 2011 Full-Year and Fourth-Quarter Results February 9, 2012 Exhibit 99.3 *********************************************************************************************** |
 *********************************************************************************************** 2 Introduction Unless otherwise stated, we will be talking about results for the full- year or fourth-quarter 2011 and comparing them with the same period in 2010 References to PMI volumes refer to PMI shipment data, unless otherwise stated Industry volume and market shares are the latest data available from a number of sources Organic volume refers to volume excluding acquisitions Net revenues exclude excise taxes OCI stands for Operating Companies Income, which is defined as operating income before general corporate expenses and the amortization of intangibles. OCI growth rates are on an adjusted basis, which excludes asset impairment, exit and other costs Data tables showing adjustments to net revenues and OCI for currency, acquisitions, asset impairment, exit and other costs, free cash flow calculations, adjustments to EPS, and reconciliations to U.S. GAAP measures are at the end of today’s webcast slides and are posted on our web site |
 *********************************************************************************************** 3 Forward-Looking and Cautionary Statements This presentation and related discussion contain statements that, to the extent they do not relate strictly to historical or current facts, constitute “forward-looking statements” within the meaning of the Private Securities Litigation Reform Act of 1995. Such forward-looking statements are based on current plans, estimates and expectations, and are not guarantees of future performance. They are based on management’s expectations that involve a number of business risks and uncertainties, any of which could cause actual results to differ materially from those expressed in or implied by the forward-looking statements. PMI undertakes no obligation to publicly update or revise any forward-looking statements, except in the normal course of its public disclosure obligations. The risks and uncertainties relating to the forward-looking statements in this presentation include those described under Item 1A. “Risk Factors” in PMI’s Form 10-Q for the quarter ended September 30, 2011, filed with the Securities and Exchange Commission. |
 4 Outstanding 2011 Results Organic cigarette volume growth of 0.5%, thanks notably to Indonesia and Japan Fourth consecutive year of global share growth driven by our superior brand portfolio Solid volume performance, strong pricing, and significant productivity savings led to record profitability Strong cash flow driving generous returns to shareholders Source: PMI Financials *********************************************************************************************** |
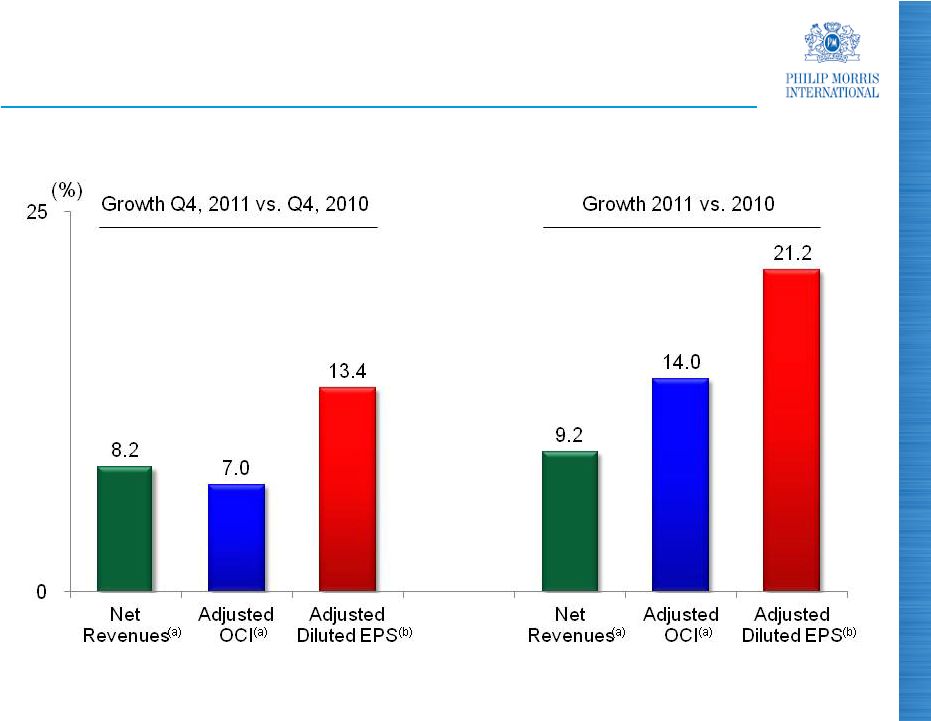 Outstanding 2011 Results (a) Excluding currency and acquisitions (b) Excluding currency Source: PMI Financials 5 *********************************************************************************************** |
 6 Reversal of Currency Favorability in 2012 Recent unfavorable currency movements: Weaker Euro, due to debt issues in Europe Depreciation of certain emerging market currencies At prevailing exchange rates, forecast currency headwind of approximately 10 cents per share in 2012 This would amount to a reversal of about half the 2011 favorability of 19 cents per share Source: PMI Forecasts *********************************************************************************************** |
 7 2012 EPS Guidance Excellent business momentum We will fully compensate the EPS hurdle of 10 cents related to the exceptional circumstances in Japan in 2011 Reported diluted EPS guidance for 2012, at prevailing exchange rates, is $5.25 to $5.35 versus $4.85 in 2011 This corresponds to a growth rate of approximately 10% to 12% on a currency-neutral basis, compared to adjusted diluted EPS of $4.88 in 2011 Expect to again meet our mid to long-term currency- neutral annual growth targets in 2012 Source: PMI Forecasts *********************************************************************************************** |
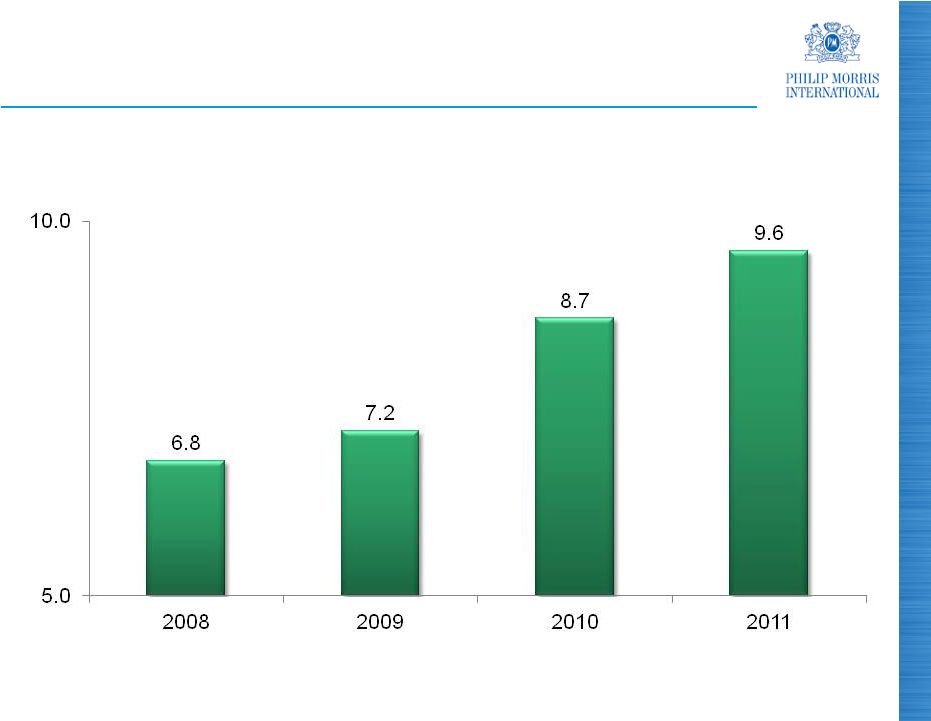 8 Growing Free Cash Flow (a) at Double-Digit Rate (a) Free cash flow equals net cash provided by operating activities less capital expenditures Source: PMI Financials ($ billion) *********************************************************************************************** |
 9 Accelerated Share Repurchases $12 billion three-year share repurchase program initiated in May 2010 $3.6 billion available under this program at the end of 2011 Current program expected to be completed well ahead of schedule Plan to spend $6 billion on share repurchases in 2012 Source: PMI Financials and PMI Forecasts *********************************************************************************************** |
 10 2011 Key Drivers and 2012 Business Outlook Manageable excise tax environment Stable industry volume trends Superior brand portfolio Market share growth Favorable pricing environment Limited input cost increases and strong productivity gains *********************************************************************************************** |
 *********************************************************************************************** 11 Manageable Excise Tax Environment Most governments appear to have understood that large disruptive excise tax increases usually do not generate targeted increases in revenues, nor are sustainable No excessive excise tax increases implemented or announced so far in 2011 Reasonable approach in terms of incidence and structure Several countries in Europe are most likely to increase VAT this year, but believe this should be manageable Source: PMI Forecasts |
 *********************************************************************************************** 12 Outlook for Industry Volume Trends Cigarette industry volume trends anticipated to be similar to those prevalent in 2011 Potential for growth in non-OECD markets where adult smoking population expanding and economy vibrant (Asia, Middle East) Moderate decline expected in OECD markets and Eastern Europe Southern Europe remains a concern, due to high and rising unemployment Expect PMI organic cigarette volume to be relatively flat in 2012 Source: PMI Forecasts |
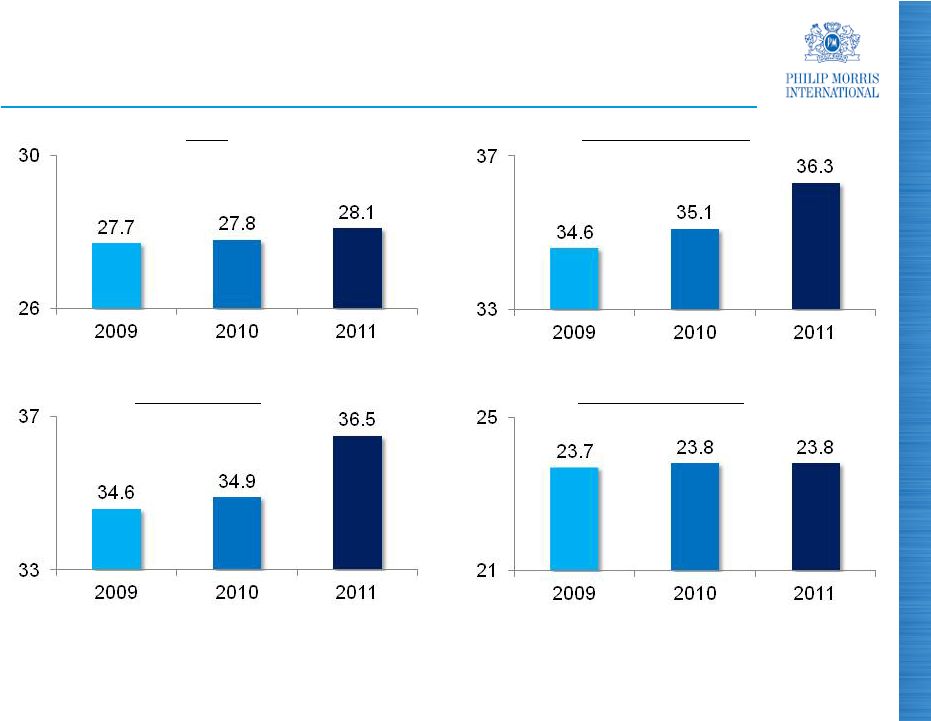 *********************************************************************************************** 13 PMI Market Share Growth Momentum (a) (a) Excluding USA and China. Historical data adjusted for pro-forma inclusion of 2010 business combination with FTC in the Philippines and the 2011 acquisition in Jordan (b) Also excluding duty-free (c) Organisation for Economic Co-operation and Development (OECD) member countries are listed on their website (www.oecd.org) Source: PMI estimates (%) Non-OECD Markets (b) (%) Total (%) Top 30 OCI Markets (%) OECD Markets (b)(c) |
 *********************************************************************************************** 14 Top Ten PMI Brands Grew in 2011 % Volume Growth vs. Prior Year Q4, 2011 FY 2011 Marlboro 2.3% 0.9% L&M (1.9) 1.7 Fortune 6.4 8.2 (a) Bond Street 1.5 2.0 Parliament 18.7 12.1 Philip Morris 2.4 1.4 Chesterfield 1.4 0.6 Sampoerna A 12.0 11.8 Lark 25.8 17.5 Dji Sam Soe 10.1 10.3 (a) March through December (business combination with FTC) Source: PMI Financials |
 *********************************************************************************************** Market Shares 2009 2010 2011 Asia (a) 5.8% 6.1% 6.4% EEMA 6.4 6.5 6.8 EU 18.4 18.1 17.9 LA&C 13.8 14.1 13.8 (c) Total (a)(b) 9.0 9.1 9.2 15 Marlboro Gaining Market Share (a) Excluding China (b) Also excluding the USA (c) Marlboro share up in all major markets in the Latin America & Canada Region. However, the regional share decreased due to a steep excise tax- driven decline in industry volume in Mexico where the brand had a 52.3% market share in 2011 Source: PMI estimates |
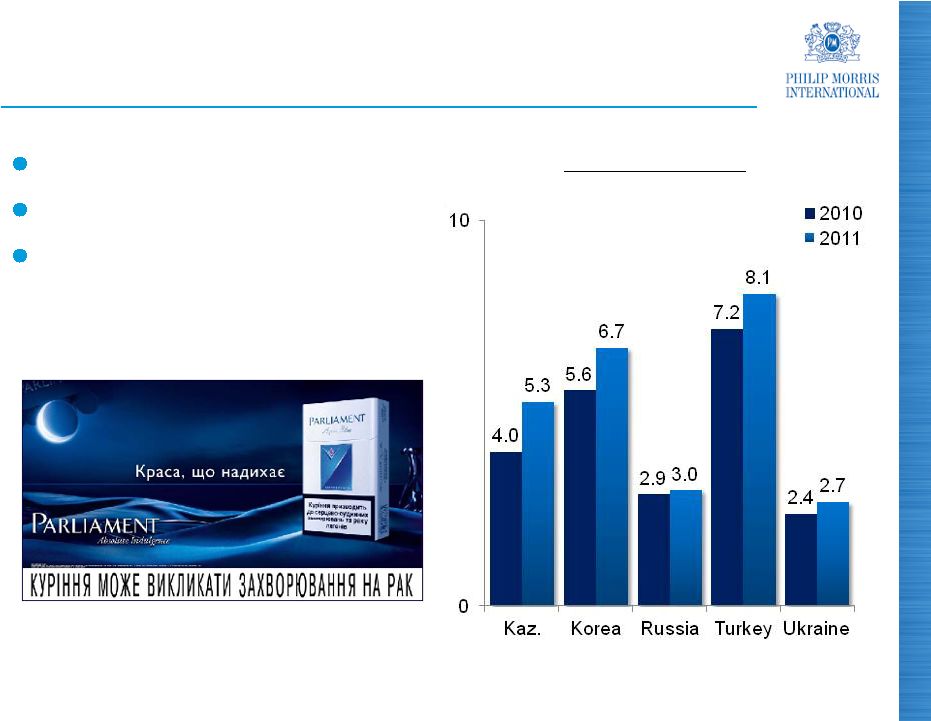 *********************************************************************************************** 16 Tremendous Performance of Parliament Luxury positioning Above premium price Volume in 2011 grew by 12.1% to 39 billion units PMI Market Shares (%) Note: Kaz. is Kazakhstan Source: PMI Financials, PMI estimates, Hankook Research and A.C. Nielsen |
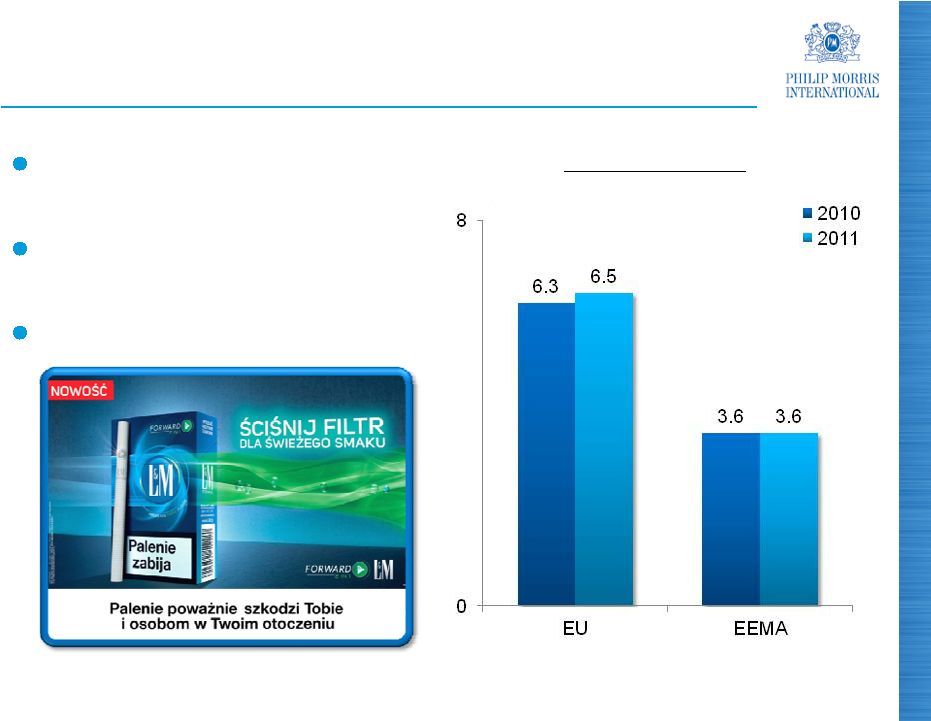 *********************************************************************************************** 17 Increased Volume of L&M Leading international low- price brand Volume in 2011 grew by 1.7% to 90 billion units Innovative line extensions (%) PMI Market Shares Source: PMI Financials and PMI estimates |
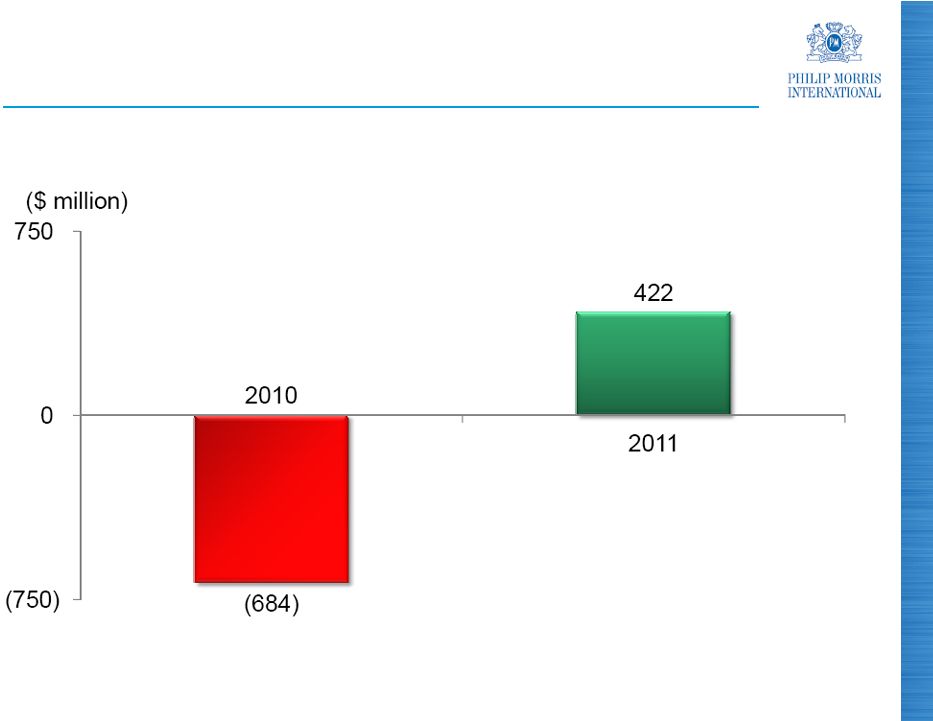 *********************************************************************************************** 18 Favorable OCI Volume/Mix Variance in 2011 Source: PMI Financials |
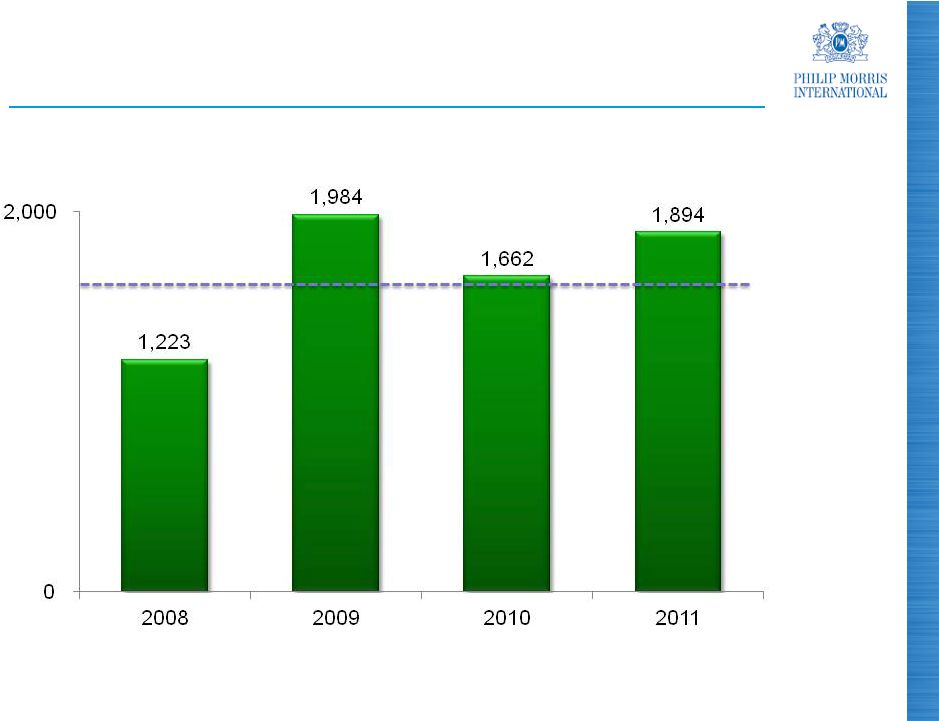 *********************************************************************************************** Pricing Variance of $1.9 Billion in 2011 ($ million) Source: PMI Financials 2008-10 average: $1,623 mio. 19 |
 ************************************************************************************************ *********************************************************************************************** Adjusted OCI Margins Full-Year 2010 2011 (a) Variance (a) Asia 38.7% 44.7% 6.0pp EEMA 42.5 42.9 0.4 EU 49.2 49.4 0.2 LA&C 31.2 31.4 0.2 Total 42.3 44.2 1.9 20 Improved Margins (a) Excluding currency and acquisitions Source: PMI Financials |
 *********************************************************************************************** 21 $300 Million Productivity Target in 2012 Forecast moderate increases in tobacco leaf prices and direct material costs, broadly in line with inflation Increased but manageable costs, mainly in Europe, relating to the imposition of “RCIP” paper $300 million productivity pre-tax target in 2012, mainly derived from manufacturing and supply chain initiatives Source: PMI Forecasts |
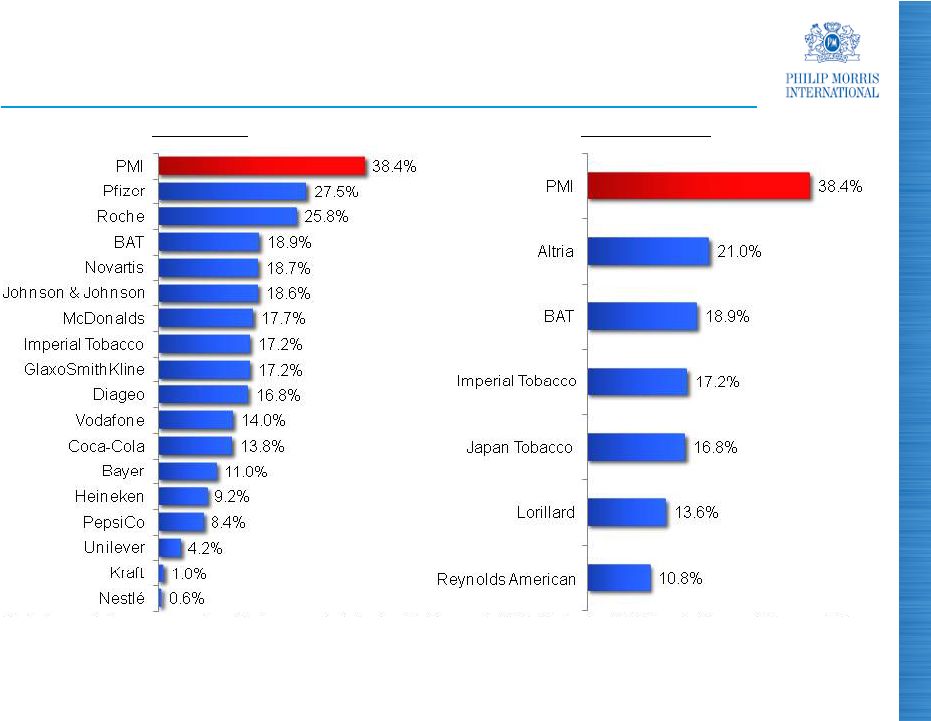 *********************************************************************************************** Peer Group Tobacco Sector Free Cash Flow as a % of Net Revenues – (YTD September, 2011) 22 Note: Free cash flow as a percentage of net revenues is defined as total January 1, 2011 – September 30, 2011 period free cash flow over total January 1, 2011 – September 30, 2011 period net revenues. Free cash flow is defined as net cash provided by operating activities less capital expenditures. Nearest comparable period is used where the January 1, 2011 – September 30, 2011 comparison is not available. PMI’s free cash flow and net revenues for the period were $9,000 million and $23,426 million, respectively Source: Company filings, compiled by Centerview |
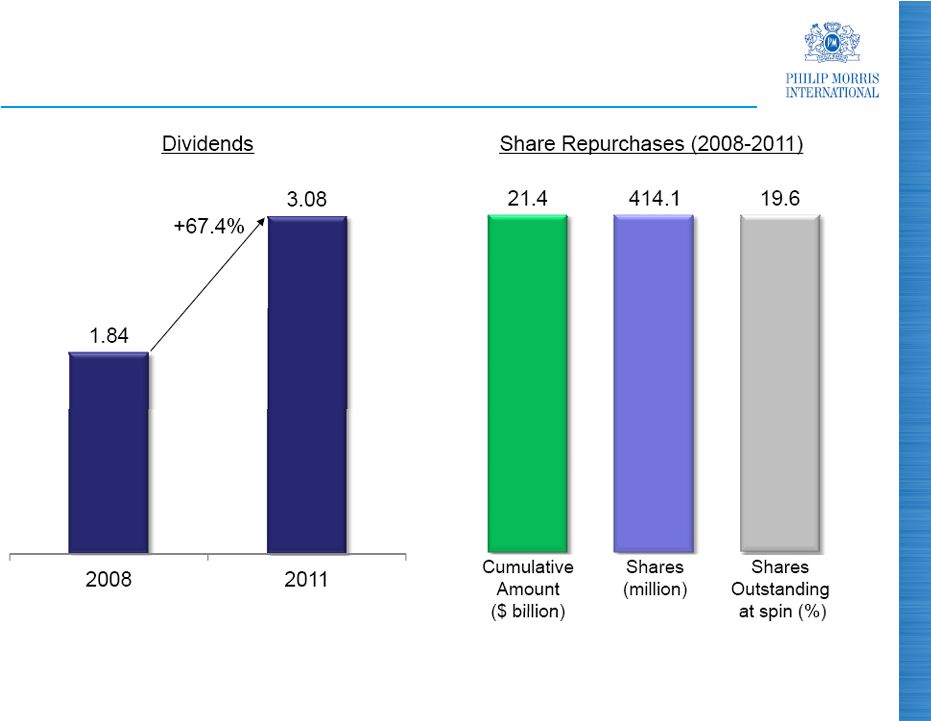 *********************************************************************************************** Significant Returns to Shareholders Through Dividends and Share Repurchases Note: Dividends for 2008 and 2011 are annualized rates. 2008 annualized rate is based on a quarterly dividend of $0.46 per common share, declared June 18, 2008. The annualized rate for 2011 is based on a quarterly dividend of $0.77 per common share, declared September 14, 2011. The outstanding PMI shares at the time of the spin were 2,109 million Source: PMI Financials 23 |
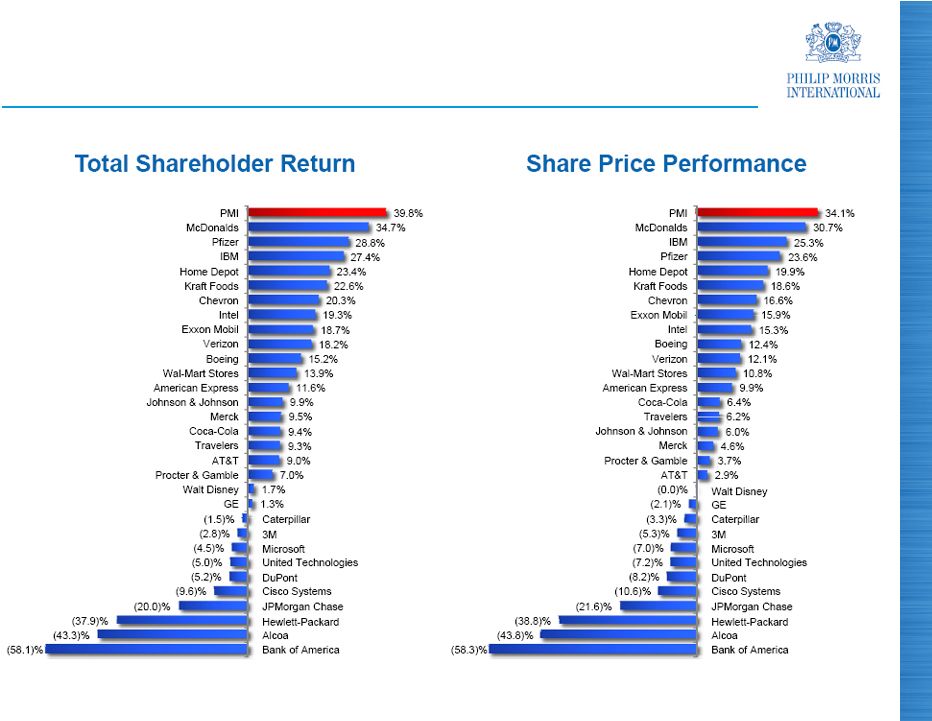 *********************************************************************************************** PMI Outperformed All 30 Stocks in the Dow Jones Industrial Average in 2011 24 Source: FactSet, compiled by Centerview |
 *********************************************************************************************** 25 Questions & Answers 2011 Full-Year and Fourth-Quarter Results |
 *********************************************************************************************** PHILIP MORRIS INTERNATIONAL INC. and Subsidiaries Reconciliation of Non-GAAP Measures Adjustments for the Impact of Currency and Acquisitions For the Quarters Ended December 31, ($ in millions) (Unaudited) Reported Net Revenues Less Excise Taxes Reported Net Revenues excluding Excise Taxes Less Currency Reported Net Revenues excluding Excise Taxes & Currency Less Acquisi- tions Reported Net Revenues excluding Excise Taxes, Currency & Acquisitions Reported Net Revenues Less Excise Taxes Reported Net Revenues excluding Excise Taxes Reported Reported excluding Currency Reported excluding Currency & Acquisitions 7,118 $ 4,910 $ 2,208 $ 38 $ 2,170 $ - $ 2,170 $ European Union 6,997 $ 4,804 $ 2,193 $ 0.7% (1.0)% (1.0)% 4,257 2,285 1,972 (66) 2,038 12 2,026 EEMA 4,263 2,385 1,878 5.0% 8.5% 7.9% 5,013 2,366 2,647 92 2,555 2 2,553 Asia 4,141 2,035 2,106 25.7% 21.3% 21.2% 2,488 1,644 844 (23) 867 - 867 Latin America & Canada 2,406 1,546 860 (1.9)% 0.8% 0.8% 18,876 $ 11,205 $ 7,671 $ 41 $ 7,630 $ 14 $ 7,616 $ PMI Total 17,807 $ 10,770 $ 7,037 $ 9.0% 8.4% 8.2% Reported Operating Companies Income Less Currency Reported Operating Companies Income excluding Currency Less Acquisi- tions Reported Operating Companies Income excluding Currency & Acquisitions Reported Operating Companies Income Reported Reported excluding Currency Reported excluding Currency & Acquisitions 1,012 $ 41 $ 971 $ - $ 971 $ European Union 1,031 $ (1.8)% (5.8)% (5.8)% 747 (64) 811 - 811 EEMA 740 0.9% 9.6% 9.6% 1,036 49 987 2 985 Asia 790 31.1% 24.9% 24.7% 214 (12) 226 - 226 Latin America & Canada 254 (15.7)% (11.0)% (11.0)% 3,009 $ 14 $ 2,995 $ 2 $ 2,993 $ PMI Total 2,815 $ 6.9% 6.4% 6.3% 2011 2010 % Change in Reported Operating Companies Income 2011 2010 % Change in Reported Net Revenues excluding Excise Taxes 26 |
 PHILIP MORRIS INTERNATIONAL INC. and Subsidiaries Reconciliation of Non-GAAP Measures Reconciliation of Reported Operating Companies Income to Adjusted Operating Companies Income & Reconciliation of Adjusted Operating Companies Income Margin, excluding Currency and Acquisitions For the Quarters Ended December 31, ($ in millions) (Unaudited) (a) For the calculation of net revenues excluding excise taxes, currency and acquisitions, refer to previous slide Reported Operating Companies Income Less Asset Impairment & Exit Costs Adjusted Operating Companies Income Less Currency Adjusted Operating Companies Income excluding Currency Less Acquisi- tions Adjusted Operating Companies Income excluding Currency & Acquisitions Reported Operating Companies Income Less Asset Impairment & Exit Costs Adjusted Operating Companies Income Adjusted Adjusted excluding Currency Adjusted excluding Currency & Acquisitions 1,012 $ (22) $ 1,034 $ 41 $ 993 $ - $ 993 $ European Union 1,031 $ (7) $ 1,038 $ (0.4)% (4.3)% (4.3)% 747 (7) 754 (64) 818 - 818 EEMA 740 - 740 1.9% 10.5% 10.5% 1,036 (8) 1,044 49 995 2 993 Asia 790 (20) 810 28.9% 22.8% 22.6% 214 (12) 226 (12) 238 - 238 Latin America & Canada 254 - 254 (11.0)% (6.3)% (6.3)% 3,009 $ (49) $ 3,058 $ 14 $ 3,044 $ 2 $ 3,042 $ PMI Total 2,815 $ (27) $ 2,842 $ 7.6% 7.1% 7.0% % Points Change Adjusted Operating Companies Income excluding Currency Net Revenues excluding Excise Taxes & Currency (a) Adjusted Operating Companies Income Margin excluding Currency Adjusted Operating Companies Income excluding Currency & Acquisitions Net Revenues excluding Excise Taxes, Currency & Acquisitions (a) Adjusted Operating Companies Income Margin excluding Currency & Acquisitions Adjusted Operating Companies Income Net Revenues excluding Excise Taxes (a) Adjusted Operating Companies Income Margin Adjusted Operating Companies Income Margin excluding Currency Adjusted Operating Companies Income Margin excluding Currency & Acquisitions 993 $ 2,170 $ 45.8% 993 $ 2,170 $ 45.8% European Union 1,038 $ 2,193 $ 47.3% (1.5) (1.5) 818 2,038 40.1% 818 2,026 40.4% EEMA 740 1,878 39.4% 0.7 1.0 995 2,555 38.9% 993 2,553 38.9% Asia 810 2,106 38.5% 0.4 0.4 238 867 27.5% 238 867 27.5% Latin America & Canada 254 860 29.5% (2.0) (2.0) 3,044 $ 7,630 $ 39.9% 3,042 $ 7,616 $ 39.9% PMI Total 2,842 $ 7,037 $ 40.4% (0.5) (0.5) 2010 2011 2010 2011 % Change in Adjusted Operating Companies Income 27 *********************************************************************************************** |
 *********************************************************************************************** PHILIP MORRIS INTERNATIONAL INC. and Subsidiaries Reconciliation of Non-GAAP Measures Reconciliation of Reported Diluted EPS to Adjusted Diluted EPS and Adjusted Diluted EPS, excluding Currency For the Quarters Ended December 31, (Unaudited) 2011 2010 % Change Reported Diluted EPS 1.08 $ 0.96 $ 12.5% Adjustments: Asset impairment and exit costs 0.02 0.01 Tax items - - Adjusted Diluted EPS 1.10 $ 0.97 $ 13.4% Less: Currency impact - Adjusted Diluted EPS, excluding Currency 1.10 $ 0.97 $ 13.4% 28 |
 PHILIP MORRIS INTERNATIONAL INC. and Subsidiaries Reconciliation of Non-GAAP Measures Adjustments for the Impact of Currency and Acquisitions For the Years Ended December 31, ($ in millions) (Unaudited) (a) Includes the business combination in the Philippines ($105) (b) Includes the business combination in the Philippines ($23) Reported Net Revenues Less Excise Taxes Reported Net Revenues excluding Excise Taxes Less Currency Reported Net Revenues excluding Excise Taxes & Currency Less Acquisi- tions Reported Net Revenues excluding Excise Taxes, Currency & Acquisitions Reported Net Revenues Less Excise Taxes Reported Net Revenues excluding Excise Taxes Reported Reported excluding Currency Reported excluding Currency & Acquisitions 29,768 $ 20,556 $ 9,212 $ 440 $ 8,772 $ - $ 8,772 $ European Union 28,050 $ 19,239 $ 8,811 $ 4.6% (0.4)% (0.4)% 17,452 9,571 7,881 49 7,832 25 7,807 EEMA 15,928 8,519 7,409 6.4% 5.7% 5.4% 19,590 8,885 10,705 690 10,015 112 (a) 9,903 Asia 15,235 7,300 7,935 34.9% 26.2% 24.8% 9,536 6,237 3,299 70 3,229 - 3,229 Latin America & Canada 8,500 5,447 3,053 8.1% 5.8% 5.8% 76,346 $ 45,249 $ 31,097 $ 1,249 $ 29,848 $ 137 $ 29,711 $ PMI Total 67,713 $ 40,505 $ 27,208 $ 14.3% 9.7% 9.2% Reported Operating Companies Income Less Currency Reported Operating Companies Income excluding Currency Less Acquisi- tions Reported Operating Companies Income excluding Currency & Acquisitions Reported Operating Companies Income Reported Reported excluding Currency Reported excluding Currency & Acquisitions 4,560 $ 277 $ 4,283 $ (1) $ 4,284 $ European Union 4,311 $ 5.8% (0.6)% (0.6)% 3,229 (97) 3,326 (13) 3,339 EEMA 3,152 2.4% 5.5% 5.9% 4,836 400 4,436 28 (b) 4,408 Asia 3,049 58.6% 45.5% 44.6% 988 (2) 990 - 990 Latin America & Canada 953 3.7% 3.9% 3.9% 13,613 $ 578 $ 13,035 $ 14 $ 13,021 $ PMI Total 11,465 $ 18.7% 13.7% 13.6% 2011 2010 % Change in Reported Operating Companies Income 2011 2010 % Change in Reported Net Revenues excluding Excise Taxes 29 *********************************************************************************************** |
 *********************************************************************************************** PHILIP MORRIS INTERNATIONAL INC. and Subsidiaries Reconciliation of Non-GAAP Measures Reconciliation of Reported Operating Companies Income to Adjusted Operating Companies Income & Reconciliation of Adjusted Operating Companies Income Margin, excluding Currency and Acquisitions For the Years Ended December 31, ($ in millions) (Unaudited) (a) Includes the business combination in the Philippines ($23) (b) For the calculation of net revenues excluding excise taxes, currency and acquisitions, refer to previous slide Reported Operating Companies Income Less Asset Impairment & Exit Costs Adjusted Operating Companies Income Less Currency Adjusted Operating Companies Income excluding Currency Less Acquisi- tions Adjusted Operating Companies Income excluding Currency & Acquisitions Reported Operating Companies Income Less Asset Impairment & Exit Costs Adjusted Operating Companies Income Adjusted Adjusted excluding Currency Adjusted excluding Currency & Acquisitions 4,560 $ (45) $ 4,605 $ 277 $ 4,328 $ (1) $ 4,329 $ European Union 4,311 $ (27) $ 4,338 $ 6.2% (0.2)% (0.2)% 3,229 (25) 3,254 (97) 3,351 (1) 3,352 EEMA 3,152 - 3,152 3.2% 6.3% 6.3% 4,836 (15) 4,851 400 4,451 28 (a) 4,423 Asia 3,049 (20) 3,069 58.1% 45.0% 44.1% 988 (24) 1,012 (2) 1,014 - 1,014 Latin America & Canada 953 - 953 6.2% 6.4% 6.4% 13,613 $ (109) $ 13,722 $ 578 $ 13,144 $ 26 $ 13,118 $ PMI Total 11,465 $ (47) $ 11,512 $ 19.2% 14.2% 14.0% % Points Change Adjusted Operating Companies Income excluding Currency Net Revenues excluding Excise Taxes & Currency (b) Adjusted Operating Companies Income Margin excluding Currency Adjusted Operating Companies Income excluding Currency & Acquisitions Net Revenues excluding Excise Taxes, Currency & Acquisitions (b) Adjusted Operating Companies Income Margin excluding Currency & Acquisitions Adjusted Operating Companies Income Net Revenues excluding Excise Taxes (b) Adjusted Operating Companies Income Margin Adjusted Operating Companies Income Margin excluding Currency Adjusted Operating Companies Income Margin excluding Currency & Acquisitions 4,328 $ 8,772 $ 49.3% 4,329 $ 8,772 $ 49.4% European Union 4,338 $ 8,811 $ 49.2% 0.1 0.2 3,351 7,832 42.8% 3,352 7,807 42.9% EEMA 3,152 7,409 42.5% 0.3 0.4 4,451 10,015 44.4% 4,423 9,903 44.7% Asia 3,069 7,935 38.7% 5.7 6.0 1,014 3,229 31.4% 1,014 3,229 31.4% Latin America & Canada 953 3,053 31.2% 0.2 0.2 13,144 $ 29,848 $ 44.0% 13,118 $ 29,711 $ 44.2% PMI Total 11,512 $ 27,208 $ 42.3% 1.7 1.9 2010 2011 2010 2011 % Change in Adjusted Operating Companies Income 30 |
 *********************************************************************************************** PHILIP MORRIS INTERNATIONAL INC. and Subsidiaries Reconciliation of Non-GAAP Measures Reconciliation of Reported Diluted EPS to Adjusted Diluted EPS and Adjusted Diluted EPS, excluding Currency For the Years Ended December 31, (Unaudited) 2011 2010 % Change Reported Diluted EPS 4.85 $ 3.92 $ 23.7% Adjustments: Asset impairment and exit costs 0.05 0.02 Tax items (0.02) (0.07) Adjusted Diluted EPS 4.88 $ 3.87 $ 26.1% Less: Currency impact 0.19 Adjusted Diluted EPS, excluding Currency 4.69 $ 3.87 $ 21.2% 31 |
 *********************************************************************************************** PHILIP MORRIS INTERNATIONAL INC. and Subsidiaries Reconciliation of Non-GAAP Measures Reconciliation of Operating Cash Flow to Free Cash Flow ($ in millions) (Unaudited) (a) Operating Cash Flow 32 For the Years Ended December 31, 2008 2009 2010 2011 Net cash provided by operating activities (a) 7,935 $ 7,884 $ 9,437 $ 10,529 $ Less: Capital expenditures 1,099 715 713 897 Free cash flow 6,836 $ 7,169 $ 8,724 $ 9,632 $ |
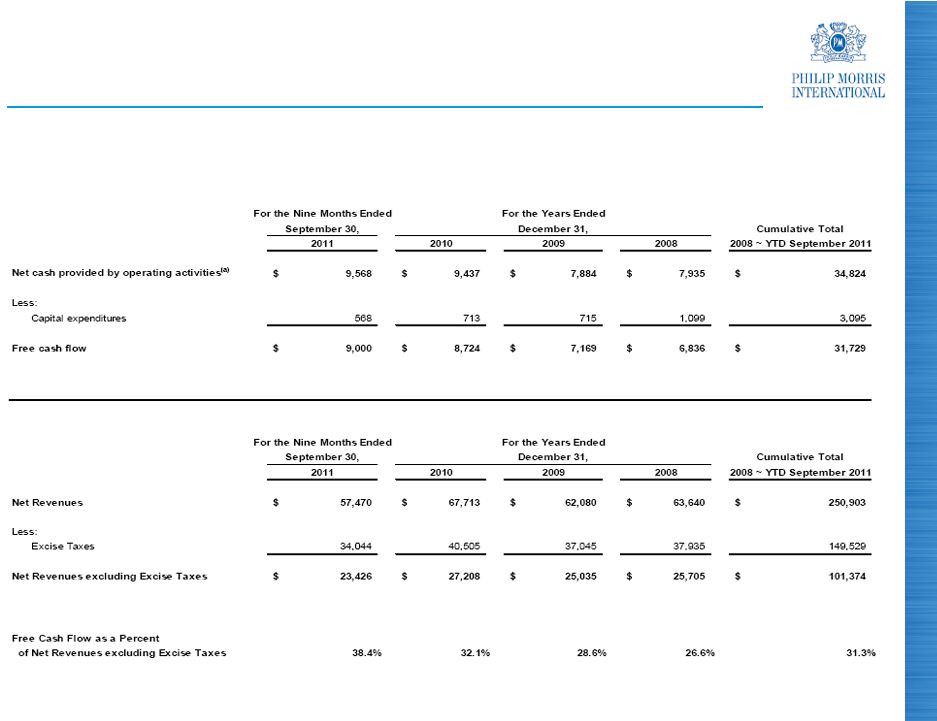 *********************************************************************************************** 33 Reconciliation of Operating Cash Flow to Free Cash Flow and Free Cash Flow as a Percent of Net Revenues excluding Excise Taxes ($ in millions) (Unaudited) PHILIP MORRIS INTERNATIONAL INC. and Subsidiaries Reconciliation of Non-GAAP Measures (a) Operating Cash Flow |
 34 2011 Full-Year and Fourth-Quarter Results February 9, 2012 *********************************************************************************************** |