 2012 First-Quarter Results April 19, 2012 Exhibit 99.3 |
 2 Introduction Unless otherwise stated, we will be talking about results for the first- quarter 2012 and comparing them with the same period in 2011 References to PMI volumes refer to PMI shipment data, unless otherwise stated Industry volume and market shares are the latest data available from a number of internal and external sources Organic volume refers to volume excluding acquisitions Net revenues exclude excise taxes OCI stands for Operating Companies Income, which is defined as operating income before general corporate expenses and the amortization of intangibles. OCI growth rates are on an adjusted basis, which excludes asset impairment, exit and other costs Data tables showing adjustments to net revenues and OCI for currency, acquisitions, asset impairment, exit and other costs, free cash flow calculations, adjustments to EPS, and reconciliations to U.S. GAAP measures are at the end of today’s webcast slides and are posted on our web site |
 3 Forward-Looking and Cautionary Statements This presentation and related discussion contain forward-looking statements. Achievement of projected results is subject to risks, uncertainties and inaccurate assumptions, and PMI is identifying important factors that, individually or in the aggregate, could cause actual results to differ materially from those contained in any forward-looking statements made by PMI PMI’s business risks include: significant increases in cigarette-related taxes; the imposition of discriminatory excise tax structures; fluctuations in customer inventory levels due to increases in product taxes and prices; increasing marketing and regulatory restrictions, often with the goal of preventing the use of tobacco products; health concerns relating to the use of tobacco products and exposure to environmental tobacco smoke; litigation related to tobacco use; intense competition; the effects of global and individual country economic, regulatory and political developments; changes in adult smoker behavior; lost revenues as a result of counterfeiting, contraband and cross-border purchases; governmental investigations; unfavorable currency exchange rates and currency devaluations; adverse changes in applicable corporate tax laws; adverse changes in the cost and quality of tobacco and other agricultural products and raw materials; and the integrity of its information systems. PMI’s future profitability may also be adversely affected should it be unsuccessful in its attempts to produce products with the potential to reduce the risk of smoking-related diseases; if it is unable to successfully introduce new products, promote brand equity, enter new markets or improve its margins through increased prices and productivity gains; if it is unable to expand its brand portfolio internally or through acquisitions and the development of strategic business relationships; or if it is unable to attract and retain the best global talent PMI is further subject to other risks detailed from time to time in its publicly filed documents, including the Form 10-K for the year ended December 31, 2011. PMI cautions that the foregoing list of important factors is not a complete discussion of all potential risks and uncertainties. PMI does not undertake to update any forward-looking statement that it may make from time to time, except in the normal course of its public disclosure obligations |
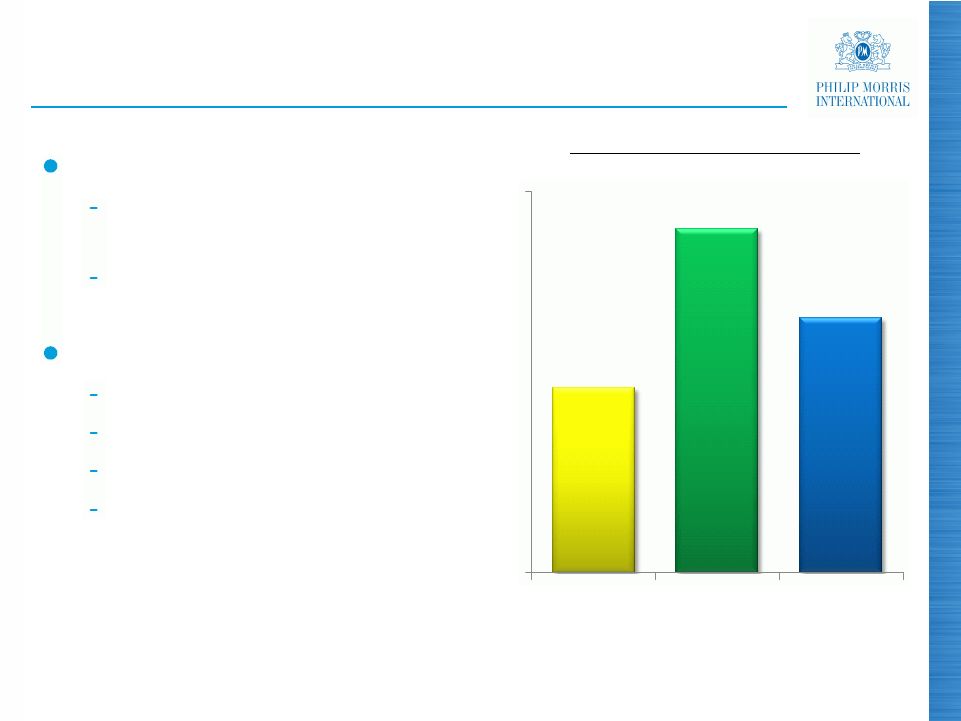
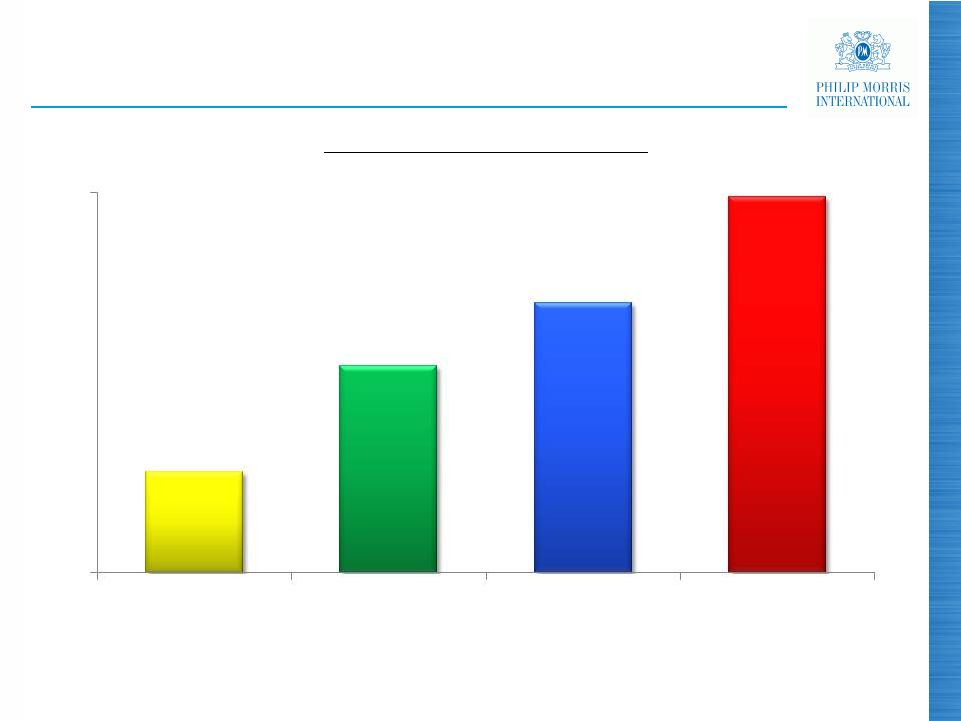 Excellent First-Quarter 2012 Results (a) Excluding currency and acquisitions (b) Excluding currency Source: PMI Financials (a) (a) 4 (%) Growth Q1, 2012 vs. Q1, 2011 (b) 5.3 10.9 14.2 19.8 0 20 Organic Cigarette Volume Net Revenues Adjusted OCI Adjusted Diluted EPS |
 5 2012 EPS Guidance Q1 results confirm our very strong business momentum Difficult comparison in Q2, 2012, due to the exceptional circumstances in Japan in 2011 Forecast currency headwind of 15 cents at prevailing exchange rates Revised reported diluted EPS guidance for 2012 is $5.20 to $5.30, compared to $4.85 in 2011 On a currency-neutral basis, our revised guidance maintains a forecast growth rate of approximately 10% to 12%, compared to adjusted diluted EPS of $4.88 in 2011 Source: PMI Financials and PMI forecasts |
 6 Excise Tax Environment Remains Reasonable No disruptively large excise tax increases in any key markets Structural improvements continue with increase in the relative importance of the specific element |
 7 Favorable Pricing and Volume/Mix Variances in Q1, 2012 Note: Variances at OCI level Source: PMI Financials ($ million) 369 224 0 400 Price Volume/Mix |
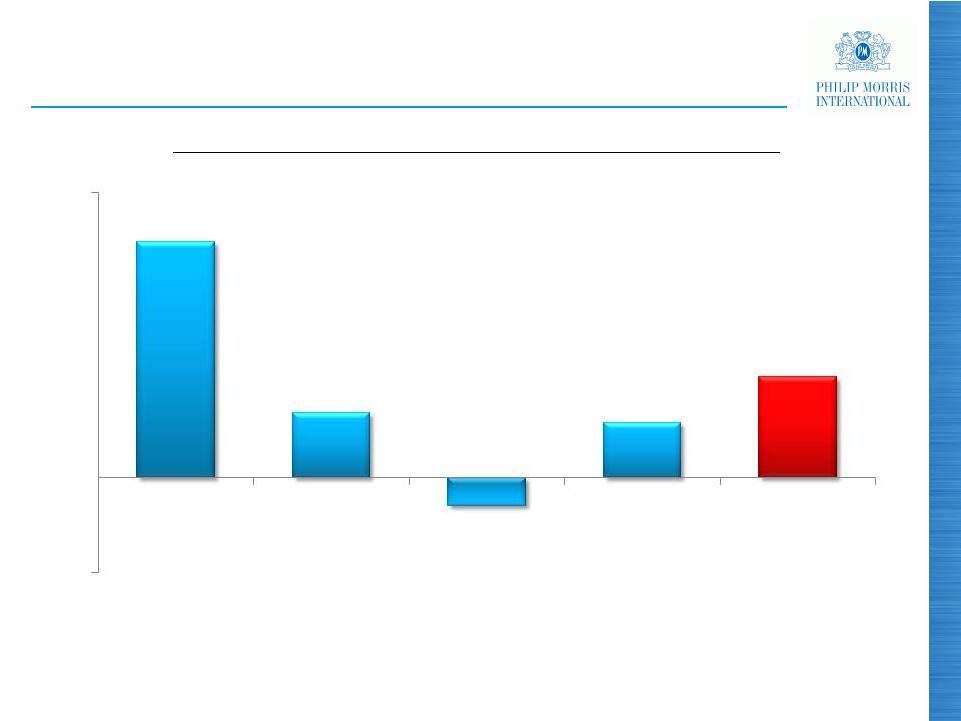 Strong First-Quarter 2012 Organic Volume (%) Source: PMI Financials Organic Cigarette Volume Growth Q1, 2012 vs. Q1, 2011 8 EU 12.4 3.4 (1.5) 2.9 5.3 (5) 15 Asia EEMA LA&C Total PMI |
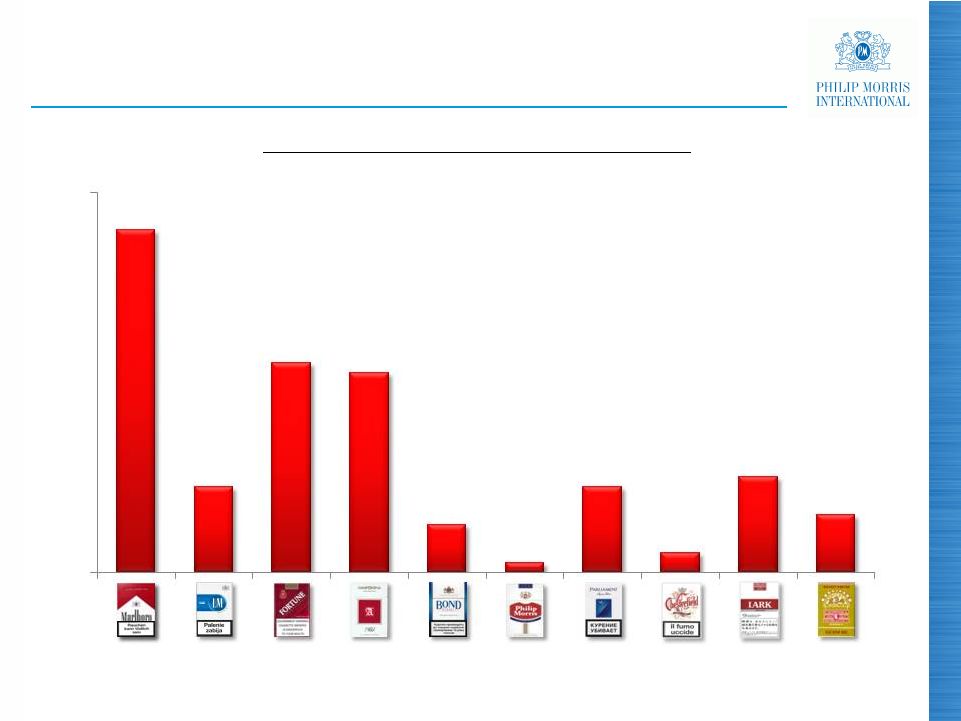 Source: PMI Financials All Top Ten PMI Brands Grew Volume in Q1, 2012 Volume Growth (Q1, 2012 vs. Q1, 2011) (units billion) 9 0 4 |
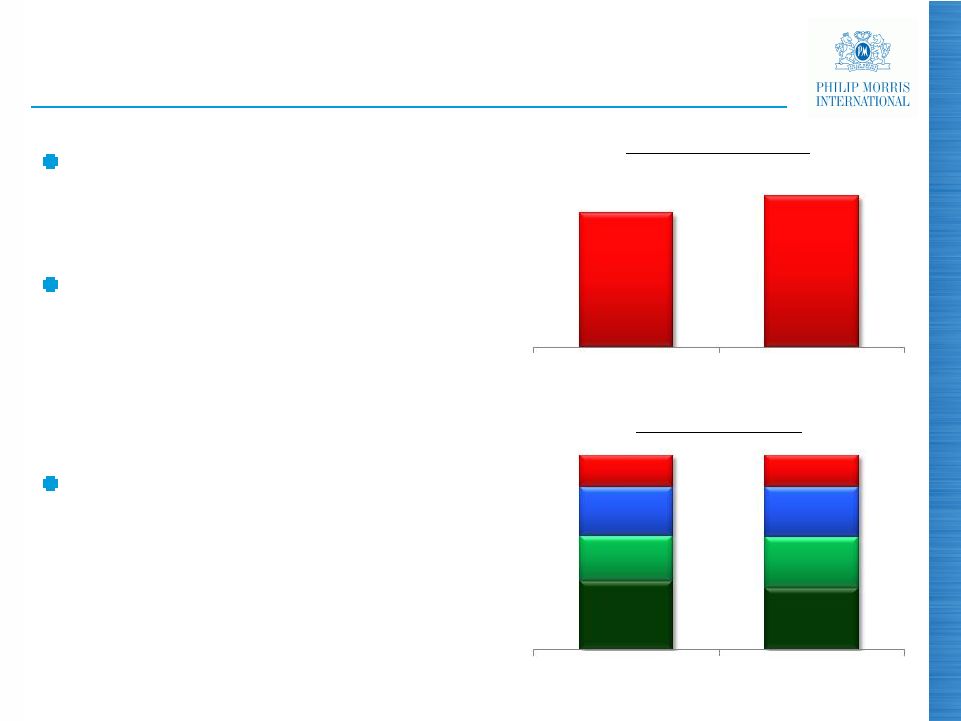
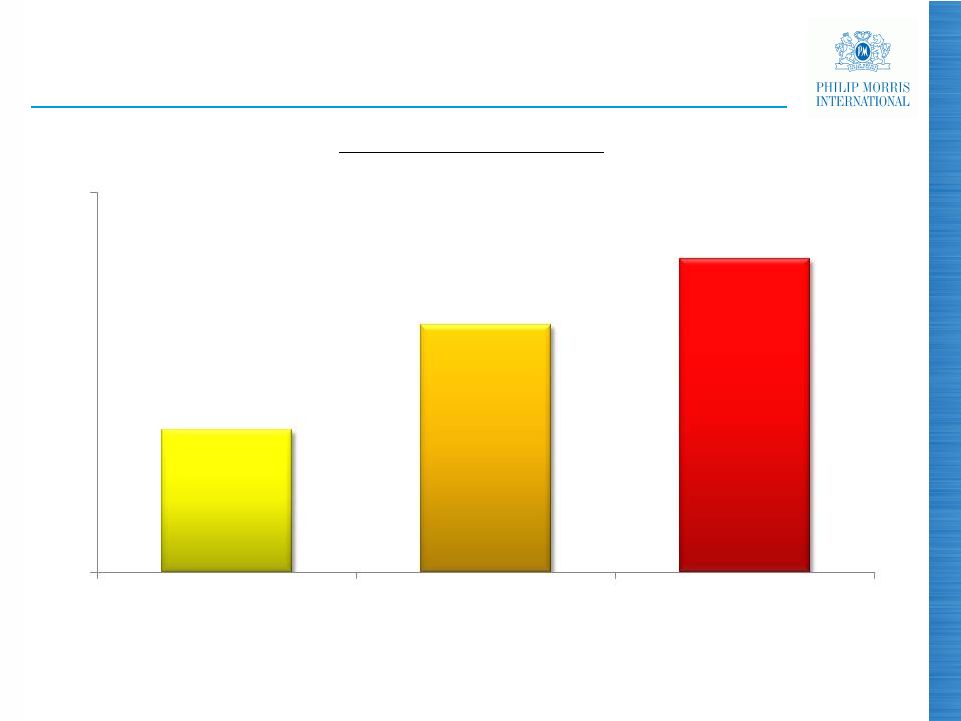 Growing Market Share in Key Markets Note: Historical data adjusted for pro forma inclusion of business combination with Fortune Tobacco Corporation in the Philippines Source: PMI Financials and PMI estimates 10 Top 30 PMI OCI Markets (%) 35.5 36.6 37.3 34 38 2010 2011 Q1, 2012 |
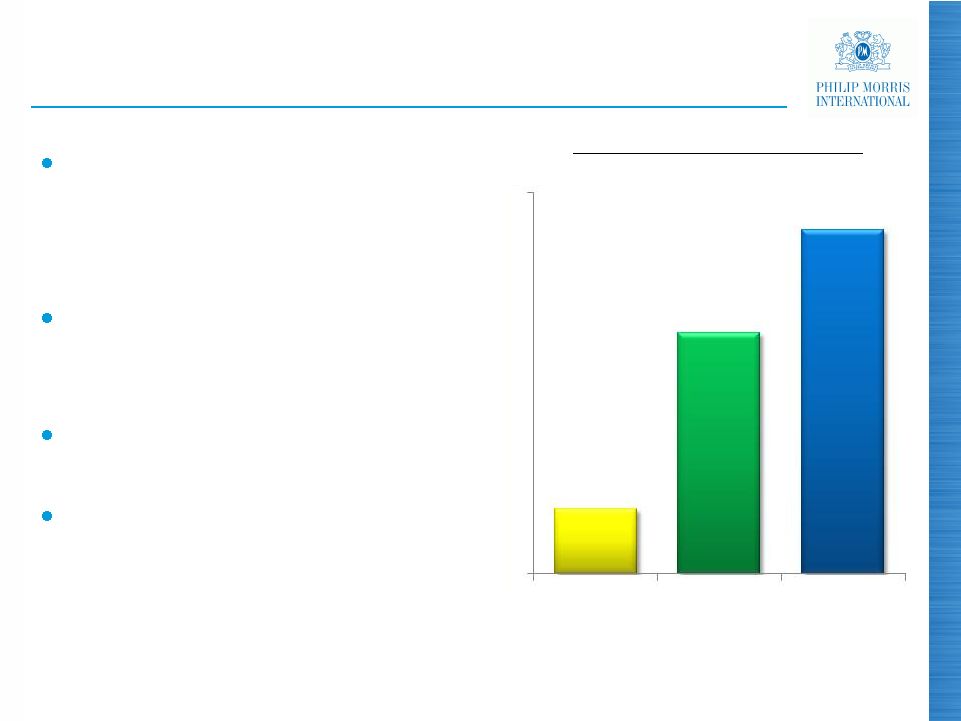
 11 Growth Q1, 2012 vs. Q1, 2011 (a) Excluding currency and acquisitions Source: PMI Financials Asia: Our Principal Growth Engine Solid economic environment Growing adult population Increasing consumer purchasing power (a) (a) (%) Organic Cigarette Volume 0 12.4 16.3 23.7 25 Revenues Adjusted OCI Net |
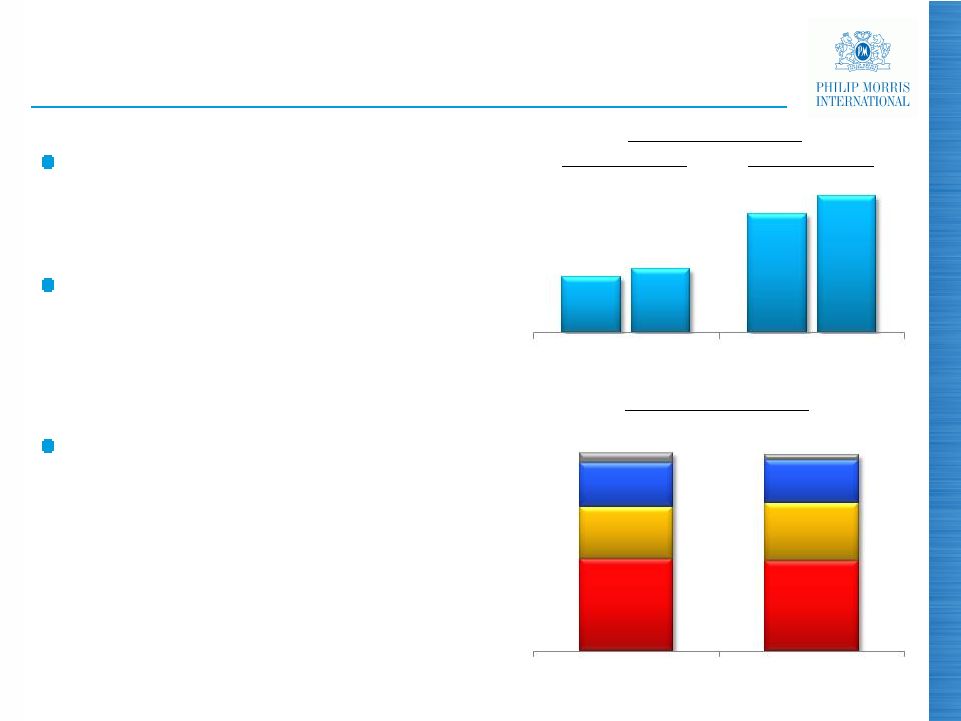
 12 PMI Market Share Variance Q1, 2012 vs. Q1, 2011 Source: PMI estimates and PMI Financials Indonesia: Premium Brands Lead the Way Total industry volume up at double-digit rate in Q1, 2012 Full-year industry volume growth forecast in 6% to 8% range PMI volume increased 24.9% in Q1, 2012 Tremendous market share momentum, with 3.5 share points gained in Q1, 2012, to reach 33.4% (pp) 0 1.9 1.1 0.5 2 Premium Mid -Price Low-Price |
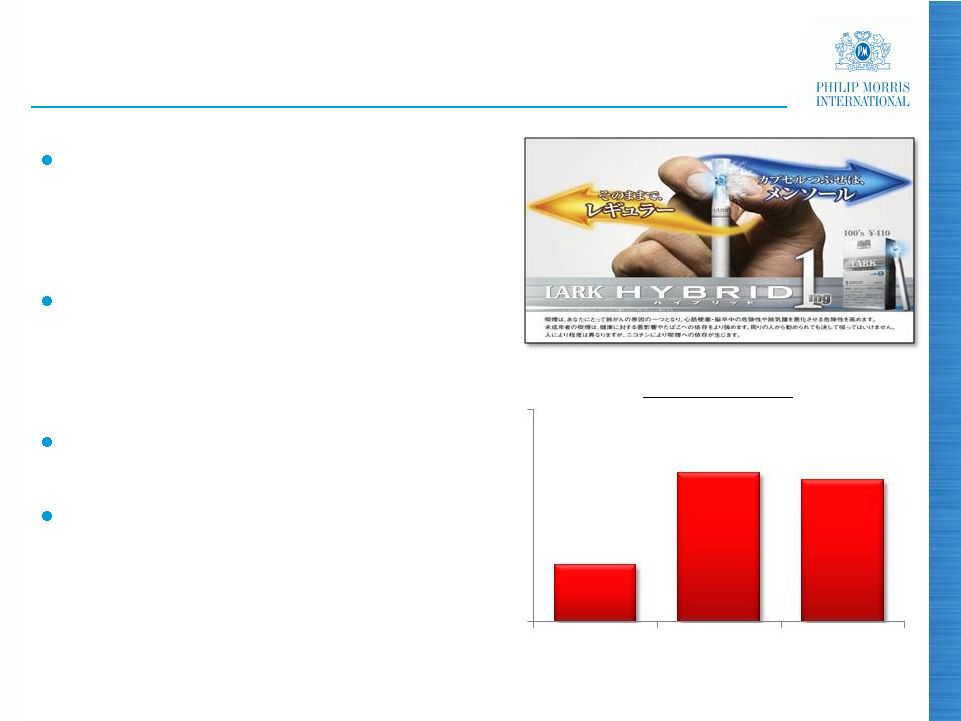 PMI Market Share Japan: Building off a Higher Base Industry volume underlying trend: more moderate decline of approximately 2% forecast in 2012 PMI Q1, 2012 market share of 28.0% impacted by significant trade purchases of new JT products in March Lark Hybrid One 100’s reached 0.4% market share in March Marlboro and Lark remain strong, and we have a full pipeline of innovative new launches planned (%) Source: PMI estimates and Tobacco Institute of Japan 13 25.6 28.2 28.0 24 30 Q1 2011 Q4 2011 Q1 2012 |
 14 Source: Hankook Research Korea: Pricing to Boost Profitability Price increase on Marlboro, Parliament and Lark from 2,500 Won to 2,700 Won per pack in February Preliminary indications that we have given back, as expected, a large part of our share gain from previous temporary price advantage PMI Market Share Q1 2011 Jan Feb Mar 2012 (%) 22.6 17.8 20.8 17.7 0 25 |
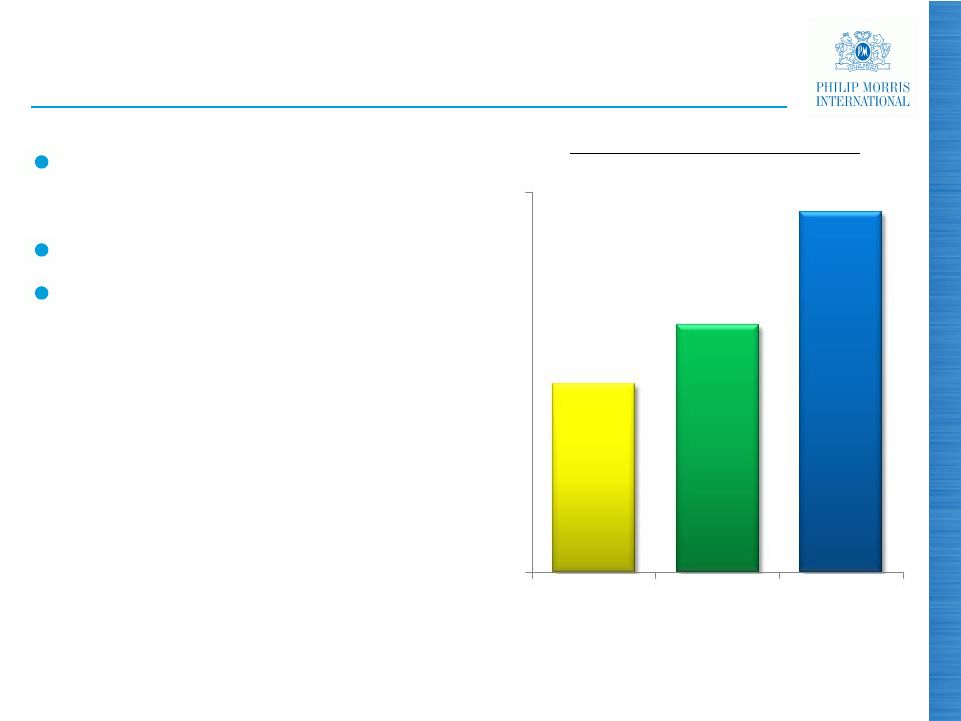
 15 Growth Q1, 2012 vs. Q1, 2011 (a) Excluding currency and acquisitions Source: PMI Financials EEMA: Strong Contribution from Volume, Mix and Pricing Strong volume growth led by Algeria, Saudi Arabia and Turkey, partly offset by Egypt Favorable mix as consumers trade up to premium and mid-price brands Price increases a key driver of higher profitability Continued investments behind Marlboro and other key brands, notably in Russia (%) Organic Cigarette Volume (a) (a) 3.4 12.6 18.0 0 20 Net Revenues Adjusted OCI |
 16 Source: PMI Financials and Nielsen Turkey: PMI Momentum Continues Strong economy has enabled market to absorb Q4, 2011, tax-driven price increases Our volume increased nearly 10% in Q1, 2012 We continued our strong share performance and mix has improved behind Parliament and Muratti Premium Mid Low PMI Market Share Total PMI (%) |
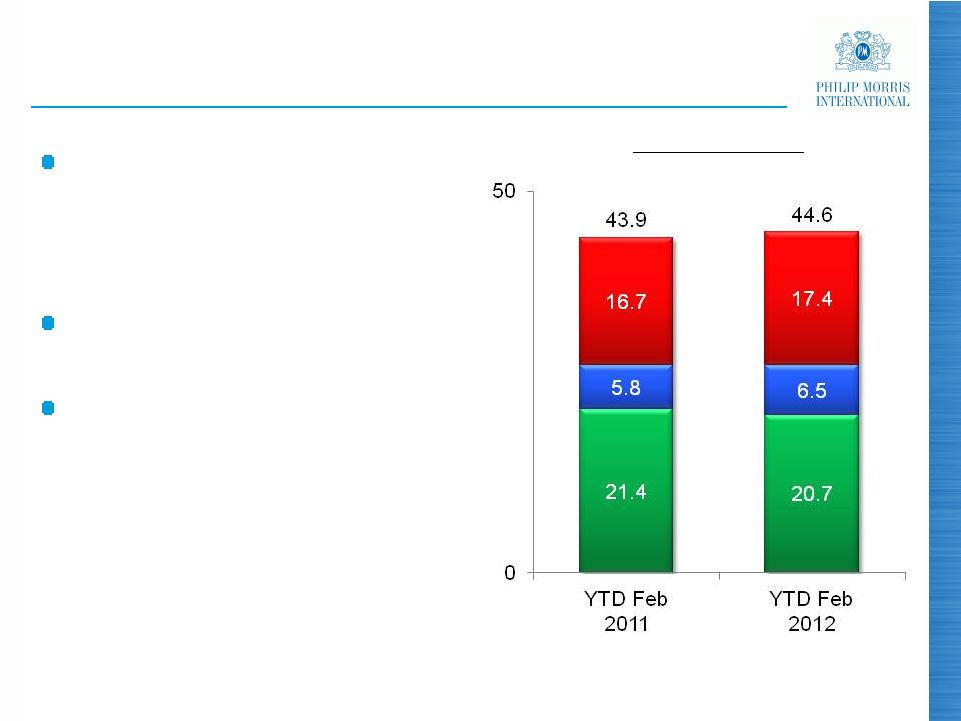
 Price Segments (%) Russia: Share Gains, Investment Continues Source: Nielsen 17 PMI Market Share (%) Consumer up-trading continuing despite price increases PMI gaining share thanks to strength of: - Parliament - Bond Street - Next Continued investment in Marlboro and other key brands Premium Mid Low Super- Low 25.5 26.2 YTD Feb 2011 YTD Feb 2012 35.2 31.8 23.2 25.7 25.1 25.9 16.5 16.6 YTD Feb 2011 YTD Feb 2012 |
 18 Growth Q1, 2012 vs. Q1, 2011 (a) Excluding currency Source: PMI estimates and PMI Financials EU: An Improved Overall Performance Total industry volume declined by a modest 1.3% despite weak economic conditions notably in Greece and Spain Continued L&M and Chesterfield share growth Organic cigarette volume decline of 1.5% is best PMI quarterly performance in many years Price increases driving growth in net revenues and adjusted OCI (a) (a) (%) Organic Cigarette Volume (3) 6 Net Revenues Adjusted OCI (1.5) 5.3 3.7 |
 PMI Market Share (%) Spain: Difficult Economic Conditions (a) “Youth” refers to Spain’s working population under 25 years old Note: Chest. is Chesterfield Source: Eurostat and PMI estimates 19 Unemployment (a) (%) Unemployment continues to increase, putting pressure on total cigarette market volume PMI market share was down 0.2 points in Q1, 2012, to 30.2%, in spite of an improvement in Chesterfield Following recent excise tax increases, PMI raised prices by €0.25/pack Total PMI Other L&M Chest. Marlboro Overall Youth Feb 2011 Feb 2012 Feb 2011 Feb 2012 14.1 13.9 8.1 8.9 6.7 6.5 30.4 30.2 Q1 2011 Q1 2012 20.6 44.0 23.6 50.5 |
 Chesterfield Share of Total Tobacco Italy: Profitability Remains Strong Source: PMI estimates 20 PMI Market Share Higher prices and a weaker economy led to a 6.1% decline in cigarette industry volume in Q1, 2012, partly offset by the growth of fine cut Some consumer down-trading to low-price cigarettes and fine cut Launch of Chesterfield in fine cut in Q2, 2011, has provided PMI with leadership in fine cut PMI portfolio in international low- price segment strengthened through launch in Q1, 2012, of Philip Morris Selection Cigarettes Fine Cut Cigarettes Fine Cut 55 50 30 (%) Q1 2011 Q1 2012 Q1 2011 Q1 2012 4.9 (%) 2011 3.6 3.6 3.5 3.3 3.3 1.6 3.6 3.8 4.0 4.5 0 5 Q1 Q2 Q3 Q4 Q1 2012 53.5 0.3 52.6 28.3 0 |
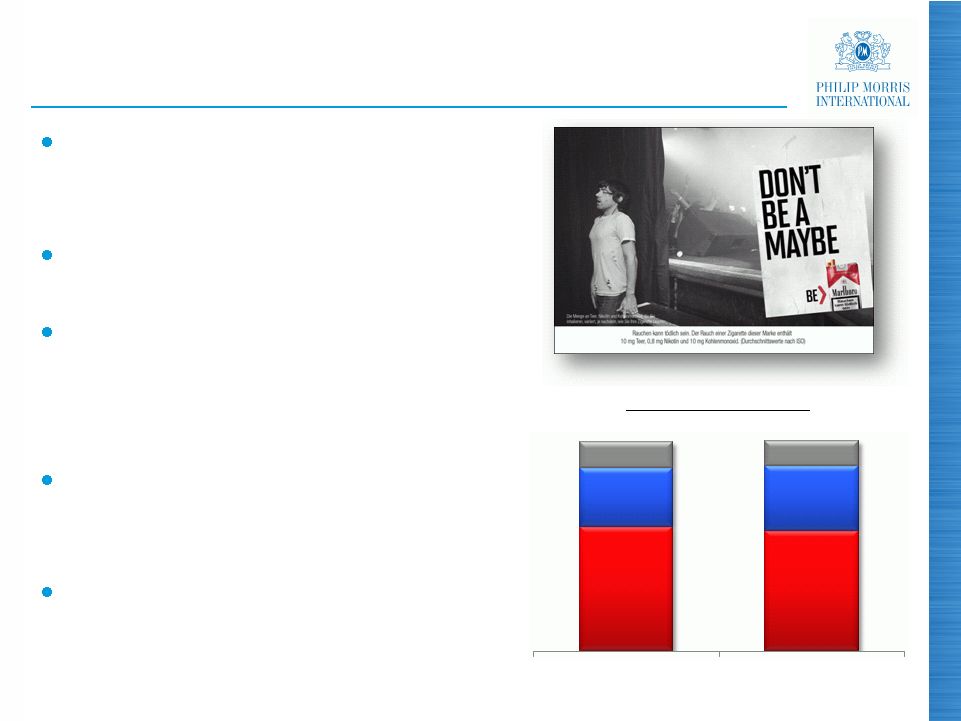 Germany: PMI Share Growth Continues (a) Young Adult Smokers: Legal Age (minimum 18) – 24 years old Source: PMI estimates and PMI Market Research 21 Total industry volume up 3.1% in Q1, 2012, helped by a decline in illicit trade Marlboro first in market with new retail prices New Marlboro marketing campaign showing promising results: YAS (a) share up 5 points to 20% L&M growth continues unabated: market share up a further 1.2 points in Q1, 2012 PMI share of fine cut market grew 0.9 points to 15.8% PMI Market Share (%) Total PMI Other L&M Marlboro 21.2 20.4 10.0 11.2 4.5 4.3 35.7 35.9 Q1 2011 Q1 2012 |
 Latin America & Canada: Solid Contribution to PMI Growth Volume growth, driven by: Share and market growth in Argentina Favorable timing and trade movements in Mexico Marlboro share: Argentina +1.0pp to 24.8% Brazil Colombia Mexico +4.0pp to 54.3% 22 Growth Q1, 2012 vs. Q1, 2011 (%) (a) Excluding currency Source: PMI Financials and PMI estimates - 0.5pp to 6.8% +1.5pp to 5.8% Organic Cigarette Volume (a) (a) 2.9 5.4 4.0 6 Net Revenues Adjusted OCI 0 |
 23 PMI Intensifying Efforts to Combat Illicit Trade (a) Estimated globally at 600 billion cigarettes Significant volume and profitability opportunities for PMI from potential reduction PMI cooperating with authorities worldwide Canada, Germany and Romania are recent examples of successful reductions in illicit trade (a) Illicit trade refers to domestic non-duty paid products Source: PMI estimates |
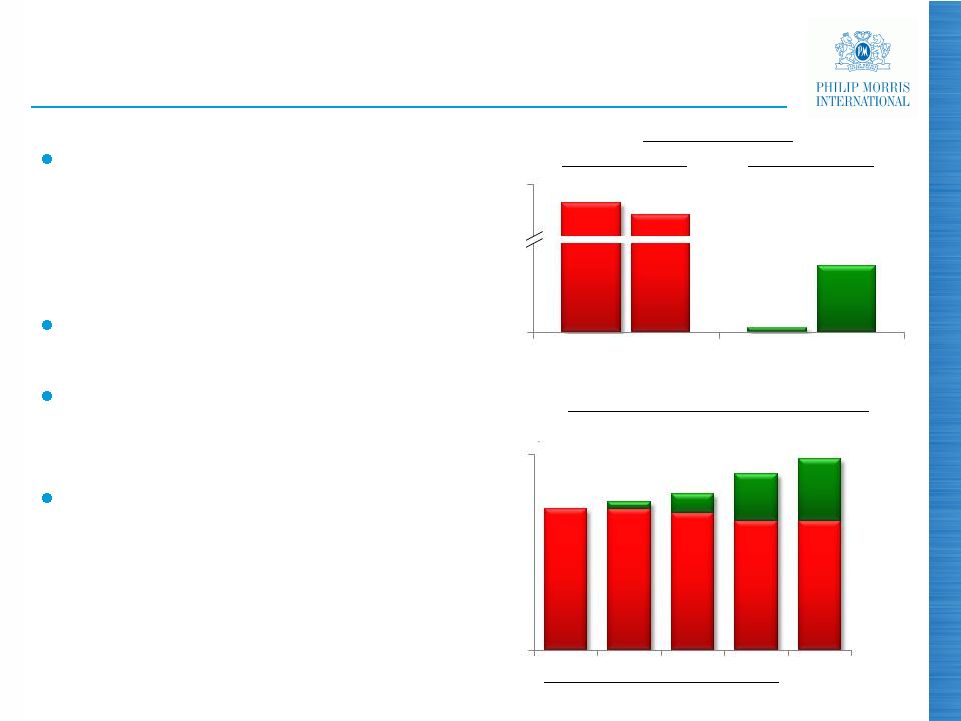
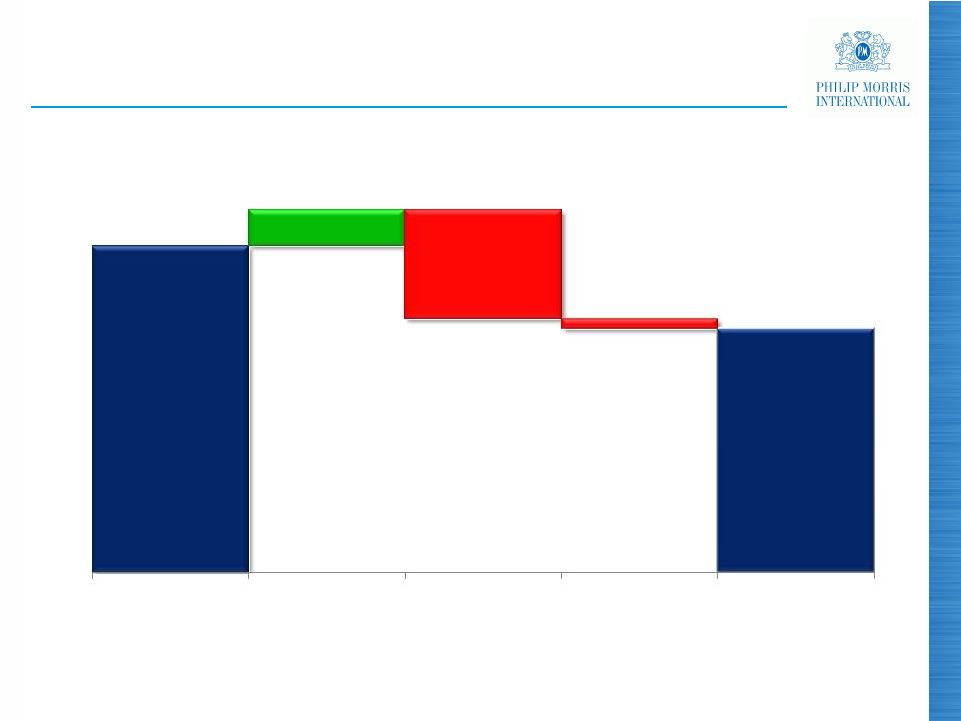 24 Free Cash Flow (a) Impacted by Working Capital Requirements (a) Free cash flow equals net cash provided by operating activities less capital expenditures Source: PMI Financials ($ million) 245 (742) (68) 2,236 1,671 Q1 2011 Net Earnings Working Capital and Other Capital Expenditures Q1 2012 |
 25 Generous Returns to Shareholders In the first quarter of 2012, PMI spent $1.5 billion to repurchase 18.1 million shares. Target for 2012 is $6 billion Since 2008 spin, 432.1 million shares repurchased at an average price of $52.88 Our annualized dividend of $3.08 per share generated a yield of 3.5% on April 13, 2012 Since the spin, dividend rate increased by 67.4% Source: PMI Financials |
 Superior Shareholder Returns Tobacco Peer Group Company Peer Group March 28, 2008 – April 13, 2012 Note: Peer groups represent the market weighted average return of the group. PMI pro forma for additional $0.46 per share dividend paid in April 2008 impacts the period March 28, 2008 – April 13, 2012. Exchange rates are as of March 28, 2008, January 1, 2012 and April 13, 2012. A list of the Tobacco and Company Peer Groups is available in the reconciliation section Source: FactSet, compiled by Centerview January 1, 2012 – April 13, 2012 Tobacco Peer Group Company Peer Group FTSE 100 26 1.4% 4.8% 10.3% 11.0% 12.9% FTSE 100 S&P 500 PMI (7.9)% 15.4% 24.6% 55.3% 107.7% S&P 500 PMI |
 27 Conclusion Excellent results in the first quarter of 2012 Very strong organic volume and consumer up-trading in non-OECD markets Key brands performing very well, led by Marlboro and Parliament Expect to deliver against our currency-neutral long-term target of 10% to 12% growth in adjusted diluted EPS in 2012 Confident about our outlook for remainder of year, notwithstanding the difficult comparison in the second quarter due to Japan |
 2012 First-Quarter Results Questions & Answers |
 PHILIP MORRIS INTERNATIONAL INC. and Subsidiaries Reconciliation of Non-GAAP Measures Adjustments for the Impact of Currency and Acquisitions For the Quarters Ended March 31, ($ in millions) (Unaudited) 29 Reported Net Revenues Less Excise Taxes Reported Net Revenues excluding Excise Taxes Less Currency Reported Net Revenues excluding Excise Taxes & Currency Less Acquisi- tions Reported Net Revenues excluding Excise Taxes, Currency & Acquisitions Reported Net Revenues Less Excise Taxes Reported Net Revenues excluding Excise Taxes Reported Reported excluding Currency Reported excluding Currency & Acquisitions 6,470 $ 4,417 $ 2,053 $ (54) $ 2,107 $ - $ 2,107 $ European Union 6,415 $ 4,414 $ 2,001 $ 2.6% 5.3% 5.3% 4,069 2,234 1,835 (73) 1,908 9 1,899 EEMA 3,671 1,984 1,687 8.8% 13.1% 12.6% 5,177 2,400 2,777 74 2,703 1 2,702 Asia 4,288 1,965 2,323 19.5% 16.4% 16.3% 2,306 1,523 783 (39) 822 - 822 Latin America & Canada 2,156 1,376 780 0.4% 5.4% 5.4% 18,022 $ 10,574 $ 7,448 $ (92) $ 7,540 $ 10 $ 7,530 $ PMI Total 16,530 $ 9,739 $ 6,791 $ 9.7% 11.0% 10.9% Reported Operating Companies Income Less Currency Reported Operating Companies Income excluding Currency Less Acquisi- tions Reported Operating Companies Income excluding Currency & Acquisitions Reported Operating Companies Income Reported Reported excluding Currency Reported excluding Currency & Acquisitions 1,030 $ (25) $ 1,055 $ - $ 1,055 $ European Union 1,006 $ 2.4% 4.9% 4.9% 810 (44) 854 - 854 EEMA 722 12.2% 18.3% 18.3% 1,407 53 1,354 - 1,354 Asia 1,093 28.7% 23.9% 23.9% 237 (17) 254 - 254 Latin America & Canada 251 (5.6)% 1.2% 1.2% 3,484 $ (33) $ 3,517 $ - $ 3,517 $ PMI Total 3,072 $ 13.4% 14.5% 14.5% 2012 2011 % Change in Reported Operating Companies Income 2012 2011 % Change in Reported Net Revenues excluding Excise Taxes |
 PHILIP MORRIS INTERNATIONAL INC. and Subsidiaries Reconciliation of Non-GAAP Measures Reconciliation of Reported Operating Companies Income to Adjusted Operating Companies Income & Reconciliation of Adjusted Operating Companies Income Margin, excluding Currency and Acquisitions For the Quarters Ended March 31, ($ in millions) (Unaudited) 30 Reported Operating Companies Income Less Asset Impairment & Exit Costs Adjusted Operating Companies Income Less Currency Adjusted Operating Companies Income excluding Currency Less Acquisi- tions Adjusted Operating Companies Income excluding Currency & Acquisitions Reported Operating Companies Income Less Asset Impairment & Exit Costs Adjusted Operating Companies Income Adjusted Adjusted excluding Currency Adjusted excluding Currency & Acquisitions 1,030 $ - $ 1,030 $ (25) $ 1,055 $ - $ 1,055 $ European Union 1,006 $ (11) $ 1,017 $ 1.3% 3.7% 3.7% 810 - 810 (44) 854 - 854 EEMA 722 (2) 724 11.9% 18.0% 18.0% 1,407 - 1,407 53 1,354 - 1,354 Asia 1,093 (2) 1,095 28.5% 23.7% 23.7% 237 (8) 245 (17) 262 - 262 Latin America & Canada 251 (1) 252 (2.8)% 4.0% 4.0% 3,484 $ (8) $ 3,492 $ (33) $ 3,525 $ - $ 3,525 $ PMI Total 3,072 $ (16) $ 3,088 $ 13.1% 14.2% 14.2% % Points Change Adjusted Operating Companies Income excluding Currency Net Revenues excluding Excise Taxes & Currency (a) Adjusted Operating Companies Income Margin excluding Currency Adjusted Operating Companies Income excluding Currency & Acquisitions Net Revenues excluding Excise Taxes, Currency & Acquisitions (a) Adjusted Operating Companies Income Margin excluding Currency & Acquisitions Adjusted Operating Companies Income Net Revenues excluding Excise Taxes (a) Adjusted Operating Companies Income Margin Adjusted Operating Companies Income Margin excluding Currency Adjusted Operating Companies Income Margin excluding Currency & Acquisitions 1,055 $ 2,107 $ 50.1% 1,055 $ 2,107 $ 50.1% European Union 1,017 $ 2,001 $ 50.8% (0.7) (0.7) 854 1,908 44.8% 854 1,899 45.0% EEMA 724 1,687 42.9% 1.9 2.1 1,354 2,703 50.1% 1,354 2,702 50.1% Asia 1,095 2,323 47.1% 3.0 3.0 262 822 31.9% 262 822 31.9% Latin America & Canada 252 780 32.3% (0.4) (0.4) 3,525 $ 7,540 $ 46.8% 3,525 $ 7,530 $ 46.8% PMI Total 3,088 $ 6,791 $ 45.5% 1.3 1.3 2011 2012 2011 2012 % Change in Adjusted Operating Companies Income (a) For the calculation of net revenues excluding excise taxes, currency and acquisitions, refer to previous slide |
 PHILIP MORRIS INTERNATIONAL INC. and Subsidiaries Reconciliation of Non-GAAP Measures Reconciliation of Reported Diluted EPS to Adjusted Diluted EPS and Adjusted Diluted EPS, excluding Currency For the Quarters Ended March 31, (Unaudited) 31 2012 2011 % Change Reported Diluted EPS 1.25 $ 1.06 $ 17.9% Adjustments: Asset impairment and exit costs - 0.01 Tax items - (0.01) Adjusted Diluted EPS 1.25 $ 1.06 $ 17.9% Less: Currency impact (0.02) Adjusted Diluted EPS, excluding Currency 1.27 $ 1.06 $ 19.8% |
 PHILIP MORRIS INTERNATIONAL INC. and Subsidiaries Reconciliation of Non-GAAP Measures Reconciliation of Reported Diluted EPS to Adjusted Diluted EPS For the Year Ended December 31, (Unaudited) 32 2011 Reported Diluted EPS 4.85 $ Adjustments: Asset impairment and exit costs 0.05 Tax items (0.02) Adjusted Diluted EPS 4.88 $ |
 PHILIP MORRIS INTERNATIONAL INC. and Subsidiaries Reconciliation of Non-GAAP Measures Reconciliation of Operating Cash Flow to Free Cash Flow and Free Cash Flow, excluding Currency For the Quarters Ended March 31, ($ in millions) (Unaudited) (a) Operating Cash Flow 33 For the Quarters Ended March 31, 2012 2011 % Change Net cash provided by operating activities (a) 1,898 $ 2,395 $ (20.8)% Less: Capital expenditures 227 159 Free cash flow 1,671 $ 2,236 $ (25.3)% Less: Currency impact (50) Free cash flow, excluding currency 1,721 $ 2,236 $ (23.0)% |
 PMI Peer Groups Bayer BAT Coca-Cola Diageo GlaxoSmithKline Heineken Imperial Tobacco Johnson & Johnson Kraft McDonald’s Nestlé Novartis PepsiCo Pfizer Roche Unilever Vodafone Altria BAT Imperial Tobacco Japan Tobacco Lorillard Reynolds American Company Peer Group Tobacco Peer Group 34 |
 2012 First-Quarter Results April 19, 2012 |