|
2012 Third-Quarter Results October 18, 2012 Exhibit 99.3 |
|
2 Introduction Unless otherwise stated, we will be talking about results for the third- quarter 2012 and comparing them with the same period in 2011 References to PMI volumes refer to PMI shipment data, unless otherwise stated Industry volume and market shares are the latest data available from a number of internal and external sources Organic volume refers to volume excluding acquisitions Net revenues exclude excise taxes OCI stands for Operating Companies Income, which is defined as operating income before general corporate expenses and the amortization of intangibles. OCI growth rates are on an adjusted basis, which excludes asset impairment, exit and other costs Data tables showing adjustments to net revenues and OCI for currency, acquisitions, asset impairment, exit and other costs, free cash flow calculations, adjustments to EPS, and reconciliations to U.S. GAAP measures are at the end of today’s webcast slides and are posted on our web site |
|
3 Forward-Looking and Cautionary Statements This presentation and related discussion contain forward-looking statements. Achievement of projected results is subject to risks, uncertainties and inaccurate assumptions, and PMI is identifying important factors that, individually or in the aggregate, could cause actual results to differ materially from those contained in any forward-looking statements made by PMI PMI’s business risks include: significant increases in cigarette-related taxes; the imposition of discriminatory excise tax structures; fluctuations in customer inventory levels due to increases in product taxes and prices; increasing marketing and regulatory restrictions, often with the goal of preventing the use of tobacco products; health concerns relating to the use of tobacco products and exposure to environmental tobacco smoke; litigation related to tobacco use; intense competition; the effects of global and individual country economic, regulatory and political developments; changes in adult smoker behavior; lost revenues as a result of counterfeiting, contraband and cross-border purchases; governmental investigations; unfavorable currency exchange rates and currency devaluations; adverse changes in applicable corporate tax laws; adverse changes in the cost and quality of tobacco and other agricultural products and raw materials; and the integrity of its information systems. PMI’s future profitability may also be adversely affected should it be unsuccessful in its attempts to produce products with the potential to reduce the risk of smoking- related diseases; if it is unable to successfully introduce new products, promote brand equity, enter new markets or improve its margins through increased prices and productivity gains; if it is unable to expand its brand portfolio internally or through acquisitions and the development of strategic business relationships; or if it is unable to attract and retain the best global talent PMI is further subject to other risks detailed from time to time in its publicly filed documents, including the Form 10-Q for the quarter ended June 30, 2012. PMI cautions that the foregoing list of important factors is not a complete discussion of all potential risks and uncertainties. PMI does not undertake to update any forward-looking statement that it may make from time to time, except in the normal course of its public disclosure obligations |
|
4 2012 EPS Guidance Narrowed 2012 reported diluted EPS guidance range to $5.12 to $5.18, compared to $4.85 in 2011 New guidance includes: 23 cents for unfavorable currency 5 cents for tax charge 2 cents for asset impairment and exit costs Excluding the impact of currency, tax charge and asset impairment and exit costs, new guidance represents a growth rate of approximately 11% to 12% compared to adjusted diluted EPS of $4.88 in 2011 Source: PMI forecasts |
|
(a) Excluding currency and acquisitions (b) Excluding currency Source: PMI Financials Organic Cigarette Volume Net Revenues Adjusted OCI Adjusted Diluted EPS Q3, 2012 vs. PY Growth Rates Q3, 2012: Very Difficult Comparisons due to Exceptional Results in Q3, 2011 5 Q3, 2011 vs. PY Growth Rates Organic Cigarette Volume Net Revenues Adjusted OCI Adjusted Diluted EPS (a) (a) (b) (a) (a) (b) 40 (%) (2) 4.4 15.7 23.7 33.0 40 (2) (%) 3.4 4.5 5.8 (1.3) |
|
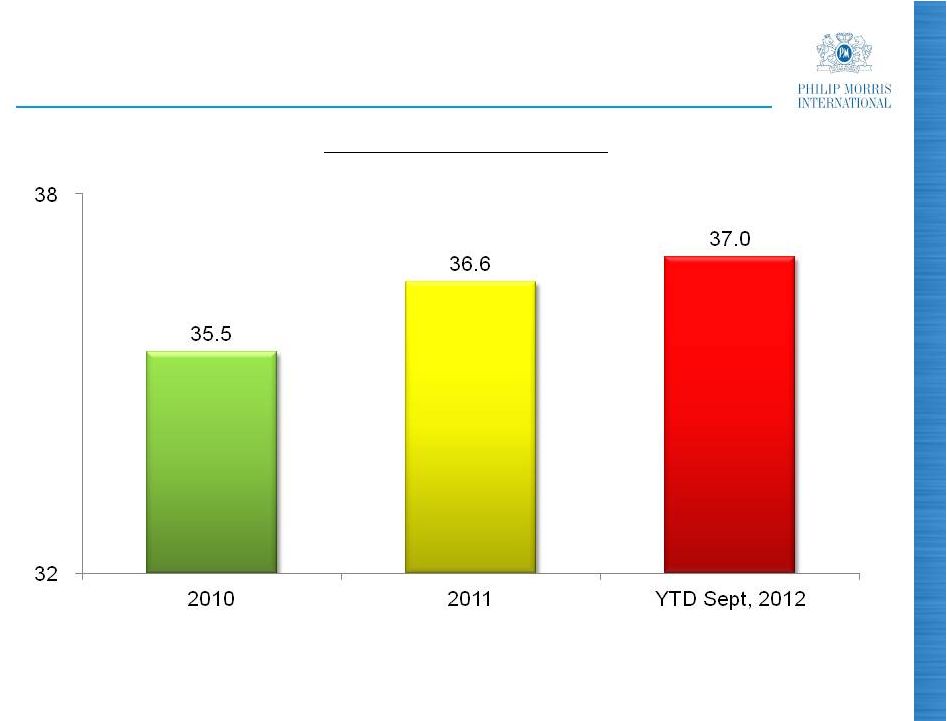
(a) Excluding currency and acquisitions (b) Excluding currency Source: PMI Financials Organic Cigarette Volume Net Revenues Adjusted OCI Adjusted Diluted EPS YTD Sept, 2012 vs. PY YTD Sept, 2012: Volume Growth and Strong Financial Results 6 (a) (a) (b) 12 (%) 0 0.7 5.4 6.9 10.9 |
|
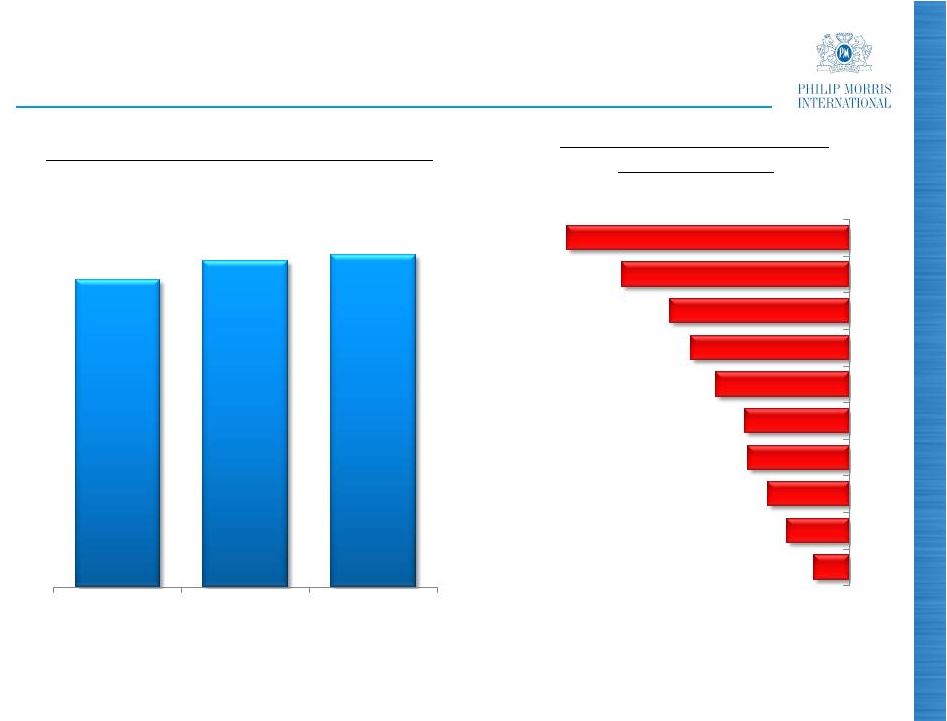
Spa. EU Region: Unemployment Depressing Cigarette Tax-Paid Volumes 7 Average Unemployment Rates in EU (%) Industry Volume Decline (%) Q3, 2012 vs. PY Gre. Port. Cze. Fra. Ita. UK Ger. Neth. Pol. Note: Gre. is Greece, Spa. is Spain, Ita. is Italy, Port. is Portugal, Pol. is Poland, Neth. is Netherlands, UK is United Kingdom, Fra. is France, Cze. is Czech Republic and Ger. is Germany Source: Eurostat and PMI estimates (2.0) (3.5) (4.6) (5.7) (5.9) (7.5) (8.9) (10.1) (12.8) (15.9) 9.7 10.3 10.5 August 2011 May 2012 August 2012 |
|
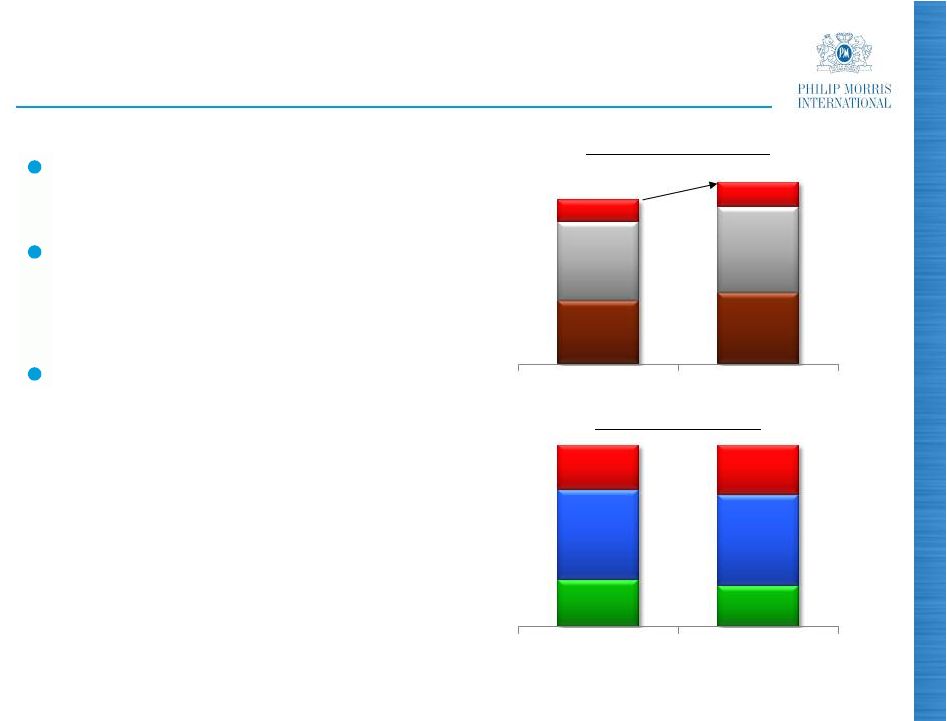
Note: Cigs. is cigarettes, Chest. is Chesterfield and PM is Philip Morris Source: PMI estimates 8 Italy: PMI Share Growth in Cigarettes and Fine Cut Adult smokers switching to lower-taxed fine cut, and illicit trade Cigarette industry volume declined by 10.1% in Q3 2012, while fine cut increased by 41% PMI share growth in cigarettes, driven by Marlboro, and fine cut, driven by Chesterfield Illicit trade incidence in 2012 estimated at around 9% Other Chest. Diana Total PMI Q3, 2011 Q3, 2012 PMI Market Shares (%) PM Cigs. Fine Cut Cigs. Fine Cut Marlboro |
|
Germany: Moderate Decline in Cigarette Market Cigarette industry volume decline of just 2.0% in Q3, 2012, and fine cut increased by 2.3% Marlboro gained share in Q3, 2012 to reach 21.0% of the cigarette category Other Chest. Marlboro Total PMI Q3, 2011 Q3, 2012 PMI Market Shares (%) L&M Cigs. Fine Cut Cigs. Fine Cut 9 Note: Cigs. is cigarettes and Chest. is Chesterfield Source: PMI estimates 20.8 2.7 21.0 2.7 10.3 5.6 10.2 5.2 4.6 5.1 35.2 14.7 35.2 14.7 |
|
10 EU Region: Good Underlying Business Performance But Tough Economic Conditions Organic cigarette volume decline of 8.1% in Q3, 2012 Organic fine cut volume increased 15.2% Marlboro cigarette market share grew by 0.4 points to 18.4% in Q3, 2012, with gains in Belgium, Germany, Greece, Italy and across Central Europe, notably Poland L&M cigarette market share down by 0.2 points to 6.5% Chesterfield cigarette market share up 0.3 points to 3.5% PMI overall share stable in cigarettes at 38.1% and up by 0.6 points to 13.4% in fine cut Net revenues and adjusted OCI, excluding currency, declined by 1.9% and 2.9%, respectively, in Q3, 2012 For full-year 2012, we expect to deliver a slight increase in profitability, excluding currency Source: PMI Financials, PMI estimates and PMI forecasts |
|
11 Asia Region: Indonesia Volume Gains, but Difficult Comparisons in Japan and Korea Q3, 2011 Q3, 2012 Volume: Japan (47.1 )% (13.4)% Korea (22.4 )% (8.9)% Indonesia (22.5 )% (13.0)% Total Asia Region (12.6 )% (0.6)% Adjusted OCI (a) 75.1 % 1.2 % % Change vs. Prior Year (a) Excluding currency and acquisitions Source: PMI Financials |
|
Source: PMI estimates and Tobacco Institute of Japan 12 Japan: Very Difficult Comparisons in Q3, 2012 Industry volume declined 7.7% compared to the distorted Q3, 2011 Full-year 2012 industry volume expected to be in line with 2011 PMI share of 27.5% in Q3, 2012 reflects continued positive trend for Marlboro Full-year 2012 market share expected to be slightly below 2011 exit share of approximately 28% PMI Market Share (%) 2012 2011 2012 Total PMI Other Lark Marlboro 12.0 12.5 12.4 8.7 8.2 8.4 7.2 6.8 7.0 27.9 27.5 27.8 Q3 Q3 YTD Sept |
|
Price Segments (%) Mid Low Premium (a) 13 Indonesia: Unique Growth Opportunity for PMI Industry volume expected to grow 6-7% for full year PMI volume up a further 13.0% and share grew 3.3 points in Q3, 2012 Decree 191 expected to be enforced by end of November PMI Market Share (%) Sampoerna A Other Kretek Q3, 2012 Q3, 2011 34.9 Marlboro Total PMI 3.3pp Q3, 2012 Q3, 2011 (a) Includes above premium Source: PMI estimates and PMI Financials 25.9 22.7 49.2 49.9 24.9 27.4 12.2 13.7 15.1 16.5 4.3 4.7 31.6 |
|
Plain Packaging: Australia The High Court issued its reasoning on plain packaging law Despite the Court’s decision, 6 of the 7 judges recognized that plain packaging deprives tobacco companies of valuable intellectual property The recognition that plain packaging results in a deprivation of property raises serious questions about the legality of plain packaging legislation in other jurisdictions Ruling turned on the specific nature of the Australian Constitution The High Court did not rule on whether plain packaging will reduce smoking prevalence or whether plain packaging breaches Australia’s international trade and treaty obligations The High Court ruling also confirms that other ongoing international legal cases are strong 14 |
|
Plain Packaging: Other International Challenges Three countries have already initiated proceedings against Australia before the World Trade Organization PM Asia is suing the Australian government for multiple breaches of its Bilateral Investment Treaty with Hong Kong Decisions in these cases are expected within two to three years The international legal cases are strong, and there is still a long way before all the legal questions about plain packaging are fully explored and resolved 15 |
|
Latin America & Canada: Solid Share Momentum Despite Volume Decline Strong Marlboro market share performance in Q3, 2012: Brazil Colombia Mexico 16 Growth Q3, 2012 vs. PY (%) Cigarette Volume (a) (a) +1.3pp to 8.2% PMI Market Shares Q3, 2011 Q3, 2012 Variance Argentina 73.9% 75.0% 1.1pp Brazil 13.3 14.8 1.5 Colombia 48.4 51.0 2.6 Mexico 73.2 73.6 0.4 +0.8pp to 53.6% +1.1pp to 6.0% (a) Excluding currency Source: PMI estimates and PMI Financials (4.9) 7.3 10.5 (6) 12 Net Revenues Adjusted OCI |
|
17 EEMA Region: Excellent Results Driven by Russia Q3, 2011 Q3, 2012 Volume: Russia (3.5)% (4.5 )% Turkey (21.6 )% (1.8)% Egypt (19.9)% (54.4 )% Total EEMA Region (5.1 )% (3.0)% Adjusted OCI (a) (13.8 )% (17.3 )% % Change vs. Prior Year (a) Excluding currency and acquisitions Source: PMI Financials |
|
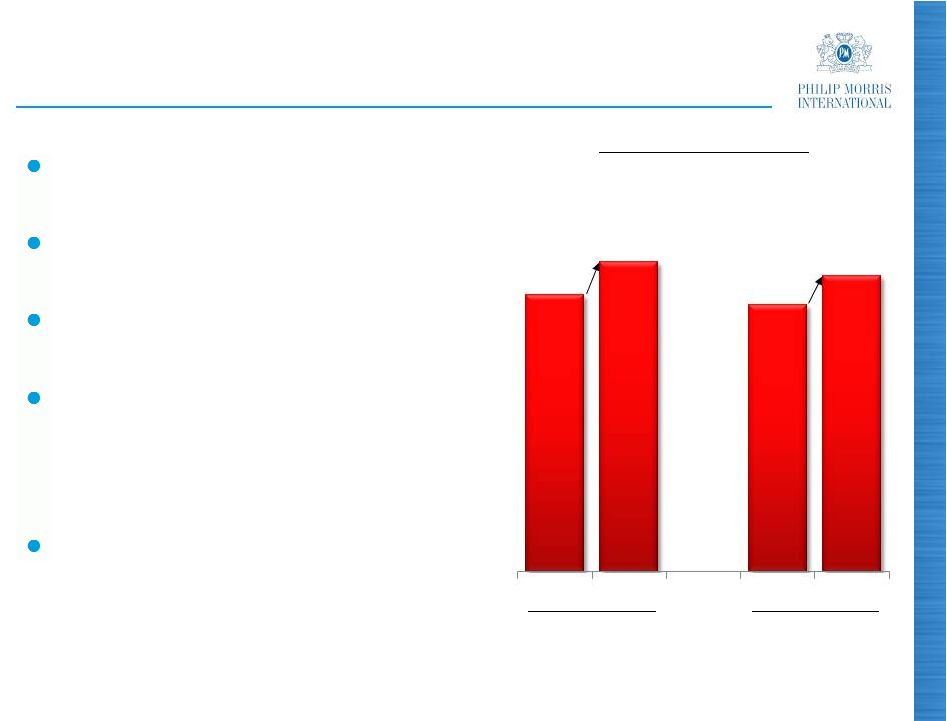
18 Russia: PMI Market Share Momentum RUB 3/pack July tax-driven price increase Industry volume expected to be down slightly in full-year 2012 PMI volume increased by 4.5% in Q3, 2012 PMI share momentum continued, as we leverage investments in brands and infrastructure Parliament, L&M, Bond Street and Next key drivers of market share expansion PMI Market Share (%) +0.6pp +0.7pp YTD August QTD August Source: PMI estimates, PMI Financials and Nielsen 25.8 26.5 25.6 26.2 2011 2012 2011 2012 |
|
2012 2013 2014 2015 Ad Valorem Excise Tax (% of RSP) 7.5% 8.0% 8.5% 9.0% Change vs. Prior Year 0.5pp 0.5pp 0.5pp 0.5pp Specific Excise Tax (RUB/000) 390 550 800 960 Growth -% 39.3% 41.0% 45.5% 20.0% Minimum Excise Tax (RUB/000) 510 730 1,040 1,250 Growth -% 41.7% 43.1% 42.5% 20.2% VAT 18% 18% 18% 18% Pass-On (RUB/pack) (a) 4 6 9 6 19 Russia: Excise Tax Structure Proposal (2013-2015) Government approved amendments to Tax Code in September 2013-2014 excise tax rates for cigarettes remain as per current Tax Code Duma to review by mid-November and vote by year-end Note: VAT is nominal (a) 2012 pass-on represents full year |
|
Market Shares 2009 2010 2011 YTD Sept 2012 Asia (a) 5.8% 6.1% 6.4% 6.5% EEMA 6.4 6.5 6.8 7.0 EU 18.4 18.2 18.0 18.2 LA&C 13.8 14.1 13.8 14.3 Total (a)(b) 9.0 9.1 9.2 9.3 Solid Marlboro Market Share Performance 20 (a) Excluding China (b) Also excluding the USA Source: PMI estimates |
|
Parliament: Double-Digit Volume Increase 21 Priced at a premium to Marlboro in most markets: superior margins Parliament volume increased by 10.7% in Q3, 2012, and by 9.4% YTD September, 2012 Parliament gained share in four of its most important markets this year PMI Market Shares YTD Sept, 2012 vs. PY (%) (a) (a) (a) (a) YTD August Note: Kaz. is Kazakhstan Source: PMI Financials, Nielsen, Hankook Research and PMI estimates YTD Sept, 2012 YTD Sept, 2011 |
|
PMI Expanding its Market Share 22 (%) Top 30 PMI OCI Markets (a) (a) Excluding duty free Note: Historical data adjusted for pro forma inclusion of business combination with Fortune Tobacco Corporation in the Philippines and Jordan acquisition Source: PMI Financials and PMI estimates |
|
1,500 23 Favorable Pricing Continued in Q3, 2012 0 Q1 Q2 Q3 Total Note: Variances at OCI level Source: PMI Financials ($ million) |
|
Adjusted OCI Margins YTD Sept 2011 YTD Sept 2012 (a) Variance (a) Asia (47.2 )% 47.9 % (0.7)pp EEMA (42.3 )% 45.4 (3.1 ) EU (51.0 )% 50.2 (0.8) LA&C (32.0 )% 32.1 (0.1 ) Total (45.5 )% 46.2 (0.7 ) Margin Expansion 24 (a) Excluding currency and acquisitions Source: PMI Financials |
|
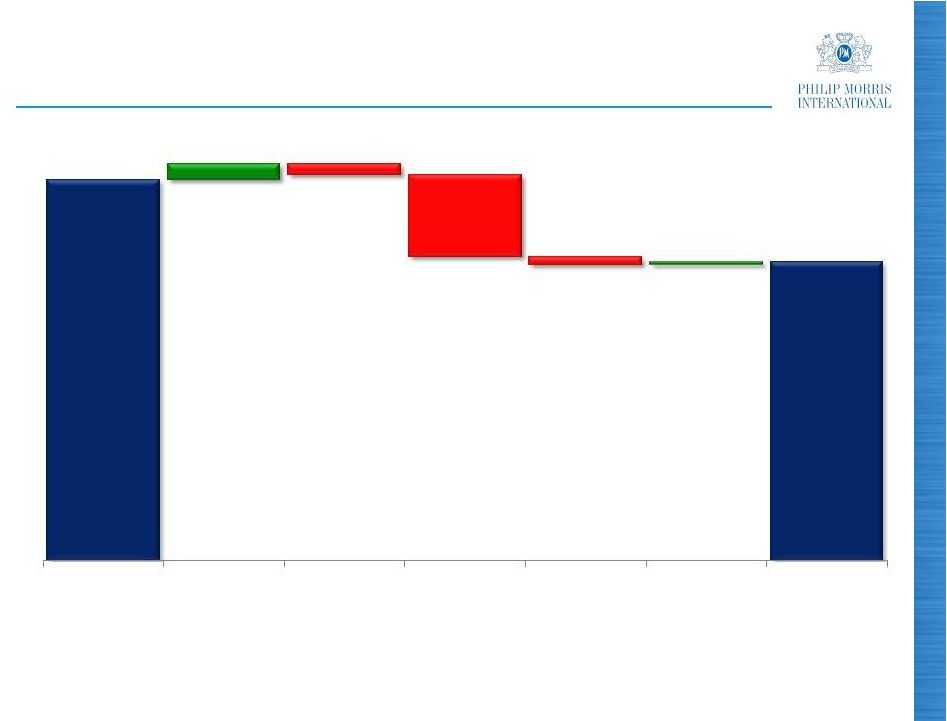
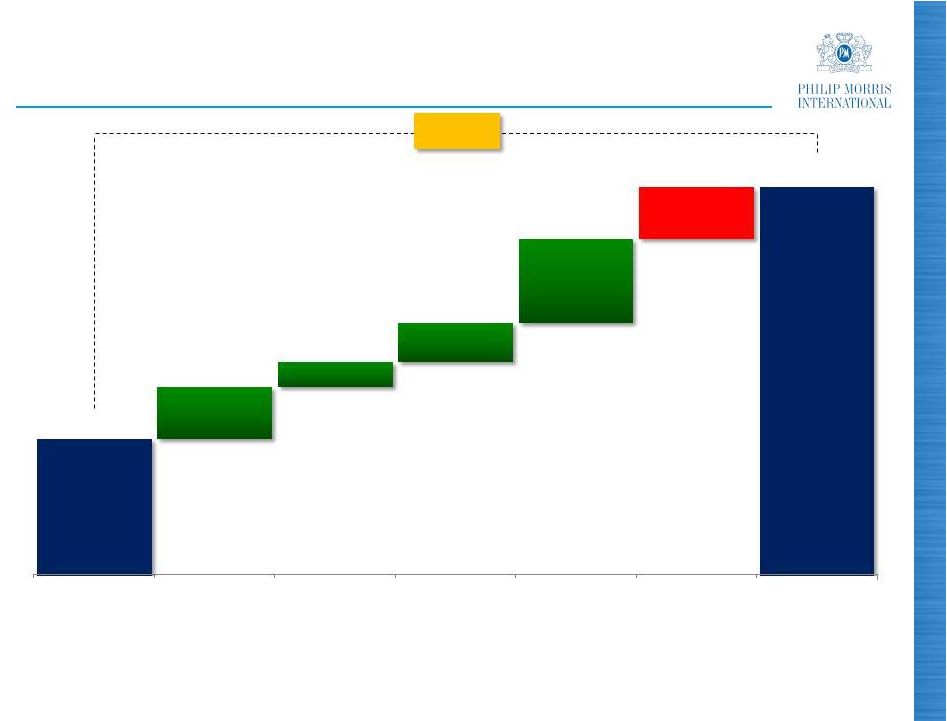
25 Free Cash Flow (a) Impacted by Currency and Working Capital Requirements ($ million) (a) Free cash flow equals net cash provided by operating activities less capital expenditures Source: PMI Financials YTD Sept 2011 Net Earnings Currency Working Capital Other YTD Sept 2012 Capital Expenditures 379 (270) (1,935) (197) 75 9,000 7,052 |
|
Very Significant Dividend Increases 26 Note: Dividends for 2008 and 2012 are annualized rates. 2008 annualized rate is based on a quarterly dividend of $0.46 per common share, declared June 18, 2008. The annualized rate for 2012 is based on a quarterly dividend of $0.85 per common share, declared September 12, 2012 Source: PMI Financials +84.8% +17.4% +7.4% +10.3% +20.3% +10.4% $1.84 $3.40 2008 Aug 2008 Sept 2009 Sept 2010 Sept 2011 Sept 2012 2012 |
|
27 Share Repurchase Program In Q3, 2012, PMI spent $1.5 billion to repurchase 16.7 million shares Since March 2008 spin through end of September 2012, $25.9 billion spent to repurchase 466.6 million shares, representing 22.1% of shares outstanding at that time, at an average price of $55.49 per share Target for 2012 remains $6 billion Source: PMI Financials |
|
Source: PMI Financials and PMI forecasts 28 Conclusion Q3, 2012, as expected, a difficult quarter due to tough comparisons Confident to achieve 1% organic volume annual growth target for 2012 driven by strong performances in EEMA and Asia Regions Narrowed 2012 reported diluted EPS guidance range to $5.12 to $5.18, compared to $4.85 in 2011 Excluding the impact of currency, tax charge and asset impairment and exit costs, new guidance represents a growth rate of approximately 11% to 12% compared to adjusted diluted EPS of $4.88 in 2011 Remain steadfast in our commitment to deliver superior returns to our shareholders |
|
2012 Third-Quarter Results Questions & Answers |

PHILIP MORRIS INTERNATIONAL INC. and Subsidiaries Reconciliation of Non-GAAP Measures Adjustments for the Impact of Currency and Acquisitions
For the Quarters Ended September 30,
($ in millions) (Unaudited)
% Change in Reported Net Revenues
2012 2011 excluding Excise Taxes
Reported Net
Reported Net Revenues
Revenues excluding Reported Net Reported
excluding Less Excise Taxes, Reported Less Revenues Reported excluding
Less Excise Taxes Acquisi- Currency & Net Excise excluding excluding Currency &
Reported Ne t Revenues Less Excise Taxes Reported Net Revenues excluding Excise Taxes Currency & Currency tions Acquisitions Revenues Taxes Excise Taxes Reported Currency Acquisitions
$ 6,904 $ 4,779 $ 2,125 $ (334) $ 2,459 $ - $ 2,459 European Union $ 8,155 $ 5,649 $ 2,506 (15.2)% (1.9)% (1.9)%
5,125 2,918 2,207 (211) 2,418 7 2,411 EEMA 4,921 2,711 2,210 (0.1)% 9.4% 9.1%
5,174 2,413 2,761 (104) 2,865 - 2,865 Asia 5,143 2,344 2,799 (1.4)% 2.4% 2.4%
2,389 1,562 827 (82) 909 - 909 Latin America & Canada 2,487 1,640 847 (2.4)% 7.3% 7.3%
$ 19,592 $ 11,672 $ 7,920 $ (731) $ 8,651 $ 7 $ 8,644 PMI Total $ 20,706 $ 12,344 $ 8,362 (5.3)% 3.5% 3.4%
% Change in Reported Operating
2012 2011 Companies Income
Reported
Reported Operating
Operating Companies
Reported Companies Income Reported Reported
Operating Income Less excluding Operating Reported excluding
Companies Less excluding Acquisi- Currency & Companies excluding Currency &
Income Currency Currency tions Acquisitions Income Reported Currency Acquisitions
$ 1,085 $ (151) $ 1,236 $ - $ 1,236 European Union $ 1,262 (14.0)% (2.1)% (2.1)%
1,047 (59) 1,106 2 1,104 EEMA 925 13.2% 19.6% 19.4%
1,297 (9) 1,306 - 1,306 Asia 1,309 (0.9)% (0.2)% (0.2)%
267 (17) 284 - 284 Latin America & Canada 255 4.7% 11.4% 11.4%
$ 3,696 $ (236) $ 3,932 $ 2 $ 3,930 PMI Total $ 3,751 (1.5)% 4.8% 4.8%
PHILIP MORRIS INTERNATIONAL INC. and Subsidiaries Reconciliation of Non-GAAP Measures
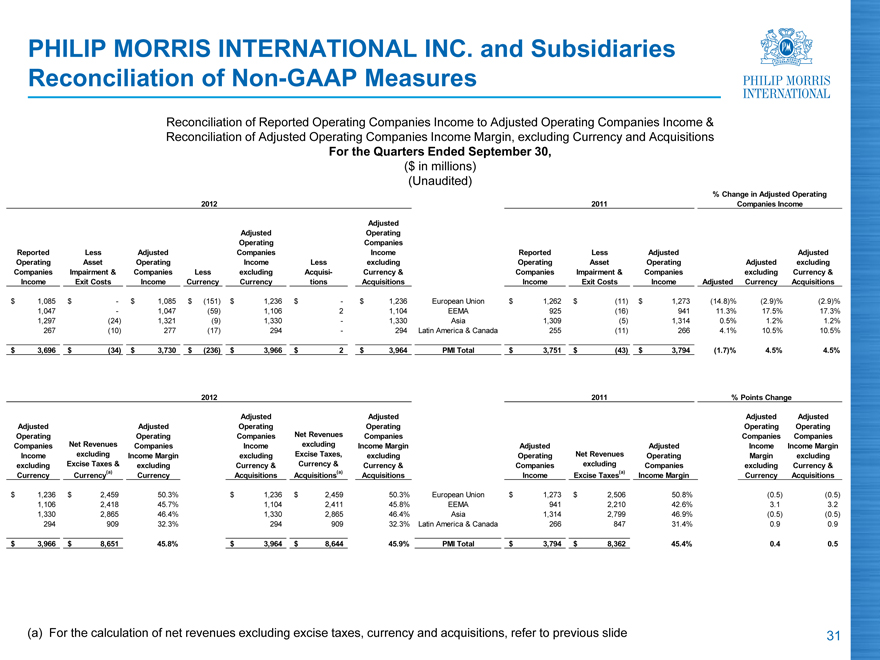
Reconciliation of Reported Operating Companies Income to Adjusted Operating Companies Income & Reconciliation of Adjusted Operating Companies Income Margin, excluding Currency and Acquisitions
For the Quarters Ended September 30,
($ in millions) (Unaudited)
% Change in Adjusted Operating
2012 2011 Companies Income
Adjusted
Adjusted Operating
Operating Companies
Reported Less Adjusted Companies Income Reported Less Adjusted Adjusted
Operating Asset Operating Income Less excluding Operating Asset Operating Adjusted excluding
Companies Impairment Companies Less excluding Acquisi- Currency & Companies Impairment Companies excluding Currency &
Income & Exit Costs Income Currency Currency tions Acquisitions Income & Exit Costs Income Adjusted Currency Acquisitions
$ 1,085 $ - $ 1,085 $ (151) $ 1,236 $ - $ 1,236 European Union $ 1,262 $ (11) $ 1,273 (14.8)% (2.9)% (2.9)%
1,047 - 1,047 (59) 1,106 2 1,104 EEMA 925 (16) 941 11.3% 17.5% 17.3%
1,297 (24) 1,321 (9) 1,330 - 1,330 Asia 1,309 (5) 1,314 0.5% 1.2% 1.2%
267 (10) 277 (17) 294 - 294 Latin America & Canada 255 (11) 266 4.1% 10.5% 10.5%
$ 3,696 $ (34) $ 3,730 $ (236) $ 3,966 $ 2 $ 3,964 PMI Total $ 3,751 $ (43) $ 3,794 (1.7)% 4.5% 4.5%
2012 2011 % Points Change
Adjusted Adjusted
Adjusted Adjusted Operating Adjusted Operating
Adjusted Operating Operating Companies Operating Companies
Operating Companies Companies Net Revenues Income Adjusted Companies Income
Companies Net Revenues Income Income excluding Margin Adjusted Net Revenues Operating Income Margin
Income excluding Margin excluding Excise Taxes, excluding Operating excluding Companies Margin excluding
excluding Excise Taxes excluding Currency & Currency & Currency & Companies Excise Income excluding Currency &
Currency & Currency(1) Currency Acquisitions Acquisitions(1) Acquisitions Income Taxes(1) Margin Currency Acquisitions
$ 1,236 $ 2,459 50.3% $ 1,236 $ 2,459 50.3% European Union $ 1,273 $ 2,506 50.8% (0.5) (0.5)
1,106 2,418 45.7% 1,104 2,411 45.8% EEMA 941 2,210 42.6% 3.1 3.2
1,330 2,865 46.4% 1,330 2,865 46.4% Asia 1,314 2,799 46.9% (0.5) (0.5)
294 909 32.3% 294 909 32.3% Latin America & Canada 266 847 31.4% 0.9 0.9
$ 3,966 $ 8,651 45.8% $ 3,964 $ 8,644 45.9% PMI Total $ 3,794 $ 8,362 45.4% 0.4 0.5
(1) For the calculation of net revenues excluding excise taxes, currency and acquisitions, refer to Schedule 10.
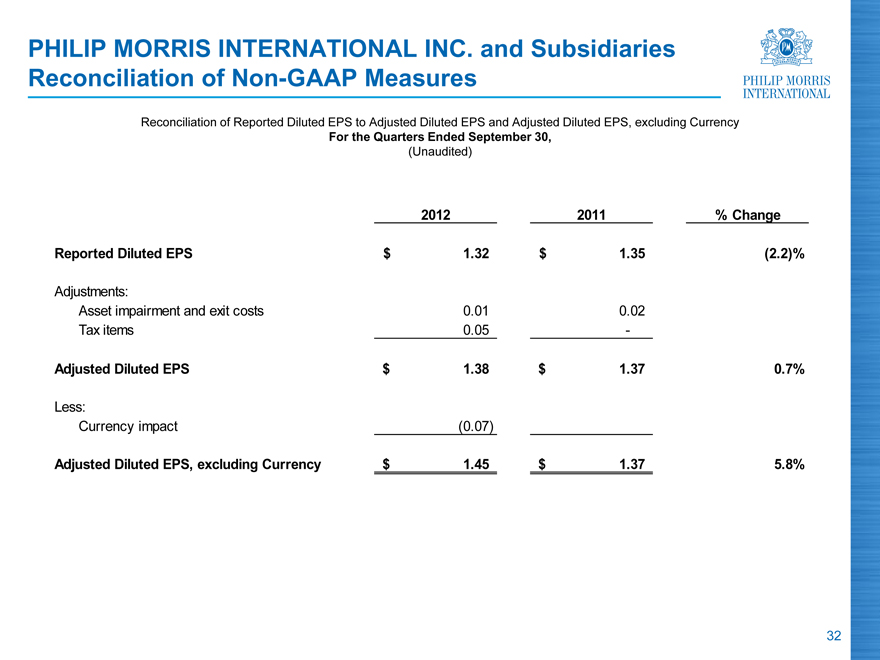
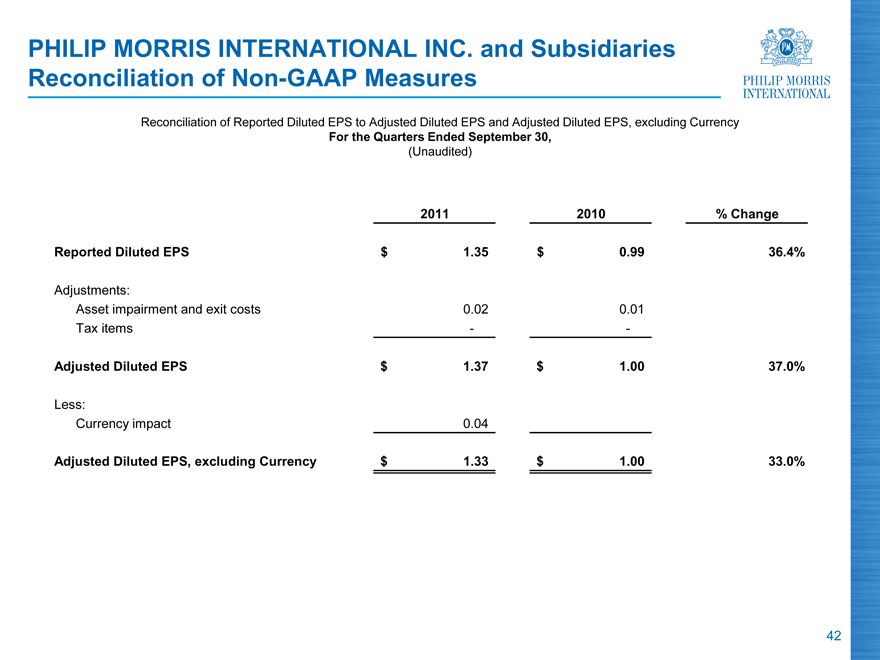
PHILIP MORRIS INTERNATIONAL INC. and Subsidiaries Reconciliation of Non-GAAP Measures Reconciliation of Reported Diluted EPS to Adjusted Diluted EPS and Adjusted Diluted EPS, excluding Currency
For the Quarters Ended September 30,
(Unaudited)
2012 2011 % Change
Reported Diluted EPS $ 1.32 $ 1.35 (2.2)%
Adjustments:
Asset impairment and exit costs 0.01 0.02
Tax items 0.05 -
Adjusted Diluted EPS $ 1.38 $ 1.37 0.7%
Less:
Currency impact (0.07)
Adjusted Diluted EPS, excluding Currency $ 1.45 $ 1.37 5.8%

PHILIP MORRIS INTERNATIONAL INC. and Subsidiaries Reconciliation of Non-GAAP Measures Reconciliation of Reported Diluted EPS to Reported Diluted EPS, excluding Currency
For the Quarters Ended September 30,
(Unaudited)
2012 2011 % Change
Reported Diluted EPS $ 1.32 $ 1.35 (2.2)%
Less:
Currency impact (0.07)
Reported Diluted EPS, excluding Currency $ 1.39 $ 1.35 3.0%
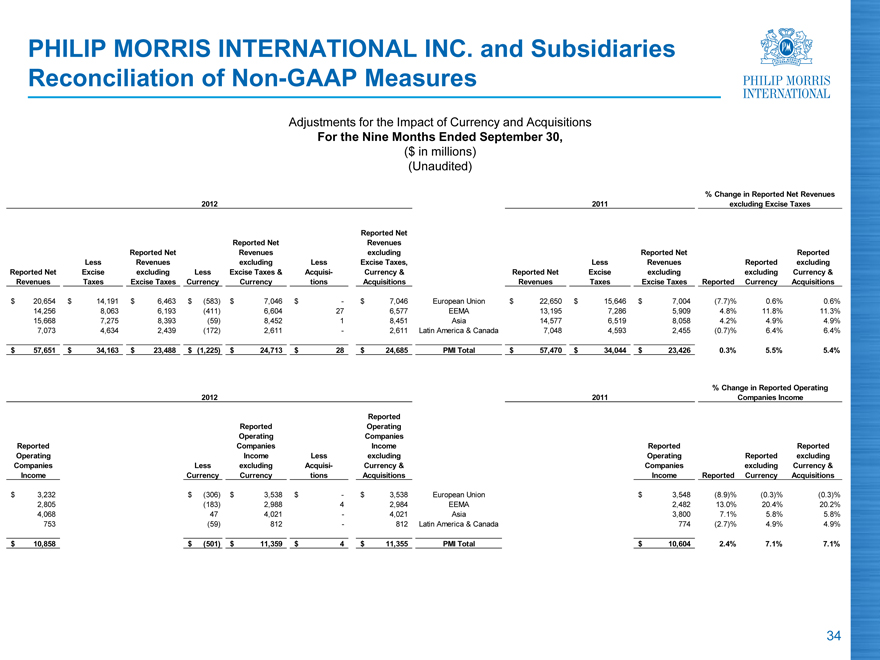
PHILIP MORRIS INTERNATIONAL INC. and Subsidiaries Reconciliation of Non-GAAP Measures Adjustments for the Impact of Currency and Acquisitions
For the Nine Months Ended September 30,
($ in millions) (Unaudited)
% Change in Reported Net Revenues
2012 2011 excluding Excise Taxes
Reported Net
Reported Net Revenues
Reported Net Revenues excluding Reported Net Reported
Less Revenues excluding Less Excise Taxes, Reported Less Revenues Reported excluding
Reported Net Excise excluding Less Excise Taxes Acquisi- Currency & Net Excise excluding excluding Currency &
Revenues Taxes Excise Taxes Currency & Currency tions Acquisitions Revenues Taxes Excise Taxes Reported Currency Acquisitions
$ 20,654 $ 14,191 $ 6,463 $ (583) $ 7,046 $ - $ 7,046 European Union $ 22,650 $ 15,646 $ 7,004 (7.7)% 0.6% 0.6%
14,256 8,063 6,193 (411) 6,604 27 6,577 EEMA 13,195 7,286 5,909 4.8% 11.8% 11.3%
15,668 7,275 8,393 (59) 8,452 1 8,451 Asia 14,577 6,519 8,058 4.2% 4.9% 4.9%
7,073 4,634 2,439 (172) 2,611 - 2,611 Latin America & Canada 7,048 4,593 2,455 (0.7)% 6.4% 6.4%
$ 57,651 $ 34,163 $ 23,488 $ (1,225) $ 24,713 $ 28 $ 24,685 PMI Total $ 57,470 $ 34,044 $ 23,426 0.3% 5.5% 5.4%
% Change in Reported Operating
2012 2011 Companies Income
Reported
Reported Operating
Operating Companies
Reported Companies Income Reported Reported
Operating Income Less excluding Operating Reported excluding
Companies Less excluding Acquisi- Currency & Companies excluding Currency &
Income Currency Currency tions Acquisitions Income Reported Currency Acquisitions
$ 3,232 $ (306) $ 3,538 $ - $ 3,538 European Union $ 3,548 (8.9)% (0.3)% (0.3)%
2,805 (183) 2,988 4 2,984 EEMA 2,482 13.0% 20.4% 20.2%
4,068 47 4,021 - 4,021 Asia 3,800 7.1% 5.8% 5.8%
753 (59) 812 - 812 Latin America & Canada 774 (2.7)% 4.9% 4.9%
$ 10,858 $ (501) $ 11,359 $ 4 $ 11,355 PMI Total $ 10,604 2.4% 7.1% 7.1%
PHILIP MORRIS INTERNATIONAL INC. and Subsidiaries Reconciliation of Non-GAAP Measures
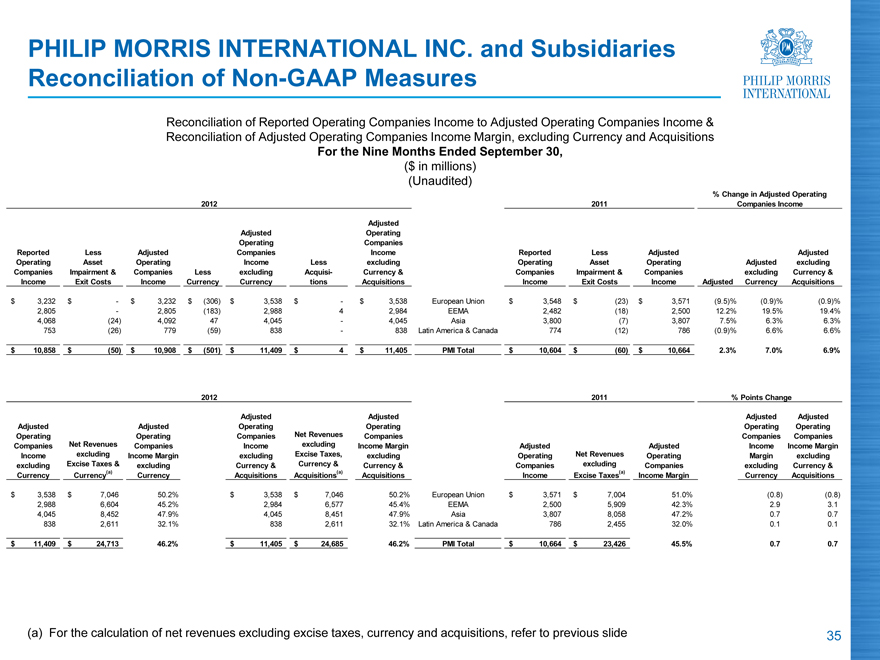
Reconciliation of Reported Operating Companies Income to Adjusted Operating Companies Income & Reconciliation of Adjusted Operating Companies Income Margin, excluding Currency and Acquisitions
For the Nine Months Ended September 30,
($ in millions) (Unaudited)
% Change in Adjusted Operating
2012 2011 Companies Income
Adjusted
Adjusted Operating
Operating Companies
Reported Less Adjusted Companies Income Reported Less Adjusted Adjusted
Operating Asset Operating Income Less excluding Operating Asset Operating Adjusted excluding
Companies Impairment Companies Less excluding Acquisi- Currency & Companies Impairment Companies excluding Currency &
Income & Exit Costs Income Currency Currency tions Acquisitions Income & Exit Costs Income Adjusted Currency Acquisitions
$ 3,232 $ - $ 3,232 $ (306) $ 3,538 $ - $ 3,538 European Union $ 3,548 $ (23) $ 3,571 (9.5)% (0.9)% (0.9)%
2,805 - 2,805 (183) 2,988 4 2,984 EEMA 2,482 (18) 2,500 12.2% 19.5% 19.4%
4,068 (24) 4,092 47 4,045 - 4,045 Asia 3,800 (7) 3,807 7.5% 6.3% 6.3%
753 (26) 779 (59) 838 - 838 Latin America & Canada 774 (12) 786 (0.9)% 6.6% 6.6%
$ 10,858 $ (50) $ 10,908 $ (501) $ 11,409 $ 4 $ 11,405 PMI Total $ 10,604 $ (60) $ 10,664 2.3% 7.0% 6.9%
2012 2011 % Points Change
Adjusted Adjusted
Adjusted Adjusted Operating Adjusted Operating
Adjusted Operating Operating Companies Operating Companies
Operating Companies Companies Net Revenues Income Adjusted Companies Income
Companies Net Revenues Income Income excluding Margin Adjusted Net Revenues Operating Income Margin
Income excluding Margin excluding Excise Taxes, excluding Operating excluding Companies Margin excluding
excluding Excise Taxes excluding Currency & Currency & Currency & Companies Excise Income excluding Currency &
Currency & Currency(1) Currency Acquisitions Acquisitions(1) Acquisitions Income Taxes(1) Margin Currency Acquisitions
$ 3,538 $ 7,046 50.2% $ 3,538 $ 7,046 50.2% European Union $ 3,571 $ 7,004 51.0% (0.8) (0.8)
2,988 6,604 45.2% 2,984 6,577 45.4% EEMA 2,500 5,909 42.3% 2.9 3.1
4,045 8,452 47.9% 4,045 8,451 47.9% Asia 3,807 8,058 47.2% 0.7 0.7
838 2,611 32.1% 838 2,611 32.1% Latin America & Canada 786 2,455 32.0% 0.1 0.1
$ 11,409 $ 24,713 46.2% $ 11,405 $ 24,685 46.2% PMI Total $ 10,664 $ 23,426 45.5% 0.7 0.7
(1) For the calculation of net revenues excluding excise taxes, currency and acquisitions, refer to Schedule 14.
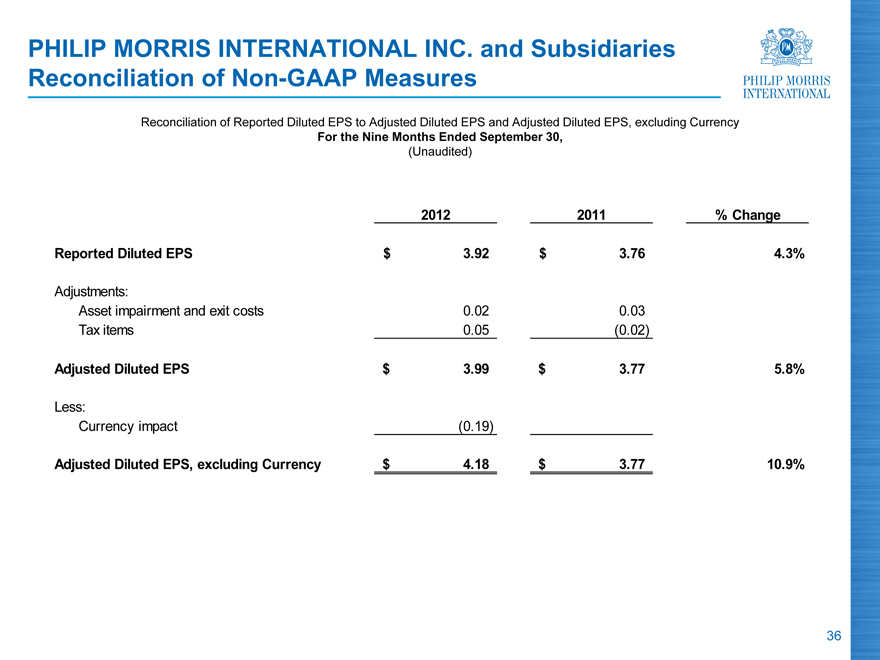
PHILIP MORRIS INTERNATIONAL INC. and Subsidiaries Reconciliation of Non-GAAP Measures Reconciliation of Reported Diluted EPS to Adjusted Diluted EPS and Adjusted Diluted EPS, excluding Currency
For the Nine Months Ended September 30,
(Unaudited)
2012 2011 % Change
Reported Diluted EPS $ 3.92 $ 3.76 4.3%
Adjustments:
Asset impairment and exit costs 0.02 0.03
Tax items 0.05 (0.02)
Adjusted Diluted EPS $ 3.99 $ 3.77 5.8%
Less:
Currency impact (0.19)
Adjusted Diluted EPS, excluding Currency $ 4.18 $ 3.77 10.9%
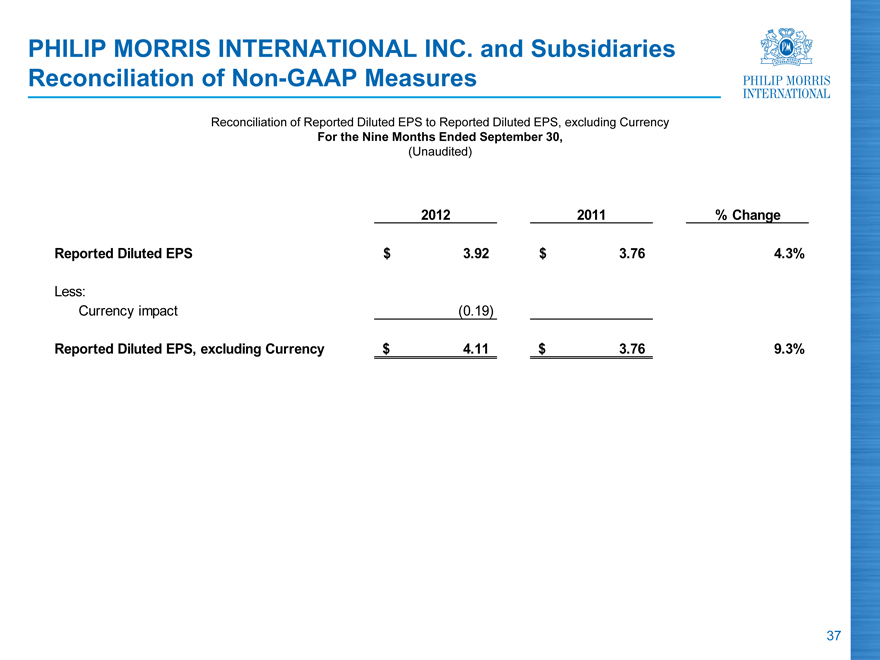
PHILIP MORRIS INTERNATIONAL INC. and Subsidiaries Reconciliation of Non-GAAP Measures Reconciliation of Reported Diluted EPS to Reported Diluted EPS, excluding Currency
For the Nine Months Ended September 30,
(Unaudited)
2012 2011 % Change
Reported Diluted EPS $ 3.92 $ 3.76 4.3%
Less:
Currency impact (0.19)
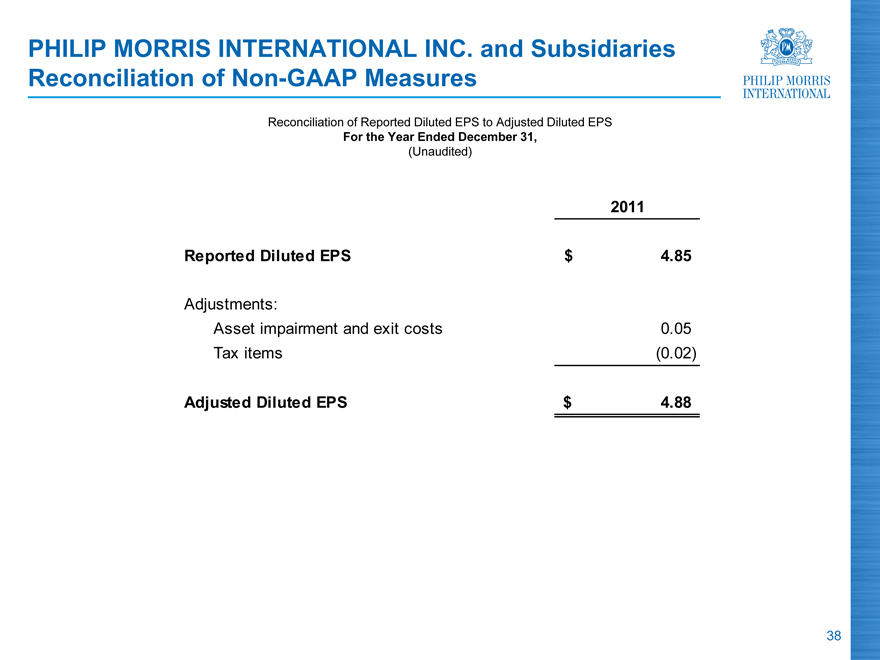
PHILIP MORRIS INTERNATIONAL INC. and Subsidiaries Reconciliation of Non-GAAP Measures
Reconciliation of Reported Diluted EPS to Adjusted Diluted EPS
For the Year Ended December 31,
(Unaudited)
2011
Reported Diluted EPS $ 4.85
Adjustments:
Asset impairment and exit costs 0.05
Tax items (0.02)
Adjusted Diluted EPS $ 4.88
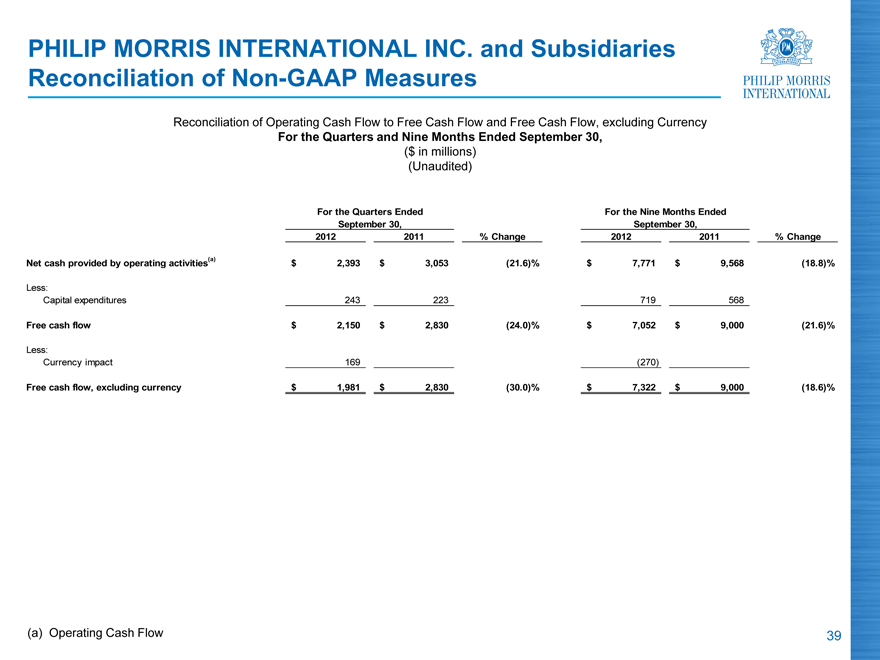
PHILIP MORRIS INTERNATIONAL INC. and Subsidiaries Reconciliation of Non-GAAP Measures
Reconciliation of Operating Cash Flow to Free Cash Flow and Free Cash Flow, excluding Currency Reconciliation of Operating Cash Flow to Operating Cash Flow, excluding Currency
For the Quarters and Nine Months Ended September 30,
($ in millions) (Unaudited)
For the Quarters Ended For the Nine Months Ended
September 30, September 30,
2012 2011 % Change 2012 2011 % Change
Net cash provided by operating activities(a) $ 2,393 $ 3,053 (21.6)% $ 7,771 $ 9,568 (18.8)%
Less:
Capital expenditures 243 223 719 568
Free cash flow $ 2,150 $ 2,830 (24.0)% $ 7,052 $ 9,000 (21.6)%
Less:
Currency impact 169 (270)
Free cash flow, excluding currency $ 1,981 $ 2,830 (30.0)% $ 7,322 $ 9,000 (18.6)%
For the Quarters Ended For the Nine Months Ended
September 30, September 30,
2012 2011 % Change 2012 2011 % Change
Net cash provided by operating activities(a) $ 2,393 $ 3,053 (21.6)% $ 7,771 $ 9,568 (18.8)%
Less:
Currency impact 139 (316)
Net cash provided by operating activities,
excluding currency $ 2,254 $ 3,053 (26.2)% $ 8,087 $ 9,568 (15.5)%
(a) Operating cash flow.

PHILIP MORRIS INTERNATIONAL INC. and Subsidiaries Reconciliation of Non-GAAP Measures Adjustments for the Impact of Currency and Acquisitions
For the Quarters Ended September 30,
($ in millions) (Unaudited)
% Change in Reported Net Revenues
2012 2011 excluding Excise Taxes
Reported Net
Reported Net Revenues
Revenues excluding Reported Net Reported
excluding Less Excise Taxes, Reported Less Revenues Reported excluding
Less Excise Taxes Acquisi- Currency & Net Excise excluding excluding Currency &
Reported Ne t Revenues Less Excise Taxes Reported Net Revenues excluding Excise Taxes Currency & Currency tions Acquisitions Revenues Taxes Excise Taxes Reported Currency Acquisitions
$ 6,904 $ 4,779 $ 2,125 $ (334) $ 2,459 $ - $ 2,459 European Union $ 8,155 $ 5,649 $ 2,506 (15.2)% (1.9)% (1.9)%
5,125 2,918 2,207 (211) 2,418 7 2,411 EEMA 4,921 2,711 2,210 (0.1)% 9.4% 9.1%
5,174 2,413 2,761 (104) 2,865 - 2,865 Asia 5,143 2,344 2,799 (1.4)% 2.4% 2.4%
2,389 1,562 827 (82) 909 - 909 Latin America & Canada 2,487 1,640 847 (2.4)% 7.3% 7.3%
$ 19,592 $ 11,672 $ 7,920 $ (731) $ 8,651 $ 7 $ 8,644 PMI Total $ 20,706 $ 12,344 $ 8,362 (5.3)% 3.5% 3.4%
% Change in Reported Operating
2012 2011 Companies Income
Reported
Reported Operating
Operating Companies
Reported Companies Income Reported Reported
Operating Income Less excluding Operating Reported excluding
Companies Less excluding Acquisi- Currency & Companies excluding Currency &
Income Currency Currency tions Acquisitions Income Reported Currency Acquisitions
$ 1,085 $ (151) $ 1,236 $ - $ 1,236 European Union $ 1,262 (14.0)% (2.1)% (2.1)%
1,047 (59) 1,106 2 1,104 EEMA 925 13.2% 19.6% 19.4%
1,297 (9) 1,306 - 1,306 Asia 1,309 (0.9)% (0.2)% (0.2)%
267 (17) 284 - 284 Latin America & Canada 255 4.7% 11.4% 11.4%
$ 3,696 $ (236) $ 3,932 $ 2 $ 3,930 PMI Total $ 3,751 (1.5)% 4.8% 4.8%

PHILIP MORRIS INTERNATIONAL INC. and Subsidiaries Reconciliation of Non-GAAP Measures
Reconciliation of Reported Operating Companies Income to Adjusted Operating Companies Income & Reconciliation of Adjusted Operating Companies Income Margin, excluding Currency and Acquisitions
For the Quarters Ended September 30,
($ in millions) (Unaudited)
% Change in Adjusted Operating
2012 2011 Companies Income
Adjusted
Adjusted Operating
Operating Companies
Reported Less Adjusted Companies Income Reported Less Adjusted Adjusted
Operating Asset Operating Income Less excluding Operating Asset Operating Adjusted excluding
Companies Impairment Companies Less excluding Acquisi- Currency & Companies Impairment Companies excluding Currency &
Income & Exit Costs Income Currency Currency tions Acquisitions Income & Exit Costs Income Adjusted Currency Acquisitions
$ 1,085 $ - $ 1,085 $ (151) $ 1,236 $ - $ 1,236 European Union $ 1,262 $ (11) $ 1,273 (14.8)% (2.9)% (2.9)%
1,047 - 1,047 (59) 1,106 2 1,104 EEMA 925 (16) 941 11.3% 17.5% 17.3%
1,297 (24) 1,321 (9) 1,330 - 1,330 Asia 1,309 (5) 1,314 0.5% 1.2% 1.2%
267 (10) 277 (17) 294 - 294 Latin America & Canada 255 (11) 266 4.1% 10.5% 10.5%
$ 3,696 $ (34) $ 3,730 $ (236) $ 3,966 $ 2 $ 3,964 PMI Total $ 3,751 $ (43) $ 3,794 (1.7)% 4.5% 4.5%
2012 2011 % Points Change
Adjusted Adjusted
Adjusted Adjusted Operating Adjusted Operating
Adjusted Operating Operating Companies Operating Companies
Operating Companies Companies Net Revenues Income Adjusted Companies Income
Companies Net Revenues Income Income excluding Margin Adjusted Net Revenues Operating Income Margin
Income excluding Margin excluding Excise Taxes, excluding Operating excluding Companies Margin excluding
excluding Excise Taxes excluding Currency & Currency & Currency & Companies Excise Income excluding Currency &
Currency & Currency(1) Currency Acquisitions Acquisitions(1) Acquisitions Income Taxes(1) Margin Currency Acquisitions
$ 1,236 $ 2,459 50.3% $ 1,236 $ 2,459 50.3% European Union $ 1,273 $ 2,506 50.8% (0.5) (0.5)
1,106 2,418 45.7% 1,104 2,411 45.8% EEMA 941 2,210 42.6% 3.1 3.2
1,330 2,865 46.4% 1,330 2,865 46.4% Asia 1,314 2,799 46.9% (0.5) (0.5)
294 909 32.3% 294 909 32.3% Latin America & Canada 266 847 31.4% 0.9 0.9
$ 3,966 $ 8,651 45.8% $ 3,964 $ 8,644 45.9% PMI Total $ 3,794 $ 8,362 45.4% 0.4 0.5
(1) For the calculation of net revenues excluding excise taxes, currency and acquisitions, refer to Schedule 10.
PHILIP MORRIS INTERNATIONAL INC. and Subsidiaries Reconciliation of Non-GAAP Measures Reconciliation of Reported Diluted EPS to Adjusted Diluted EPS and Adjusted Diluted EPS, excluding Currency
For the Quarters Ended September 30,
(Unaudited)
2012 2011 % Change
Reported Diluted EPS $ 1.32 $ 1.35 (2.2)%
Adjustments:
Asset impairment and exit costs 0.01 0.02
Tax items 0.05 -
Adjusted Diluted EPS $ 1.38 $ 1.37 0.7%
Less:
Currency impact (0.07)
Adjusted Diluted EPS, excluding Currency $ 1.45 $ 1.37 5.8%
|
2012 Third-Quarter Results October 18, 2012 |