
Designing a Smoke-Free Future 2017 Fourth-Quarter and Full-Year Results February 8, 2018 Exhibit 99.3
2 Introduction ● Unless otherwise stated, we will be talking about results for the fourth-quarter and full- year 2017 and comparing them to the same period in 2016 ● Unless otherwise stated, references to total industry, total market, PMI volume and PMI market share performance reflect cigarettes and heated tobacco units ● A glossary of terms, adjustments and other calculations, as well as reconciliations to the most directly comparable U.S. GAAP measures, are at the end of today’s webcast slides, which are posted on our website ● "Reduced-risk products," or "RRPs," is the term PMI uses to refer to products that present, are likely to present, or have the potential to present less risk of harm to smokers who switch to these products versus continued smoking. PMI has a range of RRPs in various stages of development, scientific assessment and commercialization. Because PMI's RRPs do not burn tobacco, they produce far lower quantities of harmful and potentially harmful compounds than found in cigarette smoke
3 Forward-Looking and Cautionary Statements ● This presentation and related discussion contain projections of future results and other forward-looking statements. Achievement of future results is subject to risks, uncertainties and inaccurate assumptions. In the event that risks or uncertainties materialize, or underlying assumptions prove inaccurate, actual results could vary materially from those contained in such forward-looking statements. Pursuant to the "safe harbor" provisions of the Private Securities Litigation Reform Act of 1995, PMI is identifying important factors that, individually or in the aggregate, could cause actual results and outcomes to differ materially from those contained in any forward-looking statements made by PMI ● PMI's business risks include: excise tax increases and discriminatory tax structures; increasing marketing and regulatory restrictions that could reduce our competitiveness, eliminate our ability to communicate with adult consumers, or ban certain of our products; health concerns relating to the use of tobacco products and exposure to environmental tobacco smoke; litigation related to tobacco use; intense competition; the effects of global and individual country economic, regulatory and political developments, natural disasters and conflicts; changes in adult smoker behavior; lost revenues as a result of counterfeiting, contraband and cross-border purchases; governmental investigations; unfavorable currency exchange rates and currency devaluations, and limitations on the ability to repatriate funds; adverse changes in applicable corporate tax laws; adverse changes in the cost and quality of tobacco and other agricultural products and raw materials; and the integrity of its information systems. PMI's future profitability may also be adversely affected should it be unsuccessful in its attempts to produce and commercialize reduced-risk products or if regulation or taxation do not differentiate between such products and cigarettes; if it is unable to successfully introduce new products, promote brand equity, enter new markets or improve its margins through increased prices and productivity gains; if it is unable to expand its brand portfolio internally or through acquisitions and the development of strategic business relationships; or if it is unable to attract and retain the best global talent ● PMI is further subject to other risks detailed from time to time in its publicly filed documents, including the Form 10-Q for the quarter ended September 30, 2017. PMI cautions that the foregoing list of important factors is not a complete discussion of all potential risks and uncertainties. PMI does not undertake to update any forward-looking statement that it may make from time to time, except in the normal course of its public disclosure obligations
4 Note: TPSAC stands for the Tobacco Product Scientific Advisory Committee. FDA stands for the U.S. Food & Drug Administration. MRTP stands for Modified Risk Tobacco Product. PMTA stands for Premarket Tobacco Application. "Reduced-risk products," or "RRPs," is the term PMI uses too refer to products that present, are likely to present, or have the potential to present less risk of harm to smokers who switch to these products versus continued smoking 2018: TPSAC Meeting on PMI’s MRTP Applications for IQOS ● Part of FDA’s review of PMI’s request to commercialize IQOS in the U.S. as a MRTP ● Discussion reflected respect for the integrity of our scientific data and our commitment to bring IQOS to the U.S. ● TPSAC confirmed that the evidence supported the statement that switching completely to IQOS significantly reduces exposure to harmful chemicals ● Meeting was one step in a broader, on-going review of our MRTP applications by the FDA; recommendations and votes of TPSAC are advisory ● We look forward to working with the FDA to clarify any outstanding points ● PMI’s PMTA was not before TPSAC as it follows a parallel regulatory pathway
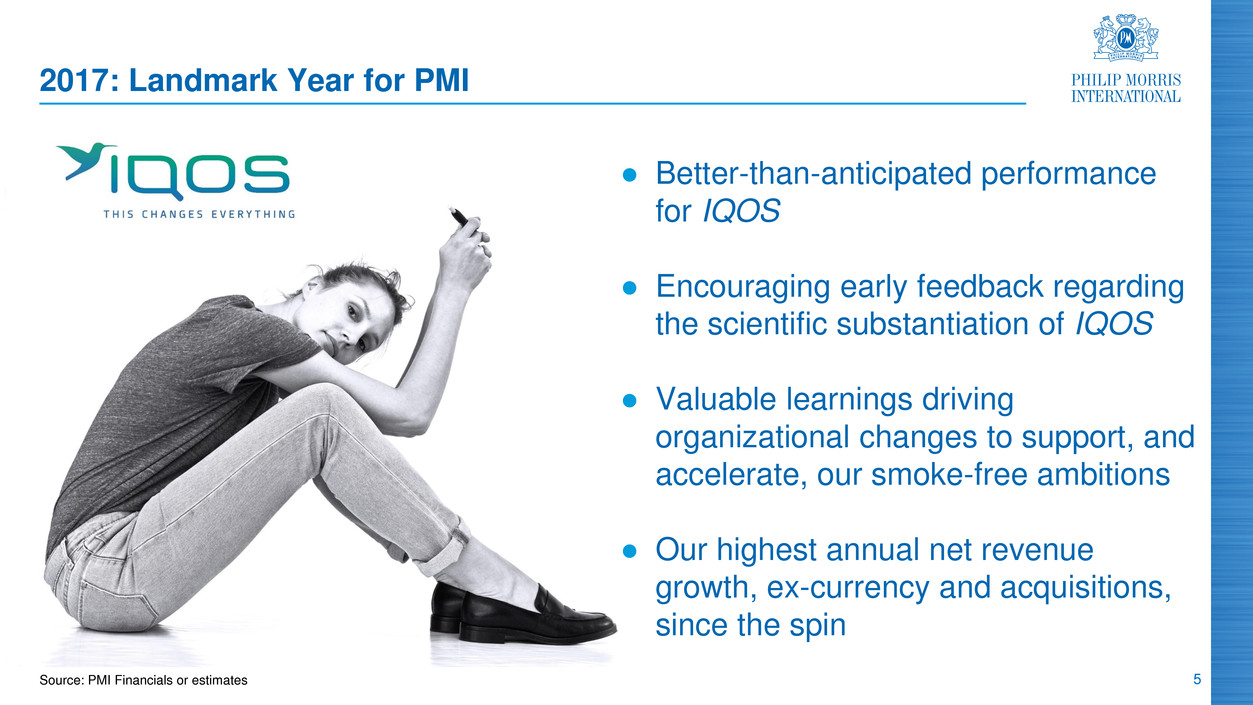
5 Source: PMI Financials or estimates 2017: Landmark Year for PMI ● Better-than-anticipated performance for IQOS ● Encouraging early feedback regarding the scientific substantiation of IQOS ● Valuable learnings driving organizational changes to support, and accelerate, our smoke-free ambitions ● Our highest annual net revenue growth, ex-currency and acquisitions, since the spin
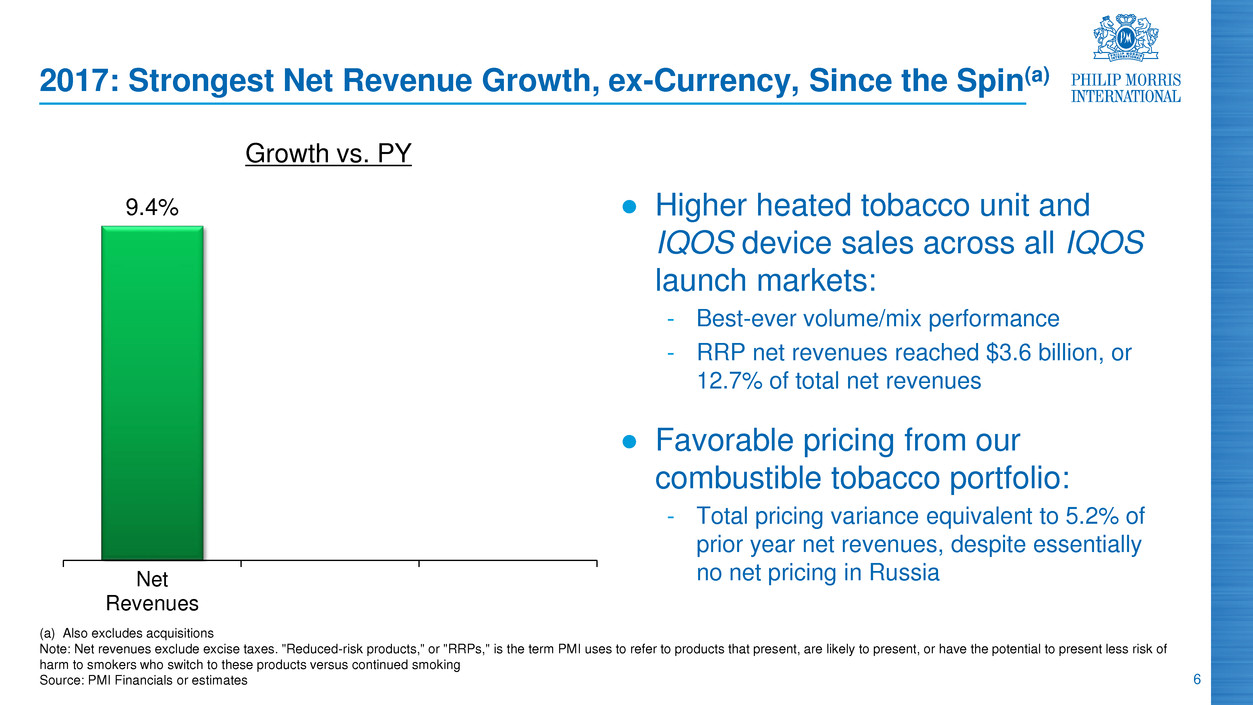
6 9.4% Net Revenues 2017: Strongest Net Revenue Growth, ex-Currency, Since the Spin(a) (a) Also excludes acquisitions Note: Net revenues exclude excise taxes. "Reduced-risk products," or "RRPs," is the term PMI uses to refer to products that present, are likely to present, or have the potential to present less risk of harm to smokers who switch to these products versus continued smoking Source: PMI Financials or estimates Growth vs. PY ● Higher heated tobacco unit and IQOS device sales across all IQOS launch markets: - Best-ever volume/mix performance - RRP net revenues reached $3.6 billion, or 12.7% of total net revenues ● Favorable pricing from our combustible tobacco portfolio: - Total pricing variance equivalent to 5.2% of prior year net revenues, despite essentially no net pricing in Russia
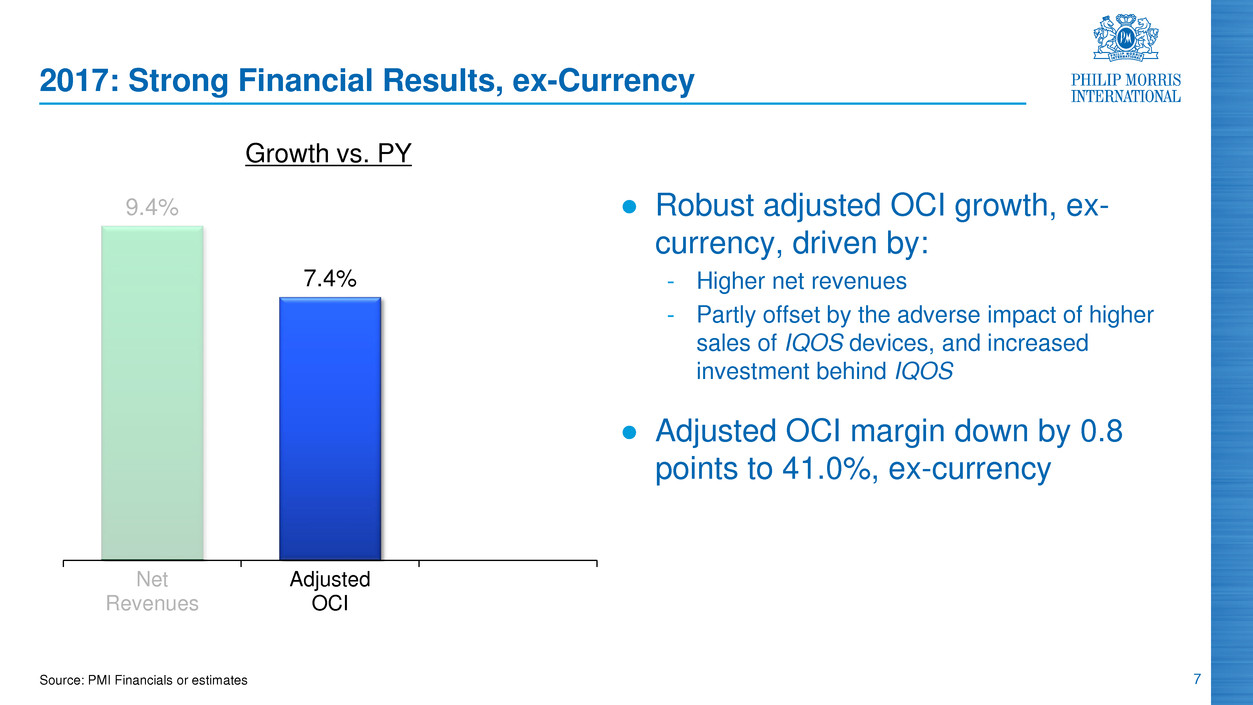
7 Source: PMI Financials or estimates 2017: Strong Financial Results, ex-Currency 9.4% 7.4% Net Revenues Adjusted OCI ● Robust adjusted OCI growth, ex- currency, driven by: - Higher net revenues - Partly offset by the adverse impact of higher sales of IQOS devices, and increased investment behind IQOS ● Adjusted OCI margin down by 0.8 points to 41.0%, ex-currency Growth vs. PY
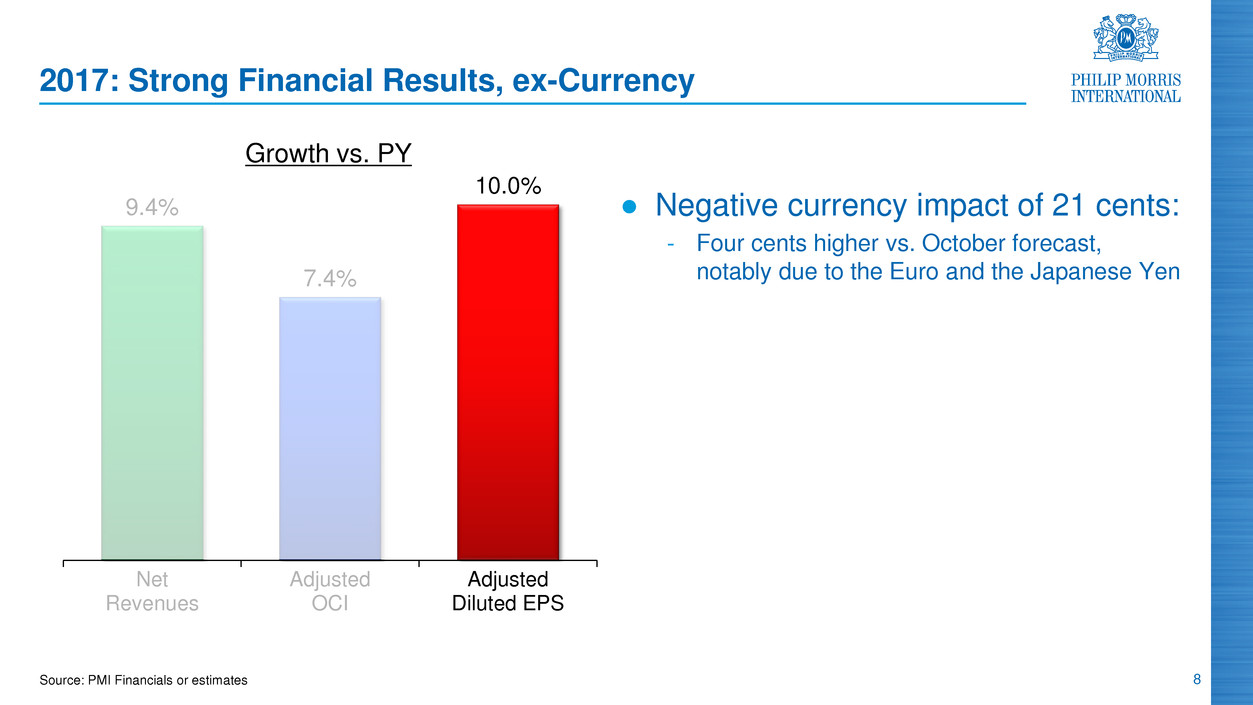
8 2017: Strong Financial Results, ex-Currency 9.4% 7.4% 10.0% Net Revenues Adjusted OCI Adjusted Diluted EPS Growth vs. PY Source: PMI Financials or estimates ● Negative currency impact of 21 cents: - Four cents higher vs. October forecast, notably due to the Euro and the Japanese Yen
9 2017: Operating Cash Flow(a) and Capital Expenditures ● Full-year operating cash flow increased by 10.3% to $8.9 billion ● Excluding currency, operating cash flow increased by 5.5% ● Capital expenditures increased by $376 million to reach $1.5 billion, reflecting higher investment behind heated tobacco unit production (a) Operating cash flow is defined as net cash provided by operating activities Source: PMI Financials or estimates
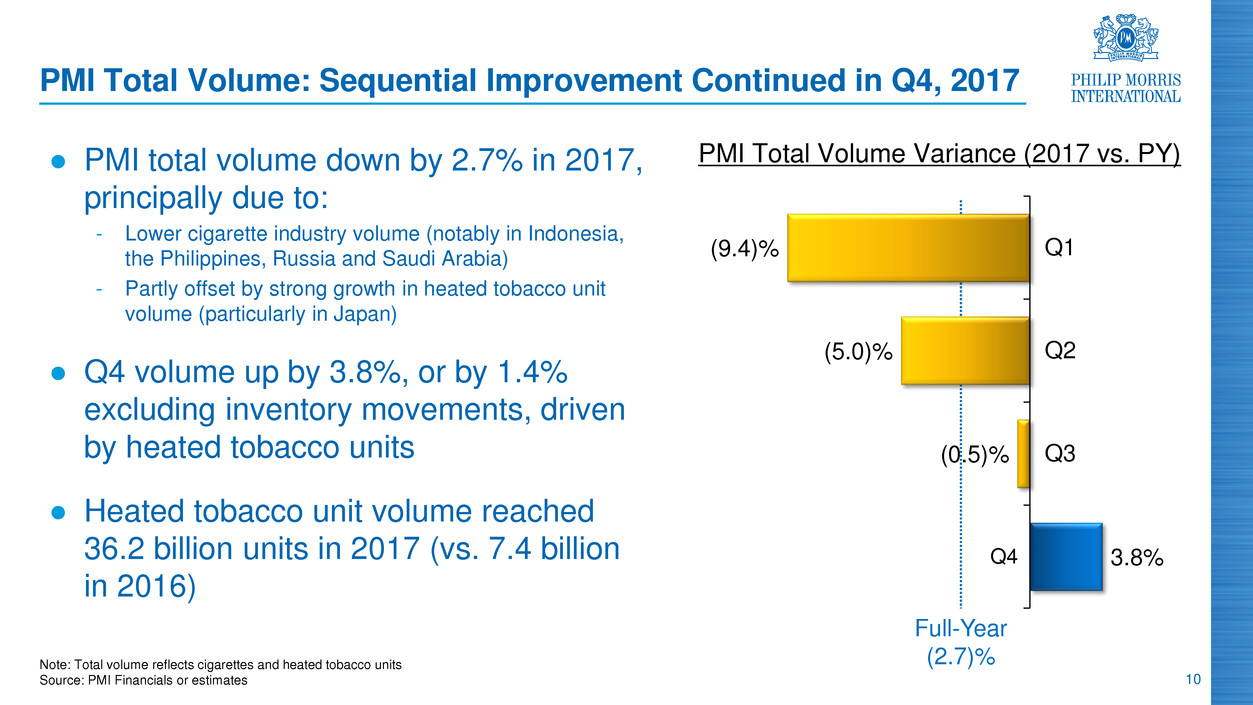
10 Full-Year (2.7)% Note: Total volume reflects cigarettes and heated tobacco units Source: PMI Financials or estimates PMI Total Volume: Sequential Improvement Continued in Q4, 2017 ● PMI total volume down by 2.7% in 2017, principally due to: - Lower cigarette industry volume (notably in Indonesia, the Philippines, Russia and Saudi Arabia) - Partly offset by strong growth in heated tobacco unit volume (particularly in Japan) ● Q4 volume up by 3.8%, or by 1.4% excluding inventory movements, driven by heated tobacco units ● Heated tobacco unit volume reached 36.2 billion units in 2017 (vs. 7.4 billion in 2016) 3.8% (0.5)% (5.0)% (9.4)% Q4 PMI Total Volume Variance (2017 vs. PY) Q2 Q3 Q1
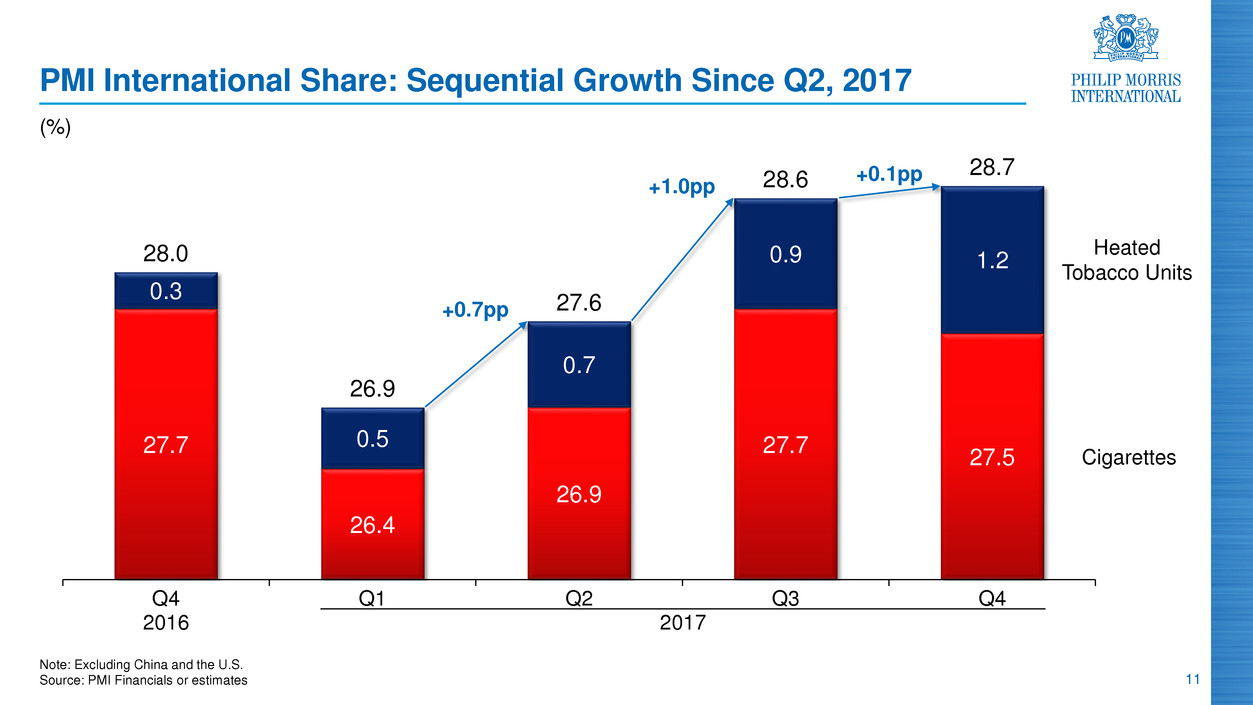
11 PMI International Share: Sequential Growth Since Q2, 2017 Note: Excluding China and the U.S. Source: PMI Financials or estimates 27.7 26.4 26.9 27.7 27.5 0.3 0.5 0.7 0.9 1.2 28.0 26.9 27.6 28.6 28.7 Q4 2016 Q1 Q2 Q3 Q4 Cigarettes +0.7pp +1.0pp Heated Tobacco Units +0.1pp 2017 (%)
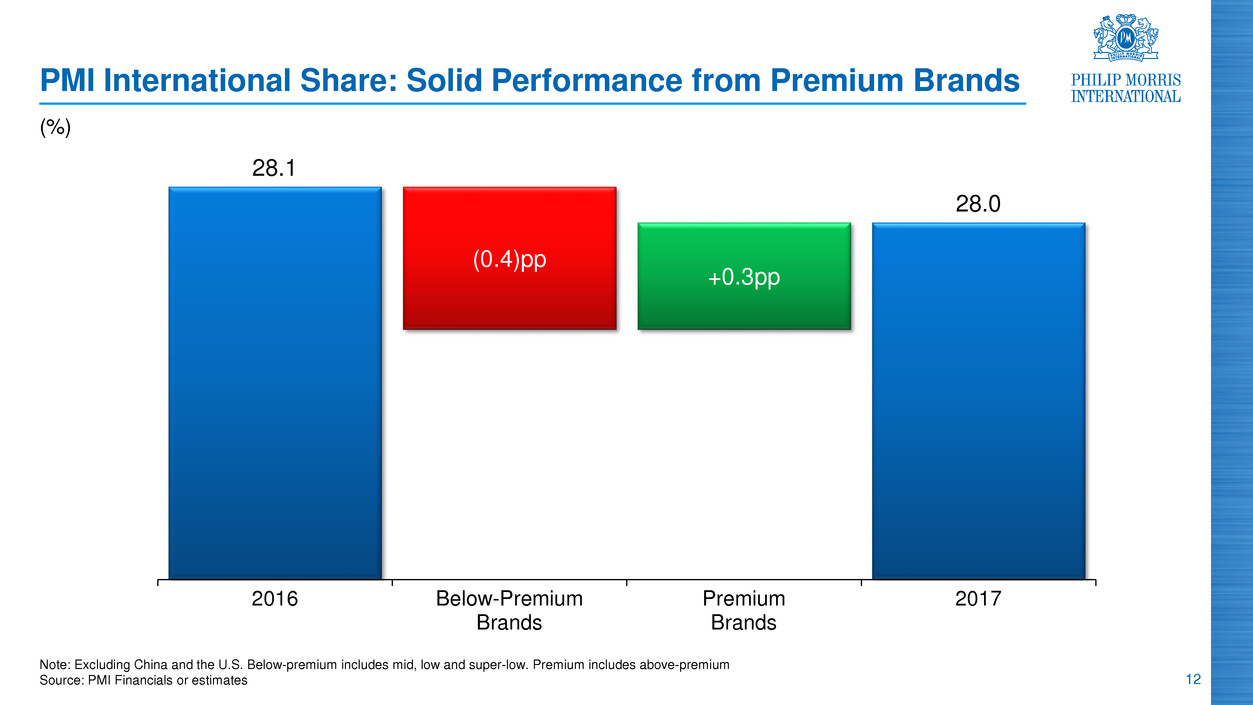
12 Note: Excluding China and the U.S. Below-premium includes mid, low and super-low. Premium includes above-premium Source: PMI Financials or estimates PMI International Share: Solid Performance from Premium Brands +0.3pp (0.4)pp 28.1 28.0 2016 Below-Premium Brands Premium Brands 2017 (%)
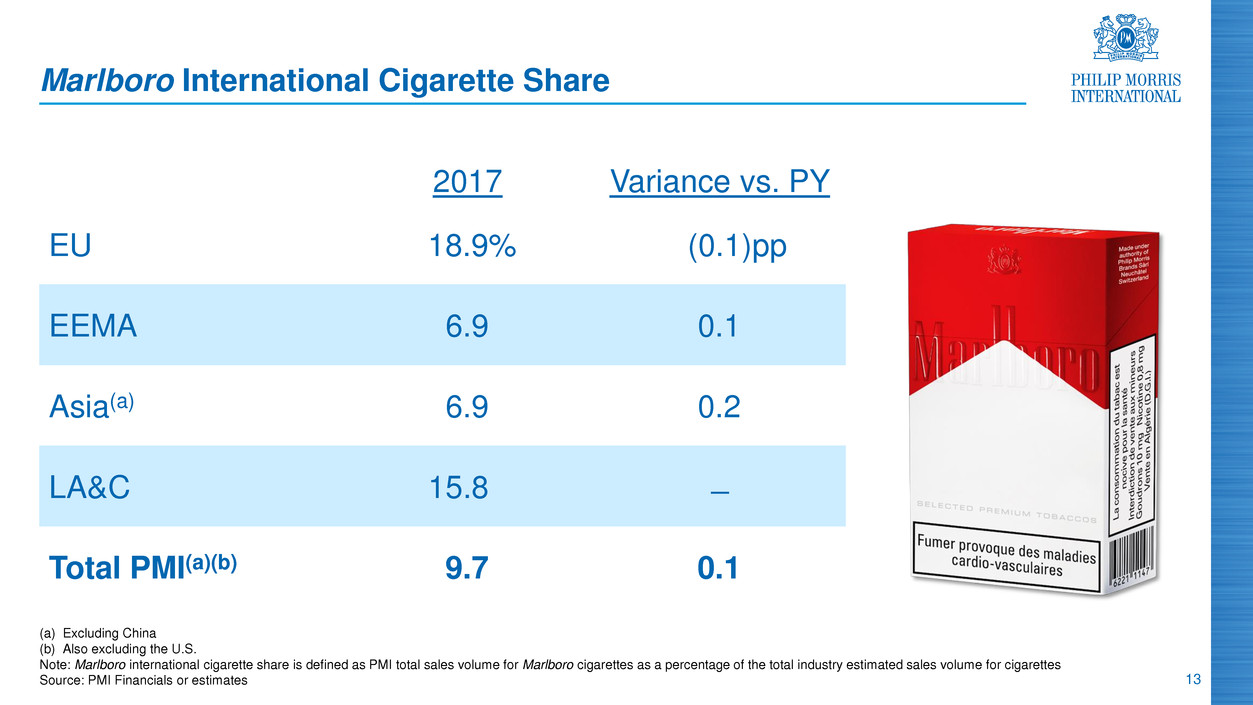
13 (a) Excluding China (b) Also excluding the U.S. Note: Marlboro international cigarette share is defined as PMI total sales volume for Marlboro cigarettes as a percentage of the total industry estimated sales volume for cigarettes Source: PMI Financials or estimates Marlboro International Cigarette Share 2017 Variance vs. PY EU 18.9% (0.1)pp EEMA 6.9 0.1 Asia(a) 6.9 0.2 LA&C 15.8 ̶ Total PMI(a)(b) 9.7 0.1

14 Source: PMI Financials or estimates EU Region: Stable Share in 2017, Supported by HEETS ● Total industry volume down by 1.9%: - Slightly better than our full-year decline forecast of 2% to 3% ● Stable Regional share: - Gain from HEETS - Offset by the decline for our cigarette portfolio ● Adjusted OCI down by 4.4%, ex- currency: - Unfavorable volume/mix and higher investments behind IQOS - Q4: adjusted OCI up by 6.1%, ex-currency, supported by higher heated tobacco unit shipments 0.8 0.4 0.1 ̶ (0.3) (1.6) France Poland Germany EU Region PMI Market Shares 43.2% 32.3% 42.7% 38.3% 52.2% 37.2% 2017 Share Variance vs. PY (pp) Italy Spain
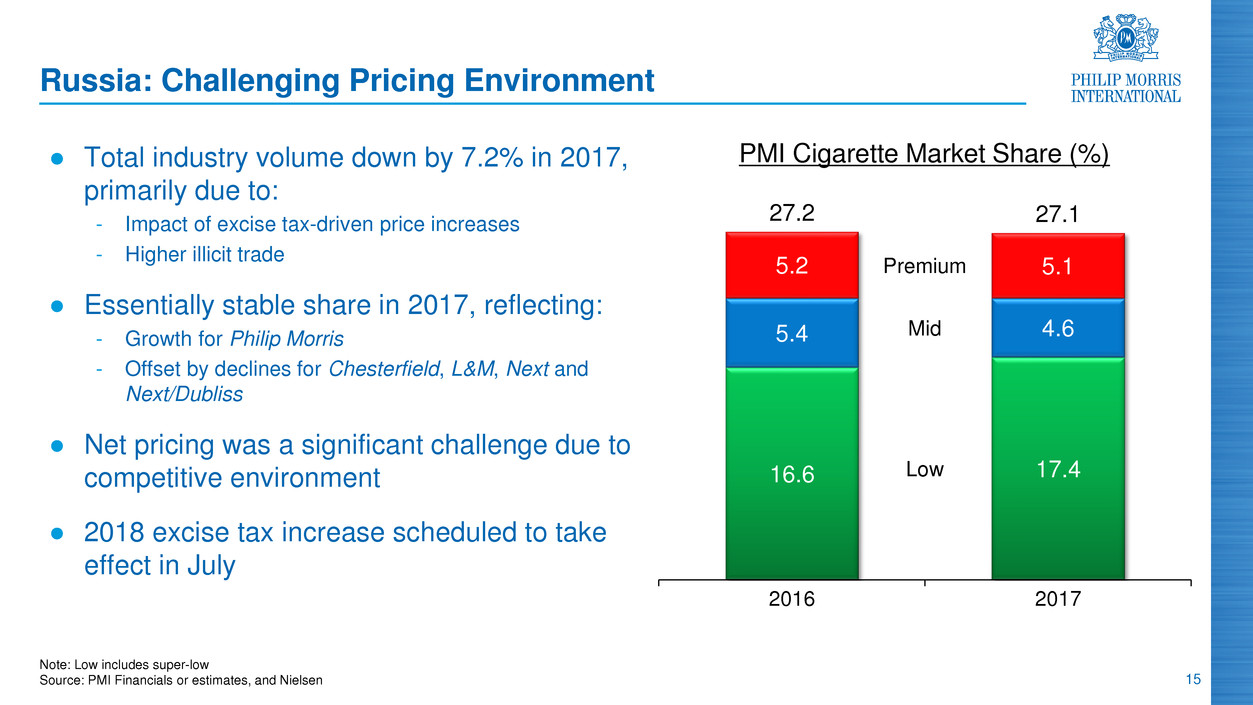
15 Note: Low includes super-low Source: PMI Financials or estimates, and Nielsen Russia: Challenging Pricing Environment ● Total industry volume down by 7.2% in 2017, primarily due to: - Impact of excise tax-driven price increases - Higher illicit trade ● Essentially stable share in 2017, reflecting: - Growth for Philip Morris - Offset by declines for Chesterfield, L&M, Next and Next/Dubliss ● Net pricing was a significant challenge due to competitive environment ● 2018 excise tax increase scheduled to take effect in July PMI Cigarette Market Share (%) 16.6 17.4 5.4 4.6 5.2 5.1 27.2 27.1 2016 2017 Low Mid Premium
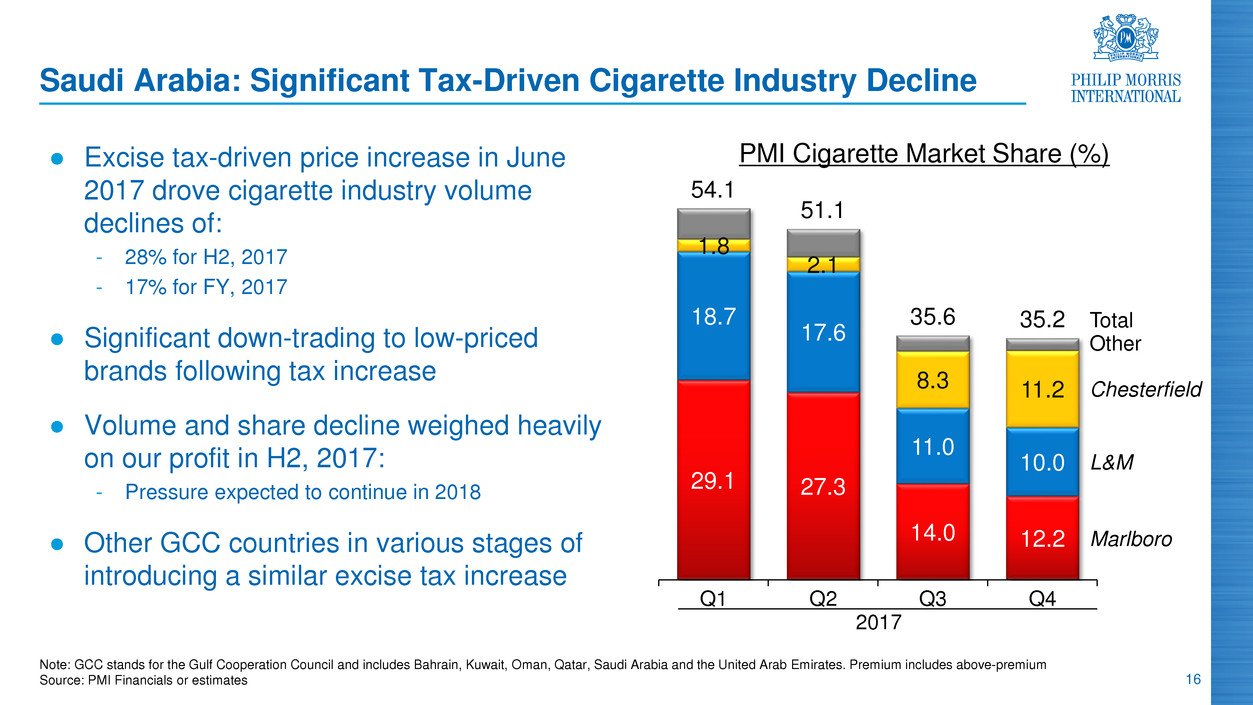
16 Saudi Arabia: Significant Tax-Driven Cigarette Industry Decline ● Excise tax-driven price increase in June 2017 drove cigarette industry volume declines of: - 28% for H2, 2017 - 17% for FY, 2017 ● Significant down-trading to low-priced brands following tax increase ● Volume and share decline weighed heavily on our profit in H2, 2017: - Pressure expected to continue in 2018 ● Other GCC countries in various stages of introducing a similar excise tax increase Note: GCC stands for the Gulf Cooperation Council and includes Bahrain, Kuwait, Oman, Qatar, Saudi Arabia and the United Arab Emirates. Premium includes above-premium Source: PMI Financials or estimates 29.1 27.3 14.0 12.2 18.7 17.6 11.0 10.0 1.8 2.1 8.3 11.2 54.1 51.1 35.6 35.2 Q1 Q2 Q3 Q4 Marlboro L&M Chesterfield Total 2017 PMI Cigarette Market Share (%) Other
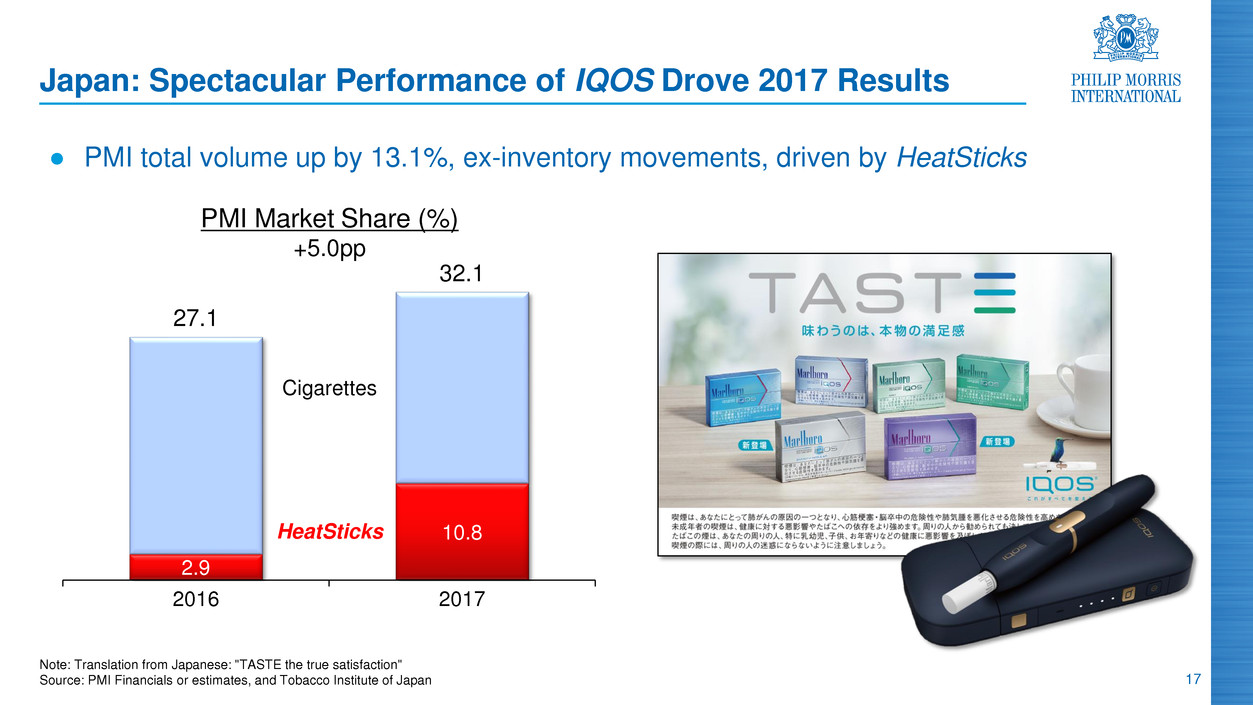
17 Japan: Spectacular Performance of IQOS Drove 2017 Results ● PMI total volume up by 13.1%, ex-inventory movements, driven by HeatSticks 2.9 10.8 27.1 32.1 2016 2017 PMI Market Share (%) +5.0pp Note: Translation from Japanese: "TASTE the true satisfaction" Source: PMI Financials or estimates, and Tobacco Institute of Japan HeatSticks Cigarettes
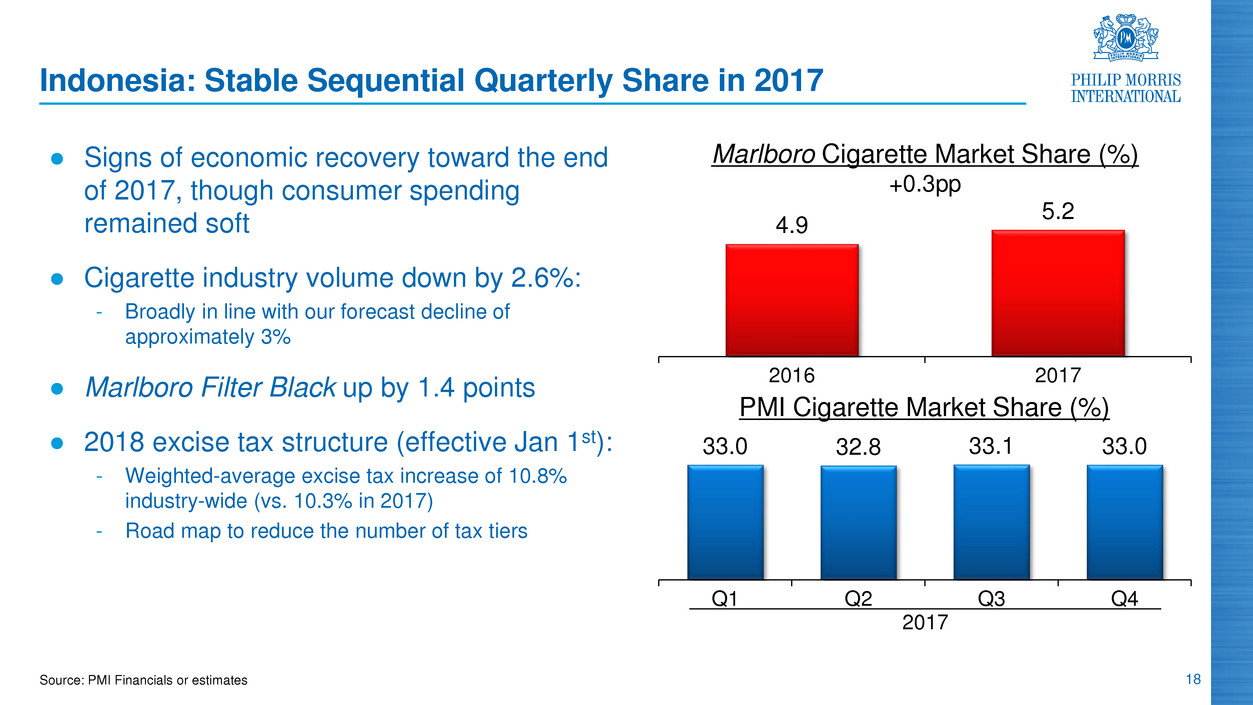
18 4.9 5.2 2016 2017 Marlboro Cigarette Market Share (%) +0.3pp Source: PMI Financials or estimates Indonesia: Stable Sequential Quarterly Share in 2017 ● Signs of economic recovery toward the end of 2017, though consumer spending remained soft ● Cigarette industry volume down by 2.6%: - Broadly in line with our forecast decline of approximately 3% ● Marlboro Filter Black up by 1.4 points ● 2018 excise tax structure (effective Jan 1st): - Weighted-average excise tax increase of 10.8% industry-wide (vs. 10.3% in 2017) - Road map to reduce the number of tax tiers PMI Cigarette Market Share (%) 33.0 32.8 33.1 33.0 Q1 Q2 Q3 Q4 2017
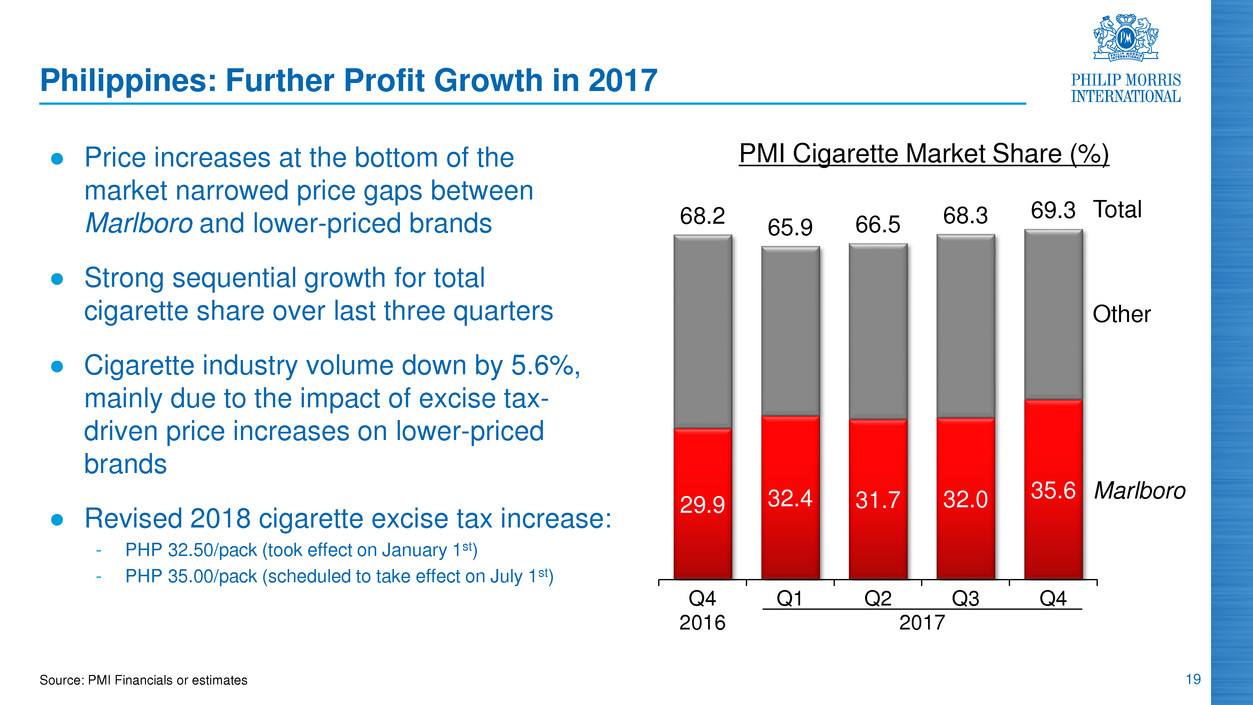
19 29.9 32.4 31.7 32.0 35.6 68.2 65.9 66.5 68.3 69.3 Q4 2016 Q1 Q2 Q3 Q4 Source: PMI Financials or estimates Philippines: Further Profit Growth in 2017 ● Price increases at the bottom of the market narrowed price gaps between Marlboro and lower-priced brands ● Strong sequential growth for total cigarette share over last three quarters ● Cigarette industry volume down by 5.6%, mainly due to the impact of excise tax- driven price increases on lower-priced brands ● Revised 2018 cigarette excise tax increase: - PHP 32.50/pack (took effect on January 1st) - PHP 35.00/pack (scheduled to take effect on July 1st) PMI Cigarette Market Share (%) Marlboro Other 2017 Total
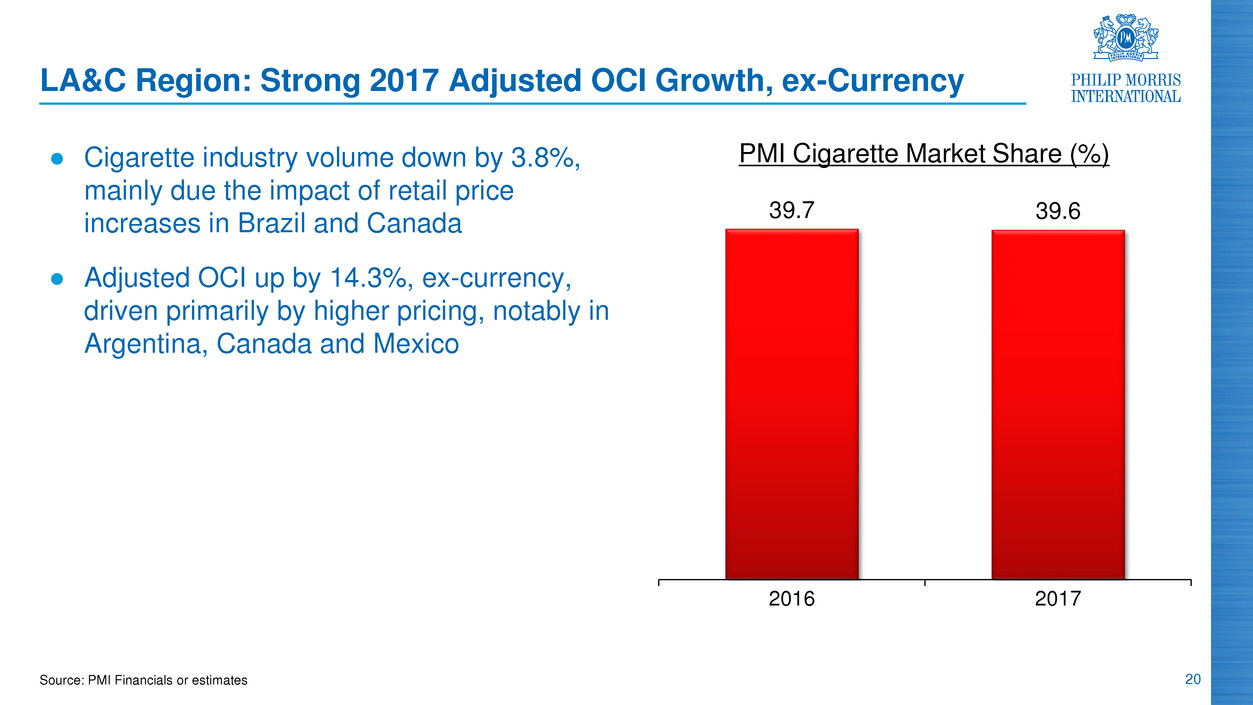
20 Source: PMI Financials or estimates LA&C Region: Strong 2017 Adjusted OCI Growth, ex-Currency ● Cigarette industry volume down by 3.8%, mainly due the impact of retail price increases in Brazil and Canada ● Adjusted OCI up by 14.3%, ex-currency, driven primarily by higher pricing, notably in Argentina, Canada and Mexico 39.7 39.6 2016 2017 PMI Cigarette Market Share (%)
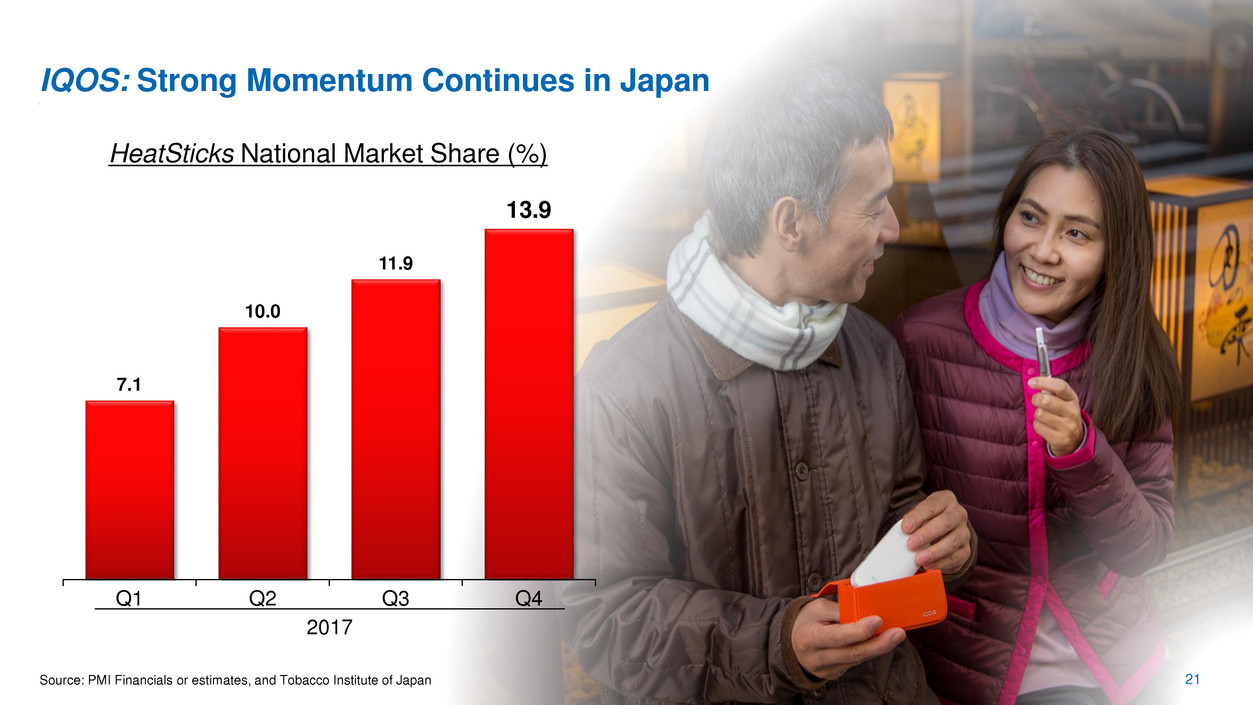
21 IQOS: Strong Momentum Continues in Japan Source: PMI Financials or estimates, and Tobacco Institute of Japan 7.1 10.0 11.9 13.9 Q1 Q2 Q3 Q4 HeatSticks National Market Share (%) 2017
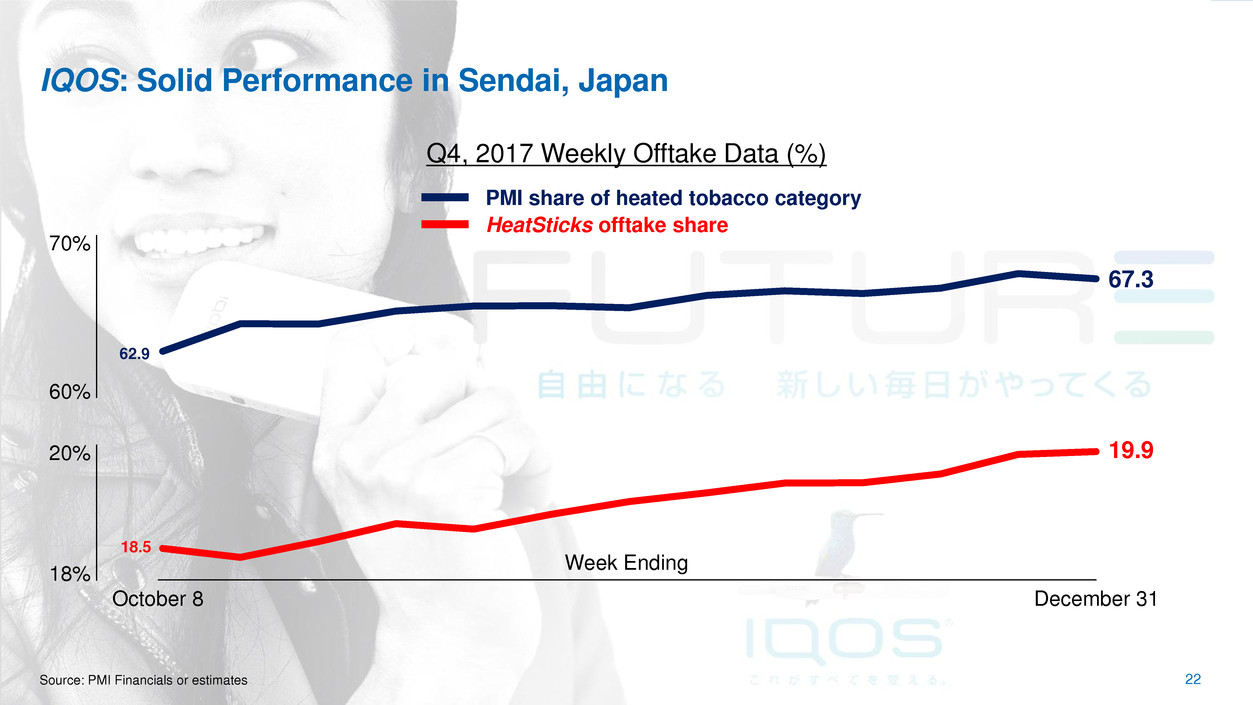
Source: PMI Financials or estimates IQOS: Solid Performance in Sendai, Japan 67.3 19.9 October 8 Week Ending December 31 Q4, 2017 Weekly Offtake Data (%) PMI share of heated tobacco category HeatSticks offtake share 62.9 18.5 20% 18% 60% 70% 22

IQOS: Exceptional Performance in Korea Source: PMI Financials or estimates, and Hankook Research 23 ̶ 0.2 2.5 5.5 Q1 Q2 Q3 Q4 2017 HEETS National Market Share (%)
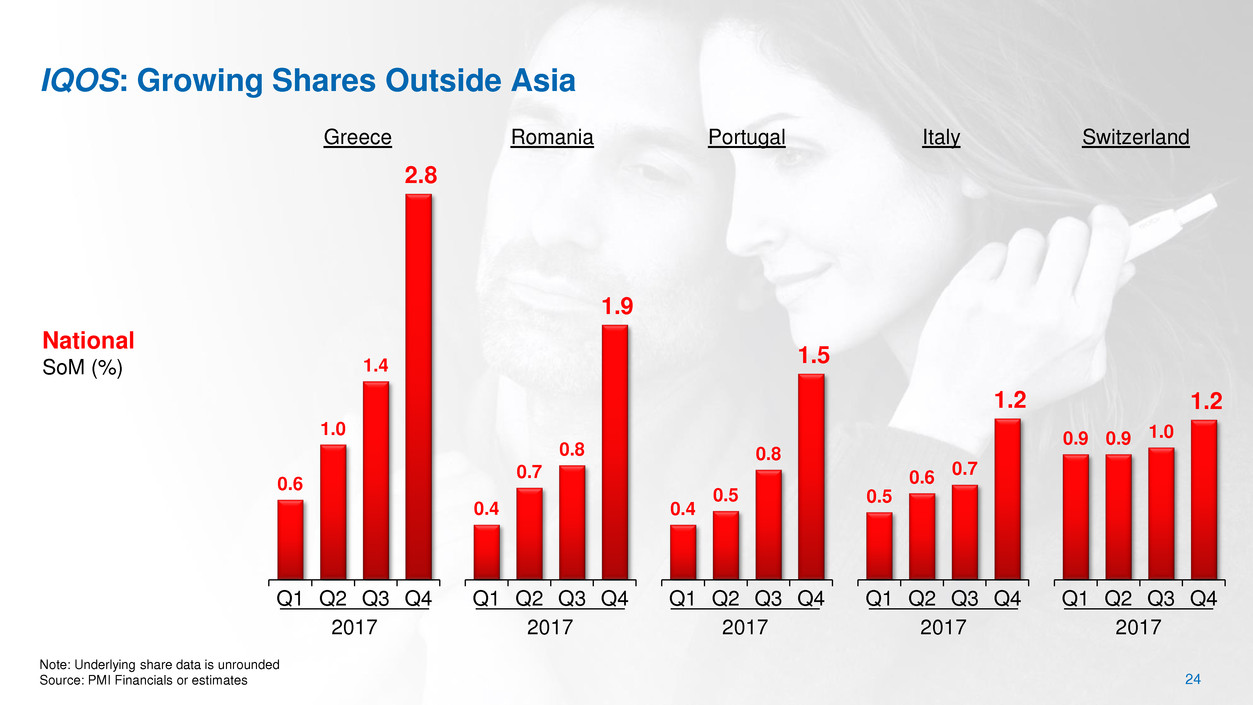
24 Greece Romania Portugal Italy Switzerland IQOS: Growing Shares Outside Asia Note: Underlying share data is unrounded Source: PMI Financials or estimates National SoM (%) 0.6 1.0 1.4 2.8 Q1 Q2 Q3 Q4 0.4 0.7 0.8 1.9 Q1 Q2 Q3 Q4 0.5 0.6 0.7 1.2 Q1 Q2 Q3 Q4 0.9 0.9 1.0 1.2 Q1 Q2 Q3 Q4 0.4 0.5 0.8 1.5 Q1 Q2 Q3 Q4 2017 2017 2017 2017 2017

25 Ukraine Colombia Czech Rep. Slovakia Russia Germany Spain Focus Area (December 2017) 5 cities Bogota 9 cities 9 cities Moscow 7 cities Barcelona & Madrid 0.3 0.7 1.3 Q1 Q2 Q3 Q4 Note: Underlying share data is unrounded. Czech Rep. is Czech Republic Source: PMI Financials or estimates IQOS: Growing Shares Outside Asia 0.1 0.6 1.4 Q1 Q2 Q3 Q4 0.3 0.4 0.6 Q1 Q2 Q3 Q4 0.1 0.2 0.2 Q1 Q2 Q3 Q4 0.5 0.6 0.8 Q1 Q2 Q3 Q4 2017 Focus Area Offtake SoM (%) ̶ ̶ 0.6 Q1 Q2 Q3 Q4 ̶ ̶ 0.4 Q1 Q2 Q3 Q4 2017 2017 2017 2017 2017 2017 2.4 2.1 1.8 1.6 1.4 0.8 0.4
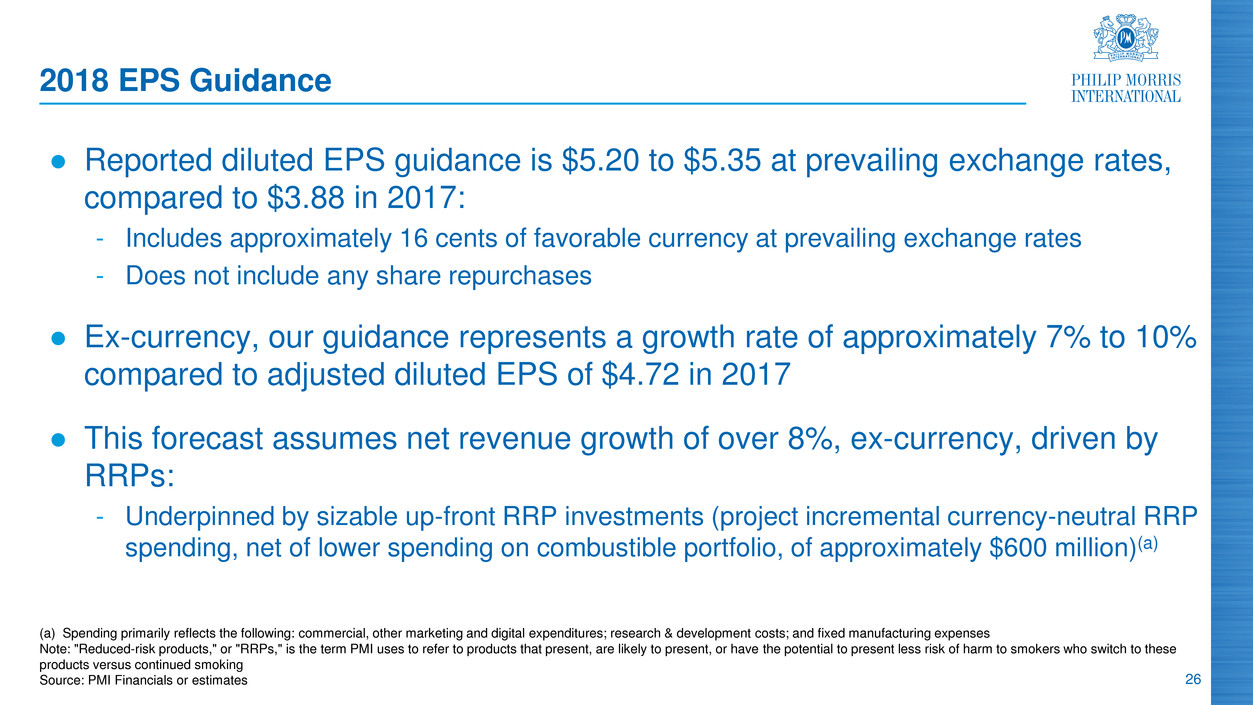
26 2018 EPS Guidance ● Reported diluted EPS guidance is $5.20 to $5.35 at prevailing exchange rates, compared to $3.88 in 2017: - Includes approximately 16 cents of favorable currency at prevailing exchange rates - Does not include any share repurchases ● Ex-currency, our guidance represents a growth rate of approximately 7% to 10% compared to adjusted diluted EPS of $4.72 in 2017 ● This forecast assumes net revenue growth of over 8%, ex-currency, driven by RRPs: - Underpinned by sizable up-front RRP investments (project incremental currency-neutral RRP spending, net of lower spending on combustible portfolio, of approximately $600 million)(a) (a) Spending primarily reflects the following: commercial, other marketing and digital expenditures; research & development costs; and fixed manufacturing expenses Note: "Reduced-risk products," or "RRPs," is the term PMI uses to refer to products that present, are likely to present, or have the potential to present less risk of harm to smokers who switch to these products versus continued smoking Source: PMI Financials or estimates
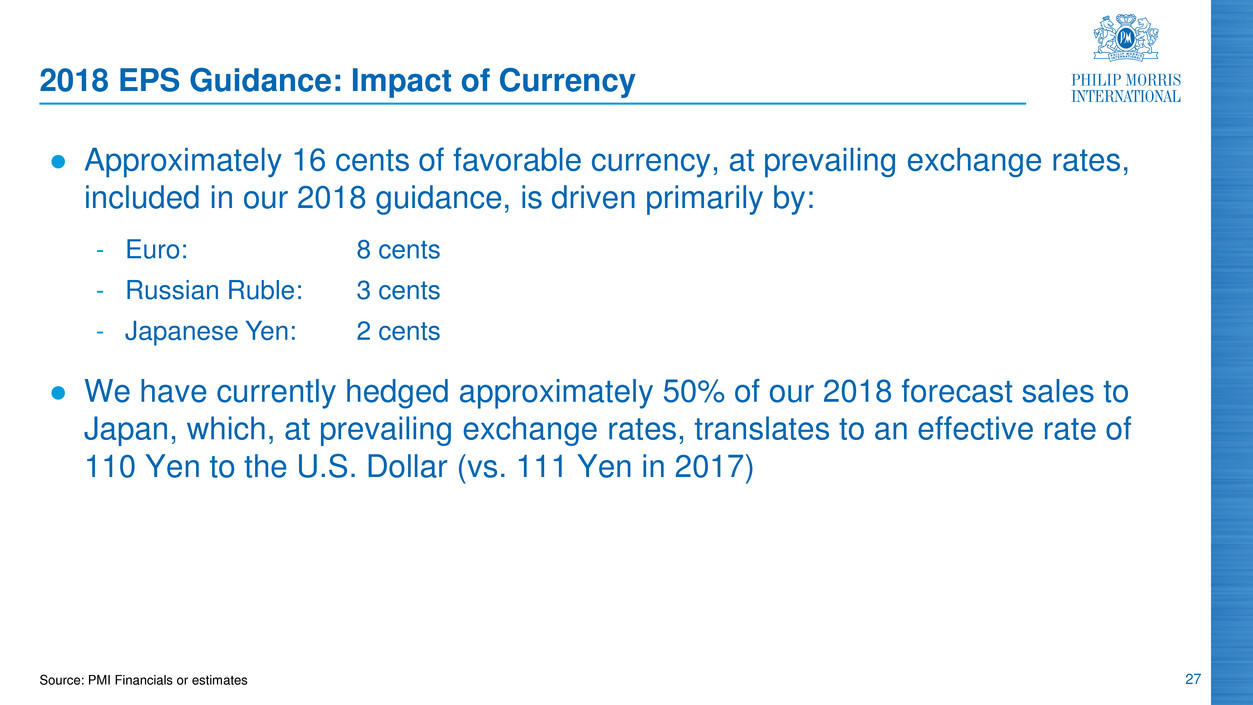
27 2018 EPS Guidance: Impact of Currency ● Approximately 16 cents of favorable currency, at prevailing exchange rates, included in our 2018 guidance, is driven primarily by: ● We have currently hedged approximately 50% of our 2018 forecast sales to Japan, which, at prevailing exchange rates, translates to an effective rate of 110 Yen to the U.S. Dollar (vs. 111 Yen in 2017) Source: PMI Financials or estimates - Euro: 8 cents - Russian Ruble: 3 cents - Japanese Yen: 2 cents
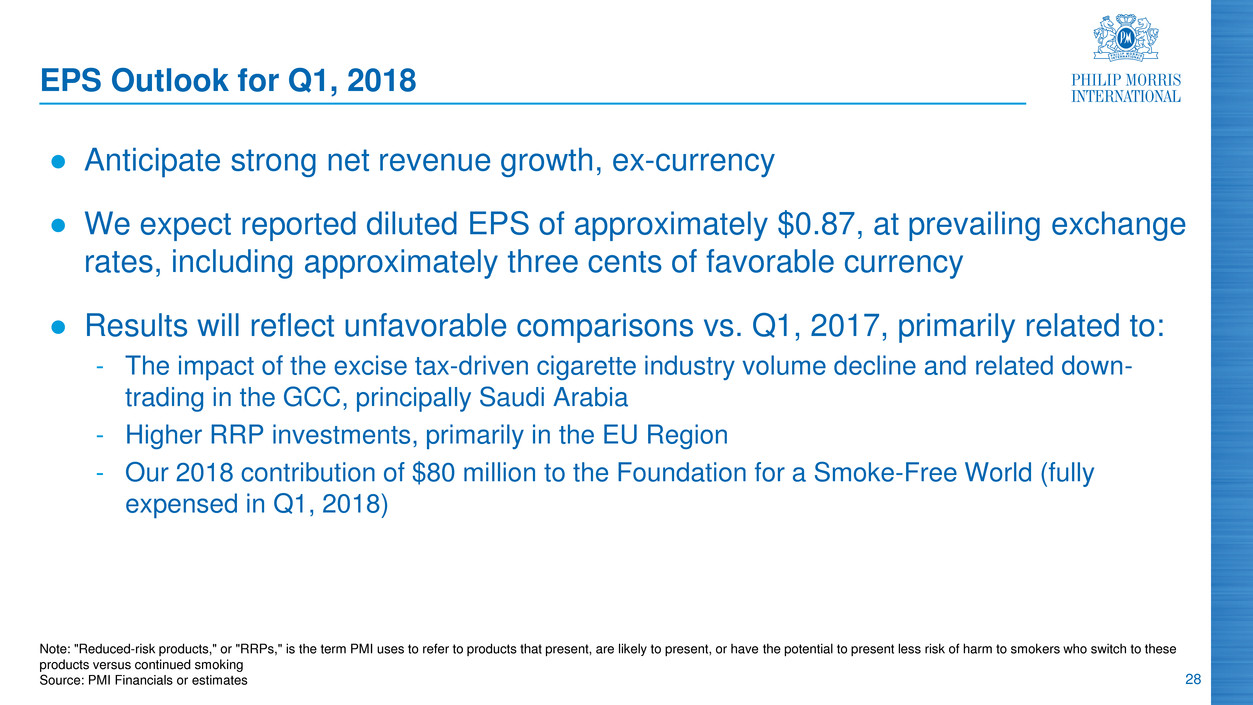
28 EPS Outlook for Q1, 2018 ● Anticipate strong net revenue growth, ex-currency ● We expect reported diluted EPS of approximately $0.87, at prevailing exchange rates, including approximately three cents of favorable currency ● Results will reflect unfavorable comparisons vs. Q1, 2017, primarily related to: - The impact of the excise tax-driven cigarette industry volume decline and related down- trading in the GCC, principally Saudi Arabia - Higher RRP investments, primarily in the EU Region - Our 2018 contribution of $80 million to the Foundation for a Smoke-Free World (fully expensed in Q1, 2018) Note: "Reduced-risk products," or "RRPs," is the term PMI uses to refer to products that present, are likely to present, or have the potential to present less risk of harm to smokers who switch to these products versus continued smoking Source: PMI Financials or estimates
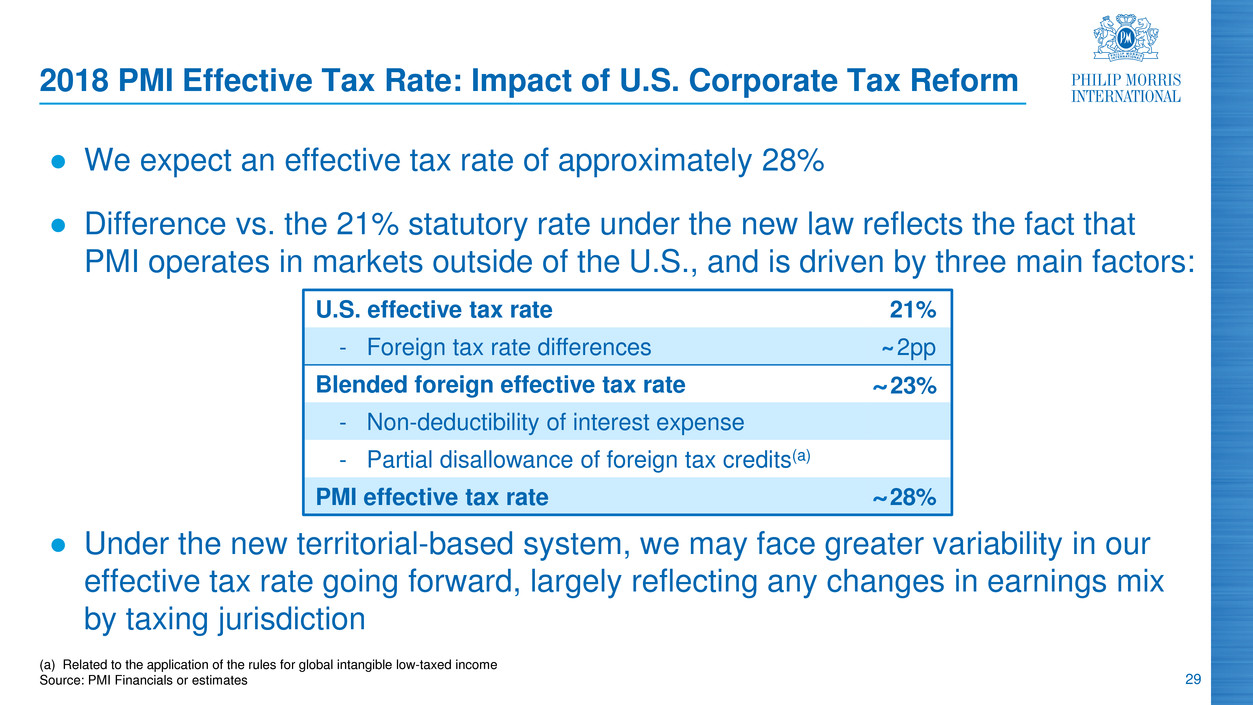
29 2018 PMI Effective Tax Rate: Impact of U.S. Corporate Tax Reform ● We expect an effective tax rate of approximately 28% ● Difference vs. the 21% statutory rate under the new law reflects the fact that PMI operates in markets outside of the U.S., and is driven by three main factors: ● Under the new territorial-based system, we may face greater variability in our effective tax rate going forward, largely reflecting any changes in earnings mix by taxing jurisdiction (a) Related to the application of the rules for global intangible low-taxed income Source: PMI Financials or estimates U.S. effective tax rate 21% - Foreign tax rate differences 2pp Blended foreign effective tax rate 23% - Non-deductibility of interest expense - Partial disallowance of foreign tax credits(a) PMI effective tax rate 28% ̴ ̴ ̴

30 2018 Outlook: Capital Structure and Operating Cash Flow(a) ● We remain committed to restoring over time our leverage multiples to the ranges associated with our single-A credit rating ● New tax law provides us with greater flexibility on cash repatriation ● Targeting operating cash flow of over $9.0 billion, despite our initial payment of approximately $130 million related to the repatriation tax on our unremitted earnings under the new tax law ● Anticipate capital expenditures of approximately $1.7 billion (vs. $1.5 billion in 2017), driven by higher investments to support RRP capacity expansion (a) Operating cash flow is defined as net cash provided by operating activities Note: "Reduced-risk products," or "RRPs," is the term PMI uses to refer to products that present, are likely to present, or have the potential to present less risk of harm to smokers who switch to these products versus continued smoking Source: PMI Financials or estimates

31 Conclusion: Robust 2017 Performance; Strong 2018 Outlook ● Strong 2017 adjusted financial results, ex-currency ● IQOS performing exceptionally: - We estimate that over 4.7 million adult consumers around the world have already stopped smoking and made the change to IQOS(a) ● Effective January 1st, we have reorganized the Company into six Regional segments (vs. four previously) to support our business transformation(b) ● 2018 EPS guidance reflects a growth rate of approximately 7% to 10%, ex- currency, compared to adjusted diluted EPS of $4.72 in 2017 (a) Status at the end of December 2017, reflecting new PMI methodology. For markets where IQOS is the only heated tobacco product, daily individual consumption of PMI heated tobacco units represents the totality of their daily tobacco consumption. For markets where IQOS is one among other heated tobacco products, daily individual consumption of heated tobacco units represents the totality of their daily tobacco consumption, of which at least 70% are PMI heated tobacco units (b) A detailed split of the markets by Region is included in the glossary Source: PMI Financials or estimates, and IQOS User Panels

Have you downloaded the PMI Investor Relations App yet? The free IR App is available to download at the Apple App Store for iOS devices and at Google Play for Android mobile devices iOS Download Android Download Or go to: www.pmi.com/irapp Designing a Smoke-Free Future Questions & Answers 2017 Fourth-Quarter and Full-Year Results
Glossary and Reconciliation of Non-GAAP Measures Designing a Smoke-Free Future
34 Glossary: General Terms ● "PMI" refers to Philip Morris International Inc. and its subsidiaries ● Until March 28, 2008, PMI was a wholly owned subsidiary of Altria Group, Inc. ("Altria"). Since that time the company has been independent and is listed on the New York Stock Exchange (ticker symbol "PM") ● Trademarks are italicized ● Comparisons are made to the same prior-year period, unless otherwise stated ● Unless otherwise stated, references to total industry, total market, PMI volume and PMI market share performance reflect cigarettes and heated tobacco units ● References to total international market, defined as worldwide cigarette and heated tobacco unit volume excluding the U.S., total industry, total market and market shares are PMI tax-paid estimates based on the latest available data from a number of internal and external sources and may, in defined instances, exclude the People's Republic of China and/or PMI's duty free business ● "Combustible products" is the term PMI uses to refer to cigarettes and OTP, combined ● "OTP" is defined as other tobacco products, primarily roll-your-own and make-your-own cigarettes, pipe tobacco, cigars and cigarillos, and does not include reduced-risk products ● "PMI volume" is defined as the combined total of cigarette shipment volume and heated tobacco unit shipment volume ● "EU" is defined as the European Union Region ● "EEMA" is defined as Eastern Europe, Middle East and Africa and includes PMI's international duty free business ● "LA&C" is defined as the Latin America & Canada Region ● "SoM" stands for share of market
35 Glossary: Financial Terms ● Net revenues exclude excise taxes ● Net revenues, excluding excise taxes, related to combustible products refer to the operating revenues generated from the sale of these products, net of sales and promotion incentives ● "Operating Companies Income," or "OCI," is defined as operating income, excluding general corporate expenses and the amortization of intangibles, plus equity (income)/loss in unconsolidated subsidiaries, net. Management evaluates business segment performance and allocates resources based on OCI ● Management reviews OCI, OCI margins, operating cash flow and earnings per share, or "EPS," on an adjusted basis, which may exclude the impact of currency and other items such as acquisitions, asset impairment and exit costs, tax items and other special items
36 Glossary: Reduced-Risk Products ● "Reduced-risk products," or "RRPs," is the term PMI uses to refer to products that present, are likely to present, or have the potential to present less risk of harm to smokers who switch to these products versus continued smoking. PMI has a range of RRPs in various stages of development, scientific assessment and commercialization. Because PMI's RRPs do not burn tobacco, they produce far lower quantities of harmful and potentially harmful compounds than found in cigarette smoke ● "Aerosol" refers to a gaseous suspension of fine solid particles and/or liquid droplets ● "Combustion" is the process of burning a substance in oxygen, producing heat and often light ● "Smoke": a visible suspension of solid particles, liquid droplets and gases in air, emitted when a material burns ● "Heated tobacco product" is a manufactured tobacco product that delivers a nicotine containing vapor (aerosol), without combustion of the tobacco mixture ● An "e-vapor product" is an electrical product that generates an aerosol by heating a nicotine or non-nicotine containing liquid, such as electronic cigarettes (or "e-cigarettes") ● "E-liquids" refer to a liquid solution that is used in/with e-cigarettes. E-liquids contain different levels of nicotine in a propylene glycol and/or vegetable glycerin based solution with various flavors ● "IQOS" is the brand name under which PMI has chosen to commercialize its Platform 1 controlled heating device into which a specially designed and proprietary tobacco unit is inserted and heated to generate an aerosol ● "Heated tobacco units" is the term PMI uses to refer to heated tobacco consumables, which include the company’s HEETS, HEETS Marlboro and HEETS FROM MARLBORO, defined collectively as HEETS, as well as Marlboro HeatSticks and Parliament HeatSticks, and competitive heated tobacco brands
37 Glossary: Reduced-Risk Products ● Heated tobacco unit "offtake volume" represents the estimated retail offtake of heated tobacco units based on a selection of sales channels that vary by market, but notably include retail points of sale and e-commerce platforms ● Heated tobacco unit "offtake share" represents the estimated retail offtake volume of heated tobacco units divided by the sum of estimated total offtake volume for cigarettes, heated tobacco units and, where the data is available, other RRPs ● National market share for heated tobacco units is defined as the total sales volume for heated tobacco units as a percentage of the total estimated sales volume for cigarettes and heated tobacco units ● Net revenues, excluding excise taxes, related to RRPs represent the sale of heated tobacco units, IQOS devices and related accessories, and other nicotine-containing products, primarily e-vapor products, net of sales and promotion incentives ● "FDA" stands for the U.S. Food & Drug Administration ● "MRTP" stands for Modified Risk Tobacco Product, the term used by the U.S. FDA to refer to RRPs ● "MRTP application" stands for Modified Risk Tobacco Product application under section 911 of the FD&C Act ● "PMTA" stands for Premarket Tobacco Application under section 910 of the FD&C Act ● "TPSAC" stands for the Tobacco Product Scientific Advisory Committee ● PMI presentation to TPSAC on MRTP applications for IQOS (January 24, 2018): https://www.pmiscience.com/news/pmi-presents-our-modified-risk-tobacco-product-application-iqos-tobacco-products- scientific
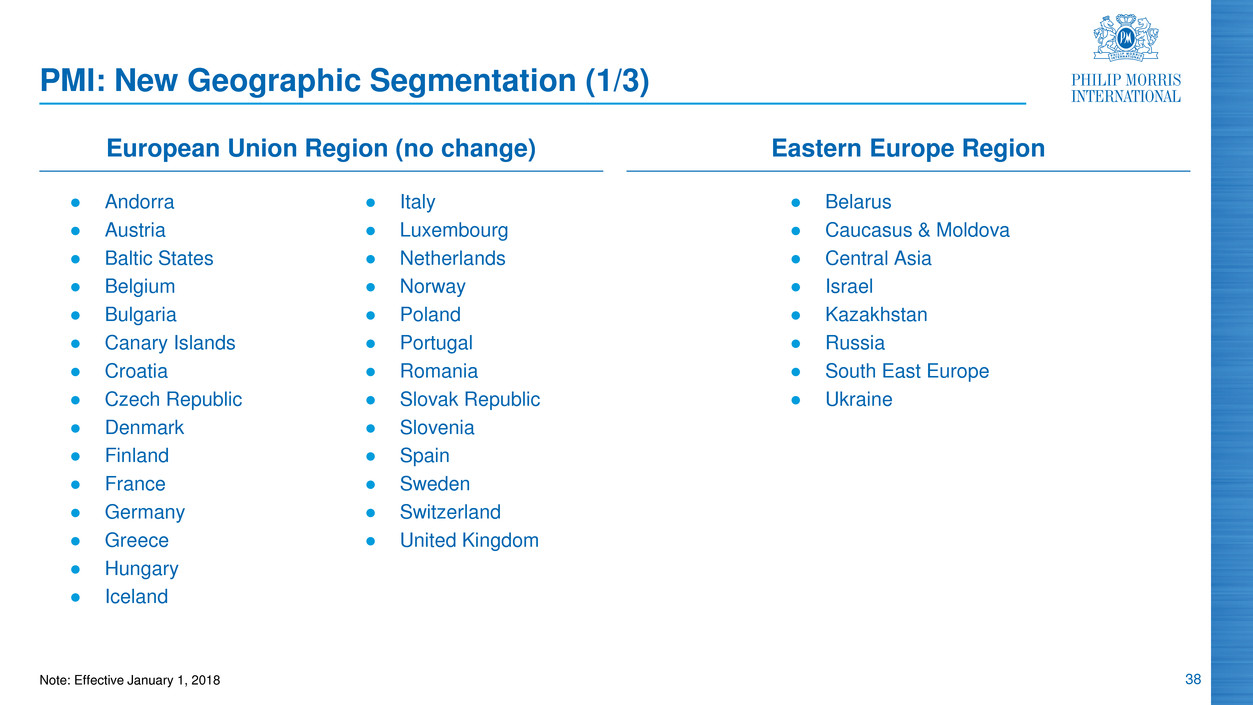
38 PMI: New Geographic Segmentation (1/3) ● Andorra ● Austria ● Baltic States ● Belgium ● Bulgaria ● Canary Islands ● Croatia ● Czech Republic ● Denmark ● Finland ● France ● Germany ● Greece ● Hungary ● Iceland ● Italy ● Luxembourg ● Netherlands ● Norway ● Poland ● Portugal ● Romania ● Slovak Republic ● Slovenia ● Spain ● Sweden ● Switzerland ● United Kingdom ● Belarus ● Caucasus & Moldova ● Central Asia ● Israel ● Kazakhstan ● Russia ● South East Europe ● Ukraine European Union Region (no change) Eastern Europe Region Note: Effective January 1, 2018
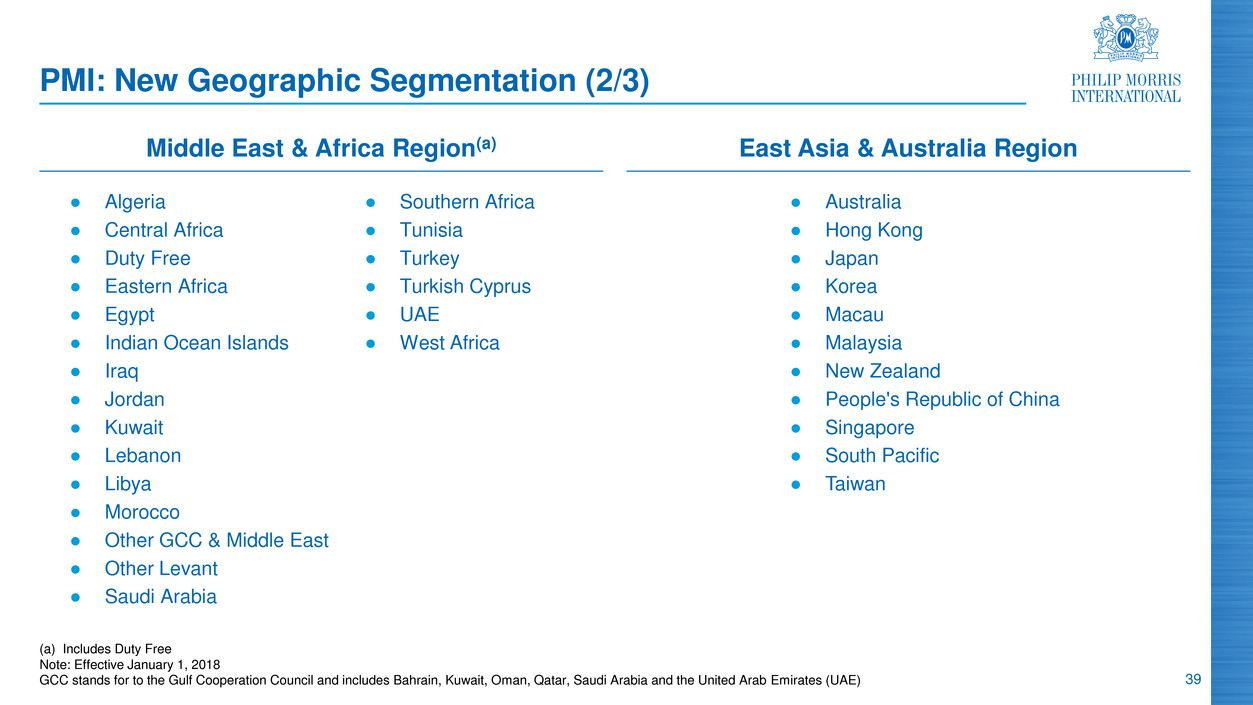
39 PMI: New Geographic Segmentation (2/3) ● Algeria ● Central Africa ● Duty Free ● Eastern Africa ● Egypt ● Indian Ocean Islands ● Iraq ● Jordan ● Kuwait ● Lebanon ● Libya ● Morocco ● Other GCC & Middle East ● Other Levant ● Saudi Arabia ● Southern Africa ● Tunisia ● Turkey ● Turkish Cyprus ● UAE ● West Africa ● Australia ● Hong Kong ● Japan ● Korea ● Macau ● Malaysia ● New Zealand ● People's Republic of China ● Singapore ● South Pacific ● Taiwan Middle East & Africa Region(a) East Asia & Australia Region (a) Includes Duty Free Note: Effective January 1, 2018 GCC stands for to the Gulf Cooperation Council and includes Bahrain, Kuwait, Oman, Qatar, Saudi Arabia and the United Arab Emirates (UAE)

40 PMI: New Geographic Segmentation (3/3) ● Afghanistan ● Bangladesh ● Cambodia ● East Timor ● India ● Indonesia ● Laos ● Maldives ● Other South Asia ● Pakistan ● Philippines ● Thailand ● Vietnam ● Argentina ● Bolivia ● Brazil ● Canada ● Caribbean ● Chile ● Colombia ● Costa Rica ● Dominican Republic ● Ecuador ● El Salvador ● Guatemala ● Honduras ● Mexico ● Nicaragua South & Southeast Asia Region Latin America & Canada Region (no change) ● Panama ● Paraguay ● Peru ● Uruguay ● Venezuela Note: Effective January 1, 2018
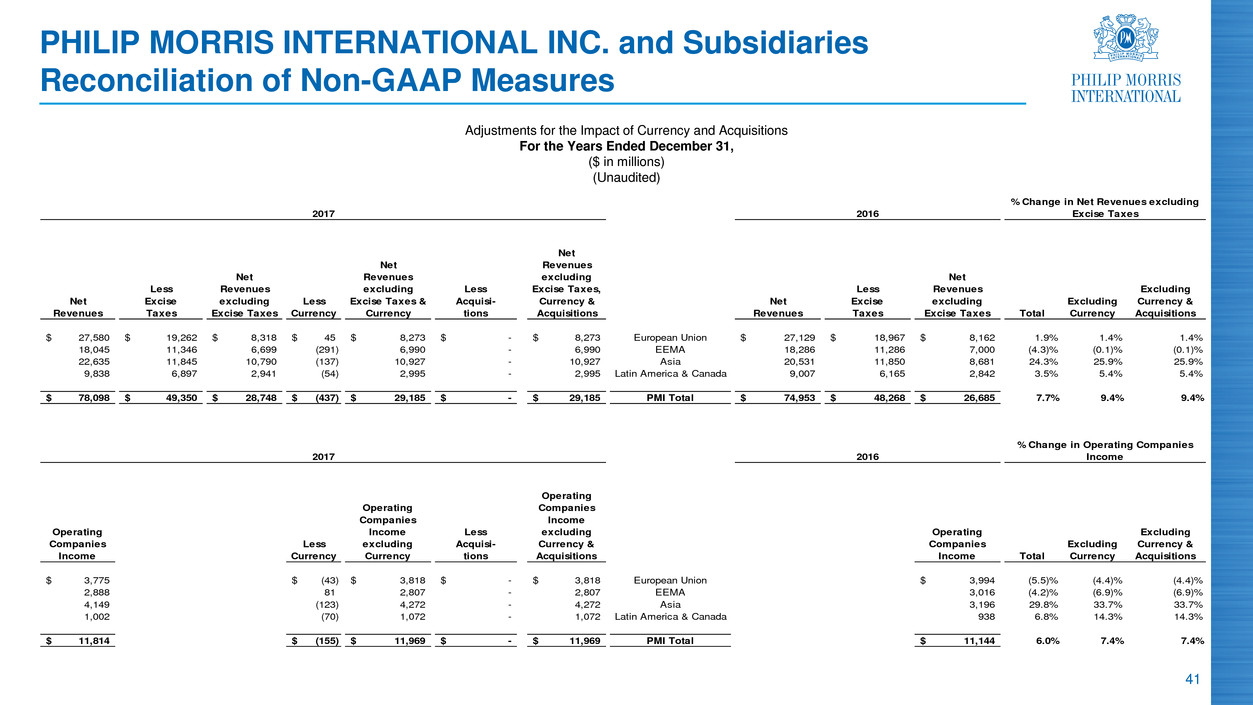
41 PHILIP MORRIS INTERNATIONAL INC. and Subsidiaries Reconciliation of Non-GAAP Measures Adjustments for the Impact of Currency and Acquisitions For the Years Ended December 31, ($ in millions) (Unaudited) Net Revenues Less Excise Taxes Net Revenues excluding Excise Taxes Less Currency Net Revenues excluding Excise Taxes & Currency Less Acquisi- tions Net Revenues excluding Excise Taxes, Currency & Acquisitions Net Revenues Less Excise Taxes Net Revenues excluding Excise Taxes Total Excluding Currency Excluding Currency & Acquisitions 27,580$ 19,262$ 8,318$ 45$ 8,273$ -$ 8,273$ European Union 27,129$ 18,967$ 8,162$ 1.9% 1.4% 1.4% 18,045 11,346 6,699 (291) 6,990 - 6,990 EEMA 18,286 11,286 7,000 (4.3)% (0.1)% (0.1)% 22,635 11,845 10,790 (137) 10,927 - 10,927 Asia 20,531 11,850 8,681 24.3% 25.9% 25.9% 9,838 6,897 2,941 (54) 2,995 - 2,995 Latin America & Canada 9,007 6,165 2,842 3.5% 5.4% 5.4% 78,098$ 49,350$ 28,748$ (437)$ 29,185$ -$ 29,185$ PMI Total 74,953$ 48,268$ 26,685$ 7.7% 9.4% 9.4% Operating Companies I come Less Currency Operating Companies Income excluding Currency Less Acquisi- tions Operating Companies Income excluding Currency & Acquisitions Operating Companies Income Total Excluding Currency Excluding Currency & Acquisitions 3,775$ (43)$ 3,818$ -$ 3,818$ European Union 3,994$ (5.5)% (4.4)% (4.4)% 2,888 81 2,807 - 2,807 EEMA 3,016 (4.2)% (6.9)% (6.9)% 4,149 (123) 4,272 - 4,272 Asia 3,196 29.8% 33.7% 33.7% 1,002 (70) 1,072 - 1,072 Latin America & Canada 938 6.8% 14.3% 14.3% 11,814$ (155)$ 11,969$ -$ 11,969$ PMI Total 11,144$ 6.0% 7.4% 7.4% 2017 2016 % Change in Operating Companies Income 2017 2016 % Change in Net Revenues excluding Excise Taxes
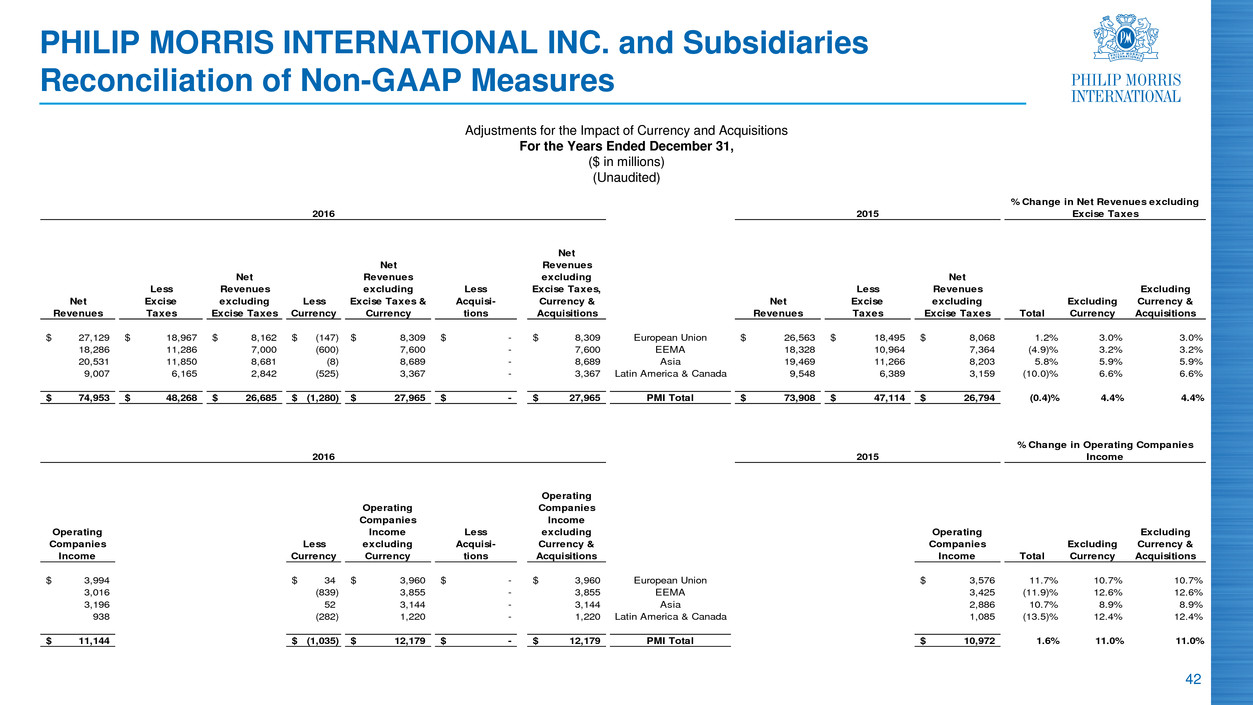
42 PHILIP MORRIS INTERNATIONAL INC. and Subsidiaries Reconciliation of Non-GAAP Measures Adjustments for the Impact of Currency and Acquisitions For the Years Ended December 31, ($ in millions) (Unaudited) Net Revenues Less Excise Taxes Net Revenues excluding Excise Taxes Less Currency Net Revenues excluding Excise Taxes & Currency Less Acquisi- tions Net Revenues excluding Excise Taxes, Currency & Acquisitions Net Revenues Less Excise Taxes Net Revenues excluding Excise Taxes Total Excluding Currency Excluding Currency & Acquisitions 27,129$ 18,967$ 8,162$ (147)$ 8,309$ -$ 8,309$ European Union 26,563$ 18,495$ 8,068$ 1.2% 3.0% 3.0% 18,286 11,286 7,000 (600) 7,600 - 7,600 EEMA 18,328 10,964 7,364 (4.9)% 3.2% 3.2% 20,531 11,850 8,681 (8) 8,689 - 8,689 Asia 19,469 11,266 8,203 5.8% 5.9% 5.9% 9,007 6,165 2,842 (525) 3,367 - 3,367 Latin America & Canada 9,548 6,389 3,159 (10.0)% 6.6% 6.6% 74,953$ 48,268$ 26,685$ (1,280)$ 27,965$ -$ 27,965$ PMI Total 73,908$ 47,114$ 26,794$ (0.4)% 4.4% 4.4% Operating Companies I come Less Currency Operating Companies Income excluding Currency Less Acquisi- tions Operating Companies Income excluding Currency & Acquisitions Operating Companies Income Total Excluding Currency Excluding Currency & Acquisitions 3,994$ 34$ 3,960$ -$ 3,960$ European Union 3,576$ 11.7% 10.7% 10.7% 3,016 (839) 3,855 - 3,855 EEMA 3,425 (11.9)% 12.6% 12.6% 3,196 52 3,144 - 3,144 Asia 2,886 10.7% 8.9% 8.9% 938 (282) 1,220 - 1,220 Latin America & Canada 1,085 (13.5)% 12.4% 12.4% 11,144$ (1,035)$ 12,179$ -$ 12,179$ PMI Total 10,972$ 1.6% 11.0% 11.0% 2016 2015 % Change in Operating Companies Income 2016 2015 % Change in Net Revenues excluding Excise Taxes
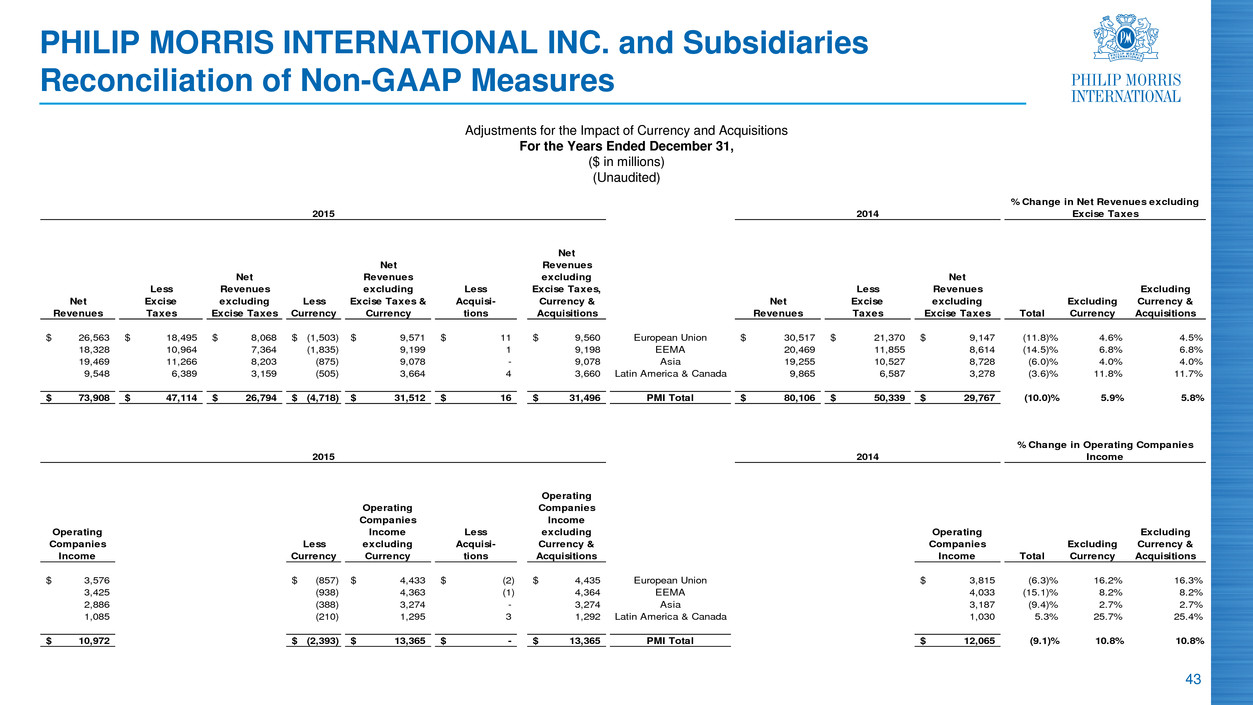
43 PHILIP MORRIS INTERNATIONAL INC. and Subsidiaries Reconciliation of Non-GAAP Measures Adjustments for the Impact of Currency and Acquisitions For the Years Ended December 31, ($ in millions) (Unaudited) Net Revenues Less Excise Taxes Net Revenues excluding Excise Taxes Less Currency Net Revenues excluding Excise Taxes & Currency Less Acquisi- tions Net Revenues excluding Excise Taxes, Currency & Acquisitions Net Revenues Less Excise Taxes Net Revenues excluding Excise Taxes Total Excluding Currency Excluding Currency & Acquisitions 26,563$ 18,495$ 8,068$ (1,503)$ 9,571$ 11$ 9,560$ European Union 30,517$ 21,370$ 9,147$ (11.8)% 4.6% 4.5% 18,328 10,964 7,364 (1,835) 9,199 1 9,198 EEMA 20,469 11,855 8,614 (14.5)% 6.8% 6.8% 19,469 11,266 8,203 (875) 9,078 - 9,078 Asia 19,255 10,527 8,728 (6.0)% 4.0% 4.0% 9,548 6,389 3,159 (505) 3,664 4 3,660 Latin America & Canada 9,865 6,587 3,278 (3.6)% 11.8% 11.7% 73,908$ 47,114$ 26,794$ (4,718)$ 31,512$ 16$ 31,496$ PMI Total 80,106$ 50,339$ 29,767$ (10.0)% 5.9% 5.8% Operating Companies I come Less Currency Operating Companies Income excluding Currency Less Acquisi- tions Operating Companies Income excluding Currency & Acquisitions Operating Companies Income Total Excluding Currency Excluding Currency & Acquisitions 3,576$ (857)$ 4,433$ (2)$ 4,435$ European Union 3,815$ (6.3)% 16.2% 16.3% 3,425 (938) 4,363 (1) 4,364 EEMA 4,033 (15.1)% 8.2% 8.2% 2,886 (388) 3,274 - 3,274 Asia 3,187 (9.4)% 2.7% 2.7% 1,085 (210) 1,295 3 1,292 Latin America & Canada 1,030 5.3% 25.7% 25.4% 10,972$ (2,393)$ 13,365$ -$ 13,365$ PMI Total 12,065$ (9.1)% 10.8% 10.8% 2015 2014 % Change in Operating Companies Income 2015 2014 % Change in Net Revenues excluding Excise Taxes
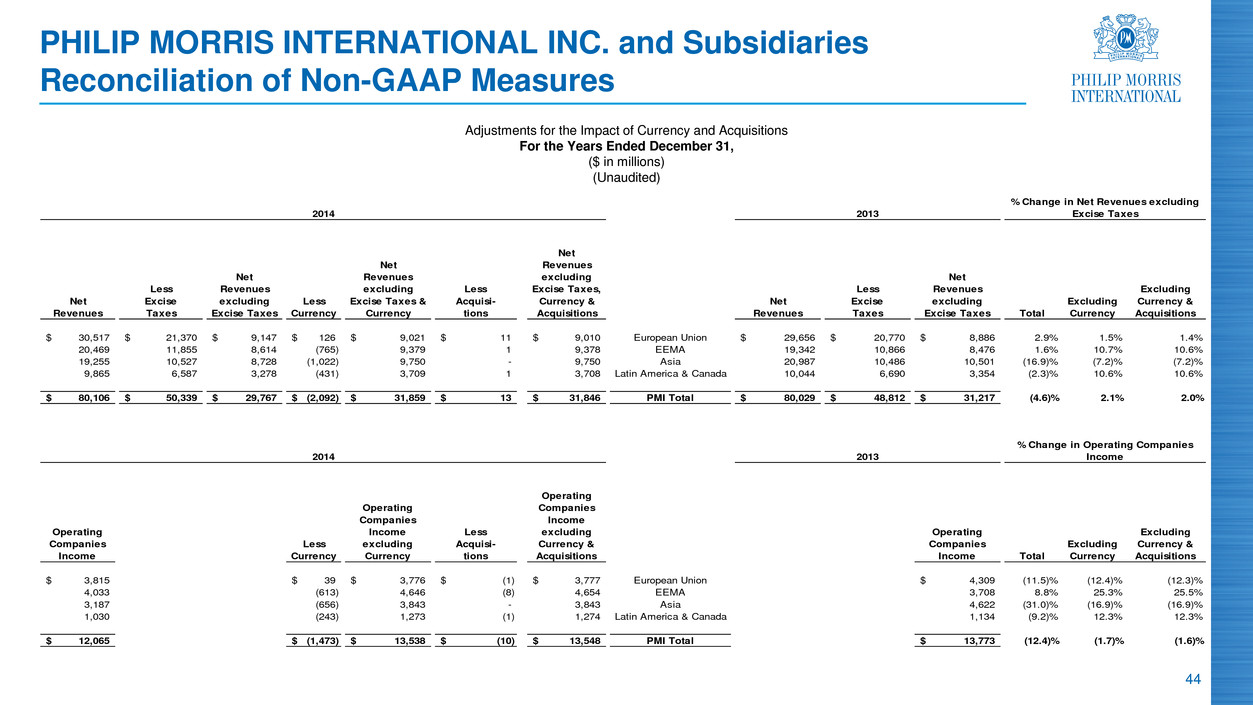
44 PHILIP MORRIS INTERNATIONAL INC. and Subsidiaries Reconciliation of Non-GAAP Measures Adjustments for the Impact of Currency and Acquisitions For the Years Ended December 31, ($ in millions) (Unaudited) Net Revenues Less Excise Taxes Net Revenues excluding Excise Taxes Less Currency Net Revenues excluding Excise Taxes & Currency Less Acquisi- tions Net Revenues excluding Excise Taxes, Currency & Acquisitions Net Revenues Less Excise Taxes Net Revenues excluding Excise Taxes Total Excluding Currency Excluding Currency & Acquisitions 30,517$ 21,370$ 9,147$ 126$ 9,021$ 11$ 9,010$ European Union 29,656$ 20,770$ 8,886$ 2.9% 1.5% 1.4% 20,469 11,855 8,614 (765) 9,379 1 9,378 EEMA 19,342 10,866 8,476 1.6% 10.7% 10.6% 19,255 10,527 8,728 (1,022) 9,750 - 9,750 Asia 20,987 10,486 10,501 (16.9)% (7.2)% (7.2)% 9,865 6,587 3,278 (431) 3,709 1 3,708 Latin America & Canada 10,044 6,690 3,354 (2.3)% 10.6% 10.6% 80,106$ 50,339$ 29,767$ (2,092)$ 31,859$ 13$ 31,846$ PMI Total 80,029$ 48,812$ 31,217$ (4.6)% 2.1% 2.0% Operating Companies I come Less Currency Operating Companies Income excluding Currency Less Acquisi- tions Operating Companies Income excluding Currency & Acquisitions Operating Companies Income Total Excluding Currency Excluding Currency & Acquisitions 3,815$ 39$ 3,776$ (1)$ 3,777$ European Union 4,309$ (11.5)% (12.4)% (12.3)% 4,033 (613) 4,646 (8) 4,654 EEMA 3,708 8.8% 25.3% 25.5% 3,187 (656) 3,843 - 3,843 Asia 4,622 (31.0)% (16.9)% (16.9)% 1,030 (243) 1,273 (1) 1,274 Latin America & Canada 1,134 (9.2)% 12.3% 12.3% 12,065$ (1,473)$ 13,538$ (10)$ 13,548$ PMI Total 13,773$ (12.4)% (1.7)% (1.6)% 2014 2013 % Change in Operating Companies Income 2014 2013 % Change in Net Revenues excluding Excise Taxes
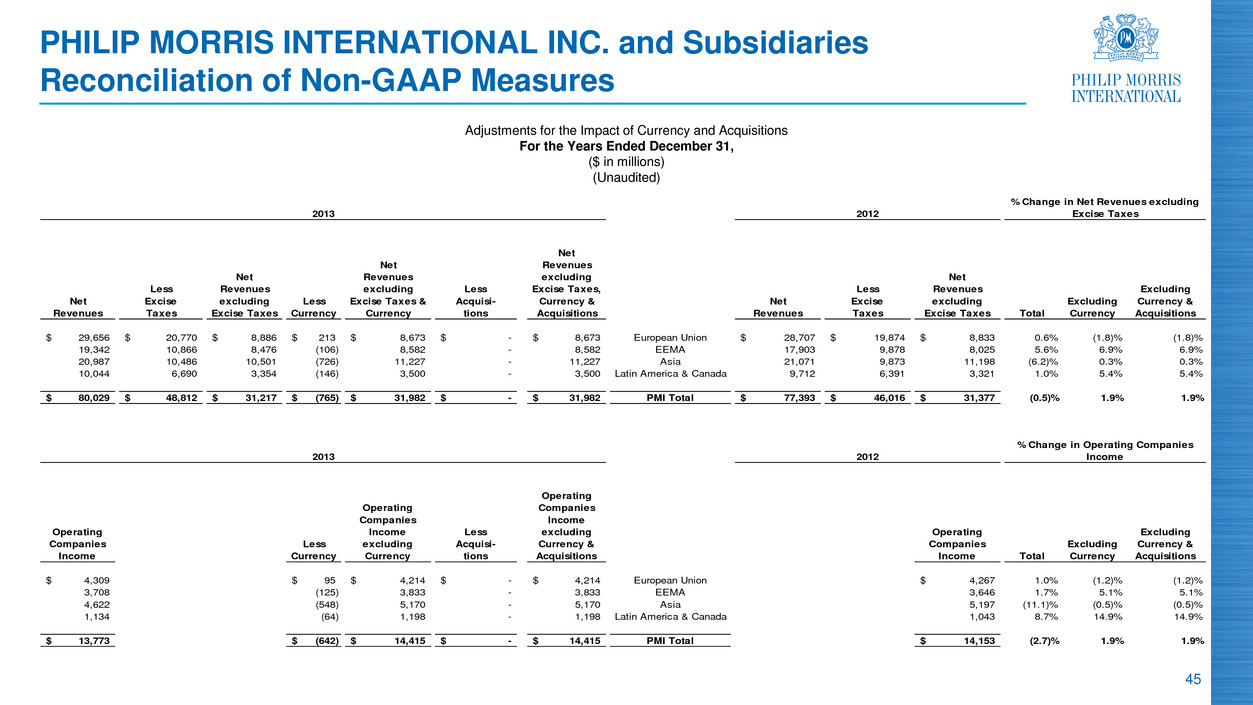
45 PHILIP MORRIS INTERNATIONAL INC. and Subsidiaries Reconciliation of Non-GAAP Measures Adjustments for the Impact of Currency and Acquisitions For the Years Ended December 31, ($ in millions) (Unaudited) Net Revenues Less Excise Taxes Net Revenues excluding Excise Taxes Less Currency Net Revenues excluding Excise Taxes & Currency Less Acquisi- tions Net Revenues excluding Excise Taxes, Currency & Acquisitions Net Revenues Less Excise Taxes Net Revenues excluding Excise Taxes Total Excluding Currency Excluding Currency & Acquisitions 29,656$ 20,770$ 8,886$ 213$ 8,673$ -$ 8,673$ European Union 28,707$ 19,874$ 8,833$ 0.6% (1.8)% (1.8)% 19,342 10,866 8,476 (106) 8,582 - 8,582 EEMA 17,903 9,878 8,025 5.6% 6.9% 6.9% 20,987 10,486 10,501 (726) 11,227 - 11,227 Asia 21,071 9,873 11,198 (6.2)% 0.3% 0.3% 10,044 6,690 3,354 (146) 3,500 - 3,500 Latin America & Canada 9,712 6,391 3,321 1.0% 5.4% 5.4% 80,029$ 48,812$ 31,217$ (765)$ 31,982$ -$ 31,982$ PMI Total 77,393$ 46,016$ 31,377$ (0.5)% 1.9% 1.9% Operating Companies I come Less Currency Operating Companies Income excluding Currency Less Acquisi- tions Operating Companies Income excluding Currency & Acquisitions Operating Companies Income Total Excluding Currency Excluding Currency & Acquisitions 4,309$ 95$ 4,214$ -$ 4,214$ European Union 4,267$ 1.0% (1.2)% (1.2)% 3,708 (125) 3,833 - 3,833 EEMA 3,646 1.7% 5.1% 5.1% 4,622 (548) 5,170 - 5,170 Asia 5,197 (11.1)% (0.5)% (0.5)% 1,134 (64) 1,198 - 1,198 Latin America & Canada 1,043 8.7% 14.9% 14.9% 13,773$ (642)$ 14,415$ -$ 14,415$ PMI Total 14,153$ (2.7)% 1.9% 1.9% 2013 2012 % Change in Operating Companies Income 2013 2012 % Change in Net Revenues excluding Excise Taxes
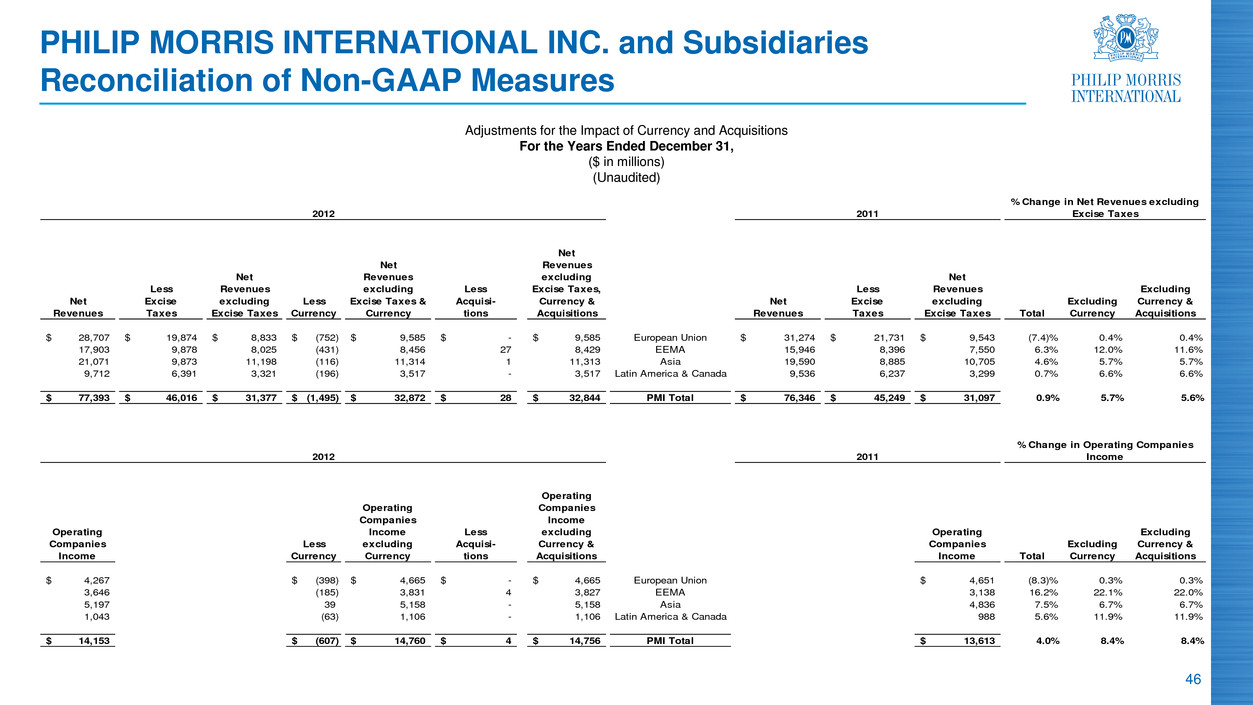
46 PHILIP MORRIS INTERNATIONAL INC. and Subsidiaries Reconciliation of Non-GAAP Measures Adjustments for the Impact of Currency and Acquisitions For the Years Ended December 31, ($ in millions) (Unaudited) Net Revenues Less Excise Taxes Net Revenues excluding Excise Taxes Less Currency Net Revenues excluding Excise Taxes & Currency Less Acquisi- tions Net Revenues excluding Excise Taxes, Currency & Acquisitions Net Revenues Less Excise Taxes Net Revenues excluding Excise Taxes Total Excluding Currency Excluding Currency & Acquisitions 28,707$ 19,874$ 8,833$ (752)$ 9,585$ -$ 9,585$ European Union 31,274$ 21,731$ 9,543$ (7.4)% 0.4% 0.4% 17,903 9,878 8,025 (431) 8,456 27 8,429 EEMA 15,946 8,396 7,550 6.3% 12.0% 11.6% 21,071 9,873 11,198 (116) 11,314 1 11,313 Asia 19,590 8,885 10,705 4.6% 5.7% 5.7% 9,712 6,391 3,321 (196) 3,517 - 3,517 Latin America & Canada 9,536 6,237 3,299 0.7% 6.6% 6.6% 77,393$ 46,016$ 31,377$ (1,495)$ 32,872$ 28$ 32,844$ PMI Total 76,346$ 45,249$ 31,097$ 0.9% 5.7% 5.6% Operating Companies I come Less Currency Operating Companies Income excluding Currency Less Acquisi- tions Operating Companies Income excluding Currency & Acquisitions Operating Companies Income Total Excluding Currency Excluding Currency & Acquisitions 4,267$ (398)$ 4,665$ -$ 4,665$ European Union 4,651$ (8.3)% 0.3% 0.3% 3,646 (185) 3,831 4 3,827 EEMA 3,138 16.2% 22.1% 22.0% 5,197 39 5,158 - 5,158 Asia 4,836 7.5% 6.7% 6.7% 1,043 (63) 1,106 - 1,106 Latin America & Canada 988 5.6% 11.9% 11.9% 14,153$ (607)$ 14,760$ 4$ 14,756$ PMI Total 13,613$ 4.0% 8.4% 8.4% 2012 2011 % Change in Operating Companies Income 2012 2011 % Change in Net Revenues excluding Excise Taxes

47 PHILIP MORRIS INTERNATIONAL INC. and Subsidiaries Reconciliation of Non-GAAP Measures Adjustments for the Impact of Currency and Acquisitions For the Years Ended December 31, ($ in millions) (Unaudited) Net Revenues Less Excise Taxes Net Revenues excluding Excise Taxes Less Currency Net Revenues excluding Excise Taxes & Currency Less Acquisi- tions Net Revenues excluding Excise Taxes, Currency & Acquisitions Net Revenues Less Excise Taxes Net Revenues excluding Excise Taxes Total Excluding Currency Excluding Currency & Acquisitions 31,274$ 21,731$ 9,543$ 454$ 9,089$ -$ 9,089$ European Union 29,305$ 20,202$ 9,103$ 4.8% (0.2)% (0.2)% 15,946 8,396 7,550 35 7,515 25 7,490 EEMA 14,673 7,556 7,117 6.1% 5.6% 5.2% 19,590 8,885 10,705 690 10,015 112 9,903 Asia 15,235 7,300 7,935 34.9% 26.2% 24.8% 9,536 6,237 3,299 70 3,229 - 3,229 Latin America & Canada 8,500 5,447 3,053 8.1% 5.8% 5.8% 76,346$ 45,249$ 31,097$ 1,249$ 29,848$ 137$ 29,711$ PMI Total 67,713$ 40,505$ 27,208$ 14.3% 9.7% 9.2% Operating Companies I come Less Currency Operating Companies Income excluding Currency Less Acquisi- tions Operating Companies Income excluding Currency & Acquisitions Operating Companies Income Total Excluding Currency Excluding Currency & Acquisitions 4,651$ 283$ 4,368$ (1)$ 4,369$ European Union 4,394$ 5.8% (0.6)% (0.6)% 3,138 (103) 3,241 (13) 3,254 EEMA 3,069 2.2% 5.6% 6.0% 4,836 400 4,436 28 4,408 Asia 3,049 58.6% 45.5% 44.6% 988 (2) 990 - 990 Latin America & Canada 953 3.7% 3.9% 3.9% 13,613$ 578$ 13,035$ 14$ 13,021$ PMI Total 11,465$ 18.7% 13.7% 13.6% 2011 2010 % Change in Operating Companies Income 2011 2010 % Change in Net Revenues excluding Excise Taxes

48 PHILIP MORRIS INTERNATIONAL INC. and Subsidiaries Reconciliation of Non-GAAP Measures Adjustments for the Impact of Currency and Acquisitions For the Years Ended December 31, ($ in millions) (Unaudited) Net Revenues Less Excise Taxes Net Revenues excluding Excise Taxes Less Currency Net Revenues excluding Excise Taxes & Currency Less Acquisi- tions Net Revenues excluding Excise Taxes, Currency & Acquisitions Net Revenues Less Excise Taxes Net Revenues excluding Excise Taxes Total Excluding Currency Excluding Currency & Acquisitions 29,305$ 20,202$ 9,103$ (182)$ 9,285$ 3$ 9,282$ European Union 29,909$ 20,534$ 9,375$ (2.9)% (1.0)% (1.0)% 14,673 7,556 7,117 86 7,031 80 6,951 EEMA 12,506 6,045 6,461 10.2% 8.8% 7.6% 15,235 7,300 7,935 611 7,324 548 6,776 Asia 12,413 5,885 6,528 21.6% 12.2% 3.8% 8,500 5,447 3,053 179 2,874 - 2,874 Latin America & Canada 7,252 4,581 2,671 14.3% 7.6% 7.6% 67,713$ 40,505$ 27,208$ 694$ 26,514$ 631$ 25,883$ PMI Total 62,080$ 37,045$ 25,035$ 8.7% 5.9% 3.4% Operating Companies I come Less Currency Operating Companies Income excluding Currency Less Acquisi- tions Operating Companies Income excluding Currency & Acquisitions Operating Companies Income Total Excluding Currency Excluding Currency & Acquisitions 4,394$ (196)$ 4,590$ 2$ 4,588$ European Union 4,601$ (4.5)% (0.2)% (0.3)% 3,069 112 2,957 28 2,929 EEMA 2,568 19.5% 15.1% 14.1% 3,049 342 2,707 84 2,623 Asia 2,436 25.2% 11.1% 7.7% 953 85 868 (3) 871 Latin America & Canada 666 43.1% 30.3% 30.8% 11,465$ 343$ 11,122$ 111$ 11,011$ PMI Total 10,271$ 11.6% 8.3% 7.2% 2010 2009 % Change in Operating Companies Income 2010 2009 % Change in Net Revenues excluding Excise Taxes

49 PHILIP MORRIS INTERNATIONAL INC. and Subsidiaries Reconciliation of Non-GAAP Measures Adjustments for the Impact of Currency and Acquisitions For the Years Ended December 31, ($ in millions) (Unaudited) Net Revenues Less Excise Taxes Net Revenues excluding Excise Taxes Less Currency Net Revenues excluding Excise Taxes & Currency Less Acquisi- tions Net Revenues excluding Excise Taxes, Currency & Acquisitions Net Revenues Less Excise Taxes Net Revenues excluding Excise Taxes Total Excluding Currency Excluding Currency & Acquisitions 29,909$ 20,534$ 9,375$ (910)$ 10,285$ 61$ 10,224$ European Union 31,724$ 21,644$ 10,080$ (7.0)% 2.0% 1.4% 12,506 6,045 6,461 (1,319) 7,780 41 7,739 EEMA 13,358 6,246 7,112 (9.2)% 9.4% 8.8% 12,413 5,885 6,528 (41) 6,569 - 6,569 Asia 12,222 6,037 6,185 5.5% 6.2% 6.2% 7,252 4,581 2,671 (328) 2,999 462 2,537 Latin America & Canada 6,336 4,008 2,328 14.7% 28.8% 9.0% 62,080$ 37,045$ 25,035$ (2,598)$ 27,633$ 564$ 27,069$ PMI Total 63,640$ 37,935$ 25,705$ (2.6)% 7.5% 5.3% Operating Companies I come Less Currency Operating Companies Income excluding Currency Less Acquisi- tions Operating Companies Income excluding Currency & Acquisitions Operating Companies Income Total Excluding Currency Excluding Currency & Acquisitions 4,601$ (512)$ 5,113$ 40$ 5,073$ European Union 4,868$ (5.5)% 5.0% 4.2% 2,568 (862) 3,430 18 3,412 EEMA 2,989 (14.1)% 14.8% 14.2% 2,436 146 2,290 - 2,290 Asia 2,057 18.4% 11.3% 11.3% 666 (162) 828 202 626 Latin America & Canada 520 28.1% 59.2% 20.4% 10,271$ (1,390)$ 11,661$ 260$ 11,401$ PMI Total 10,434$ (1.6)% 11.8% 9.3% 2009 2008 % Change in Operating Companies Income 2009 2008 % Change in Net Revenues excluding Excise Taxes
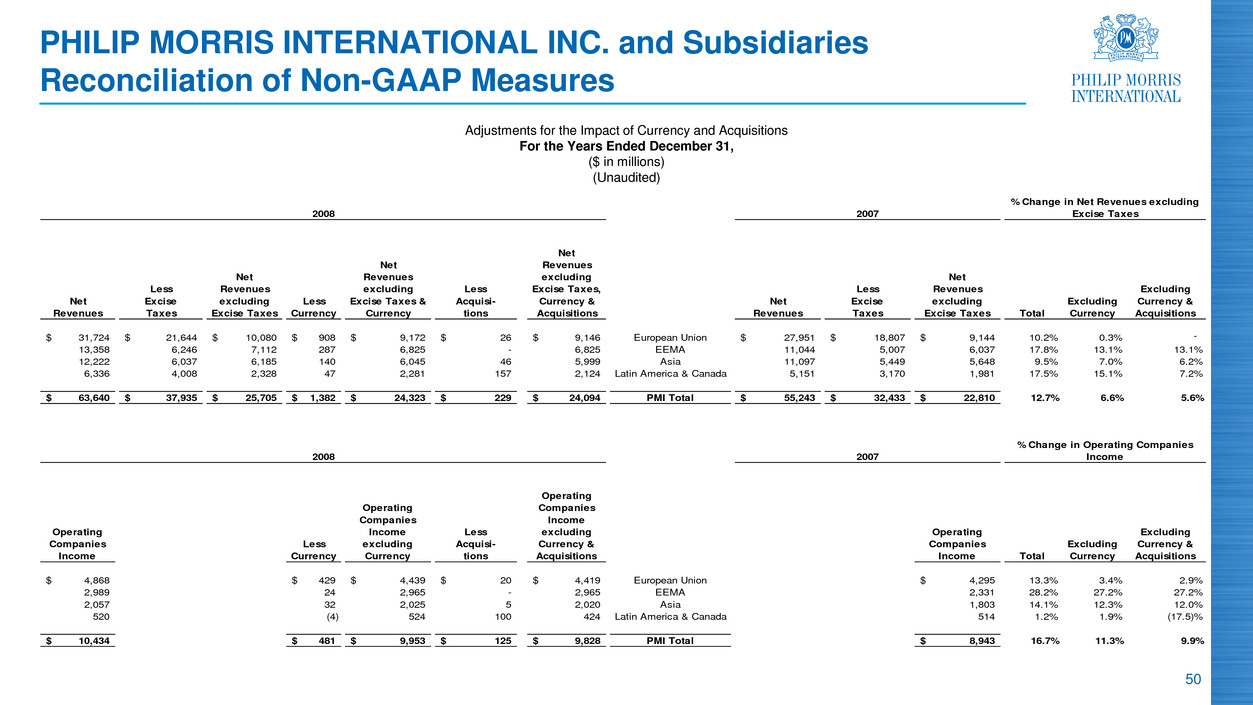
50 PHILIP MORRIS INTERNATIONAL INC. and Subsidiaries Reconciliation of Non-GAAP Measures Adjustments for the Impact of Currency and Acquisitions For the Years Ended December 31, ($ in millions) (Unaudited) Net Revenues Less Excise Taxes Net Revenues excluding Excise Taxes Less Currency Net Revenues excluding Excise Taxes & Currency Less Acquisi- tions Net Revenues excluding Excise Taxes, Currency & Acquisitions Net Revenues Less Excise Taxes Net Revenues excluding Excise Taxes Total Excluding Currency Excluding Currency & Acquisitions 31,724$ 21,644$ 10,080$ 908$ 9,172$ 26$ 9,146$ European Union 27,951$ 18,807$ 9,144$ 10.2% 0.3% 0.0% 13,358 6,246 7,112 287 6,825 - 6,825 EEMA 11,044 5,007 6,037 17.8% 13.1% 13.1% 12,222 6,037 6,185 140 6,045 46 5,999 Asia 11,097 5,449 5,648 9.5% 7.0% 6.2% 6,336 4,008 2,328 47 2,281 157 2,124 Latin America & Canada 5,151 3,170 1,981 17.5% 15.1% 7.2% 63,640$ 37,935$ 25,705$ 1,382$ 24,323$ 229$ 24,094$ PMI Total 55,243$ 32,433$ 22,810$ 12.7% 6.6% 5.6% Operating Companies I come Less Currency Operating Companies Income excluding Currency Less Acquisi- tions Operating Companies Income excluding Currency & Acquisitions Operating Companies Income Total Excluding Currency Excluding Currency & Acquisitions 4,868$ 429$ 4,439$ 20$ 4,419$ European Union 4,295$ 13.3% 3.4% 2.9% 2,989 24 2,965 - 2,965 EEMA 2,331 28.2% 27.2% 27.2% 2,057 32 2,025 5 2,020 Asia 1,803 14.1% 12.3% 12.0% 520 (4) 524 100 424 Latin America & Canada 514 1.2% 1.9% (17.5)% 10,434$ 481$ 9,953$ 125$ 9,828$ PMI Total 8,943$ 16.7% 11.3% 9.9% 2008 2007 % Change in Operating Companies Income 2008 2007 % Change in Net Revenues excluding Excise Taxes -
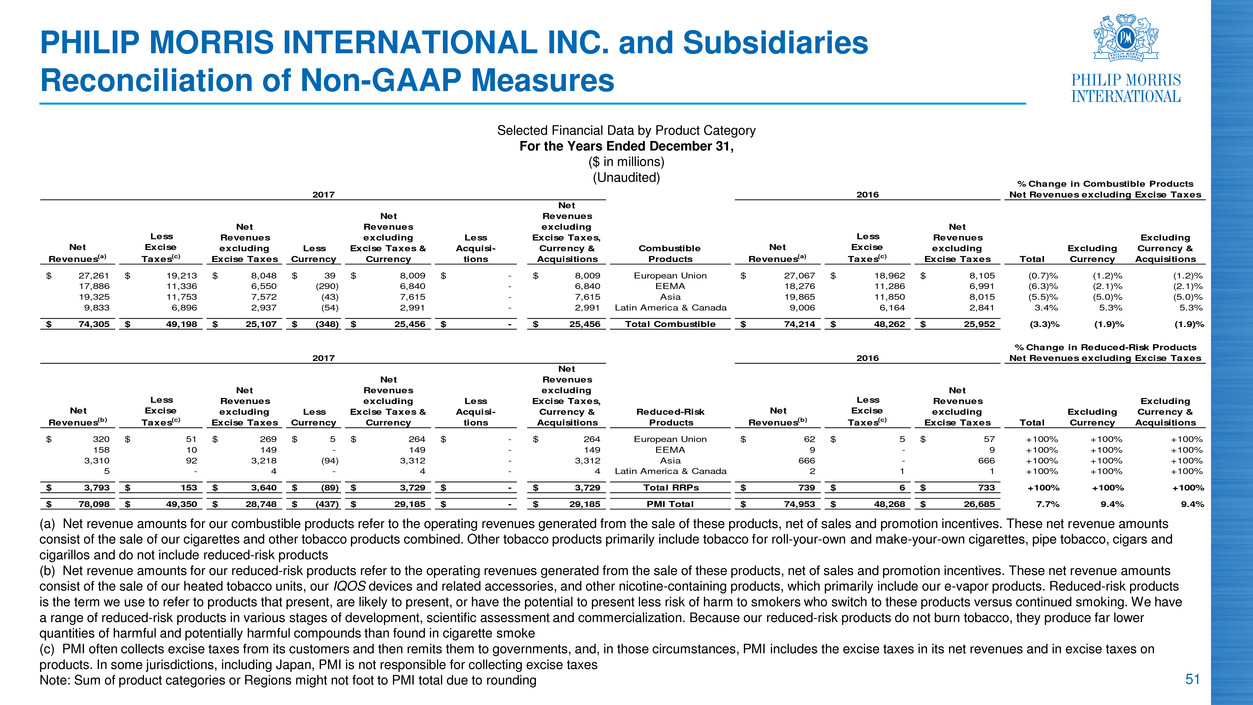
51 PHILIP MORRIS INTERNATIONAL INC. and Subsidiaries Reconciliation of Non-GAAP Measures Selected Financial Data by Product Category For the Years Ended December 31, ($ in millions) (Unaudited) (a) Net revenue amounts for our combustible products refer to the operating revenues generated from the sale of these products, net of sales and promotion incentives. These net revenue amounts consist of the sale of our cigarettes and other tobacco products combined. Other tobacco products primarily include tobacco for roll-your-own and make-your-own cigarettes, pipe tobacco, cigars and cigarillos and do not include reduced-risk products (b) Net revenue amounts for our reduced-risk products refer to the operating revenues generated from the sale of these products, net of sales and promotion incentives. These net revenue amounts consist of the sale of our heated tobacco units, our IQOS devices and related accessories, and other nicotine-containing products, which primarily include our e-vapor products. Reduced-risk products is the term we use to refer to products that present, are likely to present, or have the potential to present less risk of harm to smokers who switch to these products versus continued smoking. We have a range of reduced-risk products in various stages of development, scientific assessment and commercialization. Because our reduced-risk products do not burn tobacco, they produce far lower quantities of harmful and potentially harmful compounds than found in cigarette smoke (c) PMI often collects excise taxes from its customers and then remits them to governments, and, in those circumstances, PMI includes the excise taxes in its net revenues and in excise taxes on products. In some jurisdictions, including Japan, PMI is not responsible for collecting excise taxes Note: Sum of product categories or Regions might not foot to PMI total due to rounding Net Revenues(a) Less Excise Taxes(c) Net Revenues excluding Excise Taxes Less Currency Net Revenues excluding Excise Taxes & Currency Less Acquisi- tions Net Revenues excluding Excise Taxes, Currency & Acquisitions Combustible Products Net Revenues(a) Less Excise Taxes(c) Net Revenues excluding Excise Taxes Total Excluding Currency Excluding Currency & Acquisitions 27,261$ 19,213$ 8,048$ 39$ 8,009$ -$ 8,009$ European Union 27,067$ 18,962$ 8,105$ (0.7)% (1.2)% (1.2)% 17,886 11,336 6,550 (290) 6,840 - 6,840 EEMA 18,276 11,286 6,991 (6.3)% (2.1)% (2.1)% 19,325 11,753 7,572 (43) 7,615 - 7,615 Asia 19,865 11,850 8,015 (5.5)% (5.0)% (5.0)% 9,833 6,896 2,937 (54) 2,991 - 2,991 Latin America & Canada 9,006 6,164 2,841 3.4% 5.3% 5.3% 74,305$ 49,198$ 25,107$ (348)$ 25,456$ -$ 25,456$ Total Combustible 74,214$ 48,262$ 25,952$ (3.3)% (1.9)% (1.9)% Net Revenue (b) Less Excise Taxes(c) Net Revenues excluding Excise Taxes Less Currency Net Revenues excluding Excise Taxes & Currency Less Acquisi- tions Net Revenues excluding Excise Taxes, Currency & Acquisitions Reduced-Risk Products Net Revenues(b) Less Excise Taxes(c) Net Revenues excluding Excise Taxes Total Excluding Currency Excluding Currency & Acquisitions 320$ 51$ 269$ 5$ 264$ -$ 264$ European Union 62$ 5$ 57$ +100% +100% +100% 158 10 149 - 149 - 149 EEMA 9 - 9 +100% +100% +100% 3,310 92 3,218 (94) 3,312 - 3,312 Asia 666 - 666 +100% +100% +100% 5 - 4 - 4 - 4 Latin America & Canada 2 1 1 +100% +100% +100% 3,793$ 153$ 3,640$ (89)$ 3,729$ -$ 3,729$ Total RRPs 739$ 6$ 733$ +100% +100% +100% 78,098$ 49,350$ 28,748$ (437)$ 29,185$ -$ 29,185$ PMI Total 74,953$ 48,268$ 26,685$ 7.7% 9.4% 9.4% 2017 2016 % Change in Reduced-Risk Products Net Revenues excluding Excise Taxes 2017 2016 % Change in Combustible Products Net Revenues excluding Excise Taxes
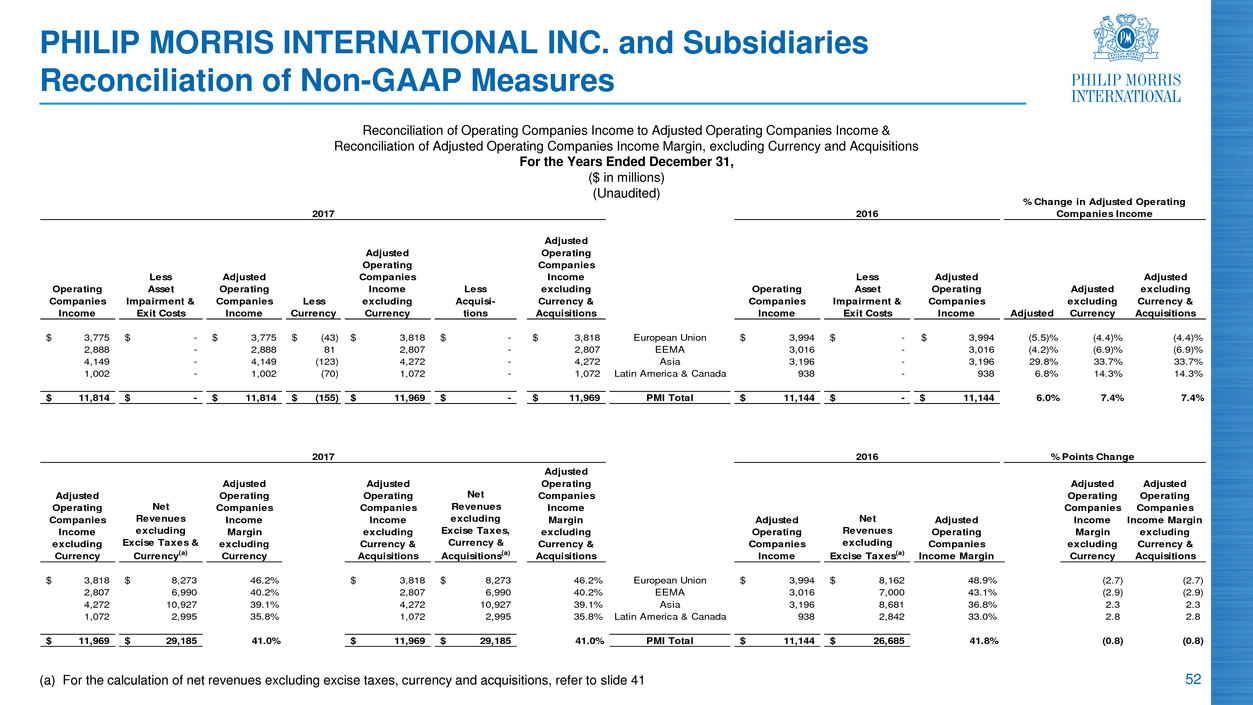
52 (a) For the calculation of net revenues excluding excise taxes, currency and acquisitions, refer to slide 41 PHILIP MORRIS INTERNATIONAL INC. and Subsidiaries Reconciliation of Non-GAAP Measures Reconciliation of Operating Companies Income to Adjusted Operating Companies Income & Reconciliation of Adjusted Operating Companies Income Margin, excluding Currency and Acquisitions For the Years Ended December 31, ($ in millions) (Unaudited) Operating Companies Income Less Asset Impairment & Exit Costs Adjusted Operating Companies Income Less Currency Adjusted Operating Companies Income excluding Currency Less Acquisi- tions Adjusted Operating Companies Income excluding Currency & Acquisitions Operating Companies Income Less Asset Impairment & Exit Costs Adjusted Operating Companies Income Adjusted Adjusted excluding Currency Adjusted excluding Currency & Acquisitions 3,775$ -$ 3,775$ (43)$ 3,818$ -$ 3,818$ European Union 3,994$ -$ 3,994$ (5.5)% (4.4)% (4.4)% 2,888 - 2,888 81 2,807 - 2,807 EEMA 3,016 - 3,016 (4.2)% (6.9)% (6.9)% 4,149 - 4,149 (123) 4,272 - 4,272 Asia 3,196 - 3,196 29.8% 33.7% 33.7% 1,002 - 1,002 (70) 1,072 - 1,072 Latin America & Canada 938 - 938 6.8% 14.3% 14.3% 11,814$ -$ 11,814$ (155)$ 11,969$ -$ 11,969$ PMI Total 11,144$ -$ 11,144$ 6.0% 7.4% 7.4% % Points Change Adjusted Operating Companies Income excluding Currency Net Revenues excluding Excise Taxes & Currency(a) Adjusted Operating Companies Income Margin excluding Currency Adjusted Operating Companies Income excluding Currency & Acquisitions Net Revenues excluding Excise Taxes, Currency & Acquisitions(a) Adjusted Operating Companies Income Margin excluding Currency & Acquisitions Adjusted Operating Companies Income Net Revenues excluding Excise Taxes(a) Adjusted Operating Companies Income Margin Adjusted Operating Companies Income Margin excluding Currency Adjusted Operating Companies Income Margin excluding Currency & Acquisitions 3,818$ 8,273$ 46.2% 3,818$ 8,273$ 46.2% European Union 3,994$ 8,162$ 48.9% (2.7) (2.7) 2,807 6,990 40.2% 2,807 6,990 40.2% EEMA 3,016 7,000 43.1% (2.9) (2.9) 4,272 10,927 39.1% 4,272 10,927 39.1% Asia 3,196 8,681 36.8% 2.3 2.3 1,072 2,995 35.8% 1,072 2,995 35.8% Latin America & Canada 938 2,842 33.0% 2.8 2.8 11,969$ 29,185$ 41.0% 11,969$ 29,185$ 41.0% PMI Total 11,144$ 26,685$ 41.8% (0.8) (0.8) 2017 2016 2017 2016 % Change in Adjusted Operating Companies Income

53 PHILIP MORRIS INTERNATIONAL INC. and Subsidiaries Reconciliation of Non-GAAP Measures Reconciliation of Reported Diluted EPS to Adjusted Diluted EPS and Adjusted Diluted EPS, excluding Currency For the Years Ended December 31, (Unaudited) 2017 2016 % Change Reported Diluted EPS 3.88$ 4.48$ (13.4)% Adjustments: Asset impairment and exit costs - - Tax items 0.84 - Adjuste iluted EPS 4.72$ 4.48$ 5.4% Less: Currency impact (0.21) Adjusted Diluted EPS, excluding Currency 4.93$ 4.48$ 10.0%
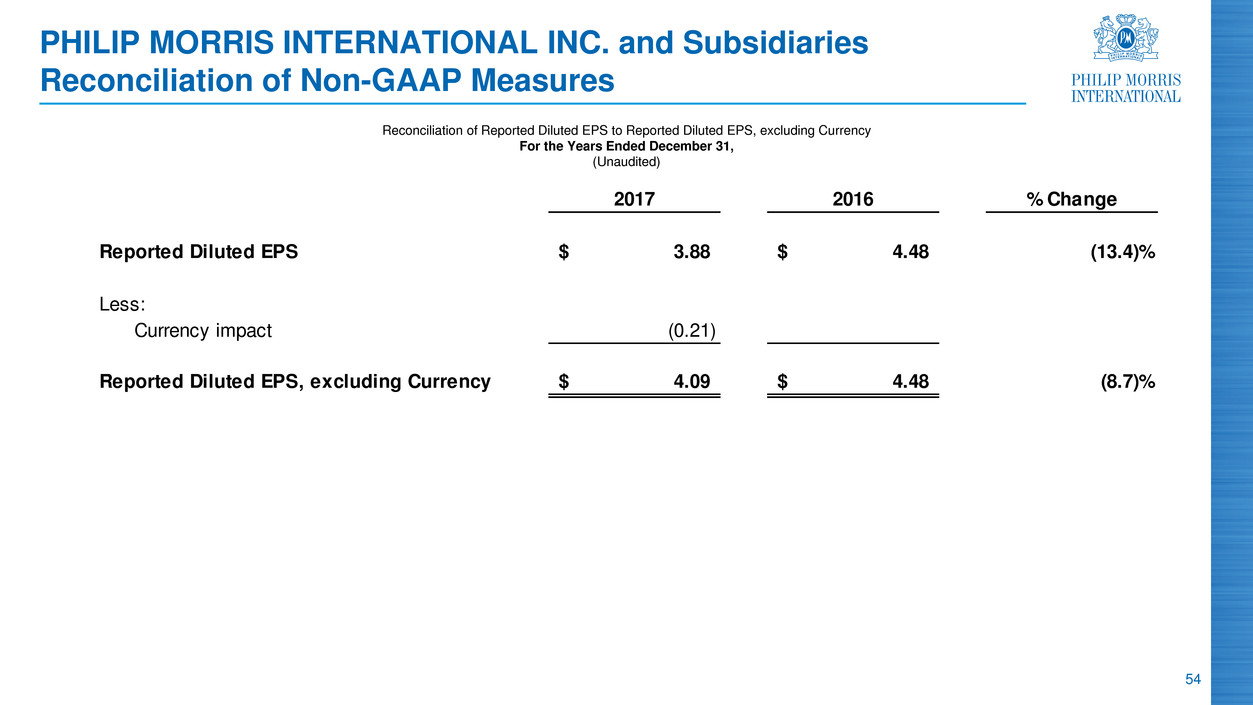
54 PHILIP MORRIS INTERNATIONAL INC. and Subsidiaries Reconciliation of Non-GAAP Measures Reconciliation of Reported Diluted EPS to Reported Diluted EPS, excluding Currency For the Years Ended December 31, (Unaudited) 2017 2016 % Change Reported Diluted EPS 3.88$ 4.48$ (13.4)% Less: Currency impact (0.21) Reported Diluted EPS, excluding Currency 4.09$ 4.48$ (8.7)%
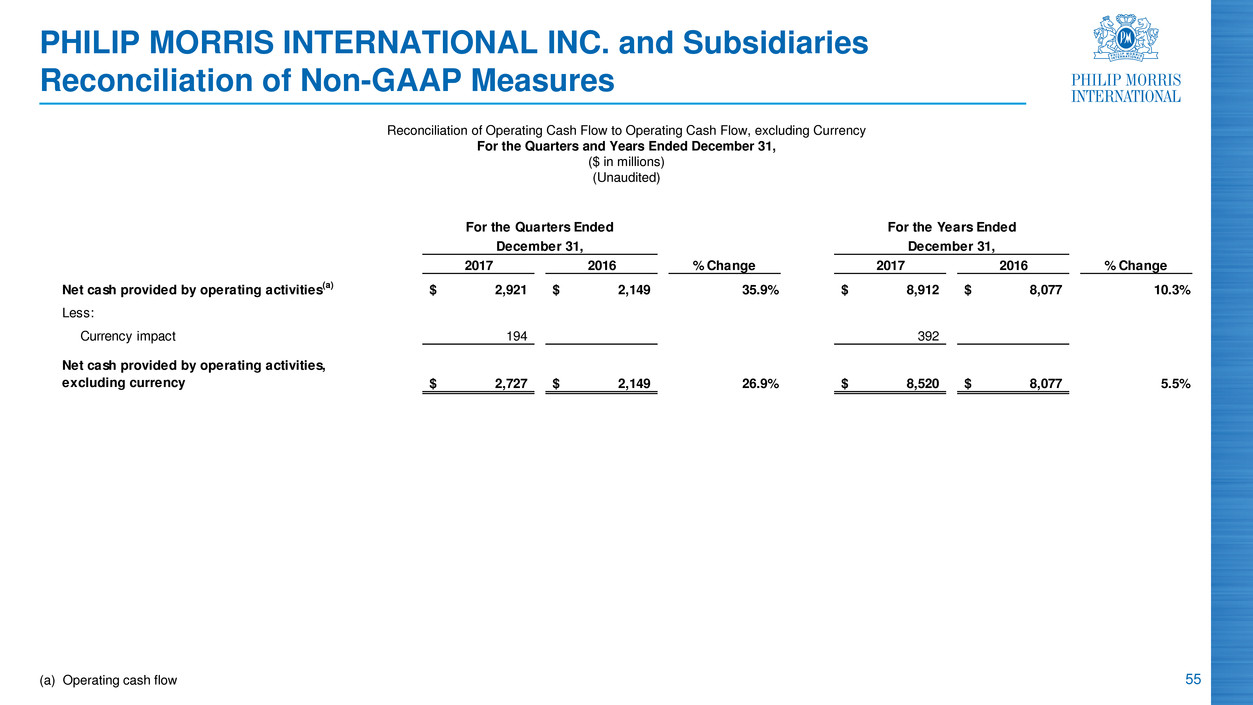
55 PHILIP MORRIS INTERNATIONAL INC. and Subsidiaries Reconciliation of Non-GAAP Measures Reconciliation of Operating Cash Flow to Operating Cash Flow, excluding Currency For the Quarters and Years Ended December 31, ($ in millions) (Unaudited) (a) Operating cash flow For the Quarters Ended For the Years Ended December 31, December 31, 2017 2016 % Change 2017 2016 % Change Net cash provided by operating activities(a) 2,921$ 2,149$ 35.9% 8,912$ 8,077$ 10.3% Less: Currency impact 194 392 Net cash provided by operating activities, excluding currency 2,727$ 2,149$ 26.9% 8,520$ 8,077$ 5.5%
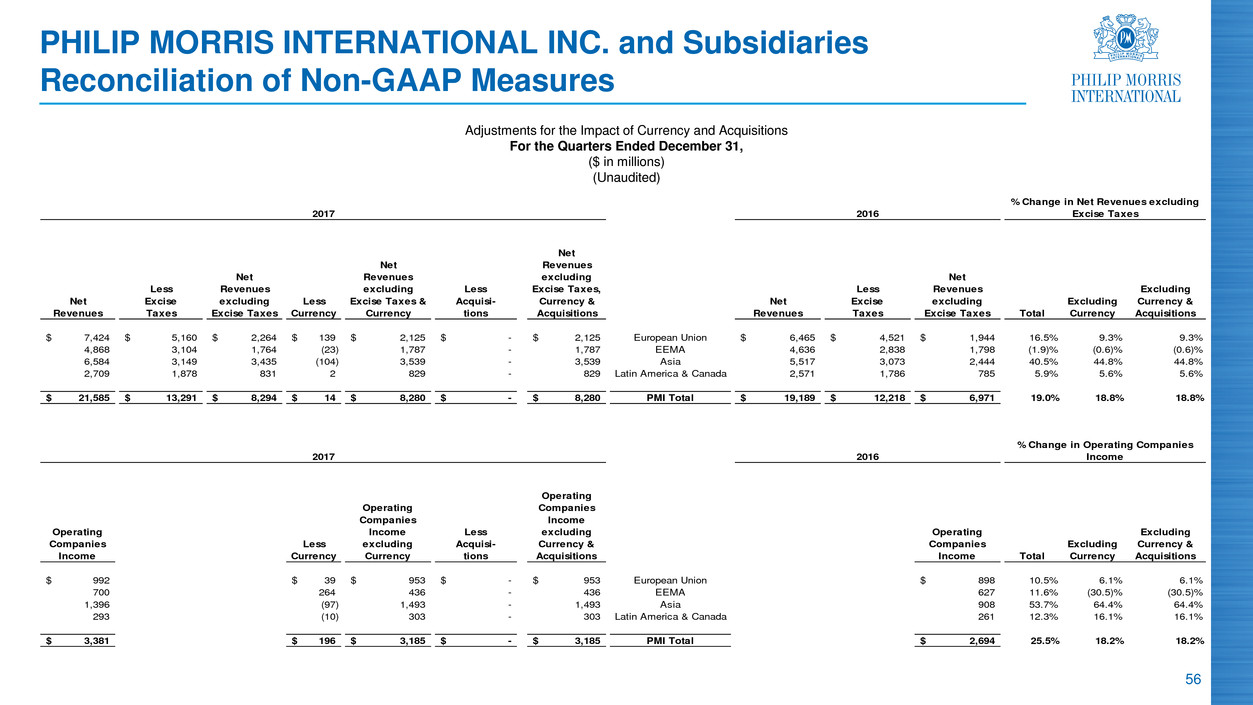
56 PHILIP MORRIS INTERNATIONAL INC. and Subsidiaries Reconciliation of Non-GAAP Measures Adjustments for the Impact of Currency and Acquisitions For the Quarters Ended December 31, ($ in millions) (Unaudited) Net Revenues Less Excise Taxes Net Revenues excluding Excise Taxes Less Currency Net Revenues excluding Excise Taxes & Currency Less Acquisi- tions Net Revenues excluding Excise Taxes, Currency & Acquisitions Net Revenues Less Excise Taxes Net Revenues excluding Excise Taxes Total Excluding Currency Excluding Currency & Acquisitions 7,424$ 5,160$ 2,264$ 139$ 2,125$ -$ 2,125$ European Union 6,465$ 4,521$ 1,944$ 16.5% 9.3% 9.3% 4,868 3,104 1,764 (23) 1,787 - 1,787 EEMA 4,636 2,838 1,798 (1.9)% (0.6)% (0.6)% 6,584 3,149 3,435 (104) 3,539 - 3,539 Asia 5,517 3,073 2,444 40.5% 44.8% 44.8% 2,709 1,878 831 2 829 - 829 Latin America & Canada 2,571 1,786 785 5.9% 5.6% 5.6% 21,585$ 13,291$ 8,294$ 14$ 8,280$ -$ 8,280$ PMI Total 19,189$ 12,218$ 6,971$ 19.0% 18.8% 18.8% Operating Companies I come Less Currency Operating Companies Income excluding Currency Less Acquisi- tions Operating Companies Income excluding Currency & Acquisitions Operating Companies Income Total Excluding Currency Excluding Currency & Acquisitions 992$ 39$ 953$ -$ 953$ European Union 898$ 10.5% 6.1% 6.1% 700 264 436 - 436 EEMA 627 11.6% (30.5)% (30.5)% 1,396 (97) 1,493 - 1,493 Asia 908 53.7% 64.4% 64.4% 293 (10) 303 - 303 Latin America & Canada 261 12.3% 16.1% 16.1% 3,381$ 196$ 3,185$ -$ 3,185$ PMI Total 2,694$ 25.5% 18.2% 18.2% 2017 2016 % Change in Operating Companies Income 2017 2016 % Change in Net Revenues excluding Excise Taxes

57 (a) For the calculation of net revenues excluding excise taxes, currency and acquisitions, refer to previous slide PHILIP MORRIS INTERNATIONAL INC. and Subsidiaries Reconciliation of Non-GAAP Measures Reconciliation of Operating Companies Income to Adjusted Operating Companies Income & Reconciliation of Adjusted Operating Companies Income Margin, excluding Currency and Acquisitions For the Quarters Ended December 31, ($ in millions) (Unaudited) Operating Companies Income Less Asset Impairment & Exit Costs Adjusted Operating Companies Income Less Currency Adjusted Operating Companies Income excluding Currency Less Acquisi- tions Adjusted Operating Companies Income excluding Currency & Acquisitions Operating Companies Income Less Asset Impairment & Exit Costs Adjusted Operating Companies Income Adjusted Adjusted excluding Currency Adjusted excluding Currency & Acquisitions 992$ -$ 992$ 39$ 953$ -$ 953$ European Union 898$ -$ 898$ 10.5% 6.1% 6.1% 700 - 700 264 436 - 436 EEMA 627 - 627 11.6% (30.5)% (30.5)% 1,396 - 1,396 (97) 1,493 - 1,493 Asia 908 - 908 53.7% 64.4% 64.4% 293 - 293 (10) 303 - 303 Latin America & Canada 261 - 261 12.3% 16.1% 16.1% 3,381$ -$ 3,381$ 196$ 3,185$ -$ 3,185$ PMI Total 2,694$ -$ 2,694$ 25.5% 18.2% 18.2% % Points Change Adjusted Operating Companies Income excluding Currency Net Revenues excluding Excise Taxes & Currency(a) Adjusted Operating Companies Income Margin excluding Currency Adjusted Operating Companies Income excluding Currency & Acquisitions Net Revenues excluding Excise Taxes, Currency & Acquisitions(a) Adjusted Operating Companies Income Margin excluding Currency & Acquisitions Adjusted Operating Companies Income Net Revenues excluding Excise Taxes(a) Adjusted Operating Companies Income Margin Adjusted Operating Companies Income Margin excluding Currency Adjusted Operating Companies Income Margin excluding Currency & Acquisitions 953$ 2,125$ 44.8% 953$ 2,125$ 44.8% European Union 898$ 1,944$ 46.2% (1.4) (1.4) 436 1,787 24.4% 436 1,787 24.4% EEMA 627 1,798 34.9% (10.5) (10.5) 1,493 3,539 42.2% 1,493 3,539 42.2% Asia 908 2,444 37.2% 5.0 5.0 303 829 36.6% 303 829 36.6% Latin America & Canada 261 785 33.2% 3.4 3.4 3,185$ 8,280$ 38.5% 3,185$ 8,280$ 38.5% PMI Total 2,694$ 6,971$ 38.6% (0.1) (0.1) 2017 2016 2017 2016 % Change in Adjusted Operating Companies Income
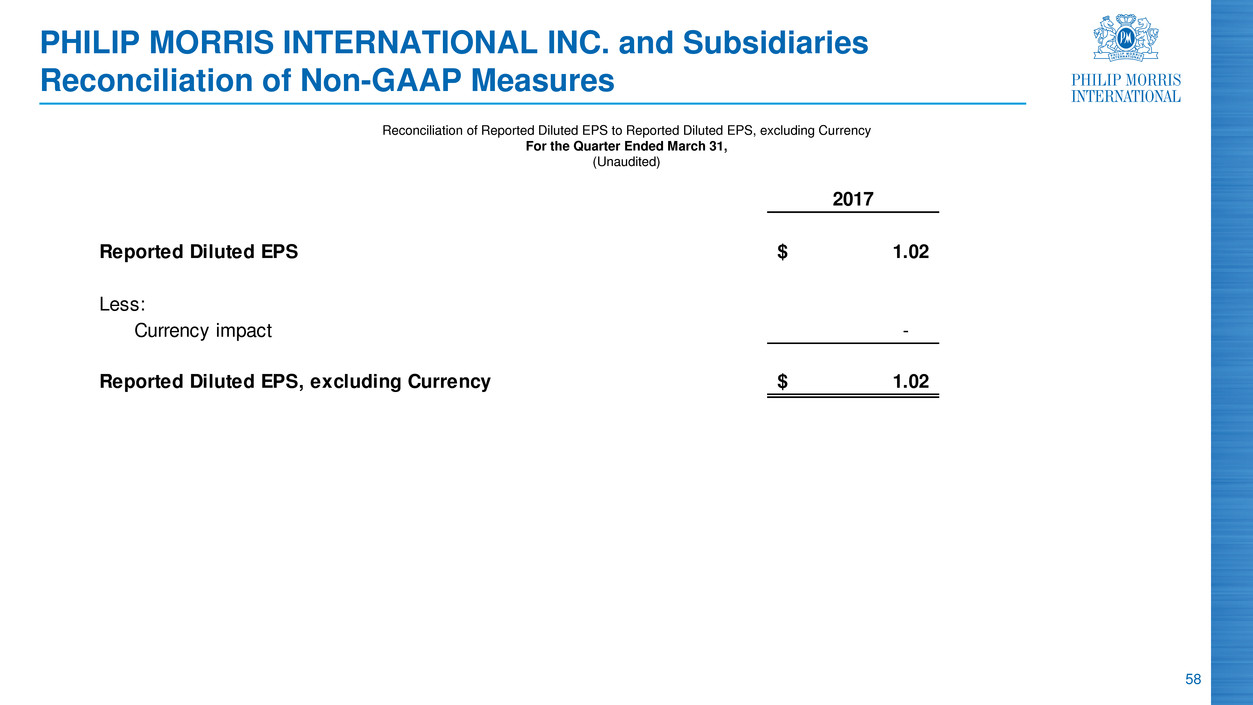
58 PHILIP MORRIS INTERNATIONAL INC. and Subsidiaries Reconciliation of Non-GAAP Measures Reconciliation of Reported Diluted EPS to Reported Diluted EPS, excluding Currency For the Quarter Ended March 31, (Unaudited) 2017 Reported Diluted EPS 1.02$ Less: Currency impact - Reported Diluted EPS, excluding Currency 1.02$
Designing a Smoke-Free Future February 8, 2018 2017 Fourth-Quarter and Full-Year Results


