UNITED STATES
SECURITIES AND EXCHANGE COMMISSION
Washington, D.C. 20549
FORM 10-K
| [X] | ANNUAL REPORT PURSUANT TO SECTION 13 OR 15(d) OF THE SECURITIES EXCHANGE ACT OF 1934 |
For the Fiscal Year Ended September 30, 2009
or
| [ ] | TRANSITION REPORT PURSUANT TO SECTION 13 OR 15(d) OF THE SECURITIES EXCHANGE ACT OF 1934 |
Commission File Number: 001-33795
HOME FEDERAL BANCORP, INC.
(Exact name of registrant as specified in its charter)
Maryland | 68-0666697 | |
(State or other jurisdiction of incorporation or organization) | (I.R.S. Employer Identification No.) | |
| | | |
500 12th Avenue South, Nampa, Idaho | 83651 | |
| (Address of principal executive offices) | (Zip Code) | |
| | | |
| Registrant’s telephone number, including area code: | (208) 466-4634 | |
| | | |
| Securities registered pursuant to Section 12(b) of the Act: | | |
| | | |
| Common Stock, par value $.01 per share | Nasdaq Global Select Market | |
| (Title of Each Class) | (Name of Each Exchange on Which Registered) |
| | | |
| Securities registered pursuant to Section 12(g) of the Act: | None | |
Indicate by check mark if the registrant is a well-known seasoned issuer, as defined in Rule 405 of the Securities Act.Yes [ ] No [X]
Indicate by check mark if the registrant is not required to file reports pursuant to Section 13 or Section 15(d) of the Act. Yes[ ] No [X]
Indicate by check mark whether the registrant (1) has filed all reports required to be filed by Section 13 or 15(d) of the Securities Exchange Act of 1934 during the preceding 12 months (or for such shorter period that the registrant was required to file such reports), and (2) has been subject to such filing requirements for the past 90 days. Yes [X] No [ ]
Indicate by check mark whether the registrant has submitted electronically and posted on its corporate Web site, if any, every Interactive Data File required to be submitted and posted pursuant to Rule 405 of Regulation S-T (§ 232.405 of this chapter) during the preceding 12 months (or for such shorter period that the registrant was required to submit and post such files).Yes [ ] No [ ]
Indicate by check mark if disclosure of delinquent filers pursuant to Item 405 of Regulation S-K is not contained herein, and will not be contained, to the best of registrant's knowledge, in definitive proxy or information statements incorporated by reference in Part III of this Form 10-K or any amendment to this Form 10-K. [ X ]
Indicate by check mark whether the registrant is a large accelerated filer, an accelerated filer, a non-accelerated filer, or a smaller reporting company. See definition of “large accelerated filer,” “accelerated filer” and “smaller reporting company” in Rule 12b-2 of the Exchange Act.
Large accelerated filer [ ] Accelerated filer [X] Non-accelerated filer [ ] Smaller reporting company [ ]
Indicate by check mark whether the registrant is a shell company (as defined in Rule 12b-2 of the Act). Yes [ ] No [X]
As of December 4, 2009, there were 16,698,168 shares of the registrant’s common stock outstanding. The aggregate market value of the voting stock held by nonaffiliates of the registrant based on the closing sales price of the registrant's common stock as quoted on The Nasdaq Global Select Market on March 31, 2009, was approximately $142,400,319 (16,311,606 shares at $8.73 per share).
DOCUMENTS INCORPORATED BY REFERENCE
Part II and Part III - Portions of the Registrant’s definitive Proxy Statement for its 2010 Annual Meeting of Stockholders.
HOME FEDERAL BANCORP, INC.
2009 ANNUAL REPORT ON FORM 10-K
TABLE OF CONTENTS
| | | Page |
| | PART I. | |
| | | |
| Item 1 - | Business | 2 |
| | | |
| Item 1A - | Risk Factors | 43 |
| | | |
| Item 1B - | Unresolved Staff Comments | 53 |
| | | |
| Item 2 - | Properties | 54 |
| | | |
| Item 3 - | Legal Proceedings | 56 |
| | | |
| Item 4 - | Submission of Matters to a Vote of Security Holders | 56 |
| | | |
| | PART II. | |
| | | |
| Item 5 - | Market for Registrant’s Common Equity, Related Stockholder Matters and Issuer Purchases of Equity Securities | 56 |
| | | |
| Item 6 - | Selected Financial Data | 59 |
| | | |
| Item 7 - | Management’s Discussion and Analysis of Financial Condition and Results of Operations | 61 |
| | | |
| Item 7A - | Quantitative and Qualitative Disclosures About Market Risk | 89 |
| | | |
| Item 8 - | Financial Statements and Supplementary Data | 90 |
| | | |
| Item 9 - | Changes in and Disagreements with Accountants on Accounting and Financial Disclosure | 130 |
| | | |
| Item 9A- | Controls and Procedures | 130 |
| | | |
| Item 9B - | Other Information | 130 |
| | | |
| | PART III. | |
| | | |
| Item 10 - | Directors, Executive Officers and Corporate Governance | 130 |
| | | |
| Item 11 - | Executive Compensation | 131 |
| | | |
| Item 12 - | Security Ownership of Certain Beneficial Owners and Management and Related Stockholder Matters | 131 |
| | | |
| Item 13 - | Certain Relationships and Related Transactions, and Director Independence | 131 |
| | | |
| Item 14 - | Principal Accounting Fees and Services | 131 |
| | | |
| | PART IV. | |
| | | |
| Item 15 – | Exhibits, Financial Statement Schedules | 132 |
Forward-Looking Statements
“Safe Harbor” statement under the Private Securities Litigation Reform Act of 1995: This Form 10-K contains forward-looking statements, which can be identified by the use of words such as “believes,” “expects,” “anticipates,” “estimates” or similar expressions. Forward-looking statements include:
| § | statements of our goals, intentions and expectations; |
| § | statements regarding our business plans, prospects, growth and operating strategies; |
| § | statements regarding the quality of our loan and investment portfolios; and |
| § | estimates of our risks and future costs and benefits. |
These forward-looking statements are subject to significant risks and uncertainties. Actual results may differ materially from those contemplated by the forward-looking statements due to, among others, the following factors:
| § | the credit risks of lending activities, including changes in the level and trend of loan delinquencies and write-offs and changes in our allowance for loan losses and provision for loan losses that may be impacted by deterioration in the housing and commercial real estate markets; |
| § | changes in general economic conditions, either nationally or in our market areas; |
| § | changes in the levels of general interest rates, and the relative differences between short and long term interest rates, deposit interest rates, our net interest margin and funding sources; |
| § | fluctuations in the demand for loans, the number of unsold homes, land and other properties and fluctuations in real estate values in our market areas; |
| § | secondary market conditions for loans and our ability to sell loans in the secondary market; |
| § | results of examinations of us by the Office of Thrift Supervision or other regulatory authorities, including the possibility that any such regulatory authority may, among other things, require us to increase our reserve for loan losses, write-down assets, change our regulatory capital position or affect our ability to borrow funds or maintain or increase deposits, which could adversely affect our liquidity and earnings; |
| § | our compliance with regulatory enforcement actions; |
| § | legislative or regulatory changes that adversely affect our business including changes in regulatory policies and principles, or the interpretation of regulatory capital or other rules; |
| § | our ability to attract and retain deposits; |
| § | further increases in premiums for deposit insurance; |
| § | our ability to control operating costs and expenses; |
| § | the use of estimates in determining fair value of certain of our assets, which estimates may prove to be incorrect and result in significant declines in valuation; |
| § | difficulties in reducing risks associated with the loans on our balance sheet; |
| § | staffing fluctuations in response to product demand or the implementation of corporate strategies that affect our workforce and potential associated charges; |
| § | computer systems on which we depend could fail or experience a security breach; |
| § | our ability to retain key members of our senior management team; |
| § | costs and effects of litigation, including settlements and judgments; |
| § | our ability to successfully integrate any assets, liabilities, customers, systems, and management personnel we may in the future acquire into our operations and our ability to realize related revenue synergies and cost savings within expected time frames and any goodwill charges related thereto; |
| § | increased competitive pressures among financial services companies; |
| § | changes in consumer spending, borrowing and savings habits; |
| § | the availability of resources to address changes in laws, rules, or regulations or to respond to regulatory actions; |
| § | our ability to pay dividends on our common stock; |
| § | adverse changes in the securities markets; |
| § | inability of key third-party providers to perform their obligations to us; |
| § | changes in accounting policies and practices, as may be adopted by the financial institution regulatory agencies or the Financial Accounting Standards Board, including additional guidance and interpretation on accounting issues and details of the implementation of new accounting methods; and |
| § | other economic, competitive, governmental, regulatory, and technological factors affecting our operations, pricing, products and services and the other risks described elsewhere in this prospectus and the incorporated documents. |
Some of these and other factors are discussed in this Annual Report on Form 10-K under the caption “Risk Factors” and elsewhere in this document and in the documents incorporated by reference herein. Such developments could have an adverse impact on our financial position and our results of operations.
Any of the forward-looking statements that we make in this annual report and in other public statements we make may turn out to be wrong because of inaccurate assumptions we might make, because of the factors illustrated above or because of other factors that we cannot foresee. Because of these and other uncertainties, our actual future results may be materially different from the results indicated by these forward-looking statements and you should not rely on such statements.
PART I
Item 1. Business
Organization
Home Federal Bancorp, Inc. (“old Home Federal Bancorp”) was organized as a federally chartered stock corporation at the direction of Home Federal Savings and Loan Association of Nampa (“Association”) in connection with its mutual holding company reorganization (“Reorganization”). On December 6, 2004, the Association completed the Reorganization and minority stock offering. In connection with the Reorganization, the Association converted to a federally chartered stock savings bank and changed its name to Home Federal Bank (the “Bank”). Old Home Federal Bancorp sold 40.06% of its outstanding shares of common stock (6,083,500 shares) to the public and issued 59.04% of its outstanding shares of common stock (8,979,246 shares) to Home Federal MHC, the mutual holding company parent of old Home Federal Bancorp. In connection with the Reorganization, old Home Federal Bancorp received $53.6 million in net proceeds after deducting expenses, and issued an additional 146,004 shares and $365,010 in cash to the Home Federal Foundation, Inc. (the “Foundation”), a charitable foundation established as part of the Reorganization.
On May 11, 2007, the Boards of Directors of Home Federal MHC, old Home Federal Bancorp, Inc., and Home Federal Bank adopted a Plan of Conversion and Reorganization (the “Conversion”) pursuant to which Home Federal Bank reorganized from the mutual holding company structure to the stock holding company structure. Pursuant to the terms of the Plan, Home Federal MHC converted to a federal interim stock savings bank and simultaneously merged with and into Home Federal Bank, with Home Federal Bank as the survivor. Additionally, Home Federal Bancorp, Inc. converted to a federal interim stock savings bank and simultaneously merged with and into Home Federal Bank, with Home Federal Bank as the survivor. Home Federal Bank then formed a new stock holding company, Home Federal Bancorp, Inc. (“we”, “us”, the “Company” or “Home Federal Bancorp”), that serves as the holding company for Home Federal Bank. Home Federal Bancorp, Inc., is a Maryland corporation. The conversion was completed on December 19, 2007.
As part of the Conversion, a total of 9,384,000 new shares of the Company were sold at $10 per share in subscription, community and syndicated community offerings through which the Company received proceeds of approximately $87.8 million, net of offering costs of approximately $5.9 million. The Company contributed $48.0 million or approximately 50% of the net proceeds to the Bank in the form of a capital contribution. The Company loaned $8.2 million to the Bank’s Employee Stock Ownership Plan (the “ESOP”) and the ESOP used those funds to acquire 816,000 shares of the Company’s common stock at $10 per share. As part of the Conversion, shares of outstanding common stock of the old Home Federal Bancorp were exchanged for 1.136 shares of the Company’s common stock. No fractional shares were issued. Instead, cash was paid to stockholders at a rate of $10 per share for any fractional shares that would otherwise be issued. The exchange resulted in an additional 853,133 outstanding shares of the Company for a total of 17,326,169 outstanding shares as of the closing of the Conversion on December 19, 2007.
The Conversion was accounted for as reorganization in corporate form with no change in the historical basis of the Company’s assets, liabilities or stockholders’ equity. All references to the number of shares outstanding, including references for purposes of calculating per share amounts, are restated to give retroactive recognition to the exchange ratio applied in the Conversion.
On August 7, 2009, the Bank entered into a purchase and assumption agreement with loss share with the Federal Deposit Insurance Corporation (“FDIC”) to assume all of the deposits (excluding nearly all brokered deposits) and certain assets of Community First Bank, a full service commercial bank, headquartered in Prineville, Oregon (the “Acquisition”). Community First Bank operated eight locations in central Oregon. Home Federal Bank assumed approximately $142.8 million of the deposits of Community First Bank. Additionally, Home Federal Bank purchased approximately $142.3 million in loans and $12.9 million of real estate and other repossessed assets (“REO”). The loans and REO purchased are covered by a loss share agreement between the FDIC and Home Federal Bank which affords the Bank significant protection. Under the loss sharing agreement, Home Federal Bank will share in the losses on assets covered under the agreement (referred to as covered assets). The FDIC has agreed to reimburse Home Federal Bank for 80% of losses up to $34.0 million, and 95% of losses that exceed that amount. In addition, Home Federal Bank also purchased cash and cash equivalents and investment securities of Community
First Bank valued at $37.7 million at the date of the Acquisition, and assumed $18.3 million in Federal Home Loan Bank advances and other borrowings. This acquisition was accounted for as a purchase under Financial Accounting Standard (“FAS”) No. 141, “Business Combinations,” with the assets acquired and liabilities assumed recorded at their respective fair values.
Business Activities
Home Federal Bancorp’s business activity is the ownership of the outstanding capital stock of Home Federal Bank and investment management of the offering proceeds retained from the Reorganization and the Conversion. Home Federal Bancorp neither owns nor leases any property but instead uses the premises, equipment and other property of Home Federal Bank with the payment of appropriate management fees, as required by applicable law and regulations. In the future, Home Federal Bancorp may acquire or organize other operating subsidiaries; however, there are no current plans to do so. Home Federal Bancorp has no significant assets, other than cash and cash equivalents, mortgage-backed securities and all of the outstanding shares of Home Federal Bank, and no significant liabilities.
Home Federal Bank was founded in 1920 as a building and loan association and reorganized as a federal mutual savings and loan association in 1936. Home Federal Bank’s deposits are insured by the FDIC up to applicable legal limits under the Deposit Insurance Fund. The Bank has been a member of the Federal Home Loan Bank ("FHLB") System since 1937. Home Federal Bank’s primary regulator is the Office of Thrift Supervision (“OTS”).
We are in the business of attracting deposits from consumers and businesses in our market areas and utilizing those deposits to originate loans. We offer a wide range of loan products to meet the credit needs of our customers. Historically, lending activities have been primarily directed toward the origination of residential and commercial real estate loans. Residential real estate lending activities have been primarily focused on first mortgages on owner occupied, one-to-four family residential properties. The Bank now originates nearly all of its one-to-four family residential loans for sale in the secondary market.
The Board of Directors and the management team have undertaken efforts to change the Company’s strategy from that of a traditional thrift to a full-service community bank. This transition includes a reduced reliance on one-to-four family loans originated for the Bank’s portfolio. As a result, the Bank’s lending activities have expanded in recent years to include commercial business lending, including commercial real estate and builder finance. While continuing our commitment to residential lending through our secondary market program, management expects commercial lending to become increasingly important for the Company.
At September 30, 2009, the Company had total assets of $827.9 million, net loans of $510.6 million, deposit accounts of $514.9 million and stockholders’ equity of $209.7 million.
Operating Lines
Home Federal Bancorp’s sole subsidiary is Home Federal Bank. Management has determined that the Bank, as a whole, is the sole reporting unit and that no reportable operating segments exist other than Home Federal Bank.
Market Area
Home Federal Bank currently has operations in two distinct market areas. The Bank’s primary market area is the Boise, Idaho, metropolitan statistical area (“MSA”) and surrounding communities, together known as the Treasure Valley region of southwestern Idaho, including Ada, Canyon, Elmore and Gem counties. The Acquisition resulted in the Bank’s entrance to the Tri-County Region of Central Oregon, including the counties of Crook, Deschutes and Jefferson. In total we have 23 full-service banking offices, one loan center, 24 automated teller machines and Internet banking services. Included in our 23 full-service banking offices were five Wal-Mart in-store branch locations at September 30, 2009. However, in the fourth quarter of fiscal year 2009 we announced our intent to close two of those Wal-Mart in-store locations in October 2009 and to open two full-service locations in Boise and Meridian, Idaho, in October and November 2009, respectively. For more information, see "Item 2. Properties."
The following table summarizes key economic and demographic information about these market areas:
| | | Idaho | | | Oregon | | | National | |
| | | Canyon | | | Ada | | | Gem | | | Elmore | | | Deschutes | | | Crook | | | Jefferson | | | U.S. | |
Median household income | | $ | 48,904 | | | $ | 63,612 | | | $ | 44,033 | | | $ | 45,691 | | | $ | 53,995 | | | $ | 43,781 | | | $ | 45,610 | | | $ | 54,719 | |
| Change 2000 – 2009 | | | 36.4 | % | | | 37.8 | % | | | 27.9 | % | | | 29.6 | % | | | 29.5 | % | | | 24.5 | % | | | 27.3 | % | | | 29.8 | % |
| | | | | | | | | | | | | | | | | | | | | | | | | | | | | | | | | |
| Population | | | 188,496 | | | | 390,996 | | | | 17,455 | | | | 29,540 | | | | 166,648 | | | | 24,799 | | | | 22,156 | | | | | |
| Change 2000 – 2009 | | | 43.4 | % | | | 29.9 | % | | | 14.9 | % | | | 1.41 | % | | | 44.4 | % | | | 29.3 | % | | | 16.6 | % | | | 10.1 | % |
| | | | | | | | | | | | | | | | | | | | | | | | | | | | | | | | | |
Unemployment rate(1) | | | | | | | | | | | | | | | | | | | | | | | | | | | | | | | | |
| September 2009 | | | 10.6 | % | | | 9.1 | % | | | 10.4 | % | | | 7.7 | % | | | 13.5 | % | | | 16.1 | % | | | 12.9 | % | | | 9.5 | % |
| September 2008 | | | 5.6 | % | | | 4.5 | % | | | 5.5 | % | | | 4.8 | % | | | 4.8 | % | | | 4.8 | % | | | 4.8 | % | | | 6.1 | % |
| | | | | | | | | | | | | | | | | | | | | | | | | | | | | | | | | |
Total industry deposits(2) | | | | | | | | | | | | | | | | | | | | | | | | | | | | | | | | |
| June 2009 | | $ | 1,509 | | | $ | 6,644 | | | $ | 144 | | | $ | 402 | | | $ | 2,823 | | | $ | 259 | | | $ | 136 | | | | | |
| June 2008 | | | 1,467 | | | | 6,244 | | | | 145 | | | | 355 | | | | 2,191 | | | | 271 | | | | 133 | | | | | |
| | | | | | | | | | | | | | | | | | | | | | | | | | | | | | | | | |
Home Federal Bank’s deposit market share June 2009 | | | 14.0 | % | | | 2.1 | % | | | 20.6 | % | | | 6.3 | % | | | 2.7 | % | | | 34.4 | % | | | 11.9 | % | | | | |
| | | | | | | | | | | | | | | | | | | | | | | | | | | | | | | | | |
| (1) Not seasonally adjusted | |
| (2) In millions. Includes deposits in credit unions | |
| Source: FDIC, SNL Financial, Bureau of Labor Statistics | |
Southwest Idaho Region. Within Idaho, Home Federal Bank maintains its largest branch presence in Ada County with eight locations, followed by Canyon County with five offices, including Home Federal Bank’s corporate headquarters in Nampa. As of June 30, 2009, the Bank had a 5.02% market share of the FDIC-insured deposits in these two counties, ranking it fifth among all insured depository institutions in these counties, according to the FDIC. The two remaining Idaho branches are located in Elmore and Gem counties.
The local economy is primarily urban with Boise, the state capital of Idaho, being the most populous of the markets that the Bank serves, followed by Nampa, the state's second largest city. Nearly 40% of the state’s population lives and works in the four counties of Ada, Canyon, Elmore and Gem that are served by Home Federal Bank.
The regional economy is well diversified with government, healthcare, manufacturing, high technology, call centers and construction providing sources of employment. In addition, agriculture and related industries continue to be key components of the economy in southwestern Idaho. Generally, sources of employment are concentrated in Ada and Canyon counties and include the headquarters of Micron Technology, J.R. Simplot Company and Boise Cascade, LLC. Other major employers include Hewlett-Packard, Supervalu, two regional medical centers and Idaho state government agencies. Boise is also home to Boise State University, the state's largest university.
The Treasure Valley has enjoyed strong population growth over the last five years, which led to an increase in residential community developments. Historically, the unemployment rate has been lower than the national rate. The current economic slowdown, which has been led by significant deterioration in residential home sales, has caused acceleration in unemployment in the Treasure Valley. This slowdown has created an over-supply of speculative construction and land development projects. During the build-up of residential construction, commercial real estate construction accelerated and many speculative construction commercial projects, as well as existing commercial buildings, are now vacant, contributing to falling property values. Continued deterioration in the local economy may result in additional losses in the Bank’s loan portfolio, restrict management’s ability to execute the Company’s growth plans or impact the Bank’s liquidity due to a shrinking deposit base. See “Risk Factors” under Item 1A of this Annual Report Form 10-K.
Central Oregon Region. Within Oregon, Home Federal Bank operates eight branches, six in Deschutes County and one each in Crook and Jefferson Counties. As of June 30, 2009, these eight branches served a 5.81% market share of the FDIC-insured deposits in these counties, which ranks it fifth overall for the three counties in Oregon in which
the Bank operates. Central Oregon has become a year-round destination resort for visitors and tourists worldwide offering premiere skiing, golfing, fishing, hiking, museums, biking, kayaking, festivals and world-class destination resorts. The largest communities in the Central Oregon region are Bend, Redmond and Prineville.
While much smaller than the Southwest Idaho market, Central Oregon’s economy is primarily driven by healthcare, government, tourism and other service industries. St. Charles Medical Center in Bend is the largest private employer with over 3,000 employees and Les Schwab Tires Centers, headquartered in Central Oregon, employs 1,500 people. Call centers and resorts are also in the top ten employers in the region.
Central Oregon has experienced rapid population growth and significant new construction has occurred over the last five years as the region’s natural beauty and resorts gained greater renown. Commercial and residential real estate values increased rapidly as construction of retail centers and new residential developments maintained pace with population growth. The median home price in Bend and Redmond rose 70% between April 2005 and April 2007 when values peaked. However, the economic slowdown nationally has reduced spending on vacations and tourism traffic in the region, resulting in very high unemployment. Additionally, commercial real estate vacancies in the region rose quickly and the median home prices in September 2009 have fallen 50% from their peak.
Operating Strategy
Management’s operating strategy centers on the continued development into a full service, community-oriented bank from a traditional savings and loan business model. Our goal is to continue to enhance our franchise value and earnings through controlled growth in our banking operations, especially lending to small to medium-sized businesses, while maintaining the community-oriented customer service and sales focus that has characterized our success to date. In order to be successful in this objective and increase stockholder value, we are committed to the following strategies:
Continue Growing in Our Existing Markets. We believe there is a large customer base in our markets that are dissatisfied with the service received from larger regional banks. By offering quicker decision making in the delivery of banking products and services, offering customized products where appropriate, and providing customer access to our senior managers, we hope to distinguish ourselves from larger, regional banks operating in our market areas.
Actively Search for Appropriate Acquisitions. In order to enhance our ability to deliver products and services in our existing markets and to expand into surrounding markets, we intend to search for acquisition opportunities. We expect to bid on failed bank transactions facilitated by the FDIC. We purchased loans and certain assets and assumed certain deposits and liabilities of a failed bank headquartered in Prineville, Oregon, in August 2009. The acquisition was consummated through a loss sharing agreement with the FDIC that provides significant credit loss mitigation and protection of our capital. However, the long-term success of such transactions is dependent upon our ability to integrate the operations of the acquired businesses. We will also consider whole bank acquisitions through market transactions that provide the potential for significant earnings growth and franchise value enhancement. However, such a transaction would be unlikely to occur due to the current economic environment and the favorable protection offered in an FDIC-assisted acquisition.
Expand Our Product Offerings. We intend to continue our emphasis on originating commercial lending products that diversify our loan portfolio by increasing the percentage of assets consisting of higher-yielding commercial real estate and commercial business loans with higher risk adjusted returns, shorter maturities and more sensitivity to interest rate fluctuations, while still providing high quality loan products for single-family residential borrowers. We also intend to selectively add products to provide diversification of revenue sources and to capture our customers’ full relationship by cross selling our loan and deposit products and services to our customers. We are planning a conversion of our core processing system in the fourth quarter of fiscal 2010, which we believe will significantly enhance and expand our commercial banking applications and products.
Focus on our Branch Utilization. Branch expansion has played a significant role in our ability to grow loans, deposits and customer relationships in the past. We have now increased our focus on branch efficiency and deployment. In fiscal year 2008, we opened two full-service banking offices to replace a Wal-Mart banking office and another small office in order to better deliver the products and services we now offer. We recently completed
construction of two full service banking offices in Boise and Meridian, Idaho, that opened in October and November 2009, respectively, that replaced two Wal-Mart banking offices in Meridian and Nampa, Idaho.
Increase Our Core Transaction Deposits. A fundamental part of our overall strategy is to improve both the level and the mix of deposits that serve as a funding base for asset growth. By growing demand deposit accounts and other transaction accounts, we intend to reduce our reliance on higher-cost certificates of deposit and borrowings such as advances from the Federal Home Loan Bank of Seattle. In order to expand our core deposit franchise, we are focusing on introducing additional products and services to obtain money market and time deposits by bundling them with other consumer and small business services. Business deposits are being pursued by the introduction of cash management products and by specific targeting of small business customers.
Hire Experienced Employees With a Customer Service Focus. Our ability to continue to attract and retain banking professionals with strong business banking and service skills, community relationships and significant knowledge of our markets is key to our success. We believe that by focusing on hiring experienced bankers who are established in their communities, we enhance our market position and add profitable growth opportunities. We emphasize to our employees the importance of delivering exemplary customer service and seeking opportunities to build further relationships with our customers. Our goal is to compete by relying on the strength of our customer service and relationship banking approach.
Develop and Nurture an Internal Management Culture Which is Driven by a Focus on Profitability, Productivity and Accountability for Results and Which Responds Proactively to the Challenge of Change. The primary method for reinforcing our culture is the comprehensive application of our “Pay for Performance” total compensation program. Every employee has clearly defined accountabilities and performance standards that tie directly or indirectly to our profitability. All incentive compensation is based on specific profitability measures, sales volume goals or a combination of specific profitability measures and individual performance goals. This approach encourages all employees to focus on our profitability and has created an environment that embraces new products, services and delivery systems. However, we also recognize that our compensation program, particularly incentive and other variable pay plan, must be structured and administered in a manner that provides incentive for achieving our goals as to growth while not encouraging disproportionate or excessive risk taking.
Lending Activities
General. Historically, our principal lending activity has consisted of the origination of loans secured by first mortgages on owner-occupied, one-to-four family residences and loans for the construction of one-to-four family residences. We also originate consumer loans, with an emphasis on home equity loans and lines of credit. Commensurate with our transformation from a traditional thrift to a full-service community bank, we have been offering commercial real estate loans and to a lesser extent, multi-family loans. While we intend to increase our commercial and small business loans, a substantial portion of our loan portfolio is currently secured by real estate, either as primary or secondary collateral.
At September 30, 2009, the maximum amount of credit that we could have extended to any one borrower and the borrower's related entities under applicable regulations was $23.4 million. Our internal policy limits loans to one borrower and the borrower's related entities to 80% of the regulatory limit, or $18.7 million. At September 30, 2009, the Company had no borrowing relationship with outstanding balances in excess of this amount. Our largest single borrower relationship at September 30, 2009 included four commercial real estate loans and a home equity line of credit totaling $5.3 million. The second largest lending relationship included five commercial real estate loans totaling $5.0 million. Our third largest borrower relationship is a single loan secured by commercial real estate for $4.9 million. The fourth largest lending relationship was two commercial acquisition and development loans and a letter of credit totaling $4.7 million. The fifth largest lending relationship included four commercial real estate secured loans totaling $4.6 million. All of these loans, including those made to corporations, have personal guarantees in place as an additional source of repayment and are secured by property or assets in our primary market area. These loans were performing according to their terms at September 30, 2009.
Our Senior Management Loan Committee, which consists of the Bank’s Chief Executive Officer, the Executive Vice President/Commercial Banking and the Senior Vice President/Chief Credit Officer, is authorized to approve loans to one borrower or a group of related borrowers of up to $5.0 million in the aggregate. The single loan limit for this committee is also $5.0 million. Loan requests in excess of $5.0 million are presented to the Loan Committee
of the Board of Directors for review and approval. The entire board comprises that committee. We will apply our organic loan policy, including our underwriting standards, to loans we originate in Central Oregon. None of the loans we acquired, which are subject to a loss share agreement with the FDIC, however, were originated pursuant to underwriting standards that were comparable to those that will be applied to new loans in the future.
The following table provides a comparison of our loan portfolios as of September 30, 2009 and 2008, detailing loans purchased in the Acquisition, net of fair value purchase adjustments, and loans existing in our organic portfolio:
| | September 30, | |
| | 2009 | | 2008 | |
| | Acquired(1) | | Organic | | Total | | Total | |
| | (in thousands) | |
| Real Estate: | | | | | | | | |
| One-to-four family residential | $ 8,537 | | $169,774 | | $178,311 | | $210,501 | |
| Multi-family residential | 6,270 | | 10,016 | | 16,286 | | 8,477 | |
| Commercial | 61,601 | | 151,870 | | 213,471 | | 151,733 | |
| Total real estate | 76,408 | | 331,660 | | 408,068 | | 370,711 | |
| | | | | | | | | |
| Real Estate Construction: | | | | | | | | |
| One-to-four family residential | 3,128 | | 7,743 | | 10,871 | | 13,448 | |
| Multi-family residential | 1,521 | | 8,896 | | 10,417 | | 920 | |
| Commercial and land development | 17,230 | | 9,914 | | 27,144 | | 18,674 | |
| Total real estate construction | 21,879 | | 26,553 | | 48,432 | | 33,042 | |
| | | | | | | | | |
| Consumer: | | | | | | | | |
| Home equity | 6,728 | | 46,640 | | 53,368 | | 52,954 | |
| Automobile | 1,188 | | 1,176 | | 2,364 | | 1,903 | |
| Other consumer | 1,850 | | 1,884 | | 3,734 | | 1,370 | |
| Total consumer | 9,766 | | 49,700 | | 59,466 | | 56,227 | |
| | | | | | | | | |
| Commercial business | 18,313 | | 5,943 | | 24,256 | | 5,385 | |
Gross loans | 126,366 | | 413,856 | | 540,222 | | 465,365 | |
| | | | | | | | | |
| Deferred loan fees | (1 | ) | (857 | ) | (858 | ) | (973 | ) |
Allowance for loan losses(2) | (16,812 | ) | (11,923 | ) | (28,735 | ) | (4,579 | ) |
| | | | | | | | | |
| Loans receivable, net | $109,553 | | $401,076 | | $510,629 | | $459,813 | |
_________________________________
| (1) | Loans purchased in the Acquisition on August 7, 2009 |
| (2) | An allowance for loan losses was not recorded on $40.4 million of loans purchased in the Acquisition that were subject to accounting under Accounting Standards Codification (“ASC”) Topic 310-30, “Loans and Debt Securities Acquired with Deteriorated Credit Quality.” A fair value adjustment of $14.3 million was recorded directly to the loan balances that were subject to ASC 310-30. An allowance for loan losses was recorded on all other loans purchased in the Acquisition |
Loan Portfolio Analysis. The following table sets forth the composition of the Company’s loan portfolio by type of loan at the dates indicated:
| | | At September 30, | |
| | | 2009 | | | 2008 | | | 2007 | | | 2006 | | | 2005 | |
| | | Amount | | | Percent | | | Amount | | | Percent | | | Amount | | | Percent | | | Amount | | | Percent | | | Amount | | | Percent | |
| | | | | | | | | | | | | | | (dollars in thousands) | | | | | | | | | | | | |
| Real estate: | | | | | | | | | | | | | | | | | | | | | | | | | | | | | | |
| One-to-four family residential (1) | $ | 178,311 | | | | 33.01 | % | | $ | 210,501 | | | | 45.23 | % | | $ | 249,545 | | | | 51.55 | % | | $ | 293,640 | | | | 57.88 | % | | $ | 252,126 | | | | 58.00 | % |
| Multi-family residential | | | 16,286 | | | | 3.01 | | | | 8,477 | | | | 1.82 | | | | 6,864 | | | | 1.42 | | | | 7,049 | | | | 1.39 | | | | 5,454 | | | | 1.25 | |
| Commercial | | | 213,471 | | | | 39.52 | | | | 151,733 | | | | 32.61 | | | | 133,823 | | | | 27.64 | | | | 125,401 | | | | 24.72 | | | | 116,432 | | | | 26.78 | |
| Total real estate | | | 408,068 | | | | 75.54 | | | | 370,711 | | | | 79.66 | | | | 390,232 | | | | 80.61 | | | | 426,090 | | | | 83.99 | | | | 374,012 | | | | 86.03 | |
| | | | | | | | | | | | | | | | | | | | | | | | | | | | | | | | | | | | | | | | | |
| Real estate construction: | | | | | | | | | | | | | | | | | | | | | | | | | | | | | | | | | | | | | | | | |
| One-to-four family residential | | | 10,871 | | | | 2.01 | | | | 13,448 | | | | 2.89 | | | | 20,545 | | | | 4.24 | | | | 23,678 | | | | 4.67 | | | | 14,421 | | | | 3.32 | |
| Multi-family residential | | | 10,417 | | | | 1.93 | | | | 920 | | | | 0.20 | | | | 1,770 | | | | 0.37 | | | | -- | | | | -- | | | | 1,427 | | | | 0.33 | |
| Commercial and land development | | | 27,144 | | | | 5.02 | | | | 18,674 | | | | 4.01 | | | | 21,899 | | | | 4.52 | | | | 16,344 | | | | 3.22 | | | | 7,470 | | | | 1.72 | |
| Total real estate construction | | | 48,432 | | | | 8.96 | | | | 33,042 | | | | 7.10 | | | | 44,214 | | | | 9.13 | | | | 40,022 | | | | 7.89 | | | | 23,318 | | | | 5.37 | |
| | | | | | | | | | | | | | | | | | | | | | | | | | | | | | | | | | | | | | | | | |
| Consumer: | | | | | | | | | | | | | | | | | | | | | | | | | | | | | | | | | | | | | | | | |
| Home equity | | | 53,368 | | | | 9.88 | | | | 52,954 | | | | 11.38 | | | | 42,990 | | | | 8.88 | | | | 34,143 | | | | 6.73 | | | | 28,558 | | | | 6.57 | |
| Automobile | | | 2,364 | | | | 0.44 | | | | 1,903 | | | | 0.41 | | | | 2,173 | | | | 0.45 | | | | 3,245 | | | | 0.64 | | | | 4,576 | | | | 1.05 | |
| Other consumer | | | 3,734 | | | | 0.69 | | | | 1,370 | | | | 0.29 | | | | 1,405 | | | | 0.29 | | | | 1,300 | | | | 0.26 | | | | 1,530 | | | | 0.35 | |
| Total consumer | | | 59,466 | | | | 11.01 | | | | 56,227 | | | | 12.08 | | | | 46,568 | | | | 9.62 | | | | 38,688 | | | | 7.63 | | | | 34,664 | | | | 7.97 | |
| | | | | | | | | | | | | | | | | | | | | | | | | | | | | | | | | | | | | | | | | |
| Commercial business | | | 24,256 | | | | 4.49 | | | | 5,385 | | | | 1.16 | | | | 3,122 | | | | 0.64 | | | | 2,480 | | | | 0.49 | | | | 2,759 | | | | 0.63 | |
| | | | 540,222 | | | | 100.00 | % | | | 465,365 | | | | 100.00 | % | | | 484,136 | | | | 100.00 | % | | | 507,280 | | | | 100.00 | % | | | 434,753 | | | | 100.00 | % |
| Less: | | | | | | | | | | | | | | | | | | | | | | | | | | | | | | | | | | | | | | | | |
| Deferred loan fees | | | 858 | | | | | | | | 973 | | | | | | | | 1,030 | | | | | | | | 1,241 | | | | | | | | 927 | | | | | |
| Allowance for loan losses | | | 28,735 | | | | | | | | 4,579 | | | | | | | | 2,988 | | | | | | | | 2,974 | | | | | | | | 2,882 | | | | | |
| Loans receivable, net | | $ | 510,629 | | | | | | | $ | 459,813 | | | | | | | $ | 480,118 | | | | | | | $ | 503,065 | | | | | | | $ | 430,944 | | | | | |
| (1) | Does not include loans held for sale of $862,000, $2.8 million, $4.9 million, $4.1 million, and $5.5 million, at September 30, 2009, 2008, 2007, 2006, and 2005, respectively. |
The following table shows the composition of the Company’s loan portfolio by fixed and adjustable rate loans at the dates indicated:
| | | At September 30, | |
| | | 2009 | | | 2008 | | | 2007 | | | 2006 | | | 2005 | |
| | | Amount | | | Percent | | | Amount | | | Percent | | | Amount | | | Percent | | | Amount | | | Percent | | | Amount | | | Percent | |
| | | | | | | | | | | | | | | (dollars in thousands) | | | | | | | | | | | | |
| FIXED RATE LOANS | | | | | | | | | | | | | | | | | | | | | | | | | | | | | | |
| Real estate: | | | | | | | | | | | | | | | | | | | | | | | | | | | | | | |
| One-to-four family residential | | $ | 111,533 | | | | 20.65 | % | | $ | 134,772 | | | | 28.96 | % | | $ | 159,099 | | | | 32.87 | % | | $ | 188,102 | | | | 37.08 | % | | $ | 199,352 | | | | 45.86 | % |
| Multi-family residential | | | 3,501 | | | | 0.65 | | | | 1,947 | | | | 0.42 | | | | 1,993 | | | | 0.41 | | | | 2,055 | | | | 0.41 | | | | 2,119 | | | | 0.48 | |
| Commercial | | | 31,521 | | | | 5.83 | | | | 20,125 | | | | 4.32 | | | | 21,345 | | | | 4.41 | | | | 19,236 | | | | 3.79 | | | | 16,303 | | | | 3.74 | |
| Total real estate | | | 146,555 | | | | 27.13 | | | | 156,844 | | | | 33.70 | | | | 182,437 | | | | 37.69 | | | | 209,393 | | | | 41.28 | | | | 217,774 | | | | 50.08 | |
| | | | | | | | | | | | | | | | | | | | | | | | | | | | | | | | | | | | | | | | | |
| Real estate construction: | | | | | | | | | | | | | | | | | | | | | | | | | | | | | | | | | | | | | | | | |
| One-to-four family residential | | | 285 | | | | 0.05 | | | | 1,370 | | | | 0.29 | | | | 1,488 | | | | 0.31 | | | | 16,797 | | | | 3.31 | | | | 3,391 | | | | 0.78 | |
| Multi-family residential | | | -- | | | | -- | | | | -- | | | | -- | | | | -- | | | | -- | | | | -- | | | | -- | | | | -- | | | | -- | |
| Commercial and land development | | | 5,267 | | | | 0.97 | | | | 2,973 | | | | 0.64 | | | | 5,102 | | | | 1.05 | | | | 5,967 | | | | 1.18 | | | | 1,838 | | | | 0.42 | |
| Total real estate construction | | | 5,552 | | | | 1.02 | | | | 4,343 | | | | 0.93 | | | | 6,590 | | | | 1.36 | | | | 22,764 | | | | 4.49 | | | | 5,229 | | | | 1.20 | |
| | | | | | | | | | | | | | | | | | | | | | | | | | | | | | | | | | | | | | | | | |
| Consumer: | | | | | | | | | | | | | | | | | | | | | | | | | | | | | | | | | | | | | | | | |
| Home equity | | | 12,248 | | | | 2.27 | | | | 17,239 | | | | 3.71 | | | | 14,860 | | | | 3.07 | | | | 9,723 | | | | 1.92 | | | | 4,903 | | | | 1.13 | |
| Automobile | | | 2,364 | | | | 0.44 | | | | 1,903 | | | | 0.41 | | | | 2,173 | | | | 0.45 | | | | 3,245 | | | | 0.64 | | | | 4,576 | | | | 1.05 | |
| Other consumer | | | 3,203 | | | | 0.59 | | | | 1,370 | | | | 0.29 | | | | 1,405 | | | | 0.29 | | | | 1,300 | | | | 0.26 | | | | 1,530 | | | | 0.35 | |
| Total consumer | | | 17,815 | | | | 3.30 | | | | 20,512 | | | | 4.41 | | | | 18,438 | | | | 3.81 | | | | 14,268 | | | | 2.82 | | | | 11,009 | | | | 2.53 | |
| | | | | | | | | | | | | | | | | | | | | | | | | | | | | | | | | | | | | | | | | |
| Commercial business | | | 7,200 | | | | 1.33 | | | | 1,543 | | | | 0.34 | | | | 1,073 | | | | 0.22 | | | | 622 | | | | 0.12 | | | | 1,091 | | | | 0.25 | |
| Total fixed rate loans | | $ | 177,122 | | | | 32.78 | % | | $ | 183,242 | | | | 39.38 | % | | $ | 208,538 | | | | 43.08 | % | | $ | 247,047 | | | | 48.71 | % | | $ | 235,103 | | | | 54.06 | % |
(table continues on following page)
(table continued from previous page)
| | | At September 30, | |
| | | 2009 | | | 2008 | | | 2007 | | | 2006 | | | 2005 | |
| | | Amount | | | Percent | | | Amount | | | Percent | | | Amount | | | Percent | | | Amount | | | Percent | | | Amount | | | Percent | |
| | | | | | | | | | | | | | | (dollars in thousands) | | | | | | | | | | | | |
| ADJUSTABLE RATE LOANS | | | | | | | | | | | | | | | | | | | | | | | | | | | | | | |
| Real estate | | | | | | | | | | | | | | | | | | | | | | | | | | | | | | |
| One-to-four family residential | | $ | 66,778 | | | | 12.36 | % | | $ | 75,729 | | | | 16.27 | % | | $ | 90,446 | | | | 18.68 | % | | $ | 105,538 | | | | 20.80 | % | | $ | 52,774 | | | | 12.14 | % |
| Multi-family residential | | | 12,785 | | | | 2.36 | | | | 6,530 | | | | 1.40 | | | | 4,871 | | | | 1.01 | | | | 4,994 | | | | 0.98 | | | | 3,335 | | | | 0.77 | |
| Commercial | | | 181,950 | | | | 33.69 | | | | 131,608 | | | | 28.29 | | | | 112,478 | | | | 23.23 | | | | 106,165 | | | | 20.93 | | | | 100,129 | | | | 23.04 | |
| Total real estate | | | 261,513 | | | | 48.41 | | | | 213,867 | | | | 45.96 | | | | 207,795 | | | | 42.92 | | | | 216,697 | | | | 42.71 | | | | 156,238 | | | | 35.95 | |
| | | | | | | | | | | | | | | | | | | | | | | | | | | | | | | | | | | | | | | | | |
| Real estate construction: | | | | | | | | | | | | | | | | | | | | | | | | | | | | | | | | | | | | | | | | |
| One-to-four family residential | | | 10,586 | | | | 1.96 | | | | 12,078 | | | | 2.60 | | | | 19,057 | | | | 3.93 | | | | 6,881 | | | | 1.36 | | | | 11,030 | | | | 2.54 | |
| Multi-family residential | | | 10,417 | | | | 1.93 | | | | 920 | | | | 0.20 | | | | 1,770 | | | | 0.37 | | | | -- | | | | -- | | | | 1,427 | | | | 0.33 | |
| Commercial and land development | | 21,877 | | | | 4.05 | | | | 15,701 | | | | 3.37 | | | | 16,797 | | | | 3.47 | | | | 10,377 | | | | 2.04 | | | | 5,632 | | | | 1.30 | |
| Total real estate construction | | | 42,880 | | | | 7.94 | | | | 28,699 | | | | 6.17 | | | | 37,624 | | | | 7.77 | | | | 17,258 | | | | 3.40 | | | | 18,089 | | | | 4.17 | |
| | | | | | | | | | | | | | | | | | | | | | | | | | | | | | | | | | | | | | | | | |
| Consumer: | | | | | | | | | | | | | | | | | | | | | | | | | | | | | | | | | | | | | | | | |
| Home equity | | | 41,120 | | | | 7.61 | | | | 35,715 | | | | 7.67 | | | | 28,130 | | | | 5.81 | | | | 24,420 | | | | 4.81 | | | | 23,655 | | | | 5.44 | |
| Automobile | | | -- | | | | -- | | | | -- | | | | -- | | | | -- | | | | -- | | | | -- | | | | -- | | | | -- | | | | -- | |
| Other consumer | | | 531 | | | | 0.10 | | | | -- | | | | -- | | | | -- | | | | -- | | | | -- | | | | -- | | | | -- | | | | -- | |
| Total consumer | | | 41,651 | | | | 7.71 | | | | 35,715 | | | | 7.67 | | | | 28,130 | | | | 5.81 | | | | 24,420 | | | | 4.81 | | | | 23,655 | | | | 5.44 | |
| | | | | | | | | | | | | | | | | | | | | | | | | | | | | | | | | | | | | | | | | |
| Commercial business | | | 17,056 | | | | 3.16 | | | | 3,842 | | | | 0.82 | | | | 2,049 | | | | 0.42 | | | | 1,858 | | | | 0.37 | | | | 1,668 | | | | 0.38 | |
| Total adjustable rate loans | | | 363,100 | | | | 67.22 | | | | 282,123 | | | | 60.62 | | | | 275,598 | | | | 56.92 | | | | 260,233 | | | | 51.29 | | | | 199,650 | | | | 45.94 | |
| | | | | | | | | | | | | | | | | | | | | | | | | | | | | | | | | | | | | | | | | |
| Total loans | | | 540,222 | | | | 100.00 | % | | | 465,365 | | | | 100.00 | % | | | 484,136 | | | | 100.00 | % | | | 507,280 | | | | 100.00 | % | | | 434,753 | | | | 100.00 | % |
| Less: | | | | | | | | | | | | | | | | | | | | | | | | | | | | | | | | | | | | | | | | |
| Deferred loan fees | | | 858 | | | | | | | | 973 | | | | | | | | 1,030 | | | | | | | | 1,241 | | | | | | | | 927 | | | | | |
| Allowance for loan losses | | | 28,735 | | | | | | | | 4,579 | | | | | | | | 2,988 | | | | | | | | 2,974 | | | | | | | | 2,882 | | | | | |
| Loans receivable, net | | $ | 510,629 | | | | | | | $ | 459,813 | | | | | | | $ | 480,118 | | | | | | | $ | 503,065 | | | | | | | $ | 430,944 | | | | | |
One-to-four Family Residential Real Estate Lending. We originate both fixed-rate loans and adjustable-rate loans in our residential lending program. Generally, these loans are originated to meet the requirements of Fannie Mae and Freddie Mac for sale in the secondary market. We do from time to time, however, retain some of these loans in our loan portfolio to meet asset and liability management objectives.
We generally underwrite our one-to-four family loans based on the applicant's employment, debt to income levels, credit history and the appraised value of the subject property. Generally, we lend up to 80% of the lesser of the appraised value or purchase price for one-to-four family residential loans. In situations where we grant a loan with a loan-to-value ratio in excess of 80%, we generally require private mortgage insurance in order to reduce our exposure to 80% or less. Properties securing our one-to-four family loans are generally appraised by independent fee appraisers who have been approved by us. We require our borrowers to obtain title and hazard insurance, and flood insurance, if necessary, in an amount equal to the regulatory maximum.
At September 30, 2009, $27.8 million, or 15.6%, of our one-to-four family residential mortgages consisted of loans for non-owner occupied properties. This consisted of $4.7 million of loans on second homes and $23.1 million of loans for investment. Non-owner occupied loans secured by one to two units are generally made with loan-to-value ratios of up to 80% and non-owner occupied loans secured by three units or more are generally made with loan-to-value ratios of up to 75%. In situations where we grant a loan with a loan-to-value ratio in excess of 80%, we generally require private mortgage insurance in order to reduce our exposure to 80% or less. As of September 30, 2009, delinquent non-owner occupied loans made up 3.1% of total non-owner occupied residential mortgages. Delinquent owner-occupied properties were 2.4% of total owner-occupied residential mortgages.
In an effort to provide financing for low-to-moderate income and first-time buyers, we participate in the Idaho Housing and Finance Association's Single Family Mortgage Program. The Idaho Housing and Finance Association is a non-profit organization that provides housing resources to low-to-moderate income families through various below market housing programs. The program is designed to meet the needs of qualified borrowers in the low-to-moderate income brackets. The program has established income limits based on family size and sales price limits for both existing and new construction. We offer residential mortgage loans through this program to qualified individuals and originate the loans using modified underwriting guidelines. All of these loans have private mortgage insurance on the portion of the principal amount that exceeds 80% of the appraised value of the property. Approximately $2.8 million of loans were sold to the Idaho Housing and Finance Association in the year ended September 30, 2009.
We did not develop a nontraditional mortgage program with subprime or Alt-A loans or other products with non-standard features. None of our one-to-four family residential mortgage loans has negative amortization or payment-option features.
Real Estate Construction. We have been an active originator of real estate construction loans in our market area for many years, but the recent contraction in construction projects and increases in speculative construction project vacancies has caused us to reduce focus in this line of business until the construction market improves. At September 30, 2009, our construction and land development loans amounted to $48.4 million, or 9.0%, of the total loan portfolio. Of this amount, approximately $21.9 million of construction and land development loans were purchased in the Acquisition, net of fair value and credit loss adjustments, and are subject to a loss share agreement with the FDIC.
The following table shows the composition of the construction loan portfolio at the dates indicated:
| | | At September 30, | |
| | | 2009 | | | 2008 | |
| | | (in thousands) | |
| One-to-four family residential: | | | | | | |
| Speculative | | $ | 6,352 | | | $ | 11,324 | |
| Owner occupied | | | 4,519 | | | | -- | |
| | | | | | | | | |
| Multi-family residential | | | 10,417 | | | | 920 | |
| | | | | | | | | |
| Commercial real estate: | | | | | | | | |
| Construction | | | 7,332 | | | | 6,181 | |
| Land development loans | | | 19,812 | | | | 12,493 | |
| Total construction and land development | | $ | 48,432 | | | $ | 33,042 | |
During the year ended September 30, 2009, we directly originated $12.5 million of short-term builder construction loans to fund the construction of one-to-four family residential properties. Most loans originated by us are written with maturities of up to one year, have interest rates that are tied to The Wall Street Journal Prime rate plus a margin, and are subject to periodic rate adjustments tied to the movement of the prime rate. All builder/borrower loans are underwritten to the same standards as other commercial loan credits, requiring minimum debt service coverage ratios and established cash reserves to carry projects through construction completion and sale of the project. The maximum loan-to-value ratio on both pre-sold and speculative projects originated by us is 80%.
We originate construction and site development loans to contractors and builders primarily to finance the construction of single-family homes and subdivisions, which homes typically have an average price ranging from $150,000 to $400,000. Loans to finance the construction of single-family homes and subdivisions are generally offered to experienced builders in our primary market areas. The maximum loan-to-value limit applicable to construction and site development loans is 80% and 70%, respectively, of the appraised market value upon completion of the project. Maturity dates for residential construction loans are largely a function of the estimated construction period of the project, and generally do not exceed 36 months for residential subdivision development loans. Substantially all of our residential construction loans have adjustable rates of interest based on the Wall Street Journal prime rate and during the term of construction, the accumulated interest is added to the principal of the loan through an interest reserve. At September 30, 2009, our largest subdivision development loan had a commitment for $2.6 million and an outstanding principal balance of $996,000. This loan was secured by a first mortgage lien and was performing according to its original terms at September 30, 2009. At September 30, 2009, the average outstanding principal balance of subdivision loans to contractors and developers was $872,000.
We also make construction loans for commercial development projects. These projects include multi-family, apartment, retail, office/warehouse and office buildings. These loans generally have an interest-only phase during construction, and generally convert to permanent financing when construction is completed. Disbursement of funds is at our sole discretion and is based on the progress of construction. The maximum loan-to-value limit applicable to these loans is 80% of the appraised post-construction value.
We originate land loans to local contractors and developers for the purpose of holding the land for future development. These loans are secured by a first lien on the property, are limited to 50% of the lower of the acquisition price or the appraised value of the land, and generally have a term of up to two years with an interest rate based on the Wall Street Journal prime rate. Our land loans are generally secured by property in our primary market areas. We require title insurance and, if applicable, a hazardous waste survey reporting that the land is free of hazardous or toxic waste.
Our construction and land development loans are based upon estimates of costs and value associated with the completed project. These estimates may be inaccurate. Construction and land development lending involves additional risks when compared with permanent residential lending because funds are advanced upon the security of the project, which is of uncertain value prior to its completion. Because of the uncertainties inherent in estimating construction costs, as well as the market value of the completed project and the effects of governmental regulation of
real property, it is relatively difficult to evaluate accurately the total funds required to complete a project and the related loan-to-value ratio. This type of lending also typically involves higher loan principal amounts and is often concentrated with a small number of builders. These loans often involve the disbursement of substantial funds with repayment substantially dependent on the success of the ultimate project and the ability of the borrower to sell or lease the property or obtain permanent take-out financing, rather than the ability of the borrower or guarantor to repay principal and interest. If our appraisal of the value of a completed project proves to be overstated, we generally require cash curtailments or additional collateral to support the shortfall.
Commercial and Multi-Family Real Estate Lending. Multi-family and commercial real estate loans generally are priced at a higher rate of interest than one-to-four family residential loans. Typically, these loans have higher loan balances, are more difficult to evaluate and monitor, and involve a greater degree of risk than one-to-four family residential loans. Often payments on loans secured by multi-family or commercial properties are dependent on the successful operation and management of the property; therefore, repayment of these loans may be affected by adverse conditions in the real estate market or the economy. We generally require and obtain loan guarantees from financially capable parties based upon the review of personal financial statements. If the borrower is a corporation, we generally require and obtain personal guarantees from the corporate principals based upon a review of their personal financial statements and individual credit reports.
We target individual multi-family and commercial real estate loans to small and mid-size owner occupants and investors between $500,000 and $2.0 million; however, we can by policy originate loans to one borrower up to 80% of our regulatory limit. As of September 30, 2009, the maximum we could lend to any one borrower based on this limit was $18.7 million. Commercial real estate loans are primarily secured by office and warehouse space, professional buildings, retail sites, industrial facilities and churches located in the our primary market areas.
We have offered both fixed and adjustable-rate loans on multi-family and commercial real estate loans, although most of these loans are now originated with adjustable rates with amortization terms up to 25 years and maturities of up to 10 years. Commercial and multi-family real estate loans are originated with rates that generally adjust after an initial period ranging from three to five years and are generally priced utilizing the applicable FHLB borrowing rate plus an acceptable margin. Prepayment penalty structures are applied for each rate lock period.
The maximum loan-to-value ratio for commercial and multi-family real estate loans is generally 75% on purchases and refinances. We require appraisals of all properties securing commercial and multi-family real estate loans. Appraisals are performed by independent appraisers designated by us or by our staff appraiser. We require our commercial and multi-family real estate loan borrowers with outstanding balances in excess of $500,000 to submit annual financial statements and rent rolls on the subject property. We also inspect the subject property at least every three to five years if the loan balance exceeds $250,000. We generally require a minimum pro forma debt coverage ratio of 1.25 times for loans secured by commercial and multi-family properties.
These loans typically involve higher principal amounts than other types of loans, and repayment is dependent upon income generated, or expected to be generated, by the property securing the loan in amounts sufficient to cover operating expenses and debt service, which may be adversely affected by changes in the economy or local market conditions. For example, if the cash flow from the borrower’s project is reduced as a result of leases not being obtained or renewed, the borrower’s ability to repay the loan may be impaired. Commercial and multi-family mortgage loans also expose a lender to greater credit risk than loans secured by residential real estate because the collateral securing these loans typically cannot be sold as easily as residential real estate. In addition, many of our commercial and multifamily real estate loans are not fully amortizing and contain large balloon payments upon maturity. Such balloon payments may require the borrower to either sell or refinance the underlying property in order to make the payment, which may increase the risk of default or non-payment. If we foreclose on a commercial and multi-family real estate loan, our holding period for the collateral typically is longer than for one-to-four family residential mortgage loans because there are fewer potential purchasers of the collateral. Additionally, commercial and multi-family real estate loans generally have relatively large balances to single borrowers or related groups of borrowers. Accordingly, if we make any errors in judgment in the collectability of our commercial and multi-family real estate loans, any resulting charge-offs may be larger on a per loan basis than those incurred with our residential or consumer loan portfolios.
Consumer Lending. To a much lesser degree than commercial and residential loans, we offer a variety of consumer loans to our customers, including home equity loans and lines of credit, savings account loans, automobile loans, recreational vehicle loans and personal unsecured loans. Generally, consumer loans have shorter terms to maturity and higher interest rates than mortgage loans. The maximum term we offer on automobile loans is 72 months and is applicable to new and one year old cars and light trucks. In addition, we offer loan terms of up to 120 months on motor homes, and qualifying travel trailers and boats. All automobile loans are risk priced based on the percentage of cost, or established value, being financed. Consumer loans are made with both fixed and variable interest rates and with varying terms.
At September 30, 2009, the largest component of the consumer loan portfolio consisted of home equity loans and lines of credit. Home equity loans are made for, among other purposes, the improvement of residential properties, debt consolidation and education expenses. The majority of these loans are secured by a first or second mortgage on residential property. The maximum loan-to-value ratio is 80%, when taking into account both the balance of the home equity loan and the first mortgage loan. Home equity lines of credit allow for a ten-year draw period, plus an additional ten year repayment period, and the interest rate is tied to the Prime rate as published in The Wall Street Journal, and may include a margin.
Consumer loans entail greater risk than do residential first-lien mortgage loans, particularly in the case of consumer loans that are unsecured or secured by rapidly depreciating assets such as automobiles, and in second-lien loans such as home equity lines of credit in markets where residential property values have declined significantly since fiscal year 2007. In these cases, any repossessed collateral for a defaulted consumer loan may not provide an adequate source of repayment of the outstanding loan balance as a result of the greater likelihood of damage, loss or depreciation. The remaining deficiency often does not warrant further substantial collection efforts against the borrower beyond obtaining a deficiency judgment. In addition, consumer loan collections are dependent on the borrower's continuing financial stability, and are more likely to be adversely affected by job loss, divorce, illness or personal bankruptcy. Furthermore, the application of various federal and state laws, including bankruptcy and insolvency laws, may limit the amount that can be recovered on these loans. These risks are not as prevalent with respect to our consumer loan portfolio because a large percentage of the portfolio consists of home equity loans and lines of credit that are underwritten in a manner such that they result in credit risk that is substantially similar to one-to-four family residential mortgage loans. Nevertheless, home equity loans and lines of credit have greater credit risk than one-to-four family residential mortgage loans because they are secured by mortgages subordinated to the existing first mortgage on the property, which we may or may not hold. In addition, we do not have private mortgage insurance coverage for these loans. We do not actively participate in wholesale or brokered home equity loan origination.
Commercial Business Lending. As part of our strategic plan, we are focusing on increasing the commercial business loans that we originate, including lines of credit, term loans and letters of credit. These loans are typically secured by collateral and are used for general business purposes, including working capital financing, equipment financing, capital investment and general investment. Loan terms vary from one to seven years. The interest rates on such loans are generally floating rates indexed to the Wall Street Journal Prime rate plus a margin.
Commercial business loans typically have shorter maturity terms and higher interest spreads than real estate loans, but generally involve more credit risk because of the type and nature of the collateral. We are focusing our efforts on small to medium-sized, privately-held companies with local or regional businesses that operate in our market area. Our commercial business lending policy includes credit file documentation and analysis of the borrower’s background, capacity to repay the loan, the adequacy of the borrower’s capital and collateral, as well as an evaluation of other conditions affecting the borrower. Analysis of the borrower’s past, present and future cash flows is also an important aspect of our credit analysis. We generally obtain personal guarantees on our commercial business loans.
Repayment of our commercial business loans is often dependent on the cash flows of the borrower, which may be unpredictable, and the collateral securing these loans may fluctuate in value. Our commercial business loans are originated primarily based on the identified cash flow of the borrower and secondarily on the general liquidity and secondary cash flow support of the borrower. Advance ratios against collateral provide additional support to repay the loan. Most often, this collateral consists of accounts receivable, inventory or equipment. Credit support provided by the borrower for most of these loans and the probability of repayment is based on the liquidation of the pledged collateral and enforcement of a personal guarantee, if any. As a result, in the case of loans secured by accounts
receivable, the availability of funds for the repayment of these loans may be substantially dependent on the ability of the borrower to collect amounts due from its customers. The collateral securing other loans may depreciate over time, may be difficult to appraise and may fluctuate in value based on the success of the business.
Loan Maturity and Repricing. The following table sets forth certain information at September 30, 2009, regarding the dollar amount of loans maturing or repricing in our portfolio based on their contractual terms to maturity or next repricing date, but does not include scheduled payments or potential prepayments. Demand loans, loans having no stated schedule of repayments and no stated maturity are reported as due in one year or less. Loan balances do not include undisbursed loan proceeds, unearned discounts, unearned income and allowance for loan losses.
| | | Within 1 Year | | | After 1 Year Through 3 Years | | | After 3 Years Through 5 Years | | | After 5 Years Through 10 Years | | | Beyond 10 Years | | | Total | |
| | | (in thousands) | |
| Real estate: | | | | | | | | | | | | | | | | | | |
| One-to-four family residential | | $ | 21,076 | | | $ | 40,243 | | | $ | 10,124 | | | $ | 44,867 | | | $ | 62,001 | | | $ | 178,311 | |
| Multi-family residential | | | 5,536 | | | | 5,874 | | | | 1,841 | | | | 1,086 | | | | 1,949 | | | | 16,286 | |
| Commercial | | | 54,628 | | | | 82,986 | | | | 53,590 | | | | 21,298 | | | | 969 | | | | 213,471 | |
| Total real estate | | | 81,240 | | | | 129,103 | | | | 65,555 | | | | 67,251 | | | | 64,919 | | | | 408,068 | |
| | | | | | | | | | | | | | | | | | | | | | | | | |
| Real estate construction: | | | | | | | | | | | | | | | | | | | | | | | | |
| One-to-four family residential | | | 10,871 | | | | -- | | | | -- | | | | -- | | | | -- | | | | 10,871 | |
| Multi-family residential | | | 10,417 | | | | -- | | | | -- | | | | -- | | | | -- | | | | 10,417 | |
| Commercial and land development | | 25,746 | | | | 1,162 | | | | 231 | | | | 5 | | | | -- | | | | 27,144 | |
| Total real estate construction | | | 47,034 | | | | 1,162 | | | | 231 | | | | 5 | | | | -- | | | | 48,432 | |
| | | | | | | | | | | | | | | | | | | | | | | | | |
| Consumer: | | | | | | | | | | | | | | | | | | | | | | | | |
| Home equity | | | 41,131 | | | | 30 | | | | 247 | | | | 1,107 | | | | 10,853 | | | | 53,368 | |
| Automobile | | | 143 | | | | 676 | | | | 826 | | | | 465 | | | | 254 | | | | 2,364 | |
| Other consumer | | | 1,178 | | | | 766 | | | | 441 | | | | 534 | | | | 815 | | | | 3,734 | |
| Total consumer | | | 42,452 | | | | 1,472 | | | | 1,514 | | | | 2,106 | | | | 11,922 | | | | 59,466 | |
| | | | | | | | | | | | | | | | | | | | | | | | | |
| Commercial business | | | 15,128 | | | | 4,145 | | | | 2,147 | | | | 2,193 | | | | 643 | | | | 24,256 | |
| Total loans receivable | | $ | 185,854 | | | $ | 135,882 | | | $ | 69,447 | | | $ | 71,555 | | | $ | 77,484 | | | $ | 540,222 | |
The following table sets forth the dollar amount of all loans maturing or repricing more than one year after September 30, 2009, which have fixed interest rates and have floating or adjustable interest rates:
| | | Floating or Adjustable Rate | | | Fixed Rates | | | Total | |
| | | (in thousands) | |
| Real estate: | | | | | | | | | |
| One-to-four family residential | | $ | 47,836 | | | $ | 109,399 | | | $ | 157,235 | |
| Multi-family residential | | | 8,801 | | | | 1,949 | | | | 10,750 | |
| Commercial | | | 135,315 | | | | 23,528 | | | | 158,843 | |
| Total real estate | | | 191,952 | | | | 134,876 | | | | 326,828 | |
| | | | | | | | | | | | | |
| Real estate construction: | | | | | | | | | | | | |
| One-to-four family residential | | | -- | | | | -- | | | | -- | |
| Multi-family residential | | | -- | | | | -- | | | | -- | |
| Commercial and land development | | | 881 | | | | 517 | | | | 1,398 | |
| Total real estate construction | | | 881 | | | | 517 | | | | 1,398 | |
| | | | | | | | | | | | | |
| Consumer: | | | | | | | | | | | | |
| Home equity | | | -- | | | | 12,237 | | | | 12,237 | |
| Automobile | | | -- | | | | 2,221 | | | | 2,221 | |
| Other consumer | | | -- | | | | 2,556 | | | | 2,556 | |
| Total consumer | | | -- | | | | 17,014 | | | | 17,014 | |
| | | | | | | | | | | | | |
| Commercial business | | | 3,305 | | | | 5,823 | | | | 9,128 | |
| | | | | | | | | | | | | |
| Total loans receivable | | $ | 196,138 | | | $ | 158,230 | | | $ | 354,368 | |
Loan Solicitation and Processing. As part of our commercial banking strategy, we are focusing our efforts in increasing the amount of our direct originations commercial business loans, followed by commercial and multi-family real estate loans and to a lesser extent construction loans to builders and developers. Residential real estate loans are solicited through media advertising, direct mail to existing customers and by realtor referrals. Loan originations are further supported by lending services offered through our internet website, advertising, cross-selling and through our employees' community service.
Upon receipt of a loan application from a prospective borrower, we obtain a credit report and other data to verify specific information relating to the applicant's employment, income and credit standing. An appraisal of the real estate offered as collateral is undertaken by a licensed appraiser we have retained and approved.
Mortgage loan applications are initiated by loan officers and are required to be approved by our underwriting staff who has appropriately delegated lending authority. Loans that exceed the underwriter’s lending authority must be approved by one or more members of the Management Loan Committee. We require title insurance on real estate loans as well as fire and casualty insurance on all secured loans and on home equity loans and lines of credit where the property serves as collateral.
Loan Originations, Servicing, Purchases and Sales. During the year ended September 30, 2009, our total loan originations were $163.3 million. The majority of all first lien residential mortgages are sold to the secondary market at the time of origination. During the year ended September 30, 2009, we sold $68.8 million to the secondary market including $2.7 million in loans originated in fiscal year 2008. The remaining $66.1 million of loans represents 97.6% of total current year one-to-four family residential loan originations. Our secondary market relationships have been major correspondent banks. The increase in loans sold during 2009 was a result of the low interest rate environment that existed during fiscal 2009.
One-to-four family home loans are generally originated in accordance with the guidelines established by Freddie Mac and Fannie Mae, with the exception of our special community development loans under the Community
Reinvestment Act. We utilize the Freddie Mac Loan Prospector and Fannie Mae Desktop Underwriter automated loan systems to underwrite the majority of our residential first mortgage loans (excluding community development loans). The remaining loans are underwritten by designated real estate loan underwriters internally in accordance with standards as provided by our Board-approved loan policy. The underwriting criteria we use on loans that are not sold to investors and retained in our portfolio are at least as stringent as those we use for the loans we sell.
Nearly all of our one-to-four family home loans are sold into the secondary market with servicing released. Loans are generally sold on a non-recourse basis. On August 28, 2008, Home Federal Bank entered into a binding agreement with another bank whereby Home Federal Bank sold its remaining servicing rights. The purchase price was 1.02% of the unpaid principal balance of all loans in the servicing portfolio, except for those loans that are 60 days or more past due, in litigation, in bankruptcy or in foreclosure as of October 31, 2008. The transfer was completed in the first quarter of the fiscal year ended September 30, 2009.
The following table shows total loans originated, purchased, sold and repaid during the periods indicated:
| | | Year Ended September 30, | |
| | | 2009 | | | 2008 | | | 2007 | |
| | | (in thousands) | |
| Loans originated: | | | | | | | | | |
| Real estate: | | | | | | | | | |
One-to-four family residential (1) | | $ | 67,701 | | | $ | 48,114 | | | $ | 96,254 | |
| Multi-family residential | | | 74 | | | | 1,819 | | | | 2,000 | |
| Commercial | | | 32,477 | | | | 47,662 | | | | 23,598 | |
| Total real estate | | | 100,252 | | | | 97,595 | | | | 121,852 | |
| | | | | | | | | | | | | |
| Real estate construction: | | | | | | | | | | | | |
| One-to-four family residential | | | 12,530 | | | | 17,853 | | | | 41,529 | |
| Multi-family residential | | | -- | | | | -- | | | | 1,770 | |
| Commercial and land development | | | 12,266 | | | | 14,152 | | | | 18,266 | |
| Total real estate construction | | | 24,796 | | | | 32,005 | | | | 61,565 | |
| | | | | | | | | | | | | |
| Consumer: | | | | | | | | | | | | |
| Home equity | | | 15,265 | | | | 35,339 | | | | 32,136 | |
| Automobile | | | 192 | | | | 894 | | | | 654 | |
| Other consumer | | | 2,643 | | | | 3,104 | | | | 3,264 | |
| Total consumer | | | 18,100 | | | | 39,337 | | | | 36,054 | |
| | | | | | | | | | | | | |
| Commercial business, including advances on lines of credit | | | 20,106 | | | | 21,352 | | | | 5,159 | |
| | | | | | | | | | | | | |
| Total loans originated | | | 163,254 | | | | 190,289 | | | | 224,630 | |
| | | | | | | | | | | | | |
| Loans purchased: | | | | | | | | | | | | |
| Net loans purchased in Acquisition | | | 129,162 | | | | -- | | | | -- | |
| | | | | | | | | | | | | |
| Loans sold: | | | | | | | | | | | | |
| One-to-four family residential | | | (68,801 | ) | | | (47,968 | ) | | | (96,370 | ) |
| | | | | | | | | | | | | |
| Principal repayments | | | (130,669 | ) | | | (161,575 | ) | | | (149,714 | ) |
| Transfer to real estate owned | | | (19,513 | ) | | | (1,394 | ) | | | (857 | ) |
| Increase (decrease) in other items, net | | | (24,586 | ) | | | (1,730 | ) | | | 149 | |
| | | | | | | | | | | | | |
| Net increase (decrease) in loans receivable and loans held for sale | | $ | 48,847 | | | $ | (22,378 | ) | | $ | (22,162 | ) |
________
| (1) | Includes originations of loans held for sale of $66.8 million, $45.9 million, and $97.2 million for the years ended September 30, 2009, 2008 and 2007, respectively. |
Loan Origination and Other Fees. In some instances, we receive loan origination fees on real estate related products. Loan fees generally represent a percentage of the principal amount of the loan, and are paid by the borrower. Accounting standards require that certain fees received, net of certain origination costs, be deferred and amortized over the contractual life of the loan. Net deferred fees or costs associated with loans that are prepaid or
sold are recognized as income at the time of prepayment. We had $858,000 of net deferred loan fees and costs as of September 30, 2009.
Asset Quality
The objective of our loan review process is to determine risk levels and exposure to loss. The depth of review varies by asset types, depending on the nature of those assets. While certain assets may represent a substantial investment and warrant individual reviews, other assets may have less risk because the asset size is small, the risk is spread over a large number of obligors or the obligations are well collateralized and further analysis of individual assets would expand the review process without measurable advantage to risk assessment. Asset types with these characteristics may be reviewed as a total portfolio on the basis of risk indicators such as delinquency (consumer and residential real estate loans) or credit rating. A formal review process is conducted on individual assets that represent greater potential risk. A formal review process is a total reevaluation of the risks associated with the asset and is documented by completing an asset review report. Certain real estate-related assets must be evaluated in terms of their fair market value or net realizable value in order to determine the likelihood of loss exposure and, consequently, the adequacy of valuation allowances.
We define a loan as being impaired when, based on current information and events, it is probable that we will be unable to collect all amounts due under the contractual terms of the loan agreement. Large groups of smaller balance homogenous loans such as consumer secured loans, residential mortgage loans and consumer unsecured loans are collectively evaluated for potential loss. All other loans are evaluated for impairment on an individual basis. Accounting Standards Codification Topic (“ASC”) 310-30 “Loans and Debt Securities Acquired with Deteriorated Credit Quality,” applies to a loan with evidence of deterioration of credit quality since origination, acquired by completion of a transfer for which it is probable, at acquisition, that the investor will be unable to collect all contractually required payments receivable. We determined that a significant number of the loans acquired were impaired and subject to ASC 310-30.
We generally assess late fees or penalty charges on delinquent loans of five percent of the monthly principal and interest amount. The borrower is given a 10 to 15-day grace period to make the loan payment depending on loan type. When a borrower fails to make a required payment when it is due, we institute collection procedures. The first notice is mailed to the borrower on the day following the expiration of the grace period requesting payment and assessing a late charge. Attempts to contact the borrower by telephone generally begin upon the 15th day of delinquency. If a satisfactory response is not obtained, continual follow-up contacts are attempted until the loan has been brought current. Before the 60th day of delinquency, attempts to interview the borrower are made to establish the cause of the delinquency, whether the cause is temporary, the attitude of the borrower toward the debt and a mutually satisfactory arrangement for curing the default.
The Board of Directors is informed monthly as to the number and dollar amount of loans that are delinquent by more than 30 days, and is given information regarding classified assets.
If a borrower is chronically delinquent and all reasonable means of obtaining payments have been exercised, we will seek to recover any collateral securing the loan according to the terms of the security instrument and applicable law. In the event of an unsecured loan, we will either seek legal action against the borrower or refer the loan to an outside collection agency.
Our determination of the initial fair value of loans purchased in the Acquisition involved a high degree of judgment and complexity. The carrying value of the acquired loans reflects management’s best estimate of the amount to be realized from the acquired loan portfolio. However, the amounts we actually realize on these loans could differ materially from the carrying value reflected in these financial statements, based upon the timing of collections on the acquired loans in future periods, underlying collateral values and the ability of borrowers to continue to make payments.
Because of the loss sharing agreement with the FDIC on these assets, we do not expect that we will incur any excessive losses. Under the loss sharing agreement, our share of the first $34.0 million of losses on the $155.2 million of covered assets (defined as loans and other real estate owned purchased in the Acquisition) is 20%, and thus only $6.8 million in losses could possibly be realized by the Company on that first tranche of losses. Any loss on covered assets in excess of the $34.0 million tranche will be limited to 5%, and thus another $6.1 million in
losses could possibly be realized by the Company. Therefore, we estimate that our exposure related to the assets covered under the loss sharing agreement is $12.9 million. This scenario is based upon no principal being collected from the borrowers on any of the covered assets but does not consider our share of incremental expenses to maintain foreclosed assets. As of September 30, 2009, the allowance for loan losses on acquired loans and fair value adjustments on loans subject to accounting under ASC 310-30 reflect that we estimated total losses on the acquired portfolio to be $38.4 million at that date and that our share of those losses totaled $7.0 million. As such, we believe our total additional loss exposure on covered assets to be $5.9 million (i.e., $12.9 million total losses less the $7.0 million of loss reserves and fair value adjustments net of the FDIC indemnification asset) under the loss scenario discussed above.
Delinquent Loans. The following table shows our delinquent loans by the type of loan and number of days delinquent as of September 30, 2009:
| | | Loans Delinquent For: | | | Total | |
| | | 60-89 Days | | | Over 90 Days | | | Delinquent Loans | |
| | | Number of Loans | | | Principal Balance Loans | | | Number of Loans | | | Principal Balance Loans | | | Number of Loans | | | Principal Balance Loans | |
| | | (dollars in thousands) | |
| Real estate: | | | | | | | | | | | | | | | | | | |
| One-to-four family residential | | | 9 | | | $ | 1,062 | | | | 32 | | | $ | 4,740 | | | | 41 | | | $ | 5,802 | |
| Multi-family residential | | | 1 | | | | 201 | | | | -- | | | | -- | | | | 1 | | | | 201 | |
| Commercial | | | 4 | | | | 1,684 | | | | 17 | | | | 6,755 | | | | 21 | | | | 8,439 | |
| Total real estate | | | 14 | | | | 2,947 | | | | 49 | | | | 11,495 | | | | 63 | | | | 14,442 | |
| | | | | | | | | | | | | | | | | | | | | | | | | |
| Real estate construction: | | | | | | | | | | | | | | | | | | | | | | | | |
| One-to-four family residential | | | 1 | | | | 481 | | | | 4 | | | | 830 | | | | 5 | | | | 1,311 | |
| Multi-family residential | | | -- | | | | -- | | | | 1 | | | | 932 | | | | 1 | | | | 932 | |
| Commercial and land development | | 7 | | | | 3,538 | | | | 14 | | | | 4,372 | | | | 21 | | | | 7,910 | |
| Total real estate construction | | | 8 | | | | 4,019 | | | | 19 | | | | 6,134 | | | | 27 | | | | 10,153 | |
| | | | | | | | | | | | | | | | | | | | | | | | | |
| Consumer: | | | | | | | | | | | | | | | | | | | | | | | | |
| Home equity | | | 14 | | | | 489 | | | | 6 | | | | 225 | | | | 20 | | | | 714 | |
| Automobile | | | 3 | | | | 9 | | | | -- | | | | -- | | | | 3 | | | | 9 | |
| Other consumer | | | 8 | | | | 19 | | | | -- | | | | -- | | | | 8 | | | | 19 | |
| Total consumer | | | 25 | | | | 517 | | | | 6 | | | | 225 | | | | 31 | | | | 742 | |
| | | | | | | | | | | | | | | | | | | | | | | | | |
| Commercial business | | | 4 | | | | 387 | | | | 9 | | | | 2,270 | | | | 13 | | | | 2,657 | |
| | | | | | | | | | | | | | | | | | | | | | | | | |
| Total | | | 51 | | | $ | 7,870 | | | | 83 | | | $ | 20,124 | | | | 134 | | | $ | 27,994 | |
Nonperforming Assets. Nonperforming assets include nonaccrual loans, loans delinquent 90 days or more and still accruing, real estate acquired through foreclosure and loans that are not delinquent but exhibit weaknesses that have evidenced doubt as to our ability to collect all contractual principal and interest and have been classified as impaired under ASC Topic 310-10-35. As a result, nonperforming loans and nonperforming assets were higher in balance than total delinquent loans at September 30, 2009. When a loan becomes 90 days delinquent, we place the loan on nonaccrual status; accordingly, we have no accruing loans that are contractually past due 90 days or more.
As of September 30, 2009, nonaccrual loans totaled $38.5 million, or 7.13% of total loans. Nonaccrual loans covered under the loss share agreement with the FDIC totaled $26.7 million, or 4.95% of total loans, at September 30, 2009. Organic nonaccrual loans totaled $11.8 million, or 2.18% of total loans.
The following table sets forth information with respect to our nonperforming assets and troubled debt restructurings within the meaning of ASC Topic 310-10-35 for the periods indicated. During the periods presented, there were no accruing loans that were contractually past due 90 days or more. There were $4.6 million of troubled debt restructurings at September 30, 2009 that were not delinquent or in nonperforming status.
| | | At September 30, | |
| | | 2009 | | | 2008 | | | 2007 | | | 2006 | | | 2005 | |
| | | (dollars in thousands) | |
| Loans accounted for on a non-accrual basis: | | | | | | | | | | | | | | | |
| Real estate: | | | | | | | | | | | | | | | |
| One-to-four family residential | | $ | 10,617 | | | $ | 1,518 | | | $ | 588 | | | $ | 358 | | | $ | 388 | |
| Multi-family residential | | | 1,753 | | | | -- | | | | -- | | | | -- | | | | -- | |
| Commercial | | | 10,750 | | | | 100 | | | | 407 | | | | -- | | | | -- | |
| Total real estate | | | 23,120 | | | | 1,618 | | | | 995 | | | | 358 | | | | 388 | |
| | | | | | | | | | | | | | | | | | | | | |
| Real estate construction: | | | | | | | | | | | | | | | | | | | | |
| One-to-four family residential | | | 2,764 | | | | 3,787 | | | | 436 | | | | -- | | | | -- | |
| Multi-family residential | | | 932 | | | | -- | | | | -- | | | | -- | | | | -- | |
| Commercial and land development | | | 7,915 | | | | 4,204 | | | | -- | | | | -- | | | | -- | |
| Total real estate construction | | | 11,611 | | | | 7,991 | | | | 436 | | | | -- | | | | -- | |
| | | | | | | | | | | | | | | | | | | | | |
| Consumer: | | | | | | | | | | | | | | | | | | | | |
| Home equity | | | 502 | | | | 306 | | | | 100 | | | | 30 | | | | 79 | |
| Automobile | | | -- | | | | -- | | | | -- | | | | -- | | | | 5 | |
| Other consumer | | | 42 | | | | 10 | | | | -- | | | | -- | | | | 6 | |
| Total consumer | | | 544 | | | | 316 | | | | 100 | | | | 30 | | | | 90 | |
| | | | | | | | | | | | | | | | | | | | | |
| Commercial business | | | 3,217 | | | | 20 | | | | -- | | | | -- | | | | -- | |
| Total loans | | | 38,492 | | | | 9,945 | | | | 1,531 | | | | 388 | | | | 478 | |
Accruing loans which are contractually past due 90 days or more | | | -- | | | | -- | | | | -- | | | | -- | | | | -- | |
| Total of nonaccrual and 90 days past due loans | | | 38,492 | | | | 9,945 | | | | 1,531 | | | | 388 | | | | 478 | |
| Repossessed assets | | | 412 | | | | -- | | | | -- | | | | -- | | | | -- | |
| Real estate owned | | | 17,979 | | | | 650 | | | | 549 | | | | -- | | | | 534 | |
| Total nonperforming assets | | $ | 56,883 | | | $ | 10,595 | | | $ | 2,080 | | | $ | 388 | | | $ | 1,012 | |
Nonperforming assets covered by loss share and included above(1) | | $ | 34,224 | | | $ | -- | | | $ | -- | | | $ | -- | | | $ | -- | |
| Troubled debt restructurings | | $ | 11,933 | | | $ | 812 | | | $ | 35 | | | $ | 11 | | | $ | 322 | |
| Allowance for loan loss on nonperforming loans | | | 1,803 | | | | 1,733 | | | | 66 | | | | -- | | | | 7 | |
| Classified assets included in nonperforming assets | | | 38,492 | | | | 10,152 | | | | 1,666 | | | | 388 | | | | 1,000 | |
| Allowance for loan loss on classified assets | | | 2,483 | | | | 1,767 | | | | 191 | | | | 46 | | | | 64 | |
Nonaccrual and accruing loans 90 days or more past due as a percentage of loans receivable | | | 7.13 | % | | | 2.14 | % | | | 0.32 | % | | | 0.08 | % | | | 0.11 | % |
Nonaccrual and accruing loans 90 days or more past due as a percentage of total assets | | | 4.65 | % | | | 1.37 | % | | | 0.22 | % | | | 0.05 | % | | | 0.07 | % |
| | | | | | | | | | | | | | | | | | | | | |
| Nonperforming assets as a percentage of total assets | | | 6.87 | % | | | 1.46 | % | | | 0.29 | % | | | 0.05 | % | | | 0.15 | % |
| Loans receivable, net | | $ | 510,629 | | | $ | 459,813 | | | $ | 480,118 | | | $ | 503,065 | | | $ | 430,944 | |
Interest foregone on nonaccrual loans(2) | | | 1,366 | | | | 182 | | | | 36 | | | | 11 | | | | 5 | |
| Total assets | | | 827,899 | | | | 725,070 | | | | 709,954 | | | | 761,292 | | | | 689,577 | |
| (1) | Includes real estate owned and other repossessed assets of $7.5 million, after fair value purchase adjustments |
| (2) | If interest on the loans classified as nonaccrual had been accrued, interest income in these amounts would have been recorded on nonaccrual loans. |
The following table summarizes nonperforming and impaired loans and real estate owned at September 30, 2009 and 2008:
| | | 2009 | | | 2008 | |
| | | Acquired | | | Organic | | | | | | Organic | |
| | | ASC 310-30(1) | | | Other | | | Portfolio | | | Total | | | Portfolio | |
(in thousands) | |
Land acquisition and development | | $ | 6,985 | | | $ | - | | | $ | 623 | | | $ | 7,608 | | | $ | 4,204 | |
| One-to-four family construction | | | 481 | | | | - | | | | 2,283 | | | | 2,764 | | | | 3,787 | |
| Commercial real estate | | | 10,974 | | | | 42 | | | | 2,725 | | | | 13,741 | | | | 100 | |
| One-to-four family residential | | | 5,020 | | | | | | | | 6,100 | | | | 11,120 | | | | 1,824 | |
| Other | | | 2,763 | | | | 443 | | | | 53 | | | | 3,259 | | | | 30 | |
| Total nonperforming loans | | $ | 26,223 | | | $ | 485 | | | $ | 11,784 | | | $ | 38,492 | | | $ | 9,945 | |
Real estate and other repossessed assets | | | | | | $ | 7,516 | | | $ | 10,875 | | | $ | 18,391 | | | $ | 650 | |
| Total nonperforming assets | | | | | | | | | | | | | | $ | 56,883 | | | $ | 10,595 | |
__________________________
(1) Presented at estimated fair value, net of fair value adjustments of $14.3 million
Real Estate Owned and Other Repossessed Assets. Real estate we acquire as a result of foreclosure or by deed-in-lieu of foreclosure is classified as real estate owned until it is sold. When the property is acquired, it is recorded at the lower of its cost, which is the unpaid principal balance of the related loan plus foreclosure costs, or the fair market value of the property less selling costs. Other repossessed collateral, including autos, are also recorded at the lower of cost (i.e., the unpaid principal balance plus repossession costs) or fair market value. As of September 30, 2009, we had $18.4 million in real estate owned with $7.5 million, after fair value purchase adjustments, subject to the loss share agreement with the FDIC.
Troubled Debt Restructurings. According to generally accepted accounting principles, we are required to account for certain loan modifications or restructuring as a "troubled debt restructuring." In general, the modification or restructuring of a debt is considered a troubled debt restructuring if we, for economic or legal reasons related to a borrower's financial difficulties, grant a concession to the borrower that we would not otherwise consider. As of September 30, 2009, we had 35 restructured loans with an aggregate balance of $11.9 million.
Classified Assets. Federal regulations provide for the classification of lower quality loans and other assets, such as debt and equity securities, as substandard, doubtful or loss. An asset is considered substandard if it is inadequately protected by the current net worth, liquidity and paying capacity of the borrower or any collateral pledged. Substandard assets include those characterized by the distinct possibility that we will sustain some loss if the deficiencies are not corrected. Assets classified as doubtful have all the weaknesses inherent in those classified substandard with the added characteristic that the weaknesses present make collection or liquidation in full highly questionable and improbable on the basis of currently existing facts, conditions and values. Assets classified as loss are those considered uncollectible and of such little value that their continuance as assets without the establishment of a specific loss reserve is not warranted.
When we classify problem assets as either substandard or doubtful, we may establish a specific allowance in an amount we deem prudent and approved by the Bank’s Classified Asset Committee to address the risk specifically or we may allow the loss to be addressed in the general allowance. Members of the Classified Asset Committee include the Bank’s Chief Executive Officer and Chief Credit Officer as well as the Bank’s internal loan review director and other members of management in our Credit Administration department. General allowances represent loss allowances which have been established to recognize the inherent risk associated with lending activities, but which, unlike specific allowances, have not been specifically allocated to particular problem assets. When an insured institution classifies problem assets as a loss, it is required to charge off such assets in the period in which they are deemed uncollectible. Assets that do not currently expose us to sufficient risk to warrant classification in one of the aforementioned categories but possess weaknesses are required to be designated as special mention. Our determination as to the classification of our assets and the amount of our valuation allowances is subject to review by the OTS, which can order the establishment of additional loss allowances.
In connection with the filing of periodic reports with the OTS and in accordance with our classification of assets policy, we regularly review the problem assets in our portfolio to determine whether any assets require classification in accordance with applicable regulations. On the basis of our review of our assets, as of September 30, 2009, we had classified assets of $49.6 million. The total amount of classified assets represented 23.7% of equity capital and 6.0% of total assets as of September 30, 2009. The increase in classified assets from prior year detailed in the table below was primarily due to troubled loans purchased in the Acquisition. The increase in classified loans in our organic portfolio occurred primarily in our commercial real estate and construction and land development portfolios. As of September 30, 2009, there were 20 impaired loans included in classified assets. The aggregate amounts of classified assets at the dates indicated were as follows:
| | | At September 30, | |
| | | 2009 | | | 2008 | |
| | | (in thousands) | |
| Classified assets: | | | | | | |
| Doubtful | | $ | 43 | | | $ | -- | |
| Substandard | | | 49,545 | | | | 9,988 | |
| Total | | $ | 49,588 | | | $ | 9,988 | |
| | | | | | | | | |
| Classified assets included in nonperforming loans | | $ | 38,492 | | | $ | 9,945 | |
| Specific allowance for loan loss on classified assets | | | 1,516 | | | | 1,767 | |
| Classified assets subject to loss share agreement | | | 27,558 | | | | -- | |
Potential Problem Loans. Potential problem loans are loans that do not yet meet the criteria for placement on non-accrual status, but known information about possible credit problems of the borrowers causes management to have doubts as to the ability of the borrowers to comply with present loan repayment terms. This may result in the future inclusion of such loans in the non-accrual loan category. As of September 30, 2009, the aggregate amount of potential problem loans was $11.0 million, which includes loans that were rated “Substandard under the Bank’s risk grading process but were not impaired or on non-accrual status. The $11.0 million balance includes $8.6 million in loans secured by commercial real estate, $681,000 in one-to-four family residential real estate loans, $1.7 million in real estate construction and land development loans, and $42,000 of non real estate commercial loans.
The following table summarizes the distribution of the allowance for loan losses by loan category. Allocations of the allowance may be made for specific loans, but the entire allowance is available for any loan that, in management’s judgment, should be charged-off. The allowance consists of specific and general components. The specific component relates to loans that are individually classified as impaired. The general component covers non-classified loans and is based on historical loss experience adjusted for current economic and other factors described more fully below.
| | At September 30, |
| | 2009 | | 2008 | | 2007 | | 2006 | | 2005 |
| | (dollars in thousands) |
| | Loan Balance | Amount by Loan Category | Percent of Loans in Loan Category to Total Loans | | Loan Balance | Amount by Loan Category | Percent of Loans in Loan Category to Total Loans | | Loan Balance | Amount by Loan Category | Percent of Loans in Loan Category to Total Loans | | Loan Balance | Amount by Loan Category | Percent of Loans in Loan Category to Total Loans | | Loan Balance | Amount by Loan Category | Percent of Loans in Loan Category to Total Loans |
| Real estate: | | | | | | | | | | | | | | | | | | | |
| One-to-four family residential | $178,311 | $ 3,781 | 32.98% | | $210,501 | $ 849 | 45.23% | | $249,545 | $ 840 | 51.55% | | $293,640 | $ 873 | 57.88% | | $252,126 | $ 784 | 58.00% |
| Multi-family residential | 16,286 | 589 | 3.02 | | 8,477 | 70 | 1.82 | | 6,864 | 60 | 1.42 | | 7,049 | 61 | 1.39 | | 5,454 | 61 | 1.25 |
| Commercial | 213,471 | 11,717 | 39.53 | | 151,733 | 1,345 | 32.61 | | 133,823 | 1,205 | 27.64 | | 125,401 | 1,087 | 24.72 | | 116,432 | 1,297 | 26.78 |
| Total real estate | 408,068 | 16,087 | 75.53 | | 370,711 | 2,264 | 79.66 | | 390,232 | 2,105 | 80.61 | | 426,090 | 2,021 | 83.99 | | 374,012 | 2,142 | 86.03 |
| | | | | | | | | | | | | | | | | | | | |
| | | | | | | | | | | | | | | | | | | | |
| Real estate construction: | | | | | | | | | | | | | | | | | | | |
| One-to-four family residential | 10,871 | 2,147 | 2.01 | | 13,448 | 610 | 2.89 | | 20,545 | 188 | 4.24 | | 23,678 | 290 | 4.67 | | 14,421 | 241 | 3.32 |
| Multi-family residential | 10,417 | 78 | 1.93 | | 920 | 11 | 0.20 | | 1,770 | 23 | 0.37 | | -- | -- | -- | | 1,427 | 18 | 0.33 |
| Commercial and land development | 27,144 | 6,492 | 5.03 | | 18,674 | 1,029 | 4.01 | | 21,899 | 245 | 4.52 | | 16,344 | 294 | 3.22 | | 7,470 | 132 | 1.72 |
| Total real estate | 48,432 | 8,717 | 8.97 | | 33,042 | 1,650 | 7.10 | | 44,214 | 455 | 9.13 | | 40,022 | 584 | 7.89 | | 23,318 | 391 | 5.37 |
| | | | | | | | | | | | | | | | | | | | |
| | | | | | | | | | | | | | | | | | | | |
| Consumer: | | | | | | | | | | | | | | | | | | | |
| Home equity | 53,368 | 2,896 | 9.88 | | 52,954 | 529 | 11.38 | | 42,990 | 311 | 8.88 | | 34,143 | 243 | 6.73 | | 28,558 | 192 | 6.57 |
| Automotive | 2,364 | 21 | 0.44 | | 1,903 | 29 | 0.41 | | 2,173 | 35 | 0.45 | | 3,245 | 58 | 0.64 | | 4,576 | 79 | 1.05 |
| Other consumer | 3,734 | 290 | 0.69 | | 1,370 | 28 | 0.29 | | 1,405 | 37 | 0.29 | | 1,300 | 32 | 0.26 | | 1,530 | 39 | 0.35 |
| Total consumer | 59,466 | 3,207 | 11.01 | | 56,227 | 586 | 12.08 | | 46,568 | 383 | 9.62 | | 38,688 | 333 | 7.63 | | 34,664 | 310 | 7.97 |
| | | | | | | | | | | | | | | | | | | | |
| Commercial business | 24,256 | 724 | 4.49 | | 5,385 | 79 | 1.16 | | 3,122 | 45 | 0.64 | | 2,480 | 36 | 0.49 | | 2,759 | 39 | 0.63 |
| | | | | | | | | | | | | | | | | | | | |
| Total loans | $540,222 | $28,735 | 100.00% | | $465,365 | $4,579 | 100.00% | | $484,136 | $2,988 | 100.00% | | $507,280 | $2,974 | 100.00% | | $434,753 | $2,882 | 100.00% |
The following table sets forth an analysis of our allowance for loan losses at the dates and for the periods indicated:
| | Year Ended September 30, |
| | 2009 | | 2008 | | 2007 | | 2006 | | 2005 |
| | (in thousands) |
| Allowance at beginning of period | $4,579 | | $2,988 | | $2,974 | | $2,882 | | $2,637 |
| Provisions for loan losses | 16,085 | | 2,431 | | 409 | | 138 | | 456 |
| Addition to allowance due to acquisition | 16,811 | | -- | | -- | | -- | | -- |
| Transfer to unfunded commitments | -- | | -- | | (192) | | -- | | -- |
| | | | | | | | | | |
| Recoveries: | | | | | | | | | |
| Real estate: | | | | | | | | | |
| One-to-four family residential | 122 | | -- | | -- | | -- | | -- |
| Multi-family residential | -- | | -- | | -- | | -- | | -- |
| Commercial | -- | | -- | | -- | | -- | | 2 |
| Total real estate | 122 | | -- | | -- | | -- | | 2 |
| | | | | | | | | | |
| Real estate construction: | | | | | | | | | |
| One-to-four family residential | 15 | | -- | | -- | | -- | | -- |
| Multi-family residential | -- | | -- | | -- | | -- | | -- |
| Commercial and land development | -- | | -- | | -- | | -- | | -- |
| Total real estate construction | 15 | | -- | | -- | | -- | | -- |
| | | | | | | | | | |
| Consumer: | | | | | | | | | |
| Home equity | 88 | | -- | | -- | | -- | | 12 |
| Automobile | 5 | | 9 | | 4 | | 12 | | -- |
| Other consumer | 7 | | 15 | | 12 | | 12 | | 9 |
| Total consumer | 100 | | 24 | | 16 | | 24 | | 21 |
| | | | | | | | | | |
| Commercial business | 1 | | -- | | -- | | -- | | -- |
| Total recoveries | 238 | | 24 | | 16 | | 24 | | 23 |
| | | | | | | | | | |
| Charge-offs: | | | | | | | | | |
| Real estate: | | | | | | | | | |
| One-to-four family residential | (1,571) | | (665) | | (73) | | -- | | -- |
| Multi-family residential | -- | | -- | | -- | | -- | | -- |
| Commercial | (919) | | -- | | -- | | -- | | (56) |
| Total real estate | (2,490) | | (665) | | (73) | | -- | | (56) |
| | | | | | | | | | |
| Real estate construction: | | | | | | | | | |
| One-to-four family residential | (1,464) | | -- | | (91) | | -- | | -- |
| Multi-family residential | -- | | -- | | -- | | -- | | -- |
| Commercial and land development | (2,987) | | -- | | -- | | -- | | -- |
| Total real estate construction | (4,451) | | -- | | (91) | | -- | | -- |
| | | | | | | | | | |
| Consumer: | | | | | | | | | |
| Home equity | (1,751) | | (137) | | -- | | (3) | | (19) |
| Automobile | (9) | | (23) | | -- | | (3) | | (22) |
| Other consumer | (83) | | (39) | | (36) | | (33) | | (51) |
| Total consumer | (1,843) | | (199) | | (36) | | (39) | | (92) |
| | | | | | | | | | |
| Commercial business | (194) | | -- | | (19) | | (31) | | (86) |
| | | | | | | | | | |
| Total charge-offs | (8,978) | | (864) | | (219) | | (70) | | (234) |
| Net charge-offs | (8,740) | | (840) | | (203) | | (46) | | (211) |
| Balance at end of period | $28,735 | | $4,579 | | $2,988 | | $2,974 | | $2,882 |
| | | | | | | | | | |
Allowance for loan losses as a percentage of total loans outstanding at the end of the period | 5.32% | | 0.98% | | 0.62% | | 0.59% | | 0.67% |
Net charge-offs as a percentage of average loans outstanding during the period | 1.87% | | 0.18% | | 0.04% | | 0.01% | | 0.05% |
Allowance for loan losses as a percentage of nonaccrual and 90 days or more past due loans at end of period | 74.65% | | 46.04% | | 195.17% | | 766.49% | | 602.97% |
Management reviews the loan losses on a monthly basis and establishes the provision for loan losses based on the risk composition of the loan portfolio, delinquency levels, loss experience, economic conditions, bank regulatory examination results, seasoning of the loan portfolios and other factors related to the collectibility of the loan portfolio The allowance is increased by the provision for loan losses, which is charged against current period operating results and decreased by the amount of actual loan charge-offs, net of recoveries.
In estimating our allowance for loan losses, we consider our historical loss ratios as a basis for our general loss reserve. We then adjust those historical loss rates after consideration of current internal and external environmental factors. We consider economic indicators that may correlate to higher, or lower, loss ratios in the current environment compared to our historical loss experience. These external factors include trends in unemployment, levels of foreclosures and bankruptcy filings, vacancy rates and peer bank delinquency levels, as well as several other economic factors in our market area. Internal factors include changes in underwriting criteria or policies, management turnover and the results of our internal loan review processes and audits. Further, we estimate a range of losses in each loan portfolio. We then subjectively select a level of allowance for loan loss within those ranges that best reflects our estimate of the Bank’s loss exposure. Classified assets that are not impaired are assigned an estimated loss percentage at a higher rate than nonclassified assets as these loans, by their nature, represent a higher likelihood of incurred loss. If management determines the repayment of an impaired loan is dependent upon the liquidation of collateral, an updated appraisal is requested. Management in some situations may use the appraiser’s “quick sale” value rather than the full appraised value, with each further reduced by estimated costs to sell.
As noted earlier, ASC 310-30 applies to a loan with evidence of deterioration of credit quality since origination, acquired by completion of a transfer for which it is probable, at acquisition, that the investor will be unable to collect all contractually required payments receivable. For loans accounted for under ASC 310-30, we determined the value of the loan portfolio based on work provided by an appraiser. Factors considered in the valuation were projected cash flows for the loans, type of loan and related collateral, classification status and current discount rates. Loans were grouped together according to similar characteristics and were treated in the aggregate when applying various valuation techniques. We also estimated the amount of credit losses that were expected to be realized for the loan portfolio primarily by estimating the liquidation value of collateral securing loans on non-accrual status or classified as substandard or doubtful. At September 30, 2009, a majority of these loans were valued based on the liquidation value of the underlying collateral, because the expected cash flows are primarily based on the liquidation of the underlying collateral. Certain amounts related to the ASC 310-30 loans are preliminary estimates and adjustments in future quarters may occur up to one year from the date of acquisition.
An allowance for loan losses was established for loans purchased in the Acquisition that are not accounted for under ASC 310-30. In developing this allowance, we had to rely on estimates and exercise judgment regarding matters where the ultimate outcome is unknown, such as economic factors, developments affecting companies in specific industries and issues with respect to single borrowers. We used loss history for Community First Bank, the failed bank, and adjusted those loss rates for current economic factors and known and estimated real estate devaluations. At the time of the Acquisition, we applied SFAS No. 141, “Business Combinations,” which was superseded by SFAS No. 141(R). We were not permitted to adopt SFAS No. 141(R) prior to its effective date for the Company, which was October 1, 2009, because of our September 30 fiscal year. As such, we established an allowance for loan losses in accordance with industry practice under FAS No. 141.
Management believes the allowance for loan losses as of September 30, 2009, and the fair value adjustments under ASC 310-30 represent our best estimate of probable incurred losses inherent in our loan portfolio at that date. While we believe the estimates and assumptions used in our determination of the allowance are reasonable, there can be no assurance that such estimates and assumptions will not be proven incorrect in the future, or that the actual amount of future provisions will not exceed the amount of past provisions or that any increased provision that may be required will not adversely impact our financial condition and results of operations. In addition, the determination of the amount of Home Federal Bank’s allowance for loan losses is subject to review by bank regulators, as part of the routine examination process, which may result in the establishment of additional reserves based upon their judgment of information available to them at the time of their examination.
The following table provides certain information with respect to our allowance for loan losses, including charge-offs, recoveries and selected ratios for the periods indicated:
| | | At September 30, | |
| | | 2009 | | | 2008 | | | 2007 | | | 2006 | | | 2005 | |
| | | (dollars in thousands) | |
| | | | | | | | | | | | | | | | |
| Provisions for loan losses | | $ | 16,085 | | | $ | 2,431 | | | $ | 409 | | | $ | 138 | | | $ | 456 | |
| Allowance for loan losses | | | 28,735 | | | | 4,579 | | | | 2,988 | | | | 2,974 | | | | 2,882 | |
Allowance for loan losses as a percentage of total loans outstanding at the end of the period | | | 5.32 | % | | | 0.98 | % | | | 0.62 | % | | | 0.59 | % | | | 0.67 | % |
| | | | | | | | | | | | | | | | | | | | | |
Allowance for loan losses included above allocated to loans covered by loss share agreement | | $ | 16,812 | | | $ | -- | | | $ | -- | | | $ | -- | | | $ | -- | |
Allowance for loan losses on covered assets as a percentage of loans covered by loss share agreement | | | 13.30 | % | | | -- | % | | | -- | % | | | -- | % | | | -- | % |
| | | | | | | | | | | | | | | | | | | | | |
| Net charge-offs | | $ | 8,740 | | | $ | 840 | | | $ | 203 | | | $ | 46 | | | $ | 211 | |
| Total of nonaccrual and 90 days past due loans | | | 38,492 | | | | 9,945 | | | | 1,531 | | | | 388 | | | | 478 | |
Nonaccrual and 90 days or more past due loans as a percentage of loans receivable | | | 7.13 | % | | | 2.14 | % | | | 0.32 | % | | | 0.08 | % | | | 0.11 | % |
| | | | | | | | | | | | | | | | | | | | | |
| Loans receivable, gross | | $ | 540,222 | | | $ | 465,364 | | | $ | 484,136 | | | $ | 507,281 | | | $ | 434,753 | |
| Loans covered by loss share agreement | | | 126,366 | | | | -- | | | | -- | | | | -- | | | | -- | |
Investment Activities
General. OTS regulations permit the Bank and the Company to invest in various types of liquid assets, including U.S. Treasury obligations, securities of U.S. Government-sponsored enterprises, certificates of deposit of federally-insured banks and savings associations, banker's acceptances, repurchase agreements and federal funds. Subject to various restrictions, we also may invest a portion of our assets in commercial paper and corporate debt securities.
Our investment policies are designed to provide and maintain adequate liquidity and to generate favorable rates of return without incurring undue interest rate or credit risk. The investment policies generally limit investments to Treasury notes, mortgage-backed securities, obligations of U.S. government sponsored enterprises, municipal bonds, certificates of deposit and marketable corporate debt obligations. Investment in mortgage-backed securities includes those issued or guaranteed by Fannie Mae, Freddie Mac and Ginnie Mae. In 2008, Freddie Mac and Fannie Mae were placed into conservatorship under the U.S. Treasury Department. As a result, these securities are now backed by the full faith and credit of the U.S. government. We do not own direct obligations of Freddie Mac or Fannie Mae in the form of preferred or common stock or subordinated debt obligations.
From time to time, investment levels may be increased or decreased depending upon yields available on investment alternatives and management's projections as to the demand for funds to be used in loan originations, deposits and other activities.
Investments. Our investment securities had a fair value of $169.3 million and a $162.8 million amortized cost at September 30, 2009. Our investments portfolio consisted of $4.1 million in obligations of U.S. government sponsored enterprises and $165.2 million in mortgage-backed securities. The mortgage-backed securities were primarily comprised of Fannie Mae and Freddie Mac mortgage-backed securities.
The following table sets forth the composition of our investment securities portfolios at the dates indicated:
| | | At September 30, | |
| | | 2009 | | | 2008 | | | 2007 | |
| | | Amortized Cost | | | Fair Value | | | Amortized Cost | | | Fair Value | | | Amortized Cost | | | Fair Value | |
| | | (dollars in thousands) | |
| Available for sale: | | | | | | | | | | | | | | | | | | |
| Obligations of U.S. Government Sponsored Enterprises (“GSE”) | | $ | 4,089 | | | $ | 4,127 | | | $ | -- | | | $ | -- | | | $ | -- | | | $ | -- | |
| Mortgage-backed securities: | | | | | | | | | | | | | | | | | | | | | | | | |
| Fannie Mae | | | 70,888 | | | | 73,769 | | | | 101,626 | | | | 100,602 | | | | 68,019 | | | | 66,477 | |
| Freddie Mac | | | 85,131 | | | | 88,742 | | | | 86,104 | | | | 85,128 | | | | 94,484 | | | | 92,394 | |
| Ginnie Mae | | | 2,046 | | | | 2,083 | | | | -- | | | | -- | | | | -- | | | | -- | |
| Private label | | | 612 | | | | 599 | | | | 3,390 | | | | 3,057 | | | | 3,464 | | | | 3,387 | |
| Total available for sale | | $ | 162,766 | | | $ | 169,320 | | | $ | 191,120 | | | $ | 188,787 | | | $ | 165,967 | | | $ | 162,258 | |
At September 30, 2009, we believe that it is more likely than not that the Company has the ability and intent to hold the securities with a fair value less than amortized cost until their value has recovered to amortized cost.
The table below sets forth information regarding the amortized cost, weighted average yields and maturities or periods to repricing of our investment portfolio at September 30, 2009:
| | | Amount Due or Repricing within: | |
| | | 1 Year or Less | | | Over 1 to 5 Years | | | Over 5 to 10 Years | | | Over 10 Years | | | Totals | |
| | | Amortized Cost | | | Weighted Average Yield (1) | | | Amortized Cost | | | Weighted Average Yield(1) | | | Amortized Cost | | | Weighted Average Yield (1) | | | Amortized Cost | | | Weighted Average Yield (1) | | | Amortized Cost | | | Weighted Average Yield (1) | |
| | | (dollars in thousands) | |
| Available for sale: | | | | | | | | | | | | | | | | | | | | | | | | | | | | | | |
Obligations of U.S. Government Sponsored Enterprises | | $ | -- | | | | -- | % | | $ | 3,024 | | | | 0.72 | % | | $ | 1,065 | | | | 4.06 | % | | $ | -- | | | | -- | % | | $ | 4,089 | | | | 1.59 | % |
| Mortgage-backed securities | | | 25,138 | | | | 3.14 | | | | 8,498 | | | | 3.72 | | | | 26,232 | | | | 4.50 | | | | 98,809 | | | | 4.68 | | | | 158,677 | | | | 4.35 | |
| Total available for sale | | $ | 25,138 | | | | 3.14 | % | | $ | 11,522 | | | | 2.93 | % | | $ | 27,297 | | | | 4.48 | % | | $ | 98,809 | | | | 4.68 | % | | $ | 162,766 | | | | 4.29 | % |
________
| (1) | Interest and dividends are reported on a tax-equivalent basis. At September 30, 2009, the Company held no tax-exempt investment securities. For available for sale securities carried at fair value, the weighted average yield is computed using amortized cost. |
The following table sets forth certain information with respect to each category which had an aggregate book value in excess of 10% of our total equity at the date indicated.
| | | At September 30, 2009 | |
| | | Amortized Cost | | | Fair Value | |
| | | (in thousands) | |
| Available for sale: | | | | | | |
| Mortgage-backed securities: | | | | | | |
| Fannie Mae | | $ | 70,888 | | | $ | 73,769 | |
| Freddie Mac | | | 85,131 | | | | 88,742 | |
Federal Home Loan Bank Stock. As a member of the FHLB of Seattle, the Bank is required to own its capital stock. The amount of stock the Bank holds is based on percentages specified by the FHLB of Seattle on outstanding advances. The redemption of any excess stock the Bank holds is at the discretion of the FHLB of Seattle. At September 30, 2009, the carrying value of FHLB stock was $10.3 million.
Bank-Owned Life Insurance. We have purchased bank-owned life insurance policies ("BOLI") to offset employee benefit costs. At September 30, 2009, we had a $12.0 million investment in “general account” life insurance contracts. The potential death benefits as of September 30, 2009 were $23.2 million. All of the insurance companies that issued the policies in the Bank’s BOLI portfolio had investment grade ratings by Standard & Poor’s and A.M Best at September 30, 2009.
Deposit Activities and Other Sources of Funds
General. Deposits are the major source of our funds for lending and other investment purposes. Scheduled loan repayments are a relatively stable source of funds, while deposit inflows and outflows and loan prepayments are influenced significantly by general interest rates and market conditions. Borrowings from the FHLB of Seattle are used to supplement the availability of funds from other sources and also as a source of term funds to assist in the management of interest rate risk.
Changes in our deposit composition reflect our strategy to reduce reliance on certificates of deposit with certificates of deposit accounting for 44.5% of the deposit portfolio at September 30, 2009, compared to 47.6% at September 30, 2008. Interest-bearing and noninterest-bearing checking, savings and money market accounts comprise the balance of total deposits, which we believe have greater stability and higher profitability than certificates of deposit. We rely on marketing activities, convenience, customer service and the availability of a broad range of competitively priced deposit products and services to attract and retain customer deposits.
Deposits. With the exception of our Health Savings Accounts, which totaled $21.2 million at September 30, 2009, substantially all of our depositors are residents and businesses located in the states of Idaho and Oregon. Deposits are attracted from within our market areas through the offering of a broad selection of deposit instruments, including checking accounts, money market deposit accounts, savings accounts and certificates of deposit with a variety of rates and terms to maturity. Deposit account terms vary according to the minimum balance required, the time periods the funds must remain on deposit and the interest rate, among other factors.
At September 30, 2009, we had $83.5 million of jumbo ($100,000 or more) certificates of deposit, which are primarily from local customers, representing 16.2% of total deposits at that date. At September 30, 2009, we had $100,000 of brokered certificates of deposit, which were assumed in the Acquisition.
Our deposit pricing philosophy is to generally maintain deposit rates at levels that are competitive with other local financial institutions. Historically, we have been able to retain a significant amount of deposits as they mature. However, recent deterioration in credit quality and capital levels at many of our competitors have limited their sources of wholesale funding, which has resulted in a highly price-competitive market for retail certificates of deposit. These rates currently exceed alternative costs of borrowings and are high compared to historical spreads to U.S. Treasury note rates. Additionally, since loan demand has slowed in 2009, we have been reluctant to offer rates
in excess of wholesale borrowing costs. This has resulted in some deposit runoff as customers are moving their maturing balances to competitors at a higher pace than the Bank has historically experienced.
Deposit Activities. The following table sets forth the total deposit activities of Home Federal Bank for the periods indicated:
| | | Year Ended September 30, | |
| | | 2009 | | | 2008 | | | 2007 | |
| | | (in thousands) | |
| | | | | | | | | | |
| Beginning balance | | $ | 372,925 | | | $ | 404,609 | | | $ | 430,281 | |
Deposits assumed in the Acquisition, at fair value | | | 143,459 | | | | -- | | | | -- | |
Net change in deposits before interest credited | | | (8,309 | ) | | | (42,230 | ) | | | (38,025 | ) |
| Interest credited | | | 6,783 | | | | 10,546 | | | | 12,353 | |
| Net increase (decrease) in deposits | | | 141,933 | | | | (31,684 | ) | | | (25,672 | ) |
| Ending balance | | $ | 514,858 | | | $ | 372,925 | | | $ | 404,609 | |
Time Deposits by Rate. The following table sets forth the time deposits in Home Federal Bank classified by rates as of the dates indicated:
| | | | At September 30, | |
| | | | 2009 | | | 2008 | | | 2007 | |
| | | | (in thousands) | |
| | | | | | | | | | | |
| | 0.00 - 0.99% | | | $ | 9,906 | | | $ | 11 | | | $ | 374 | |
| | 1.00 - 1.99 | | | | 71,921 | | | | -- | | | | 5 | |
| | 2.00 - 2.99 | | | | 68,327 | | | | 49,598 | | | | 2,257 | |
| | 3.00 - 3.99 | | | | 42,898 | | | | 54,669 | | | | 24,012 | |
| | 4.00 - 4.99 | | | | 27,389 | | | | 55,050 | | | | 63,632 | |
| | 5.00 - 5.99 | | | | 7,544 | | | | 16,234 | | | | 123,617 | |
| | 6.00 - 8.99 | | | | 912 | | | | 1,842 | | | | 1,294 | |
| Total | | | $ | 228,897 | | | $ | 177,404 | | | $ | 215,191 | |
Time Deposits by Maturity. The following table sets forth the amount and maturities of time deposits at September 30, 2009:
| | | | Amounts Due | |
| | | | | | | 1-2 | | | | | | 3-4 | | | After | | | Total | |
| | | | (in thousands) | |
| | 0.00 – 1.99% | | | $ | 72,731 | | | $ | 7,087 | | | $ | 103 | | | $ | 1,906 | | | $ | -- | | | $ | 81,827 | |
| | 2.00 - 2.99 | | | | 42,241 | | | | 16,744 | | | | 7,141 | | | | 1,692 | | | | 509 | | | | 68,327 | |
| | 3.00 - 3.99 | | | | 24,083 | | | | 4,385 | | | | 2,648 | | | | 2,501 | | | | 9,281 | | | | 42,898 | |
| | 4.00 - 4.99 | | | | 18,860 | | | | 3,668 | | | | 1,631 | | | | 1,828 | | | | 1,402 | | | | 27,389 | |
| | 5.00 - 5.99 | | | | 3,264 | | | | 2,928 | | | | 1,346 | | | | 5 | | | | 1 | | | | 7,544 | |
| | 6.00 - 8.99 | | | | 790 | | | | 9 | | | | 113 | | | | -- | | | | -- | | | | 912 | |
| Total | | | $ | 161,969 | | | $ | 34,821 | | | $ | 12,982 | | | $ | 7,932 | | | $ | 11,193 | | | $ | 228,897 | |
The following table sets forth information concerning our time deposits and other deposits at September 30, 2009:
| | | | | | | | | |
Weighted Average Interest Rate | | Original Term | | Category | | Amount, in thousands | | Percentage of Total Deposits |
| | | | | | | | | |
| | | | | | | | | |
| 0.65% | | N/A | | Savings deposits | | $ 41,757 | | 8.11% |
| 0.56 | | N/A | | Interest-bearing demand deposits | | 78,393 | | 15.23 |
| -- | | N/A | | Noninterest-bearing demand deposits | | 68,155 | | 13.24 |
| 1.00 | | N/A | | Money market accounts | | 76,408 | | 14.84 |
| 0.91 | | N/A | | Health savings accounts | | 21,248 | | 4.13 |
| | | | | | | | | |
| | | | | Certificates of Deposit | | | | |
| 1.97 | | 1-12 months | | Fixed term, fixed rate | | 113,840 | | 22.10 |
| 2.92 | | 13-24 months | | Fixed term, fixed rate | | 59,798 | | 11.61 |
| 3.65 | | 25-36 months | | Fixed term, fixed rate | | 10,174 | | 1.98 |
| 3.77 | | 37-60 months | | Fixed term, fixed rate | | 42,096 | | 8.18 |
| 2.35 | | Over 60 months | | Fixed term, fixed rate | | 2,989 | | 0.58 |
| | | | | Total certificates of deposit | | 228,897 | | 44.45 |
| | | | | Total deposits | | $ 514,858 | | 100.00% |
The following table indicates the amount of jumbo certificates of deposit by time remaining until maturity as of September 30, 2009. Jumbo certificates of deposit are certificates in amounts of $100,000 or more:
| Maturity Period | | Certificates of Deposit of $100,000 or More | |
| | | (in thousands) | |
| | | | |
| Three months or less | | $ | 23,893 | |
| Over three through six months | | | 16,573 | |
| Over six through twelve months | | | 18,109 | |
| Over twelve months | | | 24,963 | |
| Total | | $ | 83,538 | |
| | | | | |
Deposit Flow. The following table sets forth the balances of deposits in the various types of accounts offered by Home Federal Bank at the dates indicated:
| | At September 30, | |
| | 2009 | | 2008 | | 2007 | |
| | Amount | | Percent Of Total | | Increase/ (Decrease) | | Amount | | Percent Of Total | | Increase/ (Decrease) | | Amount | | Percent Of Total | | Increase/ (Decrease) | |
| | (dollars in thousands) | |
Savings deposits | $41,757 | | 8.11 | % | $15,348 | | $26,409 | | 7.08 | % | $3,293 | | $23,116 | | 5.71 | % | $(539) | |
| Demand deposits | 146,548 | | 28.47 | | 49,700 | | 96,848 | | 25.98 | | (281 | ) | 97,129 | | 24.01 | | (11,413) | |
| Money market accounts | 76,408 | | 14.84 | | 25,266 | | 51,142 | | 13.71 | | 5,441 | | 45,701 | | 11.30 | | 12,278 | |
| Health savings accounts | 21,248 | | 4.13 | | 126 | | 21,122 | | 5.66 | | (2,350 | ) | 23,472 | | 5.80 | | (7,465) | |
Fixed rate certificates that mature in the year ending: Within 1 year | 161,969 | | 31.46 | | 28,646 | | 133,323 | | 35.75 | | (39,261 | ) | 172,584 | | 42.65 | | (15,877) | |
After 1 year, but within 2 years | 34,821 | | 6.76 | | 9,127 | | 25,694 | | 6.89 | | 647 | | 25,047 | | 6.19 | | (3,360) | |
After 2 years, but within 5 years | 31,890 | | 6.19 | | 13,678 | | 18,212 | | 4.88 | | 847 | | 17,365 | | 4.29 | | 768 | |
| After 5 years | 217 | | 0.04 | | 42 | | 175 | | 0.05 | | (20 | ) | 195 | | 0.05 | | (64) | |
| | | | | | | | | | | | | | | | | | | |
| Total | $514,858 | | 100.00 | % | $141,933 | | $372,925 | | 100.00 | % | $(31,684 | ) | $404,609 | | 100.00 | % | $(25,672) | |
| | | | | | | | | | | | | | | | | | | |
| | | | | | | | | | | | | | | | | | | |
Borrowings. We use advances from the FHLB of Seattle to meet short-term deposit withdrawal requirements and also to provide longer term funding to better match the duration of selected loan and investment maturities. As one of our capital management strategies, we have and may use borrowings from the FHLB to fund the purchase of investment securities and origination of loans in order to increase our net interest income when attractive opportunities exist.
As a member of the FHLB, we are required to own its capital stock. Advances are made individually under various terms pursuant to several different credit programs, each with its own interest rate and range of maturities. We maintain a committed credit facility with the FHLB that provides for immediately available advances up to an aggregate of 40% of the Bank’s total assets. At September 30, 2009, our outstanding advances from the FHLB totaled $82.9 million, with additional borrowing capacity of $134.4 million. Our advances with the FHLB are collateralized by our FHLB stock and through a blanket pledge on our first lien one-to-four family residential real estate loan portfolio and our securities portfolio.
The FHLB of Seattle has reported a risk-based capital deficiency under the regulations of the Federal Housing Finance Agency (“FHFA”), its primary regulator. As a result, the FHLB has stopped paying a dividend and stated that it would suspend the repurchase and redemption of outstanding common stock until its retained earnings deficiency was reclaimed. The Bank is continually monitoring this issue. The FHLB has communicated to its members, including us, that it believes the calculation of risk-based capital under the current rules of the FHFA significantly overstates the market and credit risk of the FHLB’s private label mortgage backed securities in the current market environment and that it has enough capital to cover the risks reflected in the FHLB’s balance sheet. As a result, the Bank has not recorded an other-than-temporary impairment on its investment in FHLB stock. However, continued deterioration in the FHLB’s financial position may result in impairment in the value of those securities, or the requirement that the Bank contribute additional funds to recapitalize the FHLB, or reduce the Bank’s ability to borrow funds from the FHLB, which may impair the Bank’s ability to meet liquidity demands.
Other borrowings include securities sold under obligations to repurchase, also known as repurchase agreements. We originate repurchase agreements directly with our commercial and retail customers and collateralize these borrowings with securities issued by U.S. Government sponsored enterprises. Other borrowings were $1.8 million at September 30, 2009.
The following table sets forth information regarding our borrowings at the end of and during the periods indicated. The table includes both long- and short-term borrowings:
| | | Year Ended September 30, | |
| | | 2009 | | | 2008 | | | 2007 | |
| | | (dollars in thousands) | |
Maximum amount of borrowings outstanding at any month end | | $ | 137,000 | | | $ | 181,000 | | | $ | 223,000 | |
| | | | | | | | | | | | | |
Approximate average borrowings outstanding | | | 112,000 | | | | 158,000 | | | | 202,000 | |
| | | | | | | | | | | | | |
Approximate weighted average rate paid on FHLB advances and other borrowings | | | 4.39 | % | | | 4.60 | % | | | 4.49 | % |
| | | At September 30, | |
| | | 2009 | | | 2008 | | | 2007 | |
| | | (dollars in thousands) | |
Balance outstanding at end of period: FHLB advances and other borrowings | | $ | 84,737 | | | $ | 136,972 | | | $ | 180,730 | |
| | | | | | | | | | | | | |
Weighted average rate at end of period on: FHLB advances and other borrowings | | | 4.00 | % | | | 4.68 | % | | | 4.55 | % |
At September 30, 2009, we also had access to the Federal Reserve Bank of San Francisco’s discount window. No funds were drawn on this facility at September 30, 2009.
Competition
We face intense competition in originating loans and in attracting deposits within our targeted geographic markets. We compete by leveraging our full service delivery capability comprised of 23 convenient branch locations, including five branches located inside Wal-Mart Superstores offering extended banking hours, call center and Internet banking, and consistently delivering high-quality, individualized service to our customers that result in a high level of customer satisfaction. Our key competitors are U.S. Bank, Wells Fargo, Key Bank and JPMorgan Chase. These competitors control approximately 56% of the deposit market with $4.2 billion of the $7.5 billion in FDIC-insured deposits in our market areas as of June 30, 2009. Aside from these traditional competitors, credit unions, insurance companies and brokerage firms are an increasingly competing challenge for consumer deposit relationships.
Our competition for loans comes principally from mortgage bankers, commercial banks, credit unions and finance companies. Several other financial institutions, including those previously mentioned, have greater resources than us and compete with us for lending business in our targeted market areas. Among the advantages of some of these institutions are their ability to make larger loans, finance extensive advertising campaigns, access lower cost funding sources and allocate their investment assets to regions of highest yield and demand. This competition for the origination of loans may limit our future growth and earnings prospects.
Subsidiaries and Other Activities
Home Federal Bank is the only subsidiary of Home Federal Bancorp, Inc., and has one wholly-owned subsidiary of its own, Idaho Home Service Corporation, which was established in 1981 as Home Service Corporation for the purpose of facilitating various business activities. Since 2000, Idaho Home Service Corporation has been inactive.
Personnel
At September 30, 2009, we had 266 full-time equivalent employees. Our employees are not represented by any collective bargaining group. We believe our relationship with our employees is good.
Internet Website
We maintain a website with the address www.myhomefed.com. The information contained on our website is not included as a part of, or incorporated by reference into, this Annual Report on Form 10-K. Other than an investor’s own Internet access charges, we make available free of charge through our website our Annual Report on Form 10-K, Proxy Statements, quarterly reports on Form 10-Q and current reports on Form 8-K, and amendments to these reports, as soon as reasonably practicable after we have electronically filed such material with, or furnished such material to, the Securities and Exchange Commission. We have also posted our code of ethics and board committee charters on this site.
HOW WE ARE REGULATED
The following is a brief description of certain laws and regulations which are applicable to Home Federal Bancorp and Home Federal Bank. The description of these laws and regulations, as well as descriptions of laws and regulations contained elsewhere in this annual report, does not purport to be complete and is qualified in its entirety by reference to the applicable laws and regulations. Legislation is introduced from time to time in the United States Congress that may affect our operations. In addition, the regulations governing us may be amended from time to time by the respective regulators. Any such legislation or regulatory changes in the future could adversely affect us. We cannot predict whether any such changes may occur.
Regulation and Supervision of Home Federal Bank
General. Home Federal Bank, as a federally chartered savings association, is subject to extensive regulation, examination and supervision by the Office of Thrift Supervision, as its primary federal regulator, and the Federal Deposit Insurance Corporation as its deposit insurer. Home Federal Bank is a member of the Federal Home Loan Bank System and its deposit accounts are insured up to applicable limits by the Deposit Insurance Fund administered by the FDIC. Home Federal Bank must file reports with the Office of Thrift Supervision and the FDIC concerning its activities and financial condition in addition to obtaining regulatory approvals prior to entering into certain transactions such as mergers with, or acquisitions of, other financial institutions. There are periodic examinations by the Office of Thrift Supervision and, under certain circumstances, the FDIC to evaluate Home Federal Bank’s safety and soundness and compliance with various regulatory requirements. This regulatory structure is intended primarily for the protection of the insurance fund and depositors. The regulatory structure also gives the regulatory authorities extensive discretion in connection with their supervisory and enforcement activities and examination policies, including policies with respect to the classification of assets and the establishment of adequate loan loss reserves for regulatory purposes. Any change in such policies, whether by the Office of Thrift Supervision, the FDIC or Congress, could have a material adverse impact on Home Federal Bancorp and Home Federal Bank and their operations.
Office of Thrift Supervision. In addition to the authority of the Office of Thrift Supervision and the authority of the FDIC to conduct examinations, the Office of Thrift Supervision also has extensive enforcement authority over all savings associations, including Home Federal Bank. This enforcement authority includes, among other things, the ability to assess civil money penalties, issue cease-and-desist or removal orders and initiate injunctive actions. In general, these enforcement actions may be initiated for violations of laws and regulations and unsafe or unsound practices. Other actions or inactions may provide the basis for enforcement action, including misleading or untimely reports filed with the Office of Thrift Supervision. Except under certain circumstances, public disclosure of final enforcement actions by the Office of Thrift Supervision is required.
The investment, lending and branching authority of Home Federal Bank is prescribed by federal laws and it is prohibited from engaging in any activities not permitted by these laws. For example, no savings association may invest in non-investment grade corporate debt securities. In addition, the permissible level of investment by federal institutions in loans secured by non-residential real estate property may not exceed 400% of total capital, except with the approval of the Office of Thrift Supervision. Federal savings associations are also generally authorized to branch nationwide. Home Federal Bank is in compliance with the noted restrictions.
All savings associations are required to pay assessments to the Office of Thrift Supervision to fund the agency’s operations. The general assessments, paid on a semi-annual basis, are determined based on the savings association’s total assets, including consolidated subsidiaries. Home Federal Bank’s Office of Thrift Supervision assessment for the fiscal year ended September 30, 2009 was $161,000.
Home Federal Bank’s general permissible lending limit for loans-to-one-borrower is equal to the greater of $500,000 or 15% of unimpaired capital and surplus (except for loans fully secured by certain readily marketable collateral, in which case this limit is increased to 25% of unimpaired capital and surplus). At September 30, 2009, Home Federal Bank’s lending limit under this restriction was $23.4 million and, at that date, Home Federal Bank’s largest aggregate of loans to one borrower was $5.3 million, which were performing according to their original terms.
The Office of Thrift Supervision, as well as the other federal banking agencies, has adopted guidelines establishing safety and soundness standards on such matters as loan underwriting and documentation, asset quality, earnings standards, internal controls and audit systems, interest rate risk exposure and compensation and other employee benefits. Any institution that fails to comply with these standards must submit a compliance plan.
Federal Home Loan Bank System. Home Federal Bank is a member of the Federal Home Loan Bank of Seattle, which is one of 12 regional Federal Home Loan Banks that administer the home financing credit function of savings associations. Each Federal Home Loan Bank serves as a reserve or central bank for its members within its assigned region. It is funded primarily from proceeds derived from the sale of consolidated obligations of the Federal Home Loan Bank System. It makes loans or advances to members in accordance with policies and procedures, established by the board of directors of the Federal Home Loan Bank, which are subject to the oversight of the Federal Housing Finance Board. All advances from the Federal Home Loan Bank are required to be fully secured by sufficient collateral as determined by the Federal Home Loan Bank. In addition, all long-term advances are required to provide funds for residential home financing. At September 30, 2009, Home Federal Bank had $82.9 million of outstanding advances from the Federal Home Loan Bank of Seattle under an available credit facility of $217.4 million, which is limited to available collateral. See Business – Deposit Activities and Other Sources of Funds – Borrowings.
As a member, Home Federal Bank is required to purchase and maintain stock in the Federal Home Loan Bank of Seattle. At September 30, 2009, Home Federal Bank had $10.3 million in Federal Home Loan Bank stock, which was in compliance with this requirement.
Under federal law, the Federal Home Loan Banks are required to provide funds for the resolution of troubled savings associations and to contribute to housing programs through direct loans or interest subsidies on advances targeted for community investment and low-to-moderate income housing projects. These contributions have affected adversely the level of Federal Home Loan Bank dividends paid and could continue to do so in the future. These contributions could also have an adverse effect on the value of Federal Home Loan Bank stock in the future. A reduction in value of Home Federal Bank’s Federal Home Loan Bank stock may result in a corresponding reduction in Home Federal Bank’s capital.
Federal Deposit Insurance Corporation. Home Federal Bank is a member of the Deposit Insurance Fund (“DIF”), which is administered by the FDIC.
Deposits are insured up to the applicable limits by the FDIC, backed by the full faith and credit of the United States Government. Under new legislation, during the period from October 3, 2008 through December 31, 2013, the basic deposit insurance limit is $250,000, instead of the $100,000 limit in effect previously.
The FDIC assesses deposit insurance premiums on each FDIC-insured institution quarterly based on annualized rates for one of four risk categories applied to its deposits subject to certain adjustments. Each institution is assigned to one of four risk categories based on its capital, supervisory ratings and other factors. Well capitalized institutions that are financially sound with only a few minor weaknesses are assigned to Risk Category I. Risk Categories II, III and IV present progressively greater risks to the DIF. Under FDIC’s risk-based assessment rules, effective April 1, 2009, the initial base assessment rates prior to adjustments range from 12 to 16 basis points for Risk Category I, and are 22 basis points for Risk Category II, 32 basis points for Risk Category III, and 45 basis points for Risk Category IV. Initial base assessment rates are subject to adjustments based on an institution’s unsecured debt, secured liabilities and brokered deposits, such that the total base assessment rates after adjustments range from 7 to 24 basis
points for Risk Category I, 17 to 43 basis points for Risk Category II, 27 to 58 basis points for Risk Category III, and 40 to 77.5 basis points for Risk Category IV. Rates increase uniformly by 3 basis points effective January 1, 2011.
In addition to the regular quarterly assessments, as a result of losses and projected losses attributed to failed institutions, the FDIC imposed a special assessment of 5 basis points on the amount of each depository institution’s assets reduced by the amount of its Tier 1 capital (not to exceed 10 basis points of its assessment base for regular quarterly premiums) as of June 30, 2009, which was collected on September 30, 2009, and totaled $251,000.
As a result of a decline in the reserve ratio (the ratio of the net worth of the DIF to estimated insured deposits) and concerns about expected failure costs and available liquid assets in the DIF, the FDIC has adopted a rule requiring each insured institution to prepay on December 30, 2009 the estimated amount of its quarterly assessments for the fourth quarter of 2009 and all quarters through the end of 2012 (in addition to the regular quarterly assessment for the third quarter which is due on December 30, 2009). The prepaid amount is recorded as an asset with a zero risk weight and the institution will continue to record quarterly expenses for deposit insurance. For purposes of calculating the prepaid amount, assessments are measured at the institution’s assessment rate as of September 30, 2009, with a uniform increase of 3 basis points effective January 1, 2011, and are based on the institution’s assessment base for the third quarter of 2009, with growth assumed quarterly at annual rate of 5%. If events cause actual assessments during the prepayment period to vary from the prepaid amount, institutions will pay excess assessments in cash or receive a rebate of prepaid amounts not exhausted after collection of assessments due on June 13, 2013, as applicable. Collection of the prepayment does not preclude the FDIC from changing assessment rates or revising the risk-based assessment system in the future. The rule includes a process for exemption from the prepayment for institutions whose safety and soundness would be affected adversely. Home Federal Bank estimates this prepayment of assessments will result in a cash payment of $2.4 million in December 2009.
The FDIC estimates that the reserve ratio will reach the designated reserve ratio of 1.15% by 2017 as required by statute.
The FDIC may terminate the deposit insurance of any insured depository institution, including Home Federal Bank, if it determines after a hearing that the institution has engaged in unsafe or unsound practices, is in an unsafe or unsound condition to continue operations or has violated any applicable law, regulation, rule, order or condition imposed by the FDIC. It also may suspend deposit insurance temporarily during the hearing process for the permanent termination of insurance, if the institution has no tangible capital. If insurance of accounts is terminated, the accounts at the institution at the time of the termination, less subsequent withdrawals, shall continue to be insured for a period of six months to two years, as determined by the FDIC. Management of Home Federal Bank is not aware of any practice, condition or violation that might lead to termination of its deposit insurance.
Capital Requirements. The Office of Thrift Supervision’s capital regulations require federal savings associations to meet three minimum capital standards, which are ratios of capital to assets: a 1.5% tangible capital ratio, a 4% leverage ratio (3% for institutions receiving the highest rating on the CAMELS examination rating system) and an 8% total risk-based capital ratio. The leverage ratio is the ratio of Tier 1 (core) capital to assets. In addition, the prompt corrective action standards discussed below also establish, in effect, a minimum 2% tangible capital standard, a 4% leverage ratio (3% for institutions receiving the highest rating on the CAMELS system), a 4% Tier 1 risk-based capital standard, and an 8% total risk-based capital ratio. The Office of Thrift Supervision regulations also require that, in meeting the tangible, leverage and risk-based capital standards, institutions must generally deduct investments in and loans to subsidiaries engaged in activities as principal that are not permissible for a national bank. The Office of Thrift Supervision also has authority to establish individual minimum capital requirements in appropriate cases upon a determination that an institution’s capital level is or may become inadequate in light of the particular circumstances.
For the purposes of risk-based capital standards, all assets, including certain off-balance sheet assets, recourse obligations, residual interests and direct credit substitutes, are multiplied by a risk-weight factor of 0% to 100%, assigned by the Office of Thrift Supervision capital regulation based on the risks believed inherent in the type of asset. Assets covered under a loss share agreement with the FDIC and the FDIC indemnification asset are assigned a 20% risk-weight factor. Tier 1 (core) capital is defined as common stockholders’ equity (including retained earnings), certain noncumulative perpetual preferred stock and related surplus and minority interests in equity accounts of consolidated subsidiaries, less intangibles other than certain mortgage servicing rights and credit card
relationships. Total risk-based capital is the sum of Tier 1 capital and supplementary capital. The components of supplementary capital currently include cumulative preferred stock, long-term perpetual preferred stock, mandatory convertible securities, subordinated debt and intermediate preferred stock, the allowance for loan and lease losses limited to a maximum of 1.25% of risk-weighted assets and up to 45% of unrealized gains on available-for-sale equity securities with readily determinable fair market values. Overall, the amount of supplementary capital included as part of total capital cannot exceed 100% of Tier 1 capital. At September 30, 2009, Home Federal Bank exceeded each of these capital requirements.
Prompt Corrective Action. The Office of Thrift Supervision is required to take certain supervisory actions against undercapitalized savings associations, the severity of which depends upon the institution’s degree of undercapitalization. Generally, an institution that has a ratio of total capital to risk-weighted assets of less than 8%, a ratio of Tier 1capital to risk-weighted assets of less than 4%, or a ratio of core capital to total assets of less than 4% (3% or less for institutions with the highest examination rating) is considered to be “undercapitalized.” An institution that has a total risk-based capital ratio less than 6%, a Tier 1 capital ratio of less than 3% or a leverage ratio that is less than 3% is considered to be “significantly undercapitalized” and an institution that has a tangible capital to assets ratio equal to or less than 2% is deemed to be “critically undercapitalized.” Subject to a narrow exception, the Office of Thrift Supervision is required to appoint a receiver or conservator for a savings association that is “critically undercapitalized.” Office of Thrift Supervision regulations also require that a capital restoration plan be filed with the Office of Thrift Supervision within 45 days of the date a savings association receives notice that it is “undercapitalized,” “significantly undercapitalized” or “critically undercapitalized.” In addition, numerous mandatory supervisory actions become immediately applicable to an undercapitalized institution, including, but not limited to, increased monitoring by regulators and restrictions on growth, capital distributions and expansion. “Significantly undercapitalized” and “critically undercapitalized” institutions are subject to more extensive mandatory regulatory actions. The Office of Thrift Supervision also could take any one of a number of discretionary supervisory actions, including the issuance of a capital directive and the replacement of senior executive officers and directors.
At September 30, 2009, Home Federal Bank was categorized as “well capitalized” under the prompt corrective action regulations of the Office of Thrift Supervision with a Tier 1 capital ratio of 19.61%, a total risk-based capital ratio of 34.89%, and a Tier 1 risk-based capital ratio of 33.57%. The Office of Thrift Supervision defines “well capitalized” to mean that an institution has a Tier 1 capital ratio of at least 5.0%, a total risk-based capital ratio of at least 10.0% and a Tier 1 risk-based capital ratio of at least 6.0%, and is not subject to a written agreement, order or directive requiring it to maintain any specific capital measure. An “adequately capitalized” institution is one that does not meet the definition of “well capitalized” and has a Tier 1 capital ratio of at least 4.0%, a total risk-based capital ratio of at least 8.0% and Tier 1 risk-based capital ratio of at least 4.0%. The Office of Thrift Supervision may reclassify an institution to a lower capital category based on various supervisory criteria. An “adequately capitalized” institution is subject to restrictions on deposit rates under the FDIC’s brokered deposit rule which covers, in some circumstances, deposits solicited directly by the institution.
Qualified Thrift Lender Test. All savings associations, including Home Federal Bank, are required to meet a qualified thrift lender (“QTL”) test to avoid certain restrictions on their operations. This test requires a savings association to have at least 65% of its total assets, as defined by regulation, in qualified thrift investments on a monthly average for nine out of every 12 months on a rolling basis. As an alternative, the savings association may maintain 60% of its assets in those assets specified in Section 7701(a)(19) of the Internal Revenue Code. Under either test, such assets primarily consist of residential housing related loans and investments.
A savings association that fails to meet the QTL is subject to certain operating restrictions and may be required to convert to a bank charter. The holding company of such an institution may be required to register as, and become subject to the capital requirement and activities restrictions applicable to, a bank holding company. As of September 30, 2009, Home Federal Bank maintained 78.25% of its portfolio assets in qualified thrift investments and, therefore, met the qualified thrift lender test.
Limitations on Capital Distributions. Office of Thrift Supervision regulations impose various restrictions on savings associations with respect to their ability to make distributions of capital, which include dividends, stock redemptions or repurchases, cash-out mergers and other transactions charged to the capital account. Generally, savings associations, such as Home Federal Bank, that before and after the proposed distribution are well-
capitalized, may make capital distributions during any calendar year equal to up to 100% of net income for the calendar year-to-date plus retained net income for the two preceding years. However, an institution deemed to be in need of more than normal supervision by the Office of Thrift Supervision may have its dividend authority restricted by the Office of Thrift Supervision. Home Federal Bank may pay dividends to Home Federal Bancorp in accordance with this general authority.
Savings associations proposing to make any capital distribution need not submit written notice to the Office of Thrift Supervision prior to such distribution unless they are a subsidiary of a holding company or would not remain well-capitalized following the distribution. Savings associations that do not, or would not meet their current minimum capital requirements following a proposed capital distribution or propose to exceed these net income limitations, must obtain Office of Thrift Supervision approval prior to making such distribution. The Office of Thrift Supervision may object to the distribution during that 30-day period based on safety and soundness concerns.
Temporary Liquidity Guarantee Program. Following a systemic risk determination, the FDIC established its Temporary Liquidity Guarantee Program (“TLGP”) in October 2008. Under the interim rule for the TLGP, there are two parts to the program: the Debt Guarantee Program (“DGP”) and the Transaction Account Guarantee Program (“TAGP”). Eligible entities generally are participants unless they exercised opt out rights in a timely fashion.
For the DGP, eligible entities are generally US bank holding companies, savings and loan holding companies, and FDIC-insured institutions. Under the DGP, the FDIC guarantees new senior unsecured debt certain convertible debt of an eligible entity issued not later than October 31, 2009. Home Federal Bancorp and Home Federal Bank opted out of the DGP.
For the TAGP, eligible entities are FDIC-insured institutions. Under the TAGP, the FDIC provides unlimited deposit insurance coverage for noninterest-bearing transaction accounts (typically business checking accounts), NOW accounts bearing interest at 0.50% or less, and certain funds swept into noninterest-bearing savings accounts. Other NOW accounts and money market deposit accounts are not covered. TAGP coverage lasts until December 31, 2009 and, unless the participant has opted out of the extension period, during the extension period of January 1, 2010 through June 30, 2010. Participating institutions pay fees of 10 basis points (annualized) on the balance of each covered account in excess of $250,000 during the period through December 31, 2009. During the extension period, such fees are 15 basis points for institutions in Risk Category I, 20 basis points for those in Risk Category II and 25 basis points for those in Risk Categories III and IV (Risk Categories are those assigned for deposit insurance purposes. Home Federal Bank elected to participate in the TAGP and elected to extend its participation until June 30, 2010.
Activities of Savings Associations and their Subsidiaries. When a savings association establishes or acquires a subsidiary or elects to conduct any new activity through a subsidiary that it controls, the savings association must notify the FDIC and the Office of Thrift Supervision 30 days in advance and provide the information each agency may, by regulation, require. Savings associations also must conduct the activities of subsidiaries in accordance with existing regulations and orders.
The Office of Thrift Supervision may determine that the continuation by a savings association of its ownership control of, or its relationship to, the subsidiary constitutes a serious risk to the safety, soundness or stability of the institution or is inconsistent with sound banking practices or with the purposes of the Federal Deposit Insurance Act. Based upon that determination, the FDIC or the Office of Thrift Supervision has the authority to order the savings association to divest itself of control of the subsidiary. The FDIC also may determine by regulation or order that any specific activity poses a serious threat to the Depositors Insurance Fund. If so, it may require that no member of the Depositors Insurance Fund engage in that activity directly.
Transactions with Affiliates and Insiders. Home Federal Bank’s authority to engage in transactions with “affiliates” is limited by Office of Thrift Supervision regulations and by Sections 23A and 23B of the Federal Reserve Act as implemented by the Federal Reserve Board’s Regulation W. The term “affiliates” for these purposes generally means any company that controls or is under common control with an institution. Home Federal Bancorp and its non-savings association subsidiaries are affiliates of Home Federal Bank. Federally insured savings associations are subject, with certain exceptions, to restrictions on extensions of credit to their parent holding companies or other affiliates, on investments in the stock or other securities of affiliates and on the taking of such stock or securities as collateral from any borrower. In general, transactions with affiliates must be on terms that are
as favorable to the institution as comparable transactions with non-affiliates. In addition, certain types of transactions are restricted to an aggregate percentage of the institution’s capital. Collateral in specified amounts must usually be provided by affiliates in order to receive loans from an institution. In addition, savings associations are prohibited from lending to any affiliate that is engaged in activities that are not permissible for bank holding companies and no savings association may purchase the securities of any affiliate other than a subsidiary. In addition, these institutions are prohibited from engaging in certain tie-in arrangements in connection with any extension of credit or the providing of any property or service. An institution deemed to be in “troubled condition” must file a notice with the OTS and obtain its non-objection to any transaction with an affiliate (subject to certain exemptions).
The Sarbanes-Oxley Act of 2002 generally prohibits a company from making loans to its executive officers and directors. However, there is a specific exception for loans by a depository institution to its executive officers and directors in compliance with federal banking laws. Under such laws, Home Federal Bank’s authority to extend credit to executive officers, directors and 10% stockholders (“insiders”), as well as entities such persons control, is limited. The law restricts both the individual and aggregate amount of loans Home Federal Bank may make to insiders based, in part, on Home Federal Bank’s capital position and requires certain board approval procedures to be followed. Such loans must be made on terms substantially the same as those offered to unaffiliated individuals and not involve more than the normal risk of repayment. There is an exception for loans made pursuant to a benefit or compensation program that is widely available to all employees of the institution and does not give preference to insiders over other employees. There are additional restrictions applicable to loans to executive officers.
Community Reinvestment Act. Under the Community Reinvestment Act, every Federal Deposit Insurance Corporation-insured institution has a continuing and affirmative obligation consistent with safe and sound banking practices to help meet the credit needs of its entire community, including low–to-moderate income neighborhoods. The Community Reinvestment Act does not establish specific lending requirements or programs for financial institutions nor does it limit an institution’s discretion to develop the types of products and services that it believes are best suited to its particular community, consistent with the Community Reinvestment Act. The Community Reinvestment Act requires the Office of Thrift Supervision, in connection with its examination of Home Federal Bank, to assess the institution’s record of meeting the credit needs of its community and to take such record into account in its evaluation of certain applications, such as a merger or the establishment of a branch, by Home Federal Bank. An unsatisfactory rating may be used as the basis for the denial of an application by the Office of Thrift Supervision. Due to the heightened attention being given to the Community Reinvestment Act in the past few years, Home Federal Bank may be required to devote additional funds for investment and lending in its local community. Home Federal Bank was examined for Community Reinvestment Act compliance and received a rating of “Outstanding” in its latest examination.
Environmental Issues Associated with Real Estate Lending. The Comprehensive Environmental Response, Compensation and Liability Act (“CERCLA”), a federal statute, generally imposes strict liability on all prior and present “owners and operators” of sites containing hazardous waste. However, Congress asked to protect secured creditors by providing that the term “owner and operator” excludes a person whose ownership is limited to protecting its security interest in the site. Since the enactment of the CERCLA, this “secured creditor exemption” has been the subject of judicial interpretations which have left open the possibility that lenders could be liable for cleanup costs on contaminated property that they hold as collateral for a loan. To the extent that legal uncertainty exists in this area, all creditors, including Home Federal Bank, that have made loans secured by properties with potential hazardous waste contamination (such as petroleum contamination) could be subject to liability for cleanup costs, which costs often substantially exceed the value of the collateral property.
Privacy Standards. The Gramm-Leach-Bliley Financial Services Modernization Act of 1999 (“GLBA”), modernized the financial services industry by establishing a comprehensive framework to permit affiliations among commercial banks, insurance companies, securities firms and other financial service providers. Home Federal Bank is subject to Office of Thrift Supervision regulations implementing the privacy protection provisions of the GLBA. These regulations require Home Federal Bank to disclose its privacy policy, including identifying with whom it shares “non-public personal information,” to customers at the time of establishing the customer relationship and annually thereafter.
Other Consumer Protection Laws and Regulations. Home Federal Bank is subject to a broad array of federal and state consumer protection laws and regulations that govern almost every aspect of its business relationships with
consumers. While the list set forth below is not exhaustive, these include the Truth-in-Lending Act, the Truth in Savings Act, the Electronic Fund Transfer Act, the Expedited Funds Availability Act, the Equal Credit Opportunity Act, the Fair Housing Act, the Real Estate Settlement Procedures Act, the Home Mortgage Disclosure Act, the Fair Credit Reporting Act, the Fair Debt Collection Practices Act, the Right to Financial Privacy Act, the Home Ownership and Equity Protection Act, the Consumer Leasing Act, the Fair Credit Billing Act, the Homeowners Protection Act, the Check Clearing for the 21st Century Act, laws governing flood insurance, laws governing consumer protections in connection with the sale of insurance, federal and state laws prohibiting unfair and deceptive business practices, and various regulations that implement some or all of the foregoing. These laws and regulations mandate certain disclosure requirements and regulate the manner in which financial institutions must deal with customers when taking deposits, making loans, collecting loans, and providing other services. Failure to comply with these laws and regulations can subject Home Federal Bank to various penalties, including but not limited to, enforcement actions, injunctions, fines, civil liability, criminal penalties, punitive damages, and the loss of certain contractual rights.
The Americans with Disabilities Act requires employers with 15 or more employees and all businesses operating “commercial facilities” or “public accommodations” to accommodate disabled employees and customers. The Americans with Disabilities Act has two major objectives: (i) to prevent discrimination against disabled job applicants, job candidates and employees, and (ii) to provide disabled persons with ready access to commercial facilities and public accommodations. Commercial facilities, such as Home Federal Bank, must ensure that all new facilities are accessible to disabled persons, and in some instances may be required to adapt existing facilities to make them accessible.
Regulation and Supervision of Home Federal Bancorp
General. Home Federal Bancorp, Inc., is a Maryland corporation and the sole shareholder of Home Federal Bank. Under federal law, Home Federal Bancorp is a nondiversified unitary savings and loan holding company and is registered with the Office of Thrift Supervision. Generally, companies like Home Federal Bancorp that become savings and loan holding companies following the May 4, 1999 grandfather date in the Gramm-Leach-Bliley Act of 1999 may engage only in the activities permitted for financial institution holding companies and certain activities previously permitted under the law for multiple savings and loan holding companies.
As a registered savings and loan holding company, Home Federal Bancorp is required to file reports with the Office of Thrift Supervision and is subject to regulation and examination by the Office of Thrift Supervision. In addition, the Office of Thrift Supervision has examination and enforcement authority over the Company and any of its non-savings association subsidiaries. This regulatory authority permits the Office of Thrift Supervision to restrict or prohibit activities that it determines to be a serious risk to Home Federal Bank and provides protection of the depositors of Home Federal Bank rather than benefitting the stockholders of Home Federal Bancorp. Home Federal Bancorp is also subject to the rules and regulations of the Securities and Exchange Commission under the federal securities laws.
Acquisition of Control. Under the federal Change in Bank Control Act and the Savings and Loan Holding Company Act, a notice or application must be submitted to the Office of Thrift Supervision if any person (including a company), or group acting in concert, seeks to acquire “control” of a savings and loan holding company or savings association. An acquisition of control can occur upon the acquisition of 10% or more of the voting stock of a savings and loan holding company or savings association or as otherwise defined by the Office of Thrift Supervision. In connection with a proposed acquisition of control, the Office of Thrift Supervision takes into consideration certain factors, including the financial and managerial resources of the acquirer and the anti-trust effects of the acquisition. Any company that acquires control will then be subject to regulation as a savings and loan holding company.
Restrictions on Acquisitions. Except under limited circumstances, savings and loan holding companies are prohibited from acquiring, without prior approval of the Director of the Office of Thrift Supervision, (1) control of any other savings association or savings and loan holding company or substantially all the assets thereof or (2) more than 5% of the voting shares of a savings association or holding company thereof which is not a subsidiary. Except with the prior approval of the Director, no director or officer of a savings and loan holding company or person owning or controlling by proxy or otherwise more than 25% of such company’s stock, may acquire control of any savings association, other than a subsidiary savings association, subsidiary of such holding company or of any other savings and loan holding company.
The Director of the Office of Thrift Supervision may approve acquisitions resulting in the formation of a multiple savings and loan holding company which controls savings associations in more than one state if: (1) the multiple savings and loan holding company involved controls a savings association which operated a home or branch office located in the state of the institution to be acquired as of March 5, 1987; (2) the acquirer is authorized to acquire control of the savings association or to operate a home or branch office in the relevant additional state or states pursuant to the emergency acquisition provisions of the Federal Deposit Insurance Act; or (3) the statutes of the state in which the institution to be acquired is located specifically permits a savings association chartered by such state to be acquired by a savings association chartered by the state where the acquiring entity is located (or by a holding company that controls such state-chartered savings associations).
Federal Securities Laws. Home Federal Bancorp’s common stock is registered with the Securities and Exchange Commission under Section 12(b) of the Securities Exchange Act of 1934, as amended, and is subject to information, proxy solicitation, insider trading restrictions and other requirements under the Securities Exchange Act of 1934.
Sarbanes-Oxley Act of 2002. Home Federal Bancorp, as a public company, is subject to the Sarbanes-Oxley Act of 2002. Sarbanes Oxley implements a broad range of corporate governance and accounting measures for public companies designed to promote honesty and transparency in corporate America and better protect investors from corporate wrongdoing. The Sarbanes-Oxley Act of 2002 was signed into law by President Bush on July 30, 2002, in response to public concerns regarding corporate accountability in connection with several accounting scandals. The stated goals of the Sarbanes-Oxley Act are to increase corporate responsibility, to provide for enhanced penalties for accounting and auditing improprieties at publicly traded companies and to protect investors by improving the accuracy and reliability of corporate disclosures pursuant to the securities laws.
TAXATION
Federal Taxation
General. The Company is subject to federal income taxation in the same general manner as other corporations, with some exceptions discussed below. The following discussion of federal taxation is intended only to summarize certain pertinent federal income tax matters and is not a comprehensive description of the tax rules applicable to the Company.
Because the Company owns 100% of the issued and outstanding capital stock of the Bank, the Company and the Bank are members of an affiliated group within the meaning of Section 1504(a) of the Internal Revenue Code, of which group the Company is the common parent corporation. As a result of this affiliation, the Bank is included in the filing of a consolidated federal income tax return with the Company. The parties agree to compensate each other for their individual share of the consolidated tax liability and/or any tax benefits provided by them in the filing of the consolidated federal income tax return.
Method of Accounting. For federal income tax purposes, the Company currently reports its income and expenses on the accrual method of accounting and uses a fiscal year ending on September 30 for filing its federal income tax return.
Minimum Tax. The Internal Revenue Code imposes an alternative minimum tax at a rate of 20% on a base of regular taxable income plus certain tax preferences, called alternative minimum taxable income. The alternative minimum tax is payable to the extent such alternative minimum taxable income is in excess of an exemption amount. Net operating losses can offset no more than 90% of alternative minimum taxable income. Certain payments of alternative minimum tax may be used as credits against regular tax liabilities in future years. Home Federal Bank has not been subject to the alternative minimum tax, nor does it have any such amounts available as credits for carryover.
Net Operating Loss Carryovers. At September 30, 2009, Home Federal Bank had no net operating loss carryforwards or carrybacks for federal income tax purposes.
Corporate Dividends-Received Deduction. Home Federal Bancorp may eliminate from its income dividends received from Home Federal Bank as a wholly-owned subsidiary of new Home Federal Bancorp if it elects to file a consolidated return with Home Federal Bank. The corporate dividends-received deduction is 100%, or 80%, in the case of dividends received from corporations with which a corporate recipient does not file a consolidated tax return, depending on the level of stock ownership of the payer of the dividend. Corporations which own less than 20% of the stock of a corporation distributing a dividend may deduct 70% of dividends received or accrued on their behalf.
State Taxation
Home Federal Bancorp and Home Federal Bank are subject to the general corporate tax provisions of the states of Oregon and Idaho. State corporate income taxes are generally determined under federal tax law with some modifications. Taxable income is taxed at a rate of 7.6% and 6.6% in Idaho and Oregon, respectively. These taxes are reduced by certain credits, primarily the Idaho investment tax credit in the case of Home Federal Bank.
Home Federal Bancorp also is subject to the corporate tax provisions of the state of Maryland.
EXECUTIVE OFFICERS OF THE REGISTRANT
The following table sets forth certain information with respect to the executive officers of the Company and the Bank.
| Name | Age as of September 30, 2009 | Position |
| Company | Bank |
| | | | |
| Len E. Williams | 50 | Director, President and Chief Executive Officer | Director, President and Chief Executive Officer |
| | | | |
| Eric S. Nadeau | 38 | Executive Vice President, Treasurer, Secretary, and Chief Financial Officer | Executive Vice President, Treasurer, Secretary, and Chief Financial Officer |
| | | | |
| Steven K. Eyre | 48 | -- | President – Oregon Region |
| | | | |
| Steven E. Emerson | 39 | -- | Executive Vice President, Commercial Banking Team Lead – Idaho Region |
| | | | |
| Cindy L. Bateman | 48 | -- | Senior Vice President and Chief Credit Officer |
The business experience of each executive officer for at least the past five years is set forth below.
Len E. Williams joined Home Federal Bank as President in September 2006 and was appointed as a director of Home Federal Bank and Home Federal Bancorp in April 2007. Mr. Williams was appointed Chief Executive Officer of the bank and President and Chief Executive Officer of the Company in January 2008. Mr. Williams has over 30 years of commercial banking experience serving in many regional and national leadership roles. Prior to joining Home Federal Bank, Mr. Williams was Senior Vice President and Head of Business Banking with Fifth Third Bank. He was charged with creating and growing the business line and providing leadership over the company’s business banking personnel, processes and products. From 1987 to 2005, he held several management positions with Key Bank, including President of Business Banking from 2003 to 2005 and President of the Colorado District from 1999 to 2003. His prior experience includes regional corporate and commercial banking leadership responsibility. Mr. Williams is a member of the Board of Directors of the Boise Metro Chamber of Commerce and has served as chairman of Junior Achievement and Boys and Girls Clubs. Mr. Williams holds an M.B.A. from the University of Washington and is a graduate of the Pacific Coast Banking School.
Eric S. Nadeau joined the Company in June 2008 as Executive Vice President, Treasurer, Corporate Secretary and Chief Financial Officer of Home Federal Bancorp, Inc., and Home Federal Bank. He was most recently employed by Camco Financial Corporation in Cambridge, Ohio, as its Chief Financial Officer. From January 2003 until February 2006 he was the Chief Financial Officer of Ohio Legacy Corp, and its subsidiary, Ohio Legacy Bank, N.A. His previous experience includes financial management positions with telecommunications and construction equipment companies. Mr. Nadeau was employed by Crowe Horwath from 1993 to 1998 where he provided audit, tax and consulting services to financial institutions in the Midwest. Mr. Nadeau is a certified public accountant and received his Bachelor of Science in Business Administration from the Richard T. Farmer School of Business at Miami University in Oxford, Ohio.
Steven D. Emerson is Executive Vice President and Commercial Banking Team Lead for the Idaho Region of Home Federal Bank. Mr. Emerson joined Home Federal Bank as Senior Vice President and Chief Lending Officer on December 1, 2006. He has over 17 years of experience in commercial banking primarily in the Treasure Valley. He previously served as Vice President and Senior Commercial Lender for Farmers and Merchants Bank, a former local community bank, during 2006. Prior to his employment with Farmers and Merchants Bank, Mr. Emerson served in several positions with Key Bank from 2000 to 2006, including President of the Cincinnati, Ohio market. Mr. Emerson holds an M.B.A. from Northwest Nazarene University. Mr. Emerson has been active with the Better Business Bureau, Certified Development Company, Boise Kiwanis and the March of Dimes.
Steven K. Eyre has been the President of the Central Oregon Region of Home Federal Bank since October 2009. Mr. Eyre was Executive Vice President/Consumer Banking of Home Federal Bank until his appointment in October 2009. Mr. Eyre previously served as Market Executive, Business Banking, for Bank of America in upstate New York, and has more than 25 years of banking experience. From 1987 to 2006, he held several management positions with Key Bank in Salt Lake City, UT, and Albany, New York, including Regional Executive, Consumer Banking from 2003 to 2006 in Albany, New York. Mr. Eyre holds a Bachelor of Arts in Finance from the University of Utah and is a graduate of the Pacific Coast Banking School. Mr. Eyre is active with the Boy Scouts of America and is a former Board of Trustee member of the Utah Bankers Association.
Cindy L. Bateman is Senior Vice President and Chief Credit Officer of Home Federal Bank. Ms. Bateman joined Home Federal Bank in March 2007. Ms Bateman was previously employed by Key Bank from 2002 until 2007 having served as Senior Vice President and District Business Leader. Having started her career with First Security Bank of Idaho in 1983 in the Management Training program, she has held various positions in Credit Administration and Commercial and Business Banking. Ms. Bateman holds a B.B.A. in Finance from Idaho State University and an M.B.A. from the University of Washington. She currently serves as President for the Idaho Shakespeare Festival and formerly served as a director of Financial Women International.
Item 1A. Risk Factors
Our business, and an investment in our common stock, involves risks. Summarized below are the risk factors which we believe are material to our business and could negatively affect our operating results, financial condition and the trading value of our common stock. Other risks factors, not currently known to us, or that we currently deem to be immaterial or unlikely, also could adversely affect our business. In assessing the following risk factors, you should also refer to the other information contained in this Annual Report on Form 10-K and our other filings with the Securities and Exchange Commission.
The current economic recession in the market areas we serve may continue to adversely impact our earnings and could increase the credit risk associated with our loan portfolio.
Substantially all of our loans are to businesses and individuals in the states of Idaho and Oregon. A continuing decline in the economies of the markets in which we operate, could have a material adverse effect on our business, financial condition, results of operations and prospects. In particular, Idaho and Oregon have experienced substantial home price declines and increased foreclosures and have experienced above average unemployment rates.
A further deterioration in economic conditions in the market areas we serve could result in the following consequences, any of which could have a materially adverse impact on our business, financial condition and results of operations:
| § | loan delinquencies, problem assets and foreclosures may increase; |
| § | demand for our products and services may decline; |
| § | collateral for loans made may decline further in value, in turn reducing customers’ borrowing power, reducing the value of assets and collateral associated with existing loans; and |
| § | the amount of our low-cost or non-interest bearing deposits may decrease. |
Negative developments in the financial industry and credit markets may continue to adversely impact our financial condition and results of operations.
Negative developments beginning in the latter half of 2007 in the sub-prime mortgage market and the securitization markets for such loans, together with the general economic downturn, have resulted in uncertainty in the financial markets and a general economic downturn. In addition, as a consequence of the recession in the United States, business activity across a wide range of industries face serious difficulties due to the lack of consumer spending and the extreme lack of liquidity in the global credit markets. Unemployment has also increased significantly. As a result of these economic crises, many lending institutions, including us, have experienced increases in delinquent and nonperforming loans, including construction and land loans, multifamily loans, commercial loans and consumer loans. Moreover, competition among depository institutions for deposits and quality loans has increased significantly. In addition, the values of real estate collateral supporting many loans have declined and may continue to decline. Bank and holding company stock prices have been negatively affected, as has the ability of banks and holding companies to raise capital or borrow in the debt markets compared to recent years. These conditions may have a material adverse effect on our financial condition and results of operations. In addition, as a result of the foregoing factors, there is a potential for new federal or state laws and regulations regarding lending and funding practices and liquidity standards, and bank regulatory agencies have been very aggressive in responding to concerns and trends identified in examinations, including the expected issuance of formal enforcement orders. In this regard, the U.S. Department of the Treasury (the "U.S. Treasury") has announced that more rigorous regulatory capital and liquidity standards for banks should be established by December 31, 2010 and implemented by December 31, 2012, but no specific measures have yet been published.
Continued negative developments in the financial industry and the impact of new legislation in response to those developments could restrict our business operations, including our ability to originate or sell loans, and may adversely impact our results of operations and financial condition. Overall, during the past year, the general business environment has had a negative effect on our business, and there can be no assurance that the environment will improve in the near term. Until there is a sustained improvement in conditions, we expect our business, financial condition and results of operations to be negatively affected.
Legislation and measures undertaken by the Treasury, the Federal Reserve and other governmental agencies to help stabilize the U.S. financial system or improve the housing market may not be successful.
On October 3, 2008, President Bush signed into law the Emergency Economic Stabilization Act of 2008 (the “EESA”), which, among other measures, authorized the Treasury Secretary to establish the Troubled Asset Relief Program (“TARP”). EESA gives broad authority to the Treasury Department to purchase, manage, modify, sell and insure the troubled mortgage related assets that triggered the current economic crisis as well as other “troubled assets.”
Pursuant to the TARP, the Treasury Department has the authority to, among other things, invest up to $700 billion through a capital purchase program, pursuant to which may provide access to capital to financial institutions. This program may be extended to other nonfinancial companies. We did not apply for government assistance through the
Capital Purchase Program under the U.S. Treasury Department’s TARP. We believe our high capital level and liquid balance sheet provides us flexibility in today's environment to execute our growth plans without TARP capital.
EESA followed, and has been followed by, numerous actions by the Federal Reserve, Congress, Treasury, the SEC and others to address the current liquidity and credit crisis that has followed the sub-prime meltdown that commenced in 2007. These measures include homeowner relief that encourage loan restructuring and modification; the establishment of significant liquidity and credit facilities for financial institutions and investment banks; the lowering of the federal funds rate to a target of 0.00% to 0.25%; action against short selling practices; a temporary guaranty program for money market funds; the establishment of a commercial paper funding facility to provide back-stop liquidity to commercial paper issuers; and coordinated international efforts to address illiquidity and other weaknesses in the banking sector.
In addition, in early 2009, the U.S. Treasury announced its Financial Stability Plan to ameliorate the current credit crisis, and President Obama signed into law the American Recovery and Reinvestment Act (the "ARRA").
The purpose of these legislative and regulatory actions is to stabilize the U.S. banking system, improve the flow of credit and foster an economic recovery. The regulatory and legislative initiatives described above, however, may not have their desired effects. If market volatility resumes or economic conditions fail to improve or worsen, our business, financial condition and results of operations could be materially and negatively affected.
Our business strategy includes significant growth plans, and our financial condition and results of operations could be negatively affected if we fail to grow or fail to manage our growth effectively.
We intend to continue pursuing a significant growth strategy for our business, including FDIC-assisted acquisitions of failed financial institutions. Our growth initiatives are based upon recruiting experienced personnel to lead such initiatives, and, accordingly, the failure to identify and retain such personnel would place significant limitations on our ability to execute our growth strategy. In addition, achieving our growth targets requires us to attract customers that currently have banking relationships with other financial institutions in our market, thereby increasing our share of the market. To the extent we expand our lending beyond our current market area, we could incur additional risk related to those new market areas. We cannot assure that we will be able to expand our market presence in our existing markets or successfully enter new markets or that any such expansion will not adversely affect our profitability. If we do not manage our growth effectively, we may not be able to achieve our business plan, and our business, profitability and prospects could be harmed. Also, if our growth occurs more slowly than anticipated or declines, our profitability could be materially adversely affected.
Our ability to successfully grow will depend on a variety of factors, including our ability to attract and retain experienced bankers, the continued availability of desirable business opportunities, the competitive responses from other financial institutions in our market area and our ability to manage our growth. In this regard, future growth opportunities may not be available or we might not successfully manage our growth.
We are highly dependent on key individuals and a number of the members of executive and senior management have been with the Company for less than three years.
Consistent with our policy of focusing on select growth initiatives we are highly dependent on the continued services of a limited number of our executive officers and key management personnel. The loss of services of any of these individuals may have a material adverse impact on our operations because other officers may not have the experience and expertise to readily replace these individuals.
We believe we have in place qualified individuals and have provided for an orderly transition. Changes in key personnel and their responsibilities may be disruptive to our business and could have a material adverse effect on our business, financial condition and profitability. Moreover, our anticipated growth is expected to place increased demands on our human resources and will require the recruitment of additional middle management personnel. The competition to hire experienced banking professionals is also intense. If we are unable to attract qualified banking professionals, our expansion plans could be delayed or curtailed and our business, financial condition, and profitability may be adversely affected.
Fluctuations in interest rates could reduce our profitability and affect the value of our assets.
Like other financial institutions, we are subject to interest rate risk. Our primary source of income is net interest income, which is the difference between interest earned on loans and investments and the interest paid on deposits and borrowings. We expect that we will periodically experience imbalances in the interest rate sensitivities of our assets and liabilities and the relationships of various interest rates to each other. Over any defined period of time, our interest-earning assets may be more sensitive to changes in market interest rates than our interest-bearing liabilities, or vice versa. In addition, the individual market interest rates underlying our loan and deposit products (e.g., the Wall Street Journal Prime rate) may not change to the same degree over a given time period. In any event, if market interest rates should move contrary to our position, our earnings may be negatively affected. In addition, loan volume and quality and deposit volume and mix can be affected by market interest rates. Changes in levels of market interest rates could materially affect our net interest spread, asset quality, origination volume, and overall profitability.
We principally manage interest rate risk by managing our volume and mix of our earning assets and funding liabilities. In a changing interest rate environment, we may not be able to manage this risk effectively. If we are unable to manage interest rate risk effectively, our business, financial condition and results of operations could be materially harmed.
Our business is subject to various lending risks which could adversely impact our results of operations and financial condition.
Our business strategy centers on the continued transition to commercial banking activities in order to expand our net interest margin. Consistent with this strategy, we are working to further reduce the percentage of our lower-yielding assets such as residential loans and mortgage-backed securities and to increase the percentage of our assets consisting of construction and land development, commercial and multi-family real estate and commercial business loans that have higher risk-adjusted returns. Our increasing focus on these types of lending will continue to increase our risk profile relative to traditional thrift institutions as we continue to implement our business strategy for the following reasons:
Our loan portfolio possesses increased risk due to our increasing percentage of commercial real estate and commercial business loans.
At September 30, 2009, our loan portfolio included $254.0 million of commercial and multifamily real estate loans and commercial business loans, or approximately 47.0% of our total loan portfolio. We have been increasing, and intend to continue to increase, our origination of these types of loans in fiscal 2010. The credit risk related to these types of loans is considered to be greater than the risk related to one-to-four family residential loans because the repayment of commercial real estate loans and commercial business loans typically is dependent on the successful operations and income stream of the borrowers’ business and the real estate securing the loans as collateral, which can be significantly affected by economic conditions. Some of this risk is mitigated by the fact that approximately $86.2 million, or 33.9%, of $254.0 million of commercial and multifamily real estate loans and commercial business loans are loans that we acquired in the Community First Bank transaction and are covered by our loss-sharing agreement with the FDIC for that transaction.
Several of our borrowers have more than one commercial real estate loan outstanding with us. Consequently, an adverse development with respect to one loan or one credit relationship can expose us to significantly greater risk of loss compared to an adverse development with respect to a one-to-four family residential mortgage loan. Finally, if we foreclose on a commercial real estate loan, our holding period for the collateral, if any, typically is longer than for one-to-four family residential mortgage loan because there are fewer potential purchasers of the collateral. Since we plan to continue to increase our originations of these loans, it may be necessary to increase the level of our allowance for loan losses due to the increased risk characteristics associated with these types of loans. Any increase to our allowance for loan losses would adversely affect our earnings. In addition, these loans generally carry
larger balances to single borrowers or related groups of borrowers than one-to-four family loans. Any delinquent payments or the failure to repay these loans would hurt our earnings.
A large percentage of our loan portfolio is secured by real estate, in particular commercial real estate. Continued deterioration in the real estate markets or other segments of our loan portfolio could lead to additional losses, which could have a material negative effect on our financial condition and results of operations.
As a result of increased levels of residential and commercial delinquencies and declining real estate values, which reduce the customer's borrowing power and the value of the collateral securing the loan, we have experienced increasing levels of charge-offs and provisions for loan losses. Continued increases in delinquency levels or continued declines in real estate values, which cause our loan-to-value ratios to increase, could result in additional charge-offs and provisions for loan losses. This could have a material negative effect on our business and results of operations.
Our construction loans are based upon estimates of costs and value associated with the complete project. These estimates may be inaccurate.
We make land purchase, lot development and real estate construction loans to individuals and builders, primarily for the construction of residential properties and, to a lesser extent, commercial and multi-family real estate projects. We will originate these loans whether or not the collateral property underlying the loan is under contract for sale. Residential real estate construction loans include single-family tract construction loans for the construction of entry level residential homes.
Construction lending can involve a higher level of risk than other types of lending because funds are advanced partially based upon the value of the project, which is uncertain prior to the project's completion. Because of the uncertainties inherent in estimating construction costs as well as the market value of a completed project and the effects of governmental regulation of real property, our estimates with regards to the total funds required to complete a project and the related loan-to-value ratio may vary from actual results. As a result, construction loans often involve the disbursement of substantial funds with repayment dependent, in part, on the success of the ultimate project and the ability of the borrower to sell or lease the property or refinance the indebtedness. This risk has been compounded by the current slowdown in both the residential and the commercial real estate markets, which has negatively affected real estate values and the ability of our borrowers to liquidate properties or obtain adequate refinancing. If our estimate of the value of a project at completion proves to be overstated, we may have inadequate security for repayment of the loan and we may incur a loss.
Repayment of our commercial loans is often dependent on the cash flows of the borrower, which may be unpredictable, and the collateral securing these loans may fluctuate in value.
We make our commercial loans primarily based on the identified cash flow of the borrower and secondarily on the underlying collateral provided by the borrower. Collateral securing commercial loans may depreciate over time, be difficult to appraise and fluctuate in value. In addition, in the case of loans secured by accounts receivable, the availability of funds for the repayment of these loans may be substantially dependent on the ability of the borrower to collect the amounts due from its customers. Accordingly, we make our commercial loans primarily based on the historical and expected cash flow of the borrower and secondarily on underlying collateral provided by the borrower.
Because our loans are concentrated to borrowers in our market area, a downturn in the local economy or a decline in local real estate values could cause increases in nonperforming loans, which could hurt our profits.
The majority of our borrowers and depositors are individuals and businesses located and doing business in the Boise, Idaho and Bend, Oregon, metropolitan areas and surrounding rural markets. Adverse economic conditions in our market area could reduce our growth rate, affect the ability of our customers to repay their loans and generally affect our financial condition and results of operations. Conditions such as inflation, recession, unemployment, high interest rates, short money supply, scarce natural resources, international disorders, terrorism and other factors beyond our control may adversely affect our profitability. We do not have the ability of a larger institution to spread
the risks of unfavorable local economic conditions across a large number of diversified economies. Any sustained period of increased payment delinquencies, foreclosures or losses caused by adverse economic conditions in our markets could adversely affect the value of our assets, revenues, profitability and financial condition. Moreover, we may not benefit from any market growth or favorable economic conditions in our primary market areas if they do occur.
If the value of real estate in our market areas continue to decline, a significant portion of our loan portfolio could become under-collateralized, which could have a material adverse effect on Home Federal Bank.
The United States, including our primary banking markets, have experienced weakening economic conditions and declines in housing prices and real estate values in general. Our loan portfolio contains significant amounts of loans secured by residential and commercial real estate. We have experienced increases in non-performing assets, net charge-offs and provisions for credit losses as a result of continuing deterioration of the housing markets, increasing financial stress on consumers and weakening economic conditions. We expect continued economic weakness for most of calendar years 2009 and 2010. This environment could lead to increased levels of non-performing assets, net charge-offs and provision for credit losses compared to previous periods.
Substantially all of our loans secured by real property and concentrated in southwestern Idaho and central Oregon. A continued decline in local economic conditions could adversely affect the values of our real estate collateral. As a result, we have a greater risk of loan defaults and losses in the event of an economic downturn in our market area as adverse economic changes may have a negative effect on the ability of our borrowers to make timely repayment of their loans. Consequently, a decline in local economic conditions may have a greater effect on our earnings and capital than on the earnings and capital of larger financial institutions whose real estate loan portfolios are geographically diverse. If we are required to liquidate a significant amount of collateral during a period of reduced real estate values to satisfy the debt, our financial condition and profitability could be adversely affected.
If our allowance for loan losses is not sufficient to cover actual loan losses, our earnings and capital levels could be reduced.
We make various assumptions and judgments about the collectibility of our loan portfolio, including the creditworthiness of our borrowers and the value of the real estate and other assets serving as collateral for the repayment of many of our loans. In determining the amount of the allowance for loan losses, we review our loans and our loss and delinquency experience, and evaluate economic conditions. Management recognizes that significant new growth in loan portfolios, new loan products and the refinancing of existing loans can result in portfolios comprised of unseasoned loans that may not perform in a historical or projected manner. If our assumptions are incorrect, our allowance for loan losses may not be sufficient to cover actual losses, resulting in additions to our allowance. Material additions to our allowance could materially decrease our net income. In addition, bank regulators periodically review our allowance for loan losses and may require us to increase our provision for loan losses or recognize additional loan charge-offs. Any increase in our allowance for loan losses or loan charge-offs as required by these regulatory authorities could have a material adverse effect on our financial condition and profitability.
Although we believe that our underwriting criteria are appropriate for the various kinds of loans we make, we may incur losses on loans that meet our underwriting criteria, and these losses may exceed the amounts set aside as reserves in our allowance for loan losses.
The weakened housing market may result in a decline in fair value of REO.
In recent months we have foreclosed on certain real estate development and commercial real estate loans and have taken possession of several residential subdivision properties as well as single family residential properties. REO is initially recorded at its estimated fair value less costs to sell. Because of the weak housing market and declining property values, we may incur losses to write-down REO to new fair values or losses from the final sale of properties. Moreover, our ability to sell REO properties is affected by public perception that banks are inclined to
accept large discounts from market value to quickly liquidate properties. Write-downs on REO or an inability to sell REO properties will have a material adverse effect on our results of operations and financial condition.
We are subject to extensive regulation which could adversely affect our business.
Our operations are subject to extensive regulation by federal, state and local governmental authorities and are subject to various laws and judicial and administrative decisions imposing requirements and restrictions on part or all of our operations. Because our business is highly regulated, the laws, rules and regulations applicable to it are subject to regular modification and change. Regulatory authorities have extensive discretion in their supervisory and enforcement activities, including the imposition of restrictions on our operations, the classification of our assets and determination of the level of our allowance for loan losses. Any change in this regulation and oversight, whether in the form of regulatory policy, regulations, legislation or supervisory action, may have a material impact on our operations or otherwise materially and adversely affect our business, financial condition, prospects or profitability.
Our federal thrift charter may be eliminated under the federal government’s Financial Regulatory Reform Plan. Congress has proposed legislation that would significantly change the regulation of banks and thrifts, including the consolidation of the Office of the Comptroller of the Currency, which currently charters and supervises nationally chartered banks, and the Office of Thrift Supervision, which supervises federally chartered thrift and thrift holding companies, such as Home Federal Bancorp, Inc., and Home Federal Bank. In addition, under the legislative proposal, the thrift charter, under which Home Federal Bank is organized, would be eliminated. If the proposal is finalized, Home Federal Bank and Home Federal Bancorp, Inc. may be subject to a new charter. There is no assurance as to how this new charter, or the supervision by the new regulatory agency, will affect our operations going forward.
The failure of the Federal Home Loan Bank (“FHLB”) of Seattle or the national Federal Home Loan Bank System may have a material negative impact on our earnings and liquidity.
The FHLB of Seattle announced that it did not meet minimum regulatory capital requirements for the quarter ended September 30, 2009 due to the deterioration in the market value of their mortgage-backed securities portfolio. As a result, the FHLB of Seattle cannot pay a dividend on their common stock and it cannot repurchase or redeem common stock. While the FHLB of Seattle has announced it does not anticipate that additional capital is immediately necessary, nor does it believe that its capital level is inadequate to support realized losses in the future, the FHLB of Seattle could require its members, including Home Federal Bank, to contribute additional capital in order to return the FHLB of Seattle to compliance with capital guidelines.
At September 30, 2009, we held $10.3 million of common stock in the FHLB of Seattle. Should the FHLB of Seattle fail, we anticipate that our investment in the FHLB’s common stock would be “other than temporarily” impaired and may have no value.
At September 30, 2009, we held $31.2 million of cash on deposit with the FHLB of Seattle. At that date, all other cash and cash equivalents were held on deposit at the Federal Reserve Bank of San Francisco, in a correspondent bank account or on hand in branch office vaults.
At September 30, 2009, we maintained a line of credit with the FHLB of Seattle equal to 40% of total assets to the extent Home Federal Bank provides qualifying collateral and holds sufficient FHLB stock. At September 30, 2009, we were in compliance with collateral requirements and $134.4 million of the line of credit was available for additional borrowings. We are highly dependent on the FHLB of Seattle to provide the primary source of wholesale funding for immediate liquidity and borrowing needs. The failure of the FHLB of Seattle or the FHLB system in general, may materially impair our ability to meet our growth plans or to meet short and long term liquidity demands.
Liquidity risk could impair our ability to fund operations and jeopardize our financial condition, growth and prospects.
Liquidity is essential to our business. An inability to raise funds through deposits, borrowings, the sale of loans and other sources could have a substantial negative effect on our liquidity. We rely on customer deposits and advances from the FHLB of Seattle (“FHLB”), the Federal Reserve Bank of San Francisco ("FRB") and other borrowings to fund our operations. Although we have historically been able to replace maturing deposits and advances if desired, we may not be able to replace such funds in the future if, among other things, our financial condition, the financial condition of the FHLB or FRB, or market conditions change. Our access to funding sources in amounts adequate to finance our activities or the terms of which are acceptable could be impaired by factors that affect us specifically or the financial services industry or economy in general - such as a disruption in the financial markets or negative views and expectations about the prospects for the financial services industry in light of the recent turmoil faced by banking organizations and the continued deterioration in credit markets. Factors that could detrimentally impact our access to liquidity sources include a decrease in the level of our business activity as a result of a downturn in the Idaho or Oregon markets where our loans are concentrated or adverse regulatory action against us.
Our financial flexibility will be severely constrained if we are unable to maintain our access to funding or if adequate financing is not available to accommodate future growth at acceptable interest rates. Although we consider our sources of funds adequate for our liquidity needs, we may seek additional debt in the future to achieve our long-term business objectives. Additional borrowings, if sought, may not be available to us or, if available, may not be available on reasonable terms. If additional financing sources are unavailable, or are not available on reasonable terms, our financial condition, results of operations, growth and future prospects could be materially adversely affected. Finally, if we are required to rely more heavily on more expensive funding sources to support future growth, our revenues may not increase proportionately to cover our costs.
Concern of customers over deposit insurance may cause a decrease in deposits at the Bank.
With recent increased concerns about bank failures, customers increasingly are concerned about the extent to which their deposits are insured by the FDIC. Additionally, the Deposit Insurance Fund has been depleted due to the rise in bank failures in 2009. While the FDIC has access to a line of credit with the U.S. Treasury Department and has recently assessed a prepayment requirement of 2010, 2011 and 2012 annual deposit insurance premiums on financial institutions, customers may withdraw deposits from the Bank in an effort to ensure that the amount they have on deposit at the Bank is fully insured. Decreases in deposits may adversely affect our funding costs and net income.
Increases in deposit insurance premiums and special FDIC assessments will hurt our earnings.
Beginning in late 2008, the economic environment caused higher levels of bank failures, which dramatically increased FDIC resolution costs and led to a significant reduction in the Deposit Insurance Fund. As a result, the FDIC has significantly increased the initial base assessment rates paid by financial institutions for deposit insurance. The base assessment rate was increased by seven basis points (seven cents for every $100 of deposits) for the first quarter of 2009. Effective April 1, 2009, initial base assessment rates were changed to range from 12 basis points to 45 basis points across all risk categories with possible adjustments to these rates based on certain debt-related components. These increases in the base assessment rate have increased our deposit insurance costs and negatively impacted our earnings. In addition, in May 2009, the FDIC imposed a special assessment on all insured institutions due to recent bank and savings association failures. The emergency assessment amounts to five basis points on each institution’s assets minus Tier 1 capital as of June 30, 2009, subject to a maximum equal to 10 basis points times the institution’s assessment base.
In addition, the FDIC may impose additional emergency special assessments, of up to five basis points per quarter on each institution’s assets minus Tier 1 capital if necessary to maintain public confidence in federal deposit insurance or as a result of deterioration in the Deposit Insurance Fund reserve ratio due to institution failures. The latest date possible for imposing any such additional special assessment is December 31, 2009, with collection on March 30, 2010. Any additional emergency special assessment imposed by the FDIC will hurt our earnings. Additionally, as a potential alternative to special assessments, in September 2009, the FDIC proposed a rule that would require financial institutions to prepay its estimated quarterly risk-based assessment for the fourth quarter of
2009 and for all of 2010, 2011 and 2012. This proposal would not immediately impact our earnings as the payment would be expensed over time.
We operate in a highly regulated environment and may be adversely affected by changes in laws and regulations, including changes that may restrict our ability to foreclose on single-family home loans and offer overdraft protection.
We are subject to extensive examination, supervision and comprehensive regulation by the OTS and the FDIC. Banking regulations are primarily intended to protect depositors' funds, federal deposit insurance funds, and the banking system as a whole, and not holders of our common stock. These regulations affect our lending practices, capital structure, investment practices, dividend policy, and growth, among other things. Congress and federal regulatory agencies continually review banking laws, regulations, and policies for possible changes. Changes to statutes, regulations, or regulatory policies, including changes in interpretation or implementation of statutes, regulations, or policies, could affect us in substantial and unpredictable ways. Such changes could subject us to additional costs, limit the types of financial services and products we may offer, restrict mergers and acquisitions, investments, access to capital, the location of banking offices, and/or increase the ability of non-banks to offer competing financial services and products, among other things. Failure to comply with laws, regulations or policies could result in sanctions by regulatory agencies, civil money penalties and/or reputational damage, which could have a material adverse effect on our business, financial condition and results of operations. While we have policies and procedures designed to prevent any such violations, there can be no assurance that such violations will not occur.
New legislation proposed by Congress may give bankruptcy courts the power to reduce the increasing number of home foreclosures by giving bankruptcy judges the authority to restructure mortgages and reduce a borrower’s payments. Property owners would be allowed to keep their property while working out their debts. Other similar bills placing additional temporary moratoriums on foreclosure sales or otherwise modifying foreclosure procedures to the benefit of borrowers and the detriment of lenders may be enacted by either Congress or the States of Idaho and Oregon in the future. These laws may further restrict our collection efforts on one-to-four single-family loans. Additional legislation proposed or under consideration in Congress would give current debit and credit card holders the chance to opt out of an overdraft protection program and limit overdraft fees which could result in additional operational costs and a reduction in our non-interest income.
Further, our regulators have significant discretion and authority to prevent or remedy unsafe or unsound practices or violations of laws by financial institutions and holding companies in the performance of their supervisory and enforcement duties. In this regard, banking regulators are considering additional regulations governing compensation which may adversely affect our ability to attract and retain employees. On June 17, 2009, the Obama Administration published a comprehensive regulatory reform plan that is intended to modernize and protect the integrity of the United States financial system. The President’s plan contains several elements that would have a direct effect on Home Federal Bancorp and Home Federal Bank. Under the reform plan, the federal thrift charter and the OTS would be eliminated and all companies that control an insured depository institution must register as a bank holding company. Draft legislation would require Home Federal Bank to become a national bank or adopt a state charter and require Home Federal Bancorp to register as a bank holding company. Registration as a bank holding company would represent a significant change as significant differences currently exist between savings and loan holding company and bank holding company supervision and regulation. For example, the Federal Reserve imposes leverage and risk-based capital requirements on bank holding companies whereas the OTS does not impose any capital requirements on savings and loan holding companies. The reform plan also proposes the creation of a new federal agency, the Consumer Financial Protection Agency that would be dedicated to protecting consumers in the financial products and services market. The creation of this agency could result in new regulatory requirements and raise the cost of regulatory compliance. In addition, legislation stemming from the reform plan could require changes in regulatory capital requirements and compensation practices. If implemented, the foregoing regulatory reforms may have a material impact on our operations. However, because the legislation needed to implement the President’s reform plan has not been introduced, and because the final legislation may differ significantly from the legislation proposed by the Administration, we cannot determine the specific impact of regulatory reform at this time.
Our litigation related costs might continue to increase.
The Bank is subject to a variety of legal proceedings that have arisen in the ordinary course of the Bank’s business. In the current economic environment the Bank’s involvement in litigation has increased significantly, primarily as a result of defaulted borrowers asserting claims in order to defeat or delay foreclosure proceedings. The Bank believes that it has meritorious defenses in legal actions where it has been named as a defendant and is vigorously defending these suits. Although management, based on discussion with litigation counsel, believes that such proceedings will not have a material adverse effect on the financial condition or operations of the Bank, there can be no assurance that a resolution of any such legal matters will not result in significant liability to the Bank nor have a material adverse impact on its financial condition and results of operations or the Bank’s ability to meet applicable regulatory requirements. Moreover, the expenses of pending legal proceedings will adversely affect the Bank’s results of operations until they are resolved. There can be no assurance that the Bank’s loan workout and other activities will not expose the Bank to additional legal actions, including lender liability or environmental claims.
We face strong competition from other financial institutions, financial service companies and other organizations offering services similar to those offered by us, which could limit our growth and profitability.
We face direct competition from a significant number of financial institutions, many with a state-wide or regional presence, and in some cases a national presence, in both originating loans and attracting deposits. Competition in originating loans comes primarily from other banks, mortgage companies and consumer finance institutions that make loans in our primary market areas. We also face substantial competition in attracting deposits from other banking institutions, money market and mutual funds, credit unions and other investment vehicles.
In addition, banks with larger capitalization and non-bank financial institutions that are not governed by bank regulatory restrictions have large lending limits and are better able to serve the needs of larger customers. Many of these financial institutions are also significantly larger and have greater financial resources than us, have been in business for a long period of time and have established customer bases and name recognition.
We compete for loans principally on the basis of interest rates and loan fees, the types of loans we originate and the quality of service we provide to borrowers. Our ability to attract and retain deposits requires that we provide customers with competitive investment opportunities with respect to rate of return, liquidity, risk and other factors. To effectively compete, we may have to pay higher rates of interest to attract deposits, resulting in reduced profitability. If we are not able to effectively compete in our market area, our profitability may be negatively affected, potentially limiting our ability to pay dividends. The greater resources and deposit and loan products offered by some of our competitors may also limit our ability to increase our interest-earning assets.
We continually encounter technological change, and we may have fewer resources than many of our competitors to continue to invest in technological improvements.
The financial services industry is undergoing rapid technological changes, with frequent introductions of new technology-driven products and services. The effective use of technology increases efficiency and enables financial institutions to better serve customers and to reduce costs. Our future success will depend, in part, upon our ability to address the needs of our clients by using technology to provide products and services that will satisfy client demands for convenience, as well as to create additional efficiencies in our operations. Many of our competitors have substantially greater resources to invest in technological improvements. We may not be able to effectively implement new technology-driven products and services or be successful in marketing these products and services to our customers.
We intend to undertake a conversion to a new core processing application in the fourth quarter of fiscal year 2010. We will also convert the banking platform assumed in the Acquisition. After the conversions, all banking offices will operate on the same platform. Core processing conversions entail substantial operational risk and if we fail to successfully convert customer accounts, our liquidity may be significantly impaired due to customers closing their deposit accounts and our earnings may be negatively impacted.
If we fail to maintain an effective system of internal control over financial reporting, we may not be able to accurately report our financial results or prevent fraud, and, as a result, investors and depositors could lose confidence in our financial reporting, which could materially adversely affect our business, the trading price of our common stock and our ability to attract additional deposits.
In connection with the enactment of the Sarbanes-Oxley Act of 2002 (“Act”) and the implementation of the rules and regulations promulgated by the SEC, we document and evaluate our internal control over financial reporting in order to satisfy the requirements of Section 404 of the Act. This requires us to prepare an annual management report on our internal control over financial reporting, including among other matters, management’s assessment of the effectiveness of internal control over financial reporting and an attestation report by our independent auditors addressing these assessments. If we fail to identify and correct any deficiencies in the design or operating effectiveness of our internal control over financial reporting or fail to prevent fraud, current and potential shareholders and depositors could lose confidence in our internal controls and financial reporting, which could materially adversely affect our business, financial condition and results of operations, the trading price of our common stock and our ability to attract additional deposits.
Failure to comply with the terms of the loss share agreement with the FDIC may result in significant losses.
On August 7, 2009, Home Federal Bank entered into a definitive purchase and assumption agreement with the FDIC, pursuant to which Home Federal assumed certain deposits, excluding nearly all brokered deposits, and certain assets of Community First Bank, a commercial bank headquartered in Prineville, Oregon. Home Federal also entered into a loss sharing agreement with the FDIC. Under the loss sharing agreement, Home Federal will share in the losses on assets covered under the purchase and assumption agreement. The FDIC has agreed to reimburse Home Federal for 80% of losses up to $34.0 million, and 95% of losses that exceed that amount.
The purchase and assumption agreement and the loss sharing agreement have specific, detailed and cumbersome compliance, servicing, notification and reporting requirements. Our failure to comply with the terms of the agreements or to properly service the loans and REO under the requirements of the loss share agreement may cause individual loans or large pools of loans to lose eligibility for loss share payments from the FDIC. This could result in material losses that are currently not anticipated.
Item 1B. Unresolved Staff Comments
None.
Item 2. Properties
At September 30, 2009, we conducted business out of 23 full service banking offices and one loan center. Seven of the locations are owned, seven locations are leased and two locations are owned with the land being leased. At September 30, 2009, the net book value of our investment in properties and equipment was $20.5 million. The net book value of the data processing and computer equipment utilized by us at September 30, 2009 was $311,000.
The following table sets forth certain information relating to our offices as of September 30, 2009.
| Location | | Leased or Owned | | Lease Expiration Date | | Square Footage |
ADMINISTRATIVE OFFICE 500 12th Avenue South Nampa, Idaho 83651 (1) (2) | | Owned | | N/A | | 34,014 |
| | | | | | | |
| BRANCH OFFICES: | | | | | | |
| | | | | | | |
Downtown Boise (2) 800 West State Street Boise, Idaho 83703 | | Leased | | August 2010 | | 3,500 |
| | | | | | | |
Parkcenter (2) 871 East Parkcenter Boulevard Boise, Idaho 83706 | | Owned | | N/A | | 4,500 |
Meridian (2) 55 East Franklin Road Meridian, Idaho 83642 | | Owned | | N/A | | 4,000 |
Caldwell (2) 923 Dearborn Caldwell, Idaho 83605 | | Owned | | N/A | | 4,500 |
Mountain Home (2) 400 North 3rd East Mountain Home, Idaho 83647 | | Owned | | N/A | | 2,600 |
Emmett (2) 250 South Washington Avenue Emmett, Idaho 83617 | | Owned | | N/A | | 2,600 |
Boise (3) 8300 West Overland Road Boise, Idaho 83709 | | Leased | | March 2011 | | 695 |
Meridian (3)(4) 4051 East Fairview Avenue Meridian, Idaho 83642 | | Leased | | February 2011 | | 695 |
Garden City (3) 7319 West State Street Boise, Idaho 83714 | | Leased | | August 2012 | | 695 |
Idaho Center (3)(4) 5875 E. Franklin Road Nampa, Idaho 83687 | | Leased | | December 2011 | | 710 |
Eagle (2) 100 E. Riverside Dr. Eagle, Idaho 83616 | | Owned | | N/A | | 4,500 |
Karcher (2) 1820 Caldwell Blvd Nampa, Idaho 83651 | | Owned | | June 2015 | | 3,800 |
| (table continues on next page) |
| (table continued from previous page) |
| Location | | Leased or Owned | | Lease Expiration Date | | Square Footage |
Nampa (3) 2100 12th Avenue Road Nampa, Idaho 83651 | | Leased | | August 2010 | | 695 |
Ustick(2) 10440 W. Ustick Boise, ID 83706 | | Owned | | N/A | | 4,200 |
Bend Greenwood (2) 671 NE Greenwood Bend, OR 97701 | | Lease(5) | | October 2012 | | 2,600 |
Bend Mill Quarter 606 NW Arizona Ave. Bend, OR 97701 | | Lease(6) | | N/A | | 4,000 |
Madras (2) 1150 SE Hwy 97 Madras, OR 97741 | | Lease(5) | | January 2041 | | 4,500 |
La Pine 51366 South Hwy 97 La Pine, OR 97739 | | Lease(5) | | December 2023 | | 3,500 |
Prineville (2) 555 NW Third Prineville, OR 97754 | | Lease(5) | | August 2037 | | 12,860 |
Terrebonne 8222 N Hwy 97 Terrebonne, OR 97760 | | Lease(5) | | August 2012 | | 2,800 |
Redmond 821 SW 6th St. Redmond, OR 97756 | | Lease(6) | | N/A | | 7,800 |
Franklin Crossing 50 NW Franklin Ave. Suite 478 Bend, OR 97701 | | Lease(7) | | N/A | | 5,000 |
LOAN OFFICE: | | | | | | |
Blackeagle 1307 Maplegrove Boise, Idaho 83709 | | Leased | | August 2010 | | 4,310 |
________
| (2) | Drive-up ATM available |
| (4) | Closed in October 2009 |
| (5) | At September 30, 2009, Home Federal Bank was leasing the banking office from the FDIC as Receiver for Community First Bank. Home Federal assumed the lease on this property in November 2009 |
| (6) | At September 30, 2009, Home Federal Bank was leasing the banking office from the FDIC as Receiver for Community First Bank. Home Federal agreed to purchase this property from the FDIC in November 2009 |
| (7) | At September 30, 2009, Home Federal Bank was leasing the banking office from the FDIC as Receiver for Community First Bank. Home Federal closed this location in November 2009 |
We recently completed construction of two branches in Boise and Meridian, Idaho, that opened in October and November, 2009, respectively. In conjunction with the opening of these new branches, two in-store Wal-Mart branches were closed as noted above.
Item 3. Legal Proceedings
From time to time we are involved as a plaintiff or defendant in various legal actions arising in the normal course of business. We do not anticipate incurring any material liability as a result of such litigation, nor do we expect any material impact on our financial position, results of operations or cash flows.
Item 4. Submission of Matters to a Vote of Security Holders
No matters were submitted to a vote of security holders during the fourth quarter of the fiscal year ended
September 30, 2009.
PART II
Item 5. Market for the Registrant's Common Equity, Related Stockholder Matters and Issuer Purchases of Equity Securities
Home Federal Bancorp’s common stock is currently listed on the NASDAQ Global Market under the symbol “HOME,” and there is an established market for such common stock. As of December 4, 2009, there were approximately 924 stockholders of record, excluding persons or entities that hold stock in nominee or "street name" accounts with brokers.
The following table sets forth the high and low trading prices for Home Federal Bancorp common stock, as reported by The Nasdaq Stock Market LLC, and cash dividends paid for each quarter during the fiscal years ended September 30, 2009 and 2008:
| Fiscal Year Ended September 30, 2009 | High | | Low | | Cash Dividends Paid |
| Quarter Ended December 31, 2008 | $12.34 | | $ 9.28 | | $0.055 |
| Quarter Ended March 31, 2009 | 11.10 | | 7.01 | | 0.055 |
| Quarter Ended June 30, 2009 | 11.48 | | 8.87 | | 0.055 |
| Quarter Ended September 30, 2009 | 12.00 | | 10.06 | | 0.055 |
| Fiscal Year Ended September 30, 2008 | High | | Low | | Cash Dividends Paid |
Quarter Ended December 31, 2007(1) | $12.83 | | $ 9.76 | | $0.048 |
| Quarter Ended March 31, 2008 | 12.10 | | 10.00 | | 0.055 |
| Quarter Ended June 30, 2008 | 12.00 | | 9.70 | | 0.055 |
| Quarter Ended September 30, 2008 | 12.75 | | 9.81 | | 0.055 |
| (1) | The information prior to December 17, 2007 (the effective date of the Conversion from the mutual holding company form) presented in the table relates to the Company’s predecessor, which was also named Home Federal Bancorp. The share price and dividends per share have been adjusted for periods prior to December 31, 2007, to give effect for the Conversion. |
Dividends
Home Federal Bancorp has paid quarterly cash dividends since the quarter ended June 30, 2005. The dividend rate and the continued payment of dividends depends on a number of factors, including our capital requirements, our financial condition and results of operations, tax considerations, statutory and regulatory limitations and general
economic conditions. No assurance can be given that we will continue to pay dividends or that they will not be reduced in the future.
Dividend payments by us may depend upon dividends received by the Company from the Bank. Under federal regulations, the amount of dividends the Bank may pay is dependent upon its capital position and recent net income. Generally, if the Bank satisfies its regulatory capital requirements, it may make dividend payments up to the limits prescribed in the Office of Thrift Supervision regulations. However, institutions that have converted to a stock form of ownership may not declare or pay a dividend on, or repurchase any of, its common stock if the effect thereof would cause the regulatory capital of the institution to be reduced below the amount required for the liquidation account.
Equity Compensation Plan Information
The information contained in the Company’s Proxy Statement for the 2010 Annual Meeting under the section captioned “Equity Compensation Plan Information” is incorporated herein by reference.
Issuer Purchases of Equity Securities
The following table provides information about purchases of common stock by the Company during the quarter ended September 30, 2009:
| Issuer Purchases of Equity Securities |
| Period of Repurchase | | Total Number of Shares Purchased | | Average Price Paid Per Share | | Total Number of Shares Purchased as Part of Publicly Announced Plans or Programs | | Maximum Number of Shares that May Yet Be Purchased Under the Program |
| July 1 – July 31, 2009 | | -- | | $ -- | | -- | | -- |
| August 1 – August 31, 2009 | | -- | | -- | | -- | | -- |
| September 1 – September 30, 2009 | | -- | | -- | | -- | | 834,900 |
On July 27, 2009 the Company announced a stock repurchase of up to 834,900 shares of its outstanding common stock, representing approximately 5% of outstanding shares on that date. During the quarter ended March 31, 2009, the Company repurchased 867,970 shares of its common stock, which completed the common stock repurchase plan announced on December 23, 2008.
Performance Graph
The following graph compares the cumulative total stockholder return on the Company’s common stock with the cumulative total return on the Russell 2000 Index and the SNL Thrift Index. Stock prices prior to December 19, 2007, the effective date of the Conversion, relate to old Home Federal Bancorp. In connection with the Conversion, old Home Federal Bancorp ceased to exist. As a result, the Company believes that the SNL Thrift Index best reflects the performance of Home Federal Bancorp, Inc, compared to similarly-structured institutions no longer includes the SNL Thrift MHC Index in the performance graph. The graph assumes that total return includes the reinvestment of all dividends, and that the value of the investment in Home Federal Bancorp’s common stock and each index was $100 on December 7, 2004, the initial day of trading for Home Federal Bancorp’s common stock. Historical stock prices are not necessarily indicative of future stock performance.
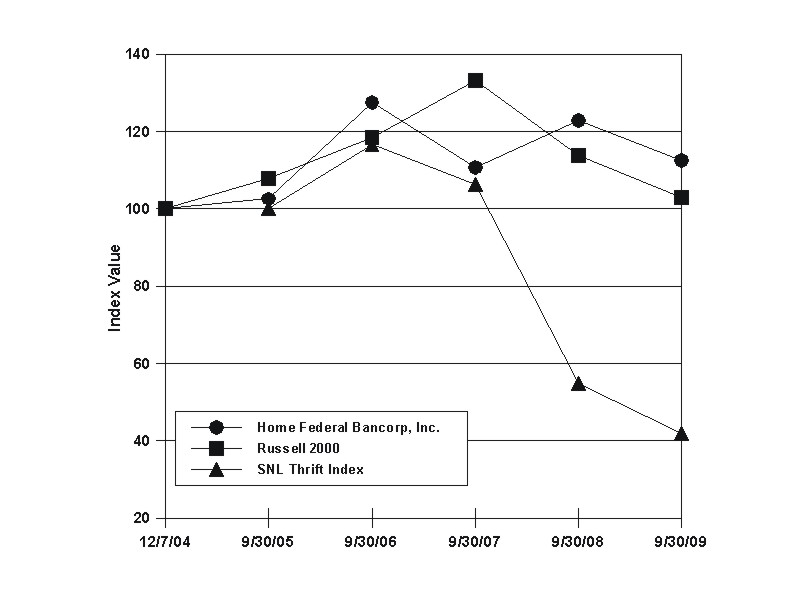
| | Period Ended |
| Index | 12/07/04 | 09/30/05 | 09/30/06 | 09/30/07 | 09/30/08 | 09/30/09 |
| Home Federal Bancorp, Inc. | 100.00 | 102.54 | 127.49 | 110.64 | 122.72 | 112.43 |
| Russell 2000 | 100.00 | 107.84 | 118.54 | 133.16 | 113.88 | 103.01 |
| SNL Thrift Index | 100.00 | 100.10 | 116.52 | 106.34 | 54.77 | 41.95 |
Item 6. Selected Financial Data
The following table sets forth certain information concerning the consolidated financial position and results of operations at and for the dates indicated and has been derived from our audited consolidated financial statements. The information below is qualified in its entirety by the detailed information included elsewhere herein and should be read along with “Item 7. Management’s Discussion and Analysis of Financial Condition and Results of Operations” and “Item 8. Financial Statements and Supplementary Data.”
| | | At September 30, | |
| | | 2009 | | | 2008 | | | 2007 | | | 2006 | | | 2005 | |
| FINANCIAL CONDITION DATA: | (in thousands) |
| | | | | | | | | | | | | | | | |
| Total assets | | $ | 827,899 | | | $ | 725,070 | | | $ | 709,954 | | | $ | 761,292 | | | $ | 689,577 | |
| Investment securities, available for sale | | | 169,320 | | | | 188,787 | | | | 162,258 | | | | 12,182 | | | | 14,830 | |
| Investment securities, held to maturity | | | -- | | | | -- | | | | -- | | | | 183,279 | | | | 180,974 | |
Loans receivable, net (1) | | | 510,629 | | | | 459,813 | | | | 480,118 | | | | 503,065 | | | | 430,944 | |
| Loans held for sale | | | 862 | | | | 2,831 | | | | 4,904 | | | | 4,119 | | | | 5,549 | |
| Total deposits | | | 514,858 | | | | 372,925 | | | | 404,609 | | | | 430,281 | | | | 396,325 | |
| FHLB advances and other borrowings | | | 84,737 | | | | 136,972 | | | | 180,730 | | | | 210,759 | | | | 175,932 | |
| Stockholders’ equity | | | 209,665 | | | | 205,187 | | | | 112,637 | | | | 107,869 | | | | 101,367 | |
| | | | | | | | | | | | | | | | | | | | | |
| | | Year Ended September 30, | |
| | | 2009 | | | 2008 | | | 2007 | | | 2006 | | | 2005 | |
| OPERATING DATA: | | (in thousands, except share data) | |
| | | | | | | | | | | | | | | | | | | | | |
| Interest and dividend income | | $ | 35,827 | | | $ | 40,583 | | | $ | 42,638 | | | $ | 39,913 | | | $ | 33,910 | |
| Interest expense | | | 11,977 | | | | 17,935 | | | | 21,336 | | | | 16,917 | | | | 12,231 | |
| Net interest income | | | 23,850 | | | | 22,648 | | | | 21,302 | | | | 22,996 | | | | 21,679 | |
| Provision for loan losses | | | 16,085 | | | | 2,431 | | | | 409 | | | | 138 | | | | 456 | |
| Net interest income after provision for loan losses | | | 7,765 | | | | 20,217 | | | | 20,893 | | | | 22,858 | | | | 21,223 | |
| Noninterest income | | | 9,291 | | | | 10,490 | | | | 11,281 | | | | 11,201 | | | | 10,128 | |
| Noninterest expense | | | 28,971 | | | | 24,439 | | | | 23,636 | | | | 24,037 | | | | 23,158 | |
| Income (loss) before income taxes | | | (11,915 | ) | | | 6,268 | | | | 8,538 | | | | 10,022 | | | | 8,193 | |
| Income tax expense (benefit) | | | (4,750 | ) | | | 2,263 | | | | 3,267 | | | | 3,810 | | | | 2,910 | |
| Income (loss) before extraordinary item | | | (7,165 | ) | | | 4,005 | | | | 5,271 | | | | 6,212 | | | | 5,283 | |
| Extraordinary item: | | | | | | | | | | | | | | | | | | | | |
| Gain on acquisition, less income tax of $9,756 | | | 15,291 | | | | -- | | | | -- | | | | -- | | | | -- | |
| Net income | | $ | 8,126 | | | $ | 4,005 | | | $ | 5,271 | | | $ | 6,212 | | | $ | 5,283 | |
| | | | | | | | | | | | | | | | | | | | | |
Earnings (loss) per share (EPS)(2): | | | | | | | | | | | | | | | | | | | | |
| Basic EPS before extraordinary item | | $ | (0.46 | ) | | $ | 0.25 | | | $ | 0.32 | | | $ | 0.38 | | | $ | 0.32 | |
| Basic EPS of extraordinary item | | | 0.98 | | | | -- | | | | -- | | | | -- | | | | -- | |
| Basic EPS after extraordinary item | | | 0.52 | | | | 0.25 | | | | 0.32 | | | | 0.38 | | | | 0.32 | |
| | | | | | | | | | | | | | | | | | | | | |
| Diluted EPS before extraordinary item | | | (0.46 | ) | | | 0.25 | | | | 0.31 | | | | 0.38 | | | | 0.32 | |
| Diluted EPS of extraordinary item | | | 0.98 | | | | -- | | | | -- | | | | -- | | | | -- | |
| Diluted EPS after extraordinary item | | | 0.52 | | | | 0.25 | | | | 0.31 | | | | 0.38 | | | | 0.32 | |
| | | | | | | | | | | | | | | | | | | | | |
Dividends declared per share(2): | | | 0.220 | | | | 0.213 | | | | 0.194 | | | | 0.189 | | | | 0.088 | |
| | | | | | | | | | | | | | | | | | | | | |
| OTHER DATA: | | 2009 | | | 2008 | | | 2007 | | | 2006 | | | 2005 | |
| Number of: | | | | | | | | | | | | | | | |
| Real estate loans outstanding | | | 2,404 | | | | 2,443 | | | | 2,967 | | | | 3,389 | | | | 3,236 | |
| Deposit accounts | | | 97,893 | | | | 66,366 | | | | 68,874 | | | | 70,373 | | | | 73,013 | |
| Full service offices | | | 23 | | | | 15 | | | | 15 | | | | 14 | | | | 15 | |
________
| (1) | Net of allowance for loan losses, loans in process and deferred loan fees. |
| (2) | Earnings per share and dividends declared per share have been adjusted to reflect the impact of the second-step conversion and reorganization of the Company, which occurred on December 19, 2007. |
| | | At or For the Year Ended September 30, | |
| | | 2009 | | | 2008 | | | 2007 | | | 2006 | | | 2005 | |
| KEY FINANCIAL RATIOS: | | | | | | |
| | | | | | | | | | | | | | | | |
| Performance Ratios: | | | | | | | | | | | | | | | |
Return on average assets (1) | | | 1.12 | % | | | 0.54 | % | | | 0.71 | % | | | 0.85 | % | | | 0.82 | % |
Return on average equity (2) | | | 4.01 | | | | 2.16 | | | | 4.75 | | | | 5.90 | | | | 5.69 | |
Dividend payout ratio (3) | | | 42.53 | | | | 74.56 | | | | 23.52 | | | | 19.72 | | | | 10.68 | |
Equity-to-assets ratio (4) | | | 27.98 | | | | 24.94 | | | | 14.94 | | | | 14.47 | | | | 14.38 | |
Interest rate spread (5) | | | 2.69 | | | | 2.25 | | | | 2.40 | | | | 2.79 | | | | 3.15 | |
Net interest margin (6) | | | 3.50 | | | | 3.21 | | | | 3.03 | | | | 3.33 | | | | 3.57 | |
Efficiency ratio (7) | | | 87.42 | | | | 73.75 | | | | 72.46 | | | | 70.21 | | | | 72.81 | |
Noninterest income/operating revenue (8) | | | 28.03 | | | | 31.70 | | | | 34.40 | | | | 32.60 | | | | 31.80 | |
Average interest-earning assets to average interest-bearing liabilities | | | 146.02 | | | | 137.83 | | | | 120.71 | | | | 122.32 | | | | 121.07 | |
Noninterest expense as a percent of average total assets | | | 4.00 | | | | 3.28 | | | | 3.17 | | | | 3.29 | | | | 3.59 | |
| | | | | | | | | | | | | | | | | | | | | |
| Capital Ratios: | | | | | | | | | | | | | | | | | | | | |
Tier 1 (core) capital (to tangible assets) | | | 19.61 | % | | | 21.66 | % | | | 13.56 | % | | | 11.77 | % | | | 12.00 | % |
Total risk-based capital (to risk-weighted assets) | | | 34.89 | | | | 32.84 | | | | 21.38 | | | | 19.46 | | | | 20.46 | |
Tier 1 risk-based capital (to risk-weighted assets) | | | 33.57 | | | | 32.18 | | | | 20.69 | | | | 18.82 | | | | 19.75 | |
| | | | | | | | | | | | | | | | | | | | | |
| Asset Quality Ratios: | | | | | | | | | | | | | | | | | | | | |
Nonaccrual and 90 days or more past due loans as a percent of total loans | | | 7.13 | % | | | 2.14 | % | | | 0.32 | % | | | 0.08 | % | | | 0.11 | % |
| Nonperforming assets as a percent of total assets | | | 6.87 | | | | 1.46 | | | | 0.29 | | | | 0.05 | | | | 0.15 | |
Allowance for losses as a percent of gross loans receivable | | | 5.32 | | | | 0.98 | | | | 0.62 | | | | 0.59 | | | | 0.67 | |
Allowance for losses as a percent of nonperforming loans | | | 74.65 | | | | 46.04 | | | | 195.17 | | | | 766.49 | | | | 602.97 | |
| Net charge-offs to average outstanding loans | | | 1.87 | | | | 0.18 | | | | 0.04 | | | | 0.01 | | | | 0.05 | |
________
| (1) | Net income divided by average total assets. |
| (2) | Net income divided by average equity. |
| (3) | Dividends paid to stockholders, excluding shares held by Home Federal MHC, divided by net income. |
| (4) | Average equity divided by average total assets. |
| (5) | Difference between weighted average yield on interest-earning assets and weighted average rate on interest-bearing liabilities. |
| (6) | Net interest margin, otherwise known as net yield on interest-earning assets, is calculated as net interest income divided by average interest-earning assets. |
| (7) | Noninterest expense divided by the sum of net interest income and noninterest income. |
| (8) | Operating revenue is defined as the sum of net interest income and noninterest income. |
Item 7. Management's Discussion and Analysis of Financial Condition and Results of Operations
Forward-Looking Statements
“Safe Harbor” statement under the Private Securities Litigation Reform Act of 1995: This Form 10-K contains forward-looking statements, which can be identified by the use of words such as “believes,” “expects,” “anticipates,” “estimates” or similar expressions. Forward-looking statements include:
| § | statements of our goals, intentions and expectations; |
| § | statements regarding our business plans, prospects, growth and operating strategies; |
| § | statements regarding the quality of our loan and investment portfolios; and |
| § | estimates of our risks and future costs and benefits. |
These forward-looking statements are subject to significant risks and uncertainties. Actual results may differ materially from those contemplated by the forward-looking statements due to, among others, the following factors:
| § | the credit risks of lending activities, including changes in the level and trend of loan delinquencies and write-offs and changes in our allowance for loan losses and provision for loan losses that may be impacted by deterioration in the housing and commercial real estate markets; |
| § | changes in general economic conditions, either nationally or in our market areas; |
| § | changes in the levels of general interest rates, and the relative differences between short and long term interest rates, deposit interest rates, our net interest margin and funding sources; |
| § | fluctuations in the demand for loans, the number of unsold homes, land and other properties and fluctuations in real estate values in our market areas; |
| § | secondary market conditions for loans and our ability to sell loans in the secondary market; |
| § | results of examinations of us by the Office of Thrift Supervision or other regulatory authorities, including the possibility that any such regulatory authority may, among other things, require us to increase our reserve for loan losses, write-down assets, change our regulatory capital position or affect our ability to borrow funds or maintain or increase deposits, which could adversely affect our liquidity and earnings; |
| § | our compliance with regulatory enforcement actions; |
| § | legislative or regulatory changes that adversely affect our business including changes in regulatory policies and principles, or the interpretation of regulatory capital or other rules; |
| § | our ability to attract and retain deposits; |
| § | further increases in premiums for deposit insurance; |
| § | our ability to control operating costs and expenses; |
| § | the use of estimates in determining fair value of certain of our assets, which estimates may prove to be incorrect and result in significant declines in valuation; |
| § | difficulties in reducing risks associated with the loans on our balance sheet; |
| § | staffing fluctuations in response to product demand or the implementation of corporate strategies that affect our workforce and potential associated charges; |
| § | computer systems on which we depend could fail or experience a security breach; |
| § | our ability to retain key members of our senior management team; |
| § | costs and effects of litigation, including settlements and judgments; |
| § | our ability to successfully integrate any assets, liabilities, customers, systems, and management personnel we may in the future acquire into our operations and our ability to realize related revenue synergies and cost savings within expected time frames and any goodwill charges related thereto; |
| § | increased competitive pressures among financial services companies; |
| § | changes in consumer spending, borrowing and savings habits; |
| § | the availability of resources to address changes in laws, rules, or regulations or to respond to regulatory actions; |
| § | our ability to pay dividends on our common stock; |
| § | adverse changes in the securities markets; |
| § | inability of key third-party providers to perform their obligations to us; |
| § | changes in accounting policies and practices, as may be adopted by the financial institution regulatory agencies or the Financial Accounting Standards Board, including additional guidance and interpretation on accounting issues and details of the implementation of new accounting methods; and |
| § | other economic, competitive, governmental, regulatory, and technological factors affecting our operations, pricing, products and services and the other risks described elsewhere in this prospectus and the incorporated documents. |
Some of these and other factors are discussed in this Annual Report on Form 10-K under the caption “Risk Factors” and elsewhere in this document and in the documents incorporated by reference herein. Such developments could have an adverse impact on our financial position and our results of operations.
Any of the forward-looking statements that we make in this annual report and in other public statements we make may turn out to be wrong because of inaccurate assumptions we might make, because of the factors illustrated above or because of other factors that we cannot foresee. Because of these and other uncertainties, our actual future results may be materially different from the results indicated by these forward-looking statements and you should not rely on such statements.
GENERAL
Our primary source of pre-tax income is net interest income. Net interest income is the difference between interest income, which is the income that we earn on our loans and investments, and interest expense, which is the interest that we pay on our deposits and borrowings. Changes in levels of interest rates affect our net interest income. We intend to diversify the mix of our assets by reducing the percentage of our assets that are lower-yielding residential loans and mortgage-backed securities and increasing the percentage of our assets consisting of commercial loans that we believe have higher risk-adjusted returns.
Our operating expenses consist primarily of compensation and benefits, occupancy and equipment, data processing, advertising, postage and supplies, professional services and deposit insurance premiums. Compensation and benefits consist primarily of the salaries and wages paid to our employees, non-cash expense related to our employee stock ownership plan (“ESOP”), payroll taxes, expenses for retirement and other employee benefits. Occupancy and equipment expenses, which are the fixed and variable costs of building and equipment, consist primarily of lease payments, taxes, depreciation charges, maintenance and costs of utilities.
Our results of operations may also be affected significantly by general and local economic and competitive conditions, changes in market interest rates, governmental policies and actions of regulatory authorities. See “Item 1A. Risk Factors" in this Annual Report on Form 10-K for additional discussion on the potential impacts of these items.
On August 7, 2009, the Bank entered into a purchase and assumption agreement with loss share with the Federal Deposit Insurance Corporation (“FDIC”) to assume all of the deposits (excluding brokered deposits) and certain assets of Community First Bank, a full service commercial bank, headquartered in Prineville, Oregon (the “Acquisition”). Community First Bank operated eight locations in central Oregon. Home Federal Bank assumed approximately $142.8 million of the deposits of Community First Bank. Additionally, Home Federal Bank purchased approximately $142.3 million in loans and $12.9 million of real estate and other repossessed assets (“REO”). The loans and REO purchased are covered by a loss share agreement between the FDIC and Home Federal which affords Home Federal Bank significant protection. Under the loss sharing agreement, Home Federal will share in the losses on assets covered under the agreement (referred to as covered assets). The FDIC has agreed to reimburse Home Federal Bank for 80% of losses up to $34.0 million, and 95% of losses that exceed that amount. In addition, Home Federal also purchased cash and cash equivalents and investment securities of Community First Bank valued at $37.7 million, and assumed $18.3 million in Federal Home Loan Bank advances and other borrowings.
OVERVIEW
Historic change continued to be the theme for Home Federal Bancorp, Inc. in fiscal year 2009. While the local and national economies continued to deteriorate, the management team searched for opportunities to prudently deploy and leverage the capital raised in fiscal year 2008 in connection with the second-step conversion from a mutual holding company. We were able to leverage the Company’s capital, as well as to bolster capital, without diluting existing shareholders by undertaking an FDIC-assisted acquisition of the failed Community First Bank in Prineville, Oregon on August 7, 2009 (the “Acquisition”). See “Business – Organization” under Part I, Item 1. of this Form 10-K for additional information regarding the Acquisition. We believe the current distressed banking climate provides a unique opportunity to participate in FDIC-assisted acquisitions in the Pacific Northwest, particularly in the intermountain region between Salt Lake City and the Cascade Mountains in western Washington and Oregon. Management is monitoring a number of troubled institutions in this market area for additional acquisition opportunities in an effort to enhance our franchise value and provide increasing returns to the Company’s shareholders.
The FDIC-assisted acquisition of the assets and liabilities of Community First Bank in Central Oregon was attractive to management for a variety of reasons, including the ability to expand into complementary markets on the outer rim of the Company’s targeted growth markets, the ability to compete against banks in Community First Bank’s markets based on Home Federal Bank’s relative capital strength as several banks in these markets are under regulatory order and are less than well-capitalized, and the attractiveness of immediate core deposit growth with low cost of funds. While management believes the Central Oregon region will increase the Company’s earnings, fiscal 2010 expenses
will be higher than expected over the long-term as the Bank will not centralize the Central Oregon operations, particularly information technology systems, until the fourth quarter of fiscal 2010 when the entire Bank’s core system applications are expected to be converted to a new platform. In the short-term, our primary focus in the Central Oregon region is aggregating core deposits and mitigating losses on troubled assets.
The following list summarizes the key internal strategic initiatives undertaken by management during fiscal 2009:
| § | The Bank acquired a failed commercial bank with FDIC-assistance and recorded an extraordinary gain of $15.3 million, net of taxes; |
| § | The Bank opened a branch in Boise, Idaho, and substantially completed the construction of two branches in Boise and Meridian, Idaho, which were opened in October and November 2009, respectively; |
| § | Two Wal-Mart banking offices were closed as management continued to revise its branching strategy in favor of constructing full-service, free-standing banking offices; |
| § | The Bank sold its mortgage servicing rights portfolio; |
| § | The Bank launched a new checking account product that is expected to increase core deposit balances and generate interchange income; |
| § | A total of 867,970 shares of the Company’s common stock were repurchased; |
| § | Management executed on its strategy to increase core deposits and reduce reliance on high-cost certificates of deposit and borrowings; and, |
| § | A team of seasoned bankers was hired to build small business deposit relationships in the Bank’s markets and to participate in Small Business Administration lending programs. |
The following items summarize the key factors affecting performance of the Company during fiscal year 2009:
| § | Economic conditions in the Treasure Valley continued to deteriorate as a result of rising unemployment, bankruptcies and foreclosures and declining real estate values, which resulted in rising levels of nonperforming assets and the need for an additional provision for loan losses; |
| § | Deteriorating asset quality and declining valuations of foreclosed real estate assets resulted in a significant provision for loan losses and increased operating expenses through valuation allowances, maintenance and property tax expenses on foreclosures; |
| § | Net interest margin expanded due to declining funding costs and continued deleveraging of low-spread assets and liabilities; |
| § | The slowdown in consumer spending reduced fee income; and |
| § | The Bank maintained its strong capital position with a total risk-based capital ratio of 34.9% at |
The current economic and interest rate environments continue to challenge our organic growth plans. A lack of demand for loans, or more importantly a diminished supply of creditworthy lending opportunities, as well as an increase in residential loan refinancing, limited the our ability to increase outstanding organic loan balances. Alternative investments are also unattractive as investment securities offer very low yields within management’s credit and interest rate risk tolerances. Some competitor financial institutions are offering deposit rates that exceed the Company’s wholesale borrowing costs. Therefore, excluding the impact of the deposits assumed in the Acquisition, certificate of deposit balances have declined as some customers chose to move their maturing certificate of deposit balances to competitors in search of higher returns.
Consistent with our stated business strategy, we reduced fixed-term borrowing balances with the Federal Home Loan Bank of Seattle (“FHLB”) and continued to focus on growing core deposits, defined as non-maturity deposits such as checking, savings and money market accounts, which we believe will increase the franchise value of the Company and improve profitability by reducing interest rate sensitivity and high-cost borrowing balances. Core deposit relationships should also increase revenue through service and interchange fee income. In response to recent declines in nonsufficient fund and interchange income and to execute the strategy of increasing core deposit balances, the Bank launched a new checking account, the “Ultimate Checking Account,” during the third quarter of fiscal 2009. We believe this will result in higher checking account balances and provide an incentive for customers to use their check cards more frequently, which should result in higher interchange income.
The overall increase in nonperforming loans from September 30, 2008, to September 30, 2009, occurred primarily as a result of the FDIC-assisted acquisition. However, our Idaho organic portfolio also had increases in
nonperforming assets during the year. Commercial real estate loans in the Treasure Valley are now being pressured as property vacancies continue to climb and the slowdown in consumer spending is causing many independent and national retailers to close stores or reduce inventory. The Bank’s Credit Administration Department is also spending considerable time reviewing home equity lines of credit and, in some cases, suspending lines at their current balances in order to mitigate future loan losses. Due to these factors and an increase in loan losses, the Bank recorded a loan loss provision of $16.1 million during fiscal 2009.
CRITICAL ACCOUNTING POLICIES AND ESTIMATES
This Management’s Discussion and Analysis of Financial Condition and Results of Operations, as well as disclosures found elsewhere in this Annual Report on Form 10-K, are based upon the Company’s consolidated financial statements, which are prepared in accordance with accounting principles generally accepted in the United States of America (“US GAAP”). The preparation of these financial statements requires us to make estimates and judgments that affect the reported amounts of assets, liabilities, revenues and expenses. Several factors are considered in determining whether or not a policy is critical in the preparation of financial statements. These factors include, among other things, whether the estimates are significant to the financial statements, the nature of the estimates, the ability to readily validate the estimates with other information including third parties or available prices, and sensitivity of the estimates to changes in economic conditions and whether alternative accounting methods may be utilized under US GAAP.
Management has identified several accounting policies that, due to the judgments, estimates and assumptions inherent in those policies, are critical to an understanding of our financial statements. These policies relate to the determination of the allowance for loan losses, including the evaluation of impaired loans, and the associated provision for loan losses, valuation of real estate owned, as well as deferred income taxes and the associated income tax expense. Management reviews the allowance for loan losses for adequacy on a quarterly basis and establishes a provision for loan losses that it believes is sufficient for the loan portfolio growth expected and the loan quality of the existing portfolio. The carrying value of real estate owned is also assessed on a quarterly basis. Income tax expense and deferred income taxes are calculated using an estimated tax rate and are based on management’s and our tax advisor’s understanding of our effective tax rate and the tax code. These estimates are reviewed by our independent auditor on an annual basis and by our regulators when they examine Home Federal Bank.
Allowance for Loan Losses. Management recognizes that losses may occur over the life of a loan and that the allowance for loan losses must be maintained at a level necessary to absorb specific losses on impaired loans and probable losses inherent in the loan portfolio. Management assesses the allowance for loan losses on a quarterly basis by analyzing several factors including delinquency rates, charge-off rates and the changing risk profile of the Bank’s loan portfolio, as well as local economic conditions such as unemployment rates, bankruptcies and vacancy rates of business and residential properties.
The Company believes that the accounting estimate related to the allowance for loan losses is a critical accounting estimate because it is highly susceptible to change from period to period, requiring management to make assumptions about probable incurred losses inherent in the loan portfolio at the balance sheet date. The impact of a sudden large loss could deplete the allowance and require increased provisions to replenish the allowance, which would negatively affect earnings.
The Company’s methodology for analyzing the allowance for loan losses consists of specific allocations on significant individual credits and a general allowance amount, including a range of losses. The specific allowance component is determined when management believes that the collectibility of an individually reviewed loan has been impaired and a loss is probable. The general allowance component relates to assets with no well-defined deficiency or weakness and takes into consideration loss that is inherent within the portfolio but has not been identified. The general allowance is determined by applying a historical loss percentage to various types of loans with similar characteristics and classified loans that are not analyzed specifically. Adjustments are made to historical loss percentages to reflect current economic and internal environmental factors such as changes in underwriting standards and unemployment rates that may increase or decrease those loss factors. As a result of the imprecision in calculating inherent and potential losses, a range is added to the general allowance to provide an allowance for loan losses that is adequate to cover losses that may arise as a result of changing economic conditions and other qualitative factors that may alter historical loss experience.
The allowance is increased by the provision for loan losses, which is charged against current period operating results and decreased by the amount of actual loan charge-offs, net of recoveries.
The Company also estimates a reserve related to unfunded loan commitments. In assessing the adequacy of the reserve, the Company uses a similar approach used in the development of the allowance for loan losses. The reserve for unfunded loan commitments is included in other liabilities on the Consolidated Balance Sheets. The provision for unfunded commitments is charged to noninterest expense.
Loans Acquired with Deteriorated Credit Quality. Accounting Standards Codification (“ASC”) Topic 310-30 applies to a loan with evidence of deterioration of credit quality since origination, acquired by completion of a transfer for which it is probable, at acquisition, that the investor will be unable to collect all contractually required payments receivable. For loans accounted for under ASC 310-30, management determined the value of the loan portfolio based on work provided by an appraiser. Factors considered in the valuation were projected cash flows for the loans, type of loan and related collateral, classification status and current discount rates. Loans were grouped together according to similar characteristics and were treated in the aggregate when applying various valuation techniques. Management also estimated the amount of credit losses that were expected to be realized for the loan portfolio primarily by estimating the liquidation value of collateral securing loans on non-accrual status or classified as substandard or doubtful. At September 30, 2009, a majority of these loans were valued based on the liquidation value of the underlying collateral, because the expected cash flows are primarily based on the liquidation of the underlying collateral. Certain amounts related to the ASC 310-30 loans are preliminary estimates and are highly subjective. Adjustments in future quarters may occur up to one year from the date of acquisition.
FDIC Indemnification Asset. On August 7, 2009, the Bank entered into a purchase and assumption agreement with loss share with the FDIC. The loans and REO purchased under the purchase and assumption agreement are covered by a loss share agreement between the FDIC and Home Federal Bank which affords the Bank significant protection. This agreement covers realized losses on loans and foreclosed real estate purchased from the FDIC. Under this agreement, the FDIC will reimburse Home Federal Bank for 80% of the first $34.0 million of losses. The FDIC will reimburse Home Federal Bank 95% on realized losses that exceed $34.0 million. Realized losses covered by the loss sharing agreement include loan contractual balances (and related unfunded commitments that were acquired), accrued interest on loans for up to 90 days, the book value of foreclosed real estate acquired, and certain direct costs, less cash or other consideration received by Home Federal Bank.
This agreement extends for ten years for one-to-four family real estate loans and for five years for other loans. The value of this loss sharing agreement was considered in determining fair values of loans and foreclosed real estate acquired.
Management has estimated the amount of losses inherent in the acquired loan and foreclosed real estate portfolios and the amounts that would be receivable from the FDIC upon a loss event. The Bank cannot submit claims of loss until certain events occur, as defined under the purchase and assumption agreement. As such, the indemnification asset is subject to a high degree of uncertainty and estimation as to the timing of the losses and subsequent recovery of a portion of those losses under the loss sharing agreement.
Real Estate Owned. Real estate properties acquired through, or in lieu of, loan foreclosure are initially recorded at the lesser of the outstanding loan balance or the fair value at the date of foreclosure minus estimated costs to sell. Any valuation adjustments required at the time of foreclosure are charged to the allowance for loan losses. After foreclosure, the properties are carried at the lower of carrying value or fair value less estimated costs to sell. Any subsequent valuation adjustments, operating expenses or income, and gains and losses on disposition of such properties are recognized in current operations. The valuation allowance is established based on our historical realization of losses and adjusted for current market trends.
Deferred Income Taxes. Deferred income taxes are reported for temporary differences between items of income or expense reported in the financial statements and those reported for income tax purposes. Deferred taxes are computed using the asset and liability approach as prescribed in ASC Topic 740, “Income Taxes.” Under this method, a deferred tax asset or liability is determined based on the enacted tax rates that will be in effect when the differences between the financial statement carrying amounts and tax basis of existing assets and liabilities are expected to be reported in an institution’s income tax returns. The deferred tax provision for the year is equal to the net change in the net deferred tax asset from the beginning to the end of the year, less amounts applicable to the
change in value related to investments available for sale. The effect on deferred taxes of a change in tax rates is recognized as income in the period that includes the enactment date. The primary differences between financial statement income and taxable income result from depreciation expense, mortgage servicing rights, loan loss reserves, deferred compensation, mark to market adjustments on our available for sale securities, and dividends received from the Federal Home Loan Bank of Seattle. Deferred income taxes do not include a liability for pre-1988 bad debt deductions allowed to thrift institutions that may be recaptured if the institution fails to qualify as a bank for income tax purposes in the future.
COMPARISON OF FINANCIAL CONDITION AT SEPTEMBER 30, 2009, AND SEPTEMBER 30, 2008
Total assets increased $102.8 million, or 14.2%, to $827.9 million at September 30, 2009, from $725.1 million at September 30, 2008. The increase was primarily a result of the acquisition of $189.8 million of the assets of Community First Bank on August 7, 2009, partially offset by decreases over the year in organic loans and mortgage backed securities. Total liabilities increased $98.4 million, or 18.9%, to $618.2 million primarily due to the $174.5 million in assumed liabilities via the acquisition less the reduction in FHLB and other borrowings of $52.2 million from the year ago period.
Assets. The increases and decreases in total assets were primarily concentrated in the following asset categories:
| | | | | | Increase / (Decrease) | |
| | | Balance at September 30, 2009 | | | Balance at September 30, 2008 | | | Amount | | | Percent | |
| | | (dollars in thousands) | |
Cash and amounts due from depository institutions | | $ | 49,953 | | | $ | 23,270 | | | $ | 26,683 | | | | 114.7 | % |
Investment securities, available for sale | | | 169,320 | | | | 188,787 | | | | (19,467 | ) | | | (10.3 | ) |
Loans receivable, net of allowance for loan losses | | | 510,629 | | | | 459,813 | | | | 50,816 | | | | 11.1 | |
Cash and amounts due from depository institutions. The higher cash balance at September 30, 2009, is due to a combination of the Acquisition as well as the current economic conditions. Total cash acquired in the Acquisition was $22.1 million. The current economic conditions, including the low interest rate environment, are presenting challenges in the deployment of this cash as the number of credit worthy borrowers has decreased substantially and locating short-term securities that provide an attractive return has also proven difficult. Additionally, we have conserved cash balances as liquidity support for the possible acquisition of a troubled institution that may not have adequate liquidity.
Securities. Included in assets acquired in the Acquisition was $15.6 million in investments. However, overall securities were down for the year as cash flows received from mortgage-backed securities were principally used throughout the year to retire term FHLB borrowings as they matured. In addition, $11.6 million in securities were sold during the year ended September 30, 2009, with $6.2 million of those sales related to the sale of securities purchased in the acquisition that did not meet our investment policy.
Nearly all of the Company’s mortgage-backed securities were issued by U.S. Government-sponsored enterprises, primarily Fannie Mae and Freddie Mac. While the U.S. Government has recently affirmed its support for government-sponsored enterprises and the mortgage-backed securities they issued, significant deterioration in the financial strength of Fannie Mae, Freddie Mac or mortgage-backed security insurers may have a material effect on the valuation and performance of the Company’s mortgage-backed securities portfolio in future periods.
At September 30, 2009, we held one private label security with a fair value of $599,000 which carried a Moody’s rating of A1. Management has reviewed the delinquency status, credit support and collateral coverage of the loans pooled in this security and has concluded it was not other than temporarily impaired at September 30, 2009.
Loans. Loans receivable, net, increased $50.8 million to $510.6 million at September 30, 2009, from $459.8 million at September 30, 2008. The fair value of loans acquired through the acquisition was $109.6 million as of September
30, 2009, net of an allowance for loan losses of $16.8 million. The organic loan portfolio declined $58.7 million with one-to-four family residential loans decreasing $40.7 million and construction and consumer loans decreasing $6.5 million in each portfolio.
The reduction of one-to-four family residential loans is consistent with our strategy to reduce the portfolio’s concentration in those loans in favor of increasing the mix of commercial and commercial real estate loans in order to improve interest rate sensitivity and net interest margin. Additionally, commercial lending relationships often translate to more profitable deposit relationships. We began selling nearly all new one-to-four family loan originations in the secondary market in 2006.
As mentioned earlier, the economic recession has significantly slowed business activity and reduced opportunities to provide commercial lending solutions. Commercial real estate vacancies in our markets have increased. Additionally, the Bank’s concentration in commercial real estate loans is nearing our internal policy limits while commercial business loans are only half of our internal goals. As a result, we are concerned that the Bank will not be able to grow the loan portfolio through fiscal 2010.
Allowance for loan losses. The allowance for loan losses increased to $28.7 million at September 30, 2009, from $4.6 million at September 30, 2008. At September 30, 2009, we recorded an allowance of $16.8 million on loans purchased in the Acquisition and an allowance of $11.9 million on our organic loan portfolio. All of the allowance on acquired loans is considered a “general allowance” available for allocation to any loan, although the calculation of the allowance was performed on each pool component in the acquired loan portfolio. Approximately $1.7 million of the $11.9 million allowance for loan losses on our organic portfolio is allocated directly to nonperforming loans. The remaining $10.2 million represents a general reserve reflecting our best estimate of inherent losses at September 30, 2009.
Loans that were troubled on the date of the Acquisition were recorded at fair value under Accounting Standards Codification Topic (“ASC”) 310-30, which means an allowance for loan losses is not reported separately on the balance sheet. Loans accounted for under ASC 310-30 reported in loans on the balance sheet totaled $26.4 million at September 30, 2009, which represents gross receivable balances of $40.6 million, net of fair value adjustments for estimated credit losses of $14.1 million. Because of the loss sharing agreement with the FDIC on these assets, we do not expect to incur excessive future losses on the acquired loan portfolio. See “Asset Quality” on page 19 of this Form 10-K for additional discussion on the loss share agreement and our estimate of losses under the agreement.
The estimated loss percentage on all of the pools in our organic loan portfolio increased at September 30, 2009 from September 30, 2008. We experienced significant losses in our construction and development loan portfolio as well as large losses in our home equity line of credit portfolio; each of these pools saw large increases in the loss estimates at the end of fiscal year 2009 as a result. We also increased our loss estimates for commercial real estate loans as we are beginning to see signs of stress in the Treasure Valley and expect to realize losses in this portfolio in 2010.
We also have a pool of residential real estate loans that were purchased from Countrywide Bank (now Bank of America) who continues to service the loans. Balances on the portfolio totaled $21.9 million at September 30, 2009. Over 90% of the portfolio balance is secured by properties outside of our primary market areas, including distressed markets such as California and Arizona, and delinquencies and foreclosures have risen quickly in that portfolio. At September 30, 2009, approximately 18% of the loans in this portfolio were delinquent over 30 days. The total loss reserve allocated to loans in this loan portfolio was $1.3 million at September 30, 2009.
Property and equipment. Property and equipment increased $5.2 million as a result of the construction of two new branches in Boise and Meridian, Idaho, that opened in October and November, 2009, respectively. At September 30, 2009, the Bank had five branches in Wal-Mart supermarkets. However, we closed two in-store branches in conjunction with the opening of these new banking offices. We have reduced the number of in-store branches in recent years and opened free-standing full-service banking office that better provide the range of products and services now being offered by the Bank.
We did not acquire banking locations in Central Oregon at the same time as the closing of the acquisition. Under the purchase and assumption agreement with the FDIC, we had a period of time after the transaction date, which was August 7, 2009, to review the eight banking facilities of the failed institution and obtain appraisals of the banking
office and their contents. In late November 2009, we informed the FDIC of our intent to close one of the banking offices in Bend, Oregon, to purchase two banking offices in Redmond and Bend, and to assume the lease agreements on five of the other banking offices. The value of the purchased banking offices totaled $4.7 million and the contents of all seven of the assumed locations totaled approximately $412,000.
We do not intend to construct new banking offices in the near future as growth in the Treasure Valley and Central Oregon has slowed. Rather, we will seek acquisition opportunities to complement and leverage the Bank’s existing footprint.
Mortgage servicing rights. In August 2008, the Bank entered into an agreement to sell its mortgage servicing rights to another financial institution since we now sell nearly all one-to-four family loan originations in the secondary market with servicing released. The placement of Fannie Mae and Freddie Mac into the conservatorship of the Federal government, in addition to sweeping changes in the secondary market, caused uncertainty about the future value of the mortgage servicing rights asset. Lastly, the rapid deterioration of the real estate market and the increase in foreclosures in the Treasure Valley raised concern among management that resources would be diverted to resolving foreclosed assets for loans owned by others and away from the mitigation of loan losses and the workout of troubled loans in our own portfolio. The sale of the mortgage servicing rights was completed in the first quarter of fiscal 2009.
Bank owned life insurance. The value of bank owned life insurance increased $424,000 to $12.0 million. The policy premiums are invested in six insurance companies, each of which had a rating of at least ‘A’ by Standard & Poor’s and A.M. Best. We continue to monitor the financial performance, capital levels and financial ratings of the companies that have issued the Bank’s “general account” life insurance policies.
Real estate and other property owned. Real estate and other property owned (“REO”) increased $17.7 million during fiscal year 2009 due to the significant increase in foreclosures and the Acquisition. REO in our Central Oregon market totaled $7.5 million at September 30, 2009, net of fair value purchase adjustments. Total REO was comprised of $11.5 million of land development and speculative one-to-four family construction projects, $5.9 million of commercial real estate, $631,000 of one-to-four family residential properties, and $412,000 of other repossessed assets at September 30, 2009.
Deferred taxes. As of September 30, 2009, the net deferred tax liability balance was $5.6 million versus a net deferred tax asset of $1.8 million at September 30, 2008. The difference is mainly due to the $9.8 million deferred tax liability that was recorded in connection with the Acquisition representing the fair value adjustments on the loans and deposits acquired, as well as the excess of the purchase discount over the net assets acquired.
FDIC indemnification receivable. As part of the purchase and assumption agreement for the Acquisition, we entered into a loss sharing agreement with the FDIC. This agreement covers realized losses on loans and foreclosed real estate purchased in the Acquisition. Under this agreement, the FDIC will reimburse Home Federal Bank for 80% of the first $34.0 million of realized losses and 95% on realized losses that exceed $34.0 million. The loss share agreement does not extend to our organic loan portfolio and does not cover loans we originate in the Central Oregon market after August 7, 2009.
Deposits. Deposits increased $141.9 million, or 38.1%, to $514.9 million at September 30, 2009, from $372.9 million at September 30, 2008 mainly due to the $143.5 million in deposits assumed in the Acquisition.
The following table details the changes in deposit accounts:
| | | | | | Increase / (Decrease) | |
| | | Balance at September 30, 2009 | | | Balance at September 30, 2008 | | | Amount | | | Percent | |
| | | (dollars in thousands) | |
| | | | | | | | | | | | | |
| Noninterest-bearing demand | | $ | 68,155 | | | $ | 41,398 | | | $ | 26,757 | | | | 64.6 | % |
| Interest-bearing demand | | | 78,393 | | | | 55,450 | | | | 22,943 | | | | 41.4 | |
| Health savings accounts | | | 21,248 | | | | 21,122 | | | | 126 | | | | 0.6 | |
| Money market | | | 76,408 | | | | 51,142 | | | | 25,266 | | | | 49.4 | |
| Savings | | | 41,757 | | | | 26,409 | | | | 15,348 | | | | 58.1 | |
| Certificates of deposit | | | 228,897 | | | | 177,404 | | | | 51,493 | | | | 29.0 | |
| Total deposit accounts | | $ | 514,858 | | | $ | 372,925 | | | $ | 141,933 | | | | 38.1 | % |
The following table details our organic and acquired market deposit portfolios at September 30, 2009:
| | | September 30, 2009 | |
| | | (in thousands) | |
| | | Acquired | | | Organic | | | Total | |
| Noninterest-bearing demand | | $ | 26,123 | | | $ | 42,032 | | | $ | 68,155 | |
| Interest-bearing demand | | | 16,188 | | | | 62,205 | | | | 78,393 | |
| Health savings accounts | | | -- | | | | 21,248 | | | | 21,248 | |
| Money market | | | 20,510 | | | | 55,898 | | | | 76,408 | |
| Savings | | | 5,324 | | | | 36,433 | | | | 41,757 | |
| Certificates of deposit | | | 68,319 | | | | 160,578 | | | | 228,897 | |
| Total deposit accounts | | $ | 136,464 | | | $ | 378,394 | | | $ | 514,858 | |
The balance of deposits assumed in the Acquisition as of the acquisition date of August 7, 2009, included $68.0 million in demand and savings deposits and $75.5 million in certificates of deposit. Since the acquisition date through September 30, 2009, core deposit balances in the Central Oregon region have increased approximately $200,000 while the certificate of deposit balances declined $6.5 million, or 8.7%, as we are now offering rates on certificates of deposit that are lower than the rates that were being offered by the failed institution. Management in the Central Oregon region continues to focus on retaining and growing core deposits (checking, savings and money market accounts).
We believe increasing core deposits and reducing reliance on certificates of deposits is an important component in the strategy to transform the balance sheet toward a commercial bank. The investment in free-standing full-service banking offices, reduced reliance on in-store branches, and changes made in the management team and organizational alignment of the Bank’s retail banking program will help increase core deposit accounts, despite the significant challenges in our markets. Additionally, we hired several small business bankers and a commercial deposit officer in fiscal 2009 to develop a more effective commercial and small business deposit program.
Our deposit portfolio includes a concentration of low-cost health savings accounts. Health savings accounts totaled $21.2 million and $21.1 million at September 30, 2009 and 2008, respectively. Nearly all of these accounts are originated through broker relationships throughout the United States. We have limited control over these accounts as they are not local to our operating markets. Additionally, changes in tax law or the structure of health savings accounts could cause the balances to be withdrawn.
Interest-bearing checking accounts grew $22.9 million, with $6.8 million of that growth occurring organically. We attribute this growth to a new checking account offered in early calendar 2009 that offers a higher interest rate on balances up to $25,000 as long as the customer meets certain qualifiers each month that are intended to increase interchange fee income and reduce noninterest expense. At September 30, 2009, account balances in this product totaled $10.2 million with approximately 55% of that balance being new account relationships. We intend to launch this product in the Central Oregon region in the second quarter of fiscal year 2010.
Borrowings. Federal Home Loan Bank advances and other borrowings decreased $52.2 million, or 38.1%, to $84.7 million at September 30, 2009, from $137.0 million at September 30, 2008. We used principal payment proceeds from our mortgage-backed securities and residential loan portfolios to reduce our advances as they matured. FHLB borrowings with a fair value of $19.0 million assumed in the Acquisition were paid off prior to September 30, 2009.
We have $19.2 million of FHLB advances maturing in fiscal 2010 and intend to reduce outstanding advance balances as they mature as we had excess liquidity at September 30, 2009. We had $134.4 million of borrowing capacity available at the Federal Home Loan Bank of Seattle at September 30, 2009.
Equity. Stockholders’ equity increased $4.5 million, or 2.2%, to $209.7 million at September 30, 2009, from $205.2 million at September 30, 2008. The extraordinary gain associated with the acquisition was the primary cause for the increase in stockholders’ equity. The gain was offset by the repurchase of stock during the quarter ended March 31, 2009. In addition, dividends and a loss from operations in fiscal 2009 reduced retained earnings while a lower interest rate environment at September 30, 2009, increased the unrealized gain on securities by $5.3 million, net of tax, compared to September 30, 2008.
We completed the share repurchase program announced in December 2008 by buying 867,970 shares, or 5%, of the Company’s common stock. We announced another 5% repurchase plan in July 2009, which authorizes us to repurchase up to 834,900 additional shares. No shares have been repurchased under the July 2009 program and we do not anticipate purchasing shares at a price higher than the Company’s book value per share. We believe the preservation of capital is critical to executing our acquisition strategy.
COMPARISON OF OPERATING RESULTS FOR THE YEARS ENDED SEPTEMBER 30, 2009, AND SEPTEMBER 30 2008
General. Net income for the year ended September 30, 2009 was $8.1 million, or $0.52 per diluted share, compared to net income of $4.0 million, or $0.25 per diluted share, for the year ended September 30, 2008. Net income for the fiscal year ended September 30, 2009 included a $15.3 million after-tax extraordinary gain related to our FDIC- assisted acquisition of the former Community First Bank headquartered in Prineville, Oregon.
Net Interest Income. Net interest income increased $1.2 million, or 5.3%, to $23.9 million for the year ended September 30, 2009, from $22.6 million for the year ended September 30, 2008. The increase in net interest income was primarily attributable to lower interest expense on deposits due to aggressive reductions in interest rates initiated by the Federal Reserve during the early part of fiscal 2009. Our net interest margin increased 29 basis points to 3.50% for the year ended September 30, 2009, from 3.21% for the same period last year. The improvement in the net interest margin is primarily attributable to the decrease in interest expense as rates have decreased significantly from the prior year.
The following table sets forth the results of balance sheet growth and changes in interest rates to our net interest income. The rate column shows the effects attributable to changes in rate (changes in rate multiplied by prior volume). The volume column shows the effects attributable to changes in volume (changes in volume multiplied by prior rate). Changes attributable to both rate and volume, which cannot be segregated, are allocated proportionately to the changes in rate and volume.
| | | Year Ended September 30, 2009 Compared to September 30, 2008 Increase (Decrease) Due to | |
| | | Rate | | | Volume | | | Total | |
| | | (in thousands) | |
| Interest-earning assets: | | | | | | | | | |
| Loans receivable, net | | $ | (2,585 | ) | | $ | (556 | ) | | $ | (3,141 | ) |
| Loans held for sale | | | (4 | ) | | | 7 | | | | 3 | |
| Interest bearing deposits in other banks | | | (646 | ) | | | (282 | ) | | | (928 | ) |
| Investment securities, available for sale | | | -- | | | | 7 | | | | 7 | |
| Mortgage-backed securities | | | (304 | ) | | | (217 | ) | | | (521 | ) |
| Federal Home Loan Bank stock | | | (174 | ) | | | (2 | ) | | | (176 | ) |
| Total net change in income on interest-earning assets | | $ | (3,713 | ) | | $ | (1,043 | ) | | $ | (4,756 | ) |
| | | | | | | | | | | | | |
| Interest-bearing liabilities: | | | | | | | | | | | | |
| Savings deposits | | $ | 3 | | | $ | 56 | | | $ | 59 | |
| Interest-bearing demand deposits | | | (35 | ) | | | (2 | ) | | | (37 | ) |
| Money market accounts | | | (689 | ) | | | (69 | ) | | | (758 | ) |
| Certificates of deposit | | | (2,397 | ) | | | (476 | ) | | | (2,873 | ) |
| Total deposits | | | (3,118 | ) | | | (491 | ) | | | (3,609 | ) |
| Federal Home Loan Bank advances | | | (315 | ) | | | (2,034 | ) | | | (2,349 | ) |
| | | | | | | | | | | | | |
Total net change in expense on interest-bearing liabilities | | $ | (3,433 | ) | | $ | (2,525 | ) | | $ | (5,958 | ) |
| | | | | | | | | | | | | |
| Total increase in net interest income | | | | | | | | | | $ | 1,202 | |
Interest and Dividend Income. Total interest and dividend income for the year ended September 30, 2009 decreased $4.8 million, or 11.7%, to $35.8 million, from $40.6 million for the same period of the prior year. The decrease during the period was primarily attributable to the decrease in yield on interest-earning assets to 5.26% from 5.75% in the prior year. This decrease in interest and dividend income is the result of lower overall interest rates during the current year compared to prior year. In addition, nonaccrual loans are significantly higher than in the prior year, which resulted in foregone interest income of approximately $1.3 million. The yield on our loan portfolio declined to 5.85% in fiscal year 2009 compared to 6.40% in fiscal year 2008.
The following table compares detailed average earning asset balances, associated yields, and resulting changes in interest and dividend income for the years ended September 30, 2009 and 2008:
| | | Year Ended September 30, | |
| | | 2009 | | | 2008 | | | Increase/ | |
| | | Average Balance | | | Yield | | | Average Balance | | | Yield | | | (Decrease) in interest and dividend income | |
| | | (dollars in thousands) | |
Loans receivable, net of deferred fees/costs | | $ | 468,205 | | | | 5.85 | % | | $ | 477,053 | | | | 6.40 | % | | $ | (3,141 | ) |
| Loans held for sale | | | 3,176 | | | | 5.65 | | | | 2,811 | | | | 6.27 | | | | 3 | |
| Interest bearing deposits in other banks | | | 18,391 | | | | 0.27 | | | | 30,753 | | | | 3.18 | | | | (928 | ) |
Investment securities, available for sale | | | 1,503 | | | | 2.79 | | | | 1,243 | | | | 2.82 | | | | 7 | |
| Mortgage-backed securities | | | 179,729 | | | | 4.57 | | | | 184,343 | | | | 4.74 | | | | (521 | ) |
| FHLB stock | | | 9,760 | | | | (0.34 | ) | | | 9,591 | | | | 1.49 | | | | (176 | ) |
| Total interest-earning assets | | $ | 680,764 | | | | 5.26 | % | | $ | 705,794 | | | | 5.75 | % | | $ | (4,756 | ) |
At September 30, 2009, approximately 67.2% of our gross loans were adjustable rate, compared to 60.6% at September 30, 2008. At September 30, 2009, approximately 32.4% of our adjustable-rate loans are tied to the Prime rate, as published in The Wall Street Journal.
Interest Expense. Interest expense decreased $6.0 million, or 33.2%, to $12.0 million for the year ended September 30, 2009 from $17.9 million for the year ended September 30, 2008. The decrease was due to both declines in the average balance of total interest-bearing liabilities and cost of funds to $466.2 million and 2.57% from $512.1 million and 3.50% for the years ended September 30, 2009 and September 30, 2008, respectively. The decline in interest-bearing liabilities was concentrated in certificates of deposit and borrowings. Capitalized interest expense related to the construction of banking offices for the year ended September 30, 2009, was $56,000.
The following table details average balances, cost of funds and the change in interest expense for the year ended September 30, 2009 and 2008:
| | | Year Ended September 30, | |
| | | 2009 | | | 2008 | | | Increase/ | |
| | | Average Balance | | | Cost | | | Average Balance | | | Cost | | | (Decrease) in Interest Expense | |
| | | (dollars in thousands) | |
| | | | | | | | | | | | | | | | |
| Savings deposits | | $ | 33,513 | | | | 0.70 | % | | $ | 24,194 | | | | 0.73 | % | | $ | 59 | |
Interest-bearing demand deposits | | | 83,651 | | | | 0.53 | | | | 78,618 | | | | 0.61 | | | | (37 | ) |
| Money market deposits | | | 55,692 | | | | 1.21 | | | | 58,698 | | | | 2.44 | | | | (758 | ) |
| Certificates of deposit | | | 181,774 | | | | 3.15 | | | | 193,002 | | | | 4.45 | | | | (2,873 | ) |
| FHLB advances | | | 111,573 | | | | 4.39 | | | | 157,549 | | | | 4.60 | | | | (2,349 | ) |
| Total interest-bearing liabilities | | $ | 466,203 | | | | 2.57 | % | | $ | 512,061 | | | | 3.50 | % | | $ | (5,958 | ) |
Approximately $162.0 million and $25.9 million of certificates of deposit and FHLB advances, respectively, are scheduled to mature during fiscal 2010.
Provision for Loan Losses. A provision for loan losses of $16.1 million was recorded in connection with our analysis of losses in the loan portfolio for the year ended September 30, 2009, compared to a provision for loan losses of $2.4 million for the same period of 2008. The increase in the provision takes into account the increase in classified assets, nonperforming loans and loan losses during fiscal 2009 as well as the current downturn in the real estate market, internal changes in our lending and underwriting policies and the general economy.
We consider the allowance for loans losses at September 30, 2009, to be our best estimate of probable incurred losses inherent in the loan portfolio as of that date based on the assessment of the above-mentioned factors affecting the loan portfolio. While we believe the estimates and assumptions used in the determination of the allowance are reasonable, there can be no assurance that such estimates and assumptions will not be proven incorrect in the future, or that the actual amount of future provisions will not exceed the amount of past provisions or that any increased provision that may be required will not adversely impact our financial condition and results of operations. In addition, the determination of the amount of our allowance for loan losses is subject to review by bank regulators, as part of the routine examination process, which may result in the establishment of additional reserves based upon their judgment of information available to them at the time of their examination.
The following table details selected activity associated with the allowance for loan losses for the years ended September 30, 2009 and 2008:
| | | At or For the Year Ended September 30, | |
| | | 2009 | | | 2008 | |
| | | (dollars in thousands) | |
| Provision for loan losses | | $ | 16,085 | | | $ | 2,431 | |
| Net charge-offs | | | 8,740 | | | | 840 | |
| Allowance for loan losses | | | 28,735 | | | | 4,579 | |
Allowance for loan losses as a percentage of gross loans receivable at the end of the period | | | 5.32 | % | | | 0.98 | % |
Allowance for loan losses as a percentage of nonperforming loans at the end of the period | | | 74.65 | % | | | 46.04 | % |
| Nonperforming loans | | $ | 38,492 | | | $ | 9,945 | |
Nonaccrual and 90 days or more past due loans as a percentage of loans receivable at the end of the period | | | 7.13 | % | | | 2.14 | % |
| Loans receivable, net | | $ | 510,629 | | | $ | 459,813 | |
Noninterest Income. Noninterest income decreased $1.4 million, or 12.9%, to $9.3 million for the year ended September 30, 2009 from $10.7 million for the year ended September 30, 2008.
The following table provides a detailed analysis of the changes in components of noninterest income:
| | | Year Ended September 30, | | | Increase / (Decrease) | |
| | | 2009 | | | 2008 | | | Amount | | | Percent | |
| | | (dollars in thousands) | |
| | | | | | | | | | | | | |
| Service fees and charges | | $ | 8,302 | | | $ | 9,077 | | | $ | (775 | ) | | | (8.5 | )% |
| Gain on sale of loans | | | 1,218 | | | | 764 | | | | 454 | | | | 59.4 | |
Increase in cash surrender value of bank owned life insurance | | | 424 | | | | 421 | | | | 3 | | | | 0.7 | |
| Loan servicing fees | | | 68 | | | | 484 | | | | (416 | ) | | | (86.0 | ) |
| Mortgage servicing rights, net | | | (31 | ) | | | (340 | ) | | | 309 | | | | (90.9 | ) |
Prepayment on FHLB borrowings, net | | | (498 | ) | | | -- | | | | (498 | ) | | | -- | |
| Loss on sale of securities, net | | | (203 | ) | | | -- | | | | (203 | ) | | | -- | |
| Other | | | 11 | | | | 256 | | | | (245 | ) | | | (95.7 | ) |
| Total noninterest income | | $ | 9,291 | | | $ | 10,662 | | | $ | (1,371 | ) | | | (12.9 | )% |
The increase in the gain on sale of loans is a reflection of the low interest rate environment that has persisted for the majority of fiscal 2009. The low interest rate environment attributed to the significant increase in residential mortgage refinancings completed during fiscal 2009 as mortgage rates fell below 5.00% for most of the year. Loans originated for sale in the secondary market increased $20.9 million, or 45.5%, in 2009 compared to fiscal 2008.
During fiscal 2009, service fees and charges decreased 8.5% to $8.3 million. Nonsufficient fund (“NSF”) fee income decreased $814,000 or 12.0% from the year ago period. However this decline in NSF income was partially offset by a $336,000 decline in check losses. A continued weak economy may result in declines in consumer spending, which may reduce fee income due to the decline in the number of checking account and debit card transactions. Additionally, banking regulators and Congress are proposing legislation that could materially change our overdraft protection products and reduce the fees we can assess when customers overdraw their checking accounts.
Checking fee income represents a larger percentage of our total revenues that many of our peers due to a deposit gathering strategy implemented many years ago that we have begun to change. Historically, the Bank focused on high-transaction, low-balance “free checking” accounts that would result in high NSF fee income. We changed our strategy on deposit aggregation in 2006 to focus on building deeper relationships with our depositors that may result in fewer accounts with higher, more stable balances and less fee income. However, we believe these customers
improve the Bank’s franchise value and provide a stable, low-cost funding source for loans, which results in higher net interest income. We have also launched a checking account, mentioned earlier, that is structured to improve interchange fee income as a result of higher debit card usage. We believe this will offset some of the lost NSF fee income, but nonetheless, our revenues may be significantly reduced as a result of regulatory changes beyond our control in fiscal year 2010.
We incurred a $498,000 prepayment penalty on the early extinguishment of $19.0 million in FHLB borrowings assumed in the Acquisition. In addition, a $203,000 loss on the sale of securities was incurred during the year, which included an $184,000 loss on the sale of a private label collateralized mortgage obligation that was sold in order to reduce credit risk exposure. A portion of the securities sold included securities obtained in the Acquisition that were not consistent with our investment policy.
Noninterest Expense. Noninterest expense increased $4.4 million, or 17.7%, to $29.0 million for the year ended September 30, 2009 from $24.6 million for the year ended September 30, 2008. The efficiency ratio, which is the percentage of noninterest expense to net interest income plus noninterest income, increased to 87.4% for the year ended September 30, 2009, compared to 73.9% for the year ended September 30, 2008. The increase in the efficiency ratio is primarily due to the combination of increased expenses associated with troubled assets as well as events related to the Acquisition. Noninterest expenses related to the Acquisition totaled $197,000 and general operating expenses in the Central Oregon region totaled $762,000, together comprising $959,000 of the increase in overall noninterest expense in fiscal year 2009.
The following table provides a detailed analysis of the changes in components of noninterest expense:
| | | Year Ended September 30, | | | Increase / (Decrease) | |
| | | 2009 | | | 2008 | | | Amount | | | Percent | |
| | | (dollars in thousands) | |
| | | | | | | | | | | | | |
| Compensation and benefits | | $ | 15,918 | | | $ | 15,211 | | | $ | 707 | | | | 4.6 | % |
| Occupancy and equipment | | | 3,214 | | | | 3,007 | | | | 207 | | | | 6.9 | |
| Data processing | | | 2,483 | | | | 2,198 | | | | 285 | | | | 13.0 | |
| Advertising | | | 913 | | | | 1,043 | | | | (130 | ) | | | (12.5 | ) |
| Professional services | | | 1,460 | | | | 788 | | | | 672 | | | | 85.3 | |
| Insurance and taxes | | | 1,541 | | | | 533 | | | | 1,008 | | | | 189.1 | |
| Provision for REO | | | 1,129 | | | | 172 | | | | 957 | | | | 556.4 | |
| Other | | | 2,313 | | | | 1,659 | | | | 654 | | | | 39.4 | |
| Total noninterest expense | | $ | 28,971 | | | $ | 24,611 | | | $ | 4,360 | | | | 17.7 | % |
Compensation and benefits. Compensation and benefits increased $707,000 or 4.7% to $15.9 million for the year ended September 30, 2009 from $15.2 million for the same period a year ago. The largest factor in the increase was compensation which increased $504,000 or 5% due to the combination of annual merit increases as well as the additional compensation expenses incurred related to the Acquisition totaling $498,000. We currently estimate the Acquisition will add $3.0 million of compensation expense in fiscal 2010 as we plan to operate a separate operation and information technology system for the Central Oregon region until we consolidate to a new technology platform in the fourth quarter of fiscal 2010. Incentive expense increased $369,000 due to bonuses related to the Acquisition in fiscal 2009. These increases were offset by ESOP expenses which decreased $260,000 or 21% due to lower stock prices on average in fiscal 2009 than in fiscal 2008.
Professional services. The increase in professional services was twofold. A $279,000 increase in legal expenses from the prior year was due to both the Acquisition and the significant increase in troubled assets. External audit expenses increased $274,000 as a change in accounting methodology related to the timing of the recording of external audit expenses caused a one-time reduction in such expenses in fiscal 2008.
Insurance and taxes. The additional expense incurred for insurance and taxes is directly correlated to the current economic climate. Property taxes increased $333,000 mainly due to the payment of overdue property taxes on foreclosed property. FDIC assessment expense increased $651,000 as the FDIC dramatically increased assessment rates as well as levied a one-time special assessment fee during fiscal 2009.
Provision for REO. The increase in provision for REO is directly related to the significant increase in REO balances from the prior year. The REO balance increased from $650,000 as of September 30, 2008 to $18.4 million as of September 30, 2009. On a quarterly basis, all REO is evaluated and their respective carrying balances are adjusted downward if warranted. The $1.1 million of provision for REO expense represents additional adjustments downward in the carrying value of REO subsequent to foreclosure.
Income Tax Expense (Benefit). Income tax benefit from continuing operations was $4.8 million based on a pre-tax loss from operations of $11.9 million. This compares to income tax expense in the prior year of $2.3 million based on $6.3 million in pre-tax income. The extraordinary gain realized in fiscal 2009 was $15.3 million, net of $9.8 million in taxes.
COMPARISON OF OPERATING RESULTS FOR THE YEARS ENDED SEPTEMBER 30, 2008, AND SEPTEMBER 30 2007
General. Net income for the year ended September 30, 2008 was $4.0 million, or $0.25 per diluted share, compared to net income of $5.3 million, or $0.31 per diluted share, for the year ended September 30, 2007. The decrease in net income during fiscal 2008 was primarily due to a $2.0 million increase in the provision for loan losses, before the effect of income taxes. A $791,000 decline in noninterest income, primarily due to lower loan sale gains, and an $803,000 increase in noninterest expense offset a margin-driven increase in net interest income of $1.3 million.
Net Interest Income. Net interest income increased $1.3 million, or 6.3%, to $22.6 million for the year ended September 30, 2008, from $21.3 million for the year ended September 30, 2007. The increase in net interest income was primarily attributable to a lower balance of certificates of deposit and FHLB advances made possible by the Conversion proceeds.
Our net interest margin increased 18 basis points to 3.21% for the year ended September 30, 2008, from 3.03% for the same period last year. The improvement in the net interest margin is primarily attributable to the increase in interest earning assets that resulted from the proceeds of the Conversion completed on December 19, 2007. In addition, decreases in interest expense and a shift in the loan portfolio toward higher yielding commercial loans from residential mortgage loans also contributed to the increase in the margin in 2008.
The following table sets forth the results of balance sheet growth and changes in interest rates to our net interest income. The rate column shows the effects attributable to changes in rate (changes in rate multiplied by prior volume). The volume column shows the effects attributable to changes in volume (changes in volume multiplied by prior rate). Changes attributable to both rate and volume, which cannot be segregated, are allocated proportionately to the changes in rate and volume.
| | | Year Ended September 30, 2008 Compared to September 30, 2007 Increase (Decrease) Due to | |
| | | Rate | | | Volume | | | Total | |
| | | (dollars in thousands) | |
| Interest-earning assets: | | | | | | | | | |
| Loans receivable, net | | $ | (1,094 | ) | | $ | (1,713 | ) | | $ | (2,807 | ) |
| Loans held for sale | | | (7 | ) | | | (53 | ) | | | (60 | ) |
Investment securities, including interest-bearing deposits in other banks | | | (183 | ) | | | 850 | | | | 667 | |
| Mortgage-backed securities | | | (142 | ) | | | 192 | | | | 50 | |
| Federal Home Loan Bank stock | | | 95 | | | | -- | | | | 95 | |
| Total net change in income on interest-earning assets | | $ | (1,331 | ) | | $ | (724 | ) | | $ | (2,055 | ) |
| | | | | | | | | | | | | |
| Interest-bearing liabilities: | | | | | | | | | | | | |
| Savings deposits | | $ | 70 | | | $ | 4 | | | $ | 74 | |
| Interest-bearing demand deposits | | | (10 | ) | | | (77 | ) | | | (87 | ) |
| Money market accounts | | | (276 | ) | | | 492 | | | | 216 | |
| Certificates of deposit | | | (297 | ) | | | (1,500 | ) | | | (1,797 | ) |
| Total deposits | | | (513 | ) | | | (1,081 | ) | | | (1,594 | ) |
| Federal Home Loan Bank advances | | | 258 | | | | (2,065 | ) | | | (1,807 | ) |
| | | | | | | | | | | | | |
| Total net change in expense on interest-bearing liabilities | | $ | (255 | ) | | $ | (3,122 | ) | | $ | (3,401 | ) |
| | | | | | | | | | | | | |
| Total increase in net interest income | | | | | | | | | | $ | 1,346 | |
Interest and Dividend Income. Total interest and dividend income for the year ended September 30, 2008 decreased $2.1 million, or 4.8%, to $40.6 million, from $42.6 million for the same period of the prior year. The decrease during the period was primarily attributable to the decrease in yield on interest-earning assets to 5.75% from 6.06% in the prior year. This decrease in interest and dividend income is the result of lower overall interest rates during the current year compared to prior year. We believe the effect of the shift in the loan portfolio toward commercial loans from residential mortgage loans, which are lower yielding, helped to mitigate further declines in interest income.
The following table compares detailed average earning asset balances, associated yields, and resulting changes in interest and dividend income for the years ended September 30, 2008 and 2007:
| | | Year Ended September 30, | |
| | | 2008 | | | 2007 | | | Increase/ | |
| | | Average Balance | | | Yield | | | Average Balance | | | Yield | | | (Decrease) in interest and dividend income | |
| | | (dollars in thousands) | |
Loans receivable, net of deferred fees/costs | | $ | 477,053 | | | | 6.40 | % | | $ | 503,478 | | | | 6.62 | % | | $ | (2,807 | ) |
| Loans held for sale | | | 2,811 | | | | 6.27 | | | | 3,652 | | | | 6.46 | | | | (60 | ) |
Investment securities, available for sale, including interest-bearing deposits in other banks | | | 31,996 | | | | 3.16 | | | | 6,645 | | | | 5.19 | | | | 667 | |
| Mortgage-backed securities | | | 184,343 | | | | 4.74 | | | | 180,309 | | | | 4.82 | | | | 50 | |
| FHLB stock | | | 9,591 | | | | 1.49 | | | | 9,591 | | | | 0.50 | | | | 95 | |
| Total interest-earning assets | | $ | 705,794 | | | | 5.75 | % | | $ | 703,675 | | | | 6.06 | % | | $ | (2,055 | ) |
At September 30, 2008, approximately 60.6% of our gross loans were adjustable rate, compared to 56.9% at September 30, 2007. At September 30, 2008, approximately 15.1% of our adjustable-rate loans are tied to the Prime rate, as published in The Wall Street Journal.
Interest Expense. Interest expense decreased $3.4 million, or 15.9%, to $17.9 million for the year ended September 30, 2008 from $21.3 million for the year ended September 30, 2007. The decrease was due to both declines in the average balance of total interest-bearing liabilities and cost of funds to $512.1 million and 3.50% from $582.9 million and 3.66% for the years ended September 30, 2008 and September 30, 2007, respectively. The decline in interest-bearing liabilities was concentrated in certificates of deposit and borrowings. Capitalized interest expense related to the construction of banking offices for the year ended September 30, 2008, was $24,000.
The following table details average balances, cost of funds and the change in interest expense for the year ended September 30, 2008 and 2007:
| | | Year Ended September 30, | |
| | | 2008 | | | 2007 | | | Increase/ | |
| | | Average Balance | | | Cost | | | Average Balance | | | Cost | | | (Decrease) in Interest Expense | |
| | | (dollars in thousands) | |
| | | | | | | | | | | | | | | | |
| Savings deposits | | $ | 24,194 | | | | 0.73 | % | | $ | 23,397 | | | | 0.44 | % | | $ | 74 | |
Interest-bearing demand deposits | | | 78,618 | | | | 0.61 | | | | 91,198 | | | | 0.62 | | | | (87 | ) |
| Money market deposits | | | 58,698 | | | | 2.44 | | | | 39,908 | | | | 3.04 | | | | 216 | |
| Certificates of deposit | | | 193,002 | | | | 4.45 | | | | 226,522 | | | | 4.59 | | | | (1,797 | ) |
| FHLB advances | | | 157,549 | | | | 4.60 | | | | 201,911 | | | | 4.49 | | | | (1,807 | ) |
| Total interest-bearing liabilities | | $ | 512,061 | | | | 3.50 | % | | $ | 582,936 | | | | 3.66 | % | | $ | (3,401 | ) |
Approximately $133.3 million and $76.9 million of certificates of deposit and FHLB advances, respectively, are scheduled to mature during fiscal 2009. Treasury rates were significantly lower at the end of fiscal 2008 compared to the start of the fiscal year and short-term Treasury bill rates were near historical lows at the end of the year. However, the current financial crisis has caused rates on FHLB advances and certificates of deposit to be high compared to historical spreads above Treasury rates. This widening of spreads is due to depositor concerns about the stability of financial institutions and investor concerns about the survivability of Federal Home Loan Banks, thereby creating a higher risk premium for deposits and advances. We currently anticipate our certificates to reprice at rates slightly lower than their current costs, which would reduce interest expense, but we cannot be certain that lower market and Treasury rates will necessarily result in lower funding costs in fiscal 2009.
Provision for Loan Losses. A provision for loan losses of $2.4 million was recorded in connection with our analysis of losses in the loan portfolio for the year ended September 30, 2008, compared to a provision for loan losses of $409,000 for the same period of 2007. The increase in the provision takes into account the increase in classified assets during fiscal 2008 as well as the current downturn in the real estate market, internal changes in management and the general economy.
The following table details selected activity associated with the allowance for loan losses for the years ended September 30, 2008 and 2007:
| | | At or For the Year Ended September 30, | |
| | | 2008 | | | 2007 | |
| | | (dollars in thousands) | |
| Provision for loan losses | | $ | 2,431 | | | $ | 409 | |
| Net charge-offs | | | 840 | | | | 203 | |
| Allowance for loan losses | | | 4,579 | | | | 2,988 | |
Allowance for loan losses as a percentage of gross loans receivable at the end of the period | | | 0.98 | % | | | 0.62 | % |
Allowance for loan losses as a percentage of nonperforming loans at the end of the period | | | 46.04 | % | | | 195.17 | % |
| Nonperforming loans | | $ | 9,945 | | | $ | 1,531 | |
Nonaccrual and 90 days or more past due loans as a percentage of loans receivable at the end of the period | | | 2.14 | % | | | 0.32 | % |
| Loans receivable, net | | $ | 459,813 | | | $ | 480,118 | |
Noninterest Income. Noninterest income decreased $619,000, or 5.5%, to $10.7 million for the year ended September 30, 2008 from $11.3 million for the year ended September 30, 2007, as the gain on sale of loans decreased $655,000 or 46.2%.
The following table provides a detailed analysis of the changes in components of noninterest income:
| | | Year Ended September 30, | | | Increase / (Decrease) | |
| | | 2008 | | | 2007 | | | Amount | | | Percent | |
| | | (dollars in thousands) | |
| | | | | | | | | | | | | |
| Service fees and charges | | $ | 9,077 | | | $ | 9,308 | | | $ | (231 | ) | | | (2.5 | )% |
| Gain on sale of loans | | | 764 | | | | 1,419 | | | | (655 | ) | | | (46.2 | ) |
Increase in cash surrender value of bank owned life insurance | | | 421 | | | | 405 | | | | 16 | | | | 4.0 | |
| Loan servicing fees | | | 484 | | | | 549 | | | | (65 | ) | | | (11.8 | ) |
| Mortgage servicing rights, net | | | (340 | ) | | | (445 | ) | | | 105 | | | | 23.6 | |
| Other | | | 256 | | | | 45 | | | | 211 | | | | 468.9 | |
| Total noninterest income | | $ | 10,662 | | | $ | 11,281 | | | $ | (619 | ) | | | (5.5 | )% |
The decrease in the gain on sale of loans is a reflection of the significant slowing in the local residential real estate market as loans originated for sale in the secondary market declined $51.3 million, or 52.7%, in 2008 compared to fiscal 2007. We undertook an organizational realignment of our mortgage banking department in the third quarter of 2008 to improve efficiency and reduce delivery time.
During fiscal 2008, interchange, debit card and checking account service fee income increased 3.2% to $8.9 million, while check losses increased $347,000 to $963,000, offsetting the fee increase. Income from health savings accounts, which are also reported in service fees and charges, declined $76,000 to $269,000 during fiscal 2008.
Noninterest Expense. Noninterest expense increased $975,000, or 4.1%, to $24.6 million for the year ended September 30, 2008 from $23.6 million for the year ended September 30, 2007. The efficiency ratio increased to 73.7% for the year ended September 30, 2008, compared to 72.5% for the year ended September 30, 2007.
The following table provides a detailed analysis of the changes in components of noninterest expense:
| | | Year Ended September 30, | | | Increase / (Decrease) | |
| | | 2008 | | | 2007 | | | Amount | | | Percent | |
| | | (dollars in thousands) | |
| | | | | | | | | | | | | |
| Compensation and benefits | | $ | 15,211 | | | $ | 14,249 | | | $ | 962 | | | | 6.8 | % |
| Occupancy and equipment | | | 3,007 | | | | 2,871 | | | | 136 | | | | 4.7 | |
| Data processing | | | 2,198 | | | | 2,097 | | | | 101 | | | | 4.8 | |
| Advertising | | | 1,043 | | | | 1,427 | | | | (384 | ) | | | (26.9 | ) |
| Other | | | 3,152 | | | | 2,992 | | | | 160 | | | | 5.3 | |
| Total noninterest expense | | $ | 24,611 | | | $ | 23,636 | | | $ | 975 | | | | 4.1 | % |
Compensation and benefits. Compensation and benefits increased $962,000 or 6.8% to $15.2 million for the year ended September 30, 2008 from $14.2 million for the same period a year ago. The largest factor in the increase was the ESOP. At the completion of the Conversion in December 2007, additional shares were added to the ESOP and were the main contributor to the $435,000 or 54.9% increase in ESOP-related expense for the year ended September 30, 2008.
We also hired several commercial lending officers throughout fiscal 2008, with most of them joining the Company during the fourth quarter of fiscal 2008. However, we continue to closely monitor personnel costs as we employed 201 full-time equivalents at September 30, 2008, compared to 223 at September 30, 2007 and 240 at September 30, 2006.
Incentive compensation totaled $359,000 in 2008 compared to $140,000 in 2007 while commissions were $190,000 lower in 2008 due to lower loan production. The Board decided to award a discretionary bonus to non-executive employees in fiscal 2008. The executive officers of the Company, including the end-of-year Chief Executive Officer and Chief Financial Officer as well as the executive vice presidents of commercial and consumer banking, did not receive incentive income during fiscal 2008. The incentive award in fiscal 2007 was lower as no award was granted on the basis of the Company’s financial performance. Some incentive compensation was awarded to non-management employees in 2007 related to individual performance above expectations.
Advertising. Advertising expense decreased $384,000 or 26.9%. The amount of dollars spent on advertising dropped for a time coinciding with the portion of the year when the position of Director of Marketing was vacant.
Occupancy and Equipment and Data Processing. We launched a stand-alone full-service office in early fiscal 2008 as a replacement for an in-store branch that was closed.
Income Tax Expense (Benefit). Income tax expense decreased $1.0 million, or 30.7%, to $2.3 million for the year ended September 30, 2008 from $3.3 million for the same period a year ago. Income before income taxes decreased $2.3 million, or 26.6%, to $6.3 million for the year ended September 30, 2008 compared to $8.5 million for the year ended September 30, 2007. Our combined federal and state effective income tax rate for the current period was 36.1% compared to 38.3% for the same period of the prior year. The decrease was due to both an increase in the net downward adjustment of book net income before taxes due to book/tax differences to arrive at taxable net income as well as a decrease in overall book net income before taxes.
AVERAGE BALANCES, INTEREST AND AVERAGE YIELDS/COST
The following table sets forth for the periods indicated, information regarding average balances of assets and liabilities as well as the total dollar amounts of interest income from average interest-earning assets and interest expense on average interest-bearing liabilities, resultant yields, interest rate spread, net interest margin, and the ratio of average interest-earning assets to average interest-bearing liabilities. Average balances have been calculated using the average of daily balances during the period. Interest and dividends are reported on a tax-equivalent basis. During the time periods presented, we did not own any tax-exempt investment securities.
| | Year Ended September 30, | |
| | 2009 | | 2008 | �� | 2007 | |
| | Average Balance | | Interest And Dividends | | Yield/ Cost | | Average Balance | | Interest And Dividends | | Yield/ Cost | | Average Balance | | Interest And Dividends | | Yield/ Cost | |
| | (dollars in thousands) |
| Interest-earning assets: | | | | | | | | | | | | | | | | | | |
Loans receivable, net (1) | $468,205 | | $27,369 | | 5.85 | % | $477,053 | | $30,510 | | 6.40 | % | $503,478 | | $ 33,317 | | 6.62 | % |
| Loans held for sale | 3,176 | | 179 | | 5.65 | | 2,811 | | 176 | | 6.27 | | 3,652 | | 236 | | 6.46 | |
Interest bearing deposits in other banks | 18,391 | | 49 | | 0.27 | | 30,753 | | 977 | | 3.18 | | 6,645 | | 345 | | 5.19 | |
Investment securities, available for sale | 1,503 | | 42 | | 2.79 | | 1,243 | | 35 | | 2.82 | | -- | | -- | | -- | |
| Mortgage-backed securities | 179,729 | | 8,221 | | 4.57 | | 184,343 | | 8,742 | | 4.74 | | 180,309 | | 8,692 | | 4.82 | |
| FHLB stock | 9,760 | | (33 | ) | (0.34 | ) | 9,591 | | 143 | | 1.49 | | 9,591 | | 48 | | 0.50 | |
Total interest-earning assets | 680,764 | | $35,827 | | 5.26% | | 705,794 | | $40,583 | | 5.75 | % | 703,675 | | $ 42,638 | | 6.06 | % |
| Noninterest earning assets | 43,982 | | | | | | 38,627 | | | | | | 38,672 | | | | | |
| Total assets | $724,746 | | | | | | $744,421 | | | | | | $742,347 | | | | | |
| | | | | | | | | | | | | | | | | | | |
| Interest-bearing liabilities: | | | | | | | | | | | | | | | | | | |
| Savings deposits | $ 33,513 | | $ 236 | | 0.70 | % | $ 24,194 | | $ 177 | | 0.73 | % | $ 23,397 | | $ 103 | | 0.44 | % |
| Interest-bearing demand deposits | 83,651 | | 445 | | 0.53 | | 78,618 | | 482 | | 0.61 | | 91,198 | | 569 | | 0.62 | |
| Money market accounts | 55,692 | | 672 | | 1.21 | | 58,698 | | 1,430 | | 2.44 | | 39,908 | | 1,214 | | 3.04 | |
| Certificates of deposit | 181,774 | | 5,723 | | 3.15 | | 193,002 | | 8,596 | | 4.45 | | 226,522 | | 10,393 | | 4.59 | |
| Total deposits | 354,630 | | 7,076 | | 2.00 | | 354,512 | | 10,685 | | 3.01 | | 381,025 | | 12,279 | | 3.22 | |
| FHLB advances | 111,573 | | 4,901 | | 4.39 | | 157,549 | | 7,250 | | 4.60 | | 201,911 | | 9,057 | | 4.49 | |
Total interest-bearing liabilities | 466,203 | | $11,977 | | 2.57 | % | 512,061 | | $17,935 | | 3.50 | % | 582,936 | | $21,336 | | 3.66 | % |
| Noninterest-bearing liabilities | 55,779 | | | | | | 46,725 | | | | | | 48,493 | | | | | |
| Total liabilities | 521,982 | | | | | | 558,786 | | | | | | 631,429 | | | | | |
| Stockholders’ equity | 202,764 | | | | | | 185,635 | | | | | | 110,918 | | | | | |
| Total liabilities and equity | $724,746 | | | | | | $744,421 | | | | | | $742,347 | | | | | |
| | | | | | | | | | | | | | | | | | | |
| Net interest income | | | $23,850 | | | | | | $22,648 | | | | | | $21,302 | | | |
| Interest rate spread | | | 2.69 | % | | | | | 2.25 | % | | | | | 2.40 | % | | |
Net interest margin (2) | | | 3.50 | | | | | | 3.21 | | | | | | 3.03 | | | |
Ratio of average interest- earning assets to average interest-bearing liabilities | | | 146.02 | | | | | | 137.83 | | | | | | 120.71 | | | |
| (1) | Non-accrual loans are included in the average balance. Loan fees are included in interest income on loans and are insignificant. |
| (2) | Net interest margin, otherwise known as yield on interest earning assets, is calculated as net interest income divided by average interest-earning assets. |
The following table sets forth (on a consolidated basis) for the periods and at the dates indicated, the weighted average yields earned on our assets, the weighted average interest rates paid on our liabilities, together with the net yield on interest-earning assets:
| | At September 30, | | Year Ended September 30, |
| | 2009 | | 2009 | | 2008 | | 2007 |
| | | | | | | | |
| Weighted average yield on: | | | | | | | |
| Loans receivable, net | 6.20% | | 5.85% | | 6.40% | | 6.62% |
| Loans held for sale | 5.15 | | 5.65 | | 6.26 | | 6.46 |
| Interest bearing deposits in other banks | 0.04 | | 0.27 | | 3.18 | | 5.19 |
| Investment securities, available for sale | 3.09 | | 2.79 | | 2.82 | | -- |
| Mortgage-backed securities | 4.27 | | 4.57 | | 4.74 | | 4.82 |
| Federal Home Loan Bank stock | 0.00 | | (0.34) | | 1.49 | | 0.50 |
| Total interest-earning assets | 5.37 | | 5.26 | | 5.75 | | 6.06 |
| | | | | | | | |
| Weighted average rate paid on: | | | | | | | |
| Savings deposits | 0.96 | | 0.70 | | 0.73 | | 0.44 |
| Interest-bearing demand deposits | 0.59 | | 0.53 | | 0.61 | | 0.62 |
| Money market accounts | 1.00 | | 1.21 | | 2.44 | | 3.04 |
| Certificates of deposit | 2.63 | | 3.15 | | 4.45 | | 4.59 |
| Total deposits | 1.74 | | 2.00 | | 3.01 | | 3.22 |
| Federal Home Loan Bank advances | 4.00 | | 4.39 | | 4.60 | | 4.49 |
| Total interest-bearing liabilities | 2.10 | | 2.57 | | 3.50 | | 3.66 |
| | | | | | | | |
Interest rate spread (spread between weighted average rate on all interest- earning assets and all interest-bearing liabilities) | 3.27 | | 2.69 | | 2.25 | | 2.40 |
| | | | | | | | |
Net interest margin (net interest income as a percentage of average interest- earning assets) | N/A | | 3.50 | | 3.21 | | 3.03 |
| | | | | | | | |
RATE/VOLUME ANALYSIS
The following table sets forth the effects of changing rates and volumes on our net interest income. Information is provided with respect to: (1) effects on interest income attributable to changes in volume (changes in volume multiplied by prior rate); and (2) effects on interest income attributable to changes in rate (changes in rate multiplied by prior volume). Changes attributable to both rate and volume, which cannot be segregated, are allocated proportionately to the changes in rate and volume.
| | Year Ended September 30, 2009 Compared to Year Ended September 30, 2008 Increase (Decrease) Due to | | Year Ended September 30, 2008 Compared to Year Ended September 30, 2007 Increase (Decrease) Due to |
| | Rate | | Volume | | Total | | Rate | | Volume | | Total |
| | (dollars in thousands) |
| Interest-earning assets: | | | | | | | | | | | |
| Loans receivable, net | $ (2,585) | | $(556) | | $(3,141) | | $ (1,094) | | $(1,713) | | $(2,807) |
| Loans held for sale | (4) | | 7 | | 3 | | (7) | | (53) | | (60) |
Interest bearing deposits in other banks | (646) | | (282) | | (928) | | (183) | | 850 | | 667 |
Investment securities, available for sale | -- | | 7 | | 7 | | -- | | -- | | -- |
| Mortgage-backed securities | (304) | | (217) | | (521) | | (142) | | 192 | | 50 |
| Federal Home Loan Bank stock | (174) | | (2) | | (176) | | 95 | | -- | | 95 |
Total net change in income on interest- earning assets | $(3,713) | | $(1,043) | | $(4,756) | | $(1,331) | | $(724) | | $(2,055) |
| | | | | | | | | | | | |
| Interest-bearing liabilities: | | | | | | | | | | | |
| Savings deposits | $ 3 | | $ 56 | | $ 59 | | $ 70 | | $ 4 | | $ 74 |
| Interest-bearing demand deposits | (35) | | (2) | | (37) | | (10) | | (77) | | (87) |
| Money market accounts | (689) | | (69) | | (758) | | (276) | | 492 | | 216 |
| Certificates of deposit | (2,397) | | (476) | | (2,873) | | (297) | | (1,500) | | (1,797) |
| Total deposits | (3,118) | | (491) | | (3,609) | | (513) | | (1,081) | | (1,594) |
| Federal Home Loan Bank advances | (315) | | (2,034) | | (2,349) | | 258 | | (2,065) | | (1,807) |
| | | | | | | | | | | | |
| Total net change in expense on interest-bearing liabilities | $(3,433) | | $(2,525) | | $(5,958) | | $(255) | | $(3,122) | | $(3,401) |
| | | | | | | | | | | | |
| Total increase in net interest income | | | | | $1,202 | | | | | | $1,346 |
Interest expense for the year ended September 30, 2009 was reduced by $56,000. This amount represents that portion of interest attributed to borrowings related to construction of branches that was capitalized.
ASSET AND LIABILITY MANAGEMENT AND MARKET RISK
General. Our Board of Directors has established an asset and liability management policy to guide management in maximizing net interest rate spread by managing the differences in terms between interest-earning assets and interest-bearing liabilities while maintaining acceptable levels of liquidity, capital adequacy, interest rate sensitivity, changes in net interest income, credit risk and profitability. The policy includes the use of an Asset Liability Management Committee whose members include certain members of senior management. The Committee’s purpose is to communicate, coordinate and manage our asset/liability positions consistent with our business plan and Board-approved policies, as well as to price savings and lending products, and to develop new products.
The Asset Liability Management Committee meets to review various areas including:
| § | interest rate risk sensitivity; |
| § | change in net interest income |
| § | current market opportunities to promote specific products; |
| § | historical financial results; |
| § | projected financial results; and |
The Committee also reviews current and projected liquidity needs. As part of its procedures, the Asset Liability Management Committee regularly reviews interest rate risk by forecasting the impact of alternative interest rate environments on net interest income and market value of portfolio equity, which is defined as the net present value
of an institution’s existing assets, liabilities and off-balance sheet instruments, and evaluating such impacts against the maximum potential change in market value of portfolio equity that is authorized by the Board of Directors.
Our Risk When Interest Rates Change. The rates of interest we earn on assets and pay on liabilities generally are established contractually for a period of time. Market interest rates change over time. Our loans generally have longer maturities than our deposits. Accordingly, our results of operations, like those of other financial institutions, are impacted by changes in interest rates and the interest rate sensitivity of our assets and liabilities. The risk associated with changes in interest rates and our ability to adapt to these changes is known as interest rate risk and is our most significant market risk.
In recent years, we primarily have utilized the following strategies in our efforts to manage interest rate risk:
| § | we have increased our originations of shorter term loans and particularly, construction and land development loans and home equity loans; |
| § | we have structured our borrowings with maturities that match fund our loan and investment portfolios; |
| § | we have attempted, where possible, to extend the maturities of our deposits which typically fund our long-term assets; and |
| § | we have invested in securities with relatively short anticipated lives, generally three to five years. |
How We Measure the Risk of Interest Rate Changes. We measure our interest rate sensitivity on a quarterly basis utilizing an internal model. Management uses various assumptions to evaluate the sensitivity of our operations to changes in interest rates. Although management believes these assumptions are reasonable, the interest rate sensitivity of our assets and liabilities on net interest income and the market value of portfolio equity could vary substantially if different assumptions were used or actual experience differs from such assumptions. The assumptions we use are based upon proprietary and market data and reflect historical results and current market conditions. These assumptions relate to interest rates, prepayments, deposit decay rates and the market value of certain assets under the various interest rate scenarios. An independent service was used to provide decay rates and market rates of interest and certain interest rate assumptions to determine prepayments and maturities of real estate loans, investments and borrowings. Time deposits are modeled to reprice to market rates upon their stated maturities. We assumed that non-maturity deposits can be maintained with rate adjustments not directly proportionate to the change in market interest rates. In the past, we have demonstrated that the tiering structure of our deposit accounts during changing rate environments results in relatively low volatility and less than market rate changes in our interest expense for deposits. Our deposit accounts are tiered by balance and rate, whereby higher balances within an account earn higher rates of interest. Therefore, deposits that are not very rate sensitive (generally, lower balance tiers) are separated from deposits that are rate sensitive (generally, higher balance tiers).
When interest rates rise, we generally do not have to raise interest rates proportionately on less rate sensitive accounts to retain these deposits. These assumptions are based upon an analysis of our customer base, competitive factors and historical experience. The following table shows the change in our net portfolio value at September 30, 2009, that would occur upon an immediate change in interest rates based on our assumptions, but without giving effect to any steps that we might take to counteract that change. The net portfolio value is calculated based upon the present value of the discounted cash flows from assets and liabilities. The difference between the present value of assets and liabilities is the net portfolio value and represents the market value of equity for the given interest rate scenario. Net portfolio value is useful for determining, on a market value basis, how much equity changes in response to various interest rate scenarios. Large changes in net portfolio value reflect increased interest rate sensitivity and generally more volatile earnings streams.
| | | Net Portfolio Value (“NPV”) | | Net Portfolio as % of Portfolio Value of Assets |
Basis Point Change in Rates | | Amount | | $ Change (1) | | % Change | | NPV Ratio (2) | | % Change (3) | | Asset Market Value |
| | (dollars in thousands) |
| | | | | | | | | | | | | |
| 300 | | $ 214,742 | | $(15,165) | | (6.60)% | | 27.03% | | (0.51)% | | $794,613 |
| 200 | | 217,099 | | (12,807) | | (5.57) | | 26.95 | | (0.59) | | 805,524 |
| 100 | | 221,710 | | (8,197) | | (3.57) | | 27.08 | | (0.46) | | 818,749 |
| Base | | 229,907 | | -- | | -- | | 27.54 | | -- | | 834,835 |
| -100 | | 231,482 | | 1,576 | | 0.69 | | 27.36 | | (0.18) | | 846,047 |
| -200 | | 227,482 | | (2,424) | | (1.05) | | 26.58 | | (0.96) | | 855,946 |
| | | | | | | | | | | | | |
| Pre-Shock NPV Ratio | | | | | | 27.54 | | | | |
| Post-Shock NPV Ratio | | | | | | 26.95 | | | | |
| Static Sensitivity Measure – decline in NPV Ratio | | | | 0.59 | | | | |
| | | | | | | | | | | | | |
| Policy Maximum | | | | | | | | 3.00 | | | | |
| | | | | | | | | | | | | |
________
| (1) | Represents the increase (decrease) of the estimated net portfolio value at the indicated change in interest rates compared to the base net portfolio value. |
| (2) | Calculated as the estimated net portfolio value divided by the portfolio value of total assets. |
| (3) | Calculated as the increase (decrease) of the net portfolio value ratio assuming the indicated change in interest rates over the base net portfolio value ratio. |
The following table illustrates the change in net interest income at September 30, 2009, that would occur in the event of an immediate change in interest rates, but without giving effect to any steps that might be taken to counter the effect of that change in interest rates:
| Basis Point | | | Net Interest Income | |
| Change in Rates | | | Amount | | | $ Change (1) | | | % Change | |
| | | | (dollars in thousands) | |
| | | | | | | | | | | |
| | 300 | | | $ | 29,301 | | | $ | 2,002 | | | | 7.33% | |
| | 200 | | | | 28,565 | | | | 1,266 | | | | 4.64 | |
| | 100 | | | | 27,848 | | | | 548 | | | | 2.01 | |
| Base | | | | 27,300 | | | | -- | | | Base | |
| | -100 | | | | 27,002 | | | | (298) | | | | (1.09) | |
| | -200 | | | | 26,076 | | | | (1,224) | | | | (4.48) | |
________
| (1) | Represents the decrease of the estimated net interest income at the indicated change in interest rates compared to net interest income assuming no change in interest rates. |
We use certain assumptions in assessing our interest rate risk. These assumptions relate to interest rates, loan prepayment rates, deposit decay rates and the market values of certain assets under differing interest rate scenarios, among others. The table above also includes projected balances for loans and deposits, actual results for which may be materially different from those estimates.
As with any method of measuring interest rate risk, shortcomings are inherent in the method of analysis presented in the foregoing tables. For example, although assets and liabilities may have similar maturities or periods to repricing, they may react in different degrees to changes in the market interest rates. Also, the interest rates on certain types of assets and liabilities may fluctuate in advance of changes in market interest rates, while interest rates on other types may lag behind changes in market rates. Additionally, certain assets, such as adjustable rate mortgage loans, have features that restrict changes in interest rates on a short-term basis and over the life of the asset. Further, if interest
rates change, expected rates of prepayments on loans and early withdrawals from certificates of deposit could deviate significantly from those assumed in calculating the table.
LIQUIDITY AND COMMITMENTS
We are required to have sufficient cash flow in order to maintain liquidity to ensure a safe and sound operation. Historically, we have maintained cash flow above the minimum level believed to be adequate to meet the requirements of normal operations, including potential deposit outflows. On a quarterly basis, we review and update cash flow projections to ensure that adequate liquidity is maintained.
Our primary sources of funds are from customer deposits, loan repayments, loan sales, maturing investment securities and advances from the Federal Home Loan Bank of Seattle. These funds, together with retained earnings and equity, are used to make loans, acquire investment securities and other assets, and fund continuing operations. While maturities and the scheduled amortization of loans are a predictable source of funds, deposit flows and mortgage prepayments are greatly influenced by the level of interest rates, economic conditions and competition. We believe that our current liquidity position is sufficient to fund all of our existing commitments.
Liquidity management is both a daily and long-term function of business management. Excess liquidity is generally invested in short-term investments such as overnight deposits or mortgage-backed securities. On a longer-term basis, we maintain a strategy of investing in loans. At September 30, 2009, the total approved loan origination commitments outstanding was $7.8 million. At the same date, unused lines of credit were $46.2 million.
We use our sources of funds primarily to meet ongoing commitments, to pay maturing certificates of deposit and savings withdrawals, to fund loan commitments and to maintain our portfolio of mortgage-backed securities and investment securities.
Certificates of deposit scheduled to mature in one year or less at September 30, 2009, totaled $162.0 million, which represented 70.8% of our certificates of deposit portfolio at September 30, 2009. Management’s policy is to generally maintain deposit rates at levels that are competitive with other local financial institutions. Historically, the Bank has been able to retain a significant amount of deposits as they mature. However, recent deterioration in credit quality and capital levels at many of our competitors have limited their sources of wholesale funding, which has resulted in a highly price-competitive market for retail certificates of deposit. These rates currently exceed alternative costs of borrowings and are high compared to historical spreads to U.S. Treasury note rates. Additionally, since loan demand has slowed, we have been reluctant to offer rates in excess of wholesale borrowing costs. This has resulted in some deposit runoff as customers are moving their maturing balances to competitors at a higher pace than the Bank has historically experienced. Nonetheless, we believe the Company has adequate resources to fund all loan commitments through FHLB advances, loan repayments, maturing investment securities, and the sale of mortgage loans in the secondary markets. We had the ability at September 30, 2009, to borrow an additional $134.4 million from the Federal Home Loan Bank of Seattle. We are also approved at the Discount Window of the Federal Reserve Bank of San Francisco and could use that facility as a funding source to meet commitments and for liquidity purposes.
We measure our liquidity based on our ability to fund our assets and to meet liability obligations when they come due. Liquidity (and funding) risk occurs when funds cannot be raised at reasonable prices, or in a reasonable time frame, to meet our normal or unanticipated obligations. We regularly monitor the mix between our assets and our liabilities to manage effectively our liquidity and funding requirements.
Our primary source of funds is our deposits. When deposits are not available to provide the funds for our assets, we use alternative funding sources. These sources include, but are not limited to: cash management from the Federal Home Loan Bank of Seattle, wholesale funding, brokered deposits, federal funds purchased and dealer repurchase agreements, as well as other short-term alternatives. Alternatively, we may also liquidate assets to meet our funding needs.
We are highly dependent on the FHLB of Seattle to provide the primary source of wholesale funding for immediate liquidity and borrowing needs. The failure of the FHLB of Seattle or the FHLB system in general may materially impair our ability to meet our growth plans or to meet short and long term liquidity demands. However, our
mortgage backed securities are marketable and could be sold to obtain cash to meet liquidity demands should our access to FHLB funding be impaired.
We do not originate loans under a forward commitment with investors in the secondary market. Many financial institutions encountered liquidity impairment as loans that they securitized for resale were met with an abrupt absence of purchasers. As a result, cash flow was restricted and caused significant contraction in liquidity. Should we encounter a reduction in demand for loans in the secondary market, we can simply discontinue the origination of such loans.
CONTRACTUAL OBLIGATIONS
Through the normal course of operations, we have entered into certain contractual obligations. Our obligations generally relate to funding of operations through deposits and borrowings as well as leases for premises. Lease terms generally cover a five-year period, with options to extend, and are non-cancelable.
At September 30, 2009, scheduled maturities of contractual obligations were as follows:
| | | | | | | | | | | | | | | | |
| | | Within 1 Year | | | After 1 year through 3 Years | | | After 3 through 5 Years | | | Beyond | | | Total Balance | |
| | | (in thousands) | | | |
| | | | | | | | | | | | | | | | |
| Certificates of deposit | | $ | 161,969 | | | $ | 47,803 | | | $ | 18,908 | | | $ | 217 | | | $ | 228,897 | |
Federal Home Loan Bank advances and other borrowings | | | 25,887 | | | | 32,150 | | | | 25,700 | | | | 1,000 | | | | 84,737 | |
| Repurchase agreements | | | 1,797 | | | | -- | | | | -- | | | | -- | | | | 1,797 | |
Deferred compensation (1) | | | 255,957 | | | | 511,914 | | | | 511,914 | | | | 3,979,863 | | | | 5,259,648 | |
| Operating leases | | | 559 | | | | 422 | | | | 236 | | | | 3,052 | | | | 4,269 | |
| Total contractual obligations | | $ | 446,169 | | | $ | 592,289 | | | $ | 556,758 | | | $ | 3,984,132 | | | $ | 5,579,348 | |
(1) – Disclosed at the 9/30/09 present value of estimated payments assuming all future vesting conditions are met.
OFF-BALANCE SHEET ARRANGEMENTS
We are party to financial instruments with off-balance sheet risk in the normal course of business in order to meet the financing needs of our customers. These financial instruments generally include commitments to originate mortgage, commercial and consumer loans, and involve to varying degrees, elements of credit and interest rate risk in excess of the amount recognized in the balance sheet. Our maximum exposure to credit loss in the event of nonperformance by the borrower is represented by the contractual amount of those instruments. Because some commitments may expire without being drawn upon, the total commitment amounts do not necessarily represent future cash requirements. We use the same credit policies in making commitments as we do for on-balance sheet instruments. Collateral is not required to support commitments.
Undisbursed balances of loans closed include funds not disbursed but committed for construction projects. Unused lines of credit include funds not disbursed, but committed to, home equity, commercial and consumer lines of credit. Commercial letters of credit are conditional commitments issued by us to guarantee the performance of a customer to a third party. Those guarantees are primarily used to support public and private borrowing arrangements. The credit risk involved in issuing letters of credit is essentially the same as that involved in extending loan facilities to customers. Collateral is required in instances where we deem it necessary.
The following is a summary of commitments and contingent liabilities with off-balance sheet risks as of September 30, 2009:
| | | Contract or Notional Amount | |
| | | (in thousands) | |
| Commitments to originate loans: | | | |
| Fixed rate | | $ | 2,824 | |
| Adjustable rate | | | 4,949 | |
| Undisbursed balance of loans | | | 5,252 | |
| Unused lines of credit | | | 46,184 | |
| Total | | $ | 59,209 | |
CAPITAL
Consistent with our goal to operate a sound and profitable financial organization, we actively seek to maintain a “well capitalized” institution in accordance with regulatory standards. Home Federal Bank’s total equity capital was $153.5 million at September 30, 2009, or 19.9%, of total assets on that date. As of September 30, 2009, we exceeded all regulatory capital requirements. Our regulatory capital ratios at September 30, 2009 were as follows: Tier 1 capital 19.6%; Tier 1 (core) risk-based capital 33.6%; and total risk-based capital 34.9%. The regulatory capital requirements to be considered well capitalized are 5%, 6% and 10%, respectively. See “How We Are Regulated – Regulation and Supervision of Home Federal Bank – Capital Requirements” and Note 14 to the Consolidated Financial Statements under Item 8 to this Annual Report on Form 10-K.
We did not apply for government assistance through the Capital Purchase Program under the U.S. Treasury Department’s Troubled Asset Relief Program (“TARP”). We believe our high capital level and liquid balance sheet provides us flexibility in today's environment to execute our growth plans without TARP capital.
IMPACT OF INFLATION AND CHANGING PRICES
The Consolidated Financial Statements and related financial data presented herein have been prepared in accordance with accounting principles generally accepted in the United States of America. These principles generally require the measurement of financial position and operating results in terms of historical dollars, without considering changes in the relative purchasing power of money over time due to inflation.
Unlike most industrial companies, virtually all the assets and liabilities of a financial institution are monetary in nature. The primary impact of inflation is reflected in the increased cost of our operations. As a result, interest rates generally have a more significant impact on a financial institution’s performance than do general levels of inflation. Interest rates do not necessarily move in the same direction or to the same extent as the prices of goods and services. In a period of rapidly rising interest rates, the liquidity and maturity structures of our assets and liabilities are critical to the maintenance of acceptable performance levels.
The principal effect of inflation on earnings, as distinct from levels of interest rates, is in the area of noninterest expense. Expense items such as employee compensation, employee benefits and occupancy and equipment costs may be subject to increases as a result of inflation. An additional effect of inflation is the possible increase in dollar value of the collateral securing loans that we have made. Our management is unable to determine the extent, if any, to which properties securing loans have appreciated in dollar value due to inflation.
Deflation, or a decrease in overall prices from one period to the next, could have a negative impact on the Company’s operations and financial condition. Deflationary periods impute a higher borrowing cost to debtors as the purchasing power of a dollar increases with time. This may decrease the demand for loan products offered by the Bank.
Inflation also indirectly impacts the Company through the pressure it may place on consumer and commercial borrowers. For example, as commodity prices rose rapidly during calendar year 2008, national delinquency rates on loans increased as the cost of gasoline and food significantly eroded disposable income available to consumers. As a
result, they were unable to service their debt obligations as a greater share of their income was used to meet ordinary daily expenditures.
RECENT ACCOUNTING PRONOUNCEMENTS
In June 2009, the Financial Accounting Standards Board (“FASB”) issued Statement of Financial Accounting Standards (“SFAS”) No. 168, The FASB Accounting Standards CodificationTM and the Hierarchy of Generally Accepted Accounting Principles – a replacement of FASB Statement No. 162. With the issuance of SFAS 168, the FASB Accounting Standards Codification (“Codification”) became the single source of authoritative U.S. accounting and reporting standards applicable for all nongovernmental entities, with the exception of guidance issued by the SEC. This change is effective for financial statements issued for interim or annual periods ending after September 15, 2009. Updates to the Codification are promulgated through an Accounting Standards Update (“ASU”). The Codification does not modify existing GAAP or any guidance issued by the SEC. GAAP accounting standards used to populate the Codification are superseded, with the exception of certain standards yet to be codified as of September 30, 2009, including SFAS 166 and 167 described subsequently.
In June 2009, the FASB issued SFAS No. 166, Accounting for Transfers of Financial Assets, an amendment of FASB Statement No. 140, and SFAS No. 167, Amendments to FASB Interpretation No. 46(R). These Statements modify the accounting for transfers of financial assets and the determination of what entities must be consolidated, and will have a significant effect on securitizations and special-purpose entities. We will adopt these Statements effective January 1, 2010, as required. Management is evaluating the impact these Statements may have on the Company’s financial statements.
ASC 855 includes new guidance on subsequent events that became effective for the second quarter of 2009. The definition of subsequent events was modified and entities are required to disclose the date through which subsequent events have been evaluated and the basis for that date. Adoption of this guidance was not significant to the Company’s financial statements.
ASC 260 includes new guidance which clarifies that unvested share-based payment awards with rights to receive nonforfeitable dividends are participating securities and should be included in the computation of earnings per share. This new guidance is effective for the Company on October 1, 2009 and will require retrospective application to earnings per share information.
ASC 320 includes amended other-than-temporary impairment (“OTTI”) guidance in GAAP for debt securities to make the guidance more operational and to improve the presentation and disclosure of OTTI on debt and equity securities in the financial statements. It provides for the bifurcation of OTTI into (i) amounts related to credit losses, which are recognized through earnings, and (ii) amounts related to all other factors that are recognized as a component of other comprehensive income. The provisions of ASC 320-10-65 were effective for the Company’s interim period ended on June 30, 2009.
ASC 805 establishes principles and requirements for how an acquirer recognizes and measures in its financial statements the identifiable assets acquired, the liabilities assumed, and the goodwill acquired. The standard also establishes disclosure requirements to enable the evaluation of the nature and financial effects of the business combination. ASC 805 is effective for fiscal years beginning after December 15, 2008, or October 1, 2009, for the Company. The acquisition described in Note 2 was accounted for under SFAS No. 141 as the Company was not permitted to adopt ASC 805 early.
Item 7A. Quantitative and Qualitative Disclosures About Market Risk
The information contained under “Item 7. Management's Discussion and Analysis of Financial Condition and Results of Operations - Asset and Liability Management and Market Risk” of this Annual Report on Form 10-K is incorporated herein by reference.
Item 8. Financial Statements and Supplementary Data
INDEX TO CONSOLIDATED FINANCIAL STATEMENTS
| | Page |
| | |
| Management’s Annual Report on Internal Control Over Financial Reporting | 91 |
| | |
| Report of Independent Registered Public Accounting Firm | 92 |
| | |
| Consolidated Balance Sheets as of September 30, 2009 and 2008 | 94 |
| | |
Consolidated Statements of Income For the Years Ended September 30, 2009, 2008 and 2007 | 95 |
| | |
Consolidated Statements of Stockholders’ Equity and Comprehensive Income For the Years Ended September 30, 2009, 2008 and 2007 | 96 |
| | |
Consolidated Statements of Cash Flows For the Years Ended September 30, 2009, 2008 and 2007 | 98 |
| | |
| Selected Notes to Consolidated Financial Statements | 100 |
MANAGEMENT’S ANNUAL REPORT ON INTERNAL CONTROL OVER FINANCIAL REPORTING
The management of Home Federal Bancorp, Inc. (the "Company") is responsible for establishing and maintaining adequate internal control over financial reporting, as defined in Rule 13a-15(f) of the Securities Exchange Act of 1934. The Company's internal control over financial reporting is a process designed to provide reasonable assurance regarding the reliability of financial reporting and the preparation of financial statements for external purposes in accordance with generally accepted accounting principles.
This process includes policies and procedures that: (i) pertain to the maintenance of records that, in reasonable detail, accurately and fairly reflect the transactions of the Company; (ii) provide reasonable assurance that transactions are recorded as necessary to permit preparation of financial statements in accordance with generally accepted accounting principles, and that receipts and expenditures of the Company are being made only in accordance with authorizations of management and directors of the Company; and (iii) provide reasonable assurance regarding prevention or timely detection of unauthorized acquisition, use or disposition of the Company's assets that could have a material effect on the financial statements. Because of its inherent limitations, internal control over financial reporting may not prevent or detect misstatements, and can provide only reasonable, not absolute, assurance that the objectives of the control system are met. Furthermore, because of changes in conditions, the effectiveness of internal control may vary over time.
The Company's management, with the participation of the Chief Executive Officer and Chief Financial Officer, assessed the effectiveness of the Company's internal control over financial reporting as of September 30, 2009. Management's assessment was based on criteria described in the Internal Control-Integrated Framework issued by the Committee of Sponsoring Organizations of the Treadway Commission ("COSO"). This assessment excluded the internal control over financial reporting of Community First Bank the operations of which were acquired on August 7, 2009, through a purchase and assumption agreement between the Company’s subsidiary, Home Federal Bank, and the Federal Deposit Insurance Corporation as Receiver for Community First Bank. The assets acquired constituted approximately 18.8% of total assets reported on the Company’s consolidated balance sheet as of September 30, 2009. Based on that assessment, the Company's management concluded that the Company's internal control over financial reporting was effective as of September 30, 2009.
Management's assessment of the effectiveness of the Company's internal control over financial reporting as of September 30, 2009 has been audited by Moss Adams LLP, the Company's independent registered public accounting firm who audits the Company's consolidated financial statements. The Report of Independent Registered Public Accounting Firm also excludes the internal control over financial reporting of Community First Bank and expresses an unqualified opinion on the effectiveness of the Company's internal control over financial reporting as of September 30, 2009.
| /s/ Len E. Williams | /s/ Eric S. Nadeau |
| Len E. Williams | Eric S. Nadeau |
| President and | Executive Vice President and |
| Chief Executive Officer | Chief Financial Officer |
Dated: December 11, 2009
REPORT OF INDEPENDENT REGISTERED
PUBLIC ACCOUNTING FIRM
To the Board of Directors and Stockholders
Home Federal Bancorp, Inc. and Subsidiary
Nampa, Idaho
We have audited the accompanying consolidated balance sheets of Home Federal Bancorp, Inc. and Subsidiary (the Company) as of September 30, 2009 and 2008, and the related consolidated statements of income, changes in stockholders’ equity and comprehensive income, and cash flows for each of the years in the three-year period ended September 30, 2009. We also have audited the Company’s internal control over financial reporting as of September 30, 2009, based on criteria established in Internal Control - Integrated Framework issued by the Committee of Sponsoring Organizations of the Treadway Commission (COSO). The Company’s management is responsible for these financial statements, for maintaining effective internal control over financial reporting, and for its assessment of the effectiveness of internal control over financial reporting included in the accompanying Management’s Report on Internal Controls over Financial Reporting. Our responsibility is to express an opinion on these financial statements and an opinion on the Company’s internal control over financial reporting based on our audits.
We conducted our audits in accordance with auditing standards of the Public Company Accounting Oversight Board (United States). Those standards require that we plan and perform the audits to obtain reasonable assurance about whether the financial statements are free of material misstatement and whether effective internal control over financial reporting was maintained in all material respects. Our audits of the financial statements included examining, on a test basis, evidence supporting the amounts and disclosures in the financial statements, assessing the accounting principles used and significant estimates made by management, and evaluating the overall financial statement presentation. Our audit of internal control over financial reporting included obtaining an understanding of internal control over financial reporting, assessing the risk that a material weakness exists, and testing and evaluating the design and operating effectiveness of internal control based on the assessed risk. Our audits also included performing such other procedures as we considered necessary in the circumstances. We believe that our audits provide a reasonable basis for our opinions.
As described in Management’s Report on Internal Control over Financial Reporting, management has excluded Community First Bank from its assessment of internal control over financial reporting as of September 30, 2009 because its operations were acquired through a purchase and assumption agreement between the Company’s subsidiary, Home Federal Bank, and the Federal Deposit Insurance Corporation as Receiver for Community First Bank on August 7, 2009. We have also excluded Community First Bank from our audit of internal control over financial reporting. The assets acquired constituted approximately 18.8% of total assets reported on the Company’s consolidated balance sheet as of September 30, 2009.
A Company’s internal control over financial reporting is a process designed to provide reasonable assurance regarding the reliability of financial reporting and the preparation of financial statements for external purposes in accordance with accounting principles generally accepted in the United States of America. A Company’s internal control over financial reporting includes those policies and procedures that (1) pertain to the maintenance of records that, in reasonable detail, accurately and fairly reflect the transactions and dispositions of the assets of the Company; (2) provide reasonable assurance that transactions are recorded as necessary to permit preparation of financial statements in accordance with accounting principles generally accepted in the United States of America, and that receipts and expenditures of the Company are being made only in accordance with authorizations of management and directors of the Company; and (3) provide reasonable assurance regarding prevention or timely detection of unauthorized acquisition, use, or disposition of the Company’s assets that could have a material effect on the financial statements.
Because of its inherent limitations, internal control over financial reporting may not prevent or detect misstatements. Also, projections of any evaluation of effectiveness to future periods are subject to the risk that controls may become inadequate because of changes in conditions, or that the degree of compliance with the policies or procedures may deteriorate.
In our opinion, the consolidated financial statements referred to above present fairly, in all material respects, the consolidated financial position of Home Federal Bancorp, Inc. and Subsidiary as of September 30, 2009 and 2008,
and the results of their operations and their cash flows for each of the years in the three-year period ended September 30, 2009, in conformity with accounting principles generally accepted in the United States of America. Also in our opinion, Home Federal Bancorp, Inc. and Subsidiary maintained, in all material respects, effective internal control over financial reporting as of September 30, 2009, based on criteria established in Internal Control - Integrated Framework issued by the Committee of Sponsoring Organizations of the Treadway Commission (COSO).
/s/Moss Adams LLP
Spokane, Washington
December 11, 2009
HOME FEDERAL BANCORP, INC. AND SUBSIDIARY CONSOLIDATED BALANCE SHEETS (In thousands, except share data) | | September 30, 2009 | | | September 30, 2008 | |
| | | | | | | |
| ASSETS | | | | | | |
| Cash and amounts due from depository institutions | | $ | 49,953 | | | $ | 23,270 | |
| Certificate of deposit in correspondent bank | | | -- | | | | 5,000 | |
| Investments available for sale, at fair value | | | 169,320 | | | | 188,787 | |
| Federal Home Loan Bank stock, at cost | | | 10,326 | | | | 9,591 | |
| Loans receivable, net of allowance for loan losses of $28,735 | | | | | | | | |
| and $4,579 | | | 510,629 | | | | 459,813 | |
| Loans held for sale | | | 862 | | | | 2,831 | |
| Accrued interest receivable | | | 2,781 | | | | 2,681 | |
| Property and equipment, net | | | 20,462 | | | | 15,246 | |
| Mortgage servicing rights, net | | | -- | | | | 1,707 | |
| Bank owned life insurance | | | 12,014 | | | | 11,590 | |
| Real estate and other property owned | | | 18,391 | | | | 650 | |
| Deferred tax asset | | | -- | | | | 1,770 | |
| FDIC indemnification receivable, net | | | 30,038 | | | | -- | |
| Other assets | | | 3,123 | | | | 2,134 | |
| TOTAL ASSETS | | $ | 827,899 | | | $ | 725,070 | |
| | | | | | | | | |
| LIABILITIES AND STOCKHOLDERS’ EQUITY | | | | | | | | |
| LIABILITIES | | | | | | | | |
| Deposit accounts | | | | | | | | |
| Noninterest-bearing demand deposits | | $ | 68,155 | | | $ | 41,398 | |
| Interest-bearing demand deposits | | | 176,049 | | | | 127,714 | |
| Savings deposits | | | 41,757 | | | | 26,409 | |
| Certificates of deposit | | | 228,897 | | | | 177,404 | |
| Total deposit accounts | | | 514,858 | | | | 372,925 | |
| Advances by borrowers for taxes and insurance | | | 1,132 | | | | 1,386 | |
| Interest payable | | | 553 | | | | 552 | |
| Deferred compensation | | | 5,260 | | | | 5,191 | |
| Federal Home Loan Bank advances and other borrowings | | | 84,737 | | | | 136,972 | |
| Deferred tax liability | | | 5,571 | | | | -- | |
| Other liabilities | | | 6,123 | | | | 2,857 | |
| Total liabilities | | | 618,234 | | | | 519,883 | |
| COMMITMENTS AND CONTINGENCIES (Note 13) | | | | | | | | |
| | | | | | | | | |
| STOCKHOLDERS’ EQUITY | | | | | | | | |
| Serial preferred stock, $.01 par value; 10,000,000 authorized, | | | | | | | | |
| issued and outstanding, none | | | -- | | | | -- | |
| Common stock, $.01 par value; 90,000,000 authorized, | | | | | | | | |
| issued and outstanding: | | | 167 | | | | 174 | |
| Sept. 30, 2009 – 17,445,311 issued, 16,698,168 outstanding | | | | | | | | |
| Sept. 30, 2008 – 17,412,449 issued, 17,374,161 outstanding | | | | | | | | |
| Additional paid-in capital | | | 150,782 | | | | 157,205 | |
| Retained earnings | | | 64,483 | | | | 59,813 | |
| Unearned shares issued to ESOP | | | (9,699 | ) | | | (10,605 | ) |
| Accumulated other comprehensive income (loss) | | | 3,932 | | | | (1,400 | ) |
| Total stockholders’ equity | | | 209,665 | | | | 205,187 | |
| TOTAL LIABILITIES AND STOCKHOLDERS’ EQUITY | | $ | 827,899 | | | $ | 725,070 | |
See accompanying notes.
| HOME FEDERAL BANCORP, INC. AND SUBSIDIARY | |
CONSOLIDATED STATEMENTS OF INCOME (In thousands, except share and per share data) | | Year Ended September 30, | |
| | | 2009 | | | 2008 | | | 2007 | |
| | | | | | | | | | |
| Interest and dividend income: | | | | | | | | | |
| Loan interest | | $ | 27,548 | | | $ | 30,686 | | | $ | 33,553 | |
| Mortgage-backed securities interest | | | 8,221 | | | | 8,742 | | | | 8,692 | |
| Other interest and dividends | | | 58 | | | | 1,155 | | | | 393 | |
| Total interest and dividend income | | | 35,827 | | | | 40,583 | | | | 42,638 | |
| Interest expense: | | | | | | | | | | | | |
| Deposits | | | 7,076 | | | | 10,685 | | | | 12,279 | |
| Federal Home Loan Bank borrowings | | | 4,901 | | | | 7,250 | | | | 9,057 | |
| Total interest expense | | | 11,977 | | | | 17,935 | | | | 21,336 | |
| Net interest income | | | 23,850 | | | | 22,648 | | | | 21,302 | |
| Provision for loan losses | | | 16,085 | | | | 2,431 | | | | 409 | |
| Net interest income after provision for loan losses | | | 7,765 | | | | 20,217 | | | | 20,893 | |
| Noninterest income: | | | | | | | | | | | | |
| Service charges and fees | | | 8,302 | | | | 9,077 | | | | 9,308 | |
| Gain on sale of loans | | | 1,218 | | | | 764 | | | | 1,419 | |
Increase in cash surrender value of bank owned life insurance | | | 424 | | | | 421 | | | | 405 | |
| Loan servicing fees | | | 68 | | | | 484 | | | | 549 | |
| Prepayment penalty on borrowings | | | (498 | ) | | | -- | | | | -- | |
| Gain (loss) on sale of securities | | | (203 | ) | | | -- | | | | 4 | |
| Mortgage servicing rights, net | | | (31 | ) | | | (340 | ) | | | (445 | ) |
| Other | | | 11 | | | | 256 | | | | 41 | |
| Total noninterest income | | | 9,291 | | | | 10,662 | | | | 11,281 | |
| Noninterest expense: | | | | | | | | | | | | |
| Compensation and benefits | | | 15,918 | | | | 15,211 | | | | 14,249 | |
| Occupancy and equipment | | | 3,214 | | | | 3,007 | | | | 2,871 | |
| Data processing | | | 2,483 | | | | 2,198 | | | | 2,097 | |
| Advertising | | | 913 | | | | 1,043 | | | | 1,427 | |
| Postage and supplies | | | 574 | | | | 617 | | | | 650 | |
| Professional services | | | 1,460 | | | | 788 | | | | 856 | |
| Insurance and taxes | | | 1,541 | | | | 533 | | | | 429 | |
| Provision for REO | | | 1,129 | | | | 172 | | | | -- | |
| Other | | | 1,739 | | | | 1,042 | | | | 1,057 | |
| Total noninterest expense | | | 28,971 | | | | 24,611 | | | | 23,636 | |
| Income (loss) before income taxes | | | (11,915 | ) | | | 6,268 | | | | 8,538 | |
| Income tax expense (benefit) | | | (4,750 | ) | | | 2,263 | | | | 3,267 | |
| Income (loss) before extraordinary item | | | (7,165 | ) | | | 4,005 | | | | 5,271 | |
| Extraordinary gain on acquisition, less income tax of $9,756 | | | 15,291 | | | | -- | | | | -- | |
| Net income | | $ | 8,126 | | | $ | 4,005 | | | $ | 5,271 | |
| | | | | | | | | | | | | |
| Earnings (loss) per common share before extraordinary item: | | | | | | | | | | | | |
| Basic | | $ | (0.46 | ) | | $ | 0.25 | (1) | | $ | 0.32 | (1) |
| Diluted | | | (0.46 | ) | | | 0.25 | (1) | | | 0.31 | (1) |
| Earnings per common share after extraordinary item: | | | | | | | | | | | | |
| Basic | | $ | 0.52 | | | $ | 0.25 | (1) | | $ | 0.32 | (1) |
| Diluted | | | 0.52 | | | | 0.25 | (1) | | | 0.31 | (1) |
| Weighted average number of shares outstanding: | | | | | | | | | | | | |
| Basic | | | 15,651,250 | | | | 16,233,200 | (1) | | | 16,602,082 | (1) |
| Diluted | | | 15,651,250 | | | | 16,252,747 | (1) | | | 16,767,219 | (1) |
| | | | | | | | | | | | | |
| Dividends declared per share: | | $ | 0.220 | | | $ | 0.213 | (1) | | $ | 0.194 | (1) |
(1) Earnings per share, average shares outstanding, and dividends per share have been adjusted to reflect the impact of the Conversion which occurred on December 19, 2007.
See accompanying notes.
HOME FEDERAL BANCORP, INC. AND SUBSIDIARY
CONSOLIDATED STATEMENTS OF STOCKHOLDERS' EQUITY AND COMPREHENSIVE INCOME
(In thousands, except share data)
| | Common Stock | Additional Paid-In Capital | Retained Earnings | Unearned Shares Issued to Employee Stock Ownership Plan | Accumulated Other Comprehensive Income (Loss) | Total |
| Shares | Amount |
| Balance at September 30, 2006 | 15,169,114 | $ 152 | $ 57,222 | $ 54,805 | $ (4,134) | $ (176) | $ 107,869 |
| Restricted stock issued, net of forfeitures | (6,924) ) | | | | | | -- |
| ESOP shares committed to be released | | | 357 | | 436 | | 793 |
| Exercise of stock options | 70,053 | | 854 | | | | 854 |
Share-based compensation expense | | | 1,036 | | | | 1,036 |
| Excess tax benefits from equity compensation plans | | | 144 | | | | 144 |
Dividends paid ($0.194 per share)(1)(2) | | | | (1,281) | | | (1,281) |
| Comprehensive income: | | | | | | | |
| Net income | | | | 5,271 | | | 5,271 |
Other comprehensive income: | | | | | | | |
| Change in unrealized holding loss on securities available for sale, net of taxes of $(67) | | | | | | (100) | (100) |
| Unrealized holding loss resulting from transfer of securities from held to maturity to available for sale, net of taxes of $(1,299) | | | | | | (1,949) | (1,949) |
| Comprehensive income: | | | | | | | 3,222 |
| Balance at September 30, 2007 | 15,232,243 | 152 | 59,613 | 58,795 | (3,698) | (2,225) | 112,637 |
| | | | | | | | |
| (continues on next page) | | | | | | | |
See accompanying notes.
HOME FEDERAL BANCORP, INC. AND SUBSIDIARY
CONSOLIDATED STATEMENTS OF STOCKHOLDERS' EQUITY AND COMPREHENSIVE INCOME (Continued)
(In thousands, except share data)
| | Common Stock | Additional Paid-In Capital | Retained Earnings | Unearned Shares Issued to Employee Stock Ownership Plan | Accumulated Other Comprehensive Income (Loss) | Total |
| | Shares | Amount |
Balance at September 30, 2007 (balance carried forward) | | | 15,232,243 | | | | 152 | | | | 59,613 | | | | 58,795 | | | | (3,698 | ) | | | (2,225 | ) | | | 112,637 | |
| | | | | | | | | | | | | | | | | | | | | | | | | | | | | |
| Second Step Conversion | | | 2,073,619 | | | | 21 | | | | 95,938 | | | | | | | | (8,160 | ) | | | | | | | 87,799 | |
| Dissolution of Mutual Holding Company | | | | | | | | | | | 50 | | | | | | | | | | | | | | | | 50 | |
| Restricted stock issued, net of forfeitures | | | 13,502 | | | | | | | | | | | | | | | | | | | | | | | | -- | |
| ESOP shares committed to be released | | | | | | | | | | | (23 | ) | | | | | | | 1,253 | | | | | | | | 1,230 | |
| Exercise of stock options | | | 54,797 | | | | 1 | | | | 605 | | | | | | | | | | | | | | | | 606 | |
| Share-based compensation | | | | | | | | | | | 1,022 | | | | | | | | | | | | | | | | 1,022 | |
Dividends paid ($0.213 per share)(1)(2) | | | | | | | | | | | | | | | (2,987 | ) | | | | | | | | | | | (2,987 | ) |
| Comprehensive income: | | | | | | | | | | | | | | | | | | | | | | | | | | | | |
Net income | | | | | | | | | | | | | | | 4,005 | | | | | | | | | | | | 4,005 | |
Other comprehensive income: | | | | | | | | | | | | | | | | | | | | | | | | | | | | |
Change in unrealized holding loss on securities available for sale, net of taxes of $550 | | | | | | | | | | | | | | | | | | | | | | | 825 | | | | 825 | |
Comprehensive income: | | | | | | | | | | | | | | | | | | | | | | | | | | | 4,830 | |
| Balance at September 30, 2008 | | | 17,374,161 | | | | 174 | | | | 157,205 | | | | 59,813 | | | | (10,605 | ) | | | (1,400 | ) | | | 205,187 | |
Restricted stock issued, net of forfeitures | | | 159,115 | | | | 2 | | | | (2 | ) | | | | | | | | | | | | | | | | |
| ESOP shares committed to be released | | | | | | | | | | | 63 | | | | | | | | 906 | | | | | | | | 969 | |
| Exercise of stock options | | | 32,862 | | | | | | | | 353 | | | | | | | | | | | | | | | | 353 | |
| Share-based compensation | | | | | | | | | | | 1,088 | | | | | | | | | | | | | | | | 1,088 | |
| Treasury shares purchased | | | (867,970 | ) | | | (9 | ) | | | (7,888 | ) | | | | | | | | | | | | | | | (7,897 | ) |
| Dividends paid ($0.220 per share) | | | | | | | | | | | | | | | (3,456 | ) | | | | | | | | | | | (3,456 | ) |
| Tax adjustment from equity compensation plans | | | | | | | | | | | (37 | ) | | | | | | | | | | | | | | | (37 | ) |
| Comprehensive income: | | | | | | | | | | | | | | | | | | | | | | | | | | | | |
| Loss before extraordinary item | | | | | | | | | | | | | | | (7,165 | ) | | | | | | | | | | | (7,165 | ) |
| Extraordinary gain, net of tax | | | | | | | | | | | | | | | 15,291 | | | | | | | | | | | | 15,291 | |
| Other comprehensive income: | | | | | | | | | | | | | | | | | | | | | | | | | | | | |
| Change in unrealized holding loss on securities available for sale, net of taxes of $3,473 | | | | | | | | | | | | | | | | | | | | | | | 5,210 | | | | 5,210 | |
| Adjustment for realized losses, net of taxes of $81: | | | | | | | | | | | | | | | | | | | | | | | 122 | | | | 122 | |
Comprehensive income | | | | | | | | | | | | | | | | | | | | | | | | | | | 20,623 | |
| Balance at September 30, 2009 | | | 16,698,168 | | | $ | 167 | | | $ | 150,782 | | | $ | 64,483 | | | $ | (9,699 | ) | | $ | 3,932 | | | $ | 209,665 | |
(1) Home Federal MHC waived its receipt of dividends on the 8,979,246 shares that it owned.
(2) Dividends per share have been adjusted to reflect the impact of the Conversion, which occurred on December 19, 2007.
See accompanying notes.
HOME FEDERAL BANCORP, INC. AND SUBSIDIARY CONSOLIDATED STATEMENTS OF CASH FLOWS (In thousands) | | Year Ended September 30, | |
| | | 2009 | | | 2008 | | | 2007 | |
CASH FLOWS FROM OPERATING ACTIVITIES: | | | | | | | | | |
| Net income | | $ | 8,126 | | | $ | 4,005 | | | $ | 5,271 | |
| Adjustments to reconcile net income to cash provided by operating activities: | | | | | | | | | | | | |
| Depreciation and amortization | | | 1,716 | | | | 1,699 | | | | 1,712 | |
Net amortization (accretion) of premiums and discounts on investments | | | 45 | | | | (19 | ) | | | (62 | ) |
| Loss on sale of fixed assets and repossessed assets | | | 178 | | | | 144 | | | | 2 | |
| Loss (Gain) on sale of securities available for sale | | | 203 | | | | -- | | | | (4 | ) |
| Extraordinary gain on acquisition | | | (25,047 | ) | | | -- | | | | -- | |
| ESOP shares committed to be released | | | 969 | | | | 1,230 | | | | 793 | |
| Equity compensation expense | | | 1,088 | | | | 1,022 | | | | 1,036 | |
| Provision for loan losses | | | 16,085 | | | | 2,431 | | | | 409 | |
| Valuation allowance on real estate and other property owned | | | 1,129 | | | | -- | | | | -- | |
| Accrued deferred compensation expense, net | | | 69 | | | | 676 | | | | 640 | |
| Net deferred loan fees | | | (115 | ) | | | 132 | | | | 81 | |
| Deferred income tax (benefit) expense | | | 3,787 | | | | (1,075 | ) | | | (535 | ) |
| Excess tax benefit from equity compensation plans | | | -- | | | | -- | | | | (144 | ) |
| Net gain on sale of loans | | | (1,218 | ) | | | (764 | ) | | | (1,419 | ) |
| Proceeds from sale of loans held for sale | | | 70,019 | | | | 48,543 | | | | 97,503 | |
| Originations of loans held for sale | | | (66,833 | ) | | | (45,895 | ) | | | (97,154 | ) |
| Net decrease in value of mortgage servicing rights | | | -- | | | | 340 | | | | 445 | |
| Net increase in value of bank owned life insurance | | | (424 | ) | | | (422 | ) | | | (405 | ) |
| Change in assets and liabilities: | | | | | | | | | | | | |
| Interest receivable | | | 847 | | | | 123 | | | | 222 | |
| Other assets | | | (341 | ) | | | 176 | | | | (801 | ) |
| Interest payable | | | (242 | ) | | | (179 | ) | | | (240 | ) |
| Other liabilities | | | 1,402 | | | | (2,274 | ) | | | 331 | |
| Net cash provided by operating activities | | | 11,443 | | | | 9,893 | | | | 7,681 | |
CASH FLOWS FROM INVESTING ACTIVITIES: | | | | | | | | | | | | |
Proceeds from maturity of mortgage-backed securities held to maturity | | | -- | | | | -- | | | | 13,094 | |
Principal repayments and maturities of securities available for sale | | | 38,564 | | | | 31,123 | | | | 15,013 | |
| Purchase of mortgage-backed securities available for sale | | | (2,734 | ) | | | (56,257 | ) | | | (2,102 | ) |
| Maturity of (investment in) certificate of deposit | | | 5,000 | | | | (5,000 | ) | | | -- | |
| Proceeds from sale of securities available for sale | | | 10,947 | | | | -- | | | | 3,848 | |
| Purchase of securities available for sale | | | (3,037 | ) | | | -- | | | | -- | |
| Sale of mortgage servicing rights | | | 1,707 | | | | -- | | | | -- | |
| Purchases of property and equipment | | | (6,912 | ) | | | (4,643 | ) | | | (1,181 | ) |
| Net decrease in loans | | | 31,749 | | | | 17,000 | | | | 22,190 | |
| Net of cash received from acquisition | | | 22,078 | | | | -- | | | | -- | |
| Proceeds from sale of fixed assets and repossessed assets | | | 2,121 | | | | 759 | | | | 172 | |
| Net cash provided (used) by investing activities | | | 99,483 | | | | (17,018 | ) | | | 51,034 | |
| | | | | | | | | | | | | |
| (continues on next page) | |
See accompanying notes.
HOME FEDERAL BANCORP, INC. AND SUBSIDIARY CONSOLIDATED STATEMENTS OF CASH FLOWS (Continued) (In thousands) | |
| | | Year Ended September 30, | |
| | | 2009 | | | 2008 | | | 2007 | |
| | | | | | | | | | |
| CASH FLOWS FROM FINANCING ACTIVITIES: | | | | | | | | | |
| Net decrease in deposits | | | (1,526 | ) | | | (31,684 | ) | | | (25,672 | ) |
| Net decrease in advances by borrowers for taxes and insurance | | | (254 | ) | | | (219 | ) | | | (528 | ) |
| Proceeds from Federal Home Loan Bank borrowings | | | 23,100 | | | | 68,215 | | | | 153,860 | |
| Repayment of Federal Home Loan Bank borrowings | | | (96,063 | ) | | | (111,973 | ) | | | (183,889 | ) |
| Proceeds from other borrowings | | | 1,500 | | | | -- | | | | -- | |
| Proceeds from exercise of stock options | | | 353 | | | | 606 | | | | 854 | |
| Repurchases of common stock | | | (7,897 | ) | | | -- | | | | -- | |
| Excess tax benefit from equity compensation plans | | | -- | | | | -- | | | | 144 | |
| Dividends paid | | | (3,456 | ) | | | (2,987 | ) | | | (1,281 | ) |
Net proceeds from stock issuance and exchange pursuant to second step conversion | | | -- | | | | 87,849 | | | | -- | |
| Net cash (used) provided by financing activities | | | (84,243 | ) | | | 9,807 | | | | (56,512 | ) |
| | | | | | | | | | | | | |
NET INCREASE IN CASH AND CASH EQUIVALENTS | | | 26,683 | | | | 2,682 | | | | 2,203 | |
| CASH AND CASH EQUIVALENTS, BEGINNING OF YEAR | | | 23,270 | | | | 20,588 | | | | 18,385 | |
| CASH AND CASH EQUIVALENTS, END OF YEAR | | $ | 49,953 | | | $ | 23,270 | | | $ | 20,588 | |
| | | | | | | | | | | | | |
| SUPPLEMENTAL DISCLOSURE OF CASH FLOW INFORMATION: | | | | | | | | | | | | |
| Cash paid during the year for: | | | | | | | | | | | | |
| Interest | | $ | 11,976 | | | $ | 18,115 | | | $ | 21,576 | |
| Income taxes | | | 2,545 | | | | 3,535 | | | | 3,800 | |
| | | | | | | | | | | | | |
| NONCASH INVESTING AND FINANCING ACTIVITIES: | | | | | | | | | | | | |
| Acquisition of real estate and other assets in settlement of loans | | $ | 19,513 | | | $ | 1,394 | | | $ | 703 | |
Fair value adjustment to securities available for sale, net of taxes | | | 5,332 | | | | 825 | | | | (100 | ) |
| Transfer of securities from held to maturity to available for sale | | | -- | | | | -- | | | | 171,668 | |
Fair value adjustment to securities available for sale, net of taxes as a result of transferring securities from held to maturity to available for sale | | | -- | | | | -- | | | | (1,949 | ) |
See accompanying notes.
HOME FEDERAL BANCORP, INC. AND SUBSIDIARY
SELECTED NOTES TO CONSOLIDATED FINANCIAL STATEMENTS
Note 1 - Summary of Significant Accounting Policies
Nature of Business and Reorganization. Home Federal Bancorp, Inc. (the “Company”), was formed as the new stock holding company for Home Federal Bank (the “Bank”) in connection with the Company’s conversion from a mutual holding company structure to a stock holding company structure, which was completed on December 19, 2007 (“Conversion”). Prior to the completion of the Conversion, the Bank was the subsidiary of Home Federal Bancorp, Inc., a federally-chartered stock mid-tier holding company (“old Home Federal Bancorp”), which was a subsidiary of Home Federal MHC, a federally-chartered mutual holding company. The Bank formed Home Federal MHC in December 2004. As a result of the Conversion, Home Federal MHC and old Home Federal Bancorp ceased to exist and were replaced by the Company as the successor to old Home Federal Bancorp.
As part of the Conversion, a total of 9,384,000 new shares of the Company were sold at $10 per share in subscription, community and syndicated community offerings through which the Company received proceeds of approximately $87.8 million, net of offering costs of approximately $5.9 million. The Company contributed $48.0 million or approximately 50% of the net proceeds to the Bank in the form of a capital contribution. The Company loaned $8.2 million to the Bank’s Employee Stock Ownership Plan (the “ESOP”) and the ESOP used those funds to acquire 816,000 shares of the Company’s common stock at $10 per share. As part of the Conversion, shares of outstanding common stock of old Home Federal Bancorp were exchanged for 1.136 shares of the Company’s common stock. No fractional shares were issued. Instead, cash was paid to stockholders at $10 per share for any fractional shares that would otherwise be issued. The exchange resulted in an additional 852,865 outstanding shares of the Company for a total of 17,325,901 outstanding shares as of the closing of the Conversion, after giving effect to the redemption of fractional shares.
The Conversion was accounted for as a reorganization in corporate form with no change in the historical basis of the Company’s assets, liabilities and equity. All references to the number of shares outstanding, with the exception of those reported on the Balance Sheet, are restated to give retroactive recognition to the exchange ratio applied in the Conversion.
The Bank was founded in 1920 as a building and loan association and reorganized as a federal mutual savings and loan association in 1936. The Bank is a community-oriented financial institution dedicated to serving the financial service needs of consumers and businesses within its market area. The Bank’s primary business is attracting deposits from the general public and using these funds to originate loans. It emphasizes the origination of loans secured by first mortgages on owner-occupied, residential real estate, residential development and construction, and commercial real estate. To a lesser extent, it originates other types of real estate loans, commercial business loans and consumer loans.
Home Federal Bank currently has operations in two distinct market areas. The Boise, Idaho, and surrounding area known as the Treasure Valley region of southwestern Idaho, which includes Ada, Canyon, Elmore, and Gem counties and the Tri-County Region of Central Oregon including the counties of Deschutes, Crook and Jefferson. In total the Bank has 23 full-service banking offices, one loan center, 24 automated teller machines and Internet banking services.
Home Federal Bank has one wholly-owned subsidiary, Idaho Home Service Corporation, which was established in 1981 as Home Service Corporation for the purpose of facilitating various business activities. Since 2000, Idaho Home Service Corporation has been inactive.
In preparing these financial statements, the Company has evaluated events and transactions for potential recognition or disclosure through December 11, 2009, the date the financial statements were available to be issued.
Principles of Consolidation. The consolidated financial statements of the Company include the accounts of the Company, the Bank and its wholly-owned subsidiary, Idaho Home Service Corporation. All intercompany transactions and balances have been eliminated in consolidation.
Use of Estimates in the Preparation of Financial Statements. The consolidated financial statements have been prepared in accordance with accounting principles generally accepted in the United States of America. In preparing the financial statements, management is required to make estimates and assumptions that affect the reported amounts of certain assets and liabilities as of the date of the statement of financial condition and certain revenues and expenses for the period. Actual results could differ, either positively or negatively, from those estimates. Material estimates that are particularly susceptible to significant change in the near-term relate to the determination of the allowance for loan losses, the evaluation of impaired loans, loans acquired with deteriorated credit quality, the FDIC indemnification asset, the valuation of real estate and other property owned (“REO”) as well as deferred income taxes.
Management believes that the allowance for loan losses reflects the best estimate of probable incurred losses inherent in the loan portfolio at the balance sheet dates presented and that the valuation of REO and computation of deferred taxes are proper. While management uses currently available information to recognize losses on loans, future additions to the allowance may be necessary based on changes in economic conditions. In addition, various regulatory agencies, as an integral part of their examination process, periodically review the Company’s allowance for loan losses. Such agencies may require the Company to recognize additions to the allowance based on their judgments of information available to them at the time of their examination.
Cash and Cash Equivalents. For the purposes of reporting cash flows, the Company has defined cash and cash equivalents as those amounts included in the consolidated balance sheet caption Cash and amounts due from depository institutions. Cash and cash equivalents, including interest-bearing deposits, are on deposit with other banks and financial institutions in amounts that periodically exceed the federal insurance limit. Management believes that its risk of loss associated with such balances is minimal due to the financial strength of the banks and financial institutions. The Company has not experienced any losses in such accounts.
Cash on Hand and in Banks. The Company is required to maintain an average reserve balance with the Federal Reserve Bank, or maintain such reserve in cash on hand. The amount of this required reserve balance at September 30, 2009 and 2008 was $5.4 million and $1.8 million, respectively.
Securities Available for Sale. Available for sale securities consist of mortgage-backed securities and obligations of U.S. Government Sponsored Enterprises. Unrealized holding gains and losses, net of tax, on available for sale securities are reported as a net amount in a separate component of equity until realized. Gains and losses on the sale of available for sale securities are determined using the specific-identification method and are included in earnings.
Declines in the fair value of individual available for sale securities below their cost that are other than temporary result in write-downs of the individual securities to their fair value. In estimating other than temporary losses, management considers, among other things, (1) the length of time and the extent to which the fair value has been less than cost, (2) the financial condition and near term prospectus of the issuer, and (3) the Company’s ability and intent to hold the security for a period of time sufficient to allow for any anticipated recovery in fair value. Any such write-downs would be included in earnings as realized losses. Management believes that all unrealized losses on investment securities at September 30, 2009 and 2008 are temporary.
Federal Home Loan Bank (“FHLB”) Stock. As a member of the FHLB of Seattle, the Bank is required to maintain a minimum level of investment in capital stock of the FHLB based on specific percentages of its outstanding FHLB advances, total assets and mortgages. The Bank's investment in FHLB of Seattle stock is carried at par value ($100 per share), which reasonably approximates its fair value. The Bank may request redemption at par value of any stock in excess of the amount the Bank is required to hold. FHLB stock is restricted as to purchase, sale, and redemption.
Loans Held for Sale. Mortgage loans originated and intended for sale in the secondary market are carried at the lower of cost or estimated market value in the aggregate. Net unrealized losses, if any, are recognized through a valuation allowance by charges to income.
Loan commitments related to the origination of mortgage loans held for sale and the corresponding sales contracts are considered derivative instruments as defined by Accounting Standards Codification Topic (“ASC”) 815, “Derivatives and Hedging.” If material, these derivatives are recognized on the consolidated balance sheet in other assets and other liabilities at fair value.
Loans Receivable and Allowance for Loan Losses. The Bank grants commercial, real estate, and consumer loans to customers. A substantial portion of the loan portfolio is represented by commercial real estate and residential real estate loans. The ability of the Bank’s debtors to honor their contracts is dependent upon the real estate market and/or general economic conditions in the Bank’s market area.
Loans are stated at the amount of unpaid principal, adjusted for deferred loan fees and related costs and an allowance for loan losses. Interest on loans is calculated by using the simple interest method on daily balances of the principal amount outstanding. Interest income is accrued on the unpaid balance. Loan origination fees, net of certain direct origination costs, are deferred and recognized as an adjustment of the related loan yield using the interest method.
The accrual of interest on loans is discontinued at the time the loan is 90 days delinquent, or in the opinion of management, the collection of interest is questionable. Thereafter, no interest is taken into income unless received in cash or until such time as the borrower demonstrates the ability to resume payments of principal and interest.
Premiums and discounts on purchased loans are amortized over the estimated life of the loans as an adjustment to yield using the interest method.
A loan is considered impaired when, based on current information and events, it is probable that the Bank will be unable to collect the scheduled payments of principal or interest when due according to the contractual terms of the loan agreement. Factors considered by management in determining impairment include payment status, collateral value, and the probability of collecting scheduled principal and interest payments when due. Loans that experience insignificant payment delays and payment shortfalls generally are not classified as impaired. Management determines the significance of payment delays and payment shortfalls on a case-by-case basis, taking into consideration all of the circumstances surrounding the loan and the borrower, including the length of the delay, the reasons for the delay, the borrower’s prior payment record, and the amount of the shortfall in relation to the principal and interest owed. Impairment is measured on a loan-by-loan basis for non-homogeneous loan types and larger balance homogeneous loan types by either the present value of expected future cash flows discounted at the loan’s effective interest rate, the loan’s obtainable market price, or the fair value of the collateral if the loan is collateral dependent.
Management believes the allowance for loan losses represents the best estimate of probable incurred losses inherent in our loan portfolio. The allowance is based upon a periodic review of loans which includes consideration of actual net loan loss experience, changes in the size and character of the loan portfolio, identification of individual problem situations that may affect the borrower's ability to pay, and an evaluation of current economic conditions. Loan losses are recognized through charges to the allowance.
Troubled Debt Restructuring. Loans occasionally may be restructured to provide a reduction or deferral of interest or principal payments. This generally occurs when the financial condition of a borrower deteriorates to the point where the borrower needs to be given temporary or permanent relief from the original contractual terms of the loan. A loan restructured in a troubled debt restructuring is an impaired loan and is accounted for as such.
Real Estate and Other Property Owned. Real estate and other property owned acquired through foreclosure, lien, judgments or deeds in lieu of foreclosure are stated at the lower of cost or estimated fair market value less selling costs. When the property is acquired, any excess of the loan balance over the estimated net realizable value is charged to the reserve for loan losses. Holding costs, subsequent write-downs to estimated fair market value less selling costs, if any, or any disposition gains or losses are included in noninterest income and expenses. Costs of development and improvement of the property are capitalized if the costs are determined to be recoverable.
Property and Equipment. Properties and equipment are stated at cost, less accumulated depreciation and amortization. Leasehold improvements are amortized over the term of the lease or the estimated useful life of the
improvements, whichever is less. Depreciation and amortization are generally computed using the straight-line method for financial statement purposes over the following estimated useful lives and lease periods:
| Buildings and leasehold improvements | 15-40 years |
| Furniture, equipment, and automobiles | 3-12 years |
The normal costs of maintenance and repairs are charged to expense as incurred.
FDIC Indemnification Asset. On August 7, 2009, the Bank entered into a purchase and assumption agreement with the Federal Deposit Insurance Corporation (“FDIC”) in connection with a failed bank. See Note 2 for additional information on this transaction. The loans and REO purchased from the FDIC are covered by a loss share agreement between the FDIC and the Bank which affords the Bank significant protection. Under this agreement, the FDIC will reimburse Home Federal Bank for 80% of the first $34.0 million of losses and 95% on realized losses that exceed $34.0 million. Realized losses covered by the loss sharing agreement include loan contractual balances (and related unfunded commitments that were acquired), accrued interest on loans for up to 90 days, the book value of foreclosed real estate acquired, and certain direct costs, less cash or other consideration received by Home Federal Bank. Management has estimated the amount of losses inherent in the acquired loan and foreclosed real estate portfolios and the amounts that would be receivable from the FDIC upon a loss event. The Bank cannot submit claims of loss until certain events occur, as defined under the purchase and assumption agreement. As such, the indemnification asset is subject to a high degree of uncertainty and estimation as to the timing of the losses and subsequent recovery of a portion of those losses under the loss sharing agreement.
Income Taxes. Deferred income taxes are reported for temporary differences between items of income or expense reported in the financial statements and those reported for income tax purposes. Deferred taxes are computed using the asset and liability approach as prescribed in ASC Topic 740, “Income Taxes.” Under this method, a deferred tax asset or liability is determined based on the enacted tax rates that will be in effect when the differences between the financial statement carrying amounts and tax basis of existing assets and liabilities are expected to be reported in the Company’s income tax returns. The deferred tax provision for the year is equal to the net change in the net deferred tax liability from the beginning to the end of the year, less amounts applicable to the change in value related to investments available for sale. The effect on deferred taxes of a change in tax rates is recognized as income in the period that includes the enactment date.
ASC 740 requires recognition and measurement of uncertain tax positions using a "more-likely-than-not" approach. The Company analyzed its tax positions, including the permanent and temporary differences as well as the major components of income and expense, and determined that it had no uncertain tax positions that would rise to the level of having a material effect on its financial statements at September 30, 2009 and 2008. It is the Company’s policy to record interest and penalties as a component of the provision for income taxes.
Comprehensive Income: Accounting principles generally require that recognized revenue, expenses, gains, and losses be included in net income. Although certain changes in assets and liabilities, such as unrealized gains and losses on available for sale securities, are reported as separate components of the equity section of the statement of financial condition, such items, along with net income are components of comprehensive income.
The components of other comprehensive income and related tax effects are as follows:
| | | Year Ended September 30, | |
| | | 2009 | | | 2008 | | | 2007 | |
| | | (in thousands) | |
| | | | |
| Unrealized holding gain (loss) on available for sale securities | | $ | 9,089 | | | $ | 1,376 | | | $ | (3,411 | ) |
| Reclassification adjustment for gain realized in income | | | (203 | ) | | | -- | | | | (4 | ) |
| | | | | | | | | | | | | |
| Net unrealized gain (loss) | | | 8,886 | | | | 1,376 | | | | (3,415 | ) |
| Tax effect | | | (3,554 | ) | | | (551 | ) | | | 1,366 | |
| | | | | | | | | | | | | |
| Unrealized gain (loss) net of tax | | $ | 5,332 | | | $ | 825 | | | $ | (2,049 | ) |
Advertising Costs. Advertising costs are expensed as incurred. Advertising expense for the years ended September 30, 2009, 2008, and 2007, was $913,000, $1.0 million, and $1.4 million respectively.
Recent Accounting Pronouncements. In June 2009, the Financial Accounting Standards Board (“FASB”) issued Statement of Financial Accounting Standards (“SFAS”) No. 168, The FASB Accounting Standards CodificationTM and the Hierarchy of Generally Accepted Accounting Principles – a replacement of FASB Statement No. 162. With the issuance of SFAS 168, the FASB Accounting Standards Codification (“Codification”) became the single source of authoritative U.S. accounting and reporting standards applicable for all nongovernmental entities, with the exception of guidance issued by the SEC. This change is effective for financial statements issued for interim or annual periods ending after September 15, 2009. Updates to the Codification are promulgated through an Accounting Standards Update (“ASU”). The Codification does not modify existing GAAP or any guidance issued by the SEC. GAAP accounting standards used to populate the Codification are superseded, with the exception of certain standards yet to be codified as of September 30, 2009, including SFAS 166 and 167 described subsequently.
In June 2009, the FASB issued SFAS No. 166, Accounting for Transfers of Financial Assets, an amendment of FASB Statement No. 140, and SFAS No. 167, Amendments to FASB Interpretation No. 46(R). These Statements modify the accounting for transfers of financial assets and the determination of what entities must be consolidated, and will have a significant effect on securitizations and special-purpose entities. We will adopt these Statements effective January 1, 2010, as required. Management is evaluating the impact these Statements may have on the Company’s financial statements.
ASC 855 includes new guidance on subsequent events that became effective for the second quarter of 2009. The definition of subsequent events was modified and entities are required to disclose the date through which subsequent events have been evaluated and the basis for that date. Adoption of this guidance was not significant to the Company’s financial statements.
ASC 260 includes new guidance which clarifies that unvested share-based payment awards with rights to receive nonforfeitable dividends are participating securities and should be included in the computation of earnings per share. This new guidance is effective for the Company on October 1, 2009 and will require retrospective application to earnings per share information.
ASC 320 includes amended other-than-temporary impairment (“OTTI”) guidance in GAAP for debt securities to make the guidance more operational and to improve the presentation and disclosure of OTTI on debt and equity securities in the financial statements. It provides for the bifurcation of OTTI into (i) amounts related to credit losses, which are recognized through earnings, and (ii) amounts related to all other factors that are recognized as a component of other comprehensive income. The provisions of ASC 320-10-65 were effective for the Company’s interim period ended on June 30, 2009.
ASC 805 establishes principles and requirements for how an acquirer recognizes and measures in its financial statements the identifiable assets acquired, the liabilities assumed, and the goodwill acquired. The standard also establishes disclosure requirements to enable the evaluation of the nature and financial effects of the business combination. ASC 805 is effective for fiscal years beginning after December 15, 2008, or October 1, 2009, for the Company. The acquisition described in Note 2 was accounted for under SFAS No. 141 as the Company was not permitted to adopt ASC 805 early.
Stock-Based Compensation. The Company’s stockholders have approved long-term stock-based benefit plans that enable the Company to grant stock options, stock appreciation rights and restricted stock awards to employees and directors. ASC 718, Compensation – Stock Compensation requires the recognition of compensation costs relating to share based payment transactions in the financial statements. The Company has elected the modified prospective application method of reporting, which provides for no restatement of prior periods and no cumulative adjustment to equity accounts. Prior to the ASC 718 the Company elected to account for its stock-based compensation plans using the intrinsic value-based method of recognizing compensation costs outlined in Accounting Principles Board Opinion No. 25, Accounting for Stock Issued to Employees, and adopted the disclosure-only provisions under SFAS No. 123.
Earnings per share (“EPS”) data: The Company displays basic and diluted EPS in the Consolidated Statements of Income. Basic EPS is computed by dividing net income or loss by the weighted average number of shares outstanding during the period. Unallocated shares relating to the ESOP are deducted in the calculation of weighted average shares outstanding. Diluted EPS is computed by dividing net income or loss by the diluted weighted average shares outstanding, which includes common stock equivalent shares outstanding using the treasury stock method, unless such shares are anti-dilutive. Common stock equivalents include stock options and restricted stock awards.
Employee Stock Ownership Plan (“ESOP”). The Company accounts for its ESOP in accordance with ASC 718-40, Employee Stock Ownership Plans. Dividends on allocated shares are recorded as a reduction of retained earnings and paid to plan participants or distributed to participants' accounts. As shares are released, compensation expense is recorded equal to the then current market price of the shares and the shares become available for earnings per share calculations. The Company records cash dividends on unallocated shares as a reduction of debt or accrued interest.
Concentrations of Credit Risk. The Bank accepts deposits and grants credit primarily within the Treasure Valley region of southwestern Idaho and the tri-country region of central Oregon. The Bank has a diversified loan portfolio and grants consumer, residential, commercial, and construction real estate loans, and is not dependent on any industry or group of customers. Although the Bank has a diversified loan portfolio, a substantial portion of its loans are real-estate-related. The ability of the Bank's debtors to honor their contracts is dependent upon the real estate and general economic conditions in the area. The Bank also regularly monitors real-estate related loans that include terms that may give rise to a concentration of credit risk, including high loan-to-value loans and interest-only loans.
Reclassifications. Certain reclassifications have been made to prior year’s financial statements in order to conform to the current year presentation. The reclassifications had no effect on previously reported net income or equity.
Note 2 – Acquisition
On August 7, 2009, the Bank entered into an agreement with the Federal Deposit Insurance Corporation (“FDIC”) and acquired certain assets and assumed certain liabilities of Community First Bank, a full service community bank that was formerly headquartered in Prineville, Oregon (“Acquisition”). The results of operations includes the impact of the Acquisition from the acquisition date through September 30, 2009.
The Acquisition consisted of assets with a fair value of $189.8 million and liabilities with a fair value of $174.5 million. The following table summarizes the estimated fair values of the assets acquired and liabilities assumed at the date of the acquisition:
| | | August 7, 2009 | |
| | | (in thousands) | |
| Cash | | $ | 8,146 | |
| Due from banks | | | 9,372 | |
| Federal Funds Sold | | | 4,560 | |
| Investment securities | | | 15,634 | |
Loans receivable, net of discount of $13,173, and allowance for loan losses of $16,812 | | | 112,350 | |
| Real estate and other repossessed assets | | | 7,363 | |
| FDIC indemnification asset | | | 30,038 | |
| Federal Home Loan Bank of Seattle stock | | | 735 | |
| Accrued interest receivable | | | 947 | |
| Other assets | | | 659 | |
Total Assets Acquired | | $ | 189,804 | |
| | | | | |
| Demand, money market and savings deposit accounts | | $ | 67,971 | |
| Certificates of deposit | | | 75,488 | |
| Advances from Federal Home Loan Bank of Seattle and other borrowings | | | 19,228 | |
| Accrued interest payable | | | 243 | |
| Other liabilities | | | 1,827 | |
| Deferred taxes | | | 9,756 | |
Total Liabilities Assumed | | | 174,513 | |
| | | | | |
Net Assets Acquired | | $ | 15,291 | |
In addition to the assets purchased and liabilities assumed, the Bank and the FDIC entered into a loss sharing agreement. This agreement covers realized losses on loans and foreclosed real estate. Under this agreement, the FDIC will reimburse the Bank for 80% of the first $34.0 million of realized losses on covered assets and 95% on realized losses that exceed $34.0 million. Realized losses covered by the loss sharing agreement include loan contractual balances (and related unfunded commitments that were acquired), accrued interest on loans for up to 90 days, the book value of foreclosed real estate acquired, and certain direct costs, less cash or other consideration received by the Bank. This agreement extends for ten years for one-to-four family real estate loans and REO and for five years for all other loans and REO. The reimbursable losses from the FDIC are based on the book value of the relevant loans and foreclosed assets as determined by the FDIC as of the date of the acquisition, August 7, 2009.
The expected reimbursements under the loss sharing agreement were recorded as an indemnification asset at their estimated fair value of $30.0 million on the acquisition date. Based upon the acquisition date preliminary fair values estimate of the net assets acquired, no goodwill was recorded. The Acquisition resulted in a pre-tax gain of $25.0 million, which was classified as an extraordinary gain in the Company’s Consolidated Statement of Operations for the year ended September 30, 2009, net of income taxes. Due to the difference in tax bases of the assets acquired and liabilities assumed, the Company recorded a deferred tax liability of $9.7 million, resulting in an after-tax gain of $15.3 million.
The determination of the initial fair value of loans purchased in the Acquisition and the initial fair value of the related FDIC indemnification asset involves a high degree of judgment and complexity. The carrying value of the acquired loans and the FDIC indemnification asset reflect management’s best estimate of the amount to be realized on each of these assets. The Company determined the estimated fair value of the assumed assets and liabilities in accordance with SFAS No. 141, Business Combinations. However, the amount the Company realizes on these assets could differ materially from the carrying value reflected in these financial statements, based upon the timing of collections on the acquired loans in future periods. Because of the loss sharing agreement with the FDIC on these assets, the Company does not expect to incur any excessive losses. To the extent the actual values realized for the acquired loans are different from the estimate, the FDIC indemnification asset will generally be impacted in an offsetting manner due to the loss sharing support from the FDIC.
In its assumption of the deposit liabilities, the Company believed that the customer relationships associated with these deposits have intangible value. The Company applied ASC 350, Intangibles – Goodwill and Other, which prescribes the accounting for goodwill and other intangible assets, such as core deposit intangibles. The Company determined the fair value of a core deposit intangible asset was approximately $2.1 million. In determining the valuation amount, deposits were analyzed based on factors such as type of deposit, deposit retention, interest rates and age of deposit relationships. In accordance with the provisions of SFAS No. 141, the Company allocated the excess of fair value of net assets acquired over cost to the fair value of the core deposit intangible asset, thus reducing the carrying value of the intangible asset to zero.
ASC 310-30 Loans and Debt Securities Acquired with Deteriorated Credit, applies to a loan with evidence of deterioration of credit quality since origination, acquired by completion of a transfer for which it is probable, at acquisition, that the investor will be unable to collect all contractually required payments receivable. On the acquisition date, the preliminary estimate of the contractually required principal payments receivable for all loans subject to ASC 310-30 was $40.4 million and the estimated fair value of these loans was $26.2 million. These amounts were determined based upon the estimated remaining life of the underlying loans, which include the effects of estimated prepayments. At August 7, 2009, a majority of these loans were valued based on the current liquidation value of the underlying collateral, because the expected cash flows are primarily based on the liquidation of underlying collateral. ASC 310-30 prohibits carrying over or creating an allowance for loan losses upon initial recognition; therefore, no allowance for loan losses was reported on the balance sheet for these loans at September 30, 2009.
The Company has omitted the pro forma disclosures required for a business combination because there are no historical financial statements for the selected assets acquired and liabilities assumed of Community First Bank
Note 3 – Fair Value Measurement
ASC 820, Fair Value Measurements and Disclosures, defines fair value, establishes a consistent framework for measuring fair value and expands disclosure requirements about fair value measurements. The Company attempts to maximize the use of observable inputs and minimize the use of unobservable inputs when measuring fair value. Observable inputs reflect market data obtained from independent sources, while unobservable inputs reflect the Company’s market assumptions. These two types of inputs create the following fair value hierarchy:
| · | Level 1 – Quoted prices for identical instruments in active markets. |
| · | Level 2 – Quoted prices for similar instruments in active markets; quoted prices for identical or similar instruments in markets that are not active; and model-derived valuations whose inputs are observable or whose significant value drivers are observable. |
| · | Level 3 – Instruments whose significant value drivers are unobservable. |
The following table summarized the Company’s financial instruments that were measured at fair value on a recurring basis at September 30, 2009:
| | September 30, 2009 |
| | | Total | | | Level 1 | | | Level 2 | | | Level 3 |
| | (in thousands) |
| Securities available for sale | | $169,320 | | | -- | | | $169,320 | | | -- |
Additionally, certain assets are measured at fair value on a non-recurring basis. These adjustments to fair value generally result from the application of lower-of-cost-or-market accounting or write-downs of individual assets due to impairment. The following table summarizes the Company’s financial instruments that were measured at fair value on a non-recurring basis at September 30, 2009:
| | September 30, 2009 |
| | | Total | | | Level 1 | | | Level 2 | | | Level 3 |
| | (in thousands) |
| Impaired loans | | $31,922 | | | -- | | | -- | | | $31,922 |
| Real estate owned | | 18,391 | | | -- | | | -- | | | 18,391 |
Impaired loans, which are measured for impairment using the fair value of the collateral at September 30, 2009, had a carrying amount of $33.4 million, net of specific valuation allowances totaling $1.5 million and a $14.2 million fair value adjustment on $40.4 million of loans purchased in the Acquisition and accounted for under ASC 310-30. The specific valuation allowance required a provision of $1.5 million during the year ended September 30, 2009.
The Company used the following methods and significant assumptions to estimate fair value:
Securities: The Company’s securities available for sale primarily consist of mortgage-backed securities issued by U.S. Government sponsored enterprises and trade in active markets. These securities are included under Level 2 because there may or may not be daily trades in each of the individual securities and because the valuation of these securities may be based on instruments that are not exactly identical to those owned by the Company.
Impaired loans: A loan is considered impaired when, based upon currently known information, it is deemed probable that the Company will be unable to collect all amounts due as scheduled according to the original terms of the agreement. Impaired loans are measured based on the present value of expected future cash flows discounted at the loan’s effective interest rate or, as a practical expedient, based on the loan’s observable market price or the fair value of collateral, if the loan is collateral dependent. Impaired loans that are collateral dependent and have experienced a write-down in carrying value or have a recognized valuation allowance are included in the table above. Impaired loans whose fair value exceeds the carrying value are excluded from the table above as these loans do not represent financial assets measured and carried at fair value.
Real estate owned: Fair value for real estate owned is determined by obtaining appraisals on the properties. The fair value under such appraisals is determined by using an income, cost or comparable sales valuation technique. The fair value is then reduced by management’s estimate for the direct costs expected to be incurred in order to sell the property. Holding costs or maintenance expenses are recorded as period costs when occurred and are not included in the fair value estimate
Note 4 – Securities
The Company’s investment policies are designed to provide and maintain adequate liquidity and to generate favorable rates of return without incurring undue interest rate or credit risk. The investment policies generally limit investments to mortgage-backed securities, U.S. Government and agency securities, municipal bonds, certificates of deposit and marketable corporate debt obligations.
Investment securities available for sale consisted of the following at September 30, 2009 and 2008:
| | | Amortized Cost | | | Gross Unrealized Gains | | | Gross Unrealized Losses | | | Fair Value | |
| | | (in thousands) | |
September 30, 2009: | | | | | | | | | | | | |
Obligations of U.S. Government- sponsored enterprises | | $ | 4,089 | | | $ | 42 | | | $ | (4 | ) | | $ | 4,127 | |
| Mortgage-backed securities | | | 158,677 | | | | 6,529 | | | | (13 | ) | | | 165,193 | |
| | | $ | 162,766 | | | $ | 6,571 | | | $ | (17 | ) | | $ | 169,320 | |
September 30, 2008: | | | |
| Mortgage-backed securities | | $ | 191,120 | | | $ | 669 | | | $ | (3,002 | ) | | $ | 188,787 | |
The contractual maturities of investment securities available for sale are shown below. Expected maturities may differ from contractual maturities because borrowers have the right to prepay obligations without prepayment penalties.
| | | September 30, 2009 | |
| | | Amortized Cost | | | Fair Value | |
| | | (in thousands) | |
| | | | | | | |
| Due within one year | | $ | 6 | | | $ | 6 | |
| Due after one year through five years | | | 5,139 | | | | 5,184 | |
| Due after five years through ten years | | | 27,297 | | | | 28,781 | |
| Due after ten years | | | 130,324 | | | | 135,349 | |
| Total | | $ | 162,766 | | | $ | 169,320 | |
For the years ended September 30, 2009, 2008, and 2007, proceeds from sales of securities available for sale amounted to $10.9 million, $0, and $3.8 million, respectively. Gross realized gains for the years ended September 30, 2009, 2008, and 2007 were $121,000, $0, and $4,000 respectively. Gross realized losses for the years ended September 30, 2009, 2008, and 2007 were $324,000, $0, and $0 respectively. All gain and losses were included in other noninterest income on the Consolidated Statements of Income.
The fair value of securities with unrealized losses, the amount of unrealized losses and the length of time these unrealized losses existed as of September 30, 2009 are as follows:
| | | Less than 12 months | | | 12 months or longer | | | Total | |
| | | Fair Value | | | Unrealized Losses | | | Fair Value | | | Unrealized Losses | | | Fair Value | | | Unrealized Losses | |
| | | (in thousands) | |
Obligations of U.S. Government Sponsored Enterprises | | $ | 2,015 | | | $ | (4 | ) | | $ | -- | | | $ | -- | | | $ | 2,015 | | | $ | (4 | ) |
Mortgage-backed securities | | | -- | | | | -- | | | | 599 | | | | (13 | ) | | | 599 | | | | (13 | ) |
| | | $ | 2,015 | | | $ | (4 | ) | | $ | 599 | | | $ | (13 | ) | | $ | 2,614 | | | $ | (17 | ) |
Management has evaluated these securities and has determined that the decline in the value is not other than temporary and not related to the underlying credit quality of the issuers or an industry specific event. The declines in value are on securities that have contractual maturity dates and future principal payments that will be sufficient to recover the current amortized cost of the securities. The Company has the ability and intent to hold the securities for a reasonable period of time for a forecasted recovery of the amortized cost.
As of September 30, 2009, the Bank had pledged mortgage-backed securities with an amortized cost of $66.1 million and a fair value of $68.9 million as collateral for FHLB advances. In addition, as of September 30, 2009, three mortgage-backed securities with a combined amortized cost of $4.5 million and a fair value of $4.8 million were pledged to the Federal Reserve Bank as collateral for treasury tax and loan funds held by the Bank and for borrowings from the discount window. The Bank also had mortgage-backed securities with an amortized cost of $3.3 million and fair value of $3.5 million pledged as collateral for repurchase agreements. Mortgage-backed securities with a combined amortized cost of $5.1 million and a fair value of $5.4 million were pledged as collateral for public funds.
Note 5 – Loans Receivable
Loans receivable are summarized as follows at September 30, 2009 and 2008:
| | | September 30, | |
| | | 2009 | | | 2008 | |
| | | (in thousands) | |
| Real Estate: | | | | | | |
| One-to-four family residential | | $ | 178,311 | | | $ | 210,501 | |
| Multi-family residential | | | 16,286 | | | | 8,477 | |
| Commercial | | | 213,471 | | | | 151,733 | |
| Total real estate | | | 408,068 | | | | 370,711 | |
| | | | | | | | | |
| Real Estate Construction: | | | | | | | | |
| One-to-four family residential | | | 10,871 | | | | 13,448 | |
| Multi-family residential | | | 10,417 | | | | 920 | |
| Commercial and land development | | | 27,144 | | | | 18,674 | |
| Total real estate construction | | | 48,432 | | | | 33,042 | |
| | | | | | | | | |
| Consumer: | | | | | | | | |
| Home equity | | | 53,368 | | | | 52,954 | |
| Automobile | | | 2,364 | | | | 1,903 | |
| Other consumer | | | 3,734 | | | | 1,370 | |
| Total consumer | | | 59,466 | | | | 56,227 | |
| | | | | | | | | |
| Commercial business | | | 24,256 | | | | 5,385 | |
| | | | 540,222 | | | | 465,365 | |
| | | | | | | | | |
| Deferred loan fees | | | (858 | ) | | | (973 | ) |
| Allowance for loan losses | | | (28,735 | ) | | | (4,579 | ) |
| Loans receivable, net | | $ | 510,629 | | | $ | 459,813 | |
The majority of residential mortgage loans are pledged as collateral for FHLB advances (see Note 9).
The interest rates on loans at September 30, 2009, fall into the following fixed and variable components
(in thousands):
| Fixed rates | | $ | 177,122 | |
| Variable rates | | | 363,100 | |
| Total loans receivable | | $ | 540,222 | |
The contractual maturity of loans receivable at September 30, 2009, are shown below. Expected maturities will differ from contractual maturities because borrowers may have the right to prepay loans with or without prepayment penalties.
| | | Within 1 Year | | | One Year To 5 Years | | | After 5 Years | | | Total | |
| | | (in thousands) | |
| Real estate: | | | | | | | | | | | | |
| One-to-four family residential | | $ | 2,938 | | | $ | 5,096 | | | $ | 170,277 | | | $ | 178,311 | |
| Multi-family residential | | | 1,753 | | | | 3,938 | | | | 10,595 | | | | 16,286 | |
| Commercial | | | 19,393 | | | | 23,367 | | | | 170,711 | | | | 213,471 | |
| Total real estate | | | 24,084 | | | | 32,401 | | | | 351,583 | | | | 408,068 | |
| | | | | | | | | | | | | | | | | |
| Real estate construction: | | | | | | | | | | | | | | | | |
| One-to-four family residential | | | 10,159 | | | | 712 | | | | -- | | | | 10,871 | |
| Multi-family residential | | | 10,417 | | | | -- | | | | -- | | | | 10,417 | |
| Commercial and land development | | | 19,424 | | | | 7,269 | | | | 451 | | | | 27,144 | |
| Total real estate construction | | | 40,000 | | | | 7,981 | | | | 451 | | | | 48,432 | |
| | | | | | | | | | | | | | | | | |
| Consumer: | | | | | | | | | | | | | | | | |
| Home equity | | | 272 | | | | 6,079 | | | | 47,017 | | | | 53,368 | |
| Automobile | | | 143 | | | | 1,502 | | | | 719 | | | | 2,364 | |
| Other consumer | | | 647 | | | | 1,207 | | | | 1,880 | | | | 3,734 | |
| Total consumer | | | 1,062 | | | | 8,788 | | | | 49,616 | | | | 59,466 | |
| | | | | | | | | | | | | | | | | |
| Commercial business | | | 13,168 | | | | 5,659 | | | | 5,429 | | | | 24,256 | |
| Total loans receivable | | $ | 78,314 | | | $ | 54,829 | | | $ | 407,079 | | | $ | 540,222 | |
An analysis of the changes in the allowance for loan losses is as follows:
| | | Year Ended September 30, | |
| | | 2009 | | | 2008 | | | 2007 | |
| | | (in thousands) | |
| | | | | | | | | | |
| Beginning balance | | $ | 4,579 | | | $ | 2,988 | | | $ | 2,974 | |
| Provision for loan losses | | | 16,085 | | | | 2,431 | | | | 409 | |
| Increase due to acquisition | | | 16,811 | | | | -- | | | | -- | |
| Charge offs, net | | | (8,978 | ) | | | (864 | ) | | | (219 | ) |
| Transfer to unfunded commitments | | | -- | | | | -- | | | | (192 | ) |
| Recoveries | | | 238 | | | | 24 | | | | 16 | |
| Ending balance | | $ | 28,735 | | | $ | 4,579 | | | $ | 2,988 | |
Impaired loan information is as follows:
| | | Year Ended September 30, | |
| | | 2009 | | | 2008 | | | 2007 | |
| | | (in thousands) | |
| | | | | | | | | | |
| Impaired loans with related specific allowance | | $ | 7,131 | | | $ | 9,215 | | | $ | 833 | |
| Impaired loans with no related allowance | | | 27,327 | | | | 266 | | | | 2,076 | |
| Total impaired loans | | $ | 34,458 | | | $ | 9,481 | | | $ | 2,909 | |
| | | | | | | | | | | | | |
| Specific allowance on impaired loans | | $ | 1,516 | | | $ | 1,729 | | | $ | 78 | |
| Average balance of impaired loans | | | 8,297 | | | | 4,041 | | | | 356 | |
Included in the impaired loans with no related allowance total for 2009 in the above table are $26.2 million of impaired loans purchased in the Acquisition. At the time of acquisition, these loans were written down $14.2 million to their estimated fair value, which was also determined to be their initial investment value. As such, there is no related allowance associated with these loans. See Note 2 of these Notes to Consolidated Financial Statements for additional information on the acquisition.
No interest income was recognized on impaired loans while they were impaired during the years ended September 30, 2009, 2008 and 2007. As of September 30, 2009, 2008 and 2007, the Company had no accruing loans that were contractually past due 90 days or more.
Note 6 – Mortgage Servicing Rights
On August 28, 2008, Home Federal Bank entered into a binding agreement with another bank whereby the Bank would sell its remaining servicing rights. The purchase price was 1.02% of the unpaid principal balance of all loans in the servicing portfolio, except for those loans that are 60 days or more past due, in litigation, in bankruptcy or in foreclosure as of October 31, 2008. The transfer was completed on December 16, 2008. The Bank now originates nearly all of its one-to-four family loans for sale in the secondary market with servicing released. As a result, the Bank will not record new capitalized servicing rights.
The following table lists the classes of servicing rights and the activities in the balance of each class for the periods indicated:
| | | Year Ended September 30, | |
| Servicing Right Classes | | 2009 | | | 2008 | | | 2007 | |
| | | (in thousands) | |
| One-to-four family residential loans: | | | | | | | | | |
| Beginning balance | | $ | 1,703 | | | $ | 2,033 | | | $ | 2,468 | |
Additions for new mortgage servicing rights capitalized | | | -- | | | | -- | | | | -- | |
| Adjustments to fair value | | | -- | | | | (330 | ) | | | (435 | ) |
| Write-up (impairment) | | | -- | | | | -- | | | | -- | |
| Sale of servicing rights | | | (1,703 | ) | | | | | | | | |
| Ending balance | | $ | - | | | $ | 1,703 | | | $ | 2,033 | |
| | | | | | | | | | | | | |
| Commercial real estate loans: | | | | | | | | | | | | |
| Beginning balance | | $ | 4 | | | $ | 14 | | | $ | 24 | |
Additions for new mortgage servicing rights capitalized | | | -- | | | | -- | | | | -- | |
| Adjustments to fair value | | | (4 | ) | | | -- | | | | (10 | ) |
| Amortization of servicing rights | | | -- | | | | (10 | ) | | | -- | |
| Ending balance | | $ | -- | | | $ | 4 | | | $ | 14 | |
The amount of contractually specified servicing fees for one-to-four family residential loans was $68,000, $484,000 and $549,000, for the years ended September 30, 2009, 2008 and 2007 respectively. The servicing fees for one-to-four family residential loans are recorded in “Loan Servicing Fees” on the Consolidated Statements of Income. The amount of contractually specified servicing fees for commercial real estate loans, as well as late fees and other ancillary fees earned for the periods indicated were immaterial in amount.
Note 7 - Property and Equipment
Property and equipment at September 30, 2009 and 2008 are summarized as follows:
| | | September 30, | |
| | | 2009 | | | 2008 | |
| | | (in thousands) | |
| | | | | | | |
| Land | | $ | 5,159 | | | $ | 3,254 | |
| Buildings and leasehold improvements | | | 12,461 | | | | 11,020 | |
| Construction in progress | | | 4,760 | | | | 1,938 | |
| Furniture and equipment | | | 9,918 | | | | 9,335 | |
| Automobiles | | | 114 | | | | 90 | |
| Total cost | | | 32,412 | | | | 25,637 | |
| Less accumulated depreciation and amortization | | | (11,950 | ) | | | (10,391 | ) |
| Net book value | | $ | 20,462 | | | $ | 15,246 | |
Repairs and maintenance are charged against income as incurred; major remodels and improvements are capitalized. Depreciation and amortization charged against operations for the years ended September 30, 2009, 2008 and 2007, was $1.7 million each year. Capitalized interest expense related to construction of banking offices for the year ended September 30, 2009, was $56,421.
In November 2009, the Bank notified the FDIC of its intent to purchase two banking offices in Redmond and Bend, Oregon, under a purchase option available in the purchase and assumption agreement for the Acquisition. The purchase price for he land and buildings totaled $4.7 million. Additionally the Bank agreed to purchase furniture and equipment in these banking offices and in five other banking office that are leased. The total purchase price of the furniture and equipment was approximately $412,000.
Note 8 - Deposit Accounts
Deposit information by type and weighted average rates are summarized as follows:
| | | | | | | |
| | | Rate | | | September 30, 2009 | | | Rate | | | September 30, 2008 | |
| | | (in thousands) | |
| | | | | | | | | | | | | |
| Savings deposits | | | 0.65 | % | | $ | 41,757 | | | | 0.84 | % | | $ | 26,409 | |
| Demand deposits | | | 0.55 | | | | 244,204 | | | | 0.75 | | | | 169,112 | |
| | | | | | | | 285,961 | | | | | | | | 195,521 | |
| | | | | | | | | | | | | | | | | |
| Certificates of deposit | | | 0.00-0.99 | | | | 9,906 | | | | 0.00-0.99 | | | | 11 | |
| | | | 1.00-1.99 | | | | 71,921 | | | | 1.00-1.99 | | | | -- | |
| | | | 2.00-2.99 | | | | 68,327 | | | | 2.00-2.99 | | | | 49,598 | |
| | | | 3.00-3.99 | | | | 42,898 | | | | 3.00-3.99 | | | | 54,669 | |
| | | | 4.00-4.99 | | | | 27,389 | | | | 4.00-4.99 | | | | 55,050 | |
| | | | 5.00-5.99 | | | | 7,544 | | | | 5.00-5.99 | | | | 16,234 | |
| | | | 6.00-8.99 | | | | 912 | | | | 6.00-6.99 | | | | 1,842 | |
| Total certificates of deposit | | | | | | | 228,897 | | | | | | | | 177,404 | |
| Total deposits | | | | | | $ | 514,858 | | | | | | | $ | 372,925 | |
Scheduled maturities of certificates of deposits are as follows during the fiscal years presented:
| | | September 30, | |
| | | 2009 | | | 2008 | |
| | | (in thousands) | |
| Fiscal year ending September 30, | | | | | | |
| 2009 | | $ | -- | | | $ | 133,323 | |
| 2010 | | | 161,969 | | | | 25,694 | |
| 2011 | | | 34,821 | | | | 7,758 | |
| 2012 | | | 12,982 | | | | 8,649 | |
| 2013 | | | 7,932 | | | | 1,805 | |
| 2014 | | | 10,976 | | | | -- | |
| Thereafter | | | 217 | | | | 175 | |
| | | $ | 228,897 | | | $ | 177,404 | |
At September 30, 2009 and 2008, certificates of deposits of $100,000 or greater were $83.5 million and $54.5 million, respectively. We had brokered certificates of deposit at September 30, 2009 and 2008 of $100,000 and $0, respectively.
Interest expense by type of deposit account is summarized as follows:
| | | Year Ended September 30, | |
| | | 2009 | | | 2008 | | | 2007 | |
| | | (in thousands) | |
| | | | | | | | | | |
| Savings deposits | | $ | 236 | | | $ | 177 | | | $ | 103 | |
| Demand deposits | | | 1,116 | | | | 1,912 | | | | 1,783 | |
| Certificates of deposit | | | 5,724 | | | | 8,596 | | | | 10,393 | |
| Total | | $ | 7,076 | | | $ | 10,685 | | | $ | 12,279 | |
Accrued interest on deposit accounts at September 30, 2009 and 2008 was $188,000 and $0, respectively.
Note 9 - Federal Home Loan Bank Advances and other borrowings
The Bank has the ability to borrow up to 40% of its total assets from the FHLB of Seattle, limited by available collateral. Advances are collateralized by all FHLB stock owned by the Bank, deposits with the FHLB of Seattle, and certain residential mortgages and mortgage-backed securities. The outstanding balances on FHLB advances at September 30, 2009 and 2008 were $82.9 million and $137.0 million, respectively, with interest rates ranging from 0.68% to 5.26% as of September 30, 2009.
Other borrowings include securities sold under obligations to repurchase (“repurchase agreements”) originated directly with commercial and retail customers. These borrowings are collateralized with securities issued by U.S. Government sponsored enterprises. Repurchase agreements totaled $1.8 million and $0 at September 30, 2009 and 2008, respectively and had an average rate of 1.90% at September 30, 2009. All repurchase agreements mature in 2010.
The Bank’s borrowings consisted of the following during the years ended September 30, 2009 and 2008:
| | | | | | | |
| | | 2009 | | | 2008 | |
| | | (in thousands) | |
| | | | | | | |
| Maximum outstanding at any month end | | $ | 137,000 | | | $ | 181,000 | |
| Average outstanding | | | 112,000 | | | | 158,000 | |
| | | | | | | | | |
| Weighted average interest rates | | | | | | | | |
| For the period | | | 4.39 | % | | | 4.60 | % |
| At end of period | | | 4.00 | | | | 4.68 | |
Scheduled maturities of the Company’s borrowings are as follows during the fiscal years presented:
| | | September 30, | |
| | | 2009 | | | 2008 | |
| | | Average Interest Rates | | | Amount | | | Average Interest Rates | | | Amount | |
| | | (dollars in thousands) | |
| Fiscal Year: | | | | | | | | | | | | |
| 2009 | | | -- | % | | $ | -- | | | | 4.60 | % | | $ | 76,882 | |
| 2010 | | | 3.26 | | | | 25,887 | | | | 4.69 | | | | 15,240 | |
| 2011 | | | 4.20 | | | | 12,050 | | | | 5.16 | | | | 8,050 | |
| 2012 | | | 4.35 | | | | 20,100 | | | | 4.91 | | | | 15,100 | |
| 2013 | | | 4.30 | | | | 23,700 | | | | 4.62 | | | | 18,700 | |
| 2014 | | | 4.83 | | | | 2,000 | | | | -- | | | | -- | |
| Thereafter | | | 4.83 | | | | 1,000 | | | | 4.83 | | | | 3,000 | |
| Total | | | | | | $ | 84,737 | | | | | | | $ | 136,972 | |
Included in the Bank’s borrowing capacity with the FHLB is a cash management advance account. The outstanding balance of this overnight borrowing included in the tables above was $4.9 million and $0 at September 30, 2009 and 2008, respectively, and carried a variable interest rate of 0.68% at September 30. 2009.
Note 10 - Employee Retirement Plans
401(k) Plan. The Company has a 401(k) retirement plan covering substantially all of its employees. The Company matches 50% of employee contributions up to the employee’s first 10% contributed to the Plan. For the years ended September 30, 2009, 2008, and 2007, total Company contributions were $251,000, $237,000, and $214,000, respectively.
Salary Continuation Plan. As a supplement to the 401(k) retirement plan, the Company has adopted a Salary Continuation Plan pursuant to agreements with certain executive officers of the Company and its subsidiaries. Under the Salary Continuation Plan, an executive will be entitled to a stated annual benefit for a period of 15 years (i) upon retirement from the Company after attaining age 65, or (ii) upon attaining age 65 if his or her employment had been previously terminated due to disability. In the event the executive dies while in active service, the Company shall pay the beneficiary the normal retirement projected benefit for a period of 15 years commencing with the month following the executive’s death. At September 30, 2009, this death benefit contingency totaled $6.8 million and is not reported on the consolidated balance sheet. In the event the executive dies after age 65, but before receiving the full 15 years of annual benefits, the remaining payments shall be paid to his or her beneficiaries. Upon termination of employment, the annual benefit amount is 50% of the officer’s average final 36 months base salary. Benefits under the Plan vest over ten years. Upon early retirement, the Company shall pay the executive the vested accrual balance as of the end of the month prior to the early retirement date. The Company will pay the early retirement benefit in 180 equal installments.
The accrued liability for the salary continuation plan was $2.3 million and $2.3 million at September 30, 2009 and 2008, respectively. The amounts recognized in compensation expense were $141,000, $389,000 and $403,000 for the years ended September 30, 2009, 2008 and 2007, respectively.
Deferred Incentive Compensation. The Company has deferred incentive compensation agreements with certain former executive officers and certain members of the Board of Directors. Under the agreements, the Company is obligated to provide payments for each such former executive and board member or his beneficiaries during a period of fifteen or ten years after the death, disability, or retirement of the executive or board member. Until October 1, 2006, the plan provided an incentive award percentage determined by reference to Home Federal’s return on assets and return on equity for the year. The resulting amount was set aside in an unfunded deferral account for participants. Although the incentive award has been discontinued, members of the Board of Directors may still elect to defer all or a part of their directors’ fees into the deferral account under the plan. The deferral accounts are
credited annually with an interest credit that is based on the growth rate of Home Federal Bank’s net worth in Home Federal, subject to a maximum of 12% per year.
The Company accrues annual interest on the unfunded liability under the plan based upon a formula relating to the change in retained earnings of the Bank, which amounted to 11.56%, 5.79%, and 8.50% for the years ended September 30, 2009, 2008 and 2007, respectively. The accrued liability for the deferred incentive compensation agreements was $2.4 million and $2.3 million at September 30, 2009 and 2008, respectively. The amounts recognized in compensation expense were $152,000, $189,000, and $124,000 for the years ended September 30, 2009, 2008, and 2007, respectively.
Director Retirement Plan. Home Federal Bancorp adopted a director retirement plan, effective January 1, 2005, that replaced prior plans. The plan is an unfunded nonqualified retirement plan for directors. Upon the later of attaining age 72 or termination of service, the director will receive an annual benefit equal to 50 percent of the fees paid to the director for the preceding year, payable in monthly installments over 15 years. The accrued benefit vests at a rate of 10 percent per year, except in the event of disability, in which case the vested percentage is 100 percent. If the director terminates service within 24 months following a change in control, he will receive 100 percent of his accrued benefit, plus a change in control benefit equal to 2.99 times his prior years directors fees. Change in control payments are subject to reduction to avoid excise taxes under Section 280G of the Internal Revenue Code. In the event a director dies before termination of service, his beneficiary would receive his projected benefit, which is the final benefit the director would have received had he attained age 72, assuming a 4% annual increase in the directors’ fees. In the event the director dies after separation from service, but before receiving the full 15 years of annual benefits, the remaining payments shall be paid to his or her beneficiaries. In-service distributions are permitted in limited circumstances.
The accrued liability for the director retirement plans was $588,000 and $572,000 at September 30, 2009 and 2008, respectively. The amounts recognized in compensation expense were $53,000, $84,000, and $51,000 for the years ended September 30, 2009, 2008, and 2007, respectively.
The Company’s deferred compensation agreements and supplemental executive retirement plans are unfunded plans and have no plan assets. The following table reconciles the accumulated liability for the benefit obligation of these contracts. The benefit obligation represents the net present value of future payments to individuals under the agreements.
| | | Year ended September 30, | |
| | | 2009 | | | 2008 | |
| | | (in thousands) | |
| Beginning balance | | $ | 5,191 | | | $ | 4,515 | |
| Benefit expense | | | 400 | | | | 710 | |
| Benefit payments | | | (331 | ) | | | (34 | ) |
| Ending Balance | | $ | 5,260 | | | $ | 5,191 | |
Note 11 - Stock-Based Compensation
At September 30, 2009, the Company maintained multiple long-term stock-based benefit plans that enable the Company to grant stock options, stock appreciation rights and restricted stock awards to employees and directors. The plans include the 2005 Stock Option Plan, the 2005 Recognition and Retention Plan, and the 2008 Equity Incentive Plan. The plans were approved by shareholders in 2005 and 2009.
Restricted Stock Awards. The Company grants restricted stock awards to promote the long-term interests of the Company and its stockholders by providing restricted stock as a means for attracting and retaining directors and key employees. The maximum number of restricted shares that may be awarded under the plans is 692,143. The fair value of restricted stock awards are accrued ratably as compensation expense over the vesting period of the award. The amounts recognized in compensation expense were $703,000, $657,000, and $640,000 for the years ended September 30, 2009, 2008, and 2007 respectively. As of September 30, 2009, restricted stock awards of 459,460 shares of common stock were outstanding. The Company has an aggregate of 232,685 restricted shares available for future issuance.
Restricted stock activity is summarized in the following table:
| | | Number of Shares | | | Weighted Average Fair Value at Date of Grant | |
| | | | | | | |
| | | | | | | |
| Nonvested at September 30, 2006 | | | 293,606 | | | $ | 11.31 | |
| Vested | | | (58,723 | ) | | | 11.31 | |
| Granted | | | 5,680 | | | | 15.34 | |
| Forfeited | | | (29,800 | ) | | | 11.18 | |
| Nonvested at September 30, 2007 | | | 210,763 | | | | 11.44 | |
| Vested | | | (56,471 | ) | | | 11.40 | |
| Granted | | | 30,858 | | | | 11.98 | |
| Nonvested at September 30, 2008 | | | 185,150 | | | | 11.54 | |
| Vested | | | (53,188 | ) | | | 11.39 | |
| Granted | | | 183,000 | | | | 9.39 | |
| Forfeited | | | (23,884 | ) | | | 11.42 | |
| Nonvested at September 30, 2009 | | | 291,078 | | | $ | 10.23 | |
Stock Option Awards. The Company grants stock options to promote the long-term interests of the Company and its stockholders by providing an incentive to directors and key employees who contribute to the operating success of the Company. The maximum number of stock options and stock appreciation rights that may be issued under the plans is 1,730,356. The exercise price of each option equals the fair market value of the Company’s stock on the date of grant. The options typically vest over five years and expire ten years from the date of grant. The Company has an aggregate of 601,584 stock options available for future issuance.
The fair value of each option award is estimated on the date of grant using the Black-Scholes option pricing model that uses the assumptions noted in the following table. The risk-free rate is based on the U.S. Treasury yield curve in effect at the time of grant. The expected life of options granted represents the period of time that options granted are expected to be outstanding. Expected volatilities are based on historical volatility of the Company’s stock. Expected forfeiture rate is the estimated forfeiture rate based upon the circumstances of the individuals that received stock options. Expected dividends represent the Company’s estimated annual dividend rate over the expected life.
| | Risk Free Interest Rate | | Expected Life (yrs) | | Expected Volatility | | Expected Forfeiture Rate | | Expected Dividend Yield |
| | | | | | | | | | |
| |
| Options granted in 2007 | 4.57% | | 7.50 | | 17.43% | | -- | | 2.00% |
| Options granted in 2008 | 3.85 | | 7.50 | | 25.41 | | -- | | 2.02 |
| Options granted in 2009 | 2.48 | | 7.50 | | 34.04 | | -- | | 2.01 |
Stock option activity is summarized in the following table:
| | | Number of Shares | | | Weighted Average Exercise Price | | | Weighted Average Fair Value | |
| | | | | | | | | | |
| | | | |
| Outstanding at September 30, 2006 | | | 765,495 | | | $ | 11.33 | | | $ | 2.15 | |
| Granted | | | 28,400 | | | | 15.34 | | | | 3.57 | |
| Forfeited | | | (85,848 | ) | | | 10.80 | | | | 1.91 | |
| Exercised | | | (79,580 | ) | | | 10.74 | | | | 1.83 | |
| Outstanding at September 30, 2007 | | | 628,467 | | | | 11.65 | | | | 2.29 | |
| Granted | | | 83,875 | | | | 11.28 | | | | 3.11 | |
| Forfeited | | | (13,546 | ) | | | 10.74 | | | | 1.83 | |
| Exercised | | | (56,420 | ) | | | 10.76 | | | | 1.85 | |
| Outstanding at September 30, 2008 | | | 642,376 | | | | 11.71 | | | | 2.44 | |
| Granted | | | 456,998 | | | | 9.39 | | | | 2.99 | |
| Forfeited | | | (120,148 | ) | | | 10.81 | | | | 1.91 | |
| Exercised | | | (32,862 | ) | | | 10.74 | | | | 1.83 | |
| Outstanding at September 30, 2009 | | | 946,364 | | | $ | 10.72 | | | $ | 2.79 | |
Options outstanding at September 30, 2009 were as follows:
| | | | | Options Outstanding | | Options Exercisable |
Range of Exercise Price | | Weighted Average Remaining Contractual Life (years) | | Number Outstanding | Weighted Average Exercise Price | Aggregate Intrinsic Value | | Number Exercisable | Weighted Average Exercise Price | Aggregate Intrinsic Value |
| | | | | | | | | | | |
| |
| $ 9.07-9.39 | | 9.6 | | 456,998 | $ 9.39 | $ 928,666 | | -- | $ -- | $ -- |
| 10.09-10.74 | | 6.1 | | 223,114 | 10.66 | 170,343 | | 161,451 | 10.72 | 113,578 |
| 11.05-11.31 | | 7.4 | | 59,080 | 11.20 | 12,944 | | 25,448 | 11.26 | 4,066 |
| 12.76 | | 8.1 | | 19,153 | 12.76 | -- | | 3,831 | 12.76 | -- |
| 13.32-13.47 | | 6.9 | | 159,619 | 13.40 | -- | | 88,322 | 13.41 | -- |
| 15.34 | | 7.2 | | 28,400 | 15.34 | -- | | 11,360 | 15.34 | -- |
| | | | | 946,364 | | $1,111,953 | | 290,412 | | $117,644 |
Cash proceeds received from the exercise of stock options were $353,000 and $607,000 for the years ended September 30, 2009 and 2008 respectively. The total intrinsic value of stock options exercised were $6,000 and $66,000 for the years ended September 30, 2009 and 2008 respectively. The amounts recognized in compensation expense were $385,000, $366,000, and $396,000 for the years ended September 30, 2009, 2008, and 2007 respectively. Tax benefits related to stock option exercises were $5,000, $43,000 and $55,000 for the years ended September 30, 2009, 2008 and 2007 respectively. It is the Company’s general policy to issue new shares for the exercise of stock options.
As of September 30, 2009, the compensation expense yet to be recognized for stock-based awards that have been awarded but not vested was as follows:
| | | Stock Options | | | Restricted Stock | | | Total Awards | |
| | | (in thousands) | |
| 2010 | | $ | 494 | | | $ | 907 | | | $ | 1,401 | |
| 2011 | | | 399 | | | | 438 | | | | 837 | |
| 2012 | | | 323 | | | | 371 | | | | 694 | |
| 2013 | | | 291 | | | | 355 | | | | 646 | |
| 2014 | | | 159 | | | | 200 | | | | 359 | |
| Total | | $ | 1,666 | | | $ | 2,271 | | | $ | 3,937 | |
Note 12 - Employee Stock Ownership Plan
In connection with the minority stock offering in 2004, the Company established an ESOP for the benefit of its employees. The ESOP covers all employees with at least one year and 1000 hours of service. Shares are released for allocation at the discretion of the Board of Directors. In 2004, the Company issued 566,137 shares of common stock to the ESOP in exchange for a ten-year note of approximately $5.0 million. These shares are expected to be released over a ten-year period. In 2007, the ESOP acquired an additional 816,000 shares of the Company’s common stock in exchange for a fifteen-year note of approximately $8.2 million. These shares are expected to be released over a fifteen-year period. As shares are released from collateral, the Company will report compensation expense equal to the average market price of the shares. ESOP compensation expense included in salaries and benefits was $969,000, $1.2 million, and $793,000 for the years ended September 30, 2009, 2008, and 2007, respectively. Dividends on allocated ESOP shares reduce retained earnings; dividends on unallocated ESOP shares reduce principal or interest on the ESOP loan.
ESOP share activity is summarized in the following table:
| | | | |
| | | | Unllocated ESOP Shares | | | | Fair Value of Unallocated Shares | | | | Allocated and Released Shares | | | | Total ESOP shares | |
| | | | | | | | | | | | | | | | | |
| Balance at September 30, 2006 | | | 452,909 | | | $ | 6,199,600 | | | | 113,228 | | | | 566,137 | |
| Allocation on September 30, 2007 | | | (56,614 | ) | | | | | | | 56,614 | | | | -- | |
| Balance at September 30, 2007 | | | 396,295 | | | | 4,643,200 | | | | 169,842 | | | | 566,137 | |
ESOP shares issued in December 2007 | | | 816,000 | | | | | | | | -- | | | | 816,000 | |
| Allocation on September 30, 2008 | | | (97,414 | ) | | | | | | | 97,414 | | | | -- | |
| Balance at September 30, 2008 | | | 1,114,881 | | | | 14,214,733 | | | | 267,256 | | | | 1,382,137 | |
| Allocation on September 30, 2009 | | | (111,014 | ) | | | | | | | 111,014 | | | | -- | |
| Balance at September 30, 2009 | | | 1,003,867 | | | $ | 14,214,733 | | | | 378,270 | | | | 1,382,137 | |
From the inception of the ESOP through September 30, 2009, 33,907 shares have been taken out of the ESOP via distributions to former employees. At September 30, 2009, a total of 1,348,230 shares remained in the ESOP.
Note 13 – Commitments and Contingencies
Lease commitments:
The Company has entered into noncancelable operating leases for land and buildings that require future minimum rental payments in excess of one year as of September 30, 2009. Certain lease payments may be adjusted periodically in accordance with changes in the Consumer Price Index.
At September 30, 2009, the Bank was leasing eight banking offices from FDIC in connection with the Acquisition. Under the purchase and assumption agreement for the Acquisition, the Bank had a 90-day option to purchase banking offices and assumed leased facilities. In November 2009, the Bank informed the FDIC that the Bank intended to assume the leases on five of the banking offices, to purchase two banking offices and to close another by November 30, 2009. The annualized payments on the leases to be assumed by the Bank are included in the table below. See Note 7 for information on facilities to be purchased.
The estimated future minimum annual rental payments, exclusive of taxes and other charges, are summarized as follows:
| | | Year ending September 30, | |
| | | (in thousands) | |
| 2010 | | $ | 555 | |
| 2011 | | | 219 | |
| 2012 | | | 201 | |
| 2013 | | | 120 | |
| 2014 | | | 116 | |
| Thereafter | | | 3,052 | |
| Total | | $ | 4,263 | |
Total rent expense for the years ended September 30, 2009, 2008, and 2007, was $501,000, $509,000, and $463,000, respectively.
Commitments to extend credit:
In the normal course of business, the Company makes various commitments and incurs certain contingent liabilities that are not presented in the accompanying financial statements. The commitments and contingent liabilities include various guarantees and commitments to extend credit. Commitments to extend credit are agreements to lend to a customer as long as there is no violation of any condition established in the agreement. Commitments generally have fixed expiration dates or other termination clauses and may require payment of a fee. Because many of the commitments are expected to expire without being drawn upon, the total commitment amounts do not necessarily represent future cash requirements. The Company evaluates each customer’s creditworthiness on a case-by-case basis. The amount of collateral obtained, if it is deemed necessary by the Company upon extension of the credit, is based on management’s credit evaluation of the borrower. Collateral held varies but may include securities, accounts receivable, inventory, fixed assets, and/or real estate properties. The distribution of commitments to extend credit approximates the distribution of loans outstanding.
At September 30, 2009 and 2008, commitments to extend credit were as follows:
| | | September 30, | |
| | | 2009 | | | 2008 | |
| | | (in thousands) | |
| | | | | | | |
Unfunded commitments under lines of credit and letters of credit | | $ | 46,184 | | | $ | 42,470 | |
| Undisbursed balance of loans closed | | | 5,252 | | | | 8,197 | |
| Commitments to originate loans: | | | | | | | | |
| Fixed rate | | | 2,824 | | | | 6,768 | |
| Adjustable rate | | | 4,949 | | | | 11,924 | |
| Total commitments | | $ | 59,209 | | | $ | 69,359 | |
The Company estimates a reserve related to unfunded loan commitments. In assessing the adequacy of the reserve, the Company uses a similar approach used in the development of the allowance for loan losses. At September 30, 2009, the reserve for unfunded loan commitments was $581,000, which was included in other liabilities on the Consolidated Balance Sheets.
Most of the Bank’s business activity is with customers located in the States of Idaho and Oregon. Loans to one borrower are generally limited, by federal banking regulation, to 15% of the Bank's regulatory capital. As of September 30, 2009 and 2008, the Bank had no individual industry concentrations of credit risk.
In connection with certain asset sales, the Bank typically makes representations and warranties about the underlying assets conforming to specified guidelines. If the underlying assets do not conform to the specifications, the Bank may have an obligation to repurchase the assets or indemnify the purchaser against loss. These representations and warranties are most applicable to the residential mortgages sold in the secondary market. The Bank believes that the potential for loss under these arrangements is remote. Accordingly, no contingent liability is recorded in the financial statements.
Note 14 - Related Party Transactions
In the normal course of business, the Company makes loans to its executive officers, directors and companies affiliated with these individuals. It is management’s opinion that loans to the Company’s officers and directors have been made on substantially the same terms, including interest rates and collateral, as those prevailing at the time for comparable transactions with unrelated parties and have not involved more than normal risk of collectibility. An analysis of activity with respect to loans receivable from directors, executive officers and their affiliates is as follows:
| | | September 30, | |
| | | 2009 | | | 2008 | |
| | | (in thousands) | |
| | | | | | | |
| Beginning balance | | $ | 60 | | | $ | 872 | |
| Principal advances | | | -- | | | | -- | |
| Principal repayments | | | -- | | | | (192 | ) |
| Other changes | | | (60 | ) | | | (620 | ) |
| Balance, end of year | | $ | -- | | | $ | 60 | |
“Other changes” in the table above for fiscal year 2009 refers to a loan to an employee who retired during the year. ”Other changes” in fiscal year 2008 refers to a loan to an employee whose status was changed from an executive officer to a non-executive officer during the year.
The Company also accepts deposits from its executive officers, directors, and affiliated companies on substantially the same terms as unrelated parties. The aggregate dollar amounts of these deposits were $888,000 and $1.2 million at September 2009 and 2008, respectively.
Note 15 - Capital Requirements
The Bank is subject to various regulatory capital requirements administered by its primary federal regulator, the Office of Thrift Supervision (“OTS”). Failure to meet the minimum regulatory capital requirements can initiate certain mandatory and possible additional discretionary actions by regulators that, if undertaken, could have a direct material effect on the Bank and the consolidated financial statements. Under the regulatory capital adequacy guidelines and the regulatory framework for prompt corrective action, the Bank must meet specific capital guidelines involving quantitative measures of the Bank’s assets, liabilities and certain off-balance-sheet items as calculated under regulatory accounting practices. The Bank’s capital amounts and classifications under the prompt corrective action guidelines are also subject to qualitative judgments by the regulators about components, risk weightings and other factors.
Quantitative measures established by regulation to ensure capital adequacy require the Bank to maintain minimum amounts and ratios of total risk-based capital and Tier 1 capital to risk-weighted assets (as defined in the regulations), Tier 1 capital to adjusted total assets (as defined), and tangible capital to adjusted total assets (as defined). As of September 2009, the Bank meets all of the capital adequacy requirements to which it is subject.
The actual and required minimum capital amounts and ratios of the Bank are presented in the following table:
| | Actual | | For Capital Adequacy Purposes | | To Be Well Capitalized Under Prompt Corrective Action Provisions |
| | Amount | | Ratio | | Amount | | Ratio | | Amount | | Ratio |
| | (dollars in thousands) |
| September 30, 2009: | | | | | | | | | | | |
| | | | | | | | | | | | |
Total risk-based capital (to risk-weighted assets) | $155,976 | | 34.89% | | $35,768 | | ≥ 8.0% | | $ 44,709 | | ≥ 10.0% |
Tier 1 risk-based capital (to risk-weighted assets) | 150,112 | | 33.57 | | 17,884 | | ≥ 4.0 | | 26,826 | | ≥ 6.0 |
| Tier 1 (core) capital | 150,235 | | 19.61 | | 30,641 | | ≥ 4.0 | | 38,302 | | ≥ 5.0 |
Tangible capital (to tangible assets) | 150,235 | | 19.61 | | 15,321 | | ≥ 2.0 | | N/A | | N/A |
| | | | | | | | | | | | |
| September 30, 2008: | | | | | | | | | |
| | | | | | | | | | | | |
Total risk-based capital (to risk-weighted assets) | $149,803 | | 32.84% | | $36,491 | | ≥ 8.0% | | $ 45,614 | | ≥ 10.0% |
Tier 1 risk-based capital (to risk-weighted assets) | 146,783 | | 32.18 | | 18,245 | | ≥ 4.0 | | 27,368 | | ≥ 6.0 |
| Tier 1 (core) capital | 146,854 | | 21.66 | | 27,116 | | ≥ 4.0 | | 33,895 | | ≥ 5.0 |
Tangible capital (to tangible assets) | 146,854 | | 21.66 | | 13,558 | | ≥ 2.0 | | N/A | | N/A |
The following table is a reconciliation of the Bank’s capital, calculated according to generally accepted accounting principles, to total Tier 1 capital:
| | | September 30, | |
| | | 2009 | | | 2008 | |
| | | (in thousands) | |
| | | | | | | |
| Equity | | $ | 153,525 | | | $ | 146,058 | |
Other comprehensive income – unrealized loss (gain) on securities | | | (3,290 | ) | | | 967 | |
| Mortgage servicing rights, net | | | -- | | | | (171 | ) |
| Total Tier 1 capital | | $ | 150,235 | | | $ | 146,854 | |
OTS regulations place certain restrictions on dividends paid by the Bank to the Company. Generally, savings associations, such as the Bank, that before and after the proposed distribution are well-capitalized, may make capital distributions during any calendar year equal to up to 100% of net income for the year-to-date plus retained net income for the two preceding years. Savings associations proposing to make any capital distribution need not submit written notice to the OTS prior to such distribution unless they are a subsidiary of a holding company or would not remain well-capitalized following the distribution.
Note 16 - Income Taxes
The extraordinary gain realized from the Acquisition is presented on the consolidated statement of income net of applicable state and federal income taxes. The following table presents income tax expense (benefit) included in the consolidated statement of income for the year ended September 30, 2009:
| | | 2009 | |
| | | (in thousands) | |
| | | | |
| Income tax benefit from loss on continuing operations | | $ | (4,750 | ) |
| Income tax expense attributable to extraordinary gain | | | 9,756 | |
Total income tax expense included in the consolidated statement of income | | $ | 5,006 | |
Income tax expense consisted of the following:
| | | Year Ended September 30, | |
| | | 2009 | | | 2008 | | | 2007 | |
| | | (in thousands) | |
| Current | | | | | | | | | |
| Federal | | $ | 1,005 | | | $ | 3,004 | | | $ | 3,461 | |
| State | | | 214 | | | | 334 | | | | 485 | |
| Deferred | | | | | | | | | | | | |
| Federal | | | 3,306 | | | | (873 | ) | | | (557 | ) |
| State | | | 481 | | | | (202 | ) | | | (122 | ) |
| Income tax expense | | $ | 5,006 | | | $ | 2,263 | | | $ | 3,267 | |
Income tax expense differs from that computed at the statutory corporate tax rate as follows:
| | | Year Ended September 30, | |
| | | 2009 | | | 2008 | | | 2007 | |
| | | (in thousands) | |
| | | | | | | | | | |
| Federal income tax at statutory rates | | $ | (4,032 | ) | | $ | 2,131 | | | $ | 2,904 | |
| State income taxes, net of federal benefit | | | 624 | | | | 275 | | | | 410 | |
Federal income tax component of extraordinary gain on FDIC transaction | | | 8,516 | | | | -- | | | | -- | |
| Effect of permanent differences | | | (102 | ) | | | (143 | ) | | | (47 | ) |
| Income tax expense (benefit) | | $ | 5,006 | | | $ | 2,263 | | | $ | 3,267 | |
The tax effects of temporary differences that give rise to significant portions of deferred tax assets and liabilities consist of the following:
| | | September 30, | |
| | | 2009 | | | 2008 | |
| | | (in thousands) | |
| Deferred tax asset: | | | | | | |
| Deferred compensation | | $ | 2,079 | | | $ | 2,025 | |
| Unrealized loss on securities available for sale | | | -- | | | | 933 | |
| Allowance for loan losses | | | 11,419 | | | | 1,853 | |
| Equity compensation | | | 577 | | | | 446 | |
| Accrued expenses | | | 180 | | | | 179 | |
| REO adjustments | | | 490 | | | | -- | |
| Other | | | 564 | | | | 316 | |
| Total deferred tax asset | | | 15,309 | | | | 5,752 | |
| Deferred tax liability: | | | | | | | | |
| Fixed asset basis | | | (313 | ) | | | (484 | ) |
| Deferred loan costs | | | (334 | ) | | | (442 | ) |
| Prepaid expenses | | | (143 | ) | | | (161 | ) |
| Mortgage servicing rights | | | -- | | | | (666 | ) |
| FHLB stock dividends | | | (1,835 | ) | | | (1,838 | ) |
| Purchase accounting adjustments | | | (9,801 | ) | | | -- | |
| Deferred tax gain on purchase price allocation | | | (5,817 | ) | | | -- | |
| Unrealized gain on securities available for sale | | | (2,621 | ) | | | -- | |
| Other | | | (16 | ) | | | (391 | ) |
| Total deferred tax liability | | | (20,880 | ) | | | (3,982 | ) |
| Net deferred tax asset (liability) | | $ | (5,571 | ) | | $ | 1,770 | |
Included in retained earnings at September 30, 2009 and 2008 is approximately $2.1 million in bad debt reserves for which no deferred income tax liability has been recorded. This amount represents allocations of income to bad debt deductions for tax purposes only. Reduction of these reserves for purposes other than tax bad debt losses or adjustments arising from carryback of net operating losses would create income for tax purposes, which would be subject to the then-current corporate income tax rate. The unrecorded deferred liability on this amount was approximately $818,000 at September 30, 2009 and 2008.
The Company determined that it was not required to establish a valuation allowance for deferred tax assets in accordance with ASC 740, Accounting for Income Taxes, since it is more likely than not that the deferred tax asset will be realized through carryback to taxable income in prior years, future reversals of existing taxable temporary differences, and, to a lesser extent, future taxable income. The Company's net deferred tax asset is recorded in the consolidated financial statements as a separate component of the consolidated balance sheet - Deferred tax liability.
At September 30, 2009 and September 30, 2008, the Company had no ASC 740-10 unrecognized tax benefits. The Company does not expect the total amount of unrecognized tax benefits to significantly increase within the next twelve months.
The Company and the Bank are subject to U.S. federal income tax as well as an income tax in the states of Idaho and Oregon.
Note 17 – Earnings Per Share
Earnings per share (“EPS”) is computed using the basic and diluted weighted average number of common shares outstanding during the period. Basic EPS is computed by dividing the Company’s net income or loss by the weighted average number of common shares outstanding for the period. Diluted EPS is computed by dividing net income or loss by diluted weighted average shares outstanding, which include common stock equivalent shares outstanding using the treasury stock method, unless such shares are anti-dilutive. Common stock equivalents arise from assumed conversion of outstanding stock options and from assumed vesting of shares awarded but not released under the Company’s RRP plan. ESOP shares are not considered outstanding for earnings per share purposes until they are committed to be released.
The following table presents the computation of basic and diluted earnings per share for the periods indicated:
| | | Year Ended September 30, | |
| | | 2009 | | | 2008 | | | 2007 | |
| | | (in thousands, except share data) | |
| | | | | | | | | | |
| Net income (loss) before extraordinary item | | $ | (7,165 | ) | | $ | 4,005 | | | $ | 5,271 | |
| Extraordinary gain, net of tax | | | 15,291 | | | | -- | | | | -- | |
| Net income | | | 8,126 | | | | 4,005 | | | | 5,271 | |
| | | | | | | | | | | | | |
| Basic earnings per share: | | | | | | | | | | | | |
| Weighted-average common shares outstanding | | | 15,651,250 | | | | 16,233,200 | | | | 16,602,082 | |
| | | | | | | | | | | | | |
| Basic EPS before extraordinary item | | $ | (0.46 | ) | | $ | 0.25 | | | $ | 0.32 | |
| Basic EPS of extraordinary item | | | 0.98 | | | | -- | | | | -- | |
| Basic EPS after extraordinary item | | | 0.52 | | | | 0.25 | | | | 0.32 | |
| | | | | | | | | | | | | |
| Diluted earnings per share: | | | | | | | | | | | | |
| Weighted-average common shares outstanding | | | 15,651,250 | | | | 16,233,200 | | | | 16,602,082 | |
| Net effect of dilutive stock options | | | -- | | | | -- | | | | 104,598 | |
| Net effect of dilutive RRP awards | | | -- | | | | 19,547 | | | | 60,539 | |
| Weighted-average common shares outstanding and common stock equivalents | | | 15,651,250 | | | | 16,252,747 | | | | 16,767,219 | |
| | | | | | | | | | | | | |
| Diluted EPS before extraordinary item | | $ | (0.46 | ) | | $ | 0.25 | | | $ | 0.31 | |
| Diluted EPS of extraordinary item | | | 0.98 | | | | -- | | | | -- | |
| Diluted EPS after extraordinary item | | | 0.52 | | | | 0.25 | | | | 0.31 | |
Note 18 - Fair Value of Financial Instruments
The estimated fair values of the Company’s financial instruments are as follows:
| | | At September 30, | |
| | | 2009 | | | 2008 | |
| | | Carrying Amount | | | Estimated Fair Value | | | Carrying Amount | | | Estimated Fair Value | |
| | | (in thousands) | |
| Financial Assets: | | | | | | | | | | | | |
| Cash and cash equivalents | | $ | 49,953 | | | $ | 49,953 | | | $ | 23,270 | | | $ | 23,270 | |
| Investments | | | 4,127 | | | | 4,127 | | | | 5,000 | | | | 4,993 | |
Mortgage-backed securities available for sale | | | 165,193 | | | | 165,193 | | | | 188,787 | | | | 188,787 | |
| Loans held for sale | | | 862 | | | | 862 | | | | 2,831 | | | | 2,831 | |
| Loans receivable | | | 540,222 | | | | 517,438 | | | | 465,364 | | | | 469,989 | |
| FHLB stock | | | 10,326 | | | | 10,326 | | | | 9,591 | | | | 9,591 | |
| | | | | | | | | | | | | | | | | |
| Financial Liabilities: | | | | | | | | | | | | | | | | |
| Demand and savings deposits | | | 285,961 | | | | 285,961 | | | | 195,521 | | | | 195,521 | |
| Certificates of deposit | | | 228,897 | | | | 232,753 | | | | 177,404 | | | | 177,550 | |
| FHLB advances | | | 84,737 | | | | 85,272 | | | | 136,972 | | | | 143,219 | |
The following methods and assumptions were used to estimate the fair value of each class of financial instruments:
Cash and cash equivalents:
The carrying amount approximates fair value.
Mortgage-backed securities available for sale:
The fair values of mortgage-backed securities are based on quoted market prices or dealer quotes. If a quoted market price is not available, fair value is estimated using quoted market prices for similar securities.
Loans held for sale:
The carrying amount approximates fair value.
FHLB stock:
The carrying value of FHLB stock approximates fair value based on the respective redemption provisions.
Loans receivable:
Fair values for all performing loans are estimated using a discounted cash flow analysis, utilizing interest rates currently being offered for loans with similar terms to borrowers of similar credit quality. In addition, the fair value reflects the decrease in loan values as estimated in the allowance for loan losses calculation.
Deposits:
The fair value of demand deposits, savings accounts and certain money market deposits is the amount payable on demand at the reporting date. The fair value of fixed-maturity certificates of deposit are estimated using discounted cash flow analysis using the rates currently offered for deposits of similar remaining maturities.
FHLB advances:
The fair value of the borrowings is estimated by discounting the future cash flows using the current rate at which similar borrowings with similar remaining maturities could be made.
Off-balance-sheet instruments:
Fair values of off-balance-sheet lending commitments are based on fees currently charged to enter into similar agreements, taking into account the remaining terms of the agreements and the borrower’s credit standing. The fair value of the fees at September 30, 2009 and 2008 were insignificant.
Note 19 - Parent Only Financial Information
Home Federal Bancorp was formed to serve as the stock holding company for the Bank. The following are the condensed financial statements for Home Federal Bancorp (parent company only):
HOME FEDERAL BANCORP, INC. PARENT-ONLY BALANCE SHEETS (In thousands) | | September 30, 2009 | | | September 30, 2008 | |
| | | | | | | |
| ASSETS | | | | | | |
| Cash and amounts due from depository institutions | | $ | 31,285 | | | $ | 19,707 | |
| Certificate of deposit in correspondent bank | | | -- | | | | 5,000 | |
Mortgage-backed securities available for sale, at fair value | | | 23,892 | | | | 33,385 | |
| Investment in the Bank | | | 154,990 | | | | 146,058 | |
| Other assets | | | 85 | | | | 1,055 | |
| TOTAL ASSETS | | $ | 210,252 | | | $ | 205,205 | |
| | | | | | | | | |
| LIABILITIES AND STOCKHOLDERS’ EQUITY | | | | | | | | |
| Other liabilities | | $ | 587 | | | $ | 18 | |
| Stockholder’s equity | | | 209,665 | | | | 205,187 | |
TOTAL LIABILITIES AND STOCKHOLDERS’ EQUITY | | $ | 210,252 | | | $ | 205,205 | |
| | | | | | | | | |
HOME FEDERAL BANCORP, INC. PARENT-ONLY STATEMENTS OF INCOME (In thousands) | | Year Ended September 30, 2009 | | | Year Ended September 30, 2008 | | | Year Ended September 30, 2007 | |
| | | | | | | | | | |
| Income: | | | | | | | | | |
| Cash dividends from bank | | $ | 5,500 | | | $ | -- | | | $ | -- | |
| Investment interest | | | 34 | | | | 526 | | | | 95 | |
| Mortgage-backed security interest | | | 1,344 | | | | 1,220 | | | | 768 | |
| Other income | | | 127 | | | | 347 | | | | 108 | |
| Total income | | | 7,005 | | | | 2,093 | | | | 971 | |
| Expense: | | | | | | | | | | | | |
| Professional services | | | 260 | | | | 124 | | | | 125 | |
| Other | | | 332 | | | | 1,443 | | | | 220 | |
| Total expense | | | 592 | | | | 1,567 | | | | 345 | |
Income before income taxes and equity in undistributed earnings of the Bank | | | 6,413 | | | | 526 | | | | 626 | |
| Income tax expense | | | 346 | | | | 100 | | | | 188 | |
| INCOME OF PARENT COMPANY | | | 6,067 | | | | 426 | | | | 438 | |
| Equity in undistributed earnings of the Bank | | | 2,059 | | | | 3,579 | | | | 4,833 | |
| NET INCOME | | $ | 8,126 | | | $ | 4,005 | | | $ | 5,271 | |
HOME FEDERAL BANCORP, INC. PARENT-ONLY STATEMENTS OF CASH FLOWS (In thousands) | | Year Ended September 30, 2009 | | | Year Ended September 30, 2008 | | | Year Ended September 30, 2007 | |
CASH FLOWS FROM OPERATING ACTIVITIES: | | | | | | | | | |
| Net income | | $ | 8,126 | | | $ | 4,005 | | | $ | 5,271 | |
| Adjustments to reconcile net income to cash provided by operating activities: | | | | | | | | | | | | |
| Equity in undistributed earnings of the Bank | | | (2,059 | ) | | | (3,579 | ) | | | (4,833 | ) |
| Net amortization of premiums on investments | | | 34 | | | | 29 | | | | 15 | |
| ESOP shares committed to be released | | | 870 | | | | 1,090 | | | | 436 | |
| Net loss on sale of investment securities | | | 165 | | | | -- | | | | -- | |
| Change in assets and liabilities: | | | | | | | | | | | | |
| Other assets | | | (970 | ) | | | (20 | ) | | | (102 | ) |
| Other liabilities | | | 141 | | | | (41 | ) | | | (8 | ) |
| Net cash provided by operating activities | | | 6,307 | | | | 1,484 | | | | 779 | |
CASH FLOWS FROM INVESTING ACTIVITIES: | | | | | | | | | | | | |
Proceeds from maturity of mortgage-backed securities held to maturity | | | -- | | | | -- | | | | 854 | |
Proceeds from sale and maturity of mortgage-backed securities available for sale | | | 11,083 | | | | 4,715 | | | | 2,298 | |
Purchase of mortgage-backed securities available for sale | | | -- | | | | (22,123 | ) | | | (2,102 | ) |
| Maturity of (investment in) certificate of deposit | | | 5,000 | | | | (5,000 | ) | | | -- | |
| Loan originations and principal collections, net | | | 188 | | | | 4 | | | | 3 | |
| Net cash provided (used) by investing activities | | | 16,271 | | | | (22,404 | ) | | | 1,053 | |
| | | | | | | | | | | | | |
| CASH FLOWS FROM FINANCING ACTIVITIES: | | | | | | | | | | | | |
| Dividends paid | | | (3,456 | ) | | | (2,987 | ) | | | (1,281 | ) |
| Repurchase of common stock | | | (7,897 | ) | | | -- | | | | -- | |
| Investment in subsidiary | | | -- | | | | (48,345 | ) | | | -- | |
Net proceeds from stock issuance and exchange pursuant to second step conversion | | | -- | | | | 87,849 | | | | -- | |
| Proceeds from exercise of stock options | | | 353 | | | | 606 | | | | 854 | |
| Net cash (used) provided by financing activities | | | (11,000 | ) | | | 37,123 | | | | (427 | ) |
NET INCREASE IN CASH AND CASH EQUIVALENTS | | | 11,578 | | | | 16,203 | | | | 1,405 | |
CASH AND CASH EQUIVALENTS, BEGINNING OF PERIOD | | | 19,707 | | | | 3,504 | | | | 2,099 | |
| CASH AND CASH EQUIVALENTS, END OF PERIOD | | $ | 31,285 | | | $ | 19,707 | | | $ | 3,504 | |
Note 20 – Selected Quarterly Financial Data (unaudited)
(In thousands, except share data)
| | | Quarter Ended | |
| | | December 31, 2008 | | | March 31, 2009 | | | June 30, 2009 | | | September 30, 2009 | |
| | | | | | | | | | | | | |
| Interest and dividend income | | $ | 9,328 | | | $ | 8,930 | | | $ | 8,410 | | | $ | 9,159 | |
| Interest expense | | | 3,583 | | | | 2,970 | | | | 2,697 | | | | 2,727 | |
Net interest income | | | 5,745 | | | | 5,960 | | | | 5,713 | | | | 6,432 | |
| Provision for loan losses | | | 3,575 | | | | 1,060 | | | | 3,450 | | | | 8,000 | |
| Non-interest income | | | 2,461 | | | | 2,345 | | | | 2,611 | | | | 1,874 | |
| Non-interest expense | | | 6,034 | | | | 6,571 | | | | 7,014 | | | | 9,352 | |
| Income (loss) before income taxes | | | (1,403 | ) | | | 674 | | | | (2,140 | ) | | | (9,046 | ) |
| Income tax expense (benefit) | | | (602 | ) | | | 198 | | | | (894 | ) | | | (3,452 | ) |
Net income (loss) before extraordinary item | | | (801 | ) | | | 476 | | | | (1,246 | ) | | | (5,594 | ) |
| Extraordinary gain, net of tax | | | -- | | | | -- | | | | -- | | | | 15,291 | |
Net income (loss) | | $ | (801 | ) | | $ | 476 | | | $ | (1,246 | ) | | $ | 9,697 | |
Basic EPS before extraordinary item(1) | | $ | (0.05 | ) | | $ | 0.03 | | | $ | (0.08 | ) | | $ | (0.36 | ) |
Basic EPS of extraordinary item(1) | | | -- | | | | -- | | | | -- | | | | 0.99 | |
Basic EPS after extraordinary item(1) | | | (0.05 | ) | | | 0.03 | | | | (0.08 | ) | | | 0.63 | |
| | | | | | | | | | | | | | | | | |
Diluted EPS before extraordinary item(1) | | | (0.05 | ) | | | 0.03 | | | | (0.08 | ) | | | (0.36 | ) |
Diluted EPS of extraordinary item(1) | | | -- | | | | -- | | | | -- | | | | 0.99 | |
Diluted EPS after extraordinary item(1) | | | (0.05 | ) | | | 0.03 | | | | (0.08 | ) | | | 0.63 | |
| | | | | | | | | | | | | | | | | |
| | | Quarter Ended | |
| | | December 31, 2007 | | | March 31, 2008 | | | June 30, 2008 | | | September 30, 2008 | |
| Interest and dividend income | | $ | 10,302 | | | $ | 10,459 | | | $ | 10,093 | | | $ | 9,730 | |
| Interest expense | | | 5,246 | | | | 4,682 | | | | 4,181 | | | | 3,826 | |
| Net interest income | | | 5,056 | | | | 5,777 | | | | 5,912 | | | | 5,903 | |
| Provision for loan losses | | | 287 | | | | 378 | | | | 652 | | | | 1,114 | |
| Non-interest income | | | 2,625 | | | | 2,483 | | | | 2,735 | | | | 2,647 | |
| Non-interest expense | | | 5,883 | | | | 6,424 | | | | 6,174 | | | | 5,958 | |
| Income before income taxes | | | 1,511 | | | | 1,458 | | | | 1,820 | | | | 1,479 | |
| Income tax expense | | | 564 | | | | 513 | | | | 702 | | | | 484 | |
Net income | | $ | 947 | | | $ | 945 | | | $ | 1,119 | | | $ | 994 | |
Basic earnings per share (1) | | $ | 0.06 | | | $ | 0.06 | | | $ | 0.07 | | | $ | 0.06 | |
Diluted earnings per share (1) | | | 0.06 | | | | 0.06 | | | | 0.07 | | | | 0.06 | |
_______
| (1) | The sum of quarterly earnings per share may vary from annual earnings per share due to rounding. |
Item 9. Changes in and Disagreements with Accountants on Accounting and Financial Disclosure
During the fiscal years ended September 30, 2009 and 2008, there were no disagreements with Moss Adams LLP, the Company’s independent registered public accounting firm, and Moss Adams LLP issued unqualified opinions on the Company’s financial statements as of and for the years then ended.
Item 9A. Controls and Procedures
Evaluation of Disclosure Controls and Procedures: An evaluation of the Company’s disclosure controls and procedures (as defined in Section 13a-15(e) of the Exchange Act) was carried out under the supervision and with the participation of the Company’s Chief Executive Officer, Chief Financial Officer and several other members of the Company’s senior management as of the end of the period covered by this annual report. The Company’s Chief Executive Officer and Chief Financial Officer concluded that the Company’s disclosure controls and procedures as in effect as of September 30, 2009, are effective in ensuring that the information required to be disclosed by the Company in the reports it files or submits under the Exchange Act is (i) accumulated and communicated to the Company’s management (including the Chief Executive Officer and Chief Financial Officer) in a timely manner, and (ii) recorded, processed, summarized and reported within the time periods specified in the Security and Exchange Commission’s rules and forms.
Management's Annual Report on Internal Control Over Financial Reporting and Auditor’s Attestation: The “Management's Annual Report on Internal Control Over Financial Reporting” included in Item 8 of this Annual Report on Form 10-K is incorporated herein by reference.
Attestation Report of the Registered Public Accounting Firm: The “Report of Independent Registered Public Accounting Firm” included in Item 8 of this Annual Report on Form 10-K is incorporated herein by reference.
Changes in Internal Controls: There have been no changes in our internal control over financial reporting (as defined in 13a-15(f) of the Exchange Act) that occurred during the quarter ended September 30, 2009, that has materially affected, or is reasonably likely to materially affect, our internal control over financial reporting. A number of internal control procedures were, however, modified during the quarter in conjunction with the Bank's internal control testing and the acquisition of Community First Bank, as described in Note 2 to the financial statements in Item 8 of this Annual Report on Form 10-K.
Item 9B. Other Information
There was no information to be disclosed by the Company in a report on Form 8-K during the fourth quarter of fiscal 2009 that was not so disclosed.
PART III
Item 10. Directors, Executive Officers and Corporate Governance
DIRECTORS
The information contained in the Company’s Proxy Statement for the 2010 Annual Meeting under the sections captioned “Proposal 1 – Election of Directors” and “Meetings and Committees of the Board of Directors and Corporate Governance Matters” are incorporated herein by reference.
EXECUTIVE OFFICERS
See the information under the section captioned “Executive Officers of the Registrant” under “Part I - Item 1. Business” in this Annual Report on Form 10-K.
COMPLIANCE WITH SECTION 16(a) OF THE EXCHANGE ACT
The information contained in the Company’s Proxy Statement for the 2010 Annual Meeting under the section captioned “Section 16(a) Beneficial Ownership Reporting Compliance” is incorporated herein by reference.
AUDIT COMMITTEE AND AUDIT COMMITTEE FINANCIAL EXPERT
The information contained in the Company’s Proxy Statement for the 2010 Annual Meeting under the section captioned “Meetings and Committees of the Board of Directors and Corporate Governance Matters” is incorporated herein by reference.
CODE OF ETHICS
We have a Code of Ethics for our officers (including its senior financial officers), directors and employees. The Code of Ethics requires our officers, directors and employees to maintain the highest standards of professional conduct. A copy of our Code of Ethics was filed as an exhibit to the Annual Report on Form 10-K for the fiscal year ended September 30, 2004 and is available on our website at www.myhomefed.com/ir.
Item 11. Executive Compensation
The information contained in the Company’s Proxy Statement for the 2010 Annual Meeting under the section captioned “Directors’ Compensation” and “Executive Compensation” are incorporated herein by reference.
Item 12. Security Ownership of Certain Beneficial Owners and Management and Related Stockholder Matters
Equity Compensation Plan Information
| Plan category | | Number of securities to be issued upon exercise of outstanding options, warrants and rights (a) | | | Weighted-average exercise price of outstanding options, warrants and rights (b) | | | Number of securities remaining available for future issuance under equity compensation plans (excluding securities reflected in column (a)) (c) | |
Equity compensation plans approved by security holders: 2005 Stock Option Plan 2005 Recognition and Retention Plan 2008 Stock Equity Incentive Plan(1) | | | 492,366 -- 453,998 | | | | $11.95 -- 9.39 | | | | 171,806 62,175 600,288 | |
Equity compensation plans not approved by security holders: None. | | | -- | | | | $ -- | | | | -- | |
Total | | | 946,364 | | | | $ 10.72 | | | | 834,269 | |
_______
| (1) | Includes 429,778 stock options and 170,510 shares of restricted stock in column (c). |
The information contained in the Company’s Proxy Statement for the 2010 Annual Meeting under the section captioned ”Security Ownership of Certain Beneficial Owners and Management” is incorporated herein by reference.
Item 13. Certain Relationships and Related Transactions, and Director Independence
The information contained in the Company’s Proxy Statement for the 2010 Annual Meeting under the section captioned “Meetings and Committees of the Board of Directors and Corporate Governance Matters” are incorporated herein by reference.
Item 14. Principal Accounting Fees and Services
The information contained in the Company’s Proxy Statement for the 2010 Annual Meeting under the sections captioned “Proposal 2 – Ratification of the Appointment of the Independent Registered Public Accounting Firm” are incorporated herein by reference.
PART IV
Item 15. Exhibits and Financial Statement Schedules
(a) Financial Statements
See Index to Consolidated Financial Statements on page 90.
(b) Financial Statement Schedules
All financial statement schedules are omitted because they are not applicable or not required, or because the required information is included in the Consolidated Financial Statements or the Notes thereto or in Part I, Item 1.
| | 2.1 | Purchase and Assumption Agreement for Community First Bank Transaction(1) |
| | 3.1 | Articles of Incorporation of the Registrant (2) |
| | 3.2 | Bylaws of the Registrant (2) |
| | 10.1 | Amended Employment Agreement entered into by Home Federal Bancorp, Inc. with Len E. Williams(8) |
| | 10.2 | Amended Severance Agreement with Eric S. Nadeau(8) |
| | 10.3 | Amended Severance Agreement with Steven D. Emerson(8) |
| | 10.4 | Amended Severance Agreement with Steven K. Eyre(8) |
| | 10.5 | Form of Home Federal Bank Employee Severance Compensation Plan (3) |
| | 10.6 | Form of Director Indexed Retirement Agreement entered into by Home Federal Savings and Loan Association of Nampa with each of its Directors (2) |
| | 10.7 | Form of Director Deferred Incentive Agreement entered into by Home Federal Savings and Loan Association of Nampa with each of its Directors (2) |
| | 10.8 | Form of Executive Deferred Incentive Agreement, and amendment thereto, entered into by Home Federal Savings and Loan Association of Nampa with Daniel L. Stevens, Robert A. Schoelkoph, and Lynn A. Sander (2) |
| | 10.9 | Form of Amended and Restated Salary Continuation Agreement entered into by Home Federal Savings and Loan Association of Nampa with Daniel L. Stevens (2) |
| | 10.10 | Amended and Restated Salary Continuation Agreement entered into by Home Federal Savings and Loan Association of Nampa with Len E. Williams(8) |
| | 10.11 | Amended and Restated Salary Continuation Agreement entered into by Home Federal Savings and Loan Association of Nampa with Eric S. Nadeau(8) |
| | 10.12 | Amended and Restated Salary Continuation Agreement entered into by Home Federal Savings and Loan Association of Nampa with Steven D. Emerson(8) |
| | 10.13 | Amended and Restated Salary Continuation Agreement entered into by Home Federal Savings and Loan Association of Nampa with Steven K. Eyre(8) |
| | 10.14 | 2005 Stock Option and Incentive Plan approved by stockholders on June 23, 2005 and Form of Incentive Stock Option Agreement and Non-Qualified Stock Option Agreement (4) |
| | 10.15 | 2005 Recognition and Retention Plan approved by stockholders on June 23, 2005 and Form of Award Agreement (4) |
| | 10.15 | Form of new Director Retirement Plan entered into by Home Federal Bank with each of its Directors (5) |
| | 10.16 | Transition Agreement with Daniel L. Stevens (6) |
| | 10.17 | 2008 Equity Incentive Plan (7) |
| | 11 | Statement regarding computation of per share earnings (9) |
| | 14 | Code of Ethics (10) |
| | 21 | Subsidiaries of the Registrant * |
| | 23 | Consent of Independent Registered Public Accounting Firm * |
| | 31.1 | Certification of Chief Executive Officer Pursuant to Section 302 of the Sarbanes-Oxley Act * |
| | 31.2 | Certification of Chief Financial Officer Pursuant to Section 302 of the Sarbanes-Oxley Act * |
| | 32 | Certification Pursuant to Section 906 of the Sarbanes-Oxley Act * |
______
| * | Filed herewith |
| (1) | Filed as an exhibit to the Registrant’s Current Report on Form 8-K dated August 7, 2009. |
| (2) | Filed as an exhibit to the Registrant's Registration Statement on Form S-1 (333-146289) |
| (3) | Filed as an exhibit to the Registrant’s Quarterly Report on Form 10-Q for the quarter ended December 31, 2008 |
| (4) | Filed as an exhibit to the Registrant’s Registration Statement on Form S-8 (333-127858) |
| (5) | Filed as an exhibit to the Registrant’s Current Report on Form 8-K dated October 21, 2005 |
| (6) | Filed as an exhibit to the Registrant’s Current Report on Form 8-K dated August 21, 2006 |
| (7) | Filed as an exhibit to the Registrant’s Registration Statement on Form S-8 (333-157540) |
| (8) | Filed as an exhibit to the Registrant’s Quarterly Report on Form 10-Q for the quarter ended March 31, 2009 |
| (9) | Reference is made to Note 17 – Earnings Per Share in the Selected Notes to Consolidated Financial Statements under Item 8 herein |
| (10) | Registrant elects to satisfy Regulation S-K §229.406(c) by posting its Code of Ethics on its website at.www.myhomefed.com under the heading “Investor Relations.” |
SIGNATURES
Pursuant to the requirements of Section 13 or 15(d) of the Securities Exchange Act of 1934, the registrant has duly caused this report to be signed on its behalf by the undersigned thereunto, duly authorized.
| | HOME FEDERAL BANCORP, INC. |
| | |
| | |
| | |
| Date: December 11, 2009 | /s/Len E. Williams |
| | Len E. Williams |
| | President and |
| | Chief Executive Officer |
Pursuant to the requirements of Section 13 or 15(d) of the Securities Exchange Act of 1934, this report has been signed below by the following persons on behalf of the registrant and in the capacities and on the dates indicated.
| SIGNATURES | TITLE | DATE |
| |
| |
| /s/ Len E. Williams | President, Chief Executive Officer | December 11, 2009 |
| Len E. Williams | and Director |
| | (Principal Executive Officer) | |
| | | |
| | | |
| /s/ Eric S. Nadeau | Chief Financial Officer | December 11, 2009 |
| Eric S. Nadeau | (Principal Financial and Accounting Officer) |
| |
| |
| /s/ Brad Little | Director | December 11, 2009 |
| Brad Little |
| |
| |
| /s/ Charles Hedemark | Director | December 11, 2009 |
| N. Charles Hedemark |
| |
| |
| /s/ Richard J. Navarro | Director | December 11, 2009 |
| Richard J. Navarro |
| |
| |
| /s/ James R. Stamey | Director | December 11, 2009 |
| James R. Stamey |
| |
| |
| /s/ Robert A. Tinstman | Director | December 11, 2009 |
| Robert A. Tinstman | | |
| | | |
| | | |
| /s/ Daniel L. Stevens | Chairman | December 11, 2009 |
| Daniel L. Stevens | | |
EXHIBIT INDEX
| 21 | Subsidiaries of the Registrant |
| 23 | Consent of Independent Registered Public Accounting Firm |
| 31.1 | Certification of Chief Executive Officer Pursuant to Section 302 of the Sarbanes-Oxley Act |
| 31.2 | Certification of Chief Financial Officer Pursuant to Section 302 of the Sarbanes-Oxley Act |
| 32 | Certification Pursuant to Section 906 of the Sarbanes-Oxley Act |