Exhibit 2
Exhibit 2
NXP Semiconductors
Investor Presentation | April 2016
LEGAL NOTICE
This document has been prepared by NXP Semiconductors N.V. (“NXP”) solely for informational purposes. The presentation includes the following slides, the oral presentation of the slides by NXP or any person on its behalf, any question-and-answer session that follows the oral presentation, hard copies of this document and any materials distributed at, or in connection with the presentation (collectively, the “Presentation”). By attending the meeting at which the Presentation is made, or by reading the Presentation, you will be deemed to have (i) agreed to all of the following restrictions and made the following undertakings and (ii)acknowledged that you understand the legal and regulatory sanctions attached to the misuse, disclosure or improper circulation of the Presentation.
Information relating to markets, market size, market share, market position, growth rates and other industry data contained in the Presentation relating to our industry and business is partly based on our estimates and is provided solely for illustrative purposes. We have also compiled, extracted and reproduced market or other industry data from external sources, including third parties or industry or general publications. Any such information contained in the Presentation has not been independently verified and no representation or warranty, express or implied, is made as to, and no reliance should be placed on, the fairness, accuracy, completeness or correctness of the information or opinions expressed herein. None of NXP, the companies in the NXP group or any of their respective directors, officers, employees, agents or any other person shall have any liability whatsoever (in negligence or otherwise) for any loss howsoever arising from any use of the Presentation or its contents or otherwise arising in connection with the Presentation. The information and opinions contained in this Presentation do not purport to be comprehensive, are provided as at the date of the document and are subject to change without notice. While we believe our internal estimates to be reasonable, they have not been verified by any independent sources, and we cannot assure you as to their accuracy or that other persons would agree with our calculations and estimates. The industry and market data included in the Presentation may be subject to significant uncertainty due to differing definitions of the relevant markets described, as well as the other uncertainties. NXP is not under any obligation to update or keep current the information contained in the Presentation.
Non-GAAP Financial Measures
In addition to providing financial information on a basis consistent with U.S. generally accepted accounting principles (“GAAP”), the Presentation also contains the following selected financial measures on a non-GAAP basis: (i) Gross profit, (ii) Gross margin, (iii) Research and development, (iv) Selling, general and administrative, (v) Other income, (vi) Operating income (loss), (vii) Operating margin, (viii) Financial Income (expense), (ix) Cash tax expense, (x) Results relating to equity-accounted investees, (xi) Net income (loss), (xii) Net income (loss) attributable to stockholders, (xiii) Weighted average shares –diluted, (xiv) Diluted net income (loss) attributable to stockholders per share, (xv) EBITDA, adjusted EBITDA and trailing 12 month adjusted EBITDA, and (xvi) non-GAAP free cash flow. The non-GAAP information excludes the amortization of acquisition related intangible assets, the purchase accounting effect on inventory and property, plant and equipment, merger related costs (including integration costs), certain items related to divestitures, share-based compensation expense, restructuring and asset impairment charges, process and product transfer costs, non-cash interest expense on convertible notes, extinguishment of debt, changes in the fair value of the warrant liability prior to January 1, 2016, foreign exchange gains and losses and the non-cash impact on income tax expense.
Management does not believe that these items are reflective of the Company’s underlying performance. The presentation of these and other similar items in NXP’s non-GAAP financial results should not be interpreted as implying that these items are non-recurring, infrequent or unusual. NXP believes this non-GAAP financial information provides additional insight into the Company’s on-going performance and has therefore chosen to provide this information to investors for a more consistent basis of comparison and to help them evaluate the results of the Company’s on-going operations and enable more meaningful period to period comparisons. These non-GAAP measures are provided in addition to, and not as a substitute for, or superior to, measures of financial performance prepared in accordance with GAAP. Reconciliations of these non-GAAP measures to the most comparable measures calculated in accordance with GAAP are provided in the financial statements portion of the quarterly earnings releases in a schedule entitled “Financial Reconciliation of GAAP to non-GAAP Results (unaudited).”
2
LEGAL NOTICE (continued)
Forward-Looking Statement
This presentation includes forward-looking statements which include statements regarding our business strategy, financial condition, results of operations, and market data, as well as any other statements which are not historical facts. By their nature, forward-looking statements are subject to numerous factors, risks and uncertainties that could cause actual outcomes and results to be materially different from those projected. These factors, risks and uncertainties include the following: market demand and semiconductor industry conditions, our ability to successfully introduce new technologies and products, the demand for the goods into which our products are incorporated, our ability to generate sufficient cash, raise sufficient capital or refinance our debt at or before maturity to meet both our debt service and research and development and capital investment requirements, our ability to accurately estimate demand and match our production capacity accordingly or obtain supplies from third-party producers, our access to production from third-party outsourcing partners, and any events that might affect their business or our relationship with them, our ability to secure adequate and timely supply of equipment and materials from suppliers, our ability to avoid operational problems and product defects and, if such issues were to arise, to rectify them quickly, our ability to form strategic partnerships and joint ventures and successfully cooperate with our alliance partners, our ability to win competitive bid selection processes to develop products for use in our customers’ equipment and products, our ability to successfully establish a brand identity, our ability to successfully hire and retain key management and senior product architects; and, our ability to maintain good relationships with our suppliers. In addition, this document contains information concerning the semiconductor industry and our business segments generally, which is forward-looking in nature and is based on a variety of assumptions regarding the ways in which the semiconductor industry, our market segments and product areas will develop. We have based these assumptions on information currently available to us, if any one or more of these assumptions turn out to be incorrect, actual market results may differ from those predicted. While we do not know what impact any such differences may have on our business, if there are such differences, our future results of operations and financial condition, and the market price of the notes, could be materially adversely affected. Readers are cautioned not to place undue reliance on these forward-looking statements, which speak to results only as of the date the statements were made; and, except for any ongoing obligation to disclose material information as required by the United States federal securities laws, we do not have any intention or obligation to publicly update or revise any forward-looking statements after we distribute this document, whether to reflect any future events or circumstances or otherwise. For a discussion of potential risks and uncertainties, please refer to the risk factors listed in our SEC filings. Copies of our filings are available from our Investor Relations department or from the SEC website, www.sec.gov.
No Offer or Solicitation
The Presentation does not constitute or form part of, and should not be construed as, an offer to sell or issue, or the solicitation of an offer to purchase, subscribe to or acquire, securities of NXP, or an inducement to enter into investment activity in the United States or in any other jurisdiction in which such offer, solicitation, inducement or sale would be unlawful prior to registration, exemption from registration or qualification under the securities laws of such jurisdiction. No part of this Presentation, nor the fact of its distribution, should form the basis of, or be relied on in connection with, any contract or commitment or investment decision whatsoever.
The Presentation is not for publication, release or distribution in any jurisdiction where such publication, release or distribution would constitute a violation of the relevant laws of such jurisdiction, nor should it be taken or transmitted into such jurisdiction.
3
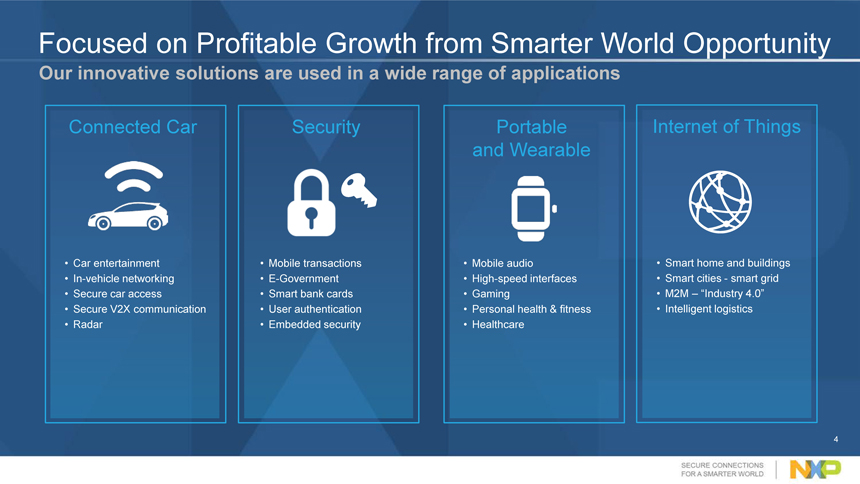
Focused on Profitable Growth from Smarter World Opportunity
Our innovative solutions are used in a wide range of applications
Connected Car Security Portable Internet of Things and Wearable
Car entertainment Mobile transactions Mobile audio Smart home and buildings
In-vehicle networking
E-Government
High-speed interfaces
Smart cities—smart grid
Secure car access
Smart bank cards
Gaming
M2M – “Industry 4.0”
Secure V2X communication User authentication Personal health & fitness Intelligent logistics
Radar Embedded security Healthcare
4
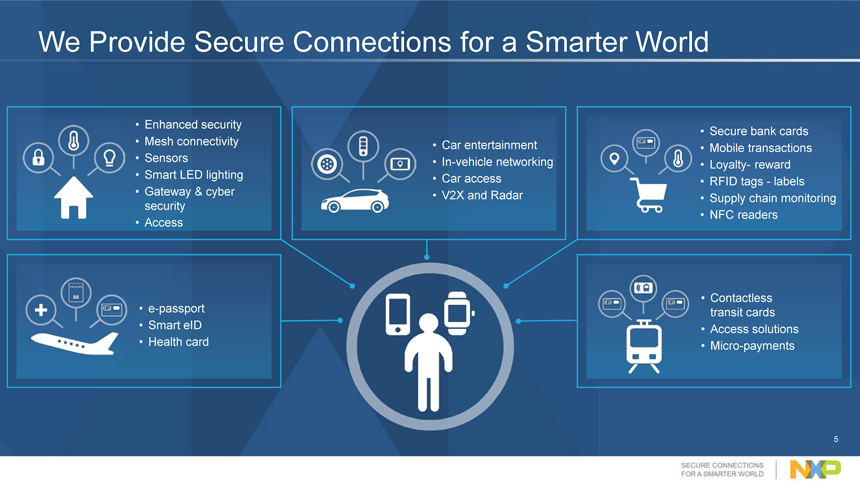
We Provide Secure Connections for a Smarter World
Enhanced security
Secure bank cards
Mesh connectivity Car entertainment
Mobile transactions
Sensors
In-vehicle networking
Loyalty- reward
Smart LED lighting Car access
RFID tags—labels
Gateway & cyber V2X and Radar
Supply chain monitoring security
NFC readers
Access
Contactless e-passport transit cards
Smart eID Access solutions
Health card Micro-payments
5
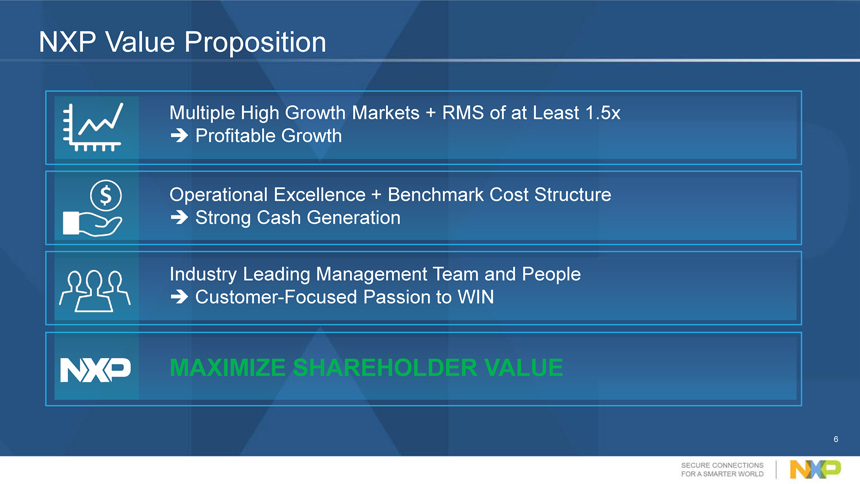
NXP Value Proposition
Multiple High Growth Markets + RMS of at Least 1.5x Profitable Growth
Operational Excellence + Benchmark Cost Structure Strong Cash Generation
Industry Leading Management Team and People Customer-Focused Passion to WIN
MAXIMIZE SHAREHOLDER VALUE
6
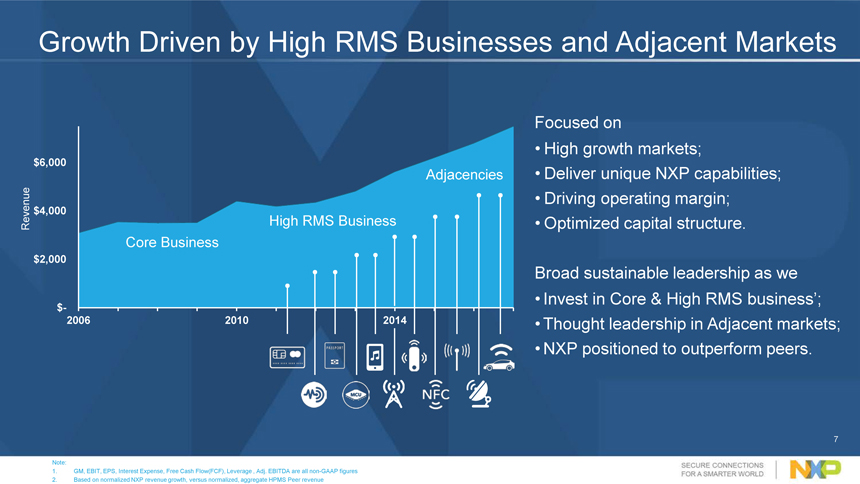
Growth Driven by High RMS Businesses and Adjacent Markets
Focused on
High growth markets;
$6,000
Adjacencies Deliver unique NXP capabilities; Driving operating margin;
$4,000
Revenue High RMS Business Optimized capital structure.
Core Business
$2,000
Broad sustainable leadership as we Invest in Core & High RMS business’;
$-
2006 2010 2014 Thought leadership in Adjacent markets; NXP positioned to outperform peers.
7
Note:
1. GM, EBIT, EPS, Interest Expense, Free Cash Flow(FCF), Leverage , Adj. EBITDA are all non-GAAP figures
2. Based on normalized NXP revenue growth, versus normalized, aggregate HPMS Peer revenue
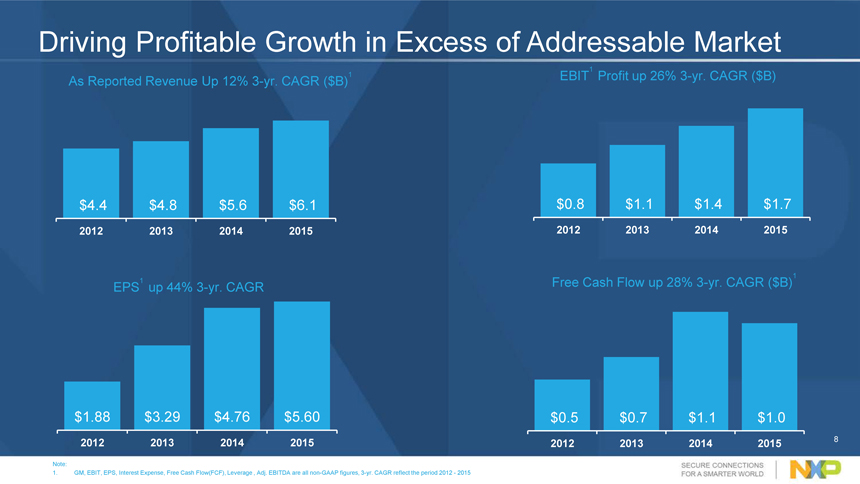
Driving Profitable Growth in Excess of Addressable Market
1
As Reported Revenue Up 12% 3-yr. CAGR ($B)1 EBIT Profit up 26% 3-yr. CAGR ($B)
$4.4 $4.8 $5.6 $6.1 $0.8 $1.1 $1.4 $1.7
2012 2013 2014 2015 2012 2013 2014 2015
1
EPS1 up 44% 3-yr. CAGR Free Cash Flow up 28% 3-yr. CAGR ($B)
$1.88 $3.29 $4.76 $5.60 $0.5 $0.7 $1.1 $1.0
2012 2013 2014 2015 2012 2013 2014 2015 8
Note:
1. GM, EBIT, EPS, Interest Expense, Free Cash Flow(FCF), Leverage , Adj. EBITDA are all non-GAAP figures, 3-yr. CAGR reflect the period 2012 – 2015
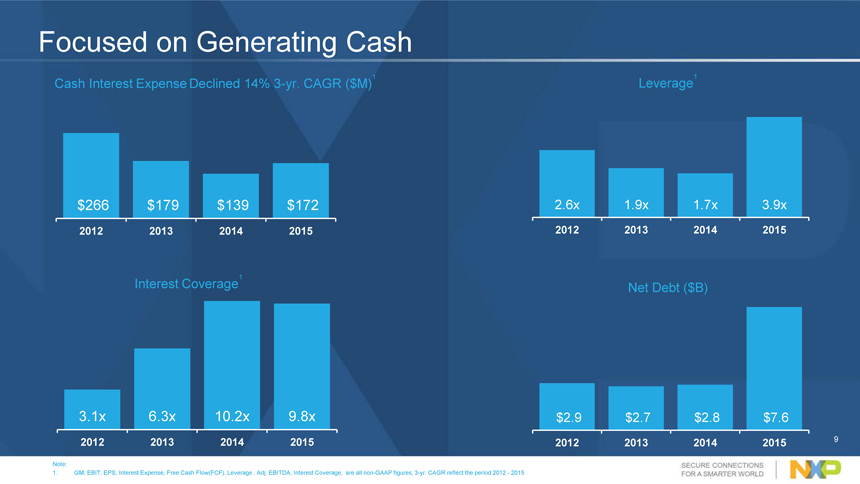
Focused on Generating Cash
Cash Interest Expense Declined 14% 3-yr. CAGR ($M)1 Leverage1
$266 $179 $139 $172 2.6x 1.9x 1.7x 3.9x
2012 2013 2014 2015 2012 2013 2014 2015
Interest Coverage1
Net Debt ($B)
3.1x 6.3x 10.2x 9.8x $2.9 $2.7 $2.8 $7.6
2012 2013 2014 2015 2012 2013 2014 2015 9
Note:
1. GM, EBIT, EPS, Interest Expense, Free Cash Flow(FCF), Leverage , Adj. EBITDA, Interest Coverage, are all non-GAAP figures, 3-yr. CAGR reflect the period 2012 – 2015
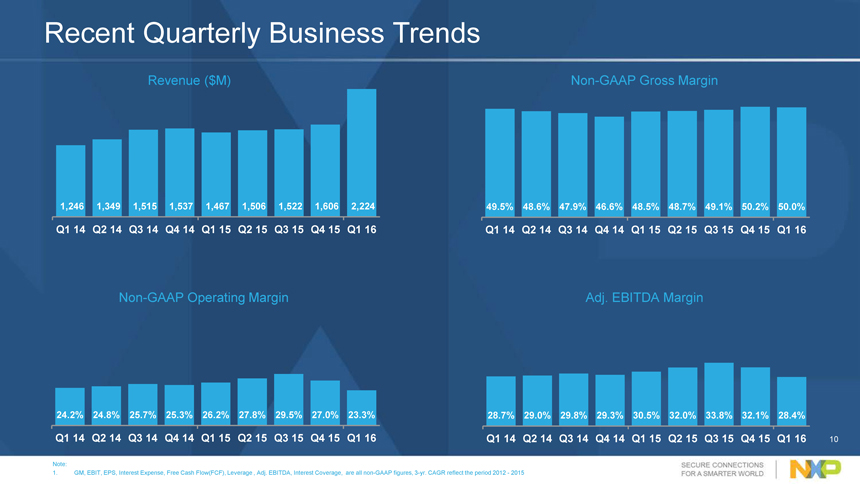
Recent Quarterly Business Trends
Revenue ($M) Non-GAAP Gross Margin
1,246 1,349 1,515 1,537 1,467 1,506 1,522 1,606 2,224 49.5% 48.6% 47.9% 46.6% 48.5% 48.7% 49.1% 50.2% 50.0%
Q1 14 Q2 14 Q3 14 Q4 14 Q1 15 Q2 15 Q3 15 Q4 15 Q1 16 Q1 14 Q2 14 Q3 14 Q4 14 Q1 15 Q2 15 Q3 15 Q4 15 Q1 16
Non-GAAP Operating Margin Adj. EBITDA Margin
24.2% 24.8% 25.7% 25.3% 26.2% 27.8% 29.5% 27.0% 23.3% 28.7% 29.0% 29.8% 29.3% 30.5% 32.0% 33.8% 32.1% 28.4%
Q1 14 Q2 14 Q3 14 Q4 14 Q1 15 Q2 15 Q3 15 Q4 15 Q1 16 Q1 14 Q2 14 Q3 14 Q4 14 Q1 15 Q2 15 Q3 15 Q4 15 Q1 16 10
Note: 10
1. GM, EBIT, EPS, Interest Expense, Free Cash Flow(FCF), Leverage , Adj. EBITDA, Interest Coverage, are all non-GAAP figures, 3-yr. CAGR reflect the period 2012 – 2015
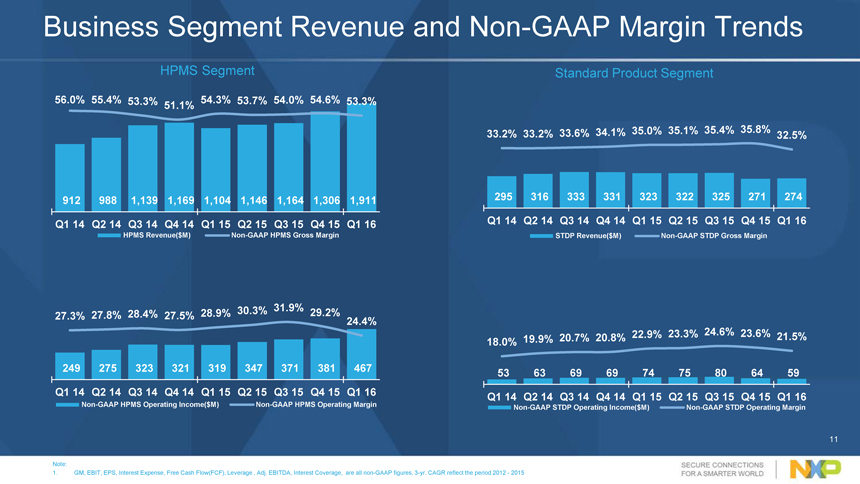
Business Segment Revenue and Non-GAAP Margin Trends
HPMS Segment Standard Product Segment
56.0% 55.4% 53.3% 54.3% 53.7% 54.0% 54.6% 53.3% 51.1%
33.2% 33.2% 33.6% 34.1% 35.0% 35.1% 35.4% 35.8% 32.5%
912 988 1,139 1,169 1,104 1,146 1,164 1,306 1,911 295 316 333 331 323 322 325 271 274 Q1 14 Q2 14 Q3 14 Q4 14 Q1 15 Q2 15 Q3 15 Q4 15 Q1 16 Q1 14 Q2 14 Q3 14 Q4 14 Q1 15 Q2 15 Q3 15 Q4 15 Q1 16
HPMS Revenue($M) Non-GAAP HPMS Gross Margin STDP Revenue($M) Non-GAAP STDP Gross Margin
28.9% 30.3% 31.9% 29.2% 27.3% 27.8% 28.4% 27.5%
24.4% 24.6%
20.7% 20.8% 22.9% 23.3% 23.6% 21.5% 18.0% 19.9% 249 275 323 321 319 347 371 381 467 53 63 69 69 74 75 80 64 59 Q1 14 Q2 14 Q3 14 Q4 14 Q1 15 Q2 15 Q3 15 Q4 15 Q1 16 Q1 14 Q2 14 Q3 14 Q4 14 Q1 15 Q2 15 Q3 15 Q4 15 Q1 16
Non-GAAP HPMS Operating Income($M) Non-GAAP HPMS Operating Margin Non-GAAP STDP Operating Income($M) Non-GAAP STDP Operating Margin
11
Note:
1. GM, EBIT, EPS, Interest Expense, Free Cash Flow(FCF), Leverage , Adj. EBITDA, Interest Coverage, are all non-GAAP figures, 3-yr. CAGR reflect the period 2012 – 2015
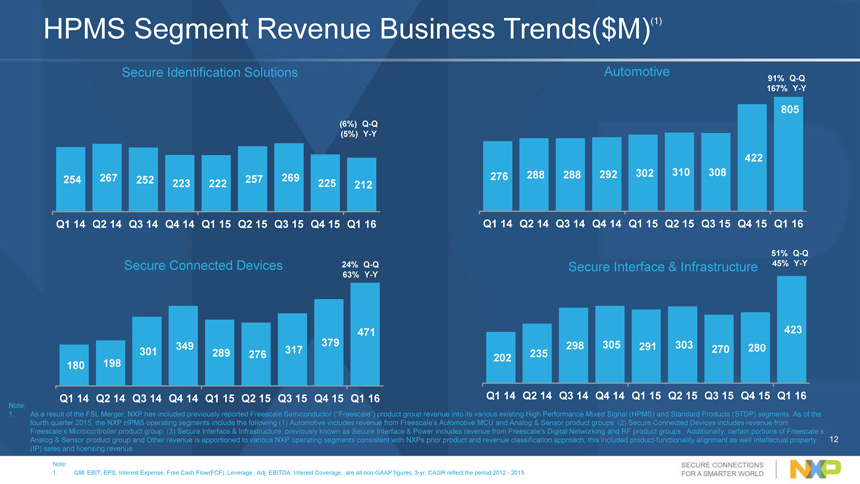
HPMS Segment Revenue Business Trends($M)(1)
Secure Identification Solutions Automotive
91% Q-Q 167% Y-Y
805
(6%) Q-Q (5%) Y-Y
422 276 288 288 292 302 310 308 254 267 252 257 269 223 222 225 212
Q1 14 Q2 14 Q3 14 Q4 14 Q1 15 Q2 15 Q3 15 Q4 15 Q1 16 Q1 14 Q2 14 Q3 14 Q4 14 Q1 15 Q2 15 Q3 15 Q4 15 Q1 16
51% Q-Q
Secure Connected Devices 24% Q-Q Secure Interface & Infrastructure 45% Y-Y
63% Y-Y
471 423 349 379 298 305 291 303 280 301 289 276 317 235 270 202 180 198
Q1 14 Q2 14 Q3 14 Q4 14 Q1 15 Q2 15 Q3 15 Q4 15 Q1 16 Q1 14 Q2 14 Q3 14 Q4 14 Q1 15 Q2 15 Q3 15 Q4 15 Q1 16
Note:
1. As a result of the FSL Merger, NXP has included previously reported Freescale Semiconductor (“Freescale”) product group revenue into its various existing High Performance Mixed Signal (HPMS) and Standard Products (STDP) segments. As of the fourth quarter 2015, the NXP HPMS operating segments include the following (1) Automotive includes revenue from Freescale’s Automotive MCU and Analog & Sensor product groups; (2) Secure Connected Devices includes revenue from Freescale’s Microcontroller product group; (3) Secure Interface & Infrastructure, previously known as Secure Interface & Power includes revenue from Freescale’s Digital Networking and RF product groups. Additionally, certain portions of Freescale’s 12 Analog & Sensor product group and Other revenue is apportioned to various NXP operating segments consistent with NXPs prior product and revenue classification approach, this included product-functionality alignment as well intellectual property (IP) sales and licensing revenue.
Note: 12
1. GM, EBIT, EPS, Interest Expense, Free Cash Flow(FCF), Leverage , Adj. EBITDA, Interest Coverage, are all non-GAAP figures, 3-yr. CAGR reflect the period 2012 – 2015
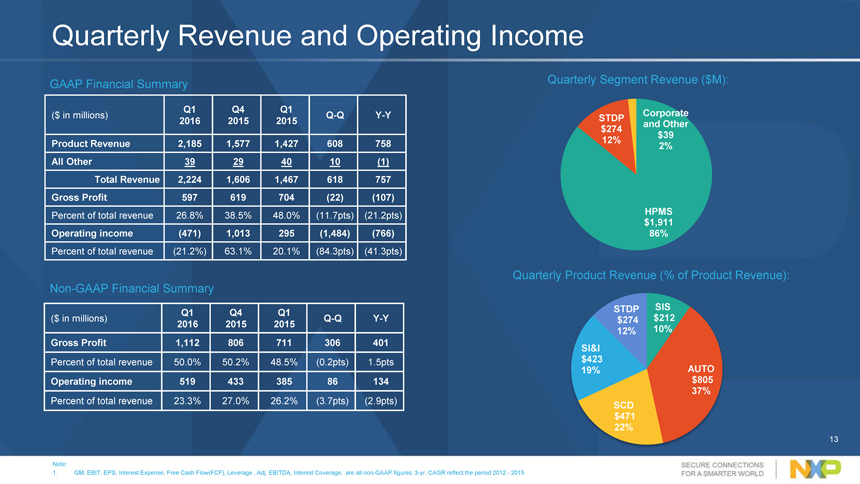
Quarterly Revenue and Operating Income
GAAP Financial Summary Quarterly Segment Revenue ($M):
Q1 Q4 Q1 Corporate
($ in millions) Q-Q Y-Y STDP
2016 2015 2015 and Other $274 $39 Product Revenue 2,185 1,577 1,427 608 758 12% 2% All Other 39 29 40 10 (1) Total Revenue 2,224 1,606 1,467 618 757 Gross Profit 597 619 704 (22) (107)
Percent of total revenue 26.8% 38.5% 48.0% (11.7pts) (21.2pts) HPMS $1,911 Operating income (471) 1,013 295 (1,484) (766) 86%
Percent of total revenue (21.2%) 63.1% 20.1% (84.3pts) (41.3pts)
Quarterly Product Revenue (% of Product Revenue): Non-GAAP Financial Summary
STDP SIS Q1 Q4 Q1 ($ in millions) Q-Q Y-Y $274 $212 2016 2015 2015 10% 12% Gross Profit 1,112 806 711 306 401 SI&I
Percent of total revenue 50.0% 50.2% 48.5% (0.2pts) 1.5pts $423 AUTO 19% $805 Operating income 519 433 385 86 134 37%
Percent of total revenue 23.3% 27.0% 26.2% (3.7pts) (2.9pts) SCD $471 22%
13
Note:
1. GM, EBIT, EPS, Interest Expense, Free Cash Flow(FCF), Leverage , Adj. EBITDA, Interest Coverage, are all non-GAAP figures, 3-yr. CAGR reflect the period 2012 – 2015
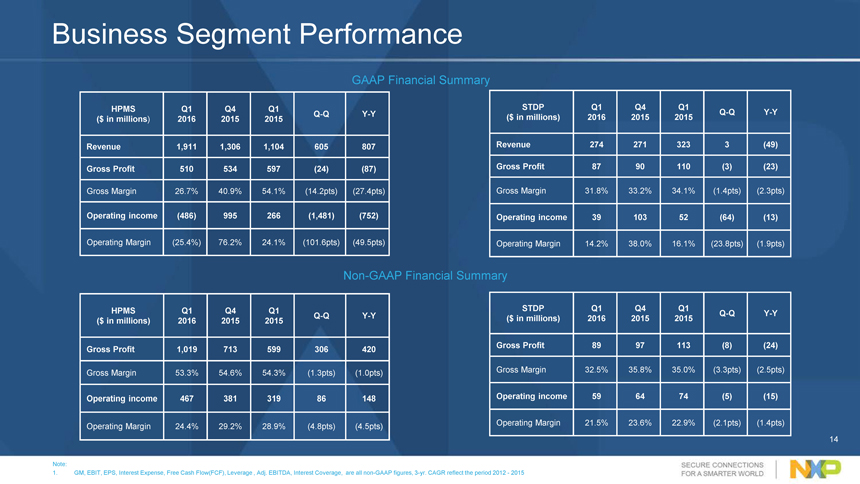
Business Segment Performance
GAAP Financial Summary
HPMS Q1 Q4 Q1 STDP Q1 Q4 Q1
Q-Q Y-Y Q-Q Y-Y ($ in millions) 2016 2015 2015 ($ in millions) 2016 2015 2015
Revenue 1,911 1,306 1,104 605 807 Revenue 274 271 323 3 (49) Gross Profit 510 534 597 (24) (87) Gross Profit 87 90 110 (3) (23)
Gross Margin 26.7% 40.9% 54.1% (14.2pts) (27.4pts) Gross Margin 31.8% 33.2% 34.1% (1.4pts) (2.3pts)
Operating income (486) 995 266 (1,481) (752) Operating income 39 103 52 (64) (13)
Operating Margin (25.4%) 76.2% 24.1% (101.6pts) (49.5pts) Operating Margin 14.2% 38.0% 16.1% (23.8pts) (1.9pts)
Non-GAAP Financial Summary
HPMS Q1 Q4 Q1 STDP Q1 Q4 Q1
Q-Q Y-Y Q-Q Y-Y ($ in millions) 2016 2015 2015 ($ in millions) 2016 2015 2015
Gross Profit 1,019 713 599 306 420 Gross Profit 89 97 113 (8) (24)
Gross Margin 53.3% 54.6% 54.3% (1.3pts) (1.0pts) Gross Margin 32.5% 35.8% 35.0% (3.3pts) (2.5pts)
Operating income 467 381 319 86 148 Operating income 59 64 74 (5) (15)
Operating Margin 24.4% 29.2% 28.9% (4.8pts) (4.5pts) Operating Margin 21.5% 23.6% 22.9% (2.1pts) (1.4pts)
14
Note:
1. GM, EBIT, EPS, Interest Expense, Free Cash Flow(FCF), Leverage , Adj. EBITDA, Interest Coverage, are all non-GAAP figures, 3-yr. CAGR reflect the period 2012 – 2015
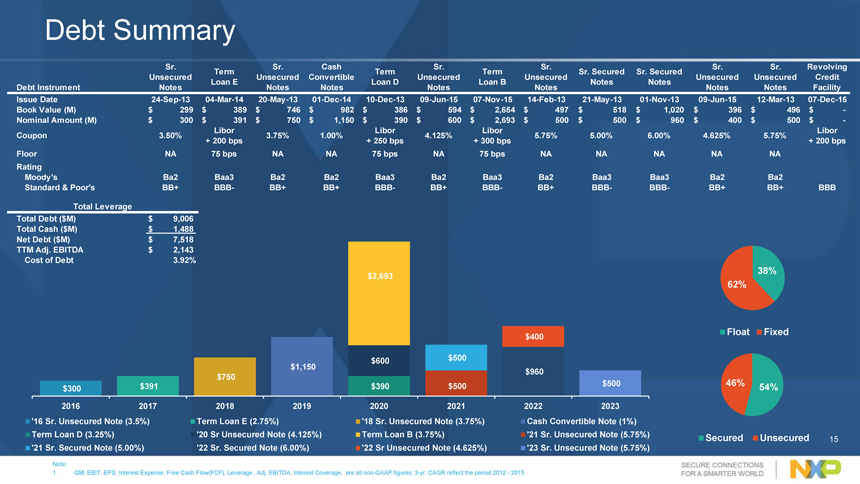
Debt Summary
Sr. Sr. Cash Sr. Sr. Sr. Sr. Revolving Term Term Term Sr. Secured Sr. Secured Unsecured Unsecured Convertible Unsecured Unsecured Unsecured Unsecured Credit Loan E Loan D Loan B Notes Notes Debt Instrument Notes Notes Notes Notes Notes Notes Notes Facility Issue Date 24-Sep-13 04-Mar-14 20-May-13 01-Dec-14 10-Dec-13 09-Jun-15 07-Nov-15 14-Feb-13 21-May-13 01-Nov-13 09-Jun-15 12-Mar-13 07-Dec-15 Book Value (M) $ 299 $ 389 $ 746 $ 982 $ 386 $ 594 $ 2,654 $ 497 $ 518 $ 1,020 $ 396 $ 496 $ -Nominal Amount (M) $ 300 $ 391 $ 750 $ 1,150 $ 390 $ 600 $ 2,693 $ 500 $ 500 $ 960 $ 400 $ 500 $ -Libor Libor Libor Libor Coupon 3.50% 3.75% 1.00% 4.125% 5.75% 5.00% 6.00% 4.625% 5.75%
+ 200 bps + 250 bps + 300 bps + 200 bps Floor NA 75 bps NA NA 75 bps NA 75 bps NA NA NA NA NA
Rating
Moody’s Ba2 Baa3 Ba2 Ba2 Baa3 Ba2 Baa3 Ba2 Baa3 Baa3 Ba2 Ba2
Standard & Poor’s BB+ BBB- BB+ BB+ BBB- BB+ BBB- BB+ BBB- BBB- BB+ BB+ BBB
Total Leverage
Total Debt ($M) $ 9,006 Total Cash ($M) $ 1,488 Net Debt ($M) $ 7,518 TTM Adj. EBITDA $ 2,143 Cost of Debt 3.92%
38% $2,693
62%
Float Fixed $400
$1,150 $600 $500 $960 $750 $391 $390 $500 $500 46% 54% $300 2016 2017 2018 2019 2020 2021 2022 2023 ‘16 Sr. Unsecured Note (3.5%) Term Loan E (2.75%) ‘18 Sr. Unsecured Note (3.75%) Cash Convertible Note (1%) Term Loan D (3.25%) ‘20 Sr Unsecured Note (4.125%) Term Loan B (3.75%) ‘21 Sr. Unsecured Note (5.75%) Secured Unsecured ‘21 Sr. Secured Note (5.00%) ‘22 Sr. Secured Note (6.00%) ‘22 Sr Unsecured Note (4.625%) ‘23 Sr. Unsecured Note (5.75%) 15
Note:
1. GM, EBIT, EPS, Interest 1 Expense, Free Cash Flow(FCF), Leverage , Adj. EBITDA, Interest Coverage, are all non-GAAP figures, 3-yr. CAGR reflect the period 2012—2015
15
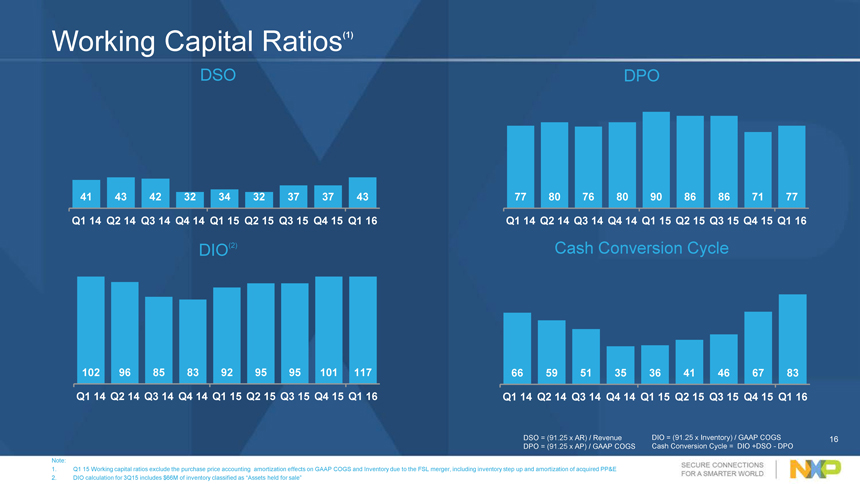
Working Capital Ratios(1)
DSO DPO
41 43 42 32 34 32 37 37 43 77 80 76 80 90 86 86 71 77 Q1 14 Q2 14 Q3 14 Q4 14 Q1 15 Q2 15 Q3 15 Q4 15 Q1 16 Q1 14 Q2 14 Q3 14 Q4 14 Q1 15 Q2 15 Q3 15 Q4 15 Q1 16
DIO(2) Cash Conversion Cycle
102 96 85 83 92 95 95 101 117 66 59 51 35 36 41 46 67 83 Q1 14 Q2 14 Q3 14 Q4 14 Q1 15 Q2 15 Q3 15 Q4 15 Q1 16 Q1 14 Q2 14 Q3 14 Q4 14 Q1 15 Q2 15 Q3 15 Q4 15 Q1 16
DSO = (91.25 x AR) / Revenue DIO = (91.25 x Inventory) / GAAP COGS 16 DPO = (91.25 x AP) / GAAP COGS Cash Conversion Cycle = DIO +DSO—DPO
Note: 16
1. Q1 15 Working capital ratios exclude the purchase price accounting amortization effects on GAAP COGS and Inventory due to the FSL merger, including inventory step up and amortization of acquired PP&E
2. DIO calculation for 3Q15 includes $66M of inventory classified as “Assets held for sale”
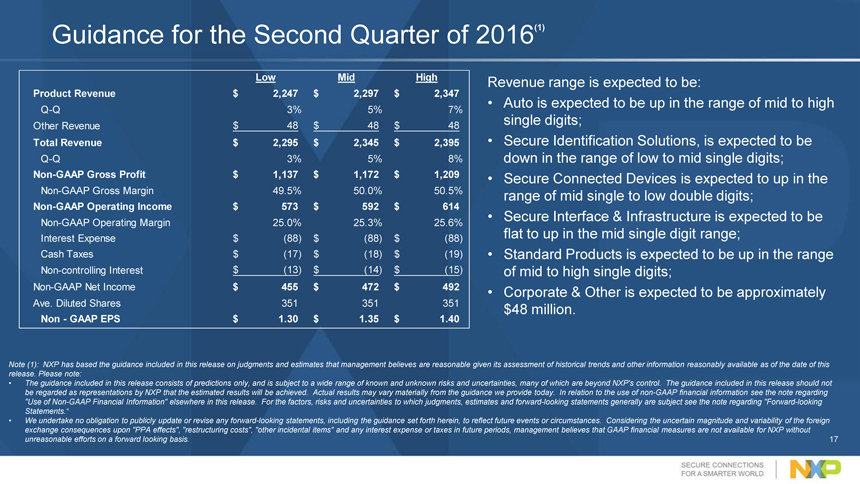
Guidance for the Second Quarter of 2016(1)
Low Mid High Revenue range is expected to be:
Product Revenue $ 2,247 $ 2,297 $ 2,347
Auto is expected to be up in the range of mid to high
Q-Q 3% 5% 7%
Other Revenue $ 48 $ 48 $ 48 single digits;
Total Revenue $ 2,295 $ 2,345 $ 2,395 Secure Identification Solutions, is expected to be
Q-Q 3% 5% 8% down in the range of low to mid single digits;
Non-GAAP Gross Profit $ 1,137 $ 1,172 $ 1,209 Secure Connected Devices is expected to up in the
Non-GAAP Gross Margin 49.5% 50.0% 50.5% range of mid single to low double digits;
Non-GAAP Operating Income $ 573 $ 592 $ 614
Non-GAAP Operating Margin 25.0% 25.3% 25.6% Secure Interface & Infrastructure is expected to be
Interest Expense $ (88) $ (88) $ (88) flat to up in the mid single digit range;
Cash Taxes $ (17) $ (18) $ (19) Standard Products is expected to be up in the range Non-controlling Interest $ (13) $ (14) $ (15) of mid to high single digits;
Non-GAAP Net Income $ 455 $ 472 $ 492 Corporate & Other is expected to be approximately
Ave. Diluted Shares 351 351 351 $48 million.
Non—GAAP EPS $ 1.30 $ 1.35 $ 1.40
Note (1): NXP has based the guidance included in this release on judgments and estimates that management believes are reasonable given its assessment of historical trends and other information reasonably available as of the date of this release. Please note:
The guidance included in this release consists of predictions only, and is subject to a wide range of known and unknown risks and uncertainties, many of which are beyond NXP’s control. The guidance included in this release should not be regarded as representations by NXP that the estimated results will be achieved. Actual results may vary materially from the guidance we provide today. In relation to the use of non-GAAP financial information see the note regarding “Use of Non-GAAP Financial Information” elsewhere in this release. For the factors, risks and uncertainties to which judgments, estimates and forward-looking statements generally are subject see the note regarding “Forward-looking Statements.”
We undertake no obligation to publicly update or revise any forward-looking statements, including the guidance set forth herein, to reflect future events or circumstances. Considering the uncertain magnitude and variability of the foreign exchange consequences upon “PPA effects”, “restructuring costs”, “other incidental items” and any interest expense or taxes in future periods, management believes that GAAP financial measures are not available for NXP without unreasonable efforts on a forward looking basis.
17
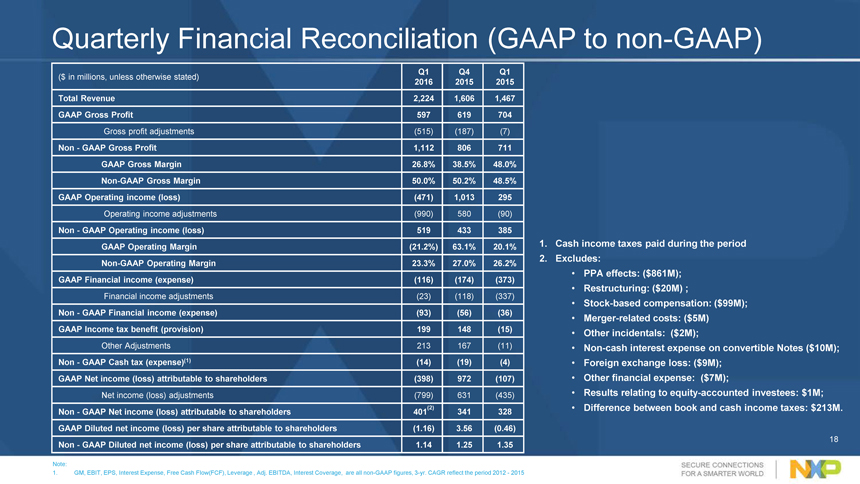
Quarterly Financial Reconciliation (GAAP to non-GAAP)
Q1 Q4 Q1
($ in millions, unless otherwise stated)
2016 2015 2015 Total Revenue 2,224 1,606 1,467 GAAP Gross Profit 597 619 704
Gross profit adjustments (515) (187) (7)
Non—GAAP Gross Profit 1,112 806 711 GAAP Gross Margin 26.8% 38.5% 48.0% Non-GAAP Gross Margin 50.0% 50.2% 48.5% GAAP Operating income (loss) (471) 1,013 295
Operating income adjustments (990) 580 (90)
Non—GAAP Operating income (loss) 519 433 385
GAAP Operating Margin (21.2%) 63.1% 20.1% 1. Cash income taxes paid during the period
2. Excludes:
Non-GAAP Operating Margin 23.3% 27.0% 26.2%
PPA effects: ($861M);
GAAP Financial income (expense) (116) (174) (373)
Restructuring: ($20M) ;
Financial income adjustments (23) (118) (337)
Stock-based compensation: ($99M);
Non—GAAP Financial income (expense) (93) (56) (36)
Merger-related costs: ($5M)
GAAP Income tax benefit (provision) 199 148 (15) Other incidentals: ($2M);
Other Adjustments 213 167 (11) Non-cash interest expense on convertible Notes ($10M);
Non—GAAP Cash tax (expense)(1) (14) (19) (4) Foreign exchange loss: ($9M); GAAP Net income (loss) attributable to shareholders (398) 972 (107) Other financial expense: ($7M);
Net income (loss) adjustments (799) 631 (435) Results relating to equity-accounted investees: $1M;
Non—GAAP Net income (loss) attributable to shareholders 401(2) 341 328 Difference between book and cash income taxes: $213M. GAAP Diluted net income (loss) per share attributable to shareholders (1.16) 3.56 (0.46)
18
Non—GAAP Diluted net income (loss) per share attributable to shareholders 1.14 1.25 1.35
Note: 18
1. GM, EBIT, EPS, Interest Expense, Free Cash Flow(FCF), Leverage , Adj. EBITDA, Interest Coverage, are all non-GAAP figures, 3-yr. CAGR reflect the period 2012 – 2015
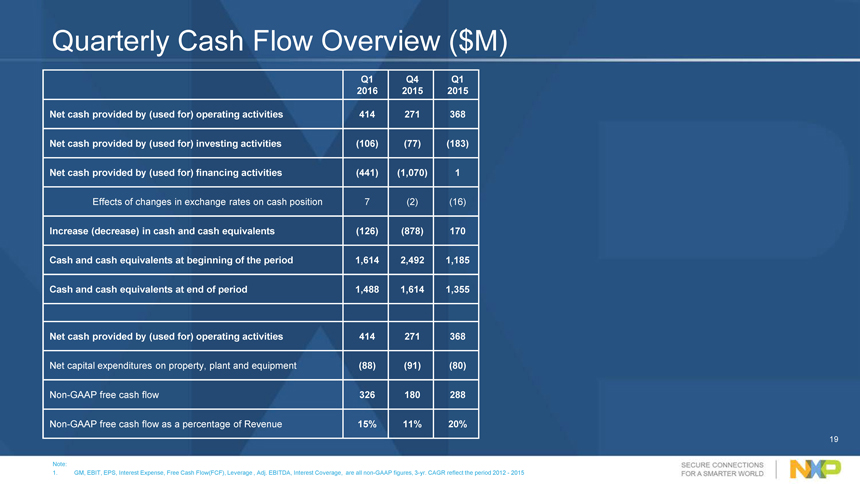
Quarterly Cash Flow Overview ($M)
Q1 Q4 Q1 2016 2015 2015
Net cash provided by (used for) operating activities 414 271 368 Net cash provided by (used for) investing activities (106) (77) (183) Net cash provided by (used for) financing activities (441) (1,070) 1
Effects of changes in exchange rates on cash position 7 (2) (16)
Increase (decrease) in cash and cash equivalents (126) (878) 170 Cash and cash equivalents at beginning of the period 1,614 2,492 1,185 Cash and cash equivalents at end of period 1,488 1,614 1,355
Net cash provided by (used for) operating activities 414 271 368
Net capital expenditures on property, plant and equipment (88) (91) (80)
Non-GAAP free cash flow 326 180 288
Non-GAAP free cash flow as a percentage of Revenue 15% 11% 20%
19
Note: 19
1. GM, EBIT, EPS, Interest Expense, Free Cash Flow(FCF), Leverage , Adj. EBITDA, Interest Coverage, are all non-GAAP figures, 3-yr. CAGR reflect the period 2012 – 2015
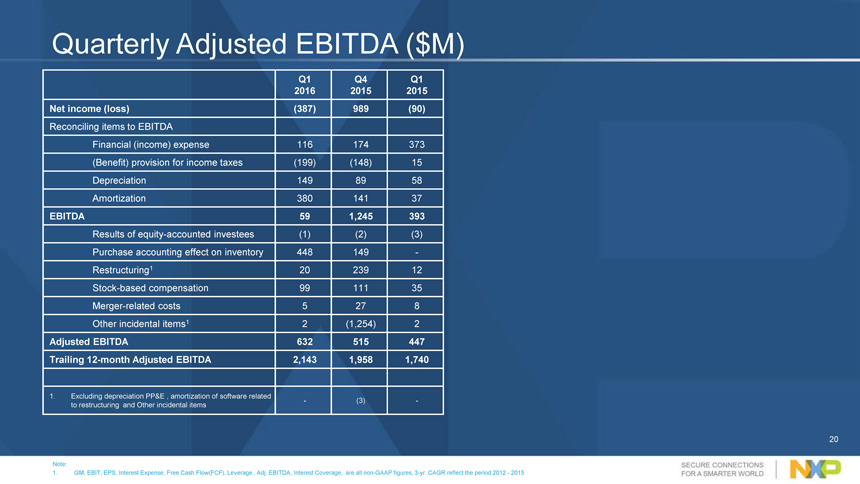
Quarterly Adjusted EBITDA ($M)
Q1 Q4 Q1 2016 2015 2015 Net income (loss) (387) 989 (90)
Reconciling items to EBITDA
Financial (income) expense 116 174 373 (Benefit) provision for income taxes (199) (148) 15 Depreciation 149 89 58 Amortization 380 141 37
EBITDA 59 1,245 393
Results of equity-accounted investees (1) (2) (3) Purchase accounting effect on inventory 448 149 -Restructuring1 20 239 12 Stock-based compensation 99 111 35 Merger-related costs 5 27 8 Other incidental items1 2 (1,254) 2
Adjusted EBITDA 632 515 447 Trailing 12-month Adjusted EBITDA 2,143 1,958 1,740
1. Excluding depreciation PP&E , amortization of software related
- (3) -to restructuring and Other incidental items
20
Note: 20
1. GM, EBIT, EPS, Interest Expense, Free Cash Flow(FCF), Leverage , Adj. EBITDA, Interest Coverage, are all non-GAAP figures, 3-yr. CAGR reflect the period 2012 – 2015
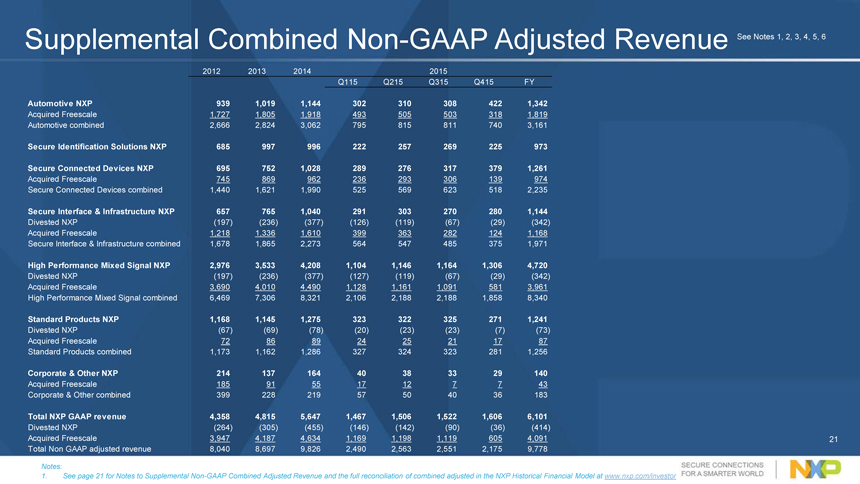
Supplemental Combined Non-GAAP Adjusted Revenue See Notes 1, 2, 3, 4, 5, 6
2012 2013 2014 2015
Q115 Q215 Q315 Q415 FY
Automotive NXP 939 1,019 1,144 302 310 308 422 1,342
Acquired Freescale 1,727 1,805 1,918 493 505 503 318 1,819 Automotive combined 2,666 2,824 3,062 795 815 811 740 3,161
Secure Identification Solutions NXP 685 997 996 222 257 269 225 973
Secure Connected Devices NXP 695 752 1,028 289 276 317 379 1,261
Acquired Freescale 745 869 962 236 293 306 139 974 Secure Connected Devices combined 1,440 1,621 1,990 525 569 623 518 2,235
Secure Interface & Infrastructure NXP 657 765 1,040 291 303 270 280 1,144
Divested NXP (197) (236) (377) (126) (119) (67) (29) (342) Acquired Freescale 1,218 1,336 1,610 399 363 282 124 1,168 Secure Interface & Infrastructure combined 1,678 1,865 2,273 564 547 485 375 1,971
High Performance Mixed Signal NXP 2,976 3,533 4,208 1,104 1,146 1,164 1,306 4,720
Divested NXP (197) (236) (377) (127) (119) (67) (29) (342) Acquired Freescale 3,690 4,010 4,490 1,128 1,161 1,091 581 3,961 High Performance Mixed Signal combined 6,469 7,306 8,321 2,106 2,188 2,188 1,858 8,340
Standard Products NXP 1,168 1,145 1,275 323 322 325 271 1,241
Divested NXP (67) (69) (78) (20) (23) (23) (7) (73) Acquired Freescale 72 86 89 24 25 21 17 87 Standard Products combined 1,173 1,162 1,286 327 324 323 281 1,256
Corporate & Other NXP 214 137 164 40 38 33 29 140
Acquired Freescale 185 91 55 17 12 7 7 43 Corporate & Other combined 399 228 219 57 50 40 36 183
Total NXP GAAP revenue 4,358 4,815 5,647 1,467 1,506 1,522 1,606 6,101
Divested NXP (264) (305) (455) (146) (142) (90) (36) (414)
Acquired Freescale 3,947 4,187 4,634 1,169 1,198 1,119 605 4,091 21 Total Non GAAP adjusted revenue 8,040 8,697 9,826 2,490 2,563 2,551 2,175 9,778
Notes:
1. See page 21 for Notes to Supplemental Non-GAAP Combined Adjusted Revenue and the full reconciliation of combined adjusted in the NXP Historical Financial Model at www.nxp.com/investor
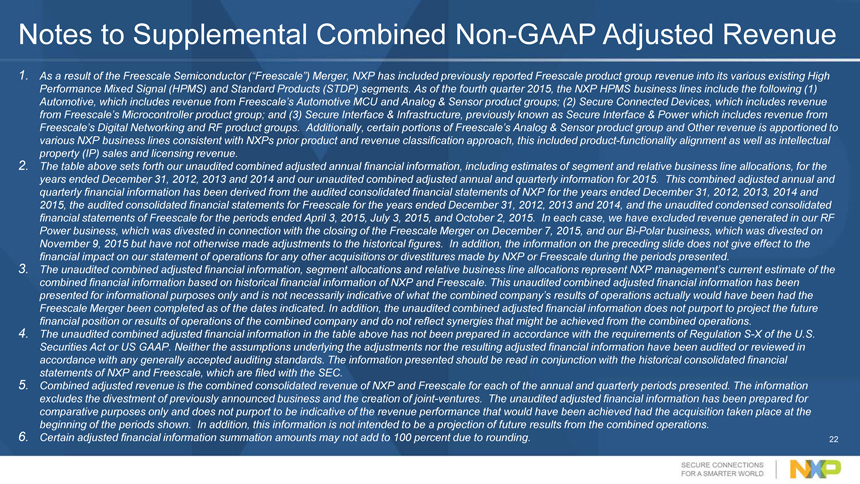
Notes to Supplemental Combined Non-GAAP Adjusted Revenue
1. As a result of the Freescale Semiconductor (“Freescale”) Merger, NXP has included previously reported Freescale product group revenue into its various existing High Performance Mixed Signal (HPMS) and Standard Products (STDP) segments. As of the fourth quarter 2015, the NXP HPMS business lines include the following (1) Automotive, which includes revenue from Freescale’s Automotive MCU and Analog & Sensor product groups; (2) Secure Connected Devices, which includes revenue from Freescale’s Microcontroller product group; and (3) Secure Interface & Infrastructure, previously known as Secure Interface & Power which includes revenue from Freescale’s Digital Networking and RF product groups. Additionally, certain portions of Freescale’s Analog & Sensor product group and Other revenue is apportioned to various NXP business lines consistent with NXPs prior product and revenue classification approach, this included product-functionality alignment as well as intellectual property (IP) sales and licensing revenue.
2. The table above sets forth our unaudited combined adjusted annual financial information, including estimates of segment and relative business line allocations, for the years ended December 31, 2012, 2013 and 2014 and our unaudited combined adjusted annual and quarterly information for 2015. This combined adjusted annual and quarterly financial information has been derived from the audited consolidated financial statements of NXP for the years ended December 31, 2012, 2013, 2014 and 2015, the audited consolidated financial statements for Freescale for the years ended December 31, 2012, 2013 and 2014, and the unaudited condensed consolidated financial statements of Freescale for the periods ended April 3, 2015, July 3, 2015, and October 2, 2015. In each case, we have excluded revenue generated in our RF Power business, which was divested in connection with the closing of the Freescale Merger on December 7, 2015, and our Bi-Polar business, which was divested on November 9, 2015 but have not otherwise made adjustments to the historical figures. In addition, the information on the preceding slide does not give effect to the financial impact on our statement of operations for any other acquisitions or divestitures made by NXP or Freescale during the periods presented.
3. The unaudited combined adjusted financial information, segment allocations and relative business line allocations represent NXP management’s current estimate of the combined financial information based on historical financial information of NXP and Freescale. This unaudited combined adjusted financial information has been presented for informational purposes only and is not necessarily indicative of what the combined company’s results of operations actually would have been had the Freescale Merger been completed as of the dates indicated. In addition, the unaudited combined adjusted financial information does not purport to project the future financial position or results of operations of the combined company and do not reflect synergies that might be achieved from the combined operations.
4. The unaudited combined adjusted financial information in the table above has not been prepared in accordance with the requirements of Regulation S-X of the U.S. Securities Act or US GAAP. Neither the assumptions underlying the adjustments nor the resulting adjusted financial information have been audited or reviewed in accordance with any generally accepted auditing standards. The information presented should be read in conjunction with the historical consolidated financial statements of NXP and Freescale, which are filed with the SEC.
5. Combined adjusted revenue is the combined consolidated revenue of NXP and Freescale for each of the annual and quarterly periods presented. The information excludes the divestment of previously announced business and the creation of joint-ventures. The unaudited adjusted financial information has been prepared for comparative purposes only and does not purport to be indicative of the revenue performance that would have been achieved had the acquisition taken place at the beginning of the periods shown. In addition, this information is not intended to be a projection of future results from the combined operations.
6. Certain adjusted financial information summation amounts may not add to 100 percent due to rounding. 22
NXP: Secure Connections for the Smarter World
Drive Profitable Drive Earnings Drive Cash Drive Significant Growth Per Share Flow Value for Our Owners
23