Exhibit 99.1

Exhibit 99.1
Atlas Investor Presentation
January 2010
The SELECT Family of Staffing companies
Select Staffing/Atlas Merger Highlights
CERTAIN STATEMENTS MADE IN THIS PRESENTATION CONSTITUTE FORWARD-LOOKING STATEMENTS WITHIN THE MEANING OF SECTION 21E OF THE SECURITIES EXCHANGE ACT OF 1934. FORWARD-LOOKING STATEMENTS INCLUDE STATEMENTS PRECEDED BY, FOLLOWED BY, OR THAT INCLUDE THE WORDS “MAY,” “COULD,” “WOULD,” “SHOULD,” “BELIEVE,” “EXPECT,” “ANTICIPATE,” “PLAN,” “ESTIMATE,” “TARGET,” “PROJECT,” “POTENTIAL,” “INTEND” OR SIMILAR EXPRESSIONS. THESE STATEMENTS INCLUDE, AMONG OTHERS, STATEMENTS REGARDING ATLAS ACQUISITION HOLDINGS CORP.’S (“ATLAS”) EXPECTATIONS REGARDING THE BUSINESS COMBINATION WITH SELECT STAFFING, INC. (“SELECT STAFFING”), SELECT STAFFING’S EXPECTED BUSINESS OUTLOOK, PROJECTED FINANCIAL AND OPERATING RESULTS, BUSINESS STRATEGY AND MEANS TO IMPLEMENT THE STRATEGY, THE AMOUNT AND TIMING OF CAPITAL EXPENDITURES, THE LIKELIHOOD OF ATLAS’ SUCCESS IN BUILDING ITS BUSINESS AFTER THE MERGER, FINANCING PLANS, BUDGETS, WORKING CAPITAL NEEDS AND SOURCES OF LIQUIDITY. ATLAS AND SELECT STAFFING BELIEVE IT IS IMPORTANT TO COMMUNICATE THEIR EXPECTATIONS TO THEIR STOCKHOLDERS. HOWEVER, THERE MAY BE EVENTS IN THE FUTURE THAT THEY ARE NOT ABLE TO PREDICT ACCURATELY OR OVER WHICH THEY HAVE NO CONTROL. FORWARD-LOOKING STATEMENTS, ESTIMATES AND PROJECTIONS ARE BASED ON MANAGEMENT’S BELIEFS AND ASSUMPTIONS, ARE NOT GUARANTEES OF PERFORMANCE, AND MAY PROVE TO BE INACCURATE. FORWARD-LOOKING STATEMENTS ALSO INVOLVE RISKS AND UNCERTAINTIES THAT COULD CAUSE ACTUAL RESULTS TO DIFFER MATERIALLY FROM THOSE CONTAINED IN ANY FORWARD LOOKING STATEMENT AND WHICH MAY HAVE A MATERIAL ADVERSE EFFECT ON SELECT STAFFING’S AND ATLAS’ BUSINESS, FINANCIAL CONDITION, RESULTS OF OPERATIONS AND LIQUIDITY (INCLUDING, BUT NOT LIMITED TO, THE FACTORS DESCRIBED IN ATLAS’ FILINGS WITH THE SECURITIES AND EXCHANGE COMMISSION AND THE FACTORS THAT WILL BE INCLUDED IN THE DEFINITIVE PROXY STATEMENT THAT ATLAS WILL FILE WITH THE SECURITIES AND EXCHANGE COMMISSION REGARDING THE PROPOSED BUSINESS COMBINATION). A NUMBER OF RISK FACTORS COULD CAUSE ACTUAL RESULTS OR EVENTS TO DIFFER MATERIALLY FROM THOSE INDICATED BY FORWARD-LOOKING STATEMENTS. SHOULD A RISK FACTOR OR UNCERTAINTY MATERIALIZE, OR SHOULD ANY OF THE UNDERLYING ASSUMPTIONS PROVE INCORRECT, ACTUAL RESULTS MAY VARY IN MATERIAL RESPECTS FROM THOSE EXPRESSED OR IMPLIED BY THESE FORWARD-LOOKING STATEMENTS. YOU SHOULD NOT PLACE UNDUE RELIANCE ON THESE FORWARD-LOOKING STATEMENTS. NEITHER ATLAS NOR SELECT STAFFING UNDERTAKES ANY OBLIGATION TO UPDATE THIS PRESENTATION, WHETHER AS A RESULT OF NEW INFORMATION, FUTURE EVENTS OR OTHERWISE, EXCEPT AS MAY BE REQUIRED UNDER APPLICABLE SECURITIES LAWS.
2
Introduction to the Select/Atlas Team
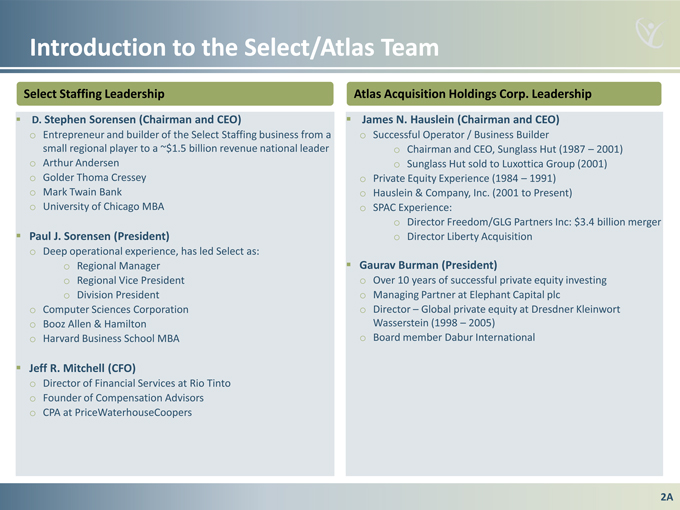
Select Staffing Leadership
D. Stephen Sorensen (Chairman and CEO)
Entrepreneur and builder of the Select Staffing business from a small regional player to a ~$1.5 billion revenue national leader
Arthur Andersen
Golder Thoma Cressey
Mark Twain Bank
University of Chicago MBA
Paul J. Sorensen (President)
o Deep operational experience, has led Select as:
o Regional Manager o Regional Vice President
o Division President
o Computer Sciences Corporation
o Booz Allen & Hamilton
o Harvard Business School MBA
Jeff R. Mitchell (CFO)
o Director of Financial Services at Rio Tinto
o Founder of Compensation Advisors
o CPA at Price Waterhouse Coopers
Atlas Acquisition Holdings Corp. Leadership
James N. Hauslein (Chairman and CEO)
o Successful Operator / Business Builder
o Chairman and CEO, Sunglass Hut (1987 –2001)
o Sunglass Hut sold to Luxottica Group (2001)
o Private Equity Experience (1984 –1991)
o Hauslein & Company, Inc. (2001 to Present)
o SPAC Experience:
o Director Freedom/GLG Partners Inc: $3.4 billion merger
o Director Liberty Acquisition
Gaurav Burman (President)
o Over 10 years of successful private equity investing
o Managing Partner at Elephant Capital plc
o Director –Global private equity at Dresdner Kleinwort Wasserstein (1998 –2005)
o Board member Dabur International
2A
Table of Contents
• Transaction Highlights
• Overview of Select Staffing Business
• Overview of Transaction
• Appendices
3
The SELECT Family of Staffing companies
Transaction Highlights
Select Staffing / Atlas Merger Highlights
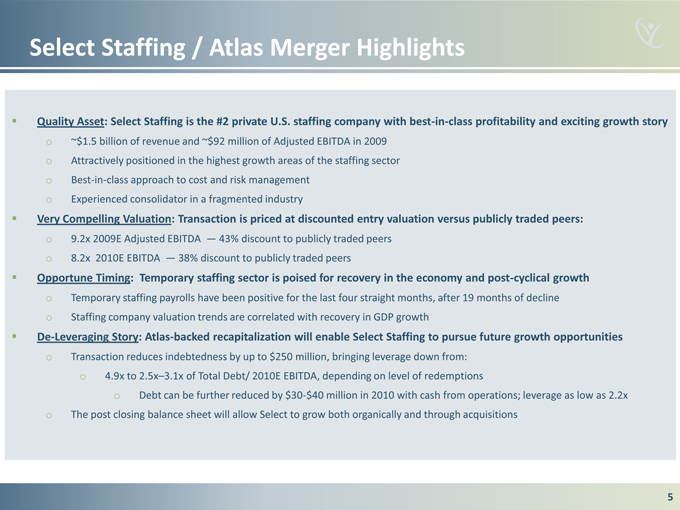
Quality Asset: Select Staffing is the #2 private U.S. staffing company with best-in-class profitability and exciting growth story
o ~$1.5 billion of revenue and ~$92 million of Adjusted EBITDA in 2009
o Attractively positioned in the highest growth areas of the staffing sector
o Best-in-class approach to cost and risk management
o Experienced consolidator in a fragmented industry
Very Compelling Valuation: Transaction is priced at discounted entry valuation versus publicly traded peers:
o 9.2x 2009E Adjusted EBITDA — 43% discount to publicly traded peers
o 8.2x 2010E EBITDA — 38% discount to publicly traded peers
Opportune Timing: Temporary staffing sector is poised for recovery in the economy and post-cyclical growth
o Temporary staffing payrolls have been positive for the last four straight months, after 19 months of decline
o Staffing company valuation trends are correlated with recovery in GDP growth
De-Leveraging Story: Atlas-backed recapitalization will enable Select Staffing to pursue future growth opportunities
o Transaction reduces indebtedness by up to $250 million, bringing leverage down from:
o 4.9x to 2.5x– 3.1x of Total Debt/ 2010E EBITDA, depending on level of redemptions
o Debt can be further reduced by $30-$40 million in 2010 with cash from operations; leverage as low as 2.2x
o The post closing balance sheet will allow Select to grow both organically and through acquisitions
5

The SELECT Family of Staffing companies
Overview of Select Staffing Business
Select Staffing Investment Thesis
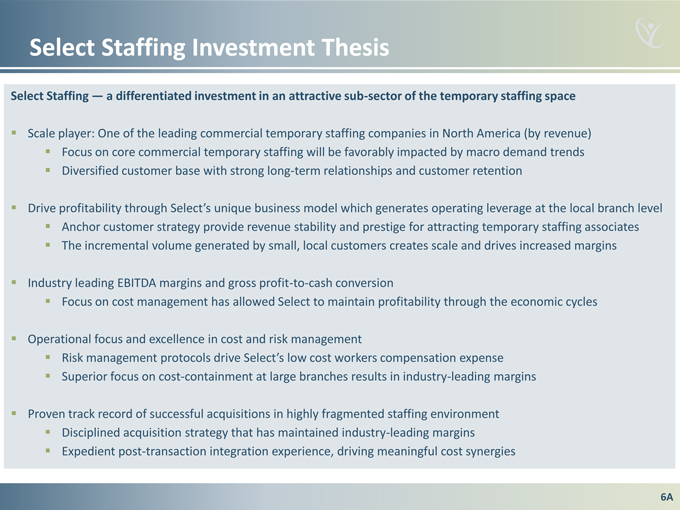
Select Staffing —a differentiated investment in an attractive sub-sector of the temporary staffing space
Scale player: One of the leading commercial temporary staffing companies in North America (by revenue)
Focus on core commercial temporary staffing will be favorably impacted by macro demand trends
Diversified customer base with strong long-term relationships and customer retention
Drive profitability through Select’s unique
Anchor customer strategy provide revenue stability and prestige for attracting temporary staffing associates
The incremental volume generated by small, local customers creates scale and drives increased margins
Industry leading EBITDA margins and gross profit-to-cash conversion
Focus on cost management has allowed Select to maintain profitability through the economic cycles
Operational focus and excellence in cost and risk management
Risk management protocols drive Select’s low
Superior focus on cost-containment at large branches results in industry-leading margins
Proven track record of successful acquisitions in highly fragmented staffing environment
Disciplined acquisition strategy that has maintained industry-leading margins
Expedient post-transaction integration experience, driving meaningful cost synergies
6A
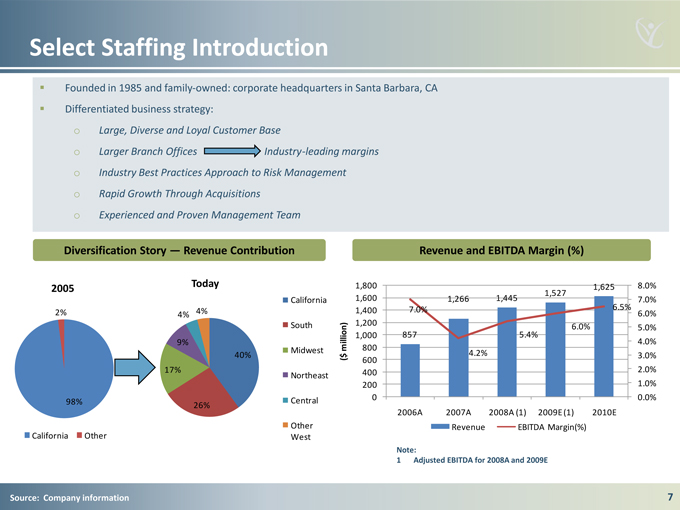
Select Staffing Introduction
Founded in 1985 and family
owned:CA
Differentiated business strategy:
o Large, Diverse and Loyal Customer Base
o Larger Branch Offices Industry-leading margins
o Industry Best Practices Approach to Risk Management
o Rapid Growth Through Acquisitions
o Experienced and Proven Management Team
Diversification Story — Revenue Contribution
Today 2005
California
2% 4% 4%
South
9% million)
40% Midwest $ (
17%
Northeast
98% Central 26%
Other California Other West
Revenue and EBITDA Margin (%)
1,800 1,625 8.0% 1,527 1,600 1,266 1,445 7.0% 1,400 7.0% 6.5% 6.0% 1,200
6.0% 5.0% 1,000 857 5.4% 4.0% 800 600 4.2% 3.0% 400 2.0% 200 1.0%
0 0.0% 2006A 2007A 2008A (1) 2009E (1) 2010E
Revenue EBITDA Margin(%)
Note:
1 Adjusted EBITDA for 2008A and 2009E
Source: Company information
7
Favorable Macro Trends
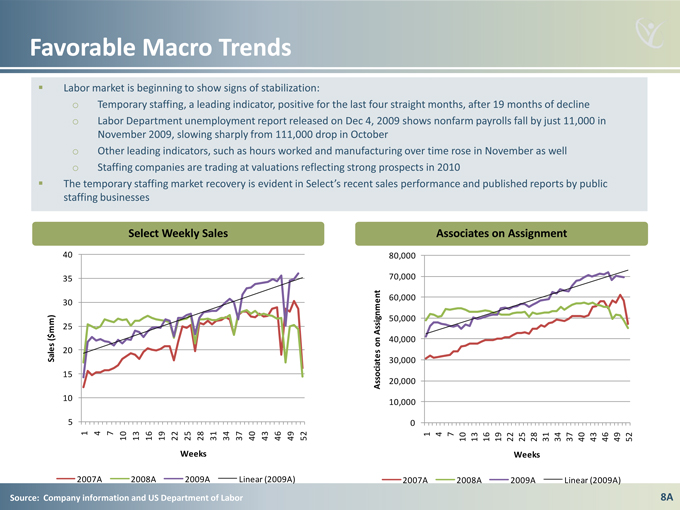
Labor market is beginning to show signs of stabilization:
o Temporary staffing, a leading indicator, positive for the last four straight months, after 19 months of decline
o Labor Department unemployment report released on Dec 4, 2009 shows nonfarm payrolls fall by just 11,000 in November 2009, slowing sharply from 111,000 drop in October
o Other leading indicators, such as hours worked and manufacturing over time rose in November as well
o Staffing companies are trading at valuations reflecting strong prospects in 2010
The temporary staffing market recovery is evident staffing businesses
Sales ($mm)
5 10 15 20 25 30 35 40 1 2007A 4 7 10 13 2008A 16 19 22 25 2009A Weeks 28 31 34 37 Linear 40 43 46 (2009A) 49 52
Associates on Assignment
2007A 0 10,000 20,000 30,000 40,000 50,000 60,000 70,000 80,000 1 4 7 10 2008A 13 16 19 22 2009A 25
Weeks 28 31 34 37 Linear 40 43 46 (2009A) 49 52
Source: Company information and US Department of Labor
8A
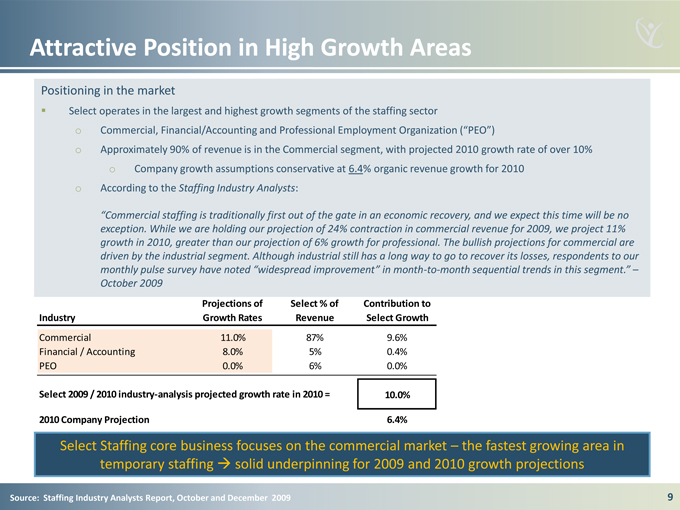
Attractive Position in High Growth Areas
Positioning in the market
Select operates in the largest and highest growth segments of the staffing sector
o Commercial, Financial/Accounting and Professional Employment
o Approximately 90% of revenue is in the Commercial segment, with projected 2010 growth rate of over 10%
o Company growth assumptions conservative at 6.4% organic revenue growth for 2010
o According to the Staffing Industry Analysts:
“Commercial staffing is traditionally first out
exception. While we are holding our projection of 24% contraction in commercial revenue for 2009, we project 11%
growth in 2010, greater than our projection of 6% growth for professional. The bullish projections for commercial are
driven by the industrial segment. Although industrial still has a long way to go to recover its losses, respondents to our
monthly pulse survey have noted “widespread-to-month sequential trends in this segment.”–
October 2009
Projections of Select % of Contribution to
Industry Growth Rates Revenue Select Growth
Commercial 11.0% 87% 9.6%
Financial / Accounting 8.0% 5% 0.4%
PEO 0.0% 6% 0.0%
Select 2009 / 2010 industry-analysis projected growth rate in 2010 = 10.0%
2010 Company Projection 6.4%
Select Staffing core business focuses on the commercial market –the fastest growing area in temporary staffing ?solid underpinning for 2009 and 2010 growth projections
Source: Staffing Industry Analysts Report, October and December 2009
9
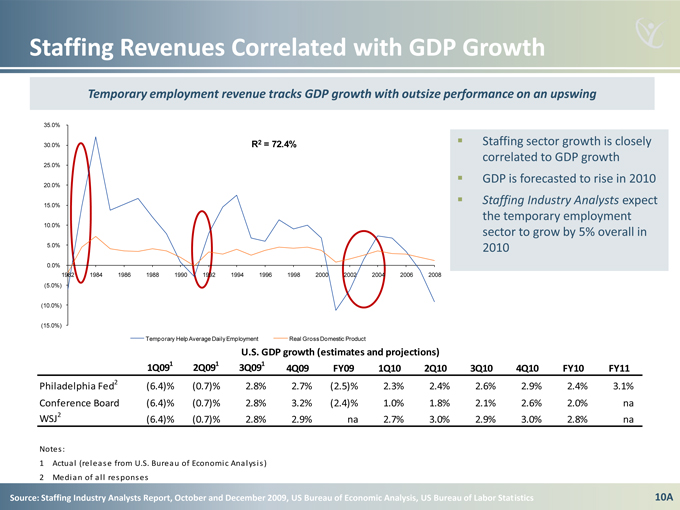
Staffing Revenues Correlated with GDP Growth
Temporary employment revenue tracks GDP growth with outsize performance on an upswing
35.0%
30.0% R2 = 72.4%
25.0% 20.0% 15.0% 10.0%
5.0%
0.0%
1982 1984 1986 1988 1990 1992 1994 1996 1998 2000 2002 2004 2006 2008 (5.0%)
(10.0%)
(15.0%)
Temporary Help Average Daily Employment Real Gross Domestic Product
• Staffing sector growth is closely correlated to GDP growth
• GDP is forecasted to rise in 2010
• Staffing Industry Analysts expect the temporary employment sector to grow by 5% overall in 2010
U.S. GDP growth (estimates and projections)
1Q091 2Q091 3Q091 4Q09 FY09 1Q10 2Q10 3Q10 4Q10 FY10 FY11
Philadelphia Fed2(6.4)%(0.7)% 2.8% 2.7%(2.5)% 2.3% 2.4% 2.6% 2.9% 2.4% 3.1%
Conference Board(6.4)%(0.7)% 2.8% 3.2%(2.4)% 1.0% 1.8% 2.1% 2.6% 2.0% na
WSJ2(6.4)%(0.7)% 2.8% 2.9% na 2.7% 3.0% 2.9% 3.0% 2.8% na
Notes:
1 Actual (release from U.S. Bureau of Economic Analysis)
2 Median of all responses
Source: Staffing Industry Analysts Report, October and December 2009, US Bureau of Economic Analysis, US Bureau of Labor Statistics
10A
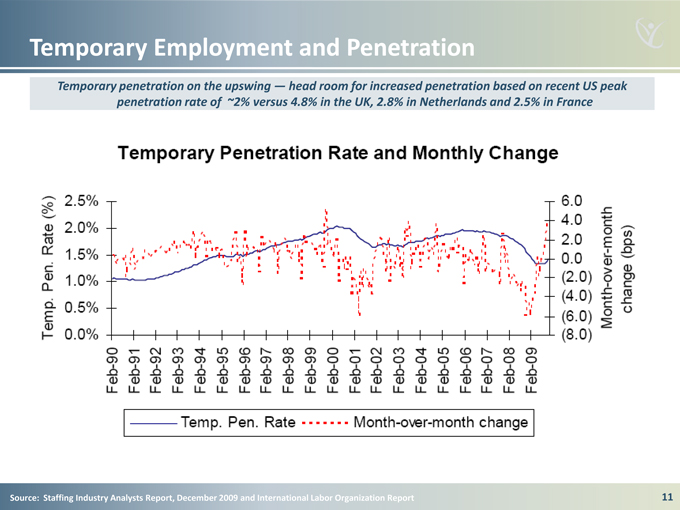
Temporary Employment and Penetration
Temporary penetration on the upswing —head room for increased penetration based on recent US peak penetration rate of ~2% versus 4.8% in the UK, 2.8% in Netherlands and 2.5% in France
Temporary Penetration Rate and Monthly change
Temp. Pen. Rate(%)
2.5%
2.0%
1.5%
1.0%
0.5%
0.0%
Month-over-month change(bps)
6.0
4.0
2.0
0.0
(2.0)
(4.0)
(6.0)
(8.0)
Feb-90
Feb-91
Feb-92
Feb-93
Feb-94
Feb-95
Feb-96
Feb-97
Feb-98
Feb-99
Feb-00
Feb-01
Feb-02
Feb-03
Feb-04
Feb-05
Feb-06
Feb-07
Feb-08
Feb-09
Temp. Pen. Rate -----— Month-over-month change
Source: Staffing Industry Analysts Report, December 2009 and International Labor Organization Report
11
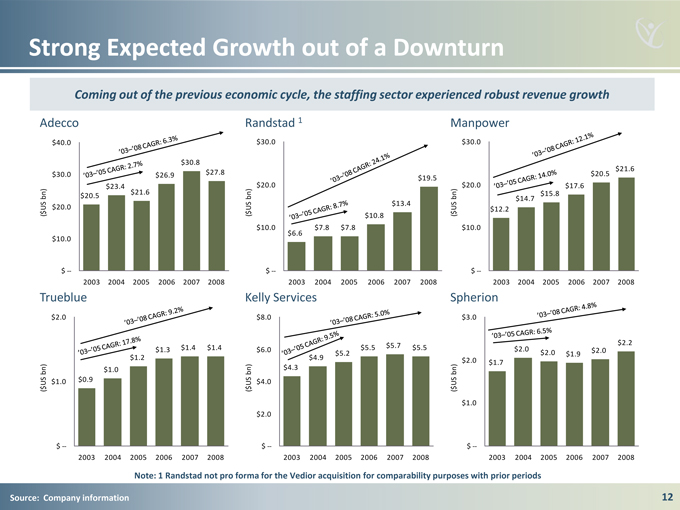
Strong Expected Growth out of a Downturn
Coming out of the previous economic cycle, the staffing sector experienced robust revenue growth
Adecco Randstad 1 Manpower
$40.0 $30.0 $30.0
$30.8 $21.6
$30.0 $26.9 $27.8 $19.5 $20.5
$23.4 $20.0 $20.0 $17.6
$21.6 $15.8 bn) $20.5 bn) bn) $14.7 $13.4 US $20.0 US US $12.2
$ ( ( $ $10.8 ( $
$10.0 $6.6 $7.8 $7.8 $10.0 $10.0
$ — $ — $ —
2003 2004 2005 2006 2007 2008 2003 2004 2005 2006 2007 2008 2003 2004 2005 2006 2007 2008
‘03-’05 CAGR: 2.7%
‘03-’05 CAGR: 14.0%
‘03-’05 CAGR: 8.7%
‘03-’08CAGR: 6.35
‘03-’08CAGR: 24.1%
‘03-’08CAGR:12.1%
Trueblue Kelly Services Spherion
$2.0 $8.0 $3.0
$5.7 $2.2
$1.3 $1.4 $1.4 $6.0 $5.5 $5.5 $2.0 $2.0
$5.2 $2.0 $1.9
$1.2 $4.9 $2.0 $1.7 bn) $1.0 bn) $4.3 bn) US $1.0 $0.9 US $4.0 US
$ ( ( $ ( $ $1.0 $2.0
$ — $ — $ —
2003 2004 2005 2006 2007 2008 2003 2004 2005 2006 2007 2008 2003 2004 2005 2006 2007 2008
‘03-’05 CAGR: 17.8%
‘03-’05 CAGR: 9.5%
‘03-’05 CAGR: 6.5%
‘03-’08 CAGR: 9.2%
‘03-’08 CAGR: 5.0%
‘03-’08 CAGR: 4.8%
Note: 1 Randstad not pro forma for the Vedior acquisition for comparability purposes with prior periods
Source: Company information
12
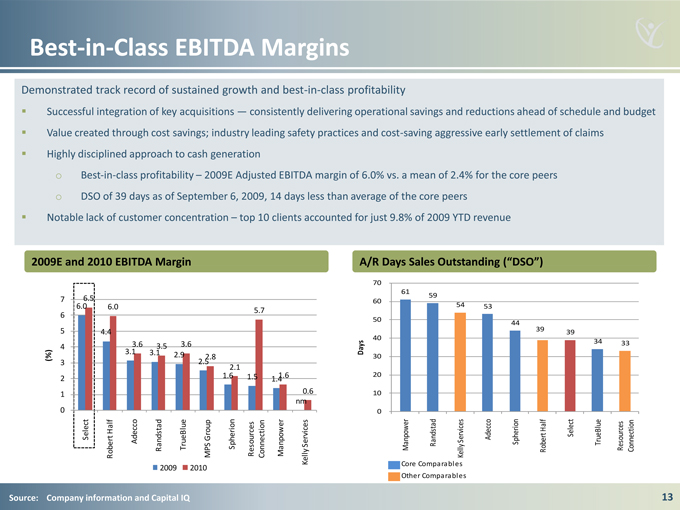
Best-in-Class EBITDA Margins
Demonstrated track record of sustained growth and best-in-class profitability
Successful integration of key acquisitions — consistently delivering operational savings and reductions ahead of schedule and budget
Value created through cost savings; industry leading safety practices and cost-saving aggressive early settlement of claims
Highly disciplined approach to cash generation
o Best-in-class –2009E Adjusted profitability EBITDA margin of 6.0% vs. a mean of 2.4% for the core peers
o DSO of 39 days as of September 6, 2009, 14 days less than average of the core peers
Notable lack of customer concentration –top 10 clients accounted for just 9.8% of 2009 YTD revenue
2009E and 2010 EBITDA Margin
7 6.5
6.0 6.0
5.7 6
5 4.4
4 3.6 3.5 3.6
3.1 3.1 2.9
(%) 2.8
3 2.5
2.1
2 1.6 1.5 1.6
1.4
1 0.6 nm 0 Half Select Group Adecco Services Robert Randstad TrueBlue MPS Spherion Resources Connection Manpower Kelly 2009 2010
A/R Days Sales
70
61
60 59
54 53 50
44 39
40 39
Days 34 33 30
20
10
0
Half Services Adecco Select Manpower Randstad Kelly Spherion Robert TrueBlue Resources Connection Core Comparables Other Comparables
Source: Company information and Capital IQ
13
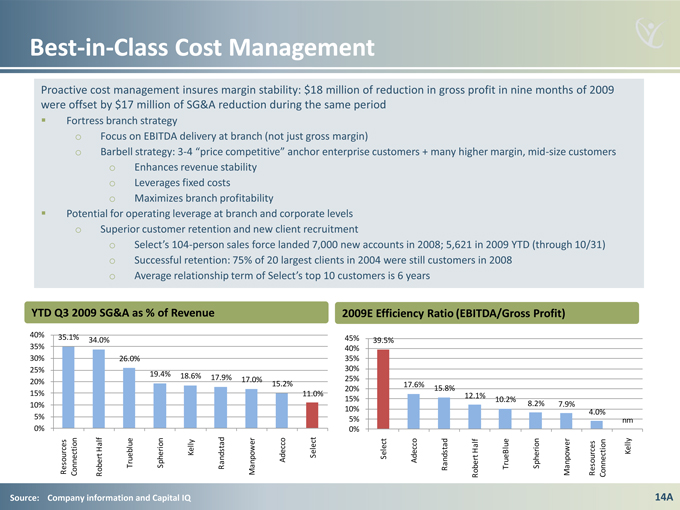
Best-in-Class Cost Management
Proactive cost management insures margin stability: $18 million of reduction in gross profit in nine months of 2009
were offset by $17 million of SG&A reduction during the same period
Fortress branch strategy
o Focus on EBITDA delivery at branch (not just gross margin)
o Barbell strategy: 3-4 “price competitive”enterprise customers anchor+ many higher margin, mid-size customers
o Enhances revenue stability
o Leverages fixed costs
o Maximizes branch profitability
Potential for operating leverage at branch and corporate levels
o Superior customer retention and new client recruitment
o Select’s-person sales104force landed 7,000 new accounts in 2008; 5,621 in 2009 YTD (through 10/31)
o Successful retention: 75% of 20 largest clients in 2004 were still customers in 2008
o Average relationship term of Select’s top 10
YTD Q3 2009 SG&A as % of Revenue
40% 35.1%
35% 34.0%
30% 26.0% 25%
19.4% 18.6%
17.9% 17.0%
20% 15.2%
15% 11.0% 10% 5% 0% Half Resources Connection Robert Trueblue Spherion Kelly Randstad Manpower Adecco Select
2009E Efficiency Ratio (EBITDA/Gross Profit)
45% 39.5% 40% 35% 30%
25% 17.6%
20% 15.8%
15% 12.1%
10.2%
8.2% 7.9%
10% 4.0% 5% nm 0% Half Kelly Select Adecco RandstadRobert TrueBlue Spherion Manpower Resources Connection
Source: Company information and Capital IQ
14A
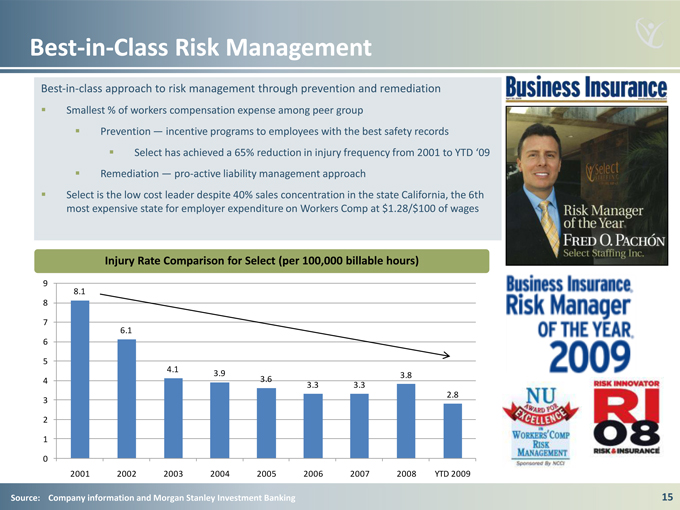
Best-in-Class Risk Management
Best - in - class management approach through prevention to and risk remediation Smallest % of workers compensation expense among peer group Prevention incentive programs to employees with the best safety records
Select has achieved a 65%
Remediation pro-active liability management approach
Select is the low cost leader despite 40% sales concentration in the state California, the 6th most expensive state for employer expenditure on Workers Comp at $1.28/$100 of wages
Injury Rate Comparison for Select (per 100,000 billable hours)
9
8.1 8
7
6.1 6
5
4.1
3.9 3.8
4 3.6
3.3 3.3
2.8 3
2
1
0
2001 2002 2003 2004 2005 2006 2007 2008 YTD 2009
Source: Company information and Morgan Stanley Investment Banking
RISK MANAGER
OF THE YEAR
FRED O PACHON
SELECT STAFFING INC
15
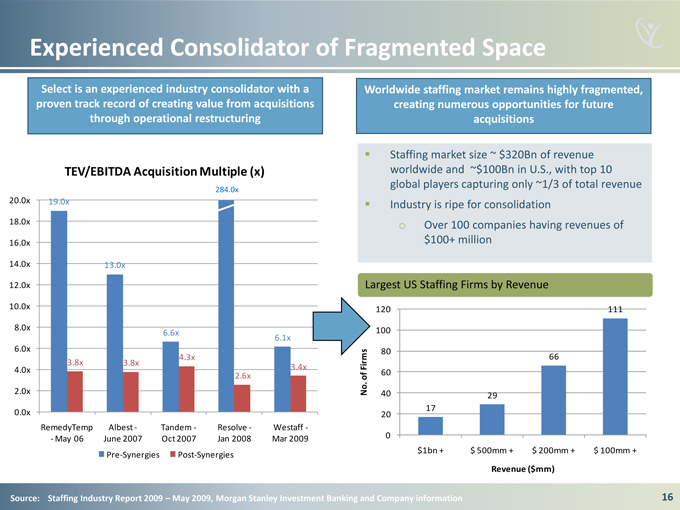
Experienced Consolidator of Fragmented Space
Select is an experienced industry consolidator with a proven track record of creating value from acquisitions through operational restructuring
TEV/EBITDA Acquisition Multiple (x)
284.0x 20.0x 19.0x
18.0x
16.0x
14.0x 13.0x
12.0x
10.0x
8.0x
6.6x
6.1x
6.0x
4.3x
3.8x 3.8x
4.0x 3.4x
2.6x
2.0x
0.0x
RemedyTemp Albest—Tandem—Resolve—Westaff — May 06 June 2007 Oct 2007 Jan 2008 Mar 2009
Pre-Synergies Post-Synergies
Worldwide staffing market remains highly fragmented, creating numerous opportunities for future acquisitions
Staffing market size ~ $320Bn of revenue worldwide and ~$100Bn in U.S., with top 10 global players capturing only ~1/3 of total revenue Industry is ripe for consolidation o Over 100 companies having revenues of $100+ million
Largest $100 million+ US Staffing US Firms Staffing by Revenue Firms
120 111
100
80
Firms 66 of 60 .
No 40 29 17 20
0
$1bn + $ 500mm + $ 200mm + $ 100mm +
Revenue ($mm)
Source: Staffing Industry Report 2009 May 2009, Morgan Stanley Investment Banking and Company information
16
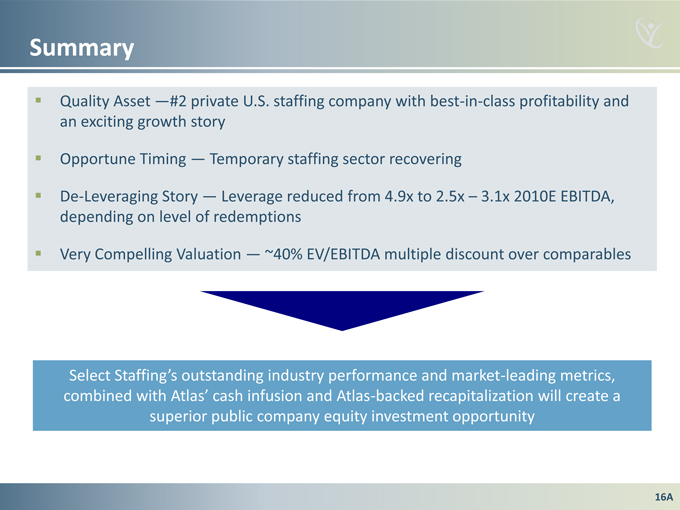
Summary
Quality Asset #2 private U.S. staffing company with best-in-class profitability and an exciting growth story
Opportune Timing Temporary staffing sector recovering
De-Leveraging Story Leverage reduced from 4.9x to 2.5x 3.1x 2010E EBITDA, depending on level of redemptions
Very Compelling Valuation ~40% EV/EBITDA multiple discount over comparables
Select Staffing’soutstanding industry performance and market-leading metrics, combined with Atlas’ -backed cash recapitalization infusion will create a superior public company equity investment opportunity
16A
THE SELECT FAMILY OF STAFFING COMPANIES
OVERVIEW OF TRANSACTION
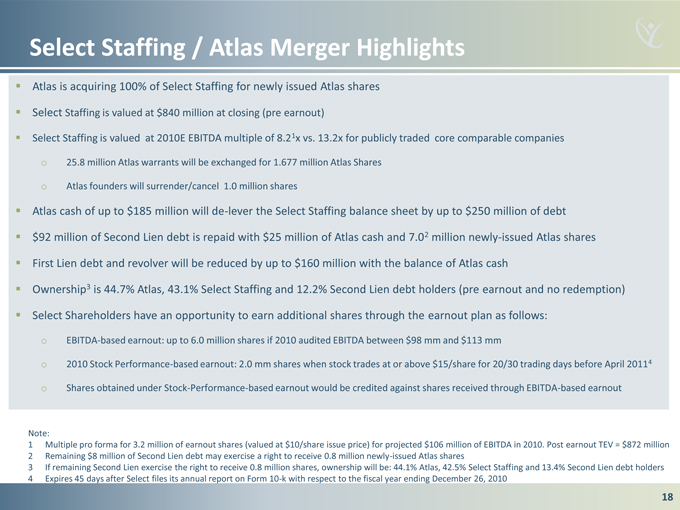
Select Staffing / Atlas Merger Highlights
Atlas is acquiring 100% of Select Staffing for newly issued Atlas shares
Select Staffing is valued at $840 million at closing (pre earnout)
Select Staffing is valued at 2010E EBITDA multiple of 8.21x vs. 13.2x for publicly traded core comparable companies o 25.8 million Atlas warrants will be exchanged for 1.677 million Atlas Shares o Atlas founders will surrender/cancel 1.0 million shares
Atlas cash of up to $185 million will de-lever the Select Staffing balance sheet by up to $250 million of debt $92 million of Second Lien debt is repaid with $25 million of Atlas cash and 7.02 million newly-issued Atlas shares First Lien debt and revolver will be reduced by up to $160 million with the balance of Atlas cash Ownership3 is 44.7% Atlas, 43.1% Select Staffing and 12.2% Second Lien debt holders (pre earnout and no redemption) Select Shareholders have an opportunity to earn additional shares through the earnout plan as follows: o EBITDA-based earnout: up to 6.0 million shares if 2010 audited EBITDA between $98 mm and $113 mm o 2010 Stock Performance-based earnout: 2.0 mm shares when stock trades at or above $15/share for 20/30 trading days before April 20114 o Shares obtained under Stock-Performance-based earnout would be credited against shares received through EBITDA-based earnout
Note:
1 Multiple pro forma for 3.2 million of earnout shares (valued at $10/share issue price) for projected $106 million of EBITDA in 2010. Post earnout TEV = $872 million
2 Remaining $8 million of Second Lien debt may exercise a right to receive 0.8 million newly-issued Atlas shares
3 If remaining Second Lien exercise the right to receive 0.8 million shares, ownership will be: 44.1% Atlas, 42.5% Select Staffing and 13.4% Second Lien debt holders
4 Expires 45 days after Select files its annual report on Form 10-k with respect to the fiscal year ending December 26, 2010
18
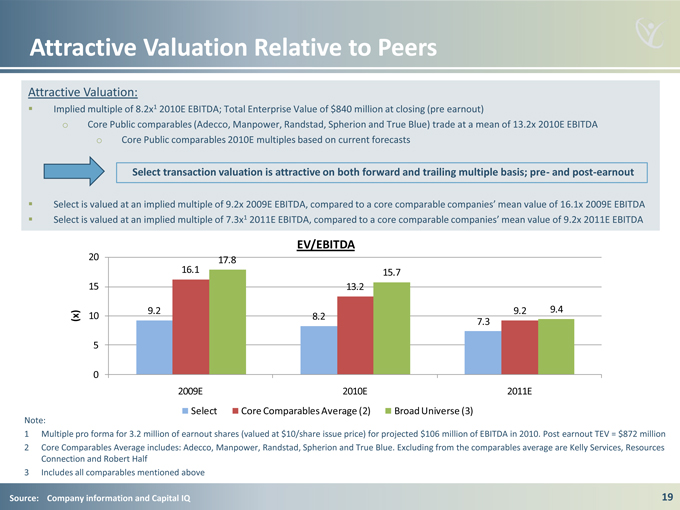
Attractive Valuation Relative to Peers
Attractive Valuation:
Implied multiple of 8.2x1 2010E EBITDA; Total Enterprise Value of $840 million at closing (pre earnout) o Core Public comparables (Adecco, Manpower, Randstad, Spherion and True Blue) trade at a mean of 13.2x 2010E EBITDA o Core Public comparables 2010E multiples based on current forecasts
Select transaction valuation is attractive on both forward and trailing multiple basis; pre- and post-earnout
Select is valued at an implied multiple of 9.2x 2009E EBITDA, compared to a core comparable companies’ 16. mean 1x 2009E value EBITDA Select is valued at an implied multiple of 7.3x1 2011E EBITDA, compared to a core comparable companies’ 9. mean 2x 2011E EBITDA value
EV/EBITDA
20 17.8
16.1 15.7
15 13.2
9.2 9.2 9.4
(x) 10 8.2
7.3 5
0
2009E 2010E 2011E
Select Core Comparables Average (2) Broad Universe (3)
Note:
1 Multiple pro forma for 3.2 million of earnout shares (valued at $10/share issue price) for projected $106 million of EBITDA in 2010. Post earnout TEV = $872 million
2 Core Comparables Average includes: Adecco, Manpower, Randstad, Spherion and True Blue. Excluding from the comparables average are Kelly Services, Resources Connection and Robert Half
3 Includes all comparables mentioned above
Source: Company information and Capital IQ
19
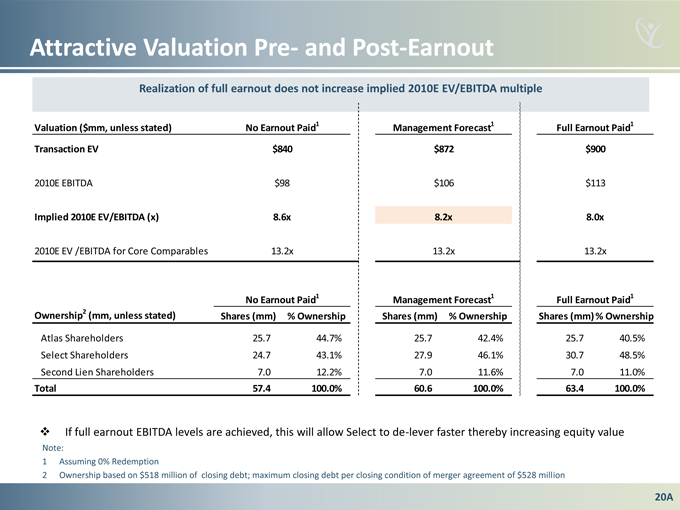
Attractive Valuation Pre- and Post-Earnout
Realization of full earnout does not increase implied 2010E EV/EBITDA multiple
Valuation ($mm, unless stated) No Earnout Paid1
Transaction EV $840
2010E EBITDA $98
Implied 2010E EV/EBITDA (x) 8.6x
2010E EV /EBITDA for Core Comparables 13.2x
No Earnout Paid1
Ownership2 (mm, unless stated) Shares (mm)% Ownership
Atlas Shareholders 25.7 44.7%
Select Shareholders 24.7 43.1%
Second Lien Shareholders 7.0 12.2%
Total 57.4 100.0%
Management Forecast1 Full Earnout Paid1
$872 $900
$106 $113
8.2x 8.0x
13.2x 13.2x
Management Forecast1 Full Earnout Paid1
Shares (mm)% Ownership Shares (mm)% Ownership
25.7 42.4% 25.7 40.5%
27.9 46.1% 30.7 48.5%
7.0 11.6% 7.0 11.0%
60.6 100.0% 63.4 100.0%
If full earnout EBITDA levels are achieved, this will allow Select to de-lever faster thereby increasing equity value
Note:
1 Assuming 0% Redemption
2 Ownership based on $518 million of closing debt; maximum closing debt per closing condition of merger agreement of $528 million
20A
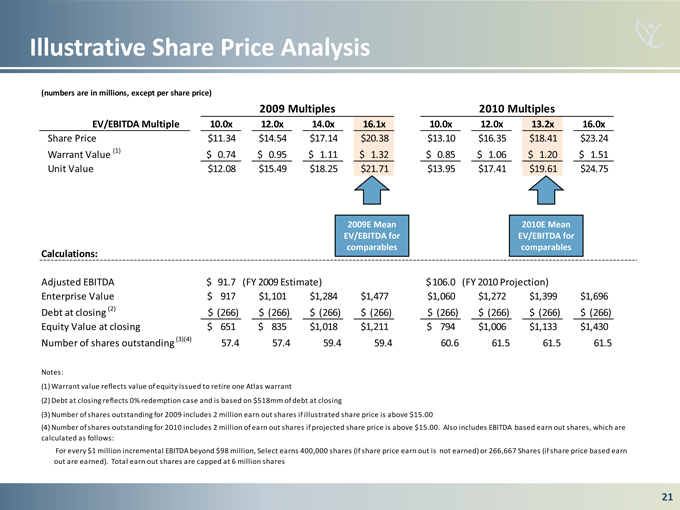
Illustrative Share Price Analysis
(numbers are in millions, except per share price)
2009 Multiples 2010 Multiples
EV/EBITDA Multiple 10.0x 12.0x 14.0x 16.1x 10.0x 12.0x 13.2x 16.0x
Share Price 11.34$ 14.54$ 17.14$ 20.38$ 13.10$ 16.35$ 18.41$ 23.24$
Warrant Value (1) $ 0.74 $ 0.95 $ 1.11 $ 1.32 $ 0.85 $ 1.06 $ 1.20 $ 1.51
Unit Value 12.08$ 15.49$ 18.25$ 21.71$ 13.95$ 17.41$ 19.61$ 24.75$
2009E Mean 2010E Mean
EV/EBITDA for EV/EBITDA for
comparables comparables
Calculations:
Adjusted EBITDA $ 91.7(FY 2009 Estimate) $ 106.0(FY 2010 Projection)
Enterprise Value $ 917 1,101$ 1,284$ 1,477$ 1,060$ 1,272$ 1,399$ 1,696$
Debt at closing (2) $ (266) $(266) $ (266) $ (266) $(266) $ (266) $ (266) $ (266)
Equity Value at closing $ 651 $ 835 1,018$ 1,211$ $ 794 1,006$ 1,133$ 1,430$
Number of shares outstanding (3)(4) 57.4 57.4 59.4 59.4 60.6 61.5 61.5 61.5
Notes:
(1) Warrant value reflects value of equity issued to retire one Atlas warrant
(2) Debt at closing reflects 0% redemption case and is based on $518mm of debt at closing
(3) Number of shares outstanding for 2009 includes 2 million earn out shares if illustrated share price is above $15.00
(4) Number of shares outstanding for 2010 includes 2 million of earn out shares if projected share price is above $15.00. Also includes EBITDA based earn out shares, which are calculated as follows: For every $1 million incremental EBITDA beyond $98 million, Select earns 400,000 shares (if share price earn out is not earned) or 266,667 Shares (if share price based earn out are earned). Total earn out shares are capped at 6 million shares
21
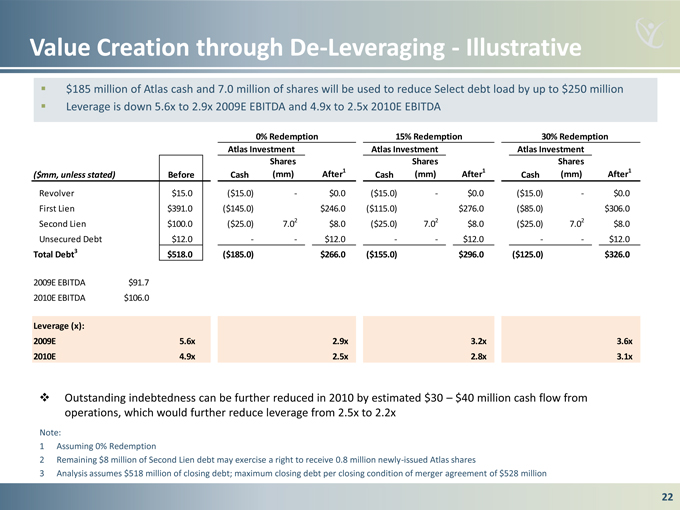
Value Creation through De-Leveraging – Illustrative
$185 million of Atlas cash and 7.0 million of shares will be used to reduce Select debt load by up to $250 million Leverage is down 5.6x to 2.9x 2009E EBITDA and 4.9x to 2.5x 2010E EBITDA
0% Redemption 15% Redemption 30% Redemption
Atlas Investment Atlas Investment Atlas Investment
Shares Shares Shares
($mm, unless stated) Before Cash(mm) After1 Cash(mm) After1 Cash(mm) After1
Revolver $15.0($15.0)—$0.0($15.0)—$0.0($15.0)—$0.0
First Lien $391.0($145.0) $246.0($115.0) $276.0($85.0) $306.0
Second Lien $100.0($25.0) 7.02 $8.0($25.0) 7.02 $8.0($25.0) 7.02 $8.0
Unsecured Debt $12.0—- $12.0—- $12.0—- $12.0
Total Debt3 $518.0($185.0) $266.0($155.0) $296.0($125.0) $326.0
2009E EBITDA $91.7
2010E EBITDA $106.0
Leverage (x):
2009E 5.6x 2.9x 3.2x 3.6x
2010E 4.9x 2.5x 2.8x 3.1x
Outstanding indebtedness can be further reduced in 2010 by estimated $30
Note:
1 Assuming 0% Redemption
2 Remaining $8 million of Second Lien debt may exercise a right to receive 0.8 million newly-issued Atlas shares
3 Analysis assumes $518 million of closing debt; maximum closing debt per closing condition of merger agreement of $528 million
22

THE SELECT FAMILY OF STAFFING COMPANIES
APPENDIX
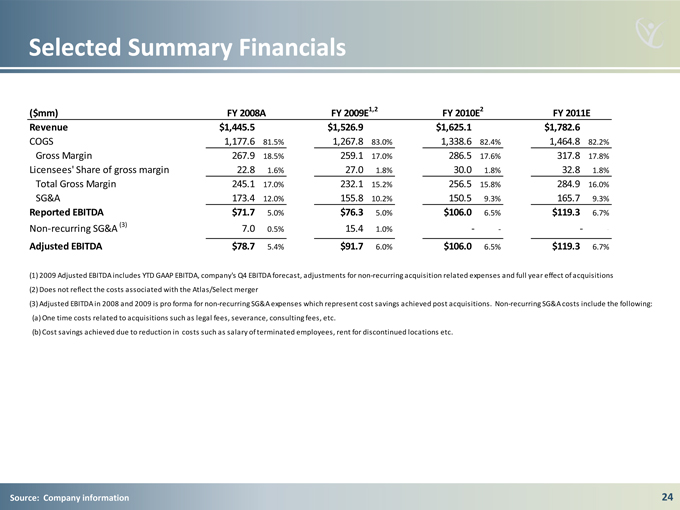
Selected Summary Financials
($mm) FY 2008A FY 2009E1,2 FY 2010E2 FY 2011E
Revenue $1,445.5 $1,526.9 $1,625.1 $1,782.6
COGS 1,177.6 81.5% 1,267.8 83.0% 1,338.6 82.4% 1,464.8 82.2%
Gross Margin 267.9 18.5% 259.1 17.0% 286.5 17.6% 317.8 17.8%
Licensees’ Share of gross margin 22.8 1.6% 27.0 1.8% 30.0 1.8% 32.8 1.8%
Total Gross Margin 245.1 17.0% 232.1 15.2% 256.5 15.8% 284.9 16.0%
SG&A 173.4 12.0% 155.8 10.2% 150.5 9.3% 165.7 9.3%
Reported EBITDA $71.7 5.0% $76.3 5.0% $106.0 6.5% $119.3 6.7%
Non-recurring SG&A (3) 7.0 0.5% 15.4 1.0%—— -
Adjusted EBITDA $78.7 5.4% $91.7 6.0% $106.0 6.5% $119.3 6.7%
(1) 2009 Adjusted EBITDA includes YTD GAAP EBITDA, company’s Q4 EBITDA forecast, adjustments for non-recurring acquisition related expenses and full year effect of acquisitions
(2) Does not reflect the costs associated with the Atlas/Select merger
(3) Adjusted EBITDA in 2008 and 2009 is pro forma for non-recurring SG&A expenses which represent cost savings achieved post acquisitions. Non-recurring SG&A costs include the following:
(a) One time costs related to acquisitions such as legal fees, severance, consulting fees, etc.
(b) Cost savings achieved due to reduction in costs such as salary of terminated employees, rent for discontinued locations etc.
Source: Company information
24
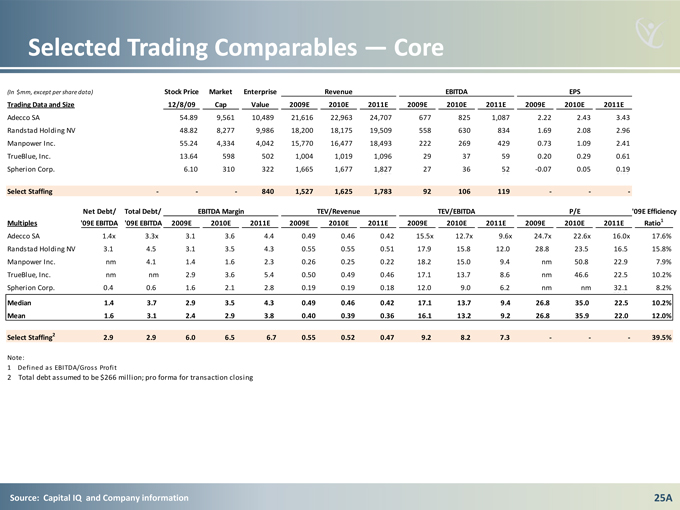
Selected Trading Comparables Core
(In $mm, except per share data) Stock Price Market Enterprise Revenue EBITDA EPS EV /
Trading Data and Size 12/8/09 Cap Value 2009E 2010E 2011E 2009E 2010E 2011E 2009E 2010E 2011E LTM EBITDA
Adecco SA 54.89 9,561 10,489 21,616 22,963 24,707 677 825 1,087 2.22 2.43 3.43 11.2x
Randstad Holding NV 48.82 8,277 9,986 18,200 18,175 19,509 558 630 834 1.69 2.08 2.96 18.9x
Manpower Inc. 55.24 4,334 4,042 15,770 16,477 18,493 222 269 429 0.73 1.09 2.41 11.2x
TrueBlue, Inc. 13.64 598 502 1,004 1,019 1,096 29 37 59 0.20 0.29 0.61 14.9x
Spherion Corp. 6.10 310 322 1,665 1,677 1,827 682 27 36 66 52 -0.07 0.05 0.69 0.19 11.4x
Select Staffing—— 840 1,527 1,625 1,783 92 106 119——
Net Debt/ Total Debt/ EBITDA Margin TEV/Revenue TEV/EBITDA P/E ‘09E Efficiency
Multiples ‘09E EBITDA ‘09E EBITDA 2009E 2010E 2011E 2009E 2010E 2011E 2009E 2010E 2011E 2009E 2010E 2011E Ratio1
Adecco SA 1.4x 3.3x 3.1 3.6 4.4 0.49 0.46 0.42 15.5x 12.7x 9.6x 24.7x 22.6x 16.0x 17.6%
Randstad Holding NV 3.1 4.5 3.1 3.5 4.3 0.55 0.55 0.51 17.9 15.8 12.0 28.8 23.5 16.5 15.8%
Manpower Inc. nm 4.1 1.4 1.6 2.3 0.26 0.25 0.22 18.2 15.0 9.4 nm 50.8 22.9 7.9%
TrueBlue, Inc. nm nm 2.9 3.6 5.4 0.50 0.49 0.46 17.1 13.7 8.6 nm 46.6 22.5 10.2%
Spherion Corp. 0.4 0.6 1.6 2.1 2.8 0.19 0.19 0.18 12.0 9.0 6.2 nm nm 29.5x 32.1 8.2%
Median 1.4 3.7 2.9 3.5 4.3 0.49 0.46 0.42 17.1 13.7 9.4 26.8 35.0 22.5 10.2%
Mean 1.6 3.1 2.4 2.9 3.8 0.40 0.39 0.36 16.1 13.2 9.2 26.8 35.9 22.0 12.0%
Select Staffing2 2.9 2.9 6.0 6.5 6.7 0.55 0.52 0.47 9.2 8.2 7.3—— 39.5%
Note:
1 Defined as EBITDA/Gross Profit
2 Total debt assumed to be $266 million; pro forma for transaction closing
Source: Capital IQ and Company information
25A
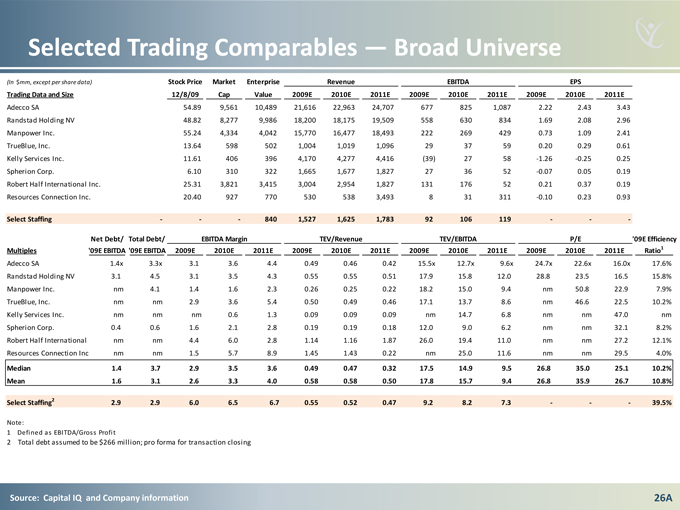
Selected Trading Comparables Broad Universe
(In $mm, except per share data) Stock Price Market Enterprise Revenue EBITDA EPS EV /
Trading Data and Size 12/8/09 Cap Value 2009E 2010E 2011E 2009E 2010E 2011E 2009E 2010E 2011E LTM EBITDA
Adecco SA 54.89 9,561 10,489 21,616 22,963 24,707 677 825 1,087 2.22 2.43 3.43 11.2x
Randstad Holding NV 48.82 8,277 9,986 18,200 18,175 19,509 558 630 834 1.69 2.08 2.96 18.9x
Manpower Inc. 55.24 4,334 4,042 15,770 16,477 18,493 222 269 429 0.73 1.09 2.41 11.2x
TrueBlue, Inc. 13.64 598 502 1,004 1,019 1,096 29 37 59 0.20 0.29 0.61 14.9x
Kelly Services Inc. 11.61 406 396 4,170 4,277 4,416(39) 27 58 -1.26 -0.25 0.25
Spherion Corp. 6.10 310 322 1,665 1,677 1,827 27 36 52 -0.07 0.05 0.19 11.4x
Robert Half International Inc. 25.31 3,821 3,415 3,004 2,954 1,827 131 176 52 0.21 0.37 0.19
Resources Connection Inc. 20.40 927 770 530 538 3,493 682 8 31 311 66 -0.10 0.23 0.69 0.93
Select Staffing—— 840 1,527 1,625 1,783 92 106 119——
Net Debt/ Total Debt/ EBITDA Margin TEV/Revenue TEV/EBITDA P/E ‘09E Efficiency
Multiples ‘09E EBITDA ‘09E EBITDA 2009E 2010E 2011E 2009E 2010E 2011E 2009E 2010E 2011E 2009E 2010E 2011E Ratio1
Adecco SA 1.4x 3.3x 3.1 3.6 4.4 0.49 0.46 0.42 15.5x 12.7x 9.6x 24.7x 22.6x 16.0x 17.6%
Randstad Holding NV 3.1 4.5 3.1 3.5 4.3 0.55 0.55 0.51 17.9 15.8 12.0 28.8 23.5 16.5 15.8%
Manpower Inc. nm 4.1 1.4 1.6 2.3 0.26 0.25 0.22 18.2 15.0 9.4 nm 50.8 22.9 7.9%
TrueBlue, Inc. nm nm 2.9 3.6 5.4 0.50 0.49 0.46 17.1 13.7 8.6 nm 46.6 22.5 10.2%
Kelly Services Inc. nm nm nm 0.6 1.3 0.09 0.09 0.09 nm 14.7 6.8 nm nm 47.0 nm
Spherion Corp. 0.4 0.6 1.6 2.1 2.8 0.19 0.19 0.18 12.0 9.0 6.2 nm nm 32.1 8.2%
Robert Half International Inc. nm nm 4.4 6.0 2.8 1.14 1.16 1.87 26.0 19.4 11.0 nm nm 27.2 12.1%
Resources Connection Inc. nm nm 1.5 5.7 8.9 1.45 1.43 0.22 nm 25.0 11.6 nm nm 29.5x 29.5 4.0%
Median 1.4 3.7 2.9 3.5 3.6 0.49 0.47 0.32 17.5 14.9 9.5 26.8 35.0 25.1 10.2%
Mean 1.6 3.1 2.6 3.3 4.0 0.58 0.58 0.50 17.8 15.7 9.4 26.8 35.9 26.7 10.8%
Select Staffing2 2.9 2.9 6.0 6.5 6.7 0.55 0.52 0.47 9.2 8.2 7.3—— 39.5%
Note:
1 Defined as EBITDA/Gross Profit
2 Total debt assumed to be $266 million; pro forma for transaction closing
Source: Capital IQ and Company information 26A
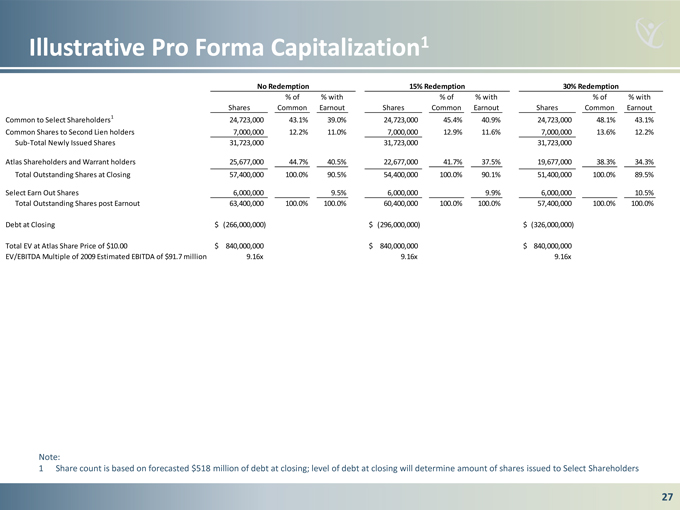
Illustrative Pro Forma Capitalization1
No Redemption 15% Redemption 30% Redemption
% of% with% of% with% of% with
Shares Common Earnout Shares Common Earnout Shares Common Earnout
Common to Select Shareholders1 24,723,000 43.1% 39.0% 24,723,000 45.4% 40.9% 24,723,000 48.1% 43.1%
Common Shares to Second Lien holders 7,000,000 12.2% 11.0% 7,000,000 12.9% 11.6% 7,000,000 13.6% 12.2%
Sub-Total Newly Issued Shares 31,723,000 31,723,000 31,723,000
Atlas Shareholders and Warrant holders 25,677,000 44.7% 40.5% 22,677,000 41.7% 37.5% 19,677,000 38.3% 34.3%
Total Outstanding Shares at Closing 57,400,000 100.0% 90.5% 54,400,000 100.0% 90.1% 51,400,000 100.0% 89.5%
Select Earn Out Shares 6,000,000 9.5% 6,000,000 9.9% 6,000,000 10.5%
Total Outstanding Shares post Earnout 63,400,000 100.0% 100.0% 60,400,000 100.0% 100.0% 57,400,000 100.0% 100.0%
Debt at Closing $ (266,000,000) $ (296,000,000) $ (326,000,000)
Total EV at Atlas Share Price of $10.00 $ 840,000,000 $ 840,000,000 $ 840,000,000
EV/EBITDA Multiple of 2009 Estimated EBITDA of $91.7 million 9.16x 9.16x 9.16x
$91,720,000.00
Note:
1 Share count is based on forecasted $518 million of debt at closing; level of debt at closing will determine amount of shares issued to Select Shareholders
27

THE SELECT FAMILY OF STAFFING COMPANIES
THANK YOU