Exhibit (c)-(6)
The information contained herein is of a confidential nature and is intended for the use of the persons or firm to whom it is furnished by Duff & Phelps, LLC.
Reproduction, publication, or dissemination of portions hereof may not be made without the prior approval of Duff & Phelps, L LC. AirMedia Group Inc. July 30, 2017
Fairness Analysis Presented to the Special Committee of Independent Directors
Exhibit (c)-(6)
Duff & Phelps’ Disclaimer
• The following pages contain materials that are being provided by Duff & Phelps, LLC (“Duff & Phelps”) to the special committee of independent directors (the “Special Committee”) of the board of directors (the “Board of Directors”) of AirMedia Group Inc. (“AirMedia” or the “Company”) in the context of a meeting of the Special Committee held to consider the Proposed Transaction (as defined herein).
• The accompanying materials are, and any Opinion (as defined herein) will be, compiled and presented on a confidential basis, solely for the use and benefit of the Special Committee in connection with their evaluation of the Proposed Transaction and may not be distributed to any other party, publicly disclosed, or relied upon for any other purpose without the prior written consent of Duff & Phelps.
• Because these materials were prepared for use in the context of an oral presentation to the Special Committee, whose members are familiar with the business and affairs of the Company, neither Duff & Phelps, nor any of their respective legal or other advisors, take any responsibility for the accuracy or completeness of any of the materials if used by persons other than the Special Committee.
• These materials are not intended to represent an Opinion but rather to serve as discussion materials for the Special Committee and as a summary of the basis upon which Duff & Phelps may render an Opinion. The Special Committee should assess Duff & Phelps’ presentation together with such Opinion.
• The accompanying material does not, and any Opinion provided by Duff & Phelps would not: (i) address the merits of the underlying business decision of the Special Committee, the Board of Directors or the Company or any other party to the Proposed Transaction to enter into the Proposed Transaction versus any alternative strategy or transaction; (ii) constitute a recommendation to the Special Committee, the Board of Directors, the Company or any other person including security holders of the Company as to how such person should vote or as to any other specific action that should be taken in connection with the Proposed Transaction, or whether to proceed with the Proposed Transaction or any related transaction; or (iii) create any fiduciary duty on Duff & Phelps’ part to any party.
• The information utilized in preparing this presentation was obtained from the Company and from public sources. Any estimates and forecasts contained herein have been prepared by or are based on discussions with the senior management of the Company and involve numerous and significant subjective determinations, which may or may not prove to be correct. No representation or warranty, expressed or implied, is made as to the accuracy or completeness of such information and nothing contained herein is, or shall be relied upon as, a representation, whether as to the past or the future of the Company’s business. Duff & Phelps did not independently verify such information used in the context of this presentation.
• No selected company or selected transaction used in our analysis is directly comparable to the Company or the Proposed Transaction.
• Duff & Phelps’ affiliate, Duff & Phelps Securities, LLC (“DPS”), has acted as financial advisor to the Special Committee providing such financial and market related advice and assistance as requested by the Special Committee in connection with the Proposed Transaction, and will receive a fee for certain investment banking services if requested by the Special Committee.
CONFIDENTIAL 2
Table of Contents
1. Introduction and Transaction Overview
2. Valuation Analysis
Appendix
1. Assumptions, Qualifications, and Limiting Conditions
2. Selected Public Companies / M&A Transactions Analysis
3. Summary of Premiums Paid – Supplemental
CONFIDENTIAL 3
Section 01 Introduction and Transaction Overview
Introduction and Transaction Overview
The Engagement
• Duff & Phelps was retained by the Special Committee and the Company to serve as independent financial advisor to the Special Committee (solely in its capacity as such).
• Specifically, Duff & Phelps has been asked to provide an opinion (the “Opinion”) to the Special Committee as to the fairness, from a financial point of view, to (i) the holders of ordinary shares, par value US$0.001 per share, of the Company (each, a “Share” and collectively, the “Shares”), other than the Excluded Shares (as defined below), and (ii) the holders of American Depositary Shares of the Company, each representing two Shares (each, an “ADS” and collectively, “ADSs”), other than ADSs representing the Excluded Shares, of the Merger Consideration (as defined below) to be received by such holders in the Proposed Transaction (as defined below) (without giving effect to any impact of the Proposed Transaction on any particular holder of the Shares or ADSs other than in their capacity as holders of Shares or ADSs).
The Proposed Transaction
• It is Duff & Phelps’ understanding that the Company, AirMedia Holdings Ltd., an exempted company with limited liability incorporated under the laws of the Cayman Islands (“Parent”), and AirMedia Merger Co. Ltd., an exempted company with limited liability incorporated under the laws of the Cayman Islands and a wholly owned subsidiary of Parent (“Merger Sub”), entered into an Agreement and Plan of Merger dated as of September 29, 2015 and as amended on June 27, 2016, December 19, 2016 and June 28, 2017 respectively (the “Merger Agreement”). Pursuant to the Merger Agreement, among other things, Merger Sub will merge with and into the Company, whereupon the separate existence of Merger Sub will cease and the Company will be the surviving company after the merger, and in connection with such merger each issued and outstanding Share (other than the Excluded Shares) will be cancelled in exchange for the right to receive US$3.00 in cash per Share without interest (the “Per Share Merger Consideration”) and each issued and outstanding
ADS (other than ADSs representing the Excluded Shares) will be cancelled in exchange for the right to receive US$6.00 in cash per ADS without interest
(the “Per ADS Merger Consideration”, and together with the Per Share Merger Consideration, the “Merger Consideration”). Notwithstanding the foregoing, the parties to the Merger Agreement have proposed to enter into an Amendment No. 4 to the Merger Agreement (the “Amendment No. 4 to the Merger Agreement”), the latest draft of which Duff & Phelps has reviewed is dated July 27, 2017, pursuant to which, among other things, the Per Share Merger Consideration will be adjusted to US$ 2.05 in cash per Share without interest and the Per ADS Merger Consideration will be adjusted to US$ 4.10 in cash per ADS without interest.
• The above is collectively referred to as the “Proposed Transaction”. The terms and conditions of the Proposed Transaction are more fully set forth in the Merger Agreement and the Amendment No. 4 to the Merger Agreement.
• For the purposes of this Opinion, “Excluded Shares” shall mean, collectively, (i) the Rollover Shares (as defined in the Merger Agreement), (ii) Shares (including ADSs corresponding to such Shares) held by Parent, Merger Sub, the Company or any of their respective Subsidiaries (as defined in the Merger Agreement), and (iii) Shares (including ADSs corresponding to such Shares) held by the Depositary (as defined in the Merger Agreement) and reserved for issuance and allocation (but not yet allocated) pursuant to the Share Incentive Plans (as defined in the Merger Agreement).
CONFIDENTIAL 5
Introduction and Transaction Overview
Scope of Analysis
Duff & Phelps has made such reviews, analyses and inquiries as it has deemed necessary and appropriate under the circumstances. Duff & Phelps also took into account its assessment of general economic, market and financial conditions, as well as its experience in securities and business valuation, in general, and with respect to similar transactions, in particular. Duff & Phelps’ procedures, investigations, and financial analysis with respect to the preparation of its analysis included, but were not limited to, the items summarized below:
1. Reviewed the following documents:
- The Company’s annual reports and audited financial statements on Form20-F filed with the Securities and Exchange Commission (“SEC”) for the years ended December 31, 2015 and the Company’s preliminary unaudited financial statements for the year ended December 31, 2016 and the three months ended March 31, 2016 and March 31, 2017 provided to Duff & Phelps by the management of the Company;
- A detailed financial projection model for the years ending December 31, 2017 through 2024, prepared and provided to Duff & Phelps by the management of the Company, upon which Duff & Phelps has relied, with your consent, in performing its analysis (the “Management Projections”);
- Other internal documents relating to the history, past and current operations, financial conditions, and probable future outlook of the Company, provided to Duff & Phelps by the management of the Company;
- A letter dated July 12, 2017 from the management of the Company, which made certain representations as to the Management Projections and the underlying assumptions for the Company (the “Management Representation Letter”); and
- Documents related to the Proposed Transaction, including the Merger Agreement and a draft of the Amendment No. 4 to the Merger Agreement dated July 27, 2017;
2. Discussed the information referred to above and the background and other elements of the Proposed Transaction with the management of the Company;
3. Discussed with the Company’s management its plans and intentions with respect to the management and operation of the business;
4. Reviewed the historical trading price and trading volume of the ADSs and the publicly traded securities of certain other companies that Duff & Phelps deemed relevant;
5. Performed certain valuation and comparative analyses using generally accepted valuation and analytical techniques including a discounted cash flow analysis, an analysis of selected public companies, an analysis of selected transactions, and a review of premiums paid in selected transactions; and
6. Conducted such other analyses and considered such other factors as Duff & Phelps deemed necessary or appropriate.
CONFIDENTIAL 6
Introduction and Transaction Overview
Ownership Summary
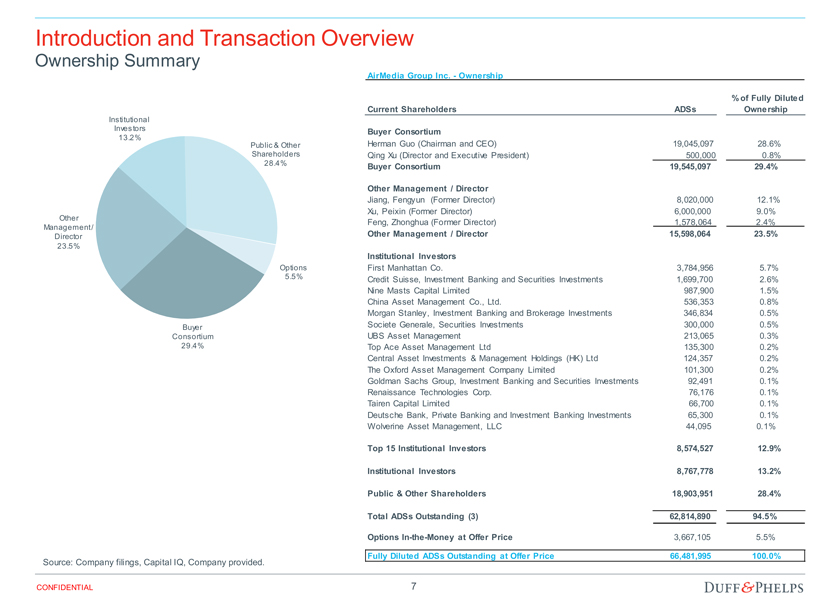
AirMedia Group Inc.—Ownership
Institutional Investors
13.2% Public & Other Shareholders 28.4%
Other Management / Director 23.5%
Options
5.5%
Buyer Consortium 29.4%
Source: Company filings, Capital IQ, Company provided.
CONFIDENTIAL
% of Fully Diluted Current Shareholders ADSs Ownership
Buyer Consortium
Herman Guo (Chairman and CEO) 19,045,097 28.6% Qing Xu (Director and Executive President) 500,000 0.8%
Buyer Consortium 19,545,097 29.4%
Other Management / Director
Jiang, Fengyun (Former Director) 8,020,000 12.1% Xu, Peixin (Former Director) 6,000,000 9.0% Feng, Zhonghua (Former Director) 1,578,064 2.4%
Other Management / Director 15,598,064 23.5%
Institutional Investors
First Manhattan Co. 3,784,956 5.7% Credit Suisse, Investment Banking and Securities Investments 1,699,700 2.6% Nine Masts Capital Limited 987,900 1.5% China Asset Management Co., Ltd. 536,353 0.8% Morgan Stanley, Investment Banking and Brokerage Investments 346,834 0.5% Societe Generale, Securities Investments 300,000 0.5% UBS Asset Management 213,065 0.3% Top Ace Asset Management Ltd 135,300 0.2% Central Asset Investments & Management Holdings (HK) Ltd 124,357 0.2% The Oxford Asset Management Company Limited 101,300 0.2% Goldman Sachs Group, Investment Banking and Securities Investments 92,491 0.1% Renaissance Technologies Corp. 76,176 0.1% Tairen Capital Limited 66,700 0.1% Deutsche Bank, Private Banking and Investment Banking Investments 65,300 0.1% Wolverine Asset Management, LLC 44,095 0.1%
Top 15 Institutional Investors 8,574,527 12.9% Institutional Investors 8,767,778 13.2% Public & Other Shareholders 18,903,951 28.4% Total ADSs Outstanding (3) 62,814,890 94.5% OptionsIn-the-Money at Offer Price 3,667,105 5.5% Fully Diluted ADSs Outstanding at Offer Price 66,481,995 100.0%
7
Introduction and Transaction Overview
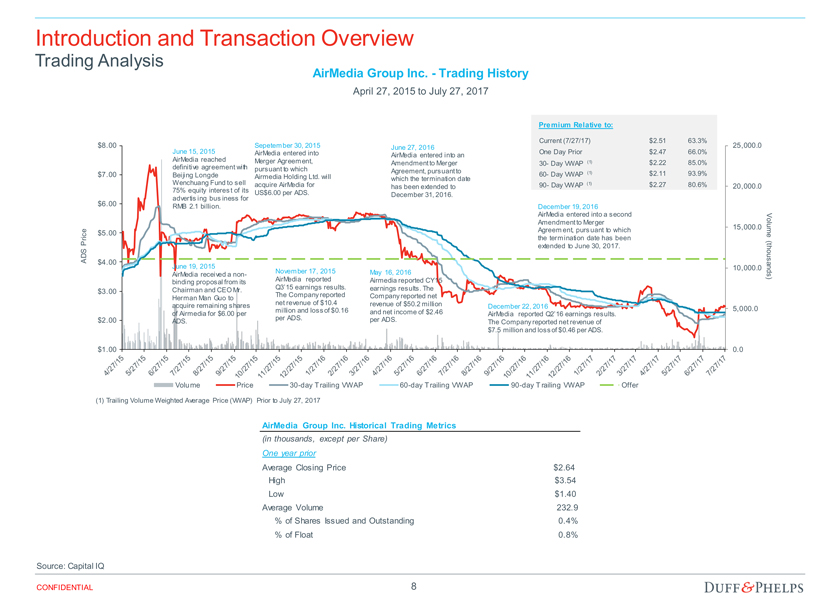
Trading Analysis AirMedia Group Inc.—Trading History
April 27, 2015 to July 27, 2017
Premium Relative to:
Current (7/27/17) $2.51 63.3% $8.00 June 15, 2015 Sepetember 30, 2015 June 27, 2016 $2.47 66.0% 25,000.0 AirMedia entered into One Day Prior AirMedia entered into an AirMedia reached Merger Agreement, (1) Amendment to Merger30- Day VWAP $2.22 85.0% definitive agreement with pursuant to which Agreement, pursuant to (1) $2.11 93.9% $7.00 Beijing Longde Airmedia Holding Ltd. will60- Day VWAP which the termination date Wenchuang Fund to sell acquire AirMedia for90- Day VWAP (1) $2.27 80.6% has been extended to 20,000.0 75% equity interest of its US$6.00 per ADS.
December 31, 2016. advertising business for $6.00 RMB 2.1 billion. December 19, 2016
AirMedia entered into a second Amendment to Merger
15,000.0 ce $5.00 Agreement, pursuant to which Volum i the termination date has been e
Pr t(
S extended to June 30, 2017. h A D $4.00
June 19, 2015 10,000.0 November 17, 2015 May 16, 2016 AirMedia received anon- ousands) AirMedia reported Airmedia reported CY15 binding proposal from its Chairman and CEO Mr. Q3’15 earnings results. earnings results. The $3.00
Herman Man Guo to The Company reported Company reported net acquire remaining shares net revenue of $10.4 revenue of $50.2 million
December 22, 2016 5,000.0 million and loss of $0.16 and net income of $2.46 of Airmedia for $6.00 per AirMedia reported Q2’16 earnings results. $2.00 per ADS. per ADS.
ADS. The Company reported net revenue of $7.5 million and loss of $0.46 per ADS.
$1.00 0.0
Volume Price30-day Trailing VWAP60-day Trailing VWAP90-day Trailing VWAP Offer
(1) Trailing Volume Weighted Average Price (VWAP) Prior to July 27, 2017
AirMedia Group Inc. Historical Trading Metrics
(in thousands, except per Share) One year prior
Average Closing Price $2.64 High $3.54 Low $1.40 Average Volume 232.9 % of Shares Issued and Outstanding 0.4% % of Float 0.8%
Source: Capital IQ
CONFIDENTIAL 8
Introduction and Transaction Overview
Proposed Transaction
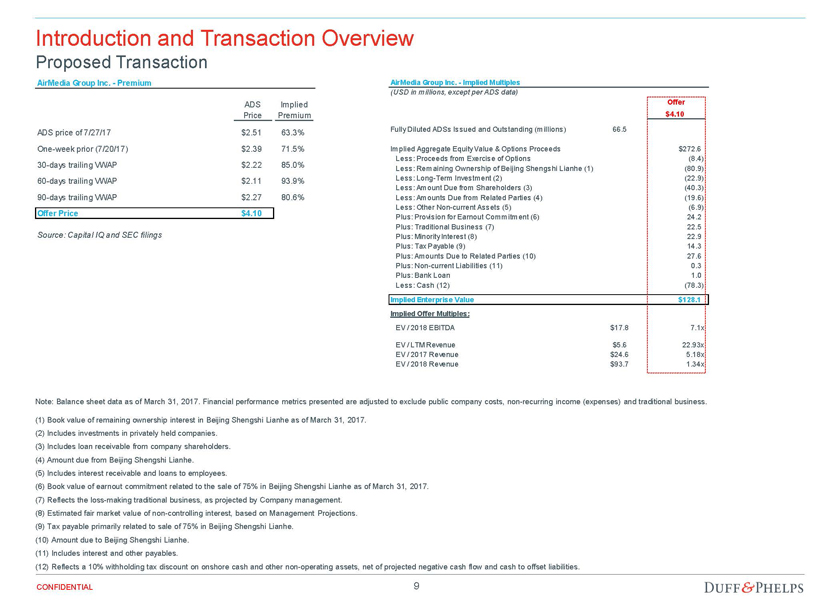
AirMedia Group Inc.—Premium
ADS Implied Price Premium
ADS price of 7/27/17 $2.51 63.3%One-week prior (7/20/17) $2.39 71.5%30-days trailing VWAP $2.22 85.0%60-days trailing VWAP $2.11 93.9%90-days trailing VWAP $2.27 80.6%
Offer Price $4.10
Source: Capital IQ and SEC filings
AirMedia Group Inc.—Implied Multiples
(USD in millions, except per ADS data)
Offer $4.10
Fully Diluted ADSs Issued and Outstanding (millions) 66.5 66.48 1.00 Implied Aggregate Equity Value & Options Proceeds $272.6 Less: Proceeds from Exercise of Options ($8.4) (8.4) Less: Remaining Ownership of Beijing Shengshi Lianhe (1) ($80.9) (80.9) Less: Long-Term Investment (2) ($22.9) (22.9) Less: Amount Due from Shareholders (3) ($40.3) (40.3) Less: Amounts Due from Related Parties (4) ($19.6) (19.6) Less: OtherNon-current Assets (5) ($6.9) (6.9) Plus: Provision for Earnout Commitment (6) $24.2 24.2 Plus: Traditional Business (7) $22.5 22.5 Plus: Minority Interest (8) $22.9 22.9 Plus: Tax Payable (9) $14.3 14.3 Plus: Amounts Due to Related Parties (10) $27.6 27.6 Plus:Non-current Liabilities (11) $0.3 0.3 Plus: Bank Loan $1.0 1.0 Less: Cash (12) ($78.3) (78.3)
Implied Enterprise Value $128.1 Implied Offer Multiples:
EV / 2018 EBITDA $17.8 7.1x
EV / LTM Revenue $5.6 22.93x EV / 2017 Revenue $24.6 5.18x EV / 2018 Revenue $93.7 1.34x
Note: Balance sheet data as of March 31, 2017. Financial performance metrics presented are adjusted to exclude public company costs,non-recurring income (expenses) and traditional business.
(1) Book value of remaining ownership interest in Beijing Shengshi Lianhe as of March 31, 2017. (2) Includes investments in privately held companies.
(3) Includes loan receivable from company shareholders. (4) Amount due from Beijing Shengshi Lianhe.
(5) Includes interest receivable and loans to employees.
(6) Book value of earnout commitment related to the sale of 75% in Beijing Shengshi Lianhe as of March 31, 2017. (7) Reflects the loss-making traditional business, as projected by Company management.
(8) Estimated fair market value ofnon-controlling interest, based on Management Projections. (9) Tax payable primarily related to sale of 75% in Beijing Shengshi Lianhe.
(10) Amount due to Beijing Shengshi Lianhe. (11) Includes interest and other payables.
(12) Reflects a 10% withholding tax discount on onshore cash and othernon-operating assets, net of projected negative cash flow and cash to offset liabilities.
CONFIDENTIAL 9
Introduction and Transaction Overview
Valuation Summary
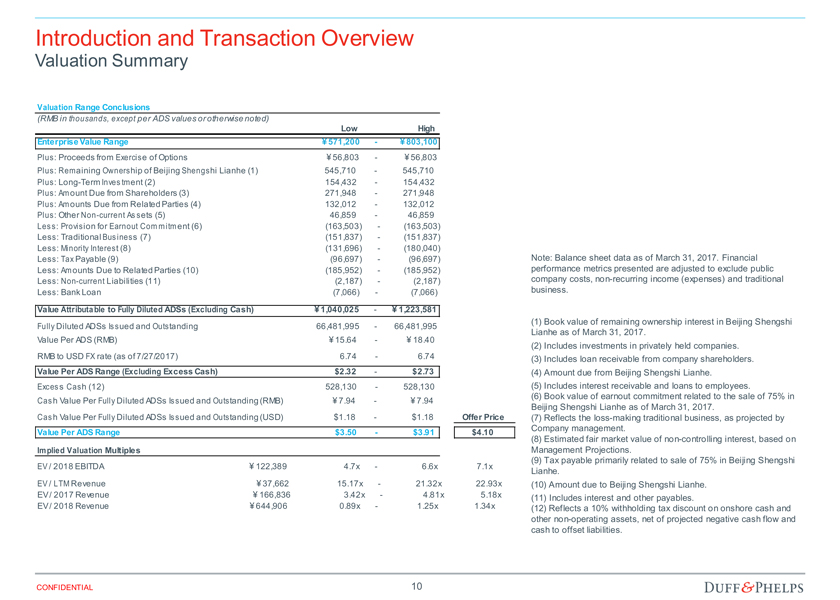
Valuation Range Conclusions
(RMB in thousands, except per ADS values or otherwise noted)
Low High Enterprise Value Range ï¿¥571,200—ï¿¥803,100
Plus: Proceeds from Exercise of Options ï¿¥56,803—ï¿¥56,803 Plus: Remaining Ownership of Beijing Shengshi Lianhe (1) 545,710—545,710 Plus: Long-Term Investment (2) 154,432—154,432 Plus: Amount Due from Shareholders (3) 271,948—271,948 Plus: Amounts Due from Related Parties (4) 132,012—132,012 Plus: OtherNon-current Assets (5) 46,859—46,859 Less: Provision for Earnout Commitment (6) (163,503)—(163,503) Less: Traditional Business (7) (151,837)—(151,837) Less: Minority Interest (8) (131,696)—(180,040) Less: Tax Payable (9) (96,697)—(96,697) Less: Amounts Due to Related Parties (10) (185,952)—(185,952) Less:Non-current Liabilities (11) (2,187)—(2,187) Less: Bank Loan (7,066)—(7,066)
Value Attributable to Fully Diluted ADSs (Excluding Cash) ï¿¥1,040,025—ï¿¥1,223,581
Fully Diluted ADSs Issued and Outstanding 66,481,995—66,481,995 Value Per ADS (RMB) ï¿¥15.64—ï¿¥18.40 RMB to USD FX rate (as of 7/27/2017) 6.74—6.74
Value Per ADS Range (Excluding Excess Cash) $2.32—$2.73
Excess Cash (12) 528,130—528,130 Cash Value Per Fully Diluted ADSs Issued and Outstanding (RMB) ï¿¥7.94—ï¿¥7.94
Cash Value Per Fully Diluted ADSs Issued and Outstanding (USD) $1.18—$1.18 Offer Price Value Per ADS Range $3.50—$3.91 $4.10
Implied Valuation Multiples
EV / 2018 EBITDA ï¿¥122,389 4.7x—6.6x 7.1x EV / LTM Revenue ï¿¥37,662 15.17x—21.32x 22.93x EV / 2017 Revenue ï¿¥166,836 3.42x—4.81x 5.18x EV / 2018 Revenue ï¿¥644,906 0.89x—1.25x 1.34x
Note: Balance sheet data as of March 31, 2017. Financial performance metrics presented are adjusted to exclude public company costs,non-recurring income (expenses) and traditional business.
(1) Book value of remaining ownership interest in Beijing Shengshi Lianhe as of March 31, 2017.
(2) Includes investments in privately held companies. (3) Includes loan receivable from company shareholders. (4) Amount due from Beijing Shengshi Lianhe.
(5) Includes interest receivable and loans to employees.
(6) Book value of earnout commitment related to the sale of 75% in Beijing Shengshi Lianhe as of March 31, 2017.
(7) Reflects the loss-making traditional business, as projected by Company management.
(8) Estimated fair market value ofnon-controlling interest, based on Management Projections.
(9) Tax payable primarily related to sale of 75% in Beijing Shengshi Lianhe.
(10) Amount due to Beijing Shengshi Lianhe. (11) Includes interest and other payables.
(12) Reflects a 10% withholding tax discount on onshore cash and othernon-operating assets, net of projected negative cash flow and cash to offset liabilities.
CONFIDENTIAL 10
Section 02 Valuation Analysis
Valuation Analysis
Financial Performance
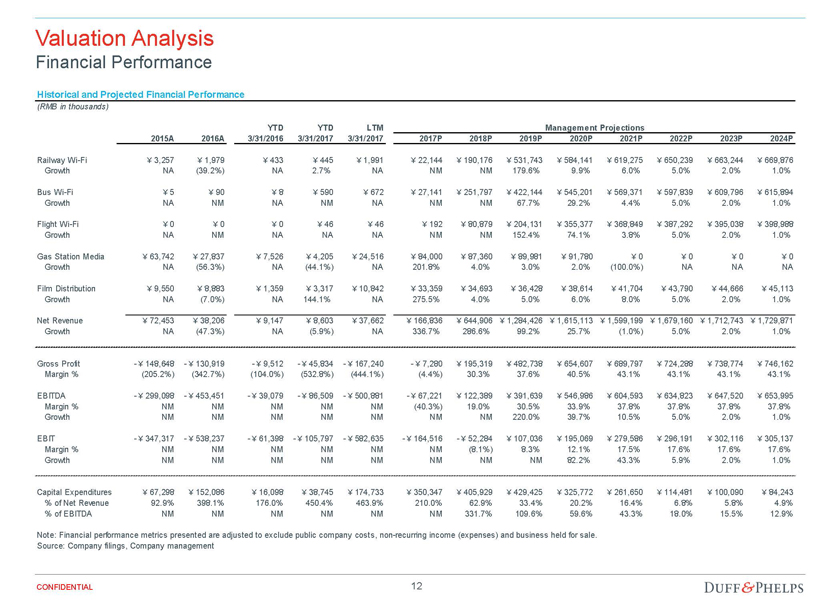
Historical and Projected Financial Performance
(RMB in thousands)
YTD YTD LTM Management Projections
2015A 2016A 3/31/2016 3/31/2017 3/31/2017 2017P 2018P 2019P 2020P 2021P 2022P 2023P 2024P
RailwayWi-Fi ï¿¥3,257 ï¿¥1,979 ï¿¥433 ï¿¥445 ï¿¥1,991 ï¿¥22,144 ï¿¥190,176 ï¿¥531,743 ï¿¥584,141 ï¿¥619,275 ï¿¥650,239 ï¿¥663,244 ï¿¥669,876 Growth NA (39.2%) NA 2.7% NA NM NM 179.6% 9.9% 6.0% 5.0% 2.0% 1.0%
BusWi-Fi ï¿¥5 ï¿¥90 ï¿¥8 ï¿¥590 ï¿¥672 ï¿¥27,141 ï¿¥251,797 ï¿¥422,144 ï¿¥545,201 ï¿¥569,371 ï¿¥597,839 ï¿¥609,796 ï¿¥615,894 Growth NA NM NA NM NA NM NM 67.7% 29.2% 4.4% 5.0% 2.0% 1.0%
FlightWi-Fi ï¿¥0 ï¿¥0 ï¿¥0 ï¿¥46 ï¿¥46 ï¿¥192 ï¿¥80,879 ï¿¥204,131 ï¿¥355,377 ï¿¥368,849 ï¿¥387,292 ï¿¥395,038 ï¿¥398,988 Growth NA NM NA NA NA NM NM 152.4% 74.1% 3.8% 5.0% 2.0% 1.0%
Gas Station Media ï¿¥63,742 ï¿¥27,837 ï¿¥7,526 ï¿¥4,205 ï¿¥24,516 ï¿¥84,000 ï¿¥87,360 ï¿¥89,981 ï¿¥91,780 ï¿¥0 ï¿¥0 ï¿¥0 ï¿¥0 Growth NA (56.3%) NA (44.1%) NA 201.8% 4.0% 3.0% 2.0% (100.0%) NA NA NA
Film Distribution ï¿¥9,550 ï¿¥8,883 ï¿¥1,359 ï¿¥3,317 ï¿¥10,842 ï¿¥33,359 ï¿¥34,693 ï¿¥36,428 ï¿¥38,614 ï¿¥41,704 ï¿¥43,790 ï¿¥44,666 ï¿¥45,113 Growth NA (7.0%) NA 144.1% NA 275.5% 4.0% 5.0% 6.0% 8.0% 5.0% 2.0% 1.0%
Net Revenue ï¿¥72,453 ï¿¥38,206 ï¿¥9,147 ï¿¥8,603 ï¿¥37,662 ï¿¥166,836 ï¿¥644,906 ï¿¥1,284,426 ï¿¥1,615,113 ï¿¥1,599,199 ï¿¥1,679,160 ï¿¥1,712,743 ï¿¥1,729,871 Growth NA (47.3%) NA (5.9%) NA 336.7% 286.6% 99.2% 25.7% (1.0%) 5.0% 2.0% 1.0%
Gross Profit -ï¿¥148,648 -ï¿¥130,919 -ï¿¥9,512 -ï¿¥45,834 -ï¿¥167,240 -ï¿¥7,280 ï¿¥195,319 ï¿¥482,738 ï¿¥654,607 ï¿¥689,797 ï¿¥724,288 ï¿¥738,774 ï¿¥746,162 Margin % (205.2%) (342.7%) (104.0%) (532.8%) (444.1%) (4.4%) 30.3% 37.6% 40.5% 43.1% 43.1% 43.1% 43.1%
EBITDA -ï¿¥299,098 -ï¿¥453,451 -ï¿¥39,079 -ï¿¥86,509 -ï¿¥500,881 -ï¿¥67,221 ï¿¥122,389 ï¿¥391,639 ï¿¥546,986 ï¿¥604,593 ï¿¥634,823 ï¿¥647,520 ï¿¥653,995 Margin % NM NM NM NM NM (40.3%) 19.0% 30.5% 33.9% 37.8% 37.8% 37.8% 37.8% Growth NM NM NM NM NM NM NM 220.0% 39.7% 10.5% 5.0% 2.0% 1.0%
EBIT -ï¿¥347,317 -ï¿¥538,237 -ï¿¥61,398 -ï¿¥105,797 -ï¿¥582,635 -ï¿¥164,516 -ï¿¥52,284 ï¿¥107,036 ï¿¥195,069 ï¿¥279,586 ï¿¥296,191 ï¿¥302,116 ï¿¥305,137 Margin % NM NM NM NM NM NM (8.1%) 8.3% 12.1% 17.5% 17.6% 17.6% 17.6% Growth NM NM NM NM NM NM NM NM 82.2% 43.3% 5.9% 2.0% 1.0%
Capital Expenditures ï¿¥67,298 ï¿¥152,086 ï¿¥16,098 ï¿¥38,745 ï¿¥174,733 ï¿¥350,347 ï¿¥405,929 ï¿¥429,425 ï¿¥325,772 ï¿¥261,650 ï¿¥114,481 ï¿¥100,090 ï¿¥84,243 % of Net Revenue 92.9% 398.1% 176.0% 450.4% 463.9% 210.0% 62.9% 33.4% 20.2% 16.4% 6.8% 5.8% 4.9% % of EBITDA NM NM NM NM NM NM 331.7% 109.6% 59.6% 43.3% 18.0% 15.5% 12.9%
Note: Financial performance metrics presented are adjusted to exclude public company costs,non-recurring income (expenses) and business held for sale. Source: Company filings, Company management
CONFIDENTIAL 12
Valuation Analysis
Discounted Cash Flow Analysis – Methodology and Key Assumptions
Discounted Cash Flow Methodology
• Duff & Phelps performed a discounted cash flow analysis of the projected unlevered free cash flows.
• Unlevered free cash flow is defined as cash generated by the business that is available to either reinvest or to distribute to security holders.
• Projected free cash flows are discounted to the present using a discount rate which reflects their relative risk.
• The discount rate is equivalent to the rate of return that security holders could expect to realize on alternative investment opportunities with similar risk profiles.
Discounted Cash Flow Key Assumptions
• Duff & Phelps utilized and relied upon the Management Projections for the fiscal years ending December 31, 2017-2024 (excluding public company expenses, as provided by the Company’s management) as well as discussions with the Company’s management, a review of the Company’s historical performance and other factors to develop the DCF analysis.
• Beyond the projection period, Duff & Phelps estimated the “terminal value” using a perpetuity formula.
• Duff & Phelps discounted the resulting free cash flows and terminal value using a weighted average cost of capital range of 16.50% to 18.50%, derived from the Capital Asset Pricing Model.
• The following is a summary of the Management Projections utilized in the discounted cash flow analysis:
- The Company’s net revenue increases at a compound annual growth rate (“CAGR”) of 39.7% over the seven-year period from 2017 to 2024.
- The Company’s EBITDA margin averages 24.3% from 2017 to 2024.
CONFIDENTIAL 13
Valuation Analysis
DCF Analysis Summary
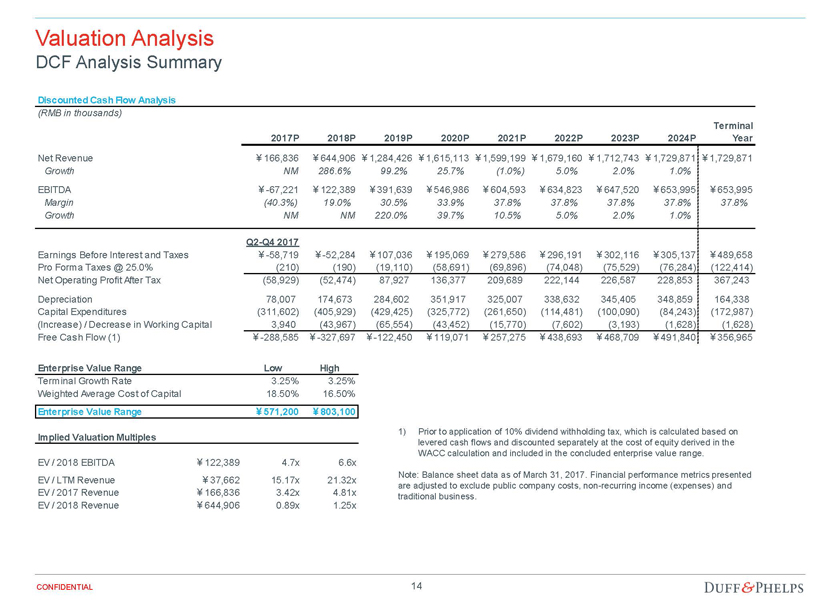
Discounted Cash Flow Analysis
(RMB in thousands)
Terminal 2017P 2018P 2019P 2020P 2021P 2022P 2023P 2024P Year
Net Revenue ï¿¥166,836 ï¿¥644,906 ï¿¥1,284,426 ï¿¥1,615,113 ï¿¥1,599,199 ï¿¥1,679,160 ï¿¥1,712,743 ï¿¥1,729,871 ï¿¥1,729,871
Growth NM 286.6% 99.2% 25.7% (1.0%) 5.0% 2.0% 1.0%
EBITDA ï¿¥-67,221 ï¿¥122,389 ï¿¥391,639 ï¿¥546,986 ï¿¥604,593 ï¿¥634,823 ï¿¥647,520 ï¿¥653,995 ï¿¥653,995
Margin (40.3%) 19.0% 30.5% 33.9% 37.8% 37.8% 37.8% 37.8% 37.8% Growth NM NM 220.0% 39.7% 10.5% 5.0% 2.0% 1.0%
Q2-Q4 2017
Earnings Before Interest and Taxes ï¿¥-58,719 ï¿¥-52,284 ï¿¥107,036 ï¿¥195,069 ï¿¥279,586 ï¿¥296,191 ï¿¥302,116 ï¿¥305,137 ï¿¥489,658
Pro Forma Taxes @ 25.0% (210) (190) (19,110) (58,691) (69,896) (74,048) (75,529) (76,284) (122,414) Net Operating Profit After Tax (58,929) (52,474) 87,927 136,377 209,689 222,144 226,587 228,853 367,243
Depreciation 78,007 174,673 284,602 351,917 325,007 338,632 345,405 348,859 164,338 Capital Expenditures (311,602) (405,929) (429,425) (325,772) (261,650) (114,481) (100,090) (84,243) (172,987) (Increase) / Decrease in Working Capital 3,940 (43,967) (65,554) (43,452) (15,770) (7,602) (3,193) (1,628) (1,628) Free Cash Flow (1) ï¿¥-288,585 ï¿¥-327,697 ï¿¥-122,450 ï¿¥119,071 ï¿¥257,275 ï¿¥438,693 ï¿¥468,709 ï¿¥491,840 ï¿¥356,965
Enterprise Value Range Low High
Terminal Growth Rate 3.25% 3.25% Weighted Average Cost of Capital 18.50% 16.50%
Enterprise Value Range ï¿¥571,200 ï¿¥803,100
Implied Valuation Multiples
EV / 2018 EBITDA ï¿¥122,389 4.7x 6.6x EV / LTM Revenue ï¿¥37,662 15.17x 21.32x EV / 2017 Revenue ï¿¥166,836 3.42x 4.81x EV / 2018 Revenue ï¿¥644,906 0.89x 1.25x
1) Prior to application of 10% dividend withholding tax, which is calculated based on levered cash flows and discounted separately at the cost of equity derived in the WACC calculation and included in the concluded enterprise value range.
Note: Balance sheet data as of March 31, 2017. Financial performance metrics presented are adjusted to exclude public company costs,non-recurring income (expenses) and traditional business.
CONFIDENTIAL 14
Appendix 01 Assumptions, Qualifications, and Limiting Conditions
Assumptions, Qualifications, and Limiting Conditions
If issued, our Opinion letter will include assumptions, qualifications and limiting conditions similar to the following. This is not meant to be a complete list of the assumptions, qualifications and limiting conditions that will be included in our Opinion letter, if rendered.
Assumptions and Reliance – In performing its analyses and rendering the Opinion with respect to the Proposed Transaction, Duff & Phelps, with the Company’s and the Special Committee’s consent and without independent verification (and Duff & Phelps does not assume any responsibility or liability for independently verifying any of the following):
• Relied upon the accuracy, completeness, and fair presentation of all information, data, advice, opinions and representations obtained from public sources or provided to it from private sources, including the Company’s management;
• Relied upon the fact that the Special Committee, the Board of Directors and the Company have been advised by counsel as to all legal matters with respect to the Proposed Transaction, including whether all procedures required by law to be taken in connection with the Proposed Transaction have been duly, validly and timely taken;
• Assumed that any estimates, evaluations, forecasts and projections including, without limitation, the Management Projections, furnished to Duff & Phelps were reasonably prepared and based upon the best currently available information and good faith judgment of the person furnishing the same, and Duff & Phelps expresses no view or opinion with respect to such estimates, evaluations, forecasts or projections or their underlying assumptions;
• Assumed that the information relating to the Company and the Proposed Transaction supplied by the Company to Duff & Phelps and the representations made by the
Company’s management regarding the Company and the Proposed Transaction in the Management Representation Letter are accurate in all material respects, did not and does not omit to state a material fact in respect of the Company and the Proposed Transaction necessary to make the information not misleading in light of the circumstances under which the information was provided;
• Assumed that the book values of the following balance sheet items provided to Duff & Phelps and included in the Company’s preliminary unaudited balance sheet dated
March 31, 2017, represent their respective current market values: (i) the RMB 163.5 million ofearn-out commitment related to the Company’s sale of its 75% equity interest in Beijing Shengshi Lianhe Advertising Co., Ltd. (“Beijing Shengshi”) in 2015 (the“Earn-out Commitment”), (ii) the RMB 545.7 million of remaining ownership interest in Beijing Shengshi (the “Remaining Beijing Shengshi Interest”), and (iii) the RMB 154.4 million in various investments and joint ventures comprising long-term investments on the Company’s balance sheet (the “Other Investments”);
• Assumed that the representations and warranties made by all parties in the Merger Agreement and in the Management Representation Letter are true and correct and that each party to the Merger Agreement will fully and duly perform all covenants, undertakings and obligations required to be performed by such party;
• Assumed that the final versions of all documents reviewed by Duff & Phelps in draft form conform in all material respects to the drafts reviewed;
• Assumed that there has been no material change in the assets, liabilities, financial condition, cash flows, results of operations, business, or prospects of the Company since the date of the most recent financial statements and other information made available to Duff & Phelps, and that there is no information or facts withheld from Duff & Phelps which would make the information reviewed by Duff & Phelps incomplete or misleading;
• Assumed that all of the conditions required to implement the Proposed Transaction will be satisfied and that the Proposed Transaction will be completed in accordance with the Merger Agreement without any amendments thereto or any waivers of any terms or conditions thereof, and in a manner that complies in all material respects with all applicable laws; and
• Assumed that all governmental, regulatory or other consents and approvals necessary for the consummation of the Proposed Transaction will be obtained without any undue delay, limitation, restriction or condition that would have a material effect on the Company or the contemplated benefits expected to be derived in the Proposed Transaction.
To the extent that any of the foregoing assumptions or any of the facts on which this Opinion is based prove to be untrue in any material respect, this Opinion cannot and should not be relied upon for any purpose. Furthermore, in Duff & Phelps’ analysis and in connection with the preparation of this Opinion, Duff & Phelps has made numerous assumptions with respect to industry performance, general business, market and economic conditions and other matters, many of which are beyond the control of any party involved in the Proposed Transaction and as to which Duff & Phelps does not express any view or opinion in this Opinion, including as to the reasonableness of such assumptions.
CONFIDENTIAL 16
Assumptions, Qualifications, and Limiting Conditions
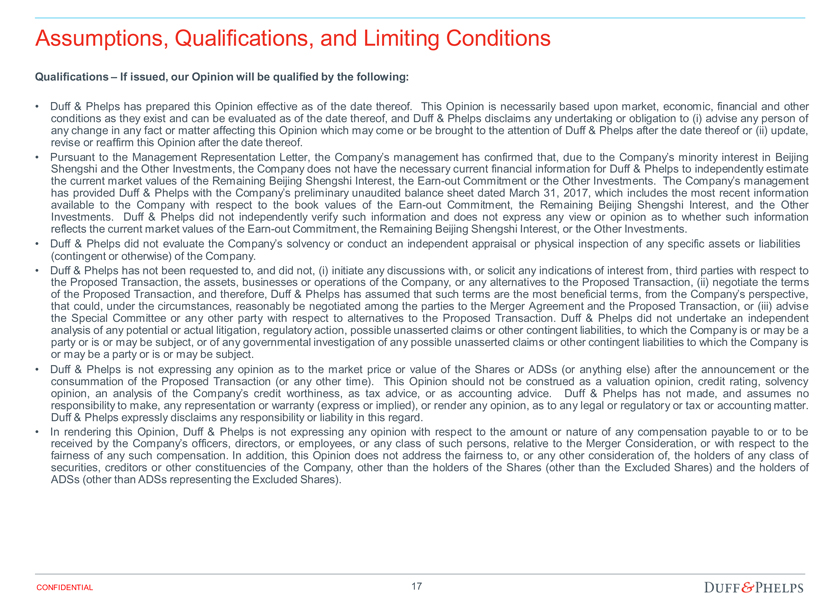
Qualifications – If issued, our Opinion will be qualified by the following:
• Duff & Phelps has prepared this Opinion effective as of the date thereof. This Opinion is necessarily based upon market, economic, financial and other conditions as they exist and can be evaluated as of the date thereof, and Duff & Phelps disclaims any undertaking or obligation to (i) advise any person of any change in any fact or matter affecting this Opinion which may come or be brought to the attention of Duff & Phelps after the date thereof or (ii) update, revise or reaffirm this Opinion after the date thereof.
• Pursuant to the Management Representation Letter, the Company’s management has confirmed that, due to the Company’s minority interest in Beijing Shengshi and the Other Investments, the Company does not have the necessary current financial information for Duff & Phelps to independently estimate the current market values of the Remaining Beijing Shengshi Interest, theEarn-out Commitment or the Other Investments. The Company’s management has provided Duff & Phelps with the Company’s preliminary unaudited balance sheet dated March 31, 2017, which includes the most recent information available to the Company with respect to the book values of theEarn-out Commitment, the Remaining Beijing Shengshi Interest, and the Other
Investments. Duff & Phelps did not independently verify such information and does not express any view or opinion as to whether such information reflects the current market values of theEarn-out Commitment, the Remaining Beijing Shengshi Interest, or the Other Investments.
• Duff & Phelps did not evaluate the Company’s solvency or conduct an independent appraisal or physical inspection of any specific assets or liabilities (contingent or otherwise) of the Company.
• Duff & Phelps has not been requested to, and did not, (i) initiate any discussions with, or solicit any indications of interest from, third parties with respect to the Proposed Transaction, the assets, businesses or operations of the Company, or any alternatives to the Proposed Transaction, (ii) negotiate the terms of the Proposed Transaction, and therefore, Duff & Phelps has assumed that such terms are the most beneficial terms, from the Company’s perspective, that could, under the circumstances, reasonably be negotiated among the parties to the Merger Agreement and the Proposed Transaction, or (iii) advise the Special Committee or any other party with respect to alternatives to the Proposed Transaction. Duff & Phelps did not undertake an independent analysis of any potential or actual litigation, regulatory action, possible unasserted claims or other contingent liabilities, to which the Company is or may be a party or is or may be subject, or of any governmental investigation of any possible unasserted claims or other contingent liabilities to which the Company is or may be a party or is or may be subject.
• Duff & Phelps is not expressing any opinion as to the market price or value of the Shares or ADSs (or anything else) after the announcement or the consummation of the Proposed Transaction (or any other time). This Opinion should not be construed as a valuation opinion, credit rating, solvency opinion, an analysis of the Company’s credit worthiness, as tax advice, or as accounting advice. Duff & Phelps has not made, and assumes no responsibility to make, any representation or warranty (express or implied), or render any opinion, as to any legal or regulatory or tax or accounting matter. Duff & Phelps expressly disclaims any responsibility or liability in this regard.
• In rendering this Opinion, Duff & Phelps is not expressing any opinion with respect to the amount or nature of any compensation payable to or to be received by the Company’s officers, directors, or employees, or any class of such persons, relative to the Merger Consideration, or with respect to the fairness of any such compensation. In addition, this Opinion does not address the fairness to, or any other consideration of, the holders of any class of securities, creditors or other constituencies of the Company, other than the holders of the Shares (other than the Excluded Shares) and the holders of ADSs (other than ADSs representing the Excluded Shares).
CONFIDENTIAL 17
Assumptions, Qualifications, and Limiting Conditions
Limiting Conditions – If issued, the use of our Opinion will be strictly limited and will state:
• This Opinion is furnished solely for the use and benefit of the Special Committee in connection with its consideration of the Proposed Transaction and is not intended to, and does not, confer any rights or remedies upon any other person, and is not intended to be used, and may not be used, by any other person or for any other purpose, without Duff & Phelps’ written consent.
• This Opinion (i) does not address the merits of the underlying business decision to enter into the Proposed Transaction versus any alternative strategy or transaction; (ii) does not address any transaction related to the Proposed Transaction; (iii) is not a recommendation as to how the Special Committee, the Board of Directors, the Company or any other person including security holders of the Company should vote or act with respect to any matters relating to the Proposed Transaction, or whether to proceed with the Proposed Transaction or any related transaction, and (iv) does not indicate that the Merger Consideration is the best possibly attainable under any circumstances; instead, it merely states whether the Merger Consideration is within a range suggested by certain financial analyses. The decision as to whether to proceed with the Proposed Transaction or any related transaction may depend on an assessment of factors unrelated to the financial analysis on which this Opinion is based.
• This Opinion should not be construed as creating any fiduciary duty on the part of Duff & Phelps to any party.
• This Opinion is solely that of Duff & Phelps, and Duff & Phelps’ liability in connection with this Opinion shall be limited in accordance with the terms set forth in the engagement letter among Duff & Phelps, DPS, the Company, and the Special Committee dated June 19, 2017 (the “Engagement Letter”).
• This Opinion is confidential and its use and disclosure is strictly limited in accordance with the terms set forth in the Engagement Letter.
CONFIDENTIAL 18
Appendix 02 Selected Public Companies / M&A Transactions Analysis
Selected Public Companies / M&A Transactions Analysis
Methodology
Selected Public Companies Analysis
• Duff & Phelps selected five publicly traded companies in theWi-Fi industry and four publicly traded companies in the China outdoor advertising industry. TheWi-Fi companies were deemed to be more comparable to the Company from a business perspective.
• Duff & Phelps analyzed the financial performance of each of the publicly traded companies. Duff & Phelps then analyzed the selected public companies’ trading multiples of enterprise value to revenue and enterprise value to EBITDA.
• Due to the limited comparability of the selected public companies’ financial metrics relative to those of the Company and negative projected EBITDA and free cash flow for the Company, as well as the significant capital spending projected for the Company over the next several years, rather than applying a range of selected multiples from a review of the public companies, Duff & Phelps reviewed various valuation multiples for the Company implied by the valuation range determined from the DCF analysis in the context of the Company’s relative size, forecasted growth in revenue and profits, profit margins, capital spending, revenue mix, and other characteristics that we deemed relevant.
Selected M&A Transactions Analysis
• Duff & Phelps also reviewed precedent transactions within the outdoor advertising and online advertising industry. Duff & Phelps computed the LTM revenue and EBITDA for each of the target companies (where publicly disclosed). Duff & Phelps then calculated the implied enterprise value to revenue and enterprise value to EBITDA multiples for each transaction.
• The Company is not directly comparable to the target companies in the Selected M&A Transactions Analysis given certain characteristics of the transactions and the target companies, including business and industry comparability and lack of recent relevant transactions. Therefore, although reviewed, Duff & Phelps did not select valuation multiples for the Company based on the Selected M&A Transactions Analysis.
None of the companies utilized for comparative purposes in the following analysis are directly comparable to the Company, and none of the transactions utilized for comparative purposes in the following analysis are directly comparable to the Proposed Transaction. Duff & Phelps does not have access tonon-public information of any of the companies used for comparative purposes. Accordingly, a complete valuation analysis of the Company and the Proposed Transaction cannot rely solely upon a quantitative review of the selected companies and selected transactions, and involves complex considerations and judgments concerning differences in financial and operating characteristics of such companies and targets, as well as other factors that could affect their value relative to that of the Company. Therefore, the Selected Public Companies / Selected M&A Transactions Analysis is subject to limitations.
CONFIDENTIAL 20
Selected Public Companies / M&A Transactions Analysis
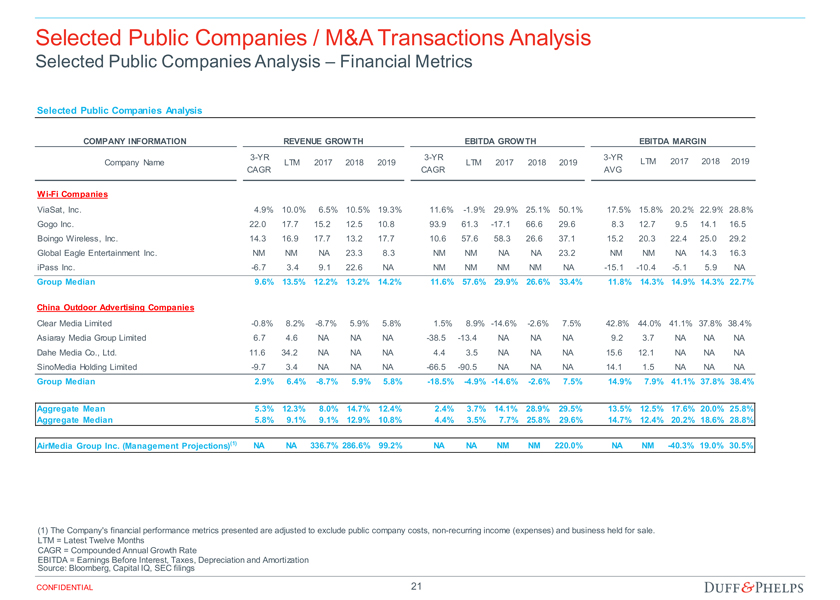
Selected Public Companies Analysis – Financial Metrics
Selected Public Companies Analysis
($ in millions, except per share data)
COMPANY INFORMATION REVENUE GROWTH EBITDA GROWTH EBITDA MARGIN
3-YR3-YR3-YR
Company Name LTM 2017 2018 2019 LTM 2017 2018 2019 LTM 2017 2018 2019 CAGR CAGR AVG
Wi-Fi Companies
ViaSat, Inc. 4.9% 10.0% 6.5% 10.5% 19.3% 11.6%-1.9% 29.9% 25.1% 50.1% 17.5% 15.8% 20.2% 22.9% 28.8% Gogo Inc. 22.0 17.7 15.2 12.5 10.8 93.9 61.3-17.1 66.6 29.6 8.3 12.7 9.5 14.1 16.5 Boingo Wireless, Inc. 14.3 16.9 17.7 13.2 17.7 10.6 57.6 58.3 26.6 37.1 15.2 20.3 22.4 25.0 29.2 Global Eagle Entertainment Inc. NM NM NA 23.3 8.3 NM NM NA NA 23.2 NM NM NA 14.3 16.3 iPass Inc.-6.7 3.4 9.1 22.6 NA NM NM NM NM NA -15.1-10.4-5.1 5.9 NA
Group Median 9.6% 13.5% 12.2% 13.2% 14.2% 11.6% 57.6% 29.9% 26.6% 33.4% 11.8% 14.3% 14.9% 14.3% 22.7%
China Outdoor Advertising Companies
Clear Media Limited-0.8% 8.2%-8.7% 5.9% 5.8% 1.5% 8.9%-14.6%-2.6% 7.5% 42.8% 44.0% 41.1% 37.8% 38.4% Asiaray Media Group Limited 6.7 4.6 NA NA NA -38.5-13.4 NA NA NA 9.2 3.7 NA NA NA Dahe Media Co., Ltd. 11.6 34.2 NA NA NA 4.4 3.5 NA NA NA 15.6 12.1 NA NA NA SinoMedia Holding Limited-9.7 3.4 NA NA NA -66.5-90.5 NA NA NA 14.1 1.5 NA NA NA
Group Median 2.9% 6.4%-8.7% 5.9% 5.8%-18.5%-4.9%-14.6%-2.6% 7.5% 14.9% 7.9% 41.1% 37.8% 38.4%
Aggregate Mean 5.3% 12.3% 8.0% 14.7% 12.4% 2.4% 3.7% 14.1% 28.9% 29.5% 13.5% 12.5% 17.6% 20.0% 25.8% Aggregate Median 5.8% 9.1% 9.1% 12.9% 10.8% 4.4% 3.5% 7.7% 25.8% 29.6% 14.7% 12.4% 20.2% 18.6% 28.8%
AirMedia Group Inc. (Management Projections)(1) NA NA 336.7% 286.6% 99.2% NA NA NM NM 220.0% NA NM -40.3% 19.0% 30.5%
(1) The Company’s financial performance metrics presented are adjusted to exclude public company costs,non-recurring income (expenses) and business held for sale.
LTM = Latest Twelve Months
CAGR = Compounded Annual Growth Rate
EBITDA = Earnings Before Interest, Taxes, Depreciation and Amortization Source: Bloomberg, Capital IQ, SEC filings
CONFIDENTIAL 21
Selected Public Companies / M&A Transactions Analysis
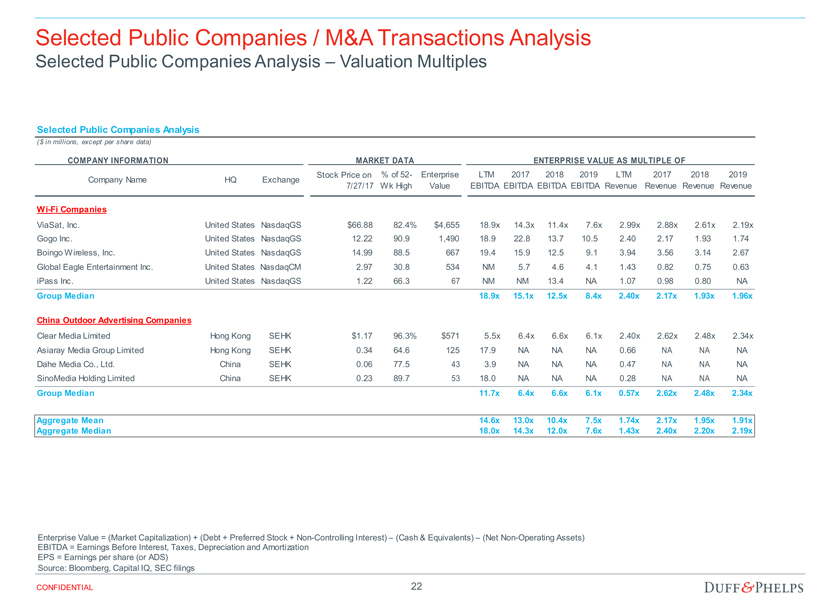
Selected Public Companies Analysis – Valuation Multiples
Selected Public Companies Analysis
($ in millions, except per share data)
COMPANY INFORMATION MARKET DATA ENTERPRISE VALUE AS MULTIPLE OF
Stock Price on % of52- Enterprise LTM 2017 2018 2019 LTM 2017 2018 2019 Company Name HQ Exchange 7/27/17 Wk High Value EBITDA EBITDA EBITDA EBITDA Revenue Revenue Revenue Revenue
Wi-Fi Companies
ViaSat, Inc. United States NasdaqGS $66.88 82.4% $4,655 18.9x 14.3x 11.4x 7.6x 2.99x 2.88x 2.61x 2.19x Gogo Inc. United States NasdaqGS 12.22 90.9 1,490 18.9 22.8 13.7 10.5 2.40 2.17 1.93 1.74 Boingo Wireless, Inc. United States NasdaqGS 14.99 88.5 667 19.4 15.9 12.5 9.1 3.94 3.56 3.14 2.67 Global Eagle Entertainment Inc. United States NasdaqCM 2.97 30.8 534 NM 5.7 4.6 4.1 1.43 0.82 0.75 0.63 iPass Inc. United States NasdaqGS 1.22 66.3 67 NM NM 13.4 NA 1.07 0.98 0.80 NA
Group Median 18.9x 15.1x 12.5x 8.4x 2.40x 2.17x 1.93x 1.96x
China Outdoor Advertising Companies
Clear Media Limited Hong Kong SEHK $1.17 96.3% $571 5.5x 6.4x 6.6x 6.1x 2.40x 2.62x 2.48x 2.34x Asiaray Media Group Limited Hong Kong SEHK 0.34 64.6 125 17.9 NA NA NA 0.66 NA NA NA Dahe Media Co., Ltd. China SEHK 0.06 77.5 43 3.9 NA NA NA 0.47 NA NA NA SinoMedia Holding Limited China SEHK 0.23 89.7 53 18.0 NA NA NA 0.28 NA NA NA
Group Median 11.7x 6.4x 6.6x 6.1x 0.57x 2.62x 2.48x 2.34x
Aggregate Mean 14.6x 13.0x 10.4x 7.5x 1.74x 2.17x 1.95x 1.91x Aggregate Median 18.0x 14.3x 12.0x 7.6x 1.43x 2.40x 2.20x 2.19x
Enterprise Value = (Market Capitalization) + (Debt + Preferred Stock +Non-Controlling Interest) – (Cash & Equivalents) – (NetNon-Operating Assets) EBITDA = Earnings Before Interest, Taxes, Depreciation and Amortization EPS = Earnings per share (or ADS) Source: Bloomberg, Capital IQ, SEC filings
CONFIDENTIAL 22
Selected Public Companies / M&A Transactions Analysis
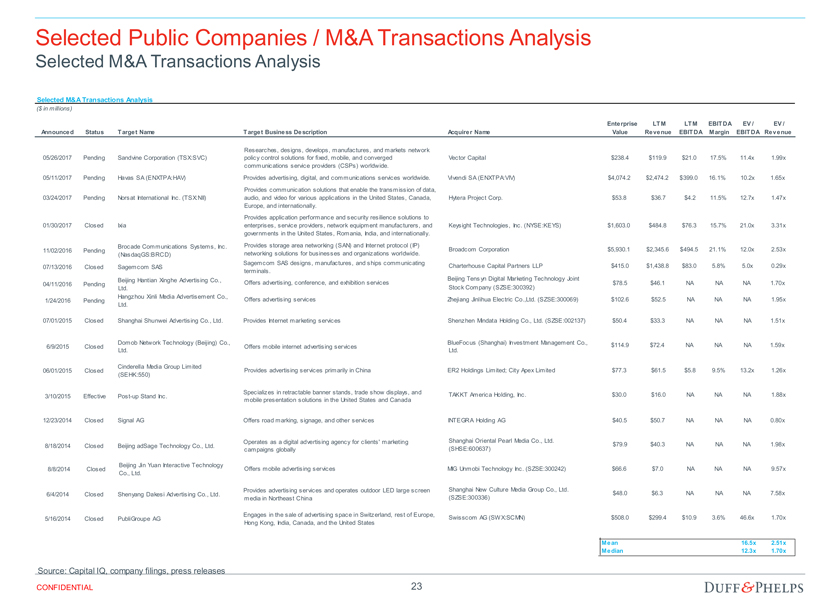
Selected M&A Transactions Analysis
Selected M&A Transactions Analysis
($ in millions)
Enterprise LTM LTM EBITDA EV / EV / Announced Status Target Name Target Business Description Acquirer Name Value Revenue EBITDA Margin EBITDA Revenue
Researches, designs, develops, manufactures, and markets network
05/26/2017 Pending Sandvine Corporation (TSX:SVC) policy control solutions for fixed, mobile, and converged Vector Capital $238.4 $119.9 $21.0 17.5% 11.4x 1.99x communications service providers (CSPs) worldwide.
05/11/2017 Pending Havas SA (ENXTPA:HAV) Provides advertising, digital, and communications services worldwide. Vivendi SA (ENXTPA:VIV) $4,074.2 $2,474.2 $399.0 16.1% 10.2x 1.65x Provides communication solutions that enable the transmission of data, 03/24/2017 Pending Norsat International Inc. (TSX:NII) audio, and video for various applications in the United States, Canada, Hytera Project Corp. $53.8 $36.7 $4.2 11.5% 12.7x 1.47x Europe, and internationally.
Provides application performance and security resilience solutions to
01/30/2017 Closed Ixia enterprises, service providers, network equipment manufacturers, and Keysight Technologies, Inc. (NYSE:KEYS) $1,603.0 $484.8 $76.3 15.7% 21.0x 3.31x governments in the United States, Romania, India, and internationally.
Brocade Communications Systems, Inc. Provides storage area networking (SAN) and Internet protocol (IP)
11/02/2016 Pending Broadcom Corporation $5,930.1 $2,345.6 $494.5 21.1% 12.0x 2.53x (NasdaqGS:BRCD) networking solutions for businesses and organizations worldwide.
Sagemcom SAS designs, manufactures, and ships communicating
07/13/2016 Closed Sagemcom SAS Charterhouse Capital Partners LLP $415.0 $1,438.8 $83.0 5.8% 5.0x 0.29x terminals.
Beijing Hantian Xinghe Advertising Co., Beijing Tensyn Digital Marketing Technology Joint
04/11/2016 Pending Offers advertising, conference, and exhibition services $78.5 $46.1 NA NA NA 1.70x Ltd. Stock Company (SZSE:300392) Hangzhou Xinli Media Advertisement Co., 1/24/2016 Pending Offers advertising services Zhejiang Jinlihua Electric Co.,Ltd. (SZSE:300069) $102.6 $52.5 NA NA NA 1.95x Ltd.
07/01/2015 Closed Shanghai Shunwei Advertising Co., Ltd. Provides Internet marketing services Shenzhen Mindata Holding Co., Ltd. (SZSE:002137) $50.4 $33.3 NA NA NA 1.51x
Domob Network Technology (Beijing) Co., BlueFocus (Shanghai) Investment Management Co.,
6/9/2015 Closed Offers mobile internet advertising services $114.9 $72.4 NA NA NA 1.59x Ltd. Ltd.
Cinderella Media Group Limited
06/01/2015 Closed Provides advertising services primarily in China ER2 Holdings Limited; City Apex Limited $77.3 $61.5 $5.8 9.5% 13.2x 1.26x (SEHK:550)
Specializes in retractable banner stands, trade show displays, and
3/10/2015 EffectivePost-up Stand Inc. TAKKT America Holding, Inc. $30.0 $16.0 NA NA NA 1.88x mobile presentation solutions in the United States and Canada
12/23/2014 Closed Signal AG Offers road marking, signage, and other services INTEGRA Holding AG $40.5 $50.7 NA NA NA 0.80x
Operates as a digital advertising agency for clients’ marketing Shanghai Oriental Pearl Media Co., Ltd.
8/18/2014 Closed Beijing adSage Technology Co., Ltd. $79.9 $40.3 NA NA NA 1.98x campaigns globally (SHSE:600637)
Beijing Jin Yuan Interactive Technology
8/8/2014 Closed Offers mobile advertising services MIG Unmobi Technology Inc. (SZSE:300242) $66.6 $7.0 NA NA NA 9.57x Co., Ltd.
Provides advertising services and operates outdoor LED large screen Shanghai New Culture Media Group Co., Ltd.
6/4/2014 Closed Shenyang Dakesi Advertising Co., Ltd. $48.0 $6.3 NA NA NA 7.58x media in Northeast China (SZSE:300336)
Engages in the sale of advertising space in Switzerland, rest of Europe,
5/16/2014 Closed PubliGroupe AG Swisscom AG (SWX:SCMN) $508.0 $299.4 $10.9 3.6% 46.6x 1.70x Hong Kong, India, Canada, and the United States
Mean 16.5x 2.51x Median 12.3x 1.70x
Source: Capital IQ, company filings, press releases
CONFIDENTIAL 23
Selected Public Companies / M&A Transactions Analysis
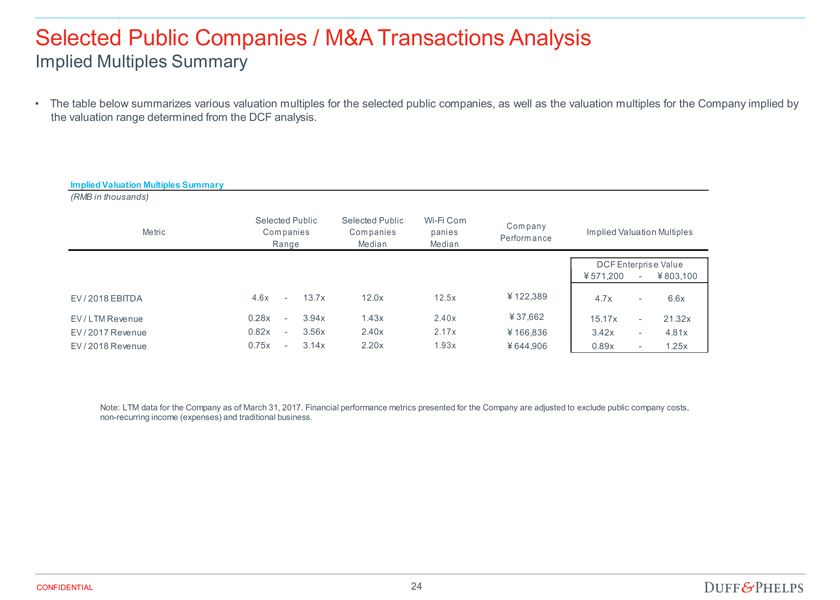
Implied Multiples Summary
• The table below summarizes various valuation multiples for the selected public companies, as well as the valuation multiples for the Company implied by the valuation range determined from the DCF analysis.
Implied Valuation Multiples Summary
(RMB in thousands)
Selected Public Selected PublicWi-Fi
Company
Metric Companies Companies Companies Implied Valuation Multiples Performance Range Median Median
DCF Enterprise Value
ï¿¥571,200—ï¿¥803,100
EV / 2018 EBITDA 4.6x—13.7x 12.0x 12.5x ï¿¥122,389 4.7x—6.6x
EV / LTM Revenue 0.28x—3.94x 1.43x 2.40x ï¿¥37,662 15.17x—21.32x EV / 2017 Revenue 0.82x—3.56x 2.40x 2.17x ï¿¥166,836 3.42x—4.81x EV / 2018 Revenue 0.75x—3.14x 2.20x 1.93x ï¿¥644,906 0.89x—1.25x
Note: LTM data for the Company as of March 31, 2017. Financial performance metrics presented for the Company are adjusted to exclude public company costs,non-recurring income (expenses) and traditional business.
CONFIDENTIAL 24
Appendix 03 Summary of Premiums Paid
Summary of Premiums Paid
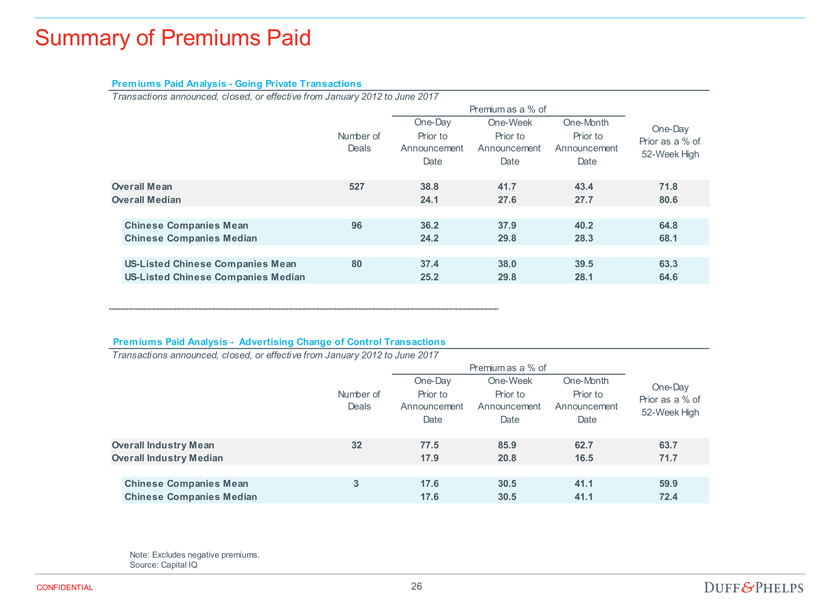
Premiums Paid Analysis—Going Private Transactions
Transactions announced, closed, or effective from January 2012 to June 2017
Premium as a % of
One-DayOne-WeekOne-Month
One-Day Number of Prior to Prior to Prior to Prior as a % of Deals Announcement Announcement Announcement52-Week High Date Date Date
Overall Mean 527 38.8 41.7 43.4 71.8 Overall Median 24.1 27.6 27.7 80.6
Chinese Companies Mean 96 36.2 37.9 40.2 64.8 Chinese Companies Median 24.2 29.8 28.3 68.1
US-Listed Chinese Companies Mean 80 37.4 38.0 39.5 63.3US-Listed Chinese Companies Median 25.2 29.8 28.1 64.6
Premiums Paid Analysis— Advertising Change of Control Transactions
Transactions announced, closed, or effective from January 2012 to June 2017
Premium as a % of
One-DayOne-WeekOne-Month
One-Day Number of Prior to Prior to Prior to Prior as a % of Deals Announcement Announcement Announcement52-Week High Date Date Date
Overall Industry Mean 32 77.5 85.9 62.7 63.7 Overall Industry Median 17.9 20.8 16.5 71.7
Chinese Companies Mean 3 17.6 30.5 41.1 59.9 Chinese Companies Median 17.6 30.5 41.1 72.4
Note: Excludes negative premiums. Source: Capital IQ
CONFIDENTIAL 26