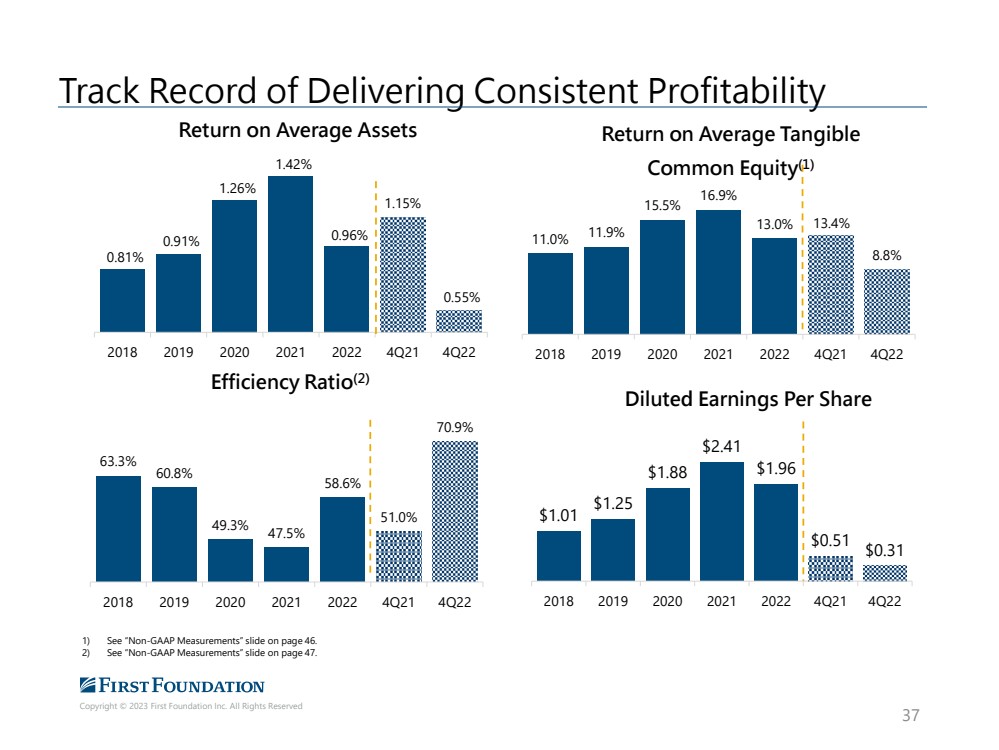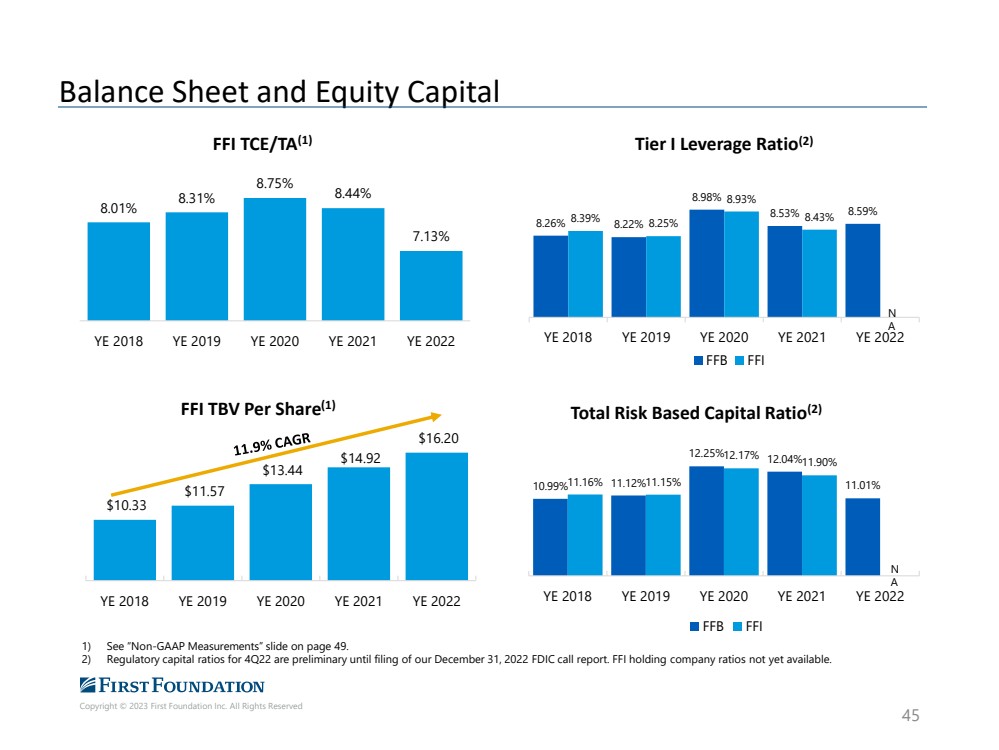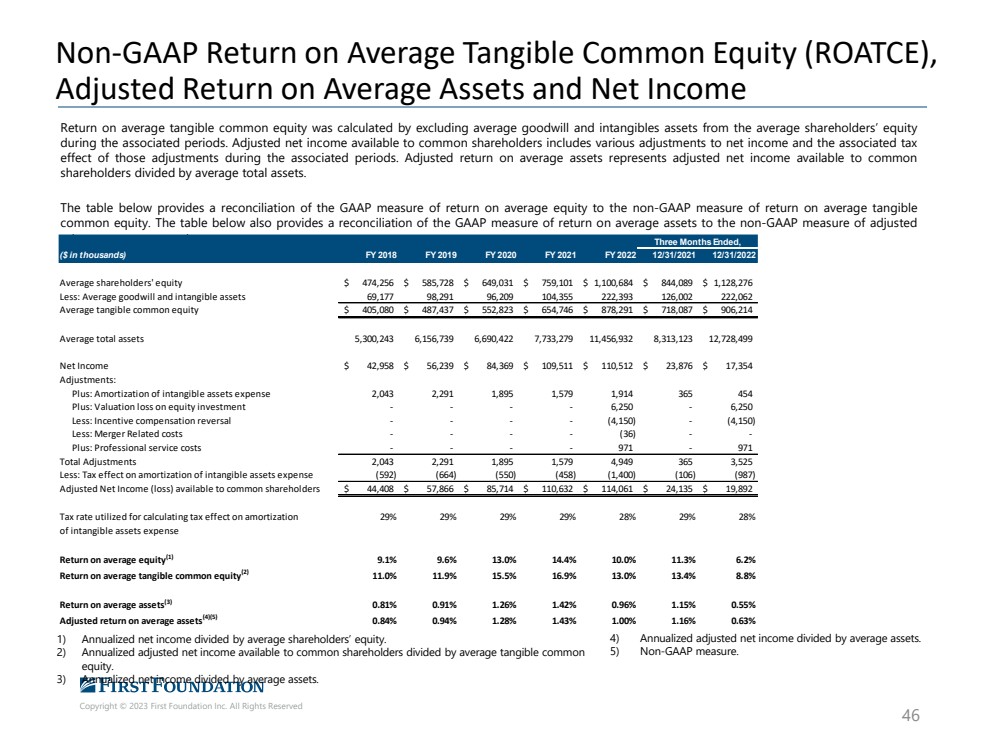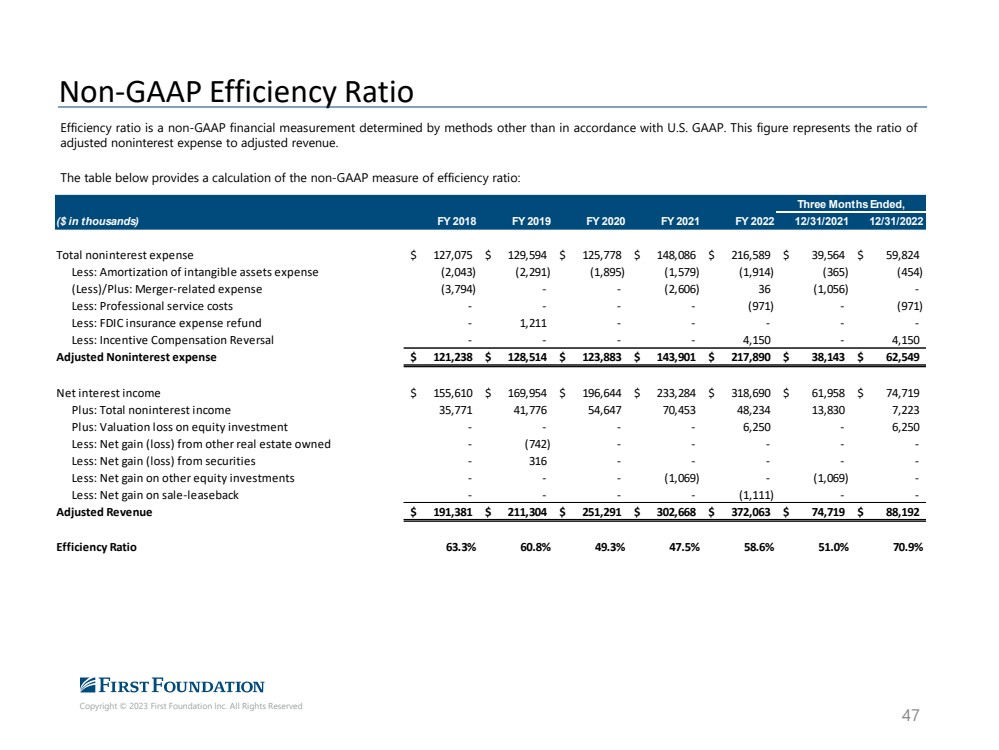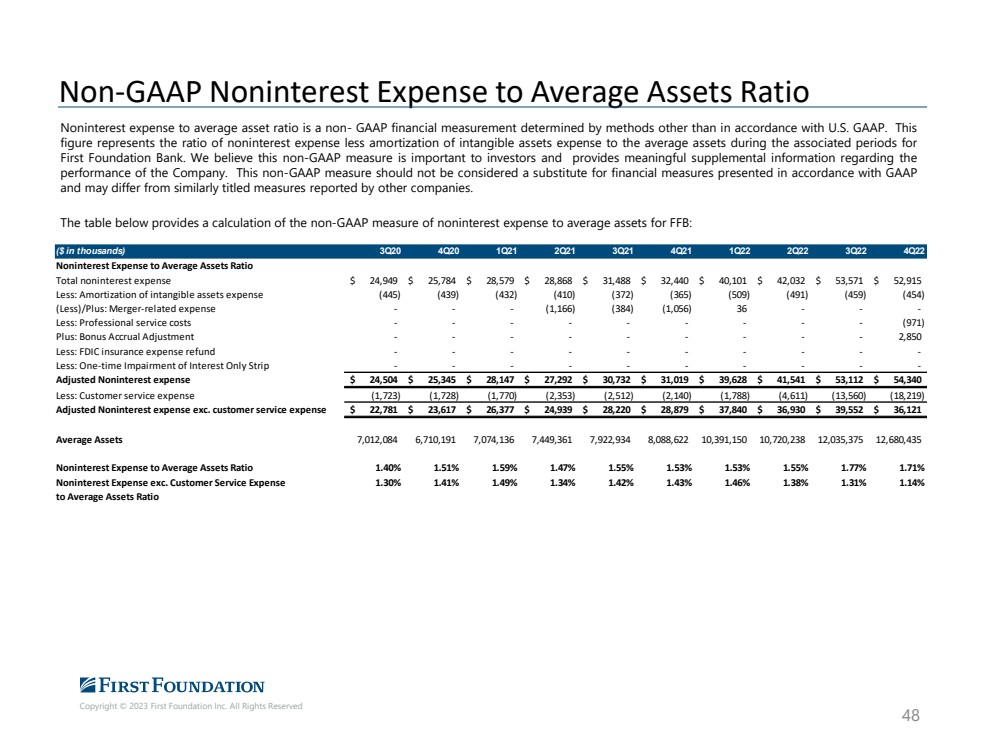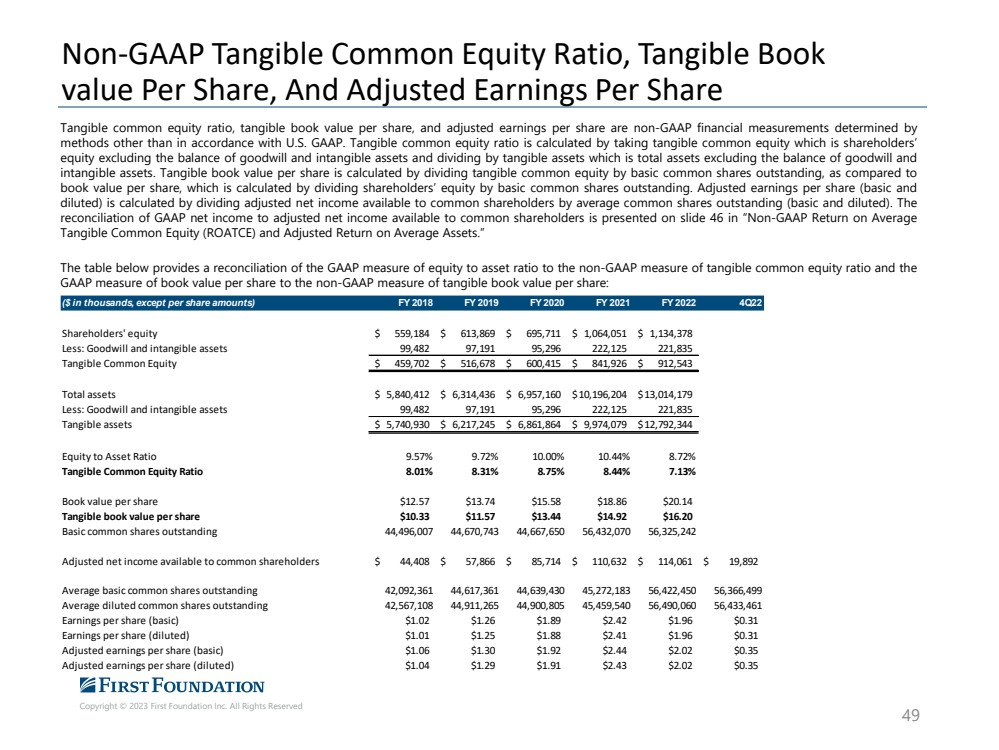
| Copyright © 2023 First Foundation Inc. All Rights Reserved Non - GAAP Tangible Common Equity Ratio, Tangible Book value Per Share, And Adjusted Earnings Per Share 49 Tangible common equity ratio, tangible book value per share, and adjusted earnings per share are non - GAAP financial measurements determined by methods other than in accordance with U .. S .. GAAP .. Tangible common equity ratio is calculated by taking tangible common equity which is shareholders’ equity excluding the balance of goodwill and intangible assets and dividing by tangible assets which is total assets excluding the balance of goodwill and intangible assets .. Tangible book value per share is calculated by dividing tangible common equity by basic common shares outstanding, as compared to book value per share, which is calculated by dividing shareholders’ equity by basic common shares outstanding .. Adjusted earnings per share (basic and diluted) is calculated by dividing adjusted net income available to common shareholders by average common shares outstanding (basic and diluted) .. The reconciliation of GAAP net income to adjusted net income available to common shareholders is presented on slide 46 in “Non - GAAP Return on Average Tangible Common Equity (ROATCE) and Adjusted Return on Average Assets .. ” The table below provides a reconciliation of the GAAP measure of equity to asset ratio to the non - GAAP measure of tangible common equity ratio and the GAAP measure of book value per share to the non - GAAP measure of tangible book value per share : ($ in thousands, except per share amounts) FY 2018 FY 2019 FY 2020 FY 2021 FY 2022 4Q22 Shareholders' equity 559,184 $ 613,869 $ 695,711 $ 1,064,051 $ 1,134,378 $ Less: Goodwill and intangible assets 99,482 97,191 95,296 222,125 221,835 Tangible Common Equity 459,702 $ 516,678 $ 600,415 $ 841,926 $ 912,543 $ Total assets 5,840,412 $ 6,314,436 $ 6,957,160 $ 10,196,204 $ 13,014,179 $ Less: Goodwill and intangible assets 99,482 97,191 95,296 222,125 221,835 Tangible assets 5,740,930 $ 6,217,245 $ 6,861,864 $ 9,974,079 $ 12,792,344 $ Equity to Asset Ratio 9.57% 9.72% 10.00% 10.44% 8.72% Tangible Common Equity Ratio 8.01% 8.31% 8.75% 8.44% 7.13% Book value per share $12.57 $13.74 $15.58 $18.86 $20.14 Tangible book value per share $10.33 $11.57 $13.44 $14.92 $16.20 Basic common shares outstanding 44,496,007 44,670,743 44,667,650 56,432,070 56,325,242 Adjusted net income available to common shareholders 44,408 $ 57,866 $ 85,714 $ 110,632 $ 114,061 $ 19,892 $ Average basic common shares outstanding 42,092,361 44,617,361 44,639,430 45,272,183 56,422,450 56,366,499 Average diluted common shares outstanding 42,567,108 44,911,265 44,900,805 45,459,540 56,490,060 56,433,461 Earnings per share (basic) $1.02 $1.26 $1.89 $2.42 $1.96 $0.31 Earnings per share (diluted) $1.01 $1.25 $1.88 $2.41 $1.96 $0.31 Adjusted earnings per share (basic) $1.06 $1.30 $1.92 $2.44 $2.02 $0.35 Adjusted earnings per share (diluted) $1.04 $1.29 $1.91 $2.43 $2.02 $0.35 |