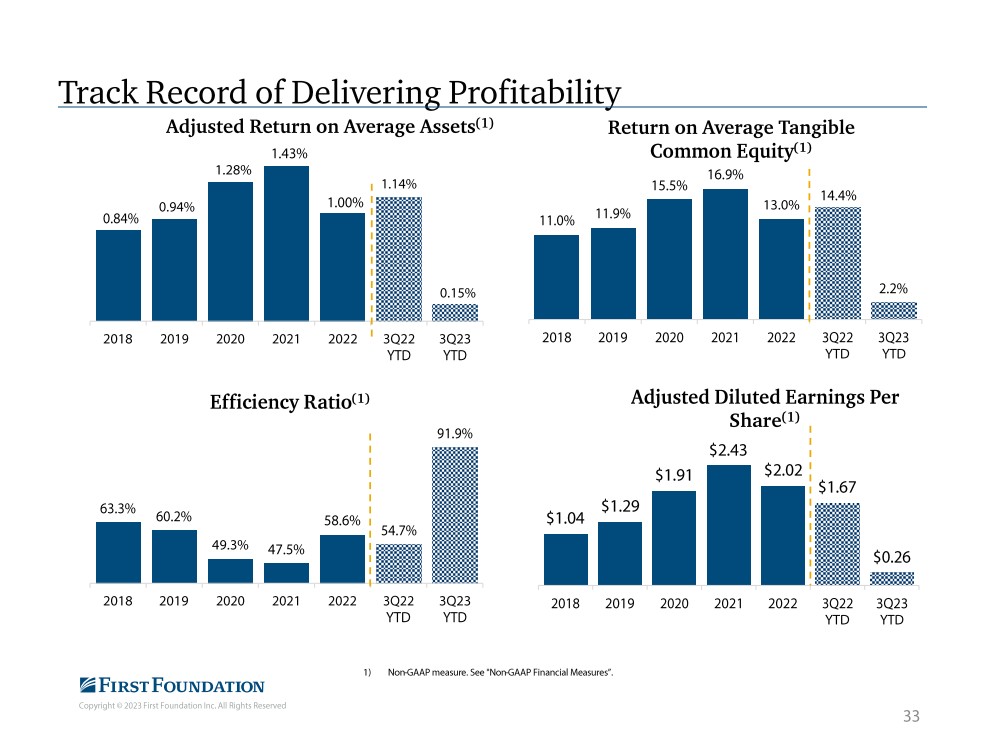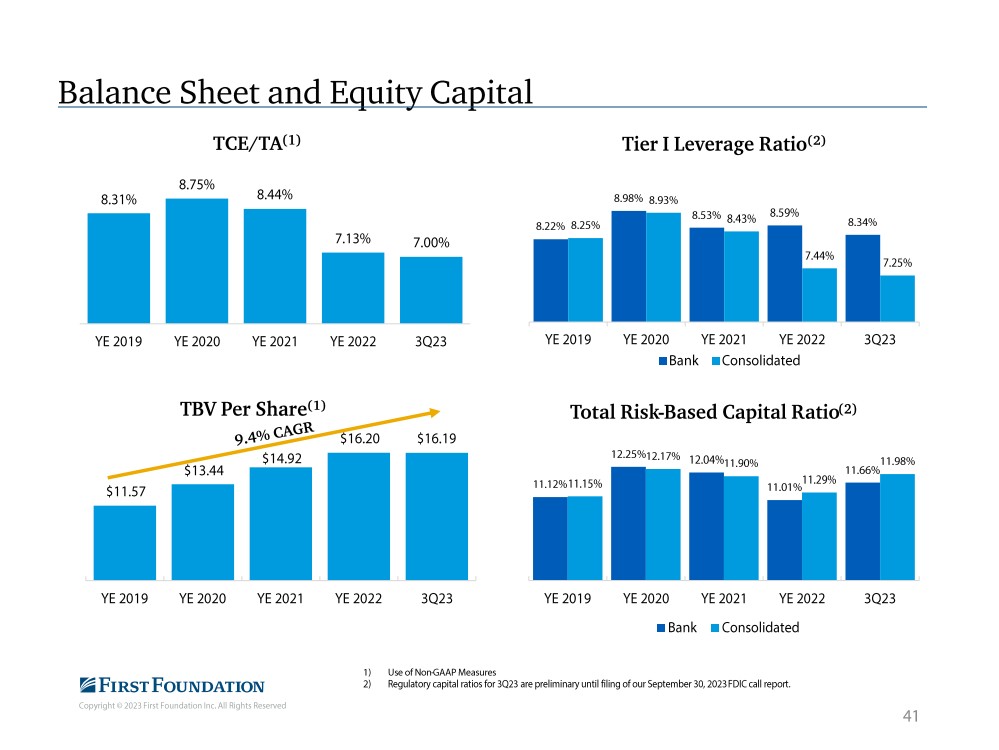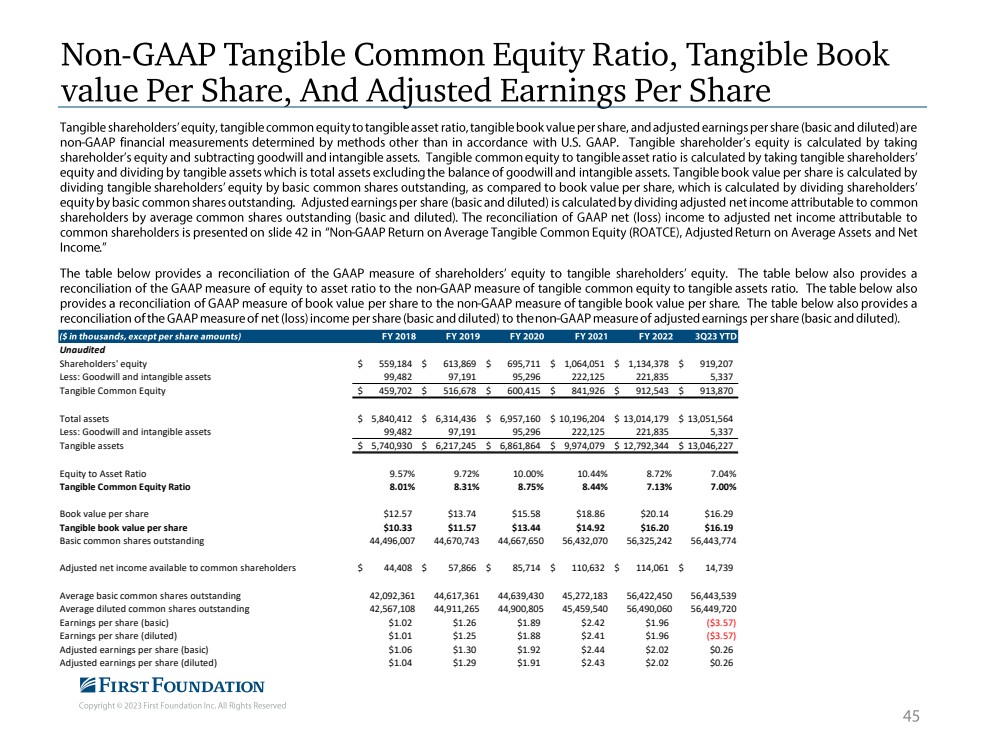
| Unaudited Shareholders' equity $ 559,184 $ 613,869 $ 695,711 $ 1,064,051 $ 1,134,378 $ 919,207 Less: Goodwill and intangible assets 99,482 97,191 95,296 222,125 221,835 5,337 Tangible Common Equity $ 459,702 $ 516,678 $ 600,415 $ 841,926 $ 912,543 $ 913,870 Total assets $ 5,840,412 $ 6,314,436 $ 6,957,160 $ 10,196,204 $ 13,014,179 $ 13,051,564 Less: Goodwill and intangible assets 99,482 97,191 95,296 222,125 221,835 5,337 Tangible assets $ 5,740,930 $ 6,217,245 $ 6,861,864 $ 9,974,079 $ 12,792,344 $ 13,046,227 Equity to Asset Ratio 9.57% 9.72% 10.00% 10.44% 8.72% 7.04% Tangible Common Equity Ratio 8.01% 8.31% 8.75% 8.44% 7.13% 7.00% Book value per share $12.57 $13.74 $15.58 $18.86 $20.14 $16.29 Tangible book value per share $10.33 $11.57 $13.44 $14.92 $16.20 $16.19 Basic common shares outstanding 44,496,007 44,670,743 44,667,650 56,432,070 56,325,242 56,443,774 Adjusted net income available to common shareholders $ 44,408 $ 57,866 $ 85,714 $ 110,632 $ 114,061 $ 14,739 Average basic common shares outstanding 42,092,361 44,617,361 44,639,430 45,272,183 56,422,450 56,443,539 Average diluted common shares outstanding 42,567,108 44,911,265 44,900,805 45,459,540 56,490,060 56,449,720 Earnings per share (basic) $1.02 $1.26 $1.89 $2.42 $1.96 ($3.57) Earnings per share (diluted) $1.01 $1.25 $1.88 $2.41 $1.96 ($3.57) Adjusted earnings per share (basic) $1.06 $1.30 $1.92 $2.44 $2.02 $0.26 Adjusted earnings per share (diluted) $1.04 $1.29 $1.91 $2.43 $2.02 $0.26 |