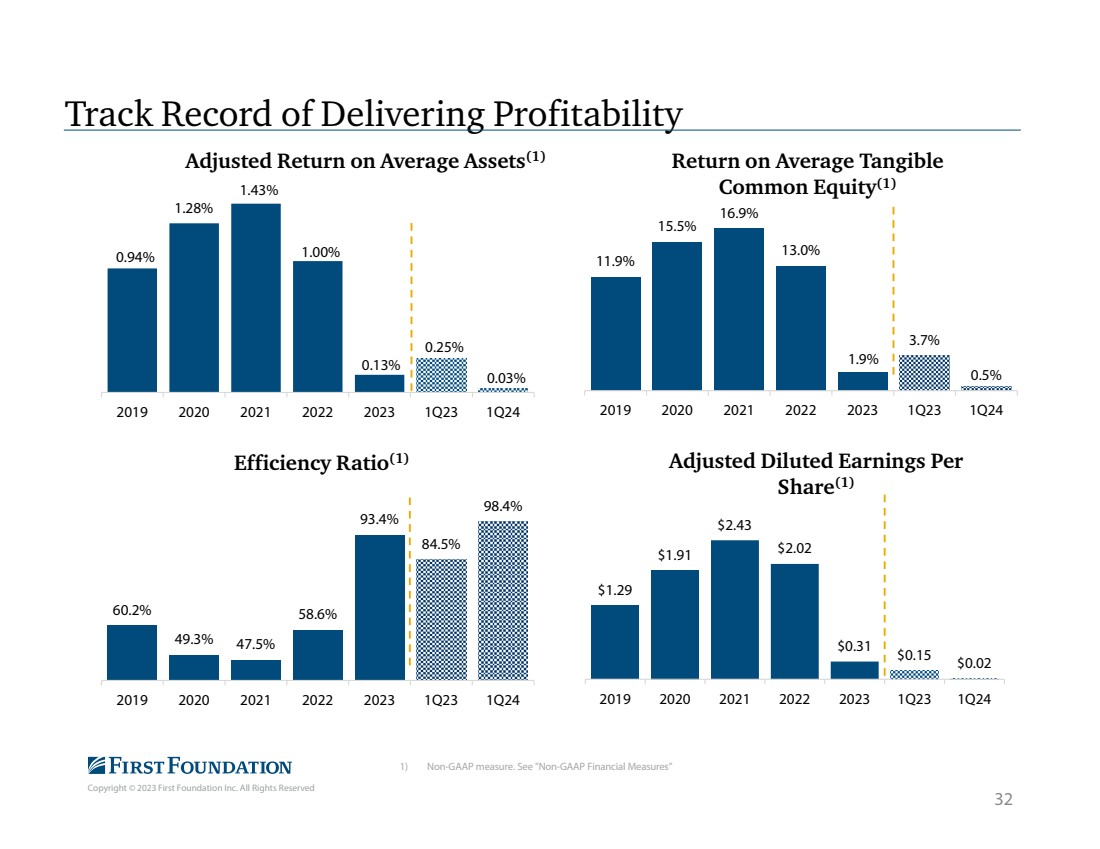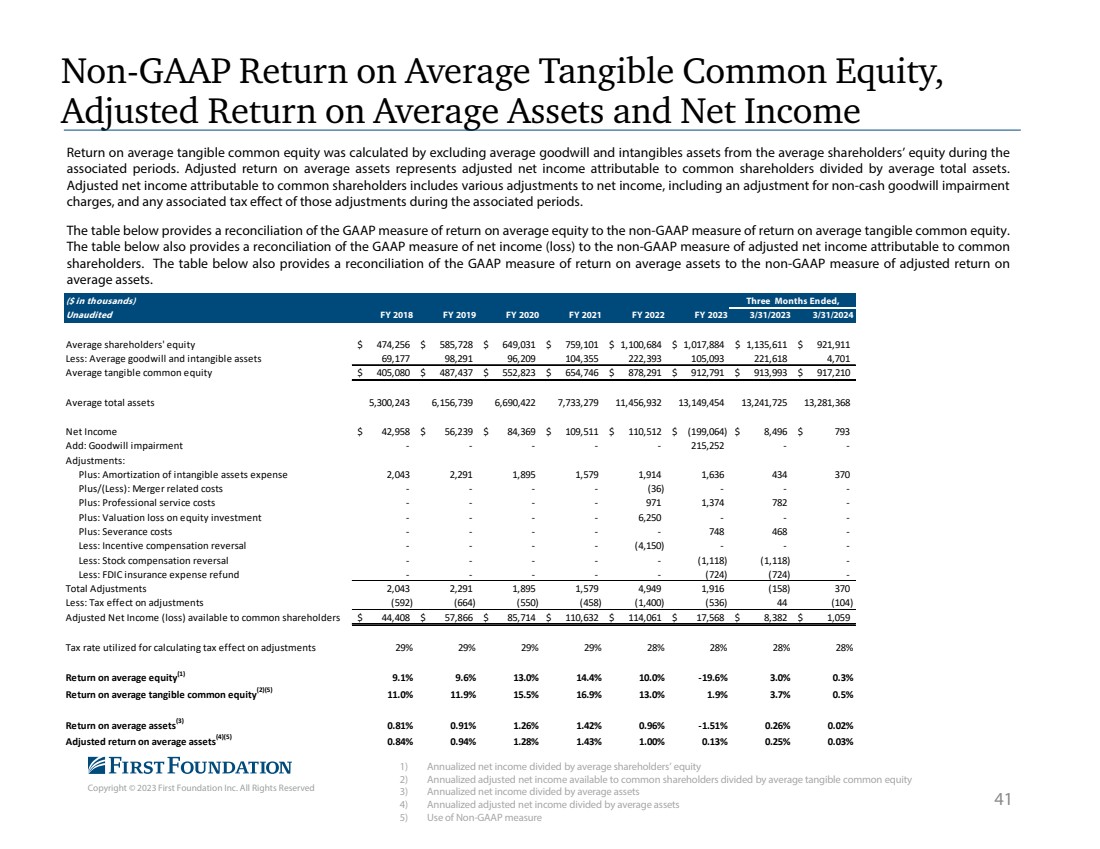
| Copyright © 2023 First Foundation Inc. All Rights Reserved Non-GAAP Return on Average Tangible Common Equity, Adjusted Return on Average Assets and Net Income 41 1) Annualized net income divided by average shareholders’ equity 2) Annualized adjusted net income available to common shareholders divided by average tangible common equity 3) Annualized net income divided by average assets 4) Annualized adjusted net income divided by average assets 5) Use of Non-GAAP measure Return on average tangible common equity was calculated by excluding average goodwill and intangibles assets from the average shareholders’ equity during the associated periods. Adjusted return on average assets represents adjusted net income attributable to common shareholders divided by average total assets. Adjusted net income attributable to common shareholders includes various adjustments to net income, including an adjustment for non-cash goodwill impairment charges, and any associated tax effect of those adjustments during the associated periods. The table below provides a reconciliation of the GAAP measure of return on average equity to the non-GAAP measure of return on average tangible common equity. The table below also provides a reconciliation of the GAAP measure of net income (loss) to the non-GAAP measure of adjusted net income attributable to common shareholders. The table below also provides a reconciliation of the GAAP measure of return on average assets to the non-GAAP measure of adjusted return on average assets. ($ in thousands) Three Months Ended, Unaudited FY 2018 FY 2019 FY 2020 FY 2021 FY 2022 FY 2023 3/31/2023 3/31/2024 Average shareholders' equity 474,256 $ 585,728 $ 649,031 $ 759,101 $ 1,100,684 $ 1,017,884 $ 1,135,611 $ 921,911 $ Less: Average goodwill and intangible assets 69,177 98,291 96,209 104,355 222,393 105,093 221,618 4,701 Average tangible common equity 405,080 $ 487,437 $ 552,823 $ 654,746 $ 878,291 $ 912,791 $ 913,993 $ 917,210 $ Average total assets 5,300,243 6,156,739 6,690,422 7,733,279 11,456,932 13,149,454 13,241,725 13,281,368 Net Income 42,958 $ 56,239 $ 84,369 $ 109,511 $ 110,512 $ (199,064) $ 8,496 $ 793 $ Add: Goodwill impairment - - - - - 215,252 - - Adjustments: Plus: Amortization of intangible assets expense 2,043 2,291 1,895 1,579 1,914 1,636 434 370 Plus/(Less): Merger related costs - - - - (36) - - - Plus: Professional service costs - - - - 971 1,374 782 - Plus: Valuation loss on equity investment - - - - 6,250 - - - Plus: Severance costs - - - - - 748 468 - Less: Incentive compensation reversal - - - - (4,150) - - - Less: Stock compensation reversal - - - - - (1,118) (1,118) - Less: FDIC insurance expense refund - - - - - (724) (724) - Total Adjustments 2,043 2,291 1,895 1,579 4,949 1,916 (158) 370 Less: Tax effect on adjustments (592) (664) (550) (458) (1,400) (536) 44 (104) Adjusted Net Income (loss) available to common shareholders 44,408 $ 57,866 $ 85,714 $ 110,632 $ 114,061 $ 17,568 $ 8,382 $ 1,059 $ Tax rate utilized for calculating tax effect on adjustments 29% 29% 29% 29% 28% 28% 28% 28% Return on average equity(1) 9.1% 9.6% 13.0% 14.4% 10.0% -19.6% 3.0% 0.3% Return on average tangible common equity(2)(5) 11.0% 11.9% 15.5% 16.9% 13.0% 1.9% 3.7% 0.5% Return on average assets(3) 0.81% 0.91% 1.26% 1.42% 0.96% -1.51% 0.26% 0.02% Adjusted return on average assets(4)(5) 0.84% 0.94% 1.28% 1.43% 1.00% 0.13% 0.25% 0.03% |