Table of Contents
SECURITIES AND EXCHANGE COMMISSION
| o | Registration statement pursuant to Section 12(b) or 12(g) of the Securities Exchange Act of 1934 |
| þ | Annual report pursuant to Section 13 or 15(d) of the Securities Exchange Act of 1934 |
| o | Transition report pursuant to Section 13 or 15(d) of the Securities Exchange Act of 1934 |
| o | Shell company report pursuant to Section 13 or 15(d) of the Securities Exchange Act of 1934 |
| Date of event requiring this shell company report |
No. 299 Yanjiang Zhong Road
Guangzhou, Guangdong 510110
People’s Republic of China
Tel: +86 20 6122-2777
E-mail: gepeng@cninsure.net
Fax: +86 20 6126-2893
22/F, Yinhai Building
No. 299 Yanjiang Zhong Road
Guangzhou, Guangdong 510110
People’s Republic of China
| Title of Each Class | Name of Each Exchange on Which Registered | |
| Ordinary shares, par value US$0.001 per share* | The NASDAQ Stock Market LLC | |
| American depositary shares, each representing | (The NASDAQ Global Select Market) | |
| 20 ordinary shares |
| * | Not for trading, but only in connection with the listing on The NASDAQ Global Select Market of American depositary shares, each representing 20 ordinary shares. |
| Large accelerated filerþ | Accelerated filero | Non-accelerated filero |
| 1 | ||||||||
| 3 | ||||||||
| 3 | ||||||||
| 3 | ||||||||
| 3 | ||||||||
| 26 | ||||||||
| 50 | ||||||||
| 51 | ||||||||
| 72 | ||||||||
| 82 | ||||||||
| 83 | ||||||||
| 84 | ||||||||
| 85 | ||||||||
| 93 | ||||||||
| 93 | ||||||||
| 95 | ||||||||
| 95 | ||||||||
| 95 | ||||||||
| 96 | ||||||||
| 98 | ||||||||
| 98 | ||||||||
| 98 | ||||||||
| 98 | ||||||||
| 98 | ||||||||
| 99 | ||||||||
| 99 | ||||||||
| 99 | ||||||||
| 99 | ||||||||
| 99 | ||||||||
| 99 | ||||||||
| Exhibit 4.18 | ||||||||
| Exhibit 4.19 | ||||||||
| Exhibit 4.20 | ||||||||
| Exhibit 4.21 | ||||||||
| Exhibit 4.22 | ||||||||
| Exhibit 4.23 | ||||||||
| Exhibit 4.24 | ||||||||
| Exhibit 4.25 | ||||||||
| Exhibit 4.26 | ||||||||
| Exhibit 4.27 | ||||||||
| Exhibit 4.28 | ||||||||
| Exhibit 4.29 | ||||||||
| Exhibit 4.30 | ||||||||
| Exhibit 4.31 | ||||||||
| Exhibit 4.32 | ||||||||
| Exhibit 4.33 | ||||||||
| Exhibit 4.34 | ||||||||
| Exhibit 4.35 | ||||||||
| Exhibit 4.36 | ||||||||
| Exhibit 4.37 | ||||||||
| Exhibit 8.1 | ||||||||
| Exhibit 12.1 | ||||||||
| Exhibit 12.2 | ||||||||
| Exhibit 13.1 | ||||||||
| Exhibit 13.2 | ||||||||
| Exhibit 15.1 | ||||||||
| Exhibit 15.2 | ||||||||
| Exhibit 15.3 | ||||||||
Table of Contents
| • | “we,” “us,” “our company,” “our” or “CNinsure” refer to CNinsure Inc., its subsidiaries and any entity carrying on CNinsure’s current business prior to the restructuring transactions in July 2007, through which CNinsure became the listing vehicle in our initial public offering, and their respective subsidiaries and consolidated affiliated entities; |
| • | “China” or “PRC” refers to the People’s Republic of China, excluding, solely for the purpose of this annual report, Taiwan, Hong Kong and Macau; |
| • | “provinces” of China refers to the 22 provinces, the four municipalities directly administered by the central government (Beijing, Shanghai, Tianjin and Chongqing) and the five autonomous regions (Xinjiang, Tibet, Inner Mongolia, Ningxia and Guangxi); |
| • | “shares” or “ordinary shares” refers to our ordinary shares, par value US$0.001 per share; |
| • | “ADSs” refers to our American depositary shares, each of which represents 20 ordinary shares; |
| • | all references to “RMB” or “Renminbi” are to the legal currency of China and all references to “$,” “dollars,” “US$” and “U.S. dollars” are to the legal currency of the United States; and |
| • | all discrepancies in any table between the amounts identified as total amounts and the sum of the amounts listed therein are due to rounding. |
| • | our anticipated growth strategies; |
| • | the anticipated growth of our life insurance business; |
| • | our future business development, results of operations and financial condition; |
| • | factors that affect our future revenues and expenses; |
| • | the future growth of the Chinese insurance industry as a whole and the professional insurance intermediary sector in particular; |
| • | trends and competition in the Chinese insurance industry; and |
| • | economic and demographic trends in the PRC. |
-1-
Table of Contents
-2-
Table of Contents
| Item 1. | Identity of Directors, Senior Management and Advisers |
| Item 2. | Offer Statistics and Expected Timetable |
| Item 3. | Key Information |
| A. | Selected Financial Data |
-3-
Table of Contents
| For the Year Ended December 31, | ||||||||||||||||||||||||
| 2006 | 2007 | 2008 | 2009 | 2010 | ||||||||||||||||||||
| RMB | RMB | RMB | RMB | RMB | US$ | |||||||||||||||||||
| (in thousands, except shares, per share and per ADS data) | ||||||||||||||||||||||||
Consolidated Statement of Operations Data | ||||||||||||||||||||||||
Net revenues: | ||||||||||||||||||||||||
| Commissions and fees | 245,652 | 446,929 | 843,107 | 1,154,090 | 1,484,389 | 224,907 | ||||||||||||||||||
| Other service fees | 897 | 1,216 | 855 | 761 | 640 | 97 | ||||||||||||||||||
Total net revenues | 246,549 | 448,145 | 843,962 | 1,154,851 | 1,485,029 | 225,004 | ||||||||||||||||||
Operating costs and expenses: | ||||||||||||||||||||||||
| Commissions and fees | (133,076 | ) | (232,550 | ) | (436,803 | ) | (579,911 | ) | (708,403 | ) | (107,333 | ) | ||||||||||||
| Selling expenses | (11,288 | ) | (9,514 | ) | (17,328 | ) | (49,498 | ) | (73,567 | ) | (11,147 | ) | ||||||||||||
General and administrative expenses(1) | (52,119 | ) | (68,177 | ) | (180,031 | ) | (199,246 | ) | (271,444 | ) | (41,128 | ) | ||||||||||||
Total operating costs and expenses | (196,483 | ) | (310,241 | ) | (634,162 | ) | (828,655 | ) | (1,053,414 | ) | (159,608 | ) | ||||||||||||
Income from operations | 50,066 | 137,904 | 209,800 | 326,196 | 431,615 | 65,396 | ||||||||||||||||||
Other income (expense), net: | ||||||||||||||||||||||||
| Gain on disposal of investment in a subsidiary | — | — | 525 | — | — | — | ||||||||||||||||||
| Investment income | — | — | — | 18,905 | 41,244 | 6,249 | ||||||||||||||||||
| Interest income | 5,364 | 16,235 | 47,967 | 33,299 | 26,924 | 4,080 | ||||||||||||||||||
| Interest expense | (34 | ) | (25 | ) | (95 | ) | (4 | ) | (5 | ) | (1 | ) | ||||||||||||
| Others, net | 5 | (2 | ) | (28 | ) | 1,408 | 391 | 59 | ||||||||||||||||
| Changes in fair value of contingent consideration payables | — | — | — | (5,946 | ) | — | — | |||||||||||||||||
Net income before income taxes and income of affiliates | 55,401 | 154,112 | 258,169 | 373,858 | 500,169 | 75,783 | ||||||||||||||||||
| Income tax benefit (expense) | 573 | (3,178 | ) | (62,438 | ) | (95,618 | ) | (96,743 | ) | (14,658 | ) | |||||||||||||
| Share of income of affiliates | — | — | 135 | 774 | 12,904 | 1,955 | ||||||||||||||||||
Net income | 55,974 | 150,934 | 195,866 | 279,014 | 416,330 | 63,080 | ||||||||||||||||||
| Less: Net income (loss) attributable to the noncontrolling interests | (1,421 | ) | (2,424 | ) | 4,129 | (21,827 | ) | (5,978 | ) | (906 | ) | |||||||||||||
Net income attributable to the CNinsure Inc.’s shareholders | 57,395 | 153,358 | 191,737 | 300,841 | 422,308 | 63,986 | ||||||||||||||||||
Net income per share (giving effect to the 10,000-for-1 share exchange in 2007): | ||||||||||||||||||||||||
| Basic | 0.0883 | 0.2178 | 0.2101 | 0.3297 | 0.4408 | 0.0668 | ||||||||||||||||||
| Diluted | 0.0875 | 0.2143 | 0.2090 | 0.3241 | 0.4264 | 0.0646 | ||||||||||||||||||
Net income per ADS: | ||||||||||||||||||||||||
| Basic | 1.7660 | 4.3551 | 4.2025 | 6.5938 | 8.8162 | 1.3358 | ||||||||||||||||||
| Diluted | 1.7500 | 4.2858 | 4.1803 | 6.4815 | 8.5288 | 1.2922 | ||||||||||||||||||
Shares used in calculating net income per share (giving effect to the 10,000-for-1 share exchange in 2007): | ||||||||||||||||||||||||
| Basic | 650,000,000 | 704,273,232 | 912,497,726 | 912,497,726 | 958,029,717 | 958,029,717 | ||||||||||||||||||
| Diluted | 655,970,000 | 715,649,950 | 917,335,390 | 928,312,312 | 990,318,528 | 990,318,528 | ||||||||||||||||||
Dividends declared per share(2) | 585 | 0.1023 | — | 0.075 | 0.089 | 0.013 | ||||||||||||||||||
| (1) | Including (i) share-based compensation expenses of RMB45.7 million, RMB7.6 million and RMB22.2 million (US$3.4 million) for the years ended December 31, 2008, 2009 and 2010, respectively; and (ii) impairment loss on intangible assets of nil, nil and RMB4.6 million (US$0.7 million) for the years ended December 31, 2008, 2009 and 2010, respectively. | |
| (2) | The 2004 and 2005 dividends were declared in 2006 and the 2006 and 2007 dividends were declared in 2007. These dividends were not paid at the time they were declared. In 2007, we paid all of the previously declared but unpaid dividends totaling approximately RMB140.0 million. The per-share amount for 2006 was determined based on the number of shares of CISG Holdings Ltd., or CISG Holdings, outstanding as of the record date for the dividends declared, without giving effect to the 10,000-for-1 share exchange in July 2007. Dividend of US$0.22 per ADS was declared on May 21, 2009, payable to our shareholders of record as of the close of business on June 26, 2009. Dividend of US$0.26 per ADS was declared on April 23, 2010, payable to our shareholders of record as of the close of business on May 20, 2010. |
-4-
Table of Contents
| As of December 31, | ||||||||||||||||||||||||
| 2006 | 2007 | 2008 | 2009 | 2010 | ||||||||||||||||||||
| RMB | RMB | RMB | RMB | RMB | US$ | |||||||||||||||||||
| (in thousands) | ||||||||||||||||||||||||
Consolidated Balance Sheet Data: | ||||||||||||||||||||||||
| Cash and cash equivalents | 223,926 | 1,544,817 | 1,510,432 | 1,457,890 | 1,924,884 | 291,649 | ||||||||||||||||||
| Total current assets | 355,703 | 1,608,256 | 1,876,883 | 1,727,499 | 2,302,425 | 348,852 | ||||||||||||||||||
| Total assets | 379,622 | 1,640,164 | 2,046,515 | 2,545,965 | 3,854,456 | 584,008 | ||||||||||||||||||
| Total current liabilities | 75,524 | 53,337 | 190,222 | 337,648 | 288,361 | 43,691 | ||||||||||||||||||
| Total liabilities | 76,321 | 54,928 | 200,444 | 359,260 | 337,393 | 51,120 | ||||||||||||||||||
| Noncontrolling interests | 13,717 | 18,324 | 94,423 | 194,897 | 456,079 | 69,103 | ||||||||||||||||||
| Total equity | 303,301 | 1,585,236 | 1,846,071 | 2,186,705 | 3,517,063 | 532,888 | ||||||||||||||||||
| Total liabilities and shareholders’ equity | 379,622 | 1,640,164 | 2,046,515 | 2,545,965 | 3,854,456 | 584,008 | ||||||||||||||||||
| Noon Buying Rate | ||||||||||||||||
| (RMB per US$1.00) | ||||||||||||||||
| Period | ||||||||||||||||
| Period | End | Average(1) | Low | High | ||||||||||||
| 2006 | 7.8041 | 7.9579 | 8.0702 | 7.8041 | ||||||||||||
| 2007 | 7.2946 | 7.5806 | 7.8127 | 7.2946 | ||||||||||||
| 2008 | 6.8225 | 6.9193 | 7.2946 | 6.7800 | ||||||||||||
| 2009 | 6.8259 | 6.8295 | 6.8470 | 6.8176 | ||||||||||||
| 2010 | 6.6000 | 6.7603 | 6.8330 | 6.6000 | ||||||||||||
| November | 6.6670 | 6.6538 | 6.6892 | 6.6330 | ||||||||||||
| December | 6.6000 | 6.6497 | 6.6745 | 6.6000 | ||||||||||||
| 2011 | ||||||||||||||||
| January | 6.6017 | 6.5964 | 6.6364 | 6.5809 | ||||||||||||
| February | 6.5713 | 6.5761 | 6.5965 | 6.5520 | ||||||||||||
| March | 6.5483 | 6.5645 | 6.5743 | 6.5483 | ||||||||||||
| April (through April 29) | 6.4900 | 6.5267 | 6.5477 | 6.4900 | ||||||||||||
| Source: Federal Reserve Bank of New York | ||
| (1) | Annual averages are calculated from month-end rates. Monthly averages are calculated using the average of the daily rates during the relevant period. | |
| B. | Capitalization and Indebtedness |
-5-
Table of Contents
| C. | Reasons for the Offer and Use of Proceeds |
| D. | Risk Factors |
-6-
Table of Contents
-7-
Table of Contents
-8-
Table of Contents
-9-
Table of Contents
| • | making misrepresentation when marketing or selling insurance products to customers; |
| • | hindering insurance applicants from making full and accurate mandatory disclosures or inducing applicants into make misrepresentations; |
| • | hiding or falsifying material information in relation to the insurance contracts; |
-10-
Table of Contents
| • | fabricating or altering insurance contracts without authorization from relevant parties, selling false policies, or providing false documents on behalf of the applicants; |
| • | falsifying insurance agency business or fraudulently returning insurance policies to obtain commissions; |
| • | colluding with applicants, insured, or beneficiaries to obtain insurance benefits; |
| • | engaging in false claims; or |
| • | otherwise not complying with laws and regulations or our control policies or procedures. |
-11-
Table of Contents
-12-
Table of Contents
-13-
Table of Contents
| • | The effectiveness of our marketing campaign to build brand recognition among consumers and our ability to attract and retain customers; |
| • | The acceptance of third party e-commerce platform as an effective channel for underwriters to distribute their insurance products; |
| • | Public concerns over security of e-commerce transactions and confidentiality of information; |
| • | Increased competition from insurance companies which directly sell insurance products through their own websites and call centers, portal websites which provide insurance product information and links to insurance companies’ websites and other professional insurance intermediary companies which may launch independent online insurance distribution in the future; and |
| • | Further development and changes in applicable rules and regulations which may increase our operating costs and expenses, impede the execution of our business plan or change the competitive landscape. |
-14-
Table of Contents
| • | exercise effective control over Meidiya Investment, Yihe Investment, Xinbao Investment and their subsidiaries; |
| • | receive a substantial portion of the economic benefits of the subsidiaries of Meidiya Investment, Yihe Investment and Xinbao Investment in consideration for the services provided by our wholly-owned subsidiaries in China; and |
| • | have an exclusive option to purchase all or part of the equity interests in each of Meidiya Investment, Yihe Investment, Xinbao Investment and their subsidiaries when and to the extent permitted by PRC law. |
-15-
Table of Contents
| • | revoking the business and operating licenses of our PRC subsidiaries and consolidated affiliated entities; |
| • | restricting or prohibiting any related-party transactions among our PRC subsidiaries and consolidated affiliated entities; |
| • | imposing fines or other requirements with which we, our PRC subsidiaries or our consolidated affiliated entities may not be able to comply; |
| • | requiring us, our PRC subsidiaries or our consolidated affiliated entities to restructure the relevant ownership structure or operations; or |
| • | restricting or prohibiting us from providing additional funding for our business and operations in China. |
-16-
Table of Contents
-17-
Table of Contents
-18-
Table of Contents
-19-
Table of Contents
-20-
Table of Contents
-21-
Table of Contents
| • | the CSRC had jurisdiction over our offering; |
| • | the CSRC by then had not issued any definitive rule or interpretation concerning whether offerings like our initial public offering were subject to this new procedure; and |
| • | despite the above, given that we had completed our inbound investment before September 8, 2006, the effective date of the M&A Rule, an application was not required under the M&A Rule to be submitted to the CSRC for its approval of the listing and trading of our ADSs on the Nasdaq Global Market, unless we were clearly required to do so by subsequent rules of the CSRC. |
-22-
Table of Contents
| • | actual or anticipated fluctuations in our quarterly operating results; |
| • | changes in financial estimates by securities research analysts; |
| • | conditions in the Chinese insurance industry; |
| • | changes in the economic performance or market valuations of other insurance intermediaries; |
| • | announcements by us or our competitors of new products, acquisitions, strategic partnerships, joint ventures or capital commitments; |
| • | addition or departure of key personnel; |
| • | fluctuations of exchange rates between the RMB and U.S. dollar or other foreign currencies; |
| • | potential litigation or administrative investigations; |
| • | sales of additional ADSs; and |
| • | general economic or political conditions in China. |
-23-
Table of Contents
-24-
Table of Contents
-25-
Table of Contents
| Item 4. | Information on the Company |
| A. | History and Development of the Company |
-26-
Table of Contents
| % of Equity | ||||||||||
| Interests | ||||||||||
| Date of Acquisition(1) | Name of Established or Acquired | Attributable to | Main Insurance Products Distributed | Location | ||||||
| or Establishment(2) | Company | Us | or Services Provided | (Province) | ||||||
January 1, 2010(1) | Hebei Fanlian Insurance Agency Co., Ltd. | 51 | % | Distribution of property and casualty insurance products | Hebei | |||||
January 1, 2010(1) | Litian Zhuoyue Software (Beijing) Co., Ltd. | 100 | % | Operating platform management and maintenance | Beijing | |||||
March 30, 2010(1) | Fujian Fanhua Investment Co., Ltd.(3) | 45 | % | Holding Company | Fujian | |||||
April 1, 2010(1) | Shandong Fanhua Mintai Insurance Agency Co., Ltd. | 51 | % | Distribution of property and casualty insurance products | Shandong | |||||
April 1, 2010(1) | Ningbo Fanhua Baolian Insurance Agency Co., Ltd. | 51 | % | Distribution of property and casualty insurance products | Zhejiang | |||||
October 1, 2010(1) | Shenyang Fangda Insurance Agency Co., Ltd. | 51 | % | Distribution of property and casualty insurance products | Liaoning | |||||
November 1, 2010(1) | Shenzhen InsCom E-commerce Co., Ltd(4) | 65.1 | % | Distribution of insurance products online | Guangdong | |||||
November 19, 2010(2) | Fanhua Puyi Investment Management Co., Ltd. | 19.48 | % | Offering wealth management services | Sichuan | |||||
February 17, 2011(2) | Fanhua Lianxing Insurance Sales Co., Ltd. | 100 | % | Distribution of life insurance products | Beijing | |||||
March 2, 2011(2) | Shenzhen Bangbang Auto Services Co., Ltd. | 100 | % | Automobile services | Guangdong | |||||
| (1) | Refers to the date on which we acquired and began to consolidate the acquired entity. | |
| (2) | Refers to the date on which we obtained business licenses for the newly established company. | |
| (3) | We acquired additional 45% equity interests in Fujian Fanhua Investment Co., Ltd. in which we previously held 55% equity interests. | |
| (4) | As of November 1, 2010, we held 65.1% of the equity interest in InsCom Holding, which beneficially owned 100% of the equity interest in Shenzhen InsCom. |
-27-
Table of Contents
-28-
Table of Contents
-29-
Table of Contents
| • | nine of China’s top 20 insurance agencies, accounting for approximately 11.96% of total insurance agency revenue in China in 2010; |
| • | one of China’s top 20 insurance brokerage, accounting for approximately 0.9% of total insurance brokerage revenue in China in 2010; and |
| • | two of China’s top 20 insurance claims adjusting firms, accounting for approximately 14.94% of total claims adjusting firm revenue in China in 2010. |
| • | Automobile Insurance.Automobile insurance is the largest segment of property and casualty insurance in the PRC in terms of gross written premiums. We distribute both standard automobile insurance policies and supplemental policies, which we refer to as riders. The standard automobile insurance policies we sell generally have a term of one year and cover damages caused to the insured vehicle by collision and other traffic accidents, falling or flying objects, fire, explosion and natural disasters. We also sell standard third party liability insurance policies, which cover bodily injury and property damage caused by an accident involving an insured vehicle to a person not in the insured vehicle. The riders we distribute cover additional losses, such as liability to passengers, losses arising from vehicle theft and robbery, broken glass and vehicle body scratches. |
-30-
Table of Contents
| • | Individual Accident Insurance.The individual accident insurance products we distribute generally provide a guaranteed benefit during the coverage period, which usually is one year or a shorter period, in the event of death or disability of the insured as a result of an accident, or a reimbursement of medical expenses to the insured in connection with an accident. These products typically require only a single premium payment for each coverage period. Because most of the individual accident insurance products we distribute are underwritten by property and casualty insurance companies, we classify individual accident insurance products as property and casualty insurance products. |
| • | Commercial Property Insurance.The commercial property insurance products we distribute include basic, comprehensive and all risk policies. Basic commercial property insurance policies generally cover damage to the insured property caused by fire, explosion and thunder and lightning. Comprehensive commercial property insurance policies generally cover damage to the insured property caused by fire, explosion and certain natural disasters. All risk commercial property insurance policies cover all causes of damage to the insured property not specifically excluded from the policies. |
| • | Homeowner Insurance.The homeowner insurance products we distribute are primarily home mortgage-based insurance policies. Home mortgage-based policies cover damage to mortgaged property caused by a number of standard risks such as fire, flood and explosion. Some policies also provide mortgage repayment protection in the event the policyholder is unable to make mortgage payment due to death or injury. |
| • | Cargo Insurance.The cargo insurance products we distribute cover damage to or loss of goods in transit by sea, land or air. |
| • | Hull Insurance.The hull insurance products we distribute cover vessels against losses, liabilities and expenses caused by natural calamities, negligence of crew members and marine accidents, as well as collision liability. |
| • | Liability Insurance.The liability insurance products we distribute are primarily product liability and employer’s liability insurance products. These products generally cover losses to third parties due to the misconduct or negligence of the insured party, but exclude losses due to fraud or the willful misconduct of the insured party. |
| • | Construction Insurance.The construction insurance products we distribute cover property damages and personal injury losses caused by natural disasters and accidents in connection with construction projects in China. |
| • | Individual Whole Life Insurance.The individual whole life insurance products we distribute provide insurance for the insured person’s entire life in exchange for the periodic payment of fixed premiums over a pre-determined period, generally ranging from five to 20 years, or until the insured reaches a certain age. The face amount of the policy or, for some policies, the face amount plus accumulated interests is paid upon the death of the insured. |
| • | Individual Term Life Insurance.The individual term life insurance products we distribute provide insurance for the insured for a specified time period or until the attainment of a certain age, in return for the periodic payment of fixed premiums over a pre-determined period, generally ranging from five to 20 years. Term life insurance policies generally expire without value if the insured survives the coverage period. |
-31-
Table of Contents
| • | Individual Endowment Life Insurance.The individual endowment products we distribute generally provide maturity benefits if the insured reaches a specified age, and provide to a beneficiary designated by the insured guaranteed benefits upon the death of the insured within the coverage period. In return, the insured makes periodic payment of premiums over a pre-determined period, generally ranging from five to 25 years. |
| • | Individual Education Annuity.The individual annuity products we distribute are primarily education related products. They provide annual benefit payments after the insured attains a certain age, e.g., 18, for a fixed time period, or e.g., four years, and a lump payment at the end of the coverage period. In addition, the beneficiary designated in the annuity contract will receive guaranteed benefits upon the death of the insured during the coverage period. In return, the purchaser of the annuity products makes periodic payment of premiums during a pre-determined accumulation period. |
| • | Universal Insurance.We distribute certain universal insurance products that provide not only insurance coverage but also a minimum guaranteed return on the amount the insured puts into an individual investment account. In return the insured makes periodic payment of premiums over a pre-determined period. |
| • | Individual Health Insurance.The individual health insurance products we distribute primarily consist of dread disease insurance products, which provide guaranteed benefits for specified dread diseases during the coverage period. In return, the insured makes periodic payment of premiums over a pre-determined period. |
| • | Group Life Insurance.We distribute several group life insurance products, including group health insurance. These group products generally have a policy period of one year and require a single premium payment. |
| • | Pre-underwriting Survey.Before an insurance policy is sold, we conduct a survey of the item to be insured to assess its current value and help our clients determine the insurable value and the amount to be insured. We also help our clients assess the underwriting risk with respect to the item to be insured through survey, appraisal and analysis. |
| • | Claims Adjusting.When an accident involving the insured subject matter has occurred, we conduct onsite survey to determine the cause of the accident and assess damage. We then determine the extent of the loss to the insured subject matter and prepare and submit a report to the insurance company summarizing our preliminary findings. Upon final conclusion of the case, we prepare and submit a detailed report to the insurance company setting forth details of the accident, cause of the loss, details of the loss, adjustment and determination of loss, indemnity proposal and, where appropriate, request for payment. |
-32-
Table of Contents
| • | Disposal of Residual Value.In the course of providing claims adjusting services, we also can appraise the residual value of the insured property and offer suggestions on the disposal of such property. Upon appointment by the insurance company, we can handle the actual disposal of the insured property through auction, discounted sale, lease or other means. |
| • | Loading and Unloading Supervision.Upon appointment by ship owners, shippers, consignees or insurance companies, we can monitor and record the loading and unloading processes of specific cargos. |
| • | Consulting Services.We provide consulting services to both the insured and the insurance companies on risk assessment and management, disaster and damage prevention, investigation, and loss assessment. |
-33-
Table of Contents
| • | Standardized operating procedures; |
| • | A Core Business System, which encompasses our property and casualty insurance unit, life insurance unit, and claims adjusting unit, that will better support business operations and facilitate risk control; |
| • | A centralized and computerized accounting and financial management system; |
| • | A human resources management system; |
| • | An office automation system; |
| • | An e-learning system to provide online training to sales agents; and |
| • | A nationwide IT network and data center to support front-office operations. |
-34-
Table of Contents
| Number of | ||||||||||||||||
| Number of Sales and | In-house Sales | Number of Sales | Number of In-house | |||||||||||||
| Province | Service Outlets(1) | Representatives | Agents(1) | Adjustors | ||||||||||||
| Guangdong | 115 | 114 | 8,325 | 689 | ||||||||||||
| Hebei | 123 | — | 7,928 | 102 | ||||||||||||
| Shandong | 28 | — | 7,895 | 11 | ||||||||||||
| Sichuan | 61 | — | 4,750 | 94 | ||||||||||||
| Beijing | 17 | 10 | 3,311 | 8 | ||||||||||||
| Hunan | 14 | — | 2,915 | 10 | ||||||||||||
| Fujian | 32 | — | 2,301 | 5 | ||||||||||||
| Henan | 15 | — | 2,105 | 7 | ||||||||||||
| Zhejiang | 30 | — | 1,541 | 41 | ||||||||||||
| Liaoning | 33 | — | 1,393 | 74 | ||||||||||||
| Jiangsu | 12 | — | 1,127 | 28 | ||||||||||||
| Jiangxi | 11 | — | 657 | 5 | ||||||||||||
| Hubei | 12 | — | 607 | 14 | ||||||||||||
| Tianjin | 4 | — | 424 | 18 | ||||||||||||
| Jilin | 2 | — | 356 | — | ||||||||||||
| Shanghai | 10 | — | 279 | 162 | ||||||||||||
| Yunnan | 4 | — | — | 47 | ||||||||||||
| Shaanxi | 1 | — | — | 9 | ||||||||||||
| Hainan | 2 | — | — | 12 | ||||||||||||
| Guangxi | 2 | — | — | 8 | ||||||||||||
| Anhui | 2 | — | — | 8 | ||||||||||||
| Chongqing | 1 | — | — | 1 | ||||||||||||
| Guizhou | 2 | — | — | 14 | ||||||||||||
Total | 533 | 124 | 45,914 | 1,367 | ||||||||||||
| (1) | Excludes 124 sales outlets and 6,412 sales agents of Datong as of the date of disposal on March 25, 2011. |
-35-
Table of Contents
| • | Professional insurance intermediaries.The professional insurance intermediary sector in China is at an early stage of development and highly fragmented, accounting for only 5.8% of the total insurance premiums generated in China in 2010. Several insurance intermediary companies have received private equity or venture capital funding in recent years and are actively pursuing expansion, including China Zhonghe Ltd. and HuaKang Financial Service Inc. We believe that we can compete effectively with these insurance intermediary companies because we have a longer operational history and over the years have assembled a strong and stable team of managers and sales professionals and built a unified operating platform. With increasing consolidation expected in the insurance intermediary sector in the coming years, we expect competition within this sector to intensify. |
| • | Insurance companies.The distribution of individual life insurance products in China historically has been dominated by insurance companies, which usually use both in-house sales force and exclusive sales agents to distribute their own products. We believe that we can compete effectively with insurance companies because we focus only on distribution and offer our customers a broad range of insurance products underwritten by multiple insurance companies. |
| • | Entities that offer insurance products online.In recent years, domestic insurance companies, portal websites and professional insurance intermediaries have begun providing online shopping experience for consumers interested in purchasing insurance products. However, each of their insurance e-commerce operations has its own limitations. The insurance products offered on an insurance company’s website are usually confined to those under its own brand. Most portal websites provide separate product information with little comparison function and none of the professional insurance intermediaries that organize online product distribution has a nation-wide sales and service network to support after-sale service. We believe we can compete effectively with these business entities because our e-commerce insurance platform offers a broad range of insurance products underwritten by multiple insurance companies, price comparison for similar products and good after-sale services that are backed by our call center and nation-wide service network. |
| • | Other business entities.In recent years, business entities that distribute insurance products as an ancillary business, primarily commercial banks and postal offices, have been playing an increasingly important role in the distribution of insurance products, especially life insurance products. However, the insurance products distributed by these entities are usually confined to those related to their main lines of business, such as investment-related life insurance products. We believe that we can compete effectively with these business entities because we offer our customers a broader variety of products. |
-36-
Table of Contents
| • | Licensing of insurance companies and insurance intermediaries, such as agencies and brokerages. The 1995 Insurance Law established requirements for minimum registered capital levels, form of organization, qualification of senior management and adequacy of the information systems for insurance companies and insurance agencies and brokerages. |
| • | Separation of property and casualty insurance businesses and life insurance businesses. The 1995 Insurance Law classified insurance between property, casualty, liability and credit insurance businesses, on the one hand, and life, accident and health insurance businesses on the other, and prohibited insurance companies from engaging in both types of businesses. |
| • | Regulation of market conduct by participants. The 1995 Insurance Law prohibited fraudulent and other unlawful conduct by insurance companies, agencies and brokerages. |
| • | Substantive regulation of insurance products. The 1995 Insurance Law gave insurance regulators the authority to approve the policy terms and premium rates for certain insurance products. |
| • | Financial condition and performance of insurance companies. The 1995 Insurance Law established reserve and solvency standards for insurance companies, imposed restrictions on investment powers and established mandatory reinsurance requirements, and put in place a reporting regime to facilitate monitoring by insurance regulators. |
| • | Supervisory and enforcement powers of the principal regulatory authority. The principal regulatory authority, then the People’s Bank of China, was given broad powers under the 1995 Insurance Law to regulate the insurance industry. |
-37-
Table of Contents
| • | Authorizing the CIRC to be the insurance supervisory and regulatory body nationwide. The 2002 Insurance Law expressly grants the CIRC the authority to supervise and administer the insurance industry nationwide. |
| • | Expanding the permitted scope of business of property and casualty insurers. Under the 2002 Insurance Law, property and casualty insurance companies may engage in the short-term health insurance and accident insurance businesses upon the CIRC’s approval. |
| • | Providing additional guidelines for the relationship between insurance companies and insurance agents. The 2002 Insurance Law requires an insurance company to enter into an agent agreement with each insurance agent that will act as an agent for that insurance company. The agent agreement sets forth the rights and obligations of the parties to the agreement as well as other matters pursuant to law. An insurance company is responsible for the acts of its agents when the acts are within the scope authorized by the insurance company. |
| • | Relaxing restrictions on the use of funds by insurance companies. Under the 2002 Insurance Law, an insurance company may use its funds to make equity investments in insurance-related enterprises, such as asset management companies. |
| • | Allowing greater freedom for insurance companies to develop insurance products. The 2002 Insurance Law allowed insurance companies to set their own policy terms and premium rates, subject to the approval of, or a filing with, the CIRC. |
| • | Strengthening protection of the insured’s interests. The 2009 Insurance Law added a variety of clauses such as incontestable clause, abstained and estoppels clause, common disaster clause and amending immunity clause, claims-settlement prescription clause, reasons for claims rejection and contract modification clause. |
| • | Strengthening supervision on the qualification of the shareholders of the insurance companies and setting forth specific qualification requirements for the major shareholders, directors, supervisors and senior managers of insurance companies. |
| • | Expanding the business scope of insurers and further relaxing restriction on the use of fund by insurers. |
| • | Strengthening supervision on solvency of insurers with stricter measures. |
| • | Tightening regulations governing the administration of insurance intermediary companies, especially those relating to behaviors of insurance agents. |
-38-
Table of Contents
| • | promulgate regulations applicable to the Chinese insurance industry; |
| • | investigate insurance companies and insurance intermediaries; |
| • | establish investment regulations; |
| • | approve policy terms and premium rates for certain insurance products; |
| • | set the standards for measuring the financial soundness of insurance companies and insurance intermediaries; |
| • | require insurance companies and insurance intermediaries to submit reports concerning their business operations and condition of assets; |
| • | order the suspension of all or part of an insurance company or an insurance intermediary’s business; |
| • | approve the establishment, change and dissolution of an insurance company, an insurance intermediary or their branches; |
| • | review and approve the appointment of senior managers of an insurance company, an insurance intermediary or their branches; and |
| • | punish improper behaviors or misconducts of an insurance company or an insurance intermediary. |
| • | selling insurance products on behalf of the insurer principal; |
| • | collecting insurance premiums on behalf of the insurer principal; |
-39-
Table of Contents
| • | conducting loss surveys and handling claims of insurance businesses on behalf of the insurer principal; and |
| • | other business activities specified by the CIRC. |
| • | making insurance proposals, selecting insurance companies and handling the insurance application procedures for the insurance applicants; |
| • | assisting the insured or the beneficiary to claim compensation; |
| • | reinsurance brokering business; |
| • | providing consulting services to clients with respect to disaster and damage prevention, risk assessment and risk management; and |
| • | other business activities specified by the CIRC. |
-40-
Table of Contents
| • | inspecting, appraising the value of and assessing the risks of the subject matter before it is insured; |
| • | surveying, inspecting, estimating the loss of and adjusting the insured subject matter after loss has been incurred; |
| • | risk management consulting; and |
| • | other business activities approved by the CIRC. |
-41-
Table of Contents
| • | Foreign Currency Administration Rules (1996), as amended, or the Exchange Rules; and |
| • | Administration Rules of the Settlement, Sale and Payment of Foreign Exchange (1996), or the Administration Rules. |
-42-
Table of Contents
| • | Wholly Foreign-Owned Enterprise Law (1986), as amended; and |
| • | Wholly Foreign-Owned Enterprise Law Implementing Rules (1990), as amended. |
| • | the CSRC had jurisdiction over our initial public offering; |
| • | the CSRC had not issued any definitive rule or interpretation concerning whether offerings like our initial public offering are subject to the M&A Rule; and |
| • | despite the above, given that we had completed our inbound investment before September 8, 2006, the effective date of the M&A Rule, an application was not required under the M&A Rule to be submitted to the CSRC for its approval of the listing and trading of our ADSs on the Nasdaq Global Market, unless we are clearly required to do so by subsequent rules of the CSRC. |
-43-
Table of Contents
-44-
Table of Contents
| • | exercise effective control over Meidiya Investment, Yihe Investment, Xinbao Investment and their subsidiaries; |
| • | receive a substantial portion of the economic benefits of the subsidiaries of Meidiya Investment, Yihe Investment and Xinbao Investment in consideration for the services provided by our subsidiaries in China; and |
| • | have an exclusive option to purchase all or part of the equity interests in each of Meidiya Investment, Yihe Investment and Xinbao Investment when and to the extent permitted by PRC law. |
-45-
Table of Contents
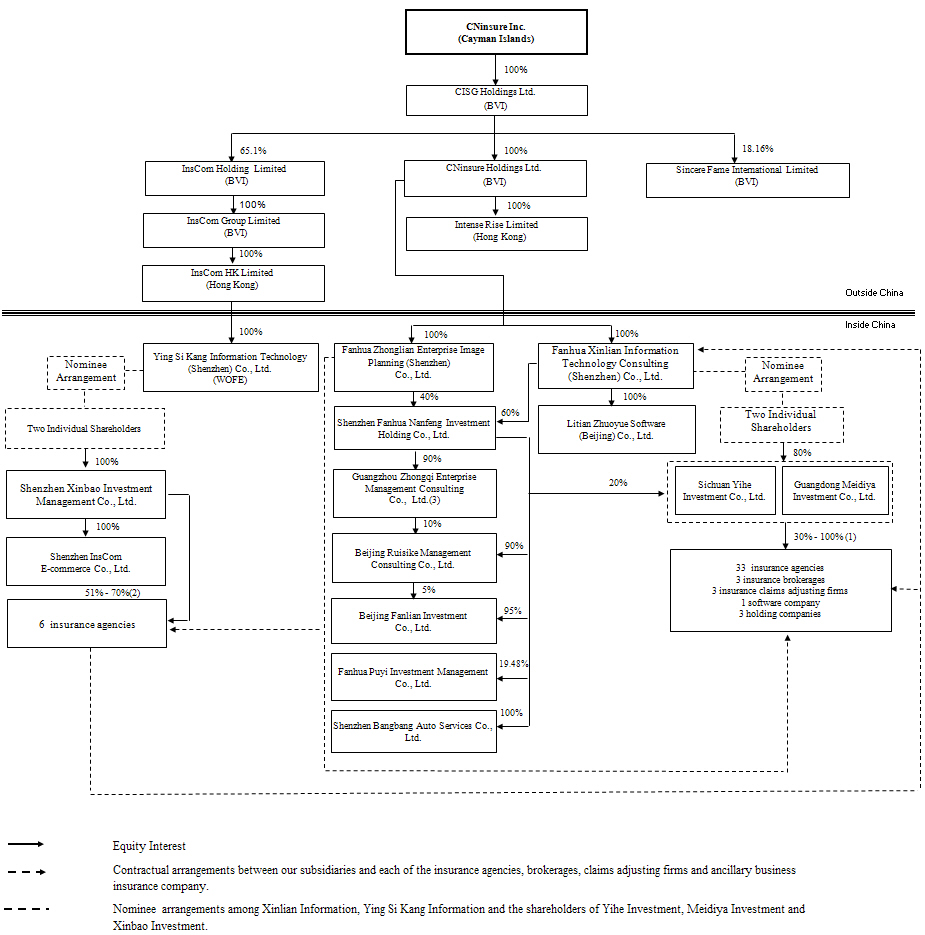
| (1) | Direct or indirect ownership attributable to Yihe Investment and Meidiya Investment. | |
| (2) | Direct or indirect ownership attributable to Xinbao Investment. | |
| (3) | The remaininig equity interest are held by one of our executive officers on behalf of our company. |
-46-
Table of Contents
| • | not transfer, pledge or otherwise dispose of or encumber his equity interests in Meidiya Investment without the prior written consent of Xinlian Information, except for equity pledge for the benefit of Xinlian Information. |
| • | not take any action without the prior written consent of Xinlian Information, if the action will have a material impact on the assets, business and liabilities of Meidiya Investment. |
| • | not vote for, or execute any resolutions to approve, the sale, transfer, mortgage, or disposal of, or the creation of any encumbrance on, any legal or beneficial interests in the equity of Meidiya Investment without the prior written consent of Xinlian Information, except to Xinlian Information or its designee. |
| • | not vote for, or execute any resolutions to approve, any merger or consolidation with any person, or any acquisition of or investment in any person by Meidiya Investment without the prior written consent of Xinlian Information. |
| • | vote to elect the directors candidates nominated by Xinlian Information. |
| • | cause Meidiya Investment not to supplement, amend or modify its articles of association in any manner, increase or decrease registered capital or change the capital structure in any way without the prior written consent of Xinlian Information. |
| • | cause Meidiya Investment not to execute any contract with a value exceeding RMB100,000 without the prior written consent of Xinlian Information, except in the ordinary course of business. |
-47-
Table of Contents
-48-
Table of Contents
-49-
Table of Contents
| • | the ownership structures of Meidiya Investment, Yihe Investment and Xinbao Investment, their subsidiaries and our subsidiaries in China comply with all existing PRC laws and regulations; |
| • | the contractual arrangements among our PRC subsidiaries, Meidiya Investment, Yihe Investment, Xinbao Investment, their individual shareholders and their subsidiaries governed by PRC law are valid, binding and enforceable, and will not result in any violation of PRC laws or regulations currently in effect; and |
| • | the business operations of our PRC subsidiaries, Meidiya Investment, Yihe Investment and Xinbao Investment and their subsidiaries comply in all material respects with existing PRC laws and regulations. |
-50-
Table of Contents
| • | the overall premium growth of the Chinese insurance industry; |
| • | the extent to which insurance companies in the PRC outsource the distribution of their products and claims adjusting functions; |
| • | premium rate levels and commission and fee rates; |
| • | the size and productivity of our sale force; |
| • | acquisitions; |
| • | commission rates for individual sales agents; |
| • | product and service mix; |
| • | share-based compensation expenses; |
| • | seasonality; and |
| • | fee-based revenue scheme. |
-51-
Table of Contents
-52-
Table of Contents
-53-
Table of Contents
| • | commissions and fees paid by insurance companies, which accounted for 99.9%, 99.9% and 99.96% of our net revenues for 2008, 2009 and 2010, respectively; and |
| • | other service fees, which refers to fees paid by insurance companies for certain insurance-related services provided by us to the insured on behalf of the insurance companies and accounted for 0.1%, 0.1% and 0.04% of our net revenues for 2008, 2009, and 2010, respectively. |
| Year Ended December 31, | ||||||||||||||||||||||||||||
| 2008 | 2009 | 2010 | ||||||||||||||||||||||||||
| RMB | % | RMB | % | RMB | US$ | % | ||||||||||||||||||||||
| (in thousands except percentages) | ||||||||||||||||||||||||||||
| Property and casualty insurance products | 634,385 | 75.1 | 783,220 | 67.8 | 821,259 | 124,433 | 55.3 | |||||||||||||||||||||
| Life insurance products | 120,565 | 14.3 | 230,961 | 20.0 | 486,676 | 73,739 | 32.8 | |||||||||||||||||||||
| Claims adjusting services | 89,012 | 10.6 | 140,670 | 12.2 | 177,094 | 26,832 | 11.9 | |||||||||||||||||||||
| Total net revenues | 843,962 | 100.0 | 1,154,851 | 100.0 | 1,485,029 | 225,004 | 100.0 | |||||||||||||||||||||
-54-
Table of Contents
-55-
Table of Contents
| Year Ended December 31, | ||||||||||||||||||||||||||||
| 2008 | 2009 | 2010 | ||||||||||||||||||||||||||
| RMB | % | RMB | % | RMB | US$ | % | ||||||||||||||||||||||
| (in thousands except percentages) | ||||||||||||||||||||||||||||
| Total net revenues | 843,962 | 100.0 | 1,154,851 | 100.0 | 1,485,029 | 225,004 | 100.0 | |||||||||||||||||||||
| Operating costs and expenses: | ||||||||||||||||||||||||||||
| Commissions and fees | (436,803 | ) | (51.8 | ) | (579,911 | ) | (50.2 | ) | (708,403 | ) | (107,333 | ) | (47.7 | ) | ||||||||||||||
| Selling expenses | (17,328 | ) | (2.1 | ) | (49,498 | ) | (4.3 | ) | (73,567 | ) | (11,147 | ) | (4.9 | ) | ||||||||||||||
| General and administrative expenses | (180,031 | ) | (21.3 | ) | (199,246 | ) | (17.3 | ) | (271,444 | ) | (41,128 | ) | (18.3 | ) | ||||||||||||||
| Total operating costs and expenses | (634,162 | ) | (75.2 | ) | (828,655 | ) | (71.8 | ) | (1,053,414 | ) | (159,608 | ) | (70.9 | ) | ||||||||||||||
| • | Salaries for employees who work in back office below the provincial management level and employment benefits for our in-house sales staff; |
| • | office rental, telecommunications expenses and office supply expenses incurred in connection with sales activities; and |
| • | advertising and marketing expenses. |
| • | salaries and benefits for our administrative staff; |
| • | share-based compensation expenses for managerial and administrative staff; |
| • | professional fees paid for valuation, market research, legal and auditing services; |
| • | compliance-related expenses, including expenses for professional services; |
| • | depreciations and amortizations; |
-56-
Table of Contents
| • | office rental expenses; |
| • | travel and telecommunications expenses; |
| • | entertainment expenses; |
| • | office supply expenses for our administrative staff; |
| • | foreign exchange loss; and |
| • | impairment loss. |
| For the Year Ended December 31, | ||||||||||||||||||||||||||||
| 2008 | 2009 | 2010 | ||||||||||||||||||||||||||
| RMB | % | RMB | % | RMB | US$ | % | ||||||||||||||||||||||
| (in thousands except percentages) | ||||||||||||||||||||||||||||
| General and administrative expenses | 180,031 | 100.0 | 199,246 | 100.0 | 271,444 | 41,128 | 100.0 | |||||||||||||||||||||
| Share-based compensation expenses | 45,659 | 25.4 | 7,553 | 3.8 | 22,211 | 3,365 | 8.2 | |||||||||||||||||||||
-57-
Table of Contents
-58-
Table of Contents
-59-
Table of Contents
-60-
Table of Contents
-61-
Table of Contents
| For the Year Ended December 31, | ||||||||||||||||||||||||
| 2008 to 2009 | 2009 to 2010 | |||||||||||||||||||||||
| Percentage | Percentage | |||||||||||||||||||||||
| 2008 | Change | 2009 | Change | 2010 | ||||||||||||||||||||
| RMB | % | RMB | % | RMB | US$ | |||||||||||||||||||
| (in thousands except percentages) | ||||||||||||||||||||||||
Consolidated Statement of Operations Data | ||||||||||||||||||||||||
Net revenues: | ||||||||||||||||||||||||
| Commissions and fees | 843,107 | 36.9 | 1,154,090 | 28.6 | 1,484,389 | 224,907 | ||||||||||||||||||
| Other service fees | 855 | (11.0 | ) | 761 | (15.9 | ) | 640 | 97 | ||||||||||||||||
Total net revenues | 843,962 | 36.8 | 1,154,851 | 28.6 | 1,485,029 | 225,004 | ||||||||||||||||||
Operating costs and expenses: | ||||||||||||||||||||||||
| Commissions and fees | (436,803 | ) | 32.8 | (579,911 | ) | 22.2 | (708,403 | ) | (107,333 | ) | ||||||||||||||
| Selling expenses | (17,328 | ) | 185.7 | (49,498 | ) | 48.6 | (73,567 | ) | (11,147 | ) | ||||||||||||||
| General and administrative expenses | (180,031 | ) | 10.7 | (199,246 | ) | 36.2 | (271,444 | ) | (41,128 | ) | ||||||||||||||
| Total operating costs and expenses | (634,162 | ) | 30.7 | (828,655 | ) | 27.1 | (1,053,414 | ) | (159,608 | ) | ||||||||||||||
Income from operations | 209,800 | 55.5 | 326,196 | 32.3 | 431,615 | 65,396 | ||||||||||||||||||
Other income (expense), net: | ||||||||||||||||||||||||
| Gain on disposal of investment in a subsidiary | 525 | * | — | * | — | — | ||||||||||||||||||
| Investment income | — | * | 18,905 | 118.2 | 41,244 | 6,249 | ||||||||||||||||||
| Interest income | 47,967 | (30.6 | ) | 33,299 | (19.1 | ) | 26,924 | 4,080 | ||||||||||||||||
| Interest expense | (95 | ) | (95.8 | ) | (4 | ) | 25.0 | (5 | ) | (1 | ) | |||||||||||||
| Others, net | (28 | ) | 5,128.6 | 1,408 | (72.2 | ) | 391 | 59 | ||||||||||||||||
| Changes in fair value of contingent consideration payables | — | * | (5,946 | ) | (100.0 | ) | — | — | ||||||||||||||||
Net income before income taxes and income of affiliates | 258,169 | 44.8 | 373,858 | 33.8 | 500,169 | 75,783 | ||||||||||||||||||
| Income tax expense | (62,438 | ) | 53.1 | (95,618 | ) | 1.2 | (96,743 | ) | (14,658 | ) | ||||||||||||||
| Share of income of affiliates | 135 | 473.3 | 774 | 1,567.18 | 12,904 | 1,955 | ||||||||||||||||||
Net income | 195,866 | 42.5 | 279,014 | 49.22 | 416,330 | 63,080 | ||||||||||||||||||
| Less: Net income (loss) attributable to the noncontrolling interests | 4,129 | (628.6 | ) | (21,827 | ) | (72.6 | ) | (5,978 | ) | (906 | ) | |||||||||||||
Net income attributable to the CNinsure Inc.’s shareholders | 191,737 | 56.9 | 300,841 | 40.4 | 422,308 | 63,986 | ||||||||||||||||||
| * | Not meaningful for analysis because the percentage change is mathematically undeterminable or involves a change from income or benefit to loss or expense, or vice versa. |
| • | a 4.9% increase from RMB783.2 million in 2009 to RMB821.3 million (US$124.4 million) in 2010 in commissions and fees and other service fees derived from the distributions of property and casualty insurance products; |
| • | a 110.7% increase from RMB231.0 million in 2009 to RMB486.7 million (US$73.7 million) in 2010 in commissions and fees derived from the distributions of life insurance products; and |
| • | a 25.9% increase from RMB140.7 million in 2009 to RMB177.1 million (US$26.8 million) in 2010 in commissions and fees derived from the provision of claims adjusting services. |
-62-
Table of Contents
| • | an increase of 59.5% in depreciation of fixed assets from RMB14.1 million in 2009 to RMB22.4 million (US$3.4 million) in 2010, largely as a result of operating the upgraded IT system in more affiliated entities in 2010; |
| • | an increase of 122.9% in amortization of intangible assets from RMB9.7 million in 2009 to RMB21.5 million (US$3.3 million) in 2010, largely as a result of the acquisitions we made in 2010; |
| • | a recognition of RMB4.6 million (US$0.7 million) impairment loss in respect of intangible assets for the fourth quarter of 2010; and |
| • | an increase of 194.0% in share-based compensation expenses from RMB7.6 million in 2009 to RMB22.2 million (US$3.4 million) in 2010, associated with the grant of options to various directors, officers and employees in February 2010. |
-63-
Table of Contents
| • | a 23.5% increase from RMB634.4 million in 2008 to RMB783.2 million in 2009 in commissions and fees and other service fees derived from the distributions of property and casualty insurance products; |
| • | a 91.6% increase from RMB120.6 million in 2008 to RMB231.0 million in 2009 in commissions and fees derived from the distributions of life insurance products; and |
| • | a 58.0% increase from RMB89.0 million in 2008 to RMB140.7 million in 2009 in commissions and fees derived from the provision of claims adjusting services. |
| • | an increase in depreciation of fixed assets due to the installation and operation of our upgraded IT system in more affiliated entities in 2009; |
| • | an increase in headcount, primarily as a result of the recruitment of more senior managers, and an increase in base salaries for the managerial and administrative staff; |
| • | an increase in amortization of intangible assets as a result of the acquisitions we made in 2008 and 2009; and |
| • | an increase in office rental expenses and expenses incurred by newly acquired entities as well as the expansion of our distribution and service network. |
-64-
Table of Contents
| • | property and casualty insurance segment, which refers to entities that have been primarily engaged in the distribution of property and casualty insurance products; |
| • | life insurance segment, which refers to entities that have been primarily engaged in the distribution of life insurance products; |
| • | claims adjusting segment, which refers to our claims adjusting firms that are engaged in claims adjusting services such as pre-underwriting survey, claims adjusting, disposal of residual value, loading and unloading supervision and consulting services; and |
| • | Datong segment, which refers to Datong and entities under its control, which are primarily engaged in the distribution of life insurance products. |
-65-
Table of Contents
| Year Ended December 31, | ||||||||||||||||||||||||
| 2008 to 2009 | 2009 to 2010 | |||||||||||||||||||||||
| Percentage | Percentage | |||||||||||||||||||||||
| 2008 | Change | 2009 | Change | 2010 | ||||||||||||||||||||
| RMB | % | RMB | % | RMB | US$ | |||||||||||||||||||
| (in thousands except percentages) | ||||||||||||||||||||||||
Net revenues: | ||||||||||||||||||||||||
| Property and casualty | 599,353 | 30.7 | 783,220 | 4.9 | 821,259 | 124,433 | ||||||||||||||||||
| Life | 154,174 | 15.3 | 177,713 | 32.6 | 235,584 | 35,695 | ||||||||||||||||||
| Claims adjusting | 89,012 | 58.0 | 140,670 | 25.9 | 177,094 | 26,832 | ||||||||||||||||||
| Datong | 1,423 | 3,642.0 | 53,248 | 371.6 | 251,092 | 38,044 | ||||||||||||||||||
Total net revenues | 843,962 | 36.8 | 1,154,851 | 28.6 | 1,485,029 | 225,004 | ||||||||||||||||||
Operating costs and expenses: | ||||||||||||||||||||||||
| Property and casualty | (319,776 | ) | 27.8 | (408,643 | ) | (4.7 | ) | (389,266 | ) | (58,980 | ) | |||||||||||||
| Life | (127,634 | ) | 24.4 | (158,804 | ) | 22.5 | (194,612 | ) | (29,487 | ) | ||||||||||||||
| Claims adjusting | (70,961 | ) | 71.6 | (121,753 | ) | 28.8 | (156,825 | ) | (23,761 | ) | ||||||||||||||
| Datong | (5,837 | ) | 1,138.3 | (72,281 | ) | 196.1 | (214,001 | ) | (32,424 | ) | ||||||||||||||
| Other | (109,954 | ) | (38.9 | ) | (67,174 | ) | 47.0 | (98,710 | ) | (14,956 | ) | |||||||||||||
Total operating costs and expenses | (634,162 | ) | 30.7 | (828,655 | ) | 27.1 | (1,053,414 | ) | (159,608 | ) | ||||||||||||||
Income (Loss) from operations: | ||||||||||||||||||||||||
| Property and casualty | 279,577 | 34.0 | 374,577 | 15.3 | 431,993 | 65,453 | ||||||||||||||||||
| Life | 26,540 | (28.8 | ) | 18,909 | 116.7 | 40,972 | 6,208 | |||||||||||||||||
| Claims adjusting | 18,051 | 4.8 | 18,917 | 7.1 | 20,269 | 3,071 | ||||||||||||||||||
| Datong | (4,414 | ) | 331.2 | (19,033 | ) | 294.9 | 37,091 | 5,620 | ||||||||||||||||
| Other | (109,954 | ) | (38.9 | ) | (67,174 | ) | 46.9 | (98,710 | ) | (14,956 | ) | |||||||||||||
Total income from operations | 209,800 | 55.5 | 326,196 | 32.3 | 431,615 | 65,396 | ||||||||||||||||||
-66-
Table of Contents
-67-
Table of Contents
-68-
Table of Contents
| Year Ended December 31, | ||||||||||||||||
| 2008 | 2009 | 2010 | ||||||||||||||
| RMB | RMB | RMB | US$ | |||||||||||||
| (in thousands) | ||||||||||||||||
| Net cash generated from operating activities | 254,619 | 259,599 | 366,665 | 55,554 | ||||||||||||
| Net cash used in investing activities | (252,920 | ) | (256,243 | ) | (400,021 | ) | (60,609 | ) | ||||||||
| Net cash generated from (used in) financing activities | 16,576 | (57,166 | ) | 511,168 | 77,450 | |||||||||||
| Net increase (decrease) in cash and cash equivalents | 18,275 | (53,810 | ) | 477,812 | 72,395 | |||||||||||
| Cash and cash equivalents at the beginning of the year | 1,544,817 | 1,510,432 | 1,457,890 | 220,892 | ||||||||||||
| Cash and cash equivalents at the end of the year | 1,510,432 | 1,457,890 | 1,924,884 | 291,649 | ||||||||||||
-69-
Table of Contents
-70-
Table of Contents
-71-
Table of Contents
| Payment Due by Period | ||||||||||||||||||||
| Less than | More than | |||||||||||||||||||
| Total | 1 year | 1-3 years | 3-5 years | 5 years | ||||||||||||||||
| (in thousands of RMB) | ||||||||||||||||||||
| Operating lease obligations | 36,138 | 21,251 | 14,333 | 554 | — | |||||||||||||||
Purchase obligations(1) | 365 | 365 | — | — | — | |||||||||||||||
| Total | 36,503 | 21,616 | 14,333 | 554 | — | |||||||||||||||
| (1) | Represents payment commitment in connection with the construction of our Core Business System and ERP-based financial and accounting system. |
| Directors and Executive Officers | Age | Position/Title | ||||
| Yinan Hu | 45 | Chairman and Chief Executive Officer | ||||
| Qiuping Lai | 57 | President and Director | ||||
| Peng Ge | 40 | Chief Financial Officer | ||||
| Chunlin Wang | 41 | Vice President, Chief Operating Officer and Head of the Property and Casualty Insurance Unit | ||||
| Feng Jin | 45 | Vice President, Chief Information Officer and Head of the Life Insurance Unit | ||||
| Shangzhi Wu | 60 | Director | ||||
| Yongwei Ma | 68 | Independent Director | ||||
| Stephen Markscheid | 57 | Independent Director | ||||
| Allen Warren Lueth | 42 | Independent Director | ||||
| Mengbo Yin | 55 | Independent Director | ||||
-72-
Table of Contents
-73-
Table of Contents
-74-
Table of Contents
| • | options to purchase our ordinary shares; |
| • | restricted shares, which represent non-transferable ordinary shares, that may be subject to forfeiture, restrictions on transferability and other restrictions; and |
| • | restricted share units, which represent the right to receive our ordinary shares at a specified date in the future, which may be subject to forfeiture. |
-75-
Table of Contents
-76-
Table of Contents
| Ordinary Shares | |||||||||||||||
| Underlying | Exercise Price (Per | ||||||||||||||
| Name | Outstanding Options | Share) | Grant Date | Expiration Date | |||||||||||
| Yinan Hu | 2,600,000 | US$ | 0.7340 | April 28, 2011 | March 31, 2017 | ||||||||||
| 1,800,000 | US$ | 0.8395 | February 08, 2010 | March 31, 2016 | |||||||||||
| 4,500,000 | US$ | 0.2780 | November 21, 2008 | March 31, 2015 | |||||||||||
| Qiuping Lai | 1,500,000 | US$ | 0.7340 | April 28, 2011 | March 31, 2017 | ||||||||||
| 1,200,000 | US$ | 0.8395 | February 08, 2010 | March 31, 2016 | |||||||||||
| 3,400,000 | US$ | 0.2780 | November 21, 2008 | March 31, 2015 | |||||||||||
| Peng Ge | 1,500,000 | US$ | 0.7340 | April 28, 2011 | March 31, 2017 | ||||||||||
| 1,200,000 | US$ | 0.8395 | February 08, 2010 | March 31, 2016 | |||||||||||
| 3,350,000 | US$ | 0.2780 | November 21, 2008 | March 31, 2015 | |||||||||||
| Chunlin Wang | 1,000,000 | US$ | 0.7340 | April 28, 2011 | March 31, 2017 | ||||||||||
| 900,000 | US$ | 0.8395 | February 08, 2010 | March 31, 2016 | |||||||||||
| 2,050,000 | US$ | 0.2780 | November 21, 2008 | March 31, 2015 | |||||||||||
| Feng Jin | 1,000,000 | US$ | 0.7340 | April 28, 2011 | March 31, 2017 | ||||||||||
| 900,000 | US$ | 0.8395 | February 08, 2010 | March 31, 2016 | |||||||||||
| 1,435,000 | US$ | 0.2780 | November 21, 2008 | March 31, 2015 | |||||||||||
| Yongwei Ma | 400,000 | US$ | 0.2780 | November 21, 2008 | March 31, 2015 | ||||||||||
| Mengbo Yin | 400,000 | US$ | 0.7340 | April 28, 2011 | March 31, 2017 | ||||||||||
| 400,000 | US$ | 0.8395 | February 08, 2010 | March 31, 2016 | |||||||||||
| 400,000 | US$ | 0.2780 | November 21, 2008 | March 31, 2015 | |||||||||||
| Stephen Markscheid | 400,000 | US$ | 0.7340 | April 28, 2011 | March 31, 2017 | ||||||||||
| 400,000 | US$ | 0.8395 | February 08, 2010 | March 31, 2016 | |||||||||||
| 600,000 | US$ | 0.2780 | November 21, 2008 | March 31, 2015 | |||||||||||
| Allen Warren Lueth | 400,000 | US$ | 0.7340 | April 28, 2011 | March 31, 2017 | ||||||||||
| 400,000 | US$ | 0.8395 | February 08, 2010 | March 31, 2016 | |||||||||||
| 600,000 | US$ | 0.2780 | November 21, 2008 | March 31, 2015 | |||||||||||
| Other individuals as a group | 19,600,000 | US$ | 0.7340 | April 28, 2011 | March 31, 2017 | ||||||||||
| 21,796,150 | (1) | US$ | 0.8395 | February 08, 2010 | March 31, 2016 | ||||||||||
| 8,248,470 | US$ | 0.3360 | March 09, 2009 | March 31, 2015 | |||||||||||
| 12,342,840 | (2) | US$ | 0.2780 | November 21, 2008 | March 31, 2015 | ||||||||||
| 652,631 | (3) | RMB | 2.3214 | February 03, 2007 | February 1, 2017 | ||||||||||
| (1) | Including 1,500,000 options held by Mr. Chengbin Li, our former Vice President and head of our Life Insurance Unit. | |
| (2) | Including 1,365,000 options held by Mr. Chengbin Li, our former Vice President and head of our Life Insurance Unit. | |
| (3) | Remaining unexercised options held by Mr. David Tang, our former Chief Financial Officer. |
-77-
Table of Contents
| • | selecting the independent auditors and pre-approving all auditing and non-auditing services permitted to be performed by the independent auditors; |
| • | reviewing with the independent auditors any audit problems or difficulties and management’s response; |
| • | reviewing and approving all proposed related-party transactions; |
| • | discussing the annual audited financial statements with management and the independent auditors; |
| • | reviewing major issues as to the adequacy of our internal controls and any special audit steps adopted in light of material control deficiencies; |
| • | annually reviewing and reassessing the adequacy of our audit committee charter; |
| • | meeting separately and periodically with management, the independent auditors and the internal auditor; and |
| • | reporting regularly to the full board of directors. |
| • | reviewing and recommending to the board with respect to the total compensation package for our chief executive officer; |
| • | approving and overseeing the total compensation package for our executives other than the chief executive officer; |
| • | reviewing and making recommendations to the board with respect to the compensation of our directors; and |
| • | reviewing periodically and approving any long-term incentive compensation or equity plans, programs or similar arrangements, annual bonuses, employee pension and welfare benefit plans. |
-78-
Table of Contents
| • | identifying and recommending to the board nominees for election or re-election to the board, or for appointment to fill any vacancy; |
| • | reviewing annually with the board the current composition of the board in light of the characteristics of independence, skills, experience and availability of service to us; |
| • | identifying and recommending to the board the names of directors to serve as members of the audit committee and the compensation committee, as well as the corporate governance and nominating committee itself; |
| • | advising the board periodically with respect to significant developments in the law and practice of corporate governance, as well as our compliance with applicable laws and regulations, and making recommendations to the board on all matters of corporate governance and on any corrective action to be taken; and |
| • | monitoring compliance with our code of business conduct and ethics, including reviewing the adequacy and effectiveness of our procedures to ensure proper compliance. |
| Number of | ||||||||
| Employees | % of Total | |||||||
| Management and administrative staff | 2,454 | 54.3 | % | |||||
| Financial and accounting staff | 421 | 9.3 | % | |||||
| Sales and marketing staff | 145 | 3.2 | % | |||||
| Professional claims adjustors | 1,497 | 33.2 | % | |||||
| Total | 4,517 | 100.0 | % | |||||
-79-
Table of Contents
| E. | Share Ownership |
| • | each of our current directors and executive officers; and |
| • | each person known to us to own beneficially more than 5% of our shares. |
| Ordinary Shares Beneficially Owned(1) (2) | ||||||||
| Number | % | |||||||
Directors and Executive Officers: | ||||||||
Yinan Hu(3) | 185,297,368 | 18.4 | ||||||
Qiuping Lai(4) | 27,752,285 | 2.8 | ||||||
Peng Ge(5) | 9,675,925 | 1.0 | ||||||
| Feng Jin | * | * | ||||||
| Chunlin Wang | * | * | ||||||
Shangzhi Wu(6) | 124,688,540 | 12.4 | ||||||
| Yongwei Ma | * | * | ||||||
| Stephen Markscheid | * | * | ||||||
| Allen Warren Lueth | * | * | ||||||
| Mengbo Yin | * | * | ||||||
All Directors and Executive Officers as a Group(7) | 355,195,662 | 35.0 | ||||||
Principal Shareholders: | ||||||||
Kingsford Resources Limited(8) | 219,441,430 | 21.9 | ||||||
CDH Inservice Limited(9) | 124,688,540 | 12.4 | ||||||
FMR LLC(10) | 65,868,840 | 6.6 | ||||||
Norges Bank (the Central Bank of Norway)(11) | 52,700,000 | 5.3 | ||||||
| * | Less than 1% of our total outstanding ordinary shares. | |
| † | Except for Dr. Wu and Mr. Ma, the business address of our directors and executive officers is c/o 22/F, Yinhai Building, No. 299 Yanjiang Zhong Road, Guangzhou, Guangdong 510110, People’s Republic of China. |
-80-
Table of Contents
| (1) | The number of shares beneficially owned by each director and executive officer includes the shares beneficially owned by such person, the shares underlying all options held by such person that have vested or will vest within 60 days after April 8, 2011. The options were granted on November 21, 2008 and February 08, 2010 under the 2007 share incentive plan. | |
| (2) | Percentage of beneficial ownership of each director and executive officer is based on 1,003,270,326 ordinary shares outstanding as of April 8, 2011 and the number of ordinary shares underlying options held by such person that have vested or will vest within 60 days after April 8, 2011. | |
| (3) | Includes 170,226,375 ordinary shares, 9,258,840 ordinary shares in the form of ADSs of our company and 3,240,000 ordinary shares issuable upon exercise of options within 60 days after April 8, 2011 held by Mr. Hu. Mr. Hu holds approximately 87.6% of the total outstanding shares of High Rank Investments Limited, or High Rank Investments, a company incorporated in the British Virgin Islands. High Rank Investments holds approximately 93.3% of the total outstanding shares of Kingsford Resources Limited, or Kingsford Resources, a company incorporated in the British Virgin Islands. Also includes 2,439,473 ordinary shares and 132,680 ordinary shares in the form of ADSs held by Ms. Hui Li, spouse of Mr. Hu. Ms. Li holds approximately 17.6% of the total outstanding shares of Better Rise Investments Limited, or Better Rise Investments, a company incorporated in the British Virgin Islands. Better Rise Investments owns approximately 6.7% of Kingsford Resources. Kingsford Resources holds 208,121,430 ordinary shares and 11,320,000 ordinary shares in the form of ADSs of our company. Mr. Hu disclaims beneficial ownership of all of our shares held by Kingsford Resources except to the extent of his pecuniary interest therein. | |
| (4) | Includes 24,044,465 ordinary shares, 1,307,820 ordinary shares in the form of ADSs and 2,400,000 ordinary shares issuable upon exercise of options held by Mr. Lai who holds approximately 12.4% of the total outstanding shares of High Rank Investments. High Rank Investments holds approximately 93.3% of the total outstanding shares of Kingsford Resources. Kingsford Resources holds 208,121,430 ordinary shares and 11,320,000 ordinary shares in the form of ADSs of our company. Mr. Lai disclaims beneficial ownership of all of our shares held by Kingsford Resources except to the extent of his pecuniary interest therein. | |
| (5) | Mr. Ge holds approximately 50.0% of the total outstanding shares of Better Rise Investments which owns approximately 6.7% of Kingsford Resources. Therefore, Mr. Ge may be deemed to beneficially own, indirectly through Better Rise Investments and Kingsford Resources, approximately 6,929,045 ordinary shares and 376,880 ordinary shares in the form of ADSs of our company. 2,370,000 ordinary shares held by Mr. Ge are issuable upon exercise of options within 60 days after April 8, 2011. Mr. Ge disclaims beneficial ownership of all of our shares held by Kingsford Resources except to the extent of his pecuniary interest therein. | |
| (6) | Includes 91,600,000 ordinary shares and 33,088,540 ordinary shares in the form of ADSs of our company held by CDH Inservice, a British Virgin Islands company. All of the issued and outstanding shares of CDH Inservice are owned by CDH China Growth Capital Fund II, L.P., or CDH Fund II, a Cayman Islands exempted limited partnership. CDH Growth Capital Holdings, a Cayman Islands exempted limited liability company, is the general partner of CDH Fund II and has the power to direct CDH Fund II as to the voting and disposition of shares directly and indirectly held by CDH Fund II. Dr. Wu is director, managing partner and member of the investment committee of CDH Growth Capital Holdings. Dr. Wu disclaims beneficial ownership of all of our shares held by CDH Inservice except to the extent of his pecuniary interest therein. The business address of Dr. Wu is c/o CDH China Growth Capital Holdings Company Limited, 1503 International Commerce Center, 1 Austin Road West, Kowloon, Hong Kong. | |
| (7) | Includes ordinary shares beneficially owned by all of our directors and executive officers as a group and ordinary shares underlying all options held by such persons that have vested or will vest within 60 days after April 8, 2011. | |
| (8) | Includes 208,121,430 ordinary shares and 11,320,000 ordinary shares in the form of ADSs of our company held by Kingsford Resources. Approximately 93.3% of the total outstanding shares of Kingsford Resources are held by High Rank Investments, which is 87.6% owned by Mr. Yinan Hu, our chairman and chief executive officer, and 12.4% owned by Mr. Qiuping Lai, our president. The remaining 6.7% of the total outstanding shares of Kingsford Resources are held by Better Rise Investments, which is owned by two of our executive officers, one former executive officer and Mr. Yinan Hu’s wife. The registered address of Kingsford Resources is Beaufort House, P.O. Box 438, Road Town, Tortola, British Virgin Islands. | |
| (9) | Includes 91,600,000 ordinary shares and 33,088,540 ordinary shares in the form of ADSs of our company held by CDH Inservice. All of the issued and outstanding shares of CDH Inservice are owned by CDH Fund II, a Cayman Islands exempted limited partnership. CDH Growth Capital Holdings, a Cayman Islands exempted limited liability company, is the general partner of CDH Fund II and has the power to direct CDH Fund II as to the voting and disposition of shares directly and indirectly held by CDH Fund II. The investment committee of CDH Growth Capital Holdings is comprised of Wu Shangzhi and two other individuals. Changes to the investment committee require the approval of the directors of CDH Growth Capital Holdings. The directors of CDH Growth Capital Holdings are nominated by the principal shareholders of CDH Growth Capital Holdings, being (i) an affiliate of Capital Z Partners, (ii) an affiliate of the Government of Singapore Investment Corporation, and (iii) China Diamond Holdings II, L.P., a British Virgin Islands limited partnership controlled by senior members of the CDH Fund II investment team. CDH Growth Capital Holdings disclaims beneficial ownership of all of our shares held by CDH Inservice except to the extent of its pecuniary interest therein. The registered address of CDH Inservice is c/o Maples Finance BVI Limited, P.O. Box 173, Kingston Chambers, Road Town, Tortola, British Virgin Islands. | |
| (10) | Represents 65,868,840 ordinary shares in the form of ADSs of our Company held by FMR LLC, as reported on Schedule 13G filed by FRM LLC on April 8, 2011. The percentage of beneficial ownership was calculated based on the total number of our ordinary shares outstanding as of April 8, 2011. The address of FMR LLC is 82 Devonshire Street, Boston, Massachusetts, USA. | |
| (11) | Represents 52,700,000 ordinary shares in the form of ADSs of our Company held by Norges Bank, as reported on Schedule 13G filed by Norges Bank on February 15, 2011. The percentage of beneficial ownership was calculated based on the total number of our ordinary shares outstanding as of April 8, 2011. The address of Norges Bank is Bankplassen 2, PO Box 1179 Sentrum, NO 0107 Oslo, Norway. |
-81-
Table of Contents
| Item 7. | Major Shareholders and Related Party Transactions |
| A. | Major Shareholders |
| B. | Related Party Transactions |
-82-
Table of Contents
| C. | Interests of Experts and Counsel |
| Item 8. | Financial Information |
| A. | Consolidated Statements and Other Financial Information |
-83-
Table of Contents
| B. | Significant Changes |
| Item 9. | The Offer and Listing |
| A. | Offer and Listing Details |
| Sales Price | ||||||||
| High | Low | |||||||
| US$ | US$ | |||||||
Annual High and Low | ||||||||
| 2007 (from October 31) | 28.74 | 12.00 | ||||||
| 2008 | 16.63 | 5.44 | ||||||
| 2009 | 24.74 | 6.26 | ||||||
| 2010 | 28.62 | 15.33 | ||||||
Quarterly Highs and Lows | ||||||||
| First Quarter of 2009 | 9.59 | 6.26 | ||||||
| Second Quarter of 2009 | 14.20 | 7.00 | ||||||
| Third Quarter of 2009 | 24.74 | 12.92 | ||||||
| Fourth Quarter of 2009 | 24.64 | 18.42 | ||||||
| First Quarter of 2010 | 27.46 | 16.49 | ||||||
| Second Quarter of 2010 | 28.62 | 20.25 | ||||||
| Third Quarter of 2010 | 27.67 | 20.13 | ||||||
| Fourth Quarter of 2010 | 26.74 | 15.33 | ||||||
| First Quarter of 2011 | 20.88 | 11.42 | ||||||
Monthly Highs and Lows | ||||||||
| November 2010 | 26.74 | 18.50 | ||||||
| December 2010 | 22.37 | 15.33 | ||||||
| January 2011 | 20.88 | 16.41 | ||||||
| February 2011 | 18.37 | 16.64 | ||||||
| March 2011 | 18.22 | 11.42 | ||||||
| April 2011 | 15.60 | 12.40 | ||||||
| May 2011 (through May 3) | 15.35 | 14.14 | ||||||
-84-
Table of Contents
| B. | Plan of Distribution |
| C. | Markets |
| D. | Selling Shareholders |
| E. | Dilution |
| F. | Expenses of the Issue |
| Item 10. | Additional Information |
| A. | Share Capital |
| B. | Memorandum and Articles of Association |
-85-
Table of Contents
-86-
Table of Contents
| C. | Material Contracts |
| D. | Exchange Controls |
| E. | Taxation |
-87-
Table of Contents
| • | banks and other financial institutions; |
| • | insurance companies; |
| • | broker-dealers; |
| • | traders that elect to use a mark-to-market method of accounting; |
| • | tax-exempt entities; |
| • | persons liable for alternative minimum tax; |
| • | U.S. expatriates; |
| • | regulated investment companies or real estate investment trusts; |
| • | persons holding an ADS or ordinary share as part of a straddle, hedging, conversion or integrated transaction; |
| • | persons who acquired ADSs or ordinary shares pursuant to the exercise of any employee stock options or otherwise as compensation; |
| • | persons that actually or constructively own 10% or more of the total combined voting power of all classes of our voting stock; or |
| • | partnerships or other pass-through entities, or persons holding ADSs or ordinary shares through such entities. |
-88-
Table of Contents
| • | an individual who is a citizen or resident of the United States; |
| • | a corporation (or other entity treated as a corporation for U.S. federal income tax purposes) organized under the laws of the United States, any state thereof or the District of Columbia; |
| • | an estate, the income of which is subject to U.S. federal income taxation regardless of its source; or |
| • | a trust that (i) is subject to the primary supervision of a court within the United States and the control of one or more U.S. persons for all substantial decisions; or (ii) has a valid election in effect under applicable U.S. Treasury regulations to be treated as a U.S. person. |
-89-
Table of Contents
| • | at least 75% of its gross income for such year is passive income; or |
| • | at least 50% of the value of its assets (based on an average of the quarterly values of the assets) during such year is attributable to assets that produce passive income or are held for the production of passive income (the “asset test”). |
-90-
Table of Contents
| • | the excess distribution or recognized gain will be allocated ratably over your holding period for the ADSs or ordinary shares; |
| • | the amount allocated to the current taxable year, and any taxable years in your holding period prior to the first taxable year in which we were a PFIC, will be treated as ordinary income; and |
| • | the amount allocated to each other year will be subject to the highest tax rate in effect for individuals or corporations, as applicable, for each such year, and the interest charge generally applicable to underpayments of tax will be imposed on the resulting tax attributable to each such year. |
-91-
Table of Contents
| F. | Dividends and Paying Agents |
| G. | Statement by Experts |
| H. | Documents on Display |
-92-
Table of Contents
| I. | Subsidiary Information |
| Item 11. | Quantitative and Qualitative Disclosures about Market Risk |
| Item 12. | Description of Securities Other than Equity Securities |
| A. | Debt Securities |
| B. | Warrants and Rights |
| C. | Other Securities |
-93-
Table of Contents
| D. | American Depositary Shares |
| Category | Depositary Actions | Associated Fees | ||
| (a) Depositing or substituting the underlying shares | Each person to whom ADRs are issued against deposits of shares, including deposits and issuances in respect of: • Share distributions, stock split, rights, merger | US$5.00 for each 100 ADSs (or portion thereof) evidenced by the new ADRs delivered | ||
• Exchange of securities or any other transaction or event or other distribution affecting the ADSs or the Deposited Securities | ||||
| (b) Receiving or distributing dividends | Distribution of dividends | US$0.02 or less per ADS | ||
| (c) Selling or exercising rights | Distribution or sale of securities, the fee being in an amount equal to the fee for the execution and delivery of ADSs which would have been charged as a result of the deposit of such securities | US$5.00 for each 100 ADSs (or portion thereof) | ||
| (d) Withdrawing an underlying security | Acceptance of ADRs surrendered for withdrawal of deposited securities | US$5.00 for each 100 ADSs (or portion thereof) evidenced by the ADRs surrendered | ||
| (e) Transferring, splitting or grouping receipts | Transfers, combining or grouping of depositary receipts | US$1.50 per ADS | ||
| (f) General depositary services, particularly those charged on an annual basis. | • Other services performed by the depositary in administering the ADRs • Provide information about the depositary’s right, if any, to collect fees and charges by offsetting them against dividends received and deposited securities | US$0.02 per ADS (or portion thereof) not more than once each calendar year and payable at the sole discretion of the depositary by billing Holders or by deducting such charge from one or more cash dividends or other cash distributions | ||
| (g) Expenses of the depositary | Expenses incurred on behalf of Holders in connection with • Compliance with foreign exchange control regulations or any law or regulation relating to foreign investment • The depositary’s or its custodian’s compliance with applicable law, rule or regulation • Stock transfer or other taxes and other governmental charges • Cable, telex, facsimile transmission/delivery • Expenses of the depositary in connection with the conversion of foreign currency into U.S. dollars (which are paid out of such foreign currency) • Any other charge payable by depositary or its agents | Expenses payable at the sole discretion of the depositary by billing Holders or by deducting charges from one or more cash dividends or other cash distributions |
-94-
Table of Contents
| For the Year Ended December 31, | ||||||||
| 2009 | 2010 | |||||||
| (in thousands of US$) | ||||||||
Investor relations(1) | 296.4 | 243.7 | ||||||
| Directors and officers liability insurance | 103.6 | 96.9 | ||||||
| Legal fees incurred in connection with preparation of Form 20-F and ongoing SEC compliance and listing requirements | 55.6 | 172.5 | ||||||
Broker reimbursements(2) | 5.4 | — | ||||||
| Listing fees | — | 42.5 | ||||||
| Advertising and public relations | — | — | ||||||
| Consulting services fee in connection with SOX Compliance | — | 330.0 | ||||||
| Others | 3.2 | 42.7 | ||||||
| (1) | Includes expenses in relation with roadshows, press release distribution, maintenance of investor relations website and printing. | |
| (2) | Broker reimbursements are fees payable to proxy agents and other service providers for the distribution of proxy materials to beneficial ADR holders. |
| For the Year Ended December 31, | ||||||||
| 2009 | 2010 | |||||||
| (in thousands of US$) | ||||||||
| Third-party expenses paid indirectly | — | — | ||||||
| Fee waived | 255 | 255 | ||||||
| Item 13. | Defaults, Dividend Arrearages and Delinquencies |
| Item 14. | Material Modifications to the Rights of Security Holders and Use of Proceeds |
-95-
Table of Contents
| E. | Use of Proceeds |
| • | approximately US$3.0 million to fund establishment of new insurance intermediary companies; |
| • | approximately US$151.1 million to fund acquisitions; and |
| • | approximately US$9.6 million to construct our operating platform. |
| Item 15. | Controls and Procedures |
-96-
Table of Contents
Deloitte Touche Tohmatsu
Hong Kong
May 4, 2011
-97-
Table of Contents
| Item 16A. | Audit Committee Financial Expert |
| Item 16B. | Code of Ethics |
| Item 16C. | Principal Accountant Fees and Services |
| For the Year Ended December 31, | ||||||||
| 2009 | 2010 | |||||||
| (in thousands of US$) | ||||||||
Audit fees(1) | 2,248 | 1,962 | ||||||
Audit-related fees(2) | 35 | 100 | ||||||
Tax fees(3) | 24 | 48 | ||||||
| All other fees | — | — | ||||||
| (1) | “Audit fees” meant the aggregate fees billed in each of the fiscal years listed for professional services rendered by our independent registered public accounting firm for the audit of our annual financial statements and review of quarterly financial statements included in our reports on Form 6-K, services that are normally provided in connection with statutory and regulatory filings or engagements for those fiscal years. | |
| (2) | “Audit-related fees” meant the aggregate fees billed in each of the fiscal years listed for assurance and related services by our independent registered public accounting firm that are reasonably related to the performance of the audit or review of our financial statements and are not reported under “Audit fees.” The fees billed in 2009 comprised US$30,300 for review of F-3 registration statement and US$5,100 for S-8 registration statements. The fee billed in 2010 comprised US$100,000 for review of F-3 registration statement for the follow-on offering. | |
| (3) | “Tax fees” meant the aggregate fees billed in each of the fiscal years listed for professional services rendered by our independent registered public accounting firm for tax compliance, tax advice, and tax planning. The fees billed in 2009 and 2010 represented tax consultant fees for transfer pricing. |
| Item 16D. | Exemptions from the Listing Standards for Audit Committees |
| Item 16E. | Purchases of Equity Securities by the Issuer and Affiliated Purchasers |
-98-
Table of Contents
| Item 16F. | Change in Registrant’s Certifying Accountant |
| Item 16G. | Corporate Governance |
| Item 17. | Financial Statements |
| Item 18. | Financial Statements |
| Item 19. | Exhibits |
| Exhibit | ||||
| Number | Description of Document | |||
| 1.1 | Amended and Restated Memorandum and Articles of Association of the Registrant (incorporated by reference to Exhibit 3.2 of our F-1 registration statement (File No. 333-146605), as amended, initially filed with the Commission on October 10, 2007) | |||
| 1.2 | Amendments to the Articles of Association adopted by the shareholders of the Registrant on December 18, 2008 (incorporated by reference to Exhibit 99.2 of our report on Form 6-K furnished to the Commission on December 22, 2008) | |||
| 2.1 | Registrant’s Specimen American Depositary Receipt (incorporated by reference to Exhibit 4.1 of our F-1 registration statement (File No. 333-146605), as amended, initially filed with the Commission on October 10, 2007) | |||
| 2.2 | Registrant’s Specimen Certificate for Ordinary Shares (incorporated by reference to Exhibit 4.2 of our F-1 registration statement (File No. 333-146605), as amended, initially filed with the Commission on October 10, 2007) | |||
| 2.3 | Form of Deposit Agreement among the Registrant, the depositary and holder of the American Depositary Receipts (incorporated by reference to Exhibit 4.3 of our F-1 registration statement (File No. 333-146605), as amended, initially filed with the Commission on October 10, 2007) | |||
| 4.1 | 2007 Share Incentive Plan (as amended and restated effective December 18, 2008) (incorporated by reference to Exhibit 99.3 of our report on Form 6-K furnished to the Commission on December 22, 2008) | |||
| 4.2 | Form of Indemnification Agreement with the Registrant’s directors and officers (incorporated by reference to Exhibit 10.3 of our F-1 registration statement (File No. 333-146605), as amended, initially filed with the Commission on October 10, 2007) | |||
-99-
Table of Contents
| Exhibit | ||||
| Number | Description of Document | |||
| 4.3 | Form of Director Agreement with Independent Directors of the Registrant (incorporated by reference to Exhibit 10.4 of our F-1 registration statement (File No. 333-146605), as amended, initially filed with the Commission on October 10, 2007) | |||
| 4.4 | Form of Employment Agreement between the Registrant and an Executive Officer of the Registrant (incorporated by reference to Exhibit 4.4 of our annual report on Form 20-F filed with the Commission on May 15, 2009) | |||
| 4.5 | English translation of Form of Loan Agreement between Fanhua Xinlian Information Technology Consulting (Shenzhen) Co., Ltd. (previously known as Yiqiman Enterprise Management Consulting (Shenzhen) Co., Ltd.) and each shareholder of Guangdong Meidiya Investment Co., Ltd. (or Sichuan Yihe Investment Co., Ltd.) (incorporated by reference to Exhibit 10.6 of our F-1 registration statement (File No. 333-146605), as amended, initially filed with the Commission on October 10, 2007) | |||
| 4.6 | English translation of Form of Equity Pledge Agreement among Fanhua Xinlian Information Technology Consulting (Shenzhen) Co., Ltd., each shareholder of Guangdong Meidiya Investment Co., Ltd. (or Sichuan Yihe Investment Co., Ltd.) and Guangdong Meidiya Investment Co., Ltd. (or Sichuan Yihe Investment Co., Ltd.) (incorporated by reference to Exhibit 10.7 of our F-1 registration statement (File No. 333-146605), as amended, initially filed with the Commission on October 10, 2007) | |||
| 4.7 | English translation of Form of Irrevocable Power of Attorney issued by each shareholder of Guangdong Meidiya Investment Co., Ltd. and Sichuan Yihe Investment Co., Ltd. (incorporated by reference to Exhibit 10.8 of our F-1 registration statement (File No. 333-146605), as amended, initially filed with the Commission on October 10, 2007) | |||
| 4.8 | English translation of Form of Exclusive Purchase Option Agreement among Fanhua Xinlian Information Technology Consulting (Shenzhen) Co., Ltd., each shareholder of Guangdong Meidiya Investment Co., Ltd. (or Sichuan Yihe Investment Co., Ltd.), and Guangdong Meidiya Investment Co., Ltd. (or Sichuan Yihe Investment Co., Ltd.) (incorporated by reference to Exhibit 10.9 of our F-1 registration statement (File No. 333-146605), as amended, initially filed with the Commission on October 10, 2007) | |||
| 4.9 | English translation of Form of Trademark Licensing Agreement between Beijing Ruisike Management Consulting Company Limited and some of the insurance agency and brokerage subsidiaries of Guangdong Meidiya Investment Co., Ltd. and Sichuan Yihe Investment Co., Ltd. (incorporated by reference to Exhibit 10.12 of our F-1 registration statement (File No. 333-146605), as amended, initially filed with the Commission on October 10, 2007) | |||
| 4.10 | English translation of Form of Employment Agreement between an acquired company and its founder (incorporated by reference to Exhibit 10.13 of our F-1 registration statement (File No. 333-146605), as amended, initially filed with the Commission on October 10, 2007) | |||
| 4.11 | English translation of Form of Technology Consulting and Service Agreement between Fanhua Xinlian Information Technology Consulting (Shenzhen) Co., Ltd. and some of the insurance intermediary subsidiaries of Guangdong Meidiya Investment Co., Ltd. and Sichuan Yihe Investment Co., Ltd. (incorporated by reference to Exhibit 4.14 of our annual report on Form 20-F filed with the Commission on June 20, 2008) | |||
| 4.12 | English translation of Form of Consulting and Service Agreement between Fanhua Zhonglian Enterprise Image Planning (Shenzhen) Co., Ltd. (formerly known as Haidileji Enterprise Image Planning (Shenzhen) Co., Ltd.) and some of the insurance intermediary subsidiaries of Guangdong Meidiya Investment Co., Ltd. and Sichuan Yihe Investment Co., Ltd. (incorporated by reference to Exhibit 4.15 of our annual report on Form 20-F filed with the Commission on June 20, 2008) | |||
| 4.13 | English translation of Form of Credit and Liability Transfer Agreement among a former shareholder of Guangdong Meidiya Investment Co., Ltd. (or Sichuan Yihe Investment Co., Ltd.), Mr. Peng Ge and Fanhua Xinlian Information Technology Consulting (Shenzhen) Co., Ltd. (incorporated by reference to Exhibit 4.13 of our annual report on Form 20-F filed with the Commission on May 15, 2009) | |||
| 4.14 | English translation of Share Transfer Agreement between CISG Holdings Ltd. and Keep High Holdings Limited (incorporated by reference to Exhibit 4.14 of our annual report on Form 20-F filed with the Commission on May 15, 2009) | |||
-100-
Table of Contents
| Exhibit | ||||
| Number | Description of Document | |||
| 4.15 | English translation of Shareholders Agreement among Guangdong Meidiya Investment Co., Ltd., Mr. Keping Lin and Chengdu Mingxia Industrial Co., Ltd. (incorporated by reference to Exhibit 4.15 of our annual report on Form 20-F filed with the Commission on May 15, 2009) | |||
| 4.16 | English translation of Supplemental Agreement I dated June 30, 2009 (to the Shareholders Agreement dated September 17, 2008) between Guangdong Meidiya Investment Co., Ltd. and Mr. Keping Lin(incorporated by reference to Exhibit 4.16 of our annual report on Form 20-F filed with the Commission on May 7, 2010) | |||
| 4.17 | English translation of Supplemental Agreement II dated November 20, 2009 (to the Shareholders Agreement dated September 17, 2008 and the supplemental agreement dated June 30, 2009) between Guangdong Meidiya Investment Co., Ltd. and Mr. Keping Lin (incorporated by reference to Exhibit 4.17 of our annual report on Form 20-F filed with the Commission on May 7, 2010) | |||
| 4.18 | * | Supplemental Subscription and Share Purchase and Shareholders Agreement relating to Inscom Holding Limited dated April 27, 2011 among InsCom HK Limited, InsCom Group Limited, InsCom Holding Limited, Apollo & Muse Holding Limited, Clever Star Holdings Limited, CISG Holdings Ltd. and Subscription and Shares Purchase and Shareholders Agreement dated July 29, 2010 among the same parties. | ||
| 4.19 | * | Deed of Adherence relating to InsCom Holding Limited dated October 29, 2010 among InsCom Holding Limited, InsCom Group Limited, InsCom HK Limited, Apollo & Muse Holding Limited, Clever Star Holdings Limited, CISG Holdings Ltd., Wang Strategic Capital Partners (II) Limited, Harbor Pacific Capital Partners I, LP | ||
| 4.20 | * | Subscription and Share Purchase Agreement relating to InsCom Holding Limited dated October 29, 2010 among InsCom Holding Limited, InsCom Group Limited, InsCom HK Limited, Apollo & Muse Holding Limited, Clever Star Holdings Limited, Wang Strategic Capital Partners (II) Limited, Harbour Pacific Capital Partners I, LP | ||
| 4.21 | * | Put Option Agreement dated October 29, 2010 among Hu Yinan, Apollo & Muse Holding Limited, Wang Strategic Capital Partners (II) Limited and Harbor Pacific Capital Partners I, LP | ||
| 4.22 | * | English translation of Loan Agreement dated December 3, 2010 between Ying Si Kang Information Technology (Shenzhen) Co., Ltd. and Chunlin Wang | ||
| 4.23 | * | English translation of Equity Pledge Contract dated December 3, 2010 between Ying Si Kang Information Technology (Shenzhen) Co., Ltd., Chunlin Wang and Shenzhen Xinbao Investment Management Co., Ltd. | ||
| 4.24 | * | English translation of Exclusive Purchase Option Contract dated December 3, 2010 among Ying Si Kang Information Technology (Shenzhen) Co., Ltd., Chunlin Wang and Shenzhen Xinbao Investment Management Co., Ltd. | ||
| 4.25 | * | English translation of Power of Attorney dated December 3, 2010 of Chunlin Wang | ||
| 4.26 | * | English translation of Loan Agreement dated December 3, 2010 between Ying Si Kang Information Technology (Shenzhen) Co., Ltd. and Yuan Tian | ||
| 4.27 | * | English translation of Equity Pledge Contract dated December 3, 2010 between Ying Si Kang Information Technology (Shenzhen) Co., Ltd., Yuan Tian and Shenzhen Xinbao Investment Management Co., Ltd. | ||
| 4.28 | * | English translation of Exclusive Purchase Option Contract dated December 3, 2010 among Ying Si Kang Information Technology (Shenzhen) Co., Ltd., Yuan Tian and Shenzhen Xinbao Investment Management Co., Ltd. | ||
| 4.29 | * | English translation of Power of Attorney dated December 3, 2010 of Yuan Tian | ||
| 4.30 | * | Share Subscription Agreement dated December 24, 2010 among Datong International Holdings Limited, Winner Sight Global Limited, CISG Holdings Ltd., Keping Lin, Expert Central Limited and Mancini Holdings Limited | ||
-101-
Table of Contents
| Exhibit | ||||
| Number | Description of Document | |||
| 4.31 | * | Share Purchase Agreement dated March 24, 2011 among Winner Sight Global Limited, CNinsure Inc., CISG Holdings Ltd., Guangdong Meidiya Investment Co., Ltd., Keping Lin, Expert Central Limited, Mancini Holdings Limited, Datong International Holdings Limited, Datong Group Limited, Beijing Dahua Rongjin Information Technology Limited, Beijing Fanhua Datong Investment Management Co., Ltd. and Datong Insurance Sales and Services Co., Ltd. | ||
| 4.32 | * | English translation of Share Transfer Agreement dated March 24, 2011 between Guangdong Meidiya Investment Co., Ltd. and Beijing Min Si Lian Hua Investment Management Co., Ltd. | ||
| 4.33 | * | English translation of Supplemental Agreement (to the Share Transfer Agreement dated March 24, 2011) dated March 24, 2011 between Guangdong Meidiya Investment Co., Ltd. and Beijing Min Si Lian Hua Investment Management Co., Ltd. | ||
| 4.34 | * | English translation of Settlement Agreement (Shareholders Agreement) dated March 24, 2011 among Guangdong Meidiya Investment Co., Ltd., Mr. Keping Lin and Beijing Fanhua Datong Investment Management Co., Ltd. | ||
| 4.35 | * | English translation of Form of Consulting and Service Agreement made with Fanhua Xinlian Information Technology Consulting (Shenzhen) Co., Ltd. | ||
| 4.36 | * | English translation of Form of Consulting and Service Agreement made with Fanhua Zhonnglian Enterprise Image Planning (Shenzhen) Co., Ltd. | ||
| 4.37 | * | English translation of Form of IT Platform Service Agreement made with Litian Zhuoyue Software (Beijing) Co., Ltd. | ||
| 8.1 | * | Subsidiaries and Consolidated Affiliated Entities of the Registrant | ||
| 11.1 | Code of Business Conduct and Ethics of the Registrant (incorporated by reference to Exhibit 99.1 of our F-1 registration statement (File No. 333-146605), as amended, initially filed with the Commission on October 10, 2007) | |||
| 12.1 | * | CEO Certification Pursuant to Section 302 of the Sarbanes-Oxley Act of 2002 | ||
| 12.2 | * | CFO Certification Pursuant to Section 302 of the Sarbanes-Oxley Act of 2002 | ||
| 13.1 | * | CEO Certification Pursuant to Section 906 of the Sarbanes-Oxley Act of 2002 | ||
| 13.2 | * | CFO Certification Pursuant to Section 906 of the Sarbanes-Oxley Act of 2002 | ||
| 15.1 | * | Consent of Maples and Calder | ||
| 15.2 | * | Consent of Commerce & Finance Law Offices | ||
| 15.3 | * | Consent of Deloitte Touche Tohmatsu | ||
| * | Filed with this Annual Report on Form 20-F |
-102-
Table of Contents
| CNINSURE INC. | ||||
| By: | /s/ Yinan Hu | |||
| Name: | Yinan Hu | |||
| Title: | Chairman and Chief Executive Officer | |||
Table of Contents
INDEX TO CONSOLIDATED FINANCIAL STATEMENTS
| Page | ||||
| F-2 | ||||
| F-3 | ||||
| F-6 | ||||
| F-7 | ||||
| F-9 | ||||
| F-11 | ||||
| F-46 | ||||
F-1
Table of Contents
Deloitte Touche Tohmatsu
Hong Kong
May 4, 2011
F-2
Table of Contents
(In thousands, except for shares and per share data)
| As of December 31, | ||||||||||||
| 2009 | 2010 | 2010 | ||||||||||
| RMB | RMB | US$ | ||||||||||
ASSETS: | ||||||||||||
Current assets: | ||||||||||||
| Cash and cash equivalents | 1,457,890 | 1,924,884 | 291,649 | |||||||||
| Restricted cash | 1,957 | 9,177 | 1,390 | |||||||||
| Accounts receivable, net of allowance for doubtful amounts of RMB2,136 and RMB5,790 (US$877) as of December 31, 2009 and 2010, respectively | 181,360 | 243,175 | 36,845 | |||||||||
| Insurance premium receivables | 230 | 92 | 14 | |||||||||
| Other receivables (Note 4) | 52,108 | 67,034 | 10,157 | |||||||||
| Deferred tax assets (Note 11) | 2,602 | 5,691 | 862 | |||||||||
| Amounts due from related parties (Note 15) | 25,337 | 40,000 | 6,061 | |||||||||
| Other current assets | 6,015 | 12,372 | 1,874 | |||||||||
Total current assets | 1,727,499 | 2,302,425 | 348,852 | |||||||||
Non-current assets: | ||||||||||||
| Property, plant and equipment, net (Note 5) | 108,318 | 102,175 | 15,481 | |||||||||
| Goodwill (Note 6) | 535,911 | 1,154,373 | 174,905 | |||||||||
| Intangible assets, net | 81,485 | 145,653 | 22,069 | |||||||||
| Deferred tax assets (Note 11) | 3,801 | 6,755 | 1,023 | |||||||||
| Investment in affiliates (Note 7) | 86,701 | 139,116 | 21,078 | |||||||||
| Other non-current assets | 2,250 | 3,959 | 600 | |||||||||
Total non-current assets | 818,466 | 1,552,031 | 235,156 | |||||||||
Total assets | 2,545,965 | 3,854,456 | 584,008 | |||||||||
F-3
Table of Contents
(In thousands, except for shares and per share data)
| As of December 31, | ||||||||||||
| 2009 | 2010 | 2010 | ||||||||||
| RMB | RMB | US$ | ||||||||||
| LIABILITIES AND EQUITY: | ||||||||||||
Current liabilities: | ||||||||||||
| Accounts payable (including accounts payable of the consolidated variable interest entities (“VIEs”) without recourse to CNinsure Inc. of RMB59,168 and RMB75,285 (US$11,407) as of December 31, 2009 and December 31, 2010, respectively) | 72,716 | 89,573 | 13,572 | |||||||||
| Insurance premium payables (including insurance premium payables of the consolidated VIEs without recourse to CNinsure Inc. of RMB1,957 and RMB1,364 (US$207) as of December 31, 2009 and December 31, 2010, respectively) | 1,957 | 1,364 | 207 | |||||||||
| Other payables and accrued expenses (including other payables and accrued expenses of the consolidated VIEs without recourse to CNinsure Inc. of RMB130,073 and RMB52,725 (US$7,989) as of December 31, 2009 and December 31, 2010, respectively) (Note 9) | 182,139 | 93,460 | 14,160 | |||||||||
| Accrued payroll (including accrued payroll of the consolidated VIEs without recourse to CNinsure Inc. of RMB18,962 and RMB27,158 (US$4,115) as of December 31, 2009 and December 31, 2010, respectively) | 24,152 | 31,237 | 4,733 | |||||||||
| Income taxes payable (including income taxes payable of the consolidated VIEs without recourse to CNinsure Inc. of RMB18,564 and RMB32,134 (US$4,869) as of December 31, 2009 and December 31, 2010, respectively) | 37,410 | 34,927 | 5,292 | |||||||||
| Amounts due to related parties (including amounts due to related parties of the consolidated VIEs without recourse to CNinsure Inc. of RMB1,718 and RMB7,800 (US$1,182) as of December 31, 2009 and December 31, 2010, respectively) (Note 15) | 19,274 | 37,800 | 5,727 | |||||||||
Total current liabilities | 337,648 | 288,361 | 43,691 | |||||||||
F-4
Table of Contents
| As of December 31, | ||||||||||||
| 2009 | 2010 | 2010 | ||||||||||
| RMB | RMB | RMB | ||||||||||
Non-current liabilities: | ||||||||||||
| Other tax liabilities (including non-current portion of other tax liabilities of the consolidated VIEs without recourse to CNinsure Inc. of Nil and Nil as of December 31, 2009 and December 31, 2010) (Note 11) | 2,537 | 5,519 | 836 | |||||||||
| Deferred tax liabilities (including non-current portion of deferred tax liabilities of the consolidated VIEs without recourse to CNinsure Inc. of RMB Nil and Nil as of December 31, 2009 and December 31, 2010) (Note 11) | 19,075 | 43,513 | 6,593 | |||||||||
Total non-current liabilities | 21,612 | 49,032 | 7,429 | |||||||||
Total liabilities | 359,260 | 337,393 | 51,120 | |||||||||
Commitments and contingencies(Note 16) | ||||||||||||
| Ordinary shares (Authorized shares:10,000,000,000 at US$0.001 each; issued and outstanding shares: 912,497,726 and 1,002,977,326 as of December 31, 2009 and 2010, respectively) (Note 12) | 7,036 | 7,649 | 1,159 | |||||||||
| Additional paid-in capital | 1,604,774 | 2,261,849 | 342,704 | |||||||||
| Statutory reserves | 103,877 | 136,681 | 20,709 | |||||||||
| Retained earnings | 348,663 | 738,165 | 111,843 | |||||||||
| Accumulated other comprehensive loss | (72,542 | ) | (83,360 | ) | (12,630 | ) | ||||||
Total CNinsure Inc. shareholders’ equity | 1,991,808 | 3,060,984 | 463,785 | |||||||||
Noncontrolling interests | 194,897 | 456,079 | 69,103 | |||||||||
Total equity | 2,186,705 | 3,517,063 | 532,888 | |||||||||
Total liabilities and equity | 2,545,965 | 3,854,456 | 584,008 | |||||||||
F-5
Table of Contents
(In thousands, except for shares and per share data)
| Year Ended December 31, | ||||||||||||||||
| 2008 | 2009 | 2010 | 2010 | |||||||||||||
| RMB | RMB | RMB | US$ | |||||||||||||
Net revenues: | ||||||||||||||||
| Commissions and fees | 843,107 | 1,154,090 | 1,484,389 | 224,907 | ||||||||||||
| Other service fees | 855 | 761 | 640 | 97 | ||||||||||||
Total net revenues | 843,962 | 1,154,851 | 1,485,029 | 225,004 | ||||||||||||
Operating costs and expenses: | ||||||||||||||||
| Commissions and fees | (436,803 | ) | (579,911 | ) | (708,403 | ) | (107,333 | ) | ||||||||
| Selling expenses | (17,328 | ) | (49,498 | ) | (73,567 | ) | (11,147 | ) | ||||||||
| General and administrative expenses* | (180,031 | ) | (199,246 | ) | (271,444 | ) | (41,128 | ) | ||||||||
Total operating costs and expenses | (634,162 | ) | (828,655 | ) | (1,053,414 | ) | (159,608 | ) | ||||||||
Income from operations | 209,800 | 326,196 | 431,615 | 65,396 | ||||||||||||
Other income (expense), net: | ||||||||||||||||
| Gain on disposal of investment in subsidiary | 525 | — | — | — | ||||||||||||
| Investment income | — | 18,905 | 41,244 | 6,249 | ||||||||||||
| Interest income | 47,967 | 33,299 | 26,924 | 4,080 | ||||||||||||
| Interest expense | (95 | ) | (4 | ) | (5 | ) | (1 | ) | ||||||||
| Others, net | (28 | ) | 1,408 | 391 | 59 | |||||||||||
| Changes in fair value of contingent consideration payables | — | (5,946 | ) | — | — | |||||||||||
Net income before income taxes and income of affiliates | 258,169 | 373,858 | 500,169 | 75,783 | ||||||||||||
| Income tax expense | (62,438 | ) | (95,618 | ) | (96,743 | ) | (14,658 | ) | ||||||||
| Share of income of affiliates | 135 | 774 | 12,904 | 1,955 | ||||||||||||
Net income | 195,866 | 279,014 | 416,330 | 63,080 | ||||||||||||
| Less: Net income (loss) attributable to the noncontrolling interests | 4,129 | (21,827 | ) | (5,978 | ) | (906 | ) | |||||||||
Net income attributable to the CNinsure Inc’s shareholders | 191,737 | 300,841 | 422,308 | 63,986 | ||||||||||||
Net income per share: | ||||||||||||||||
| Basic | 0.2101 | 0.3297 | 0.4408 | 0.0668 | ||||||||||||
| Diluted | 0.2090 | 0.3241 | 0.4264 | 0.0646 | ||||||||||||
Net income per American Depositary Shares (“ADS”): | ||||||||||||||||
| Basic | 4.2025 | 6.5938 | 8.8162 | 1.3358 | ||||||||||||
| Diluted | 4.1803 | 6.4815 | 8.5288 | 1.2922 | ||||||||||||
Shares used in calculating net income per share: | ||||||||||||||||
| Basic | 912,497,726 | 912,497,726 | 958,029,717 | 958,029,717 | ||||||||||||
| Diluted | 917,335,390 | 928,312,312 | 990,318,528 | 990,318,528 | ||||||||||||
| * | Including (i) share-based compensation expenses of RMB45,659 and RMB7,553 and RMB22,211 (US$3,365) for the years ended December 31, 2008, 2009 and 2010, respectively; and (ii) impairment loss on intangible assets of Nil, Nil and RMB4,600 (US$697) for the years ended December 31, 2008, 2009 and 2010, respectively. |
F-6
Table of Contents
(In thousands, except for shares and per share data)
| Accumulated | ||||||||||||||||||||||||||||||||||||
| (Accumulated | other | |||||||||||||||||||||||||||||||||||
| Share Capital | Additional | Statutory | deficit) | comprehensive | Noncontrolling | Comprehensive | ||||||||||||||||||||||||||||||
| Number of Share | Amounts | Paid-in Capital | Reserves | retained earnings | income (loss) | Interests | Total | income (loss) | ||||||||||||||||||||||||||||
| RMB | RMB | RMB | RMB | RMB | RMB | RMB | RMB | |||||||||||||||||||||||||||||
January 1, 2008 | 912,497,726 | 7,036 | 1,621,064 | 47,903 | (87,941 | ) | (21,150 | ) | 18,324 | 1,585,236 | 129,963 | |||||||||||||||||||||||||
| Share-based compensation | — | — | 45,659 | — | — | — | — | 45,659 | ||||||||||||||||||||||||||||
| Net income | — | — | — | — | 191,737 | — | 4,129 | 195,866 | 195,866 | |||||||||||||||||||||||||||
| Provision for statutory reserves | — | — | — | 23,334 | (23,334 | ) | — | — | — | |||||||||||||||||||||||||||
| Acquisition of subsidiaries | — | — | — | — | — | — | 71,970 | 71,970 | ||||||||||||||||||||||||||||
| Foreign currency translation | — | — | — | — | — | (52,660 | ) | — | (52,660 | ) | (52,660 | ) | ||||||||||||||||||||||||
Balance as of December 31, 2008 | 912,497,726 | 7,036 | 1,666,723 | 71,237 | 80,462 | (73,810 | ) | 94,423 | 1,846,071 | 143,206 | ||||||||||||||||||||||||||
| Share-based compensation | — | — | 6,609 | — | — | — | — | 6,609 | ||||||||||||||||||||||||||||
| Net income | — | — | — | — | 300,841 | — | (21,827 | ) | 279,014 | 279,014 | ||||||||||||||||||||||||||
| Dividends | — | — | (68,558 | ) | — | — | — | — | (68,558 | ) | ||||||||||||||||||||||||||
| Provision for statutory reserves | — | — | — | 32,640 | (32,640 | ) | — | — | — | |||||||||||||||||||||||||||
| Acquisition of subsidiaries | — | — | — | — | — | — | 122,301 | 122,301 | ||||||||||||||||||||||||||||
| Foreign currency translation | — | — | — | — | — | 1,268 | — | 1,268 | 1,268 | |||||||||||||||||||||||||||
Balance as of December 31, 2009 | 912,497,726 | 7,036 | 1,604,774 | 103,877 | 348,663 | (72,542 | ) | 194,897 | 2,186,705 | 280,282 | ||||||||||||||||||||||||||
F-7
Table of Contents
(In thousands, except for shares and per share data)
| Accumulated | ||||||||||||||||||||||||||||||||||||
| Additional | (Accumulated | other | ||||||||||||||||||||||||||||||||||
| Share Capital | Paid-in | Statutory | deficit) | comprehensive | Noncontrolling | Comprehensive | ||||||||||||||||||||||||||||||
| Number of Share | Amounts | Capital | Reserves | retained earnings | income (loss) | Interests | Total | income (loss) | ||||||||||||||||||||||||||||
| RMB | RMB | RMB | RMB | RMB | RMB | RMB | RMB | |||||||||||||||||||||||||||||
| Issuance of ordinary shares upon follow-on offering on July 14, 2010 | 92,000,000 | 623 | 743,144 | — | — | — | — | 743,767 | — | |||||||||||||||||||||||||||
| Exercise of share options | 5,100,780 | 34 | 10,041 | — | — | — | — | 10,075 | — | |||||||||||||||||||||||||||
| Repurchase of ordinary shares | (6,621,180 | ) | (44 | ) | (37,243 | ) | — | — | — | — | (37,287 | ) | — | |||||||||||||||||||||||
| Share-based compensation | — | — | 22,211 | — | — | — | — | 22,211 | — | |||||||||||||||||||||||||||
| Net income | — | — | — | — | 422,308 | — | (5,978 | ) | 416,330 | 416,330 | ||||||||||||||||||||||||||
| Dividends | — | — | (80,985 | ) | — | — | — | — | (80,985 | ) | — | |||||||||||||||||||||||||
| Provision for statutory reserves | — | — | — | 32,806 | (32,806 | ) | — | — | — | — | ||||||||||||||||||||||||||
| Acquisition of subsidiaries | — | — | — | — | — | — | 272,061 | 272,061 | — | |||||||||||||||||||||||||||
| Acquisition of additional shares in a subsidiary | — | — | (93 | ) | — | — | — | (2,317 | ) | (2,410 | ) | — | ||||||||||||||||||||||||
| Disposal of subsidiaries | — | — | — | (2 | ) | — | — | (2,584 | ) | (2,586 | ) | |||||||||||||||||||||||||
| Foreign currency translation | — | — | — | — | — | (10,818 | ) | — | (10,818 | ) | (10,818 | ) | ||||||||||||||||||||||||
Balance as of December 31, 2010 | 1,002,977,326 | 7,649 | 2,261,849 | 136,681 | 738,165 | (83,360 | ) | 456,079 | 3,517,063 | 405,512 | ||||||||||||||||||||||||||
Balance as of December 31, 2010 in US$ | 1,159 | 342,704 | 20,709 | 111,843 | (12,630 | ) | 69,103 | 532,888 | 61,441 | |||||||||||||||||||||||||||
F-8
Table of Contents
(In thousands)
| Year Ended December 31, | ||||||||||||||||
| 2008 | 2009 | 2010 | 2010 | |||||||||||||
| RMB | RMB | RMB | US$ | |||||||||||||
OPERATING ACTIVITIES | ||||||||||||||||
Net income | 195,866 | 279,014 | 416,330 | 63,080 | ||||||||||||
Adjustments to reconcile net income to net cash generated from operating activities: | ||||||||||||||||
| Depreciation | 6,222 | 18,791 | 30,552 | 4,629 | ||||||||||||
| Amortization of acquired intangible assets | 3,260 | 9,654 | 21,520 | 3,261 | ||||||||||||
| Impairment loss for acquired intangible assets | — | — | 4,600 | 697 | ||||||||||||
| Allowance for doubtful receivables | 251 | 1,885 | 5,136 | 778 | ||||||||||||
| Change in fair value of contingent consideration payables | — | 5,946 | — | — | ||||||||||||
| Compensation expenses associated with stock options | 45,659 | 6,609 | 22,211 | 3,365 | ||||||||||||
| Loss (gain) on disposal of property, plant and equipment | 249 | 26 | (97 | ) | (15 | ) | ||||||||||
| Investment income | — | (18,905 | ) | (41,244 | ) | (6,249 | ) | |||||||||
| Share of income of affiliates | (135 | ) | (774 | ) | (12,904 | ) | (1,955 | ) | ||||||||
| Gain on disposal of investment in a subsidiary | (525 | ) | — | — | — | |||||||||||
| Deferred taxes | (4,175 | ) | 2,835 | (1,450 | ) | (220 | ) | |||||||||
Changes in operating assets and liabilities: | ||||||||||||||||
| Accounts receivable | (58,265 | ) | (85,639 | ) | (61,750 | ) | (9,356 | ) | ||||||||
| Insurance premium receivables | 2,419 | (213 | ) | 141 | 21 | |||||||||||
| Other receivables | (13,827 | ) | (5,167 | ) | (7,951 | ) | (1,205 | ) | ||||||||
| Other current assets | (3,927 | ) | (762 | ) | (6,357 | ) | (963 | ) | ||||||||
| Accounts payable | 48,415 | 13,071 | 13,793 | 2,090 | ||||||||||||
| Insurance premium payables | (11,361 | ) | (2,243 | ) | (607 | ) | (92 | ) | ||||||||
| Other payables and accrued expenses | 13,641 | 16,004 | (22,386 | ) | (3,392 | ) | ||||||||||
| Accrued payroll | 6,830 | 7,631 | 6,629 | 1,004 | ||||||||||||
| Income taxes payable | 23,310 | 11,170 | (2,482 | ) | (376 | ) | ||||||||||
| Other tax liabilities | 712 | 666 | 2,981 | 452 | ||||||||||||
Net cash generated from operating activities | 254,619 | 259,599 | 366,665 | 55,554 | ||||||||||||
Cash flows from investing activities: | ||||||||||||||||
| Addition in other investments | (189 | ) | (1,401 | ) | (2,509 | ) | (380 | ) | ||||||||
| Addition in investment in affiliates | (292 | ) | (68,269 | ) | (39,511 | ) | (5,986 | ) | ||||||||
| Purchase of property, plant and equipment | (51,828 | ) | (47,792 | ) | (24,398 | ) | (3,697 | ) | ||||||||
| Proceeds from disposal of property and equipment | 759 | 2,059 | 1,425 | 216 | ||||||||||||
F-9
Table of Contents
(In thousands)
| Year Ended December 31, | ||||||||||||||||
| 2008 | 2009 | 2010 | 2010 | |||||||||||||
| RMB | RMB | RMB | US$ | |||||||||||||
| Acquisition of subsidiaries, net of cash acquired of RMB41,025, RMB2,006 and RMB18,156 (US$2,751) in 2008, 2009 and 2010, respectively | (23,868 | ) | (330,652 | ) | (307,844 | ) | (46,643 | ) | ||||||||
| Disposal of investment in subsidiaries, net of cash disposed of RMB64, RMB255, and RMB5,283 (US$800) in 2008, 2009 and 2010, respectively | 1,545 | 4,110 | (2,733 | ) | (414 | ) | ||||||||||
| Amounts due from related parties | (187,595 | ) | — | — | — | |||||||||||
| Repayments from (to) related parties | — | 183,459 | (17,231 | ) | (2,611 | ) | ||||||||||
| Decrease (increase) in restricted cash | 8,548 | 2,243 | (7,220 | ) | (1,094 | ) | ||||||||||
Net cash used in investing activities | (252,920 | ) | (256,243 | ) | (400,021 | ) | (60,609 | ) | ||||||||
Cash flows from financing activities: | ||||||||||||||||
| Repayments of bank loans | (1,634 | ) | — | — | — | |||||||||||
| Payment for contingent consideration | — | — | (125,380 | ) | (18,997 | ) | ||||||||||
| Acquisition of additional interest in a subsidiary | (3,000 | ) | — | (2,410 | ) | (365 | ) | |||||||||
| Increase in capital injection by noncontrolling interests | 10,612 | 20,315 | 12,295 | 1,863 | ||||||||||||
| Advances from related parties | 10,598 | — | — | — | ||||||||||||
| Repayments to related parties | — | (8,923 | ) | (8,907 | ) | (1,350 | ) | |||||||||
| Proceeds from share issuances | — | — | 743,767 | 112,692 | ||||||||||||
| Proceeds on exercise of stock options | — | — | 10,075 | 1,527 | ||||||||||||
| Repurchase of ordinary shares | — | — | (37,287 | ) | (5,650 | ) | ||||||||||
| Dividends paid | — | (68,558 | ) | (80,985 | ) | (12,270 | ) | |||||||||
Net cash generated from (used in) financing activities | 16,576 | (57,166 | ) | 511,168 | 77,450 | |||||||||||
Net increase (decrease) in cash and cash equivalents | 18,275 | (53,810 | ) | 477,812 | 72,395 | |||||||||||
Cash and cash equivalents at beginning of year | 1,544,817 | 1,510,432 | 1,457,890 | 220,892 | ||||||||||||
| Effect of exchange rate changes on cash and cash equivalents | (52,660 | ) | 1,268 | (10,818 | ) | (1,638 | ) | |||||||||
Cash and cash equivalents at end of year | 1,510,432 | 1,457,890 | 1,924,884 | 291,649 | ||||||||||||
| Supplemental disclosure of cash flow information: | ||||||||||||||||
| Interest paid | 95 | 4 | 5 | 1 | ||||||||||||
| Income taxes paid | 42,590 | 80,826 | 97,869 | 14,829 | ||||||||||||
F-10
Table of Contents
(In thousands, except for shares and per share data)
F-11
Table of Contents
(In thousands, except for shares and per share data)
| As of December 31, | ||||||||
| 2009 | 2010 | |||||||
| RMB | RMB | |||||||
| Accounts receivable | 183,496 | 248,965 | ||||||
| Allowance for doubtful accounts | (2,136 | ) | (5,790 | ) | ||||
| Accounts receivable, net | 181,360 | 243,175 | ||||||
| 2008 | 2009 | 2010 | ||||||||||
| RMB | RMB | RMB | ||||||||||
| Balance at the beginning of the year | — | 251 | 2,136 | |||||||||
| Provision for doubtful accounts | 251 | 1,885 | 5,136 | |||||||||
| Write-offs | — | — | (1,482 | ) | ||||||||
| Balance at the ending of the year | 251 | 2,136 | 5,790 | |||||||||
| Estimated useful | Estimated residual | |||
| life (Years) | value | |||
| Office equipment, furniture and fixtures | 3-5 | 0%-3% | ||
| Motor vehicles | 5-10 | 0%-3% | ||
| Leasehold improvements | 5 | 0% |
F-12
Table of Contents
(In thousands, except for shares and per share data)
F-13
Table of Contents
(In thousands, except for shares and per share data)
| Useful | As of December 31, 2009 | As of December 31, 2010 | ||||||||||||||||||||||||||||
| life | Accumulated | Net carrying | Accumulated | Impairment | Net carrying | |||||||||||||||||||||||||
| (Years) | Cost | amortization | values | Cost | amortization | loss | values | |||||||||||||||||||||||
| RMB | RMB | RMB | RMB | RMB | RMB | RMB | ||||||||||||||||||||||||
| Brand name | Indefinite | 24,091 | — | 24,091 | 24,091 | — | — | 24,091 | ||||||||||||||||||||||
| Trade name | 10 | — | — | — | 8,140 | (144 | ) | — | 7,996 | |||||||||||||||||||||
| Customer relationship | 4.6 to 9.8 | 24,086 | 6,596 | 17,490 | 48,356 | (14,987 | ) | — | 33,369 | |||||||||||||||||||||
| Non-compete agreement | 3 to 14 | 43,340 | 5,956 | 37,384 | 83,191 | (16,583 | ) | (4,600 | ) | 62,008 | ||||||||||||||||||||
| Agency agreement and licence | 4.6 to 10 | 3,007 | 487 | 2,520 | 15,294 | (2,654 | ) | — | 12,640 | |||||||||||||||||||||
| Software and system | 5 to 10 | — | — | — | 5,740 | (191 | ) | — | 5,549 | |||||||||||||||||||||
| 94,524 | 13,039 | 81,485 | 184,812 | (34,559 | ) | (4,600 | ) | 145,653 | ||||||||||||||||||||||
F-14
Table of Contents
(In thousands, except for shares and per share data)
F-15
Table of Contents
(In thousands, except for shares and per share data)
F-16
Table of Contents
(In thousands, except for shares and per share data)
F-17
Table of Contents
(In thousands, except for shares and per share data)
F-18
Table of Contents
(In thousands, except for shares and per share data)
F-19
Table of Contents
(In thousands, except for shares and per share data)
| Fanlian | Mintai | Baolian | Fangda | Inscom | ||||||||||||||||
| RMB | RMB | RMB | RMB | RMB | ||||||||||||||||
| Cash consideration for controlling interest | 52,000 | 90,000 | 60,000 | 40,000 | 84,000 | |||||||||||||||
| Fair value of previously held equity interest | 10,530 | 16,900 | 11,270 | 3,344 | — | |||||||||||||||
| Fair value of noncontrolling interests | 51,580 | 82,820 | 55,210 | 32,776 | 37,380 | |||||||||||||||
| Total consideration | 114,110 | 189,720 | 126,480 | 76,120 | 121,380 | |||||||||||||||
F-20
Table of Contents
(In thousands, except for shares and per share data)
| Fanlian | Mintai | Baolian | Fangda | Inscom | ||||||||||||||||
| RMB | RMB | RMB | RMB | RMB | ||||||||||||||||
| Net tangible assets acquired | 3,265 | 2,632 | (411 | ) | 2,382 | 10,044 | ||||||||||||||
| Intangible assets | 20,880 | 17,850 | 12,760 | 12,111 | 17,680 | |||||||||||||||
| Goodwill | 95,185 | 173,608 | 117,093 | 64,500 | 98,076 | |||||||||||||||
| Deferred tax assets | — | 92 | 228 | 155 | — | |||||||||||||||
| Deferred tax liability | (5,220 | ) | (4,462 | ) | (3,190 | ) | (3,028 | ) | (4,420 | ) | ||||||||||
| Total consideration | 114,110 | 189,720 | 126,480 | 76,120 | 121,380 | |||||||||||||||
| Fair Value Acquired | ||||||||||||||||||||||||
| Useful life | RMB | |||||||||||||||||||||||
| (Years) | Fanlian | Mintai | Baolian | Fangda | Inscom | |||||||||||||||||||
| Trade name | 9.4 | — | — | — | — | 8,140 | ||||||||||||||||||
| Customer relationship | 5.8-6.25 | 13,360 | 490 | 2,300 | 4,910 | 3,210 | ||||||||||||||||||
| Non-compete agreement | 5.8-6.25 | 6,640 | 16,880 | 10,020 | 6,311 | — | ||||||||||||||||||
| Agency agreement | 5.8-6.25 | 880 | 480 | 440 | 890 | 590 | ||||||||||||||||||
| System and software | 5.0-10.0 | — | — | — | — | 5,740 | ||||||||||||||||||
| Total | 20,880 | 17,850 | 12,760 | 12,111 | 17,680 | |||||||||||||||||||
| Year ended December 31, | ||||||||
| 2009 | 2010 | |||||||
| RMB | RMB | |||||||
| (unaudited) | (unaudited) | |||||||
| Pro forma net revenues | 1,180,577 | 1,485,029 | ||||||
| Pro forma income from operations | 322,981 | 431,616 | ||||||
| Pro forma net income | 299,775 | 422,309 | ||||||
| Pro forma net income per share | 0.3285 | 0.4408 | ||||||
F-21
Table of Contents
(In thousands, except for shares and per share data)
| Year ended December 31, | ||||||||
| 2009 | 2010 | |||||||
| RMB | RMB | |||||||
| (unaudited) | (unaudited) | |||||||
| Pro forma net revenues | 1,154,934 | 1,485,639 | ||||||
| Pro forma income from operations | 322,948 | 430,649 | ||||||
| Pro forma net income | 299,494 | 421,817 | ||||||
| Pro forma net income per share | 0.3282 | 0.4403 | ||||||
| Year ended December 31, | ||||||||
| 2009 | 2010 | |||||||
| RMB | RMB | |||||||
| (unaudited) | (unaudited) | |||||||
| Pro forma net revenues | 1,157,672 | 1,486,220 | ||||||
| Pro forma income from operations | 323,474 | 430,684 | ||||||
| Pro forma net income | 299,474 | 421,714 | ||||||
| Pro forma net income per share | 0.3282 | 0.4402 | ||||||
| Year ended December 31, | ||||||||
| 2009 | 2010 | |||||||
| RMB | RMB | |||||||
| (unaudited) | (unaudited) | |||||||
| Pro forma net revenues | 1,158,969 | 1,492,002 | ||||||
| Pro forma income from operations | 323,819 | 430,148 | ||||||
| Pro forma net income | 299,661 | 421,738 | ||||||
| Pro forma net income per share | 0.3284 | 0.4402 | ||||||
| Year ended December 31, | ||||||||
| 2009 | 2010 | |||||||
| RMB | RMB | |||||||
| (unaudited) | (unaudited) | |||||||
| Pro forma net revenues | 1,169,207 | 1,490,068 | ||||||
| Pro forma income from operations | 328,576 | 426,688 | ||||||
| Pro forma net income | 304,225 | 415,734 | ||||||
| Pro forma net income per share | 0.3334 | 0.4339 | ||||||
F-22
Table of Contents
(In thousands, except for shares and per share data)
| RMB | ||||
| Net tangible assets acquired | 3,597 | |||
| Intangible assets | 11,290 | |||
| Goodwill | 16,940 | |||
| Deferred tax liability | (1,827 | ) | ||
| Total consideration | 30,000 | |||
| Useful life | Fair value acquired | |||||||
| (Years) | RMB | |||||||
| Brand name | Indefinite | 3,980 | ||||||
| Customer relationship | 5.6 | 5,910 | ||||||
| Non-compete agreement | 3.0 | 410 | ||||||
| Agency agreement | 5.6 | 990 | ||||||
| Total | 11,290 | |||||||
F-23
Table of Contents
(In thousands, except for shares and per share data)
| Year ended December 31, | ||||||||
| 2008 | 2009 | |||||||
| RMB | RMB | |||||||
| (unaudited) | (unaudited) | |||||||
| Pro forma net revenues | 869,361 | 1,161,248 | ||||||
| Pro forma income from operations | 210,580 | 325,572 | ||||||
| Pro forma net income | 192,691 | 300,132 | ||||||
| Pro forma net income per share | 0.2112 | 0.3289 | ||||||
| Zhixin | Anlian | |||||||
| RMB | RMB | |||||||
| Cash consideration on acquisition date | 1,000 | 1,000 | ||||||
| Fair value of previously held equity interest | 16,250 | 2,730 | ||||||
| Fair value of noncontrolling interests | 79,600 | 26,720 | ||||||
| Contingent consideration payables at fair value on acquisition date | 85,500 | 31,580 | ||||||
| Total consideration | 182,350 | 62,030 | ||||||
F-24
Table of Contents
(In thousands, except for shares and per share data)
| Zhixin | Anlian | |||||||
| RMB | RMB | |||||||
| Net tangible assets (liabilities) acquired | (394 | ) | 268 | |||||
| Intangible assets | 18,090 | 8,240 | ||||||
| Goodwill | 168,953 | 55,524 | ||||||
| Deferred tax assets | 223 | 58 | ||||||
| Deferred tax liability | (4,522 | ) | (2,060 | ) | ||||
| Total | 182,350 | 62,030 | ||||||
| Fair value acquired | ||||||||||||
| Useful life | RMB | |||||||||||
| (Years) | Zhixin | Anlian | ||||||||||
| Customer relationship | 5.8 | 720 | 1,010 | |||||||||
| Non-compete agreement | 5.8 | 16,590 | 6,810 | |||||||||
| Agency agreement | 5.8 | 780 | 420 | |||||||||
| Total | 18,090 | 8,240 | ||||||||||
| Year ended December 31, | ||||||||
| 2008 | 2009 | |||||||
| RMB | RMB | |||||||
| (unaudited) | (unaudited) | |||||||
| Pro forma net revenues | 844,265 | 1,157,538 | ||||||
| Pro forma income from operations | 204,209 | 324,987 | ||||||
| Pro forma net income | 187,279 | 299,916 | ||||||
| Pro forma net income per share | 0.2052 | 0.3287 | ||||||
F-25
Table of Contents
(In thousands, except for shares and per share data)
| As of December 31, | ||||||||
| 2009 | 2010 | |||||||
| RMB | RMB | |||||||
| Advances to staff (i) | 6,142 | 9,046 | ||||||
| Advances to entrepreneurial agents (ii) | 15,919 | 9,897 | ||||||
| Insurance claim receivables | 86 | 65 | ||||||
| Rental deposits | 5,428 | 6,147 | ||||||
| Interest income receivables (iii) | 18,778 | 13,673 | ||||||
| Advances to third parties (iv) | — | 21,294 | ||||||
| Others | 5,755 | 6,912 | ||||||
| 52,108 | 67,034 | |||||||
| (i) | This represented advances to staff of the Group for daily business operations which are unsecured, interest-free and repayable on demand. | |
| (ii) | This represented advances to entrepreneurial agents who provide services to the Group. The advances are used by entrepreneurial individual sales agents to build business. The advances were unsecured, interest-free and repayable on demand. | |
| (iii) | This represented accrued interest income on bank deposits. | |
| (iv) | This mainly represented advance consideration payment made for the acquisition of Henan Zhongrui Insurance Agency Co., Ltd. (“Zhongrui”) amounting to RMB18,000. On June 30, 2010, the Group entered into agreement to acquire an additional 45% equity interest in Zhongrui for RMB18,000, bringing the Group’s shareholdings in Zhongrui from 10% to 55%. As at December 31, 2010 the acquisition of Zhongrui has not been completed and the acquisition has been subsequently terminated with the refund received on March 25, 2011. |
| As of December 31, | ||||||||
| 2009 | 2010 | |||||||
| RMB | RMB | |||||||
| Office equipment, furniture and fixtures | 95,456 | 97,028 | ||||||
| Motor vehicles | 40,639 | 47,030 | ||||||
| Leasehold improvements | 6,961 | 9,548 | ||||||
| Total | 143,056 | 153,606 | ||||||
| Less: Accumulated depreciation | (34,738 | ) | (51,431 | ) | ||||
| Property, plant and equipment, net | 108,318 | 102,175 | ||||||
F-26
Table of Contents
(In thousands, except for shares and per share data)
| Claims | ||||||||||||||||||||
| P&C | Adjusting | Datong | ||||||||||||||||||
| segment | Life segment | segment | segment | Total | ||||||||||||||||
| RMB | RMB | RMB | RMB | RMB | ||||||||||||||||
| Balance as of January 1, 2009 | — | 10,362 | 21,137 | 6,389 | 37,888 | |||||||||||||||
| Addition for acquisitions | 224,477 | — | 16,940 | — | 241,417 | |||||||||||||||
| Addition for contingent considerations | 210,068 | 6,538 | — | 40,000 | 256,606 | |||||||||||||||
| Balance as of December 31, 2009 | 434,545 | 16,900 | 38,077 | 46,389 | 535,911 | |||||||||||||||
| Addition for acquisitions | 548,462 | — | — | — | 548,462 | |||||||||||||||
| Addition for contingent considerations | — | — | — | 70,000 | 70,000 | |||||||||||||||
| Balance as of December 31, 2010 | 983,007 | 16,900 | 38,077 | 116,389 | 1,154,373 | |||||||||||||||
| As of December 31, | ||||||||
| 2009 | 2010 | |||||||
| RMB | RMB | |||||||
| Teamhead Automobile | 489 | 266 | ||||||
| Sincere Fame | 86,212 | 138,850 | ||||||
| Total | 86,701 | 139,116 | ||||||
F-27
Table of Contents
(In thousands, except for shares and per share data)
F-28
Table of Contents
(In thousands, except for shares and per share data)
| • | If the ownership structure and contractual arrangements are found to be in violation of any existing or future PRC laws or regulations, the Group could be subject to severe penalties; | ||
| • | The Group rely on contractual arrangements with the VIEs and its equity holders for substantially all of its China operations, which may not be as effective as direct ownership in providing operational control; and | ||
| • | The Group may have to incur significant cost to enforce, or may not be able to effectively enforce, the contractual arrangements with the VIEs and their equity holders in the event of a breach or non-compliance by the VIEs or their equity holders. |
F-29
Table of Contents
(In thousands, except for shares and per share data)
| As of December 31, | ||||||||
| 2009 | 2010 | |||||||
| RMB | RMB | |||||||
| Total assets | 1,249,737 | 1,644,806 | ||||||
| Total liabilities | 896,406 | 992,668 | ||||||
| Year Ended December 31, | ||||||||||||
| 2008 | 2009 | 2010 | ||||||||||
| RMB | RMB | RMB | ||||||||||
| Net Revenues | 709,536 | 1,062,019 | 1,379,040 | |||||||||
| Net Income | 23,850 | 56,825 | 68,571 | |||||||||
| Net cash provided by operating activities | 3,897 | (7,704 | ) | 8,688 | ||||||||
| Net cash used in investing activities | (36,857 | ) | (346,255 | ) | (192,449 | ) | ||||||
| Net cash provided by financing activities | 19,577 | 387,749 | 287,846 | |||||||||
| As of December 31, | ||||||||
| 2009 | 2010 | |||||||
| RMB | RMB | |||||||
| Consideration payables on acquisition of subsidiaries | 85,380 | — | ||||||
| Business and other tax payable | 17,897 | 34,085 | ||||||
| Refundable deposits from employees and agents | 13,354 | 15,177 | ||||||
| Audit fee | 11,085 | 10,177 | ||||||
| Advances from third parties | 20,643 | 11,517 | ||||||
| Payables for addition of office equipment, furniture and fixtures | 12,593 | 9,799 | ||||||
| Other professional fees | 5,431 | 2,423 | ||||||
| Insurance compensation claim payable to customers | 3,575 | 2,307 | ||||||
| Others | 12,181 | 7,975 | ||||||
| Total | 182,139 | 93,460 | ||||||
F-30
Table of Contents
(In thousands, except for shares and per share data)
| RMB | ||||
| Balance as of January 1, 2008 | 1,160 | |||
| Gross increase in prior-period tax positions | 711 | |||
| Balance as of December 31, 2008 | 1,871 | |||
| Gross increase in prior-period tax positions | 666 | |||
| Balance as of December 31, 2009 | 2,537 | �� | ||
| Gross increase in prior-period tax positions | 2,982 | |||
| Balance as of December 31, 2010 | 5,519 | |||
F-31
Table of Contents
(In thousands, except for shares and per share data)
| Year Ended December 31, | ||||||||||||
| 2008 | 2009 | 2010 | ||||||||||
| RMB | RMB | RMB | ||||||||||
| Current tax expense | (65,901 | ) | (92,117 | ) | (95,229 | ) | ||||||
| Deferred tax income (expense) | 3,463 | (3,501 | ) | (1,514 | ) | |||||||
| Income tax expense | (62,438 | ) | (95,618 | ) | (96,743 | ) | ||||||
| As of December 31, | ||||||||
| 2009 | 2010 | |||||||
| RMB | RMB | |||||||
Current deferred tax assets: | ||||||||
| Operating loss carry forward | 2,602 | 5,691 | ||||||
| Less: valuation allowances | — | — | ||||||
| Current deferred tax asset, net | 2,602 | 5,691 | ||||||
Non-current deferred tax assets: | ||||||||
| Operating loss carry forward | 5,063 | 5,730 | ||||||
| Others | 2,115 | 2,592 | ||||||
| Less: valuation allowances | (3,377 | ) | (1,567 | ) | ||||
| Non-current deferred tax asset, net | 3,801 | 6,755 | ||||||
| Total | 6,403 | 12,446 | ||||||
Deferred tax liabilities: | ||||||||
| Intangible assets, net | (19,075 | ) | (43,513 | ) | ||||
F-32
Table of Contents
(In thousands, except for shares and per share data)
| Year Ended December 31, | ||||||||||||
| 2008 | 2009 | 2010 | ||||||||||
| RMB | RMB | RMB | ||||||||||
| Net income before income taxes and income of affiliates | 258,169 | 373,858 | 500,169 | |||||||||
| PRC statutory tax rate | 25 | % | 25 | % | 25 | % | ||||||
| Income tax at statutory tax rate | 64,542 | 93,464 | 125,042 | |||||||||
| Expenses not deductible for tax purposes: | ||||||||||||
| Entertainment | 355 | 475 | 840 | |||||||||
| Salaries and employee’s benefits | 118 | — | — | |||||||||
| Others | — | 471 | 1,130 | |||||||||
| Tax exemption and tax relief: | ||||||||||||
| Income tax at preferential tax rate of 18%, 20% and 22% for 2008, 2009 and 2010 | (15,111 | ) | (15,541 | ) | (8,023 | ) | ||||||
| Impact of lower tax rates in other jurisdictions | 12,530 | 14,561 | 9,007 | |||||||||
| Tax holidays | — | — | (31,783 | ) | ||||||||
| Change in valuation allowance | (279 | ) | 1,253 | (1,810 | ) | |||||||
| Others | 283 | 935 | 2,340 | |||||||||
| Income tax expense | 62,438 | 95,618 | 96,743 | |||||||||
F-33
Table of Contents
(In thousands, except for shares and per share data)
F-34
Table of Contents
(In thousands, except for shares and per share data)
| Year Ended December 31, | ||||||||||||
| 2008 | 2009 | 2010 | ||||||||||
| RMB | RMB | RMB | ||||||||||
Basic: | ||||||||||||
| Net income attributable to the Company’s shareholders | 191,737 | 300,841 | 422,308 | |||||||||
| Weighted average number of ordinary shares outstanding | 912,497,726 | 912,497,726 | 958,029,717 | |||||||||
| Basic net income per ordinary share | 0.2101 | 0.3297 | 0.4408 | |||||||||
| Basic net income per ADS | 4.2025 | 6.5938 | 8.8162 | |||||||||
Diluted: | ||||||||||||
| Net income attributable to the Company’s shareholders | 191,737 | 300,841 | 422,308 | |||||||||
| Weighted average number of ordinary shares outstanding | 912,497,726 | 912,497,726 | 958,029,717 | |||||||||
| Share options | 4,837,664 | 15,814,586 | 32,288,811 | |||||||||
| Total | 917,335,390 | 928,312,312 | 990,318,528 | |||||||||
| Diluted net income per ordinary share | 0.2090 | 0.3241 | 0.4264 | |||||||||
| Diluted net income per ADS | 4.1803 | 6.4815 | 8.5288 | |||||||||
F-35
Table of Contents
(In thousands, except for shares and per share data)
| As of December 31, | ||||||||
| 2009 | 2010 | |||||||
| RMB | RMB | |||||||
| Amount due from an affiliate (i) | 500 | 20,000 | ||||||
| Amounts due from directors/officers (i) | 3,637 | — | ||||||
| Amounts due from noncontrolling shareholders (ii) | 21,200 | 20,000 | ||||||
| Total | 25,337 | 40,000 | ||||||
| As of December 31, | ||||||||
| 2009 | 2010 | |||||||
| RMB | RMB | |||||||
| Amount due to an affiliate (i) | 17,231 | — | ||||||
| Amount due to a shareholder (i) | 325 | — | ||||||
| Amounts due to noncontrolling shareholders (iii) | 1,718 | 37,800 | ||||||
| Total | 19,274 | 37,800 | ||||||
| (i) | The amount due from/to an affiliate, amounts due from directors/officers and amount due to a shareholder were unsecured, interest-free and repayable on demand. As of December 31, 2010, amount due from an affiliate represents RMB20,000 receivable from a subsidiary of Sincere Fame. This amount was subsequently settled on January 4, 2011. | |
| (ii) | Amounts due from noncontrolling interests were unsecured, interest free and repayable on demand. The amounts represented RMB20,000 receivable from Mr. Keping Lin (“Mr. Lin”) who committed to inject to Datong as working capital unilaterally within two years on the completion of selling Beijing Fanhua Datong Investment Management Co., Ltd. (“Datong Investment”) to the Group. Such commitment has been cancelled subsequent to year ended December 31, 2010 on selling of Datong Investment on March 25, 2011. | |
| (iii) | As of December 31, 2010, included in amount due to noncontrolling shareholders was RMB30,000 payable to Mr. Lin, the selling shareholder of Datong Investment as Datong Investment met the year 2010 performance target. Such contingent consideration payable has been subsequently settled in 2011. The amount was unsecured, interest-free and repayable demand. |
F-36
Table of Contents
(In thousands, except for shares and per share data)
| Minimum Lease | ||||
| Payment | ||||
| RMB | ||||
| Year ending December 31: | ||||
| 2011 | 21,251 | |||
| 2012 | 8,747 | |||
| 2013 | 5,586 | |||
| 2014 | 482 | |||
| 2015 | 72 | |||
| Total | 36,138 | |||
| Year ended December 31, | ||||||||||||||||||||||||
| 2008 | % of sales | 2009 | % of sales | 2010 | % of sales | |||||||||||||||||||
| RMB | RMB | RMB | ||||||||||||||||||||||
| PICC Property and Casualty Company Limited (“PICC”) | 180,595 | 21 | % | 225,847 | 20 | % | 275,889 | 19 | % | |||||||||||||||
| China Pacific Property Insurance Co., Ltd (“CPIC”) | 165,879 | 20 | % | 196,530 | 17 | % | 202,404 | 14 | % | |||||||||||||||
| Aviva-Cofco Life Insurance Co., Ltd (“Aviva-Cofco”) | * | * | * | * | 192,670 | 13 | % | |||||||||||||||||
| Ping An Property & Casualty Insurance Company of China, Ltd (“Ping An”) | 98,410 | 12 | % | 140,057 | 12 | % | 156,251 | 11 | % | |||||||||||||||
| 444,884 | 53 | % | 562,434 | 49 | % | 827,214 | 57 | % | ||||||||||||||||
F-37
Table of Contents
(In thousands, except for shares and per share data)
| As of December 31, | ||||||||||||||||
| 2009 | % | 2010 | % | |||||||||||||
| RMB | RMB | |||||||||||||||
| Aviva-Cofco | 26,176 | 14 | % | 62,509 | 26 | % | ||||||||||
| PICC | 46,539 | 25 | % | 34,572 | 14 | % | ||||||||||
| Ping An | 18,305 | 10 | % | * | * | |||||||||||
| CPIC | 17,638 | 10 | % | * | * | |||||||||||
| 108,658 | 59 | % | 97,081 | 40 | % | |||||||||||
| * | Less than 10% |
| Year ended December 31, | ||||||||||||
| 2008 | 2009 | 2010 | ||||||||||
| RMB | RMB | RMB | ||||||||||
| Considerations payable in connection with acquisition of subsidiaries | 11,406 | 85,380 | 30,000 | |||||||||
| Considerations payable in connection with acquisition of an affiliate | — | 17,231 | — | |||||||||
| Payables for addition of office equipment, furniture and fixtures | 4,652 | 12,593 | 9,799 | |||||||||
| Net assets acquired in connection with acquisitions of subsidiaries (Note 15 (ii)) | 20,000 | — | — | |||||||||
F-38
Table of Contents
(In thousands, except for shares and per share data)
| Option E1 | Option E2 | Option E3 | Option E4 | |||||||||||||
| Weight average assumptions — expected dividend yield | 1.31 | % | 1.31 | % | 1.31 | % | 1.31 | % | ||||||||
| Risk-free interest rate | 2.35 | % | 2.61 | % | 2.82 | % | 3.06 | % | ||||||||
| Expected life | 3.64 years | 4.14 years | 4.64 years | 5.14 years | ||||||||||||
| Expected volatility | 34.91 | % | 33.7 | % | 32.62 | % | 31.82 | % | ||||||||
| Option D1 | Option D2 | Option D3 | Option D4 | |||||||||||||
| Weight average assumptions — expected dividend yield | 0 | % | 0 | % | 0 | % | 0 | % | ||||||||
| Risk-free interest rate | 3.35 | % | 3.51 | % | 3.55 | % | 3.61 | % | ||||||||
| Expected life | 3.56 years | 4.06 years | 4.56 years | 5.06 years | ||||||||||||
| Expected volatility | 33.0 | % | 31.9 | % | 32.2 | % | 31.2 | % | ||||||||
F-39
Table of Contents
(In thousands, except for shares and per share data)
| Option C1 | Option C2 | Option C3 | Option C4 | |||||||||||||
| Weight average assumptions — expected dividend yield | 0 | % | 0 | % | 0 | % | 0 | % | ||||||||
| Risk-free interest rate | 3.70 | % | 3.71 | % | 3.93 | % | 4.07 | % | ||||||||
| Expected life | 3.86 years | 4.36 years | 4.86 years | 5.36 years | ||||||||||||
| Expected volatility | 28.2 | % | 28.9 | % | 28.0 | % | 27.6 | % | ||||||||
| Weighted average assumptions—expected dividend yield | 0 | % | ||
| Risk-free interest rate | 2.71 | % | ||
| Expected life | 5.6 years | |||
| Expected volatility | 28.5 | % | ||
F-40
Table of Contents
(In thousands, except for shares and per share data)
| Option B1 | Option B2 | Option B3 | ||||||||||
| Weight average assumptions — expected dividend yield | 0 | % | 0 | % | 0 | % | ||||||
| Risk-free interest rate | 3.81 | % | 3.89 | % | 3.97 | % | ||||||
| Expected life | 3.92 years | 4.42 years | 4.92 years | |||||||||
| Expected volatility | 23.07 | % | 23.29 | % | 24.20 | % | ||||||
| Weighted | ||||||||||||
| No. of Shares | average | Aggregate | ||||||||||
| underlying | exercise price in | Intrinsic Value | ||||||||||
| options granted | RMB | RMB | ||||||||||
| Balance as of December 31, 2008 | 39,492,631 | 2.2305 | 30,330 | |||||||||
| Granted on March 9, 2009 | 10,000,000 | 2.2982 | ||||||||||
| Exercised | — | — | ||||||||||
| Cancelled | (2,360,600 | ) | 5.8437 | |||||||||
| Forfeited | (565,400 | ) | 5.2703 | |||||||||
| Balance as of December 31, 2009 | 46,566,631 | 2.0250 | 224,835 | |||||||||
| Granted on February 8, 2010 | 48,000,000 | 5.7308 | ||||||||||
| Exercised | (5,100,780 | ) | 2.1240 | |||||||||
| Cancelled | — | — | ||||||||||
| Forfeited | (1,446,410 | ) | 2.1513 | |||||||||
| Balance as of December 31, 2010 | 88,019,441 | 4.0381 | 146,782 | |||||||||
| Exercisable as of December 31, 2010 | 11,853,681 | 2.0618 | 43,193 | |||||||||
F-41
Table of Contents
(In thousands, except for shares and per share data)
| Year ended December 31, | ||||||||||||
| 2008 | 2009 | 2010 | ||||||||||
| RMB | RMB | RMB | ||||||||||
| Weighted-average grant-date fair value of options granted | 0.5790 | 0.7208 | 1.5770 | |||||||||
| Total intrinsic value of options exercised | — | — | 32,465 | |||||||||
| Total fair value of share options vested | 3,414 | — | 7,526 | |||||||||
| Weighted Average | ||||||||||||||||
| Remaining | Weighted average | |||||||||||||||
| Contractual Life | exercise price in | |||||||||||||||
| Options outstanding | (Years) | RMB | Options Exercisable | |||||||||||||
| 2010 Options | 48,000,000 | 4.25 | 5.7308 | — | ||||||||||||
| 2009 Options | 8,272,170 | 3.25 | 2.2982 | 2,068,770 | ||||||||||||
| 2008 Options | 29,094,640 | 3.26 | 1.8967 | 7,132,280 | ||||||||||||
| 2007 Option A | 2,652,631 | 6.0 | 2.3214 | 2,652,631 | ||||||||||||
Total | 88,019,441 | 11,853,681 | ||||||||||||||
F-42
Table of Contents
(In thousands, except for shares and per share data)
| Year ended December 31, | ||||||||||||||||
| 2008 | 2009 | 2010 | 2010 | |||||||||||||
| RMB | RMB | RMB | US$ | |||||||||||||
Net revenues | ||||||||||||||||
| P&C | 599,353 | 783,220 | 821,259 | 124,433 | ||||||||||||
| Life | 154,174 | 177,713 | 235,584 | 35,695 | ||||||||||||
| Claims Adjusting | 89,012 | 140,670 | 177,094 | 26,832 | ||||||||||||
| Datong | 1,423 | 53,248 | 251,092 | 38,044 | ||||||||||||
Total net revenues | 843,962 | 1,154,851 | 1,485,029 | 225,004 | ||||||||||||
Operating costs and expenses | ||||||||||||||||
| P&C | (319,776 | ) | (408,643 | ) | (389,266 | ) | (58,980 | ) | ||||||||
| Life | (127,634 | ) | (158,804 | ) | (194,612 | ) | (29,487 | ) | ||||||||
| Claims Adjusting | (70,961 | ) | (121,753 | ) | (156,825 | ) | (23,761 | ) | ||||||||
| Datong | (5,837 | ) | (72,281 | ) | (214,001 | ) | (32,424 | ) | ||||||||
| Others | (109,954 | ) | (67,174 | ) | (98,710 | ) | (14,956 | ) | ||||||||
Total operating costs and expenses | (634,162 | ) | (828,655 | ) | (1,053,414 | ) | (159,608 | ) | ||||||||
Income (loss) from operations | ||||||||||||||||
| P&C | 279,577 | 374,577 | 431,993 | 65,453 | ||||||||||||
| Life | 26,540 | 18,909 | 40,972 | 6,208 | ||||||||||||
| Claims Adjusting | 18,051 | 18,917 | 20,269 | 3,071 | ||||||||||||
| Datong | (4,414 | ) | (19,033 | ) | 37,091 | 5,620 | ||||||||||
| Others | (109,954 | ) | (67,174 | ) | (98,710 | ) | (14,956 | ) | ||||||||
Total income from operations | 209,800 | 326,196 | 431,615 | 65,396 | ||||||||||||
F-43
Table of Contents
(In thousands, except for shares and per share data)
| As of December 31, | ||||||||||||
| 2009 | 2010 | 2010 | ||||||||||
| RMB | RMB | US$ | ||||||||||
Segment assets | ||||||||||||
| P&C | 956,836 | 1,876,999 | 284,394 | |||||||||
| Life | 120,860 | 175,064 | 26,525 | |||||||||
| Claims Adjusting | 174,425 | 175,777 | 26,633 | |||||||||
| Datong | 169,507 | 282,799 | 42,848 | |||||||||
| Others | 1,124,337 | 1,343,817 | 203,608 | |||||||||
Total assets | 2,545,965 | 3,854,456 | 584,008 | |||||||||
F-44
Table of Contents
(In thousands, except for shares and per share data)
| (a) | On March 25, 2011, the Company announced that it has reached definitive agreements to sell its 55% equity interest in Datong to an independent third party at a cash consideration of approximately US$63,690. In addition, Datong agreed to pay a cash dividend of RMB10,000 exclusively to the Company. The transaction has been completed on March 25, 2011. | ||
| (b) | On February 15, 2011, the Company entered into an agreement to waive the selling shareholders of Fanlian, Mintai, Baolian and Fangda to transfer 5% interest in Fanlian, Mintai, Baolian and Fangda if these entities fails to meet performance target as described in note (3)(a). | ||
| (c) | On April 28, 2011, our board of directors approved the grant of options to purchase an aggregate of 28,400,000 ordinary shares to certain directors, officers and employees pursuant to the amended and restated 2007 Share Incentive Plan. The exercise price of these options is US$0.734 per ordinary share equal to the closing price of ADS at grant date. These options will vest over a four-year period starting from March 31, 2012. |
F-45
Table of Contents
(In thousands, except for shares)
| As of December 31, | ||||||||||||
| 2009 | 2010 | 2010 | ||||||||||
| RMB | RMB | US$ | ||||||||||
| ASSETS: | ||||||||||||
Current assets: | ||||||||||||
| Cash and cash equivalents | 43,490 | 109,393 | 16,575 | |||||||||
| Other receivables | 3,057 | 2,034 | 308 | |||||||||
| Amounts due from subsidiaries | 1,011,289 | 1,539,092 | 233,196 | |||||||||
Total current assets | 1,057,836 | 1,650,519 | 250,079 | |||||||||
Non-current assets: | ||||||||||||
| Investment in subsidiaries | 947,610 | 1,436,221 | 217,609 | |||||||||
Total assets | 2,005,446 | 3,086,740 | 467,688 | |||||||||
| LIABILITIES AND SHAREHOLDERS’ EQUITY: | ||||||||||||
Current liabilities: | ||||||||||||
| Other payables | 10,030 | 12,557 | 1,903 | |||||||||
| Amounts due to subsidiaries | 3,608 | 13,199 | 2,000 | |||||||||
Total liabilities | 13,638 | 25,756 | 3,903 | |||||||||
| Ordinary shares (Authorized shares:10,000,000,000 at US$0.001 each; issued and outstanding shares: 912,497,726 and 1,002,977,326 as of December 31, 2009 and 2010, respectively) | 7,036 | 7,649 | 1,159 | |||||||||
| Additional paid-in capital | 1,604,774 | 2,261,849 | 342,704 | |||||||||
| Statutory reserves | 103,877 | 136,681 | 20,709 | |||||||||
| Retained earnings | 348,663 | 738,165 | 111,843 | |||||||||
| Accumulated other comprehensive loss | (72,542 | ) | (83,360 | ) | (12,630 | ) | ||||||
Total shareholders’ equity | 1,991,808 | 3,060,984 | 463,785 | |||||||||
Total liabilities and shareholders’ equity | 2,005,446 | 3,086,740 | 467,688 | |||||||||
F-46
Table of Contents
(In thousands)
| Year Ended December 31, | ||||||||||||||||
| 2008 | 2009 | 2010 | 2010 | |||||||||||||
| RMB | RMB | RMB | US$ | |||||||||||||
| General and administrative expenses | (63,757 | ) | (18,749 | ) | (26,705 | ) | (4,046 | ) | ||||||||
| Interest income | 17,089 | 896 | 450 | 68 | ||||||||||||
| Equity in earnings of subsidiaries | 238,405 | 318,694 | 448,563 | 67,964 | ||||||||||||
Net income | 191,737 | 300,841 | 422,308 | 63,986 | ||||||||||||
F-47
Table of Contents
(In thousands, except for shares)
| (Accumulated | Accumulated | |||||||||||||||||||||||||||||||
| Share Capital | Additional | deficit) | other | |||||||||||||||||||||||||||||
| Number of | Paid-in | Statutory | retained | comprehensive (loss) | Comprehensive | |||||||||||||||||||||||||||
| Share | Amounts | Capital | Reserves | earnings | income | Total | (loss) income | |||||||||||||||||||||||||
| RMB | RMB | RMB | RMB | RMB | RMB | RMB | ||||||||||||||||||||||||||
Balance as of January 1, 2008 | 912,497,726 | 7,036 | 1,621,064 | 47,903 | (87,941 | ) | (21,150 | ) | 1,566,912 | 132,387 | ||||||||||||||||||||||
| Share-based compensation | — | — | 45,659 | — | — | — | 45,659 | |||||||||||||||||||||||||
| Net income | — | — | — | — | 191,737 | — | 191,737 | 191,737 | ||||||||||||||||||||||||
| Provision for statutory reserves | — | — | — | 23,334 | (23,334 | ) | — | — | ||||||||||||||||||||||||
| Foreign currency translation | — | — | — | — | — | (52,660 | ) | (52,660 | ) | (52,660 | ) | |||||||||||||||||||||
Balance as of December 31, 2008 | 912,497,726 | 7,036 | 1,666,723 | 71,237 | 80,462 | (73,810 | ) | 1,751,648 | 139,077 | |||||||||||||||||||||||
| Share-based compensation | — | — | 6,609 | — | — | — | 6,609 | |||||||||||||||||||||||||
| Net income | — | — | — | — | 300,841 | — | 300,841 | 300,841 | ||||||||||||||||||||||||
| Dividends | — | — | (68,558 | ) | — | — | — | (68,558 | ) | |||||||||||||||||||||||
| Provision for statutory reserves | — | — | — | 32,640 | (32,640 | ) | — | — | ||||||||||||||||||||||||
| Foreign currency translation | — | — | — | — | — | 1,268 | 1,268 | 1,268 | ||||||||||||||||||||||||
Balance as of December 31, 2009 | 912,497,726 | 7,036 | 1,604,774 | 103,877 | 348,663 | (72,542 | ) | 1,991,808 | 302,109 | |||||||||||||||||||||||
| Issuance of ordinary shares upon follow-on offering | 92,000,000 | 623 | 743,144 | — | — | — | 743,767 | |||||||||||||||||||||||||
| Exercise of share options | 5,100,780 | 34 | 10,041 | — | — | — | 10,075 | |||||||||||||||||||||||||
| Repurchase of ordinary shares | (6,621,180 | ) | (44 | ) | (37,243 | ) | — | — | — | (37,287 | ) | |||||||||||||||||||||
| Share-based compensation | — | — | 22,211 | — | — | — | 22,211 | |||||||||||||||||||||||||
| Net income | — | — | — | 422,308 | — | 422,308 | 422,308 | |||||||||||||||||||||||||
| Dividends | — | — | (80,985 | ) | — | — | — | (80,985 | ) | |||||||||||||||||||||||
| Provision for statutory reserves | — | — | — | 32,806 | (32,806 | ) | — | — | ||||||||||||||||||||||||
| Foreign currency translation | — | — | — | — | — | (10,818 | ) | (10,818 | ) | (10,818 | ) | |||||||||||||||||||||
| Others | — | — | (93 | ) | (2 | ) | — | — | (95 | ) | ||||||||||||||||||||||
Balance as of December 31, 2010 | 1,002,977,326 | 7,649 | 2,261,849 | 136,681 | 738,165 | (83,360 | ) | 3,060,984 | 411,490 | |||||||||||||||||||||||
Balance as of December 31, 2010 in US$ | 1,159 | 342,704 | 20,709 | 111,843 | (12,630 | ) | 463,785 | 62,347 | ||||||||||||||||||||||||
F-48
Table of Contents
(In thousands)
| Year Ended December 31, | ||||||||||||||||
| 2008 | 2009 | 2010 | 2010 | |||||||||||||
| RMB | RMB | RMB | US$ | |||||||||||||
OPERATING ACTIVITIES | ||||||||||||||||
Net income | 191,737 | 300,841 | 422,308 | 63,986 | ||||||||||||
Adjustments to reconcile net income to net cash generated from operating activities: | ||||||||||||||||
| Equity in earnings of subsidiaries | (238,405 | ) | (318,694 | ) | (448,563 | ) | (67,964 | ) | ||||||||
| Compensation expenses associated with stock options | 45,659 | 6,609 | 22,211 | 3,365 | ||||||||||||
Changes in operating assets and liabilities: | ||||||||||||||||
| Other receivables | 2,004 | (459 | ) | 1,023 | 155 | |||||||||||
| Other payables | 8,564 | (2,547 | ) | 2,527 | 383 | |||||||||||
Net cash generated from (used in) operating activities | 9,559 | (14,250 | ) | (494 | ) | (75 | ) | |||||||||
Cash flows from investing activities | ||||||||||||||||
| Increase in investment in subsidiaries | (36,989 | ) | (5,653 | ) | (40,143 | ) | (6,082 | ) | ||||||||
| Advances to subsidiaries | (664,893 | ) | (198,132 | ) | (518,212 | ) | (78,517 | ) | ||||||||
Net cash used in investing activities | (701,882 | ) | (203,785 | ) | (558,355 | ) | (84,599 | ) | ||||||||
Cash flows from financing activities: | ||||||||||||||||
| Proceeds from share issuances | — | — | 743,767 | 112,692 | ||||||||||||
| Proceeds on exercise of stock options | — | — | 10,075 | 1,527 | ||||||||||||
| Share repurchase | — | — | (37,287 | ) | (5,650 | ) | ||||||||||
| Dividends paid | — | (68,558 | ) | (80,985 | ) | (12,270 | ) | |||||||||
Net cash generated from (used in) financing activities | — | (68,558 | ) | 635,570 | 96,299 | |||||||||||
Net increase (decrease) in cash and cash equivalents | (692,323 | ) | (286,593 | ) | 76,721 | 11,625 | ||||||||||
Cash and cash equivalents at beginning of year | 1,073,798 | 328,815 | 43,490 | 6,588 | ||||||||||||
| Effect of exchange rate changes on cash and cash equivalents | (52,660 | ) | 1,268 | (10,818 | ) | (1,638 | ) | |||||||||
Cash and cash equivalents at end of year | 328,815 | 43,490 | 109,393 | 16,575 | ||||||||||||
F-49
Table of Contents
F-50