UNITED STATES
SECURITIES AND EXCHANGE COMMISSION
Washington, D.C. 20549
FORM N-CSR
CERTIFIED SHAREHOLDER REPORT OF REGISTERED
MANAGEMENT INVESTMENT COMPANIES
Investment Company Act file number:
811-22175
ALPS ETF TRUST
(Exact name of registrant as specified in charter)
1290 Broadway, Suite 1000, Denver, Colorado 80203
(Address of principal executive offices) (Zip code)
Richard C. Noyes, Secretary
ALPS ETF Trust
1290 Broadway, Suite 1000
Denver, Colorado 80203
(Name and address of agent for service)
Registrant’s Telephone Number, including Area Code: (303) 623-2577
Date of fiscal year end: November 30
Date of reporting period: May 31, 2020
Item 1. Report to Stockholders.
Table of Contents
| Performance Overview | |
| Alerian MLP ETF | 1 |
| Alerian Energy Infrastructure ETF | 4 |
| Disclosure of Fund Expenses | 7 |
| Financial Statements | |
| Alerian MLP ETF | |
| Schedule of Investments | 8 |
| Statement of Assets and Liabilities | 9 |
| Statement of Operations | 10 |
| Statements of Changes in Net Assets | 11 |
| Financial Highlights | 12 |
| Alerian Energy Infrastrcture ETF | |
| Schedule of Investments | 13 |
| Statement of Assets and Liabilities | 15 |
| Statement of Operations | 16 |
| Statements of Changes in Net Assets | 17 |
| Financial Highlights | 18 |
| Notes to Financial Statements | 19 |
| Additional Information | 30 |
| Liquidity Risk Management Program | 32 |
Beginning on January 1, 2021, as permitted by regulations adopted by the U.S. Securities and Exchange Commission, paper copies of the Funds’ annual and semi-annual shareholder reports will no longer be sent by mail, unless you specifically request paper copies of the reports from your financial intermediary (such as a broker-dealer or bank). Instead, the reports will be made available on the Funds’ website (www.alpsfunds.com), and you will be notified by mail each time a report is posted and provided with a website link to access the report.
If you already elected to receive shareholder reports electronically, you will not be affected by this change and you need not take any action. You may elect to receive shareholder reports and other communications from a Fund electronically anytime by contacting your financial intermediary.
You may elect to receive all future reports in paper free of charge. You can contact your financial intermediary to request that you continue to receive paper copies of your shareholder reports. Your election to receive reports in paper will apply to all funds held in your account with your financial intermediary.
alpsfunds.com
Alerian MLP ETF
| Performance Overview | May 31, 2020 (Unaudited) |
INVESTMENT OBJECTIVE
The Alerian MLP ETF (the “Fund” or “AMLP”) seeks investment results that correspond (before fees and expenses) generally to the price and yield performance of its underlying index, the Alerian MLP Infrastructure Total Return Index (the “Underlying Index” or “AMZI”). The shares of the Fund are listed and trade on the NYSE Arca, Inc. (“NYSE”) under the ticker symbol AMLP. The Fund will normally invest at least 90% of its total assets in securities that comprise the Underlying Index.
The Underlying Index is a rules based, modified capitalization weighted, float-adjusted index intended to give investors a means of tracking the overall performance of the United States energy infrastructure Master Limited Partnership (“MLP”) asset class. The Underlying Index is comprised of energy infrastructure MLPs that earn a majority of their cash flow from the transportation, storage, and processing of energy commodities.
PERFORMANCE OVERVIEW
During the six-month period from December 1, 2019, to May 31, 2020, the Fund delivered a total return of -27.55% (-27.32% NAV). This compares to the Fund’s Underlying Index, which decreased -30.57% on a price-return basis and -26.82% on a total-return basis.
During the period, CNX Midstream (CNXM) and Holly Energy Partners (HEP) were added to the Underlying Index, while Tallgrass Energy (TGE) was removed. The methodology for the Underlying Index was updated in May primarily to refresh branding and stylization. There were no material changes to the calculation methodology during the period.
In a bid to reduce trading costs for investors, AMLP underwent a 1-for-5 reverse split. The reverse split occurred on May 18, 2020. The Bid/Ask spread on AMLP has averaged $0.01 in recent years which over the past 3 months grew to be an average of 22 bps. Since the reverse split, the spread has averaged 6 bps.
For the first quarter of 2020 relative to the prior quarter, 12 out of the 21 constituents in the Underlying Index cut their distributions by an average of roughly 65%, 8 companies maintained their distributions and one company grew its distribution. By weighting, nearly 70% of the portfolio maintained or grew distributions. Adding it all up, the quarterly distribution for AMLP was down 21% from the previous quarter. In addition to the wave of distribution cuts, companies across the portfolio announced cuts to growth capital spending plans, reflecting project deferrals and suspensions.
Turning to performance, MLPs struggled in January and February as oil prices began to fall due to concerns about global growth stemming from the impact of Covid-19. Natural gas prices were also weak, and the energy sector lurched to its lowest weighting in the S&P 500 in thirty years. The downside move in MLPs accelerated in March as Covid-19 infections exploded globally and countries began a wave of aggressive economic lockdowns, while oil prices plummeted in the wake of a short-lived price war between Saudi Arabia and Russia. The sharp selloff in MLPs was exacerbated by forced liquidations from closed-end funds in the second half of March.
As broader equity market weakness started to abate, MLPs embarked on a strong rally, driving AMLP’s shares higher over the course of April and May, eclipsing a 100% rebound. Despite unprecedented volatility in West Texas Intermediate (WTI) oil futures prices—the front-month contract traded to -$37 a barrel at one point in April—investors were willing to look through the near-term volatility, bidding AMLP shares higher through April and May. As company earnings started to come in and clarity around results and forward guidance improved, investors were given additional context around earnings resilience, distributions and counterparty risks that were absent in March.
Notably, the Underlying Index has outperformed the broader energy sector since the March bottom, due to the fee-based nature of the MLP business model, which helps insulate cash flows from WTI crude price volatility, as well as attractive potential income in an environment of low interest rates. Company-level improvements have also supported MLP performance. With a focus on financial flexibility, MLPs continue to shift towards free cash flow generation with a view to reducing leverage.
1 | May 31, 2020
Alerian MLP ETF
| Performance Overview | May 31, 2020 (Unaudited) |
Performance (as of May 31, 2020)
| 6 Months | 1 Year | 5 Year | Since Inception^ | |
| Alerian MLP ETF – NAV | -27.32% | -38.08% | -13.09% | -3.09% |
| Alerian MLP ETF – Market Price* | -27.55% | -38.07% | -13.12% | -3.11% |
| Alerian MLP Infrastructure Total Return Index | -26.82% | -37.56% | -13.72% | -1.02% |
| Alerian MLP Total Return Index | -24.26% | -34.74% | -12.93% | -1.16% |
Total Expense Ratio (per the current prospectus) is 0.87%.
Performance data quoted represents past performance. Past performance does not guarantee future results. Total return figures assume reinvestment of dividends, if any. The table does not reflect the deduction of taxes that a shareholder would pay on Fund distributions or the redemption of Fund shares. Investment return and principal value of an investment will fluctuate so that an investor’s shares, when sold or redeemed, may be worth more or less than the original cost. Current performance data may be higher or lower than actual data quoted. For the most current month-end performance data please visit www.alpsfunds.com or call 1.877.398.8461. The Fund accrues deferred income taxes for future tax liabilities associated with the portion of MLP distributions considered to be a tax-deferred return of capital and for any net operating gains as well as capital appreciation of its investment. This deferred tax liability is reflected in the daily NAV and as a result the fund's after-tax performance could differ significantly from the underlying assets even if the pre-tax performance is closely tracked.
NAV is an exchange-traded fund’s per-share value. The per-share dollar amount of the Fund is derived by dividing the total value of all the securities in its portfolio, less any liabilities, by the number of Fund shares outstanding. Market Price is the price at which a share can currently be traded in the market. Information detailing the number of days the Market Price of the Fund was greater than the Fund’s NAV and the number of days it was less than the Fund’s NAV can be obtained at www.alpsfunds.com.
| ^ | The Fund commenced Investment Operations on August 24, 2010 with an Inception Date, the first day of trading on the NYSE ARCA, of August 25, 2010. |
| * | Market Price is based on the midpoint of the bid-ask spread at 4 p.m. ET and does not represent the returns an investor would receive if shares were traded at other times. |
The Alerian MLP Infrastructure Total Return Index is comprised of 21 midstream energy Master Limited Partnerships and provides investors with an unbiased benchmark for the infrastructure component of this emerging asset class. Total return assumes reinvestment of any dividends and distributions realized during a given time period.
The Alerian MLP Total Return Index is recognized as a leading gauge of energy infrastructure Master Limited Partnerships (MLPs). The capped, float-adjusted, capitalization-weighted index, whose constituents earn the majority of their cash flow from midstream activities involving energy commodities, is reported on a total-return basis (AMZX), which assumes reinvestment of any dividends and distributions realized during a given period.
The index is not actively managed and does not reflect any deductions for fees, expenses or taxes. One cannot invest directly in an index. Index performance does not reflect fund performance.
The Fund’s shares are not individually redeemable. Investors buy and sell shares of the Fund on a secondary market. Only market makers or “authorized participants” may trade directly with the Fund, typically in blocks of 25,000 shares.
The Alerian MLP ETF is not suitable for all investors. Investments in the Fund are subject to investment risks, including possible loss of the principal amount invested.
ALPS Portfolio Solutions Distributor, Inc., a FINRA member, is the distributor for the Fund.
2 | May 31, 2020
Alerian MLP ETF
| Performance Overview | May 31, 2020 (Unaudited) |
Top 10 Holdings* (as of May 31, 2020)
| MPLX LP | 11.66% |
| Magellan Midstream Partners LP | 10.36% |
| Enterprise Products Partners LP | 10.20% |
| Energy Transfer LP | 9.18% |
| Plains All American Pipeline LP | 8.84% |
| Phillips 66 Partners LP | 8.45% |
| TC PipeLines LP | 4.99% |
| Western Midstream Partners LP | 4.93% |
| NuStar Energy LP | 4.48% |
| Shell Midstream Partners LP | 4.37% |
| Total % of Top 10 Holdings | 77.46% |
| * | % of Total Investments |
Future holdings are subject to change.
Growth of $10,000 (as of May 31, 2020)
Comparison of change in value of a $10,000 investment in the Fund and the Indexes

The chart above compares historical performance of a hypothetical investment of $10,000 in the Fund since inception with the performance of the Fund’s benchmark index. Past performance does not guarantee future results. The chart does not reflect the deduction of taxes that a shareholder would pay on Fund distributions or the redemption of Fund shares.
3 | May 31, 2020
Alerian Energy Infrastructure ETF
| Performance Overview | May 31, 2020 (Unaudited) |
INVESTMENT OBJECTIVE
The Alerian Energy Infrastructure ETF (the “Fund” or “ENFR”) seeks investment results that correspond (before fees and expenses) generally to the price and yield performance of its underlying index, the Alerian Midstream Energy Select Total Return Index (the “Underlying Index” or “AMEI”). As a secondary objective, the Fund seeks to provide total return through income and capital appreciation. The Shares of the Fund are listed and trade on the NYSE Acra, Inc. (“NYSE”) under the ticker symbol ENFR. The Fund will normally invest at least 90% of its total assets in securities that comprise the Underlying Index.
The Underlying Index is a composite of North American energy infrastructure companies engaged in midstream activities involving energy commodities, including gathering and processing, liquefaction, pipeline transportation, rail terminaling, and storage (also known as “midstream energy businesses”). Midstream energy companies include midstream MLPs and midstream corporations, either based in the United States or Canada. The Underlying Index has a 25% limit for companies taxed as pass-through entities.
PERFORMANCE OVERVIEW
During the six-month period from December 1, 2019, to May 31, 2020, the Fund delivered a total return of -22.55% (-22.43% NAV). This compares to the Fund’s Underlying Index, which decreased -25.22% on a price-return basis and -22.16% on a total-return basis.
During the period, Rattler Midstream (RTLR) was added to the Underlying Index, while Summit Midstream Partners (SMLP) was removed. SemGroup (SEMG) and Tallgrass Energy (TGE) were removed in special rebalancings in relation to their acquisition by another entity. The methodology for the Underlying Index was updated in May primarily to refresh branding and stylization. There were no material changes to the calculation methodology during the period.
Turning to performance, midstream energy infrastructure companies have struggled since December amid falling oil prices and a burgeoning global recession. While midstream energy infrastructure has outperformed the broader energy sector over the six months ended May 31, it has not been immune to supply and demand turmoil in energy markets. In March, Saudi Arabia and Russia fell into an oil price war while aggressive economic lockdowns eroded demand for crude oil as consumption of refined products like gasoline and jet fuel collapsed. The price war and unprecedented demand decline drove a sharp drop in oil prices. Meanwhile, natural gas prices weakened further as industrial demand deteriorated. The combination added to existing negative sentiment surrounding energy.
The sell-off in midstream accelerated into March as global equity markets cratered. Energy equities largely bottomed in the second half of March, even as oil prices fell further in April. Supported by constructive company updates and improvement in oil prices, ENFR has rallied nearly 100% from its March lows. This move has coincided with a dramatic rally in the broader equity market and a corresponding move higher in some of the hardest hit segments of the energy sector, notably exploration and production companies as well as oilfield services firms.
The quarterly dividend for ENFR paid in May decreased 1.4% from the prior quarter, coming in at $0.284 vs. $0.288 previously. The payout was relatively resilient considering 20.2% of ENFR’s portfolio by weight cut their dividends on a quarter-over-quarter basis, representing 14 of the 34 names in the portfolio. Conversely, 17 companies representing 66.2% of the portfolio by weight maintained dividends and one company grew its dividend. (Two constituents do not pay dividends.) Many of the companies that cut their payouts shared similar characteristics, including greater exposure to the wellhead given gathering and processing activities, higher leverage, and lower distribution coverage.
Fundamentals for energy infrastructure had improved coming into the latest energy market crisis, and companies have taken further steps to enhance financial flexibility in the current environment. Names across the cap spectrum have announced reductions to growth spending plans and project deferrals in response to declining production of oil and natural gas amidst weaker commodity prices. To date, downward revisions to forward earnings estimates for midstream energy infrastructure companies have been modest relative to those of the broader energy sector, which reinforces the relatively stable, fee-based nature of midstream energy infrastructure cash flows.
4 | May 31, 2020
Alerian Energy Infrastructure ETF
| Performance Overview | May 31, 2020 (Unaudited) |
Performance (as of May 31, 2020)
| 6 Months | 1 Year | 5 Year | Since Inception^ | |
| Alerian Energy Infrastructure ETF - NAV | -22.43% | -26.55% | -7.90% | -4.58% |
| Alerian Energy Infrastructure ETF - Market Price* | -22.55% | -26.48% | -7.91% | -4.58% |
| Alerian Midstream Energy Select Total Return Index | -22.16% | -26.05% | -7.16% | -3.79% |
| Alerian MLP Total Return Index | -24.26% | -34.74% | -12.93% | -9.41% |
Total Expense Ratio (per the current prospectus) is 0.65%.
Performance data quoted represents past performance. Past performance does not guarantee future results. Total return figures assume reinvestment of dividends and capital gains distributions, if any. The table does not reflect the deduction of taxes that a shareholder would pay on Fund distributions or the redemption of Fund shares. Investment return and principal value of an investment will fluctuate so that an investor’s shares, when sold or redeemed, may be worth more or less than the original cost. Current performance data may be higher or lower than actual data quoted. For most current month-end performance data please visit www.alpsfunds.com or call 1.866.675.2639.
NAV is an exchange-traded fund’s per-share value. The per-share dollar amount of the Fund is derived by dividing the total value of all the securities in its portfolio, less any liabilities, by the number of Fund shares outstanding. Market Price is the price at which a share can currently be traded in the market. Information detailing the number of days the Market Price of the Fund was greater than the Fund’s NAV and the number of days it was less than the Fund’s NAV can be obtained at www.alpsfunds.com.
| ^ | The Fund commenced Investment Operations on November 1, 2013. |
| * | Market Price is based on the midpoint of the bid-ask spread at 4 p.m. ET and does not represent the returns an investor would receive if shares were traded at other times. |
The Alerian Midstream Energy Select Total Return Index is comprised of 35 equity securities of issuers headquartered or incorporated in the United States and Canada that engage in the transportation, storage, and processing of energy commodities. Total return assumes reinvestment of any dividends and distributions realized during a given time period.
The Alerian MLP Total Return Index is recognized as a leading gauge of energy infrastructure Master Limited Partnerships (MLPs). The capped, float-adjusted, capitalization-weighted index, whose constituents earn the majority of their cash flow from midstream activities involving energy commodities, is reported on a total-return basis (AMZX), which assumes reinvestment of any dividends and distributions realized during a given period.
The index is not actively managed and does not reflect any deductions for fees, expenses or taxes. One cannot invest directly in an index. Index performance does not reflect fund performance.
The Fund’s shares are not individually redeemable. Investors buy and sell shares of the Fund on a secondary market. Only market makers or “authorized participants” may trade directly with the Fund, typically in blocks of 50,000 shares.
The Alerian Energy Infrastructure ETF is not suitable for all investors. Investments in the Fund are subject to investment risks, including possible loss of the principal amount invested.
ALPS Portfolio Solutions Distributor, Inc., a FINRA member, is the distributor for the Fund.
5 | May 31, 2020
Alerian Energy Infrastructure ETF
| Performance Overview | May 31, 2020 (Unaudited) |
Top 10 Holdings* (as of May 31, 2020)
| Enterprise Products Partners LP | 9.59% |
| Enbridge, Inc. | 9.33% |
| TC Energy Corp. | 7.95% |
| Kinder Morgan, Inc. | 7.50% |
| Energy Transfer LP | 6.40% |
| Plains GP Holdings LP | 6.03% |
| The Williams Cos., Inc. | 4.98% |
| ONEOK, Inc. | 4.93% |
| Pembina Pipeline Corp. | 4.90% |
| Cheniere Energy, Inc. | 4.73% |
| Total % of Top 10 Holdings | 66.34% |
| * | % of Total Investments (excluding investments purchased with collateral from securities loaned) |
Future holdings are subject to change.
Growth of $10,000 (as of May 31, 2020)
Comparison of change in value of a $10,000 investment in the Fund and the Indexes
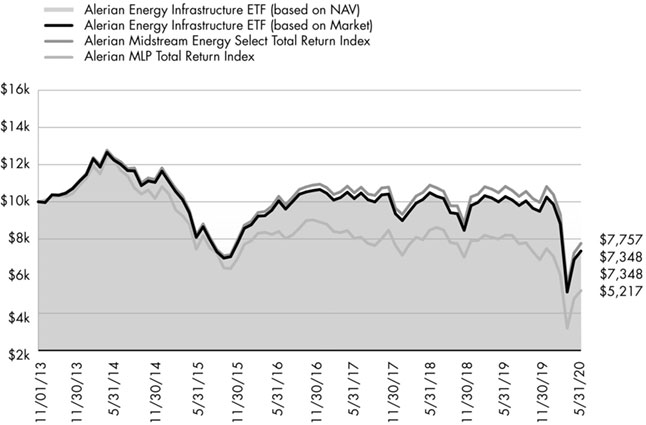
The chart above compares historical performance of a hypothetical investment of $10,000 in the Fund since inception with the performance of the Fund’s benchmark index. Past performance does not guarantee future results. The chart does not reflect the deduction of taxes that a shareholder would pay on Fund distributions or the redemption of Fund shares.
6 | May 31, 2020
Alerian Exchange Traded Funds
| Disclosure of Fund Expenses | May 31, 2020 (Unaudited) |
Shareholder Expense Example: As a shareholder of a Fund, you incur two types of costs: (1) transaction costs which may include creation and redemption fees or brokerage charges, and (2) ongoing costs, including management fees and other Fund expenses. These examples are intended to help you understand your ongoing costs (in dollars) of investing in the Fund and to compare these costs with the ongoing costs of investing in other funds. It is based on an investment of $1,000 invested at the beginning of the (six month) period and held through May 31, 2020.
Actual Return: The first line of the table provides information about actual account values and actual expenses. You may use the information in this line, together with the amount you invested, to estimate the expenses that you incurred over the period. Simply divide your account value by $1,000 (for example, an $8,600 account value divided by $1,000 = 8.6), then multiply the result by the number in the first line under the heading entitled “Expenses Paid During Period” to estimate the expenses attributable to your investment during this period.
Hypothetical 5% Return: The second line of the table provides information about hypothetical account values and hypothetical expenses based on the Fund’s actual expense ratio and an assumed rate of return of 5% per year before expenses, which is not the Fund’s actual return. The hypothetical account values and expenses may not be used to estimate the actual ending account balance or expenses you paid for the period. You may use this information to compare ongoing costs of investing in the Fund and other funds. To do so, compare this 5% hypothetical example with the 5% hypothetical examples that appear in the shareholder reports of other funds.
The expenses shown in the table are meant to highlight ongoing Fund costs only and do not reflect any transaction costs, such as creation and redemption fees or brokerage charges. Therefore, the second line is useful in comparing ongoing costs only, and will not help you determine the relative total costs of owning different funds. In addition, if these costs were included, your costs would have been higher.
Beginning Account Value 12/1/19 | Ending Account Value 5/31/20 | Expense Ratio(a) | Expenses Paid During Period 12/1/19 - 5/31/20(b) | |
| Alerian MLP ETF | ||||
| Actual | $1,000.00 | $726.80 | 0.85% | $3.67 |
| Hypothetical (5% return before expenses) | $1,000.00 | $1,020.75 | 0.85% | $4.29 |
| Alerian Energy Infrastructure ETF | ||||
| Actual | $1,000.00 | $775.70 | 0.65% | $2.89 |
| Hypothetical (5% return before expenses) | $1,000.00 | $1,021.75 | 0.65% | $3.29 |
| (a) | Annualized, based on the Fund's most recent fiscal half-year expenses. |
| (b) | Expenses are equal to the Fund's annualized expense ratio multiplied by the average account value over the period, multiplied by the number of days in the most recent fiscal half year (183), divided by 366. |
7 | May 31, 2020
Alerian MLP ETF
| Schedule of Investments | May 31, 2020 (Unaudited) |
| Security Description | Shares | Value | ||||||
| MASTER LIMITED PARTNERSHIPS (99.93%) | ||||||||
| Energy (0.76%) | ||||||||
| CNX Midstream Partners LP(a) | 4,667,585 | $ | 33,886,667 | |||||
| Gathering + Processing (24.51%) | ||||||||
| Crestwood Equity Partners LP(a) | 5,804,830 | 82,486,634 | ||||||
| DCP Midstream LP(a) | 10,520,080 | 115,720,880 | ||||||
| Enable Midstream Partners LP | 10,253,084 | 42,652,829 | ||||||
| EnLink Midstream LLC(a) | 30,253,417 | 71,398,064 | ||||||
| MPLX LP | 27,242,351 | 517,332,246 | ||||||
| Noble Midstream Partners LP | 3,854,871 | 37,276,603 | ||||||
| Western Midstream Partners LP(a) | 23,418,080 | 218,724,867 | ||||||
| Total Gathering + Processing | 1,085,592,123 | |||||||
| Liquefaction (3.60%) | ||||||||
| Cheniere Energy Partners LP | 4,728,699 | 159,546,305 | ||||||
| Pipeline Transportation | Natural Gas (28.69%) | ||||||||
| Energy Transfer LP | 49,890,008 | 407,102,465 | ||||||
| Enterprise Products Partners LP | 23,684,647 | 452,376,758 | ||||||
| EQM Midstream Partners LP | 9,673,508 | 190,084,432 | ||||||
| TC PipeLines LP(a) | 6,294,959 | 221,267,809 | ||||||
| Total Pipeline Transportation | Natural Gas | 1,270,831,464 | |||||||
| Pipeline Transportation | Petroleum (42.37%) | ||||||||
| Genesis Energy LP(a) | 12,691,890 | 101,788,958 | ||||||
| Holly Energy Partners LP(a) | 5,303,158 | 85,699,033 | ||||||
| Magellan Midstream Partners LP | 10,130,658 | 459,324,034 | ||||||
| NGL Energy Partners LP(a) | 13,798,486 | 70,372,278 | ||||||
| NuStar Energy LP(a) | 11,438,737 | 198,690,862 | ||||||
| Phillips 66 Partners LP | 8,389,088 | 374,824,452 | ||||||
| Plains All American Pipeline LP(a) | 40,443,485 | 392,301,804 | ||||||
| Shell Midstream Partners LP | 14,382,130 | 194,014,934 | ||||||
| Total Pipeline Transportation | Petroleum | 1,877,016,355 | |||||||
| TOTAL MASTER LIMITED PARTNERSHIPS | ||||||||
| (Cost $5,810,923,327) | 4,426,872,914 | |||||||
7 Day Yield | Shares | Value | ||||||||||
| SHORT TERM INVESTMENTS (0.20%) | ||||||||||||
| State Street Institutional Treasury Plus Money Market Fund | 0.15 | % | 8,670,958 | $ | 8,670,958 | |||||||
| TOTAL SHORT TERM INVESTMENTS | ||||||||||||
| (Cost $8,670,958) | 8,670,958 | |||||||||||
| TOTAL INVESTMENTS (100.13%) | ||||||||||||
| (Cost $5,819,594,285) | $ | 4,435,543,872 | ||||||||||
| LIABILITIES IN EXCESS OF OTHER ASSETS (-0.13%) | (5,956,168 | ) | ||||||||||
| NET ASSETS - 100.00% | $ | 4,429,587,704 | ||||||||||
| (a) | Affiliated Company. See Note 8 in Notes to Financial Statement. |
See Notes to Financial Statements.
8 | May 31, 2020
Alerian MLP ETF
| Statement of Assets and Liabilities | May 31, 2020 (Unaudited) |
| ASSETS: | ||||
| Investments, at value | $ | 2,843,206,016 | ||
| Investments in affiliates, at value | 1,592,337,856 | |||
| Receivable for investments sold | 6,727,521 | |||
| Receivable for fund shares sold | 6,055,868 | |||
| Deferred tax asset (Note 2) | – | (a) | ||
| Income tax receivable | 1,935,889 | |||
| Franchise tax receivable | 487,323 | |||
| Total Assets | 4,450,750,473 | |||
| LIABILITIES: | ||||
| Payable for investments purchased | 6,055,783 | |||
| Payable for shares redeemed | 12,111,290 | |||
| Payable to adviser | 2,995,696 | |||
| Total Liabilities | 21,162,769 | |||
| NET ASSETS | $ | 4,429,587,704 | ||
| NET ASSETS CONSIST OF: | ||||
| Paid-in capital | $ | 9,127,978,918 | ||
| Distributable earnings | (4,698,391,214 | ) | ||
| NET ASSETS | $ | 4,429,587,704 | ||
| INVESTMENTS, AT COST | $ | 3,924,391,732 | ||
| INVESTMENTS IN AFFILIATES, AT COST | 1,895,202,553 | |||
| PRICING OF SHARES | ||||
| Net Assets | $ | 4,429,587,704 | ||
| Shares of beneficial interest outstanding (Unlimited number of shares authorized, par value $0.01 per share) | 164,607,420 | (b) | ||
| Net Asset Value, offering and redemption price per share | $ | 26.91 | (b) | |
| (a) | Net Deferred Tax Asset of $844,403,666 is offset 100% by Valuation Allowance. |
| (b) | Shares outstanding and net asset value per share reflect a one for five reverse stock split effective prior to commencement of trading on May 18, 2020. See Note 1. |
See Notes to Financial Statements.
9 | May 31, 2020
Alerian MLP ETF
| Statement of Operations | For the Six Months Ended May 31, 2020 (Unaudited) |
| INVESTMENT INCOME: | ||||
| Distributions from master limited partnerships | $ | 285,233,904 | ||
| Less return of capital distributions | (285,233,904 | ) | ||
| Total Investment Income | – | |||
| EXPENSES: | ||||
| Investment adviser fee | 24,252,546 | |||
| Total Expenses | 24,252,546 | |||
| NET INVESTMENT LOSS, BEFORE INCOME TAXES | (24,252,546 | ) | ||
| Current income tax benefit/(expense) | – | |||
| NET INVESTMENT LOSS | (24,252,546 | ) | ||
| REALIZED AND UNREALIZED GAIN/(LOSS): | ||||
| Net realized loss on investments, before income taxes | (332,043,531 | ) | ||
| Net realized loss on affiliated investments, before income taxes | (1,036,830,293 | ) | ||
| Current income tax benefit/(expense) | – | |||
| Net realized loss | (1,368,873,824 | ) | ||
| Net change in unrealized depreciation on investments, before income taxes | (281,374,696 | ) | ||
| Net change in unrealized depreciation on affiliated investments, before income taxes | (269,842,446 | ) | ||
| Current income tax benefit/(expense) | – | |||
| Net change in unrealized depreciation | (551,217,142 | ) | ||
| NET REALIZED AND UNREALIZED LOSS ON INVESTMENTS | (1,920,090,966 | ) | ||
| NET DECREASE IN NET ASSETS RESULTING FROM OPERATIONS | $ | (1,944,343,512 | ) | |
See Notes to Financial Statements.
10 | May 31, 2020
Alerian MLP ETF
Statements of Changes in Net Assets
For the Six Months Ended May 31, 2020 (Unaudited) | For the Year Ended November 30, 2019 | |||||||
| OPERATIONS: | ||||||||
| Net investment loss | $ | (24,252,546 | ) | $ | (66,514,625 | ) | ||
| Net realized loss | (1,368,873,824 | ) | (1,107,683,146 | ) | ||||
| Net change in unrealized appreciation/(depreciation) | (551,217,142 | ) | 379,463,225 | |||||
| Net decrease in net assets resulting from operations | (1,944,343,512 | ) | (794,734,546 | ) | ||||
| DISTRIBUTIONS TO SHAREHOLDERS: | ||||||||
| From tax return of capital | (295,974,114 | ) | (704,785,128 | ) | ||||
| Total distributions | (295,974,114 | ) | (704,785,128 | ) | ||||
| CAPITAL SHARE TRANSACTIONS: | ||||||||
| Proceeds from sale of shares | 630,630,675 | 1,923,590,589 | ||||||
| Cost of shares redeemed | (1,209,730,472 | ) | (1,874,813,815 | ) | ||||
| Net increase/(decrease) from share transactions | (579,099,797 | ) | 48,776,774 | |||||
| Net decrease in net assets | (2,819,417,423 | ) | (1,450,742,900 | ) | ||||
| NET ASSETS: | ||||||||
| Beginning of period | 7,249,005,127 | 8,699,748,027 | ||||||
| End of period | $ | 4,429,587,704 | $ | 7,249,005,127 | ||||
| OTHER INFORMATION: | ||||||||
| SHARE TRANSACTIONS: | ||||||||
| Beginning shares | 926,062,100 | 910,762,100 | ||||||
| Shares sold | 108,925,000 | 209,850,000 | ||||||
| Shares redeemed | (210,050,000 | ) | (194,550,000 | ) | ||||
| Reverse stock split (Note 1) | (660,329,680 | ) | – | |||||
| Shares outstanding, end of period | 164,607,420 | 926,062,100 | ||||||
See Notes to Financial Statements.
11 | May 31, 2020
Alerian MLP ETF
| Financial Highlights | For a Share Outstanding Throughout the Periods Presented |
For the Six Months Ended May 31, 2020 (Unaudited) (a) | For the Year Ended November 30, 2019 (a) | For the Year Ended November 30, 2018 (a) | For the Year Ended November 30, 2017 (a) | For the Year Ended November 30, 2016 (a) | For the Year Ended November 30, 2015 (a) | |||||||||||||||||||
| NET ASSET VALUE, BEGINNING OF PERIOD | $ | 39.15 | $ | 47.75 | $ | 51.85 | $ | 61.55 | $ | 61.25 | $ | 90.50 | ||||||||||||
| INCOME/(LOSS) FROM OPERATIONS: | ||||||||||||||||||||||||
| Net investment income/(loss)(b) | (0.14 | ) | (0.35 | ) | (0.45 | ) | (1.10 | ) | 0.20 | (0.65 | ) | |||||||||||||
| Net realized and unrealized gain/(loss) on investments | (10.40 | ) | (4.35 | ) | 0.40 | (4.30 | ) | 5.20 | (22.65 | ) | ||||||||||||||
| Total from investment operations | (10.54 | ) | (4.70 | ) | (0.05 | ) | (5.40 | ) | 5.40 | (23.30 | ) | |||||||||||||
| DISTRIBUTIONS: | ||||||||||||||||||||||||
| From net realized gains | – | – | (4.05 | ) | – | – | – | |||||||||||||||||
| From tax return of capital | (1.70 | ) | (3.90 | ) | – | (4.30 | ) | (5.10 | ) | (5.95 | ) | |||||||||||||
| Total distributions | (1.70 | ) | (3.90 | ) | (4.05 | ) | (4.30 | ) | (5.10 | ) | (5.95 | ) | ||||||||||||
| NET INCREASE/(DECREASE) IN NET ASSET VALUE | (12.24 | ) | (8.60 | ) | (4.01 | ) | (9.70 | ) | 0.30 | (29.25 | ) | |||||||||||||
| NET ASSET VALUE, END OF PERIOD | $ | 26.91 | $ | 39.15 | $ | 47.75 | $ | 51.85 | $ | 61.55 | $ | 61.25 | ||||||||||||
| TOTAL RETURN(c) | (27.32 | )% | (10.79 | )% | (0.55 | )% | (9.27 | )% | 9.76 | % | (26.84 | )% | ||||||||||||
| RATIOS/SUPPLEMENTAL DATA: | ||||||||||||||||||||||||
| Net assets, end of period (000s) | $ | 4,429,588 | $ | 7,249,005 | $ | 8,699,748 | $ | 9,405,284 | $ | 9,378,019 | $ | 7,203,754 | ||||||||||||
| RATIO TO AVERAGE NET ASSETS: | ||||||||||||||||||||||||
| Expenses (excluding net current and deferred tax expenses/benefits and franchise tax expense) | 0.85 | %(d) | 0.85 | % | 0.85 | % | 0.85 | % | 0.85 | % | 0.85 | % | ||||||||||||
| Expenses (including net current and deferred tax expenses/benefits)(e) | 0.85 | %(d) | 0.87 | % | 0.85 | % | 0.41 | % | 1.42 | % | (11.40 | )% | ||||||||||||
| Expenses (including current and deferred tax expenses/benefits)(f) | 0.85 | %(d) | 0.85 | % | 0.85 | % | 1.81 | % | (0.36 | )% | 1.57 | % | ||||||||||||
| Net investment loss (excluding deferred tax expenses/benefits and franchise tax expense) | (0.85 | )%(d) | (0.77 | )% | (0.85 | )% | (0.85 | )% | (0.85 | )% | (0.85 | )% | ||||||||||||
| Net investment income/(loss)(including deferred tax expenses/benefits)(f) | (0.85 | )%(d) | (0.77 | )% | (0.85 | )% | (1.81 | )% | 0.36 | % | (1.57 | )% | ||||||||||||
| PORTFOLIO TURNOVER RATE(g) | 10 | % | 34 | % | 26 | % | 23 | % | 31 | % | 21 | % | ||||||||||||
| (a) | On May 18, 2020, the Alerian MLP ETF underwent a one for five reverse stock split. The capital share activity presented here has been retroactively adjusted to reflect this reverse split. See Note 1. |
| (b) | Based on average shares outstanding during the period. |
| (c) | Total return is calculated assuming an initial investment made at the net assets value at the beginning of the period and redemption at the net asset value on the last day of the period and assuming all distributions are reinvested at actual reinvestment prices. Total return calculated for a period of less than one year is not annualized. |
| (d) | Annualized. |
| (e) | Includes amount of current and deferred taxes/benefits for all components of the Statement of Operations. |
| (f) | Includes amount of current and deferred tax benefit associated with net investment income/(loss). |
| (g) | Portfolio turnover for periods less than one year is not annualized and does not include securities received or delivered from processing creations or redemptions in-kind. |
See Notes to Financial Statements.
12 | May 31, 2020
Alerian Energy Infrastructure ETF
| Schedule of Investments | May 31, 2020 (Unaudited) |
| Security Description | Shares | Value | ||||||
| CANADIAN ENERGY INFRASTRUCTURE COMPANIES (31.90%) | ||||||||
| Gathering + Processing (3.71%) | ||||||||
| Keyera Corp. | 89,229 | $ | 1,414,080 | |||||
| Pipeline Transportation | Natural Gas (7.73%) | ||||||||
| TC Energy Corp. | 65,294 | 2,942,581 | ||||||
| Pipeline Transportation | Petroleum (18.02%) | ||||||||
| Enbridge, Inc. | 106,226 | 3,454,843 | ||||||
| Inter Pipeline, Ltd. | 173,473 | 1,588,768 | ||||||
| Pembina Pipeline Corp. | 72,605 | 1,814,004 | ||||||
| Total Pipeline Transportation | Petroleum | 6,857,615 | |||||||
| Storage (2.44%) | ||||||||
| Gibson Energy, Inc.(a) | 59,988 | 928,020 | ||||||
| TOTAL CANADIAN ENERGY INFRASTRUCTURE COMPANIES | ||||||||
| (Cost $15,334,964) | 12,142,296 | |||||||
| U.S. ENERGY INFRASTRUCTURE COMPANIES (27.04%) | ||||||||
| Gathering + Processing (9.25%) | ||||||||
| ONEOK, Inc. | 49,710 | 1,823,860 | ||||||
| Targa Resources Corp. | 94,829 | 1,696,491 | ||||||
| Total Gathering + Processing | 3,520,351 | |||||||
| Liquefaction (4.71%) | ||||||||
| Cheniere Energy, Inc.(b) | 39,499 | 1,751,781 | ||||||
| Tellurian, Inc.(a)(b) | 40,077 | 40,073 | ||||||
| Total Liquefaction | 1,791,854 | |||||||
| Pipeline Transportation | Natural Gas (10.82%) | ||||||||
| Equitrans Midstream Corp.(a) | 166,023 | 1,343,126 | ||||||
| Kinder Morgan, Inc. | 175,668 | 2,775,554 | ||||||
| Total Pipeline Transportation | Natural Gas | 4,118,680 | |||||||
| Storage (2.26%) | ||||||||
| Macquarie Infrastructure Corp. | 30,362 | 861,977 | ||||||
| TOTAL U.S. ENERGY INFRASTRUCTURE COMPANIES | ||||||||
| (Cost $15,996,239) | 10,292,862 | |||||||
| U.S. ENERGY INFRASTRUCTURE MLPS (25.01%) | ||||||||
| Gathering + Processing (3.73%) | ||||||||
| CNX Midstream Partners LP | 5,104 | 37,055 | ||||||
| Crestwood Equity Partners LP | 6,357 | 90,333 | ||||||
| Enable Midstream Partners LP | 11,288 | 46,958 | ||||||
| MPLX LP | 47,029 | 893,081 | ||||||
| Noble Midstream Partners LP | 4,059 | 39,251 | ||||||
| Rattler Midstream LP | 18,011 | 151,472 | ||||||
| Security Description | Shares | Value | ||||||
| Gathering + Processing (continued) | ||||||||
| Western Midstream Partners LP | 17,166 | $ | 160,330 | |||||
| Total Gathering + Processing | 1,418,480 | |||||||
| Pipeline Transportation | Natural Gas (15.56%) | ||||||||
| Energy Transfer LP | 290,421 | 2,369,835 | ||||||
| Enterprise Products Partners LP | 185,994 | 3,552,486 | ||||||
| Total Pipeline Transportation | Natural Gas | 5,922,321 | |||||||
| Pipeline Transportation | Petroleum (5.72%) | ||||||||
| BP Midstream Partners LP | 6,061 | 75,823 | ||||||
| Genesis Energy LP | 9,245 | 74,145 | ||||||
| Holly Energy Partners LP | 3,394 | 54,847 | ||||||
| Magellan Midstream Partners LP | 27,700 | 1,255,918 | ||||||
| NGL Energy Partners LP | 15,069 | 76,852 | ||||||
| NuStar Energy LP | 7,942 | 137,953 | ||||||
| Phillips 66 Partners LP | 8,251 | 368,655 | ||||||
| Shell Midstream Partners LP | 10,019 | 135,156 | ||||||
| Total Pipeline Transportation | Petroleum | 2,179,349 | |||||||
| TOTAL U.S. ENERGY INFRASTRUCTURE MLPS | ||||||||
| (Cost $16,188,710) | 9,520,150 | |||||||
| U.S. GENERAL PARTNERS (13.05%) | ||||||||
| Gathering + Processing (7.18%) | ||||||||
| Antero Midstream Corp. | 133,152 | 636,466 | ||||||
| EnLink Midstream LLC | 107,722 | 254,224 | ||||||
| The Williams Cos., Inc. | 90,188 | 1,842,541 | ||||||
| Total Gathering + Processing | 2,733,231 | |||||||
| Pipeline Transportation | Petroleum (5.87%) | ||||||||
| Plains GP Holdings LP | 223,448 | 2,232,246 | ||||||
| TOTAL U.S. GENERAL PARTNERS | ||||||||
| (Cost $9,867,451) | 4,965,477 | |||||||
See Notes to Financial Statements.
13 | May 31, 2020
Alerian Energy Infrastructure ETF
| Schedule of Investments | May 31, 2020 (Unaudited) |
7 Day Yield | Shares | Value | ||||||||||
| SHORT TERM INVESTMENTS (2.62%) | ||||||||||||
| Money Market Fund (0.28%) | ||||||||||||
| State Street Institutional Treasury Plus Money Market Fund | ||||||||||||
| (Cost $107,017) | 0.15 | % | 107,017 | $ | 107,017 | |||||||
| Investments Purchased with Collateral from Securities Loaned (2.34%) | ||||||||||||
| State Street Navigator Securities Lending Government Money Market Portfolio, 0.15% | ||||||||||||
| (Cost $890,420) | 890,420 | 890,420 | ||||||||||
| TOTAL SHORT TERM INVESTMENTS | ||||||||||||
| (Cost $997,437) | 997,437 | |||||||||||
| TOTAL INVESTMENTS (99.62%) | ||||||||||||
| (Cost $58,384,801) | $ | 37,918,222 | ||||||||||
| OTHER ASSETS IN EXCESS OF LIABILITIES (0.38%) | 144,533 | |||||||||||
| NET ASSETS - 100.00% | $ | 38,062,755 | ||||||||||
| (a) | Security, or a portion of the security position is currently on loan. The total market value of securities on loan is $866,651. |
| (b) | Non-income producing security. |
See Notes to Financial Statements.
14 | May 31, 2020
Alerian Energy Infrastructure ETF
| Statement of Assets and Liabilities | May 31, 2020 (Unaudited) |
| ASSETS: | ||||
| Investments, at value | $ | 37,918,222 | ||
| Receivable for Investments Sold | 987,263 | |||
| Dividends receivable | 65,061 | |||
| Total Assets | 38,970,546 | |||
| LIABILITIES: | ||||
| Payable to adviser | 17,371 | |||
| Payable for collateral upon return of securities loaned | 890,420 | |||
| Total Liabilities | 907,791 | |||
| NET ASSETS | $ | 38,062,755 | ||
| NET ASSETS CONSIST OF: | ||||
| Paid-in capital | $ | 65,006,673 | ||
| Distributable earnings | (26,943,918 | ) | ||
| NET ASSETS | $ | 38,062,755 | ||
| INVESTMENTS, AT COST | $ | 58,384,801 | ||
| PRICING OF SHARES | ||||
| Net Assets | $ | 38,062,755 | ||
| Shares of beneficial interest outstanding (Unlimited number of shares authorized, par value $0.01 per share) | 2,650,000 | |||
| Net Asset Value, offering and redemption price per share | $ | 14.36 | ||
See Notes to Financial Statements.
15 | May 31, 2020
Alerian Energy Infrastructure ETF
| Statement of Operations | For the Six Months Ended May 31, 2020 (Unaudited) |
| INVESTMENT INCOME: | ||||
| Dividends* | $ | 1,642,283 | ||
| Securities lending income | 6,873 | |||
| Total Investment Income | 1,649,156 | |||
| EXPENSES: | ||||
| Investment adviser fees | 144,526 | |||
| Total Expenses | 144,526 | |||
| NET INVESTMENT INCOME | 1,504,630 | |||
| REALIZED AND UNREALIZED GAIN/(LOSS): | ||||
| Net realized loss on investments | (6,224,034 | ) | ||
| Net realized loss on foreign currency transactions | (1,959 | ) | ||
| Net realized loss | (6,225,993 | ) | ||
| Net change in unrealized depreciation on investments | (10,152,388 | ) | ||
| Net change in unrealized appreciation on translation of assets and liabilities denominated in foreign currencies | 1,315 | |||
| Net change in unrealized depreciation | (10,151,073 | ) | ||
| NET REALIZED AND UNREALIZED LOSS ON INVESTMENTS AND FOREIGN CURRENCIES | (16,377,066 | ) | ||
| NET DECREASE IN NET ASSETS RESULTING FROM OPERATIONS | $ | (14,872,436 | ) | |
| * Net of foreign tax withholding. | $ | 69,014 | ||
See Notes to Financial Statements.
16 | May 31, 2020
Alerian Energy Infrastructure ETF
Statements of Changes in Net Assets
For the Six Months Ended May 31, 2020 (Unaudited) | For the Year Ended November 30, 2019 | |||||||
| OPERATIONS: | ||||||||
| Net investment income | $ | 1,504,630 | $ | 2,547,452 | ||||
| Net realized gain/(loss) | (6,225,993 | ) | 385,284 | |||||
| Net change in unrealized depreciation | (10,151,073 | ) | (1,916,143 | ) | ||||
| Net increase/(decrease) in net assets resulting from operations | (14,872,436 | ) | 1,016,593 | |||||
| DISTRIBUTIONS: | ||||||||
| From distributable earnings | (1,502,624 | ) | (1,375,978 | ) | ||||
| From tax return of capital | – | (2,575,568 | ) | |||||
| Total distributions | (1,502,624 | ) | (3,951,546 | ) | ||||
| CAPITAL SHARE TRANSACTIONS: | ||||||||
| Proceeds from sale of shares | 17,186,378 | 28,422,425 | ||||||
| Cost of shares redeemed | (14,557,294 | ) | (15,378,212 | ) | ||||
| Net increase from share transactions | 2,629,084 | 13,044,213 | ||||||
| Net increase/(decrease) in net assets | (13,745,976 | ) | 10,109,260 | |||||
| NET ASSETS: | ||||||||
| Beginning of period | 51,808,731 | 41,699,471 | ||||||
| End of period | $ | 38,062,755 | $ | 51,808,731 | ||||
| OTHER INFORMATION: | ||||||||
| CAPITAL SHARE TRANSACTIONS: | ||||||||
| Beginning shares | 2,700,000 | 2,050,000 | ||||||
| Shares sold | 1,050,000 | 1,400,000 | ||||||
| Shares redeemed | (1,100,000 | ) | (750,000 | ) | ||||
| Shares outstanding, end of period | 2,650,000 | 2,700,000 | ||||||
See Notes to Financial Statements.
17 | May 31, 2020
Alerian Energy Infrastructure ETF
| Financial Highlights | For a Share Outstanding Throughout the Periods Presented |
For the Six Months Ended May 31, 2020 (Unaudited) | For the Year Ended November 30, 2019 | For the Year Ended November 30, 2018 | For the Year Ended November 30, 2017 | For the Year Ended November 30, 2016 | For the Year Ended November 30, 2015 | |||||||||||||||||||
| NET ASSET VALUE, BEGINNING OF PERIOD | $ | 19.19 | $ | 20.34 | $ | 22.30 | $ | 22.95 | $ | 18.97 | $ | 28.55 | ||||||||||||
| INCOME/(LOSS) FROM INVESTMENT OPERATIONS: | ||||||||||||||||||||||||
| Net investment income(a) | 0.57 | 0.88 | 0.85 | 0.79 | 0.80 | 0.83 | ||||||||||||||||||
| Net realized and unrealized gain/(loss) on investments | (4.83 | ) | (0.64 | ) | (2.23 | ) | (0.72 | ) | 3.95 | (9.78 | ) | |||||||||||||
| Total from investment operations | (4.26 | ) | 0.24 | (1.38 | ) | 0.07 | 4.75 | (8.95 | ) | |||||||||||||||
| DISTRIBUTIONS: | ||||||||||||||||||||||||
| From net investment income | (0.57 | ) | (0.50 | ) | (0.47 | ) | (0.47 | ) | (0.63 | ) | (0.48 | ) | ||||||||||||
| Tax return of capital | – | (0.89 | ) | (0.11 | ) | (0.25 | ) | (0.14 | ) | (0.15 | ) | |||||||||||||
| Total distributions | (0.57 | ) | (1.39 | ) | (0.58 | ) | (0.72 | ) | (0.77 | ) | (0.63 | ) | ||||||||||||
| NET INCREASE/(DECREASE) IN NET ASSET VALUE | (4.83 | ) | (1.15 | ) | (1.96 | ) | (0.65 | ) | 3.98 | (9.58 | ) | |||||||||||||
| NET ASSET VALUE, END OF PERIOD | $ | 14.36 | $ | 19.19 | $ | 20.34 | $ | 22.30 | $ | 22.95 | $ | 18.97 | ||||||||||||
| TOTAL RETURN(b) | (22.43 | )% | 1.09 | % | (6.27 | )% | 0.21 | % | 25.63 | % | (31.83 | )% | ||||||||||||
| RATIOS/SUPPLEMENTAL DATA: | ||||||||||||||||||||||||
| Net assets, end of period (000s) | $ | 38,063 | $ | 51,809 | $ | 41,699 | $ | 42,370 | $ | 18,357 | $ | 12,331 | ||||||||||||
| Ratio of expenses to average net assets | 0.65 | %(c) | 0.65 | % | 0.65 | % | 0.65 | % | 0.65 | % | 0.65 | % | ||||||||||||
| Ratio of net investment income to average net assets | 6.77 | %(c) | 4.23 | % | 3.86 | % | 3.39 | % | 4.04 | % | 3.31 | % | ||||||||||||
| PORTFOLIO TURNOVER RATE(d) | 17 | % | 26 | % | 73 | % | 37 | % | 38 | % | 47 | % | ||||||||||||
| (a) | Based on average shares outstanding during the period. |
| (b) | Total return is calculated assuming an initial investment made at the net assets value at the beginning of the period and redemption at the net asset value on the last day of the period and assuming all distributions are reinvested at actual reinvestment prices. Total return calculated for a period of less than one year is not annualized. |
| (c) | Annualized. |
| (d) | Portfolio turnover for periods less than one year is not annualized and does not include securities received or delivered from processing creations or redemptions in-kind. |
See Notes to Financial Statements.
18 | May 31, 2020
Alerian Exchange Traded Funds
| Notes to Financial Statements | May 31, 2020 (Unaudited) |
1. ORGANIZATION
ALPS ETF Trust (the “Trust”), a Delaware statutory trust, is an open-end management investment company registered under the Investment Company Act of 1940, as amended (the “1940 Act”). As of May 31, 2020, the Trust consisted of sixteen separate portfolios. Each portfolio represents a separate series of the Trust. This report pertains to the Alerian MLP ETF and the Alerian Energy Infrastructure ETF (each a “Fund” and collectively, the “Funds”).
The investment objective of the Alerian MLP ETF is to seek investment results that correspond (before fees and expenses) generally to the price and yield performance of its underlying index, the Alerian MLP Infrastructure Total Return Index. The investment objective of the Alerian Energy Infrastructure ETF is to seek investment results that correspond (before fees and expenses) generally to the price and yield performance of its underlying index, the Alerian Midstream Energy Select Total Return Index. The investment advisor uses a “passive management” or indexing investment approach to try to achieve each Fund’s investment objective. Each Fund is considered non-diversified and may invest a greater portion of assets in securities of individual issuers than a diversified fund. As a result, changes in the market value of a single investment could cause greater fluctuations in share price than would occur in a diversified fund.
Each Fund’s Shares (“Shares”) are listed on the NYSE Arca, Inc. (“the NYSE Arca”). Each Fund issues and redeems Shares at net asset value (“NAV”), in blocks of 50,000 Shares, each of which is called a “Creation Unit”. Creation Units are issued and redeemed principally in-kind for securities included in the Underlying Index. Except when aggregated in Creation Units, Shares are not redeemable securities of the Fund. On May 18, 2020, Alerian MLP ETF reduced its Creation Unit size from 50,000 to 25,000 shares.
The Board authorized a one-for-five reverse stock split of Alerian MLP ETF that was effective at the market open on May 18, 2020. The impact of the reverse stock split was to decrease the number of shares outstanding by a factor of five, while increasing the NAV of shares outstanding by a factor of five, resulting in no effect to the net assets of the Fund. The financial statements of the Fund have been adjusted to reflect the reverse stock split.
Pursuant to the Trust’s organizational documents, its Officers and Trustees are indemnified against certain liability arising out of the performance of their duties to the Trust. Additionally, in the normal course of business, the Trust enters into contracts with service providers that contain general indemnification clauses. The Trust’s maximum exposure under these arrangements is unknown, as this would involve future claims that may be made against the Trust that have not yet occurred.
2. SIGNIFICANT ACCOUNTING POLICIES
The following is a summary of significant accounting policies consistently followed by the Funds in the preparation of the financial statements. The accompanying financial statements were prepared in accordance with accounting principles generally accepted in the United States of America (“U.S. GAAP”). The preparation of financial statements in conformity with U.S. GAAP requires management to make certain estimates and assumptions that affect the reported amounts of assets and liabilities and disclosures of contingent assets and liabilities at the date of the financial statements and the reported amounts of revenue and expenses during the period. Actual results could differ from those estimates. Each Fund is considered an investment company under U.S. GAAP and follows the accounting and reporting guidance applicable to investment companies in the Financial Accounting Standards Board (“FASB”) Accounting Standards Codification Topic 946.
A. Portfolio Valuation
Each Fund’s NAV is determined daily, as of the close of regular trading on the New York Stock Exchange (“NYSE”), normally 4:00 p.m. Eastern Time, on each day the NYSE is open for trading. The NAV is computed by dividing the value of all assets of the Fund (including accrued interest and dividends), less all liabilities (including accrued expenses and dividends declared but unpaid), by the total number of shares outstanding.
Portfolio securities listed on any exchange other than the NASDAQ Stock Market LLC (“NASDAQ”) are valued at the last sale price on the business day as of which such value is being determined. If there has been no sale on such day, the securities are valued at the mean of the most recent bid and ask prices on such day. Securities traded on the NASDAQ are valued at the NASDAQ Official Closing Price as determined by NASDAQ. Portfolio securities traded on more than one securities exchange are valued at the last sale price on the business day as of which such value is being determined at the close of the exchange representing the principal market for such securities. Portfolio securities traded in the over-the-counter market, but excluding securities traded on the NASDAQ, are valued at the latest quoted sale price in such market.
19 | May 31, 2020
Alerian Exchange Traded Funds
| Notes to Financial Statements | May 31, 2020 (Unaudited) |
The Funds’ investments are valued at market value or, in the absence of market value with respect to any portfolio securities, at fair value according to procedures adopted by the Trust’s Board of Trustees (the “Board”). When market quotations are not readily available or when events occur that make established valuation methods unreliable, securities of the Funds may be valued in good faith by or under the direction of the Board. These securities generally include, but are not limited to, restricted securities (securities which may not be publicly sold without registration under the Securities Act of 1933) for which a pricing service is unable to provide a market price; securities whose trading has been formally suspended; a security whose market price is not available from a pre-established primary pricing source or the pricing source is not willing to provide a price; a security with respect to which an event has occurred that is most likely to materially affect the value of the security after the market has closed but before the calculation of the Funds’ NAV or make it difficult or impossible to obtain a reliable market quotation; or a security whose price, as provided by the pricing service, does not reflect the security’s “fair value” due to the security being de-listed from a national exchange or the security’s primary trading market is temporarily closed at a time when, under normal conditions, it would be open. As a general principle, the current “fair value” of a security would be the amount which the owner might reasonably expect to receive from the sale on the applicable exchange or principal market. A variety of factors may be considered in determining the fair value of such securities.
B. Fair Value Measurements
Each Fund discloses the classification of its fair value measurements following a three-tier hierarchy based on the inputs used to measure fair value. Inputs refer broadly to the assumptions that market participants would use in pricing the asset or liability, including assumptions about risk. Inputs may be observable or unobservable. Observable inputs reflect the assumptions market participants would use in pricing the asset or liability that are developed based on market data obtained from sources independent of the reporting entity. Unobservable inputs reflect the reporting entity’s own assumptions about the assumptions market participants would use in pricing the asset or liability that are developed based on the best information available.
Valuation techniques used to value the Funds’ investments by major category are as follows:
Equity securities, including restricted securities, and Limited Partnerships for which market quotations are readily available, are valued at the last reported sale price or official closing price as reported by a third party pricing vendor on the primary market or exchange on which they are traded and are categorized as Level 1 in the hierarchy. In the event there were no sales during the day or closing prices are not available, securities are valued at the mean of the most recent quoted bid and ask prices on such day and are generally categorized as Level 2 in the hierarchy. Investments in open-end mutual funds are valued at their closing NAV each business day and are categorized as Level 1 in the hierarchy.
Changes in valuation techniques may result in transfers in or out of an assigned level within the disclosure hierarchy.
Various inputs are used in determining the value of the Funds’ investments as of the end of the reporting period. When inputs used fall into different levels of the fair value hierarchy, the level in the hierarchy within which the fair value measurement falls is determined based on the lowest level input that is significant to the fair value measurement in its entirety. The designated input levels are not necessarily an indication of the risk or liquidity associated with these investments.
These inputs are categorized in the following hierarchy under applicable financial accounting standards:
| Level 1 – | Unadjusted quoted prices in active markets for identical investments, unrestricted assets or liabilities that a Fund has the ability to access at the measurement date; |
| Level 2 – | Quoted prices which are not active, quoted prices for similar assets or liabilities in active markets or inputs other than quoted prices that are observable (either directly or indirectly) for substantially the full term of the asset or liability; and |
| Level 3 – | Significant unobservable prices or inputs (including the Fund’s own assumptions in determining the fair value of investments) where there is little or no market activity for the asset or liability at the measurement date. |
20 | May 31, 2020
Alerian Exchange Traded Funds
| Notes to Financial Statements | May 31, 2020 (Unaudited) |
The following is a summary of the inputs used to value each Fund’s investments as of May 31, 2020:
Alerian MLP ETF
| Investments in Securities at Value | Level 1 - Quoted and Unadjusted Prices | Level 2 - Other Significant Observable Inputs | Level 3 - Significant Unobservable Inputs | Total | ||||||||||||
| Master Limited Partnerships* | $ | 4,426,872,914 | $ | – | $ | – | $ | 4,426,872,914 | ||||||||
| Short Term Investments | 8,670,958 | – | – | 8,670,958 | ||||||||||||
| Total | $ | 4,435,543,872 | $ | – | $ | – | $ | 4,435,543,872 | ||||||||
Alerian Energy Infrastructure ETF
| Investments in Securities at Value | Level 1 - Quoted and Unadjusted Prices | Level 2 - Other Significant Observable Inputs | Level 3 - Significant Unobservable Inputs | Total | ||||||||||||
| Canadian Energy Infrastructure Companies* | $ | 12,142,296 | $ | – | $ | – | $ | 12,142,296 | ||||||||
| U.S. Energy Infrastructure Companies* | 10,292,862 | – | – | 10,292,862 | ||||||||||||
| U.S. Energy Infrastructure MLPs* | 9,520,150 | – | – | 9,520,150 | ||||||||||||
| U.S. General Partners* | 4,965,477 | – | – | 4,965,477 | ||||||||||||
| Short Term Investments | 997,437 | – | – | 997,437 | ||||||||||||
| Total | $ | 37,918,222 | $ | – | $ | – | $ | 37,918,222 | ||||||||
| * | For a detailed breakdown of sectors, see the accompanying Schedule of Investments. |
The Funds did not have any securities that used significant unobservable inputs (Level 3) in determining fair value and there were no transfers into or out of Level 3.
C. Foreign Currency Translation
The books and records of the Funds are maintained in U.S. dollars. Investment valuations and other assets and liabilities initially expressed in foreign currencies are converted each business day into U.S. dollars based upon current exchange rates. The portion of realized and unrealized gains or losses on investments due to fluctuations in foreign currency exchange rates is not separately disclosed and is included in realized and unrealized gains or losses on investments, when applicable.
D. Securities Transactions and Investment Income
Securities transactions are recorded as of the trade date. Realized gains and losses from securities transactions are recorded using the specific identification method. Dividend income and capital gains distributions, if any, are recorded on the ex-dividend date, net of any foreign taxes withheld. Interest income, if any, is recorded on the accrual basis, including amortization of premiums and accretion of discounts.
E. Dividends and Distributions to Shareholders
Each Fund intends to declare and make quarterly distributions, or as the Board may determine from time to time. Distributions of net realized capital gains earned by the Alerian Energy Infrastructure ETF, if any, are distributed at least annually. Distributions from net investment income and capital gains are determined in accordance with income tax regulations, which may differ from U.S. GAAP. These differences are primarily due to differing treatments of income and gains on various investment securities held by the Funds, timing differences and differing characterization of distributions made by the Funds.
Distributions received from each Fund’s investments in Master Limited Partnerships (“MLPs”) may be comprised of both income and return of capital. Each Fund records investment income and return of capital based on estimates made at the time such distributions are received. Such estimates are based on historical information available from each MLP and other industry sources. These estimates may subsequently be revised based on information received from MLPs after their tax reporting periods are concluded.
The Funds each expect a portion of its distributions to shareholders might be comprised of tax deferred return of capital. Return of capital distributions are not taxable income to the shareholder, but reduce the investor’s tax basis in the investor’s Fund Shares. Such a reduction in tax basis will result in larger taxable gains and/or lower tax losses on a subsequent sale of Fund Shares. Shareholders who periodically receive the payment of dividends or other distributions consisting of a return of capital may be under the impression that they are receiving net profits from the Funds when, in fact, they are not. Shareholders should not assume that the source of the distributions is from the net profits of the Funds.
21 | May 31, 2020
Alerian Exchange Traded Funds
| Notes to Financial Statements | May 31, 2020 (Unaudited) |
F. Federal Income Taxation and Tax Basis Information
Alerian MLP ETF
The Fund is taxed as a regular C-corporation for federal income tax purposes and as such is obligated to pay federal and state income tax. This treatment differs from most investment companies, which elect to be treated as “regulated investment companies” under the Internal Revenue Code of 1986, as amended (the “Code”) in order to avoid paying entity level income taxes. Under current law, the Fund is not eligible to elect treatment as a regulated investment company due to its investments primarily in MLPs invested in energy assets. The Fund expects that substantially all of the distributions it receives from MLPs may be treated as a tax-deferred return of capital, thus reducing the Fund’s current tax liability. However, the amount of taxes paid by the Fund will vary depending on the amount of income and gains derived from investments and/or sales of MLP interests and such taxes will reduce your return from an investment in the Fund.
Since the Fund will be subject to taxation on its taxable income, the NAV of the Fund shares will also be reduced by the accrual of any deferred tax liabilities. The Underlying Index however is calculated without any deductions for taxes. As a result, the Fund's after tax performance could differ significantly from the Underlying Index even if the pretax performance of the Fund and the performance of Underlying Index are closely related.
Cash distributions from MLPs to the Fund that exceed the Fund’s allocable share of such MLP’s net taxable income are considered a tax deferred return of capital that will reduce the Fund’s adjusted tax basis in the equity securities of the MLP. These reductions in the Fund’s adjusted tax basis in the MLP equity securities will increase the amount of any taxable gain (or decrease the amount of any tax loss) recognized by the Fund on a subsequent sale of the securities. The Fund will accrue deferred income taxes for any future tax liability associated with (i) that portion of MLP distributions considered to be a tax-deferred return of capital as well as (ii) capital appreciation of its investments. Upon the sale of an MLP security, the Fund may be liable for previously deferred taxes. The Fund will rely to some extent on information provided by the MLPs, which is not necessarily timely, to estimate the deferred tax liability for purposes of financial statement reporting and determining the Fund’s NAV. From time to time, the Adviser will modify the estimates or assumptions related to the Fund’s deferred tax liability as new information becomes available. The Fund will generally compute deferred income taxes based on the federal income tax rate applicable to corporations and an assumed rate attributable to state taxes.
The Fund’s income tax expense/(benefit) consists of the following:
| Alerian MLP ETF | Period ended May 31, 2020 | |||||||||||
| Current | Deferred | Total | ||||||||||
| Federal | $ | – | $ | (408,808,819 | ) | $ | (408,808,819 | ) | ||||
| State | – | (42,048,907 | ) | (42,048,907 | ) | |||||||
| Valuation Allowance | – | 450,857,726 | 450,857,726 | |||||||||
| Total tax expense/(benefit) | $ | – | $ | – | $ | – | ||||||
Deferred income taxes reflect the net tax effect of temporary differences between the carrying amount of assets and liabilities for financial reporting and tax purposes.
Components of the Fund’s deferred tax assets and liabilities are as follows:
| Alerian MLP ETF | As of May 31, 2020 | |||
| Deferred tax assets: | ||||
| Capital loss carryforward | $ | 361,871,768 | ||
| Net operating loss carryforward | 182,143,720 | |||
| Income recognized from MLP investments | 1,235,904,840 | |||
| Other deferred tax assets | 12,526,982 | |||
| Valuation allowance | (844,403,666 | ) | ||
| Less Deferred tax liabilities: | ||||
| Net unrealized gain on investment securities | (948,043,644 | ) | ||
| Net Deferred Tax Asset/(Liability) | $ | – | ||
22 | May 31, 2020
Alerian Exchange Traded Funds
| Notes to Financial Statements | May 31, 2020 (Unaudited) |
Due to the activities of the MLPs that the fund is invested in, the Fund is required to pay franchise tax in certain states. Generally speaking, franchise tax expense is a tax on equity of a corporation, or base minimum fees, imposed by various jurisdictions. The amounts of the tax are estimated throughout the year based upon the Fund's estimate of underlying activities conducted in the states and reconciled to actual amounts paid upon the filing of the tax returns for the states. These taxes are paid as either estimated tax payments, extension payments, or with the tax return filings of the various states.
The capital loss carryforward is available to offset future taxable income. The capital loss can be carried forward for 5 years and, accordingly, would begin to expire as of November 30, 2023. The Fund has net capital loss carryforwards for federal income tax purposes as follows:
| Alerian MLP ETF | Period-Ended | Amount | Expiration | |||||
| Federal | 11/30/2018 | 238,631,783 | 11/30/2023 | |||||
| Federal | 11/30/2019 | 775,952,106 | 11/30/2024 | |||||
| Federal | 11/30/2020 | 547,902,157 | 11/30/2025 | |||||
| Total | $ | 1,562,486,046 | ||||||
The net operating loss carryforward is available to offset future taxable income. The Fund has net operating loss carryforwards for federal income tax purposes as follows:
| Alerian MLP ETF | Period-Ended | Amount | Expiration | |||||
| Federal | 11/30/2016 | 368,943,599 | 11/30/2036 | |||||
| Federal | 11/30/2017 | 343,920,174 | 11/30/2037 | |||||
| Federal | 11/30/2020 | 50,387,233 | Indefinite | |||||
| Total | $ | 763,251,006 | ||||||
The Fund also has state tax net operating loss carryforwards of various amounts per state. The Deferred Tax Assets associated with these state tax net operating losses are as follows:
| Alerian MLP ETF | Period-Ended | Amount | Expiration | |||||
| State | 11/30/2015 | 3,371,089 | Varies by State (5-20 years) | |||||
| State | 11/30/2016 | 11,572,162 | Varies by State (5-20 years) | |||||
| State | 11/30/2017 | 5,829,393 | Varies by State (5-20 years) | |||||
| State | 11/30/2020 | 1,088,364 | Various | |||||
| Total | $ | 21,861,008 | ||||||
The Tax Cuts and Jobs Act (“TCJA”) was signed into law on December 22, 2017. The TCJA made modifications to the net operating loss (“NOL”) deduction. The TCJA eliminated the NOL carryback ability and replaced the 20 year carryforward period with an indefinite carryforward period for any NOLs arising in tax years beginning after December 31, 2017. The TCJA also established a limitation for any NOLs generated in tax years beginning after December 31, 2017 to the lesser of the aggregate of available NOLs or 80% of taxable income before any NOL utilization. The Coronavirus Aid, Relief, and Economic Stability Act (“CARES Act”) was signed into law on March 27, 2020. The CARES Act delays the application of the 80% net operating loss limitation, established under TCJA, to tax years ending November 30, 2022 and beyond.
The Fund reviews the recoverability of its deferred tax assets based upon the weight of available evidence. When assessing the recoverability of its deferred tax assets, significant weight was given to the effects of potential future realized and unrealized gains on investments and the period over which these deferred tax assets can be realized. Currently, any capital losses that may be generated by the Fund are eligible to be carried back up to three years and can be carried forward for five years to offset capital gains recognized by the Fund in those years.
Based upon the Fund’s assessment, it has determined that it is “more-likely-than-not” that a portion of its deferred tax assets will not be realized through future taxable income of the appropriate character. Accordingly, a valuation allowance has been established for the Fund’s deferred tax assets. The Fund will continue to assess the need for a valuation allowance in the future. Significant increases in the fair value of its portfolio of investments may change the Fund’s assessment of the recoverability of these assets and may result in the removal of the valuation allowance against all or a portion of the Fund’s gross deferred tax assets.
23 | May 31, 2020
Alerian Exchange Traded Funds
| Notes to Financial Statements | May 31, 2020 (Unaudited) |
Total income tax expense/(benefit) (current and deferred) differs from the amount computed by applying the federal statutory income tax rate of 21% to net investment income and realized and unrealized gain/(losses) on investment before taxes as follows:
| Alerian MLP ETF | As of May 31, 2020 | |||
| Income tax expense at statutory rate | $ | (408,312,138 | ) | |
| State income tax benefit (net of federal benefit) | (41,997,820 | ) | ||
| Permanent differences, net | (690,520 | ) | ||
| Valuation allowance | 451,000,478 | |||
| Net income tax expense | $ | – | ||
The following is a tabular reconciliation of the total amounts of unrecognized tax benefits:
| Alerian MLP ETF | Inception to May 31, 2020 | |||
| Unrecognized tax benefit - Beginning | $ | – | ||
| Gross increases - tax positions in prior period | – | |||
| Gross decreases - tax positions in prior period | – | |||
| Gross increases - tax positions in current period | – | |||
| Settlement | – | |||
| Lapse of statute of limitations | – | |||
| Unrecognized tax benefit - Ending | $ | – | ||
The Fund recognizes interest accrued related to unrecognized tax benefits and penalties as income tax expense. For the period from inception to May 31, 2020, the Fund had no accrued penalties or interest.
The Fund recognizes the tax benefits of uncertain tax positions only where the position is “more-likely-than-not” to be sustained assuming examination by tax authorities. Management has analyzed the Fund’s tax positions, and has concluded that no liability for unrecognized tax benefits should be recorded related to uncertain tax positions taken on U.S. tax returns and state tax returns filed since inception of the Fund. Tax periods ended November 30, 2016 through November 30, 2018 remain subject to examination by tax authorities in the United States. Due to the nature of the Fund’s investments, the Fund may be required to file income tax returns in several states. The Fund is not aware of any tax positions for which it is reasonably possible that the total amounts of unrecognized tax benefits will change materially in the next 12 months.
Alerian Energy Infrastructure ETF
The timing and character of income and capital gain distributions are determined in accordance with income tax regulations, which may differ from U.S. GAAP. Reclassifications are made to the Fund’s capital accounts for permanent tax differences to reflect income and gains available for distribution (or available capital loss carryforwards) under income tax regulations. The amounts and characteristics of tax basis distributions and composition of distributable earnings/(accumulated losses) are finalized at fiscal year-end; accordingly, tax basis balances have not been determined as of May 31, 2020.
No provision for income taxes is included in the accompanying financial statements, as the Alerian Energy Infrastructure ETF intends to distribute to shareholders all taxable investment income and realized gains and otherwise comply with Subchapter M of the Internal Revenue Code of 1986, as amended, applicable to regulated investment companies. The Alerian Energy Infrastructure ETF evaluates tax positions taken (or expected to be taken) in the course of preparing the Fund’s tax returns to determine whether these positions meet a “more-likely-than-not” standard that, based on the technical merits, have a more than fifty percent likelihood of being sustained by a taxing authority upon examination. A tax position that meets the “more-likely-than-not” recognition threshold is measured to determine the amount of benefit to recognize in the financial statements.
As of and during the six months ended May 31, 2020, the Alerian Energy Infrastructure ETF did not have a liability for any unrecognized tax benefits. The Alerian Energy Infrastructure ETF files U.S. federal, state, and local tax returns as required. The Fund’s tax returns are subject to examination by the relevant tax authorities until expiration of the applicable statute of limitations, which is generally three years after the filing of the tax return, but may extend to four years in certain jurisdictions. Tax returns for open years have incorporated no uncertain tax positions that require a provision for income taxes.
24 | May 31, 2020
Alerian Exchange Traded Funds
| Notes to Financial Statements | May 31, 2020 (Unaudited) |
The tax character of the distributions paid during the fiscal year ended November 30, 2019 was as follows:
Ordinary Income | Long-Term Capital Gain | Return of Capital | ||||||||||
| November 30, 2019 | ||||||||||||
| Alerian Energy Infrastructure ETF | $ | 1,375,978 | $ | – | $ | 2,575,568 | ||||||
Under current law, capital losses maintain their character as short-term or long-term and are carried forward to the next tax year without expiration. As of November 30, 2019, the following amounts are available as carry forwards to the next tax year:
| Short-Term | Long-Term | |||||||
| Alerian Energy Infrastructure ETF | $ | 1,074,081 | $ | 869,503 | ||||
As of May 31, 2020, the costs of investments for federal income tax purposes and accumulated net unrealized appreciation/(depreciation) on investments were as follows:
Alerian MLP ETF | Alerian Energy Infrastructure ETF | |||||||
| Cost of investments for income tax purposes | $ | 5,538,603,580 | $ | 54,316,125 | ||||
| Gross appreciation (excess of value over tax cost) | $ | 1,166,862,237 | $ | 6,427,751 | ||||
| Gross depreciation (excess of tax cost over value) | (2,269,921,945 | ) | (22,825,654 | ) | ||||
| Net unrealized appreciation/(depreciation) | $ | (1,103,059,708 | ) | $ | (16,397,903 | ) | ||
The difference between cost amounts for financial statement purposes is due primarily to the recognition of pass-through income from a Fund’s investments in master limited partnerships and wash sales. In addition, certain tax cost basis adjustments are finalized at fiscal year-end and therefore have not been determined as of May 31, 2020.
G. Lending of Portfolio Securities
The Alerian Energy Infrastructure ETF has entered into a securities lending agreement with State Street Bank & Trust Co. (“SSB”), the Fund’s lending agent. The Fund may lend its portfolio securities only to borrowers that are approved by SSB. The Fund will limit such lending to not more than 33 1/3% of the value of its total assets. The Fund’s securities held at SSB as custodian shall be available to be lent except those securities the Fund or ALPS Advisors, Inc. specifically identifies in writing as not being available for lending. The borrower pledges and maintains with the Fund collateral consisting of cash (U.S. Dollars only), securities issued or guaranteed by the U.S. government or its agencies or instrumentalities, and cash equivalents (including irrevocable bank letters of credit) issued by a person other than the borrower or an affiliate of the borrower. The initial collateral received by the Fund is required to have a value of no less than 102% of the market value of the loaned securities for U.S equity securities and a value of no less than 105% of the market value for non-U.S. equity securities. The collateral is maintained thereafter, at a market value equal to not less than 102% of the current value of the U.S. equity securities on loan and not less than 105% of the current value of the non-U.S. equity securities on loan. The market value of the loaned securities is determined at the close of each business day and any additional required collateral is delivered to the Fund on the next business day. During the term of the loan, the Fund is entitled to all distributions made on or in respect of the loaned securities. Loans of securities are terminable at any time and the borrower, after notice, is required to return borrowed securities within the customary time period for settlement of securities transactions.
Any cash collateral received is reinvested in a money market fund managed by SSB as disclosed in the Fund’s Schedule of Investments and is reflected in the Statements of Assets and Liabilities as a payable for collateral upon return of securities loaned. Non-cash collateral, in the form of securities issued or guaranteed by the U.S. government or its agencies or instrumentalities, is not disclosed in the Fund’s Statements of Assets and Liabilities as it is held by the lending agent on behalf of the Fund, and the Fund does not have the ability to re-hypothecate these securities. Income earned by the Fund from securities lending activity is disclosed in the Statement of Operations.
25 | May 31, 2020
Alerian Exchange Traded Funds
| Notes to Financial Statements | May 31, 2020 (Unaudited) |
The following is a summary of the Fund's securities lending agreement and related cash and non-cash collateral received as of May 31, 2020:
Market Value of Securities on Loan | Cash Collateral Received | Non-Cash Collateral Received | Total Collateral Received | |||||||||||||
| Alerian Energy Infrastructure ETF | $ | 866,651 | $ | 890,420 | $ | – | $ | 890,420 | ||||||||
The risks of securities lending include the risk that the borrower may not provide additional collateral when required or may not return the securities when due. To mitigate these risks, the Fund benefits from a borrower default indemnity provided by SSB. SSB’s indemnity allows for full replacement of securities lent wherein SSB will purchase the unreturned loaned securities on the open market by applying the proceeds of the collateral, or to the extent such proceeds are insufficient or the collateral is unavailable, SSB will purchase the unreturned loan securities at SSB’s expense. However, the Fund could suffer a loss if the value of the investments purchased with cash collateral falls below the value of the cash collateral received.
The following table reflects a breakdown of transactions accounted for as secured borrowings, the gross obligation by the type of collateral pledged or securities loaned, and the remaining contractual maturity of those transactions as of May 31, 2020:
| Alerian Energy Infrastructure ETF | Remaining contractual maturity of the agreements | ||||||||||||||||||
| Securities Lending Transactions | Overnight & Continuous | Up to 30 days | 30-90 days | Greater than 90 days | Total | ||||||||||||||
| Common Stocks | $ | 890,420 | $ | – | $ | – | $ | – | $ | 890,420 | |||||||||
| Total Borrowings | 890,420 | ||||||||||||||||||
| Gross amount of recognized liabilities for securities lending (collateral received) | $ | 890,420 | |||||||||||||||||
3. INVESTMENT ADVISORY FEE AND OTHER AFFILIATED TRANSACTIONS
ALPS Advisors, Inc. (the “Adviser”) serves as the Funds’ investment adviser pursuant to an Investment Advisory Agreement with the Trust on behalf of each Fund (the “Advisory Agreement”). Pursuant to the Advisory Agreement, each Fund pays the Adviser an annual management fee for the services and facilities it provides, payable on a monthly basis as a percentage of the relevant Fund’s average daily net assets as set out below.
| Fund | Advisory Fee | |
| Alerian MLP ETF | 0.85% | up to and including $10 billion |
| 0.80% | greater than $10 billion up to and including $15 billion | |
| 0.70% | greater than $15 billion up to and including $20 billion | |
| 0.55% | greater than $20 billion up to and including $25 billion | |
| 0.40% | greater than $25 billion |
| Fund | Advisory Fee | |
| Alerian Energy Infrastructure ETF | 0.65% |
Out of the unitary management fees, the Adviser pays substantially all expenses of each Fund, including the cost of transfer agency, custody, fund administration, legal, audit, independent trustees and other services, except for interest expenses, distribution fees or expenses, brokerage expenses, taxes and extraordinary expenses not incurred in the ordinary course of each Fund's business. The Adviser’s unitary management fee is designed to pay substantially all of each Fund’s expenses and to compensate the Adviser for providing services for each Fund.
ALPS Fund Services, Inc., an affiliate of the Adviser, is the administrator of the Funds.
Each Trustee who is not considered an “interested person” (as defined in the Investment Company Act of 1940, as amended (“1940 Act”)) (“Independent Trustees”) receives (1) a quarterly retainer of $5,000, (2) a per meeting fee for regularly scheduled meetings of $3,750, (3) $1,500 for any special meeting held outside of a regularly scheduled board meeting, and (4) reimbursement for all reasonable out-of-pocket expenses relating to attendance at meetings. Prior to January 1, 2020, a Trustee who is considered an “interested person” (as defined in the 1940 Act) (“Interested Trustee”) received no compensation or expense reimbursements from the Trust. Effective January 1, 2020 the Interested Trustee receives (1) a quarterly retainer of $5,000, (2) a per meeting fee of $3,750, (3) $1,500 for any special meeting held outside of a regularly scheduled board meeting, and (4) reimbursement for all reasonable out-of-pocket expenses relating to attendance at meetings. In addition, the Chairman of the Board and Chairman of the Audit Committee each receives a quarterly retainer of $2,000, in connection with their respective roles.
26 | May 31, 2020
Alerian Exchange Traded Funds
| Notes to Financial Statements | May 31, 2020 (Unaudited) |
4. PURCHASES AND SALES OF SECURITIES
For the six months ended May 31, 2020, the cost of purchases and proceeds from sales of investment securities, excluding short-term investments and in-kind transactions, were as follows:
| Fund | Purchases | Sales | ||||||
| Alerian MLP ETF | $ | 560,233,104 | $ | 1,800,588,999 | ||||
| Alerian Energy Infrastructure ETF | 7,689,002 | 8,130,520 | ||||||
For the year ended May 31, 2020, the cost of in-kind purchases and proceeds from in-kind sales were as follows:
| Fund | Purchases | Sales | ||||||
| Alerian MLP ETF | $ | 624,514,456 | $ | – | ||||
| Alerian Energy Infrastructure ETF | 17,181,637 | 14,544,115 | ||||||
For the six months ended May 31, 2020, the Alerian Energy Infrastructure ETF had in-kind net realized loss of $5,962,809.
Gains on in-kind transactions are not considered taxable for federal income tax purposes and losses on in-kind transactions are also not deductible for tax purposes.
5. MASTER LIMITED PARTNERSHIPS
MLPs are publicly traded partnerships engaged in, among other things, the transportation, storage and processing of minerals and natural resources, and are treated as partnerships for U.S. federal income tax purposes. By confining their operations to these specific activities, their interests, or units, are able to trade on public securities exchanges exactly like the shares of a corporation, without entity level taxation. To qualify as a MLP and to not be taxed as a corporation, a partnership must receive at least 90% of its income from qualifying sources as set forth in Section 7704(d) of the Code. These qualifying sources include, among other things, natural resource-based activities such as the processing, transportation and storage of mineral or natural resources. MLPs generally have two classes of owners, the general partner and limited partners. The general partner of an MLP is typically owned by a major energy company, an investment fund, the direct management of the MLP, or is an entity owned by one or more of such parties. The general partner may be structured as a private or publicly traded corporation or other entity. The general partner typically controls the operations and management of the MLP through an up to 2% equity interest in the MLP plus, in many cases, ownership of common units and subordinated units. Limited partners typically own the remainder of the partnership, through ownership of common units, and have a limited role in the partnership’s operations and management.
MLPs are typically structured such that common units and general partner interests have first priority to receive quarterly cash distributions up to an established minimum amount (“minimum quarterly distributions” or “MQD”). Common and general partner interests also accrue arrearages in distributions to the extent the MQD is not paid. Once common and general partner interests have been paid, subordinated units receive distributions of up to the MQD; however, subordinated units do not accrue arrearages. Distributable cash in excess of the MQD is distributed to both common and subordinated units and generally on a pro rata basis. The general partner is also eligible to receive incentive distributions if the general partner operates the business in a manner which results in distributions paid per common unit surpassing specified target levels. As the general partner increases cash distributions to the limited partners, the general partner receives an increasingly higher percentage of the incremental cash distributions.
6. CAPITAL SHARE TRANSACTIONS
Shares are created and redeemed by each Fund only in Creation Unit size aggregations of 50,000 Shares. On May 18, 2020, Alerian MLP ETF reduced its Creation Unit size from 50,000 to 25,000 shares. Only broker-dealers or large institutional investors with creation and redemption agreements called Authorized Participants (“AP”) are permitted to purchase or redeem Creation Units from the Funds. Such transactions are generally permitted on an in-kind basis, with a balancing cash component to equate the transaction to the NAV per unit of each Fund on the transaction date. Cash may be substituted equivalent to the value of certain securities generally when they are not available in sufficient quantity for delivery, not eligible for trading by the AP or as a result of other market circumstances.
27 | May 31, 2020
Alerian Exchange Traded Funds
| Notes to Financial Statements | May 31, 2020 (Unaudited) |
7. RELATED PARTY TRANSACTIONS
The Funds engaged in cross trades between other funds in the Trust during the six months ended May 31, 2020 pursuant to Rule 17a-7 under the 1940 Act. Cross trading is the buying or selling of portfolio securities between funds to which the Adviser serves as the investment adviser. The Board previously adopted procedures that apply to transactions between the Funds of the Trust pursuant to Rule 17a-7. These transactions related to cross trades during the period complied with the requirements set forth by Rule 17a-7 and the Trust’s procedures.
Transactions related to cross trades during the six months ended May 31, 2020, were as follows:
| Fund | Purchase cost paid | Sale proceeds received | Realized gain/(loss) on sales | |||||||||
| Alerian MLP ETF | $ | 486,619 | $ | 368,210 | $ | (404,096 | ) | |||||
| Alerian Energy Infrastructure ETF | 173,831 | - | - | |||||||||
8. AFFILIATED COMPANIES
As defined by the Investment Company Act of 1940, an affiliated person, including an affiliated company, is one in which a Fund owns 5% or more of the outstanding voting securities, or a company which is under common ownership or control with the Fund.
For the six months ended May 31, 2020, the Alerian MLP ETF held shares in the following affiliates, as defined by the Investment Company Act of 1940.
| Security Name | Market Value as of November 30, 2019 | Purchases | Purchases In-Kind | Sales | Market Value as of May 31, 2020 | Share Balance as of May 31, 2020 | Dividends* | Change in Unrealized Gain/(Loss) | Realized Gain/(Loss) | |||||||||||||||||||
| CNX Midstream Partners LP | $ | – | $ | 45,463,617 | $ | 1,766,867 | $ | (7,393,669 | ) | $ | 33,886,667 | 4,667,585 | $ | – | $ | (5,254,049 | ) | $ | (305,827 | ) | ||||||||
| Crestwood Equity Partners LP | 193,019,499 | 4,603,597 | 11,970,719 | (30,202,707 | ) | 82,486,634 | 5,804,830 | – | (50,638,311 | ) | (39,077,854 | ) | ||||||||||||||||
| DCP Midstream LP | 235,207,472 | 6,480,663 | 16,401,532 | (45,251,360 | ) | 115,720,880 | 10,520,080 | – | (23,852,635 | ) | (61,098,507 | ) | ||||||||||||||||
| EnLink Midstream LLC | 151,555,599 | 5,073,403 | 10,810,123 | (29,790,936 | ) | 71,398,064 | 30,253,417 | – | 14,699,397 | (72,540,873 | ) | |||||||||||||||||
| Genesis Energy LP | 255,950,735 | 7,480,047 | 16,772,874 | (44,063,876 | ) | 101,788,958 | 12,691,890 | – | (74,073,363 | ) | (51,499,564 | ) | ||||||||||||||||
| Holly Energy Partners LP | – | 81,207,994 | 3,337,299 | (12,366,245 | ) | 85,699,033 | 5,303,158 | – | 16,755,305 | (1,355,804 | ) | |||||||||||||||||
| NGL Energy Partners LP | 142,634,103 | 7,216,635 | 10,712,184 | (25,850,075 | ) | 70,372,278 | 13,798,486 | – | (25,937,392 | ) | (30,345,352 | ) | ||||||||||||||||
| NuStar Energy LP | 341,042,510 | 15,252,390 | 24,944,949 | (61,808,601 | ) | 198,690,862 | 11,438,737 | – | (73,575,316 | ) | (35,793,361 | ) | ||||||||||||||||
| Plains All American Pipeline LP | 677,150,858 | 79,631,772 | 54,199,598 | (114,234,699 | ) | 392,301,804 | 40,443,485 | – | (103,733,224 | ) | (178,853,389 | ) | ||||||||||||||||
| TC PipeLines LP | 260,040,764 | 25,075,043 | 26,821,068 | (70,746,608 | ) | 221,267,809 | 6,294,959 | – | 30,418,082 | (42,179,759 | ) | |||||||||||||||||
| Western Midstream Partners LP | 440,612,042 | 17,118,048 | 31,537,981 | (84,113,051 | ) | 218,724,867 | 23,418,080 | – | (13,903,774 | ) | (150,830,249 | ) | ||||||||||||||||
| $ | 1,592,337,856 | 164,634,707 | $ | – | $ | (309,095,280 | ) | $ | (663,880,539 | ) | ||||||||||||||||||
28 | May 31, 2020
Alerian Exchange Traded Funds
| Notes to Financial Statements | May 31, 2020 (Unaudited) |
| Investments no longer affiliated as of May 31, 2020 | ||||||||||||||||||||||||||||
| EQM Midstream Partners LP | $ | 237,295,022 | $ | 16,636,772 | $ | 21,781,332 | $ | (61,376,050 | ) | 190,084,432 | 9,673,508 | $ | – | $ | 135,380,460 | $ | (144,829,714 | ) | ||||||||||
| Magellan Midstream Partners LP | 731,291,774 | 564,371 | 67,960,709 | (169,157,304 | ) | 459,324,034 | 3,854,871 | – | (93,904,727 | ) | (54,554,938 | ) | ||||||||||||||||
| Noble Midstream Partners LP | 55,449,095 | 37,700,768 | 5,040,665 | (11,167,937 | ) | 37,276,603 | 10,130,658 | – | (17,796,271 | ) | (28,583,733 | ) | ||||||||||||||||
| Shell Midstream Partners LP | 299,598,190 | 19,999,212 | 26,489,117 | (69,131,581 | ) | 194,014,934 | 14,382,130 | – | (19,966,381 | ) | (49,769,943 | ) | ||||||||||||||||
| Tallgrass Energy LP, Class A | 346,315,139 | 316,677 | 27,153,968 | (314,114,111 | ) | – | – | – | 35,539,753 | (95,211,426 | ) | |||||||||||||||||
| $ | 880,700,003 | 38,041,167 | $ | – | $ | 39,252,834 | $ | (372,949,754 | ) | |||||||||||||||||||
| GRAND TOTAL | $ | – | $ | (269,842,446 | ) | $ | (1,036,830,293 | ) | ||||||||||||||||||||
| * | 100% of the income received was estimated as Return of Capital. |
9. MARKET DISRUPTIONS RISK
The Funds are subject to investment and operational risks associated with financial, economic and other global market developments and disruptions, including the recent spread of an infectious respiratory illness caused by a novel strain of coronavirus (known as COVID-19), which can negatively impact the securities markets and cause each Fund to lose value.
The spread of COVID-19 has caused volatility, severe market dislocations and liquidity constraints in many markets, including markets for the securities each Fund holds, and may adversely affect each Fund’s investments and operations. The transmission of COVID-19 and efforts to contain its spread have resulted in travel restrictions and disruptions, closed international borders, enhanced health screenings at ports of entry and elsewhere, disruption of and delays in healthcare service preparation and delivery, quarantines, event and service cancellations or interruptions, disruptions to business operations and supply chains, and a reduction in consumer and business spending, as well as general concern and uncertainty that has negatively affected the economy. These disruptions have led to instability in the market place and the jobs market. The impact of COVID-19 could adversely affect the economies of many nations or the entire global economy, the financial well-being and performance of individual issuers, borrowers and sectors and the health of the markets generally in potentially significant and unforeseen ways.
The foregoing could lead to a significant economic downturn or recession, increased market volatility, a greater number of market closures, higher default rates and adverse effects on the values and liquidity of each Fund’s securities or other assets. Such impacts may adversely affect the performance of the Funds.
10. SUBSEQUENT EVENTS
Effective July 1, 2020, each Trustee will be compensated a quarterly retainer of $10,000, and a per meeting fee of $5,000.
29 | May 31, 2020
Alerian Exchange Traded Funds
| Additional Information | May 31, 2020 (Unaudited) |
PROXY VOTING RECORDS, POLICIES AND PROCEDURES
Information regarding how each Fund voted proxies relating to portfolio securities during the most recent 12-month period ended June 30 and a description of the Funds’ proxy voting policies and procedures used in determining how to vote for proxies are available without charge on the SEC’s website at www.sec.gov and upon request, by calling (toll-free) 1-866-675-2639.
PORTFOLIO HOLDINGS
The Fund files a complete schedule of portfolio holdings with the U.S. Securities and Exchange Commission (“SEC”) for the first and third quarters of each fiscal year on Form N-PORT within 60 days after the end of the period. Copies of the Fund’s Form N-PORT are available without a charge, upon request, by contacting the Fund at 1-855-838-9485 and on the SEC’s website at https://www.sec.gov.
TAX INFORMATION
The Fund designates the following as a percentage of taxable ordinary income distributions, or up to the maximum amount allowable, for the calendar year ended December 31, 2019:
| Qualified Dividend Income | Dividend Received Deduction | |
| Alerian Energy Infrastructure ETF | 100.00% | 37.15% |
In early 2020, if applicable, shareholders of record received this information for the distribution paid to them by the Fund during the calendar year 2019 via Form 1099. The Fund will notify shareholders in early 2021 of amounts paid to them by the Fund, if any, during the calendar year 2020.
LICENSING AGREEMENTS
Alerian (the “Licensor”) has entered into an index licensing agreement with ALPS Advisors Inc. (the “Adviser”) with respect to each of the Alerian MLP ETF and the Alerian Energy Infrastructure ETF, to allow the Adviser’s use of AMZI and AMEI. The following disclosure relates to the Licensor: Alerian is the designer of the construction and methodology for the underlying index (each an “Underlying Index”) for each of the Alerian MLP ETF and the Alerian Energy Infrastructure ETF (each a “Fund” and collectively, the “Funds”). “Alerian,” “Alerian MLP Infrastructure Index,” “Alerian Energy Infrastructure Index,” “Alerian Index Series” and “AMZI” are service marks or trademarks of Alerian. Alerian acts as brand licensor for each Underlying Index. Alerian is not responsible for the descriptions of either Underlying Index or the Funds that appear herein. Alerian is not affiliated with the Trust, the Adviser or the Distributor.
Neither Fund is issued, sponsored, endorsed, sold or promoted by Alerian (“Licensor”) or its affiliates. Licensor makes no representation or warranty, express or implied, to the owners of the Fund or any member of the public regarding the advisability of investing in securities generally or in the Fund particularly or the ability of the Alerian MLP Infrastructure Index (“Index”) to track general market performance. Licensor’s only relationship to the Licensee is the licensing of the Index which is determined, composed and calculated by Licensor without regard to the Licensee or the Fund. Licensor has no obligation to take the needs of the Licensee or the owners of the Fund into consideration in determining, composing or calculating the Index. Licensor is not responsible for and has not participated in the determination of the timing of, prices at, or quantities of the Fund to be issued or in the determination or calculation of the equation by which the Fund is to be converted into cash. Licensor has no obligation or liability in connection with the issuance, administration, marketing or trading of either Fund and is not responsible for and has not participated in the determination of pricing or the timing of the issuance or sale of the Shares of either Fund or in the determination or calculation of the NAV of the relevant Fund. Alerian MLP Infrastructure Index, Alerian MLP Infrastructure Total Return Index, AMZI and AMZIX are trademarks of GKD Index Partners, LLC and their general use is granted under a license from GKD Index Partners, LLC.
LICENSOR DOES NOT GUARANTEE THE QUALITY, ACCURACY AND/OR THE COMPLETENESS OF THE INDEX OR ANY DATA INCLUDED THEREIN AND SHALL HAVE NO LIABILITY FOR ERRORS OR OMISSIONS OF ANY KIND RELATED TO THE INDEX OR DATA. LICENSOR MAKES NO WARRANTY, EXPRESS OR IMPLIED, AS TO RESULTS TO BE OBTAINED BY LICENSEE, OWNERS OF THE FUND, OR ANY OTHER PERSON OR ENTITY FROM THE USE OF THE INDEX OR ANY DATA INCLUDED THEREIN IN CONNECTION WITH THE RIGHTS LICENSED TO LICENSEE OR FOR ANY OTHER USE. LICENSOR MAKES NO EXPRESS OR IMPLIED WARRANTIES, AND HEREBY EXPRESSLY DISCLAIMS ALL WARRANTIES OF MERCHANTABILITY OR FITNESS FOR A PARTICULAR PURPOSE OR USE WITH RESPECT TO THE INDEX OR ANY DATA INCLUDED THEREIN. WITHOUT LIMITING ANY OF THE FOREGOING, IN NO EVENT SHALL LICENSOR HAVE ANY LIABILITY FOR ANY SPECIAL, PUNITIVE, INDIRECT, OR CONSEQUENTIAL DAMAGES (INCLUDING LOST PROFITS), EVEN IF NOTIFIED OF THE POSSIBILITY OF SUCH DAMAGES.
30 | May 31, 2020
Alerian Exchange Traded Funds
| Additional Information | May 31, 2020 (Unaudited) |
The Adviser does not guarantee the accuracy and/or the completeness of either Underlying Index or any data included therein, and the Adviser shall have no liability for any errors, omissions or interruptions therein. The Adviser makes no warranty, express or implied, as to results to be obtained by either Fund, owners of the Shares of the relevant Fund or any other person or entity from the use of either Underlying Index or any data included therein. The Adviser makes no express or implied warranties, and expressly disclaims all warranties of merchantability or fitness for a particular purpose or use with respect to either Underlying Index or any data included therein. Without limiting any of the foregoing, in no event shall the Adviser have any liability for any special, punitive, direct, indirect, or consequential damages (including lost profits) arising out of matters relating to the use of either Underlying Index, even if notified of the possibility of such damages.
(Applicable to the Alerian Energy Infrastructure ETF only)
The Underlying Index is the exclusive property of GKD Index Partners LLC d/b/a Alerian, which has contracted with S&P Opco, LLC (a subsidiary of S&P Dow Jones Indices LLC) (“S&P Dow Jones Indices”) to calculate and maintain the Underlying Index. S&P® is a registered trademark of Standard & Poor’s Financial Services LLC (“SPFS”); Dow Jones® is a registered trademark of Dow Jones Trademark Holdings LLC (“Dow Jones”); and these trademarks have been licensed to S&P Dow Jones Indices. “Calculated by S&P Dow Jones Indices” and its related stylized mark(s) have been licensed for use by Alerian.
The Fund is not sponsored, endorsed, sold or promoted by S&P Dow Jones Indices, SPFS, Dow Jones or any of their affiliates (collectively, “S&P Dow Jones Indices Entities”). S&P Dow Jones Indices Entities do not make any representation or warranty, express or implied, to the owners of the Fund or any member of the public regarding the advisability of investing in securities generally or in the Fund particularly or the ability of the Underlying Index to track general market performance. S&P Dow Jones Indices Entities only relationship to Alerian with respect to the Underlying Index is the licensing of certain trademarks, service marks and trade names of S&P Dow Jones Indices Entities and for the providing of calculation and maintenance services related to the Underlying Index. S&P Dow Jones Indices Entities are not responsible for and have not participated in the determination of the prices and amount of the Fund or the timing of the issuance or sale of the Fund or in the determination or calculation of the equation by which the Fund is to be converted into cash. S&P Dow Jones Indices Entities have no obligation or liability in connection with the administration, marketing or trading of the Fund. S&P Dow Jones Indices LLC is not an investment advisor. Inclusion of a security within the Underlying Index is not a recommendation by S&P Dow Jones Indices Entities to buy, sell, or hold such security, nor is it considered to be investment advice.
S&P DOW JONES INDICES ENTITIES DO NOT GUARANTEE THE ADEQUACY, ACCURACY, TIMELINESS AND/OR THE COMPLETENESS OF THE UNDERLYING INDEX OR ANY DATA RELATED THERETO OR ANY COMMUNICATION, INCLUDING BUT NOT LIMITED TO, ORAL OR WRITTEN COMMUNICATION (INCLUDING ELECTRONIC COMMUNICATIONS) WITH RESPECT THERETO. S&P DOW JONES INDICES ENTITIES SHALL NOT BE SUBJECT TO ANY DAMAGES OR LIABILITY FOR ANY ERRORS, OMISSIONS, OR DELAYS THEREIN. S&P DOW JONES INDICES ENTITIES MAKE NO EXPRESS OR IMPLIED WARRANTIES, AND EXPRESSLY DISCLAIMS ALL WARRANTIES, OF MERCHANTABILITY OR FITNESS FOR A PARTICULAR PURPOSE OR USE OR AS TO RESULTS TO BE OBTAINED BY ALERIAN, OWNERS OF THE FUND, OR ANY OTHER PERSON OR ENTITY FROM THE USE OF THE UNDERLYING INDEX OR WITH RESPECT TO ANY DATA RELATED THERETO. WITHOUT LIMITING ANY OF THE FOREGOING, IN NO EVENT WHATSOEVER SHALL S&P DOW JONES INDICES ENTITIES BE LIABLE FOR ANY INDIRECT, SPECIAL, INCIDENTAL, PUNITIVE, OR CONSEQUENTIAL DAMAGES INCLUDING BUT NOT LIMITED TO, LOSS OF PROFITS, TRADING LOSSES, LOST TIME OR GOODWILL, EVEN IF THEY HAVE BEEN ADVISED OF THE POSSIBILITY OF SUCH DAMAGES, WHETHER IN CONTRACT, TORT, STRICT LIABILITY, OR OTHERWISE.
31 | May 31, 2020
Alerian Exchange Traded Funds
| Liquidity Risk Management Program | May 31, 2020 (Unaudited) |
In compliance with the Securities and Exchange Commission’s liquidity risk management rule (the “Liquidity Rule”), the ALPS ETF Trust (the “Trust”) has established a liquidity risk management program (the “Program”) to govern the Trust’s approach to managing liquidity risk for each series of the Trust (each a “Fund”). The Program is overseen by the Liquidity Committee (the “Committee”), a committee comprised of representatives of the Trust’s investment adviser, ALPS Advisors, Inc. The Trust’s Board of Trustees (the “Board”) has approved the designation of the Committee to oversee the Program.
The Program’s principal objectives include supporting each Fund’s compliance with limits on investments in illiquid assets and assessing and managing the risk that a Fund will be unable to meet its redemption obligations without significant dilution of remaining investors’ interests in the Fund. The Program includes a number of elements that support the management and assessment of liquidity risk, including an annual assessment of factors that influence a Fund’s liquidity and, for Funds that are not “In-Kind ETFs,” the periodic classification and re-classification of such Fund’s investments into groupings that reflect the Committee’s assessment of their liquidity under current market conditions.
At a meeting of the Board held on March 2, 2020, the Trustees received a report from the Committee regarding the design and operational effectiveness of the Program since its implementation on December 1, 2018. The Committee determined, and reported to the Board, that the Program has been operating effectively to assess and manage each Fund’s liquidity risk and has been and continues to be adequately and effectively implemented to monitor and (as applicable) respond to the Funds’ liquidity developments.
The Committee reported that during the period covered by the report, there were no liquidity events that impacted the Funds or their ability to timely meet redemptions without dilution to existing shareholders. Among other things, the Committee’s report noted that no Fund is required to have a highly liquid investment minimum based either on its status as an In-Kind ETF or on its ability to rely on another exemption under the Liquidity Rule. The Committee’s report further noted that no material changes have been made to the Program since its implementation.
32 | May 31, 2020


Table of Contents
| Performance Overview | 1 |
| Disclosure of Fund Expenses | 3 |
| Financial Statements | |
| Schedule of Investments | 4 |
| Statement of Assets and Liabilities | 5 |
| Statement of Operations | 6 |
| Statements of Changes in Net Assets | 7 |
| Financial Highlights | 8 |
| Notes to Financial Statements | 9 |
| Additional Information | 15 |
| Liquidity Risk Management Program | 16 |
Beginning on January 1, 2021, as permitted by regulations adopted by the U.S. Securities and Exchange Commission, paper copies of the Fund’s annual and semi-annual shareholder reports will no longer be sent by mail, unless you specifically request paper copies of the reports from your financial intermediary (such as a broker-dealer or bank). Instead, the reports will be made available on the Fund’s website (www.alpsfunds.com), and you will be notified by mail each time a report is posted and provided with a website link to access the report.
If you already elected to receive shareholder reports electronically, you will not be affected by this change and you need not take any action. You may elect to receive shareholder reports and other communications from a Fund electronically anytime by contacting your financial intermediary.
You may elect to receive all future reports in paper free of charge. You can contact your financial intermediary to request that you continue to receive paper copies of your shareholder reports. Your election to receive reports in paper will apply to all funds held in your account with your financial intermediary.
alpsfunds.com
ALPS Equal Sector Weight ETF
| Performance Overview | May 31, 2020 (Unaudited) |
Investment Objective
The ALPS Equal Sector Weight ETF (the “Fund” or “EQL”) seeks investment results that replicate as closely as possible, before fees and expenses, the performance of the NYSE Equal Sector Weight IndexSM (the “Underlying Index”).
The Underlying Index is an index of ETFs comprised of all active Select Sector SPDR® ETFs in an equal weighted portfolio. These are the Communication Services Select Sector SPDR® Fund, Consumer Discretionary Select Sector SPDR® Fund, Consumer Staples Select Sector SPDR® Fund, Materials Select Sector SPDR® Fund, Energy Select Sector SPDR® Fund, Technology Select Sector SPDR® Fund, Utilities Select Sector SPDR® Fund, Financial Select Sector SPDR® Fund, Industrial Select Sector SPDR® Fund, Health Care Select Sector SPDR® Fund and Real Estate Select Sector SPDR® Fund (each, an “Underlying Sector ETF” and collectively, the “Underlying Sector ETFs”). In order to track the Underlying Index, the Fund will use a “fund of funds” approach, and seek to achieve its investment objective by investing at least 90% of its total assets in the shares of the Underlying Sector ETFs.
The Underlying Index is designed to track performance of the equally weighted Underlying Sector ETFs. Accordingly, the Underlying Index is rebalanced to an equal weighting quarterly during the months of March, June, September, and December.
Each Underlying Sector ETF is an “index fund” that invests in the equity securities of companies in a particular sector or group of industries. The objective of each Underlying Sector ETF is to track its respective underlying sector index by replicating the securities in the underlying sector index. Together, the Underlying Sector ETFs represent the Underlying Index as a whole.
Performance (as of May 31, 2020)
| 6 Month | 1 Year | 5 Year | 10 Year | Since Inception^ | |
| ALPS Equal Sector Weight ETF - NAV | -5.85% | 6.15% | 7.21% | 11.41% | 12.57% |
| ALPS Equal Sector Weight ETF - Market Price* | -5.70% | 6.23% | 7.24% | 11.43% | 12.60% |
| NYSE® Equal Sector Weight Total Return Index | -5.67% | 6.42% | 7.39% | 11.69% | 12.86% |
| S&P 500® Total Return Index | -2.10% | 12.84% | 9.86% | 13.15% | 14.19% |
Total Expense Ratio (per the current Prospectus) is 0.50%. Net Expense Ratio (per the current Prospectus) is 0.28%. Net expense ratio reflects the reimbursement of distribution fees for underlying sector ETFs. In addition, the Adviser has contractually agreed, through March 31, 2021, to reduce its advisory fee by 0.19%. This fee waiver may only be terminated by the Fund’s Board of Trustees (and not by the Adviser) prior to such date. Please see the prospectus for additional information.
Performance data quoted represents past performance. Past performance does not guarantee future results. Total return figures assume reinvestment of dividends and capital gains distributions, if any. The table does not reflect the deduction of taxes that a shareholder would pay on Fund distributions or the redemption of Fund shares. Investment return and principal value of an investment will fluctuate so that an investor’s shares, when sold or redeemed, may be worth more or less than the original cost. Current performance data may be higher or lower than actual data quoted. For the most current month-end performance data please visit www.alpsfunds.com or call 1.866.675.2639.
NAV is an exchange-traded fund’s per-share value. The per-share dollar amount of the Fund is derived by dividing the total value of all the securities in its portfolio, less any liabilities, by the number of Fund shares outstanding. Market Price is the price at which a share can currently be traded in the market. Information detailing the number of days the Market Price of the Fund was greater than the Fund’s NAV and the number of days it was less than the Fund’s NAV can be obtained at www.alpsfunds.com.
| ^ | The Fund commenced Investment Operations on July 6, 2009 with an Inception Date, the first day of trading on the Exchange, of July 7, 2009. |
| * | Market Price is based on the midpoint of the bid/ask spread at 4 p.m. ET and does not represent the returns an investor would receive if shares were traded at other times. |
The NYSE® Equal Sector Weight Total Return Index consists of a strategy that holds all active Select Sector SPDR® ETFs in an equal-weighted portfolio. Total return assumes reinvestment of any dividends and distributions realized during a given time period.
S&P 500® Total Return Index: the Standard & Poor’s composite index of 500 stocks, a widely recognized, unmanaged index of common stock prices. Total return assumes reinvestment of any dividends and distributions realized during a given time period.
The indexes are not actively managed and do not reflect any deductions for fees, expenses or taxes. The indexes are reported on a total return basis, which assumes reinvestment of any dividends and distributions realized during a given time period. One cannot invest directly in an index. Index performance does not reflect fund performance.
The Fund’s shares are not individually redeemable. Investors buy and sell shares of the Fund on a secondary market. Only market makers or “authorized participants” may trade directly with the Fund, typically in blocks of 50,000 shares.
The ALPS Equal Sector Weight ETF is not suitable for all investors. Investments in the Fund are subject to investment risks, including possible loss of the principal amount invested.
ALPS Portfolio Solutions Distributor, Inc., a FINRA member, is the distributor for the Fund.
1 | May 31, 2020
ALPS Equal Sector Weight ETF
| Performance Overview | May 31, 2020 (Unaudited) |
The following table shows the sector weights of both the Fund and the S&P 500® Total Return Index as of May 31, 2020:
Sector Weighting Comparison (as of May 31, 2020)
| EQL* | S&P 500® | +/- | |
| Energy | 9.8% | 2.9% | 6.9% |
| Communication Services | 9.5% | 11.0% | -1.5% |
| Materials | 9.4% | 2.6% | 6.8% |
| Consumer Discretionary | 9.4% | 10.6% | -1.2% |
| Technology | 9.4% | 26.2% | -16.8% |
| Industrials | 9.2% | 8.0% | 1.2% |
| Financials | 9.0% | 10.4% | -1.4% |
| Healthcare | 8.8% | 15.2% | -6.4% |
| Real Estate | 8.6% | 2.8% | 5.8% |
| Utilities | 8.5% | 3.2% | 5.3% |
| Consumer Staples | 8.4% | 7.1% | 1.3% |
| Total | 100.0% | 100.0% |
Source: S&P 500®
| * | % of Total Investments (excluding investments purchased with collateral from securities loaned). |
Future holdings are subject to change.
Growth of $10,000 (as of May 31, 2020)
Comparison of Change in Value of $10,000 Investment in the Fund and the Indexes
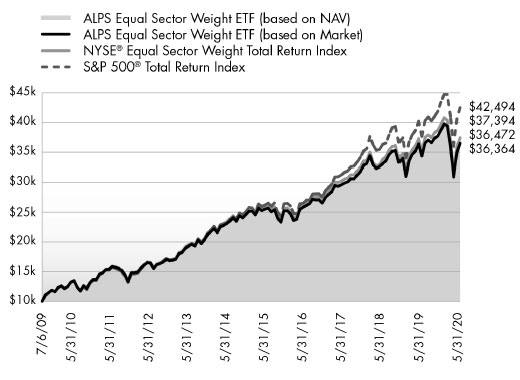
The chart above compares historical performance of a hypothetical investment of $10,000 in the Fund since inception with the performance of the Fund’s benchmark index. Past performance does not guarantee future results. The chart does not reflect the deduction of taxes that a shareholder would pay on Fund distributions or the redemption of Fund shares.
2 | May 31, 2020
ALPS Equal Sector Weight ETF
| Disclosure of Fund Expenses | May 31, 2020 (Unaudited) |
Shareholder Expense Example: As a shareholder of the Fund, you incur two types of costs: (1) transaction costs which may include creation and redemption fees or brokerage charges, and (2) ongoing costs, including management fees and other Fund expenses. These examples are intended to help you understand your ongoing costs (in dollars) of investing in the Fund and to compare these costs with the ongoing costs of investing in other funds. The example is based on an investment of $1,000 invested at the beginning of the (six month) period and held through May 31, 2020.
Actual Return: The first line of the table provides information about actual account values and actual expenses. You may use the information in this line, together with the amount you invested, to estimate the expenses that you incurred over the period. Simply divide your account value by $1,000 (for example, an $8,600 account value divided by $1,000 = 8.6), then multiply the result by the number in the first line under the heading entitled “Expenses Paid During Period” to estimate the expenses attributable to your investment during this period.
Hypothetical 5% Return: The second line of the table provides information about hypothetical account values and hypothetical expenses based on the Fund’s actual expense ratio and an assumed rate of return of 5% per year before expenses, which is not the Fund’s actual return. The hypothetical account values and expenses may not be used to estimate the actual ending account balance or expenses you paid for the period. You may use this information to compare ongoing costs of investing in the Fund and other funds. To do so, compare this 5% hypothetical example with the 5% hypothetical examples that appear in the shareholder reports of other funds.
The expenses shown in the table are meant to highlight ongoing Fund costs only and do not reflect any transaction costs, such as creation and redemption fees or brokerage charges. Therefore, the second line of the table is useful in comparing ongoing costs only, and will not help you determine the relative total costs of owning different funds. In addition, if these costs were included, your costs would have been higher.
Beginning Account Value 12/1/19 | Ending Account Value 5/31/20 | Expense Ratio(a) | Expenses Paid During Period 12/1/19 - 5/31/20(b) | |
| ALPS Equal Sector Weight ETF | ||||
| Actual | $1,000.00 | $941.50 | 0.15% | $0.73 |
| Hypothetical (5% return before expenses) | $1,000.00 | $1,024.25 | 0.15% | $0.76 |
| (a) | Annualized, based on the Fund’s most recent fiscal half year expenses. |
| (b) | Expenses are equal to the Fund’s annualized expense ratio multiplied by the average account value over the period, multiplied by the number of days in the most recent fiscal half year (183), divided by 366. |
3 | May 31, 2020
ALPS Equal Sector Weight ETF
| Schedule of Investments | May 31, 2020 (Unaudited) |
| Security Description | Shares | Value | ||||||
| EXCHANGE TRADED FUNDS (99.99%) | ||||||||
| Communication Services (9.56%) | ||||||||
| Communication Services Select Sector SPDR Fund | 256,963 | $ | 13,881,141 | |||||
| Consumer Discretionary (9.42%) | ||||||||
| Consumer Discretionary Select Sector SPDR Fund | 110,148 | 13,679,280 | ||||||
| Consumer Staples (8.39%) | ||||||||
| Consumer Staples Select Sector SPDR Fund | 205,608 | 12,178,162 | ||||||
| Energy (9.79%) | ||||||||
| Energy Select Sector SPDR Fund(a) | 366,405 | 14,201,858 | ||||||
| Financials (8.96%) | ||||||||
| Financial Select Sector SPDR Fund(a) | 555,584 | 13,006,222 | ||||||
| Healthcare (8.76%) | ||||||||
| Health Care Select Sector SPDR Fund(a) | 123,427 | 12,714,215 | ||||||
| Industrials (9.19%) | ||||||||
| Industrial Select Sector SPDR Fund(a) | 197,137 | 13,340,261 | ||||||
| Materials (9.46%) | ||||||||
| Materials Select Sector SPDR Fund(a) | 247,500 | 13,723,875 | ||||||
| Real Estate (8.60%) | ||||||||
| Real Estate Select Sector SPDR Fund | 360,150 | 12,479,197 | ||||||
| Technology (9.41%) | ||||||||
| Technology Select Sector SPDR Fund | 139,363 | 13,653,393 | ||||||
| Utilities (8.45%) | ||||||||
| Utilities Select Sector SPDR Fund(a) | 205,512 | 12,267,011 | ||||||
| TOTAL EXCHANGE TRADED FUNDS | ||||||||
| (Cost $120,813,698) | 145,124,615 | |||||||
| 7 Day Yield | Shares | Value | ||||||||||
| SHORT TERM INVESTMENTS (7.81%) | ||||||||||||
| Money Market Fund (0.01%) | ||||||||||||
| State Street Institutional Treasury Plus Money Market Fund | ||||||||||||
| (Cost $18,587) | 0.15 | % | 18,587 | $ | 18,587 | |||||||
| Investments Purchased with Collateral from Securities Loaned (7.80%) | ||||||||||||
| State Street Navigator Securities Lending Government Money Market Portfolio, 0.15% | ||||||||||||
| (Cost $11,316,974) | 11,316,974 | 11,316,974 | ||||||||||
| TOTAL SHORT TERM INVESTMENTS | ||||||||||||
| (Cost $11,335,561) | 11,335,561 | |||||||||||
| TOTAL INVESTMENTS (107.81%) | ||||||||||||
| (Cost $132,149,259) | $ | 156,460,176 | ||||||||||
| LIABILITIES IN EXCESS OF OTHER ASSETS (-7.81%) | (11,328,890 | ) | ||||||||||
| NET ASSETS - 100.00% | $ | 145,131,286 | ||||||||||
| (a) | Security, or a portion of the security position is currently on loan. The total market value of securities on loan is $40,535,598. |
Common Abbreviations:
SPDR® - Standard & Poor’s Depositary Receipts
See Notes to Financial Statements.
4 | May 31, 2020
ALPS Equal Sector Weight ETF
| Statement of Assets and Liabilities | May 31, 2020 (Unaudited) |
| ASSETS: | ||||
| Investments, at value | $ | 156,460,176 | ||
| Dividends receivable | 5,481 | |||
| Total Assets | 156,465,657 | |||
LIABILITIES: | ||||
| Payable to adviser | 17,397 | |||
| Payable for collateral upon return of securities loaned | 11,316,974 | |||
| Total Liabilities | 11,334,371 | |||
| NET ASSETS | $ | 145,131,286 | ||
| NET ASSETS CONSIST OF: | ||||
| Paid-in capital | $ | 112,137,952 | ||
| Total distributable earnings | 32,993,334 | |||
| NET ASSETS | $ | 145,131,286 | ||
| INVESTMENTS, AT COST | $ | 132,149,259 | ||
| PRICING OF SHARES | ||||
| Net Assets | $ | 145,131,286 | ||
| Shares of beneficial interest outstanding (Unlimited number of shares authorized, par value $0.01 per share) | 2,000,000 | |||
| Net Asset Value, offering and redemption price per share | $ | 72.57 | ||
See Notes to Financial Statements.
5 | May 31, 2020
ALPS Equal Sector Weight ETF
| Statement of Operations | For the Six Months Ended May 31, 2020 (Unaudited) |
| INVESTMENT INCOME: | ||||
| Dividends | $ | 2,325,188 | ||
| Securities Lending Income | 20,459 | |||
| Total Investment Income | 2,345,647 | |||
EXPENSES: | ||||
| Investment adviser fees | 279,363 | |||
| Total Expenses before waiver/reimbursement | 279,363 | |||
| Less fee waiver/reimbursement by investment adviser | (166,108 | ) | ||
| Net Expenses | 113,255 | |||
| NET INVESTMENT INCOME | 2,232,392 | |||
| REALIZED AND UNREALIZED GAIN/(LOSS): | ||||
| Net realized gain on investments | 9,534,015 | |||
| Net change in unrealized appreciation/depreciation on investments | (21,950,657 | ) | ||
| NET REALIZED AND UNREALIZED LOSS ON INVESTMENTS | (12,416,642 | ) | ||
| NET DECREASE IN NET ASSETS RESULTING FROM OPERATIONS | $ | (10,184,250 | ) | |
See Notes to Financial Statements.
6 | May 31, 2020
ALPS Equal Sector Weight ETF
| Statements of Changes in Net Assets |
| For the Six Months Ended May 31, 2020 (Unaudited) | For the Year Ended November 30, 2019 | |||||||
| OPERATIONS: | ||||||||
| Net investment income | $ | 2,232,392 | $ | 3,291,025 | ||||
| Net realized gain | 9,534,015 | 4,595,674 | ||||||
| Net change in unrealized appreciation/depreciation | (21,950,657 | ) | 12,663,405 | |||||
| Net increase/(decrease) in net assets resulting from operations | (10,184,250 | ) | 20,550,104 | |||||
| DISTRIBUTIONS TO SHAREHOLDERS: | ||||||||
| From distributable earnings | (2,309,510 | ) | (3,395,008 | ) | ||||
| Total distributions | (2,309,510 | ) | (3,395,008 | ) | ||||
| CAPITAL SHARE TRANSACTIONS: | ||||||||
| Proceeds from sale of shares | 17,482,034 | 14,156,882 | ||||||
| Cost of shares redeemed | (28,264,313 | ) | (17,646,683 | ) | ||||
| Net decrease from capital share transactions | (10,782,279 | ) | (3,489,801 | ) | ||||
| Net increase/(decrease) in net assets | (23,276,039 | ) | 13,665,295 | |||||
| NET ASSETS: | ||||||||
| Beginning of period | 168,407,325 | 154,742,030 | ||||||
| End of period | $ | 145,131,286 | $ | 168,407,325 | ||||
| OTHER INFORMATION: | ||||||||
| CAPITAL SHARE TRANSACTIONS: | ||||||||
| Beginning shares | 2,150,000 | 2,200,000 | ||||||
| Shares sold | 250,000 | 200,000 | ||||||
| Shares redeemed | (400,000 | ) | (250,000 | ) | ||||
| Shares outstanding, end of period | 2,000,000 | 2,150,000 | ||||||
See Notes to Financial Statements.
7 | May 31, 2020
ALPS Equal Sector Weight ETF
| Financial Highlights | For a Share Outstanding Throughout the Periods Presented |
For the 2020 | For the Year Ended | For the Year Ended | For the Year Ended | For the Year Ended | For the Year Ended | |||||||||||||||||||
| NET ASSET VALUE, BEGINNING OF PERIOD | $ | 78.33 | $ | 70.34 | $ | 69.28 | $ | 59.74 | $ | 56.16 | $ | 57.01 | ||||||||||||
| INCOME FROM OPERATIONS: | ||||||||||||||||||||||||
| Net investment income(a) | 1.09 | 1.53 | 1.50 | 1.37 | 1.66 | 1.09 | ||||||||||||||||||
| Net realized and unrealized gain/(loss) | (5.74 | ) | 8.03 | 1.02 | 10.03 | 3.11 | (0.84 | ) | ||||||||||||||||
| Total from investment operations | (4.65 | ) | 9.56 | 2.52 | 11.40 | 4.77 | 0.25 | |||||||||||||||||
| DISTRIBUTIONS: | ||||||||||||||||||||||||
| From net investment income | (1.11 | ) | (1.57 | ) | (1.46 | ) | (1.86 | ) | (1.19 | ) | (1.10 | ) | ||||||||||||
| Total distributions | (1.11 | ) | (1.57 | ) | (1.46 | ) | (1.86 | ) | (1.19 | ) | (1.10 | ) | ||||||||||||
| NET INCREASE/(DECREASE) IN NET ASSET VALUE | (5.76 | ) | 7.99 | 1.06 | 9.54 | 3.58 | (0.85 | ) | ||||||||||||||||
| NET ASSET VALUE, END OF PERIOD | $ | 72.57 | $ | 78.33 | $ | 70.34 | $ | 69.28 | $ | 59.74 | $ | 56.16 | ||||||||||||
| TOTAL RETURN(b) | (5.85 | )% | 13.86 | % | 3.66 | % | 19.46 | % | 8.62 | % | 0.48 | % | ||||||||||||
| RATIOS/SUPPLEMENTAL DATA: | ||||||||||||||||||||||||
| Net assets, end of period (in 000s) | $ | 145,131 | $ | 168,407 | $ | 154,742 | $ | 166,284 | $ | 140,391 | $ | 140,407 | ||||||||||||
| RATIOS TO AVERAGE NET ASSETS | ||||||||||||||||||||||||
| Ratio of expenses excluding waiver/reimbursement to average net assets | 0.37 | %(c) | 0.37 | % | 0.37 | % | 0.37 | % | 0.37 | % | 0.37 | % | ||||||||||||
| Ratio of expenses including waiver/reimbursement to average net assets | 0.15 | %(c) | 0.15 | % | 0.15 | % | 0.15 | % | 0.15 | % | 0.21 | %(d) | ||||||||||||
| Ratio of net investment income excluding waiver/reimbursement to average net assets | 2.74 | %(c) | 1.89 | % | 1.92 | % | 1.92 | % | 2.71 | % | 1.78 | % | ||||||||||||
| Ratio of net investment income including waiver/reimbursement to average net assets | 2.96 | %(c) | 2.11 | % | 2.14 | % | 2.14 | % | 2.93 | % | 1.94 | %(d) | ||||||||||||
| Portfolio turnover rate(e) | 6 | % | 4 | % | 14 | % | 5 | % | 13 | % | 6 | % | ||||||||||||
| (a) | Based on average shares outstanding during the period. |
| (b) | Total return is calculated assuming an initial investment made at the net asset value at the beginning of the period and redemption at the net asset value on the last day of the period and assuming all distributions are reinvested at the reinvestment prices. |
| (c) | Annualized. |
| (d) | The effective expense ratio including waivers changed from 0.34% to 0.15% effective April 1, 2015 through March 31, 2016. |
| (e) | Portfolio turnover for periods less than one year are not annualized and does not include securities received or delivered from processing creations or redemptions in-kind. |
See Notes to Financial Statements.
8 | May 31, 2020
ALPS Equal Sector Weight ETF
| Notes to Financial Statements | May 31, 2020 (Unaudited) |
1. ORGANIZATION
ALPS ETF Trust (the “Trust”), a Delaware statutory trust, is an open-end management investment company registered under the Investment Company Act of 1940, as amended (the “1940 Act”). As of May 31, 2020, the Trust consists of sixteen separate portfolios. Each portfolio represents a separate series of the Trust. This report pertains solely to the ALPS Equal Sector Weight ETF (the “Fund”). The investment objective of the Fund is to seek investment results that replicate as closely as possible, before fees and expenses, the performance of the NYSE® Equal Sector Weight Index (the “Underlying Index”). The Fund is considered non-diversified and may invest a greater portion of assets in securities of individual issuers than a diversified fund. As a result, changes in the market value of a single investment could cause greater fluctuations in share price than would occur in a diversified fund.
The Fund’s Shares (“Shares”) are listed on the NYSE Arca, Inc. The Fund issues and redeems Shares at net asset value (“NAV”) in blocks of 50,000 Shares each of which is called a “Creation Unit”. Creation Units are issued and redeemed principally in-kind for securities included in the Underlying Index. Except when aggregated in Creation Units, Shares are not redeemable securities of the Fund.
Pursuant to the Trust’s organizational documents, its Officers and Trustees are indemnified against certain liability arising out of the performance of their duties to the Trust. Additionally, in the normal course of business, the Trust enters into contracts with service providers that contain general indemnification clauses. The Trust’s maximum exposure under these arrangements is unknown, as this would involve future claims that may be made against the Trust that have not yet occurred.
2. SIGNIFICANT ACCOUNTING POLICIES
The following is a summary of significant accounting policies consistently followed by the Fund in the preparation of the financial statements. The accompanying financial statements were prepared in accordance with accounting principles generally accepted in the United States of America (“U.S. GAAP”). The preparation of financial statements in conformity with U.S. GAAP requires management to make certain estimates and assumptions that affect the reported amounts of assets and liabilities and disclosures of contingent assets and liabilities at the date of the financial statements and the reported amounts of revenue and expenses during the period. Actual results could differ from those estimates. The Fund is considered an investment company under U.S. GAAP and follows the accounting and reporting guidance applicable to investment companies in the Financial Accounting Standards Board (“FASB”) Accounting Standards Codification Topic 946.
A. Portfolio Valuation
The Fund’s NAV is determined daily, as of the close of regular trading on the New York Stock Exchange (the “NYSE”), normally 4:00 p.m. Eastern Time, on each day the NYSE is open for trading. The NAV is computed by dividing the value of all assets of the Fund (including accrued interest and dividends), less all liabilities (including accrued expenses and dividends declared but unpaid), by the total number of shares outstanding.
Portfolio securities listed on any exchange other than the NASDAQ Stock Market LLC (“NASDAQ”) are valued at the last sale price on the business day as of which such value is being determined. If there has been no sale on such day, the securities are valued at the mean of the most recent bid and ask prices on such day. Securities traded on the NASDAQ are valued at the NASDAQ Official Closing Price as determined by NASDAQ. Portfolio securities traded on more than one securities exchange are valued at the last sale price on the business day as of which such value is being determined at the close of the exchange representing the principal market for such securities. Portfolio securities traded in the over-the-counter market, but excluding securities traded on the NASDAQ, are valued at the last quoted sale price in such market.
The Fund’s investments are valued at market value or, in the absence of market value with respect to any portfolio securities, at fair value according to procedures adopted by the Trust’s Board of Trustees (the “Board”). When market quotations are not readily available or when events occur that make established valuation methods unreliable, securities of the Fund may be valued in good faith by or under the direction of the Board. These securities generally include, but are not limited to, restricted securities (securities which may not be publicly sold without registration under the Securities Act of 1933) for which a pricing service is unable to provide a market price; securities whose trading has been formally suspended; a security whose market price is not available from a pre-established primary pricing source or the pricing source is not willing to provide a price; a security with respect to which an event has occurred that is most likely to materially affect the value of the security after the market has closed but before the calculation of the Fund’s NAV or make it difficult or impossible to obtain a reliable market quotation; or a security whose price, as provided by the pricing service, does not reflect the security’s “fair value” due to the security being de-listed from a national exchange or the security’s primary trading market is temporarily closed at a time when, under normal conditions, it would be open. As a general principle, the current “fair value” of a security would be the amount which the owner might reasonably expect to receive from the sale on the applicable exchange or principal market. A variety of factors may be considered in determining the fair value of such securities.
9 | May 31, 2020
ALPS Equal Sector Weight ETF
| Notes to Financial Statements | May 31, 2020 (Unaudited) |
B. Fair Value Measurements
The Fund discloses the classification of its fair value measurements following a three-tier hierarchy based on the inputs used to measure fair value. Inputs refer broadly to the assumptions that market participants would use in pricing the asset or liability, including assumptions about risk. Inputs may be observable or unobservable. Observable inputs reflect the assumptions market participants would use in pricing the asset or liability that are developed based on market data obtained from sources independent of the reporting entity. Unobservable inputs reflect the reporting entity’s own assumptions about the assumptions market participants would use in pricing the asset or liability that are developed based on the best information available.
Valuation techniques used to value the Fund’s investments by major category are as follows:
Exchange Traded Funds, for which market quotations are readily available, are valued at the last reported sale price or official closing price as reported by a third party pricing vendor on the primary market or exchange on which they are traded and are categorized as Level 1 in the hierarchy. In the event there were no sales during the day or closing prices are not available, securities are valued at the mean of the most recent quoted bid and ask prices on such day and are generally categorized as Level 2 in the hierarchy. Investments in open-end mutual funds are valued at their closing NAV each business day and are categorized as Level 1 in the hierarchy.
Changes in valuation techniques may result in transfers in or out of an assigned level within the disclosure hierarchy.
Various inputs are used in determining the value of the Fund’s investments as of the end of the reporting period. When inputs used fall into different levels of the fair value hierarchy, the level in the hierarchy within which the fair value measurement falls is determined based on the lowest level input that is significant to the fair value measurement in its entirety. The designated input levels are not necessarily an indication of the risk or liquidity associated with these investments.
These inputs are categorized in the following hierarchy under applicable financial accounting standards:
| Level 1 – | Unadjusted quoted prices in active markets for identical investments, unrestricted assets or liabilities that a Fund has the ability to access at the measurement date; |
| Level 2 – | Quoted prices which are not active, quoted prices for similar assets or liabilities in active markets or inputs other than quoted prices that are observable (either directly or indirectly) for substantially the full term of the asset or liability; and |
| Level 3 – | Significant unobservable prices or inputs (including the Fund’s own assumptions in determining the fair value of investments) where there is little or no market activity for the asset or liability at the measurement date. |
The following is a summary of inputs used to value the Fund’s investments as of May 31, 2020:
| ALPS Equal Sector Weight ETF | ||||||||||||||||
| Investments in Securities at Value | Level 1 - Quoted and Unadjusted Prices | Level 2 - Other Significant Observable Inputs | Level 3 - Significant Unobservable Inputs | Total | ||||||||||||
| Exchange Traded Funds* | $ | 145,124,615 | $ | – | $ | – | $ | 145,124,615 | ||||||||
| Short-Term Investments | 11,335,561 | – | – | 11,335,561 | ||||||||||||
| Total | $ | 156,460,176 | $ | – | $ | – | $ | 156,460,176 | ||||||||
| * | For a detailed breakdown of sectors, see the accompanying Schedule of Investments. |
The Fund did not have any securities that used significant unobservable inputs (Level 3) in determining fair value and there were no transfers into or out of Level 3 during the six months ended May 31, 2020.
C. Securities Transactions and Investment Income
Securities transactions are recorded as of the trade date. Realized gains and losses from securities transactions are recorded on the highest cost basis. Dividend income and capital gains distributions, if any, are recorded on the ex-dividend date. Interest income, if any, is recorded on the accrual basis.
D. Dividends and Distributions to Shareholders
Dividends from net investment income of the Fund, if any, are declared and paid quarterly or as the Board may determine from time to time. Distributions of net realized capital gains earned by the Fund, if any, are distributed at least annually.
10 | May 31, 2020
ALPS Equal Sector Weight ETF
| Notes to Financial Statements | May 31, 2020 (Unaudited) |
E. Federal Tax and Tax Basis Information
The timing and character of income and capital gain distributions are determined in accordance with income tax regulations, which may differ from U.S. GAAP. Reclassifications are made to the Fund’s capital accounts for permanent tax differences to reflect income and gains available for distribution (or available capital loss carryforwards) under income tax regulations. The amounts and characteristics of tax basis distributions and composition of distributable earnings/(accumulated losses) are finalized at fiscal year-end; accordingly, tax basis balances have not been determined as of May 31, 2020.
The tax character of the distributions paid during the fiscal year ended November 30, 2019 was as follows:
Ordinary Income | ||||
| November 30, 2019 | ||||
| ALPS Equal Sector Weight ETF | $ | 3,395,008 | ||
Under current law, capital losses maintain their character as short-term or long-term and are carried forward to the next tax year without expiration. As of November 30, 2019, the following amounts are available as carry forwards to the next tax year:
| Fund | Short-Term | Long-Term | ||||||
| ALPS Equal Sector Weight ETF | $ | 36,299 | $ | 690,898 | ||||
As of May 31, 2020, the cost of investments for federal income tax purposes and accumulated net unrealized appreciation/(depreciation) on investments were as follows:
| Gross appreciation (excess of value over tax cost) | $ | 32,214,758 | ||
| Gross depreciation (excess of tax cost over value) | (8,014,938 | ) | ||
| Net unrealized appreciation (depreciation) | 24,199,820 | |||
| Cost of investments for income tax purposes | $ | 132,260,356 |
The differences between book-basis and tax-basis are primarily due to the deferral of losses from wash sales. In addition, certain tax cost basis adjustments are finalized at fiscal year-end and therefore have not been determined as of May 31, 2020.
F. Income Taxes
No provision for income taxes is included in the accompanying financial statements, as the Fund intends to distribute to shareholders all taxable investment income and realized gains and otherwise comply with Subchapter M of the Internal Revenue Code of 1986, as amended, applicable to regulated investment companies. The Fund evaluates tax positions taken (or expected to be taken) in the course of preparing the Fund’s tax returns to determine whether these positions meet a “more-likely-than-not” standard that, based on the technical merits, have a more than fifty percent likelihood of being sustained by a taxing authority upon examination. A tax position that meets the “more-likely-than-not” recognition threshold is measured to determine the amount of benefit to recognize in the financial statements.
As of and during the six months ended May 31, 2020, the Fund did not have a liability for any unrecognized tax benefits. The Fund files U.S. federal, state, and local tax returns as required. The Fund’s tax returns are subject to examination by the relevant tax authorities until expiration of the applicable statute of limitations, which is generally three years after the filing of the tax return, but may extend to four years in certain jurisdictions. Tax returns for open years have incorporated no uncertain tax positions that require a provision for income taxes.
G. Lending of Portfolio Securities
The Fund has entered into a securities lending agreement with State Street Bank & Trust Co. (“SSB”), the Fund’s lending agent. The Fund may lend its portfolio securities only to borrowers that are approved by SSB. The Fund will limit such lending to not more than 33 1/3% of the value of its total assets. The Fund’s securities held at SSB as custodian shall be available to be lent except those securities the Fund or ALPS Advisors, Inc. specifically identifies in writing as not being available for lending. The borrower pledges and maintains with the Fund collateral consisting of cash (U.S. Dollars only), securities issued or guaranteed by the U.S. government or its agencies or instrumentalities, and cash equivalents (including irrevocable bank letters of credit) issued by a person other than the borrower or an affiliate of the borrower. The initial collateral received by the Fund is required to have a value of no less than 102% of the market value of the loaned securities for U.S equity securities and a value of no less than 105% of the market value for non-U.S. equity securities. The collateral is maintained thereafter, at a market value equal to not less than 102% of the current value of the U.S. equity securities on loan and not less than 105% of the current value of the non-U.S. equity securities on loan. The market value of the loaned securities is determined at the close of each business day and any additional required collateral is delivered to the Fund on the next business day. During the term of the loan, the Fund is entitled to all distributions made on or in respect of the loaned securities. Loans of securities are terminable at any time and the borrower, after notice, is required to return borrowed securities within the customary time period for settlement of securities transactions.
11 | May 31, 2020
ALPS Equal Sector Weight ETF
| Notes to Financial Statements | May 31, 2020 (Unaudited) |
Any cash collateral received is reinvested in a money market fund managed by SSB as disclosed in the Fund’s Schedule of Investments and is reflected in the Statements of Assets and Liabilities as a payable for collateral upon return of securities loaned. Non-cash collateral, in the form of securities issued or guaranteed by the U.S. government or its agencies or instrumentalities, is not disclosed in the Fund’s Statements of Assets and Liabilities as it is held by the lending agent on behalf of the Fund, and the Fund does not have the ability to re-hypothecate these securities. Income earned by the Fund from securities lending activity is disclosed in the Statement of Operations.
The following is a summary of the Fund’s securities lending agreement and related cash and non-cash collateral received as of May 31, 2020:
Market Value of Securities on Loan | Cash Collateral Received | Non-Cash Collateral Received | Total Collateral Received | |||||||||||||
| ALPS Equal Sector Weight ETF | $ | 40,535,598 | $ | 11,316,974 | $ | 30,329,527 | $ | 41,646,501 | ||||||||
The risks of securities lending include the risk that the borrower may not provide additional collateral when required or may not return the securities when due. To mitigate these risks, the Fund benefits from a borrower default indemnity provided by SSB. SSB’s indemnity allows for full replacement of securities lent wherein SSB will purchase the unreturned loaned securities on the open market by applying the proceeds of the collateral, or to the extent such proceeds are insufficient or the collateral is unavailable, SSB will purchase the unreturned loan securities at SSB’s expense. However, the Fund could suffer a loss if the value of the investments purchased with cash collateral falls below the value of the cash collateral received.
The following table reflects a breakdown of transactions accounted for as secured borrowings, the gross obligation by the type of collateral pledged or securities loaned, and the remaining contractual maturity of those transactions as of May 31, 2020:
| ALPS Equal Sector Weight ETF | Remaining contractual maturity of the agreements |
| Securities Lending Transactions | Overnight & Continuous | Up to 30 days | 30-90 days | Greater than 90 days | Total | |||||||||||||||
| Common Stocks | $ | 11,316,974 | $ | – | $ | – | $ | – | $ | 11,316,974 | ||||||||||
| Total Borrowings | 11,316,974 | |||||||||||||||||||
| Gross amount of recognized liabilities for securities lending (collateral received) | $ | 11,316,974 | ||||||||||||||||||
3. INVESTMENT ADVISORY FEE AND OTHER AFFILIATED TRANSACTIONS
ALPS Advisors, Inc. (the “Adviser”) serves as the Fund’s investment adviser pursuant to an Investment Advisory Agreement with the Trust on behalf of the Fund (the “Advisory Agreement”). Pursuant to the Advisory Agreement, the Fund pays the Adviser an annual management fee for the services and facilities it provides, payable on a monthly basis at the annual rate of 0.37% of the Fund’s average daily net assets.
Effective April 1, 2020, the Adviser has contractually agreed to waive 0.19% of its annual unitary fee payable by the Fund until at least March 31, 2021. The waiver may only be terminated by the Fund’s Board of Trustees prior to such date.
ALPS Portfolio Solutions Distributor, Inc. (“APSD”) is both the distributor for the Fund as well as the Select Sector SPDR exchange traded funds (“Underlying Sector ETFs”) that the Fund invests in. As required by exemptive relief obtained by the Underlying Sector ETFs, the Adviser will reimburse the Fund an amount equal to the distribution fee received by APSD from the Underlying Sector ETFs attributable to the Fund’s investment in the Underlying Sector ETFs, for so long as APSD acts as the distributor to the Fund and the Underlying Sector ETFs. Such reimbursement is generally expected to equal 0.03% annually.
Out of the unitary management fees, the Adviser pays substantially all expenses of the Fund, including licensing fees to the Underlying Index provider, the cost of transfer agency, custody, fund administration, legal, audit, independent trustees and other services, except for acquired fund fees and expenses, interest expenses, distribution fees or expenses, brokerage expenses, taxes and extraordinary expenses not incurred in the ordinary course of the Fund’s business. The Adviser’s unitary management fee is designed to pay substantially all of the Fund’s expenses and to compensate the Adviser for providing services to the Fund.
12 | May 31, 2020
ALPS Equal Sector Weight ETF
| Notes to Financial Statements | May 31, 2020 (Unaudited) |
ALPS Fund Services, Inc., an affiliate of the Adviser, is the administrator of the Fund.
Each Trustee who is not considered an “interested person” (as defined in the Investment Company Act of 1940, as amended (“1940 Act”)) (“Independent Trustees”) receives (1) a quarterly retainer of $5,000, (2) a per meeting fee for regularly scheduled meetings of $3,750, (3) $1,500 for any special meeting held outside of a regularly scheduled board meeting, and (4) reimbursement for all reasonable out-of-pocket expenses relating to attendance at meetings. Prior to January 1, 2020, a Trustee who is considered an “interested person” (as defined in the 1940 Act) (“Interested Trustee”) received no compensation or expense reimbursements from the Trust. Effective January 1, 2020 the Interested Trustee receives (1) a quarterly retainer of $5,000, (2) a per meeting fee of $3,750, (3) $1,500 for any special meeting held outside of a regularly scheduled board meeting, and (4) reimbursement for all reasonable out-of-pocket expenses relating to attendance at meetings. In addition, the Chairman of the Board and Chairman of the Audit Committee each receives a quarterly retainer of $2,000, in connection with their respective roles.
4. PURCHASES AND SALES OF SECURITIES
For the six months ended May 31, 2020 the cost of purchases and proceeds from sales of investment securities, excluding short-term investments and in-kind transactions, were as follows:
| Fund | Purchases | Sales | ||||||
| ALPS Equal Sector Weight ETF | $ | 8,863,138 | $ | 9,528,217 | ||||
For the year ended May 31, 2020, the cost of in-kind purchases and proceeds from in-kind sales were as follows:
| Fund | Purchases | Sales | ||||||
| ALPS Equal Sector Weight ETF | $ | 17,482,026 | $ | 27,597,102 | ||||
For the six months ended May 31, 2020, the ALPS Equal Sector Weight ETF had in-kind net realized gain of $9,779,053.
Gains on in-kind transactions are not considered taxable for federal income tax purposes and losses on in-kind transactions are also not deductible for tax purposes.
5. CAPITAL SHARE TRANSACTIONS
Shares are created and redeemed by the Fund only in Creation Unit size aggregations of 50,000 Shares. Only broker-dealers or large institutional investors with creation and redemption agreements called Authorized Participants (“AP”) are permitted to purchase or redeem Creation Units from the Fund. Such transactions are generally permitted on an in-kind basis, with a balancing cash component to equate the transaction to the NAV per unit of the Fund on the transaction date. Cash may be substituted equivalent to the value of certain securities generally when they are not available in sufficient quantity for delivery, not eligible for trading by the AP or as a result of other market circumstances.
6. MARKET DISRUPTIONS RISK
The Fund is subject to investment and operational risks associated with financial, economic and other global market developments and disruptions, including the recent spread of an infectious respiratory illness caused by a novel strain of coronavirus (known as COVID-19), which can negatively impact the securities markets and cause the Fund to lose value.
The spread of COVID-19 has caused volatility, severe market dislocations and liquidity constraints in many markets, including markets for the securities the Fund holds, and may adversely affect the Fund’s investments and operations. The transmission of COVID-19 and efforts to contain its spread have resulted in travel restrictions and disruptions, closed international borders, enhanced health screenings at ports of entry and elsewhere, disruption of and delays in healthcare service preparation and delivery, quarantines, event and service cancellations or interruptions, disruptions to business operations and supply chains, and a reduction in consumer and business spending, as well as general concern and uncertainty that has negatively affected the economy. These disruptions have led to instability in the market place and the jobs market. The impact of COVID-19 could adversely affect the economies of many nations or the entire global economy, the financial well-being and performance of individual issuers, borrowers and sectors and the health of the markets generally in potentially significant and unforeseen ways.
The foregoing could lead to a significant economic downturn or recession, increased market volatility, a greater number of market closures, higher default rates and adverse effects on the values and liquidity of the Fund’s securities or other assets. Such impacts may adversely affect the performance of the Fund.
13 | May 31, 2020
ALPS Equal Sector Weight ETF
| Notes to Financial Statements | May 31, 2020 (Unaudited) |
7. SUBSEQUENT EVENTS
Effective July 1, 2020, each Trustee will be compensated a quarterly retainer of $10,000, and a per meeting fee of $5,000.
14 | May 31, 2020
ALPS Equal Sector Weight ETF
| Additional Information | May 31, 2020 (Unaudited) |
PROXY VOTING RECORDS, POLICIES AND PROCEDURES
Information regarding how the Fund voted proxies relating to portfolio securities during the most recent 12-month period ended June 30 and a description of the Fund’s proxy voting policies and procedures used in determining how to vote for proxies are available without charge on the SEC’s website at www.sec.gov and upon request, by calling (toll-free) 1-866-675-2639.
PORTFOLIO HOLDINGS
The Fund files a complete schedule of portfolio holdings with the U.S. Securities and Exchange Commission (“SEC”) for the first and third quarters of each fiscal year on Form N-PORT within 60 days after the end of the period. Copies of the Fund’s Form N-PORT are available without a charge, upon request, by contacting the Fund at 1-855-838-9485 and on the SEC’s website at https://www.sec.gov.
TAX INFORMATION
The Fund designates the following as a percentage of taxable ordinary income distributions, or up to the maximum amount allowable, for the calendar year ended December 31, 2019:
| Qualified Dividend Income | Dividend Received Deduction | |
| ALPS Equal Sector Weight ETF | 98.34% | 98.86% |
In early 2020, if applicable, shareholders of record received this information for the distribution paid to them by the Fund during the calendar year 2019 via Form 1099. The Fund will notify shareholders in early 2021 of amounts paid to them by the Fund, if any, during the calendar year 2020.
LICENSING AGREEMENT
ICE Data Indices, LLC (the “Index Provider”) is not affiliated with the ALPS Equal Sector Weight ETF (the “Fund”) or ALPS Advisors, Inc. (the “Adviser”). The Fund is entitled to use the Underlying Index pursuant to a licensing agreement with the Index Provider and the Adviser. The Adviser pays a licensing fee to the Index Provider out of the management fee.
The only relationship that the Index Provider has with the Fund, the Adviser or Distributor of the Fund in connection with the Fund is that the Index Provider has licensed certain of its intellectual property, including the determination of the component stocks of the Underlying Index and the name of the Underlying Index. The Underlying Index is selected and calculated without regard to the Adviser, Distributor or owners of the Fund. The Index Provider has no obligation to take the specific needs of the Adviser, Distributor or owners of the Fund into consideration in the determination and calculation of the Underlying Index. The Index Provider is not responsible for and has not participated in the determination of pricing or the timing of the issuance or sale of the Shares of the Fund or in the determination or calculation of the net asset value of the Fund. The Index Provider has no obligation or liability in connection with the administration or trading of the Fund.
NYSE® Equal Sector Weight Index is a service mark of ICE Data Indices, LLC or its affiliates (“ICE Data”) and has been licensed for use by the Adviser in connection with the Fund. Neither the Trust nor the Fund is sponsored, endorsed, sold or promoted by ICE Data. ICE Data makes no representations or warranties regarding the Adviser or the Fund or the ability of the NYSE® Equal Sector Weight Index to track general stock market performance.
ICE DATA MAKES NO EXPRESS OR IMPLIED WARRANTIES, AND HEREBY EXPRESSLY DISCLAIMS ALL WARRANTIES OF MERCHANTABILITY OR FITNESS FOR A PARTICULAR PURPOSE WITH RESPECT TO THE NYSE® EQUAL SECTOR WEIGHT INDEX OR ANY DATA INCLUDED THEREIN. IN NO EVENT SHALL ICE DATA HAVE ANY LIABILITY FOR ANY SPECIAL, PUNITIVE, INDIRECT, OR CONSEQUENTIAL DAMAGES (INCLUDING LOST PROFITS), EVEN IF NOTIFIED OF THE POSSIBILITY OF SUCH DAMAGES.
The Adviser does not guarantee the accuracy and/or the completeness of the Underlying Index or any data included therein, and the Adviser shall have no liability for any errors, omissions or interruptions therein. The Adviser makes no warranty, express or implied, as to results to be obtained by the Fund, owners of the Shares of the Fund or any other person or entity from the use of the Underlying Index or any data included therein. The Adviser makes no express or implied warranties, and expressly disclaims all warranties of merchantability or fitness for a particular purpose or use with respect to the Underlying Index or any data included therein. Without limiting any of the foregoing, in no event shall the Adviser have any liability for any special, punitive, direct, indirect or consequential damages (including lost profits) arising out of matters relating to the use of the Underlying Index even if notified of the possibility of such damages.
15 | May 31, 2020
ALPS Equal Sector Weight ETF
| Liquidity Risk Management Program | May 31, 2020 (Unaudited) |
In compliance with the Securities and Exchange Commission’s liquidity risk management rule (the “Liquidity Rule”), the ALPS ETF Trust (the “Trust”) has established a liquidity risk management program (the “Program”) to govern the Trust’s approach to managing liquidity risk for each series of the Trust (each a “Fund”). The Program is overseen by the Liquidity Committee (the “Committee”), a committee comprised of representatives of the Trust’s investment adviser, ALPS Advisors, Inc. The Trust’s Board of Trustees (the “Board”) has approved the designation of the Committee to oversee the Program.
The Program’s principal objectives include supporting each Fund’s compliance with limits on investments in illiquid assets and assessing and managing the risk that a Fund will be unable to meet its redemption obligations without significant dilution of remaining investors’ interests in the Fund. The Program includes a number of elements that support the management and assessment of liquidity risk, including an annual assessment of factors that influence a Fund’s liquidity and, for Funds that are not “In-Kind ETFs,” the periodic classification and re-classification of such Fund’s investments into groupings that reflect the Committee’s assessment of their liquidity under current market conditions.
At a meeting of the Board held on March 2, 2020, the Trustees received a report from the Committee regarding the design and operational effectiveness of the Program since its implementation on December 1, 2018. The Committee determined, and reported to the Board, that the Program has been operating effectively to assess and manage each Fund’s liquidity risk and has been and continues to be adequately and effectively implemented to monitor and (as applicable) respond to the Funds’ liquidity developments.
The Committee reported that during the period covered by the report, there were no liquidity events that impacted the Funds or their ability to timely meet redemptions without dilution to existing shareholders. Among other things, the Committee’s report noted that no Fund is required to have a highly liquid investment minimum based either on its status as an In-Kind ETF or on its ability to rely on another exemption under the Liquidity Rule. The Committee’s report further noted that no material changes have been made to the Program since its implementation.
16 | May 31, 2020

Table of Contents
| Performance Overview | |
| ALPS Clean Energy ETF | 1 |
| ALPS Disruptive Technologies ETF | 3 |
| ALPS Medical Breakthroughs ETF | 6 |
| Disclosure of Fund Expenses | 9 |
| Financial Statements | |
| Schedule of Investments | |
| ALPS Clean Energy ETF | 10 |
| ALPS Disruptive Technologies ETF | 11 |
| ALPS Medical Breakthroughs ETF | 13 |
| Statements of Assets and Liabilities | 15 |
| Statements of Operations | 16 |
| Statements of Changes in Net Assets | |
| ALPS Clean Energy ETF | 17 |
| ALPS Disruptive Technologies ETF | 18 |
| ALPS Medical Breakthroughs ETF | 19 |
| Financial Highlights | 20 |
| Notes to Financial Statements | 23 |
| Additional Information | 32 |
| Liquidity Risk Management Program | 36 |
Beginning on January 1, 2021, as permitted by regulations adopted by the U.S. Securities and Exchange Commission, paper copies of the Funds’ annual and semi-annual shareholder reports will no longer be sent by mail, unless you specifically request paper copies of the reports from your financial intermediary (such as a broker-dealer or bank). Instead, the reports will be made available on the Funds’ website (www.alpsfunds.com), and you will be notified by mail each time a report is posted and provided with a website link to access the report.
If you already elected to receive shareholder reports electronically, you will not be affected by this change and you need not take any action. You may elect to receive shareholder reports and other communications from a Fund electronically anytime by contacting your financial intermediary.
You may elect to receive all future reports in paper free of charge. You can contact your financial intermediary to request that you continue to receive paper copies of your shareholder reports. Your election to receive reports in paper will apply to all funds held in your account with your financial intermediary.
alpsfunds.com
ALPS Clean Energy ETF
| Performance Overview | May 31, 2020 (Unaudited) |
Investment Objective
The ALPS Clean Energy ETF (the “Fund” or “ACES”) seeks investment results that correspond (before fees and expenses) generally to the performance of its underlying index, the CIBC Atlas Clean Energy Total Return Index (ticker symbol NACEX) (the “Underlying Index”). The Underlying Index utilizes a rules-based methodology developed by CIBC National Trust Company, which is designed to provide exposure to a diverse set of U.S. and Canadian companies involved in the clean energy sector including renewables and clean technology.
Fund Performance (as of May 31, 2020)
| 6 Months | 1 Year | Since Inception^ | |
| ALPS Clean Energy ETF - NAV | 13.10% | 36.72% | 23.02% |
| ALPS Clean Energy ETF - Market Price* | 12.65% | 36.97% | 23.02% |
| S&P 1000® Total Return Index | -13.53% | -2.97% | -5.54% |
| CIBC Atlas Clean Energy Total Return Index | 13.21% | 37.04% | 23.88% |
Total Expense Ratio (per the current prospectus) is 0.65%.
Performance data quoted represents past performance. Past performance does not guarantee future results. Total return figures assume reinvestment of dividends and capital gains distributions, if any. The table does not reflect the deduction of taxes that a shareholder would pay on Fund distributions or the redemption of Fund shares. Investment return and principal value of an investment will fluctuate so that an investor’s shares, when sold or redeemed, may be worth more or less than the original cost. Current performance data may be higher or lower than actual data quoted. For the most current month-end performance data please visit www.alpsfunds.com or call 1.866.759.5679.
NAV is an exchange-traded fund’s per-share value. The per-share dollar amount of the fund is derived by dividing the total value of all the securities in its portfolio, less any liabilities, by the number of fund shares outstanding. Market Price is the price at which a share can currently be traded in the market. Information detailing the number of days the Market Price of the Fund was greater than the Fund’s NAV and the number of days it was less than the Fund’s NAV can be obtained at www.alpsfunds.com.
| ^ | The Fund commenced operations on June 28, 2018, with the first day of trading on the exchange of June 29, 2018. |
| * | Market Price is based on the midpoint of the bid-ask spread at 4 p.m. ET and does not represent the returns an investor would receive if shares were traded at other times. |
The Fund is new with limited operating history.
CIBC Atlas Clean Energy Total Return Index is an adjusted market cap weighted index designed to provide exposure to a diverse set of U.S. or Canadian based companies involved in the clean energy sector including renewables and clean technology. The clean energy sector is comprised of companies that provide the products and services which enable the evolution of a more sustainable energy sector. Clean energy business segments include but are not limited to: solar, wind, hydro, geothermal, electric vehicles, LED, biomass, smart grid, energy efficiency and storage. Total return assumes reinvestment of any dividends and distributions realized during a given time period.
The S&P 1000® Total Return Index combines the S&P MidCap 400® and the S&P SmallCap 600® to form an investable benchmark for the mid- to small-cap segment of the U.S. equity market. Total return assumes reinvestment of any dividends and distributions realized during a given time period.
One cannot invest directly in an index. Index performance does not reflect fund performance.
The Fund’s shares are not individually redeemable. Investors buy and sell shares of the Fund on a secondary market. Only market makers or “authorized participants” may trade directly with the Fund, typically in blocks of 50,000 shares.
The ALPS Clean Energy ETF is not suitable for all investors. Investments in the Fund are subject to investment risks, including possible loss of the principal amount invested.
ALPS Portfolio Solutions Distributor, Inc., a FINRA member, is the Distributor for the ALPS Clean Energy ETF.
1 | May 31, 2020
ALPS Clean Energy ETF
| Performance Overview | May 31, 2020 (Unaudited) |
Top Ten Holdings* (as of May 31, 2020)
| Cree, Inc. | 6.28% |
| Tesla, Inc. | 6.21% |
| Enphase Energy, Inc. | 5.74% |
| First Solar, Inc. | 5.62% |
| Ormat Technologies, Inc. | 5.37% |
| Northland Power, Inc. | 5.09% |
| Universal Display Corp. | 4.92% |
| Brookfield Renewable Partners LP | 4.76% |
| Itron, Inc. | 4.64% |
| NextEra Energy Partners LP | 4.57% |
| Total % of Top 10 Holdings | 53.20% |
| * | % of Total Investments (excluding investments purchased with collateral from securities loaned) |
Future holdings are subject to change.
Clean Energy Segment Allocation* (as of May 31, 2020)
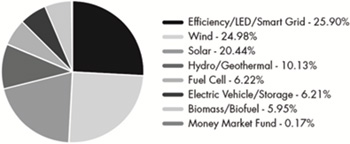
Growth of $10,000 (as of May 31, 2020)
Comparison of change in value of a $10,000 investment in the Fund and the Index
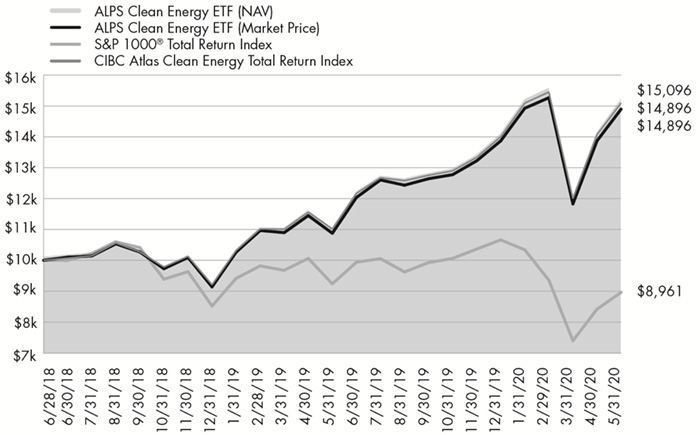
The chart above compares historical performance of a hypothetical investment of $10,000 in the Fund since inception with the performance of the Fund’s benchmark index. Past performance does not guarantee future results. The chart does not reflect the deduction of taxes that a shareholder would pay on Fund distributions or the redemption of Fund shares.
2 | May 31, 2020
ALPS Disruptive Technologies ETF
| Performance Overview | May 31, 2020 (Unaudited) |
Investment Objective
ALPS Disruptive Technologies ETF (the “Fund” or “DTEC”) seeks investment results that correspond (before fees and expenses) generally to the performance of the Indxx Disruptive Technologies Net Total Return Index (ticker symbol IDTEC) (the “Underlying Index”). The Fund will invest at least 80% of its net assets in securities that comprise the Underlying Index.
The Fund employs a “passive management” – or indexing – investment approach designed to track the performance of the Underlying Index. The Underlying Index utilizes a rules-based methodology developed by Indxx, LLC (the “Index Provider”), which is designed to identify the companies using disruptive technologies in each of ten thematic areas: Healthcare Innovation, Internet of Things, Clean Energy and Smart Grid, Cloud Computing, Data and Analytics, FinTech, Robotics and Artificial Intelligence, Cybersecurity, 3D Printing, and Mobile Payments (each a “Theme” and together, the “Themes”). Companies using disruptive technologies are those that are entering traditional markets with new digital forms of production and distribution, seek to disrupt an existing market and value network, displace established market-leading firms, products and alliances and increasingly gain market share. The Underlying Index is compiled by the Index Provider and may be comprised of U.S. and non-U.S. companies, including foreign and emerging markets companies. In order to be eligible for inclusion in the Underlying Index’s Index Universe, a company’s stock must be traded on one or more major global securities exchanges, have a minimum market capitalization of at least $500 million, and have a six month minimum average daily trading volume of $2 million, and the company must derive a minimum of 50% of its revenue from a single Theme. All equity securities meeting the above criteria are selected for inclusion in the Index Universe. From the Index Universe, the Underlying Index methodology selects ten stocks in each Theme according to proprietary quantitative and qualitative factors. The eligible stocks that are selected for inclusion in the Underlying Index’s portfolio are equally weighted. The Underlying Index is reconstituted annually on the third Friday of September and rebalanced quarterly.
Fund Performance (as of May 31, 2020)
| 6 Months | 1 Year | Since Inception^ | |
| ALPS Disruptive Technologies ETF - NAV | 6.00% | 19.07% | 13.26% |
| ALPS Disruptive Technologies ETF - Market Price* | 5.61% | 19.01% | 13.22% |
| MSCI All Country World Net Total Return Index | -5.96% | 5.43% | 1.67% |
| Indxx Disruptive Technologies Net Total Return Index | 6.16% | 19.48% | 13.50% |
| Morningstar® Global Markets Index** | -6.61% | 4.51% | 1.10% |
Total Expense Ratio (per the current prospectus) is 0.50%.
Performance data quoted represents past performance. Past performance does not guarantee future results. Total return figures assume reinvestment of dividends and capital gains distributions, if any. The table does not reflect the deduction of taxes that a shareholder would pay on Fund distributions or the redemption of Fund shares. Investment return and principal value of an investment will fluctuate so that an investor’s shares, when sold or redeemed, may be worth more or less than the original cost. Current performance data may be higher or lower than actual data quoted. For the most current month-end performance data please visit www. alpsfunds.com or call 1.866.759.5679.
NAV is an exchange-traded fund’s per-share value. The per-share dollar amount of the fund is derived by dividing the total value of all the securities in its portfolio, less any liabilities, by the number of fund shares outstanding. Market Price is the price at which a share can currently be traded in the market. Information detailing the number of days the Market Price of the Fund was greater than the Fund’s NAV and the number of days it was less than the Fund’s NAV can be obtained at www.alpsfunds.com.
| ^ | The Fund commenced operations on December 28, 2017, with the first day of trading on the exchange of December 29, 2017. |
| * | Market Price is based on the midpoint of the bid-ask spread at 4 p.m. ET and does not represent the returns an investor would receive if shares were traded at other times. |
| ** | Effective December 13, 2019, the Fund replaced the MSCI ACWI Net Total Return Index as the Fund’s secondary benchmark for performance comparison purposes. The Adviser made this recommendation to the Board because the Fund’s new secondary benchmark, the Morningstar Global Markets Index, closely aligns with the Fund’s investment strategies and investment restrictions. Returns for both benchmarks will be shown for a transition period. |
Indxx Disruptive Technologies Net Total Return Index (Ticker: IDTEC) is based around companies that enter traditional markets with new digital forms of production and distribution, are likely to disrupt an existing market and value network, displace established market leading firms, products and alliances and increasingly gain market share. Total Return assumes reinvestment of any dividends and distributions realized during a given time period. Net Total Return (NTR) is obtained by reinvesting the net dividend, which is equal to the ordinary gross dividend minus the amount of withholding tax.
3 | May 31, 2020
ALPS Disruptive Technologies ETF
| Performance Overview | May 31, 2020 (Unaudited) |
The MSCI All Country World Net Total Return Index, MSCI’s flagship global equity index, is designed to represent performance of the full opportunity set of large- and mid-cap stocks across 23 developed and 26 emerging markets. As of December 2019, it covers more than 3,050 constituents across 11 sectors and approximately 85% of the free float-adjusted market capitalization in each market.
The Morningstar® Global Markets Index, measures the performance of performance of the stocks located in the developed and emerging countries across the world. Stocks in the index are weighted by their float capital, which removes corporate cross ownership, government holdings and other locked-in shares.
One cannot invest directly in an index. Index performance does not reflect fund performance.
The Fund’s shares are not individually redeemable. Investors buy and sell shares of the Fund on a secondary market. Only market makers or “authorized participants” may trade directly with the Fund, typically in blocks of 50,000 shares.
The ALPS Disruptive Technologies ETF is not suitable for all investors. Investments in the Fund are subject to investment risks, including possible loss of the principal amount invested.
ALPS Portfolio Solutions Distributor, Inc., a FINRA member, is the Distributor for the ALPS Disruptive Technologies ETF.
Top Ten Holdings* (as of May 31, 2020)
| Zscaler, Inc. | 1.82% |
| ams AG | 1.79% |
| iRobot Corp. | 1.47% |
| Okta, Inc. | 1.35% |
| Fortinet, Inc. | 1.35% |
| Proto Labs, Inc. | 1.34% |
| Splunk, Inc. | 1.30% |
| Adyen NV | 1.23% |
| Palo Alto Networks, Inc. | 1.23% |
| Nemetschek SE | 1.22% |
| Total % of Top 10 Holdings | 14.10% |
| * | % of Total Investments (excluding investments purchased with collateral from securities loaned) |
Future holdings are subject to change.
Thematic Allocation* (as of May 31, 2020)

4 | May 31, 2020
ALPS Disruptive Technologies ETF
| Performance Overview | May 31, 2020 (Unaudited) |
Growth of $10,000 (as of May 31, 2020)
Comparison of change in value of a $10,000 investment in the Fund and the Index
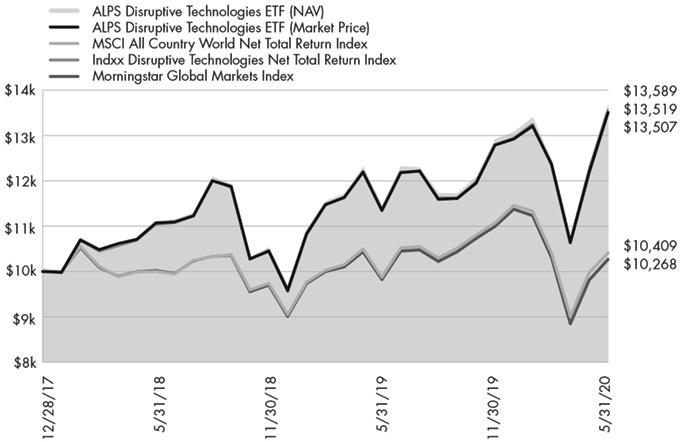
The chart above compares historical performance of a hypothetical investment of $10,000 in the Fund since inception with the performance of the Fund’s benchmark index. Past performance does not guarantee future results. The chart does not reflect the deduction of taxes that a shareholder would pay on Fund distributions or the redemption of Fund shares.
5 | May 31, 2020
ALPS Medical Breakthroughs ETF
| Performance Overview | May 31, 2020 (Unaudited) |
Investment Objective
ALPS Medical Breakthroughs ETF (the “Fund” or “SBIO”) seeks investment results that correspond (before fees and expenses) generally to the performance of the S-Network® Medical Breakthroughs Total Return Index (the “Underlying Index”). The Fund will normally invest at least 80% of its net assets in securities that comprise the Underlying Index (or depository receipts based on such securities).
The Fund employs a “passive management” – or indexing – investment approach designed to track the performance of the Underlying Index. The Underlying Index is comprised of small- and mid-cap stocks of biotechnology companies that have one or more drugs in either Phase II or Phase III of the U.S. Food and Drug Administration ("FDA") clinical trials. In a Phase II trial, the drug is administered to a group of 100-300 people to see if it is effective and to evaluate its safety. In a Phase III trial, the drug is given to a larger group, between 500-3,000 people, to confirm its effectiveness, monitor side effects, compare it to commonly used treatments and collect information that will allow the drug or treatment to be used safely. Stocks selected for inclusion in the Underlying Index must be listed on a U.S. stock exchange. Underlying Index constituents must have a market capitalization of no less than $200 million and no more than $5 billion. Stocks included in the Underlying Index must also sustain an average daily trading volume in excess of $1 million for the 90-day period preceding an Underlying Index reconstitution. Constituents must be able to sustain the monthly rates at which they use shareholder capital ("cash burn rates") for at least 24 months. The Underlying Index is reconstituted semi-annually on the third Fridays of June and December.
Fund Performance (as of May 31, 2020)
| 6 Months | 1 Year | 5 Year | Since Inception^ | |
| ALPS Medical Breakthroughs ETF - NAV | 5.00% | 28.36% | 5.09% | 11.03% |
| ALPS Medical Breakthroughs ETF - Market Price* | 5.07% | 28.40% | 5.10% | 11.04% |
| S-Network Medical Breakthroughs Total Return Index | 5.20% | 28.60% | 5.41% | 11.37% |
| NASDAQ Biotechnology Total Return Index | 13.02% | 35.58% | 2.55% | 5.87% |
Total Expense Ratio (per the current prospectus) is 0.50%
Performance data quoted represents past performance. Past performance does not guarantee future results. Total return figures assume reinvestment of dividends and capital gains distributions, if any. Investment return and principal value of an investment will fluctuate so that an investor’s shares, when sold or redeemed, may be worth more or less than the original cost. Current performance data may be higher or lower than actual data quoted. For most current month-end performance data please visit www.alpsfunds.com or call 1.844.234.5852.
NAV is an exchange-traded fund’s per-share value. The per-share dollar amount of the fund is derived by dividing the total value of all the securities in its portfolio, less any liabilities, by the number of fund shares outstanding. Market Price is the price at which a share can currently be traded in the market. Information detailing the number of days the Market Price of the Fund was greater than the Fund’s NAV and the number of days it was less than the Fund’s NAV can be obtained at www.alpsfunds.com.
| ^ | The Fund commenced investment operations on December 31, 2014. |
| * | Market Price is based on the midpoint of the bid-ask spread at 4 p.m. ET and does not represent the returns an investor would receive if shares were traded at other times. |
NASDAQ Biotechnology Total Return Index (Ticker: NBI) is a modified market capitalization-weighted index designed to measure the performance of the all NASDAQ stocks in the biotechnology sector. Total return assumes reinvestment of any dividends and distributions realized during a given time period.
S-Network Medical Breakthroughs Total Return Index (Ticker: PMBI) is designed to capture research and development opportunities in the biotechnology industry. PMBI consists of small-cap and mid-cap biotechnology stocks listed on U.S. stock exchanges that have one or more drugs in either Phase II or Phase III U.S. FDA clinical trials. Total return assumes reinvestment of any dividends and distributions realized during a given time period.
One cannot invest directly in an index. Index performance does not reflect fund performance.
Companies in the pharmaceuticals and biotechnology industry may be subject to extensive litigation based on product liability and similar claims. Legislation introduced or considered by certain governments on such industries or on the healthcare sector cannot be predicted.
Companies in the pharmaceuticals industry are subject to competitive forces that may make it difficult to raise prices and, in fact, may result in price discounting. The profitability of some companies in the pharmaceuticals industry may be dependent on a relatively limited number of products. In addition, their products can become obsolete due to industry innovation, changes in technologies or other market developments. Many new products in the pharmaceuticals industry are subject to government approvals, regulation and reimbursement rates. The process of obtaining government approvals may be long and costly. Many companies in the pharmaceuticals industry are heavily dependent on patents and intellectual property rights. The loss or impairment of these rights may adversely affect the profitability of these companies.
6 | May 31, 2020
ALPS Medical Breakthroughs ETF
| Performance Overview | May 31, 2020 (Unaudited) |
The development of new drugs generally has a high failure rate, and such failures may negatively impact the stock price of the company developing the failed drug. Biotechnology companies may have persistent losses during a new product’s transition from development to production. In order to fund operations, biotechnology companies may require financing from the capital markets, which may not always be available on satisfactory terms or at all.
The Fund’s shares are not individually redeemable. Investors buy and sell shares of the Fund on a secondary market. Only market makers or “authorized participants” may trade directly with the Fund, typically in blocks of 50,000 shares.
The ALPS Medical Breakthroughs ETF is not suitable for all investors. Investments in the Fund are subject to investment risks, including possible loss of the principal amount invested.
ALPS Portfolio Solutions Distributor, Inc., a FINRA member, is the Distributor for the ALPS Medical Breakthroughs ETF.
ALPS Portfolio Solutions Distributor, Inc. is not affiliated with S-Network Global Indexes, Inc.
Top Ten Holdings* (as of May 31, 2020)
| Immunomedics, Inc. | 6.24% |
| United Therapeutics Corp. | 4.56% |
| Acceleron Pharma, Inc. | 4.26% |
| Global Blood Therapeutics, Inc. | 3.80% |
| Mirati Therapeutics, Inc. | 3.80% |
| MorphoSys AG | 3.71% |
| ChemoCentryx, Inc. | 3.28% |
| Bluebird Bio, Inc. | 3.17% |
| Deciphera Pharmaceuticals, Inc. | 2.87% |
| Allakos, Inc. | 2.85% |
| Total % of Top 10 Holdings | 38.54% |
| * | % of Total Investments (excluding investments purchased with collateral from securities loaned) |
Future holdings are subject to change.
Sector Allocation* (as of May 31, 2020)
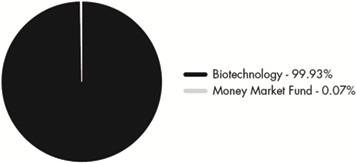
7 | May 31, 2020
ALPS Medical Breakthroughs ETF
| Performance Overview | May 31, 2020 (Unaudited) |
Growth of $10,000 (as of May 31, 2020)
Comparison of change in value of a $10,000 investment in the Fund and the Index
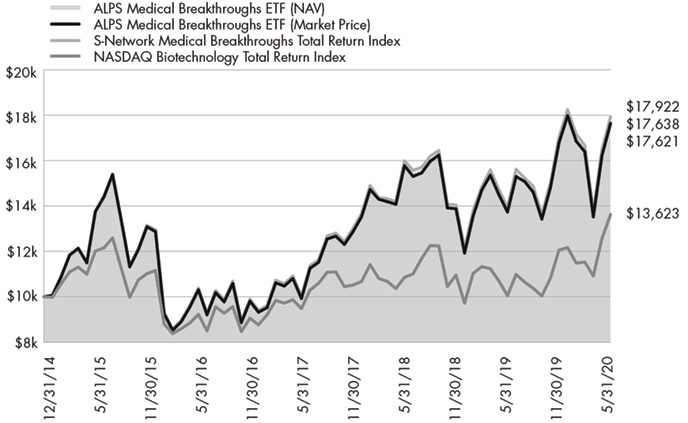
The chart above compares historical performance of a hypothetical investment of $10,000 in the Fund since inception with the performance of the Fund’s benchmark index. Past performance does not guarantee future results. The chart does not reflect the deduction of taxes that a shareholder would pay on Fund distributions or the redemption of Fund shares.
8 | May 31, 2020
ALPS ETF Trust
| Disclosure of Fund Expenses | May 31, 2020 (Unaudited) |
Shareholder Expense Example: As a shareholder of a Fund, you incur two types of costs: (1) transaction costs which may include creation and redemption fees or brokerage charges, and (2) ongoing costs, including management fees and other Fund expenses. These examples are intended to help you understand your ongoing costs (in dollars) of investing in a Fund and to compare these costs with the ongoing costs of investing in other funds. It is based on an investment of $1,000 invested at the beginning of the (six month) period and held through May 31, 2020.
Actual Return: The first line of the table provides information about actual account values and actual expenses. You may use the information in this line, together with the amount you invested, to estimate the expenses that you incurred over the period. Simply divide your account value by $1,000 (for example, an $8,600 account value divided by $1,000 = 8.6), then multiply the result by the number in the first line under the heading entitled “Expenses Paid During Period” to estimate the expenses attributable to your investment during this period.
Hypothetical 5% Return: The second line of the table provides information about hypothetical account values and hypothetical expenses based on the Fund’s actual expense ratio and an assumed rate of return of 5% per year before expenses, which is not the Fund’s actual return. The hypothetical account values and expenses may not be used to estimate the actual ending account balance or expenses you paid for the period. You may use this information to compare ongoing costs of investing in the Fund and other funds. To do so, compare this 5% hypothetical example with the 5% hypothetical examples that appear in the shareholder reports of the other funds.
The expenses shown in the table are meant to highlight ongoing Fund costs only and do not reflect any transaction costs, such as creation and redemption fees or brokerage charges. Therefore, the second line is useful in comparing ongoing costs only, and will not help you determine the relative total costs of owning different funds. In addition, if these costs were included, your costs would have been higher.
Beginning Account Value 12/1/19 | Ending Account Value 5/31/20 | Expense Ratio(a) | Expenses Paid During Period 12/1/19 - 5/31/20(b) | |
| ALPS Clean Energy ETF | ||||
| Actual | $1,000.00 | $1,131.00 | 0.65% | $3.46 |
| Hypothetical (5% return before expenses) | $1,000.00 | $1,021.75 | 0.65% | $3.29 |
| ALPS Disruptive Technologies ETF | ||||
| Actual | $1,000.00 | $1,060.00 | 0.50% | $2.58 |
| Hypothetical (5% return before expenses) | $1,000.00 | $1,022.50 | 0.50% | $2.53 |
| ALPS Medical Breakthroughs ETF | ||||
| Actual | $1,000.00 | $1,050.00 | 0.50% | $2.56 |
| Hypothetical (5% return before expenses) | $1,000.00 | $1,022.50 | 0.50% | $2.53 |
| (a) | Annualized, based on the Fund's most recent fiscal half year expenses. |
| (b) | Expenses are equal to the Fund's annualized expense ratio multiplied by the average account value over the period, multiplied by the number of days in the most recent fiscal half year (183), divided by 366. |
9 | May 31, 2020
| ALPS Clean Energy ETF | |
| Schedule of Investments | May 31, 2020 (Unaudited) |
| Security Description | Shares | Value | ||||||
| COMMON STOCKS (88.88%) | ||||||||
| Consumer Discretionary (6.20%) | ||||||||
| Tesla, Inc.(a) | 13,405 | $ | 11,193,175 | |||||
| Energy (2.26%) | ||||||||
| Renewable Energy Group, Inc.(a) | 143,836 | 4,092,134 | ||||||
| Industrials (19.93%) | ||||||||
| Acuity Brands, Inc. | 91,542 | 7,886,343 | ||||||
| Ameresco, Inc., Class A(a) | 80,096 | 1,718,860 | ||||||
| American Superconductor Corp.(a)(b) | 68,047 | 493,341 | ||||||
| Ballard Power Systems, Inc.(a)(b) | 609,723 | 6,578,911 | ||||||
| Covanta Holding Corp. | 442,642 | 3,983,778 | ||||||
| Orion Energy Systems, Inc.(a) | 96,062 | 430,358 | ||||||
| Plug Power, Inc.(a)(b) | 1,100,190 | 4,631,800 | ||||||
| Sunrun, Inc.(a) | 313,241 | 5,231,125 | ||||||
| TPI Composites, Inc.(a) | 125,739 | 2,609,084 | ||||||
| Vivint Solar, Inc.(a) | 187,502 | 1,410,015 | ||||||
| Willdan Group, Inc.(a) | 41,435 | 1,013,086 | ||||||
| Total Industrials | 35,986,701 | |||||||
| Information Technology (28.42%) | ||||||||
| Cree, Inc.(a) | 214,989 | 11,327,770 | ||||||
| Enphase Energy, Inc.(a) | 177,862 | 10,349,789 | ||||||
| First Solar, Inc.(a)(b) | 217,524 | 10,140,969 | ||||||
| Itron, Inc.(a) | 129,875 | 8,366,548 | ||||||
| SunPower Corp.(a)(b) | 317,745 | 2,294,119 | ||||||
| Universal Display Corp. | 60,524 | 8,872,818 | ||||||
| Total Information Technology | 51,352,013 | |||||||
| Real Estate (3.93%) | ||||||||
| Hannon Armstrong Sustainable Infrastructure Capital, Inc.(b) | 244,610 | 7,096,136 | ||||||
| Utilities (28.14%) | ||||||||
| Boralex, Inc., Class A | 346,241 | 7,204,710 | ||||||
| Clearway Energy, Inc., Class C | 297,306 | 6,513,974 | ||||||
| Innergex Renewable Energy, Inc. | 484,630 | 6,666,588 | ||||||
| Northland Power, Inc. | 396,487 | 9,168,861 | ||||||
| Ormat Technologies, Inc. | 132,918 | 9,677,760 | ||||||
| Sunnova Energy International, Inc.(a)(b) | 89,647 | 1,344,705 | ||||||
| TerraForm Power, Inc., Class A | 331,063 | 6,084,938 | ||||||
| Security Description | Shares | Value | ||||||
| Utilities (continued) | ||||||||
| TransAlta Renewables, Inc.(b) | 398,263 | $ | 4,145,048 | |||||
| Total Utilities | 50,806,584 | |||||||
| TOTAL COMMON STOCKS | ||||||||
| (Cost $135,353,735) | 160,526,743 | |||||||
| MASTER LIMITED PARTNERSHIPS (10.78%) | ||||||||
| Energy (1.47%) | ||||||||
| Enviva Partners LP | 75,933 | 2,656,136 | ||||||
| Utilities (9.31%) | ||||||||
| Brookfield Renewable Partners LP | 175,319 | 8,582,272 | ||||||
| NextEra Energy Partners LP | 161,221 | 8,240,005 | ||||||
| Total Utilities | 16,822,277 | |||||||
| TOTAL MASTER LIMITED PARTNERSHIPS | ||||||||
| (Cost $16,701,188) | 19,478,413 | |||||||
| 7 Day Yield | Shares | Value | ||||||||||
| SHORT TERM INVESTMENTS (5.85%) | ||||||||||||
| Money Market Fund (0.17%) | ||||||||||||
| State Street Institutional Treasury Plus Money Market Fund | ||||||||||||
| (Cost $302,180) | 0.15 | % | 302,180 | 302,180 | ||||||||
| Investments Purchased with Collateral from Securities Loaned (5.68%) | ||||||||||||
| State Street Navigator Securities Lending Government Money Market Portfolio, 0.15% | ||||||||||||
| (Cost $10,262,064) | 10,262,064 | 10,262,064 | ||||||||||
| TOTAL SHORT TERM INVESTMENTS | ||||||||||||
| (Cost $10,564,244) | 10,564,244 | |||||||||||
| TOTAL INVESTMENTS (105.51%) | ||||||||||||
| (Cost $162,619,167) | $ | 190,569,400 | ||||||||||
| LIABILITIES IN EXCESS OF OTHER ASSETS (-5.51%) | (9,954,938 | ) | ||||||||||
| NET ASSETS - 100.00% | $ | 180,614,462 | ||||||||||
| (a) | Non-income producing security. |
| (b) | Security, or a portion of the security position is currently on loan. The total market value of securities on loan is $13,057,662. |
See Notes to Financial Statements.
10 | May 31, 2020
| ALPS Disruptive Technologies ETF | |
| Schedule of Investments | May 31, 2020 (Unaudited) |
| Security Description | Shares | Value | ||||||
| COMMON STOCKS (98.89%) | ||||||||
| Communication Services (2.03%) | ||||||||
| Netflix, Inc.(a) | 2,005 | $ | 841,559 | |||||
| Spotify Technology SA(a) | 4,963 | 897,956 | ||||||
| Total Communication Services | 1,739,515 | |||||||
| Consumer Discretionary (2.37%) | ||||||||
| Garmin, Ltd. | 8,667 | 781,503 | ||||||
| iRobot Corp.(a)(b) | 17,046 | 1,256,631 | ||||||
| Total Consumer Discretionary | 2,038,134 | |||||||
| Financials (3.77%) | ||||||||
| American Express Co. | 7,534 | 716,257 | ||||||
| LendingTree, Inc.(a)(b) | 2,820 | 733,256 | ||||||
| Moody's Corp. | 3,260 | 871,757 | ||||||
| S&P Global, Inc. | 2,845 | 924,682 | ||||||
| Total Financials | 3,245,952 | |||||||
| Health Care (11.45%) | ||||||||
| ABIOMED, Inc.(a) | 4,609 | 1,031,956 | ||||||
| Align Technology, Inc.(a) | 3,490 | 857,214 | ||||||
| Boston Scientific Corp.(a) | 20,293 | 770,931 | ||||||
| Cochlear, Ltd. | 5,703 | 733,697 | ||||||
| CYBERDYNE, Inc.(a)(b) | 175,300 | 828,995 | ||||||
| Demant A/S(a) | 27,132 | 764,851 | ||||||
| DENTSPLY SIRONA, Inc. | 15,739 | 732,178 | ||||||
| DexCom, Inc.(a) | 2,551 | 965,069 | ||||||
| Insulet Corp.(a) | 3,807 | 717,886 | ||||||
| Intuitive Surgical, Inc.(a) | 1,379 | 799,861 | ||||||
| Smith & Nephew PLC, Sponsored ADR(b) | 18,450 | 752,945 | ||||||
| Tecan Group AG | 2,468 | 861,158 | ||||||
| Total Health Care | 9,816,741 | |||||||
| Industrials (18.01%) | ||||||||
| ABB, Ltd., Sponsored ADR | 37,428 | 735,834 | ||||||
| ADT, Inc. | 130,090 | 921,037 | ||||||
| AeroVironment, Inc.(a) | 13,477 | 954,576 | ||||||
| ATS Automation Tooling Systems, Inc.(a)(b) | 55,836 | 811,474 | ||||||
| Experian PLC | 24,102 | 837,313 | ||||||
| FANUC Corp. | 4,312 | 768,279 | ||||||
| IHS Markit, Ltd. | 11,886 | 825,601 | ||||||
| Proto Labs, Inc.(a) | 9,063 | 1,145,110 | ||||||
| Prysmian SpA | 40,849 | 868,119 | ||||||
| RELX PLC, Sponsored ADR | 32,794 | 763,772 | ||||||
| Schneider Electric SE | 8,166 | 808,931 | ||||||
| Sensata Technologies Holding PLC(a) | 19,053 | 679,239 | ||||||
| Security Description | Shares | Value | ||||||
| Industrials (continued) | ||||||||
| Siemens Gamesa Renewable Energy SA(a) | 51,598 | $ | 866,878 | |||||
| Thomson Reuters Corp.(b) | 10,368 | 694,438 | ||||||
| TransUnion | 8,713 | 751,845 | ||||||
| Verisk Analytics, Inc. | 4,527 | 781,722 | ||||||
| Vestas Wind Systems A/S | 7,845 | 798,852 | ||||||
| Wolters Kluwer NV | 10,156 | 808,097 | ||||||
| Xinjiang Goldwind Science & Technology Co., Ltd., Class H | 714,000 | 642,936 | ||||||
| Total Industrials | 15,464,053 | |||||||
| Information Technology (58.89%) | ||||||||
| 3D Systems Corp.(a)(b) | 96,588 | 711,854 | ||||||
| Adobe, Inc.(a) | 2,213 | 855,546 | ||||||
| Adyen NV(a)(c)(d) | 806 | 1,058,431 | ||||||
| Alarm.com Holdings, Inc.(a) | 17,587 | 831,689 | ||||||
| ams AG(a) | 101,997 | 1,532,394 | ||||||
| ANSYS, Inc.(a) | 3,085 | 873,055 | ||||||
| Autodesk, Inc.(a) | 4,632 | 974,480 | ||||||
| Avast PLC(c)(d) | 154,716 | 961,099 | ||||||
| Black Knight, Inc.(a) | 10,169 | 782,810 | ||||||
| Brooks Automation, Inc. | 22,435 | 896,727 | ||||||
| Check Point Software Technologies, Ltd.(a) | 7,677 | 841,937 | ||||||
| Cognex Corp. | 16,153 | 916,522 | ||||||
| CyberArk Software, Ltd.(a) | 8,006 | 830,863 | ||||||
| Dassault Systemes SE | 4,839 | 817,816 | ||||||
| FARO Technologies, Inc.(a) | 14,394 | 810,094 | ||||||
| Fidelity National Information Services, Inc. | 5,328 | 739,686 | ||||||
| First Solar, Inc.(a)(b) | 17,223 | 802,936 | ||||||
| Fiserv, Inc.(a) | 6,652 | 710,234 | ||||||
| FleetCor Technologies, Inc.(a) | 2,946 | 718,205 | ||||||
| Fortinet, Inc.(a) | 8,303 | 1,155,778 | ||||||
| Global Payments, Inc. | 4,019 | 721,370 | ||||||
| Guidewire Software, Inc.(a) | 8,128 | 833,770 | ||||||
| Intuit, Inc. | 2,655 | 770,800 | ||||||
| Itron, Inc.(a) | 10,918 | 703,338 | ||||||
| Keyence Corp. | 2,192 | 901,435 | ||||||
| Landis+Gyr Group AG | 9,951 | 653,881 | ||||||
| Mastercard, Inc., Class A | 2,614 | 786,526 | ||||||
| Nemetschek SE | 13,315 | 1,047,925 | ||||||
| NortonLifeLock, Inc. | 36,509 | 831,675 | ||||||
| Okta, Inc.(a) | 5,934 | 1,160,572 | ||||||
| Omron Corp. | 13,500 | 893,783 | ||||||
| Palo Alto Networks, Inc.(a) | 4,492 | 1,056,833 | ||||||
| PayPal Holdings, Inc.(a) | 6,513 | 1,009,580 | ||||||
| Proofpoint, Inc.(a) | 6,907 | 803,077 | ||||||
11 | May 31, 2020
| ALPS Disruptive Technologies ETF | |
| Schedule of Investments | May 31, 2020 (Unaudited) |
| Security Description | Shares | Value | ||||||
| Information Technology (continued) | ||||||||
| PTC, Inc.(a) | 11,658 | $ | 890,438 | |||||
| Qorvo, Inc.(a) | 8,226 | 861,591 | ||||||
| Renishaw PLC | 17,352 | 825,041 | ||||||
| salesforce.com, Inc.(a) | 4,490 | 784,807 | ||||||
| SAP SE, Sponsored ADR | 6,204 | 794,732 | ||||||
| ServiceNow, Inc.(a) | 2,406 | 933,360 | ||||||
| Silicon Laboratories, Inc.(a) | 9,076 | 850,058 | ||||||
| SimCorp A/S | 8,049 | 883,992 | ||||||
| Skyworks Solutions, Inc. | 7,827 | 927,813 | ||||||
| SolarEdge Technologies, Inc.(a) | 6,964 | 988,191 | ||||||
| Splunk, Inc.(a) | 5,997 | 1,114,482 | ||||||
| Square, Inc.(a) | 11,789 | 955,852 | ||||||
| SS&C Technologies Holdings, Inc. | 14,862 | 860,435 | ||||||
| StoneCo, Ltd.(a)(b) | 20,909 | 662,397 | ||||||
| Stratasys, Ltd.(a)(b) | 48,392 | 864,281 | ||||||
| Temenos AG | 5,582 | 851,403 | ||||||
| Trend Micro, Inc. | 14,034 | 770,377 | ||||||
| Visa, Inc., Class A | 3,948 | 770,808 | ||||||
| VMware, Inc., Class A(a)(b) | 6,431 | 1,004,972 | ||||||
| Wirecard AG | 6,712 | 704,534 | ||||||
| Workday, Inc., Class A(a) | 4,792 | 878,997 | ||||||
| Xero, Ltd.(a) | 13,672 | 777,073 | ||||||
| Zscaler, Inc.(a)(b) | 15,950 | 1,564,536 | ||||||
| Total Information Technology | 50,516,891 | |||||||
| Real Estate (1.73%) | ||||||||
| Digital Realty Trust, Inc. | 4,901 | 703,588 | ||||||
| Equinix, Inc. | 1,120 | 781,345 | ||||||
| Total Real Estate | 1,484,933 | |||||||
| Utilities (0.64%) | ||||||||
| China Longyuan Power Group Corp., Ltd., Class H | 1,125,000 | 547,152 | ||||||
| TOTAL COMMON STOCKS | ||||||||
| (Cost $72,484,586) | 84,853,371 | |||||||
| MASTER LIMITED PARTERSHIPS (0.90%) | ||||||||
| Utilities (0.90%) | ||||||||
| Brookfield Renewable Partners LP | 15,860 | 776,384 | ||||||
| TOTAL MASTER LIMITED PARTERSHIPS | ||||||||
| (Cost $497,577) | 776,384 | |||||||
| 7 Day Yield | Shares | Value | ||||||||||
| SHORT TERM INVESTMENTS (1.53%) | ||||||||||||
| Money Market Fund (0.15%) | ||||||||||||
| State Street Institutional Treasury Plus Money Market Fund | ||||||||||||
| (Cost $127,000) | 0.15 | % | 127,000 | $ | 127,000 | |||||||
| Investments Purchased with Collateral from Securities Loaned (1.38%) | ||||||||||||
| State Street Navigator Securities Lending Government Money Market Portfolio, 0.15% | ||||||||||||
| (Cost $1,187,919) | 1,187,919 | 1,187,919 | ||||||||||
| TOTAL SHORT TERM INVESTMENTS | ||||||||||||
| (Cost $1,314,919) | 1,314,919 | |||||||||||
| TOTAL INVESTMENTS (101.32%) | ||||||||||||
| (Cost $74,297,082) | $ | 86,944,674 | ||||||||||
| LIABILITIES IN EXCESS OF OTHER ASSETS (-1.32%) | (1,132,280 | ) | ||||||||||
| NET ASSETS - 100.00% | $ | 85,812,394 | ||||||||||
| (a) | Non-income producing security. |
| (b) | Security, or a portion of the security position is currently on loan. The total market value of securities on loan is $5,262,402. |
| (c) | Securities exempt from registration under Rule 144A of the Securities Act of 1933. These securities may be sold in the ordinary course of business in transactions exempt from registration, normally to qualified institutional buyers. At period end, the aggregate market value of those securities was $2,019,530, representing 2.35% of net assets. |
| (d) | Securities were purchased pursuant to Regulation S under the Securities Act of 1933, which exempts securities offered and sold outside of the United States from registration. Such securities cannot be sold in the United States without either an effective registration statement filed pursuant to the Securities Act of 1933, or pursuant to an exemption from registration. As of May 31, 2020, the market value of those securities was $2,019,530 representing 2.35% of net assets. |
See Notes to Financial Statements.
12 | May 31, 2020
| ALPS Medical Breakthroughs ETF | |
| Schedule of Investments | May 31, 2020 (Unaudited) |
| Security Description | Shares | Value | ||||||
| COMMON STOCKS (99.96%) | ||||||||
| Biotechnology (99.96%) | ||||||||
| Acceleron Pharma, Inc.(a) | 83,089 | $ | 8,211,685 | |||||
| Agenus, Inc.(a) | 239,449 | 893,145 | ||||||
| Akcea Therapeutics, Inc.(a)(b) | 163,689 | 2,438,966 | ||||||
| Akero Therapeutics, Inc.(a)(b) | 49,778 | 1,265,357 | ||||||
| Albireo Pharma, Inc.(a)(b) | 25,435 | 680,641 | ||||||
| Alector, Inc.(a)(b) | 134,329 | 4,392,558 | ||||||
| Alkermes PLC(a) | 273,758 | 4,478,681 | ||||||
| Allakos, Inc.(a)(b) | 84,627 | 5,500,755 | ||||||
| Apellis Pharmaceuticals, Inc.(a)(b) | 127,519 | 4,296,115 | ||||||
| Aprea Therapeutics, Inc.(a) | 36,589 | 982,781 | ||||||
| Arena Pharmaceuticals, Inc.(a) | 87,042 | 5,202,500 | ||||||
| Assembly Biosciences, Inc.(a) | 54,077 | 1,053,961 | ||||||
| Bluebird Bio, Inc.(a)(b) | 96,199 | 6,121,142 | ||||||
| Catalyst Pharmaceuticals, Inc.(a)(b) | 179,632 | 774,214 | ||||||
| ChemoCentryx, Inc.(a) | 101,274 | 6,318,485 | ||||||
| Coherus Biosciences, Inc.(a)(b) | 122,248 | 2,278,703 | ||||||
| Concert Pharmaceuticals, Inc.(a) | 49,850 | 529,407 | ||||||
| Constellation Pharmaceuticals, Inc.(a) | 69,792 | 2,479,710 | ||||||
| Cortexyme, Inc.(a)(b) | 46,809 | 2,157,427 | ||||||
| Crinetics Pharmaceuticals, Inc.(a)(b) | 42,228 | 690,006 | ||||||
| CytomX Therapeutics, Inc.(a) | 79,201 | 701,721 | ||||||
| Deciphera Pharmaceuticals, Inc.(a) | 94,391 | 5,528,481 | ||||||
| Dicerna Pharmaceuticals, Inc.(a) | 119,287 | 2,573,021 | ||||||
| Eidos Therapeutics, Inc.(a)(b) | 65,106 | 3,184,334 | ||||||
| Enanta Pharmaceuticals, Inc.(a) | 34,390 | 1,770,741 | ||||||
| Epizyme, Inc.(a)(b) | 158,755 | 2,786,150 | ||||||
| Fate Therapeutics, Inc.(a)(b) | 131,773 | 4,273,398 | ||||||
| FibroGen, Inc.(a)(b) | 151,645 | 5,071,009 | ||||||
| Frequency Therapeutics, Inc.(a) | 53,664 | 996,004 | ||||||
| G1 Therapeutics, Inc.(a)(b) | 65,512 | 1,111,739 | ||||||
| Global Blood Therapeutics, Inc.(a)(b) | 104,729 | 7,322,651 | ||||||
| GlycoMimetics, Inc.(a) | 75,579 | 213,889 | ||||||
| Gossamer Bio, Inc.(a)(b) | 115,114 | 1,398,635 | ||||||
| ImmunoGen, Inc.(a) | 300,506 | 1,406,368 | ||||||
| Immunomedics, Inc.(a)(b) | 358,350 | 12,036,976 | ||||||
| Intercept Pharmaceuticals, Inc.(a)(b) | 56,859 | 4,108,631 | ||||||
| Ironwood Pharmaceuticals, Inc.(a)(b) | 273,360 | 2,659,793 | ||||||
| Security Description | Shares | Value | ||||||
| Biotechnology (continued) | ||||||||
| KalVista Pharmaceuticals, Inc.(a) | 31,058 | $ | 349,403 | |||||
| Karuna Therapeutics, Inc.(a)(b) | 45,292 | 4,251,107 | ||||||
| Krystal Biotech, Inc.(a) | 30,174 | 1,551,245 | ||||||
| Kura Oncology, Inc.(a) | 78,998 | 1,350,076 | ||||||
| Ligand Pharmaceuticals, Inc.(a)(b) | 28,775 | 2,922,677 | ||||||
| MacroGenics, Inc.(a) | 85,266 | 1,640,518 | ||||||
| Madrigal Pharmaceuticals, Inc.(a)(b) | 26,897 | 3,120,590 | ||||||
| MediciNova, Inc.(a) | 76,423 | 408,099 | ||||||
| MeiraGTx Holdings PLC(a)(b) | 63,754 | 946,109 | ||||||
| Merus NV(a)(b) | 49,082 | 669,969 | ||||||
| Mirati Therapeutics, Inc.(a)(b) | 73,824 | 7,322,602 | ||||||
| MorphoSys AG, ADR(a) | 221,206 | 7,160,438 | ||||||
| Orchard Therapeutics PLC, ADR(a) | 165,369 | 1,571,006 | ||||||
| Oyster Point Pharma, Inc.(a)(b) | 37,232 | 1,059,623 | ||||||
| PDL BioPharma, Inc.(a) | 199,050 | 650,894 | ||||||
| Portola Pharmaceuticals, Inc.(a)(b) | 133,107 | 2,389,271 | ||||||
| Principia Biopharma, Inc.(a)(b) | 56,922 | 3,636,747 | ||||||
| PTC Therapeutics, Inc.(a) | 107,148 | 5,433,475 | ||||||
| Puma Biotechnology, Inc.(a) | 67,913 | 693,392 | ||||||
| Replimune Group, Inc.(a) | 62,215 | 1,168,398 | ||||||
| Rigel Pharmaceuticals, Inc.(a) | 292,175 | 571,202 | ||||||
| Rocket Pharmaceuticals, Inc.(a) | 94,433 | 1,776,285 | ||||||
| SpringWorks Therapeutics, Inc.(a)(b) | 74,963 | 2,853,841 | ||||||
| uniQure NV(a)(b) | 74,232 | 4,985,421 | ||||||
| United Therapeutics Corp.(a) | 74,599 | 8,798,951 | ||||||
| UroGen Pharma, Ltd.(a)(b) | 36,565 | 858,181 | ||||||
| Vericel Corp.(a) | 77,906 | 1,120,288 | ||||||
| Viking Therapeutics, Inc.(a)(b) | 125,967 | 900,664 | ||||||
| Voyager Therapeutics, Inc.(a)(b) | 64,621 | 781,914 | ||||||
| XBiotech, Inc.(a) | 47,220 | 659,663 | ||||||
| XOMA Corp.(a) | 16,278 | 335,652 | ||||||
| Zymeworks, Inc.(a)(b) | 77,244 | 2,944,541 | ||||||
| Total Biotechnology | 192,772,022 | |||||||
| TOTAL COMMON STOCKS (Cost $172,067,292) | 192,772,022 | |||||||
13 | May 31, 2020
| ALPS Medical Breakthroughs ETF | |
| Schedule of Investments | May 31, 2020 (Unaudited) |
| 7 Day Yield | Shares | Value | ||||||||||
| SHORT TERM INVESTMENTS (15.26%) | ||||||||||||
| Money Market Fund (0.07%) | ||||||||||||
| State Street Institutional Treasury Plus Money Market Fund | ||||||||||||
| (Cost $132,179) | 0.15 | % | 132,179 | $ | 132,179 | |||||||
| Investments Purchased with Collateral from Securities Loaned (15.19%) | ||||||||||||
| State Street Navigator Securities Lending Government Money Market Portfolio, 0.15% | ||||||||||||
| (Cost $29,270,745) | 29,270,745 | 29,270,745 | ||||||||||
| TOTAL SHORT TERM INVESTMENTS | ||||||||||||
| (Cost $29,402,924) | 29,402,924 | |||||||||||
| TOTAL INVESTMENTS (115.22%) | ||||||||||||
| (Cost $201,470,216) | $ | 222,174,946 | ||||||||||
| LIABILITIES IN EXCESS OF OTHER ASSETS (-15.22%) | (29,337,954 | ) | ||||||||||
| NET ASSETS - 100.00% | $ | 192,836,992 | ||||||||||
| (a) | Non-income producing security. |
| (b) | Security, or a portion of the security position is currently on loan. The total market value of securities on loan is $48,668,465. |
See Notes to Financial Statements.
14 | May 31, 2020
| ALPS ETF Trust | |
| Statements of Assets and Liabilities | May 31, 2020 (Unaudited) |
| ALPS Clean Energy ETF | ALPS Disruptive Technologies ETF | ALPS Medical Breakthroughs ETF | ||||||||||
| ASSETS: | ||||||||||||
| Investments, at value | $ | 190,569,400 | $ | 86,944,674 | $ | 222,174,946 | ||||||
| Foreign Currency, at value (Cost $19,066, $– and $–) | 19,066 | – | – | |||||||||
| Dividends receivable | 380,783 | 89,537 | 12,598 | |||||||||
| Total Assets | 190,969,249 | 87,034,211 | 222,187,544 | |||||||||
| LIABILITIES: | ||||||||||||
| Payable to adviser | 92,723 | 33,898 | 79,807 | |||||||||
| Payable for collateral upon return of securities loaned | 10,262,064 | 1,187,919 | 29,270,745 | |||||||||
| Total Liabilities | 10,354,787 | 1,221,817 | 29,350,552 | |||||||||
| NET ASSETS | $ | 180,614,462 | $ | 85,812,394 | $ | 192,836,992 | ||||||
| NET ASSETS CONSIST OF: | ||||||||||||
| Paid-in capital | $ | 154,719,132 | $ | 75,947,643 | $ | 251,001,636 | ||||||
| Total distributable earnings | 25,895,330 | 9,864,751 | (58,164,644 | ) | ||||||||
| NET ASSETS | $ | 180,614,462 | $ | 85,812,394 | $ | 192,836,992 | ||||||
| INVESTMENTS, AT COST | $ | 162,619,167 | $ | 74,297,082 | $ | 201,470,216 | ||||||
| PRICING OF SHARES | ||||||||||||
| Net Assets | $ | 180,614,462 | $ | 85,812,394 | $ | 192,836,992 | ||||||
| Shares of beneficial interest outstanding (Unlimited number of shares authorized, par value $0.01 per share) | 5,000,002 | 2,550,002 | 4,650,000 | |||||||||
| Net Asset Value, offering and redemption price per share | $ | 36.12 | $ | 33.65 | $ | 41.47 | ||||||
See Notes to Financial Statements.
15 | May 31, 2020
| ALPS ETF Trust | |
| Statements of Operations | For the Six Months Ended May 31, 2020 (Unaudited) |
| ALPS Clean Energy ETF | ALPS Disruptive Technologies ETF | ALPS Medical Breakthroughs ETF | ||||||||||
| INVESTMENT INCOME: | ||||||||||||
| Dividends* | $ | 1,498,883 | $ | 752,253 | $ | 303 | ||||||
| Securities Lending Income | 412,814 | 19,498 | 128,084 | |||||||||
| Total Investment Income | 1,911,697 | 771,751 | 128,387 | |||||||||
| EXPENSES: | ||||||||||||
| Investment adviser fees | 467,916 | 195,372 | 495,990 | |||||||||
| Total Expenses | 467,916 | 195,372 | 495,990 | |||||||||
| NET INVESTMENT INCOME/(LOSS) | 1,443,781 | 576,379 | (367,603 | ) | ||||||||
| REALIZED AND UNREALIZED GAIN/LOSS | ||||||||||||
| Net realized gain/(loss) on investments | (1,765,761 | ) | (503,211 | ) | 2,813,286 | |||||||
| Net realized loss on foreign currency transactions | (3,590 | ) | (1,327 | ) | – | |||||||
| Total net realized gain/(loss) | (1,769,351 | ) | (504,538 | ) | 2,813,286 | |||||||
| Net change in unrealized appreciation/(depreciation) on investments | 13,494,403 | 3,871,022 | (3,979,874 | ) | ||||||||
| Net change in unrealized appreciation on translation of assets and liabilities denominated in foreign currencies | 1 | 295 | – | |||||||||
| Total net change in unrealized appreciation/(depreciation) | 13,494,404 | 3,871,317 | (3,979,874 | ) | ||||||||
| NET REALIZED AND UNREALIZED GAIN/LOSS ON INVESTMENTS | 11,725,053 | 3,366,779 | (1,166,588 | ) | ||||||||
| NET INCREASE/(DECREASE) IN NET ASSETS RESULTING FROM OPERATIONS | $ | 13,168,834 | $ | 3,943,158 | $ | (1,534,191 | ) | |||||
| *Net of foreign tax withholding. | $ | 66,735 | $ | 22,708 | $ | – | ||||||
See Notes to Financial Statements.
16 | May 31, 2020
ALPS Clean Energy ETF
Statement of Changes in Net Assets
| For the Six Months Ended May 31, 2020 (Unaudited) | For the Year Ended November 30, 2019 | |||||||
| OPERATIONS: | ||||||||
| Net investment income | $ | 1,443,781 | $ | 622,902 | ||||
| Net realized loss | (1,769,351 | ) | (376,469 | ) | ||||
| Net change in unrealized appreciation | 13,494,404 | 14,645,242 | ||||||
| Net increase in net assets resulting from operations | 13,168,834 | 14,891,675 | ||||||
| DISTRIBUTIONS TO SHAREHOLDERS: | ||||||||
| From distributable earnings | (1,171,286 | ) | (391,478 | ) | ||||
| From tax return of capital | – | (652,198 | ) | |||||
| Total distributions | (1,171,286 | ) | (1,043,676 | ) | ||||
| CAPITAL SHARE TRANSACTIONS: | ||||||||
| Proceeds from sale of shares | 65,611,928 | 77,603,077 | ||||||
| Cost of shares redeemed | (3,354,150 | ) | (1,362,989 | ) | ||||
| Net increase from capital share transactions | 62,257,778 | 76,240,088 | ||||||
| Net increase in net assets | 74,255,326 | 90,088,087 | ||||||
| NET ASSETS: | ||||||||
| Beginning of period | 106,359,136 | 16,271,049 | ||||||
| End of period | $ | 180,614,462 | $ | 106,359,136 | ||||
| OTHER INFORMATION: | ||||||||
| CAPITAL SHARE TRANSACTIONS: | ||||||||
| Beginning shares | 3,300,002 | 650,002 | ||||||
| Shares sold | 1,800,000 | 2,700,000 | ||||||
| Shares redeemed | (100,000 | ) | (50,000 | ) | ||||
| Shares outstanding, end of period | 5,000,002 | 3,300,002 | ||||||
See Notes to Financial Statements.
17 | May 31, 2020
ALPS Disruptive Technologies ETF
Statement of Changes in Net Assets
| For the Six Months Ended May 31, 2020 (Unaudited) | For the Year Ended November 30, 2019 | |||||||
| OPERATIONS: | ||||||||
| Net investment income | $ | 576,379 | $ | 295,771 | ||||
| Net realized loss | (504,538 | ) | (1,828,096 | ) | ||||
| Net change in unrealized appreciation | 3,871,317 | 12,543,297 | ||||||
| Net increase in net assets resulting from operations | 3,943,158 | 11,010,972 | ||||||
| DISTRIBUTIONS TO SHAREHOLDERS: | ||||||||
| From distributable earnings | (330,120 | ) | (147,001 | ) | ||||
| Total distributions | (330,120 | ) | (147,001 | ) | ||||
| CAPITAL SHARE TRANSACTIONS: | ||||||||
| Proceeds from sale of shares | 10,065,531 | 22,068,308 | ||||||
| Cost of shares redeemed | (2,776,262 | ) | (6,505,138 | ) | ||||
| Net increase from capital share transactions | 7,289,269 | 15,563,170 | ||||||
| Net increase in net assets | 10,902,307 | 26,427,141 | ||||||
| NET ASSETS: | ||||||||
| Beginning of period | 74,910,087 | 48,482,946 | ||||||
| End of period | $ | 85,812,394 | $ | 74,910,087 | ||||
| OTHER INFORMATION: | ||||||||
| CAPITAL SHARE TRANSACTIONS: | ||||||||
| Beginning shares | 2,350,002 | 1,850,002 | ||||||
| Shares sold | 300,000 | 750,000 | ||||||
| Shares redeemed | (100,000 | ) | (250,000 | ) | ||||
| Shares outstanding, end of period | 2,550,002 | 2,350,002 | ||||||
See Notes to Financial Statements.
18 | May 31, 2020
ALPS Medical Breakthroughs ETF
Statements of Changes in Net Assets
| For the Six Months Ended May 31, 2020 (Unaudited) | For the Year Ended November 30, 2019 | |||||||
| OPERATIONS: | ||||||||
| Net investment income/(loss) | $ | (367,603 | ) | $ | 158,073 | |||
| Net realized gain/(loss) | 2,813,286 | (9,081,617 | ) | |||||
| Net change in unrealized appreciation/(depreciation) | (3,979,874 | ) | 38,722,701 | |||||
| Net increase/(decrease) in net assets resulting from operations | (1,534,191 | ) | 29,799,157 | |||||
| DISTRIBUTIONS TO SHAREHOLDERS: | ||||||||
| From distributable earnings | (84,005 | ) | (4,900,375 | ) | ||||
| Total distributions | (84,005 | ) | (4,900,375 | ) | ||||
| CAPITAL SHARE TRANSACTIONS: | ||||||||
| Proceeds from sale of shares | 33,907,592 | 23,073,262 | ||||||
| Cost of shares redeemed | (37,022,130 | ) | (72,096,324 | ) | ||||
| Net decrease from capital share transactions | (3,114,538 | ) | (49,023,062 | ) | ||||
| Net decrease in net assets | (4,732,734 | ) | (24,124,280 | ) | ||||
| NET ASSETS: | ||||||||
| Beginning of period | 197,569,726 | 221,694,006 | ||||||
| End of period | $ | 192,836,992 | $ | 197,569,726 | ||||
| OTHER INFORMATION: | ||||||||
| CAPITAL SHARE TRANSACTIONS: | ||||||||
| Beginning shares | 5,000,000 | 6,600,000 | ||||||
| Shares sold | 800,000 | 650,000 | ||||||
| Shares redeemed | (1,150,000 | ) | (2,250,000 | ) | ||||
| Shares outstanding, end of period | 4,650,000 | 5,000,000 | ||||||
See Notes to Financial Statements.
19 | May 31, 2020
| ALPS Clean Energy ETF | |
| Financial Highlights | For a Share Outstanding Throughout the Periods Presented |
| For the Six Months Ended May 31, 2020 (Unaudited) | For the Year Ended November 30, 2019 | For the Period June 28, 2018 (Commencement of Operations) to November 30, 2018 | ||||||||||
| NET ASSET VALUE, BEGINNING OF PERIOD | $ | 32.23 | $ | 25.03 | $ | 24.95 | ||||||
| INCOME/(LOSS) FROM INVESTMENT OPERATIONS: | ||||||||||||
| Net investment income (a) | 0.34 | 0.32 | 0.09 | |||||||||
| Net realized and unrealized gain/(loss) | 3.84 | 7.42 | (0.01 | ) | ||||||||
| Total from investment operations | 4.18 | 7.74 | 0.08 | |||||||||
| DISTRIBUTIONS: | ||||||||||||
| From net investment income | (0.29 | ) | (0.23 | ) | – | |||||||
| Tax return of capital | – | (0.31 | ) | – | ||||||||
| Total distributions | (0.29 | ) | (0.54 | ) | – | |||||||
| Net increase in net asset value | 3.89 | 7.20 | 0.08 | |||||||||
| NET ASSET VALUE, END OF PERIOD | $ | 36.12 | $ | 32.23 | $ | 25.03 | ||||||
| TOTAL RETURN(b) | 13.10 | % | 31.28 | % | 0.32 | % | ||||||
| RATIOS/SUPPLEMENTAL DATA: | ||||||||||||
| Net assets, end of period (000s) | $ | 180,614 | $ | 106,359 | $ | 16,271 | ||||||
| Ratio of expenses to average net assets | 0.65 | %(c) | 0.65 | % | 0.65 | %(c) | ||||||
| Ratio of net investment income to average net assets | 2.01 | %(c) | 1.10 | % | 0.89 | %(c) | ||||||
| Portfolio turnover rate(d) | 16 | % | 15 | % | 9 | % | ||||||
| (a) | Based on average shares outstanding during the period. |
| (b) | Total return is calculated assuming an initial investment made at the net asset value at the beginning of the period and redemption at the net asset value on the last day of the period and assuming all distributions are reinvested at reinvestment prices. Total return calculated for a period of less than one year is not annualized. |
| (c) | Annualized. |
| (d) | Portfolio turnover for periods less than one year are not annualized and does not include securities received or delivered from processing creations or redemptions in-kind. |
See Notes to Financial Statements.
20 | May 31, 2020
| ALPS Disruptive Technologies ETF | |
| Financial Highlights | For a Share Outstanding Throughout the Periods Presented |
| For the Six Months Ended May 31, 2020 (Unaudited) | For the Year Ended November 30, 2019 | For the Period December 28, 2017 (Commencement of Operations) to November 30, 2018 | ||||||||||
| NET ASSET VALUE, BEGINNING OF PERIOD | $ | 31.88 | $ | 26.21 | $ | 25.08 | ||||||
| INCOME/(LOSS) FROM INVESTMENT OPERATIONS: | ||||||||||||
| Net investment income (a) | 0.23 | 0.14 | 0.13 | |||||||||
| Net realized and unrealized gain | 1.68 | 5.61 | 1.00 | (b) | ||||||||
| Total from investment operations | 1.91 | 5.75 | 1.13 | |||||||||
| DISTRIBUTIONS: | ||||||||||||
| From net investment income | (0.14 | ) | (0.08 | ) | – | |||||||
| Total distributions | (0.14 | ) | (0.08 | ) | – | |||||||
| Net increase in net asset value | 1.77 | 5.67 | 1.13 | |||||||||
| NET ASSET VALUE, END OF PERIOD | $ | 33.65 | $ | 31.88 | $ | 26.21 | ||||||
| TOTAL RETURN(c) | 6.00 | % | 22.04 | % | 4.47 | % | ||||||
| RATIOS/SUPPLEMENTAL DATA: | ||||||||||||
| Net assets, end of period (000s) | $ | 85,812 | $ | 74,910 | $ | 48,483 | ||||||
| Ratio of expenses to average net assets | 0.50 | %(d) | 0.50 | % | 0.50 | %(d) | ||||||
| Ratio of net investment income to average net assets | 1.48 | %(d) | 0.48 | % | 0.53 | %(d) | ||||||
| Portfolio turnover rate(e) | 11 | % | 42 | % | 33 | % | ||||||
| (a) | Based on average shares outstanding during the period. |
| (b) | Net realized and unrealized loss on investments per share does not correlate to aggregate of the net realized and unrealized gain in the Statements of Operations for the year ended November 30, 2018, primarily due to the timing of the sales and repurchases of the Fund's shares in relation to the fluctuating market values for the Fund's portfolio. |
| (c) | Total return is calculated assuming an initial investment made at the net asset value at the beginning of the period and redemption at the net asset value on the last day of the period and assuming all distributions are reinvested at reinvestment prices. Total return calculated for a period of less than one year is not annualized. |
| (d) | Annualized. |
| (e) | Portfolio turnover for periods less than one year are not annualized and does not include securities received or delivered from processing creations or redemptions in-kind. |
See Notes to Financial Statements.
21 | May 31, 2020
| ALPS Medical Breakthroughs ETF | |
| Financial Highlights | For a Share Outstanding Throughout the Periods Presented |
| For the Six Months Ended May 31, 2020 (Unaudited) | For the Year Ended November 30, 2019 | For the Year Ended November 30, 2018 | For the Year Ended November 30, 2017 | For the Year Ended November 30, 2016 | For the Period December 31, 2014 (Commencement of Operations) to November 30, 2015 | |||||||||||||||||||
| NET ASSET VALUE, BEGINNING OF PERIOD | $ | 39.51 | $ | 33.59 | $ | 31.70 | $ | 24.16 | $ | 32.23 | $ | 24.64 | ||||||||||||
| INCOME/(LOSS) FROM INVESTMENT OPERATIONS: | ||||||||||||||||||||||||
| Net investment income/(loss) (a) | (0.07 | ) | 0.03 | (0.10 | ) | 0.18 | (0.09 | ) | (0.13 | ) | ||||||||||||||
| Net realized and unrealized gain/(loss) | 2.05 | (b) | 6.67 | 2.57 | (b) | 7.36 | (7.98 | ) | 7.72 | |||||||||||||||
| Total from investment operations | 1.98 | 6.70 | 2.47 | 7.54 | (8.07 | ) | 7.59 | |||||||||||||||||
| DISTRIBUTIONS: | ||||||||||||||||||||||||
| From net investment income | (0.02 | ) | (0.78 | ) | (0.58 | ) | – | – | – | |||||||||||||||
| Total distributions | (0.02 | ) | (0.78 | ) | (0.58 | ) | – | – | – | |||||||||||||||
| Net increase/(decrease) in net asset value | 1.96 | 5.92 | 1.89 | 7.54 | (8.07 | ) | 7.59 | |||||||||||||||||
| NET ASSET VALUE, END OF PERIOD | $ | 41.47 | $ | 39.51 | $ | 33.59 | $ | 31.70 | $ | 24.16 | $ | 32.23 | ||||||||||||
| TOTAL RETURN(c) | 5.00 | % | 20.99 | % | 7.81 | % | 31.21 | % | (25.04 | )% | 30.80 | % | ||||||||||||
| RATIOS/SUPPLEMENTAL DATA: | ||||||||||||||||||||||||
| Net assets, end of period (000s) | $ | 192,837 | $ | 197,570 | $ | 221,694 | $ | 128,402 | $ | 118,370 | $ | 170,824 | ||||||||||||
| Ratio of expenses to average net assets | 0.50 | %(d) | 0.50 | % | 0.50 | % | 0.50 | % | 0.50 | % | 0.50 | %(d) | ||||||||||||
| Ratio of net investment income/(loss) to average net assets | (0.37 | )%(d) | 0.09 | % | (0.27 | )% | 0.66 | % | (0.38 | )% | (0.42 | )%(d) | ||||||||||||
| Portfolio turnover rate(e) | 34 | % | 88 | % | 48 | % | 43 | % | 62 | % | 25 | % | ||||||||||||
| (a) | Based on average shares outstanding during the period. |
| (b) | Net realized and unrealized loss on investments per share does not correlate to aggregate of the net realized and unrealized gain in the Statements of Operations during the six months ended May 31, 2020 and during the year ended November 30, 2018, primarily due to the timing of the sales and repurchases of the Fund's shares in relation to the fluctuating market values for the Fund's portfolio. |
| (c) | Total return is calculated assuming an initial investment made at the net asset value at the beginning of the period and redemption at the net asset value on the last day of the period and assuming all distributions are reinvested at reinvestment prices. Total return calculated for a period of less than one year is not annualized. |
| (d) | Annualized. |
| (e) | Portfolio turnover for periods less than one year are not annualized and does not include securities received or delivered from processing creations or redemptions in-kind. |
See Notes to Financial Statements.
22 | May 31, 2020
ALPS ETF Trust
| Notes to Financial Statements | May 31, 2020 (Unaudited) |
1. ORGANIZATION
ALPS ETF Trust (the “Trust”), a Delaware statutory trust, is an open-end management investment company registered under the Investment Company Act of 1940, as amended (the “1940 Act”). As of May 31, 2020, the Trust consisted of sixteen separate portfolios. Each portfolio represents a separate series of the Trust. This report pertains to the ALPS Clean Energy ETF, ALPS Disruptive Technologies ETF, and the ALPS Medical Breakthroughs ETF (each a “Fund” and collectively, the “Funds”). ALPS Clean Energy ETF and ALPS Disruptive Technologies ETF are considered non-diversified and may invest a greater portion of assets in securities of individual issuers than a diversified fund. As a result, changes in the market value of a single investment could cause greater fluctuations in share price than would occur in a diversified fund. ALPS Medical Breakthroughs ETF has elected to qualify as a diversified series of the Trust under the 1940 Act.
The investment objective of the ALPS Clean Energy ETF is to seek investment results that correspond generally, before fees and expenses, to the performance of the CIBC Atlas Clean Energy Total Return Index. The investment objective of the ALPS Disruptive Technologies ETF is to seek investment results that correspond generally, before fees and expenses, to the performance of the Indxx Disruptive Technologies Total Return Index. The investment objective of the ALPS Medical Breakthroughs ETF is to seek investment results that correspond generally, before fees and expenses, to the performance of the S-Network Medical Breakthroughs Total Return Index.
The shares of the ALPS Clean Energy ETF and ALPS Disruptive Technologies ETF (“Shares”) are listed on the Cboe BZX Exchange, Inc. (the “Cboe BZX”). The shares of the ALPS Medical Breakthroughs ETF (“Shares”) are listed on the NYSE Arca, Inc. (the “NYSE Arca”). Each Fund issues and redeems Shares at net asset value (“NAV”) in blocks of 50,000 Shares, each of which is called a “Creation Unit”. Creation Units are issued and redeemed principally in-kind for securities included in the Underlying Index. Except when aggregated in Creation Units, Shares are not redeemable securities of the Fund.
Pursuant to the Trust’s organizational documents, its Officers and Trustees are indemnified against certain liability arising out of the performance of their duties to the Trust. Additionally, in the normal course of business, the Trust enters into contracts with service providers that contain general indemnification clauses. The Trust’s maximum exposure under these arrangements is unknown, as this would involve future claims that may be made against the Trust that have not yet occurred.
2. SIGNIFICANT ACCOUNTING POLICIES
The following is a summary of significant accounting policies consistently followed by the Funds in the preparation of the financial statements. The accompanying financial statements were prepared in accordance with accounting principles generally accepted in the United States of America (“U.S. GAAP”). The preparation of financial statements in conformity with U.S. GAAP requires management to make certain estimates and assumptions that affect the reported amounts of assets and liabilities and disclosures of contingent assets and liabilities at the date of the financial statements and the reported amounts of revenue and expenses during the period. Actual results could differ from those estimates. Each Fund is considered an investment company under U.S. GAAP and follows the accounting and reporting guidance applicable to investment companies in the Financial Accounting Standards Board (“FASB”) Accounting Standards Codification Topic 946.
A. Portfolio Valuation
Each Fund’s NAV is determined daily, as of the close of regular trading on the New York Stock Exchange (the “NYSE”), normally 4:00 p.m. Eastern time, on each day the NYSE is open for trading. The NAV is computed by dividing the value of all assets of the Fund (including accrued interest and dividends), less all liabilities (including accrued expenses and dividends declared but unpaid), by the total number of shares outstanding.
Portfolio securities listed on any exchange other than the NASDAQ Stock Market LLC (“NASDAQ”) are valued at the last sale price on the business day as of which such value is being determined. If there has been no sale on such day, the securities are valued at the mean of the most recent bid and ask prices on such day. Securities traded on the NASDAQ are valued at the NASDAQ Official Closing Price as determined by NASDAQ. Portfolio securities traded on more than one securities exchange are valued at the last sale price on the business day as of which such value is being determined at the close of the exchange representing the principal market for such securities. Portfolio securities traded in the over-the-counter market, but excluding securities traded on the NASDAQ, are valued at the last quoted sale price in such market.
The Funds’ investments are valued at market value or, in the absence of market value with respect to any portfolio securities, at fair value according to procedures adopted by the Trust’s Board of Trustees (the “Board”). When market quotations are not readily available or when events occur that make established valuation methods unreliable, securities of the Funds may be valued in good faith by or under the direction of the Board. These securities generally include, but are not limited to, restricted securities (securities which may not be publicly sold without registration under the Securities Act of 1933) for which a pricing service is unable to provide a market price; securities whose trading has been formally suspended; a security whose market price is not available from a pre-established primary pricing source or the pricing source is not willing to provide a price; a security with respect to which an event has occurred that is most likely to materially affect the value of the security after the market has closed but before the calculation of the Fund’s NAV or make it difficult or impossible to obtain a reliable market quotation; or a security whose price, as provided by the pricing service, does not reflect the security’s “fair value” due to the security being de-listed from a national exchange or the security’s primary trading market is temporarily closed at a time when, under normal conditions, it would be open. As a general principle, the current “fair value” of a security would be the amount which the owner might reasonably expect to receive from the sale on the applicable exchange or principal market. A variety of factors may be considered in determining the fair value of such securities.
23 | May 31, 2020
ALPS ETF Trust
| Notes to Financial Statements | May 31, 2020 (Unaudited) |
B. Fair Value Measurements
Each Fund discloses the classification of its fair value measurements following a three-tier hierarchy based on the inputs used to measure fair value. Inputs refer broadly to the assumptions that market participants would use in pricing the asset or liability; including assumptions about risk. Inputs may be observable or unobservable. Observable inputs reflect the assumptions market participants would use in pricing the asset or liability that are developed based on market data obtained from sources independent of the reporting entity. Unobservable inputs reflect the reporting entity’s own assumptions about the assumptions market participants would use in pricing the asset or liability that are developed based on the best information available.
Valuation techniques used to value the Funds’ investments by major category are as follows:
Equity securities, including restricted securities, for which market quotations are readily available, are valued at the last reported sale price or official closing price as reported by a third party pricing vendor on the primary market or exchange on which they are traded and are categorized as Level 1 in the hierarchy. In the event there were no sales during the day or closing prices are not available, securities are valued at the mean of the most recent quoted bid and ask prices on such day and are generally categorized as Level 2 in the hierarchy. Investments in open-end mutual funds are valued at their closing NAV each business day and are categorized as Level 1 in the hierarchy.
Changes in valuation techniques may result in transfers in or out of an assigned level within the disclosure hierarchy.
Various inputs are used in determining the value of each Fund’s investments as of the end of the reporting period. When inputs used fall into different levels of the fair value hierarchy, the level in the hierarchy within which the fair value measurement falls is determined based on the lowest level input that is significant to the fair value measurement in its entirety. The designated input levels are not necessarily an indication of the risk or liquidity associated with these investments.
These inputs are categorized in the following hierarchy under applicable financial accounting standards:
| Level 1 – | Unadjusted quoted prices in active markets for identical investments, unrestricted assets or liabilities that a Fund has the ability to access at the measurement date; |
| Level 2 – | Quoted prices which are not active, quoted prices for similar assets or liabilities in active markets or inputs other than quoted prices that are observable (either directly or indirectly) for substantially the full term of the asset or liability; and |
| Level 3 – | Significant unobservable prices or inputs (including the Fund’s own assumptions in determining the fair value of investments) where there is little or no market activity for the asset or liability at the measurement date. |
24 | May 31, 2020
ALPS ETF Trust
| Notes to Financial Statements | May 31, 2020 (Unaudited) |
The following is a summary of the inputs used to value the Funds’ investments as of May 31, 2020:
ALPS Clean Energy ETF
| Investments in Securities at Value | Level 1 - Quoted and Unadjusted Prices | Level 2 - Other Significant Observable Inputs | Level 3 - Significant Unobservable Inputs | Total | ||||||||||||
| Common Stocks* | $ | 160,526,743 | $ | – | $ | – | $ | 160,526,743 | ||||||||
| Master Limited Partnerships* | 19,478,413 | – | – | 19,478,413 | ||||||||||||
| Short Term Investments | 10,564,244 | – | – | 10,564,244 | ||||||||||||
| Total | $ | 190,569,400 | $ | – | $ | – | $ | 190,569,400 | ||||||||
ALPS Disruptive Technologies ETF
��
| Investments in Securities at Value | Level 1 - Quoted and Unadjusted Prices | Level 2 - Other Significant Observable Inputs | Level 3 - Significant Unobservable Inputs | Total | ||||||||||||
| Common Stocks* | $ | 84,853,371 | $ | – | $ | – | $ | 84,853,371 | ||||||||
| Master Limited Parterships* | 776,384 | – | – | 776,384 | ||||||||||||
| Short Term Investments | 1,314,919 | – | – | 1,314,919 | ||||||||||||
| Total | $ | 86,944,674 | $ | – | $ | – | $ | 86,944,674 | ||||||||
ALPS Medical Breakthroughs ETF
| Investments in Securities at Value | Level 1 - Quoted and Unadjusted Prices | Level 2 - Other Significant Observable Inputs | Level 3 - Significant Unobservable Inputs | Total | ||||||||||||
| Common Stocks* | $ | 192,772,022 | $ | – | $ | – | $ | 192,772,022 | ||||||||
| Short Term Investments | 29,402,924 | – | – | 29,402,924 | ||||||||||||
| Total | $ | 222,174,946 | $ | – | $ | – | $ | 222,174,946 | ||||||||
| * | For a detailed sector breakdown, see the accompanying Schedule of Investments. |
The Funds did not have any securities that used significant unobservable inputs (Level 3) in determining fair value and there were no transfers into or out of Level 3 during the six months ended May 31, 2020.
C. Foreign Investment Risk
The Funds may directly purchase securities of foreign issuers. Investments in non-U.S. issuers may involve unique risks compared to investing in securities of U.S. issuers, including, among others, less liquidity generally, greater market volatility than U.S. securities and less complete financial information than for U.S. issuers. In addition, adverse political, economic or social developments could undermine the value of the Fund’s investments or prevent the Fund from realizing the full value of its investments. Financial reporting standards for companies based in foreign markets differ from those in the United States. Finally, the value of the currency of the country in which the Fund has invested could decline relative to the value of the U.S. dollar, which may affect the value of the investment to U.S. investors. The Fund will not enter into transactions to hedge against declines in the value of the Fund’s assets that are denominated in foreign currency.
Countries with emerging markets may have relatively unstable governments and may present the risks of nationalization of businesses, restrictions on foreign ownership and prohibitions on the repatriation of assets. The economies of emerging markets countries also may be based on only a few industries, making them more vulnerable to changes in local or global trade conditions and more sensitive to debt burdens, inflation rates or adverse news and events.
Because foreign markets may be open on different days than the days during which investors may purchase the shares of the Fund, the value of the Funds’ securities may change on the days when investors are not able to purchase the shares of the Fund. The value of securities denominated in foreign currencies is converted into U.S. dollars using exchange rates determined daily as of the close of regular trading on the NYSE. Any use of a different rate from the rates used by the Index may adversely affect a Fund's ability to track its Index.
25 | May 31, 2020
ALPS ETF Trust
| Notes to Financial Statements | May 31, 2020 (Unaudited) |
D. Foreign Currency Translation
The books and records of the Funds are maintained in U.S. dollars. Investment valuations and other assets and liabilities initially expressed in foreign currencies are converted each business day into U.S. dollars based upon current exchange rates. The portion of realized and unrealized gains or losses on investments due to fluctuations in foreign currency exchange rates is not separately disclosed and is included in realized and unrealized gains or losses on investments, when applicable.
E. Other Risks
Equity Risk: A principal risk of investing in the Funds is equity risk, which is the risk that the value of the securities held by the Fund will fall due to general market and economic conditions, perceptions regarding the industries in which the issuers of securities held by the Fund participate or factors relating to specific companies in which the Fund invests. For example, an adverse event, such as an unfavorable earnings report, may depress the value of equity securities of an issuer held by a Fund; the price of common stock of an issuer may be particularly sensitive to general movements in the stock market; or a drop in the stock market may depress the price of most or all of the common stocks and other equity securities held by a Fund. In addition, common stock of an issuer in a Fund’s portfolio may decline in price if the issuer fails to make anticipated dividend payments because, among other reasons, the issuer of the security experiences a decline in its financial condition.
Small- and Mid- Capitalization Company Risk: Investments in securities of small and mid-capitalization companies are subject to the risks of common stocks. Investments in smaller companies may involve greater risks because these companies generally have a limited track record. Smaller companies often have narrower markets, more limited managerial and financial resources and a less diversified product offering than larger, more established companies. As a result, their performance can be more volatile, which may increase the volatility of the Fund’s portfolio.
Concentration Risk: Each Fund seeks to track its respective Underlying Index, which may have concentration in certain industries or sectors, as well as regions, economies or markets. Underperformance or increased risk in such other concentrated areas may result in underperformance or increased risk in a Fund.
Non-Correlation Risk: Each Fund’s return may not match the return of its respective Underlying Index for a number of reasons. For example, a Fund incurs a number of operating expenses not applicable to its Underlying Index, and incurs costs in buying and selling securities, especially when rebalancing the Fund’s securities holdings to reflect changes in the composition of the Underlying Index. In addition, the performance of a Fund and its Underlying Index may vary due to asset valuation differences and differences between the Fund’s portfolio and the Underlying Index resulting from legal restrictions. Due to legal and regulatory rules and limitations, a Fund may not be able to invest in all securities included in its Underlying Index. For tax efficiency purposes, a Fund may sell certain securities to realize losses, causing it to deviate from the Underlying Index. The Fund may not be fully invested at times, either as a result of cash flows into the Fund or reserves of cash held by the Fund to meet redemptions and expenses. If a Fund utilizes a sampling approach or otherwise does not hold all of the securities in the Underlying Index, its return may not correlate as well with the return on its Underlying Index, as would be the case if it purchased all of the securities in the Underlying Index with the same weightings as the Underlying Index.
F. Securities Transactions and Investment Income
Securities transactions are recorded as of the trade date. Realized gains and losses from securities transactions are recorded on the highest cost basis. Dividend income and capital gains distributions, if any, are recorded on the ex-dividend date, net of any foreign taxes withheld. Interest income, if any, is recorded on the accrual basis.
G. Dividends and Distributions to Shareholders
Dividends from net investment income for both ALPS Disruptive Technology ETF and ALPS Medical Breakthroughs ETF, if any, are declared and paid annually or as the Board may determine from time to time. Dividends from net investment income for ALPS Clean Energy ETF, if any, are declared and paid quarterly or as the Board may determine from time to time. Distributions of net realized capital gains earned by the Funds, if any, are distributed at least annually.
26 | May 31, 2020
ALPS ETF Trust
| Notes to Financial Statements | May 31, 2020 (Unaudited) |
H. Federal Tax and Tax Basis Information
The timing and character of income and capital gain distributions are determined in accordance with income tax regulations, which may differ from U.S. GAAP. Reclassifications are made to the Funds’ capital accounts for permanent tax differences to reflect income and gains available for distribution (or available capital loss carryforwards) under income tax regulations. The amounts and characteristics of tax basis distributions and composition of distributable earnings/(accumulated losses) are finalized at fiscal year-end; accordingly, tax basis balances have not been determined as of May 31, 2020.
The tax character of the distributions paid during the fiscal year ended November 30, 2019 was as follows:
| Ordinary Income | Long-Term Capital Gain | Return of Capital | ||||||||||
| November 30, 2019 | ||||||||||||
| ALPS Clean Energy ETF | $ | 391,478 | $ | – | $ | 652,198 | ||||||
| ALPS Disruptive Technologies ETF | 147,001 | – | – | |||||||||
| ALPS Medical Breakthroughs ETF | 4,900,375 | – | – | |||||||||
Under current law, capital losses maintain their character as short-term or long-term and are carried forward to the next tax year without expiration. As of November 30, 2019, the following amounts are available as carry forwards to the next tax year:
| Fund | Short-Term | Long-Term | ||||||
| ALPS Clean Energy ETF | $ | 681,866 | $ | 43,253 | ||||
| ALPS Disruptive Technologies ETF | 1,750,762 | 989,644 | ||||||
| ALPS Medical Breakthroughs ETF | 39,644,148 | 39,378,453 | ||||||
The ALPS Medical Breakthrough ETF elects to defer to the year ending November 30, 2020, late year ordinary losses in the amount of $484,171.
As of May 31, 2020, the cost of investments for federal income tax purposes and accumulated net unrealized appreciation/(depreciation) on investments were as follows:
| ALPS Clean Energy ETF | ALPS Disruptive Technologies ETF | ALPS Medical Breakthroughs ETF | ||||||||||
| Gross appreciation (excess of value over tax cost) | $ | 39,231,442 | $ | 16,526,384 | $ | 43,420,975 | ||||||
| Gross depreciation (excess of tax cost over value) | (12,112,553 | ) | (3,997,786 | ) | (23,424,552 | ) | ||||||
| Net unrealized appreciation (depreciation) | $ | 27,118,889 | $ | 12,528,598 | $ | 19,996,423 | ||||||
| Cost of investments for income tax purposes | $ | 163,450,511 | $ | 74,416,076 | $ | 202,178,523 | ||||||
The differences between book-basis and tax-basis are primarily due to the deferral of losses from wash sales and investments in partnerships. In addition, certain tax cost basis adjustments are finalized at fiscal year-end and therefore have not been determined as of May 31, 2020.
I. Income Taxes
No provision for income taxes is included in the accompanying financial statements, as each Fund intends to distribute to shareholders all taxable investment income and realized gains and otherwise comply with Subchapter M of the Internal Revenue Code of 1986, as amended, applicable to regulated investment companies. Each Fund evaluates tax positions taken (or expected to be taken) in the course of preparing the Fund’s tax returns to determine whether these positions meet a “more-likely-than-not” standard that, based on the technical merits, have a more than fifty percent likelihood of being sustained by a taxing authority upon examination. A tax position that meets the “more-likely-than-not” recognition threshold is measured to determine the amount of benefit to recognize in the financial statements.
As of and during the six months ended May 31, 2020, each Fund did not have a liability for any unrecognized tax benefits. Each Fund files U.S. federal, state, and local tax returns as required. Each Fund’s tax returns are subject to examination by the relevant tax authorities until expiration of the applicable statute of limitations, which is generally three years after the filing of the tax return, but may extend to four years in certain jurisdictions. Tax returns for open years have incorporated no uncertain tax positions that require a provision for income taxes.
27 | May 31, 2020
ALPS ETF Trust
| Notes to Financial Statements | May 31, 2020 (Unaudited) |
J. Lending of Portfolio Securities
The Funds have entered into a securities lending agreement with State Street Bank & Trust Co. (“SSB”), the Funds’ lending agent. Each Fund may lend their portfolio securities only to borrowers that are approved by SSB. Each Fund will limit such lending to not more than 33 1/3% of the value of its total assets. Each Funds’ securities held at SSB as custodian shall be available to be lent except those securities the Fund or ALPS Advisors, Inc. specifically identifies in writing as not being available for lending. The borrower pledges and maintains with each Fund collateral consisting of cash (U.S. Dollars only), securities issued or guaranteed by the U.S. government or its agencies or instrumentalities, and cash equivalents (including irrevocable bank letters of credit) issued by a person other than the borrower or an affiliate of the borrower. The initial collateral received by each Fund is required to have a value of no less than 102% of the market value of the loaned securities for U.S equity securities and a value of no less than 105% of the market value for non-U.S. equity securities. The collateral is maintained thereafter, at a market value equal to not less than 102% of the current value of the U.S. equity securities on loan and not less than 105% of the current value of the non-U.S. equity securities on loan. The market value of the loaned securities is determined at the close of each business day and any additional required collateral is delivered to each Fund on the next business day. During the term of the loan, each Fund is entitled to all distributions made on or in respect of the loaned securities. Loans of securities are terminable at any time and the borrower, after notice, is required to return borrowed securities within the customary time period for settlement of securities transactions.
Any cash collateral received is reinvested in a money market fund managed by SSB as disclosed in the Fund’s Schedule of Investments and is reflected in the Statements of Assets and Liabilities as a payable for collateral upon return of securities loaned. Non-cash collateral, in the form of securities issued or guaranteed by the U.S. government or its agencies or instrumentalities, is not disclosed in a Fund’s Statements of Assets and Liabilities as it is held by the lending agent on behalf of each Fund, and each Fund does not have the ability to re-hypothecate these securities. Income earned by the Fund from securities lending activity is disclosed in the Statement of Operations.
The following is a summary of each Fund's securities lending agreement and related cash and non-cash collateral received as of May 31, 2020:
| Market Value of Securities on Loan | Cash Collateral Received | Non-Cash Collateral Received | Total Collateral Received | |||||||||||||
| ALPS Clean Energy ETF | $ | 13,057,662 | $ | 10,262,064 | $ | 3,006,321 | $ | 13,268,385 | ||||||||
| ALPS Disruptive Technologies ETF | 5,262,402 | 1,187,919 | 4,036,929 | 5,224,848 | ||||||||||||
| ALPS Medical Breakthroughs ETF | 48,668,465 | 29,270,745 | 20,715,464 | 49,986,209 | ||||||||||||
The risks of securities lending include the risk that the borrower may not provide additional collateral when required or may not return the securities when due. To mitigate these risks, each Fund benefits from a borrower default indemnity provided by SSB. SSB’s indemnity allows for full replacement of securities lent wherein SSB will purchase the unreturned loaned securities on the open market by applying the proceeds of the collateral or to the extent such proceeds are insufficient or the collateral is unavailable, SSB will purchase the unreturned loan securities at SSB’s expense. However, the Funds could suffer a loss if the value of the investments purchased with cash collateral falls below the value of the cash collateral received.
28 | May 31, 2020
ALPS ETF Trust
| Notes to Financial Statements | May 31, 2020 (Unaudited) |
The following tables reflect a breakdown of transactions accounted for as secured borrowings, the gross obligation by the type of collateral pledged or securities loaned, and the remaining contractual maturity of those transactions as of May 31, 2020:
| ALPS Clean Energy ETF | Remaining contractual maturity of the agreements | |||||||||||||||||||
| Securities Lending Transactions | Overnight & Continuous | Up to 30 days | 30-90 days | Greater than 90 days | Total | |||||||||||||||
| Common Stocks | $ | 10,262,064 | $ | – | $ | – | $ | – | $ | 10,262,064 | ||||||||||
| Total Borrowings | 10,262,064 | |||||||||||||||||||
| Gross amount of recognized liabilities for securities lending (collateral received) | $ | 10,262,064 | ||||||||||||||||||
| ALPS Disruptive Technologies ETF | Remaining contractual maturity of the agreements | |||||||||||||||||||
| Securities Lending Transactions | Overnight & Continuous | Up to 30 days | 30-90 days | Greater than 90 days | Total | |||||||||||||||
| Common Stocks | $ | 1,187,919 | $ | – | $ | – | $ | – | $ | 1,187,919 | ||||||||||
| Total Borrowings | 1,187,919 | |||||||||||||||||||
| Gross amount of recognized liabilities for securities lending (collateral received) | $ | 1,187,919 | ||||||||||||||||||
| ALPS Medical Breakthroughs ETF | Remaining contractual maturity of the agreements | |||||||||||||||||||
| Securities Lending Transactions | Overnight & Continuous | Up to 30 days | 30-90 days | Greater than 90 days | Total | |||||||||||||||
| Common Stocks | $ | 29,270,745 | $ | – | $ | – | $ | – | $ | 29,270,745 | ||||||||||
| Total Borrowings | 29,270,745 | |||||||||||||||||||
| Gross amount of recognized liabilities for securities lending (collateral received) | $ | 29,270,745 | ||||||||||||||||||
3. INVESTMENT ADVISORY FEE AND OTHER AFFILIATED TRANSACTIONS
ALPS Advisors, Inc. (the “Adviser”) serves as the Funds’ investment adviser pursuant to an Investment Advisory Agreement with the Trust on behalf of each Fund (the “Advisory Agreement”). Pursuant to the Advisory Agreement, each Fund pays the Adviser an annual management fee for the services and facilities it provides, payable on a monthly basis as a percentage of the relevant Fund’s average daily net assets as set out below. From time to time, the Adviser may waive all or a portion of its fee.
| Fund | Advisory Fee |
| ALPS Clean Energy ETF | 0.65% |
| ALPS Disruptive Technologies ETF | 0.50% |
| ALPS Medical Breakthroughs ETF | 0.50% |
Out of the unitary management fee, the Adviser pays substantially all expenses of each Fund, including licensing fees to the Underlying Index provider, the cost of transfer agency, custody, fund administration, legal, audit, independent trustees and other services, except for interest expenses, distribution fees or expenses, brokerage expenses, taxes and extraordinary expenses not incurred in the ordinary course of each Fund's business. The Adviser’s unitary management fee is designed to pay substantially all of each Fund's expenses and to compensate the Adviser for providing services for each Fund.
ALPS Fund Services, Inc., an affiliate of the Adviser, is the administrator for the Funds.
Each Trustee who is not considered an “interested person” (as defined in the Investment Company Act of 1940, as amended (“1940 Act”)) (“Independent Trustees”) receives (1) a quarterly retainer of $5,000, (2) a per meeting fee for regularly scheduled meetings of $3,750, (3) $1,500 for any special meeting held outside of a regularly scheduled board meeting, and (4) reimbursement for all reasonable out-of-pocket expenses relating to attendance at meetings. Prior to January 1, 2020, a Trustee who is considered an “interested person” (as defined in the 1940 Act) (“Interested Trustee”) received no compensation or expense reimbursements from the Trust. Effective January 1, 2020 the Interested Trustee receives (1) a quarterly retainer of $5,000, (2) a per meeting fee of $3,750, (3) $1,500 for any special meeting held outside of a regularly scheduled board meeting, and (4) reimbursement for all reasonable out-of-pocket expenses relating to attendance at meetings. In addition, the Chairman of the Board and Chairman of the Audit Committee each receives a quarterly retainer of $2,000, in connection with their respective roles.
29 | May 31, 2020
ALPS ETF Trust
| Notes to Financial Statements | May 31, 2020 (Unaudited) |
4. PURCHASES AND SALES OF SECURITIES
For the six months ended May 31, 2020, the cost of purchases and proceeds from sales of investment securities, excluding short-term investments and in-kind transactions, were as follows:
| Fund | Purchases | Sales | ||||||
| ALPS Clean Energy ETF | $ | 22,767,760 | $ | 22,719,302 | ||||
| ALPS Disruptive Technologies ETF | 8,619,454 | 8,348,266 | ||||||
| ALPS Medical Breakthroughs ETF | 65,716,984 | 66,183,112 | ||||||
For the six months ended May 31, 2020, the cost of in-kind purchases and proceeds from in-kind sales were as follows:
| Fund | Purchases | Sales | ||||||
| ALPS Clean Energy ETF | $ | 65,616,776 | $ | 3,443,977 | ||||
| ALPS Disruptive Technologies ETF | 9,917,068 | 2,779,881 | ||||||
| ALPS Medical Breakthroughs ETF | 33,849,931 | 37,028,908 | ||||||
For the six months ended May 31, 2020, the in-kind net realized gains/(losses) were as follows:
| Fund | Net Realized Gain/(Loss) | |||
| ALPS Clean Energy ETF | $ | 1,237,310 | ||
| ALPS Disruptive Technologies ETF | 546,549 | |||
| ALPS Medical Breakthroughs ETF | 1,275,532 | |||
Gains on in-kind transactions are not considered taxable for federal income tax purposes and losses on in-kind transactions are also not deductible for tax purposes.
5. CAPITAL SHARE TRANSACTIONS
Shares are created and redeemed by each Fund only in Creation Unit size aggregations of 50,000 Shares. Only broker-dealers or large institutional investors with creation and redemption agreements called Authorized Participants (“AP”) are permitted to purchase or redeem Creation Units from the Funds. Such transactions are generally permitted on an in-kind basis, with a balancing cash component to equate the transaction to the NAV per unit of each Fund on the transaction date. Cash may be substituted equivalent to the value of certain securities generally when they are not available in sufficient quantity for delivery, not eligible for trading by the AP or as a result of other market circumstances.
6. RELATED PARTY TRANSACTIONS
The ALPS Clean Energy ETF engaged in cross trades between other funds in the Trust during the six months ended May 31, 2020 pursuant to Rule 17a-7 under the 1940 Act. Cross trading is the buying or selling of portfolio securities between funds to which the Adviser serves as the investment adviser. The Board previously adopted procedures that apply to transactions between the Funds of the Trust pursuant to Rule 17a-7. These transactions related to cross trades during the period complied with the requirements set forth by Rule 17a-7 and the Trust’s procedures.
Transactions related to cross trades during the six months ended May 31, 2020, were as follows:
| Fund | Purchase cost paid | Sale proceeds received | Realized gain/(loss) on sales | |||||||||
| ALPS Clean Energy ETF | $ | – | $ | 216,242 | $ | (275,210 | ) | |||||
30 | May 31, 2020
ALPS ETF Trust
| Notes to Financial Statements | May 31, 2020 (Unaudited) |
7. MARKET DISRUPTIONS RISK
The Funds are subject to investment and operational risks associated with financial, economic and other global market developments and disruptions, including the recent spread of an infectious respiratory illness caused by a novel strain of coronavirus (known as COVID-19), which can negatively impact the securities markets and cause each Fund to lose value.
The spread of COVID-19 has caused volatility, severe market dislocations and liquidity constraints in many markets, including markets for the securities each Fund holds, and may adversely affect each Fund’s investments and operations. The transmission of COVID-19 and efforts to contain its spread have resulted in travel restrictions and disruptions, closed international borders, enhanced health screenings at ports of entry and elsewhere, disruption of and delays in healthcare service preparation and delivery, quarantines, event and service cancellations or interruptions, disruptions to business operations and supply chains, and a reduction in consumer and business spending, as well as general concern and uncertainty that has negatively affected the economy. These disruptions have led to instability in the market place and the jobs market. The impact of COVID-19 could adversely affect the economies of many nations or the entire global economy, the financial well-being and performance of individual issuers, borrowers and sectors and the health of the markets generally in potentially significant and unforeseen ways.
The foregoing could lead to a significant economic downturn or recession, increased market volatility, a greater number of market closures, higher default rates and adverse effects on the values and liquidity of each Fund’s securities or other assets. Such impacts may adversely affect the performance of the Funds.
8. SUBSEQUENT EVENTS
Effective July 1, 2020, each Trustee will be compensated a quarterly retainer of $10,000, and a per meeting fee of $5,000.
31 | May 31, 2020
ALPS ETF Trust
| Additional Information | May 31, 2020 (Unaudited) |
PROXY VOTING RECORDS, POLICIES AND PROCEDURES
Information regarding how each Fund voted proxies relating to portfolio securities during the most recent 12-month period ended June 30 and a description of the Fund’s proxy voting policies and procedures used in determining how to vote for proxies are available without charge on the SEC’s website at www.sec.gov and upon request, by calling (toll-free) 1-866-675-2639.
PORTFOLIO HOLDINGS
The Fund files a complete schedule of portfolio holdings with the U.S. Securities and Exchange Commission (“SEC”) for the first and third quarters of each fiscal year on Form N-PORT within 60 days after the end of the period. Copies of the Fund’s Form N-PORT are available without a charge, upon request, by contacting the Fund at 1-855-838-9485 and on the SEC’s website at https://www.sec.gov.
TAX INFORMATION
The Funds designate the following as a percentage of taxable ordinary income distributions, or up to the maximum amount allowable, for the calendar year ended December 31, 2019:
| Qualified Dividend Income | Dividend Received Deduction | |
| ALPS Clean Energy ETF | 30.12% | 3.50% |
| ALPS Disruptive Technologies ETF | 100.00% | 59.30% |
| ALPS Medical Breakthroughs ETF | 0.00% | 0.00% |
In early 2020, if applicable, shareholders of record received this information for the distribution paid to them by the Funds during the calendar year 2019 via Form 1099. The Funds will notify shareholders in early 2021 of amounts paid to them by the Fund, if any, during the calendar year 2020.
LICENSING AGREEMENT
ALPS Clean Energy ETF
CIBC NTC is the designer of the construction and methodology for the Underlying Index. “CIBC NTC” and “CIBC Atlas Clean Energy Index” are service marks or trademarks of the Index Provider. CIBC NTC acts as brand licensor for the Underlying Index and is not responsible for the descriptions of the Fund that appear herein.
The Fund is not sponsored by CIBC NTC or any of its affiliates. CIBC NTC makes no representation or warranty, express or implied, to the owners of the Fund or any member of the public regarding the advisability of investing in securities or commodities generally or in the Fund particularly. CIBC NTC does not guarantee the quality, accuracy or completeness of the Underlying Index or any Underlying Index data included herein or derived therefrom and assumes no liability in connection with their use. The Underlying Index is determined and composed without regard to the Adviser or the Fund. CIBC NTC has no obligation to take the needs of the Adviser, the Fund or the shareholders of the Fund into consideration in determining, composing or calculating the Underlying Index. CIBC NTC is not responsible for and has not participated in the determination of the timing of, prices at, or quantities of the Fund to be issued or in the determination or calculation of the equation by which the Fund is to be converted into cash. CIBC NTC has no obligation or liability in connection with the administration, marketing or trading of the Fund and is not responsible for and has not participated in the determination of pricing or the timing of the issuance or sale of the Shares of the Fund or in the determination or calculation of the NAV of the Fund.
CIBC NTC has no obligation or liability in connection with the administration, marketing or trading of the Fund. CIBC NTC makes no warranty, express or implied, as to results to be obtained by the Adviser, the Fund, Fund shareholders or any other person or entity from the use of the Underlying Index or any data included therein. CIBC NTC makes no express or implied warranties, and expressly disclaims all warranties of merchantability or fitness for a particular purpose or use with respect to the Underlying Index or any data included therein. Without limiting any of the foregoing, in no event shall CIBC NTC have any liability for any special, punitive, indirect, or consequential damages (including lost profits) arising out of matters relating to the use of the Underlying Index, even if notified of the possibility of such damages.
All intellectual property rights in the Underlying Index vests in CIBC NTC.
32 | May 31, 2020
ALPS ETF Trust
| Additional Information | May 31, 2020 (Unaudited) |
The Underlying Index is the property of CIBC NTC, which has contracted with S&P Opco, LLC (a subsidiary of S&P Dow Jones Indices LLC) to calculate and maintain the Underlying Index. The Underlying Index is not sponsored by S&P Dow Jones Indices or its affiliates or its third party licensors (collectively, “S&P Dow Jones Indices”). S&P Dow Jones Indices will not be liable for any errors or omissions in calculating the Underlying Index. “Calculated by S&P Dow Jones Indices” and the related stylized mark(s) are service marks of S&P Dow Jones Indices and have been licensed for use by CIBC NTC. S&P® is a registered trademark of Standard & Poor’s Financial Services LLC (“SPFS”), and Dow Jones® is a registered trademark of Dow Jones Trademark Holdings LLC (“Dow Jones”).
The Fund is not sponsored, endorsed, sold or promoted by S&P Dow Jones Indices. S&P Dow Jones Indices does not make any representation or warranty, express or implied, to the owners of the Fund or any member of the public regarding the advisability of investing in securities generally or in the Fund particularly or the ability of the Underlying Index to track general market performance. S&P Dow Jones Indices’ only relationship to CIBC NTC with respect to the Underlying Index is the licensing of certain trademarks, service marks and trade names of S&P Dow Jones Indices, and the provision of the calculation services related to the Underlying Index. S&P Dow Jones Indices is not responsible for and has not participated in the determination of the prices and amount of the Fund or the timing of the issuance or sale of the Fund or in the determination or calculation of the equation by which the Fund may be converted into cash or other redemption mechanics. S&P Dow Jones Indices has no obligation or liability in connection with the administration, marketing or trading of the Fund. S&P Dow Jones Indices LLC is not an investment advisor. Inclusion of a security within the Underlying Index is not a recommendation by S&P Dow Jones Indices to buy, sell, or hold such security, nor is it investment advice.
S&P DOW JONES INDICES DOES NOT GUARANTEE THE ADEQUACY, ACCURACY, TIMELINESS AND/OR THE COMPLETENESS OF THE UNDERLYING INDEX OR ANY DATA RELATED THERETO OR ANY COMMUNICATION WITH RESPECT THERETO, INCLUDING, ORAL, WRITTEN, OR ELECTRONIC COMMUNICATIONS. S&P DOW JONES INDICES SHALL NOT BE SUBJECT TO ANY DAMAGES OR LIABILITY FOR ANY ERRORS, OMISSIONS, OR DELAYS THEREIN. S&P DOW JONES INDICES MAKES NO EXPRESS OR IMPLIED WARRANTIES, AND EXPRESSLY DISCLAIMS ALL WARRANTIES, OF MERCHANTABILITY OR FITNESS FOR A PARTICULAR PURPOSE OR USE OR AS TO RESULTS TO BE OBTAINED BY CIBC NTC, OWNERS OF THE FUND, OR ANY OTHER PERSON OR ENTITY FROM THE USE OF THE UNDERLYING INDEX OR WITH RESPECT TO ANY DATA RELATED THERETO. WITHOUT LIMITING ANY OF THE FOREGOING, IN NO EVENT WHATSOEVER SHALL S&P DOW JONES INDICES BE LIABLE FOR ANY INDIRECT, SPECIAL, INCIDENTAL, PUNITIVE, OR CONSEQUENTIAL DAMAGES, INCLUDING BUT NOT LIMITED TO, LOSS OF PROFITS, TRADING LOSSES, LOST TIME, OR GOODWILL, EVEN IF THEY HAVE BEEN ADVISED OF THE POSSIBILITY OF SUCH DAMAGES, WHETHER IN CONTRACT, TORT, STRICT LIABILITY, OR OTHERWISE.
The Index Provider is not affiliated with the Trust, the Adviser or ALPS Portfolio Solutions Distributor, Inc. (the “Distributor”). The Index Provider has entered into a license agreement with the Adviser (the “License Agreement”). The use of the Underlying Index by the Adviser and the Fund is subject to the terms of the License Agreement, which impose certain limitations and conditions on the Fund’s ability to use the Underlying Index.
The Adviser does not guarantee the accuracy and/or the completeness of the Underlying Index or any data included therein, and the Adviser shall have no liability for any errors, omissions or interruptions therein. The Adviser makes no warranty, express or implied, as to results to be obtained by the Fund, owners of the Shares of the Fund or any other person or entity from the use of the Underlying Index or any data included therein. The Adviser makes no express or implied warranties, and expressly disclaims all warranties of merchantability or fitness for a particular purpose or use with respect to the Underlying Index or any data included therein. Without limiting any of the foregoing, in no event shall the Adviser have any liability for any special, punitive, direct, indirect, or consequential damages (including lost profits) arising out of matters relating to the use of the Underlying Index, even if notified of the possibility of such damages.
ALPS Disruptive Technology ETF
The Indxx Disruptive Technologies Index (the “Underlying Index”) is a service mark of Indxx, LLC (“Indxx” or the “Index Provider”) and has been licensed for use for certain purposes by ALPS Advisors, Inc. The ALPS Disruptive Technologies ETF is not sponsored, endorsed, sold or promoted by Indxx and Indxx makes no representation regarding the advisability of investing in the ALPS Disruptive Technologies ETF.
The ALPS Disruptive Technologies ETF is not sponsored, endorsed, sold or promoted by Indxx. Indxx makes no representation or warranty, express or implied, to the owners of the ALPS Disruptive Technologies ETF or any member of the public regarding the advisability of investing in securities generally or in the ALPS Disruptive Technologies ETF particularly. Indxx has no obligation to take the needs of ALPS Advisors, Inc. or the shareholders of ALPS Disruptive Technologies ETF into consideration in determining, composing, or calculating the Underlying Index. Indxx is not responsible for and has not participated in the determination of the timing, amount or pricing of the ALPS Disruptive Technologies ETF shares to be issued or in the determination or calculation of the equation by which the ALPS Disruptive Technologies ETF is to be converted into cash. Indxx has no obligation or liability in connection with the administration, marketing or trading of the ALPS Disruptive Technologies ETF.
INDXX MAKES NO WARRANTY, EXPRESS OR IMPLIED, AS TO THE RESULTS TO BE OBTAINED BY ANY PERSON OR ENTITY FROM THE USE OF THE INDEX(ES), TRADING BASED ON THE INDEX(ES), OR ANY DATA INCLUDED THEREIN IN CONNECTION WITH THE PRODUCTS, OR FOR ANY OTHER USE. INDXX EXPRESSLY DISCLAIMS ALL WARRANTIES AND CONDITIONS, EXPRESS, STATUTORY, OR IMPLIED, EXCEPT AS SET FORTH IN THIS AGREEMENT. EXCEPT AS OTHERWISE SPECIFICALLY SET FORTH IN THIS AGREEMENT, INDXX HEREBY EXPRESSLY DISCLAIMS ALL IMPLIED WARRANTIES AND CONDITIONS OF MERCHANTABILITY, TITLE, OR FITNESS FOR A PARTICULAR PURPOSE OR USE WITH RESPECT TO THE INDEX(ES) OR ANY DATA INCLUDED THEREIN. INDXX DOES NOT GUARANTEE THE ACCURACY AND/OR THE COMPLETENESS OF ANY DATA SUPPLIED BY IT OR ANY DATA INCLUDED THEREIN. INDXX MAKES NO WARRANTY, EXPRESS OR IMPLIED, AS TO RESULTS TO BE OBTAINED BY THE FUNDS, ITS SHAREHOLDERS OR AFFILIATES, OR ANY OTHER PERSON OR ENTITY FROM THE USE OF THE DATA SUPPLIED BY INDXX OR ANY DATA INCLUDED THEREIN. INDXX MAKES NO EXPRESS OR IMPLIED WARRANTIES, AND EXPRESSLY DISCLAIMS ALL WARRANTIES OF MERCHANTABILITY OR FITNESS FOR A PARTICULAR PURPOSE OR USE WITH RESPECT TO THE DATA SUPPLIED BY INDXX OR ANY DATA INCLUDED THEREIN. WITHOUT LIMITING ANY OF THE FOREGOING, IN NO EVENT SHALL INDXX HAVE ANY LIABILITY FOR ANY SPECIAL, PUNITIVE, INDIRECT, OR CONSEQUENTIAL DAMAGES (INCLUDING LOST PROFITS), EVEN IF NOTIFIED OF THE POSSIBILITY OF SUCH DAMAGES.
33 | May 31, 2020
ALPS ETF Trust
| Additional Information | May 31, 2020 (Unaudited) |
The Adviser does not guarantee the accuracy and/or the completeness of the Underlying Index or any data included therein, and the Adviser shall have no liability for any errors, omissions or interruptions therein. The Adviser makes no warranty, express or implied, as to results to be obtained by the Fund, owners of the Shares of the Fund or any other person or entity from the use of the Underlying Index or any data included therein. Adviser makes no express or implied warranties, and expressly disclaims all warranties of merchantability or fitness for a particular purpose or use with respect to the Underlying Index or any data included therein. Without limiting any of the foregoing, in no event shall the Adviser have any liability for any special, punitive, direct, indirect or consequential damages (including lost profits) arising out of matters relating to the use of the Underlying Index, even if notified of the possibility of such damages.
ALPS Medical Breakthroughs ETF
The Fund is not sponsored, endorsed, sold or promoted by S-Network Global Indexes, Inc. (“Licensor”). Licensor makes no representation or warranty, express or implied, to the owners of the Fund or any member of the public regarding the advisability of investing in securities generally or in the Fund particularly or the ability of the Underlying Index to track the performance of the physical commodities market. Licensor’s only relationship to the Licensee is the licensing of certain service marks and trade names of Licensor and of the Underlying Index that is determined, composed and calculated by Licensor without regard to the Licensee or the Fund. Licensor has no obligation to take the needs of the Licensee or the owners of the Fund into consideration in determining, composing or calculating the Underlying Index. Licensor is not responsible for and has not participated in the determination of the timing of, prices at, or quantities of the Fund to be issued or in the determination or calculation of the equation by which the Fund is to be converted into cash. Licensor has no obligation or liability in connection with the administration, marketing or trading of the Fund.
LICENSOR DOES NOT GUARANTEE THE ACCURACY AND/OR THE COMPLETENESS OF THE UNDERLYING INDEX OR ANY DATA INCLUDED THEREIN AND LICENSOR SHALL HAVE NO LIABILITY FOR ANY ERRORS, OMISSIONS, OR INTERRUPTIONS THEREIN. LICENSOR MAKES NO WARRANTY, EXPRESS OR IMPLIED, AS TO RESULTS TO BE OBTAINED BY LICENSEE, OWNERS OF THE FUND, OR ANY OTHER PERSON OR ENTITY FROM THE USE OF THE UNDERLYING INDEX OR ANY DATA INCLUDED THEREIN. LICENSOR MAKES NO EXPRESS OR IMPLIED WARRANTIES, AND EXPRESSLY DISCLAIMS ALL WARRANTIES OF MERCHANTABILITY OR FITNESS FOR A PARTICULAR PURPOSE OR USE WITH RESPECT TO THE UNDERLYING INDEX OR ANY DATA INCLUDED THEREIN. WITHOUT LIMITING ANY OF THE FOREGOING, IN NO EVENT SHALL LICENSOR HAVE ANY LIABILITY FOR ANY SPECIAL, PUNITIVE, INDIRECT, OR CONSEQUENTIAL DAMAGES (INCLUDING LOST PROFITS), EVEN IF NOTIFIED OF THE POSSIBILITY OF SUCH DAMAGES.
Standard & Poor’s Custom Indexes serves as calculation agent for the Index. The Fund is not sponsored, endorsed, sold or promoted by Standard & Poor’s, a division of The McGraw-Hill Companies, Inc. (“S&P”) or its third party licensors. Neither S&P nor its third party licensors make any representation or warranty, express or implied, to the owners of the Fund or any member of the public regarding the advisability of investing in securities generally or in the Fund particularly or the ability of the Underlying Index to track general stock market performance. S&P’s and its third party licensor’s only relationship to S-Network Global Indexes, Inc. is the licensing of certain trademarks, service marks and trade names of S&P and/or its third party licensors and for the providing of calculation and maintenance services related to the Underlying Index. Neither S&P nor its third party licensors is responsible for and has not participated in the determination of the prices and amount of the Fund or the timing of the issuance or sale of the Fund or in the determination or calculation of the equation by which the Fund is to be converted into cash. S&P has no obligation or liability in connection with the administration, marketing or trading of the Fund.
NEITHER S&P, ITS AFFILIATES NOR THEIR THIRD PARTY LICENSORS GUARANTEE THE ADEQUACY, ACCURACY, TIMELINESS OR COMPLETENESS OF THE UNDERLYING INDEX OR ANY DATA INCLUDED THEREIN OR ANY COMMUNICATIONS, INCLUDING BUT NOT LIMITED TO, ORAL OR WRITTEN COMMUNICATIONS (INCLUDING ELECTRONIC COMMUNICATIONS) WITH RESPECT THERETO. S&P, ITS AFFILIATES AND THEIR THIRD PARTY LICENSORS SHALL NOT BE SUBJECT TO ANY DAMAGES OR LIABILITY FOR ANY ERRORS, OMISSIONS OR DELAYS THEREIN. S&P MAKES NO EXPRESS OR IMPLIED WARRANTIES, AND EXPRESSLY DISCLAIMS ALL WARRANTIES OF MERCHANTABILITY OR FITNESS FOR A PARTICULAR PURPOSE OR USE WITH RESPECT TO ITS TRADEMARKS, THE UNDERLYING INDEX OR ANY DATA INCLUDED THEREIN. WITHOUT LIMITING ANY OF THE FOREGOING, IN NO EVENT WHATSOEVER SHALL S&P, ITS AFFILIATES OR THEIR THIRD PARTY LICENSORS BE LIABLE FOR ANY INDIRECT, SPECIAL, INCIDENTAL, PUNITIVE OR CONSEQUENTIAL DAMAGES, INCLUDING BUT NOT LIMITED TO, LOSS OF PROFITS, TRADING LOSSES, LOST TIME OR GOODWILL, EVEN IF THEY HAVE BEEN ADVISED OF THE POSSIBILITY OF SUCH DAMAGES, WHETHER IN CONTRACT, TORT, STRICT LIABILITY OR OTHERWISE.
34 | May 31, 2020
ALPS ETF Trust
| Additional Information | May 31, 2020 (Unaudited) |
Standard & Poor’s®, and S&P® are registered trademarks of The McGraw-Hill Companies, Inc.; “Calculated by S&P Custom Indices” and its related stylized mark are service marks of The McGraw-Hill Companies, Inc. These marks have been licensed for use by S-Network Global Indexes, Inc.
The Adviser does not guarantee the accuracy and/or the completeness of the Underlying Index or any data included therein, and the Adviser shall have no liability for any errors, omissions or interruptions therein. The Adviser makes no warranty, express or implied, as to results to be obtained by the Fund, owners of the Shares of the Fund or any other person or entity from the use of the Underlying Index or any data included therein. The Adviser makes no express or implied warranties, and expressly disclaims all warranties of merchantability or fitness for a particular purpose or use with respect to the Underlying Index or any data included therein. Without limiting any of the foregoing, in no event shall the Adviser have any liability for any special, punitive, direct, indirect, or consequential damages (including lost profits) arising out of matters relating to the use of the Underlying Index, even if notified of the possibility of such damages.
35 | May 31, 2020
ALPS ETF Trust
| Liquidity Risk Management Program | May 31, 2020 (Unaudited) |
In compliance with the Securities and Exchange Commission’s liquidity risk management rule (the “Liquidity Rule”), the ALPS ETF Trust (the “Trust”) has established a liquidity risk management program (the “Program”) to govern the Trust’s approach to managing liquidity risk for each series of the Trust (each a “Fund”). The Program is overseen by the Liquidity Committee (the “Committee”), a committee comprised of representatives of the Trust’s investment adviser, ALPS Advisors, Inc. The Trust’s Board of Trustees (the “Board”) has approved the designation of the Committee to oversee the Program.
The Program’s principal objectives include supporting each Fund’s compliance with limits on investments in illiquid assets and assessing and managing the risk that a Fund will be unable to meet its redemption obligations without significant dilution of remaining investors’ interests in the Fund. The Program includes a number of elements that support the management and assessment of liquidity risk, including an annual assessment of factors that influence a Fund’s liquidity and, for Funds that are not “In-Kind ETFs,” the periodic classification and re-classification of such Fund’s investments into groupings that reflect the Committee’s assessment of their liquidity under current market conditions.
At a meeting of the Board held on March 2, 2020, the Trustees received a report from the Committee regarding the design and operational effectiveness of the Program since its implementation on December 1, 2018. The Committee determined, and reported to the Board, that the Program has been operating effectively to assess and manage each Fund’s liquidity risk and has been and continues to be adequately and effectively implemented to monitor and (as applicable) respond to the Funds’ liquidity developments.
The Committee reported that during the period covered by the report, there were no liquidity events that impacted the Funds or their ability to timely meet redemptions without dilution to existing shareholders. Among other things, the Committee’s report noted that no Fund is required to have a highly liquid investment minimum based either on its status as an In-Kind ETF or on its ability to rely on another exemption under the Liquidity Rule. The Committee’s report further noted that no material changes have been made to the Program since its implementation.
36 | May 31, 2020


Table of Contents
| Performance Overview | 1 |
| Disclosure of Fund Expenses | 11 |
| Financial Statements | |
| Schedule of Investments | 12 |
| Statements of Assets and Liabilities | 18 |
| Statements of Operations | 19 |
| Statements of Changes in Net Assets | 20 |
| Financial Highlights | 24 |
| Notes to Financial Statements | 28 |
| Additional Information | 36 |
| Liquidity Risk Management Program | 38 |
| Board Considerations Regarding Approval of Investment Advisory Agreements | 39 |
Beginning on January 1, 2021, as permitted by regulations adopted by the U.S. Securities and Exchange Commission, paper copies of the Funds’ annual and semi-annual shareholder reports will no longer be sent by mail, unless you specifically request paper copies of the reports from your financial intermediary (such as a broker-dealer or bank). Instead, the reports will be made available on the Funds’ website (www.alpsfunds.com), and you will be notified by mail each time a report is posted and provided with a website link to access the report.
If you already elected to receive shareholder reports electronically, you will not be affected by this change and you need not take any action. You may elect to receive shareholder reports and other communications from a Fund electronically anytime by contacting your financial intermediary.
You may elect to receive all future reports in paper free of charge. You can contact your financial intermediary to request that you continue to receive paper copies of your shareholder reports. Your election to receive reports in paper will apply to all funds held in your account with your financial intermediary.
alpsfunds.com
ALPS Sector Dividend Dogs ETF
| Performance Overview | May 31, 2020 (Unaudited) |
Investment Objective
The ALPS Sector Dividend Dogs ETF (the “Fund”) seeks investment results that replicate as closely as possible, before fees and expenses, the performance of the S-Network® Sector Dividend Dogs Index (the “Underlying Index”).
The Underlying Index is a rules based index intended to give investors a means of tracking the overall performance of the highest dividend paying stocks (i.e. “Dividend Dogs”) in the S&P 500® Total Return Index (“SPX”) on a sector-by-sector basis. “Dividend Dogs” refers to the five stocks in each of the Global Industry Classification Standard (“GICS”) sectors, excluding the real estate sector, that make up the S&P 500® Total Return Index which offer the highest dividend yields.
Performance (as of May 31, 2020)
| 6 Months | 1 Year | 5 Year | Since Inception^ | |
| ALPS Sector Dividend Dogs ETF – NAV | -19.57% | -7.25% | 2.42% | 8.54% |
| ALPS Sector Dividend Dogs ETF – Market Price* | -19.61% | -7.23% | 2.41% | 8.54% |
S-Network® Sector Dividend Dogs Total Return Index | -19.42% | -6.84% | 2.89% | 9.05% |
| S&P 500® Total Return Index | -2.10% | 12.84% | 9.86% | 13.01% |
Total Expense Ratio (per the current prospectus) 0.40%.
Performance data quoted represents past performance. Past performance does not guarantee future results. Total return figures assume reinvestment of dividends and capital gains distributions, if any. The table does not reflect the deduction of taxes that a shareholder would pay on Fund distributions or the redemption of Fund shares. Investment return and principal value of an investment will fluctuate so that an investor’s shares, when sold or redeemed, may be worth more or less than the original cost. Current performance data may be higher or lower than actual data quoted. For the most current month-end performance data please visit www.alpsfunds.com or call 1.866.675.2639.
NAV is an exchange-traded fund’s per-share value. The per-share dollar amount of the Fund is derived by dividing the total value of all the securities in its portfolio, less any liabilities, by the number of Fund shares outstanding. Market Price is the price at which a share can currently be traded in the market. Information detailing the number of days the Market Price of the Fund was greater than the Fund’s NAV and the number of days it was less than the Fund’s NAV can be obtained at www.alpsfunds.com.
| ^ | The Fund Commencement Date was June 29, 2012. |
| * | Market Price is based on the midpoint of the bid-ask spread at 4 p.m. ET and does not represent the returns an investor would receive if shares were traded at other times. |
The S-Network® Sector Dividend Dogs Total Return Index is designed to serve as a fair, impartial and transparent measure of the performance of US large cap equities with above average dividend yields. The Underlying Index is a portfolio of fifty stocks derived from the S&P 500® Index. The index is reported on a total return basis, which assumes reinvestment of any dividends and distributions realized during a given time period.
The S&P 500® Total Return Index is an index of 500 stocks chosen for market size, liquidity and industry grouping among other factors. Total return assumes reinvestment of any dividends and distributions realized during a given time period.
The indexes are not actively managed and do not reflect any deductions for fees, expenses or taxes. One cannot invest directly in an index. Index performance does not reflect fund performance.
The Fund’s shares are not individually redeemable. Investors buy and sell shares of the Fund on a secondary market. Only market makers or “authorized participants” may trade directly with the Fund, typically in blocks of 50,000 shares.
The ALPS Sector Dividend Dogs ETF is not suitable for all investors. Investments in the Fund are subject to investment risks, including possible loss of the principal amount invested.
ALPS Portfolio Solutions Distributor, Inc., a FINRA member, is the distributor for the ETF.
1 | May 31, 2020
ALPS Sector Dividend Dogs ETF
| Performance Overview | May 31, 2020 (Unaudited) |
| Top 10 Holdings* (as of May 31, 2020) | |
| Eastman Chemical Co. | 2.80% |
| LyondellBasell Industries NV | 2.59% |
| Williams Cos., Inc. | 2.46% |
| Kraft Heinz Co. | 2.42% |
| Broadcom, Inc. | 2.37% |
| Cummins, Inc. | 2.36% |
| Emerson Electric Co. | 2.30% |
| Exxon Mobil Corp. | 2.27% |
| Maxim Integrated Products, Inc. | 2.26% |
| Nucor Corp. | 2.24% |
| Total % of Top 10 Holdings | 24.07% |
| Sector Allocation* (as of May 31, 2020) | |
| Materials | 11.64% |
| Information Technology | 10.90% |
| Energy | 10.81% |
| Industrials | 10.66% |
| Health Care | 10.62% |
| Utilities | 10.09% |
| Financials | 9.13% |
| Communication Services | 9.12% |
| Consumer Staples | 8.60% |
| Consumer Discretionary | 8.38% |
| Money Market Fund | 0.05% |
| Total | 100.00% |
| * | % of Total Investments |
Future holdings are subject to change.
Growth of $10,000 (as of May 31, 2020)
Comparison of Change in Value of $10,000 Investment in the Fund and the Indexes
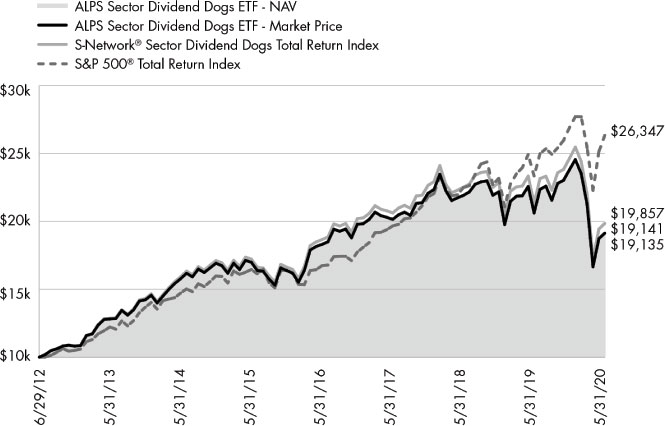
The chart above compares historical performance of a hypothetical investment of $10,000 in the Fund since inception with the performance of the Fund’s benchmark index. Past performance does not guarantee future results. The chart does not reflect the deduction of taxes that a shareholder would pay on Fund distributions or the redemption of Fund shares.
2 | May 31, 2020
ALPS International Sector Dividend Dogs ETF
| Performance Overview | May 31, 2020 (Unaudited) |
Investment Objective
The ALPS International Sector Dividend Dogs ETF (the “Fund”) seeks investment results that replicate as closely as possible, before fees and expenses, the performance of the S-Network® International Sector Dividend Dogs Net Total Return Index (the “Underlying Index”).
The Underlying Index is a rules-based index intended to give investors a means of tracking the overall performance of the highest dividend paying stocks (i.e. “Dividend Dogs”) in the S-Network® Developed Markets (ex NA) Index, a universe of mainly large capitalization stocks in international developed markets not located in the Americas (the “S-Net Developed Markets”) on a sector-by-sector basis. “Dividend Dogs” refers to the five stocks in each of the Global Industry Classification Standard (“GICS”) sectors, excluding the real estate sector, that make up the S-Net Developed Markets which offer the highest dividend yields.
Performance (as of May 31, 2020)
| 6 Months | 1 Year | 5 Year | Since Inception^ | |
| ALPS International Sector Dividend Dogs ETF – NAV | -17.51% | -9.63% | -0.54% | 1.85% |
| ALPS International Sector Dividend Dogs ETF – Market Price* | -17.20% | -8.99% | -0.52% | 1.89% |
S-Network® International Sector Dividend Dogs Net Total Return Index | -17.39% | -9.14% | -0.18% | 2.24% |
| MSCI EAFE® Net Total Return Index** | -11.48% | -2.81% | 0.79% | 3.49% |
Morningstar® Developed Markets ex-North America Net Total Return Index** | -11.16% | -2.24% | 1.08% | 3.73% |
Total Expense Ratio (per the current prospectus) 0.50%.
Performance data quoted represents past performance. Past performance does not guarantee future results. Total return figures assume reinvestment of dividends and capital gains distributions, if any. The table does not reflect the deduction of taxes that a shareholder would pay on Fund distributions or the redemption of Fund shares. Investment return and principal value of an investment will fluctuate so that an investor’s shares, when sold or redeemed, may be worth more or less than the original cost. Current performance data may be higher or lower than actual data quoted. For the most current month-end performance data please visit www.alpsfunds.com or call 1.866.675.2639.
NAV is an exchange-traded fund’s per-share value. The per-share dollar amount of the Fund is derived by dividing the total value of all the securities in its portfolio, less any liabilities, by the number of Fund shares outstanding. Market Price is the price at which a share can currently be traded in the market. Information detailing the number of days the Market Price of the Fund was greater than the Fund’s NAV and the number of days it was less than the Fund’s NAV can be obtained at www.alpsfunds.com.
| ^ | The Fund Commencement Date was June 28, 2013. |
| * | Market Price is based on the midpoint of the bid-ask spread at 4 p.m. ET and does not represent the returns an investor would receive if shares were traded at other times. |
| ** | Effective December 13, 2019, the Fund replaced the MSCI EAFE Net Total Return Index as the Fund’s secondary benchmark for performance comparison purposes. The Adviser made this recommendation to the Board because the Fund’s new secondary benchmark, the Morningstar Developed Markets ex-North America Net Total Return Index, closely aligns with the Fund’s investment strategies and investment restrictions. Returns for both benchmarks will be shown for a transition period. |
The S-Network® International Sector Dividend Dogs Net Total Return Index is designed to serve as a fair, impartial and transparent measure of the performance of international large cap equities with above average dividend yields. The Underlying Index is a portfolio of fifty stocks derived from the S-Net International Developed Markets Index (ex-Americas) Index. Total Return assumes reinvestment of any dividends and distributions realized during a given time period. Net Total Return (NTR) is obtained by reinvesting the net dividend, which is equal to the ordinary gross dividend minus the amount of withholding tax.
MSCI EAFE® Net Total Return Index is a stock market index that is designed to measure the equity market performance of developed markets outside of the U.S. & Canada.
Morningstar® Developed Markets ex-North America Net Total Return Index measures the performance of companies in developed markets ex-North America. It covers approximately 97% of the full market capitalization in the Developed Markets ex-North America.
The indexes are not actively managed and do not reflect any deductions for fees, expenses or taxes. One cannot invest directly in an index. Index performance does not reflect fund performance.
The Fund’s shares are not individually redeemable. Investors buy and sell shares of the Fund on a secondary market. Only market makers or “authorized participants” may trade directly with the Fund, typically in blocks of 50,000 shares.
The ALPS International Sector Dividend Dogs ETF is not suitable for all investors. Investments in the Fund are subject to investment risks, including possible loss of the principal amount invested.
ALPS Portfolio Solutions Distributor, Inc., a FINRA member, is the distributor for the ETF.
3 | May 31, 2020
ALPS International Sector Dividend Dogs ETF
| Performance Overview | May 31, 2020 (Unaudited) |
Top 10 Holdings* (as of May 31, 2020)
| Fortescue Metals Group, Ltd. | 2.62% |
| Equinor ASA | 2.46% |
| BHP Group, Ltd. | 2.43% |
| ACS Actividades de Construccion y Servicios SA | 2.43% |
| AstraZeneca PLC | 2.38% |
| Takeda Pharmaceutical Co., Ltd. | 2.35% |
| Komatsu, Ltd. | 2.23% |
| Bayer AG | 2.22% |
| Endesa SA | 2.19% |
| Rio Tinto, Ltd. | 2.15% |
| Total % of Top 10 Holdings | 23.46% |
| * | % of Total Investments (excluding investments purchased with collateral from securities loaned). |
Future holdings are subject to change.
Sector Allocation* (as of May 31, 2020)
| Materials | 11.33% |
| Health Care | 11.13% |
| Energy | 10.35% |
| Consumer Staples | 9.88% |
| Information Technology | 9.73% |
| Utilities | 9.73% |
| Industrials | 9.59% |
| Consumer Discretionary | 9.47% |
| Communication Services | 9.15% |
| Financials | 9.11% |
| Money Market Fund | 0.53% |
| Total | 100.00% |
Growth of $10,000 (as of May 31, 2020)
Comparison of Change in Value of $10,000 Investment in the Fund and the Indexes
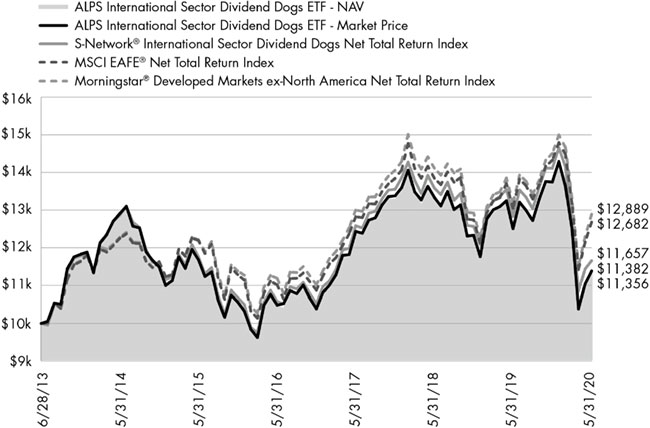
The chart above compares historical performance of a hypothetical investment of $10,000 in the Fund since inception with the performance of the Fund’s benchmark index. Past performance does not guarantee future results. The chart does not reflect the deduction of taxes that a shareholder would pay on Fund distributions or the redemption of Fund shares.
4 | May 31, 2020
ALPS Emerging Sector Dividend Dogs ETF
| Performance Overview | May 31, 2020 (Unaudited) |
Investment Objective
The ALPS Emerging Sector Dividend Dogs ETF (the “Fund”) seeks investment results that replicate as closely as possible, before fees and expenses, the performance of the S-Network® Emerging Sector Dividend Dogs Net Total Return Index (the “Underlying Index”).
The Underlying Index is a rules-based index intended to give investors a means of tracking the overall performance of the highest dividend paying stocks (i.e. “Dividend Dogs”) in the S-Network® Emerging Markets Index, a universe of mainly large capitalization stocks domiciled in emerging markets (the “S-Network Emerging Markets”) on a sector-by-sector basis. “Dividend Dogs” refers to the five stocks in each of the Global Industry Classification Standard (“GICS”) sectors, excluding the real estate sector, that make up the S-Network® Emerging Markets which offer the highest dividend yields. Emerging market countries are countries that major international financial institutions, such as the World Bank, generally consider to be less economically mature than developed nations.
Performance (as of May 31, 2020)
| 6 Months | 1 Year | 5 Year | Since Inception^ | |
| ALPS Emerging Sector Dividend Dogs ETF – NAV | -13.10% | -11.20% | -2.32% | -1.74% |
| ALPS Emerging Sector Dividend Dogs ETF – Market Price* | -13.05% | -11.25% | -2.33% | -1.79% |
S-Network® Emerging Sector Dividend Dogs Net Total Return Index | -12.83% | -10.65% | -1.53% | -0.94% |
| MSCI® Emerging Markets Net Total Return Index** | -9.69% | -4.39% | 0.88% | 1.65% |
| Morningstar® Emerging Markets Net Total Return Index** | -10.19% | -4.95% | 0.88% | 1.98% |
Total Expense Ratio (per the current prospectus) 0.60%.
Performance data quoted represents past performance. Past performance does not guarantee future results. Total return figures assume reinvestment of dividends and capital gains distributions, if any. The table does not reflect the deduction of taxes that a shareholder would pay on Fund distributions or the redemption of Fund shares. Investment return and principal value of an investment will fluctuate so that an investor’s shares, when sold or redeemed, may be worth more or less than the original cost. Current performance data may be higher or lower than actual data quoted. For the most current month-end performance data please visit www.alpsfunds.com or call 1.866.675.2639.
NAV is an exchange-traded fund’s per-share value. The per-share dollar amount of the Fund is derived by dividing the total value of all the securities in its portfolio, less any liabilities, by the number of Fund shares outstanding. Market Price is the price at which a share can currently be traded in the market. Information detailing the number of days the Market Price of the Fund was greater than the Fund’s NAV and the number of days it was less than the Fund’s NAV can be obtained at www.alpsfunds.com.
| ^ | The Fund Commencement Date was March 28, 2014. |
| * | Market Price is based on the midpoint of the bid-ask spread at 4 p.m. ET and does not represent the returns an investor would receive if shares were traded at other times. |
| ** | Effective December 13, 2019, the Fund replaced the MSCI Emerging Markets Net Total Return Index as the Fund’s secondary benchmark for performance comparison purposes. The Adviser made this recommendation to the Board because the Fund’s new secondary benchmark, the Morningstar Emerging Markets Net Total Return Index, closely aligns with the Fund’s investment strategies and investment restrictions. Returns for both benchmarks will be shown for a transition period. |
The S-Network® Emerging Sector Dividend Dogs Net Total Return Index is a portfolio of stocks derived from a universe of mainly large capitalization stocks domiciled in emerging markets (the “S-Network Emerging Markets Index” “SNEMX”). The index methodology selects the five stocks in each of the GICS sectors, excluding the real estate sector, that make up the universe which offer the highest dividend yields as of the last trading day of November. The fifty stocks that are selected for inclusion in the portfolio are equally weighted. The universe includes stocks whose domicile and primary exchange listings are in countries identified by the World Bank as Upper Middle Income (certain lower middle income countries are also included, as well as stocks traded on the Taiwan Stock Exchange despite non-recognition by the World Bank). The selection criteria for the universe, in addition to the aforementioned country qualifications, also include requirements for sector inclusion, primary exchange listing, minimum market capitalization, share price, average daily trading volume and other factors. Total Return assumes reinvestment of any dividends and distributions realized during a given time period. Net Total Return (NTR) is obtained by reinvesting the net dividend, which is equal to the ordinary gross dividend minus the amount of withholding tax.
The MSCI® Emerging Markets Net Total Return Index is a free float-adjusted market capitalization index that is designed to measure equity market performance in the global emerging markets.
Morningstar® Emerging Markets Net Total Return Index measures the performance of emerging markets targeting the top 97% of stocks by market capitalization.
5 | May 31, 2020
ALPS Emerging Sector Dividend Dogs ETF
| Performance Overview | May 31, 2020 (Unaudited) |
The indexes are not actively managed and do not reflect any deductions for fees, expenses or taxes. One cannot invest directly in an index. Index performance does not reflect fund performance.
The Fund’s shares are not individually redeemable. Investors buy and sell shares of the Fund on a secondary market. Only market makers or “authorized participants” may trade directly with the Fund, typically in blocks of 50,000 shares.
The ALPS Emerging Sector Dividend Dogs ETF is not suitable for all investors. Investments in the Fund are subject to investment risks, including possible loss of the principal amount invested.
ALPS Portfolio Solutions Distributor, Inc., a FINRA member, is the distributor for the ETF.
6 | May 31, 2020
ALPS Emerging Sector Dividend Dogs ETF
| Performance Overview | May 31, 2020 (Unaudited) |
Top 10 Holdings* (as of May 31, 2020)
| Top Glove Corp. Bhd | 3.91% |
| Magnit PJSC | 2.89% |
| Adaro Energy Tbk PT | 2.50% |
| Ternium SA | 2.47% |
| Petronas Gas Bhd | 2.39% |
| MMC Norilsk Nickel PJSC | 2.39% |
| Globe Telecom, Inc. | 2.36% |
| PLDT, Inc. | 2.33% |
| CEZ AS | 2.31% |
| Home Product Center PCL | 2.28% |
| Total % of Top 10 Holdings | 25.83% |
| * | % of Total Investments (excluding investments purchased with collateral from securities loaned). |
Future holdings are subject to change.
Sector Allocation* (as of May 31, 2020)
| Health Care | 12.13% |
| Materials | 10.82% |
| Consumer Staples | 10.79% |
| Communication Services | 10.67% |
| Energy | 10.58% |
| Utilities | 10.01% |
| Consumer Discretionary | 9.36% |
| Industrials | 8.78% |
| Information Technology | 8.67% |
| Financials | 8.11% |
| Money Market Fund | 0.08% |
| Total | 100.00% |
Growth of $10,000 (as of May 31, 2020)
Comparison of Change in Value of $10,000 Investment in the Fund and the Indexes
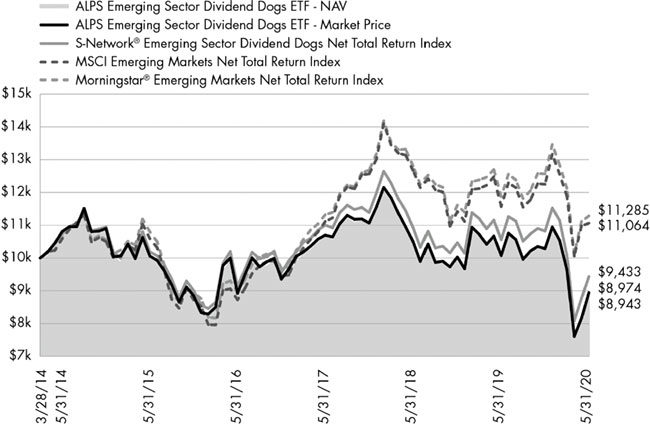
The chart above compares historical performance of a hypothetical investment of $10,000 in the Fund since inception with the performance of the Fund’s benchmark index. Past performance does not guarantee future results. The chart does not reflect the deduction of taxes that a shareholder would pay on Fund distributions or the redemption of Fund shares.
7 | May 31, 2020
ALPS REIT Dividend Dogs ETF
| Performance Overview | May 31, 2020 (Unaudited) |
Investment Objective
The ALPS REIT Dividend Dogs ETF (the “Fund”) seeks investment results that replicate as closely as possible, before fees and expenses, the performance of the S-Network® REIT Dividend Dogs Total Return Index (the “Underlying Index”).
The Underlying Index is a rules-based index intended to give investors a means of tracking the overall performance of the highest dividend paying real estate investment trusts (“REITs”) (i.e. “Dividend Dogs”) in the S-Network® Composite US REIT Index, a universe of mainly REITs listed in the United States (the “S-Net U.S. REIT” or "SNREIT"), on a segment-by-segment basis. “Dividend Dogs” refers to the five REITs in each of the nine segments that make up the S-Net U.S. REIT which offer the highest dividend yields.
Performance (as of May 31, 2020)
| 6 Months | 1 Year | 5 Year | 10 Year | Since Inception^ | |
| ALPS REIT Dividend Dogs ETF – NAV | -24.84% | -21.38% | -0.93% | 5.44% | 1.01% |
| ALPS REIT Dividend Dogs ETF – Market Price* | -24.65% | -21.35% | -0.97% | 5.50% | 1.01% |
| S-Network® REIT Dividend Dogs Total Return Index** | -25.53% | -15.41% | 3.39% | 7.82% | 6.31% |
| Cohen & Steers Global Realty Majors® Index** | -16.99% | -12.84% | 1.72% | 7.24% | 2.61% |
| S-Network® Composite US REIT Index*** | -16.24% | -9.38% | 4.67% | 9.10% | 6.29% |
| FTSE EPRA/ NAREIT Developed Real Estate Index*** | -22.53% | -16.27% | 0.87% | 6.68% | 2.29% |
| S&P 500® Total Return Index*** | -2.10% | 12.84% | 9.86% | 13.15% | 9.00% |
Total Expense Ratio (per the current prospectus) is 0.35%.
Performance data quoted represents past performance. Past performance does not guarantee future results. On January 2, 2020, the Fund changed its Underlying Index and principal investment strategies. Consequently, the Fund's total returns shown above for the periods prior to January 2, 2020 are not necessarily indicative of the performance of the Fund, as it is currently managed. Total return figures assume reinvestment of dividends and capital gains distributions, if any. The table does not reflect the deduction of taxes that a shareholder would pay on Fund distributions or the redemption of Fund shares. Investment return and principal value of an investment will fluctuate so that an investor’s shares, when sold or redeemed, may be worth more or less than the original cost. Current performance data may be higher or lower than actual data quoted. For the most current month-end performance data please visit www.alpsfunds.com or call 1.866.759.5679.
NAV is an exchange-traded fund’s per-share value. The per-share dollar amount of the Fund is derived by dividing the total value of all the securities in its portfolio, less any liabilities, by the number of Fund shares outstanding. Market Price is the price at which a share can currently be traded in the market. Information detailing the number of days the Market Price of the Fund was greater than the Fund’s NAV and the number of days it was less than the Fund’s NAV can be obtained at www.alpsfunds.com.
| ^ | The Fund Inception Date was May 7, 2008. |
| * | Market Price is based on the midpoint of the bid-ask spread at 4 p.m. ET and does not represent the returns an investor would receive if shares were traded at other times. |
| ** | Effective January 2, 2020, the Fund replaced the Cohen & Steers Global Realty Majors Portfolio Index as the Fund’s primary benchmark for performance comparison purposes. The Adviser made this recommendation to the Board because the Fund’s new primary benchmark, the S-Network® REIT Dividend Dogs Total Return Index more closely aligns with the Fund’s investment strategies and investment restrictions. Returns for both benchmarks will be shown for a transition period. |
| *** | Effective January 2, 2020, the Fund replaced the S&P 500® Total Return Index and the FTSE EPRA/NAREIT Developed Real Estate Index as the Fund’s secondary benchmarks for performance comparison purposes. The Adviser made this recommendation to the Board because the Fund’s new secondary benchmark, the S-Network® Composite US REIT Index, more closely aligns with the Fund’s investment strategies and investment restrictions. Returns for both benchmarks will be shown for a transition period. |
The S-Network® REIT Dividend Dogs Total Return Index, like the S-Net U.S. REIT from which components of the Underlying Index are selected, divides into nine segments, eight of which are based on Global Industry Classification Standard (“GICS”) Sub-Industries (excluding Technology REITs involved in cell towers and/or data centers) and a separate Technology REIT segment based on the research of the Underlying Index provider, S-Network® Global Indexes, Inc. (the “Index Provider”). The Underlying Index generally consists of 45 REITs on each annual reconstitution date. The Underlying Index’s REITs must be constituents of the S-Net U.S. REIT universe, which includes a universe of mainly REITs listed in the United States. The selection criteria for the universe also includes requirements for segment inclusion, primary exchange listing, minimum market capitalization, share price, average daily trading volume and other factors. The Underlying Index is rebalanced quarterly. The index is reported on a total return basis, which assumes reinvestment of any dividends and distributions realized during a given time period.
8 | May 31, 2020
ALPS REIT Dividend Dogs ETF
| Performance Overview | May 31, 2020 (Unaudited) |
Cohen & Steers Global Realty Majors® Index: A free-float adjusted, modified market capitalization-weighted index of global real estate equities. The modified market capitalization weighting approach and qualitative screening process emphasize those companies that, in the opinion of the Cohen & Steers investment committee, are leading the securitization of real estate globally.
The S-Network® Composite US REIT Index (the “S-Net U.S. REIT” or “SNREIT”) is a benchmark index for the Real Estate Investment Trust component of the US stock market. The SNREIT provides the universe of stocks for RDOGX. The selection criteria for SNREIT include requirements for sector inclusion, primary exchange listing, minimum market capitalization, minimum average daily trading volume, and other factors. All constituents of RDOGX must be constituents of SNREIT.
FTSE EPRA/NAREIT Developed Real Estate Index: An unmanaged market-weighted total return index that consists of many companies from developed markets whose floats are larger than $100 million and which derive more than half of their revenue from property-related activities.
The S&P 500® Total Return Index is an index of 500 stocks chosen for market size, liquidity and industry grouping among other factors. Total return assumes reinvestment of any dividends and distributions realized during a given time period.
The indexes are not actively managed and do not reflect any deductions for fees, expenses or taxes. Total return assumes reinvestment of any dividends and distributions realized during a given time period. One cannot invest directly in an index. Index performance does not reflect fund performance.
The Fund’s shares are not individually redeemable. Investors buy and sell shares of the Fund on a secondary market. Only market makers or “authorized participants” may trade directly with the Fund, typically in blocks of 50,000 shares.
The ALPS REIT Dividend Dogs ETF is not suitable for all investors. Investments in the Fund are subject to investment risks, including possible loss of the principal amount invested.
ALPS Portfolio Solutions Distributor, Inc., a FINRA member, is the distributor for the ETF.
9 | May 31, 2020
ALPS REIT Dividend Dogs ETF
| Performance Overview | May 31, 2020 (Unaudited) |
Top 10 Holdings* (as of May 31, 2020)
| CyrusOne, Inc. | 3.04% |
| Sabra Health Care REIT, Inc. | 3.02% |
| QTS Realty Trust, Inc. | 2.93% |
| RLJ Lodging Trust | 2.89% |
| Prologis, Inc. | 2.76% |
| Omega Healthcare Investors, Inc. | 2.76% |
| CoreSite Realty Corp. | 2.70% |
| Apple Hospitality REIT, Inc. | 2.62% |
| STAG Industrial, Inc. | 2.61% |
| Crown Castle International Corp. | 2.61% |
| Total % of Top 10 Holdings | 27.94% |
| * | % of Total Investments (excluding investments purchased with collateral from securities loaned). |
REIT Sector Allocation* (as of May 31, 2020)
| Technology REITs | 13.63% |
| Industrial REITs | 12.70% |
| Health Care REITs | 12.70% |
| Hotel & Resort REITs | 12.26% |
| Specialized REITs | 11.36% |
| Office REITs | 10.09% |
| Residential REITs | 9.97% |
| Diversified REITs | 9.58% |
| Retail REITs | 7.48% |
| Money Market Fund | 0.23% |
| Total | 100.00% |
Future holdings are subject to change.
Growth of $10,000 (as of May 31, 2020)
Comparison of Change in Value of $10,000 Investment in the Fund and the Indexes
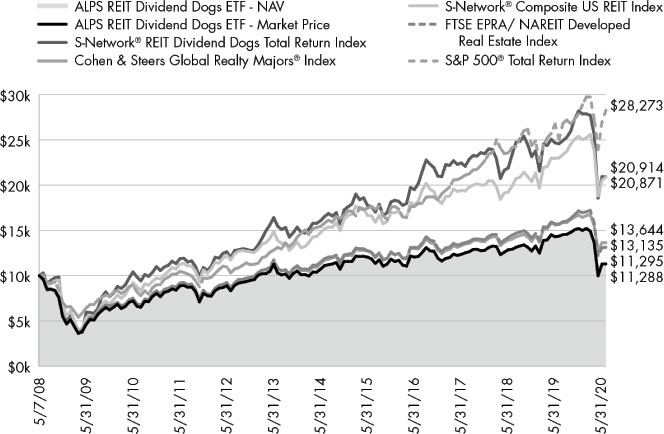
The chart above compares historical performance of a hypothetical investment of $10,000 in the Fund since inception with the performance of the Fund’s benchmark index. Past performance does not guarantee future results. The chart does not reflect the deduction of taxes that a shareholder would pay on Fund distributions or the redemption of Fund shares.
10 | May 31, 2020
ALPS ETF Trust
| Disclosure of Fund Expenses | May 31, 2020 (Unaudited) |
Shareholder Expense Example: As a shareholder of a Fund, you incur two types of costs: (1) transaction costs which may include creation and redemption fees or brokerage charges, and (2) ongoing costs, including management fees and other Fund expenses. These examples are intended to help you understand your ongoing costs (in dollars) of investing in the Fund and to compare these costs with the ongoing costs of investing in other funds. It is based on an investment of $1,000 invested at the beginning of the (six month) period and held through May 31, 2020.
Actual Return: The first line of the table provides information about actual account values and actual expenses. You may use the information in this line, together with the amount you invested, to estimate the expenses that you incurred over the period. Simply divide your account value by $1,000 (for example, an $8,600 account value divided by $1,000 = 8.6), then multiply the result by the number in the first line under the heading entitled “Expenses Paid During Period” to estimate the expenses attributable to your investment during this period.
Hypothetical 5% Return: The second line of the table provides information about hypothetical account values and hypothetical expenses based on the Fund’s actual expense ratio and an assumed rate of return of 5% per year before expenses, which is not the Fund’s actual return. The hypothetical account values and expenses may not be used to estimate the actual ending account balance or expenses you paid for the period. You may use this information to compare ongoing costs of investing in the Fund and other funds. To do so, compare this 5% hypothetical example with the 5% hypothetical examples that appear in the shareholder reports of other funds.
The expenses shown in the table are meant to highlight ongoing Fund costs only and do not reflect any transaction costs, such as creation and redemption fees or brokerage charges. Therefore, the second line is useful in comparing ongoing costs only, and will not help you determine the relative total costs of owning different funds. In addition, if these costs were included, your costs would have been higher.
| Beginning Account Value 12/1/19 | Ending Account Value 5/31/20 | Expense Ratio(a) | Expenses Paid During Period 12/1/19 - 5/31/20(b) | |
| ALPS Sector Dividend Dogs ETF | ||||
| Actual | $1,000.00 | $804.30 | 0.40% | $1.80 |
| Hypothetical (5% return before expenses) | $1,000.00 | $1,023.00 | 0.40% | $2.02 |
| ALPS International Sector Dividend Dogs ETF | ||||
| Actual | $1,000.00 | $824.90 | 0.50% | $2.28 |
| Hypothetical (5% return before expenses) | $1,000.00 | $1,022.50 | 0.50% | $2.53 |
| ALPS Emerging Sector Dividend Dogs ETF | ||||
| Actual | $1,000.00 | $869.00 | 0.60% | $2.80 |
| Hypothetical (5% return before expenses) | $1,000.00 | $1,022.00 | 0.60% | $3.03 |
| ALPS REIT Dividend Dogs ETF (c) | ||||
| Actual | $1,000.00 | $751.60 | 0.39% | $1.71 |
| Hypothetical (5% return before expenses) | $1,000.00 | $1,023.05 | 0.39% | $1.97 |
| (a) | Annualized based on the Fund's most recent half-year expenses. |
| (b) | Expenses are equal to the Fund's annualized expense ratio multiplied by the average account value over the period, multiplied by the number of days in the most recent fiscal half year (183), divided by 366. |
| (c) | Prior to January 2, 2020, the ALPS REIT Dividend Dogs ETF was known as the Cohen & Steers Global Realty Majors ETF. |
11 | May 31, 2020
ALPS Sector Dividend Dogs ETF
| Schedule of Investments | May 31, 2020 (Unaudited) |
| Security Description | Shares | Value | ||||||
| COMMON STOCKS (99.40%) | ||||||||
| Communication Services (9.07%) | ||||||||
| AT&T, Inc. | 547,070 | $ | 16,882,580 | |||||
| CenturyLink, Inc. | 1,864,313 | 18,326,197 | ||||||
| Interpublic Group of Cos., Inc. | 1,102,964 | 18,871,714 | ||||||
| Omnicom Group, Inc. | 299,378 | 16,402,920 | ||||||
| Verizon Communications, Inc. | 348,186 | 19,978,913 | ||||||
| Total Communication Services | 90,462,324 | |||||||
| Consumer Discretionary (8.34%) | ||||||||
| Ford Motor Co. | 3,347,348 | 19,113,357 | ||||||
| Kohl's Corp. | 760,676 | 14,620,193 | ||||||
| L Brands, Inc. | 1,169,485 | 18,933,962 | ||||||
| Macy's, Inc. | 2,347,717 | 14,931,480 | ||||||
| The Gap, Inc. | 1,744,543 | 15,526,433 | ||||||
| Total Consumer Discretionary | 83,125,425 | |||||||
| Consumer Staples (8.56%) | ||||||||
| Altria Group, Inc. | 470,478 | 18,372,166 | ||||||
| Coty, Inc., Class A | 2,415,940 | 8,769,862 | ||||||
| Kraft Heinz Co. | 786,852 | 23,975,381 | ||||||
| Molson Coors Beverage Co., Class B | 443,195 | 16,823,682 | ||||||
| Philip Morris International, Inc. | 237,054 | 17,390,281 | ||||||
| Total Consumer Staples | 85,331,372 | |||||||
| Energy (10.75%) | ||||||||
| Exxon Mobil Corp. | 494,807 | 22,498,874 | ||||||
| Helmerich & Payne, Inc. | 1,076,531 | 21,670,569 | ||||||
| Occidental Petroleum Corp. | 1,322,368 | 17,124,666 | ||||||
| Schlumberger, Ltd. | 1,166,603 | 21,547,158 | ||||||
| Williams Cos., Inc. | 1,192,310 | 24,358,893 | ||||||
| Total Energy | 107,200,160 | |||||||
| Financials (9.08%) | ||||||||
| Huntington Bancshares, Inc. | 1,985,020 | 17,646,828 | ||||||
| Invesco, Ltd. | 1,746,137 | 13,916,712 | ||||||
| People's United Financial, Inc. | 1,466,218 | 16,788,196 | ||||||
| Principal Financial Group, Inc. | 530,224 | 20,477,251 | ||||||
| Prudential Financial, Inc. | 356,313 | 21,720,840 | ||||||
| Total Financials | 90,549,827 | |||||||
| Health Care (10.57%) | ||||||||
| AbbVie, Inc. | 220,804 | 20,461,907 | ||||||
| Bristol-Myers Squibb Co. | 343,039 | 20,486,289 | ||||||
| Cardinal Health, Inc. | 395,577 | 21,634,106 | ||||||
| Gilead Sciences, Inc. | 266,696 | 20,756,950 | ||||||
| Pfizer, Inc. | 576,319 | 22,009,622 | ||||||
| Total Health Care | 105,348,874 | |||||||
| Industrials (10.60%) | ||||||||
| 3M Co. | 133,082 | 20,819,348 | ||||||
| Cummins, Inc. | 137,835 | 23,376,816 | ||||||
| Eaton Corp. PLC | 220,315 | 18,704,744 | ||||||
| Emerson Electric Co. | 374,483 | 22,850,953 | ||||||
| Security Description | Shares | Value | ||||||
| Industrials (continued) | ||||||||
| United Parcel Service, Inc., Class B | 200,054 | $ | 19,947,384 | |||||
| Total Industrials | 105,699,245 | |||||||
| Information Technology (10.84%) | ||||||||
| Broadcom, Inc. | 80,522 | 23,453,643 | ||||||
| International Business Machines Corp. | 174,672 | 21,816,533 | ||||||
| Maxim Integrated Products, Inc. | 387,992 | 22,379,378 | ||||||
| Seagate Technology PLC | 385,098 | 20,425,598 | ||||||
| Western Digital Corp. | 451,065 | 20,013,754 | ||||||
| Total Information Technology | 108,088,906 | |||||||
| Materials (11.56%) | ||||||||
| Eastman Chemical Co. | 407,176 | 27,720,542 | ||||||
| International Paper Co. | 563,856 | 19,199,297 | ||||||
| LyondellBasell Industries NV, Class A | 402,624 | 25,671,306 | ||||||
| Nucor Corp. | 526,179 | 22,236,324 | ||||||
| Westrock Co. | 728,964 | 20,454,730 | ||||||
| Total Materials | 115,282,199 | |||||||
| Utilities (10.03%) | ||||||||
| CenterPoint Energy, Inc. | 1,212,853 | 21,564,526 | ||||||
| Dominion Resources, Inc. | 240,879 | 20,477,124 | ||||||
| Duke Energy Corp. | 219,781 | 18,819,847 | ||||||
| PPL Corp. | 688,042 | 19,223,894 | ||||||
| Southern Co. | 349,461 | 19,943,739 | ||||||
| Total Utilities | 100,029,130 | |||||||
| TOTAL COMMON STOCKS | ||||||||
| (Cost $1,354,733,123) | 991,117,462 | |||||||
| 7 Day Yield | Shares | Value | ||||||
| SHORT TERM INVESTMENTS (0.06%) | ||||||||
| Money Market Fund | ||||||||
| State Street Institutional Treasury Plus Money Market Fund | 0.15 | % | 543,391 | 543,391 | ||||
| TOTAL SHORT TERM INVESTMENTS | ||||||||
| (Cost $543,391) | 543,391 | |||||||
| TOTAL INVESTMENTS (99.46%) | ||||||||
| (Cost $1,355,276,514) | $ | 991,660,853 | ||||||
| OTHER ASSETS IN EXCESS OF LIABILITIES (0.54%) | 5,396,837 | |||||||
| NET ASSETS - 100.00% | $ | 997,057,690 | ||||||
See Notes to Financial Statements.
12 | May 31, 2020
ALPS International Sector Dividend Dogs ETF
| Schedule of Investments | May 31, 2020 (Unaudited) |
| Security Description | Shares | Value | ||||||
| COMMON STOCKS (98.99%) | ||||||||
| Australia (12.71%) | ||||||||
| Australia & New Zealand Banking Group, Ltd. | 205,560 | $ | 2,451,221 | |||||
| BHP Group, Ltd.(a) | 145,200 | 3,352,571 | ||||||
| Fortescue Metals Group, Ltd. | 390,442 | 3,617,469 | ||||||
| National Australia Bank, Ltd. | 210,181 | 2,495,117 | ||||||
| Rio Tinto, Ltd. | 47,763 | 2,973,527 | ||||||
| Wesfarmers, Ltd. | 102,361 | 2,754,398 | ||||||
| Total Australia | 17,644,303 | |||||||
| Denmark (1.87%) | ||||||||
| Danske Bank A/S(b) | 209,598 | 2,590,030 | ||||||
| France (7.93%) | ||||||||
| Bouygues SA(b) | 84,058 | 2,569,719 | ||||||
| Natixis SA(b) | 1,185,561 | 2,622,853 | ||||||
| Renault SA(b) | 130,614 | 2,929,485 | ||||||
| Sanofi | 29,703 | 2,886,024 | ||||||
| Total France | 11,008,081 | |||||||
| Germany (6.32%) | ||||||||
| BASF SE | 52,889 | 2,855,922 | ||||||
| Bayer AG | 45,402 | 3,060,197 | ||||||
| Evonik Industries AG | 115,976 | 2,851,573 | ||||||
| Total Germany | 8,767,692 | |||||||
| Hong Kong (4.75%) | ||||||||
| CITIC, Ltd. | 2,266,000 | 2,151,553 | ||||||
| CK Hutchison Holdings, Ltd. | 341,000 | 2,085,196 | ||||||
| Sands China, Ltd. | 606,200 | 2,357,857 | ||||||
| Total Hong Kong | 6,594,606 | |||||||
| Italy (3.79%) | ||||||||
| Eni SpA | 315,771 | 2,847,288 | ||||||
| Intesa Sanpaolo SpA(b) | 1,404,162 | 2,419,711 | ||||||
| Total Italy | 5,266,999 | |||||||
| Japan (17.84%) | ||||||||
| Canon, Inc. | 122,263 | 2,515,662 | ||||||
| FUJIFILM Holdings Corp. | 60,500 | 2,794,293 | ||||||
| Hitachi, Ltd. | 90,300 | 2,892,916 | ||||||
| Japan Tobacco, Inc. | 134,100 | 2,657,877 | ||||||
| Komatsu, Ltd. | 152,700 | 3,086,708 | ||||||
| Kyocera Corp. | 45,300 | 2,449,296 | ||||||
| Softbank Corp. | 183,400 | 2,323,004 | ||||||
| Takeda Pharmaceutical Co., Ltd. | 83,600 | 3,248,807 | ||||||
| Tokyo Electron, Ltd. | 14,000 | 2,791,042 | ||||||
| Total Japan | 24,759,605 | |||||||
| Macau (1.74%) | ||||||||
| Wynn Macau, Ltd. | 1,427,600 | 2,412,638 | ||||||
| Netherlands (4.06%) | ||||||||
| Koninklijke Ahold Delhaize NV | 116,344 | 2,945,859 | ||||||
| Security Description | Shares | Value | ||||||
| Netherlands (continued) | ||||||||
| Royal Dutch Shell PLC, Class A | 170,541 | $ | 2,684,782 | |||||
| Total Netherlands | 5,630,641 | |||||||
| Norway (4.30%) | ||||||||
| Equinor ASA | 233,787 | 3,394,701 | ||||||
| Mowi ASA | 136,661 | 2,573,443 | ||||||
| Total Norway | 5,968,144 | |||||||
| Portugal (2.08%) | ||||||||
| EDP - Energias de Portugal SA | 614,620 | 2,881,180 | ||||||
| Spain (10.31%) | ||||||||
| ACS Actividades de | ||||||||
| Construccion y Servicios SA | 131,504 | 3,350,151 | ||||||
| Endesa SA | 127,747 | 3,027,550 | ||||||
| Naturgy Energy Group SA | 140,532 | 2,604,380 | ||||||
| Repsol SA | 289,316 | 2,688,070 | ||||||
| Telefonica SA | 562,033 | 2,645,896 | ||||||
| Total Spain | 14,316,047 | |||||||
| Sweden (3.69%) | ||||||||
| Hennes & Mauritz AB, Class B(a) | 173,848 | 2,622,697 | ||||||
| Telia Co. AB | 731,661 | 2,506,542 | ||||||
| Total Sweden | 5,129,239 | |||||||
| United Kingdom (17.60%) | ||||||||
| AstraZeneca PLC | 31,086 | 3,293,952 | ||||||
| BP PLC | 710,570 | 2,683,110 | ||||||
| British American Tobacco PLC | 73,352 | 2,889,347 | ||||||
| BT Group PLC | 1,748,194 | 2,509,850 | ||||||
| GlaxoSmithKline PLC | 139,929 | 2,889,064 | ||||||
| Imperial Brands PLC | 142,388 | 2,578,818 | ||||||
| National Grid Plc | 228,213 | 2,609,856 | ||||||
| SSE PLC | 151,246 | 2,318,973 | ||||||
| WPP PLC | 352,061 | 2,659,197 | ||||||
| Total United Kingdom | 24,432,167 | |||||||
| TOTAL COMMON STOCKS | ||||||||
| (Cost $175,286,360) | 137,401,372 | |||||||
13 | May 31, 2020
ALPS International Sector Dividend Dogs ETF
| Schedule of Investments | May 31, 2020 (Unaudited) |
| 7 Day Yield | Shares | Value | ||||||
| SHORT TERM INVESTMENTS (3.62%) | ||||||||
| Money Market Fund (0.53%) | ||||||||
| State Street Institutional Treasury Plus Money Market Fund | ||||||||
| (Cost $733,665) | 0.15 | % | 733,665 | $ | 733,665 | |||
| Investments Purchased with Collateral from Securities Loaned (3.09%) | ||||||||
| State Street Navigator Securities Lending Government Money Market Portfolio, 0.15% | ||||||||
| (Cost $4,288,025) | 4,288,025 | 4,288,025 | ||||||
| TOTAL SHORT TERM INVESTMENTS | ||||||||
| (Cost $5,021,690) | 5,021,690 | |||||||
| TOTAL INVESTMENTS (102.61%) | ||||||||
| (Cost $180,308,050) | $ | 142,423,062 | ||||||
| LIABILITIES IN EXCESS OF OTHER ASSETS (-2.61%) | (3,626,884 | ) | ||||||
| NET ASSETS - 100.00% | $ | 138,796,178 | ||||||
| (a) | Security, or a portion of the security position is currently on loan. The total market value of securities on loan is $4,088,139. |
| (b) | Non-income producing security. |
See Notes to Financial Statements.
14 | May 31, 2020
ALPS Emerging Sector Dividend Dogs ETF
| Schedule of Investments | May 31, 2020 (Unaudited) |
| Security Description | Shares | Value | ||||||
| COMMON STOCKS (99.75%) | ||||||||
| Brazil (6.18%) | ||||||||
| CCR SA | 120,600 | $ | 333,349 | |||||
| Cielo SA | 306,322 | 238,224 | ||||||
| Engie Brasil Energia SA | 36,180 | 286,793 | ||||||
| Petrobras Distribuidora SA | 84,700 | 346,178 | ||||||
| Total Brazil | 1,204,544 | |||||||
| Chile (1.68%) | ||||||||
| Enel Chile SA, ADR | 88,340 | 327,741 | ||||||
| China (9.03%) | ||||||||
| China International Marine Containers Group Co., Ltd. | 398,500 | 307,428 | ||||||
| China Petroleum & Chemical Corp., ADR | 7,581 | 360,325 | ||||||
| Legend Holdings Corp.(a)(b) | 252,100 | 305,063 | ||||||
| Lenovo Group, Ltd. | 658,000 | 357,374 | ||||||
| Livzon Pharmaceutical Group, Inc., Class H | 106,530 | 428,099 | ||||||
| Total China | 1,758,289 | |||||||
| Colombia (2.15%) | ||||||||
| Grupo Energia Bogota SA ESP | 718,043 | 419,661 | ||||||
| Czech Republic (3.86%) | ||||||||
| CEZ AS | 22,863 | 448,447 | ||||||
| Komercni banka A.S.(c) | 14,170 | 303,365 | ||||||
| Total Czech Republic | 751,812 | |||||||
| Hungary (2.08%) | ||||||||
| Richter Gedeon Nyrt | 18,609 | 405,283 | ||||||
| India (4.03%) | ||||||||
| Infosys, Ltd., Sponsored ADR | 43,224 | 393,338 | ||||||
| Wipro, Ltd., ADR | 118,374 | 391,818 | ||||||
| Total India | 785,156 | |||||||
| Indonesia (8.45%) | ||||||||
| Adaro Energy Tbk PT | 6,459,900 | 486,372 | ||||||
| Astra International Tbk PT | 1,100,900 | 359,431 | ||||||
| Gudang Garam Tbk PT | 128,800 | 429,774 | ||||||
| United Tractors Tbk PT | 343,700 | 369,342 | ||||||
| Total Indonesia | 1,644,919 | |||||||
| Luxembourg (2.47%) | ||||||||
| Ternium SA, Sponsored ADR | 30,232 | 480,387 | ||||||
| Malaysia (9.77%) | ||||||||
| Genting Malaysia Bhd | 638,000 | 340,462 | ||||||
| Malayan Banking Bhd | 196,700 | 339,333 | ||||||
| Petronas Gas Bhd | 106,300 | 464,566 | ||||||
| Top Glove Corp. Bhd | 248,400 | 759,913 | ||||||
| Total Malaysia | 1,904,274 | |||||||
| Mexico (7.42%) | ||||||||
| Alfa SAB de CV | 780,151 | 413,744 | ||||||
| Security Description | Shares | Value | ||||||
| Mexico (continued) | ||||||||
| Coca-Cola Femsa SAB de CV, ADR | 7,614 | $ | 333,341 | |||||
| Grupo Aeroportuario del Pacifico SAB de CV, ADR(d) | 4,560 | 302,830 | ||||||
| Grupo Mexico SAB de CV, Series B | 183,479 | 395,264 | ||||||
| Total Mexico | 1,445,179 | |||||||
| Philippines (4.68%) | ||||||||
| Globe Telecom, Inc. | 10,110 | 458,166 | ||||||
| PLDT, Inc. | 17,975 | 452,748 | ||||||
| Total Philippines | 910,914 | |||||||
| Poland (3.62%) | ||||||||
| Powszechny Zaklad Ubezpieczen SA | 52,978 | 394,127 | ||||||
| Santander Bank Polska SA(c) | 7,648 | 310,416 | ||||||
| Total Poland | 704,543 | |||||||
| Russia (11.83%) | ||||||||
| Magnit PJSC, GDR(b) | 49,290 | 561,906 | ||||||
| MMC Norilsk Nickel PJSC, ADR | 14,815 | 464,154 | ||||||
| Mobile TeleSystems PJSC, Sponsored ADR | 47,281 | 420,328 | ||||||
| Severstal PAO, GDR | 32,508 | 426,505 | ||||||
| Tatneft PJSC, ADR | 9,568 | 430,560 | ||||||
| Total Russia | 2,303,453 | |||||||
| South Africa (8.86%) | ||||||||
| Absa Group, Ltd. | 49,734 | 230,082 | ||||||
| Exxaro Resources, Ltd. | 58,201 | 410,942 | ||||||
| MTN Group, Ltd. | 107,711 | 330,767 | ||||||
| Tiger Brands, Ltd. | 38,125 | 341,044 | ||||||
| Vodacom Group, Ltd.(d) | 57,451 | 413,175 | ||||||
| Total South Africa | 1,726,010 | |||||||
| Thailand (6.19%) | ||||||||
| Bangkok Dusit Medical Services Pcl | 578,600 | 409,258 | ||||||
| Bumrungrad Hospital Pcl | 93,900 | 354,228 | ||||||
| Home Product Center PCL | 951,500 | 442,697 | ||||||
| Total Thailand | 1,206,183 | |||||||
| Turkey (7.45%) | ||||||||
| BIM Birlesik Magazalar AS | 45,445 | 433,349 | ||||||
| Enka Insaat ve Sanayi AS | 435,458 | 350,178 | ||||||
| Eregli Demir ve Celik Fabrikalari TAS | 285,278 | 336,383 | ||||||
| Ford Otomotiv Sanayi AS | 36,548 | 331,111 | ||||||
| Total Turkey | 1,451,021 | |||||||
| TOTAL COMMON STOCKS | ||||||||
| (Cost $23,545,575) | 19,429,369 | |||||||
15 | May 31, 2020
ALPS Emerging Sector Dividend Dogs ETF
| Schedule of Investments | May 31, 2020 (Unaudited) |
| 7 Day Yield | Shares | Value | ||||||||||
| SHORT TERM INVESTMENTS (1.78%) | ||||||||||||
| Money Market Fund (0.08%) | ||||||||||||
| State Street Institutional Treasury Plus Money Market Fund | ||||||||||||
| (Cost $16,361) | 0.15 | % | 16,361 | $ | 16,361 | |||||||
| Investments Purchased with Collateral from Securities Loaned (1.69%) | ||||||||||||
| State Street Navigator Securities Lending Government Money Market Portfolio, 0.15% | ||||||||||||
| (Cost $329,942) | 329,942 | 329,942 | ||||||||||
| TOTAL SHORT TERM INVESTMENTS | ||||||||||||
| (Cost $346,303) | 346,303 | |||||||||||
| TOTAL INVESTMENTS (101.53%) (Cost $23,891,878) | $ | 19,775,672 | ||||||||||
| LIABILITIES IN EXCESS OF OTHER ASSETS (-1.53%) | (297,689 | ) | ||||||||||
| NET ASSETS - 100.00% | $ | 19,477,983 | ||||||||||
| (a) | Securities exempt from registration under Rule 144A of the Securities Act of 1933. These securities may be sold in the ordinary course of business in transactions exempt from registration, normally to qualified institutional buyers. At period end, the aggregate market value of those securities was $305,063, representing 1.57% of net assets. |
| (b) | Securities were purchased pursuant to Regulation S under the Securities Act of 1933, which exempts securities offered and sold outside of the United States from registration. Such securities cannot be sold in the United States without either an effective registration statement filed pursuant to the Securities Act of 1933, or pursuant to an exemption from registration. As of May 31, 2020, the market value of those securities was $866,969 representing 4.45% of net assets. |
| (c) | Non-income producing security. |
| (d) | Security, or a portion of the security position is currently on loan. The total market value of securities on loan is $513,799. |
See Notes to Financial Statements.
16 | May 31, 2020
ALPS REIT Dividend Dogs ETF
| Schedule of Investments | May 31, 2020 (Unaudited) |
| Security Description | Shares | Value | ||||||
| COMMON STOCKS (99.59%) | ||||||||
| Diversified REITs (9.56%) | ||||||||
| Global Net Lease, Inc. | 47,599 | $ | 667,814 | |||||
| STORE Capital Corp. | 25,930 | 501,486 | ||||||
| VEREIT, Inc. | 99,868 | 547,277 | ||||||
| Washington Real Estate Investment Trust | 26,416 | 579,303 | ||||||
| WP Carey, Inc. | 9,513 | 569,924 | ||||||
| Total Diversified REITs | 2,865,804 | |||||||
| Health Care REITs (12.68%) | ||||||||
| Diversified Healthcare Trust | 185,515 | 664,144 | ||||||
| National Health Investors, Inc. | 12,038 | 667,989 | ||||||
| Omega Healthcare Investors, Inc. | 26,533 | 826,238 | ||||||
| Sabra Health Care REIT, Inc. | 67,154 | 903,893 | ||||||
| Ventas, Inc. | 21,092 | 737,165 | ||||||
| Total Health Care REITs | 3,799,429 | |||||||
| Hotel & Resort REITs (12.24%) | ||||||||
| Apple Hospitality REIT, Inc. | 76,839 | 784,526 | ||||||
| Park Hotels & Resorts, Inc. | 75,521 | 742,371 | ||||||
| RLJ Lodging Trust | 83,800 | 863,978 | ||||||
| Service Properties Trust | 80,816 | 545,508 | ||||||
| Summit Hotel Properties, Inc. | 117,179 | 732,369 | ||||||
| Total Hotel & Resort REITs | 3,668,752 | |||||||
| Industrial REITs (12.69%) | ||||||||
| Duke Realty Corp. | 22,048 | 760,215 | ||||||
| EastGroup Properties, Inc. | 6,305 | 732,956 | ||||||
| Lexington Realty Trust | 72,036 | 700,190 | ||||||
| Prologis, Inc. | 9,030 | 826,245 | ||||||
| STAG Industrial, Inc. | 29,058 | 781,660 | ||||||
| Total Industrial REITs | 3,801,266 | |||||||
| Office REITs (10.07%) | ||||||||
| Brandywine Realty Trust | 60,088 | 579,849 | ||||||
| City Office REIT, Inc. | 80,724 | 749,119 | ||||||
| Highwoods Properties, Inc. | 17,385 | 665,324 | ||||||
| SL Green Realty Corp. | 10,665 | 449,210 | ||||||
| Vornado Realty Trust | 15,892 | 575,449 | ||||||
| Total Office REITs | 3,018,951 | |||||||
| Residential REITs (9.94%) | ||||||||
| American Campus Communities, Inc. | 18,578 | 600,069 | ||||||
| Apartment Investment and Management Co., Class A | 15,268 | 562,931 | ||||||
| AvalonBay Communities, Inc. | 3,636 | 567,252 | ||||||
| Camden Property Trust | 7,318 | 670,109 | ||||||
| UDR, Inc. | 15,743 | 582,176 | ||||||
| Total Residential REITs | 2,982,537 | |||||||
| Retail REITs (7.47%) | ||||||||
| Pennsylvania Real Estate Investment Trust | 450,717 | 509,310 | ||||||
| Security Description | Shares | Value | ||||||
| Retail REITs (continued) | ||||||||
| Tanger Factory Outlet Centers, Inc.(a) | 78,552 | $ | 483,095 | |||||
| Taubman Centers, Inc. | 14,604 | 603,729 | ||||||
| The Macerich Co. | 55,721 | 379,460 | ||||||
| Washington Prime Group, Inc. | 411,973 | 263,910 | ||||||
| Total Retail REITs | 2,239,504 | |||||||
| Specialized REITs (24.94%) | ||||||||
| CoreCivic, Inc. | 58,103 | 698,979 | ||||||
| CoreSite Realty Corp. | 6,463 | 806,712 | ||||||
| Crown Castle International Corp. | 4,534 | 780,573 | ||||||
| CubeSmart | 24,741 | 704,129 | ||||||
| CyrusOne, Inc. | 12,231 | 909,253 | ||||||
| Digital Realty Trust, Inc. | 4,898 | 703,157 | ||||||
| EPR Properties | 21,173 | 668,432 | ||||||
| Four Corners Property Trust, Inc. | 29,244 | 632,255 | ||||||
| National Storage Affiliates Trust | 23,146 | 694,612 | ||||||
| QTS Realty Trust, Inc., Class A | 12,785 | 877,051 | ||||||
| Total Specialized REITs | 7,475,153 | |||||||
| TOTAL COMMON STOCKS | ||||||||
| (Cost $40,680,401) | 29,851,396 | |||||||
| 7 Day Yield | Shares | Value | ||||||||||
| SHORT TERM INVESTMENTS (1.56%) | ||||||||||||
| Money Market Fund (0.23%) | ||||||||||||
| State Street Institutional Treasury Plus Money Market Fund | ||||||||||||
| (Cost $68,699) | 0.15 | % | 68,699 | 68,699 | ||||||||
| Investments Purchased with Collateral from Securities Loaned (1.33%) | ||||||||||||
| State Street Navigator Securities Lending Government Money Market Portfolio, 0.15% | ||||||||||||
| (Cost $397,670) | 397,670 | 397,670 | ||||||||||
| TOTAL SHORT TERM INVESTMENTS | ||||||||||||
| (Cost $466,369) | 466,369 | |||||||||||
| TOTAL INVESTMENTS (101.14%) | ||||||||||||
| (Cost $41,146,770) | $ | 30,317,765 | ||||||||||
| LIABILITIES IN EXCESS OF OTHER ASSETS (-1.14%) | (342,963 | ) | ||||||||||
| NET ASSETS - 100.00% | $ | 29,974,802 | ||||||||||
| (a) | Security, or a portion of the security position is currently on loan. The total market value of securities on loan is $362,321. |
17 | May 31, 2020
| ALPS ETF Trust |
| Statements of Assets and Liabilities | May 31, 2020 (Unaudited) |
ALPS Sector Dividend Dogs ETF | ALPS International Sector Dividend Dogs ETF | ALPS Emerging Sector Dividend Dogs ETF | ALPS REIT Dividend Dogs ETF | |||||||||||||
| ASSETS: | ||||||||||||||||
| Investments, at value | $ | 991,660,853 | $ | 142,423,062 | $ | 19,775,672 | $ | 30,317,765 | ||||||||
| Foreign currency, at value (Cost $–, $101,180, $2,974 and $–) | – | 101,180 | 2,979 | – | ||||||||||||
| Foreign tax reclaims | – | 348,642 | 4,431 | 8,418 | ||||||||||||
| Dividends receivable | 5,743,120 | 664,326 | 34,158 | 54,939 | ||||||||||||
| Receivable for investments sold | 12,614,713 | – | – | – | ||||||||||||
| Total Assets | 1,010,018,686 | 143,537,210 | 19,817,240 | 30,381,122 | ||||||||||||
| LIABILITIES: | ||||||||||||||||
| Payable for investments purchased | – | 394,789 | – | – | ||||||||||||
| Payable to adviser | 334,324 | 58,218 | 9,315 | 8,650 | ||||||||||||
| Payable for shares redeemed | 12,626,672 | – | – | – | ||||||||||||
| Payable for collateral upon return of securities loaned | – | 4,288,025 | 329,942 | 397,670 | ||||||||||||
| Total Liabilities | 12,960,996 | 4,741,032 | 339,257 | 406,320 | ||||||||||||
| NET ASSETS | $ | 997,057,690 | $ | 138,796,178 | $ | 19,477,983 | $ | 29,974,802 | ||||||||
| NET ASSETS CONSIST OF: | ||||||||||||||||
| Paid-in capital | $ | 1,504,034,314 | $ | 228,121,664 | $ | 34,044,710 | $ | 39,391,733 | ||||||||
| Total Distributable earnings | (506,976,624 | ) | (89,325,486 | ) | (14,566,727 | ) | (9,416,931 | ) | ||||||||
| NET ASSETS | $ | 997,057,690 | $ | 138,796,178 | $ | 19,477,983 | $ | 29,974,802 | ||||||||
| INVESTMENTS, AT COST | $ | 1,355,276,514 | $ | 180,308,050 | $ | 23,891,878 | $ | 41,146,770 | ||||||||
| PRICING OF SHARES: | ||||||||||||||||
| Net Assets | $ | 997,057,690 | $ | 138,796,178 | $ | 19,477,983 | $ | 29,974,802 | ||||||||
| Shares of beneficial interest outstanding (Unlimited number of shares authorized, par value $0.01 per share) | 27,709,141 | 6,450,000 | 1,100,000 | 850,000 | ||||||||||||
| Net Asset Value, offering and redemption price per share | $ | 35.98 | $ | 21.52 | $ | 17.71 | $ | 35.26 | ||||||||
See Notes to Financial Statements.
18 | May 31, 2020
| ALPS ETF Trust |
| Statements of Operations | For the Six Months Ended May 31, 2020 (Unaudited) |
ALPS Sector Dividend Dogs ETF | ALPS International Sector Dividend Dogs ETF | ALPS Emerging Sector Dividend Dogs ETF | ALPS REIT Dividend Dogs ETF(a) | |||||||||||||
| INVESTMENT INCOME: | ||||||||||||||||
| Dividends* | $ | 35,263,069 | $ | 3,379,272 | $ | 395,064 | $ | 1,217,194 | ||||||||
| Securities Lending Income | 3,885 | 2,396 | 262 | 6,610 | ||||||||||||
| Total Investment Income | 35,266,954 | 3,381,668 | 395,326 | 1,223,804 | ||||||||||||
| EXPENSES: | ||||||||||||||||
| Investment adviser fees | 2,803,418 | 463,457 | 76,273 | 81,685 | ||||||||||||
| Total Expenses | 2,803,418 | 463,457 | 76,273 | 81,685 | ||||||||||||
| NET INVESTMENT INCOME | 32,463,536 | 2,918,211 | 319,053 | 1,142,119 | ||||||||||||
| REALIZED AND UNREALIZED GAIN/(LOSS) | ||||||||||||||||
| Net realized gain/(loss) on investments | 29,896,574 | (5,164,510 | ) | (2,374,588 | ) | 7,304,175 | ||||||||||
| Net realized gain/(loss) on foreign currency transactions | – | (92,907 | ) | 6,618 | (18,744 | ) | ||||||||||
| Total net realized gain/(loss) | 29,896,574 | (5,257,417 | ) | (2,367,970 | ) | 7,285,431 | ||||||||||
| Net change in unrealized depreciation on investments | (411,413,401 | ) | (36,887,017 | ) | (2,631,620 | ) | (20,696,852 | ) | ||||||||
| Net change in unrealized appreciation/(depreciation) on translation of assets and liabilities denominated in foreign currencies | – | 16,517 | (1,291 | ) | 598 | |||||||||||
| Total net change in unrealized depreciation | (411,413,401 | ) | (36,870,500 | ) | (2,632,911 | ) | (20,696,254 | ) | ||||||||
| NET REALIZED AND UNREALIZED LOSS ON INVESTMENTS | (381,516,827 | ) | (42,127,917 | ) | (5,000,881 | ) | (13,410,823 | ) | ||||||||
| NET DECREASE IN NET ASSETS RESULTING FROM OPERATIONS | $ | (349,053,291 | ) | $ | (39,209,706 | ) | $ | (4,681,828 | ) | $ | (12,268,704 | ) | ||||
| *Net of foreign tax withholding: | $ | – | $ | 315,341 | $ | 61,256 | $ | 10,386 | ||||||||
| (a) | Prior to January 2, 2020, the ALPS REIT Dividend Dogs ETF was known as the Cohen & Steers Global Realty Majors ETF. |
See Notes to Financial Statements.
19 | May 31, 2020
| ALPS Sector Dividend Dogs ETF |
| Statements of Changes in Net Assets |
For the Six Months Ended May 31, 2020 (Unaudited) | For the Year Ended November 30, 2019 | |||||||
| OPERATIONS: | ||||||||
| Net investment income | $ | 32,463,536 | $ | 73,241,493 | ||||
| Net realized gain/(loss) | 29,896,574 | (29,760,791 | ) | |||||
| Net change in unrealized appreciation/(depreciation) | (411,413,401 | ) | 59,917,242 | |||||
| Net increase/(decrease) in net assets resulting from operations | (349,053,291 | ) | 103,397,944 | |||||
| Net Equalization Credits | 2,733,673 | 2,780,661 | ||||||
| DISTRIBUTIONS TO SHAREHOLDERS: | ||||||||
| From distributable earnings | (31,476,873 | ) | (66,976,075 | ) | ||||
| Total distributions | (31,476,873 | ) | (66,976,075 | ) | ||||
| CAPITAL SHARE TRANSACTIONS: | ||||||||
| Proceeds from sale of shares | 144,664,169 | 6,339,997 | ||||||
| Cost of shares redeemed | (513,860,795 | ) | (462,685,894 | ) | ||||
| Net income equalization (Note 2) | (2,733,673 | ) | (2,780,661 | ) | ||||
| Net decrease from share transactions | (371,930,299 | ) | (459,126,558 | ) | ||||
| Net decrease in net assets | (749,726,790 | ) | (419,924,028 | ) | ||||
| NET ASSETS: | ||||||||
| Beginning of period | 1,746,784,480 | 2,166,708,508 | ||||||
| End of period | $ | 997,057,690 | $ | 1,746,784,480 | ||||
| OTHER INFORMATION: | ||||||||
| CAPITAL SHARE TRANSACTIONS: | ||||||||
| Beginning shares | 38,159,141 | 48,959,141 | ||||||
| Shares sold | 3,150,000 | 150,000 | ||||||
| Shares redeemed | (13,600,000 | ) | (10,950,000 | ) | ||||
| Shares outstanding, end of period | 27,709,141 | 38,159,141 | ||||||
See Notes to Financial Statements.
20 | May 31, 2020
| ALPS International Sector Dividend Dogs ETF |
| Statements of Changes in Net Assets |
For the Six Months Ended May 31, 2020 (Unaudited) | For the Year Ended November 30, 2019 | |||||||
| OPERATIONS: | ||||||||
| Net investment income | $ | 2,918,211 | $ | 11,789,400 | ||||
| Net realized loss | (5,257,417 | ) | (20,865,192 | ) | ||||
| Net change in unrealized appreciation/(depreciation) | (36,870,500 | ) | 34,514,316 | |||||
| Net increase/(decrease) in net assets resulting from operations | (39,209,706 | ) | 25,438,524 | |||||
| Net Equalization Credits | 8,266 | 364,051 | ||||||
| DISTRIBUTIONS TO SHAREHOLDERS: | ||||||||
| From distributable earnings | (5,972,461 | ) | (11,551,790 | ) | ||||
| Total distributions | (5,972,461 | ) | (11,551,790 | ) | ||||
| CAPITAL SHARE TRANSACTIONS: | ||||||||
| Proceeds from sale of shares | 2,727,386 | 10,544,878 | ||||||
| Cost of shares redeemed | (40,490,099 | ) | (88,017,701 | ) | ||||
| Net income equalization (Note 2) | (8,266 | ) | (364,051 | ) | ||||
| Net decrease from share transactions | (37,770,979 | ) | (77,836,874 | ) | ||||
| Net decrease in net assets | (82,944,880 | ) | (63,586,089 | ) | ||||
| NET ASSETS: | ||||||||
| Beginning of period | 221,741,058 | 285,327,147 | ||||||
| End of period | $ | 138,796,178 | $ | 221,741,058 | ||||
| OTHER INFORMATION: | ||||||||
| CAPITAL SHARE TRANSACTIONS: | ||||||||
| Beginning shares | 8,250,000 | 11,350,000 | ||||||
| Shares sold | 100,000 | 400,000 | ||||||
| Shares redeemed | (1,900,000 | ) | (3,500,000 | ) | ||||
| Shares outstanding, end of period | 6,450,000 | 8,250,000 | ||||||
See Notes to Financial Statements.
21 | May 31, 2020
| ALPS Emerging Sector Dividend Dogs ETF |
| Statements of Changes in Net Assets |
For the Six Months Ended May 31, 2020 (Unaudited) | For the Year Ended November 30, 2019 | |||||||
| OPERATIONS: | ||||||||
| Net investment income | $ | 319,053 | $ | 1,332,392 | ||||
| Net realized loss | (2,367,970 | ) | (3,357,958 | ) | ||||
| Net change in unrealized appreciation/(depreciation) | (2,632,911 | ) | 2,763,939 | |||||
| Net increase/(decrease) in net assets resulting from operations | (4,681,828 | ) | 738,373 | |||||
| Net Equalization Credits | 27,791 | 18,601 | ||||||
| DISTRIBUTIONS TO SHAREHOLDERS: | ||||||||
| From distributable earnings | (373,882 | ) | (1,883,340 | ) | ||||
| Total distributions | (373,882 | ) | (1,883,340 | ) | ||||
| CAPITAL SHARE TRANSACTIONS: | ||||||||
| Proceeds from sale of shares | 3,162,367 | – | ||||||
| Cost of shares redeemed | (7,569,426 | ) | (5,114,874 | ) | ||||
| Net income equalization (Note 2) | (27,791 | ) | (18,601 | ) | ||||
| Net decrease from share transactions | (4,434,850 | ) | (5,133,475 | ) | ||||
| Net decrease in net assets | (9,462,769 | ) | (6,259,841 | ) | ||||
| NET ASSETS: | ||||||||
| Beginning of period | 28,940,752 | 35,200,593 | ||||||
| End of period | $ | 19,477,983 | $ | 28,940,752 | ||||
| OTHER INFORMATION: | ||||||||
| CAPITAL SHARE TRANSACTIONS: | ||||||||
| Beginning shares | 1,400,000 | 1,650,000 | ||||||
| Shares sold | 150,000 | – | ||||||
| Shares redeemed | (450,000 | ) | (250,000 | ) | ||||
| Shares outstanding, end of period | 1,100,000 | 1,400,000 | ||||||
See Notes to Financial Statements.
22 | May 31, 2020
| ALPS REIT Dividend Dogs ETF |
| Statements of Changes in Net Assets |
For the Six Months Ended May 31, 2020 (Unaudited)(a) | For the Year Ended November 30, 2019 | |||||||
| OPERATIONS: | ||||||||
| Net investment income | $ | 1,142,119 | $ | 1,368,984 | ||||
| Net realized gain | 7,285,431 | 1,744,020 | ||||||
| Net change in unrealized appreciation/(depreciation) | (20,696,254 | ) | 3,448,816 | |||||
| Net increase/(decrease) in net assets resulting from operations | (12,268,704 | ) | 6,561,820 | |||||
| DISTRIBUTIONS TO SHAREHOLDERS: | ||||||||
| From distributable earnings | (1,246,819 | ) | (1,634,862 | ) | ||||
| Total distributions | (1,246,819 | ) | (1,634,862 | ) | ||||
| CAPITAL SHARE TRANSACTIONS: | ||||||||
| Proceeds from sale of shares | 19,287,844 | – | ||||||
| Cost of shares redeemed | (29,062,684 | ) | (6,883,881 | ) | ||||
| Net decrease from share transactions | (9,774,840 | ) | (6,883,881 | ) | ||||
| Net decrease in net assets | (23,290,363 | ) | (1,956,923 | ) | ||||
| NET ASSETS: | ||||||||
| Beginning of period | 53,265,165 | 55,222,088 | ||||||
| End of period | $ | 29,974,802 | $ | 53,265,165 | ||||
| OTHER INFORMATION: | ||||||||
| CAPITAL SHARE TRANSACTIONS: | ||||||||
| Beginning shares | 1,100,000 | 1,250,000 | ||||||
| Shares sold | 400,000 | – | ||||||
| Shares redeemed | (650,000 | ) | (150,000 | ) | ||||
| Shares outstanding, end of period | 850,000 | 1,100,000 | ||||||
| (a) | Prior to January 2, 2020, the ALPS REIT Dividend Dogs ETF was known as the Cohen & Steers Global Realty Majors ETF. |
See Notes to Financial Statements.
23 | May 31, 2020
ALPS Sector Dividend Dogs ETF
| Financial Highlights | For a Share Outstanding Throughout the Periods Presented |
| For the Six Months Ended May 31, 2020 (Unaudited) | For the Year Ended November 30, 2019 | For the Year Ended November 30, 2018 | For the Year Ended November 30, 2017 | For the Year Ended November 30, 2016 | For the Year Ended November 30, 2015 | |||||||||||||||||||
| NET ASSET VALUE, BEGINNING OF PERIOD | $ | 45.78 | $ | 44.26 | $ | 45.61 | $ | 42.29 | $ | 36.23 | $ | 38.80 | ||||||||||||
| INCOME/(LOSS) FROM INVESTMENT OPERATIONS: | ||||||||||||||||||||||||
| Net investment income (a) | 0.94 | 1.71 | 1.54 | 1.40 | 1.26 | 1.21 | ||||||||||||||||||
| Net realized and unrealized gain/(loss) | (9.86 | ) | 1.34 | (1.31 | ) | 3.39 | 6.15 | (2.47 | ) | |||||||||||||||
| Total from investment operations | (8.92 | ) | 3.05 | 0.23 | 4.79 | 7.41 | (1.26 | ) | ||||||||||||||||
| DISTRIBUTIONS: | ||||||||||||||||||||||||
| From net investment income | (0.88 | ) | (1.53 | ) | (1.58 | ) | (1.42 | ) | (1.34 | ) | (1.31 | ) | ||||||||||||
| Tax return of capital | – | – | – | (0.05 | ) | (0.01 | ) | – | ||||||||||||||||
| Total distributions | (0.88 | ) | (1.53 | ) | (1.58 | ) | (1.47 | ) | (1.35 | ) | (1.31 | ) | ||||||||||||
| Net increase/(decrease) in net asset value | (9.80 | ) | 1.52 | (1.35 | ) | 3.32 | 6.06 | (2.57 | ) | |||||||||||||||
| NET ASSET VALUE, END OF PERIOD | $ | 35.98 | $ | 45.78 | $ | 44.26 | $ | 45.61 | $ | 42.29 | $ | 36.23 | ||||||||||||
| TOTAL RETURN(b) | (19.57 | )% | 7.26 | % | 0.51 | % | 11.59 | % | 20.86 | % | (3.21 | )% | ||||||||||||
| RATIOS/SUPPLEMENTAL DATA: | ||||||||||||||||||||||||
| Net assets, end of period (000s) | $ | 997,058 | $ | 1,746,784 | $ | 2,166,709 | $ | 2,322,205 | $ | 1,702,405 | $ | 1,014,899 | ||||||||||||
| Ratio of expenses to average net assets | 0.40 | %(c) | 0.40 | % | 0.40 | % | 0.40 | % | 0.40 | % | 0.40 | % | ||||||||||||
| Ratio of net investment income to average net assets | 4.63 | %(c) | 3.97 | % | 3.40 | % | 3.24 | % | 3.23 | % | 3.25 | % | ||||||||||||
| Portfolio turnover rate(d) | 46 | % | 55 | % | 61 | % | 48 | % | 49 | % | 55 | % | ||||||||||||
| Undistributed net investment income included in price of units issued and redeemed(a)(e) | $ | 0.08 | $ | 0.06 | $ | 0.04 | $ | 0.03 | $ | 0.06 | $ | 0.06 | ||||||||||||
| (a) | Based on average shares outstanding during the period. |
| (b) | Total return is calculated assuming an initial investment made at the net asset value at the beginning of the period and redemption at the net asset value on the last day of the period and assuming all distributions are reinvested at reinvestment prices. Total return calculated for a period of less than one year is not annualized. |
| (c) | Annualized. |
| (d) | Portfolio turnover for periods less than one year is not annualized and does not include securities received or delivered from processing creations or redemptions in-kind. |
| (e) | The per share amount of equalization is presented to show the impact of equalization on distributable earnings per share. |
See Notes to Financial Statements.
24 | May 31, 2020
ALPS International Sector Dividend Dogs ETF
| Financial Highlights | For a Share Outstanding Throughout the Periods Presented |
| For the Six Months Ended May 31, 2020 (Unaudited) | For the Year Ended November 30, 2019 | For the Year Ended November 30, 2018 | For the Year Ended November 30, 2017 | For the Year Ended November 30, 2016 | For the Year Ended November 30, 2015 | |||||||||||||||||||
| NET ASSET VALUE, BEGINNING OF PERIOD | $ | 26.88 | $ | 25.14 | $ | 28.27 | $ | 22.84 | $ | 24.25 | $ | 27.33 | ||||||||||||
| INCOME/(LOSS) FROM INVESTMENT OPERATIONS: | ||||||||||||||||||||||||
| Net investment income(a) | 0.38 | 1.20 | 1.15 | 0.94 | 1.00 | 1.06 | ||||||||||||||||||
| Net realized and unrealized gain/(loss) | (5.00 | ) | 1.69 | (3.19 | ) | 5.41 | (1.47 | ) | (3.13 | ) | ||||||||||||||
| Total from investment operations | (4.62 | ) | 2.89 | (2.04 | ) | 6.35 | (0.47 | ) | (2.07 | ) | ||||||||||||||
| DISTRIBUTIONS: | ||||||||||||||||||||||||
| From net investment income | (0.74 | ) | (1.15 | ) | (1.09 | ) | (0.92 | ) | (0.94 | ) | (0.99 | ) | ||||||||||||
| Tax return of capital | – | – | – | – | – | (0.02 | ) | |||||||||||||||||
| Total distributions | (0.74 | ) | (1.15 | ) | (1.09 | ) | (0.92 | ) | (0.94 | ) | (1.01 | ) | ||||||||||||
| Net increase/(decrease) in net asset value | (5.36 | ) | 1.74 | (3.13 | ) | 5.43 | (1.41 | ) | (3.08 | ) | ||||||||||||||
| NET ASSET VALUE, END OF PERIOD | $ | 21.52 | $ | 26.88 | $ | 25.14 | $ | 28.27 | $ | 22.84 | $ | 24.25 | ||||||||||||
| TOTAL RETURN(b) | (17.51 | )% | 11.79 | % | (7.47 | )% | 28.21 | % | (1.95 | )% | (7.76 | )% | ||||||||||||
| RATIOS/SUPPLEMENTAL DATA: | ||||||||||||||||||||||||
| Net assets, end of period (000s) | $ | 138,796 | $ | 221,741 | $ | 285,327 | $ | 349,184 | $ | 161,042 | $ | 135,778 | ||||||||||||
| Ratio of expenses to average net assets | 0.50 | %(c) | 0.50 | % | 0.50 | % | 0.50 | % | 0.50 | % | 0.50 | % | ||||||||||||
| Ratio of net investment income to average net assets | 3.15 | %(c) | 4.65 | % | 4.16 | % | 3.55 | % | 4.28 | % | 4.05 | % | ||||||||||||
| Portfolio turnover rate(d) | 63 | % | 58 | % | 72 | % | 37 | % | 47 | % | 67 | % | ||||||||||||
| Undistributed net investment income included in price of units issued and redeemed(a)(e) | $ | 0.00 | (f) | $ | 0.04 | $ | 0.05 | $ | 0.12 | $ | 0.09 | $ | 0.05 | |||||||||||
| (a) | Based on average shares outstanding during the period. |
| (b) | Total return is calculated assuming an initial investment made at the net asset value at the beginning of the period and redemption at the net asset value on the last day of the period and assuming all distributions are reinvested at reinvestment prices. Total return calculated for a period of less than one year is not annualized. |
| (c) | Annualized. |
| (d) | Portfolio turnover for periods less than one year is not annualized and does not include securities received or delivered from processing creations or redemptions in-kind. |
| (e) | The per share amount of equalization is presented to show the impact of equalization on distributable earnings per share. |
| (f) | Less than $0.005. |
See Notes to Financial Statements.
25 | May 31, 2020
ALPS Emerging Sector Dividend Dogs ETF
| Financial Highlights | For a Share Outstanding Throughout the Periods Presented |
| For the Six Months Ended May 31, 2020 (Unaudited) | For the Year Ended November 30, 2019 | For the Year Ended November 30, 2018 | For the Year Ended November 30, 2017 | For the Year Ended November 30, 2016 | For the Year Ended November 30, 2015 | |||||||||||||||||||
| NET ASSET VALUE, BEGINNING OF PERIOD | $ | 20.67 | $ | 21.33 | $ | 24.29 | $ | 21.17 | $ | 20.78 | $ | 26.57 | ||||||||||||
| INCOME/(LOSS) FROM INVESTMENT OPERATIONS: | ||||||||||||||||||||||||
| Net investment income(a) | 0.24 | 0.89 | 0.91 | 0.80 | 0.67 | 1.26 | ||||||||||||||||||
| Net realized and unrealized gain/(loss) | (2.93 | ) | (0.33 | ) | (3.02 | ) | 3.06 | 0.39 | (6.15 | ) | ||||||||||||||
| Total from investment operations | (2.69 | ) | 0.56 | (2.11 | ) | 3.86 | 1.06 | (4.89 | ) | |||||||||||||||
| DISTRIBUTIONS: | ||||||||||||||||||||||||
| From net investment income | (0.27 | ) | (1.22 | ) | (0.85 | ) | (0.74 | ) | (0.67 | ) | (0.90 | ) | ||||||||||||
| Total distributions | (0.27 | ) | (1.22 | ) | (0.85 | ) | (0.74 | ) | (0.67 | ) | (0.90 | ) | ||||||||||||
| Net increase/(decrease) in net asset value | (2.96 | ) | (0.66 | ) | (2.96 | ) | 3.12 | 0.39 | (5.79 | ) | ||||||||||||||
| NET ASSET VALUE, END OF PERIOD | $ | 17.71 | $ | 20.67 | $ | 21.33 | $ | 24.29 | $ | 21.17 | $ | 20.78 | ||||||||||||
| TOTAL RETURN(b) | (13.10 | )% | 2.67 | % | (8.76 | )% | 18.37 | % | 5.10 | % | (18.66 | )% | ||||||||||||
| RATIOS/SUPPLEMENTAL DATA: | ||||||||||||||||||||||||
| Net assets, end of period (000s) | $ | 19,478 | $ | 28,941 | $ | 35,201 | $ | 47,356 | $ | 19,057 | $ | 9,349 | ||||||||||||
| Ratio of expenses to average net assets | 0.60 | %(c) | 0.60 | % | 0.60 | % | 0.60 | % | 0.60 | % | 0.60 | % | ||||||||||||
| Ratio of net investment income to average net assets | 2.51 | %(c) | 4.16 | % | 3.88 | % | 3.33 | % | 3.11 | % | 5.34 | % | ||||||||||||
| Portfolio turnover rate(d) | 73 | % | 83 | % | 85 | % | 42 | % | 68 | % | 96 | % | ||||||||||||
| Undistributed net investment income included in price of units issued and redeemed(a)(e) | $ | 0.02 | $ | 0.01 | $ | 0.10 | $ | 0.05 | $ | 0.36 | $ | 0.03 | ||||||||||||
| (a) | Based on average shares outstanding during the period. |
| (b) | Total return is calculated assuming an initial investment made at the net asset value at the beginning of the period and redemption at the net asset value on the last day of the period and assuming all distributions are reinvested at reinvestment prices. Total return calculated for a period of less than one year is not annualized. |
| (c) | Annualized. |
| (d) | Portfolio turnover for periods less than one year is not annualized and does not include securities received or delivered from processing creations or redemptions in-kind. |
| (e) | The per share amount of equalization is presented to show the impact of equalization on distributable earnings per share. |
See Notes to Financial Statements.
26 | May 31, 2020
ALPS REIT Dividend Dogs ETF
| Financial Highlights | For a Share Outstanding Throughout the Periods Presented |
| For the Six Months Ended May 31, 2020 (Unaudited)(a) | For the Year Ended November 30, 2019 | For the Year Ended November 30, 2018 | For the Year Ended November 30, 2017 | For the Year Ended November 30, 2016 | For the Year Ended November 30, 2015 | |||||||||||||||||||
| NET ASSET VALUE, BEGINNING OF PERIOD | $ | 48.42 | $ | 44.18 | $ | 45.37 | $ | 41.31 | $ | 42.25 | $ | 44.07 | ||||||||||||
| INCOME/(LOSS) FROM INVESTMENT OPERATIONS: | ||||||||||||||||||||||||
| Net investment income (b) | 1.15 | 1.19 | 1.17 | 0.75 | 1.24 | 1.41 | ||||||||||||||||||
| Net realized and unrealized gain/(loss) | (13.11 | ) | 4.45 | (0.53 | ) | 4.45 | (0.90 | ) | (1.57 | ) | ||||||||||||||
| Total from investment operations | (11.96 | ) | 5.64 | 0.64 | 5.20 | 0.34 | (0.16 | ) | ||||||||||||||||
| DISTRIBUTIONS: | ||||||||||||||||||||||||
| From net investment income | (1.20 | ) | (1.40 | ) | (1.83 | ) | (1.14 | ) | (1.28 | ) | (1.66 | ) | ||||||||||||
| Total distributions | (1.20 | ) | (1.40 | ) | (1.83 | ) | (1.14 | ) | (1.28 | ) | (1.66 | ) | ||||||||||||
| Net increase/(decrease) in net asset value | (13.16 | ) | 4.24 | (1.19 | ) | 4.06 | (0.94 | ) | (1.82 | ) | ||||||||||||||
| NET ASSET VALUE, END OF PERIOD | $ | 35.26 | $ | 48.42 | $ | 44.18 | $ | 45.37 | $ | 41.31 | $ | 42.25 | ||||||||||||
| TOTAL RETURN(c) | (24.84 | )% | 13.00 | % | 1.47 | % | 12.77 | % | 0.61 | % | (0.38 | )% | ||||||||||||
| RATIOS/SUPPLEMENTAL DATA: | ||||||||||||||||||||||||
| Net assets, end of period (000s) | $ | 29,975 | $ | 53,265 | $ | 55,222 | $ | 68,050 | $ | 80,550 | $ | 99,298 | ||||||||||||
| Ratio of expenses to average net assets | 0.39 | %(d) | 0.55 | % | 0.55 | % | 0.55 | % | 0.55 | % | 0.55 | % | ||||||||||||
| Ratio of net investment income to average net assets | 5.52 | %(d) | 2.56 | % | 2.67 | % | 1.71 | % | 2.86 | % | 3.24 | % | ||||||||||||
| Portfolio turnover rate(e) | 111 | % | 10 | % | 14 | % | 10 | % | 8 | % | 7 | % | ||||||||||||
| (a) | Prior to January 2, 2020, the ALPS REIT Dividend Dogs ETF was known as the Cohen & Steers Global Realty Majors ETF. |
| (b) | Based on average shares outstanding during the period. |
| (c) | Total return is calculated assuming an initial investment made at the net asset value at the beginning of the period and redemption at the net asset value on the last day of the period and assuming all distributions are reinvested at reinvestment prices. Total return calculated for a period of less than one year is not annualized. |
| (d) | Annualized. |
| (e) | Portfolio turnover for periods less than one year is not annualized and does not include securities received or delivered from processing creations or redemptions in-kind. |
See Notes to Financial Statements.
27 | May 31, 2020
ALPS ETF Trust
| Notes to Financial Statements | May 31, 2020 (Unaudited) |
1. ORGANIZATION
ALPS ETF Trust (the “Trust”), a Delaware statutory trust, is an open-end management investment company registered under the Investment Company Act of 1940, as amended (the “1940 Act”). As of May 31, 2020, the Trust consisted of sixteen separate portfolios. Each portfolio represents a separate series of the Trust. This report pertains to the ALPS Sector Dividend Dogs ETF, the ALPS International Sector Dividend Dogs ETF, the ALPS Emerging Sector Dividend Dogs ETF, and the ALPS REIT Dividend Dogs ETF (formerly known as the Cohen & Steers Global Realty Majors ETF) (each a “Fund” and collectively, the “Funds”). Each Fund has elected to qualify as a diversified series of the Trust under the 1940 Act.
The investment objective of the ALPS Sector Dividend Dogs ETF is to seek investment results that replicate as closely as possible, before fees and expenses, the performance of the S-Network® Sector Dividend Dogs Index. The investment objective of the ALPS International Sector Dividend Dogs ETF is to seek investment results that replicate as closely as possible, before fees and expenses, the performance of the S-Network® International Sector Dividend Dogs Index. The investment objective of the ALPS Emerging Sector Dividend Dogs ETF is to seek investment results that replicate as closely as possible, before fees and expenses, the performance of the S-Network® Emerging Sector Dividend Dogs Index. The investment objective of the ALPS REIT Dividend Dogs ETF is to seek investment results that replicate as closely as possible, before fees and expenses, the performance of the S-Network® REIT Dividend Dogs Index.
The shares of the ALPS Sector Dividend Dogs ETF, the ALPS International Sector Dividend Dogs ETF, the ALPS Emerging Sector Dividend Dogs ETF, and the ALPS REIT Dividend Dogs ETF (“Shares”) are listed on the NYSE Arca, Inc. (the “NYSE Arca”). Each Fund issues and redeems Shares, at net asset value (“NAV”) in blocks of 50,000 Shares, each of which is called a “Creation Unit”. Creation Units are issued and redeemed principally in-kind for securities included in the Underlying Index. Except when aggregated in Creation Units, Shares are not redeemable securities of the Fund.
Pursuant to the Trust’s organizational documents, its Officers and Trustees are indemnified against certain liability arising out of the performance of their duties to the Trust. Additionally, in the normal course of business, the Trust enters into contracts with service providers that contain general indemnification clauses. The Trust’s maximum exposure under these arrangements is unknown, as this would involve future claims that may be made against the Trust that have not yet occurred.
2. SIGNIFICANT ACCOUNTING POLICIES
The following is a summary of significant accounting policies consistently followed by the Funds in the preparation of the financial statements. The accompanying financial statements were prepared in accordance with accounting principles generally accepted in the United States of America (“U.S. GAAP”). The preparation of financial statements in conformity with U.S. GAAP requires management to make certain estimates and assumptions that affect the reported amounts of assets and liabilities and disclosures of contingent assets and liabilities at the date of the financial statements and the reported amounts of revenue and expenses during the period. Actual results could differ from those estimates. Each Fund is considered an investment company under U.S. GAAP and follows the accounting and reporting guidance applicable to investment companies in the Financial Accounting Standards Board (“FASB”) Accounting Standards Codification Topic 946.
A. Portfolio Valuation
Each Fund’s NAV is determined daily, as of the close of regular trading on the New York Stock Exchange (“NYSE”), normally 4:00 p.m. Eastern time, on each day the NYSE is open for trading. The NAV is computed by dividing the value of all assets of the Fund (including accrued interest and dividends), less all liabilities (including accrued expenses and dividends declared but unpaid), by the total number of shares outstanding.
Portfolio securities listed on any exchange other than the NASDAQ Stock Market LLC (“NASDAQ”) are valued at the last sale price on the business day as of which such value is being determined. If there has been no sale on such day, the securities are valued at the mean of the most recent bid and ask prices on such day. Securities traded on the NASDAQ are valued at the NASDAQ Official Closing Price as determined by NASDAQ. Portfolio securities traded on more than one securities exchange are valued at the last sale price on the business day as of which such value is being determined at the close of the exchange representing the principal market for such securities. Portfolio securities traded in the over-the-counter market, but excluding securities traded on the NASDAQ, are valued at the latest quoted sale price in such market.
The Funds’ investments are valued at market value or, in the absence of market value with respect to any portfolio securities, at fair value according to procedures adopted by the Trust’s Board of Trustees (the “Board”). When market quotations are not readily available or when events occur that make established valuation methods unreliable, securities of the Funds may be valued in good faith by or under the direction of the Board. These securities generally include, but are not limited to, restricted securities (securities which may not be publicly sold without registration under the Securities Act of 1933) for which a pricing service is unable to provide a market price; securities whose trading has been formally suspended; a security whose market price is not available from a pre-established primary pricing source or the pricing source is not willing to provide a price; a security with respect to which an event has occurred that is most likely to materially affect the value of the security after the market has closed but before the calculation of the Fund’s NAV or make it difficult or impossible to obtain a reliable market quotation; or a security whose price, as provided by the pricing service, does not reflect the security’s “fair value” due to the security being de-listed from a national exchange or the security’s primary trading market is temporarily closed at a time when, under normal conditions, it would be open. As a general principle, the current “fair value” of a security would be the amount which the owner might reasonably expect to receive from the sale on the applicable exchange or principal market. A variety of factors may be considered in determining the fair value of such securities.
28 | May 31, 2020
ALPS ETF Trust
| Notes to Financial Statements | May 31, 2020 (Unaudited) |
B. Fair Value Measurements
Each Fund discloses the classification of its fair value measurements following a three-tier hierarchy based on the inputs used to measure fair value. Inputs refer broadly to the assumptions that market participants would use in pricing the asset or liability, including assumptions about risk. Inputs may be observable or unobservable. Observable inputs reflect the assumptions market participants would use in pricing the asset or liability that are developed based on market data obtained from sources independent of the reporting entity. Unobservable inputs reflect the reporting entity’s own assumptions about the assumptions market participants would use in pricing the asset or liability that are developed based on the best information available.
Valuation techniques used to value the Funds’ investments by major category are as follows:
Equity securities, including restricted securities, for which market quotations are readily available, are valued at the last reported sale price or official closing price as reported by a third party pricing vendor on the primary market or exchange on which they are traded and are categorized as Level 1 in the hierarchy. In the event there were no sales during the day or closing prices are not available, securities are valued at the mean of the most recent quoted bid and ask prices on such day and are generally categorized as Level 2 in the hierarchy. Investments in open-end mutual funds are valued at their closing NAV each business day and are categorized as Level 1 in the hierarchy.
Changes in valuation techniques may result in transfers in or out of an assigned level within the disclosure hierarchy.
Various inputs are used in determining the value of each Fund’s investments as of the end of the reporting period. When inputs used fall into different levels of the fair value hierarchy, the level in the hierarchy within which the fair value measurement falls is determined based on the lowest level input that is significant to the fair value measurement in its entirety. The designated input levels are not necessarily an indication of the risk or liquidity associated with these investments.
These inputs are categorized in the following hierarchy under applicable financial accounting standards:
| Level 1 – | Unadjusted quoted prices in active markets for identical investments, unrestricted assets or liabilities that a Fund has the ability to access at the measurement date; |
| Level 2 – | Quoted prices which are not active, quoted prices for similar assets or liabilities in active markets or inputs other than quoted prices that are observable (either directly or indirectly) for substantially the full term of the asset or liability; and |
| Level 3 – | Significant unobservable prices or inputs (including the Fund’s own assumptions in determining the fair value of investments) where there is little or no market activity for the asset or liability at the measurement date. |
The following is a summary of the inputs used to value the Funds’ investments as of May 31, 2020:
| ALPS Sector Dividend Dogs ETF | ||||||||||||||||
| Investments in Securities at Value | Level 1 - Quoted and Unadjusted Prices | Level 2 - Other Significant Observable Inputs | Level 3 - Significant Unobservable Inputs | Total | ||||||||||||
| Common Stocks* | $ | 991,117,462 | $ | – | $ | – | $ | 991,117,462 | ||||||||
| Short Term Investments | 543,391 | – | – | 543,391 | ||||||||||||
| Total | $ | 991,660,853 | $ | – | $ | – | $ | 991,660,853 | ||||||||
| ALPS International Sector Dividend Dogs ETF | ||||||||||||||||
| Investments in Securities at Value | Level 1 - Quoted and Unadjusted Prices | Level 2 - Other Significant Observable Inputs | Level 3 - Significant Unobservable Inputs | Total | ||||||||||||
| Common Stocks* | $ | 137,401,372 | $ | – | $ | – | $ | 137,401,372 | ||||||||
| Short Term Investments | 5,021,690 | – | – | 5,021,690 | ||||||||||||
| Total | $ | 142,423,062 | $ | – | $ | – | $ | 142,423,062 | ||||||||
29 | May 31, 2020
ALPS ETF Trust
| Notes to Financial Statements | May 31, 2020 (Unaudited) |
| ALPS Emerging Sector Dividend Dogs ETF | ||||||||||||||||
| Investments in Securities at Value | Level 1 - Quoted and Unadjusted Prices | Level 2 - Other Significant Observable Inputs | Level 3 - Significant Unobservable Inputs | Total | ||||||||||||
| Common Stocks* | $ | 19,429,369 | $ | – | $ | – | $ | 19,429,369 | ||||||||
| Short Term Investments | 346,303 | – | – | 346,303 | ||||||||||||
| Total | $ | 19,775,672 | $ | – | $ | – | $ | 19,775,672 | ||||||||
| ALPS REIT Dividend Dogs ETF | ||||||||||||||||
| Investments in Securities at Value | Level 1 - Quoted and Unadjusted Prices | Level 2 - Other Significant Observable Inputs | Level 3 - Significant Unobservable Inputs | Total | ||||||||||||
| Common Stocks* | $ | 29,851,396 | $ | – | $ | – | $ | 29,851,396 | ||||||||
| Short-Term Investments | 466,369 | – | – | 466,369 | ||||||||||||
| Total | $ | 30,317,765 | $ | – | $ | – | $ | 30,317,765 | ||||||||
| * | For a detailed sector/country breakdown, see the accompanying Schedule of Investments. |
The Funds did not have any securities that used significant unobservable inputs (Level 3) in determining fair value and there were no transfers into or out of Level 3.
C. Foreign Securities
The ALPS International Sector Dividend Dogs ETF, the ALPS Emerging Sector Dividend Dogs ETF, and the ALPS REIT Dividend Dogs ETF may directly purchase securities of foreign issuers. Investments in non-U.S. issuers may involve unique risks compared to investing in securities of U.S. issuers, including, among others, less liquidity generally, greater market volatility than U.S. securities and less complete financial information than for U.S. issuers. In addition, adverse political, economic or social developments could undermine the value of the Fund’s investments or prevent the Fund from realizing the full value of its investments. Financial reporting standards for companies based in foreign markets differ from those in the United States. Finally, the value of the currency of the country in which the Fund has invested could decline relative to the value of the U.S. dollar, which may affect the value of the investment to U.S. investors.
Because foreign markets may be open on different days than the days during which investors may purchase the shares of each Fund, the value of each Fund's securities may change on the days when investors are not able to purchase the shares of the Funds. The value of securities denominated in foreign currencies is converted into U.S. dollars using exchange rates determined daily as of the close of regular trading on the NYSE or NASDAQ. Any use of a different rate from the rates used by the Index may adversely affect a Fund's ability to track its Index.
D. Foreign Currency Translation
The books and records of the Funds are maintained in U.S. dollars. Investment valuations and other assets and liabilities initially expressed in foreign currencies are converted each business day into U.S. dollars based upon current exchange rates. The portion of realized and unrealized gains or losses on investments due to fluctuations in foreign currency exchange rates is not separately disclosed and is included in realized and unrealized gains or losses on investments, when applicable.
E. Securities Transactions and Investment Income
Securities transactions are recorded as of the trade date. Realized gains and losses from securities transactions are recorded on the highest cost basis. Dividend income and capital gains distributions, if any, are recorded on the ex-dividend date, net of any foreign taxes withheld. Interest income, if any, is recorded on the accrual basis, including any amortization of premiums and accretion of discounts.
F. Dividends and Distributions to Shareholders
Dividends from net investment income for each Fund, if any, are declared and paid quarterly or as the Board may determine from time to time. Distributions of net realized capital gains earned by the Funds, if any, are distributed at least annually.
G. Equalization
The ALPS Sector Dividend Dogs ETF, the ALPS International Sector Dividend Dogs ETF, and the ALPS Emerging Sector Dividend Dogs ETF utilize the accounting practice known as “Equalization” by which a portion of the proceeds from sales and costs of reacquiring the Funds’ shares, equivalent on a per share basis to the amount of distributable net investment income on the date of the transaction, is credited or charged to undistributed net investment income. As a result, undistributed net investment income per share is unaffected by sales or reacquisitions of the Funds’ shares. Amounts related to Equalization can be found on the Statement of Changes in Net Assets.
30 | May 31, 2020
ALPS ETF Trust
| Notes to Financial Statements | May 31, 2020 (Unaudited) |
H. Real Estate Investment Trusts (“REITs”)
As part of its investments in real estate related securities, the ALPS REIT Dividend Dogs ETF (“RDOG”) will invest in REITs and is subject to certain risks associated with direct investment in REITs. REITs possess certain risks which differ from an investment in common stocks. REITs are financial vehicles that pool investors’ capital to acquire, develop and/or finance real estate and provide services to their tenants. REITs may concentrate their investments in specific geographic areas or in specific property types, e.g., regional malls, shopping centers, office buildings, apartment buildings and industrial warehouses. REITs may be affected by changes in the value of their underlying properties and by defaults by borrowers or tenants. REITs depend generally on their ability to generate cash flow to make distributions to shareowners, and certain REITs have self-liquidation provisions by which mortgages held may be paid in full and distributions of capital returns may be made at any time.
As REITs generally pay a higher rate of dividends than most other operating companies, to the extent application of RDOG’s investment strategy results in RDOG investing in REIT shares, the percentage of RDOG’s dividend income received from REIT shares will likely exceed the percentage of RDOG’s portfolio that is comprised of REIT shares. Distributions received by RDOG from REITs may consist of dividends, capital gains and/or return of capital.
Dividend income from REITs is recognized on the ex-dividend date. The calendar year-end amounts of ordinary income, capital gains, and return of capital included in distributions received from RDOG’s investments in REITs are reported to RDOG after the end of the calendar year; accordingly, RDOG estimates these amounts for accounting purposes until the characterization of REIT distributions is reported to RDOG after the end of the calendar year. Estimates are based on the most recent REIT distribution information available.
The performance of a REIT may be affected by its failure to qualify for tax-free pass-through of income under the Internal Revenue Code of 1986, as amended (the “Code”), or its failure to maintain exemption from registration under the 1940 Act. Due to RDOG’s investments in REITs, RDOG may also make distributions in excess of RDOG’s earnings and capital gains. Distributions, if any, in excess of RDOG’s earnings and profits will first reduce the adjusted tax basis of a holder’s shares and, after that basis has been reduced to zero, will constitute capital gains to the shareholder.
I. Federal Tax and Tax Basis Information
The timing and character of income and capital gain distributions are determined in accordance with income tax regulations, which may differ from U.S. GAAP. Reclassifications are made to the Funds’ capital accounts for permanent tax differences to reflect income and gains available for distribution (or available capital loss carryforwards) under income tax regulations. The amounts and characteristics of tax basis distributions and composition of distributable earnings/(accumulated losses) are finalized at fiscal year-end; accordingly, tax basis balances have not been determined as of May 31, 2020.
The tax character of the distributions paid during the fiscal year ended November 30, 2019 was as follows:
| Fund | Ordinary Income | |||
| November 30, 2019 | ||||
| ALPS Sector Dividend Dogs ETF | $ | 66,976,075 | ||
| ALPS International Sector Dividend Dogs ETF | 11,551,790 | |||
| ALPS Emerging Sector Dividend Dogs ETF | 1,883,340 | |||
| ALPS REIT Dividend Dogs ETF | 1,634,862 | |||
Under current law, capital losses maintain their character as short-term or long-term and are carried forward to the next tax year without expiration. As of November 30, 2019, the following amounts are available as carry forwards to the next tax year:
| Fund | Short-Term | Long-Term | ||||||
| ALPS Sector Dividend Dogs ETF | $ | 2,169,732 | $ | 173,041,937 | ||||
| ALPS International Sector Dividend Dogs ETF | 8,275,625 | 35,798,889 | ||||||
| ALPS Emerging Sector Dividend Dogs ETF | 1,412,622 | 6,268,339 | ||||||
| ALPS REIT Dividend Dogs ETF | 955,134 | 3,344,205 | ||||||
31 | May 31, 2020
| ALPS ETF Trust |
| Notes to Financial Statements | May 31, 2020 (Unaudited) |
As of May 31, 2020, the cost of investments for federal income tax purposes and accumulated net unrealized appreciation/(depreciation) on investments were as follows:
| Gross Appreciation (excess of value over tax cost) | Gross Depreciation (excess of tax cost over value) | Net Unrealized Appreciation/ (Depreciation) | Cost of Investments for Income Tax Purposes | |||||||||||||
| ALPS Sector Dividend Dogs ETF | $ | 48,826,106 | $ | (416,903,404 | ) | $ | (368,077,298 | ) | $ | 1,359,738,151 | ||||||
| ALPS International Sector Dividend Dogs ETF | 5,489,313 | (43,747,016 | ) | (38,257,703 | ) | 180,680,765 | ||||||||||
| ALPS Emerging Sector Dividend Dogs ETF | 727,542 | (5,412,538 | ) | (4,684,996 | ) | 24,460,668 | ||||||||||
| ALPS REIT Dividend Dogs ETF | 2,514,412 | (13,444,974 | ) | (10,930,562 | ) | 41,248,327 | ||||||||||
The differences between book-basis and tax-basis are primarily due to the deferral of losses from wash sales and investments in partnerships. In addition, certain tax cost basis adjustments are finalized at fiscal year-end and therefore have not been determined as of May 31, 2020.
J. Income Taxes
No provision for income taxes is included in the accompanying financial statements, as each Fund intends to distribute to shareholders all taxable investment income and realized gains and otherwise comply with Subchapter M of the Code, applicable to regulated investment companies. Each Fund evaluates tax positions taken (or expected to be taken) in the course of preparing the Fund’s tax returns to determine whether these positions meet a “more-likely-than-not” standard that, based on the technical merits, have a more than fifty percent likelihood of being sustained by a taxing authority upon examination. A tax position that meets the “more-likely-than-not” recognition threshold is measured to determine the amount of benefit to recognize in the financial statements.
As of and during the six months ended May 31, 2020, each Fund did not have a liability for any unrecognized tax benefits. Each Fund files U.S. federal, state, and local tax returns as required. Each Fund’s tax returns are subject to examination by the relevant tax authorities until expiration of the applicable statute of limitations, which is generally three years after the filing of the tax return, but may extend to four years in certain jurisdictions. Each Fund’s tax returns for open years have incorporated no uncertain tax positions that require a provision for income taxes.
K. Lending of Portfolio Securities
The Funds have entered into a securities lending agreement with State Street Bank & Trust Co. (“SSB”), the Funds’ lending agent. Each Fund may lend its portfolio securities only to borrowers that are approved by SSB. Each Fund will limit such lending to not more than 33 1/3% of the value of its total assets. The Fund’s securities held at SSB as custodian shall be available to be lent except those securities the Fund or ALPS Advisors, Inc. specifically identifies in writing as not being available for lending. The borrower pledges and maintains with the Fund collateral consisting of cash (U.S. Dollars only), securities issued or guaranteed by the U.S. government or its agencies or instrumentalities, and cash equivalents (including irrevocable bank letters of credit) issued by a person other than the borrower or an affiliate of the borrower. The initial collateral received by the Fund is required to have a value of no less than 102% of the market value of the loaned securities for U.S equity securities and a value of no less than 105% of the market value for non-U.S. equity securities. The collateral is maintained thereafter, at a market value equal to not less than 102% of the current value of the U.S. equity securities on loan and not less than 105% of the current value of the non-U.S. equity securities on loan. The market value of the loaned securities is determined at the close of each business day and any additional required collateral is delivered to the Fund on the next business day. During the term of the loan, each Fund is entitled to all distributions made on or in respect of the loaned securities. Loans of securities are terminable at any time and the borrower, after notice, is required to return borrowed securities within the customary time period for settlement of securities transactions.
Any cash collateral received is reinvested in a money market fund managed by SSB as disclosed in the Fund’s Schedule of Investments and is reflected in the Statements of Assets and Liabilities as a payable for collateral upon return of securities loaned. Non-cash collateral, in the form of securities issued or guaranteed by the U.S. government or its agencies or instrumentalities, is not disclosed in the Fund’s Statement of Assets and Liabilities as it is held by the lending agent on behalf of the Fund, and the Fund does not have the ability to re-hypothecate these securities. Income earned by the Fund from securities lending activity is disclosed in the Statement of Operations.
32 | May 31, 2020
| ALPS ETF Trust |
| Notes to Financial Statements | May 31, 2020 (Unaudited) |
The following is a summary of the Fund's securities lending agreement and related cash and non-cash collateral received as of May 31, 2020:
| Market Value of Securities on Loan | Cash Collateral Received | Non-Cash Collateral Received | Total Collateral Received | |||||||||||||
| ALPS International Sector Dividend Dogs ETF | $ | 4,088,139 | $ | 4,288,025 | $ | – | $ | 4,288,025 | ||||||||
| ALPS Emerging Sector Dividend Dogs ETF | $ | 513,799 | $ | 329,942 | $ | 219,836 | $ | 549,778 | ||||||||
| ALPS REIT Dividend Dogs ETF | $ | 362,321 | $ | 397,670 | $ | – | $ | 397,670 | ||||||||
The risks of securities lending include the risk that the borrower may not provide additional collateral when required or may not return the securities when due. To mitigate these risks, the Funds benefit from a borrower default indemnity provided by SSB. SSB’s indemnity allows for full replacement of securities lent wherein SSB will purchase the unreturned loaned securities on the open market by applying the proceeds of the collateral, or to the extent such proceeds are insufficient or the collateral is unavailable, SSB will purchase the unreturned loan securities at SSB’s expense. However, the Funds could suffer a loss if the value of the investments purchased with cash collateral falls below the value of the cash collateral received.
The following table reflects a breakdown of transactions accounted for as secured borrowings, the gross obligation by the type of collateral pledged or securities loaned, and the remaining contractual maturity of those transactions as of May 31, 2020:
| ALPS International Sector Dividend Dogs ETF | Remaining contractual maturity of the agreements |
| Securities Lending Transactions | Overnight & Continuous | Up to 30 days | 30-90 days | Greater than 90 days | Total | |||||||||||||||
| Common Stocks | $ | 4,288,025 | $ | – | $ | – | $ | – | $ | 4,288,025 | ||||||||||
| Total Borrowings | 4,288,025 | |||||||||||||||||||
| Gross amount of recognized liabilities for securities lending (collateral received) | $ | 4,288,025 | ||||||||||||||||||
| ALPS Emerging Sector Dividend Dogs ETF | Remaining contractual maturity of the agreements |
| Securities Lending Transactions | Overnight & Continuous | Up to 30 days | 30-90 days | Greater than 90 days | Total | |||||||||||||||
| Common Stocks | $ | 329,942 | $ | – | $ | – | $ | – | $ | 329,942 | ||||||||||
| Total Borrowings | 329,942 | |||||||||||||||||||
| Gross amount of recognized liabilities for securities lending (collateral received) | $ | 329,942 | ||||||||||||||||||
| ALPS REIT Dividend Dogs ETF | Remaining contractual maturity of the agreements |
| Securities Lending Transactions | Overnight & Continuous | Up to 30 days | 30-90 days | Greater than 90 days | Total | |||||||||||||||
| Common Stocks | $ | 397,670 | $ | – | $ | – | $ | – | $ | 397,670 | ||||||||||
| Total Borrowings | 397,670 | |||||||||||||||||||
| Gross amount of recognized liabilities for securities lending (collateral received) | $ | 397,670 | ||||||||||||||||||
3. INVESTMENT ADVISORY FEE AND OTHER AFFILIATED TRANSACTIONS
ALPS Advisors, Inc. (the “Adviser”) serves as the Funds’ investment adviser pursuant to an Investment Advisory Agreement with the Trust on behalf of each Fund (the “Advisory Agreement”). Pursuant to the Advisory Agreement, each Fund pays the Adviser an annual management fee for the services and facilities it provides, payable on a monthly basis as a percentage of the relevant Fund’s average daily net assets as set out below. From time to time, the Adviser may waive all or a portion of its fee.
| Fund | Advisory Fee |
| ALPS Sector Dividend Dogs ETF | 0.40% |
| ALPS International Sector Dividend Dogs ETF | 0.50% |
| ALPS Emerging Sector Dividend Dogs ETF | 0.60% |
| ALPS REIT Dividend Dogs ETF | 0.35%(a) |
| (a) | Prior to January 2, 2020, the Fund's Advisory Fee was 0.55%. |
33 | May 31, 2020
| ALPS ETF Trust |
| Notes to Financial Statements | May 31, 2020 (Unaudited) |
Out of the unitary management fee, the Adviser pays substantially all expenses of each Fund, including licensing fees to the Underlying Index provider, the cost of transfer agency, custody, fund administration, legal, audit, independent trustees and other services, except for interest expenses, distribution fees or expenses, brokerage expenses, taxes and extraordinary expenses not incurred in the ordinary course of each Fund's business. The Adviser’s unitary management fee is designed to pay substantially all of each Fund's expenses and to compensate the Adviser for providing services for each Fund.
ALPS Fund Services, Inc., an affiliate of the Adviser, is the administrator of the Funds.
Each Trustee who is not considered an “interested person” (as defined in the Investment Company Act of 1940, as amended (“1940 Act”)) (“Independent Trustees”) receives (1) a quarterly retainer of $5,000, (2) a per meeting fee for regularly scheduled meetings of $3,750, (3) $1,500 for any special meeting held outside of a regularly scheduled board meeting, and (4) reimbursement for all reasonable out-of-pocket expenses relating to attendance at meetings. Prior to January 1, 2020, a Trustee who is considered an “interested person” (as defined in the 1940 Act) (“Interested Trustee”) received no compensation or expense reimbursements from the Trust. Effective January 1, 2020 the Interested Trustee receives (1) a quarterly retainer of $5,000, (2) a per meeting fee of $3,750, (3) $1,500 for any special meeting held outside of a regularly scheduled board meeting, and (4) reimbursement for all reasonable out-of-pocket expenses relating to attendance at meetings. In addition, the Chairman of the Board and Chairman of the Audit Committee each receives a quarterly retainer of $2,000, in connection with their respective roles.
4. PURCHASES AND SALES OF SECURITIES
For the six months ended May 31, 2020, the cost of purchases and proceeds from sales of investment securities, excluding short-term investments and in-kind transactions, were as follows:
| Fund | Purchases | Sales | ||||||
| ALPS Sector Dividend Dogs ETF | $ | 651,933,408 | $ | 641,636,117 | ||||
| ALPS International Sector Dividend Dogs ETF | 115,321,916 | 117,743,852 | ||||||
| ALPS Emerging Sector Dividend Dogs ETF | 17,891,777 | 18,660,425 | ||||||
| ALPS REIT Dividend Dogs ETF | 49,659,810 | 46,111,338 | ||||||
For the six months ended May 31, 2020, the cost of in-kind purchases and proceeds from in-kind sales were as follows:
| Fund | Purchases | Sales | ||||||
| ALPS Sector Dividend Dogs ETF | $ | 144,604,626 | $ | 521,160,698 | ||||
| ALPS International Sector Dividend Dogs ETF | 2,731,643 | 40,553,628 | ||||||
| ALPS Emerging Sector Dividend Dogs ETF | 2,577,580 | 6,219,201 | ||||||
| ALPS REIT Dividend Dogs ETF | 16,123,209 | 29,494,450 | ||||||
For the six months ended May 31, 2020, the in-kind net realized gains/(losses) were as follows:
| Fund | Net Realized Gain/(Loss) | |||
| ALPS Sector Dividend Dogs ETF | $ | 30,505,545 | ||
| ALPS International Sector Dividend Dogs ETF | (3,002,461 | ) | ||
| ALPS Emerging Sector Dividend Dogs ETF | (549,034 | ) | ||
| ALPS REIT Dividend Dogs ETF | 7,441,911 | |||
Gains on in-kind transactions are not considered taxable for federal income tax purposes and losses on in-kind transactions are also not deductible for tax purposes.
34 | May 31, 2020
ALPS ETF Trust
| Notes to Financial Statements | May 31, 2020 (Unaudited) |
5. CAPITAL SHARE TRANSACTIONS
Shares are created and redeemed by each Fund only in Creation Unit size aggregations of 50,000 shares. Only broker-dealers or large institutional investors with creation and redemption agreements called Authorized Participants (“AP”) are permitted to purchase or redeem Creation Units from the Funds. Such transactions are generally permitted on an in-kind basis, with a balancing cash component to equate the transaction to the NAV per unit of each Fund on the transaction date. Cash may be substituted equivalent to the value of certain securities generally when they are not available in sufficient quantity for delivery, not eligible for trading by the AP or as a result of other market circumstances.
6. RELATED PARTY TRANSACTIONS
The ALPS Sector Dvidend Dogs ETF engaged in cross trades between other funds in the Trust during the six months ended May 31, 2020 pursuant to Rule 17a-7 under the 1940 Act. Cross trading is the buying or selling of portfolio securities between funds to which the Adviser serves as the investment adviser. The Board previously adopted procedures that apply to transactions between the Funds of the Trust pursuant to Rule 17a-7. These transactions related to cross trades during the period complied with the requirements set forth by Rule 17a-7 and the Trust’s procedures.
Transactions related to cross trades during the six months ended May 31, 2020, were as follows:
| Fund | Purchase cost paid | Sale proceeds received | Realized gain/(loss) on sales |
| ALPS Sector Dividend Dogs ETF | $172,601 | $223,115 | ($90,614) |
7. MARKET DISRUPTIONS RISK
The Funds are subject to investment and operational risks associated with financial, economic and other global market developments and disruptions, including the recent spread of an infectious respiratory illness caused by a novel strain of coronavirus (known as COVID-19), which can negatively impact the securities markets and cause each Fund to lose value.
The spread of COVID-19 has caused volatility, severe market dislocations and liquidity constraints in many markets, including markets for the securities each Fund holds, and may adversely affect each Fund’s investments and operations. The transmission of COVID-19 and efforts to contain its spread have resulted in travel restrictions and disruptions, closed international borders, enhanced health screenings at ports of entry and elsewhere, disruption of and delays in healthcare service preparation and delivery, quarantines, event and service cancellations or interruptions, disruptions to business operations and supply chains, and a reduction in consumer and business spending, as well as general concern and uncertainty that has negatively affected the economy. These disruptions have led to instability in the market place and the jobs market. The impact of COVID-19 could adversely affect the economies of many nations or the entire global economy, the financial well-being and performance of individual issuers, borrowers and sectors and the health of the markets generally in potentially significant and unforeseen ways.
The foregoing could lead to a significant economic downturn or recession, increased market volatility, a greater number of market closures, higher default rates and adverse effects on the values and liquidity of each Fund’s securities or other assets. Such impacts may adversely affect the performance of the Funds.
8. SUBSEQUENT EVENTS
Effective July 1, 2020, each Trustee will be compensated a quarterly retainer of $10,000, and a per meeting fee of $5,000.
35 | May 31, 2020
ALPS ETF Trust
| Additional Information | May 31, 2020 (Unaudited) |
PROXY VOTING POLICIES AND PROCEDURES
Information regarding how the Fund voted proxies relating to portfolio securities during the most recent 12-month period ended June 30 and a description of the Fund’s proxy voting policies and procedures used in determining how to vote for proxies are available without charge on the SEC’s website at www.sec.gov and upon request, by calling (toll-free) 1-866-675-2639.
PORTFOLIO HOLDINGS
The Fund files a complete schedule of portfolio holdings with the U.S. Securities and Exchange Commission (“SEC”) for the first and third quarters of each fiscal year on Form N-PORT within 60 days after the end of the period. Copies of the Fund’s Form N-PORT are available without a charge, upon request, by contacting the Fund at 1-855-838-9485 and on the SEC’s website at https://www.sec.gov.
TAX INFORMATION (UNAUDITED)
The Funds designate the following for federal income tax purposes for distributions made during the calendar year ended December 31, 2019:
| QDI | DRD | |
| ALPS Sector Dividend Dogs ETF | 100.00% | 98.67% |
| ALPS International Sector Dividend Dogs ETF | 79.04% | 0.00% |
| ALPS Emerging Sector Dividend Dogs ETF | 62.28% | 0.00% |
| ALPS REIT Dividend Dogs ETF | 30.00% | 0.00% |
In early 2020, if applicable, shareholders of record received this information for the distributions paid to them by the Funds during the calendar year 2019 via Form 1099. The Funds will notify shareholders in early 2021 of amounts paid to them by the Funds, if any, during the calendar year 2020.
LICENSING AGREEMENTS
ALPS Sector Dividend Dogs ETF, ALPS International Sector Dividend Dogs ETF, ALPS Emerging Sector Dividend Dogs ETF, and ALPS REIT Dividend Dogs ETF
The Funds are not sponsored, endorsed, sold or promoted by the Index Provider. The Index Provider makes no representation or warranty, express or implied, to the owners of each Fund or any member of the public regarding the advisability of investing in securities generally or in each Fund particularly or the ability of each Fund to track the performance of the physical commodities market. The Index Provider’s only relationship to the Adviser or each Fund is the licensing of certain service marks and trade names of the Index Provider and of each Underlying Index that is determined, composed and calculated by the Index Provider without regard to the Adviser or the Funds. The Index Provider has no obligation to take the needs of the Adviser or the Funds or the owners of each Fund into consideration in determining, composing or calculating each Underlying Index. The Index Provider is not responsible for and has not participated in the determination of the timing of, prices at, or quantities of each Fund to be issued or in the determination or calculation of the equation by which each Fund is to be converted into cash. The Index Provider has no obligation or liability in connection with the administration, marketing or trading of each Fund.
THE INDEX PROVIDER DOES NOT GUARANTEE THE ACCURACY AND/OR THE COMPLETENESS OF EACH UNDERLYING INDEX OR ANY DATA INCLUDED THEREIN AND THE INDEX PROVIDER SHALL HAVE NO LIABILITY FOR ANY ERRORS, OMISSIONS, OR INTERRUPTIONS THEREIN. THE INDEX PROVIDER MAKES NO WARRANTY, EXPRESS OR IMPLIED, AS TO RESULTS TO BE OBTAINED BY THE ADVISER, EACH FUND, OWNERS OF EACH FUND, OR ANY OTHER PERSON OR ENTITY FROM THE USE OF THE UNDERLYING INDEX OR ANY DATA INCLUDED THEREIN. THE INDEX PROVIDER MAKES NO EXPRESS OR IMPLIED WARRANTIES, AND EXPRESSLY DISCLAIMS ALL WARRANTIES OF MERCHANTABILITY OR FITNESS FOR A PARTICULAR PURPOSE OR USE WITH RESPECT TO EACH UNDERLYING INDEX OR ANY DATA INCLUDED THEREIN. WITHOUT LIMITING ANY OF THE FOREGOING, IN NO EVENT SHALL THE INDEX PROVIDER HAVE ANY LIABILITY FOR ANY SPECIAL, PUNITIVE, INDIRECT, OR CONSEQUENTIAL DAMAGES (INCLUDING LOST PROFITS), EVEN IF NOTIFIED OF THE POSSIBILITY OF SUCH DAMAGES.
36 | May 31, 2020
ALPS ETF Trust
| Additional Information | May 31, 2020 (Unaudited) |
The Funds are not sponsored, endorsed, sold or promoted by Standard & Poor’s, a division of The McGraw-Hill Companies, Inc. (“S&P”) or its third party licensors. Neither S&P nor its third party licensors make any representation or warranty, express or implied, to the owners of each Fund or any member of the public regarding the advisability of investing in securities generally or in each Fund particularly or the ability of each Underlying Index to track general stock market performance. S&P’s and its third party licensor’s only relationship to the Index Provider is the licensing of certain trademarks, service marks and trade names of S&P and/or its third party licensors and for the providing of calculation and maintenance services related to the Underlying Index. Neither S&P nor its third party licensors is responsible for and has not participated in the determination of the prices and amount of each Fund or the timing of the issuance or sale of each Fund or in the determination or calculation of the equation by which each Fund is to be converted into cash. S&P has no obligation or liability in connection with the administration, marketing or trading of each Fund.
NEITHER S&P, ITS AFFILIATES NOR THEIR THIRD PARTY LICENSORS GUARANTEE THE ADEQUACY, ACCURACY, TIMELINESS OR COMPLETENESS OF EACH UNDERLYING INDEX OR ANY DATA INCLUDED THEREIN OR ANY COMMUNICATIONS, INCLUDING BUT NOT LIMITED TO, ORAL OR WRITTEN COMMUNICATIONS (INCLUDING ELECTRONIC COMMUNICATIONS) WITH RESPECT THERETO. S&P, ITS AFFILIATES AND THEIR THIRD PARTY LICENSORS SHALL NOT BE SUBJECT TO ANY DAMAGES OR LIABILITY FOR ANY ERRORS, OMISSIONS OR DELAYS THEREIN. S&P MAKES NO EXPRESS OR IMPLIED WARRANTIES, AND EXPRESSLY DISCLAIMS ALL WARRANTIES OF MERCHANTABILITY OR FITNESS FOR A PARTICULAR PURPOSE OR USE WITH RESPECT TO ITS TRADEMARKS, EACH UNDERLYING INDEX OR ANY DATA INCLUDED THEREIN. WITHOUT LIMITING ANY OF THE FOREGOING, IN NO EVENT WHATSOEVER SHALL S&P, ITS AFFILIATES OR THEIR THIRD PARTY LICENSORS BE LIABLE FOR ANY INDIRECT, SPECIAL, INCIDENTAL, PUNITIVE OR CONSEQUENTIAL DAMAGES, INCLUDING BUT NOT LIMITED TO, LOSS OF PROFITS, TRADING LOSSES, LOST TIME OR GOODWILL, EVEN IF THEY HAVE BEEN ADVISED OF THE POSSIBILITY OF SUCH DAMAGES, WHETHER IN CONTRACT, TORT, STRICT LIABILITY OR OTHERWISE.
Standard & Poor’s® and S&P® are registered trademarks of The McGraw-Hill Companies, Inc.; “Calculated by S&P Custom Indices” and its related stylized mark are service marks of The McGraw-Hill Companies, Inc. These marks have been licensed for use by the Index Provider.
The S&P 500® is the property of Standard and Poor’s Financial Services LLC (“S&P”) and has been licensed by S&P for use by S-Network® Global Indexes, Inc. in connection with the S-Network® Sector Dividend Dogs Index (Ticker: SDOGX), the S-Network® International Sector Dividend Dogs Index (Ticker: IDOGX), the S-Network® Emerging Sector Dividend Dogs Index (Ticker: EDOGX), and the S-Network® REIT Dividend Dogs Index (Ticker: RDOGX).
The Adviser does not guarantee the accuracy and/or the completeness of each Underlying Index or any data included therein, and the Adviser shall have no liability for any errors, omissions or interruptions therein. The Adviser makes no warranty, express or implied, as to results to be obtained by each Fund, owners of the Shares of each Fund or any other person or entity from the use of each Underlying Index or any data included therein. The Adviser makes no express or implied warranties, and expressly disclaims all warranties of merchantability or fitness for a particular purpose or use with respect to each Underlying Index or any data included therein. Without limiting any of the foregoing, in no event shall the Adviser have any liability for any special, punitive, direct, indirect or consequential damages (including lost profits) arising out of matters relating to the use of each Underlying Index, even if notified of the possibility of such damages.
37 | May 31, 2020
ALPS ETF Trust
| Liquidity Risk Management Program | May 31, 2020 (Unaudited) |
In compliance with the Securities and Exchange Commission’s liquidity risk management rule (the “Liquidity Rule”), the ALPS ETF Trust (the “Trust”) has established a liquidity risk management program (the “Program”) to govern the Trust’s approach to managing liquidity risk for each series of the Trust (each a “Fund”). The Program is overseen by the Liquidity Committee (the “Committee”), a committee comprised of representatives of the Trust’s investment adviser, ALPS Advisors, Inc. The Trust’s Board of Trustees (the “Board”) has approved the designation of the Committee to oversee the Program.
The Program’s principal objectives include supporting each Fund’s compliance with limits on investments in illiquid assets and assessing and managing the risk that a Fund will be unable to meet its redemption obligations without significant dilution of remaining investors’ interests in the Fund. The Program includes a number of elements that support the management and assessment of liquidity risk, including an annual assessment of factors that influence a Fund’s liquidity and, for Funds that are not “In-Kind ETFs,” the periodic classification and re-classification of such Fund’s investments into groupings that reflect the Committee’s assessment of their liquidity under current market conditions.
At a meeting of the Board held on March 2, 2020, the Trustees received a report from the Committee regarding the design and operational effectiveness of the Program since its implementation on December 1, 2018. The Committee determined, and reported to the Board, that the Program has been operating effectively to assess and manage each Fund’s liquidity risk and has been and continues to be adequately and effectively implemented to monitor and (as applicable) respond to the Funds’ liquidity developments.
The Committee reported that during the period covered by the report, there were no liquidity events that impacted the Funds or their ability to timely meet redemptions without dilution to existing shareholders. Among other things, the Committee’s report noted that no Fund is required to have a highly liquid investment minimum based either on its status as an In-Kind ETF or on its ability to rely on another exemption under the Liquidity Rule. The Committee’s report further noted that no material changes have been made to the Program since its implementation.
38 | May 31, 2020
ALPS ETF Trust
| Board Considerations Regarding Approval of Investment Advisory Agreements | May 31, 2020 (Unaudited) |
At an in-person meeting held on December 9, 2019 (the “Meeting”), the Board of Trustees of the Trust (the “Board” or the “Trustees”), including the Trustees who are not “interested persons” of the Trust within the meaning of the Investment Company Act of 1940, as amended (the “Independent Trustees”), evaluated a proposal to approve an amendment to the Investment Advisory Agreement between the Trust and ALPS Advisors, Inc. (the “Adviser” or “AAI”) with respect to the ALPS REIT Dividend Dogs ETF (the "Fund"). The Independent Trustees also met separately to consider the amendment to the Advisory Agreement.
In evaluating the amendment to the Investment Advisory Agreement with respect to the Fund, the Independent Trustees considered various factors, including (i) the nature, extent and quality of the services to be provided by AAI with respect to the Fund under the amended Advisory Agreement; (ii) the advisory fees and other expenses to be paid by the Fund compared to those of similar funds managed by other investment advisers; (iii) the costs of the services provided to the Fund by AAI and the profits realized by AAI and its affiliates from its relationship to the Fund; (iv) the extent to which economies of scale have been or would be realized if and as the assets of the Fund grow and whether fees reflect the economies of scale for the benefit of shareholders; and (v) any additional benefits and other considerations. In doing so, the Independent Trustees considered the materials presented to the Board at the Meeting, as well as related materials presented at the Board’s October 28, 2019 meeting and the materials presented at the June 2019 meeting in connection with the most recent renewal of the Fund’s Advisory Agreement.
With respect to the nature, extent and quality of the services to be provided by AAI under the amended Advisory Agreement, the Independent Trustees considered and reviewed information concerning the services to be provided under the amended Advisory Agreement, the investment parameters of the Fund’s new underlying index, financial information regarding AAI and its parent company, information describing AAI’s current organization and the background and experience of the persons responsible for the day-to-day management of the Fund. The Independent Trustees noted that the amended Advisory Agreement was identical to the Advisory Agreement currently in place for the Fund other than with respect to the reduced advisory fee.
The Independent Trustees considered information recently received on the performance of the Fund and its benchmark. Based on their review, the Independent Trustees found that the nature and extent of services provided to the Fund under the amended Advisory Agreement was appropriate, that the quality was satisfactory, and that there will be no diminution in the nature or level of services provided to the Fund.
The Independent Trustees noted that the advisory fees for the Fund were unitary fees pursuant to which AAI assumes all expenses of the Fund (including the cost of transfer agency, custody, fund administration, legal, audit and other services) other than the payments under the Advisory Agreement, brokerage expenses, taxes, interest, litigation expenses and other extraordinary expenses.
With respect to the proposed advisory fee rate, the Independent Trustees noted the following:
The gross management fee rate for the Fund is lower than the median of its FUSE expense group. The Fund’s net expense ratio is also lower than the median of its FUSE expense group.
Based on the foregoing, and the other information available to them, the Independent Trustees concluded that the proposed advisory fee rate for the Fund was reasonable under the circumstances and in light of the quality of the services to be provided.
The Independent Trustees considered other benefits available to AAI because of its relationship with the Fund and concluded that the proposed advisory fees were reasonable taking into account any such benefits.
The Independent Trustees also considered with respect to the Fund the information provided by AAI about the costs and profitability of AAI with respect to the Fund. The Independent Trustees noted the relatively small size of the Fund and concluded that AAI was not realizing any economies of scale. The Independent Trustees determined that AAI should continue to keep the Board informed on an ongoing basis of any significant developments (e.g., material increases in asset levels) so as to facilitate the Independent Trustees’ evaluation of whether further economies of scale have been achieved.
In voting to approve the amendment to the Advisory Agreement, the Independent Trustees concluded that the terms of the Advisory Agreement are reasonable and fair in light of the services to be performed, the fees paid by certain other funds, expenses to be incurred and such other matters as the Independent Trustees considered relevant in the exercise of their reasonable business judgment. The Independent Trustees did not identify any single factor or group of factors as all important or controlling and considered all factors together.
39 | May 31, 2020


TABLE OF CONTENTS
| Performance Overview | 1 |
| Disclosure of Fund Expenses | 3 |
| Schedule of Investments | 4 |
| Statement of Assets and Liabilities | 9 |
| Statement of Operations | 10 |
| Statements of Changes in Net Assets | 11 |
| Financial Highlights | 12 |
| Notes to Financial Statements | 13 |
| Additional Information | 19 |
| Liquidity Risk Management Program | 21 |
Beginning on January 1, 2021, as permitted by regulations adopted by the U.S. Securities and Exchange Commission, paper copies of the Fund’s annual and semi-annual shareholder reports will no longer be sent by mail, unless you specifically request paper copies of the reports from your financial intermediary (such as a broker-dealer or bank). Instead, the reports will be made available on the Fund’s website (www.alpsfunds.com), and you will be notified by mail each time a report is posted and provided with a website link to access the report.
If you already elected to receive shareholder reports electronically, you will not be affected by this change and you need not take any action. You may elect to receive shareholder reports and other communications from the Fund electronically anytime by contacting your financial intermediary.
You may elect to receive all future reports in paper free of charge. You can contact your financial intermediary to request that you continue to receive paper copies of your shareholder reports. Your election to receive reports in paper will apply to all funds held in your account with your financial intermediary.
| Barron’s 400SM ETF |
| Performance Overview | May 31, 2020 (Unaudited) |
Investment Objective
The Barron’s 400SM ETF (the “Fund” or “BFOR”) seeks investment results that correspond generally, before fees and expenses, to the performance of the Barron’s 400 IndexSM (the “Underlying Index”). The Underlying Index is a rules-based index intended to give investors a means of tracking the overall performance of high performing equity securities of U.S. companies. The Fund will invest at least 80% of its total assets in the equity securities which comprise the Underlying Index.
The Underlying Index generally consists of 400 stocks. The Underlying Index’s stocks are constituents of the MarketGrader U.S. Coverage Universe. In compiling the Underlying Index, MarketGrader Capital, LLC (the “Index Provider”) selects the 400 stocks from the MarketGrader U.S. Coverage Universe by using a methodology that selects components based on the strength of their fundamentals in growth, value, profitability and cash flow and then screens such potential Underlying Index components for certain criteria regarding concentration, market capitalization, and liquidity. The eligible stocks that are selected for inclusion in the Underlying Index’s portfolio are equally weighted. The Underlying Index is rebalanced by the Index Provider semiannually, on the third Friday of March and September each year.
Performance (as of May 31, 2020)
| 6 Months | 1 Year | 5 Year | Since Inception^ | |
| Barron’s 400SM ETF – NAV | -7.31% | 3.80% | 3.86% | 7.17% |
| Barron’s 400SM ETF – Market Price* | -7.36% | 3.86% | 3.83% | 7.17% |
| Barron’s 400 IndexSM | -6.99% | 4.55% | 4.52% | 7.88% |
Total Expense Ratio (per the current prospectus) is 0.65%
Performance data quoted represents past performance. Past performance does not guarantee future results. Total return figures assume reinvestment of dividends and capital gains distributions, if any. The table does not reflect the deduction of taxes that a shareholder would pay on Fund distributions or the redemption of Fund shares. Investment return and principal value of an investment will fluctuate so that an investor’s shares, when sold or redeemed, may be worth more or less than the original cost. Current performance data may be higher or lower than actual data quoted. For the most current month-end performance data please visit www.alpsfunds.com or call 1.855.724.0450.
NAV is an exchange-traded fund’s per-share value. The per-share dollar amount of the Fund is derived by dividing the total value of all the securities in its portfolio, less any liabilities, by the number of Fund shares outstanding. Market Price is the price at which a share can currently be traded in the market. Information detailing the number of days the Market Price of the Fund was greater than the Fund’s NAV and the number of days it was less than the Fund’s NAV can be obtained at www.alpsfunds.com.
| ^ | The Fund commenced Investment Operations on June 4, 2013. |
| * | Market Price is based on the midpoint of the bid/ask spread at 4 p.m. ET and does not represent the returns an investor would receive if shares were traded at other times. |
The Barron’s 400 IndexSM, calculated by NYSE Arca or its affiliates, measures the performance of a diversified group of U.S. companies selected in part based on fundamentals-related rules-based criteria. The index includes companies that have scored highest according to fundamentals-related rankings calculated by MarketGrader Capital, LLC. Additional rules-based screening provides for sector and market cap diversification. The Underlying Index has been licensed by MarketGrader for use with the Barron’s 400SM ETF.
The index is not actively managed and does not reflect any deductions for fees, expenses or taxes. One cannot invest directly in an index. Index performance does not reflect Fund performance.
Funds that emphasize investments in small/mid cap companies will generally experience greater price volatility.
Barron’s 400SM ETF shares are not individually redeemable. Investors buy and sell shares of the Barron’s 400SM ETF on a secondary market. Only market makers or “authorized participants” may trade directly with the Fund, typically in blocks of 50,000 shares.
The Barron’s 400SM ETF is not suitable for all investors. Investments in the Fund are subject to investment risks, including possible loss of the principal amount invested.
ALPS Portfolio Solutions Distributor, Inc., a FINRA member, is the distributor for the Fund.
| 1 | May 31, 2020 |
| Barron’s 400SM ETF |
| Performance Overview | May 31, 2020 (Unaudited) |
Top 10 Holdings* (as of May 31, 2020)
| ACM Research, Inc. | 0.48% |
| ProPetro Holding Corp. | 0.48% |
| Williams-Sonoma, Inc. | 0.46% |
| Raytheon Technologies Corp. | 0.45% |
| MarineMax, Inc. | 0.40% |
| Century Communities, Inc. | 0.40% |
| Meritage Homes Corp. | 0.40% |
| iRobot Corp. | 0.39% |
| Enphase Energy, Inc. | 0.38% |
| Crocs, Inc. | 0.38% |
| Total % of Top 10 Holdings | 4.22% |
| * | % of Total Investments (excluding investments purchased with collateral from securities loaned). |
Future holdings are subject to change.
Sector Allocation* (as of May 31, 2020)
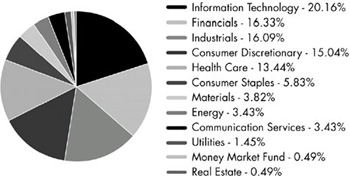
Growth of $10,000 (as of May 31, 2020)
Comparison of change in value of a $10,000 investment in the Fund and the Underlying Index
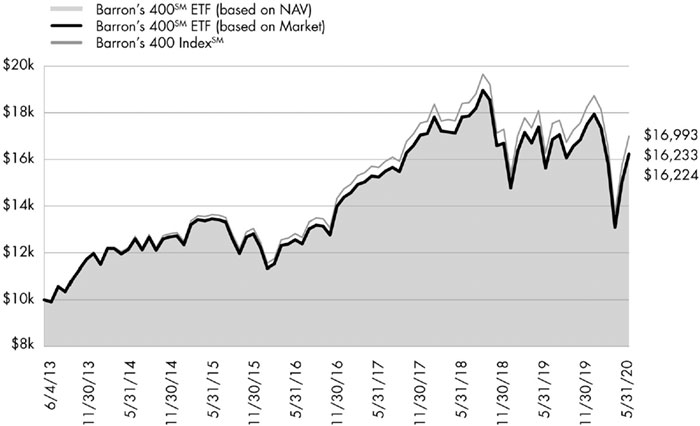
The chart above compares historical performance of a hypothetical investment of $10,000 in the Fund since inception with the performance of the Fund’s benchmark index. Past performance does not guarantee future results. The chart does not reflect the deduction of taxes that a shareholder would pay on Fund distributions or the redemption of Fund shares.
| 2 | May 31, 2020 |
| Barron’s 400SM ETF |
| Disclosure of Fund Expenses | May 31, 2020 (Unaudited) |
Shareholder Expense Example: As a shareholder of the Fund, you incur two types of costs: (1) transaction costs which may include creation and redemption fees or brokerage charges, and (2) ongoing costs, including management fees and other Fund expenses. These examples are intended to help you understand your ongoing costs (in dollars) of investing in the Fund and to compare these costs with the ongoing costs of investing in other funds. It is based on an investment of $1,000 invested at the beginning of the (six month) period and held through May 31, 2020.
Actual Return: The first line of the table provides information about actual account values and actual expenses. You may use the information in this line, together with the amount you invested, to estimate the expenses that you incurred over the period. Simply divide your account value by $1,000 (for example, an $8,600 account value divided by $1,000 = 8.6), then multiply the result by the number in the first line under the heading entitled “Expenses Paid During Period” to estimate the expenses attributable to your investment during this period.
Hypothetical 5% Return: The second line of the table provides information about hypothetical account values and hypothetical expenses based on the Fund’s actual expense ratio and an assumed rate of return of 5% per year before expenses, which is not the Fund’s actual return. The hypothetical account values and expenses may not be used to estimate the actual ending account balance or expenses you paid for the period. You may use this information to compare ongoing costs of investing in the Fund and other funds. To do so, compare this 5% hypothetical example with the 5% hypothetical examples that appear in the shareholder reports of other funds.
The expenses shown in the table are meant to highlight ongoing Fund costs only and do not reflect any transaction costs, such as creation and redemption fees or brokerage charges. Therefore, the second line is useful in comparing ongoing costs only, and will not help you determine the relative total costs of owning different funds. In addition, if these costs were included, your costs would have been higher.
| Beginning Account Value 12/1/19 | Ending Account Value 5/31/20 | Expense Ratio(a) | Expenses Paid During Period 12/1/19 - 5/31/20(b) | |
| Barron's 400 ETF | ||||
| Actual | $1,000.00 | $926.90 | 0.65% | $3.13 |
| Hypothetical (5% return before expenses) | $1,000.00 | $1,021.75 | 0.65% | $3.29 |
| (a) | Annualized, based on the Fund's most recent fiscal half year expenses. |
| (b) | Expenses are equal to the Fund's annualized expense ratio multiplied by the average account value over the period, multiplied by the number of days in the most recent fiscal half year (183), divided by 366. |
| 3 | May 31, 2020 |
| Barron’s 400SM ETF |
| Schedule of Investments | May 31, 2020 (Unaudited) |
| Security Description | Shares | Value | ||||||
| COMMON STOCKS (96.74%) | ||||||||
| Communication Services (3.43%) | ||||||||
| Activision Blizzard, Inc. | 3,667 | $ | 263,951 | |||||
| Alphabet, Inc., Class A(a) | 183 | 262,334 | ||||||
| Electronic Arts, Inc.(a) | 2,162 | 265,667 | ||||||
| Facebook, Inc., Class A(a) | 1,379 | 310,399 | ||||||
| Fox Corp., Class A | 8,198 | 239,136 | ||||||
| Gray Television, Inc.(a)(b) | 18,616 | 259,507 | ||||||
| Interpublic Group of Cos., Inc. | 13,068 | 223,593 | ||||||
| Match Group, Inc.(a)(b) | 3,610 | 321,434 | ||||||
| Netflix, Inc.(a) | 641 | 269,047 | ||||||
| New York Times Co., Class A(b) | 6,318 | 247,855 | ||||||
| The Meet Group, Inc.(a) | 39,178 | 242,120 | ||||||
| T-Mobile US, Inc.(a) | 2,628 | 262,905 | ||||||
| Twitter, Inc.(a) | 8,418 | 260,705 | ||||||
| Verizon Communications, Inc. | 3,794 | 217,700 | ||||||
| Total Communication Services | 3,646,353 | |||||||
| Consumer Discretionary (15.03%) | ||||||||
| Amazon.com, Inc.(a) | 112 | 273,545 | ||||||
| America's Car-Mart, Inc.(a) | 3,466 | 275,790 | ||||||
| AutoZone, Inc.(a) | 226 | 259,416 | ||||||
| Best Buy Co., Inc. | 3,417 | 266,834 | ||||||
| Buckle, Inc.(b) | 13,365 | 188,179 | ||||||
| Burlington Stores, Inc.(a) | 1,476 | 309,473 | ||||||
| Cavco Industries, Inc.(a) | 1,678 | 319,139 | ||||||
| Century Communities, Inc.(a) | 14,260 | 421,240 | ||||||
| Chipotle Mexican Grill, Inc.(a) | 386 | 387,509 | ||||||
| Crocs, Inc.(a) | 14,290 | 409,409 | ||||||
| Deckers Outdoor Corp.(a) | 1,860 | 339,506 | ||||||
| Dollar General Corp. | 1,335 | 255,666 | ||||||
| Domino's Pizza, Inc. | 684 | 263,915 | ||||||
| DR Horton, Inc. | 6,598 | 364,869 | ||||||
| Floor & Decor Holdings, Inc., Class A(a) | 6,575 | 341,900 | ||||||
| Fox Factory Holding Corp.(a) | 4,045 | 291,685 | ||||||
| Gentex Corp. | 8,838 | 233,677 | ||||||
| Helen of Troy, Ltd.(a) | 1,762 | 320,543 | ||||||
| Hyatt Hotels Corp., Class A(b) | 4,566 | 251,541 | ||||||
| Installed Building Products, Inc.(a) | 5,632 | 362,025 | ||||||
| iRobot Corp.(a)(b) | 5,572 | 410,768 | ||||||
| Johnson Outdoors, Inc., Class A | 3,546 | 275,205 | ||||||
| Lennar Corp., Class B | 8,004 | 359,220 | ||||||
| Levi Strauss & Co. | 14,847 | 200,286 | ||||||
| LGI Homes, Inc.(a) | 4,765 | 397,496 | ||||||
| Lowe's Cos., Inc. | 2,791 | 363,807 | ||||||
| Malibu Boats, Inc., Class A(a) | 7,400 | 348,762 | ||||||
| MarineMax, Inc.(a) | 22,399 | 426,253 | ||||||
| McDonald's Corp. | 1,370 | 255,258 | ||||||
| Meritage Homes Corp.(a) | 6,059 | 421,101 | ||||||
| NIKE, Inc., Class B | 2,946 | 290,417 | ||||||
| NVR, Inc.(a) | 87 | 280,280 | ||||||
| Perdoceo Education Corp.(a) | 21,381 | 348,083 | ||||||
| Polaris, Inc. | 3,772 | 329,446 | ||||||
| Pool Corp. | 1,134 | 305,069 | ||||||
| PulteGroup, Inc. | 8,927 | 303,250 | ||||||
| Ralph Lauren Corp. | 2,802 | 211,579 | ||||||
| Security Description | Shares | Value | ||||||
| Consumer Discretionary (continued) | ||||||||
| Ross Stores, Inc. | 2,961 | $ | 287,099 | |||||
| Skechers U.S.A., Inc., Class A(a) | 9,997 | 313,106 | ||||||
| Standard Motor Products, Inc. | 5,044 | 214,622 | ||||||
| Strategic Education, Inc. | 1,658 | 281,247 | ||||||
| Target Corp. | 1,990 | 243,437 | ||||||
| Tempur Sealy International, Inc.(a) | 6,163 | 402,012 | ||||||
| Texas Roadhouse, Inc. | 5,865 | 304,100 | ||||||
| Tiffany & Co. | 1,751 | 224,356 | ||||||
| TJX Cos., Inc. | 4,849 | 255,833 | ||||||
| TopBuild Corp.(a) | 3,234 | 370,907 | ||||||
| Ulta Beauty, Inc.(a) | 1,335 | 325,753 | ||||||
| Williams-Sonoma, Inc.(b) | 5,878 | 489,108 | ||||||
| YETI Holdings, Inc.(a) | 10,374 | 333,005 | ||||||
| Zumiez, Inc.(a) | 11,859 | 289,004 | ||||||
| Total Consumer Discretionary | 15,995,730 | |||||||
| Consumer Staples (5.18%) | ||||||||
| Boston Beer Co., Inc., Class A(a) | 590 | 333,191 | ||||||
| Brown-Forman Corp., Class B | 3,551 | 234,117 | ||||||
| Church & Dwight Co., Inc. | 2,995 | 224,835 | ||||||
| Clorox Co. | 1,040 | 214,500 | ||||||
| Coca-Cola Co. | 4,370 | 203,992 | ||||||
| Colgate-Palmolive Co. | 2,939 | 212,578 | ||||||
| Conagra Brands, Inc. | 6,913 | 240,503 | ||||||
| Costco Wholesale Corp. | 672 | 207,292 | ||||||
| Estee Lauder Cos., Inc., Class A | 1,314 | 259,476 | ||||||
| General Mills, Inc. | 3,452 | 217,614 | ||||||
| Hershey Co. | 1,480 | 200,806 | ||||||
| Hormel Foods Corp. | 4,247 | 207,381 | ||||||
| Ingredion, Inc. | 2,914 | 245,446 | ||||||
| John B Sanfilippo & Son, Inc. | 2,699 | 234,651 | ||||||
| Lamb Weston Holdings, Inc. | 3,880 | 233,033 | ||||||
| Mondelez International, Inc., Class A | 4,218 | 219,842 | ||||||
| Monster Beverage Corp.(a) | 3,446 | 247,802 | ||||||
| PepsiCo, Inc. | 1,616 | 212,585 | ||||||
| Philip Morris International, Inc. | 2,782 | 204,087 | ||||||
| Sprouts Farmers Market, Inc.(a) | 10,885 | 273,540 | ||||||
| Sysco Corp. | 5,877 | 324,175 | ||||||
| USANA Health Sciences, Inc.(a) | 4,120 | 349,046 | ||||||
| Wal-Mart Stores, Inc. | 1,732 | 214,872 | ||||||
| Total Consumer Staples | 5,515,364 | |||||||
| Energy (0.97%) | ||||||||
| Cabot Oil & Gas Corp. | 10,797 | 214,213 | ||||||
| ProPetro Holding Corp.(a) | 102,528 | 507,514 | ||||||
| Renewable Energy Group, Inc.(a) | 10,864 | 309,081 | ||||||
| Total Energy | 1,030,808 | |||||||
| Financials (16.08%) | ||||||||
| Allstate Corp. | 2,339 | 228,778 | ||||||
| Ally Financial, Inc. | 12,825 | 223,668 | ||||||
| American Equity Investment Life Holding Co. | 13,302 | 288,520 | ||||||
| American Express Co. | 2,383 | 226,552 | ||||||
| American Financial Group, Inc. | 3,386 | 203,973 | ||||||
| 4 | May 31, 2020 |
| Barron’s 400SM ETF |
| Schedule of Investments | May 31, 2020 (Unaudited) |
| Security Description | Shares | Value | ||||||
| Financials (continued) | ||||||||
| Apollo Global Management, Inc., Class A | 6,606 | $ | 314,446 | |||||
| Arch Capital Group, Ltd.(a) | 6,819 | 192,432 | ||||||
| Artisan Partners Asset Management, Inc., Class A | 10,215 | 295,929 | ||||||
| Athene Holding, Ltd., Class A(a) | 10,374 | 299,705 | ||||||
| BancorpSouth Bank | 9,767 | 217,120 | ||||||
| Bank of America Corp. | 9,304 | 224,413 | ||||||
| Bank of Hawaii Corp. | 3,091 | 198,844 | ||||||
| Bank of NT Butterfield & Son, Ltd. | 10,778 | 263,307 | ||||||
| Blackstone Group, Inc. | 4,973 | 282,466 | ||||||
| Camden National Corp. | 5,979 | 200,536 | ||||||
| Capital One Financial Corp. | 3,822 | 260,049 | ||||||
| Central Pacific Financial Corp. | 11,731 | 188,986 | ||||||
| Cincinnati Financial Corp. | 2,426 | 143,013 | ||||||
| Citigroup, Inc. | 5,120 | 245,299 | ||||||
| Citizens Financial Group, Inc. | 10,784 | 259,894 | ||||||
| Cohen & Steers, Inc. | 4,175 | 265,321 | ||||||
| Columbia Banking System, Inc. | 7,093 | 172,785 | ||||||
| Commerce Bancshares, Inc. | 3,382 | 215,535 | ||||||
| Community Bank System, Inc. | 3,512 | 208,683 | ||||||
| Eaton Vance Corp. | 7,128 | 256,964 | ||||||
| Evercore, Inc., Class A | 4,883 | 269,102 | ||||||
| FactSet Research Systems, Inc. | 837 | 257,386 | ||||||
| FB Financial Corp. | 10,510 | 248,141 | ||||||
| Federal Agricultural Mortgage Corp., Class C | 3,693 | 236,832 | ||||||
| Federated Hermes, Inc. | 11,307 | 250,337 | ||||||
| FGL Holdings | 20,856 | 173,939 | ||||||
| First Commonwealth Financial Corp. | 21,603 | 176,713 | ||||||
| First Horizon National Corp. | 23,258 | 217,462 | ||||||
| Flagstar Bancorp, Inc. | 7,956 | 233,111 | ||||||
| Fulton Financial Corp. | 15,022 | 168,397 | ||||||
| Gladstone Capital Corp. | 33,078 | 231,877 | ||||||
| Hamilton Lane, Inc., Class A | 3,996 | 292,387 | ||||||
| Heartland Financial USA, Inc. | 6,327 | 202,527 | ||||||
| Hercules Capital, Inc. | 24,682 | 274,957 | ||||||
| Hilltop Holdings, Inc. | 12,797 | 239,176 | ||||||
| Houlihan Lokey, Inc. | 4,022 | 243,251 | ||||||
| Independent Bank Corp. | 13,775 | 190,371 | ||||||
| Investors Bancorp, Inc. | 25,759 | 223,588 | ||||||
| JPMorgan Chase & Co. | 2,198 | 213,887 | ||||||
| KeyCorp | 20,123 | 238,458 | ||||||
| Kinsale Capital Group, Inc. | 2,107 | 314,617 | ||||||
| Markel Corp.(a) | 235 | 210,894 | ||||||
| Meta Financial Group, Inc. | 10,244 | 185,621 | ||||||
| Moody's Corp. | 1,015 | 271,421 | ||||||
| National Bank Holdings Corp., Class A | 8,310 | 218,553 | ||||||
| Nicolet Bankshares, Inc.(a) | 3,348 | 187,187 | ||||||
| Old National Bancorp | 13,639 | 185,354 | ||||||
| Old Republic International Corp. | 12,309 | 191,897 | ||||||
| OneMain Holdings, Inc. | 9,631 | 224,691 | ||||||
| PennyMac Financial Services, Inc., Class A | 8,427 | 282,979 | ||||||
| Security Description | Shares | Value | ||||||
| Financials (continued) | ||||||||
| PJT Partners, Inc., Class A | 6,790 | $ | 371,345 | |||||
| Preferred Bank | 6,071 | 228,087 | ||||||
| Prosperity Bancshares, Inc. | 3,629 | 237,300 | ||||||
| RenaissanceRe Holdings, Ltd. | 1,434 | 240,711 | ||||||
| S&P Global, Inc. | 909 | 295,443 | ||||||
| Saratoga Investment Corp.(b) | 18,401 | 279,327 | ||||||
| SEI Investments Co. | 4,551 | 246,755 | ||||||
| ServisFirst Bancshares, Inc. | 7,070 | 246,602 | ||||||
| Signature Bank/New York NY | 2,190 | 225,373 | ||||||
| SLM Corp. | 30,713 | 232,805 | ||||||
| T Rowe Price Group, Inc. | 1,903 | 230,073 | ||||||
| Tompkins Financial Corp. | 2,722 | 175,161 | ||||||
| Towne Bank | 9,713 | 183,187 | ||||||
| Unum Group | 15,332 | 232,280 | ||||||
| Victory Capital Holdings, Inc., Class A | 15,086 | 252,087 | ||||||
| Washington Federal, Inc. | 7,114 | 183,968 | ||||||
| Westamerica BanCorp | 3,410 | 201,122 | ||||||
| Western Alliance Bancorp | 7,996 | 305,047 | ||||||
| Total Financials | 17,099,004 | |||||||
| Health Care (14.07%) | ||||||||
| Abbott Laboratories | 2,593 | 246,128 | ||||||
| AbbVie, Inc. | 2,824 | 261,700 | ||||||
| Agilent Technologies, Inc. | 2,927 | 257,986 | ||||||
| Align Technology, Inc.(a) | 1,218 | 299,165 | ||||||
| Amedisys, Inc.(a) | 1,346 | 258,499 | ||||||
| Amgen, Inc. | 991 | 227,633 | ||||||
| Anthem, Inc. | 861 | 253,229 | ||||||
| Baxter International, Inc. | 2,555 | 229,976 | ||||||
| Biogen, Inc.(a) | 662 | 203,294 | ||||||
| BioMarin Pharmaceutical, Inc.(a) | 2,667 | 284,169 | ||||||
| Bio-Rad Laboratories, Inc.(a) | 569 | 279,561 | ||||||
| BioSpecifics Technologies Corp.(a) | 4,139 | 257,446 | ||||||
| Boston Scientific Corp.(a) | 7,159 | 271,970 | ||||||
| Bristol-Myers Squibb Co. | 3,812 | 227,653 | ||||||
| Bruker Corp. | 5,882 | 254,573 | ||||||
| Charles River Laboratories International, Inc.(a) | 1,805 | 324,286 | ||||||
| Chemed Corp. | 570 | 272,751 | ||||||
| Cigna Corp. | 1,330 | 262,436 | ||||||
| Coherus Biosciences, Inc.(a)(b) | 15,389 | 286,851 | ||||||
| Cooper Cos, Inc. | 745 | 236,150 | ||||||
| CVS Health Corp. | 3,548 | 232,642 | ||||||
| DaVita, Inc.(a) | 2,742 | 221,992 | ||||||
| DexCom, Inc.(a) | 1,036 | 391,929 | ||||||
| Edwards Lifesciences Corp.(a) | 1,170 | 262,922 | ||||||
| Eli Lilly & Co. | 1,440 | 220,248 | ||||||
| Encompass Health Corp. | 3,677 | 269,340 | ||||||
| Gilead Sciences, Inc. | 2,768 | 215,433 | ||||||
| Globus Medical, Inc., Class A(a) | 5,146 | 281,229 | ||||||
| Haemonetics Corp.(a) | 2,470 | 270,910 | ||||||
| HCA Healthcare, Inc. | 2,664 | 284,782 | ||||||
| Hologic, Inc.(a) | 6,549 | 347,097 | ||||||
| Humana, Inc. | 753 | 309,219 | ||||||
| IDEXX Laboratories, Inc.(a) | 958 | 295,907 | ||||||
| 5 | May 31, 2020 |
| Barron’s 400SM ETF |
| Schedule of Investments | May 31, 2020 (Unaudited) |
| Security Description | Shares | Value | ||||||
| Health Care (continued) | ||||||||
| Innoviva, Inc.(a) | 20,835 | $ | 291,065 | |||||
| Intuitive Surgical, Inc.(a) | 481 | 278,994 | ||||||
| Johnson & Johnson | 1,478 | 219,853 | ||||||
| Laboratory Corp. of America Holdings(a) | 1,657 | 290,505 | ||||||
| Medpace Holdings, Inc.(a) | 2,835 | 263,145 | ||||||
| Merck & Co., Inc. | 2,770 | 223,594 | ||||||
| Mettler-Toledo International, Inc.(a) | 299 | 237,705 | ||||||
| Neurocrine Biosciences, Inc.(a) | 2,589 | 323,004 | ||||||
| Omnicell, Inc.(a) | 3,191 | 213,510 | ||||||
| Pfizer, Inc. | 6,409 | 244,760 | ||||||
| Quest Diagnostics, Inc. | 2,391 | 282,807 | ||||||
| Regeneron Pharmaceuticals, Inc.(a) | 415 | 254,316 | ||||||
| ResMed, Inc. | 1,279 | 205,689 | ||||||
| Simulations Plus, Inc. | 6,875 | 348,356 | ||||||
| Teleflex, Inc. | 786 | 285,208 | ||||||
| Thermo Fisher Scientific, Inc. | 692 | 241,639 | ||||||
| UnitedHealth Group, Inc. | 847 | 258,208 | ||||||
| Varian Medical Systems, Inc.(a) | 1,848 | 224,329 | ||||||
| Veeva Systems, Inc., Class A(a) | 1,551 | 339,467 | ||||||
| Vertex Pharmaceuticals, Inc.(a) | 976 | 281,049 | ||||||
| West Pharmaceutical Services, Inc. | 1,442 | 311,530 | ||||||
| Zimmer Biomet Holdings, Inc. | 2,392 | 302,205 | ||||||
| Zoetis, Inc. | 1,852 | 258,150 | ||||||
| Total Health Care | 14,978,194 | |||||||
| Industrials (16.08%) | ||||||||
| 3M Co. | 1,531 | 239,510 | ||||||
| Aerojet Rocketdyne Holdings, Inc.(a) | 5,198 | 227,932 | ||||||
| AMETEK, Inc. | 3,076 | 282,100 | ||||||
| Arcosa, Inc. | 5,575 | 212,798 | ||||||
| Armstrong World Industries, Inc. | 2,722 | 205,212 | ||||||
| Atkore International Group, Inc.(a) | 10,202 | 273,822 | ||||||
| Brady Corp., Class A | 4,829 | 246,907 | ||||||
| BWX Technologies, Inc. | 4,319 | 270,240 | ||||||
| Carlisle Cos., Inc. | 1,662 | 199,207 | ||||||
| Cintas Corp. | 984 | 243,993 | ||||||
| Comfort Systems USA, Inc. | 5,719 | 211,603 | ||||||
| Copart, Inc.(a) | 2,962 | 264,773 | ||||||
| CoStar Group, Inc.(a) | 349 | 229,223 | ||||||
| CSW Industrials, Inc. | 2,888 | 206,665 | ||||||
| Curtiss-Wright Corp. | 2,444 | 245,133 | ||||||
| Deere & Co. | 1,621 | 246,586 | ||||||
| Dover Corp. | 2,541 | 247,112 | ||||||
| EMCOR Group, Inc. | 4,264 | 270,977 | ||||||
| Emerson Electric Co. | 4,345 | 265,132 | ||||||
| Ennis, Inc. | 12,632 | 224,850 | ||||||
| Exponent, Inc. | 3,105 | 230,515 | ||||||
| Fastenal Co. | 5,967 | 246,198 | ||||||
| Federal Signal Corp. | 7,393 | 215,432 | ||||||
| FTI Consulting, Inc.(a) | 1,735 | 208,998 | ||||||
| Gates Industrial Corp. PLC(a)(b) | 33,462 | 336,293 | ||||||
| Security Description | Shares | Value | ||||||
| Industrials (continued) | ||||||||
| Generac Holdings, Inc.(a) | 2,171 | $ | 241,567 | |||||
| Gibraltar Industries, Inc.(a) | 5,516 | 242,759 | ||||||
| Graco, Inc. | 4,574 | 220,513 | ||||||
| HEICO Corp., Class A | 3,205 | 269,060 | ||||||
| HNI Corp. | 9,145 | 232,923 | ||||||
| Honeywell International, Inc. | 1,528 | 222,859 | ||||||
| Hubbell, Inc. | 1,897 | 232,231 | ||||||
| IDEX Corp. | 1,620 | 258,179 | ||||||
| Illinois Tool Works, Inc. | 1,292 | 222,818 | ||||||
| ITT, Inc. | 4,645 | 268,016 | ||||||
| Kansas City Southern | 1,700 | 255,884 | ||||||
| L3Harris Technologies, Inc. | 1,221 | 243,528 | ||||||
| Lockheed Martin Corp. | 643 | 249,767 | ||||||
| McGrath RentCorp | 3,964 | 221,033 | ||||||
| Mercury Systems, Inc.(a) | 2,745 | 245,266 | ||||||
| Moog, Inc., Class A | 4,657 | 252,828 | ||||||
| Norfolk Southern Corp. | 1,474 | 262,799 | ||||||
| Northwest Pipe Co.(a) | 9,069 | 227,541 | ||||||
| Old Dominion Freight Line, Inc. | 1,813 | 310,186 | ||||||
| Oshkosh Corp. | 3,530 | 253,525 | ||||||
| Parker-Hannifin Corp. | 1,679 | 302,170 | ||||||
| Raytheon Technologies Corp. | 7,442 | 480,158 | ||||||
| RBC Bearings, Inc.(a) | 1,735 | 244,028 | ||||||
| Rexnord Corp. | 8,318 | 250,372 | ||||||
| Robert Half International, Inc. | 4,975 | 252,431 | ||||||
| Rockwell Automation, Inc. | 1,329 | 287,277 | ||||||
| Roper Technologies, Inc. | 666 | 262,271 | ||||||
| Shyft Group Inc/the | 19,172 | 327,458 | ||||||
| Simpson Manufacturing Co., Inc. | 3,269 | 261,716 | ||||||
| Stanley Black & Decker, Inc. | 2,269 | 284,646 | ||||||
| Steelcase, Inc., Class A | 21,603 | 250,163 | ||||||
| Teledyne Technologies, Inc.(a) | 792 | 296,303 | ||||||
| The Timken Co. | 6,790 | 288,847 | ||||||
| TransDigm Group, Inc. | 653 | 277,407 | ||||||
| TransUnion | 3,020 | 260,596 | ||||||
| Trex Co., Inc.(a) | 2,936 | 352,672 | ||||||
| UFP Industries, Inc. | 5,796 | 265,051 | ||||||
| UniFirst Corp. | 1,390 | 249,922 | ||||||
| Union Pacific Corp. | 1,603 | 272,286 | ||||||
| Waste Management, Inc. | 1,895 | 202,291 | ||||||
| Watts Water Technologies, Inc., Class A | 2,467 | 205,156 | ||||||
| WW Grainger, Inc. | 838 | 259,462 | ||||||
| Total Industrials | 17,117,176 | |||||||
| Information Technology (20.14%) | ||||||||
| ACM Research, Inc., Class A(a)(b) | 8,579 | 512,938 | ||||||
| Adobe, Inc.(a) | 661 | 255,543 | ||||||
| Advanced Micro Devices, Inc.(a) | 4,921 | 264,750 | ||||||
| Akamai Technologies, Inc.(a) | 2,334 | 246,937 | ||||||
| Alarm.com Holdings, Inc.(a) | 5,859 | 277,072 | ||||||
| Amdocs, Ltd. | 3,984 | 248,044 | ||||||
| Amphenol Corp., Class A | 2,887 | 278,769 | ||||||
| ANSYS, Inc.(a) | 878 | 248,474 | ||||||
| Apple, Inc. | 813 | 258,485 | ||||||
| Applied Materials, Inc. | 4,595 | 258,147 | ||||||
| Arista Networks, Inc.(a) | 1,228 | 286,689 | ||||||
| 6 | May 31, 2020 |
| Barron’s 400SM ETF |
| Schedule of Investments | May 31, 2020 (Unaudited) |
| Security Description | Shares | Value | ||||||
| Information Technology (continued) | ||||||||
| Automatic Data Processing, Inc. | 1,591 | $ | 233,066 | |||||
| Booz Allen Hamilton Holding Corp. | 3,121 | 248,931 | ||||||
| CACI International, Inc., Class A(a) | 1,088 | 272,849 | ||||||
| Cadence Design Systems, Inc.(a) | 3,492 | 318,785 | ||||||
| CDW Corp. | 2,361 | 261,859 | ||||||
| Ciena Corp.(a) | 5,254 | 290,336 | ||||||
| Cirrus Logic, Inc.(a) | 3,665 | 265,639 | ||||||
| Citrix Systems, Inc. | 1,606 | 237,881 | ||||||
| Diodes, Inc.(a) | 5,678 | 276,178 | ||||||
| Enphase Energy, Inc.(a) | 7,037 | 409,483 | ||||||
| Entegris, Inc. | 4,633 | 277,424 | ||||||
| EPAM Systems, Inc.(a) | 1,123 | 259,009 | ||||||
| ePlus, Inc.(a) | 3,692 | 272,137 | ||||||
| EVERTEC, Inc. | 9,365 | 272,709 | ||||||
| Fabrinet(a) | 4,090 | 261,515 | ||||||
| Fair Isaac Corp.(a) | 841 | 338,629 | ||||||
| FleetCor Technologies, Inc.(a) | 899 | 219,167 | ||||||
| Fortinet, Inc.(a) | 2,641 | 367,627 | ||||||
| Gartner, Inc.(a) | 2,285 | 278,084 | ||||||
| GoDaddy, Inc., Class A(a) | 4,599 | 355,273 | ||||||
| Intel Corp. | 4,113 | 258,831 | ||||||
| International Business Machines Corp. | 1,885 | 235,436 | ||||||
| Intuit, Inc. | 858 | 249,095 | ||||||
| j2 Global, Inc.(b) | 2,822 | 220,963 | ||||||
| Jack Henry & Associates, Inc. | 1,319 | 238,554 | ||||||
| KEMET Corp. | 9,305 | 251,514 | ||||||
| Keysight Technologies, Inc.(a) | 2,186 | 236,372 | ||||||
| KLA Corp. | 1,376 | 242,121 | ||||||
| Lam Research Corp. | 902 | 246,850 | ||||||
| Leidos Holdings, Inc. | 2,533 | 266,700 | ||||||
| ManTech International Corp., Class A | 2,822 | 219,382 | ||||||
| Mastercard, Inc., Class A | 864 | 259,969 | ||||||
| Maxim Integrated Products, Inc. | 4,277 | 246,697 | ||||||
| MAXIMUS, Inc. | 3,612 | 260,136 | ||||||
| Methode Electronics, Inc. | 7,620 | 238,887 | ||||||
| Microchip Technology, Inc. | 3,296 | 316,482 | ||||||
| Micron Technology, Inc.(a) | 5,484 | 262,738 | ||||||
| Microsoft Corp. | 1,402 | 256,916 | ||||||
| Mitek Systems, Inc.(a) | 33,950 | 316,754 | ||||||
| National Instruments Corp. | 7,439 | 288,038 | ||||||
| NortonLifeLock, Inc. | 12,386 | 282,153 | ||||||
| NVIDIA Corp. | 951 | 337,624 | ||||||
| Oracle Corp. | 4,397 | 236,427 | ||||||
| Paychex, Inc. | 3,374 | 243,873 | ||||||
| Paycom Software, Inc.(a) | 952 | 282,963 | ||||||
| PayPal Holdings, Inc.(a) | 2,109 | 326,916 | ||||||
| Photronics, Inc.(a) | 20,404 | 244,644 | ||||||
| Power Integrations, Inc. | 2,112 | 228,835 | ||||||
| Qorvo, Inc.(a) | 2,579 | 270,124 | ||||||
| QUALCOMM, Inc. | 2,996 | 242,316 | ||||||
| Qualys, Inc.(a) | 2,724 | 314,132 | ||||||
| ServiceNow, Inc.(a) | 717 | 278,146 | ||||||
| Security Description | Shares | Value | ||||||
| Information Technology (continued) | ||||||||
| Skyworks Solutions, Inc. | 2,651 | $ | 314,250 | |||||
| SPS Commerce, Inc.(a) | 5,359 | 365,269 | ||||||
| Square, Inc., Class A(a) | 4,605 | 373,373 | ||||||
| SS&C Technologies Holdings, Inc. | 5,245 | 303,659 | ||||||
| SYNNEX Corp. | 2,750 | 293,288 | ||||||
| Synopsys, Inc.(a) | 1,726 | 312,251 | ||||||
| Teradyne, Inc. | 3,984 | 267,008 | ||||||
| Texas Instruments, Inc. | 1,944 | 230,831 | ||||||
| Trade Desk, Inc., Class A(a)(b) | 1,212 | 377,611 | ||||||
| Trimble, Inc.(a) | 9,154 | 358,104 | ||||||
| Tyler Technologies, Inc.(a) | 720 | 270,223 | ||||||
| Visa, Inc., Class A | 1,302 | 254,202 | ||||||
| Xerox Holdings Corp. | 10,472 | 166,295 | ||||||
| Zebra Technologies Corp., Class A(a) | 1,138 | 297,382 | ||||||
| Total Information Technology | 21,436,763 | |||||||
| Materials (3.82%) | ||||||||
| Air Products and Chemicals, Inc. | 1,007 | 243,341 | ||||||
| AptarGroup, Inc. | 2,134 | 237,706 | ||||||
| Avery Dennison Corp. | 1,932 | 213,814 | ||||||
| Ball Corp. | 3,188 | 227,177 | ||||||
| Commercial Metals Co. | 15,505 | 266,066 | ||||||
| Crown Holdings, Inc.(a) | 4,095 | 267,936 | ||||||
| Ecolab, Inc. | 1,216 | 258,497 | ||||||
| FMC Corp. | 2,998 | 295,033 | ||||||
| Martin Marietta Materials, Inc. | 1,190 | 228,587 | ||||||
| NewMarket Corp. | 512 | 223,299 | ||||||
| Newmont Corp. | 4,497 | 262,940 | ||||||
| PPG Industries, Inc. | 2,497 | 253,870 | ||||||
| Scotts Miracle-Gro Co. | 2,009 | 286,423 | ||||||
| Sherwin-Williams Co. | 489 | 290,393 | ||||||
| Southern Copper Corp. | 7,393 | 268,366 | ||||||
| Vulcan Materials Co. | 2,218 | 240,254 | ||||||
| Total Materials | 4,063,702 | |||||||
| Real Estate (0.49%) | ||||||||
| CBRE Group, Inc., Class A(a) | 5,682 | 249,894 | ||||||
| Essential Properties Realty Trust, Inc.(b) | 20,042 | 273,373 | ||||||
| Total Real Estate | 523,267 | |||||||
| Utilities (1.45%) | ||||||||
| Alliant Energy Corp. | 3,933 | 194,133 | ||||||
| CMS Energy Corp. | 3,177 | 186,109 | ||||||
| FirstEnergy Corp. | 5,137 | 217,090 | ||||||
| NiSource, Inc. | 8,388 | 199,886 | ||||||
| NRG Energy, Inc. | 8,743 | 315,185 | ||||||
| PPL Corp. | 8,061 | 225,224 | ||||||
| Southern Co. | 3,646 | 208,077 | ||||||
| Total Utilities | 1,545,704 | |||||||
| TOTAL COMMON STOCKS | ||||||||
| (Cost $82,164,328) | 102,952,065 | |||||||
| 7 | May 31, 2020 |
| Barron’s 400SM ETF |
| Schedule of Investments | May 31, 2020 (Unaudited) |
| Security Description | Shares | Value | ||||||
| Utilities (continued) | ||||||||
| LIMITED PARTNERSHIPS (2.72%) | ||||||||
| Energy (2.71%) | ||||||||
| BP Midstream Partners LP | 26,118 | $ | 326,736 | |||||
| CNX Midstream Partners LP | 30,988 | 224,973 | ||||||
| Energy Transfer LP | 39,256 | 320,329 | ||||||
| Enterprise Products Partners LP | 15,551 | 297,024 | ||||||
| Holly Energy Partners LP | 21,883 | 353,629 | ||||||
| KKR & Co., LP | 9,492 | 263,403 | ||||||
| Phillips 66 Partners LP | 6,399 | 285,907 | ||||||
| Plains All American Pipeline LP | 41,846 | 405,906 | ||||||
| Western Gas Partners LP | 43,540 | 406,664 | ||||||
| Total Energy | 2,884,571 | |||||||
| TOTAL LIMITED PARTNERSHIPS | ||||||||
| (Cost $3,128,405) | 2,884,571 | |||||||
| RIGHTS (0.02%) | ||||||||
| Health Care (0.01%) | ||||||||
| Bristol-Myers Squibb Co.(a) | 3,600 | 11,844 | ||||||
| TOTAL RIGHTS | ||||||||
| (Cost $7,668) | 11,844 | |||||||
| 7 Day Yield | Shares | Value | ||||||
| SHORT TERM INVESTMENTS (1.53%) | ||||||||
| Money Market Fund (0.49%) | ||||||||
| State Street Institutional Treasury Plus Money Market Fund | ||||||||
| (Cost $525,819) | 0.15 | % | 525,819 | 525,819 | ||||
| Investments Purchased with Collateral from Securities Loaned (1.04%) | ||||||||
| State Street Navigator Securities Lending Government Money Market Portfolio, 0.15% | ||||||||
| (Cost $1,106,951) | 1,106,951 | 1,106,951 | ||||||
| TOTAL SHORT TERM INVESTMENTS | ||||||||
| (Cost $1,632,770) | 1,632,770 | |||||||
| TOTAL INVESTMENTS (100.99%) | ||||||||
| (Cost $86,933,171) | $ | 107,481,250 | ||||||
| LIABILITIES IN EXCESS OF OTHER ASSETS (0.99%) | (1,052,302 | ) | ||||||
| NET ASSETS - 100.00% | $ | 106,428,948 | ||||||
| (a) | Non-income producing security. |
| (b) | Security, or a portion of the security position is currently on loan. The total market value of securities on loan is $3,550,658. |
See Notes to Financial Statements.
| 8 | May 31, 2020 |
Barron’s 400SM ETF
| Statement of Assets and Liabilities | May 31, 2020 (Unaudited) |
| ASSETS: | ||||
| Investments, at value | $ | 107,481,250 | ||
| Dividends receivable | 111,115 | |||
| Total Assets | 107,592,365 | |||
| LIABILITIES: | ||||
| Payable to adviser | 56,466 | |||
| Payable for collateral upon return of securities loaned | 1,106,951 | |||
| Total Liabilities | 1,163,417 | |||
| NET ASSETS | $ | 106,428,948 | ||
| NET ASSETS CONSIST OF: | ||||
| Paid-in capital | $ | 149,642,805 | ||
| Total distributable earnings | (43,213,857 | ) | ||
| NET ASSETS | $ | 106,428,948 | ||
| INVESTMENTS, AT COST | $ | 86,933,170 | ||
| PRICING OF SHARES | ||||
| Net Assets | $ | 106,428,948 | ||
| Shares of beneficial interest outstanding (Unlimited number of shares authorized, par value $0.01 per share) | 2,750,000 | |||
| Net Asset Value, offering and redemption price per share | $ | 38.70 | ||
See Notes to Financial Statements.
9 | May 31, 2020
Barron’s 400SM ETF
| Statement of Operations | For the Six Months Ended May 31, 2020 (Unaudited) |
| INVESTMENT INCOME: | ||||
| Dividends(a) | $ | 1,131,121 | ||
| Securities Lending Income | 19,287 | |||
| Total Investment Income | 1,150,408 | |||
| EXPENSES: | ||||
| Investment adviser fees | 399,468 | |||
| Net Expenses | 399,468 | |||
| NET INVESTMENT INCOME | 750,940 | |||
| REALIZED AND UNREALIZED GAIN/(LOSS): | ||||
| Net realized loss on investments | (21,195,093 | ) | ||
| Net change in unrealized appreciation on investments | 7,164,598 | |||
| NET REALIZED AND UNREALIZED LOSS ON INVESTMENTS | (14,030,495 | ) | ||
| NET DECREASE IN NET ASSETS RESULTING FROM OPERATIONS | $ | (13,279,555 | ) | |
| (a) | Net of foreign tax withholding of $660. |
See Notes to Financial Statements.
10 | May 31, 2020
Barron’s 400SM ETF
Statements of Changes in Net Assets
For the Six Months Ended May 31, 2020 (Unaudited) | For the Year Ended November 30, 2019 | |||||||
| OPERATIONS: | ||||||||
| Net investment income | $ | 750,940 | $ | 1,674,201 | ||||
| Net realized loss | (21,195,093 | ) | (13,333,969 | ) | ||||
| Net change in unrealized appreciation | 7,164,598 | 18,178,162 | ||||||
| Net increase/(decrease) in net assets resulting from operations | (13,279,555 | ) | 6,518,394 | |||||
| DISTRIBUTIONS TO SHAREHOLDERS: | ||||||||
| From distributable earnings | (1,017,716 | ) | (1,353,834 | ) | ||||
| Total distributions | (1,017,716 | ) | (1,353,834 | ) | ||||
| CAPITAL SHARE TRANSACTIONS: | ||||||||
| Cost of shares redeemed | (26,423,613 | ) | (21,723,092 | ) | ||||
| Net decrease from capital share transactions | (26,423,613 | ) | (21,723,092 | ) | ||||
| Net decrease in net assets | (40,720,884 | ) | (16,558,532 | ) | ||||
| NET ASSETS: | ||||||||
| Beginning of period | 147,149,832 | 163,708,364 | ||||||
| End of period | $ | 106,428,948 | $ | 147,149,832 | ||||
| OTHER INFORMATION: | ||||||||
| CAPITAL SHARE TRANSACTIONS: | ||||||||
| Beginning shares | 3,500,000 | 4,050,000 | ||||||
| Shares sold | – | – | ||||||
| Shares redeemed | (750,000 | ) | (550,000 | ) | ||||
| Shares outstanding, end of period | 2,750,000 | 3,500,000 | ||||||
See Notes to Financial Statements.
11 | May 31, 2020
Barron’s 400SM ETF
| Financial Highlights | For a Share Outstanding Throughout the Periods Presented |
For the Six Months Ended May 31, 2020 (Unaudited) | For the Year Ended November 30, 2019 | For the Year Ended November 30, 2018 | For the Year Ended November 30, 2017 | For the Year Ended November 30, 2016 | For the Year Ended November 30, 2015 | |||||||||||||||||||
| NET ASSET VALUE, BEGINNING OF PERIOD | $ | 42.04 | $ | 40.42 | $ | 41.54 | $ | 34.35 | $ | 31.75 | $ | 31.64 | ||||||||||||
| INCOME FROM OPERATIONS: | ||||||||||||||||||||||||
| Net investment income(a) | 0.24 | 0.44 | 0.40 | 0.29 | 0.33 | 0.32 | ||||||||||||||||||
| Net realized and unrealized gain/(loss) | (3.29 | ) | 1.51 | (1.27 | ) | 7.17 | 2.53 | 0.02 | ||||||||||||||||
| Total from investment operations | (3.05 | ) | 1.95 | (0.87 | ) | 7.46 | 2.86 | 0.34 | ||||||||||||||||
| DISTRIBUTIONS: | ||||||||||||||||||||||||
| From net investment income | (0.29 | ) | (0.33 | ) | (0.25 | ) | (0.27 | ) | (0.26 | ) | (0.23 | ) | ||||||||||||
| Total distributions | (0.29 | ) | (0.33 | ) | (0.25 | ) | (0.27 | ) | (0.26 | ) | (0.23 | ) | ||||||||||||
| NET INCREASE/(DECREASE) IN NET ASSET VALUE | (3.34 | ) | 1.62 | (1.12 | ) | 7.19 | 2.60 | 0.11 | ||||||||||||||||
| NET ASSET VALUE, END OF PERIOD | $ | 38.70 | $ | 42.04 | $ | 40.42 | $ | 41.54 | $ | 34.35 | $ | 31.75 | ||||||||||||
| TOTAL RETURN(b) | (7.31 | )% | 5.00 | % | (2.12 | )% | 21.87 | % | 9.12 | % | 1.07 | % | ||||||||||||
| RATIOS/SUPPLEMENTAL DATA: | ||||||||||||||||||||||||
| Net assets, end of period (in 000s) | $ | 106,429 | $ | 147,150 | $ | 163,708 | $ | 205,601 | $ | 178,612 | $ | 204,805 | ||||||||||||
| RATIOS TO AVERAGE NET ASSETS | ||||||||||||||||||||||||
| Ratio of expenses to average net assets | 0.65 | %(c) | 0.65 | % | 0.65 | % | 0.65 | % | 0.65 | % | 0.65 | % | ||||||||||||
| Ratio of net investment income to average net assets | 1.22 | %(c) | 1.10 | % | 0.93 | % | 0.78 | % | 1.07 | % | 1.00 | % | ||||||||||||
| Portfolio turnover rate(d) | 35 | % | 109 | % | 88 | % | 84 | % | 88 | % | 87 | % | ||||||||||||
| (a) | Based on average shares outstanding during the period. |
| (b) | Total return is calculated assuming an initial investment made at the net asset value at the beginning of the period and redemption at the net asset value on the last day of the period and assuming all distributions are reinvested at the reinvestment prices. |
| (c) | Annualized. |
| (d) | Portfolio turnover for periods less than one year are not annualized and does not include securities received or delivered from processing creations or redemptions in-kind. |
See Notes to Financial Statements.
12 | May 31, 2020
Barron’s 400SM ETF
| Notes to Financial Statements | May 31, 2020 (Unaudited) |
1. ORGANIZATION
ALPS ETF Trust (the “Trust”), a Delaware statutory trust, is an open-end management investment company registered under the Investment Company Act of 1940, as amended (the “1940 Act”). As of May 31, 2020, the Trust consisted of sixteen separate portfolios. Each portfolio represents a separate series of the Trust. This report pertains solely to the Barron’s 400SM ETF (the “Fund”). The investment objective of the Fund is to seek investment results that correspond generally, before fees and expenses, to the performance of the Barron’s 400 IndexSM (the “Underlying Index”). The Fund has elected to qualify as a diversified series of the Trust under the 1940 Act.
The Fund’s Shares (“Shares”) are listed on the NYSE Arca, Inc. (the “NYSE Arca”). The Fund issues and redeems Shares at net asset value (“NAV”) in blocks of 50,000 Shares, each of which is called a “Creation Unit”. Creation Units are issued and redeemed principally in-kind for securities included in the Underlying Index. Except when aggregated in Creation Units, Shares are not redeemable securities of the Fund.
Pursuant to the Trust’s organizational documents, its Officers and Trustees are indemnified against certain liability arising out of the performance of their duties to the Trust. Additionally, in the normal course of business, the Trust enters into contracts with service providers that contain general indemnification clauses. The Trust’s maximum exposure under these arrangements is unknown, as this would involve future claims that may be made against the Trust that have not yet occurred.
2. SIGNIFICANT ACCOUNTING POLICIES
The following is a summary of significant accounting policies consistently followed by the Fund in the preparation of the financial statements. The accompanying financial statements were prepared in accordance with accounting principles generally accepted in the United States of America (“U.S. GAAP”). The preparation of financial statements in conformity with U.S. GAAP requires management to make certain estimates and assumptions that affect the reported amounts of assets and liabilities and disclosures of contingent assets and liabilities at the date of the financial statements and the reported amounts of revenue and expenses during the period. Actual results could differ from those estimates. The Fund is considered an investment company under U.S. GAAP and follows the accounting and reporting guidance applicable to investment companies in the Financial Accounting Standards Board (“FASB”) Accounting Standards Codification Topic 946.
A. Portfolio Valuation
The Fund’s NAV is determined daily, as of the close of regular trading on the New York Stock Exchange (the “NYSE”), normally 4:00 p.m. Eastern time, on each day the NYSE is open for trading. The NAV is computed by dividing the value of all assets of the Fund (including accrued interest and dividends), less all liabilities (including accrued expenses and dividends declared but unpaid), by the total number of shares outstanding.
Portfolio securities listed on any exchange other than the NASDAQ Stock Market LLC (“NASDAQ”) are valued at the last sale price on the business day as of which such value is being determined. If there has been no sale on such day, the securities are valued at the mean of the most recent bid and ask prices on such day. Securities traded on the NASDAQ are valued at the NASDAQ Official Closing Price as determined by NASDAQ. Portfolio securities traded on more than one securities exchange are valued at the last sale price on the business day as of which such value is being determined at the close of the exchange representing the principal market for such securities. Portfolio securities traded in the over-the-counter market, but excluding securities traded on the NASDAQ, are valued at the latest quoted sale price in such market.
The Fund’s investments are valued at market value or, in the absence of market value with respect to any portfolio securities, at fair value according to procedures adopted by the Trust’s Board of Trustees (the “Board”). When market quotations are not readily available or when events occur that make established valuation methods unreliable, securities of the Fund may be valued in good faith by or under the direction of the Board. These securities generally include, but are not limited to, restricted securities (securities which may not be publicly sold without registration under the Securities Act of 1933) for which a pricing service is unable to provide a market price; securities whose trading has been formally suspended; a security whose market price is not available from a pre-established primary pricing source or the pricing source is not willing to provide a price; a security with respect to which an event has occurred that is most likely to materially affect the value of the security after the market has closed but before the calculation of the Fund’s NAV or make it difficult or impossible to obtain a reliable market quotation; or a security whose price, as provided by the pricing service, does not reflect the security’s “fair value” due to the security being de-listed from a national exchange or the security’s primary trading market is temporarily closed at a time when, under normal conditions, it would be open. As a general principle, the current “fair value” of a security would be the amount which the owner might reasonably expect to receive from the sale on the applicable exchange or principal market. A variety of factors may be considered in determining the fair value of such securities.
13 | May 31, 2020
Barron’s 400SM ETF
| Notes to Financial Statements | May 31, 2020 (Unaudited) |
B. Fair Value Measurements
The Fund discloses the classification of its fair value measurements following a three-tier hierarchy based on the inputs used to measure fair value. Inputs refer broadly to the assumptions that market participants would use in pricing the asset or liability; including assumptions about risk. Inputs may be observable or unobservable. Observable inputs reflect the assumptions market participants would use in pricing the asset or liability that are developed based on market data obtained from sources independent of the reporting entity. Unobservable inputs reflect the reporting entity’s own assumptions about the assumptions market participants would use in pricing the asset or liability that are developed based on the best information available.
Valuation techniques used to value the Fund's investments by major category are as follows:
Equity securities and Limited Partnerships, including restricted securities, for which market quotations are readily available, are valued at the last reported sale price or official closing price as reported by a third party pricing vendor on the primary market or exchange on which they are traded and are categorized as Level 1 in the hierarchy. In the event there were no sales during the day or closing prices are not available, securities are valued at the mean of the most recent quoted bid and ask prices on such day and are generally categorized as Level 2 in the hierarchy. Investments in open-end mutual funds are valued at their closing NAV each business day and are categorized as Level 1 in the hierarchy.
Changes in valuation techniques may result in transfers in or out of an assigned level within the disclosure hierarchy.
Various inputs are used in determining the value of the Fund’s investments as of the end of the reporting period. When inputs used fall into different levels of the fair value hierarchy, the level in the hierarchy within which the fair value measurement falls is determined based on the lowest level input that is significant to the fair value measurement in its entirety. The designated input levels are not necessarily an indication of the risk or liquidity associated with these investments.
These inputs are categorized in the following hierarchy under applicable financial accounting standards:
| Level 1 – | Unadjusted quoted prices in active markets for identical investments, unrestricted assets or liabilities that a Fund has the ability to access at the measurement date; |
| Level 2 – | Quoted prices which are not active, quoted prices for similar assets or liabilities in active markets or inputs other than quoted prices that are observable (either directly or indirectly) for substantially the full term of the asset or liability; and |
| Level 3 – | Significant unobservable prices or inputs (including the Fund’s own assumptions in determining the fair value of investments) where there is little or no market activity for the asset or liability at the measurement date. |
The following is a summary of the inputs used to value the Fund’s investments as of May 31, 2020:
Barron's 400 ETF
| Investments in Securities at Value | Level 1 - Quoted and Unadjusted Prices | Level 2 - Other Significant Observable Inputs | Level 3 - Significant Unobservable Inputs | Total | ||||||||||||
| Common Stocks* | $ | 102,952,065 | $ | – | $ | – | $ | 102,952,065 | ||||||||
| Limited Partnerships* | 2,884,571 | – | – | 2,884,571 | ||||||||||||
| Rights* | 11,844 | – | – | 11,844 | ||||||||||||
| Short Term Investments | 1,632,770 | – | – | 1,632,770 | ||||||||||||
| Total | $ | 107,481,250 | $ | – | $ | – | $ | 107,481,250 | ||||||||
| * | For a detailed sector breakdown, see the accompanying Schedule of Investments. |
The Fund did not have any securities that used significant unobservable inputs (Level 3) in determining fair value and there were no transfers into or out of Level 3.
C. Securities Transactions and Investment Income
Securities transactions are recorded as of the trade date. Realized gains and losses from securities transactions are recorded on the highest cost basis. Dividend income and capital gains distributions, if any, are recorded on the ex-dividend date. Interest income, if any, is recorded on the accrual basis.
14 | May 31, 2020
Barron’s 400SM ETF
| Notes to Financial Statements | May 31, 2020 (Unaudited) |
D. Dividends and Distributions to Shareholders
Dividends from net investment income of the Fund, if any, are declared and paid annually or as the Board may determine from time to time. Distributions of net realized capital gains earned by the Fund, if any, are distributed at least annually.
E. Federal Tax and Tax Basis Information
The timing and character of income and capital gain distributions are determined in accordance with income tax regulations, which may differ from U.S. GAAP. Reclassifications are made to the Fund’s capital accounts for permanent tax differences to reflect income and gains available for distribution (or available capital loss carryforwards) under income tax regulations. The amounts and characteristics of tax basis distributions and composition of distributable earnings/(accumulated losses) are finalized at fiscal year-end; accordingly, tax basis balances have not been determined as of May 31, 2020.
The tax character of the distributions paid during the fiscal year ended November 30, 2019 was as follows:
Ordinary Income | Long-Term Capital Gain | Return of Capital | ||||||||||
| November 30, 2019 | ||||||||||||
| Barron’s 400SM ETF | $ | 1,353,834 | $ | – | $ | – | ||||||
Under current law, capital losses maintain their character as short-term or long-term and are carried forward to the next tax year without expiration. As of November 30, 2019, the following amounts are available as carry forwards to the next tax year:
| Fund | Short-Term | Long-Term | ||||||
| Barron’s 400SM ETF | $ | 34,243,564 | $ | 9,297,396 | ||||
As of May 31, 2020, the cost of investments for federal income tax purposes and accumulated net unrealized appreciation/(depreciation) on investments were as follows:
Barron’s 400SM ETF | ||||
| Gross appreciation (excess of value over tax cost) | $ | 26,199,608 | ||
| Gross depreciation (excess of tax cost over value) | (4,832,525 | ) | ||
| Net unrealized appreciation (depreciation) | $ | 21,367,083 | ||
| Cost of investments for income tax purposes | $ | 86,114,167 | ||
The differences between book-basis and tax-basis are primarily due to the deferral of losses from wash sales and investments in partnerships. In addition, certain tax cost basis adjustments are finalized at fiscal year-end and therefore have not been determined as of May 31, 2020.
F. Income Taxes
No provision for income taxes is included in the accompanying financial statements, as the Fund intends to distribute to shareholders all taxable investment income and realized gains and otherwise comply with Subchapter M of the Internal Revenue Code of 1986, as amended, applicable to regulated investment companies. The Fund evaluates tax positions taken (or expected to be taken) in the course of preparing the Fund’s tax returns to determine whether these positions meet a “more-likely-than-not” standard that, based on the technical merits, have a more than fifty percent likelihood of being sustained by a taxing authority upon examination. A tax position that meets the “more-likely-than-not” recognition threshold is measured to determine the amount of benefit to recognize in the financial statements.
As of and during the six months ended May 31, 2020, the Fund did not have a liability for any unrecognized tax benefits. The Fund files U.S. federal, state, and local tax returns as required. The Fund’s tax returns are subject to examination by the relevant tax authorities until expiration of the applicable statute of limitations, which is generally three years after the filing of the tax return, but may extend to four years in certain jurisdictions. Tax returns for open years have incorporated no uncertain tax positions that require a provision for income taxes.
G. Lending of Portfolio Securities
The Fund has entered into a securities lending agreement with State Street Bank & Trust Co. (“SSB”), the Fund’s lending agent. The Fund may lend its portfolio securities only to borrowers that are approved by SSB. The Fund will limit such lending to not more than 33 1/3% of the value of its total assets. The Fund’s securities held at SSB as custodian shall be available to be lent except those securities the Fund or ALPS Advisors, Inc. specifically identifies in writing as not being available for lending. The borrower pledges and maintains with the Fund collateral consisting of cash (U.S. Dollars only), securities issued or guaranteed by the U.S. government or its agencies or instrumentalities, and cash equivalents (including irrevocable bank letters of credit) issued by a person other than the borrower or an affiliate of the borrower. The initial collateral received by the Fund is required to have a value of no less than 102% of the market value of the loaned securities for U.S equity securities and a value of no less than 105% of the market value for non-U.S. equity securities. The collateral is maintained thereafter, at a market value equal to not less than 102% of the current value of the U.S. equity securities on loan and not less than 105% of the current value of the non-U.S. equity securities on loan. The market value of the loaned securities is determined at the close of each business day and any additional required collateral is delivered to the Fund on the next business day. During the term of the loan, the Fund is entitled to all distributions made on or in respect of the loaned securities. Loans of securities are terminable at any time and the borrower, after notice, is required to return borrowed securities within the customary time period for settlement of securities transactions.
15 | May 31, 2020
Barron’s 400SM ETF
| Notes to Financial Statements | May 31, 2020 (Unaudited) |
Any cash collateral received is reinvested in a money market fund managed by SSB as disclosed in the Fund’s Schedule of Investments and is reflected in the Statements of Assets and Liabilities as a payable for collateral upon return of securities loaned. Non-cash collateral, in the form of securities issued or guaranteed by the U.S. government or its agencies or instrumentalities, is not disclosed in the Fund’s Statements of Assets and Liabilities as it is held by the lending agent on behalf of the Fund, and the Fund does not have the ability to re-hypothecate these securities. Income earned by the Fund from securities lending activity is disclosed in the Statement of Operations.
The following is a summary of the Fund's securities lending agreement and related cash and non-cash collateral received as of May 31, 2020:
Market Value of Securities on Loan | Cash Collateral Received | Non-Cash Collateral Received | Total Collateral Received | |||||||||||||
| Barron's 400 ETF | $ | 3,550,658 | $ | 1,106,951 | $ | 2,486,110 | $ | 3,593,061 | ||||||||
The risks of securities lending include the risk that the borrower may not provide additional collateral when required or may not return the securities when due. To mitigate these risks, the Fund benefits from a borrower default indemnity provided by SSB. SSB’s indemnity allows for full replacement of securities lent wherein SSB will purchase the unreturned loaned securities on the open market by applying the proceeds of the collateral, or to the extent such proceeds are insufficient or the collateral is unavailable, SSB will purchase the unreturned loan securities at SSB’s expense. However, the Fund could suffer a loss if the value of the investments purchased with cash collateral falls below the value of the cash collateral received.
The following table reflects a breakdown of transactions accounted for as secured borrowings, the gross obligation by the type of collateral pledged or securities loaned, and the remaining contractual maturity of those transactions as of May 31, 2020:
| Barron's 400 ETF | Remaining contractual maturity of the agreements | |||||||||||||||||||
| Securities Lending Transactions | Overnight & Continuous | Up to 30 days | 30-90 days | Greater than 90 days | Total | |||||||||||||||
| Common Stocks | $ | 1,106,951 | $ | – | $ | – | $ | – | $ | 1,106,951 | ||||||||||
| Total Borrowings | 1,106,951 | |||||||||||||||||||
| Gross amount of recognized liabilities for securities lending (collateral received) | $ | 1,106,951 | ||||||||||||||||||
16 | May 31, 2020
Barron’s 400SM ETF
| Notes to Financial Statements | May 31, 2020 (Unaudited) |
3. INVESTMENT ADVISORY FEE AND OTHER AFFILIATED TRANSACTIONS
ALPS Advisors, Inc. (the “Adviser”) serves as the Fund’s investment adviser pursuant to an Investment Advisory Agreement with the Trust on behalf of the Fund (the “Advisory Agreement”). Pursuant to the Advisory Agreement, the Fund pays the Adviser an annual management fee for the services and facilities it provides, payable on a monthly basis at the annual rate of 0.65% of the Fund’s average daily net assets. From time to time, the Adviser may waive all or a portion of its fee.
Out of the unitary management fees, the Adviser pays substantially all expenses of the Fund, including the cost of transfer agency, custody, fund administration, legal, audit, independent trustees and other services, except for interest expenses, distribution fees or expenses, brokerage expenses, taxes and extraordinary expenses not incurred in the ordinary course of the Fund's business. The Adviser’s unitary management fee is designed to pay substantially all of the Fund’s expenses and to compensate the Adviser for providing services to the Fund.
ALPS Fund Services, Inc., an affiliate of the Adviser, is the administrator of the Fund.
Each Trustee who is not considered an “interested person” (as defined in the Investment Company Act of 1940, as amended (“1940 Act”)) (“Independent Trustees”) receives (1) a quarterly retainer of $5,000, (2) a per meeting fee for regularly scheduled meetings of $3,750, (3) $1,500 for any special meeting held outside of a regularly scheduled board meeting, and (4) reimbursement for all reasonable out-of-pocket expenses relating to attendance at meetings. Prior to January 1, 2020, a Trustee who is considered an “interested person” (as defined in the 1940 Act) (“Interested Trustee”) received no compensation or expense reimbursements from the Trust. Effective January 1, 2020 the Interested Trustee receives (1) a quarterly retainer of $5,000, (2) a per meeting fee of $3,750, (3) $1,500 for any special meeting held outside of a regularly scheduled board meeting, and (4) reimbursement for all reasonable out-of-pocket expenses relating to attendance at meetings. In addition, the Chairman of the Board and Chairman of the Audit Committee each receives a quarterly retainer of $2,000, in connection with their respective roles.
4. PURCHASES AND SALES OF SECURITIES
For the six months ended May 31, 2020, the cost of purchases and proceeds from sales of investment securities, excluding in-kind transactions and short-term investments, were as follows:
| Fund | Purchases | Sales | ||||||
| Barron's 400 ETF | $ | 43,526,079 | $ | 42,570,011 | ||||
For the year ended May 31, 2020, the cost of in-kind purchases and proceeds from in-kind sales were as follows:
| Fund | Purchases | Sales | ||||||
| Barron's 400 ETF | $ | – | $ | 26,300,748 | ||||
For the six months ended May 31, 2020, the Barron's 400 ETF had in-kind net realized gains of $2,714,635.
Gains on in-kind transactions are not considered taxable for federal income tax purposes and losses on in-kind transactions are also not deductible for tax purposes.
5. CAPITAL SHARE TRANSACTIONS
Shares are created and redeemed by the Fund only in Creation Unit size aggregations of 50,000 Shares. Only broker-dealers or large institutional investors with creation and redemption agreements called Authorized Participants (“AP”) are permitted to purchase or redeem Creation Units from the Fund. Such transactions are generally permitted on an in-kind basis, with a balancing cash component to equate the transaction to the NAV per unit of the Fund on the transaction date. Cash may be substituted equivalent to the value of certain securities generally when they are not available in sufficient quantity for delivery, not eligible for trading by the AP or as a result of other market circumstances.
6. RELATED PARTY TRANSACTIONS
The Fund engaged in cross trades between other funds in the Trust during the six months ended May 31, 2020 pursuant to Rule 17a-7 under the
1940 Act. Cross trading is the buying or selling of portfolio securities between funds to which the Adviser serves as the investment adviser. The Board previously adopted procedures that apply to transactions between the Funds of the Trust pursuant to Rule 17a-7. These transactions related to cross trades during the period complied with the requirements set forth by Rule 17a-7 and the Trust’s procedures.
17 | May 31, 2020
Barron’s 400SM ETF
| Notes to Financial Statements | May 31, 2020 (Unaudited) |
Transactions related to cross trades during the six months ended May 31, 2020, were as follows:
| Fund | Purchase cost paid | Sale proceeds received | Realized gain/(loss) on sales | |||||||||
| Barron's 400 ETF | $ | 662,658 | $ | 688,134 | $ | (1,062,500 | ) | |||||
7. MARKET DISRUPTIONS RISK
The Fund is subject to investment and operational risks associated with financial, economic and other global market developments and disruptions, including the recent spread of an infectious respiratory illness caused by a novel strain of coronavirus (known as COVID-19), which can negatively impact the securities markets and cause the Fund to lose value.
The spread of COVID-19 has caused volatility, severe market dislocations and liquidity constraints in many markets, including markets for the securities the Fund holds, and may adversely affect the Fund’s investments and operations. The transmission of COVID-19 and efforts to contain its spread have resulted in travel restrictions and disruptions, closed international borders, enhanced health screenings at ports of entry and elsewhere, disruption of and delays in healthcare service preparation and delivery, quarantines, event and service cancellations or interruptions, disruptions to business operations and supply chains, and a reduction in consumer and business spending, as well as general concern and uncertainty that has negatively affected the economy. These disruptions have led to instability in the market place and the jobs market. The impact of COVID-19 could adversely affect the economies of many nations or the entire global economy, the financial well-being and performance of individual issuers, borrowers and sectors and the health of the markets generally in potentially significant and unforeseen ways.
The foregoing could lead to a significant economic downturn or recession, increased market volatility, a greater number of market closures, higher default rates and adverse effects on the values and liquidity of the Fund’s securities or other assets. Such impacts may adversely affect the performance of the Fund.
8. SUBSEQUENT EVENTS
Effective July 1, 2020, each Trustee will be compensated a quarterly retainer of $10,000, and a per meeting fee of $5,000.
18 | May 31, 2020
Barron’s 400SM ETF
| Additional Information | May 31, 2020 (Unaudited) |
PROXY VOTING RECORDS, POLICIES AND PROCEDURES
Information regarding how the Fund voted proxies relating to portfolio securities during the most recent 12-month period ended June 30 and a description of the Fund’s proxy voting policies and procedures used in determining how to vote for proxies are available without charge on the SEC’s website at www.sec.gov and upon request, by calling (toll-free) 1-866-675-2639.
PORTFOLIO HOLDINGS
The Fund files a complete schedule of portfolio holdings with the U.S. Securities and Exchange Commission (“SEC”) for the first and third quarters of each fiscal year on Form N-PORT within 60 days after the end of the period. Copies of the Fund’s Form N-PORT are available without a charge, upon request, by contacting the Fund at 1-855-838-9485 and on the SEC’s website at https://www.sec.gov.
TAX INFORMATION
The Fund designates the following as a percentage of taxable ordinary income distributions, or up to the maximum amount allowable, for the calendar year ended December 31, 2019:
Qualified Dividend Income | Dividend Received Deduction | |
| Barron's 400 ETF | 100.00% | 100.00% |
In early 2020, if applicable, shareholders of record received this information for the distribution paid to them by the Fund during the calendar year 2019 via Form 1099. The Fund will notify shareholders in early 2021 of amounts paid to them by the Fund, if any, during the calendar year 2020.
LICENSING AGREEMENT
MarketGrader Capital, LLC (the “Index Provider”) has entered into a license agreement with Dow Jones & Company to use the “Barron’s” name and certain related intellectual property in connection with the Underlying Index. The Index Provider also has entered into a license and services agreement with its parent company, MarketGrader.com, to use the methodology for constructing the Underlying Index. The Index Provider in turn has entered into the Sublicense Agreement with ALPS Advisers, Inc. to use the Underlying Index. The following disclosure relates to such licensing agreements:
The Barron’s 400 ETF (the “Fund”) is not sponsored, endorsed, sold or promoted by the the Index Provider. The Index Provider makes no representation or warranty, express or implied, to the owners of the Fund or any member of the public regarding the advisability of investing in securities generally or in the Fund particularly or the ability of the Fund to track the performance of the physical commodities market. The Index Provider’s only relationship to the ALPS Advisors, Inc. (the “Adviser”) or the Fund is the licensing of certain service marks and trade names of the Index Provider and of the Underlying Index that is determined, composed and calculated by the Index Provider without regard to the Adviser or the Fund. The Index Provider has no obligation to take the needs of the Adviser or the Fund or the owners of the Fund into consideration in determining, composing or calculating the Underlying Index. The Index Provider is not responsible for and has not participated in the determination of the timing of, prices at, or quantities of the Fund to be issued or in the determination or calculation of the equation by which the Fund is to be converted into cash. The Index Provider has no obligation or liability in connection with the administration, marketing or trading of the Fund.
THE INDEX PROVIDER DOES NOT GUARANTEE THE ACCURACY AND/OR THE COMPLETENESS OF THE UNDERLYING INDEX OR ANY DATA INCLUDED THEREIN AND THE INDEX PROVIDER SHALL HAVE NO LIABILITY FOR ANY ERRORS, OMISSIONS, OR INTERRUPTIONS THEREIN. THE INDEX PROVIDER MAKES NO WARRANTY, EXPRESS OR IMPLIED, AS TO RESULTS TO BE OBTAINED BY THE ADVISER, THE FUND, OWNERS OF THE FUND, OR ANY OTHER PERSON OR ENTITY FROM THE USE OF THE UNDERLYING INDEX OR ANY DATA INCLUDED THEREIN. THE INDEX PROVIDER MAKES NO EXPRESS OR IMPLIED WARRANTIES, AND EXPRESSLY DISCLAIMS ALL WARRANTIES OF MERCHANTABILITY OR FITNESS FOR A PARTICULAR PURPOSE OR USE WITH RESPECT TO THE UNDERLYING INDEX OR ANY DATA INCLUDED THEREIN. WITHOUT LIMITING ANY OF THE FOREGOING, IN NO EVENT SHALL THE INDEX PROVIDER HAVE ANY LIABILITY FOR ANY SPECIAL, PUNITIVE, INDIRECT, OR CONSEQUENTIAL DAMAGES (INCLUDING LOST PROFITS), EVEN IF NOTIFIED OF THE POSSIBILITY OF SUCH DAMAGES.
“The Barron’s 400 IndexSM” is calculated and published by MarketGrader Capital, LLC (“MarketGrader”). “Barron’s,” “Barron’s 400” and “Barron’s 400 Index” are trademarks or service marks of DJC & Company, Inc. or its affiliates and have been licensed to MarketGrader and sublicensed for certain purposes by Barron’s 400 Exchange Traded Fund, a sub-fund of that certain ALPS ETF Trust, a Delaware Statutory Trust (“Sub-Licensee”). The Barron’s 400 ETF (the “Product”) is not sponsored, endorsed, sold or promoted by DJC or its affiliates. DJC and its affiliates make no representation or warranty, express or implied, to the owners of the Fund or any member of the public regarding the advisability of trading in the Fund particularly. DJC and its affiliates’ only relationship to the Licensee is the licensing of certain trademarks and trade names of DJC. DJC has no obligation to take the needs of the Licensee or the owners of the Fund into consideration in connection with its licensing of the Barron’s 400 Index to MarketGrader or the sublicense to Licensee. DJC and its affiliates are not responsible for and have not participated in the determination of the timing of, prices at, or quantities of the Fund to be sold or in the determination or calculation of the equation by which the Product are to be converted into cash. DJC and its affiliates have no obligation or liability in connection with the administration, marketing or trading of the Barron’s 400 Index or the Product.
19 | May 31, 2020
Barron’s 400SM ETF
| Additional Information | May 31, 2020 (Unaudited) |
DOW JONES DOES NOT GUARANTEE THE ACCURACY AND/OR THE COMPLETENESS OF THE BARRON’S 400 INDEX OR ANY DATA INCLUDED THEREIN AND DOW JONES AND ITS AFFILIATES SHALL HAVE NO LIABILITY FOR ANY ERRORS, OMISSIONS, OR INTERRUPTIONS THEREIN. DOW JONESAND ITS AFFILIATES MAKE NO WARRANTY, EXPRESS OR IMPLIED, AS TO RESULTS TO BE OBTAINED BY THE LICENSEE, OWNERS OF THE FUND, OR ANY OTHER PERSON OR ENTITY FROM THE USE OF THE BARRON’S 400 INDEX OR ANY DATA INCLUDED THEREIN. DOW JONES AND ITS AFFILIATES MAKE NO EXPRESS OR IMPLIED WARRANTIES. AND EXPRESSLY DISCLAIM ALL WARRANTIES, OF MERCHANTABILITY OR FITNESS FOR A PARTICULAR PURPOSE OR USE WITH RESPECT TO THE BARRON’S 400 INDEX OR ANY DATA INCLUDED THEREIN. WITHOUT LIMITING ANY OF THE FOREGOING, IN NO EVENT SHALL DOW JONES AND ITS AFFILIATES HAVE ANY LIABILITY FOR ANY LOST PROFITS OR INDIRECT, PUNITIVE, SPECIAL OR CONSEQUENTIAL DAMAGES OR LOSSES, EVEN IF NOTIFIED OF THE POSSIBILITY OF SUCH DAMAGES. THERE ARE NO THIRD PARTY BENEFICIARIES OF ANY AGREEMENTS OR ARRANGEMENTS BETWEEN DJC AND THE LICENSEE, OTHER THAN THE LICENSORS OF MARKETGRADER.
The Adviser does not guarantee the accuracy and/or the completeness of the Underlying Index or any data included therein, and the Adviser shall have no liability for any errors, omissions or interruptions therein. The Adviser makes no warranty, express or implied, as to results to be obtained by the Fund, owners of the Shares of the Fund or any other person or entity from the use of the Underlying Index or any data included therein. The Adviser makes no express or implied warranties, and expressly disclaims all warranties of merchantability or fitness for a particular purpose or use with respect to the Underlying Index or any data included therein. Without limiting any of the foregoing, in no event shall the Adviser have any liability for any special, punitive, direct, indirect or consequential damages (including lost profits) arising out of matters relating to the use of the Underlying Index, even if notified of the possibility of such damages.
20 | May 31, 2020
Barron’s 400SM ETF
| Liquidity Risk Management Program | May 31, 2020 (Unaudited) |
In compliance with the Securities and Exchange Commission’s liquidity risk management rule (the “Liquidity Rule”), the ALPS ETF Trust (the “Trust”) has established a liquidity risk management program (the “Program”) to govern the Trust’s approach to managing liquidity risk for each series of the Trust (each a “Fund”). The Program is overseen by the Liquidity Committee (the “Committee”), a committee comprised of representatives of the Trust’s investment adviser, ALPS Advisors, Inc. The Trust’s Board of Trustees (the “Board”) has approved the designation of the Committee to oversee the Program.
The Program’s principal objectives include supporting each Fund’s compliance with limits on investments in illiquid assets and assessing and managing the risk that a Fund will be unable to meet its redemption obligations without significant dilution of remaining investors’ interests in the Fund. The Program includes a number of elements that support the management and assessment of liquidity risk, including an annual assessment of factors that influence a Fund’s liquidity and, for Funds that are not “In-Kind ETFs,” the periodic classification and re-classification of such Fund’s investments into groupings that reflect the Committee’s assessment of their liquidity under current market conditions.
At a meeting of the Board held on March 2, 2020, the Trustees received a report from the Committee regarding the design and operational effectiveness of the Program since its implementation on December 1, 2018. The Committee determined, and reported to the Board, that the Program has been operating effectively to assess and manage each Fund’s liquidity risk and has been and continues to be adequately and effectively implemented to monitor and (as applicable) respond to the Funds’ liquidity developments.
The Committee reported that during the period covered by the report, there were no liquidity events that impacted the Funds or their ability to timely meet redemptions without dilution to existing shareholders. Among other things, the Committee’s report noted that no Fund is required to have a highly liquid investment minimum based either on its status as an In-Kind ETF or on its ability to rely on another exemption under the Liquidity Rule. The Committee’s report further noted that no material changes have been made to the Program since its implementation.
21 | May 31, 2020

Table of Contents
| Performance Overview | |
| RiverFront Dynamic Core Income ETF | 1 |
| RiverFront Dynamic Unconstrained Income ETF | 3 |
| RiverFront Dynamic US Dividend Advantage ETF | 5 |
| RiverFront Dynamic US Flex-Cap ETF | 7 |
| RiverFront Strategic Income Fund | 9 |
| Disclosure of Fund Expenses | 11 |
| Financial Statements | |
| Schedule of Investments | |
| RiverFront Dynamic Core Income ETF | 12 |
| RiverFront Dynamic Unconstrained Income ETF | 18 |
| RiverFront Dynamic US Dividend Advantage ETF | 22 |
| RiverFront Dynamic US Flex-Cap ETF | 24 |
| RiverFront Strategic Income Fund | 26 |
| Statement of Assets and Liabilities | 29 |
| Statement of Operations | 30 |
| Statements of Changes in Net Assets | |
| RiverFront Dynamic Core Income ETF | 31 |
| RiverFront Dynamic Unconstrained Income ETF | 32 |
| RiverFront Dynamic US Dividend Advantage ETF | 33 |
| RiverFront Dynamic US Flex-Cap ETF | 34 |
| RiverFront Strategic Income Fund | 35 |
| Financial Highlights | 36 |
| Notes to Financial Statements | 41 |
| Additional Information | 49 |
| Liquidity Risk Management Program | 50 |
Beginning on January 1, 2021, as permitted by regulations adopted by the U.S. Securities and Exchange Commission, paper copies of the Funds’ annual and semi-annual shareholder reports will no longer be sent by mail, unless you specifically request paper copies of the reports from your financial intermediary (such as a broker-dealer or bank). Instead, the reports will be made available on the Funds’ website (www.alpsfunds.com), and you will be notified by mail each time a report is posted and provided with a website link to access the report.
If you already elected to receive shareholder reports electronically, you will not be affected by this change and you need not take any action. You may elect to receive shareholder reports and other communications from a Fund electronically anytime by contacting your financial intermediary.
You may elect to receive all future reports in paper free of charge. You can contact your financial intermediary to request that you continue to receive paper copies of your shareholder reports. Your election to receive reports in paper will apply to all funds held in your account with your financial intermediary.
alpsfunds.com
RiverFront Dynamic Core Income ETF
| Performance Overview | May 31, 2020 (Unaudited) |
Investment Objective
RiverFront Dynamic Core Income ETF (the “Fund” or "RFCI") seeks total return, with an emphasis on income as the source of that total return. The Fund seeks to achieve its investment objective by investing in a global portfolio of fixed income securities of various maturities, ratings and currency denominations.
Performance Overview
RFCI underperformed its benchmark by 0.69% over the six-month period ended May 31, 2020, based on its returns at NAV. Despite the recent volatility, the Fund continues to prefer corporate bonds, which offer a yield advantage to US Treasuries and Mortgages. In this timeframe, investment grade corporate bond spreads widened by about 76 basis points, according to the ICE BofAML US Corporate Index. As of May 31, 2020, the Fund’s option-adjusted duration was 5.98 years and the average credit quality of the Fund was approximately A+.
Performance (as of May 31, 2020)
| 6 Months | 1 Year | 3 Year | Since Inception^ | |
| RiverFront Dynamic Core Income ETF – NAV | 4.71% | 8.27% | 4.54% | 3.57% |
| RiverFront Dynamic Core Income ETF – Market Price* | 5.44% | 8.81% | 4.69% | 3.72% |
| Bloomberg Barclays US Aggregate Bond Total Return Index | 5.40% | 9.42% | 5.07% | 3.94% |
Total Expense Ratio (per the current prospectus) is 0.52%.
Performance data quoted represents past performance. Past performance does not guarantee future results. Total return figures assume reinvestment of dividends and capital gains distributions, if any. The table does not reflect the deduction of taxes that a shareholder would pay on Fund distributions or the redemption of Fund shares. Investment return and principal value of an investment will fluctuate so that an investor’s shares, when sold or redeemed, may be worth more or less than the original cost. Current performance data may be higher or lower than actual data quoted. For the most current month-end performance data please visit www.alpsfunds.com or call 1.866.759.5679.
NAV is an exchange-traded fund’s per-share value. The per-share dollar amount of the fund is derived by dividing the total value of all the securities in its portfolio, less any liabilities, by the number of fund shares outstanding. Market Price is the price at which a share can currently be traded in the market. Information detailing the number of days the Market Price of the Fund was greater than the Fund’s NAV and the number of days it was less than the Fund’s NAV can be obtained at www.alpsfunds.com.
| ^ | The Fund commenced operations on June 14, 2016. |
| * | Market Price is based on the midpoint of the bid-ask spread at 4 p.m. ET and does not represent the returns an investor would receive if shares were traded at other times. |
Bloomberg Barclays U.S. Aggregate Bond Total Return Index is a broad-based benchmark that measures the investment grade, U.S. dollar-denominated, fixed-rate taxable bond market, including Treasuries, government-related and corporate securities, MBS (agency fixed-rate and hybrid ARM pass-throughs), ABS, and CMBS (agency and non-agency). The index is reported on a total return basis, which assumes reinvestment of any dividends and distributions realized during a given time period. The index is not actively managed and does not reflect any deductions for fees, expenses or taxes. One cannot invest directly in an index. Index performance does not reflect fund performance.
The RiverFront Dynamic Core Income ETF is not suitable for all investors. Investments in the Fund are subject to investment risks, including possible loss of the principal amount invested.
The Fund’s shares are not individually redeemable. Investors buy and sell shares of the Fund on a secondary market. Only market makers or “authorized participants” may trade directly with the Fund, typically in blocks of 50,000 shares.
ALPS Portfolio Solutions Distributor, Inc., a FINRA member, is the Distributor for the RiverFront Dynamic Core Income ETF.
1 | May 31, 2020
RiverFront Dynamic Core Income ETF
| Performance Overview | May 31, 2020 (Unaudited) |
Top 10 Holdings*^ (as of May 31, 2020)
| United States Treasury Bond 2.75%, 02/15/2028 | 6.97% |
| United States Treasury Note 3.00%, 10/31/2025 | 3.40% |
| United States Treasury Note 2.88%, 11/15/2021 | 3.09% |
| United States Treasury Strip Principal, 08/15/2039 | 2.87% |
| United States Treasury Strip Principal, 02/15/2038 | 2.50% |
| United States Treasury Note 2.88%, 10/31/2023 | 1.94% |
| United States Treasury Strip Principal, 05/15/2048 | 1.58% |
| United States Treasury Bond 2.75%, 11/15/2047 | 1.48% |
| United States Treasury Bond 3.88%, 08/15/2040 | 1.24% |
| United States Treasury Strip Principal, 11/15/2046 | 1.21% |
| Total % of Top 10 Holdings | 26.29% |
| * | % of Total Investments. |
| ^ | Excludes Money Market Fund |
Future holdings are subject to change.
Asset Allocation* (as of May 31, 2020)
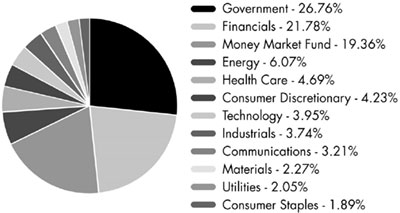
Growth of $10,000 (as of May 31, 2020)
Comparison of Change in Value of $10,000 Investment in the Fund and the Fund’s benchmark
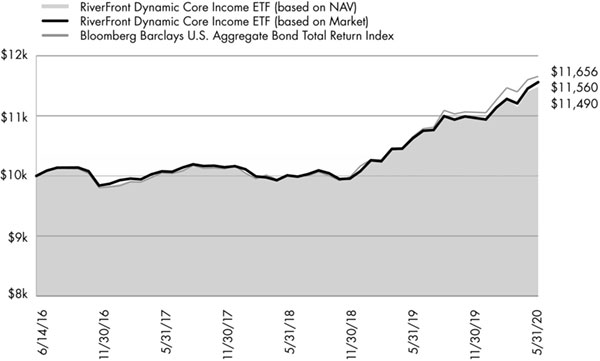
The chart above compares historical performance of a hypothetical investment of $10,000 in the Fund since inception with the performance of the Fund’s benchmark index. Past performance does not guarantee future results. The chart does not reflect the deduction of taxes that a shareholder would pay on Fund distributions or the redemption of Fund shares.
2 | May 31, 2020
RiverFront Dynamic Unconstrained Income ETF
| Performance Overview | May 31, 2020 (Unaudited) |
Investment Objective
RiverFront Dynamic Unconstrained Income ETF (the “Fund” or "RFUN") seeks total return, with an emphasis on income as the source of that total return. The Fund seeks to achieve its investment objective by investing in a global portfolio of fixed income securities of various maturities, ratings and currency denominations.
Performance Overview
RFUN outperformed its benchmark by 3.40% over the six months ending May 31, 2020, based on its return at NAV. The primary reason for the Fund’s outperformance was due to an elevated cash position and higher quality credit. The Fund continues to hold a significant underweight to the lowest rated (CCC) bonds. As of May 31, 2020 the Fund’s option-adjusted duration was 2.54 years and the average credit quality of the Fund was approximately BB-.
Performance (as of May 31, 2020)
| 6 Months | 1 Year | 3 Year | Since Inception^ | |
| RiverFront Dynamic Unconstrained Income ETF – NAV | -0.32% | 4.16% | 2.97% | 4.74% |
| RiverFront Dynamic Unconstrained Income ETF – Market Price* | -0.12% | 4.75% | 2.98% | 4.77% |
| ICE BofAML U.S. High Yield Master II Total Return Index | -3.72% | 0.35% | 2.65% | 5.21% |
Total Expense Ratio (per the current prospectus) is 0.52%.
Performance data quoted represents past performance. Past performance does not guarantee future results. Total return figures assume reinvestment of dividends and capital gains distributions, if any. The table does not reflect the deduction of taxes that a shareholder would pay on Fund distributions or the redemption of Fund shares. Investment return and principal value of an investment will fluctuate so that an investor’s shares, when sold or redeemed, may be worth more or less than the original cost. Current performance data may be higher or lower than actual data quoted. For the most current month-end performance data please visit www.alpsfunds.com or call 1.866.759.5679.
NAV is an exchange-traded fund’s per-share value. The per-share dollar amount of the fund is derived by dividing the total value of all the securities in its portfolio, less any liabilities, by the number of fund shares outstanding. Market Price is the price at which a share can currently be traded in the market. Information detailing the number of days the Market Price of the Fund was greater than the Fund’s NAV and the number of days it was less than the Fund’s NAV can be obtained at www.alpsfunds.com.
| ^ | The Fund commenced operations on June 14, 2016. |
| * | Market Price is based on the midpoint of the bid-ask spread at 4 p.m. ET and does not represent the returns an investor would receive if shares were traded at other times. |
ICE BofAML U.S. High Yield Master II Total Return Index tracks the performance of below-investment grade U.S. dollar-denominated corporate bonds issued in the U.S. Domestic market. The index is reported on a total return basis, which assumes reinvestment of any dividends and distributions realized during a given time period. The index is not actively managed and does not reflect any deductions for fees, expenses or taxes. One cannot invest directly in an index. Index performance does not reflect fund performance.
The RiverFront Dynamic Unconstrained Income ETF is not suitable for all investors. Investments in the Fund are subject to investment risks, including possible loss of the principal amount invested.
The Fund’s shares are not individually redeemable. Investors buy and sell shares of the Fund on a secondary market. Only market makers or “authorized participants” may trade directly with the Fund, typically in blocks of 50,000 shares.
ALPS Portfolio Solutions Distributor, Inc., a FINRA member, is the Distributor for the RiverFront Dynamic Unconstrained Income ETF.
3 | May 31, 2020
RiverFront Dynamic Unconstrained Income ETF
| Performance Overview | May 31, 2020 (Unaudited) |
Top 10 Holdings*^ (as of May 31, 2020)
| Xtrackers USD High Yield Corporate Bond ETF | 4.80% |
| iShares iBoxx High Yield Corporate Bond ETF | 4.78% |
| Lamar Media Corp. | 1.27% |
| United Rentals North America, Inc. | 1.23% |
| Spectrum Brands, Inc. | 1.21% |
| Hanesbrands, Inc. | 1.18% |
| CenturyLink, Inc. | 1.09% |
| T-Mobile USA, Inc. | 1.08% |
| HCA, Inc. | 1.02% |
| WESCO Distribution, Inc. | 1.00% |
| Total % of Top 10 Holdings | 18.65% |
| * | % of Total Investments. |
| ^ | Excludes Money Market Fund |
Future holdings are subject to change.
Asset Allocation* (as of May 31, 2020)
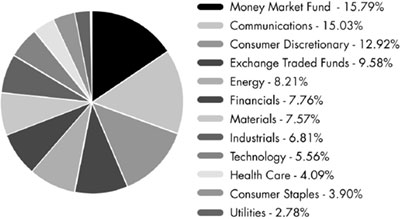
Growth of $10,000 (as of May 31, 2020)
Comparison of Change in Value of $10,000 Investment in the Fund and the Fund’s benchmark
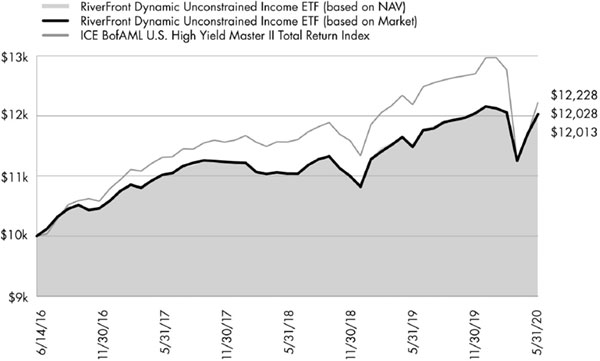
The chart above compares historical performance of a hypothetical investment of $10,000 in the Fund since inception with the performance of the Fund’s benchmark index. Results include the reinvestment of all dividends and capital gains distributions. Past performance does not guarantee future results. The graph does not reflect the deduction of taxes that a shareholder would pay on Fund distributions or the redemption of Fund shares.
4 | May 31, 2020
RiverFront Dynamic US Dividend Advantage ETF
| Performance Overview | May 31, 2020 (Unaudited) |
Investment Objective
RiverFront Dynamic US Dividend Advantage ETF (the “Fund” or "RFDA") seeks to provide capital appreciation and dividend income. Under normal conditions, the Fund seeks to achieve its investment objective by investing at least 65% of its net assets in a portfolio of equity securities of publicly traded U.S. companies with the potential for dividend growth. Equity securities include common stocks and common or preferred shares of real estate investment trusts (“REITs”).
Performance Overview
The Fund underperformed its benchmark over the six-month period ended May 31, 2020, due largely to stock selection decisions. Security selection in the finance sector led to the majority of this weakness, with technology and consumer staples selection also detracting. The selection in these sectors overshadowed positive selection effects in the discretionary and healthcare sectors. The period was also a time where companies with ‘value’ characteristics, a bias in our portfolios, significantly underperformed their peers.
Performance (as of May 31, 2020)
| 6 Months | 1 Year | 3 Year | Since Inception^ | |
| RiverFront Dynamic US Dividend Advantage ETF – NAV | -5.63% | 7.09% | 6.21% | 8.20% |
| RiverFront Dynamic US Dividend Advantage ETF – Market Price* | -5.60% | 7.16% | 6.24% | 8.22% |
| S&P 500® Total Return Index | -2.10% | 12.84% | 10.23% | 11.88% |
Total Expense Ratio (per the current prospectus) is 0.52%.
Performance data quoted represents past performance. Past performance does not guarantee future results. Total return figures assume reinvestment of dividends and capital gains distributions, if any. The table does not reflect the deduction of taxes that a shareholder would pay on Fund distributions or the redemption of Fund shares. Investment return and principal value of an investment will fluctuate so that an investor’s shares, when sold or redeemed, may be worth more or less than the original cost. Current performance data may be higher or lower than actual data quoted. For the most current month-end performance data please visit www.alpsfunds.com or call 1.866.759.5679.
NAV is an exchange-traded fund’s per-share value. The per-share dollar amount of the fund is derived by dividing the total value of all the securities in its portfolio, less any liabilities, by the number of fund shares outstanding. Market Price is the price at which a share can currently be traded in the market. Information detailing the number of days the Market Price of the Fund was greater than the Fund’s NAV and the number of days it was less than the Fund’s NAV can be obtained at www.alpsfunds.com.
| ^ | The Fund commenced operations on June 7, 2016. |
| * | Market Price is based on the midpoint of the bid-ask spread at 4 p.m. ET and does not represent the returns an investor would receive if shares were traded at other times. |
S&P 500® Total Return Index is the Standard & Poor’s composite index of 500 stocks, a widely recognized, unmanaged index of common stock prices. The index is reported on a total return basis, which assumes reinvestment of any dividends and distributions realized during a given time period. The index is not actively managed and does not reflect any deductions for fees, expenses or taxes. One cannot invest directly in an index. Index performance does not reflect fund performance.
The RiverFront Dynamic US Dividend Advantage ETF is not suitable for all investors. Investments in the Fund are subject to investment risks, including possible loss of the principal amount invested.
The Fund’s shares are not individually redeemable. Investors buy and sell shares of the Fund on a secondary market. Only market makers or “authorized participants” may trade directly with the Fund, typically in blocks of 50,000 shares.
ALPS Portfolio Solutions Distributor, Inc., a FINRA member, is the Distributor for the RiverFront Dynamic US Dividend Advantage ETF.
5 | May 31, 2020
RiverFront Dynamic US Dividend Advantage ETF
| Performance Overview | May 31, 2020 (Unaudited) |
Top 10 Holdings* (as of May 31, 2020)
| Microsoft Corp. | 6.03% |
| Apple, Inc. | 5.90% |
| Amazon.com, Inc. | 4.41% |
| Johnson & Johnson | 2.60% |
| Visa, Inc. | 2.34% |
| Home Depot, Inc. | 1.95% |
| Pfizer, Inc. | 1.93% |
| Intel Corp. | 1.77% |
| Verizon Communications, Inc. | 1.72% |
| AT&T, Inc. | 1.71% |
| Total % of Top 10 Holdings | 30.36% |
| * | % of Total Investments (excluding investments purchased with collateral from securities loaned) |
Future holdings are subject to change.
Asset Allocation* (as of May 31, 2020)

Growth of $10,000 (as of May 31, 2020)
Comparison of Change in Value of $10,000 Investment in the Fund and the Fund’s benchmark
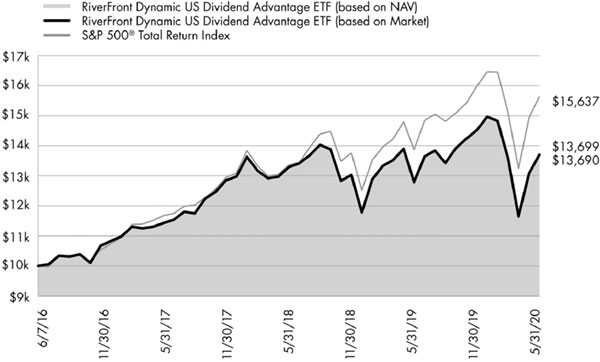
The chart above compares historical performance of a hypothetical investment of $10,000 in the Fund since inception with the performance of the Fund’s benchmark index. Results include the reinvestment of all dividends and capital gains distributions. Past performance does not guarantee future results. The graph does not reflect the deduction of taxes that a shareholder would pay on Fund distributions or the redemption of Fund shares.
6 | May 31, 2020
RiverFront Dynamic US Flex-Cap ETF
| Performance Overview | May 31, 2020 (Unaudited) |
Investment Objective
RiverFront Dynamic US Flex-Cap ETF (the “Fund” or "RFFC") seeks to provide capital appreciation. Under normal conditions, the Fund seeks to achieve its investment objective by investing at least 65% of its net assets in a portfolio of equity securities of publicly traded U.S. companies. Equity securities include common stocks and common or preferred shares of real estate investment trusts (“REITs”).
Performance Overview
The Fund underperformed its benchmark over the six-month period ended May 31, 2020, due largely to stock selection decisions. Security selection weakness was led by technology, non-energy materials and financial stocks. Contrary to this, security selection in the discretionary and industrials sectors contributed positively to the Fund’s performance. The period was also a time where companies with ‘value’ characteristics, a bias in our portfolios, significantly underperformed their peers.
Performance (as of May 31, 2020)
| 6 Months | 1 Year | 3 Year | Since Inception^ | |
| RiverFront Dynamic US Flex-Cap ETF – NAV | -8.09% | 3.67% | 4.25% | 7.29% |
| RiverFront Dynamic US Flex-Cap ETF – Market Price* | -8.12% | 3.70% | 4.23% | 7.29% |
| S&P Composite 1500® Index | -3.12% | 11.39% | 9.47% | 11.28% |
Total Expense Ratio (per the current prospectus) is 0.52%.
Performance data quoted represents past performance. Past performance does not guarantee future results. Total return figures assume reinvestment of dividends and capital gains distributions, if any. The table does not reflect the deduction of taxes that a shareholder would pay on Fund distributions or the redemption of Fund shares. Investment return and principal value of an investment will fluctuate so that an investor’s shares, when sold or redeemed, may be worth more or less than the original cost. Current performance data may be higher or lower than actual data quoted. For the most current month-end performance data please visit www.alpsfunds.com or call 1.866.759.5679.
NAV is an exchange-traded fund’s per-share value. The per-share dollar amount of the fund is derived by dividing the total value of all the securities in its portfolio, less any liabilities, by the number of fund shares outstanding. Market Price is the price at which a share can currently be traded in the market. Information detailing the number of days the Market Price of the Fund was greater than the Fund’s NAV and the number of days it was less than the Fund’s NAV can be obtained at www.alpsfunds.com.
| ^ | The Fund commenced operations on June 7, 2016. |
| * | Market Price is based on the midpoint of the bid-ask spread at 4 p.m. ET and does not represent the returns an investor would receive if shares were traded at other times. |
S&P Composite 1500® Total Return Index is the Standard & Poor’s broad-based unmanaged capitalization-weighted index comprising 1,500 stocks of Large-cap, Mid-cap, and Small-cap U.S. companies. The index is reported on a total return basis, which assumes reinvestment of any dividends and distributions realized during a given time period. The index is not actively managed and does not reflect any deductions for fees, expenses or taxes. One cannot invest directly in an index. Index performance does not reflect fund performance.
The RiverFront Dynamic US Flex-Cap ETF is not suitable for all investors. Investments in the Fund are subject to investment risks, including possible loss of the principal amount invested.
The Fund’s shares are not individually redeemable. Investors buy and sell shares of the Fund on a secondary market. Only market makers or “authorized participants” may trade directly with the Fund, typically in blocks of 50,000 shares.
ALPS Portfolio Solutions Distributor, Inc., a FINRA member, is the Distributor for the RiverFront Dynamic US Flex-Cap ETF.
7 | May 31, 2020
RiverFront Dynamic US Flex-Cap ETF
| Performance Overview | May 31, 2020 (Unaudited) |
Top 10 Holdings* (as of May 31, 2020)
| Microsoft Corp. | 5.17% |
| Apple, Inc. | 5.14% |
| Amazon.com, Inc. | 3.95% |
| Alphabet, Inc. | 2.43% |
| Visa, Inc. | 1.93% |
| Johnson & Johnson | 1.84% |
| Cisco Systems, Inc. | 1.62% |
| Pfizer, Inc. | 1.60% |
| Salesforce.com, Inc. | 1.37% |
| Home Depot, Inc. | 1.36% |
| Total % of Top 10 Holdings | 26.41% |
| * | % of Total Investments (excluding investments purchased with collateral from securities loaned) |
Future holdings are subject to change.
Asset Allocation* (as of May 31, 2020)
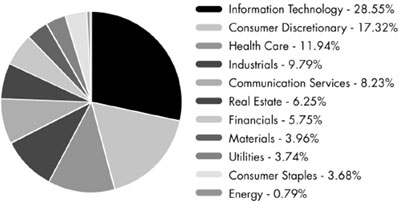
Growth of $10,000 (as of May 31, 2020)
Comparison of Change in Value of $10,000 Investment in the Fund and the Fund’s benchmark

The chart above compares historical performance of a hypothetical investment of $10,000 in the Fund since inception with the performance of the Fund’s benchmark index. Results include the reinvestment of all dividends and capital gains distributions. Past performance does not guarantee future results. The graph does not reflect the deduction of taxes that a shareholder would pay on Fund distributions or the redemption of Fund shares.
8 | May 31, 2020
RiverFront Strategic Income Fund
| Performance Overview | May 31, 2020 (Unaudited) |
Investment Objective
The RiverFront Strategic Income Fund (the “Fund” or "RIGS") seeks total return, with an emphasis on income as the source of that total return. The Fund seeks to achieve its investment objective by investing in a global portfolio of fixed income securities of various maturities, ratings and currency denominations. The Fund intends to utilize various investment strategies in a broad array of fixed income sectors.
Performance Overview
RIGS underperformed its benchmark by 5.39% over the six-month period ending May 31, 2020, based on its return at NAV. The primary sources of the Fund’s underperformance were its shorter duration and its lower credit quality. Over the preceding six months, the Fund continued to be invested primarily in shorter-maturity, higher quality, below investment grade rated bonds. High yield spreads widened during this period, as fears surrounding COVID-19 negatively impacted the credit market. Treasury yields fell significantly during this period as well, leading shorter duration securities to underperform. We maintain our preference for high yield credit considering the income advantage relative to traditional sectors of the bond market. As of May 31, 2020, the duration of the Fund was about 1.63 years. The average credit quality of the Fund was approximately BB-rated.
Performance (as of May 31, 2020)
| 6 Months | 1 Year | 5 Year | Since Inception^ | |
| RiverFront Strategic Income Fund – NAV | 0.01% | 2.58% | 3.47% | 3.89% |
| RiverFront Strategic Income Fund – Market Price* | -1.88% | 0.11% | 3.10% | 3.62% |
| Bloomberg Barclays U.S. Aggregate Bond Total Return Index | 5.40% | 9.42% | 3.94% | 3.99% |
Total Expense Ratio (per the current prospectus) is 0.47%. The Fund’s management fees consist of a fee of 0.11% paid to the Fund’s investment adviser and a fee of 0.35% paid to the Fund’s sub-adviser.
Performance data quoted represents past performance. Past performance does not guarantee future results. Total return figures assume reinvestment of dividends and capital gains distributions, if any. The table does not reflect the deduction of taxes that a shareholder would pay on Fund distributions or the redemption of Fund shares. Investment return and principal value of an investment will fluctuate so that an investor’s shares, when sold or redeemed, may be worth more or less than the original cost. Current performance data may be higher or lower than actual data quoted. For most current month-end performance data please visit www.alpsfunds.com or call 1.866.759.5679.
NAV is an exchange-traded fund’s per-share value. The per-share dollar amount of the Fund is derived by dividing the total value of all the securities in its portfolio, less any liabilities, by the number of Fund shares outstanding. Market Price is the price at which a share can currently be traded in the market. Information detailing the number of days the Market Price of the Fund was greater than the Fund’s NAV and the number of days it was less than the Fund’s NAV can be obtained at www.alpsfunds.com.
| ^ | The Fund commenced Investment Operations on October 8, 2013. |
| * | Market Price is based on the midpoint of the bid/ask spread at 4 p.m. ET and does not represent the returns an investor would receive if shares were traded at other times |
Duration is a measure of the sensitivity of the price (the value of principal) of a fixed-income investment to a change in interest rates. Duration is expressed as a number of years. The duration number is a calculation involving present value, yield, coupon, final maturity and call features. The bigger the duration number, the greater the interest-rate risk or reward for bond prices. Rising interest rates mean falling bond prices, while declining interest rates mean rising bond prices.
Bloomberg Barclays U.S. Aggregate Bond Total Return Index is a broad-based benchmark that measures the investment grade, U.S. dollar-denominated, fixed-rate taxable bond market, including Treasuries, government-related and corporate securities, MBS (agency fixed-rate and hybrid ARM pass-throughs), ABS, and CMBS (agency and non-agency). The index is reported on a total return basis, which assumes reinvestment of any dividends and distributions realized during a given time period. The index is not actively managed and does not reflect any deductions for fees, expenses or taxes. One cannot invest directly in an index. Index performance does not reflect fund performance.
The RiverFront Strategic Income Fund is not suitable for all investors. Investments in the Fund are subject to investment risks, including possible loss of the principal amount invested.
ALPS Portfolio Solutions Distributor, Inc., a FINRA member, is the distributor for the RiverFront Strategic Income Fund.
9 | May 31, 2020
RiverFront Strategic Income Fund
| Performance Overview | May 31, 2020 (Unaudited) |
Top 10 Holdings*^ (as of May 31, 2020)
| XPO Logistics, Inc. | 2.09% |
| Sprint Communications, Inc. | 1.63% |
| CIT Group, Inc. | 1.56% |
| WESCO Distribution, Inc. | 1.55% |
| T-Mobile USA, Inc. | 1.52% |
| Marathon Petroleum Corp. | 1.41% |
| WR Grace & Co.-Conn | 1.40% |
| FMG Resources August 2006 Pty, Ltd. | 1.40% |
| International Game Technology PLC | 1.36% |
| Park Aerospace Holdings, Ltd. | 1.34% |
| Total % of Top 10 Holdings | 15.26% |
| * | % of Total Investments. |
| ^ | Excludes Money Market Fund |
Future holdings are subject to change.
Asset Allocation* (as of May 31, 2020)
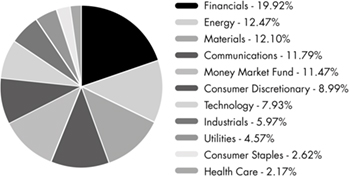
Growth of $10,000 (as of May 31, 2020)
Comparison of Change in Value of $10,000 Investment in the Fund and the Fund’s benchmark
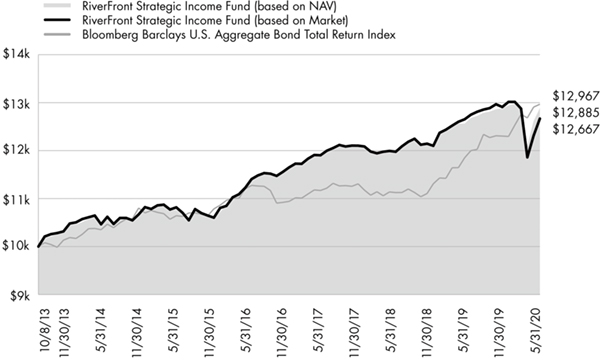
The chart above compares historical performance of a hypothetical investment of $10,000 in the Fund since inception with the performance of the Fund’s benchmark index. Results include the reinvestment of all dividends and capital gains distributions. Past performance does not guarantee future results. The graph does not reflect the deduction of taxes that a shareholder would pay on Fund distributions or the redemption of Fund shares.
10 | May 31, 2020
RiverFront ETFs
| Disclosure of Fund Expenses | May 31, 2020 (Unaudited) |
Shareholder Expense Example: As a shareholder of a Fund, you incur two types of costs: (1) transaction costs which may include creation and redemption fees or brokerage charges, and (2) ongoing costs, including management fees and other Fund expenses. These examples are intended to help you understand your ongoing costs (in dollars) of investing in a Fund and to compare these costs with the ongoing costs of investing in other funds. It is based on an investment of $1,000 invested at the beginning of the (six month) period and held through May 31, 2020.
Actual Return: The first line of the table provides information about actual account values and actual expenses. You may use the information in this line, together with the amount you invested, to estimate the expenses that you incurred over the period. Simply divide your account value by $1,000 (for example, an $8,600 account value divided by $1,000 = 8.6), then multiply the result by the number in the first line under the heading entitled “Expenses Paid During Period” to estimate the expenses attributable to your investment during this period.
Hypothetical 5% Return: The second line of the table provides information about hypothetical account values and hypothetical expenses based on the Fund’s actual expense ratio and an assumed rate of return of 5% per year before expenses, which is not the Fund’s actual return. The hypothetical account values and expenses may not be used to estimate the actual ending account balance or expenses you paid for the period. You may use this information to compare ongoing costs of investing in the Fund and other funds. To do so, compare this 5% hypothetical example with the 5% hypothetical examples that appear in the shareholder reports of other funds.
The expenses shown in the table are meant to highlight ongoing Fund costs only and do not reflect any transaction costs, such as creation and redemption fees or brokerage charges. Therefore, the second line is useful in comparing ongoing costs only, and will not help you determine the relative total costs of owning different funds. In addition, if these costs were included, your costs would have been higher.
| Beginning Account Value 12/1/19 | Ending Account Value 5/31/20 | Expense Ratio(a) | Expenses Paid During Period 12/1/19 - 5/31/20(b) | |
| RiverFront Dynamic Core Income ETF | ||||
| Actual | $1,000.00 | $1,047.10 | 0.51% | $2.61 |
| Hypothetical (5% return before expenses) | $1,000.00 | $1,022.45 | 0.51% | $2.58 |
| RiverFront Dynamic Unconstrained Income ETF | ||||
| Actual | $1,000.00 | $996.80 | 0.51% | $2.55 |
| Hypothetical (5% return before expenses) | $1,000.00 | $1,022.45 | 0.51% | $2.58 |
| RiverFront Dynamic US Dividend Advantage ETF | ||||
| Actual | $1,000.00 | $943.70 | 0.52% | $2.53 |
| Hypothetical (5% return before expenses) | $1,000.00 | $1,022.40 | 0.52% | $2.63 |
| RiverFront Dynamic US Flex-Cap ETF | ||||
| Actual | $1,000.00 | $919.10 | 0.52% | $2.49 |
| Hypothetical (5% return before expenses) | $1,000.00 | $1,022.40 | 0.52% | $2.63 |
| RiverFront Strategic Income Fund | ||||
| Actual | $1,000.00 | $1,000.10 | 0.46% | $2.30 |
| Hypothetical (5% return before expenses) | $1,000.00 | $1,022.70 | 0.46% | $2.33 |
| (a) | Annualized, based on the Fund's most recent fiscal half year expenses. |
| (b) | Expenses are equal to the Fund's annualized expense ratio multiplied by the average account value over the period, multiplied by the number of days in the most recent fiscal half year (183), divided by 366. |
11 | May 31, 2020
RiverFront Dynamic Core Income ETF
| Schedule of Investments | May 31, 2020 (Unaudited) |
| Security Description | Principal Amount | Value | ||||||
| CORPORATE BONDS (53.65%) | ||||||||
| Communications (3.20%) | ||||||||
| Alphabet, Inc. | ||||||||
| 2.00%, 08/15/2026 | $ | 240,000 | $ | 259,984 | ||||
| AT&T, Inc. | ||||||||
| 3.40%, 05/15/2025 | 160,000 | 172,950 | ||||||
| 4.10%, 02/15/2028 | 409,000 | 454,499 | ||||||
| Charter Communications Operating LLC / Charter Communications Operating Capital | ||||||||
| 3.58%, 07/23/2020 | 320,000 | 320,020 | ||||||
| Comcast Corp. | ||||||||
| 3.60%, 03/01/2024 | 86,000 | 95,249 | ||||||
| 3.55%, 05/01/2028 | 240,000 | 272,474 | ||||||
| 4.15%, 10/15/2028 | 160,000 | 189,731 | ||||||
| Discovery Communications LLC | ||||||||
| 2.95%, 03/20/2023 | 84,000 | 87,445 | ||||||
| 3.95%, 03/20/2028 | 160,000 | 172,724 | ||||||
| Lamar Media Corp. | ||||||||
| 5.00%, 05/01/2023 | 320,000 | 322,197 | ||||||
| Level 3 Financing, Inc. | ||||||||
| 5.13%, 05/01/2023 | 70,000 | 70,095 | ||||||
| Time Warner Cable LLC | ||||||||
| 4.00%, 09/01/2021 | 105,000 | 107,652 | ||||||
| T-Mobile USA, Inc. | ||||||||
| 4.00%, 04/15/2022 | 240,000 | 247,348 | ||||||
| TWDC Enterprises 18 Corp. | ||||||||
| 2.45%, 03/04/2022 | 80,000 | 82,996 | ||||||
| 3.15%, 09/17/2025 | 47,000 | 52,045 | ||||||
| VeriSign, Inc. | ||||||||
| 4.63%, 05/01/2023 | 240,000 | 241,775 | ||||||
| Verizon Communications, Inc. | ||||||||
| 3.38%, 02/15/2025 | 27,000 | 29,930 | ||||||
| 3M US L + 1.10%, 05/15/2025(a) | 135,000 | 134,841 | ||||||
| 4.33%, 09/21/2028 | 240,000 | 286,688 | ||||||
| 4.02%, 12/03/2029 | 134,000 | 157,769 | ||||||
| ViacomCBS, Inc. | ||||||||
| 3.50%, 01/15/2025 | 439,000 | 454,979 | ||||||
| 3.70%, 06/01/2028 | 48,000 | 49,969 | ||||||
| Walt Disney Co. | ||||||||
| 3.00%, 09/15/2022 | 160,000 | 167,888 | ||||||
| Total Communications | 4,431,248 | |||||||
| Consumer Discretionary (4.21%) | ||||||||
| ADT Security Corp. | ||||||||
| 4.13%, 06/15/2023 | 105,000 | 105,536 | ||||||
| Alibaba Group Holding, Ltd. | ||||||||
| 3.60%, 11/28/2024 | 320,000 | 348,125 | ||||||
| 3.40%, 12/06/2027 | 240,000 | 266,660 | ||||||
| Amazon.com, Inc. | ||||||||
| 3.15%, 08/22/2027 | 483,000 | 549,041 | ||||||
| American Honda Finance Corp. | ||||||||
| 2.60%, 11/16/2022 | 178,000 | 183,688 | ||||||
| Delta Air Lines, Inc. | ||||||||
| 3.40%, 04/19/2021 | 240,000 | 230,622 | ||||||
| Security Description | Principal Amount | Value | ||||||
| Consumer Discretionary (continued) | ||||||||
| eBay, Inc. | ||||||||
| 2.88%, 08/01/2021 | $ | 160,000 | $ | 163,521 | ||||
| 3.45%, 08/01/2024 | 160,000 | 172,939 | ||||||
| General Motors Financial Co., Inc. | ||||||||
| 3.20%, 07/13/2020 | 136,000 | 136,162 | ||||||
| 4.38%, 09/25/2021 | 80,000 | 80,489 | ||||||
| 3.70%, 05/09/2023 | 409,000 | 408,244 | ||||||
| Goodyear Tire & Rubber Co. | ||||||||
| 5.13%, 11/15/2023 | 240,000 | 232,650 | ||||||
| Hilton Worldwide Finance LLC / Hilton Worldwide Finance Corp. | ||||||||
| 4.63%, 04/01/2025 | 80,000 | 79,692 | ||||||
| Home Depot, Inc. | ||||||||
| 2.70%, 04/01/2023 | 320,000 | 338,697 | ||||||
| Lowe's Cos., Inc. | ||||||||
| 2.50%, 04/15/2026 | 160,000 | 170,602 | ||||||
| 3.10%, 05/03/2027 | 160,000 | 174,618 | ||||||
| Marriott International, Inc. | ||||||||
| 4.00%, 04/15/2028 | 210,000 | 203,167 | ||||||
| McDonald's Corp. | ||||||||
| 3.70%, 01/30/2026 | 240,000 | 269,107 | ||||||
| 3.50%, 03/01/2027 | 80,000 | 89,515 | ||||||
| Service Corp. International | ||||||||
| 5.38%, 05/15/2024 | 240,000 | 246,025 | ||||||
| Starbucks Corp. | ||||||||
| 3.85%, 10/01/2023 | 240,000 | 261,958 | ||||||
| TJX Cos., Inc. | ||||||||
| 2.75%, 06/15/2021 | 80,000 | 81,476 | ||||||
| Toyota Motor Corp. | ||||||||
| 3.42%, 07/20/2023 | 578,000 | 620,834 | ||||||
| Toyota Motor Credit Corp. | ||||||||
| 3M US L + 0.39%, 01/11/2023(a) | 240,000 | 236,008 | ||||||
| 3.20%, 01/11/2027 | 160,000 | 174,883 | ||||||
| Total Consumer Discretionary | 5,824,259 | |||||||
| Consumer Staples (1.88%) | ||||||||
| Anheuser-Busch InBev Worldwide, Inc. | ||||||||
| 4.00%, 04/13/2028 | 160,000 | 181,573 | ||||||
| Constellation Brands, Inc. | ||||||||
| 2.70%, 05/09/2022 | 80,000 | 82,316 | ||||||
| 4.25%, 05/01/2023 | 240,000 | 262,519 | ||||||
| 4.75%, 12/01/2025 | 80,000 | 92,429 | ||||||
| Kroger Co. | ||||||||
| 3.70%, 08/01/2027 | 81,000 | 91,770 | ||||||
| PepsiCo, Inc. | ||||||||
| 1.70%, 10/06/2021 | 578,000 | 587,244 | ||||||
| 3.10%, 07/17/2022 | 240,000 | 252,467 | ||||||
| Procter & Gamble Co. | ||||||||
| 2.45%, 11/03/2026 | 240,000 | 262,281 | ||||||
See Notes to Financial Statements.
12 | May 31, 2020
RiverFront Dynamic Core Income ETF
| Schedule of Investments | May 31, 2020 (Unaudited) |
| Security Description | Principal Amount | Value | ||||||
| Consumer Staples (continued) | ||||||||
| Walmart, Inc. | ||||||||
| 3.40%, 06/26/2023 | $ | 224,000 | $ | 243,044 | ||||
| 3.30%, 04/22/2024 | 240,000 | 262,489 | ||||||
| 3.70%, 06/26/2028 | 240,000 | 284,377 | ||||||
| Total Consumer Staples | 2,602,509 | |||||||
| Energy (6.04%) | ||||||||
| BP Capital Markets America, Inc. | ||||||||
| 3.25%, 05/06/2022 | 826,000 | 863,055 | ||||||
| BP Capital Markets PLC | ||||||||
| 3.51%, 03/17/2025 | 210,000 | 231,419 | ||||||
| 3.72%, 11/28/2028 | 160,000 | 180,252 | ||||||
| Chevron Corp. | ||||||||
| 2.90%, 03/03/2024 | 409,000 | 441,380 | ||||||
| 3.33%, 11/17/2025 | 240,000 | 269,902 | ||||||
| 2.95%, 05/16/2026 | 229,000 | 253,924 | ||||||
| Concho Resources, Inc. | ||||||||
| 3.75%, 10/01/2027 | 160,000 | 167,675 | ||||||
| ConocoPhillips Co. | ||||||||
| 4.95%, 03/15/2026 | 160,000 | 190,724 | ||||||
| Continental Resources, Inc. | ||||||||
| 4.50%, 04/15/2023 | 240,000 | 223,272 | ||||||
| 3.80%, 06/01/2024 | 240,000 | 210,000 | ||||||
| Energy Transfer Operating LP | ||||||||
| 3.60%, 02/01/2023 | 138,000 | 141,424 | ||||||
| 4.25%, 03/15/2023 | 35,000 | 36,345 | ||||||
| Enterprise Products Operating LLC | ||||||||
| 3.35%, 03/15/2023 | 409,000 | 433,612 | ||||||
| Exxon Mobil Corp. | ||||||||
| 2.22%, 03/01/2021 | 409,000 | 414,040 | ||||||
| 3.04%, 03/01/2026 | 578,000 | 641,252 | ||||||
| Halliburton Co. | ||||||||
| 3.80%, 11/15/2025 | 10,000 | 10,590 | ||||||
| Kinder Morgan Energy Partners LP | ||||||||
| 4.25%, 09/01/2024 | 240,000 | 262,903 | ||||||
| Marathon Oil Corp. | ||||||||
| 4.40%, 07/15/2027 | 48,000 | 44,472 | ||||||
| Marathon Petroleum Corp. | ||||||||
| 3.80%, 04/01/2028 | 160,000 | 162,347 | ||||||
| MPLX LP | ||||||||
| 4.50%, 07/15/2023 | 210,000 | 220,789 | ||||||
| 5.25%, 01/15/2025 | 255,000 | 264,425 | ||||||
| Nabors Industries, Inc. | ||||||||
| 5.00%, 09/15/2020 | 53,000 | 51,881 | ||||||
| Newfield Exploration Co. | ||||||||
| 5.63%, 07/01/2024 | 240,000 | 218,886 | ||||||
| ONEOK Partners LP | ||||||||
| 3.38%, 10/01/2022 | 409,000 | 412,824 | ||||||
| Sabine Pass Liquefaction LLC | ||||||||
| 5.63%, 02/01/2021 | 80,000 | 81,599 | ||||||
| 5.63%, 04/15/2023 | 320,000 | 346,427 | ||||||
| 5.75%, 05/15/2024 | 160,000 | 177,152 | ||||||
| Schlumberger Investment SA | ||||||||
| 3.65%, 12/01/2023 | 663,000 | 702,540 | ||||||
| Shell International Finance BV | ||||||||
| 2.88%, 05/10/2026 | 240,000 | 262,164 | ||||||
| Security Description | Principal Amount | Value | ||||||
| Energy (continued) | ||||||||
| Williams Cos., Inc. | ||||||||
| 4.55%, 06/24/2024 | $ | 160,000 | $ | 173,899 | ||||
| 3.90%, 01/15/2025 | 253,000 | 271,039 | ||||||
| Total Energy | 8,362,213 | |||||||
| Financials (21.68%) | ||||||||
| Aflac, Inc. | ||||||||
| 3.63%, 11/15/2024 | 320,000 | 357,528 | ||||||
| Aircastle, Ltd. | ||||||||
| 5.50%, 02/15/2022 | 320,000 | 300,891 | ||||||
| Ally Financial, Inc. | ||||||||
| 4.13%, 02/13/2022 | 596,000 | 610,563 | ||||||
| American Express Credit Corp. | ||||||||
| 2.25%, 05/05/2021 | 320,000 | 324,771 | ||||||
| American International Group, Inc. | ||||||||
| 4.13%, 02/15/2024 | 136,000 | 149,255 | ||||||
| 3.90%, 04/01/2026 | 160,000 | 176,168 | ||||||
| Bank of America Corp. | ||||||||
| 3M US L + 0.77%, 02/05/2026(a) | 826,000 | 795,040 | ||||||
| 4.25%, 10/22/2026 | 409,000 | 460,340 | ||||||
| Bank of Montreal | ||||||||
| 1.90%, 08/27/2021 | 826,000 | 840,542 | ||||||
| 2.35%, 09/11/2022 | 240,000 | 250,327 | ||||||
| 2.55%, 11/06/2022 | 160,000 | 167,433 | ||||||
| Bank of New York Mellon Corp. | ||||||||
| 2.45%, 11/27/2020 | 532,000 | 536,539 | ||||||
| 3M US L + 1.05%, 10/30/2023(a) | 402,000 | 403,045 | ||||||
| 3.25%, 05/16/2027 | 65,000 | 72,721 | ||||||
| Barclays PLC | ||||||||
| 3M US L + 1.38%, 05/16/2024(a) | 409,000 | 398,340 | ||||||
| Berkshire Hathaway, Inc. | ||||||||
| 3.13%, 03/15/2026 | 409,000 | 457,976 | ||||||
| BNP Paribas SA | ||||||||
| 5.00%, 01/15/2021 | 136,000 | 139,823 | ||||||
| 3.25%, 03/03/2023 | 210,000 | 225,647 | ||||||
| Boston Properties LP | ||||||||
| 3.85%, 02/01/2023 | 663,000 | 704,847 | ||||||
| Capital One Financial Corp. | ||||||||
| 3.50%, 06/15/2023 | 498,000 | 525,614 | ||||||
| 3.30%, 10/30/2024 | 105,000 | 109,389 | ||||||
| 3.80%, 01/31/2028 | 52,000 | 54,345 | ||||||
| Capital One NA | ||||||||
| 2.25%, 09/13/2021 | 240,000 | 242,971 | ||||||
| Charles Schwab Corp. | ||||||||
| 2.65%, 01/25/2023 | 240,000 | 252,787 | ||||||
| Chubb INA Holdings, Inc. | ||||||||
| 2.70%, 03/13/2023 | 95,000 | 100,081 | ||||||
| 3.35%, 05/03/2026 | 398,000 | 444,395 | ||||||
See Notes to Financial Statements.
13 | May 31, 2020
RiverFront Dynamic Core Income ETF
| Schedule of Investments | May 31, 2020 (Unaudited) |
| Security Description | Principal Amount | Value | ||||||
| Financials (continued) | ||||||||
| Citigroup, Inc. | ||||||||
| 2.65%, 10/26/2020 | $ | 240,000 | $ | 242,039 | ||||
| 2.70%, 03/30/2021 | 290,000 | 294,861 | ||||||
| 3M US L + 1.43%, 09/01/2023(a) | 409,000 | 411,743 | ||||||
| 4.45%, 09/29/2027 | 240,000 | 267,544 | ||||||
| CME Group, Inc. | ||||||||
| 3.75%, 06/15/2028 | 80,000 | 95,373 | ||||||
| Cooperatieve Rabobank UA | ||||||||
| 4.63%, 12/01/2023 | 409,000 | 446,832 | ||||||
| CoreCivic, Inc. | ||||||||
| 4.63%, 05/01/2023 | 240,000 | 233,550 | ||||||
| Credit Suisse Group Funding Guernsey, Ltd. | ||||||||
| 3.13%, 12/10/2020 | 135,000 | 136,573 | ||||||
| 3.45%, 04/16/2021 | 136,000 | 139,193 | ||||||
| 4.55%, 04/17/2026 | 370,000 | 420,150 | ||||||
| Crown Castle International Corp. | ||||||||
| 4.88%, 04/15/2022 | 115,000 | 123,013 | ||||||
| Deutsche Bank AG | ||||||||
| 4.25%, 10/14/2021 | 240,000 | 243,576 | ||||||
| 3.95%, 02/27/2023 | 160,000 | 163,554 | ||||||
| Discover Bank | ||||||||
| 3.20%, 08/09/2021 | 80,000 | 80,841 | ||||||
| 4.65%, 09/13/2028 | 210,000 | 229,597 | ||||||
| Fidelity National Information Services, Inc. | ||||||||
| 3.50%, 04/15/2023 | 135,000 | 143,951 | ||||||
| Goldman Sachs Group, Inc. | ||||||||
| 3M US L + 0.75%, 02/23/2023(a) | 663,000 | 651,592 | ||||||
| 3M US L + 1.60%, 11/29/2023(a) | 409,000 | 411,861 | ||||||
| 3.50%, 11/16/2026 | 40,000 | 43,170 | ||||||
| Host Hotels & Resorts LP | ||||||||
| 4.00%, 06/15/2025 | 160,000 | 159,037 | ||||||
| HSBC Holdings PLC | ||||||||
| 4.30%, 03/08/2026 | 210,000 | 235,444 | ||||||
| 3.90%, 05/25/2026 | 320,000 | 352,057 | ||||||
| 3M US L + 1.38%, 09/12/2026(a) | 240,000 | 235,994 | ||||||
| 4.38%, 11/23/2026 | 160,000 | 175,340 | ||||||
| Huntington Bancshares, Inc. | ||||||||
| 3.15%, 03/14/2021 | 320,000 | 324,953 | ||||||
| 4.00%, 05/15/2025 | 48,000 | 53,142 | ||||||
| Huntington National Bank | ||||||||
| 3.25%, 05/14/2021 | 320,000 | 327,373 | ||||||
| Intercontinental Exchange, Inc. | ||||||||
| 3.75%, 12/01/2025 | 160,000 | 181,431 | ||||||
| 3.10%, 09/15/2027 | 204,000 | 224,451 | ||||||
| 3.75%, 09/21/2028 | 240,000 | 275,198 | ||||||
| International Lease Finance Corp. | ||||||||
| 8.25%, 12/15/2020 | 610,000 | 620,507 | ||||||
| 5.88%, 08/15/2022 | 210,000 | 211,968 | ||||||
| Iron Mountain, Inc. | ||||||||
| 6.00%, 08/15/2023 | 47,000 | 47,592 | ||||||
| Security Description | Principal Amount | Value | ||||||
| Financials (continued) | ||||||||
| JPMorgan Chase & Co. | ||||||||
| 3.38%, 05/01/2023 | $ | 320,000 | $ | 341,027 | ||||
| 3M US L + 1.23%, 10/24/2023(a) | 952,000 | 954,742 | ||||||
| KeyBank NA/Cleveland OH | ||||||||
| 3.38%, 03/07/2023 | 210,000 | 223,860 | ||||||
| KeyCorp | ||||||||
| 5.10%, 03/24/2021 | 498,000 | 515,460 | ||||||
| Lincoln National Corp. | ||||||||
| 3.35%, 03/09/2025 | 320,000 | 340,873 | ||||||
| 3.80%, 03/01/2028 | 80,000 | 85,274 | ||||||
| M&T Bank Corp. | ||||||||
| 3M US L + 0.68%, 07/26/2023(a) | 409,000 | 407,017 | ||||||
| Manufacturers & Traders Trust Co. | ||||||||
| 3M US L + 0.27%, 01/25/2021(a) | 498,000 | 498,413 | ||||||
| MetLife, Inc. | ||||||||
| 3.60%, 04/10/2024 | 400,000 | 440,231 | ||||||
| 6.50%, 12/15/2032 | 48,000 | 68,439 | ||||||
| Mitsubishi UFJ Financial Group, Inc. | ||||||||
| 3.85%, 03/01/2026 | 320,000 | 355,895 | ||||||
| Mizuho Financial Group, Inc. | ||||||||
| 2.95%, 02/28/2022 | 240,000 | 248,198 | ||||||
| 3M US L + 1.00%, 09/11/2024(a) | 826,000 | 807,460 | ||||||
| 3.17%, 09/11/2027 | 80,000 | 84,176 | ||||||
| Morgan Stanley | ||||||||
| 3M US L + 1.40%, 10/24/2023(a) | 826,000 | 828,745 | ||||||
| 5.00%, 11/24/2025 | 498,000 | 574,313 | ||||||
| National Australia Bank, Ltd. | ||||||||
| 2.50%, 07/12/2026 | 80,000 | 84,675 | ||||||
| PNC Financial Services Group, Inc. | ||||||||
| 3.15%, 05/19/2027 | 320,000 | 353,516 | ||||||
| Prudential Financial, Inc. | ||||||||
| 4.50%, 11/16/2021 | 160,000 | 168,572 | ||||||
| Royal Bank of Canada | ||||||||
| 2.15%, 10/26/2020 | 240,000 | 241,776 | ||||||
| Royal Bank of Scotland Group PLC | ||||||||
| 3M US L + 1.48%, 05/15/2023(a) | 320,000 | 329,328 | ||||||
| 3M US L + 1.47%, 05/15/2023(a) | 409,000 | 403,326 | ||||||
| Simon Property Group LP | ||||||||
| 3.38%, 10/01/2024 | 80,000 | 81,740 | ||||||
| 3.38%, 12/01/2027 | 160,000 | 157,505 | ||||||
| Starwood Property Trust, Inc. | ||||||||
| 5.00%, 12/15/2021 | 210,000 | 206,391 | ||||||
| State Street Corp. | ||||||||
| 3.30%, 12/16/2024 | 240,000 | 265,437 | ||||||
| 3.55%, 08/18/2025 | 105,000 | 118,634 | ||||||
| Toronto-Dominion Bank | ||||||||
| 3.15%, 09/17/2020 | 409,000 | 412,408 | ||||||
See Notes to Financial Statements.
14 | May 31, 2020
RiverFront Dynamic Core Income ETF
| Schedule of Investments | May 31, 2020 (Unaudited) |
| Security Description | Principal Amount | Value | ||||||
| Financials (continued) | ||||||||
| Truist Bank | ||||||||
| 3.30%, 05/15/2026 | $ | 320,000 | $ | 343,133 | ||||
| UBS Group AG | ||||||||
| 3.49%, 05/23/2023(b) | 160,000 | 166,711 | ||||||
| 4.13%, 09/24/2025(b) | 136,000 | 151,376 | ||||||
| 4.13%, 04/15/2026(b) | 80,000 | 89,700 | ||||||
| US Bancorp | ||||||||
| 2.63%, 01/24/2022 | 160,000 | 165,342 | ||||||
| 3.00%, 03/15/2022 | 320,000 | 333,875 | ||||||
| Visa, Inc. | ||||||||
| 3.15%, 12/14/2025 | 240,000 | 270,048 | ||||||
| 2.75%, 09/15/2027 | 210,000 | 232,668 | ||||||
| Wells Fargo & Co. | ||||||||
| 2.55%, 12/07/2020 | 160,000 | 161,656 | ||||||
| 3M US L + 0.93%, 02/11/2022(a) | 160,000 | 160,036 | ||||||
| 3M US L + 1.23%, 10/31/2023(a) | 240,000 | 240,175 | ||||||
| 3.00%, 04/22/2026 | 160,000 | 171,293 | ||||||
| Westpac Banking Corp. | ||||||||
| 2.10%, 05/13/2021 | 280,000 | 284,580 | ||||||
| 3.65%, 05/15/2023 | 240,000 | 260,767 | ||||||
| 2.70%, 08/19/2026 | 80,000 | 86,433 | ||||||
| Total Financials | 30,020,102 | |||||||
| Health Care (4.67%) | ||||||||
| AbbVie, Inc. | ||||||||
| 2.90%, 11/06/2022 | 498,000 | 521,681 | ||||||
| 3.85%, 06/15/2024(b) | 252,000 | 275,638 | ||||||
| 3.60%, 05/14/2025 | 80,000 | 88,229 | ||||||
| Aetna, Inc. | ||||||||
| 3.50%, 11/15/2024 | 240,000 | 259,584 | ||||||
| Amgen, Inc. | ||||||||
| 3.63%, 05/22/2024 | 320,000 | 348,152 | ||||||
| Anthem, Inc. | ||||||||
| 3.50%, 08/15/2024 | 80,000 | 87,604 | ||||||
| Becton Dickinson and Co. | ||||||||
| 3M US L + 0.875%, 12/29/2020(a) | 136,000 | 135,977 | ||||||
| Centene Corp. | ||||||||
| 4.75%, 05/15/2022 | 320,000 | 324,728 | ||||||
| Cigna Corp. | ||||||||
| 3.00%, 07/15/2023(b) | 399,000 | 421,085 | ||||||
| 4.38%, 10/15/2028 | 178,000 | 209,364 | ||||||
| CVS Health Corp. | ||||||||
| 4.00%, 12/05/2023 | 136,000 | 148,426 | ||||||
| Eli Lilly and Co. | ||||||||
| 2.75%, 06/01/2025 | 56,000 | 60,339 | ||||||
| Fresenius Medical Care US Finance II, Inc. | ||||||||
| 4.13%, 10/15/2020(b) | 320,000 | 320,578 | ||||||
| Gilead Sciences, Inc. | ||||||||
| 4.40%, 12/01/2021 | 160,000 | 167,697 | ||||||
| 2.50%, 09/01/2023 | 160,000 | 169,667 | ||||||
| Johnson & Johnson | ||||||||
| 2.45%, 03/01/2026 | 409,000 | 448,060 | ||||||
| Security Description | Principal Amount | Value | ||||||
| Health Care (continued) | ||||||||
| Medtronic, Inc. | ||||||||
| 3.50%, 03/15/2025 | $ | 114,000 | $ | 129,292 | ||||
| Merck & Co., Inc. | ||||||||
| 2.80%, 05/18/2023 | 800,000 | 855,879 | ||||||
| Pfizer, Inc. | ||||||||
| 3.20%, 09/15/2023 | 343,000 | 376,003 | ||||||
| 3.00%, 12/15/2026 | 160,000 | 182,531 | ||||||
| Thermo Fisher Scientific, Inc. | ||||||||
| 3.65%, 12/15/2025 | 136,000 | 152,071 | ||||||
| UnitedHealth Group, Inc. | ||||||||
| 2.88%, 03/15/2023 | 240,000 | 255,309 | ||||||
| 3.75%, 07/15/2025 | 320,000 | 366,343 | ||||||
| 3.10%, 03/15/2026 | 143,000 | 159,129 | ||||||
| Total Health Care | 6,463,366 | |||||||
| Industrials (3.73%) | ||||||||
| Boeing Co. | ||||||||
| 3.45%, 11/01/2028 | 240,000 | 227,607 | ||||||
| Burlington Northern Santa Fe LLC | ||||||||
| 3.05%, 09/01/2022 | 240,000 | 251,814 | ||||||
| Caterpillar Financial Services Corp. | ||||||||
| 2.75%, 08/20/2021 | 48,000 | 49,230 | ||||||
| 2.40%, 06/06/2022 | 240,000 | 249,625 | ||||||
| CNH Industrial Capital LLC | ||||||||
| 4.88%, 04/01/2021 | 240,000 | 243,481 | ||||||
| CNH Industrial NV | ||||||||
| 4.50%, 08/15/2023 | 320,000 | 335,662 | ||||||
| CSX Corp. | ||||||||
| 3.40%, 08/01/2024 | 240,000 | 263,168 | ||||||
| 2.60%, 11/01/2026 | 80,000 | 85,553 | ||||||
| FedEx Corp. | ||||||||
| 3.40%, 02/15/2028 | 240,000 | 256,463 | ||||||
| General Dynamics Corp. | ||||||||
| 3.50%, 05/15/2025 | 313,000 | 349,143 | ||||||
| 2.63%, 11/15/2027 | 240,000 | 255,499 | ||||||
| Honeywell International, Inc. | ||||||||
| 2.50%, 11/01/2026 | 240,000 | 262,763 | ||||||
| John Deere Capital Corp. | ||||||||
| 3M US L + 0.16%, 01/08/2021(a) | 160,000 | 159,943 | ||||||
| 2.65%, 06/24/2024 | 320,000 | 342,479 | ||||||
| Lockheed Martin Corp. | ||||||||
| 3.55%, 01/15/2026 | 240,000 | 274,406 | ||||||
| Northrop Grumman Corp. | ||||||||
| 3.50%, 03/15/2021 | 35,000 | 35,792 | ||||||
| 3.25%, 01/15/2028 | 240,000 | 266,339 | ||||||
| Textron, Inc. | ||||||||
| 3.65%, 03/01/2021 | 69,000 | 70,104 | ||||||
| 3.65%, 03/15/2027 | 210,000 | 212,846 | ||||||
| United Parcel Service, Inc. | ||||||||
| 2.50%, 04/01/2023 | 485,000 | 510,013 | ||||||
| 2.40%, 11/15/2026 | 52,000 | 56,810 | ||||||
| WESCO Distribution, Inc. | ||||||||
| 5.38%, 12/15/2021 | 160,000 | 159,564 | ||||||
See Notes to Financial Statements.
15 | May 31, 2020
RiverFront Dynamic Core Income ETF
| Schedule of Investments | May 31, 2020 (Unaudited) |
| Security Description | Principal Amount | Value | ||||||
| Industrials (continued) | ||||||||
| XPO Logistics, Inc. | ||||||||
| 6.13%, 09/01/2023(b) | $ | 240,000 | $ | 243,625 | ||||
| Total Industrials | 5,161,929 | |||||||
| Materials (2.26%) | ||||||||
| 3M Co. | ||||||||
| 3.25%, 02/14/2024 | 663,000 | 721,349 | ||||||
| Ashland LLC | ||||||||
| 4.75%, 08/15/2022 | 26,000 | 27,186 | ||||||
| Ball Corp. | ||||||||
| 4.00%, 11/15/2023 | 240,000 | 252,961 | ||||||
| Celanese US Holdings LLC | ||||||||
| 5.88%, 06/15/2021 | 160,000 | 166,246 | ||||||
| 4.63%, 11/15/2022 | 160,000 | 168,325 | ||||||
| Glencore Funding LLC | ||||||||
| 3.00%, 10/27/2022(b) | 409,000 | 417,612 | ||||||
| Graphic Packaging International LLC | ||||||||
| 4.75%, 04/15/2021 | 160,000 | 162,400 | ||||||
| International Paper Co. | ||||||||
| 3.00%, 02/15/2027 | 160,000 | 170,417 | ||||||
| LyondellBasell Industries NV | ||||||||
| 5.75%, 04/15/2024 | 240,000 | 273,402 | ||||||
| Nutrien, Ltd. | ||||||||
| 3.50%, 06/01/2023 | 240,000 | 253,471 | ||||||
| Sherwin-Williams Co. | ||||||||
| 3.45%, 08/01/2025 | 240,000 | 264,197 | ||||||
| 3.45%, 06/01/2027 | 160,000 | 176,243 | ||||||
| Steel Dynamics, Inc. | ||||||||
| 5.50%, 10/01/2024 | 80,000 | 82,108 | ||||||
| Total Materials | 3,135,917 | |||||||
| Technology (3.94%) | ||||||||
| Apple, Inc. | ||||||||
| 2.40%, 05/03/2023 | 409,000 | 433,262 | ||||||
| 3.45%, 05/06/2024 | 240,000 | 266,510 | ||||||
| 2.75%, 01/13/2025 | 105,000 | 114,517 | ||||||
| 3.20%, 05/11/2027 | 240,000 | 271,231 | ||||||
| Broadcom, Inc. | ||||||||
| 4.11%, 09/15/2028(b) | 252,000 | 264,319 | ||||||
| Cisco Systems, Inc. | ||||||||
| 2.20%, 09/20/2023 | 160,000 | 170,304 | ||||||
| Corning, Inc. | ||||||||
| 2.90%, 05/15/2022 | 80,000 | 82,891 | ||||||
| Dell International LLC / EMC Corp. | ||||||||
| 4.42%, 06/15/2021(b) | 240,000 | 244,543 | ||||||
| 5.88%, 06/15/2021(b) | 30,000 | 30,056 | ||||||
| Flex, Ltd. | ||||||||
| 5.00%, 02/15/2023 | 320,000 | 335,413 | ||||||
| IBM Credit LLC | ||||||||
| 3M US L + 0.16%, 02/05/2021(a) | 610,000 | 610,473 | ||||||
| Intel Corp. | ||||||||
| 2.60%, 05/19/2026 | 240,000 | 262,677 | ||||||
| Security Description | Principal Amount | Value | ||||||
| Technology (continued) | ||||||||
| International Business Machines Corp. | ||||||||
| 2.50%, 01/27/2022 | $ | 409,000 | $ | 423,520 | ||||
| 3.63%, 02/12/2024 | 240,000 | 264,824 | ||||||
| Microsoft Corp. | ||||||||
| 3.45%, 08/08/2036 | 210,000 | 248,514 | ||||||
| Moody's Corp. | ||||||||
| 4.50%, 09/01/2022 | 52,000 | 55,809 | ||||||
| NCR Corp. | ||||||||
| 5.00%, 07/15/2022 | 80,000 | 80,202 | ||||||
| Oracle Corp. | ||||||||
| 3.40%, 07/08/2024 | 240,000 | 263,777 | ||||||
| QUALCOMM, Inc. | ||||||||
| 2.60%, 01/30/2023 | 320,000 | 336,173 | ||||||
| 2.90%, 05/20/2024 | 313,000 | 337,190 | ||||||
| S&P Global, Inc. | ||||||||
| 4.00%, 06/15/2025 | 240,000 | 274,354 | ||||||
| Xerox Corp. | ||||||||
| 3.50%, 08/20/2020 | 80,000 | 79,989 | ||||||
| Total Technology | 5,450,548 | |||||||
| Utilities (2.04%) | ||||||||
| AES Corp. | ||||||||
| 4.50%, 03/15/2023 | 240,000 | 245,137 | ||||||
| Alabama Power Co. | ||||||||
| 3.55%, 12/01/2023 | 136,000 | 148,638 | ||||||
| CMS Energy Corp. | ||||||||
| 3.60%, 11/15/2025 | 136,000 | 147,538 | ||||||
| Consumers Energy Co. | ||||||||
| 3.38%, 08/15/2023 | 160,000 | 172,582 | ||||||
| 3.13%, 08/31/2024 | 160,000 | 173,766 | ||||||
| Dominion Energy, Inc. | ||||||||
| 4.25%, 06/01/2028 | 210,000 | 238,448 | ||||||
| Duke Energy Carolinas LLC | ||||||||
| 2.95%, 12/01/2026 | 160,000 | 177,265 | ||||||
| Duke Energy Corp. | ||||||||
| 1.80%, 09/01/2021 | 498,000 | 504,001 | ||||||
| Exelon Corp. | ||||||||
| 3.50%, 06/01/2022 | 160,000 | 166,504 | ||||||
| 3.40%, 04/15/2026 | 135,000 | 150,013 | ||||||
| Exelon Generation Co. LLC | ||||||||
| 4.25%, 06/15/2022 | 80,000 | 84,319 | ||||||
| Southern Co. | ||||||||
| 2.95%, 07/01/2023 | 409,000 | 432,272 | ||||||
| Southwestern Electric Power Co. | ||||||||
| 4.10%, 09/15/2028 | 160,000 | 180,802 | ||||||
| Total Utilities | 2,821,285 | |||||||
| TOTAL CORPORATE BONDS | ||||||||
| (Cost $70,202,342) | 74,273,376 | |||||||
See Notes to Financial Statements.
16 | May 31, 2020
RiverFront Dynamic Core Income ETF
| Schedule of Investments | May 31, 2020 (Unaudited) |
| Security Description | Principal Amount | Value | ||||||
| GOVERNMENT BONDS (26.65%) | ||||||||
| United States Treasury Bond | ||||||||
| 2.75%, 02/15/2028 | $ | 8,219,000 | $ | 9,602,586 | ||||
| 3.88%, 08/15/2040 | 1,151,300 | 1,715,977 | ||||||
| 2.75%, 11/15/2047 | 1,558,000 | 2,039,459 | ||||||
| United States Treasury Inflation Indexed Bonds | ||||||||
| 2.13%, 02/15/2040(c) | 450,008 | 649,920 | ||||||
| United States Treasury Note | ||||||||
| 2.88%, 11/15/2021 | 4,105,000 | 4,266,074 | ||||||
| 2.88%, 10/31/2023 | 2,458,000 | 2,681,141 | ||||||
| 3.00%, 10/31/2025 | 4,105,000 | 4,685,874 | ||||||
| United States Treasury Strip Principal | ||||||||
| 0.00%, 02/15/2038(d) | 4,105,000 | 3,450,745 | ||||||
| 0.00%, 08/15/2039(d) | 4,931,000 | 3,962,026 | ||||||
| 0.00%, 11/15/2046(d) | 2,458,000 | 1,666,629 | ||||||
| 0.00%, 05/15/2048(d) | 3,284,000 | 2,172,680 | ||||||
| TOTAL GOVERNMENT BONDS | ||||||||
| (Cost $30,460,333) | 36,893,111 | |||||||
| 7 Day Yield | Shares | Value | ||||||||||
| SHORT TERM INVESTMENTS (19.27%) | ||||||||||||
| State Street Institutional Treasury Plus Money Market Fund | 0.15% | 26,682,397 | 26,682,397 | |||||||||
| TOTAL SHORT TERM INVESTMENTS | ||||||||||||
| (Cost $26,682,397) | 26,682,397 | |||||||||||
| TOTAL INVESTMENTS (99.57%) | ||||||||||||
| (Cost $127,345,072) | $ | 137,848,884 | ||||||||||
| OTHER ASSETS IN EXCESS OF LIABILITIES (0.43%) | 583,093 | |||||||||||
| NET ASSETS - 100.00% | $ | 138,431,977 | ||||||||||
Investment Abbreviations:
LIBOR - London Interbank Offered Rate
Reference Rates:
3M US L - 3 Month LIBOR as of May 31, 2020 was 0.34%
| (a) | Floating or variable rate security. The reference rate is described above. The rate in effect as of May 31, 2020 is based on the reference rate plus the displayed spread as of the security's last reset date. |
| (b) | Securities exempt from registration under Rule 144A of the Securities Act of 1933. These securities may be sold in the ordinary course of business in transactions exempt from registration, normally to qualified institutional buyers. At period end, the aggregate market value of those securities was $2,625,243, representing 1.90% of net assets. |
| (c) | Principal amount of security is adjusted for inflation. |
| (d) | Zero coupon bond. |
See Notes to Financial Statements.
17 | May 31, 2020
| RiverFront Dynamic Unconstrained Income ETF |
| Schedule of Investments | May 31, 2020 (Unaudited) |
| Security Description | Principal Amount | Value | ||||||
| CORPORATE BONDS (73.82%) | ||||||||
| Communications (14.87%) | ||||||||
| AMC Networks, Inc. | ||||||||
| 4.75%, 08/01/2025 | $ | 70,000 | $ | 70,707 | ||||
| CCO Holdings LLC / CCO Holdings Capital Corp. | ||||||||
| 5.75%, 02/15/2026(a) | 100,000 | 104,499 | ||||||
| 5.13%, 05/01/2027(a) | 101,000 | 106,286 | ||||||
| 5.00%, 02/01/2028(a) | 35,000 | 36,739 | ||||||
| CenturyLink, Inc. | ||||||||
| 6.45%, 06/15/2021 | 129,000 | 132,950 | ||||||
| 7.50%, 04/01/2024 | 26,000 | 28,668 | ||||||
| CSC Holdings LLC | ||||||||
| 5.38%, 07/15/2023(a) | 101,000 | 102,750 | ||||||
| DISH DBS Corp. | ||||||||
| 5.88%, 07/15/2022 | 75,000 | 77,246 | ||||||
| Hughes Satellite Systems Corp. | ||||||||
| 7.63%, 06/15/2021 | 49,000 | 51,326 | ||||||
| 6.63%, 08/01/2026 | 49,000 | 51,304 | ||||||
| Lamar Media Corp. | ||||||||
| 5.75%, 02/01/2026 | 149,000 | 155,491 | ||||||
| Level 3 Financing, Inc. | ||||||||
| 5.38%, 01/15/2024 | 75,000 | 76,211 | ||||||
| Netflix, Inc. | ||||||||
| 5.50%, 02/15/2022 | 94,000 | 98,848 | ||||||
| Sinclair Television Group, Inc. | ||||||||
| 5.13%, 02/15/2027(a) | 26,000 | 24,283 | ||||||
| Sirius XM Radio, Inc. | ||||||||
| 4.63%, 05/15/2023(a) | 75,000 | 75,374 | ||||||
| Sprint Communications, Inc. | ||||||||
| 6.00%, 11/15/2022 | 108,000 | 114,990 | ||||||
| Sprint Corp. | ||||||||
| 7.88%, 09/15/2023 | 49,000 | 55,743 | ||||||
| 7.13%, 06/15/2024 | 49,000 | 55,684 | ||||||
| T-Mobile USA, Inc. | ||||||||
| 6.50%, 01/15/2024 | 129,000 | 132,277 | ||||||
| Univision Communications, Inc. | ||||||||
| 5.13%, 05/15/2023(a) | 49,000 | 47,775 | ||||||
| VeriSign, Inc. | ||||||||
| 4.75%, 07/15/2027 | 49,000 | 51,275 | ||||||
| ViacomCBS, Inc. | ||||||||
| 3M US L + 3.895%, 02/28/2057(b) | 36,000 | 34,386 | ||||||
| Virgin Media Finance PLC | ||||||||
| 6.00%, 10/15/2024(a) | 75,000 | 77,336 | ||||||
| Ziggo BV | ||||||||
| 5.50%, 01/15/2027(a) | 75,000 | 79,061 | ||||||
| Total Communications | 1,841,209 | |||||||
| Consumer Discretionary (12.79%) | ||||||||
| ADT Security Corp. | ||||||||
| 6.25%, 10/15/2021 | 101,000 | 104,677 | ||||||
| Aramark Services, Inc. | ||||||||
| 5.00%, 02/01/2028(a) | 70,000 | 69,112 | ||||||
| Avis Budget Car Rental LLC / Avis Budget Finance, Inc. | ||||||||
| 5.50%, 04/01/2023 | 7,000 | 6,059 | ||||||
| Security Description | Principal Amount | Value | ||||||
| Consumer Discretionary (continued) | ||||||||
| Boyd Gaming Corp. | ||||||||
| 6.38%, 04/01/2026 | $ | 75,000 | $ | 74,776 | ||||
| Builders FirstSource, Inc. | ||||||||
| 6.75%, 06/01/2027(a) | 33,000 | 34,850 | ||||||
| Dana, Inc. | ||||||||
| 5.50%, 12/15/2024 | 75,000 | 75,273 | ||||||
| Goodyear Tire & Rubber Co. | ||||||||
| 5.00%, 05/31/2026 | 35,000 | 32,453 | ||||||
| Hanesbrands, Inc. | ||||||||
| 4.88%, 05/15/2026(a) | 143,000 | 145,119 | ||||||
| Hertz Corp. | ||||||||
| 7.63%, 06/01/2022(a)(c) | 7,000 | 3,049 | ||||||
| Hilton Worldwide Finance LLC / Hilton Worldwide Finance Corp. | ||||||||
| 4.63%, 04/01/2025 | 49,000 | 48,811 | ||||||
| International Game Technology PLC | ||||||||
| 6.25%, 02/15/2022(a) | 101,000 | 103,300 | ||||||
| KB Home | ||||||||
| 7.50%, 09/15/2022 | 65,000 | 71,403 | ||||||
| KFC Holding Co./Pizza Hut Holdings LLC/Taco Bell of America LLC | ||||||||
| 5.00%, 06/01/2024(a) | 49,000 | 50,284 | ||||||
| L Brands, Inc. | ||||||||
| 5.63%, 02/15/2022 | 33,000 | 32,248 | ||||||
| Lennar Corp. | ||||||||
| 4.75%, 11/29/2027 | 100,000 | 109,232 | ||||||
| Penske Automotive Group, Inc. | ||||||||
| 5.50%, 05/15/2026 | 70,000 | 69,112 | ||||||
| PulteGroup, Inc. | ||||||||
| 5.00%, 01/15/2027 | 49,000 | 52,082 | ||||||
| Scotts Miracle-Gro Co. | ||||||||
| 5.25%, 12/15/2026 | 70,000 | 72,962 | ||||||
| Service Corp. International | ||||||||
| 4.63%, 12/15/2027 | 87,000 | 91,803 | ||||||
| ServiceMaster Co. LLC | ||||||||
| 5.13%, 11/15/2024(a) | 89,000 | 90,344 | ||||||
| Six Flags Entertainment Corp. | ||||||||
| 4.88%, 07/31/2024(a) | 49,000 | 46,188 | ||||||
| Toll Brothers Finance Corp. | ||||||||
| 4.88%, 03/15/2027 | 49,000 | 51,747 | ||||||
| Wynn Las Vegas LLC / Wynn Las Vegas Capital Corp. | ||||||||
| 5.50%, 03/01/2025(a) | 49,000 | 47,652 | ||||||
| Wynn Macau, Ltd. | ||||||||
| 4.88%, 10/01/2024(a) | 101,000 | 100,758 | ||||||
| Total Consumer Discretionary | 1,583,294 | |||||||
| Consumer Staples (3.85%) | ||||||||
| Albertsons Cos. Inc / Safeway, Inc. / New Albertsons LP / Albertsons LLC | ||||||||
| 6.63%, 06/15/2024 | 70,000 | 72,598 | ||||||
See Notes to Financial Statements.
18 | May 31, 2020
| RiverFront Dynamic Unconstrained Income ETF |
| Schedule of Investments | May 31, 2020 (Unaudited) |
| Security Description | Principal Amount | Value | ||||||
| Consumer Staples (continued) | ||||||||
| B&G Foods, Inc. | ||||||||
| 5.25%, 04/01/2025 | $ | 49,000 | $ | 50,475 | ||||
| Energizer Holdings, Inc. | ||||||||
| 6.38%, 07/15/2026(a) | 75,000 | 79,299 | ||||||
| Pilgrim's Pride Corp. | ||||||||
| 5.75%, 03/15/2025(a) | 49,000 | 50,230 | ||||||
| Spectrum Brands, Inc. | ||||||||
| 5.75%, 07/15/2025 | 143,000 | 147,618 | ||||||
| TreeHouse Foods, Inc. | ||||||||
| 6.00%, 02/15/2024(a) | 75,000 | 77,070 | ||||||
| Total Consumer Staples | 477,290 | |||||||
| Energy (8.12%) | ||||||||
| Antero Resources Corp. | ||||||||
| 5.38%, 11/01/2021 | 89,000 | 79,902 | ||||||
| Callon Petroleum Co. | ||||||||
| 6.38%, 07/01/2026 | 49,000 | 13,895 | ||||||
| CNX Resources Corp. | ||||||||
| 5.88%, 04/15/2022 | 50,000 | 49,790 | ||||||
| CrownRock LP / CrownRock Finance, Inc. | ||||||||
| 5.63%, 10/15/2025(a) | 49,000 | 46,887 | ||||||
| DCP Midstream Operating LP | ||||||||
| 5.38%, 07/15/2025 | 70,000 | 67,913 | ||||||
| Endeavor Energy Resources LP / EER Finance, Inc. | ||||||||
| 5.50%, 01/30/2026(a) | 49,000 | 47,813 | ||||||
| Murphy Oil Corp. | ||||||||
| 5.75%, 08/15/2025 | 75,000 | 70,414 | ||||||
| NGL Energy Partners LP / NGL Energy Finance Corp. | ||||||||
| 6.13%, 03/01/2025 | 94,000 | 66,143 | ||||||
| Parkland Corp. | ||||||||
| 6.00%, 04/01/2026(a) | 75,000 | 75,736 | ||||||
| Parsley Energy LLC / Parsley Finance Corp. | ||||||||
| 5.38%, 01/15/2025(a) | 75,000 | 73,921 | ||||||
| Peabody Energy Corp. | ||||||||
| 6.00%, 03/31/2022(a) | 49,000 | 33,473 | ||||||
| Range Resources Corp. | ||||||||
| 5.00%, 08/15/2022 | 82,000 | 76,926 | ||||||
| SM Energy Co. | ||||||||
| 6.13%, 11/15/2022 | 49,000 | 29,572 | ||||||
| Sunoco LP / Sunoco Finance Corp. | ||||||||
| 5.50%, 02/15/2026 | 49,000 | 49,419 | ||||||
| Targa Resources Partners LP / Targa Resources Partners Finance Corp. | ||||||||
| 5.88%, 04/15/2026 | 75,000 | 76,301 | ||||||
| USA Compression Partners LP / USA Compression Finance Corp. | ||||||||
| 6.88%, 04/01/2026 | 75,000 | 72,363 | ||||||
| Security Description | Principal Amount | Value | ||||||
| Energy (continued) | ||||||||
| WPX Energy, Inc. | ||||||||
| 5.75%, 06/01/2026 | $ | 75,000 | $ | 75,218 | ||||
| Total Energy | 1,005,686 | |||||||
| Financials (7.67%) | ||||||||
| Ally Financial, Inc. | ||||||||
| 5.75%, 11/20/2025 | 101,000 | 105,356 | ||||||
| CIT Group, Inc. | ||||||||
| 5.00%, 08/15/2022 | 118,000 | 118,663 | ||||||
| 5.25%, 03/07/2025 | 40,000 | 40,204 | ||||||
| Icahn Enterprises LP / Icahn Enterprises Finance Corp. | ||||||||
| 6.25%, 02/01/2022 | 50,000 | 50,361 | ||||||
| Iron Mountain, Inc. | ||||||||
| 5.75%, 08/15/2024 | 75,000 | 75,304 | ||||||
| 4.88%, 09/15/2027(a) | 50,000 | 50,395 | ||||||
| iStar, Inc. | ||||||||
| 5.25%, 09/15/2022 | 75,000 | 72,674 | ||||||
| Jefferies Financial Group, Inc. | ||||||||
| 5.50%, 10/18/2023 | 49,000 | 52,734 | ||||||
| MGM Growth Properties Operating Partnership LP / MGP Finance Co.-Issuer, Inc. | ||||||||
| 5.63%, 05/01/2024 | 49,000 | 51,088 | ||||||
| Navient Corp. | ||||||||
| 6.50%, 06/15/2022 | 89,000 | 87,636 | ||||||
| Park Aerospace Holdings, Ltd. | ||||||||
| 5.25%, 08/15/2022(a) | 75,000 | 66,245 | ||||||
| Quicken Loans LLC | ||||||||
| 5.25%, 01/15/2028(a) | 70,000 | 70,847 | ||||||
| Springleaf Finance Corp. | ||||||||
| 5.63%, 03/15/2023 | 80,000 | 78,650 | ||||||
| Starwood Property Trust, Inc. | ||||||||
| 4.75%, 03/15/2025 | 35,000 | 30,227 | ||||||
| Total Financials | 950,384 | |||||||
| Health Care (4.05%) | ||||||||
| Avantor, Inc. | ||||||||
| 6.00%, 10/01/2024(a) | 75,000 | 78,930 | ||||||
| Bausch Health Cos., Inc. | ||||||||
| 5.50%, 03/01/2023(a) | 12,000 | 12,079 | ||||||
| 6.13%, 04/15/2025(a) | 26,000 | 26,452 | ||||||
| 9.00%, 12/15/2025(a) | 35,000 | 38,479 | ||||||
| DaVita, Inc. | ||||||||
| 5.00%, 05/01/2025 | 101,000 | 103,841 | ||||||
| Encompass Health Corp. | ||||||||
| 5.75%, 11/01/2024 | 43,000 | 43,369 | ||||||
| HCA, Inc. | ||||||||
| 5.88%, 05/01/2023 | 115,000 | 125,330 | ||||||
| Hologic, Inc. | ||||||||
| 4.38%, 10/15/2025(a) | 35,000 | 35,871 | ||||||
| Tenet Healthcare Corp. | ||||||||
| 8.13%, 04/01/2022 | 26,000 | 27,228 | ||||||
See Notes to Financial Statements.
19 | May 31, 2020
| RiverFront Dynamic Unconstrained Income ETF |
| Schedule of Investments | May 31, 2020 (Unaudited) |
| Security Description | Principal Amount | Value | ||||||
| Health Care (continued) | ||||||||
| Teva Pharmaceutical Finance Netherlands III BV | ||||||||
| 2.20%, 07/21/2021 | $ | 10,000 | $ | 9,827 | ||||
| Total Health Care | 501,406 | |||||||
| Industrials (6.73%) | ||||||||
| Anixter, Inc. | ||||||||
| 5.50%, 03/01/2023 | 75,000 | 76,211 | ||||||
| Bombardier, Inc. | ||||||||
| 6.13%, 01/15/2023(a) | 49,000 | 29,920 | ||||||
| Covanta Holding Corp. | ||||||||
| 5.88%, 03/01/2024 | 75,000 | 75,461 | ||||||
| H&E Equipment Services, Inc. | ||||||||
| 5.63%, 09/01/2025 | 35,000 | 34,296 | ||||||
| Howmet Aerospace, Inc. | ||||||||
| 5.13%, 10/01/2024 | 70,000 | 71,134 | ||||||
| Terex Corp. | ||||||||
| 5.63%, 02/01/2025(a) | 101,000 | 94,088 | ||||||
| United Rentals North America, Inc. | ||||||||
| 5.88%, 09/15/2026 | 143,000 | 150,244 | ||||||
| WESCO Distribution, Inc. | ||||||||
| 5.38%, 06/15/2024 | 125,000 | 122,018 | ||||||
| XPO Logistics, Inc. | ||||||||
| 6.50%, 06/15/2022(a) | 107,000 | 107,372 | ||||||
| 6.75%, 08/15/2024(a) | 70,000 | 72,982 | ||||||
| Total Industrials | 833,726 | |||||||
| Materials (7.49%) | ||||||||
| Ball Corp. | ||||||||
| 4.88%, 03/15/2026 | 49,000 | 54,044 | ||||||
| Berry Global, Inc. | ||||||||
| 4.88%, 07/15/2026(a) | 35,000 | 36,668 | ||||||
| Chemours Co. | ||||||||
| 7.00%, 05/15/2025 | 101,000 | 98,233 | ||||||
| Crown Americas LLC / Crown Americas Capital Corp. V | ||||||||
| 4.25%, 09/30/2026 | 85,000 | 87,428 | ||||||
| FMG Resources August 2006 Pty, Ltd. | ||||||||
| 5.13%, 03/15/2023(a) | 49,000 | 50,745 | ||||||
| Freeport-McMoRan, Inc. | ||||||||
| 3.88%, 03/15/2023 | 75,000 | 75,789 | ||||||
| Graphic Packaging International LLC | ||||||||
| 4.75%, 07/15/2027(a) | 70,000 | 73,574 | ||||||
| Koppers, Inc. | ||||||||
| 6.00%, 02/15/2025(a) | 49,000 | 45,233 | ||||||
| Mauser Packaging Solutions Holding Co. | ||||||||
| 5.50%, 04/15/2024(a) | 49,000 | 48,785 | ||||||
| NOVA Chemicals Corp. | ||||||||
| 5.25%, 06/01/2027(a) | 75,000 | 63,670 | ||||||
| OCI NV | ||||||||
| 6.63%, 04/15/2023(a) | 49,000 | 50,225 | ||||||
| Security Description | Principal Amount | Value | ||||||
| Materials (continued) | ||||||||
| Owens-Brockway Glass Container, Inc. | ||||||||
| 5.00%, 01/15/2022(a) | $ | 12,000 | $ | 12,117 | ||||
| Rayonier AM Products, Inc. | ||||||||
| 5.50%, 06/01/2024(a) | 19,000 | 8,809 | ||||||
| Reynolds Group Issuer, Inc. / Reynolds Group Issuer LLC / Reynolds Group Issuer Lu | ||||||||
| 5.13%, 07/15/2023(a) | 96,000 | 97,450 | ||||||
| Sealed Air Corp. | ||||||||
| 5.25%, 04/01/2023(a) | 49,000 | 51,506 | ||||||
| SunCoke Energy Partners LP / SunCoke Energy Partners Finance Corp. | ||||||||
| 7.50%, 06/15/2025(a) | 35,000 | 26,600 | ||||||
| United States Steel Corp. | ||||||||
| 6.88%, 08/15/2025 | 70,000 | 47,082 | ||||||
| Total Materials | 927,958 | |||||||
| Technology (5.50%) | ||||||||
| Amkor Technology, Inc. | ||||||||
| 6.63%, 09/15/2027(a) | 35,000 | 37,094 | ||||||
| CommScope Technologies LLC | ||||||||
| 6.00%, 06/15/2025(a) | 49,000 | 47,792 | ||||||
| CommScope, Inc. | ||||||||
| 5.50%, 03/01/2024(a) | 70,000 | 72,174 | ||||||
| Dell International LLC / EMC Corp. | ||||||||
| 5.88%, 06/15/2021(a) | 48,000 | 48,089 | ||||||
| 7.13%, 06/15/2024(a) | 26,000 | 27,032 | ||||||
| j2 Cloud Services LLC / j2 Cloud Co.-Obligor, Inc. | ||||||||
| 6.00%, 07/15/2025(a) | 75,000 | 78,289 | ||||||
| MSCI, Inc. | ||||||||
| 5.38%, 05/15/2027(a) | 49,000 | 52,817 | ||||||
| NCR Corp. | ||||||||
| 5.00%, 07/15/2022 | 86,000 | 86,217 | ||||||
| Nielsen Finance LLC / Nielsen Finance Co. | ||||||||
| 5.00%, 04/15/2022(a) | 75,000 | 75,051 | ||||||
| NortonLifeLock, Inc. | ||||||||
| 5.00%, 04/15/2025(a) | 49,000 | 50,225 | ||||||
| Seagate HDD Cayman | ||||||||
| 4.75%, 01/01/2025 | 19,000 | 20,222 | ||||||
| Western Digital Corp. | ||||||||
| 4.75%, 02/15/2026 | 49,000 | 51,687 | ||||||
| Xerox Corp. | ||||||||
| 4.13%, 03/15/2023 | 35,000 | 34,671 | ||||||
| Total Technology | 681,360 | |||||||
| Utilities (2.75%) | ||||||||
| AmeriGas Partners LP / AmeriGas Finance Corp. | ||||||||
| 5.75%, 05/20/2027 | 75,000 | 79,920 | ||||||
| Cemig Geracao e Transmissao SA | ||||||||
| 9.25%, 12/05/2024(a) | 49,000 | 52,792 | ||||||
See Notes to Financial Statements.
20 | May 31, 2020
| RiverFront Dynamic Unconstrained Income ETF |
| Schedule of Investments | May 31, 2020 (Unaudited) |
| Security Description | Principal Amount | Value | ||||||
| Utilities (continued) | ||||||||
| NRG Energy, Inc. | ||||||||
| 6.63%, 01/15/2027 | $ | 89,000 | $ | 94,991 | ||||
| Suburban Propane Partners LP/Suburban Energy Finance Corp. | ||||||||
| 5.50%, 06/01/2024 | 75,000 | 75,984 | ||||||
| Vistra Operations Co. LLC | ||||||||
| 5.00%, 07/31/2027(a) | 35,000 | 36,700 | ||||||
| Total Utilities | 340,387 | |||||||
| TOTAL CORPORATE BONDS | ||||||||
| (Cost $9,200,930) | 9,142,700 | |||||||
| Security Description | Shares | Value | ||||||
| EXCHANGE TRADED FUNDS (9.48%) | ||||||||
| iShares iBoxx High Yield Corporate Bond ETF | 7,100 | 585,182 | ||||||
| Xtrackers USD High Yield Corporate Bond ETF | 12,500 | 588,500 | ||||||
| TOTAL EXCHANGE TRADED FUNDS | ||||||||
| (Cost $1,117,024) | 1,173,682 | |||||||
| 7 Day Yield | Shares | Value | ||||||||||
| SHORT TERM INVESTMENTS (15.61%) | ||||||||||||
| State Street Institutional Treasury Plus Money Market Fund | 0.15 | % | 1,933,419 | 1,933,419 | ||||||||
| TOTAL SHORT TERM INVESTMENTS | ||||||||||||
| (Cost $1,933,419) | 1,933,419 | |||||||||||
| TOTAL INVESTMENTS (98.91%) | ||||||||||||
| (Cost $12,251,373) | $ | 12,249,801 | ||||||||||
| OTHER ASSETS IN EXCESS OF LIABILITIES (1.09%) | 134,906 | |||||||||||
| NET ASSETS - 100.00% | $ | 12,384,707 | ||||||||||
Investment Abbreviations:
LIBOR - London Interbank Offered Rate
Reference Rates:
3M US L - 3 Month LIBOR as of May 31, 2020 was 0.34%
| (a) | Securities exempt from registration under Rule 144A of the Securities Act of 1933. These securities may be sold in the ordinary course of business in transactions exempt from registration, normally to qualified institutional buyers. At period end, the aggregate market value of those securities was $3,656,285, representing 29.52% of net assets. |
| (b) | Floating or variable rate security. The reference rate is described above. The rate in effect as of May 31, 2020 is based on the reference rate plus the displayed spread as of the security's last reset date. |
| (c) | Security is in default on interest payments |
See Notes to Financial Statements.
21 | May 31, 2020
| RiverFront Dynamic US Dividend Advantage ETF |
| Schedule of Investments | May 31, 2020 (Unaudited) |
| Security Description | Shares | Value | ||||||
| COMMON STOCKS (99.63%) | ||||||||
| Communication Services (6.22%) | ||||||||
| Alphabet, Inc., Class A(a) | 1,009 | $ | 1,446,422 | |||||
| Alphabet, Inc., Class C(a) | 537 | 767,330 | ||||||
| AT&T, Inc. | 66,865 | 2,063,454 | ||||||
| Facebook, Inc., Class A(a) | 5,143 | 1,157,638 | ||||||
| Verizon Communications, Inc. | 36,141 | 2,073,770 | ||||||
| Total Communication Services | 7,508,614 | |||||||
| Consumer Discretionary (18.15%) | ||||||||
| Amazon.com, Inc.(a) | 2,177 | 5,317,039 | ||||||
| Best Buy Co., Inc. | 12,684 | 990,493 | ||||||
| Booking Holdings, Inc.(a) | 952 | 1,560,728 | ||||||
| Dana, Inc. | 49,095 | 620,561 | ||||||
| Dollar General Corp. | 4,166 | 797,831 | ||||||
| Domino's Pizza, Inc. | 3,354 | 1,294,107 | ||||||
| Expedia Group, Inc. | 7,485 | 594,908 | ||||||
| H&R Block, Inc. | 33,592 | 571,064 | ||||||
| Home Depot, Inc. | 9,436 | 2,344,657 | ||||||
| Kohl's Corp. | 17,136 | 329,354 | ||||||
| Macy's, Inc.(b) | 59,686 | 379,603 | ||||||
| NIKE, Inc., Class B | 19,065 | 1,879,428 | ||||||
| NVR, Inc.(a) | 178 | 573,446 | ||||||
| Sally Beauty Holdings, Inc.(a) | 57,980 | 756,059 | ||||||
| Starbucks Corp. | 15,423 | 1,202,840 | ||||||
| Target Corp. | 7,996 | 978,151 | ||||||
| Thor Industries, Inc.(b) | 10,179 | 877,430 | ||||||
| Yum! Brands, Inc. | 9,278 | 832,515 | ||||||
| Total Consumer Discretionary | 21,900,214 | |||||||
| Consumer Staples (6.06%) | ||||||||
| Coca-Cola Co. | 36,858 | 1,720,531 | ||||||
| Colgate-Palmolive Co. | 20,324 | 1,470,035 | ||||||
| Molson Coors Beverage Co., Class B | 13,524 | 513,371 | ||||||
| Mondelez International, Inc., Class A | 28,214 | 1,470,514 | ||||||
| Philip Morris International, Inc. | 7,794 | 571,768 | ||||||
| Walmart, Inc. | 12,645 | 1,568,739 | ||||||
| Total Consumer Staples | 7,314,958 | |||||||
| Energy (0.45%) | ||||||||
| ONEOK, Inc. | 14,666 | 538,096 | ||||||
| Financials (5.22%) | ||||||||
| Bank of America Corp. | 63,626 | 1,534,659 | ||||||
| Berkshire Hathaway, Inc., Class B(a) | 3,768 | 699,265 | ||||||
| Hope Bancorp, Inc. | 51,391 | 487,958 | ||||||
| Morgan Stanley | 18,999 | 839,756 | ||||||
| Navient Corp. | 63,917 | 475,542 | ||||||
| Principal Financial Group, Inc. | 15,400 | 594,748 | ||||||
| Renasant Corp. | 20,858 | 503,095 | ||||||
| Wells Fargo & Co. | 17,870 | 473,019 | ||||||
| WR Berkley Corp. | 11,890 | 689,026 | ||||||
| Total Financials | 6,297,068 | |||||||
| Security Description | Shares | Value | ||||||
| Health Care (15.89%) | ||||||||
| AbbVie, Inc. | 20,960 | $ | 1,942,363 | |||||
| Baxter International, Inc. | 12,374 | 1,113,784 | ||||||
| Boston Scientific Corp.(a) | 21,334 | 810,479 | ||||||
| Bristol-Myers Squibb Co. | 28,029 | 1,673,892 | ||||||
| Eli Lilly and Co. | 12,269 | 1,876,543 | ||||||
| IDEXX Laboratories, Inc.(a) | 2,475 | 764,478 | ||||||
| Inovalon Holdings, Inc.(a) | 31,494 | 592,717 | ||||||
| Johnson & Johnson | 21,032 | 3,128,510 | ||||||
| Medtronic PLC | 18,453 | 1,819,097 | ||||||
| Merck & Co., Inc. | 19,722 | 1,591,960 | ||||||
| Pfizer, Inc. | 60,809 | 2,322,296 | ||||||
| Zoetis, Inc. | 11,065 | 1,542,350 | ||||||
| Total Health Care | 19,178,469 | |||||||
| Industrials (5.28%) | ||||||||
| AO Smith Corp. | 10,689 | 507,727 | ||||||
| CSX Corp. | 11,937 | 854,450 | ||||||
| Lennox International, Inc. | 4,026 | 860,920 | ||||||
| Matson, Inc. | 19,888 | 568,200 | ||||||
| Nordson Corp. | 6,396 | 1,204,687 | ||||||
| Roper Technologies, Inc. | 2,873 | 1,131,387 | ||||||
| United Parcel Service, Inc., Class B | 12,436 | 1,239,994 | ||||||
| Total Industrials | 6,367,365 | |||||||
| Information Technology (29.47%) | ||||||||
| Accenture PLC, Class A | 6,502 | 1,310,933 | ||||||
| Advanced Micro Devices, Inc.(a) | 16,541 | 889,906 | ||||||
| Apple, Inc. | 22,343 | 7,103,733 | ||||||
| Cadence Design Systems, Inc.(a) | 19,720 | 1,800,239 | ||||||
| Cisco Systems, Inc. | 12,185 | 582,687 | ||||||
| Citrix Systems, Inc. | 10,220 | 1,513,786 | ||||||
| CommVault Systems, Inc.(a) | 24,801 | 1,003,449 | ||||||
| Intel Corp. | 33,837 | 2,129,362 | ||||||
| Intuit, Inc. | 4,582 | 1,330,246 | ||||||
| J2 Global, Inc. | 10,912 | 854,410 | ||||||
| Lam Research Corp. | 3,281 | 897,911 | ||||||
| Mastercard, Inc., Class A | 2,313 | 695,959 | ||||||
| Microsoft Corp. | 39,644 | 7,264,763 | ||||||
| National Instruments Corp. | 21,024 | 814,049 | ||||||
| Oracle Corp. | 19,387 | 1,042,439 | ||||||
| PayPal Holdings, Inc.(a) | 5,266 | 816,283 | ||||||
| Power Integrations, Inc. | 9,835 | 1,065,622 | ||||||
| Salesforce.com, Inc.(a) | 3,576 | 625,049 | ||||||
| Square, Inc., Class A(a) | 12,163 | 986,176 | ||||||
| Visa, Inc. | 14,467 | 2,824,537 | ||||||
| Total Information Technology | 35,551,539 | |||||||
| Materials (0.88%) | ||||||||
| LyondellBasell Industries NV, Class A | 9,820 | 626,123 | ||||||
| Westrock Co. | 15,509 | 435,183 | ||||||
| Total Materials | 1,061,306 | |||||||
| Real Estate (5.27%) | ||||||||
| CoreCivic, Inc. | 39,751 | 478,205 | ||||||
| Douglas Emmett, Inc. | 20,402 | 599,003 | ||||||
See Notes to Financial Statements.
22 | May 31, 2020
| RiverFront Dynamic US Dividend Advantage ETF |
| Schedule of Investments | May 31, 2020 (Unaudited) |
| Security Description | Shares | Value | ||||||
| Real Estate (continued) | ||||||||
| Iron Mountain, Inc. | 19,841 | $ | 511,104 | |||||
| Kimco Realty Corp. | 34,688 | 385,384 | ||||||
| Lexington Realty Trust | 55,456 | 539,032 | ||||||
| Piedmont Office Realty Trust, Inc., Class A | 40,390 | 673,705 | ||||||
| Prologis, Inc. | 10,712 | 980,148 | ||||||
| Service Properties Trust | 39,462 | 266,368 | ||||||
| SITE Centers Corp. | 66,325 | 376,063 | ||||||
| The GEO Group, Inc. | 44,900 | 537,902 | ||||||
| Uniti Group, Inc. | 67,853 | 559,787 | ||||||
| Xenia Hotels & Resorts, Inc. | 49,874 | 448,866 | ||||||
| Total Real Estate | 6,355,567 | |||||||
| Utilities (6.74%) | ||||||||
| Alliant Energy Corp. | 10,689 | 527,609 | ||||||
| American Electric Power Co., Inc. | 6,098 | 519,855 | ||||||
| Consolidated Edison, Inc. | 10,590 | 794,885 | ||||||
| Duke Energy Corp. | 15,031 | 1,287,105 | ||||||
| Evergy, Inc. | 13,857 | 854,838 | ||||||
| Exelon Corp. | 20,088 | 769,571 | ||||||
| PPL Corp. | 43,472 | 1,214,608 | ||||||
| Sempra Energy | 6,633 | 837,814 | ||||||
| Southern Co. | 23,234 | 1,325,964 | ||||||
| Total Utilities | 8,132,249 | |||||||
| TOTAL COMMON STOCKS | ||||||||
| (Cost $111,815,630) | 120,205,445 | |||||||
| 7 Day Yield | Shares | Value | ||||||||||
| SHORT TERM INVESTMENTS (0.59%) | ||||||||||||
| Money Market Fund (0.23%) | ||||||||||||
| State Street Institutional Treasury Plus Money Market Fund | ||||||||||||
| (Cost $273,035) | 0.15 | % | 273,035 | 273,035 | ||||||||
| Investments Purchased with Collateral from Securities Loaned (0.36%) | ||||||||||||
| State Street Navigator Securities Lending Government Money Market Portfolio, 0.15% | ||||||||||||
| (Cost $435,528) | 435,528 | 435,528 | ||||||||||
| TOTAL SHORT TERM INVESTMENTS | ||||||||||||
| (Cost $708,563) | 708,563 | |||||||||||
| TOTAL INVESTMENTS (100.22%) | ||||||||||||
| (Cost $112,524,193) | $ | 120,914,008 | ||||||||||
| LIABILITIES IN EXCESS OF OTHER ASSETS (-0.22%) | (261,484 | ) | ||||||||||
| NET ASSETS - 100.00% | $ | 120,652,524 | ||||||||||
| (a) | Non-income producing security. |
| (b) | Security, or a portion of the security position is currently on loan. The total market value of securities on loan is $942,750. |
See Notes to Financial Statements.
23 | May 31, 2020
| RiverFront Dynamic US Flex-Cap ETF |
| Schedule of Investments | May 31, 2020 (Unaudited) |
| Security Description | Shares | Value | ||||||
| COMMON STOCKS (99.92%) | ||||||||
| Communication Services (8.22%) | ||||||||
| Alphabet, Inc., Class A(a) | 976 | $ | 1,399,116 | |||||
| Alphabet, Inc., Class C(a) | 231 | 330,081 | ||||||
| AT&T, Inc. | 12,584 | 388,342 | ||||||
| Comcast Corp., Class A | 18,114 | 717,314 | ||||||
| Discovery, Inc., Class C(a) | 13,636 | 267,129 | ||||||
| EW Scripps Co., Class A | 29,178 | 252,973 | ||||||
| Facebook, Inc., Class A(a) | 2,252 | 506,903 | ||||||
| New York Times Co., Class A(b) | 12,502 | 490,454 | ||||||
| News Corp., Class A | 23,472 | 287,532 | ||||||
| News Corp., Class B | 22,963 | 281,526 | ||||||
| Sirius XM Holdings, Inc. | 91,216 | 530,877 | ||||||
| Verizon Communications, Inc. | 6,995 | 401,373 | ||||||
| Total Communication Services | 5,853,620 | |||||||
| Consumer Discretionary (17.32%) | ||||||||
| Aaron's, Inc. | 5,370 | 198,207 | ||||||
| Amazon.com, Inc.(a) | 1,150 | 2,808,725 | ||||||
| American Eagle Outfitters, Inc.(b) | 39,964 | 366,070 | ||||||
| Booking Holdings, Inc.(a) | 472 | 773,806 | ||||||
| Dine Brands Global, Inc.(b) | 4,407 | 200,034 | ||||||
| Dollar General Corp. | 2,616 | 500,990 | ||||||
| Domino's Pizza, Inc. | 1,687 | 650,912 | ||||||
| Expedia Group, Inc. | 2,962 | 235,420 | ||||||
| Fox Factory Holding Corp.(a) | 4,833 | 348,508 | ||||||
| Hanesbrands, Inc. | 37,181 | 366,605 | ||||||
| Home Depot, Inc. | 3,898 | 968,575 | ||||||
| Kohl's Corp. | 7,121 | 136,866 | ||||||
| Macy's, Inc. | 17,266 | 109,812 | ||||||
| MGM Resorts International | 27,909 | 479,477 | ||||||
| NIKE, Inc., Class B | 6,949 | 685,032 | ||||||
| NVR, Inc.(a) | 156 | 502,571 | ||||||
| PulteGroup, Inc. | 10,831 | 367,929 | ||||||
| Starbucks Corp. | 5,959 | 464,742 | ||||||
| Target Corp. | 5,330 | 652,019 | ||||||
| Wingstop, Inc. | 5,594 | 682,188 | ||||||
| YETI Holdings, Inc.(a) | 15,929 | 511,321 | ||||||
| Yum! Brands, Inc. | 3,549 | 318,452 | ||||||
| Total Consumer Discretionary | 12,328,261 | |||||||
| Consumer Staples (3.68%) | ||||||||
| Altria Group, Inc. | 12,136 | 473,911 | ||||||
| Coca-Cola Co. | 7,445 | 347,532 | ||||||
| Colgate-Palmolive Co. | 10,052 | 727,061 | ||||||
| Mondelez International, Inc., Class A | 13,921 | 725,562 | ||||||
| Philip Morris International, Inc. | 1,636 | 120,017 | ||||||
| Walmart, Inc. | 1,810 | 224,549 | ||||||
| Total Consumer Staples | 2,618,632 | |||||||
| Energy (0.79%) | ||||||||
| Kinder Morgan, Inc. | 21,676 | 342,481 | ||||||
| Schlumberger Ltd. | 11,894 | 219,682 | ||||||
| Total Energy | 562,163 | |||||||
| Security Description | Shares | Value | ||||||
| Financials (5.74%) | ||||||||
| American Express Co. | 3,126 | $ | 297,189 | |||||
| Bank of America Corp. | 21,723 | 523,959 | ||||||
| Banner Corp. | 6,382 | 239,708 | ||||||
| Berkshire Hathaway, Inc., Class B(a) | 1,619 | 300,454 | ||||||
| Citigroup, Inc. | 10,281 | 492,563 | ||||||
| Enova International, Inc.(a) | 15,135 | 214,160 | ||||||
| Hope Bancorp, Inc. | 41,473 | 393,786 | ||||||
| Morgan Stanley | 7,814 | 345,379 | ||||||
| Renasant Corp. | 16,488 | 397,690 | ||||||
| SEI Investments Co. | 3,369 | 182,667 | ||||||
| Wells Fargo & Co. | 7,891 | 208,875 | ||||||
| WR Berkley Corp. | 8,467 | 490,662 | ||||||
| Total Financials | 4,087,092 | |||||||
| Health Care (11.94%) | ||||||||
| AbbVie, Inc. | 8,344 | 773,239 | ||||||
| Cerner Corp. | 5,205 | 379,445 | ||||||
| Danaher Corp. | 3,853 | 641,948 | ||||||
| Eli Lilly and Co. | 6,040 | 923,818 | ||||||
| IQVIA Holdings, Inc.(a) | 2,406 | 359,745 | ||||||
| Johnson & Johnson | 8,816 | 1,311,380 | ||||||
| McKesson Corp. | 2,646 | 419,841 | ||||||
| Medtronic PLC | 3,640 | 358,831 | ||||||
| Mylan NV(a) | 35,415 | 604,534 | ||||||
| NeoGenomics, Inc.(a) | 15,355 | 409,825 | ||||||
| Pfizer, Inc. | 29,711 | 1,134,663 | ||||||
| RadNet, Inc.(a) | 24,510 | 417,650 | ||||||
| Zoetis, Inc. | 5,472 | 762,742 | ||||||
| Total Health Care | 8,497,661 | |||||||
| Industrials (9.78%) | ||||||||
| 3M Co. | 2,451 | 383,434 | ||||||
| ACCO Brands Corp. | 56,584 | 350,255 | ||||||
| AECOM(a) | 10,846 | 420,499 | ||||||
| Allison Transmission Holdings, Inc. | 11,350 | 428,122 | ||||||
| Cintas Corp. | 2,338 | 579,731 | ||||||
| CSX Corp. | 6,899 | 493,830 | ||||||
| Encore Wire Corp. | 7,039 | 339,913 | ||||||
| Expeditors International of Washington, Inc. | 5,043 | 385,134 | ||||||
| General Electric Co. | 45,257 | 297,339 | ||||||
| Hubbell, Inc. | 2,826 | 345,959 | ||||||
| Lockheed Martin Corp. | 1,057 | 410,581 | ||||||
| Nordson Corp. | 2,585 | 486,885 | ||||||
| Norfolk Southern Corp. | 2,541 | 453,035 | ||||||
| Roper Technologies, Inc. | 1,106 | 435,543 | ||||||
| Union Pacific Corp. | 3,514 | 596,888 | ||||||
| United Parcel Service, Inc., Class B | 5,534 | 551,795 | ||||||
| Total Industrials | 6,958,943 | |||||||
| Information Technology (28.53%) | ||||||||
| Adobe, Inc.(a) | 523 | 202,192 | ||||||
| Advanced Micro Devices, Inc.(a) | 15,192 | 817,330 | ||||||
| Alliance Data Systems Corp. | 2,451 | 113,555 | ||||||
See Notes to Financial Statements.
24 | May 31, 2020
| RiverFront Dynamic US Flex-Cap ETF |
| Schedule of Investments | May 31, 2020 (Unaudited) |
| Security Description | Shares | Value | ||||||
| Information Technology (continued) | ||||||||
| Alteryx, Inc., Class A(a)(b) | 3,475 | $ | 500,191 | |||||
| Appfolio, Inc., Class A(a)(b) | 3,837 | 608,203 | ||||||
| Apple, Inc. | 11,493 | 3,654,084 | ||||||
| CACI International, Inc., Class A(a) | 1,629 | 408,521 | ||||||
| Cisco Systems, Inc. | 24,086 | 1,151,792 | ||||||
| Cognizant Technology Solutions Corp., Class A | 6,722 | 356,266 | ||||||
| Enphase Energy, Inc.(a) | 9,005 | 524,001 | ||||||
| HP, Inc. | 13,639 | 206,494 | ||||||
| Intel Corp. | 7,848 | 493,875 | ||||||
| Intuit, Inc. | 1,608 | 466,835 | ||||||
| LogMeIn, Inc. | 5,099 | 432,905 | ||||||
| Mastercard, Inc., Class A | 2,707 | 814,509 | ||||||
| Micron Technology, Inc.(a) | 10,048 | 481,400 | ||||||
| Microsoft Corp. | 20,084 | 3,680,393 | ||||||
| NVIDIA Corp. | 2,401 | 852,403 | ||||||
| Oracle Corp. | 12,122 | 651,800 | ||||||
| PayPal Holdings, Inc.(a) | 3,126 | 484,561 | ||||||
| Power Integrations, Inc. | 4,862 | 526,798 | ||||||
| Salesforce.com, Inc.(a) | 5,592 | 977,426 | ||||||
| Tech Data Corp.(a) | 3,885 | 529,292 | ||||||
| Visa, Inc. | 7,039 | 1,374,294 | ||||||
| Total Information Technology | 20,309,120 | |||||||
| Materials (3.95%) | ||||||||
| Celanese Corp. | 3,116 | 280,160 | ||||||
| Eastman Chemical Co. | 4,987 | 339,515 | ||||||
| NewMarket Corp. | 860 | 375,072 | ||||||
| Olin Corp. | 17,614 | 211,896 | ||||||
| Packaging Corp. of America | 3,261 | 330,698 | ||||||
| PolyOne Corp. | 11,275 | 279,394 | ||||||
| PPG Industries, Inc. | 3,502 | 356,048 | ||||||
| Vulcan Materials Co. | 3,305 | 357,998 | ||||||
| Westrock Co. | 10,042 | 281,779 | ||||||
| Total Materials | 2,812,560 | |||||||
| Real Estate (6.24%) | ||||||||
| American Tower Corp. | 2,455 | 633,807 | ||||||
| Apartment Investment and Management Co., Class A | 10,862 | 400,482 | ||||||
| Apple Hospitality REIT, Inc. | 35,051 | 357,871 | ||||||
| Douglas Emmett, Inc. | 12,229 | 359,044 | ||||||
| Equity Commonwealth | 13,666 | 460,544 | ||||||
| Lexington Realty Trust | 36,561 | 355,373 | ||||||
| Outfront Media, Inc. | 18,761 | 263,404 | ||||||
| Piedmont Office Realty Trust, Inc., Class A | 19,166 | 319,689 | ||||||
| Prologis, Inc. | 6,356 | 581,574 | ||||||
| RMR Group, Inc., Class A | 8,611 | 232,153 | ||||||
| Vornado Realty Trust | 5,644 | 204,369 | ||||||
| Xenia Hotels & Resorts, Inc. | 30,309 | 272,781 | ||||||
| Total Real Estate | 4,441,091 | |||||||
| Utilities (3.73%) | ||||||||
| AES Corp. | 35,112 | 438,549 | ||||||
| Security Description | Shares | Value | ||||||
| Utilities (continued) | ||||||||
| American Electric Power Co., Inc. | 5,017 | $ | 427,699 | |||||
| Avangrid, Inc. | 6,894 | 306,645 | ||||||
| Avista Corp. | 7,782 | 304,821 | ||||||
| Evergy, Inc. | 5,635 | 347,623 | ||||||
| Exelon Corp. | 9,696 | 371,454 | ||||||
| National Fuel Gas Co. | 10,936 | 458,984 | ||||||
| Total Utilities | 2,655,775 | |||||||
| TOTAL COMMON STOCKS | ||||||||
| (Cost $65,293,089) | 71,124,918 | |||||||
| Shares | Value | |||||||
| SHORT TERM INVESTMENTS (0.52%) | ||||||||
| Investments Purchased with Collateral from Securities Loaned (0.52%) | ||||||||
| State Street Navigator Securities Lending Government Money Market Portfolio, 0.15% | ||||||||
| (Cost $372,007) | 372,007 | 372,007 | ||||||
| TOTAL SHORT TERM INVESTMENTS | ||||||||
| (Cost $372,007) | 372,007 | |||||||
| TOTAL INVESTMENTS (100.44%) | ||||||||
| (Cost $65,665,096) | $ | 71,496,925 | ||||||
| LIABILITIES IN EXCESS OF OTHER ASSETS (-0.44%) | (313,402 | ) | ||||||
| NET ASSETS - 100.00% | $ | 71,183,523 | ||||||
| (a) | Non-income producing security. |
| (b) | Security, or a portion of the security position is currently on loan. The total market value of securities on loan is $1,556,473. |
See Notes to Financial Statements.
25 | May 31, 2020
RiverFront Strategic Income Fund
| Schedule of Investments | May 31, 2020 (Unaudited) |
| Security Description | Principal Amount | Value | ||||||
| CORPORATE BONDS (87.45%) | ||||||||
| Communications (11.65%) | ||||||||
| AMC Networks, Inc. | ||||||||
| 5.00%, 04/01/2024 | $ | 1,216,000 | $ | 1,222,840 | ||||
| Charter Communications Operating LLC / Charter Communications Operating Capital | ||||||||
| 3.58%, 07/23/2020 | 1,718,000 | 1,718,108 | ||||||
| Hughes Satellite Systems Corp. | ||||||||
| 7.63%, 06/15/2021 | 1,333,000 | 1,396,284 | ||||||
| Lamar Media Corp. | ||||||||
| 5.00%, 05/01/2023 | 1,410,000 | 1,419,679 | ||||||
| Level 3 Financing, Inc. | ||||||||
| 5.38%, 08/15/2022 | 1,314,000 | 1,317,534 | ||||||
| Netflix, Inc. | ||||||||
| 5.38%, 02/01/2021 | 1,429,000 | 1,463,382 | ||||||
| Sprint Communications, Inc. | ||||||||
| 7.00%, 08/15/2020 | 2,086,000 | 2,104,649 | ||||||
| T-Mobile USA, Inc. | ||||||||
| 6.50%, 01/15/2024 | 1,913,000 | 1,961,600 | ||||||
| VeriSign, Inc. | ||||||||
| 4.63%, 05/01/2023 | 1,187,000 | 1,195,778 | ||||||
| Videotron, Ltd. | ||||||||
| 5.00%, 07/15/2022 | 1,382,000 | 1,434,675 | ||||||
| Total Communications | 15,234,529 | |||||||
| Consumer Discretionary (8.88%) | ||||||||
| ADT Security Corp. | ||||||||
| 6.25%, 10/15/2021 | 1,489,000 | 1,543,207 | ||||||
| Boyd Gaming Corp. | ||||||||
| 6.00%, 08/15/2026 | 827,000 | 807,210 | ||||||
| DR Horton, Inc. | ||||||||
| 4.38%, 09/15/2022 | 1,633,000 | 1,716,134 | ||||||
| Ford Motor Credit Co. LLC | ||||||||
| 3.16%, 08/04/2020 | 982,000 | 986,124 | ||||||
| Griffon Corp. | ||||||||
| 5.25%, 03/01/2022 | 393,000 | 385,881 | ||||||
| Hilton Worldwide Finance LLC / Hilton Worldwide Finance Corp. | ||||||||
| 4.63%, 04/01/2025 | 925,000 | 921,434 | ||||||
| International Game Technology PLC | ||||||||
| 6.25%, 02/15/2022(a) | 1,723,000 | 1,762,241 | ||||||
| Las Vegas Sands Corp. | ||||||||
| 3.20%, 08/08/2024 | 925,000 | 897,882 | ||||||
| Lennar Corp. | ||||||||
| 4.75%, 04/01/2021 | 435,000 | 441,732 | ||||||
| NCL Corp., Ltd. | ||||||||
| 3.63%, 12/15/2024(a) | 862,000 | 519,894 | ||||||
| Six Flags Entertainment Corp. | ||||||||
| 4.88%, 07/31/2024(a) | 1,723,000 | 1,624,109 | ||||||
| Total Consumer Discretionary | 11,605,848 | |||||||
| Security Description | Principal Amount | Value | ||||||
| Consumer Staples (2.59%) | ||||||||
| JBS USA LUX SA / JBS USA Finance, Inc. | ||||||||
| 5.88%, 07/15/2024(a) | $ | 982,000 | $ | 999,494 | ||||
| 5.75%, 06/15/2025(a) | 420,000 | 431,550 | ||||||
| Spectrum Brands, Inc. | ||||||||
| 5.75%, 07/15/2025 | 644,000 | 664,798 | ||||||
| TreeHouse Foods, Inc. | ||||||||
| 6.00%, 02/15/2024(a) | 1,256,000 | 1,290,672 | ||||||
| Total Consumer Staples | 3,386,514 | |||||||
| Energy (12.32%) | ||||||||
| Cheniere Corpus Christi Holdings LLC | ||||||||
| 7.00%, 06/30/2024 | 1,207,000 | 1,344,149 | ||||||
| Concho Resources, Inc. | ||||||||
| 4.38%, 01/15/2025 | 1,368,000 | 1,403,033 | ||||||
| Continental Resources, Inc. | ||||||||
| 5.00%, 09/15/2022 | 983,000 | 939,453 | ||||||
| EnLink Midstream Partners LP | ||||||||
| 4.40%, 04/01/2024 | 12,000 | 9,667 | ||||||
| EQM Midstream Partners LP | ||||||||
| 4.75%, 07/15/2023 | 982,000 | 973,314 | ||||||
| EQT Corp. | ||||||||
| 4.88%, 11/15/2021 | 106,000 | 104,211 | ||||||
| Kinder Morgan Energy Partners LP | ||||||||
| 5.00%, 10/01/2021 | 1,415,000 | 1,468,390 | ||||||
| Marathon Petroleum Corp. | ||||||||
| 5.38%, 10/01/2022 | 1,811,000 | 1,825,780 | ||||||
| Newfield Exploration Co. | ||||||||
| 5.75%, 01/30/2022 | 1,649,000 | 1,592,567 | ||||||
| Occidental Petroleum Corp. | ||||||||
| 4.10%, 02/01/2021 | 1,375,000 | 1,357,813 | ||||||
| Petroleos Mexicanos | ||||||||
| 5.50%, 01/21/2021 | 1,215,000 | 1,218,038 | ||||||
| Sunoco LP / Sunoco Finance Corp. | ||||||||
| 4.88%, 01/15/2023 | 1,422,000 | 1,448,072 | ||||||
| Tallgrass Energy Partners LP / Tallgrass Energy Finance Corp. | ||||||||
| 4.75%, 10/01/2023(a) | 826,000 | 809,988 | ||||||
| Targa Resources Partners LP / Targa Resources Partners Finance Corp. | ||||||||
| 5.25%, 05/01/2023 | 1,603,000 | 1,615,191 | ||||||
| Total Energy | 16,109,666 | |||||||
| Financials (19.68%) | ||||||||
| AerCap Ireland Capital DAC / AerCap Global Aviation Trust | ||||||||
| 4.63%, 10/30/2020 | 1,653,000 | 1,646,486 | ||||||
| Air Lease Corp. | ||||||||
| 4.25%, 02/01/2024 | 955,000 | 907,555 | ||||||
| Ally Financial, Inc. | ||||||||
| 4.25%, 04/15/2021 | 1,462,000 | 1,479,946 | ||||||
| Ares Capital Corp. | ||||||||
| 3.50%, 02/10/2023 | 1,146,000 | 1,123,212 | ||||||
See Notes to Financial Statements.
26 | May 31, 2020
RiverFront Strategic Income Fund
| Schedule of Investments | May 31, 2020 (Unaudited) |
| Security Description | Principal Amount | Value | ||||||
| Financials (continued) | ||||||||
| Bancolombia SA | ||||||||
| 5.13%, 09/11/2022 | $ | 408,000 | $ | 425,473 | ||||
| CIT Group, Inc. | ||||||||
| 5.00%, 08/15/2022 | 2,002,000 | 2,013,241 | ||||||
| ESH Hospitality, Inc. | ||||||||
| 5.25%, 05/01/2025(a) | 1,146,000 | 1,117,470 | ||||||
| Fortress Transportation and Infrastructure Investors LLC | ||||||||
| 6.75%, 03/15/2022(a) | 408,000 | 378,544 | ||||||
| GLP Capital LP / GLP Financing II, Inc. | ||||||||
| 3.35%, 09/01/2024 | 925,000 | 856,545 | ||||||
| HAT Holdings I LLC / HAT Holdings II LLC | ||||||||
| 5.25%, 07/15/2024(a) | 408,000 | 414,163 | ||||||
| Icahn Enterprises LP / Icahn Enterprises Finance Corp. | ||||||||
| 4.75%, 09/15/2024 | 1,235,000 | 1,196,795 | ||||||
| Iron Mountain, Inc. | ||||||||
| 4.38%, 06/01/2021(a) | 1,520,000 | 1,523,108 | ||||||
| iStar, Inc. | ||||||||
| 4.75%, 10/01/2024 | 1,282,000 | 1,157,140 | ||||||
| Ladder Capital Finance Holdings LLLP / Ladder Capital Finance Corp. | ||||||||
| 5.25%, 03/15/2022(a) | 408,000 | 382,751 | ||||||
| MPT Operating Partnership LP / MPT Finance Corp. | ||||||||
| 5.25%, 08/01/2026 | 925,000 | 950,812 | ||||||
| Newmark Group, Inc. | ||||||||
| 6.13%, 11/15/2023 | 408,000 | 375,837 | ||||||
| Omega Healthcare Investors, Inc. | ||||||||
| 4.38%, 08/01/2023 | 1,524,000 | 1,536,478 | ||||||
| Park Aerospace Holdings, Ltd. | ||||||||
| 5.25%, 08/15/2022(a) | 1,957,000 | 1,728,562 | ||||||
| Santander Holdings USA, Inc. | ||||||||
| 3.50%, 06/07/2024 | 468,000 | 486,474 | ||||||
| SBA Communications Corp. | ||||||||
| 4.00%, 10/01/2022 | 408,000 | 414,967 | ||||||
| Service Properties Trust | ||||||||
| 4.35%, 10/01/2024 | 1,375,000 | 1,211,946 | ||||||
| Springleaf Finance Corp. | ||||||||
| 8.25%, 12/15/2020 | 1,532,000 | 1,555,463 | ||||||
| Starwood Property Trust, Inc. | ||||||||
| 5.00%, 12/15/2021 | 1,619,000 | 1,591,178 | ||||||
| Synchrony Financial | ||||||||
| 2.85%, 07/25/2022 | 450,000 | 441,963 | ||||||
| VICI Properties LP / VICI Note Co., Inc. | ||||||||
| 4.25%, 12/01/2026(a) | 821,000 | 815,249 | ||||||
| Total Financials | 25,731,358 | |||||||
| Health Care (2.14%) | ||||||||
| Centene Corp. | ||||||||
| 4.75%, 01/15/2025 | 1,375,000 | 1,423,270 | ||||||
| Security Description | Principal Amount | Value | ||||||
| Health Care (continued) | ||||||||
| DaVita, Inc. | ||||||||
| 5.13%, 07/15/2024 | $ | 925,000 | $ | 944,439 | ||||
| 5.00%, 05/01/2025 | 420,000 | 431,812 | ||||||
| Total Health Care | 2,799,521 | |||||||
| Industrials (5.90%) | ||||||||
| Colfax Corp. | ||||||||
| 6.00%, 02/15/2024(a) | 850,000 | 886,214 | ||||||
| Stericycle, Inc. | ||||||||
| 5.38%, 07/15/2024(a) | 408,000 | 418,455 | ||||||
| United Rentals North America, Inc. | ||||||||
| 5.50%, 07/15/2025 | 435,000 | 451,358 | ||||||
| 4.63%, 10/15/2025 | 1,235,000 | 1,259,058 | ||||||
| WESCO Distribution, Inc. | ||||||||
| 5.38%, 12/15/2021 | 2,007,000 | 2,001,531 | ||||||
| XPO Logistics, Inc. | ||||||||
| 6.50%, 06/15/2022(a) | 1,728,000 | 1,734,005 | ||||||
| 6.75%, 08/15/2024(a) | 925,000 | 964,410 | ||||||
| Total Industrials | 7,715,031 | |||||||
| Materials (11.95%) | ||||||||
| Ashland LLC | ||||||||
| 4.75%, 08/15/2022 | 154,000 | 161,026 | ||||||
| Berry Global, Inc. | ||||||||
| 6.00%, 10/15/2022 | 171,000 | 172,883 | ||||||
| 4.88%, 07/15/2026(a) | 827,000 | 866,415 | ||||||
| Braskem Finance, Ltd. | ||||||||
| 6.45%, 02/03/2024 | 1,258,000 | 1,323,913 | ||||||
| Cascades, Inc. | ||||||||
| 5.75%, 07/15/2023(a) | 1,310,000 | 1,331,150 | ||||||
| Celanese US Holdings LLC | ||||||||
| 5.88%, 06/15/2021 | 1,452,000 | 1,508,677 | ||||||
| CEMEX Finance LLC | ||||||||
| 6.00%, 04/01/2024(a) | 631,000 | 631,385 | ||||||
| CF Industries, Inc. | ||||||||
| 3.45%, 06/01/2023 | 168,000 | 169,573 | ||||||
| Crown Americas LLC / Crown Americas Capital Corp. IV | ||||||||
| 4.50%, 01/15/2023 | 1,259,000 | 1,303,839 | ||||||
| FMG Resources August 2006 Pty, Ltd. | ||||||||
| 4.75%, 05/15/2022(a) | 1,775,000 | 1,806,551 | ||||||
| Freeport-McMoRan, Inc. | ||||||||
| 3.55%, 03/01/2022 | 184,000 | 186,250 | ||||||
| 3.88%, 03/15/2023 | 147,000 | 148,547 | ||||||
| Graphic Packaging International LLC | ||||||||
| 4.75%, 04/15/2021 | 723,000 | 733,845 | ||||||
| 4.88%, 11/15/2022 | 1,404,000 | 1,454,565 | ||||||
| Mauser Packaging Solutions Holding Co. | ||||||||
| 5.50%, 04/15/2024(a) | 408,000 | 406,211 | ||||||
| Owens-Brockway Glass Container, Inc. | ||||||||
| 5.00%, 01/15/2022(a) | 242,000 | 244,353 | ||||||
See Notes to Financial Statements.
27 | May 31, 2020
RiverFront Strategic Income Fund
| Schedule of Investments | May 31, 2020 (Unaudited) |
| Security Description | Principal Amount | Value | ||||||
| Materials (continued) | ||||||||
| Sasol Financing International, Ltd. | ||||||||
| 4.50%, 11/14/2022 | $ | 1,599,000 | $ | 1,369,288 | ||||
| WR Grace & Co.-Conn | ||||||||
| 5.13%, 10/01/2021(a) | 1,761,000 | 1,812,395 | ||||||
| Total Materials | 15,630,866 | |||||||
| Technology (7.83%) | ||||||||
| CommScope, Inc. | ||||||||
| 5.50%, 03/01/2024(a) | 1,368,000 | 1,410,483 | ||||||
| Dell, Inc. | ||||||||
| 4.63%, 04/01/2021 | 97,000 | 99,025 | ||||||
| EMC Corp. | ||||||||
| 2.65%, 06/01/2020 | 634,000 | 634,000 | ||||||
| Flex, Ltd. | ||||||||
| 5.00%, 02/15/2023 | 1,256,000 | 1,316,496 | ||||||
| Micron Technology, Inc. | ||||||||
| 4.64%, 02/06/2024 | 955,000 | 1,049,976 | ||||||
| Nielsen Finance LLC / Nielsen Finance Co. | ||||||||
| 4.50%, 10/01/2020 | 1,524,000 | 1,525,905 | ||||||
| NortonLifeLock, Inc. | ||||||||
| 3.95%, 06/15/2022 | 147,000 | 149,940 | ||||||
| 5.00%, 04/15/2025(a) | 821,000 | 841,525 | ||||||
| NXP BV / NXP Funding LLC | ||||||||
| 4.13%, 06/01/2021(a) | 925,000 | 952,255 | ||||||
| Seagate HDD Cayman | ||||||||
| 4.25%, 03/01/2022 | 339,000 | 349,565 | ||||||
| 4.75%, 06/01/2023 | 674,000 | 712,405 | ||||||
| Xerox Corp. | ||||||||
| 4.50%, 05/15/2021 | 1,189,000 | 1,195,129 | ||||||
| Total Technology | 10,236,704 | |||||||
| Utilities (4.51%) | ||||||||
| AES Corp. | ||||||||
| 4.00%, 03/15/2021 | 482,000 | 495,648 | ||||||
| 4.50%, 03/15/2023 | 450,000 | 459,632 | ||||||
| Calpine Corp. | ||||||||
| 5.25%, 06/01/2026(a) | 827,000 | 858,769 | ||||||
| DPL, Inc. | ||||||||
| 7.25%, 10/15/2021 | 931,000 | 959,978 | ||||||
| NextEra Energy Operating Partners LP | ||||||||
| 4.25%, 07/15/2024(a) | 1,419,000 | 1,468,814 | ||||||
| Vistra Operations Co. LLC | ||||||||
| 3.55%, 07/15/2024(a) | 1,622,000 | 1,660,141 | ||||||
| Total Utilities | 5,902,982 | |||||||
| TOTAL CORPORATE BONDS | ||||||||
| (Cost $116,182,332) | 114,353,019 | |||||||
| 7 Day Yield | Shares | Value | ||||||||||
| SHORT TERM INVESTMENTS (11.33%) | ||||||||||||
| State Street Institutional Treasury Plus Money Market Fund | 0.15 | % | 14,809,834 | $ | 14,809,834 | |||||||
| TOTAL SHORT TERM INVESTMENTS | ||||||||||||
| (Cost $14,809,834) | 14,809,834 | |||||||||||
| TOTAL INVESTMENTS (98.78%) | ||||||||||||
| (Cost $130,992,166) | $ | 129,162,853 | ||||||||||
| OTHER ASSETS IN EXCESS OF LIABILITIES (1.22%) | 1,595,935 | |||||||||||
| NET ASSETS - 100.00% | $ | 130,758,788 | ||||||||||
| (a) | Securities exempt from registration under Rule 144A of the Securities Act of 1933. These securities may be sold in the ordinary course of business in transactions exempt from registration, normally to qualified institutional buyers. At period end, the aggregate market value of those securities was $32,091,326, representing 24.54% of net assets. |
See Notes to Financial Statements.
28 | May 31, 2020
RiverFront ETFs
| Statement of Assets and Liabilities | May 31, 2020 (Unaudited) |
RiverFront Dynamic Core Income ETF | RiverFront Dynamic Unconstrained Income ETF | RiverFront Dynamic US Dividend Advantage ETF | RiverFront Dynamic US Flex-Cap ETF | RiverFront Strategic Income Fund | ||||||||||||||||
| ASSETS: | ||||||||||||||||||||
| Investments, at value | $ | 137,848,884 | $ | 12,249,801 | $ | 120,914,008 | $ | 71,496,925 | $ | 129,162,853 | ||||||||||
| Cash | – | 890 | – | – | – | |||||||||||||||
| Dividend receivable | – | – | 224,976 | 118,183 | – | |||||||||||||||
| Interest receivable | 642,618 | 139,276 | – | – | 1,646,293 | |||||||||||||||
| Receivable for investments sold | – | – | – | 1,577,451 | – | |||||||||||||||
| Total Assets | 138,491,502 | 12,389,967 | 121,138,984 | 73,192,559 | 130,809,146 | |||||||||||||||
| LIABILITIES: | ||||||||||||||||||||
| Payable to adviser | 59,525 | 5,260 | 50,932 | 31,138 | 50,358 | |||||||||||||||
| Due to custodian | – | – | – | 29,343 | – | |||||||||||||||
| Payable for collateral upon return of securities loaned | – | – | 435,528 | 372,007 | – | |||||||||||||||
| Payable for Capital Shares | – | – | – | 1,576,548 | – | |||||||||||||||
| Total Liabilities | 59,525 | 5,260 | 486,460 | 2,009,036 | 50,358 | |||||||||||||||
| NET ASSETS | $ | 138,431,977 | $ | 12,384,707 | $ | 120,652,524 | $ | 71,183,523 | $ | 130,758,788 | ||||||||||
| NET ASSETS CONSIST OF: | ||||||||||||||||||||
| Paid-in capital | $ | 127,556,457 | $ | 12,874,193 | $ | 125,321,008 | $ | 88,435,658 | $ | 142,559,971 | ||||||||||
| Total distributable earnings | 10,875,520 | (489,486 | ) | (4,668,484 | ) | (17,252,135 | ) | (11,801,183 | ) | |||||||||||
| NET ASSETS | $ | 138,431,977 | $ | 12,384,707 | $ | 120,652,524 | $ | 71,183,523 | $ | 130,758,788 | ||||||||||
| INVESTMENTS, AT COST | $ | 127,345,072 | $ | 12,251,373 | $ | 112,524,193 | $ | 65,665,096 | $ | 130,992,166 | ||||||||||
| PRICING OF SHARES | ||||||||||||||||||||
| Net Assets | $ | 138,431,977 | $ | 12,384,707 | $ | 120,652,524 | $ | 71,183,523 | $ | 130,758,788 | ||||||||||
| Shares of beneficial interest outstanding (Unlimited number of shares authorized, par value $0.01 per share) | 5,300,000 | 500,000 | 3,800,002 | 2,250,002 | 5,400,000 | |||||||||||||||
| Net Asset Value, offering and redemption price per share | $ | 26.12 | $ | 24.77 | $ | 31.75 | $ | 31.64 | $ | 24.21 | ||||||||||
See Notes to Financial Statements.
29 | May 31, 2020
RiverFront ETFs
| Statement of Operations | For the Six Months Ended May 31, 2020 (Unaudited) |
RiverFront Dynamic Core Income ETF | RiverFront Dynamic Unconstrained Income ETF | RiverFront Dynamic US Dividend Advantage ETF | RiverFront Dynamic US Flex-Cap ETF | RiverFront Strategic Income Fund | ||||||||||||||||
| INVESTMENT INCOME: | ||||||||||||||||||||
| Interest | $ | 1,657,241 | $ | 348,105 | $ | – | $ | – | $ | 3,162,707 | ||||||||||
| Dividends(a) | 108,329 | 16,061 | 1,610,109 | 1,114,335 | 90,191 | |||||||||||||||
| Securities Lending Income | – | – | 1,789 | 2,024 | – | |||||||||||||||
| Total Investment Income | 1,765,570 | 364,166 | 1,611,898 | 1,116,359 | 3,252,898 | |||||||||||||||
| EXPENSES: | ||||||||||||||||||||
| Investment adviser and sub-adviser fees (Note 3) | 331,994 | 36,945 | 305,045 | 273,443 | 366,876 | |||||||||||||||
| Total Expenses | 331,994 | 36,945 | 305,045 | 273,443 | 366,876 | |||||||||||||||
| NET INVESTMENT INCOME | 1,433,576 | 327,221 | 1,306,853 | 842,916 | 2,886,022 | |||||||||||||||
| REALIZED AND UNREALIZED GAIN/(LOSS) | ||||||||||||||||||||
| Net realized gain/(loss) on investments | 786,585 | (27,434 | ) | (9,216,858 | ) | (12,835,831 | ) | (360,995 | ) | |||||||||||
| NET REALIZED GAIN/(LOSS) | 786,585 | (27,434 | ) | (9,216,858 | ) | (12,835,831 | ) | (360,995 | ) | |||||||||||
| Net change in unrealized appreciation/(depreciation) on investments | 3,760,127 | (448,990 | ) | 2,573,973 | (845,579 | ) | (4,168,008 | ) | ||||||||||||
| NET CHANGE IN UNREALIZED | ||||||||||||||||||||
| APPRECIATION/(DEPRECIATION) | 3,760,127 | (448,990 | ) | 2,573,973 | (845,579 | ) | (4,168,008 | ) | ||||||||||||
| NET REALIZED AND UNREALIZED | ||||||||||||||||||||
| GAIN/(LOSS) ON INVESTMENTS | 4,546,712 | (476,424 | ) | (6,642,885 | ) | (13,681,410 | ) | (4,529,003 | ) | |||||||||||
| NET INCREASE/(DECREASE) IN NET ASSETS | ||||||||||||||||||||
| RESULTING FROM OPERATIONS | $ | 5,980,288 | $ | (149,203 | ) | $ | (5,336,032 | ) | $ | (12,838,494 | ) | $ | (1,642,981 | ) | ||||||
| (a) | Net of foreign tax withholding in the amounts of $0, $0, $0, $572 and $0 respectively. |
See Notes to Financial Statements.
30 | May 31, 2020
RiverFront Dynamic Core Income ETF
Statements of Changes in Net Assets
For the Six Months Ended May 31, 2020 (Unaudited) | For the Year Ended November 30, 2019 | |||||||
| OPERATIONS: | ||||||||
| Net investment income | $ | 1,433,576 | $ | 4,038,242 | ||||
| Net realized gain | 786,585 | 1,644,094 | ||||||
| Net change in unrealized appreciation | 3,760,127 | 9,057,180 | ||||||
| Net increase in net assets resulting from operations | 5,980,288 | 14,739,516 | ||||||
| DISTRIBUTIONS TO SHAREHOLDERS: | ||||||||
| From distributable earnings | (1,432,860 | ) | (4,068,776 | ) | ||||
| Total distributions | (1,432,860 | ) | (4,068,776 | ) | ||||
| CAPITAL SHARE TRANSACTIONS: | ||||||||
| Proceeds from sale of shares | 11,656,737 | 8,489,400 | ||||||
| Shares redeemed | (12,723,612 | ) | (34,735,633 | ) | ||||
| Net decrease from share transactions | (1,066,875 | ) | (26,246,233 | ) | ||||
| Net increase/(decrease) in net assets | 3,480,553 | (15,575,493 | ) | |||||
| NET ASSETS: | ||||||||
| Beginning of period | 134,951,424 | 150,526,917 | ||||||
| End of period | $ | 138,431,977 | $ | 134,951,424 | ||||
| OTHER INFORMATION: | ||||||||
| CAPITAL SHARE TRANSACTIONS: | ||||||||
| Beginning shares | 5,350,000 | 6,400,000 | ||||||
| Shares sold | 450,000 | 350,000 | ||||||
| Shares redeemed | (500,000 | ) | (1,400,000 | ) | ||||
| Shares outstanding, end of period | 5,300,000 | 5,350,000 | ||||||
See Notes to Financial Statements.
31 | May 31, 2020
RiverFront Dynamic Unconstrained Income ETF
Statements of Changes in Net Assets
For the Six Months Ended May 31, 2020 (Unaudited) | For the Year Ended November 30, 2019 | |||||||
| OPERATIONS: | ||||||||
| Net investment income | $ | 327,221 | $ | 893,603 | ||||
| Net realized loss | (27,434 | ) | (73,537 | ) | ||||
| Net change in unrealized appreciation/(depreciation) | (448,990 | ) | 864,883 | |||||
| Net Increase/(Decrease) in net assets resulting from operations | (149,203 | ) | 1,684,949 | |||||
| DISTRIBUTIONS TO SHAREHOLDERS: | ||||||||
| From distributable earnings | (332,846 | ) | (919,523 | ) | ||||
| Total distributions | (332,846 | ) | (919,523 | ) | ||||
| CAPITAL SHARE TRANSACTIONS: | ||||||||
| Shares redeemed | (3,666,634 | ) | (8,712,993 | ) | ||||
| Net decrease from share transactions | (3,666,634 | ) | (8,712,993 | ) | ||||
| Net decrease in net assets | (4,148,683 | ) | (7,947,567 | ) | ||||
| NET ASSETS: | ||||||||
| Beginning of period | 16,533,390 | 24,480,957 | ||||||
| End of period | $ | 12,384,707 | $ | 16,533,390 | ||||
| OTHER INFORMATION: | ||||||||
| CAPITAL SHARE TRANSACTIONS: | ||||||||
| Beginning shares | 650,000 | 1,000,000 | ||||||
| Shares sold | – | – | ||||||
| Shares redeemed | (150,000 | ) | (350,000 | ) | ||||
| Shares outstanding, end of period | 500,000 | 650,000 | ||||||
See Notes to Financial Statements.
32 | May 31, 2020
RiverFront Dynamic US Dividend Advantage ETF
Statements of Changes in Net Assets
For the Six Months Ended May 31, 2020 (Unaudited) | For the Year Ended November 30, 2019 | |||||||
| OPERATIONS: | ||||||||
| Net investment income | $ | 1,306,853 | $ | 2,748,112 | ||||
| Net realized gain/(loss) | (9,216,858 | ) | 842,336 | |||||
| Net change in unrealized appreciation | 2,573,973 | 9,392,104 | ||||||
| Net Increase/(Decrease) in net assets resulting from operations | (5,336,032 | ) | 12,982,552 | |||||
| DISTRIBUTIONS TO SHAREHOLDERS: | ||||||||
| From distributable earnings | (1,167,511 | ) | (2,830,437 | ) | ||||
| Total distributions | (1,167,511 | ) | (2,830,437 | ) | ||||
| CAPITAL SHARE TRANSACTIONS: | ||||||||
| Proceeds from sale of shares | 17,859,214 | 12,883,372 | ||||||
| Shares redeemed | (21,531,414 | ) | (43,499,849 | ) | ||||
| Net decrease from share transactions | (3,672,200 | ) | (30,616,477 | ) | ||||
| Net decrease in net assets | (10,175,743 | ) | (20,464,362 | ) | ||||
| NET ASSETS: | ||||||||
| Beginning of period | 130,828,267 | 151,292,629 | ||||||
| End of period | $ | 120,652,524 | $ | 130,828,267 | ||||
| OTHER INFORMATION: | ||||||||
| CAPITAL SHARE TRANSACTIONS: | ||||||||
| Beginning shares | 3,850,002 | 4,850,002 | ||||||
| Shares sold | 600,000 | 400,000 | ||||||
| Shares redeemed | (650,000 | ) | (1,400,000 | ) | ||||
| Shares outstanding, end of period | 3,800,002 | 3,850,002 | ||||||
See Notes to Financial Statements.
33 | May 31, 2020
RiverFront Dynamic US Flex-Cap ETF
Statements of Changes in Net Assets
For the Six Months Ended May 31, 2020 (Unaudited) | For the Year Ended November 30, 2019 | |||||||
| OPERATIONS: | ||||||||
| Net investment income | $ | 842,916 | $ | 1,979,232 | ||||
| Net realized loss | (12,835,831 | ) | (7,792,444 | ) | ||||
| Net change in unrealized appreciation/(depreciation) | (845,579 | ) | 14,831,746 | |||||
| Net Increase/(Decrease) in net assets resulting from operations | (12,838,494 | ) | 9,018,534 | |||||
| DISTRIBUTIONS TO SHAREHOLDERS: | ||||||||
| From distributable earnings | (801,844 | ) | (2,084,364 | ) | ||||
| Total distributions | (801,844 | ) | (2,084,364 | ) | ||||
| CAPITAL SHARE TRANSACTIONS: | ||||||||
| Proceeds from sale of shares | 1,823,641 | 14,320,639 | ||||||
| Shares redeemed | (43,661,782 | ) | (47,057,304 | ) | ||||
| Net decrease from share transactions | (41,838,141 | ) | (32,736,665 | ) | ||||
| Net decrease in net assets | (55,478,479 | ) | (25,802,495 | ) | ||||
| NET ASSETS: | ||||||||
| Beginning of period | 126,662,002 | 152,464,497 | ||||||
| End of period | $ | 71,183,523 | $ | 126,662,002 | ||||
| OTHER INFORMATION: | ||||||||
| CAPITAL SHARE TRANSACTIONS: | ||||||||
| Beginning shares | 3,650,002 | 4,650,002 | ||||||
| Shares sold | 50,000 | 450,000 | ||||||
| Shares redeemed | (1,450,000 | ) | (1,450,000 | ) | ||||
| Shares outstanding, end of period | 2,250,002 | 3,650,002 | ||||||
See Notes to Financial Statements.
34 | May 31, 2020
RiverFront Strategic Income Fund
Statements of Changes in Net Assets
For the Six Months Ended May 31, 2020 (Unaudited) | For the Year Ended November 30, 2019 | |||||||
| OPERATIONS: | ||||||||
| Net investment income | $ | 2,886,022 | $ | 5,968,063 | ||||
| Net realized gain/(loss) | (360,995 | ) | 2,778 | |||||
| Net change in unrealized appreciation/(depreciation) | (4,168,008 | ) | 3,051,952 | |||||
| Net Increase/(Decrease) in net assets resulting from operations | (1,642,981 | ) | 9,022,793 | |||||
| DISTRIBUTIONS TO SHAREHOLDERS: | ||||||||
| From distributable earnings | (3,057,240 | ) | (6,324,290 | ) | ||||
| Total distributions | (3,057,240 | ) | (6,324,290 | ) | ||||
| CAPITAL SHARE TRANSACTIONS: | ||||||||
| Proceeds from sale of shares | 13,702,517 | 26,966,259 | ||||||
| Shares redeemed | (46,132,847 | ) | (14,655,413 | ) | ||||
| Net increase/(decrease) from share transactions | (32,430,330 | ) | 12,310,846 | |||||
| Net increase/(decrease) in net assets | (37,130,551 | ) | 15,009,349 | |||||
| NET ASSETS: | ||||||||
| Beginning of period | 167,889,339 | 152,879,990 | ||||||
| End of period | $ | 130,758,788 | $ | 167,889,339 | ||||
| OTHER INFORMATION: | ||||||||
| CAPITAL SHARE TRANSACTIONS: | ||||||||
| Beginning shares | 6,800,000 | 6,300,000 | ||||||
| Shares sold | 550,000 | 1,100,000 | ||||||
| Shares redeemed | (1,950,000 | ) | (600,000 | ) | ||||
| Shares outstanding, end of period | 5,400,000 | 6,800,000 | ||||||
See Notes to Financial Statements.
35 | May 31, 2020
RiverFront Dynamic Core Income ETF
| Financial Highlights | For a share outstanding throughout the periods presented |
For the Six Months Ended May 31, 2020 (Unaudited) | For the Year Ended November 30, 2019 | For the Year Ended November 30, 2018 | For the Year Ended November 30, 2017 | For the Period June 14, 2016 (Commencement) to November 30, 2016 | ||||||||||||||||
| NET ASSET VALUE, BEGINNING OF PERIOD | $ | 25.22 | $ | 23.52 | $ | 24.60 | $ | 24.32 | $ | 25.00 | ||||||||||
| INCOME/(LOSS) FROM INVESTMENT OPERATIONS: | ||||||||||||||||||||
| Net investment income(a) | 0.28 | 0.68 | 0.68 | 0.53 | 0.24 | |||||||||||||||
| Net realized and unrealized gain/(loss) | 0.90 | 1.70 | (1.10 | ) | 0.23 | (0.68 | ) | |||||||||||||
| Total from investment operations | 1.18 | 2.38 | (0.42 | ) | 0.76 | (0.44 | ) | |||||||||||||
| DISTRIBUTIONS: | ||||||||||||||||||||
| From net investment income | (0.28 | ) | (0.68 | ) | (0.66 | ) | (0.48 | ) | (0.24 | ) | ||||||||||
| Total distributions | (0.28 | ) | (0.68 | ) | (0.66 | ) | (0.48 | ) | (0.24 | ) | ||||||||||
| NET INCREASE/(DECREASE) IN NET ASSET VALUE | 0.90 | 1.70 | (1.08 | ) | 0.28 | (0.68 | ) | |||||||||||||
| NET ASSET VALUE, END OF PERIOD | $ | 26.12 | $ | 25.22 | $ | 23.52 | $ | 24.60 | $ | 24.32 | ||||||||||
| TOTAL RETURN(b) | 4.71 | % | 10.22 | % | (1.74 | )% | 3.15 | % | (1.77 | )% | ||||||||||
| RATIOS/SUPPLEMENTAL DATA: | ||||||||||||||||||||
Net assets, end of period (000s) | $ | 138,432 | $ | 134,951 | $ | 150,527 | $ | 47,962 | $ | 6,081 | ||||||||||
| Ratio of expenses to average net assets | 0.51 | %(c) | 0.51 | % | 0.51 | % | 0.51 | % | 0.51 | %(c) | ||||||||||
| Ratio of net investment income to average net assets | 2.20 | %(c) | 2.74 | % | 2.83 | % | 2.15 | % | 2.12 | %(c) | ||||||||||
| Portfolio turnover rate(d) | 0 | % | 6 | % | 15 | % | 18 | % | 26 | % | ||||||||||
| (a) | Based on average shares outstanding during the period. |
| (b) | Total return is calculated assuming an initial investment made at the net asset value at the beginning of the period and the redemption at the net asset value on the last day of the period and assuming all distributions are reinvested at the actual reinvestment prices. Total return calculated for a period of less than one year is not annualized. |
| (c) | Annualized. |
| (d) | Portfolio turnover for periods less than one year are not annualized and does not include securities received or delivered from processing creations or redemptions in-kind. |
See Notes to Financial Statements.
36 | May 31, 2020
RiverFront Dynamic Unconstrained Income ETF
| Financial Highlights | For a share outstanding throughout the periods presented |
For the Six Months Ended May 31, 2020 (Unaudited) | For the Year Ended November 30, 2019 | For the Year Ended November 30, 2018 | For the Year Ended November 30, 2017 | For the Period June 14, 2016 (Commencement) to November 30, 2016 | ||||||||||||||||
| NET ASSET VALUE, BEGINNING OF PERIOD | $ | 25.44 | $ | 24.48 | $ | 26.13 | $ | 25.55 | $ | 25.00 | ||||||||||
| INCOME/(LOSS) FROM INVESTMENT OPERATIONS: | ||||||||||||||||||||
| Net investment income(a) | 0.56 | 1.20 | 1.24 | 1.22 | 0.63 | |||||||||||||||
| Net realized and unrealized gain/(loss) | (0.65 | ) | 0.99 | (1.63 | ) | 0.56 | 0.55 | |||||||||||||
| Total from investment operations | (0.09 | ) | 2.19 | (0.39 | ) | 1.78 | 1.18 | |||||||||||||
| DISTRIBUTIONS: | ||||||||||||||||||||
| From net investment income | (0.58 | ) | (1.23 | ) | (1.15 | ) | (1.20 | ) | (0.63 | ) | ||||||||||
| From net realized gains | – | – | (0.09 | ) | – | – | ||||||||||||||
| Tax return of capital | – | – | (0.02 | ) | – | – | ||||||||||||||
| Total distributions | (0.58 | ) | (1.23 | ) | (1.26 | ) | (1.20 | ) | (0.63 | ) | ||||||||||
| NET INCREASE/(DECREASE) IN NET ASSET VALUE | (0.67 | ) | 0.96 | (1.65 | ) | 0.58 | 0.55 | |||||||||||||
| NET ASSET VALUE, END OF PERIOD | $ | 24.77 | $ | 25.44 | $ | 24.48 | $ | 26.13 | $ | 25.55 | ||||||||||
| TOTAL RETURN(b) | (0.32 | )% | 9.15 | % | (1.52 | )% | 7.06 | % | 4.72 | % | ||||||||||
| RATIOS/SUPPLEMENTAL DATA: | ||||||||||||||||||||
Net assets, end of period (000s) | $ | 12,385 | $ | 16,533 | $ | 24,481 | $ | 11,759 | $ | 5,110 | ||||||||||
| Ratio of expenses to average net assets | 0.51 | %(c) | 0.51 | % | 0.51 | % | 0.51 | % | 0.51 | %(c) | ||||||||||
| Ratio of net investment income to average net assets | 4.52 | %(c) | 4.77 | % | 4.93 | % | 4.65 | % | 5.31 | %(c) | ||||||||||
| Portfolio turnover rate(d) | 13 | % | 23 | % | 51 | % | 30 | % | 11 | % | ||||||||||
| (a) | Based on average shares outstanding during the period. |
| (b) | Total return is calculated assuming an initial investment made at the net asset value at the beginning of the period and the redemption at the net asset value on the last day of the period and assuming all distributions are reinvested at the actual reinvestment prices. Total return calculated for a period of less than one year is not annualized. |
| (c) | Annualized. |
| (d) | Portfolio turnover for periods less than one year are not annualized and does not include securities received or delivered from processing creations or redemptions in-kind. |
See Notes to Financial Statements.
37 | May 31, 2020
RiverFront Dynamic US Dividend Advantage ETF
| Financial Highlights | For a share outstanding throughout the periods presented |
For the Six Months Ended May 31, 2020 (Unaudited) | For the Year Ended November 30, 2019 | For the Year Ended November 30, 2018 | For the Year Ended November 30, 2017 | For the Period June 7, 2016 (Commencement) to November 30, 2016 | ||||||||||||||||
| NET ASSET VALUE, BEGINNING OF PERIOD | $ | 33.98 | $ | 31.19 | $ | 31.39 | $ | 26.59 | $ | 25.14 | ||||||||||
| INCOME/(LOSS) FROM INVESTMENT OPERATIONS: | ||||||||||||||||||||
| Net investment income(a) | 0.36 | 0.65 | 0.73 | 0.63 | 0.26 | |||||||||||||||
| Net realized and unrealized gain/(loss) | (2.27 | ) | 2.81 | (0.26 | ) | 4.76 | 1.40 | |||||||||||||
| Total from investment operations | (1.91 | ) | 3.46 | 0.47 | 5.39 | 1.66 | ||||||||||||||
| DISTRIBUTIONS: | ||||||||||||||||||||
| From net investment income | (0.32 | ) | (0.67 | ) | (0.67 | ) | (0.59 | ) | (0.21 | ) | ||||||||||
| Total distributions | (0.32 | ) | (0.67 | ) | (0.67 | ) | (0.59 | ) | (0.21 | ) | ||||||||||
| NET INCREASE/(DECREASE) IN NET ASSET VALUE | (2.23 | ) | 2.79 | (0.20 | ) | 4.80 | 1.45 | |||||||||||||
| NET ASSET VALUE, END OF PERIOD | $ | 31.75 | $ | 33.98 | $ | 31.19 | $ | 31.39 | $ | 26.59 | ||||||||||
| TOTAL RETURN(b) | (5.63 | )% | 11.29 | % | 1.45 | % | 20.49 | % | 6.64 | % | ||||||||||
| RATIOS/SUPPLEMENTAL DATA: | ||||||||||||||||||||
Net assets, end of period (000s) | $ | 120,653 | $ | 130,828 | $ | 151,293 | $ | 59,644 | $ | 13,297 | ||||||||||
| Ratio of expenses to average net assets | 0.52 | %(c) | 0.52 | % | 0.52 | % | 0.52 | % | 0.52 | %(c) | ||||||||||
| Ratio of net investment income to average net assets | 2.23 | %(c) | 2.05 | % | 2.27 | % | 2.19 | % | 2.13 | %(c) | ||||||||||
| Portfolio turnover rate(d) | 21 | % | 64 | % | 96 | % | 54 | % | 45 | % | ||||||||||
| (a) | Based on average shares outstanding during the period. |
| (b) | Total return is calculated assuming an initial investment made at the net asset value at the beginning of the period and the redemption at the net asset value on the last day of the period and assuming all distributions are reinvested at the actual reinvestment prices. Total return calculated for a period of less than one year is not annualized. |
| (c) | Annualized. |
| (d) | Portfolio turnover for periods less than one year are not annualized and does not include securities received or delivered from processing creations or redemptions in-kind. |
See Notes to Financial Statements.
38 | May 31, 2020
RiverFront Dynamic US Flex-Cap ETF
| Financial Highlights | For a share outstanding throughout the periods presented |
For the Six Months Ended May 31, 2020 (Unaudited) | For the Year Ended November 30, 2019 | For the Year Ended November 30, 2018 | For the Year Ended November 30, 2017 | For the Period June 7, 2016 (Commencement) to November 30, 2016 | ||||||||||||||||
| NET ASSET VALUE, BEGINNING OF PERIOD | $ | 34.70 | $ | 32.79 | $ | 32.46 | $ | 26.84 | $ | 25.13 | ||||||||||
| INCOME/(LOSS) FROM INVESTMENT OPERATIONS: | ||||||||||||||||||||
| Net investment income(a) | 0.26 | 0.48 | 0.44 | 0.31 | 0.17 | |||||||||||||||
| Net realized and unrealized gain/(loss) | (3.07 | ) | 1.93 | 0.27 | (b) | 5.59 | 1.70 | |||||||||||||
| Total from investment operations | (2.81 | ) | 2.41 | 0.71 | 5.90 | 1.87 | ||||||||||||||
| DISTRIBUTIONS: | ||||||||||||||||||||
| From net investment income | (0.25 | ) | (0.50 | ) | (0.38 | ) | (0.28 | ) | (0.16 | ) | ||||||||||
| Total distributions | (0.25 | ) | (0.50 | ) | (0.38 | ) | (0.28 | ) | (0.16 | ) | ||||||||||
| NET INCREASE/(DECREASE) IN NET ASSET VALUE | (3.06 | ) | 1.91 | 0.33 | 5.62 | 1.71 | ||||||||||||||
| NET ASSET VALUE, END OF PERIOD | $ | 31.64 | $ | 34.70 | $ | 32.79 | $ | 32.46 | $ | 26.84 | ||||||||||
| TOTAL RETURN(c) | (8.09 | )% | 7.49 | % | 2.16 | % | 22.08 | % | 7.45 | % | ||||||||||
| RATIOS/SUPPLEMENTAL DATA: | ||||||||||||||||||||
Net assets, end of period (000s) | $ | 71,184 | $ | 126,662 | $ | 152,464 | $ | 40,576 | $ | 8,053 | ||||||||||
| Ratio of expenses to average net assets | 0.52 | %(d) | 0.52 | % | 0.52 | % | 0.52 | % | 0.52 | %(d) | ||||||||||
| Ratio of net investment income to average net assets | 1.60 | %(d) | 1.46 | % | 1.30 | % | 1.05 | % | 1.34 | %(d) | ||||||||||
| Portfolio turnover rate(e) | 29 | % | 98 | % | 152 | % | 86 | % | 41 | % | ||||||||||
| (a) | Based on average shares outstanding during the period. |
| (b) | Net realized and unrealized loss on investments per share does not correlate to aggregate of the net realized and unrealized gain in the Statements of Operations for the year ended November 30, 2018, primarily due to the timing of the sales and repurchases of the Fund's shares in relation to the fluctuating market values for the Fund's portfolio. |
| (c) | Total return is calculated assuming an initial investment made at the net asset value at the beginning of the period and the redemption at the net asset value on the last day of the period and assuming all distributions are reinvested at the actual reinvestment prices. Total return calculated for a period of less than one year is not annualized. |
| (d) | Annualized. |
| (e) | Portfolio turnover for periods less than one year are not annualized and does not include securities received or delivered from processing creations or redemptions in-kind. |
See Notes to Financial Statements.
39 | May 31, 2020
RiverFront Strategic Income Fund
| Financial Highlights | For a share outstanding throughout the periods presented |
For the Six Months Ended May 31, 2020 (Unaudited) | For the Year Ended November 30, 2019 | For the Year Ended November 30, 2018 | For the Year Ended November 30, 2017 | For the Year Ended November 30, 2016 | For the Year Ended November 30, 2015 | |||||||||||||||||||
| NET ASSET VALUE, BEGINNING OF PERIOD | $ | 24.69 | $ | 24.27 | $ | 25.21 | $ | 25.02 | $ | 24.36 | $ | 25.02 | ||||||||||||
| INCOME/(LOSS) FROM INVESTMENT OPERATIONS: | ||||||||||||||||||||||||
| Net investment income(a) | 0.44 | 0.94 | 1.06 | 1.11 | 1.05 | 0.88 | ||||||||||||||||||
| Net realized and unrealized gain/(loss) | (0.45 | ) | 0.48 | (0.92 | ) | 0.19 | 0.71 | (0.65 | ) | |||||||||||||||
| Total from investment operations | (0.01 | ) | 1.42 | 0.14 | 1.30 | 1.76 | 0.23 | |||||||||||||||||
| DISTRIBUTIONS: | ||||||||||||||||||||||||
| From net investment income | (0.47 | ) | (1.00 | ) | (1.08 | ) | (1.11 | ) | (1.10 | ) | (0.87 | ) | ||||||||||||
| From net realized gains | – | – | – | – | – | (0.02 | ) | |||||||||||||||||
| Total distributions | (0.47 | ) | (1.00 | ) | (1.08 | ) | (1.11 | ) | (1.10 | ) | (0.89 | ) | ||||||||||||
| NET INCREASE/(DECREASE) IN NET ASSET VALUE | (0.48 | ) | 0.42 | (0.94 | ) | 0.19 | 0.66 | (0.66 | ) | |||||||||||||||
| NET ASSET VALUE, END OF PERIOD | $ | 24.21 | $ | 24.69 | $ | 24.27 | $ | 25.21 | $ | 25.02 | $ | 24.36 | ||||||||||||
| TOTAL RETURN(b) | 0.01 | % | 5.96 | % | 0.57 | % | 5.29 | % | 7.38 | % | 0.91 | % | ||||||||||||
| RATIOS/SUPPLEMENTAL DATA: | ||||||||||||||||||||||||
Net assets, end of period (000s) | $ | 130,759 | $ | 167,889 | $ | 152,880 | $ | 337,769 | $ | 326,515 | $ | 464,007 | ||||||||||||
| Ratio of expenses excluding waiver/reimbursement to average net assets | 0.46 | %(c) | 0.46 | % | 0.46 | % | 0.46 | % | 0.46 | % | 0.46 | % | ||||||||||||
| Ratio of expenses including waiver/reimbursement to average net assets | 0.46 | %(c) | 0.46 | % | 0.17 | %(d) | 0.16 | %(e) | 0.17 | %(e) | 0.22 | % | ||||||||||||
| Ratio of net investment income including expenses waiver/reimbursement to average net assets | 3.62 | %(c) | 3.83 | % | 4.31 | % | 4.41 | % | 4.26 | % | 3.54 | % | ||||||||||||
| Portfolio turnover rate(f) | 17 | % | 44 | % | 35 | % | 32 | % | 52 | % | 36 | % | ||||||||||||
| (a) | Based on average shares outstanding during the period. |
| (b) | Total return is calculated assuming an initial investment made at the net asset value at the beginning of the period and the redemption at the net asset value on the last day of the period and assuming all distributions are reinvested at the actual reinvestment prices. Total return calculated for a period of less than one year is not annualized. |
| (c) | Annualized. |
| (d) | Effective November 1, 2018, the Fund’s management fee consists of a fee of 0.11% paid to the Fund’s investment adviser and a fee of 0.35% paid to the Fund’s sub-adviser. The Fund’s sub-adviser ceased its voluntary waiver effective November 1, 2018. |
| (e) | Effective July 1, 2016, the Fund’s management fee consists of a fee of 0.16% paid to the Fund’s investment adviser and a fee of 0.30% paid to the Fund’s sub-adviser. The Fund’s sub-adviser voluntarily waived all of its 0.30% annual sub-advisory fee payable by the Fund until November 1, 2018. |
| (f) | Portfolio turnover for periods less than one year are not annualized and does not include securities received or delivered from processing creations or redemptions in-kind. |
See Notes to Financial Statements.
40 | May 31, 2020
| RiverFront ETFs | |
| Notes to Financial Statements | May 31, 2020 (Unaudited) |
1. ORGANIZATION
ALPS ETF Trust (the “Trust”), a Delaware statutory trust, is an open-end management investment company registered under the Investment Company Act of 1940, as amended (the “1940 Act”). As of May 31, 2020, the Trust consists of sixteen separate portfolios. Each portfolio represents a separate series of the Trust. This report pertains solely to the RiverFront Dynamic Core Income ETF, the RiverFront Dynamic Unconstrained Income ETF, the RiverFront Dynamic US Dividend Advantage ETF, the RiverFront Dynamic US Flex-Cap ETF, and the RiverFront Strategic Income Fund (each a “Fund” and collectively, the “Funds”).
The investment objective of the RiverFront Dynamic Core Income ETF Fund is to seek total return, with an emphasis on income as the source of that total return. The Fund has elected to qualify as a diversified series of the Trust under the 1940 Act.
The investment objective of the RiverFront Dynamic Unconstrained Income ETF Fund is to seek total return, with an emphasis on income as the source of that total return. The Fund is considered non-diversified and may invest a greater portion of assets in securities of individual issuers than a diversified fund. As a result, changes in the market value of a single investment could cause greater fluctuations in share price than would occur in a diversified fund.
The investment objective of the RiverFront Dynamic US Dividend Advantage ETF Fund is to seek to provide capital appreciation and dividend income. The Fund has elected to qualify as a diversified series of the Trust under the 1940 Act.
The investment objective of the RiverFront Dynamic US Flex-Cap ETF Fund is to seek to provide capital appreciation. The Fund has elected to qualify as a diversified series of the Trust under the 1940 Act.
The investment objective of the RiverFront Strategic Income Fund is to seek total return, with an emphasis on income as the source of that total return. The Fund has elected to qualify as a diversified series of the Trust under the 1940 Act.
Each Fund’s Shares (“Shares”) are listed on the NYSE Arca, Inc. Each Fund issues and redeems Shares at net asset value (“NAV”) in blocks of 50,000 Shares, each of which is called a “Creation Unit”. Creation Units are issued and redeemed principally in-kind for securities and/or cash. Except when aggregated in Creation Units, Shares are not redeemable securities of a Fund.
Pursuant to the Trust’s organizational documents, its Officers and Trustees are indemnified against certain liability arising out of the performance of their duties to the Trust. Additionally, in the normal course of business, the Trust enters into contracts with service providers that contain general indemnification clauses. The Trust’s maximum exposure under these arrangements is unknown, as this would involve future claims that may be made against the Trust that have not yet occurred.
2. SIGNIFICANT ACCOUNTING POLICIES
The following is a summary of significant accounting policies consistently followed by the Funds in the preparation of the financial statements. The accompanying financial statements were prepared in accordance with accounting principles generally accepted in the United States of America (“U.S. GAAP”). The preparation of financial statements in conformity with U.S. GAAP requires management to make certain estimates and assumptions that affect the reported amounts of assets and liabilities and disclosures of contingent assets and liabilities at the date of the financial statements and the reported amounts of revenue and expenses during the period. Actual results could differ from those estimates. Each Fund is considered an investment company under U.S. GAAP and follows the accounting and reporting guidance applicable to investment companies in the Financial Accounting Standards Board (“FASB”) Accounting Standards Codification Topic 946.
A. Portfolio Valuation
Each Fund’s NAV is determined daily, as of the close of regular trading on the New York Stock Exchange (the “NYSE”), normally 4:00 p.m. Eastern time, on each day the NYSE is open for trading. The NAV is computed by dividing the value of all assets of each Fund (including accrued interest and dividends), less all liabilities (including accrued expenses and dividends declared but unpaid), by the total number of shares outstanding.
Portfolio securities listed on any exchange other than the NASDAQ Stock Market LLC (“NASDAQ”) are valued at the last sale price on the business day as of which such value is being determined. If there has been no sale on such day, the securities are valued at the mean of the most recent bid and ask prices on such day. Securities traded on the NASDAQ are valued at the NASDAQ Official Closing Price as determined by NASDAQ. Portfolio securities traded on more than one securities exchange are valued at the last sale price on the business day as of which such value is being determined at the close of the exchange representing the principal market for such securities. Portfolio securities traded in the over-the-counter market, but excluding securities traded on the NASDAQ, are valued at the last quoted sale price in such market.
41 | May 31, 2020
| RiverFront ETFs | |
| Notes to Financial Statements | May 31, 2020 (Unaudited) |
Corporate bonds and United States government bonds are typically valued at the mean between the evaluated bid and ask prices formulated by an independent pricing service.
Each Fund’s investments are valued at market value or, in the absence of market value with respect to any portfolio securities, at fair value according to procedures adopted by the Trust’s Board of Trustees (the “Board”). When market quotations are not readily available or when events occur that make established valuation methods unreliable, securities of the Funds may be valued in good faith by or under the direction of the Board. These securities generally include, but are not limited to, restricted securities (securities which may not be publicly sold without registration under the Securities Act of 1933) for which a pricing service is unable to provide a market price; securities whose trading has been formally suspended; a security whose market price is not available from a pre-established primary pricing source or the pricing source is not willing to provide a price; a security with respect to which an event has occurred that is most likely to materially affect the value of the security after the market has closed but before the calculation of a Fund’s NAV or make it difficult or impossible to obtain a reliable market quotation; or a security whose price, as provided by the pricing service, does not reflect the security’s “fair value” due to the security being de-listed from a national exchange or the security’s primary trading market is temporarily closed at a time when, under normal conditions, it would be open. As a general principle, the current “fair value” of a security would be the amount which the owner might reasonably expect to receive from the sale on the applicable exchange or principal market. A variety of factors may be considered in determining the fair value of such securities.
B. Fair Value Measurements
Each Fund discloses the classification of its fair value measurements following a three-tier hierarchy based on the inputs used to measure fair value. Inputs refer broadly to the assumptions that market participants would use in pricing the asset or liability, including assumptions about risk. Inputs may be observable or unobservable. Observable inputs reflect the assumptions market participants would use in pricing the asset or liability that are developed based on market data obtained from sources independent of the reporting entity. Unobservable inputs reflect the reporting entity’s own assumptions about the assumptions market participants would use in pricing the asset or liability that are developed based on the best information available.
Valuation techniques used to value the Funds’ investments by major category are as follows:
Equity securities, including restricted securities, for which market quotations are readily available, are valued at the last reported sale price or official closing price as reported by a third party pricing vendor on the primary market or exchange on which they are traded and are categorized as Level 1 in the hierarchy. In the event there were no sales during the day or closing prices are not available, securities are valued at the mean of the most recent quoted bid and ask prices on such day and are generally categorized as Level 2 in the hierarchy. Investments in open-end mutual funds are valued at their closing NAV each business day and are categorized as Level 1 in the hierarchy.
Debt securities, including restricted securities, are valued based on evaluated prices received from third party pricing vendors or from brokers who make markets in such securities. For corporate bonds, pricing vendors utilize matrix pricing which considers yield or price of bonds of comparable quality, coupon, maturity and type as well as broker-supplied prices. When independent prices are unavailable or unreliable, debt securities may be valued utilizing pricing methodologies which consider similar factors that would be used by third party pricing vendors. Debt securities are generally categorized as Level 2 in the hierarchy but may be Level 3 depending on the circumstances. The RiverFront Dynamic Core Income ETF, the RiverFront Dynamic Unconstrained Income ETF, and the RiverFront Strategic Income Fund may invest a significant portion of their assets in below investment grade securities. The value of these securities can be more volatile due to changes in the credit quality of the issuer and is sensitive to changes in economic, market and regulatory conditions.
Changes in valuation techniques may result in transfers in or out of an assigned level within the disclosure hierarchy.
Various inputs are used in determining the value of each Fund’s investments as of the end of the reporting period. When inputs used fall into different levels of the fair value hierarchy, the level in the hierarchy within which the fair value measurement falls is determined based on the lowest level input that is significant to the fair value measurement in its entirety. The designated input levels are not necessarily an indication of the risk or liquidity associated with these investments.
42 | May 31, 2020
| RiverFront ETFs | |
| Notes to Financial Statements | May 31, 2020 (Unaudited) |
These inputs are categorized in the following hierarchy under applicable financial accounting standards:
| Level 1 – | Unadjusted quoted prices in active markets for identical investments, unrestricted assets or liabilities that a Fund has the ability to access at the measurement date; |
| Level 2 – | Quoted prices which are not active, quoted prices for similar assets or liabilities in active markets or inputs other than quoted prices that are observable (either directly or indirectly) for substantially the full term of the asset or liability; and |
| Level 3 – | Significant unobservable prices or inputs (including the Fund’s own assumptions in determining the fair value of investments) where there is little or no market activity for the asset or liability at the measurement date. |
The following is a summary of the inputs used to value the Funds’ investments as of May 31, 2020:
| RiverFront Dynamic Core Income ETF | ||||||||||||||||
| Investments in Securities at Value | Level 1 - Quoted and Unadjusted Prices | Level 2 - Other Significant Observable Inputs | Level 3 - Significant Unobservable Inputs | Total | ||||||||||||
| Corporate Bonds* | $ | – | $ | 74,273,376 | $ | – | $ | 74,273,376 | ||||||||
| Government Bonds* | – | 36,893,111 | – | 36,893,111 | ||||||||||||
| Short Term Investments | 26,682,397 | – | – | 26,682,397 | ||||||||||||
| Total | $ | 26,682,397 | $ | 111,166,487 | $ | – | $ | 137,848,884 | ||||||||
| RiverFront Dynamic Unconstrained Income ETF | ||||||||||||||||
| Investments in Securities at Value | Level 1 - Quoted and Unadjusted Prices | Level 2 - Other Significant Observable Inputs | Level 3 - Significant Unobservable Inputs | Total | ||||||||||||
| Corporate Bonds* | $ | – | $ | 9,142,700 | $ | – | $ | 9,142,700 | ||||||||
| Exchange Traded Funds | 1,173,682 | – | – | 1,173,682 | ||||||||||||
| Short Term Investments | 1,933,419 | – | – | 1,933,419 | ||||||||||||
| Total | $ | 3,107,101 | $ | 9,142,700 | $ | – | $ | 12,249,801 | ||||||||
| RiverFront Dynamic US Dividend Advantage ETF | ||||||||||||||||
| Investments in Securities at Value | Level 1 - Quoted and Unadjusted Prices | Level 2 - Other Significant Observable Inputs | Level 3 - Significant Unobservable Inputs | Total | ||||||||||||
| Common Stocks* | $ | 120,205,445 | $ | – | $ | – | $ | 120,205,445 | ||||||||
| Short-Term Investments | 708,563 | – | – | 708,563 | ||||||||||||
| Total | $ | 120,914,008 | $ | – | $ | – | $ | 120,914,008 | ||||||||
| RiverFront Dynamic US Flex-Cap ETF | ||||||||||||||||
| Investments in Securities at Value | Level 1 - Quoted and Unadjusted Prices | Level 2 - Other Significant Observable Inputs | Level 3 - Significant Unobservable Inputs | Total | ||||||||||||
| Common Stocks* | $ | 71,124,918 | $ | – | $ | – | $ | 71,124,918 | ||||||||
| Short Term Investments | 372,007 | – | – | 372,007 | ||||||||||||
| Total | $ | 71,496,925 | $ | – | $ | – | $ | 71,496,925 | ||||||||
| RiverFront Strategic Income Fund | ||||||||||||||||
| Investments in Securities at Value | Level 1 - Quoted and Unadjusted Prices | Level 2 - Other Significant Observable Inputs | Level 3 - Significant Unobservable Inputs | Total | ||||||||||||
| Corporate Bonds* | $ | – | $ | 114,353,019 | $ | – | $ | 114,353,019 | ||||||||
| Short Term Investments | 14,809,834 | – | – | 14,809,834 | ||||||||||||
| Total | $ | 14,809,834 | $ | 114,353,019 | $ | – | $ | 129,162,853 | ||||||||
| * | For a detailed sector breakdown, see the accompanying Schedule of Investments. |
For liabilities arising from overdrafts in the custody account, the carrying amount reported in the Statement of Assets and Liabilities approximates fair value due to the relatively short-term maturity of these financial instruments. As of May 31, 2020, the liability related to the custody overdraft in the RiverFront Dynamic US Flex-Cap ETF is based on level 2 inputs.
43 | May 31, 2020
| RiverFront ETFs | |
| Notes to Financial Statements | May 31, 2020 (Unaudited) |
The Funds did not have any securities that used significant unobservable inputs (Level 3) in determining fair value and there were no transfers into or out of Level 3 during the six months ended May 31, 2020.
C. Securities Transactions and Investment Income
Securities transactions are recorded as of the trade date. Realized gains and losses from securities transactions are recorded on the highest cost basis. Dividend income and capital gains distributions, if any, are recorded on the ex-dividend date. Interest income, if any, is recorded on the accrual basis, including amortization of premiums and accretion of discounts.
D. Dividends and Distributions to Shareholders
Dividends from net investment income for each Fund, if any, are declared and paid monthly or as the Board may determine from time to time. Distributions of net realized capital gains earned by the Funds, if any, are distributed at least annually.
E. Federal Tax and Tax Basis Information
The timing and character of income and capital gain distributions are determined in accordance with income tax regulations, which may differ from U.S. GAAP. Reclassifications are made to the Funds’ capital accounts for permanent tax differences to reflect income and gains available for distribution (or available capital loss carryforwards) under income tax regulations. The amounts and characteristics of tax basis distributions and composition of distributable earnings/(accumulated losses) are finalized at fiscal year-end; accordingly, tax basis balances have not been determined as of May 31, 2020.
The tax character of the distributions paid during the fiscal year ended November 30, 2019 was as follows:
| Ordinary Income | Long-Term Capital Gain | Return of Capital | ||||||||||
| November 30, 2019 | ||||||||||||
| RiverFront Dynamic Core Income ETF | $ | 4,068,776 | $ | – | $ | – | ||||||
| RiverFront Dynamic Unconstrained Income ETF | 919,523 | – | – | |||||||||
| RiverFront Dynamic US Dividend Advantage ETF | 2,830,437 | – | – | |||||||||
| RiverFront Dynamic US Flex-Cap ETF | 2,084,364 | – | – | |||||||||
| RiverFront Strategic Income Fund | 6,324,290 | – | – | |||||||||
Under current law, capital losses maintain their character as short-term or long-term and are carried forward to the next tax year without expiration. As of November 30, 2019, the following amounts are available as carry forwards to the next tax year:
| Fund | Short-Term | Long-Term | ||||||
| RiverFront Dynamic Core Income ETF | $ | 275,669 | $ | 132,460 | ||||
| RiverFront Dynamic Unconstrained Income ETF | 433,125 | 14,023 | ||||||
| RiverFront Dynamic US Dividend Advantage ETF | 7,397,787 | – | ||||||
| RiverFront Dynamic US Flex-Cap ETF | 12,276,604 | 974,123 | ||||||
| RiverFront Strategic Income Fund | 6,135,910 | 3,145,418 | ||||||
As of May 31, 2020, the cost of investments for federal income tax purposes and accumulated net unrealized appreciation/(depreciation) on investments were as follows:
| RiverFront Dynamic Core Income ETF | RiverFront Dynamic Unconstrained Income ETF | RiverFront Dynamic US Dividend Advantage ETF | RiverFront Dynamic US Flex-Cap ETF | RiverFront Strategic Income Fund | ||||||||||||||||
| Gross appreciation (excess of value over tax cost) | $ | 10,796,849 | $ | 274,696 | $ | 19,017,450 | $ | 11,804,956 | $ | 781,116 | ||||||||||
| Gross depreciation (excess of tax cost over value) | (293,785 | ) | (276,268 | ) | (10,639,857 | ) | (5,979,877 | ) | (2,610,709 | ) | ||||||||||
| Net unrealized appreciation/(depreciation) | 10,503,064 | (1,572 | ) | 8,377,593 | 5,825,079 | (1,829,593 | ) | |||||||||||||
| Cost of investments for income tax purposes | $ | 127,345,820 | $ | 12,251,373 | $ | 112,536,415 | $ | 65,671,846 | $ | 130,992,446 | ||||||||||
44 | May 31, 2020
| RiverFront ETFs | |
| Notes to Financial Statements | May 31, 2020 (Unaudited) |
The differences between book-basis and tax-basis are primarily due to the deferral of losses from wash sales and difference between premium amortization due to ASU 2017-08. In addition, certain tax cost basis adjustments are finalized at fiscal year-end and therefore have not been determined as of May 31, 2020.
F. Income Taxes
No provision for income taxes is included in the accompanying financial statements, as each Fund intends to distribute to shareholders all taxable investment income and realized gains and otherwise comply with Subchapter M of the Internal Revenue Code of 1986, as amended, applicable to regulated investment companies. Each Fund evaluates tax positions taken (or expected to be taken) in the course of preparing the Funds’ tax returns to determine whether these positions meet a “more-likely-than-not” standard that, based on the technical merits, have a more than fifty percent likelihood of being sustained by a taxing authority upon examination. A tax position that meets the “more-likely-than-not” recognition threshold is measured to determine the amount of benefit to recognize in the financial statements.
As of and during the six months ended May 31, 2020, the Funds did not have a liability for any unrecognized tax benefits. Each Fund files U.S. federal, state, and local tax returns as required. Each Fund’s tax returns are subject to examination by the relevant tax authorities until expiration of the applicable statute of limitations, which is generally three years after the filing of the tax return, but may extend to four years in certain jurisdictions. Tax returns for open years have incorporated no uncertain tax positions that require a provision for income taxes.
G. Lending of Portfolio Securities
The RiverFront Dynamic US Dividend Advantage ETF and the RiverFront Dynamic US Flex-Cap ETF have entered into a securities lending agreement with State Street Bank & Trust Co. (“SSB”), the Funds’ lending agent. Each Fund may lend its portfolio securities only to borrowers that are approved by SSB. Each Fund will limit such lending to not more than 33 1/3% of the value of its total assets. Each Fund’s securities held at SSB as custodian shall be available to be lent except those securities the Fund or ALPS Advisors, Inc. specifically identifies in writing as not being available for lending. The borrower pledges and maintains with the Fund collateral consisting of cash (U.S. Dollars only), securities issued or guaranteed by the U.S. government or its agencies or instrumentalities, and cash equivalents (including irrevocable bank letters of credit) issued by a person other than the borrower or an affiliate of the borrower. The initial collateral received by each Fund is required to have a value of no less than 102% of the market value of the loaned securities for U.S equity securities and a value of no less than 105% of the market value for non-U.S. equity securities. The collateral is maintained thereafter, at a market value equal to not less than 102% of the current value of the U.S. equity securities on loan and not less than 105% of the current value of the non-U.S. equity securities on loan. The market value of the loaned securities is determined at the close of each business day and any additional required collateral is delivered to each Fund on the next business day. During the term of the loan, each Fund is entitled to all distributions made on or in respect of the loaned securities. Loans of securities are terminable at any time and the borrower, after notice, is required to return borrowed securities within the customary time period for settlement of securities transactions.
Any cash collateral received is reinvested in a money market fund managed by SSB as disclosed in the Fund’s Schedule of Investments and is reflected in the Statements of Assets and Liabilities as a payable for collateral upon return of securities loaned. Non-cash collateral, in the form of securities issued or guaranteed by the U.S. government or its agencies or instrumentalities, is not disclosed in the Fund’s Statements of Assets and Liabilities as it is held by the lending agent on behalf of the Fund, and the Fund does not have the ability to re-hypothecate these securities. Income earned by the Fund from securities lending activity is disclosed in the Statement of Operations. As of May 31, 2020, the Funds had no securities on loan.
The following is a summary of the Fund's securities lending agreement and related cash and non-cash collateral received as of May 31, 2020:
| Market Value of Securities on Loan | Cash Collateral Received | Non-Cash Collateral Received | Total Collateral Received | |||||||||||||
| RiverFront Dynamic US Dividend Advantage ETF | $ | 942,750 | $ | 435,528 | $ | 537,890 | $ | 973,418 | ||||||||
| RiverFront Dynamic US Flex-Cap ETF | 1,566,473 | 372,007 | 1,249,531 | 1,621,538 | ||||||||||||
The risks of securities lending include the risk that the borrower may not provide additional collateral when required or may not return the securities when due. To mitigate these risks, the Funds benefit from a borrower default indemnity provided by SSB. SSB’s indemnity allows for full replacement of securities lent wherein SSB will purchase the unreturned loaned securities on the open market by applying the proceeds of the collateral, or to the extent such proceeds are insufficient or the collateral is unavailable, SSB will purchase the unreturned loan securities at SSB’s expense. However, the Funds could suffer a loss if the value of the investments purchased with cash collateral falls below the value of the cash collateral received.
45 | May 31, 2020
| RiverFront ETFs | |
| Notes to Financial Statements | May 31, 2020 (Unaudited) |
The following table reflects a breakdown of transactions accounted for as secured borrowings, the gross obligation by the type of collateral pledged or securities loaned, and the remaining contractual maturity of those transactions as of May 31, 2020:
| RiverFront Dynamic US Dividend Advantage ETF Remaining contractual maturity of the agreements | |||||||||||||||||||
| Securities Lending Transactions | Overnight & Continuous | Up to 30 days | 30-90 days | Greater than 90 days | Total | ||||||||||||||
| Common Stocks | $ | 435,528 | $ | – | $ | – | $ | – | $ | 435,528 | |||||||||
| Total Borrowings | 435,528 | ||||||||||||||||||
| Gross amount of recognized liabilities for securities lending (collateral received) | $ | 435,528 | |||||||||||||||||
| RiverFront Dynamic US Flex-Cap ETF | Remaining contractual maturity of the agreements | ||||||||||||||||||
| Securities Lending Transactions | Overnight & Continuous | Up to 30 days | 30-90 days | Greater than 90 days | Total | ||||||||||||||
| Common Stocks | $ | 372,007 | $ | – | $ | – | $ | – | $ | 372,007 | |||||||||
| Total Borrowings | 372,007 | ||||||||||||||||||
| Gross amount of recognized liabilities for securities lending (collateral received) | $ | 372,007 | |||||||||||||||||
3. INVESTMENT ADVISORY FEE AND OTHER AFFILIATED TRANSACTIONS
ALPS Advisors, Inc. (the “Adviser”) serves as the Funds’ investment adviser pursuant to an Investment Advisory Agreement with the Trust on behalf of each Fund (the “Advisory Agreement”). Pursuant to the Advisory Agreement, each Fund pays the Adviser an annual management fee for the services and facilities it provides, payable on a monthly basis as a percentage of the relevant Fund’s average daily net assets as set out below:
| Fund | Advisory Fee |
| RiverFront Dynamic Core Income ETF | 0.51%(a) |
| RiverFront Dynamic Unconstrained Income ETF | 0.51%(a) |
| RiverFront Dynamic US Dividend Advantage ETF | 0.52%(b) |
| RiverFront Dynamic US Flex-Cap ETF | 0.52%(b) |
| RiverFront Strategic Income Fund | 0.11% |
| (a) | The unitary advisory fee as a percentage of net assets is subject to the following breakpoints: (i) 0.51% for average net assets up to $600 million, (ii) 0.48% for average net assets equal to or greater than $600 million. |
| (b) | The unitary advisory fee as a percentage of net assets is subject to the following breakpoints: (i) 0.52% for average net assets up to $600 million, (ii) 0.49% for average net assets equal to or greater than $600 million. |
Out of the unitary management fee, the Adviser pays substantially all expenses of each Fund, including the cost of transfer agency, custody, fund administration, legal, audit, independent trustees and other services, except for interest expenses, distribution fees or expenses, brokerage expenses, taxes and extraordinary expenses not incurred in the ordinary course of each Fund's business. The Adviser’s unitary management fee is designed to pay substantially all of each Fund's expenses and to compensate the Adviser for providing services for each Fund.
RiverFront Investment Group, LLC (the “Sub-Adviser”) serves as each Fund’s sub-adviser pursuant to a sub-advisory agreement with the Trust (the ‘‘Sub-Advisory Agreement’’). Pursuant to the Sub-Advisory Agreement, the Adviser pays the Sub-Adviser a sub-advisory fee out of the Adviser’s advisory fee for the services it provides besides RiverFront Strategic Income Fund, in which the Fund directly pays the Sub-Adviser. The fee is payable on a monthly basis at the annual rate of the relevant Fund’s average daily net assets as set out below:
| Fund | Sub-Advisory Fee |
| RiverFront Dynamic Core Income ETF | 0.35% |
| RiverFront Dynamic Unconstrained Income ETF | 0.35% |
| RiverFront Dynamic US Dividend Advantage ETF | 0.35% |
| RiverFront Dynamic US Flex-Cap ETF | 0.35% |
| RiverFront Strategic Income Fund | 0.35% |
ALPS Fund Services, Inc., an affiliate of the Adviser, is the administrator of the Funds.
46 | May 31, 2020
| RiverFront ETFs | |
| Notes to Financial Statements | May 31, 2020 (Unaudited) |
Each Trustee who is not considered an “interested person” (as defined in the Investment Company Act of 1940, as amended (“1940 Act”)) (“Independent Trustees”) receives (1) a quarterly retainer of $5,000, (2) a per meeting fee for regularly scheduled meetings of $3,750, (3) $1,500 for any special meeting held outside of a regularly scheduled board meeting, and (4) reimbursement for all reasonable out-of-pocket expenses relating to attendance at meetings. Prior to January 1, 2020, a Trustee who is considered an “interested person” (as defined in the 1940 Act) (“Interested Trustee”) received no compensation or expense reimbursements from the Trust. Effective January 1, 2020 the Interested Trustee receives (1) a quarterly retainer of $5,000, (2) a per meeting fee of $3,750, (3) $1,500 for any special meeting held outside of a regularly scheduled board meeting, and (4) reimbursement for all reasonable out-of-pocket expenses relating to attendance at meetings. In addition, the Chairman of the Board and Chairman of the Audit Committee each receives a quarterly retainer of $2,000, in connection with their respective roles.
4. PURCHASES AND SALES OF SECURITIES
For the six months ended May 31, 2020, the cost of purchases and proceeds from sales of investment securities, excluding in-kind transactions and short-term investments, were as follows:
| Fund | Purchases | Sales | ||||||
| RiverFront Dynamic Core Income ETF | $ | 302,012 | $ | 5,444,452 | ||||
| RiverFront Dynamic Unconstrained Income ETF | 1,589,112 | 2,376,973 | ||||||
| RiverFront Dynamic US Dividend Advantage ETF | 24,730,244 | 24,639,423 | ||||||
| RiverFront Dynamic US Flex-Cap ETF | 30,587,880 | 30,381,494 | ||||||
| RiverFront Strategic Income Fund | 23,268,033 | 35,294,843 | ||||||
For the six months ended May 31, 2020, the cost of U.S. Government security purchases and proceeds from U.S. Government security sales were as follows:
| Fund | Purchases | Sales | ||||||
| RiverFront Dynamic Core Income ETF | $ | 2,516,993 | $ | 2,954,292 | ||||
For the six months ended May 31, 2020, the cost of in-kind purchases and proceeds from in-kind sales were as follows:
| Fund | Purchases | Sales | ||||||
| RiverFront Dynamic Core Income ETF | $ | 5,382,004 | $ | 7,344,763 | ||||
| RiverFront Dynamic Unconstrained Income ETF | – | 3,529,272 | ||||||
| RiverFront Dynamic US Dividend Advantage ETF | 17,815,777 | 21,517,128 | ||||||
| RiverFront Dynamic US Flex-Cap ETF | 1,823,520 | 43,652,733 | ||||||
| RiverFront Strategic Income Fund | 12,061,275 | 27,062,241 | ||||||
For the six months ended May 31, 2020, the in-kind net realized gains/(losses) were as follows:
| Fund | Net Realized Gain/(Loss) | |||
| RiverFront Dynamic Core Income ETF | $ | (35,076 | ) | |
| RiverFront Dynamic Unconstrained Income ETF | (63,314 | ) | ||
| RiverFront Dynamic US Dividend Advantage ETF | 3,107,277 | |||
| RiverFront Dynamic US Flex-Cap ETF | 2,365,343 | |||
| RiverFront Strategic Income Fund | (522,815 | ) | ||
Gains on in-kind transactions are not considered taxable for federal income tax purposes and losses on in-kind transactions are also not deductible for tax purposes.
5. CAPITAL SHARE TRANSACTIONS
Shares are created and redeemed by each Fund only in Creation Unit size aggregations of 50,000 Shares. Only broker-dealers or large institutional investors with creation and redemption agreements called Authorized Participants (“AP”) are permitted to purchase or redeem Creation Units from each Fund. Such transactions are generally permitted on an in-kind basis, with a balancing cash component to equate the transaction to the NAV per unit of each Fund on the transaction date. Cash may be substituted equivalent to the value of certain securities generally when they are not available in sufficient quantity for delivery, not eligible for trading by the AP or as a result of other market circumstances.
47 | May 31, 2020
| RiverFront ETFs | |
| Notes to Financial Statements | May 31, 2020 (Unaudited) |
6. MARKET DISRUPTIONS RISK
The Funds are subject to investment and operational risks associated with financial, economic and other global market developments and disruptions, including the recent spread of an infectious respiratory illness caused by a novel strain of coronavirus (known as COVID-19), which can negatively impact the securities markets and cause each Fund to lose value.
The spread of COVID-19 has caused volatility, severe market dislocations and liquidity constraints in many markets, including markets for the securities each Fund holds, and may adversely affect each Fund’s investments and operations. The transmission of COVID-19 and efforts to contain its spread have resulted in travel restrictions and disruptions, closed international borders, enhanced health screenings at ports of entry and elsewhere, disruption of and delays in healthcare service preparation and delivery, quarantines, event and service cancellations or interruptions, disruptions to business operations and supply chains, and a reduction in consumer and business spending, as well as general concern and uncertainty that has negatively affected the economy. These disruptions have led to instability in the market place and the jobs market. The impact of COVID-19 could adversely affect the economies of many nations or the entire global economy, the financial well-being and performance of individual issuers, borrowers and sectors and the health of the markets generally in potentially significant and unforeseen ways.
The foregoing could lead to a significant economic downturn or recession, increased market volatility, a greater number of market closures, higher default rates and adverse effects on the values and liquidity of each Fund’s securities or other assets. Such impacts may adversely affect the performance of the Funds.
7. SUBSEQUENT EVENTS
Effective July 1, 2020, each Trustee will be compensated a quarterly retainer of $10,000, and a per meeting fee of $5,000.
48 | May 31, 2020
| RiverFront ETFs | |
| Additional Information | May 31, 2020 (Unaudited) |
PROXY VOTING RECORDS, POLICIES AND PROCEDURES
Information regarding how each Fund voted proxies relating to portfolio securities during the most recent 12-month period ended June 30 and a description of the Funds’ proxy voting policies and procedures used in determining how to vote for proxies are available without charge on the SEC’s website at www.sec.gov and upon request, by calling (toll-free) 1-866-675-2639.
PORTFOLIO HOLDINGS
The Fund files a complete schedule of portfolio holdings with the U.S. Securities and Exchange Commission (“SEC”) for the first and third quarters of each fiscal year on Form N-PORT within 60 days after the end of the period. Copies of the Fund’s Form N-PORT are available without a charge, upon request, by contacting the Fund at 1-855-838-9485 and on the SEC’s website at https://www.sec.gov.
TAX INFORMATION
The Funds designate the following as a percentage of taxable ordinary income distributions, or up to the maximum amount allowable, for the calendar year ended December 31, 2019:
| Qualified Dividend Income | Dividend Received Deduction | |
| RiverFront Dynamic Core Income ETF | 0.00% | 0.00% |
| RiverFront Dynamic Unconstrained Income ETF | 0.00% | 0.00% |
| Riverfront Dynamic US Dividend Advantage ETF | 100.00% | 100.00% |
| Riverfront Dynamic US Flex-Cap ETF | 100.00% | 100.00% |
| Riverfront Strategic Income Fund | 0.00% | 0.00% |
In early 2020, if applicable, shareholders of record received this information for the distributions paid to them by the Funds during the calendar year 2019 via Form 1099. The Funds will notify shareholders in early 2021 of amounts paid to them by the Funds, if any, during the calendar year 2020.
49 | May 31, 2020
| RiverFront ETFs | |
| Liquidity Risk Management Program | May 31, 2020 (Unaudited) |
In compliance with the Securities and Exchange Commission’s liquidity risk management rule (the “Liquidity Rule”), the ALPS ETF Trust (the “Trust”) has established a liquidity risk management program (the “Program”) to govern the Trust’s approach to managing liquidity risk for each series of the Trust (each a “Fund”). The Program is overseen by the Liquidity Committee (the “Committee”), a committee comprised of representatives of the Trust’s investment adviser, ALPS Advisors, Inc. The Trust’s Board of Trustees (the “Board”) has approved the designation of the Committee to oversee the Program.
The Program’s principal objectives include supporting each Fund’s compliance with limits on investments in illiquid assets and assessing and managing the risk that a Fund will be unable to meet its redemption obligations without significant dilution of remaining investors’ interests in the Fund. The Program includes a number of elements that support the management and assessment of liquidity risk, including an annual assessment of factors that influence a Fund’s liquidity and, for Funds that are not “In-Kind ETFs,” the periodic classification and re-classification of such Fund’s investments into groupings that reflect the Committee’s assessment of their liquidity under current market conditions.
At a meeting of the Board held on March 2, 2020, the Trustees received a report from the Committee regarding the design and operational effectiveness of the Program since its implementation on December 1, 2018. The Committee determined, and reported to the Board, that the Program has been operating effectively to assess and manage each Fund’s liquidity risk and has been and continues to be adequately and effectively implemented to monitor and (as applicable) respond to the Funds’ liquidity developments.
The Committee reported that during the period covered by the report, there were no liquidity events that impacted the Funds or their ability to timely meet redemptions without dilution to existing shareholders. Among other things, the Committee’s report noted that no Fund is required to have a highly liquid investment minimum based either on its status as an In-Kind ETF or on its ability to rely on another exemption under the Liquidity Rule. The Committee’s report further noted that no material changes have been made to the Program since its implementation.
50 | May 31, 2020
Intentionally Left Blank

| Item 2. | Code of Ethics. |
Not Applicable to this Report.
| Item 3. | Audit Committee Financial Expert. |
Not Applicable to this Report.
| Item 4. | Principal Accountant Fees and Services. |
Not Applicable to this Report.
| Item 5. | Audit Committee of Listed Registrants. |
Not applicable to Registrant.
| Item 6. | Investments. |
(a) Schedule of Investments is included as part of the Report to Stockholders filed under Item 1 of this Form N-CSR.
(b) Not applicable
| Item 7. | Disclosure of Proxy Voting Policies and Procedures for Closed-End Management Investment Companies. |
Not applicable to Registrant.
| Item 8. | Portfolio Managers of Closed-End Management Investment Companies. |
Not applicable to Registrant.
-2-
| Item 9. | Purchases of Equity Securities by Closed-End Management Investment Company and Affiliated Purchasers. |
Not applicable to Registrant.
| Item 10. | Submission of Matters to a Vote of Security Holders. |
No material changes to the procedures by which the shareholders may recommend nominees to the Registrant’s Board of Trustees have been implemented after the Registrant’s last provided disclosure in response to the requirements of Item 407(c)(2)(iv) of Regulation S-K (17 CFR 229.407) (as required by Item 22(b)(15) of Schedule 14A (17 CFR 240.14a-101)), or this Item.
| Item 11. | Controls and Procedures. |
| (a) | The Registrant’s principal executive officer and principal financial officer have concluded that the Registrant’s disclosure controls and procedures (as defined in Rule 30a-3(c) under the Investment Company Act of 1940, as amended) are effective based on their evaluation of these controls and procedures as of a date within 90 days of the filing date of this report. |
| (b) | There was no change in the Registrant's internal control over financial reporting (as defined in Rule 30a-3(d) under the Investment Company Act of 1940, as amended) that occurred during the period covered by this report that has materially affected, or is reasonably likely to materially affect, the Registrant's internal control over financial reporting. |
| Item 12. | Disclosure of Securities Lending Activities for Closed-End Management Investment Companies. |
Not applicable.
| Item 13. | Exhibits. |
| (a)(1) | Not applicable to this Report. |
| (a)(2) | The certifications required by Rule 30a-2(a) of the Investment Company Act of 1940, as amended, and Section 302 of the Sarbanes-Oxley Act of 2002 are attached hereto as Exhibit 99.Cert. |
| (a)(3) | Not applicable. |
| (a)(4) | Not applicable. |
-3-
SIGNATURES
Pursuant to the requirements of the Securities Exchange Act of 1934 and the Investment Company Act of 1940, the Registrant has duly caused this report to be signed on its behalf by the undersigned, thereunto duly authorized.
ALPS ETF TRUST
| By: | /s/ Bradley J. Swenson | |
| Bradley J. Swenson (Principal Executive Officer) | ||
| President | ||
| Date: | August 3, 2020 |
Pursuant to the requirements of the Securities Exchange Act of 1934 and the Investment Company Act of 1940, this report has been signed below by the following persons on behalf of the Registrant and in the capacities and on the dates indicated.
| By: | /s/ Bradley J. Swenson | |
| Bradley J. Swenson (Principal Executive Officer) | ||
| President | ||
| Date: | August 3, 2020 |
| By: | /s/ Kathryn Burns | |
| Kathryn Burns (Principal Financial Officer) | ||
| Treasurer | ||
| Date: | August 3, 2020 |
-4-