0001414040 alps:AlerianEnergyInfrastructureETFAlerianEnergyInfrastructureETFAlerianMLPIndexMember 2023-06-30 0001414040 alps:ALPSEqualSectorWeightETFALPSEqualSectorWeightETFSampP500174IndexMember 2022-10-31 0001414040 alps:ALPSMedicalBreakthroughsETFALPSMedicalBreakthroughsETFSNetworksup174supMedicalBreakthroughIndexMember 2015-10-31 0001414040 alps:ALPSInternationalSectorDividendDogsETFALPSInternationalSectorDividendDogsETFMorningstarDevelopedMarketsexNorthAmericaIndexMember 2015-12-31 0001414040 alps:ALPSREITDividendDogsETFALPSREITDividendDogsETFBloombergUS1000TotalReturnIndexMember 2017-12-31 0001414040 alps:ALPSOSharesUSSmallCapQualityDividendETFALPSOSharesUSSmallCapQualityDividendETFOSharesUSSmallCapQualityDividendIndexMember 2018-12-31 0001414040 alps:ALPSOSharesEuropeQualityDividendETFALPSOSharesEuropeQualityDividendETFEUROSTOXX50NetReturnUSDIndexMember 2019-06-30 0001414040 alps:RiverFrontDynamicCoreIncomeETFRiverFrontDynamicCoreIncomeETFBloombergUSAggregateBondIndexMember 2022-02-28
UNITED STATES
SECURITIES AND EXCHANGE COMMISSION
Washington, D.C. 20549
FORM N-CSR
CERTIFIED SHAREHOLDER REPORT OF REGISTERED
MANAGEMENT INVESTMENT COMPANIES
Investment Company Act file number:
811-22175
ALPS ETF TRUST
(Exact name of registrant as specified in charter)
1290 Broadway, Suite 1000, Denver, Colorado 80203
(Address of principal executive offices) (Zip code)
Brendan Hamill, Secretary
ALPS ETF Trust
1290 Broadway, Suite 1000
Denver, Colorado 80203
(Name and address of agent for service)
Registrant’s Telephone Number, including Area Code: 877-398-8461
Date of fiscal year end: November 30
Date of reporting period: December 1, 2023 – November 30, 2024
| Item 1. | Report to Stockholders. |
Alerian MLP ETF | ALPS ETF TRUST |
NYSE ARCA: AMLP | |
This annual shareholder report contains important information about Alerian MLP ETF (the "Fund" or "AMLP") for the period of December 1, 2023 to November 30, 2024 (the "Period"). You can find additional information about the Fund at www.alpsfunds.com/exchange-traded-funds/amlp. You can also request this information by contacting us at 1-866-759-5679.
The Alerian MLP ETF delivered a total return of 25.74% for the twelve-month period ended November 30, 2024. This compares to the Alerian MLP Infrastructure Index (the "Underlying Index"), which increased 22.40% on a price-return basis and 31.89% on a total-return basis. The difference in performance between the Fund and its Underlying Index is primarily attributable to the Fund's operating expenses and the tax impact of the Fund's C-Corporation structure, including the accrual of approximately $465.9 million in income tax expense during the period.
Pipeline Transportation | Natural Gas was the best-performing subsector and benefitted from an improving multi-year outlook for US natural gas demand driven by liquefied natural gas (LNG) exports and power generation. Gathering & Processing and Pipeline Transportation | Petroleum also performed well. All subsectors saw positive total returns during the period.
Liquefaction, which only includes Cheniere Energy Partners (CQP), was the worst-performing subsector as global prices for LNG remained well below 2022 highs and CQP lowered the variable component of its distribution paid in May 2024.
AMLP: Index Performance Attribution as of the end of the Period. |
Compression | 6.27% |
Gathering & Processing | 35.89% |
Liquefaction | 0.98% |
Marketing & Distribution | 17.25% |
Pipeline Transportation | Natural Gas | 46.60% |
Pipeline Transportation | Petroleum | 35.23% |
Comparison of change in value of a $10,000 investment in the Fund and the Indexes
The Fund's past performance is not a good predictor of the Fund's future performance. The chart and the table below do not reflect the deduction of taxes that a shareholder would pay on Fund distributions or sale of Fund shares.
| 11/30/2014 | 10000 | 10000 | 10000 | 10000 |
| 12/31/2014 | 9663 | 9525 | 9438 | 9976 |
| 01/31/2015 | 9442 | 9217 | 9149 | 9704 |
| 02/28/2015 | 9581 | 9419 | 9340 | 10262 |
| 03/31/2015 | 9312 | 9035 | 8944 | 10135 |
| 04/30/2015 | 9671 | 9568 | 9497 | 10201 |
| 05/31/2015 | 9475 | 9293 | 9158 | 10340 |
| 06/30/2015 | 8903 | 8475 | 8399 | 10144 |
| 07/31/2015 | 8806 | 8339 | 8126 | 10341 |
| 08/31/2015 | 8445 | 7821 | 7723 | 9720 |
| 09/30/2015 | 7283 | 6610 | 6543 | 9454 |
| 10/31/2015 | 7949 | 7221 | 7177 | 10214 |
| 11/30/2015 | 7316 | 6647 | 6597 | 10249 |
| 12/31/2015 | 7161 | 6501 | 6362 | 10071 |
| 01/31/2016 | 6217 | 5650 | 5655 | 9525 |
| 02/29/2016 | 6212 | 5652 | 5628 | 9518 |
| 03/31/2016 | 6741 | 6134 | 6097 | 10176 |
| 04/30/2016 | 7548 | 6873 | 6770 | 10231 |
| 05/31/2016 | 7692 | 7011 | 6941 | 10421 |
| 06/30/2016 | 8031 | 7395 | 7298 | 10445 |
| 07/31/2016 | 8056 | 7435 | 7338 | 10845 |
| 08/31/2016 | 8016 | 7388 | 7242 | 10860 |
| 09/30/2016 | 8112 | 7532 | 7376 | 10871 |
| 10/31/2016 | 7876 | 7214 | 7048 | 10657 |
| 11/30/2016 | 8030 | 7404 | 7210 | 11074 |
| 12/31/2016 | 8246 | 7720 | 7526 | 11281 |
| 01/31/2017 | 8481 | 8071 | 7895 | 11509 |
| 02/28/2017 | 8533 | 8150 | 7926 | 11953 |
| 03/31/2017 | 8454 | 8037 | 7824 | 11964 |
| 04/30/2017 | 8354 | 7902 | 7723 | 12093 |
| 05/31/2017 | 8097 | 7527 | 7374 | 12251 |
| 06/30/2017 | 8063 | 7482 | 7327 | 12341 |
| 07/31/2017 | 8104 | 7550 | 7421 | 12584 |
| 08/31/2017 | 7715 | 7126 | 7054 | 12619 |
| 09/30/2017 | 7756 | 7166 | 7103 | 12890 |
| 10/31/2017 | 7391 | 6835 | 6809 | 13189 |
| 11/30/2017 | 7286 | 6737 | 6717 | 13590 |
| 12/31/2017 | 7602 | 7039 | 7036 | 13738 |
| 01/31/2018 | 8038 | 7458 | 7441 | 14499 |
| 02/28/2018 | 7247 | 6715 | 6720 | 13968 |
| 03/31/2018 | 6717 | 6229 | 6253 | 13654 |
| 04/30/2018 | 7240 | 6719 | 6760 | 13697 |
| 05/31/2018 | 7544 | 7009 | 7101 | 14049 |
| 06/30/2018 | 7442 | 6922 | 6991 | 14139 |
| 07/31/2018 | 7945 | 7392 | 7451 | 14626 |
| 08/31/2018 | 8073 | 7553 | 7569 | 15115 |
| 09/30/2018 | 7946 | 7406 | 7451 | 15167 |
| 10/31/2018 | 7291 | 6798 | 6855 | 14083 |
| 11/30/2018 | 7246 | 6763 | 6798 | 14384 |
| 12/31/2018 | 6639 | 6199 | 6162 | 13069 |
| 01/31/2019 | 7496 | 7002 | 6941 | 14174 |
| 02/28/2019 | 7497 | 7013 | 6960 | 14660 |
| 03/31/2019 | 7776 | 7276 | 7198 | 14907 |
| 04/30/2019 | 7668 | 7186 | 7103 | 15509 |
| 05/31/2019 | 7588 | 7116 | 7022 | 14534 |
| 06/30/2019 | 7777 | 7299 | 7207 | 15546 |
| 07/31/2019 | 7738 | 7267 | 7193 | 15796 |
| 08/31/2019 | 7324 | 6877 | 6797 | 15514 |
| 09/30/2019 | 7372 | 6929 | 6845 | 15775 |
| 10/31/2019 | 6881 | 6471 | 6419 | 16106 |
| 11/30/2019 | 6464 | 6072 | 6050 | 16713 |
| 12/31/2019 | 7034 | 6613 | 6566 | 17186 |
| 01/31/2020 | 6613 | 6222 | 6198 | 17216 |
| 02/29/2020 | 5675 | 5337 | 5327 | 15812 |
| 03/31/2020 | 2935 | 2772 | 2811 | 13728 |
| 04/30/2020 | 4322 | 4090 | 4206 | 15542 |
| 05/31/2020 | 4698 | 4443 | 4582 | 16376 |
| 06/30/2020 | 4311 | 4080 | 4222 | 16741 |
| 07/31/2020 | 4152 | 3932 | 4071 | 17698 |
| 08/31/2020 | 4151 | 3936 | 4093 | 18996 |
| 09/30/2020 | 3597 | 3412 | 3535 | 18307 |
| 10/31/2020 | 3761 | 3569 | 3690 | 17878 |
| 11/30/2020 | 4631 | 4421 | 4568 | 19980 |
| 12/31/2020 | 4746 | 4532 | 4682 | 20817 |
| 01/31/2021 | 5007 | 4785 | 4956 | 20661 |
| 02/28/2021 | 5395 | 5161 | 5341 | 21273 |
| 03/31/2021 | 5769 | 5523 | 5710 | 22052 |
| 04/30/2021 | 6195 | 5935 | 6118 | 23232 |
| 05/31/2021 | 6627 | 6360 | 6582 | 23318 |
| 06/30/2021 | 7035 | 6757 | 6922 | 23944 |
| 07/31/2021 | 6567 | 6311 | 6485 | 24455 |
| 08/31/2021 | 6390 | 6146 | 6335 | 25172 |
| 09/30/2021 | 6580 | 6333 | 6527 | 24022 |
| 10/31/2021 | 6925 | 6670 | 6852 | 25694 |
| 11/30/2021 | 6389 | 6160 | 6338 | 25354 |
| 12/31/2021 | 6620 | 6387 | 6563 | 26337 |
| 01/31/2022 | 7351 | 7097 | 7289 | 24807 |
| 02/28/2022 | 7734 | 7473 | 7641 | 24115 |
| 03/31/2022 | 7878 | 7617 | 7797 | 24908 |
| 04/30/2022 | 7843 | 7588 | 7791 | 22655 |
| 05/31/2022 | 8450 | 8176 | 8393 | 22598 |
| 06/30/2022 | 7241 | 7011 | 7222 | 20734 |
| 07/31/2022 | 8148 | 7894 | 8124 | 22675 |
| 08/31/2022 | 8460 | 8212 | 8447 | 21806 |
| 09/30/2022 | 7821 | 7597 | 7803 | 19779 |
| 10/31/2022 | 8941 | 8692 | 8921 | 21351 |
| 11/30/2022 | 8709 | 8803 | 9015 | 22493 |
| 12/31/2022 | 8283 | 8392 | 8592 | 21180 |
| 01/31/2023 | 8801 | 8902 | 9160 | 22607 |
| 02/28/2023 | 8628 | 8740 | 9051 | 22061 |
| 03/31/2023 | 8559 | 8678 | 8944 | 22764 |
| 04/30/2023 | 8704 | 8825 | 9098 | 23033 |
| 05/31/2023 | 8494 | 8825 | 9051 | 23162 |
| 06/30/2023 | 8890 | 9218 | 9426 | 24727 |
| 07/31/2023 | 9457 | 9779 | 9987 | 25581 |
| 08/31/2023 | 9523 | 9850 | 10034 | 25129 |
| 09/30/2023 | 9754 | 10084 | 10358 | 23952 |
| 10/31/2023 | 9717 | 10053 | 10402 | 23367 |
| 11/30/2023 | 10435 | 10756 | 11116 | 25561 |
| 12/31/2023 | 10055 | 10386 | 10874 | 26827 |
| 01/31/2024 | 10508 | 10840 | 11356 | 27197 |
| 02/29/2024 | 11001 | 11360 | 11848 | 28675 |
| 03/31/2024 | 11428 | 11917 | 12384 | 29597 |
| 04/30/2024 | 11305 | 11760 | 12233 | 28322 |
| 05/31/2024 | 11270 | 11825 | 12254 | 29658 |
| 06/30/2024 | 11769 | 12375 | 12799 | 30650 |
| 07/31/2024 | 11833 | 12466 | 12879 | 31083 |
| 08/31/2024 | 11871 | 12522 | 12929 | 31796 |
| 09/30/2024 | 11824 | 12466 | 12892 | 32471 |
| 10/31/2024 | 11695 | 12310 | 12719 | 32224 |
| 11/30/2024 | 13121 | 14186 | 14576 | 34281 |
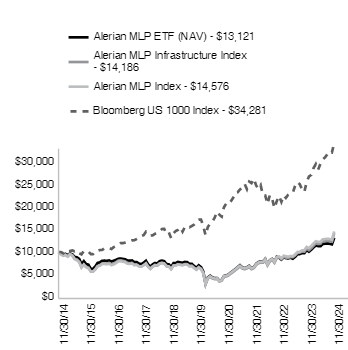
| Alerian MLP ETF - NAV | 25.74% | 15.21% | 2.75% |
| Alerian MLP Infrastructure Index | 31.89% | 18.50% | 3.56% |
| Alerian MLP Index | 31.13% | 19.23% | 3.84% |
| Bloomberg US 1000 Index‡ | 34.11% | 15.45% | 13.11% |
For the most current month-end performance data please visit www.alpsfunds.com or call 1-866-759-5679.
| |
‡ | This index represents a broad measure of market performance and has been added to comply with new regulatory requirements. |
| Net Assets | $10,230,541,232 |
| Number of Portfolio Holdings | 14 |
| Portfolio Turnover Rate | 18% |
| Total Advisory Fees Paid | $70,761,336 |
| Energy Transfer LP | 13.29% |
| MPLX LP | 12.77% |
| Enterprise Products Partners LP | 12.54% |
| Plains All American Pipeline LP | 11.49% |
| Western Midstream Partners LP | 11.22% |
| Sunoco LP | 10.58% |
| EnLink Midstream LLC | 7.24% |
| Hess Midstream LP | 5.99% |
| Cheniere Energy Partners LP | 4.09% |
| USA Compression Partners LP | 2.94% |
| Total % of Top 10 Holdings | 92.15% |
| Pipeline Transportation | Petroleum | 27.38% |
| Pipeline Transportation | Natural Gas | 25.83% |
| Gathering + Processing | 24.45% |
| Marketing & Distribution | 15.30% |
| Liquefaction | 4.09% |
| Compression | 2.94% |
| Money Market Fund | 0.01% |
| Total | 100.00% |
Holdings are subject to change.
If you wish to view additional information about the Fund, including but not limited to the Fund's prospectus, financial information, holdings, and proxy voting information, please visit www.alpsfunds.com/exchange-traded-funds/amlp.
The Funds send only one report to a household if more than one account has the same address. If you do not want this policy to apply to you, or if you wish to receive a copy of this document at a new address, contact 1-866-759-5679.
Alerian Energy Infrastructure ETF | ALPS ETF TRUST |
NYSE ARCA: ENFR | |
This annual shareholder report contains important information about Alerian Energy Infrastructure ETF (the "Fund" or "ENFR") for the period of December 1, 2023 to November 30, 2024 (the "Period"). You can find additional information about the Fund at https://www.alpsfunds.com/exchange-traded-funds/enfr. You can also request this information by contacting us at 1-866-759-5679.
| Alerian Energy Infrastructure ETF | $44 | 0.35% |
The Alerian Energy Infrastructure ETF delivered a total return of 50.02% for the twelve-month period ended November 30, 2024. This compares to the Fund's Underlying Index, which increased 42.55% on a price-return basis and 51.22% on a total-return basis. Energy infrastructure companies broadly saw strong performance in the period, including noticeable gains following the election.
The best-performing subsector in the portfolio was Pipeline Transportation | Natural Gas, followed by Gathering & Processing. These subsectors have benefitted from a strengthening multi-year outlook for North American natural gas demand. Energy infrastructure companies will play a critical role in transporting natural gas to demand centers, while also helping facilitate the production growth required to meet new demand. All subsectors saw double-digit percentage total returns during the period.
ENFR: Index Performance Attribution as of the end of the Period. |
Gathering & Processing | 56.82% |
Liquefaction | 30.93% |
Pipeline Transportation | Natural Gas | 61.32% |
Pipeline Transportation | Petroleum | 36.69% |
Storage | 20.22% |
Comparison of change in value of a $10,000 investment in the Fund and the Indexes
The Fund's past performance is not a good predictor of the Fund's future performance. The chart and the table below do not reflect the deduction of taxes that a shareholder would pay on Fund distributions or sale of Fund shares.
| 11/30/2014 | 10000 | 10000 | 10000 | 10000 |
| 12/31/2014 | 10012 | 10023 | 9438 | 9976 |
| 01/31/2015 | 9330 | 9341 | 9149 | 9704 |
| 02/28/2015 | 9552 | 9567 | 9340 | 10262 |
| 03/31/2015 | 9482 | 9502 | 8944 | 10135 |
| 04/30/2015 | 10010 | 10024 | 9497 | 10201 |
| 05/31/2015 | 9521 | 9541 | 9158 | 10340 |
| 06/30/2015 | 9052 | 9088 | 8399 | 10144 |
| 07/31/2015 | 8685 | 8732 | 8126 | 10341 |
| 08/31/2015 | 8074 | 8087 | 7723 | 9720 |
| 09/30/2015 | 6954 | 6971 | 6543 | 9454 |
| 10/31/2015 | 7439 | 7468 | 7177 | 10214 |
| 11/30/2015 | 6817 | 6851 | 6597 | 10249 |
| 12/31/2015 | 6279 | 6300 | 6362 | 10071 |
| 01/31/2016 | 5994 | 6013 | 5655 | 9525 |
| 02/29/2016 | 6048 | 6072 | 5628 | 9518 |
| 03/31/2016 | 6681 | 6733 | 6097 | 10176 |
| 04/30/2016 | 7358 | 7413 | 6770 | 10231 |
| 05/31/2016 | 7522 | 7589 | 6941 | 10421 |
| 06/30/2016 | 7930 | 7993 | 7298 | 10445 |
| 07/31/2016 | 7956 | 8037 | 7338 | 10845 |
| 08/31/2016 | 8189 | 8280 | 7242 | 10860 |
| 09/30/2016 | 8628 | 8730 | 7376 | 10871 |
| 10/31/2016 | 8240 | 8345 | 7048 | 10657 |
| 11/30/2016 | 8565 | 8677 | 7210 | 11074 |
| 12/31/2016 | 8913 | 9044 | 7526 | 11281 |
| 01/31/2017 | 9033 | 9165 | 7895 | 11509 |
| 02/28/2017 | 9097 | 9246 | 7926 | 11953 |
| 03/31/2017 | 9137 | 9284 | 7824 | 11964 |
| 04/30/2017 | 8978 | 9130 | 7723 | 12093 |
| 05/31/2017 | 8662 | 8818 | 7374 | 12251 |
| 06/30/2017 | 8772 | 8935 | 7327 | 12341 |
| 07/31/2017 | 9024 | 9193 | 7421 | 12584 |
| 08/31/2017 | 8730 | 8895 | 7054 | 12619 |
| 09/30/2017 | 8964 | 9145 | 7103 | 12890 |
| 10/31/2017 | 8648 | 8835 | 6809 | 13189 |
| 11/30/2017 | 8583 | 8774 | 6717 | 13590 |
| 12/31/2017 | 8905 | 9113 | 7036 | 13738 |
| 01/31/2018 | 8936 | 9150 | 7441 | 14499 |
| 02/28/2018 | 7995 | 8188 | 6720 | 13968 |
| 03/31/2018 | 7723 | 7910 | 6253 | 13654 |
| 04/30/2018 | 8116 | 8322 | 6760 | 13697 |
| 05/31/2018 | 8517 | 8742 | 7101 | 14049 |
| 06/30/2018 | 8678 | 8912 | 6991 | 14139 |
| 07/31/2018 | 8996 | 9242 | 7451 | 14626 |
| 08/31/2018 | 8862 | 9119 | 7569 | 15115 |
| 09/30/2018 | 8709 | 8962 | 7451 | 15167 |
| 10/31/2018 | 8053 | 8301 | 6855 | 14083 |
| 11/30/2018 | 8045 | 8294 | 6798 | 14384 |
| 12/31/2018 | 7277 | 7503 | 6162 | 13069 |
| 01/31/2019 | 8432 | 8708 | 6941 | 14174 |
| 02/28/2019 | 8547 | 8827 | 6960 | 14660 |
| 03/31/2019 | 8866 | 9169 | 7198 | 14907 |
| 04/30/2019 | 8773 | 9066 | 7103 | 15509 |
| 05/31/2019 | 8589 | 8899 | 7022 | 14534 |
| 06/30/2019 | 8852 | 9184 | 7207 | 15546 |
| 07/31/2019 | 8659 | 8997 | 7193 | 15796 |
| 08/31/2019 | 8410 | 8731 | 6797 | 15514 |
| 09/30/2019 | 8622 | 8956 | 6845 | 15775 |
| 10/31/2019 | 8301 | 8629 | 6419 | 16106 |
| 11/30/2019 | 8133 | 8454 | 6050 | 16713 |
| 12/31/2019 | 8819 | 9179 | 6566 | 17186 |
| 01/31/2020 | 8463 | 8810 | 6198 | 17216 |
| 02/29/2020 | 7587 | 7906 | 5327 | 15812 |
| 03/31/2020 | 4462 | 4627 | 2811 | 13728 |
| 04/30/2020 | 5884 | 6144 | 4206 | 15542 |
| 05/31/2020 | 6309 | 6581 | 4582 | 16376 |
| 06/30/2020 | 6115 | 6385 | 4222 | 16741 |
| 07/31/2020 | 6080 | 6356 | 4071 | 17698 |
| 08/31/2020 | 6236 | 6532 | 4093 | 18996 |
| 09/30/2020 | 5533 | 5802 | 3535 | 18307 |
| 10/31/2020 | 5538 | 5811 | 3690 | 17878 |
| 11/30/2020 | 6602 | 6944 | 4568 | 19980 |
| 12/31/2020 | 6676 | 7029 | 4682 | 20817 |
| 01/31/2021 | 6995 | 7373 | 4956 | 20661 |
| 02/28/2021 | 7512 | 7924 | 5341 | 21273 |
| 03/31/2021 | 8033 | 8485 | 5710 | 22052 |
| 04/30/2021 | 8504 | 8988 | 6118 | 23232 |
| 05/31/2021 | 9072 | 9581 | 6582 | 23318 |
| 06/30/2021 | 9468 | 10035 | 6922 | 23944 |
| 07/31/2021 | 9115 | 9664 | 6485 | 24455 |
| 08/31/2021 | 8980 | 9523 | 6335 | 25172 |
| 09/30/2021 | 9396 | 9970 | 6527 | 24022 |
| 10/31/2021 | 9903 | 10527 | 6852 | 25694 |
| 11/30/2021 | 9172 | 9731 | 6338 | 25354 |
| 12/31/2021 | 9319 | 9893 | 6563 | 26337 |
| 01/31/2022 | 10070 | 10700 | 7289 | 24807 |
| 02/28/2022 | 10529 | 11192 | 7641 | 24115 |
| 03/31/2022 | 11302 | 12023 | 7797 | 24908 |
| 04/30/2022 | 11053 | 11762 | 7791 | 22655 |
| 05/31/2022 | 11771 | 12532 | 8393 | 22598 |
| 06/30/2022 | 10216 | 10880 | 7222 | 20734 |
| 07/31/2022 | 11320 | 12061 | 8124 | 22675 |
| 08/31/2022 | 11318 | 12074 | 8447 | 21806 |
| 09/30/2022 | 10093 | 10770 | 7803 | 19779 |
| 10/31/2022 | 11292 | 12055 | 8921 | 21351 |
| 11/30/2022 | 11760 | 12568 | 9015 | 22493 |
| 12/31/2022 | 11027 | 11788 | 8592 | 21180 |
| 01/31/2023 | 11578 | 12383 | 9160 | 22607 |
| 02/28/2023 | 11111 | 11889 | 9051 | 22061 |
| 03/31/2023 | 11042 | 11819 | 8944 | 22764 |
| 04/30/2023 | 11301 | 12099 | 9098 | 23033 |
| 05/31/2023 | 10893 | 11668 | 9051 | 23162 |
| 06/30/2023 | 11669 | 12511 | 9426 | 24727 |
| 07/31/2023 | 12171 | 13051 | 9987 | 25581 |
| 08/31/2023 | 12105 | 12986 | 10034 | 25129 |
| 09/30/2023 | 12007 | 12889 | 10358 | 23952 |
| 10/31/2023 | 11942 | 12824 | 10402 | 23367 |
| 11/30/2023 | 12775 | 13728 | 11116 | 25561 |
| 12/31/2023 | 12687 | 13650 | 10874 | 26827 |
| 01/31/2024 | 12764 | 13741 | 11356 | 27197 |
| 02/29/2024 | 13288 | 14302 | 11848 | 28675 |
| 03/31/2024 | 14193 | 15290 | 12384 | 29597 |
| 04/30/2024 | 14109 | 15201 | 12233 | 28322 |
| 05/31/2024 | 14613 | 15758 | 12254 | 29658 |
| 06/30/2024 | 15037 | 16231 | 12799 | 30650 |
| 07/31/2024 | 15479 | 16717 | 12879 | 31083 |
| 08/31/2024 | 16102 | 17397 | 12929 | 31796 |
| 09/30/2024 | 16194 | 17515 | 12892 | 32471 |
| 10/31/2024 | 16807 | 18188 | 12719 | 32224 |
| 11/30/2024 | 19164 | 20760 | 14576 | 34281 |
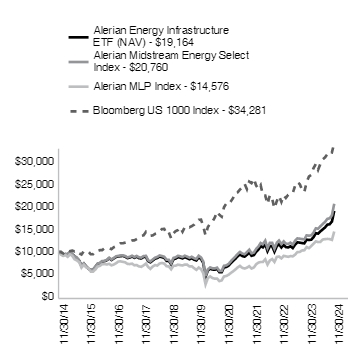
| Alerian Energy Infrastructure ETF - NAV | 50.02% | 18.70% | 6.72% |
| Alerian Midstream Energy Select Index | 51.22% | 19.68% | 7.58% |
| Alerian MLP Index | 31.13% | 19.23% | 3.84% |
| Bloomberg US 1000 Index‡ | 34.11% | 15.45% | 13.11% |
For the most current month-end performance data please visit www.alpsfunds.com or call 1-866-759-5679.
| |
‡ | This index represents a broad measure of market performance and has been added to comply with new regulatory requirements. |
| Net Assets | $235,540,637 |
| Number of Portfolio Holdings | 26 |
| Portfolio Turnover Rate | 33% |
| Total Advisory Fees Paid | $545,871 |
| Energy Transfer LP | 9.53% |
| Enterprise Products Partners LP | 7.83% |
| Enbridge, Inc. | 7.37% |
| DT Midstream, Inc. | 5.95% |
| Targa Resources Corp. | 5.90% |
| Kinder Morgan, Inc. | 5.72% |
| The Williams Cos., Inc. | 5.57% |
| Cheniere Energy, Inc. | 4.93% |
| ONEOK, Inc. | 4.91% |
| MPLX LP | 4.86% |
| Total % of Top 10 Holdings | 62.57% |
| Pipeline Transportation | Natural Gas | 40.14% |
| Gathering + Processing | 29.23% |
| Pipeline Transportation | Petroleum | 21.93% |
| Liquefaction | 5.50% |
| Storage | 2.18% |
| Exchange Traded Fund | 1.01% |
| Money Market Fund | 0.01% |
| Total | 100.00% |
| |
* | % of Total Investments (excluding investments purchased with collateral from securities loaned). |
Holdings are subject to change.
If you wish to view additional information about the Fund, including but not limited to the Fund's prospectus, financial information, holdings, and proxy voting information, please visit https://www.alpsfunds.com/exchange-traded-funds/enfr.
The Funds send only one report to a household if more than one account has the same address. If you do not want this policy to apply to you, or if you wish to receive a copy of this document at a new address, contact 1-866-759-5679.
Alerian MLP Infrastructure Index
Alerian MLP Index
Bloomberg US 1000 Index
Alerian Midstream Energy Select Index
Alerian MLP Index
Bloomberg US 1000 Index
Marketing & Distribution
ALPS Active Equity Opportunity ETF (formerly, the RiverFront Dynamic US Flex-Cap ETF) | ALPS ETF TRUST |
NYSE ARCANYSEArca: RFFC | |
This annual shareholder report contains important information about ALPS Active Equity Opportunity ETF (formerly, the RiverFront Dynamic US Flex-Cap ETF) (the "Fund" or "RFFC") for the period of December 1, 2023 to November 30, 2024 (the "Period"). You can find additional information about the Fund at https://www.alpsfunds.com/exchange-traded-funds/rffc. You can also request this information by contacting us at 1-866-759-5679.
| ALPS Active Equity Opportunity ETF | $56 | 0.48% |
Performance Overview
The ALPS Active Equity Opportunity ETF (RFFC), for the trailing twelve-month period ended November 30, 2024, generated a NAV total return of 34.50%. The Fund outperformed the S&P 1500 Composite Index, which returned 33.87% for the same period.
Attribution
Top contributors to relative performance
Security selection of names within the Consumer Staples sector, which outperformed.
Security selection of names within the Financials sector, which outperformed.
AI & semiconductor company, NVIDIA Corp. (NVDA, 4.76% weight*), provided the best individual contribution to RFFC's performance over the 1-year period (+5.61%).
Top detractors from relative performance
Underweight allocation to the Information Technology sector.
Security selection of names within the Consumer Discretionary sector, which underperformed.
Computer and microprocessor manufacturer, Intel Corp. (INTC, portfolio drop in August), provided the worst individual contribution to RFFC's performance over the 1-year period (-0.76%).
*Weights as of 11/30/2024, Bloomberg
The Fund's past performance is not a good predictor of the Fund's future performance. The chart and the table below do not reflect the deduction of taxes that a shareholder would pay on Fund distributions or sale of Fund shares.
| 06/06/2016 | 10000 | 10000 | 10000 |
| 06/30/2016 | 9976 | 9957 | 9953 |
| 07/31/2016 | 10353 | 10333 | 10334 |
| 08/31/2016 | 10366 | 10354 | 10348 |
| 09/30/2016 | 10355 | 10353 | 10359 |
| 10/31/2016 | 10168 | 10149 | 10155 |
| 11/30/2016 | 10745 | 10584 | 10552 |
| 12/31/2016 | 10942 | 10800 | 10749 |
| 01/31/2017 | 11189 | 10995 | 10967 |
| 02/28/2017 | 11539 | 11412 | 11390 |
| 03/31/2017 | 11530 | 11420 | 11400 |
| 04/30/2017 | 11565 | 11535 | 11523 |
| 05/31/2017 | 11685 | 11669 | 11674 |
| 06/30/2017 | 11862 | 11758 | 11759 |
| 07/31/2017 | 12081 | 11986 | 11990 |
| 08/31/2017 | 11844 | 11997 | 12024 |
| 09/30/2017 | 12377 | 12280 | 12283 |
| 10/31/2017 | 12655 | 12561 | 12568 |
| 11/30/2017 | 13117 | 12953 | 12949 |
| 12/31/2017 | 13219 | 13082 | 13091 |
| 01/31/2018 | 13878 | 13792 | 13816 |
| 02/28/2018 | 13277 | 13276 | 13310 |
| 03/31/2018 | 13005 | 12988 | 13011 |
| 04/30/2018 | 13094 | 13035 | 13051 |
| 05/31/2018 | 13656 | 13380 | 13387 |
| 06/30/2018 | 13861 | 13463 | 13473 |
| 07/31/2018 | 14323 | 13943 | 13937 |
| 08/31/2018 | 14756 | 14404 | 14403 |
| 09/30/2018 | 14662 | 14452 | 14452 |
| 10/31/2018 | 13412 | 13422 | 13419 |
| 11/30/2018 | 13400 | 13703 | 13706 |
| 12/31/2018 | 11941 | 12433 | 12453 |
| 01/31/2019 | 13105 | 13458 | 13506 |
| 02/28/2019 | 13451 | 13904 | 13969 |
| 03/31/2019 | 13530 | 14130 | 14205 |
| 04/30/2019 | 14029 | 14701 | 14778 |
| 05/31/2019 | 12769 | 13742 | 13849 |
| 06/30/2019 | 13786 | 14717 | 14813 |
| 07/31/2019 | 13885 | 14925 | 15052 |
| 08/31/2019 | 13324 | 14652 | 14783 |
| 09/30/2019 | 13663 | 14943 | 15032 |
| 10/31/2019 | 13921 | 15256 | 15346 |
| 11/30/2019 | 14403 | 15801 | 15925 |
| 12/31/2019 | 14871 | 16275 | 16376 |
| 01/31/2020 | 14663 | 16226 | 16404 |
| 02/29/2020 | 13354 | 14872 | 15067 |
| 03/31/2020 | 11121 | 12927 | 13081 |
| 04/30/2020 | 12608 | 14593 | 14809 |
| 05/31/2020 | 13238 | 15308 | 15604 |
| 06/30/2020 | 13604 | 15612 | 15952 |
| 07/31/2020 | 14252 | 16477 | 16864 |
| 08/31/2020 | 15083 | 17616 | 18100 |
| 09/30/2020 | 14677 | 16948 | 17444 |
| 10/31/2020 | 14340 | 16562 | 17035 |
| 11/30/2020 | 15807 | 18434 | 19039 |
| 12/31/2020 | 16618 | 19192 | 19836 |
| 01/31/2021 | 16510 | 19063 | 19687 |
| 02/28/2021 | 16736 | 19660 | 20270 |
| 03/31/2021 | 17414 | 20518 | 21013 |
| 04/30/2021 | 18262 | 21584 | 22137 |
| 05/31/2021 | 18382 | 21737 | 22219 |
| 06/30/2021 | 18904 | 22188 | 22815 |
| 07/31/2021 | 19292 | 22660 | 23302 |
| 08/31/2021 | 19745 | 23329 | 23985 |
| 09/30/2021 | 18697 | 22266 | 22890 |
| 10/31/2021 | 19888 | 23792 | 24483 |
| 11/30/2021 | 19546 | 23586 | 24159 |
| 12/31/2021 | 20325 | 24652 | 25096 |
| 01/31/2022 | 19546 | 23335 | 23637 |
| 02/28/2022 | 19375 | 22714 | 22979 |
| 03/31/2022 | 19933 | 23508 | 23734 |
| 04/30/2022 | 18517 | 21484 | 21587 |
| 05/31/2022 | 18621 | 21539 | 21533 |
| 06/30/2022 | 17014 | 19743 | 19757 |
| 07/31/2022 | 18590 | 21585 | 21607 |
| 08/31/2022 | 17855 | 20715 | 20778 |
| 09/30/2022 | 15975 | 18804 | 18847 |
| 10/31/2022 | 17418 | 20373 | 20345 |
| 11/30/2022 | 18377 | 21510 | 21433 |
| 12/31/2022 | 17365 | 20269 | 20182 |
| 01/31/2023 | 18444 | 21593 | 21541 |
| 02/28/2023 | 17888 | 21081 | 21021 |
| 03/31/2023 | 18050 | 21720 | 21691 |
| 04/30/2023 | 18173 | 22007 | 21948 |
| 05/31/2023 | 18195 | 22046 | 22070 |
| 06/30/2023 | 19171 | 23542 | 23562 |
| 07/31/2023 | 19831 | 24324 | 24375 |
| 08/31/2023 | 19406 | 23903 | 23945 |
| 09/30/2023 | 18625 | 22750 | 22823 |
| 10/31/2023 | 18282 | 22209 | 22265 |
| 11/30/2023 | 19813 | 24224 | 24356 |
| 12/31/2023 | 20762 | 25430 | 25563 |
| 01/31/2024 | 21142 | 25770 | 25915 |
| 02/29/2024 | 22364 | 27142 | 27324 |
| 03/31/2024 | 23209 | 28051 | 28202 |
| 04/30/2024 | 22265 | 26864 | 26987 |
| 05/31/2024 | 23271 | 28188 | 28260 |
| 06/30/2024 | 23906 | 29079 | 29205 |
| 07/31/2024 | 24360 | 29571 | 29618 |
| 08/31/2024 | 24973 | 30217 | 30298 |
| 09/30/2024 | 25464 | 30836 | 30940 |
| 10/31/2024 | 25230 | 30546 | 30705 |
| 11/30/2024 | 26648 | 32428 | 32665 |
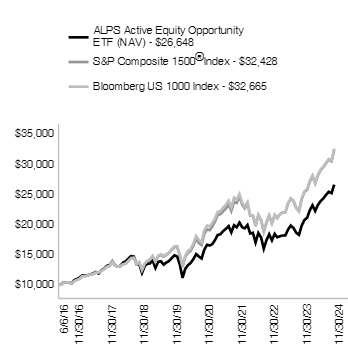
| ALPS Active Equity Opportunity ETF - NAV | 34.50% | 13.09% | 12.24% |
| S&P Composite 1500® Index | 33.87% | 15.46% | 14.87% |
| Bloomberg US 1000 Index‡ | 34.11% | 15.45% | 14.97% |
For the most current month-end performance data please visit www.alpsfunds.com or call 1-866-759-5679.
| |
^ | Effective June 1, 2023, RiverFront Investment Group, LLC ceased to serve as the Sub-Adviser to the RiverFront Dynamic US Flex-Cap ETF and ALPS Advisors, Inc. assumed all responsibility for selecting the investments of the Fund. In addition, the Fund changed its name from RiverFront Dynamic US Flex-Cap ETF to ALPS Active Equity Opportunity ETF and its principal investment strategies. Performance figures shown above for periods before June 1, 2023 represent performance of the Fund during the times when the Fund's investments were selected by RiverFront Investment Group, LLC. |
| |
‡ | This index represents a broad measure of market performance and has been added to comply with new regulatory requirements. |
| Net Assets | $24,135,761 |
| Number of Portfolio Holdings | 58 |
| Portfolio Turnover Rate | 33% |
| Total Advisory Fees Paid | $110,846 |
| Apple, Inc. | 6.05% |
| NVIDIA Corp. | 4.60% |
| Amazon.com, Inc. | 4.13% |
| Microsoft Corp. | 3.49% |
| JPMorgan Chase & Co. | 3.14% |
| Alphabet, Inc. | 2.82% |
| Meta Platforms, Inc. | 2.75% |
| Walmart, Inc. | 2.62% |
| UnitedHealth Group, Inc. | 2.52% |
| Taiwan Semiconductor Manufacturing Co., Ltd. | 2.42% |
| Total % of Top 10 Holdings | 34.54% |
| Information Technology | 26.79% |
| Financials | 13.76% |
| Industrials | 11.07% |
| Consumer Discretionary | 9.06% |
| Health Care | 8.55% |
| Communication Services | 8.49% |
| Consumer Staples | 7.22% |
| Energy | 4.94% |
| Real Estate | 2.58% |
| Utilities | 2.43% |
| Materials | 1.81% |
| Money Market Fund | 3.30% |
| Total | 100.00% |
| |
* | % of Total Investments (excluding investments purchased with collateral from securities loaned). |
^ | Excludes Money Market Fund. |
Holdings are subject to change.
If you wish to view additional information about the Fund, including but not limited to the Fund's prospectus, financial information, holdings, and proxy voting information, please visit https://www.alpsfunds.com/exchange-traded-funds/rffc.
The Funds send only one report to a household if more than one account has the same address. If you do not want this policy to apply to you, or if you wish to receive a copy of this document at a new address, contact 1-866-759-5679.
ALPS Active REIT ETF | ALPS ETF TRUST |
NASDAQ: REIT | |
This annual shareholder report contains important information about ALPS Active REIT ETF (the "Fund" or "REIT") for the period of December 1, 2023 to November 30, 2024 (the "Period"). You can find additional information about the Fund at https://www.alpsfunds.com/exchange-traded-funds/reit. You can also request this information by contacting us at 1-866-759-5679.
| ALPS Active REIT ETF | $77 | 0.68% |
●REIT share prices enjoyed a strong recovery for the fiscal year ending November 30, 2024, as the S&P United States REIT Index was up 28.64% for the period, outpacing most other sectors of the market. The Fund was up 27.28% for the fiscal year, net of all fees and expenses, slightly lagging the benchmark. Key drivers of the strong absolute performance were a combination of overly discounted valuations at the beginning of the year, investor rotation out of large cap technology stocks into more value-oriented areas including REITs, and the beginning of monetary easing and a decline in short-term interest rates.
●The Fund benefited from broad-based contribution to total returns from its portfolio holdings, with the largest contributors to the Fund's total returns coming from holdings in the healthcare, storage and industrial property sectors. Key positive contributors to excess returns included stock selection in the lodging and office sectors. Within the broader lodging category, the portfolio was underweight the lagging hotel sub-sector and overweight the outperforming gaming sub-sector.
●The largest detractors of relative returns were the Fund's overweight position in the underperforming single-family rental property sector, stock selection and allocation within healthcare and its property subsectors, and an underweight position in outperforming specialty REITs, specifically those focused on technology and data storage.
●Earnings growth has been one of the primary drivers of investment performance for the REIT universe this year as sectors and individual companies with high actual and expected growth rates have generated strong total returns. The best examples of this trend include companies in the senior housing and specialty REIT sectors.
●The underperforming property sectors for the year have generally been those experiencing a deceleration in earnings growth. The industrial and single-family rental sectors have been two of the weakest performing sectors for the year, as both have seen declining growth in earnings and net operating income from previously high levels. Despite the recent slowdown, these sectors should benefit from favorable, long-term secular fundamentals and do well over the long term. The hotel and cold storage sectors have also suffered from weakening demand and operating results but may be poised for a recovery as both are trading at discounted valuations that could provide the potential for favorable returns should business recover.
The Fund's past performance is not a good predictor of the Fund's future performance. The chart and the table below do not reflect the deduction of taxes that a shareholder would pay on Fund distributions or sale of Fund shares.
| 02/25/2021 | 10000 | 10000 | 10000 |
| 02/28/2021 | 9870 | 9861 | 9967 |
| 03/31/2021 | 10284 | 10298 | 10333 |
| 04/30/2021 | 11124 | 11126 | 10885 |
| 05/31/2021 | 11243 | 11229 | 10926 |
| 06/30/2021 | 11579 | 11527 | 11219 |
| 07/31/2021 | 12152 | 12089 | 11458 |
| 08/31/2021 | 12222 | 12315 | 11794 |
| 09/30/2021 | 11594 | 11640 | 11256 |
| 10/31/2021 | 12362 | 12541 | 12039 |
| 11/30/2021 | 12201 | 12457 | 11880 |
| 12/31/2021 | 13213 | 13549 | 12340 |
| 01/31/2022 | 12343 | 12612 | 11623 |
| 02/28/2022 | 12031 | 12211 | 11299 |
| 03/31/2022 | 12813 | 13009 | 11671 |
| 04/30/2022 | 12296 | 12433 | 10615 |
| 05/31/2022 | 11710 | 11668 | 10588 |
| 06/30/2022 | 10931 | 10813 | 9715 |
| 07/31/2022 | 11970 | 11783 | 10625 |
| 08/31/2022 | 11317 | 11082 | 10217 |
| 09/30/2022 | 9978 | 9735 | 9268 |
| 10/31/2022 | 10395 | 10215 | 10004 |
| 11/30/2022 | 10960 | 10803 | 10539 |
| 12/31/2022 | 10448 | 10248 | 9924 |
| 01/31/2023 | 11522 | 11335 | 10593 |
| 02/28/2023 | 10988 | 10795 | 10337 |
| 03/31/2023 | 10740 | 10527 | 10666 |
| 04/30/2023 | 10824 | 10609 | 10792 |
| 05/31/2023 | 10440 | 10285 | 10853 |
| 06/30/2023 | 10933 | 10806 | 11586 |
| 07/31/2023 | 11266 | 11114 | 11986 |
| 08/31/2023 | 10893 | 10777 | 11774 |
| 09/30/2023 | 10234 | 10048 | 11223 |
| 10/31/2023 | 9727 | 9614 | 10948 |
| 11/30/2023 | 10791 | 10614 | 11977 |
| 12/31/2023 | 11883 | 11660 | 12570 |
| 01/31/2024 | 11443 | 11174 | 12743 |
| 02/29/2024 | 11557 | 11397 | 13436 |
| 03/31/2024 | 11784 | 11618 | 13868 |
| 04/30/2024 | 10915 | 10796 | 13270 |
| 05/31/2024 | 11414 | 11293 | 13896 |
| 06/30/2024 | 11725 | 11619 | 14361 |
| 07/31/2024 | 12514 | 12352 | 14564 |
| 08/31/2024 | 13206 | 13141 | 14898 |
| 09/30/2024 | 13535 | 13489 | 15214 |
| 10/31/2024 | 13145 | 13093 | 15099 |
| 11/30/2024 | 13735 | 13653 | 16063 |
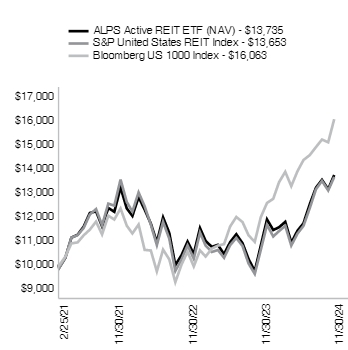
| ALPS Active REIT ETF - NAV | 27.28% | 8.80% |
| S&P United States REIT Index | 28.64% | 8.63% |
| Bloomberg US 1000 Index‡ | 34.11% | 13.43% |
For the most current month-end performance data please visit www.alpsfunds.com or call 1-866-759-5679.
| |
‡ | This index represents a broad measure of market performance and has been added to comply with new regulatory requirements. |
| Net Assets | $41,376,443 |
| Number of Portfolio Holdings | 29 |
| Portfolio Turnover Rate | 79% |
| Total Advisory Fees Paid | $189,355 |
| Equinix, Inc. | 9.51% |
| Prologis, Inc. | 7.14% |
| Welltower, Inc. | 4.94% |
| Public Storage | 4.85% |
| VICI Properties, Inc. | 4.75% |
| Healthpeak Properties, Inc. | 3.96% |
| Simon Property Group, Inc. | 3.94% |
| First Industrial Realty Trust, Inc. | 3.91% |
| Extra Space Storage, Inc. | |
| Invitation Homes, Inc. | 3.78% |
| Total % of Top 10 Holdings | 50.61% |
| Real Estate | 98.14% |
| Money Market Fund | 1.86% |
| Total | 100.00% |
| |
* | % of Total Investments (excluding investments purchased with collateral from securities loaned). |
Holdings are subject to change.
If you wish to view additional information about the Fund, including but not limited to the Fund's prospectus, financial information, holdings, and proxy voting information, please visit https://www.alpsfunds.com/exchange-traded-funds/reit.
The Funds send only one report to a household if more than one account has the same address. If you do not want this policy to apply to you, or if you wish to receive a copy of this document at a new address, contact 1-866-759-5679.
ALPS Equal Sector Weight ETF | ALPS ETF TRUST |
NYSE ARCA: NYSEARCAEQL | |
This annual shareholder report contains important information about ALPS Equal Sector Weight ETF (the "Fund" or "EQL") for the period of December 1, 2023 to November 30, 2024 (the "Period"). You can find additional information about the Fund at https://www.alpsfunds.com/exchange-traded-funds/eql. You can also request this information by contacting us at 1-866-759-5679.
| ALPS Equal Sector Weight ETF | $18 | 0.16% |
Performance Overview
The ALPS Equal Sector Weight ETF (EQL), for the trailing twelve-month period ended November 30, 2024, generated a NAV total return of 28.68%. The Fund underperformed the S&P 500® Index, which returned 33.89% for the period.
Top contributors to relative performance:
Underweight allocation to the Health Care sector.
Overweight allocation to the Utilities sector, which overperformed.
The Financial Select Sector SPDR ETF (XLF US, 9.72% weight*), provided the best individual contribution to EQL's performance over the 1-year period (+3.98%).
Top detractors from relative performance:
Underweight allocation to the Information Technology sector.
Overweight allocation to the Materials sector, which underperformed.
The Health Care Select Sector SPDR ETF (XLV US, 8.20% weight*), provided the worst individual contribution to EQL's performance over the 1-year period (+1.40%).
*Weights as of 11/30/2024, Bloomberg
The Fund's past performance is not a good predictor of the Fund's future performance. The chart and the table below do not reflect the deduction of taxes that a shareholder would pay on Fund distributions or sale of Fund shares.
| 11/30/2014 | 10000 | 10000 | 10000 |
| 12/31/2014 | 10008 | 9975 | 10010 |
| 01/31/2015 | 9775 | 9675 | 9779 |
| 02/28/2015 | 10223 | 10231 | 10231 |
| 03/31/2015 | 10044 | 10070 | 10056 |
| 04/30/2015 | 10161 | 10166 | 10171 |
| 05/31/2015 | 10228 | 10297 | 10239 |
| 06/30/2015 | 9971 | 10098 | 9984 |
| 07/31/2015 | 10119 | 10309 | 10133 |
| 08/31/2015 | 9535 | 9687 | 9548 |
| 09/30/2015 | 9286 | 9447 | 9299 |
| 10/31/2015 | 10038 | 10244 | 10055 |
| 11/30/2015 | 10048 | 10275 | 10067 |
| 12/31/2015 | 9842 | 10113 | 9860 |
| 01/31/2016 | 9401 | 9611 | 9422 |
| 02/29/2016 | 9484 | 9598 | 9504 |
| 03/31/2016 | 10146 | 10249 | 10170 |
| 04/30/2016 | 10287 | 10289 | 10314 |
| 05/31/2016 | 10392 | 10474 | 10421 |
| 06/30/2016 | 10511 | 10501 | 10542 |
| 07/31/2016 | 10812 | 10888 | 10843 |
| 08/31/2016 | 10772 | 10903 | 10803 |
| 09/30/2016 | 10780 | 10905 | 10816 |
| 10/31/2016 | 10564 | 10706 | 10600 |
| 11/30/2016 | 10915 | 11103 | 10955 |
| 12/31/2016 | 11144 | 11322 | 11185 |
| 01/31/2017 | 11324 | 11537 | 11368 |
| 02/28/2017 | 11723 | 11995 | 11769 |
| 03/31/2017 | 11697 | 12009 | 11745 |
| 04/30/2017 | 11781 | 12132 | 11832 |
| 05/31/2017 | 11905 | 12303 | 11958 |
| 06/30/2017 | 11981 | 12380 | 12035 |
| 07/31/2017 | 12191 | 12635 | 12247 |
| 08/31/2017 | 12189 | 12673 | 12247 |
| 09/30/2017 | 12437 | 12935 | 12497 |
| 10/31/2017 | 12654 | 13237 | 12717 |
| 11/30/2017 | 13040 | 13642 | 13107 |
| 12/31/2017 | 13165 | 13794 | 13154 |
| 01/31/2018 | 13680 | 14584 | 13671 |
| 02/28/2018 | 13000 | 14046 | 12994 |
| 03/31/2018 | 12843 | 13689 | 12777 |
| 04/30/2018 | 12936 | 13742 | 12872 |
| 05/31/2018 | 13137 | 14073 | 13212 |
| 06/30/2018 | 13299 | 14160 | 13375 |
| 07/31/2018 | 13742 | 14686 | 13823 |
| 08/31/2018 | 13978 | 15165 | 14061 |
| 09/30/2018 | 14026 | 15251 | 14112 |
| 10/31/2018 | 13199 | 14209 | 13280 |
| 11/30/2018 | 13517 | 14498 | 13600 |
| 12/31/2018 | 12373 | 13189 | 12453 |
| 01/31/2019 | 13384 | 14246 | 13472 |
| 02/28/2019 | 13746 | 14704 | 13838 |
| 03/31/2019 | 14016 | 14989 | 14113 |
| 04/30/2019 | 14470 | 15596 | 14571 |
| 05/31/2019 | 13651 | 14605 | 13745 |
| 06/30/2019 | 14555 | 15635 | 14658 |
| 07/31/2019 | 14703 | 15859 | 14809 |
| 08/31/2019 | 14537 | 15608 | 14644 |
| 09/30/2019 | 14856 | 15900 | 14965 |
| 10/31/2019 | 15011 | 16245 | 15123 |
| 11/30/2019 | 15390 | 16834 | 15507 |
| 12/31/2019 | 15820 | 17342 | 15942 |
| 01/31/2020 | 15678 | 17335 | 15801 |
| 02/29/2020 | 14312 | 15908 | 14427 |
| 03/31/2020 | 12293 | 13944 | 12409 |
| 04/30/2020 | 13865 | 15731 | 13996 |
| 05/31/2020 | 14490 | 16480 | 14627 |
| 06/30/2020 | 14585 | 16808 | 14726 |
| 07/31/2020 | 15324 | 17756 | 15473 |
| 08/31/2020 | 16046 | 19032 | 16204 |
| 09/30/2020 | 15536 | 18309 | 15687 |
| 10/31/2020 | 15257 | 17822 | 15407 |
| 11/30/2020 | 16987 | 19773 | 17157 |
| 12/31/2020 | 17503 | 20533 | 17680 |
| 01/31/2021 | 17347 | 20326 | 17523 |
| 02/28/2021 | 18056 | 20886 | 18242 |
| 03/31/2021 | 19105 | 21801 | 19304 |
| 04/30/2021 | 20013 | 22964 | 20224 |
| 05/31/2021 | 20325 | 23125 | 20543 |
| 06/30/2021 | 20493 | 23665 | 20716 |
| 07/31/2021 | 20802 | 24227 | 21032 |
| 08/31/2021 | 21290 | 24963 | 21527 |
| 09/30/2021 | 20451 | 23802 | 20679 |
| 10/31/2021 | 21822 | 25470 | 22068 |
| 11/30/2021 | 21385 | 25294 | 21628 |
| 12/31/2021 | 22627 | 26427 | 22889 |
| 01/31/2022 | 21915 | 25060 | 22170 |
| 02/28/2022 | 21524 | 24309 | 21777 |
| 03/31/2022 | 22569 | 25212 | 22836 |
| 04/30/2022 | 21132 | 23013 | 21384 |
| 05/31/2022 | 21379 | 23056 | 21636 |
| 06/30/2022 | 19490 | 21152 | 19729 |
| 07/31/2022 | 21050 | 23103 | 21310 |
| 08/31/2022 | 20416 | 22161 | 20671 |
| 09/30/2022 | 18497 | 20120 | 18724 |
| 10/31/2022 | 20049 | 21749 | 20297 |
| 11/30/2022 | 21259 | 22964 | 21525 |
| 12/31/2022 | 20233 | 21641 | 20491 |
| 01/31/2023 | 21446 | 23001 | 21719 |
| 02/28/2023 | 20730 | 22440 | 20998 |
| 03/31/2023 | 21152 | 23263 | 21428 |
| 04/30/2023 | 21464 | 23626 | 21746 |
| 05/31/2023 | 20876 | 23729 | 21152 |
| 06/30/2023 | 22258 | 25297 | 22553 |
| 07/31/2023 | 22994 | 26110 | 23303 |
| 08/31/2023 | 22478 | 25694 | 22781 |
| 09/30/2023 | 21525 | 24469 | 21813 |
| 10/31/2023 | 20984 | 23954 | 21268 |
| 11/30/2023 | 22626 | 26142 | 22934 |
| 12/31/2023 | 23645 | 27330 | 23971 |
| 01/31/2024 | 23578 | 27789 | 23907 |
| 02/29/2024 | 24584 | 29273 | 24928 |
| 03/31/2024 | 25557 | 30215 | 25921 |
| 04/30/2024 | 24604 | 28981 | 24956 |
| 05/31/2024 | 25514 | 30418 | 25883 |
| 06/30/2024 | 25648 | 31509 | 26022 |
| 07/31/2024 | 26479 | 31893 | 26871 |
| 08/31/2024 | 27240 | 32666 | 27646 |
| 09/30/2024 | 27871 | 33364 | 28291 |
| 10/31/2024 | 27491 | 33061 | 27910 |
| 11/30/2024 | 29115 | 35002 | 29563 |
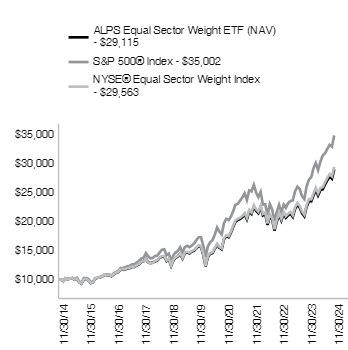
| ALPS Equal Sector Weight ETF - NAV | 28.68% | 13.60% | 11.28% |
| NYSE® Equal Sector Weight Index | 28.90% | 13.77% | 11.45% |
| S&P 500® Index‡ | 33.89% | 15.77% | 13.35% |
For the most current month-end performance data please visit www.alpsfunds.com or call 1-866-759-5679.
| |
‡ | This index represents a broad measure of market performance for purposes of new regulatory requirements. |
| Net Assets | $422,915,659 |
| Number of Portfolio Holdings | 11 |
| Portfolio Turnover Rate | 7% |
| Total Advisory Fees Paid | $568,031 |
| Consumer Discretionary Select Sector SPDR Fund | 9.77% |
| Financial Select Sector SPDR Fund | 9.72% |
| Communication Services Select Sector SPDR Fund | 9.56% |
| Industrial Select Sector SPDR Fund | 9.34% |
| Energy Select Sector SPDR Fund | 9.30% |
| Technology Select Sector SPDR Fund | 9.08% |
| Utilities Select Sector SPDR Fund | 8.95% |
| Materials Select Sector SPDR Fund | 8.71% |
| Real Estate Select Sector SPDR Fund | 8.70% |
| Consumer Staples Select Sector SPDR Fund | 8.66% |
| Total % of Top 10 Holdings | 91.79% |
| Consumer Discretionary | 9.77% |
| Financials | 9.72% |
| Communication Services | 9.56% |
| Industrials | 9.34% |
| Energy | 9.30% |
| Technology | 9.08% |
| Utilities | 8.95% |
| Materials | 8.71% |
| Real Estate | 8.70% |
| Consumer Staples | 8.66% |
| Healthcare | 8.20% |
| Money Market Fund | 0.01% |
| Total | 100.00% |
Holdings are subject to change.
If you wish to view additional information about the Fund, including but not limited to the Fund's prospectus, financial information, holdings, and proxy voting information, please visit https://www.alpsfunds.com/exchange-traded-funds/eql.
The Funds send only one report to a household if more than one account has the same address. If you do not want this policy to apply to you, or if you wish to receive a copy of this document at a new address, contact 1-866-759-5679.
ALPS Intermediate Municipal Bond ETF | ALPS ETF TRUST |
NYSE ARCA: MNBD | |
This annual shareholder report contains important information about ALPS Intermediate Municipal Bond ETF (the "Fund" or "MNBD") for the period of December 1, 2023 to November 30, 2024 (the "Period"). You can find additional information about the Fund at https://www.alpsfunds.com/exchange-traded-funds/mnbd. You can also request this information by contacting us at 1-866-759-5679.
| ALPS Intermediate Municipal Bond ETF | $51 | 0.50% |
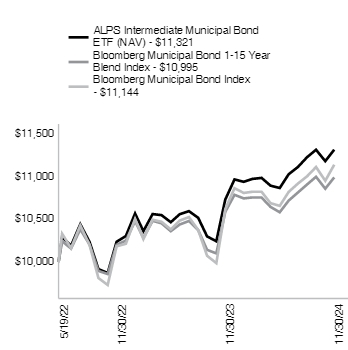
The ALPS Intermediate Municipal ETF (the "Fund") produced a total return of 5.46% for the twelve-month period ending November 30, 2024. In comparison, its benchmark, the Bloomberg Municipal Bond 1-15 Year Blend Index, had a return of 3.83% over the period. Throughout the measurement period, changing investor expectations regarding inflation and monetary policy drove significant market volatility.
For the twelve-month period, 10-year maturity municipal yields increased 15 basis points, the 5-year maturity remained unchanged and short maturity yields declined by 15 basis points. The Fed's tightening cycle officially ended in September when they reduced their policy rate by 50 basis points. Although core measures of inflation remain moderately above the Fed's target of 2%, they have fallen substantially. This gave the Fed confidence to ease rates to help support the labor market.
The credit-sensitive portions of the Municipal market performed very strongly. Relative to Triple-A rated securities, Triple-B rated bonds and Municipal High Yield outperformed by 300 basis points and 700 basis points, respectively during the year. A core element of the Fund's strategy is to focus on smaller areas of the market and own securities that are structurally more complex. This has allowed us to enhance the risk-adjusted return of the Fund. To help preserve Fund liquidity, we focus on high quality securities in these areas.
Against this backdrop, the Fund outperformed its benchmark by 1.63%. Despite the Fund's low exposure to Triple B rated bonds and no high yield positions, it still performed well relative to its benchmark and its peers. The Fund's significant holdings of State Housing Finance Authorities, Prepaid Natural Gas, and Airports were large contributors to performance. Also enhancing returns were the Fund's positions in zero-coupon bonds and floating rate notes.
The Fund's past performance is not a good predictor of the Fund's future performance. The chart and the table below do not reflect the deduction of taxes that a shareholder would pay on Fund distributions or sale of Fund shares.
| 05/19/2022 | 10000 | 10000 | 10000 |
| 05/31/2022 | 10292 | 10244 | 10332 |
| 06/30/2022 | 10192 | 10158 | 10163 |
| 07/31/2022 | 10444 | 10385 | 10431 |
| 08/31/2022 | 10237 | 10205 | 10203 |
| 09/30/2022 | 9916 | 9895 | 9811 |
| 10/31/2022 | 9871 | 9858 | 9730 |
| 11/30/2022 | 10238 | 10203 | 10185 |
| 12/31/2022 | 10305 | 10251 | 10214 |
| 01/31/2023 | 10570 | 10481 | 10507 |
| 02/28/2023 | 10363 | 10284 | 10270 |
| 03/31/2023 | 10564 | 10484 | 10497 |
| 04/30/2023 | 10551 | 10455 | 10473 |
| 05/31/2023 | 10468 | 10362 | 10383 |
| 06/30/2023 | 10562 | 10441 | 10487 |
| 07/31/2023 | 10598 | 10482 | 10528 |
| 08/31/2023 | 10520 | 10376 | 10377 |
| 09/30/2023 | 10301 | 10143 | 10073 |
| 10/31/2023 | 10244 | 10101 | 9987 |
| 11/30/2023 | 10734 | 10589 | 10621 |
| 12/31/2023 | 10971 | 10790 | 10868 |
| 01/31/2024 | 10943 | 10748 | 10812 |
| 02/29/2024 | 10977 | 10759 | 10826 |
| 03/31/2024 | 10989 | 10758 | 10826 |
| 04/30/2024 | 10898 | 10648 | 10692 |
| 05/31/2024 | 10870 | 10585 | 10660 |
| 06/30/2024 | 11032 | 10722 | 10824 |
| 07/31/2024 | 11117 | 10817 | 10922 |
| 08/31/2024 | 11233 | 10912 | 11008 |
| 09/30/2024 | 11320 | 11002 | 11117 |
| 10/31/2024 | 11186 | 10862 | 10955 |
| 11/30/2024 | 11321 | 10995 | 11144 |
| ALPS Intermediate Municipal Bond ETF - NAV | 5.46% | 5.02% |
| Bloomberg Municipal Bond 1-15 Year Blend Index | 3.83% | 3.82% |
| Bloomberg Municipal Bond Index‡ | 4.93% | 4.37% |
For the most current month-end performance data please visit www.alpsfunds.com or call 1-866-759-5679.
| |
‡ | This index represents a broad measure of market performance and has been added to comply with new regulatory requirements. |
| Net Assets | $34,896,018 |
| Number of Portfolio Holdings | 116 |
| Portfolio Turnover Rate | 98% |
| Total Advisory Fees Paid | $163,193 |
| United States Treasury Bill | 4.08% |
| Port Authority of New York & New Jersey | 3.24% |
| South Carolina State Housing Finance & Development Authority | 2.82% |
| Wyoming Community Development Authority | |
| North Carolina Housing Finance Agency | 2.26% |
| Central Plains Energy Project | 2.11% |
| Salt Verde Financial Corp. | 2.02% |
| Minnesota Housing Finance Agency | 1.93% |
| New Jersey Transportation Trust Fund Authority | 1.57% |
| Morris Area Schools Independent School District No 2769 | 1.55% |
| Total % of Top 10 Holdings | 24.32% |
| Revenue Bonds | 75.87% |
| General Obligation Unlimited | 17.20% |
| Government Bonds | 4.08% |
| General Obligation Limited | 1.41% |
| Commercial Paper | 1.13% |
| Money Market Fund | 0.31% |
| Total | 100.00% |
Holdings are subject to change.
If you wish to view additional information about the Fund, including but not limited to the Fund's prospectus, financial information, holdings, and proxy voting information, please visit https://www.alpsfunds.com/exchange-traded-funds/mnbd.
The Funds send only one report to a household if more than one account has the same address. If you do not want this policy to apply to you, or if you wish to receive a copy of this document at a new address, contact 1-866-759-5679.
ALPS Clean Energy ETF | ALPS ETF TRUST |
NYSE ARCA: ACES | |
This annual shareholder report contains important information about ALPS Clean Energy ETF (the "Fund" or "ACES") for the period of December 1, 2023 to November 30, 2024 (the "Period"). You can find additional information about the Fund at https://www.alpsfunds.com/exchange-traded-funds/aces. You can also request this information by contacting us at 1-866-759-5679.
| ALPS Clean Energy ETF | $52 | 0.55% |
The ALPS Clean Energy ETF (ACES), for the trailing twelve-month period ended November 30, 2024, generated a NAV total return of -9.32%. The fund underperformed the S&P 1000 Index, which returned 33.37% for the same period.
Top contributors to relative performance:
Overweight allocation to the Utilities sector, which overperformed.
Overweight allocation to the Health Care sector, which overperformed.
Electric vehicle manufacturer, Tesla Inc. (TSLA US, 7.77% weight*), provided the best individual contribution to ACES' performance over the 1-year period (+2.95%).
Top detractors from relative performance:
Underweight allocation to the Financials sector.
Security selection of names within the Industrials sector, which underperformed.
Semiconductor manufacturer, Wolfspeed, Inc. (WOLF US, 1.41% weight*), provided the worst individual contribution to ACES' performance over the 1-year period (-2.26%).
*Weights as of 11/30/2024, Bloomberg
The Fund's past performance is not a good predictor of the Fund's future performance. The chart and the table below do not reflect the deduction of taxes that a shareholder would pay on Fund distributions or sale of Fund shares.
| 06/28/2018 | 10000 | 10000 | 10000 | 10000 |
| 06/30/2018 | 10068 | 10067 | 9997 | 10009 |
| 07/31/2018 | 10128 | 10144 | 10217 | 10354 |
| 08/31/2018 | 10505 | 10562 | 10597 | 10700 |
| 09/30/2018 | 10188 | 10273 | 10410 | 10737 |
| 10/31/2018 | 9687 | 9786 | 9386 | 9969 |
| 11/30/2018 | 10032 | 10132 | 9631 | 10183 |
| 12/31/2018 | 9122 | 9210 | 8518 | 9251 |
| 01/31/2019 | 10220 | 10319 | 9414 | 10034 |
| 02/28/2019 | 10907 | 11017 | 9817 | 10378 |
| 03/31/2019 | 10896 | 11008 | 9676 | 10553 |
| 04/30/2019 | 11445 | 11560 | 10061 | 10978 |
| 05/31/2019 | 10896 | 11015 | 9236 | 10288 |
| 06/30/2019 | 12022 | 12166 | 9937 | 11005 |
| 07/31/2019 | 12518 | 12674 | 10053 | 11182 |
| 08/31/2019 | 12433 | 12580 | 9622 | 10983 |
| 09/30/2019 | 12602 | 12755 | 9925 | 11167 |
| 10/31/2019 | 12737 | 12899 | 10061 | 11401 |
| 11/30/2019 | 13170 | 13334 | 10364 | 11831 |
| 12/31/2019 | 13824 | 14004 | 10660 | 12166 |
| 01/31/2020 | 14895 | 15095 | 10339 | 12187 |
| 02/29/2020 | 15248 | 15453 | 9354 | 11193 |
| 03/31/2020 | 11873 | 12003 | 7401 | 9718 |
| 04/30/2020 | 13873 | 14069 | 8418 | 11002 |
| 05/31/2020 | 14896 | 15096 | 8961 | 11593 |
| 06/30/2020 | 16154 | 16377 | 9138 | 11851 |
| 07/31/2020 | 18631 | 18950 | 9546 | 12528 |
| 08/31/2020 | 22160 | 22496 | 9894 | 13447 |
| 09/30/2020 | 22950 | 23304 | 9531 | 12959 |
| 10/31/2020 | 22883 | 23251 | 9749 | 12655 |
| 11/30/2020 | 29034 | 29520 | 11250 | 14144 |
| 12/31/2020 | 33171 | 33745 | 12044 | 14736 |
| 01/31/2021 | 38112 | 38784 | 12397 | 14626 |
| 02/28/2021 | 33652 | 34255 | 13272 | 15059 |
| 03/31/2021 | 32308 | 32895 | 13835 | 15611 |
| 04/30/2021 | 30191 | 30740 | 14352 | 16446 |
| 05/31/2021 | 28713 | 29270 | 14463 | 16507 |
| 06/30/2021 | 31523 | 32110 | 14376 | 16950 |
| 07/31/2021 | 30092 | 30658 | 14303 | 17311 |
| 08/31/2021 | 29334 | 29897 | 14585 | 17819 |
| 09/30/2021 | 27542 | 28091 | 14074 | 17005 |
| 10/31/2021 | 33003 | 33673 | 14796 | 18189 |
| 11/30/2021 | 30823 | 31460 | 14390 | 17948 |
| 12/31/2021 | 26767 | 27329 | 15097 | 18644 |
| 01/31/2022 | 22344 | 22816 | 14006 | 17561 |
| 02/28/2022 | 23664 | 24165 | 14174 | 17071 |
| 03/31/2022 | 26426 | 26991 | 14326 | 17632 |
| 04/30/2022 | 20953 | 21400 | 13278 | 16037 |
| 05/31/2022 | 22233 | 22712 | 13422 | 15997 |
| 06/30/2022 | 20384 | 20819 | 12174 | 14678 |
| 07/31/2022 | 24945 | 25485 | 13464 | 16052 |
| 08/31/2022 | 26416 | 26989 | 12994 | 15436 |
| 09/30/2022 | 23283 | 23784 | 11773 | 14001 |
| 10/31/2022 | 22981 | 23474 | 13076 | 15114 |
| 11/30/2022 | 23426 | 23935 | 13799 | 15923 |
| 12/31/2022 | 19242 | 19661 | 12986 | 14993 |
| 01/31/2023 | 22317 | 22799 | 14195 | 16003 |
| 02/28/2023 | 20377 | 20809 | 13963 | 15617 |
| 03/31/2023 | 19657 | 20067 | 13432 | 16114 |
| 04/30/2023 | 17977 | 18346 | 13247 | 16305 |
| 05/31/2023 | 18340 | 18712 | 12881 | 16396 |
| 06/30/2023 | 19125 | 19513 | 14024 | 17504 |
| 07/31/2023 | 20396 | 20807 | 14662 | 18109 |
| 08/31/2023 | 17638 | 17990 | 14182 | 17789 |
| 09/30/2023 | 15584 | 15897 | 13405 | 16955 |
| 10/31/2023 | 12582 | 12815 | 12673 | 16541 |
| 11/30/2023 | 13326 | 13574 | 13742 | 18095 |
| 12/31/2023 | 15331 | 15624 | 15110 | 18991 |
| 01/31/2024 | 12802 | 13045 | 14745 | 19252 |
| 02/29/2024 | 12802 | 13041 | 15503 | 20299 |
| 03/31/2024 | 12678 | 12913 | 16261 | 20952 |
| 04/30/2024 | 11494 | 11660 | 15302 | 20049 |
| 05/31/2024 | 13489 | 13685 | 16004 | 20995 |
| 06/30/2024 | 12075 | 12250 | 15718 | 21697 |
| 07/31/2024 | 12898 | 13082 | 16873 | 22003 |
| 08/31/2024 | 12401 | 12585 | 16787 | 22509 |
| 09/30/2024 | 12643 | 12834 | 16965 | 22986 |
| 10/31/2024 | 11955 | 12138 | 16741 | 22811 |
| 11/30/2024 | 12084 | 12275 | 18327 | 24268 |
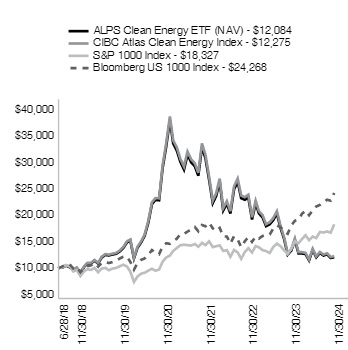
| ALPS Clean Energy ETF - NAV | -9.32% | -1.71% | 2.99% |
| CIBC Atlas Clean Energy Index | -9.57% | -1.64% | 3.24% |
| S&P 1000 Index | 33.37% | 12.08% | 9.89% |
| Bloomberg US 1000 Index‡ | 34.11% | 15.45% | 14.80% |
For the most current month-end performance data please visit www.alpsfunds.com or call 1-866-759-5679.
| |
‡ | This index represents a broad measure of market performance and has been added to comply with new regulatory requirements. |
| Net Assets | $127,910,880 |
| Number of Portfolio Holdings | 37 |
| Portfolio Turnover Rate | 32% |
| Total Advisory Fees Paid | $1,185,832 |
| Tesla, Inc. | 7.77% |
| Albemarle Corp. | 6.64% |
| Arcadium Lithium PLC | 6.32% |
| Itron, Inc. | 5.80% |
| Ormat Technologies, Inc. | 5.32% |
| Darling Ingredients, Inc. | 5.23% |
| NEXTracker, Inc. | |
| Brookfield Renewable Partners LP | 5.07% |
| First Solar, Inc. | 4.53% |
| Rivian Automotive, Inc. | 4.38% |
| Total % of Top 10 Holdings | 56.29% |
| Electric Vehicles | 31.44% |
| Solar | 22.95% |
| Wind | 12.77% |
| Hydro/Geothermal | 10.39% |
| Bioenergy | 10.24% |
| Energy Management & Storage | 9.36% |
| Fuel Cell/Hydrogen | 2.83% |
| Money Market Fund | 0.02% |
| Total | 100.00% |
| |
* | % of Total Investments (excluding investments purchased with collateral from securities loaned). |
Holdings are subject to change.
If you wish to view additional information about the Fund, including but not limited to the Fund's prospectus, financial information, holdings, and proxy voting information, please visit https://www.alpsfunds.com/exchange-traded-funds/aces.
The Funds send only one report to a household if more than one account has the same address. If you do not want this policy to apply to you, or if you wish to receive a copy of this document at a new address, contact 1-866-759-5679.
ALPS Disruptive Technologies ETF | ALPS ETF TRUST |
NYSE ARCA: DTEC | |
This annual shareholder report contains important information about ALPS Disruptive Technologies ETF (the "Fund" or "DTEC") for the period of December 1, 2023 to November 30, 2024 (the "Period"). You can find additional information about the Fund at https://www.alpsfunds.com/exchange-traded-funds/dtec. You can also request this information by contacting us at 1-866-759-5679.
| ALPS Disruptive Technologies ETF | $55 | 0.50% |
Performance Overview
The ALPS Disruptive Technologies ETF (DTEC), for the trailing twelve-month period ended November 30, 2024, generated a NAV total return of 21.70%. The Fund underperformed the Morningstar Global Markets Index, which returned 25.55% for the same period.
Top contributors to relative performance:
Overweight allocation to the Information Technology sector.
Security selection of names within the Health Care sector, which overperformed.
Surgical equipment manufacturer, PROCEPT BioRobotics Corp. (PRCT US, 1.08% weight*), provided the best individual contribution to DTEC's performance over the 1-year period (+1.17%).
Top detractors from relative performance:
Overweight allocation to stocks domiciled in Western Europe, which underperformed.
Security selection of names within the Information Technology sector, which underperformed.
Solar power equipment company, SolarEdge Technologies Inc. (SEDG US, 0.79% weight*), provided the worst individual contribution to DTEC's performance over the 1-year period (-1.40%).
*Weights as of 11/30/2024, Bloomberg
The Fund's past performance is not a good predictor of the Fund's future performance. The chart and the table below do not reflect the deduction of taxes that a shareholder would pay on Fund distributions or sale of Fund shares.
| 12/28/2017 | 10000 | 10000 | 10000 |
| 12/31/2017 | 9952 | 9955 | 9993 |
| 01/31/2018 | 10662 | 10683 | 10530 |
| 02/28/2018 | 10415 | 10433 | 10093 |
| 03/31/2018 | 10522 | 10554 | 9895 |
| 04/30/2018 | 10654 | 10679 | 9995 |
| 05/31/2018 | 11005 | 11029 | 10020 |
| 06/30/2018 | 11037 | 11064 | 9957 |
| 07/31/2018 | 11188 | 11221 | 10238 |
| 08/31/2018 | 11958 | 12007 | 10332 |
| 09/30/2018 | 11798 | 11841 | 10358 |
| 10/31/2018 | 10235 | 10272 | 9557 |
| 11/30/2018 | 10447 | 10483 | 9702 |
| 12/31/2018 | 9625 | 9639 | 9011 |
| 01/31/2019 | 10837 | 10872 | 9735 |
| 02/28/2019 | 11430 | 11462 | 9999 |
| 03/31/2019 | 11590 | 11621 | 10104 |
| 04/30/2019 | 12166 | 12191 | 10437 |
| 05/31/2019 | 11354 | 11373 | 9825 |
| 06/30/2019 | 12174 | 12211 | 10451 |
| 07/31/2019 | 12150 | 12199 | 10477 |
| 08/31/2019 | 11602 | 11640 | 10223 |
| 09/30/2019 | 11594 | 11636 | 10437 |
| 10/31/2019 | 11954 | 11995 | 10730 |
| 11/30/2019 | 12754 | 12800 | 10995 |
| 12/31/2019 | 12908 | 12960 | 11376 |
| 01/31/2020 | 13218 | 13269 | 11232 |
| 02/29/2020 | 12302 | 12328 | 10313 |
| 03/31/2020 | 10679 | 10705 | 8848 |
| 04/30/2020 | 12234 | 12294 | 9810 |
| 05/31/2020 | 13519 | 13589 | 10268 |
| 06/30/2020 | 13873 | 13945 | 10584 |
| 07/31/2020 | 14913 | 15018 | 11124 |
| 08/31/2020 | 15652 | 15763 | 11799 |
| 09/30/2020 | 15444 | 15554 | 11432 |
| 10/31/2020 | 15114 | 15222 | 11182 |
| 11/30/2020 | 17272 | 17410 | 12592 |
| 12/31/2020 | 18621 | 18770 | 13204 |
| 01/31/2021 | 18762 | 18922 | 13163 |
| 02/28/2021 | 18629 | 18798 | 13504 |
| 03/31/2021 | 18081 | 18245 | 13847 |
| 04/30/2021 | 18778 | 18950 | 14446 |
| 05/31/2021 | 18629 | 18790 | 14659 |
| 06/30/2021 | 19585 | 19772 | 14822 |
| 07/31/2021 | 19940 | 20137 | 14896 |
| 08/31/2021 | 20605 | 20820 | 15268 |
| 09/30/2021 | 19528 | 19738 | 14664 |
| 10/31/2021 | 20815 | 21051 | 15368 |
| 11/30/2021 | 19448 | 19636 | 14954 |
| 12/31/2021 | 19562 | 19782 | 15554 |
| 01/31/2022 | 17456 | 17664 | 14744 |
| 02/28/2022 | 16926 | 17150 | 14414 |
| 03/31/2022 | 17290 | 17515 | 14706 |
| 04/30/2022 | 15184 | 15373 | 13547 |
| 05/31/2022 | 14760 | 14942 | 13551 |
| 06/30/2022 | 13446 | 13611 | 12382 |
| 07/31/2022 | 14877 | 15067 | 13252 |
| 08/31/2022 | 14169 | 14366 | 12785 |
| 09/30/2022 | 12759 | 12938 | 11554 |
| 10/31/2022 | 13547 | 13738 | 12249 |
| 11/30/2022 | 14117 | 14287 | 13196 |
| 12/31/2022 | 13481 | 13673 | 12726 |
| 01/31/2023 | 14893 | 15121 | 13619 |
| 02/28/2023 | 14537 | 14771 | 13240 |
| 03/31/2023 | 15058 | 15297 | 13575 |
| 04/30/2023 | 14674 | 14914 | 13760 |
| 05/31/2023 | 15167 | 15408 | 13593 |
| 06/30/2023 | 15883 | 16149 | 14379 |
| 07/31/2023 | 16381 | 16669 | 14920 |
| 08/31/2023 | 15301 | 15565 | 14501 |
| 09/30/2023 | 14355 | 14617 | 13905 |
| 10/31/2023 | 13316 | 13555 | 13451 |
| 11/30/2023 | 15552 | 15846 | 14690 |
| 12/31/2023 | 16834 | 17138 | 15441 |
| 01/31/2024 | 16376 | 16693 | 15496 |
| 02/29/2024 | 17049 | 17380 | 16142 |
| 03/31/2024 | 17142 | 17479 | 16648 |
| 04/30/2024 | 16299 | 16616 | 16096 |
| 05/31/2024 | 16688 | 17008 | 16737 |
| 06/30/2024 | 16729 | 17061 | 17053 |
| 07/31/2024 | 17122 | 17460 | 17383 |
| 08/31/2024 | 17483 | 17845 | 17794 |
| 09/30/2024 | 18010 | 18399 | 18206 |
| 10/31/2024 | 17609 | 17976 | 17777 |
| 11/30/2024 | 18926 | 19330 | 18443 |
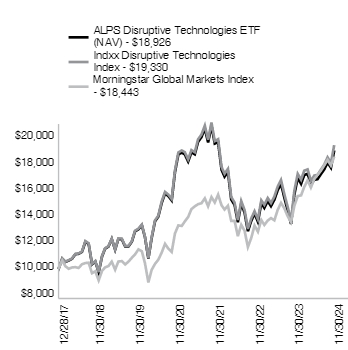
| ALPS Disruptive Technologies ETF - NAV | 21.70%* | 8.21% | 9.65% |
| Indxx Disruptive Technologies Index | 21.98% | 8.59% | 9.99% |
| Morningstar Global Markets Index‡ | 25.55% | 10.90% | 9.24% |
For the most current month-end performance data please visit www.alpsfunds.com or call 1-866-759-5679.
| |
* | Excludes adjustments in accordance with accounting principles generally accepted in the United States of America and as such, the net asset value and total return for shareholder transactions reported to the market may differ from the net asset value for financial reporting purposes. |
‡ | This index represents a broad measure of market performance for purposes of new regulatory requirements. |
| Net Assets | $93,353,399 |
| Number of Portfolio Holdings | 100 |
| Portfolio Turnover Rate | 35% |
| Total Advisory Fees Paid | $487,040 |
| SoundHound AI, Inc. | 1.73% |
| Goldwind Science & Technology Co., Ltd. | 1.49% |
| Snowflake, Inc. | 1.40% |
| Tesla, Inc. | 1.36% |
| SenseTime Group, Inc. | 1.30% |
| Proto Labs, Inc. | 1.28% |
| Datadog, Inc. | 1.26% |
| Block, Inc. | 1.26% |
| Stratasys, Ltd. | 1.23% |
| Crowdstrike Holdings, Inc. | 1.22% |
| Total % of Top 10 Holdings | 13.53% |
| Cloud Computing | 10.71% |
| Robotics & Artificial Intelligence | 10.59% |
| Cybersecurity | 10.40% |
| 3D Printing | 10.20% |
| Mobile Payments | 9.94% |
| Clean Energy & Smart Grid | 9.94% |
| FinTech | 9.76% |
| Healthcare Innovation | 9.51% |
| Data & Analytics | 9.41% |
| Internet of Things | 9.37% |
| Money Market Fund | 0.17% |
| Total | 100.00% |
| |
* | % of Total Investments (excluding investments purchased with collateral from securities loaned). |
Holdings are subject to change.
If you wish to view additional information about the Fund, including but not limited to the Fund's prospectus, financial information, holdings, and proxy voting information, please visit https://www.alpsfunds.com/exchange-traded-funds/dtec.
The Funds send only one report to a household if more than one account has the same address. If you do not want this policy to apply to you, or if you wish to receive a copy of this document at a new address, contact 1-866-759-5679.
ALPS Medical Breakthroughs ETF | ALPS ETF TRUST |
NYSE ARCA: SBIO | |
This annual shareholder report contains important information about ALPS Medical Breakthroughs ETF (the "Fund" or "SBIO") for the period of December 1, 2023 to November 30, 2024 (the "Period"). You can find additional information about the Fund at https://www.alpsfunds.com/exchange-traded-funds/sbio. You can also request this information by contacting us at 1-866-759-5679.
| ALPS Medical Breakthroughs ETF | $62 | 0.50% |
Performance Overview
The ALPS Medical Breakthroughs ETF (SBIO), for the trailing twelve-month period ended November 30, 2024, generated a NAV total return of 47.50%. The fund outperformed the NASDAQ Biotechnology Index, which returned 20.87% for the same period.
Top contributors to relative performance:
Overweight allocation to mid-cap biotechnology stocks, which overperformed.
Security selection of names within the Health Care sector, which overperformed.
Biopharmaceutical company, Summit Therapeutics, Inc. (SMMT US, portfolio deletion during June rebalance), provided the best individual contribution to SBIO's performance over the 1-year period (+3.62%).
Top detractors from relative performance:
Overweight allocation to small-cap biotechnology stocks, which underperformed.
Gene-therapy-focused biotechnology company, Intellia Therapeutics, Inc. (NTLA US, 1.01% weight*), provided the worst individual contribution to SBIO's performance over the 1-year period (-1.26%).
*Weights as of 11/30/2024, Bloomberg
The Fund's past performance is not a good predictor of the Fund's future performance. The chart and the table below do not reflect the deduction of taxes that a shareholder would pay on Fund distributions or sale of Fund shares.
| 12/30/2014 | 10000 | 10000 | 10000 | 10000 |
| 12/31/2014 | 10057 | 10058 | 9978 | 9900 |
| 01/31/2015 | 10856 | 10863 | 10566 | 9630 |
| 02/28/2015 | 11822 | 11831 | 11088 | 10184 |
| 03/31/2015 | 12114 | 12130 | 11302 | 10058 |
| 04/30/2015 | 11494 | 11512 | 10992 | 10124 |
| 05/31/2015 | 13746 | 13772 | 12012 | 10262 |
| 06/30/2015 | 14399 | 14434 | 12153 | 10067 |
| 07/31/2015 | 15369 | 15413 | 12588 | 10262 |
| 08/31/2015 | 13389 | 13433 | 11261 | 9646 |
| 09/30/2015 | 11327 | 11371 | 9974 | 9382 |
| 10/31/2015 | 12070 | 12120 | 10733 | 10136 |
| 11/30/2015 | 13080 | 13144 | 11014 | 10171 |
| 12/31/2015 | 12881 | 12949 | 11152 | 9995 |
| 01/31/2016 | 9261 | 9315 | 8809 | 9453 |
| 02/29/2016 | 8535 | 8588 | 8385 | 9446 |
| 03/31/2016 | 8912 | 8970 | 8600 | 10099 |
| 04/30/2016 | 9541 | 9608 | 8847 | 10153 |
| 05/31/2016 | 10296 | 10374 | 9226 | 10342 |
| 06/30/2016 | 9213 | 9286 | 8504 | 10366 |
| 07/31/2016 | 10187 | 10272 | 9561 | 10763 |
| 08/31/2016 | 9789 | 9873 | 9281 | 10777 |
| 09/30/2016 | 10584 | 10680 | 9566 | 10789 |
| 10/31/2016 | 8868 | 8944 | 8477 | 10576 |
| 11/30/2016 | 9805 | 9894 | 9057 | 10990 |
| 12/31/2016 | 9318 | 9407 | 8771 | 11195 |
| 01/31/2017 | 9517 | 9610 | 9206 | 11422 |
| 02/28/2017 | 10621 | 10725 | 9837 | 11862 |
| 03/31/2017 | 10471 | 10574 | 9722 | 11873 |
| 04/30/2017 | 10804 | 10910 | 9865 | 12001 |
| 05/31/2017 | 9927 | 10026 | 9481 | 12158 |
| 06/30/2017 | 11250 | 11367 | 10292 | 12247 |
| 07/31/2017 | 11514 | 11634 | 10591 | 12488 |
| 08/31/2017 | 12549 | 12682 | 11077 | 12523 |
| 09/30/2017 | 12666 | 12802 | 11090 | 12792 |
| 10/31/2017 | 12301 | 12435 | 10445 | 13089 |
| 11/30/2017 | 12865 | 13010 | 10508 | 13487 |
| 12/31/2017 | 13503 | 13667 | 10669 | 13634 |
| 01/31/2018 | 14717 | 14898 | 11411 | 14389 |
| 02/28/2018 | 14189 | 14368 | 10807 | 13862 |
| 03/31/2018 | 14135 | 14316 | 10675 | 13551 |
| 04/30/2018 | 14003 | 14188 | 10359 | 13593 |
| 05/31/2018 | 15774 | 15988 | 10850 | 13942 |
| 06/30/2018 | 15353 | 15568 | 11004 | 14032 |
| 07/31/2018 | 15481 | 15702 | 11682 | 14515 |
| 08/31/2018 | 15968 | 16197 | 12251 | 15000 |
| 09/30/2018 | 16245 | 16442 | 12236 | 15052 |
| 10/31/2018 | 13908 | 14075 | 10450 | 13976 |
| 11/30/2018 | 13871 | 14042 | 10948 | 14275 |
| 12/31/2018 | 11990 | 12158 | 9723 | 12969 |
| 01/31/2019 | 13613 | 13805 | 11026 | 14066 |
| 02/28/2019 | 14632 | 14843 | 11326 | 14549 |
| 03/31/2019 | 15363 | 15589 | 11235 | 14794 |
| 04/30/2019 | 14505 | 14722 | 10693 | 15391 |
| 05/31/2019 | 13728 | 13936 | 10048 | 14423 |
| 06/30/2019 | 15371 | 15615 | 10982 | 15428 |
| 07/31/2019 | 14989 | 15230 | 10644 | 15676 |
| 08/31/2019 | 14632 | 14865 | 10370 | 15397 |
| 09/30/2019 | 13422 | 13639 | 10035 | 15656 |
| 10/31/2019 | 14802 | 15021 | 10811 | 15983 |
| 11/30/2019 | 16782 | 17037 | 12054 | 16586 |
| 12/31/2019 | 17969 | 18249 | 12165 | 17056 |
| 01/31/2020 | 16898 | 17167 | 11483 | 17085 |
| 02/29/2020 | 16405 | 16670 | 11525 | 15692 |
| 03/31/2020 | 13537 | 13764 | 10915 | 13624 |
| 04/30/2020 | 16210 | 16488 | 12555 | 15424 |
| 05/31/2020 | 17621 | 17922 | 13623 | 16252 |
| 06/30/2020 | 17769 | 18080 | 13852 | 16614 |
| 07/31/2020 | 16983 | 17288 | 13616 | 17564 |
| 08/31/2020 | 17587 | 17906 | 13746 | 18851 |
| 09/30/2020 | 17485 | 17807 | 13738 | 18168 |
| 10/31/2020 | 18547 | 18895 | 13226 | 17742 |
| 11/30/2020 | 20820 | 21215 | 14707 | 19829 |
| 12/31/2020 | 21780 | 22204 | 15379 | 20659 |
| 01/31/2021 | 23807 | 24152 | 16341 | 20504 |
| 02/28/2021 | 23476 | 23941 | 15969 | 21111 |
| 03/31/2021 | 21334 | 21769 | 15295 | 21885 |
| 04/30/2021 | 21296 | 21731 | 15750 | 23056 |
| 05/31/2021 | 19826 | 20238 | 15446 | 23141 |
| 06/30/2021 | 20812 | 21257 | 16694 | 23762 |
| 07/31/2021 | 18742 | 19148 | 16661 | 24269 |
| 08/31/2021 | 19936 | 20378 | 17355 | 24980 |
| 09/30/2021 | 19358 | 19795 | 16515 | 23840 |
| 10/31/2021 | 19579 | 20021 | 16202 | 25499 |
| 11/30/2021 | 18245 | 18645 | 15574 | 25161 |
| 12/31/2021 | 17961 | 18361 | 15383 | 26137 |
| 01/31/2022 | 14820 | 15158 | 13557 | 24618 |
| 02/28/2022 | 14281 | 14608 | 13022 | 23932 |
| 03/31/2022 | 14319 | 14655 | 13588 | 24719 |
| 04/30/2022 | 12118 | 12404 | 12265 | 22483 |
| 05/31/2022 | 10924 | 11184 | 12123 | 22426 |
| 06/30/2022 | 11770 | 12096 | 12259 | 20577 |
| 07/31/2022 | 12666 | 13024 | 12763 | 22503 |
| 08/31/2022 | 13465 | 13848 | 12641 | 21640 |
| 09/30/2022 | 12789 | 13158 | 12343 | 19629 |
| 10/31/2022 | 13044 | 13428 | 13443 | 21189 |
| 11/30/2022 | 13295 | 13717 | 14244 | 22322 |
| 12/31/2022 | 12955 | 13373 | 13825 | 21019 |
| 01/31/2023 | 13822 | 14271 | 14310 | 22435 |
| 02/28/2023 | 12862 | 13273 | 13390 | 21893 |
| 03/31/2023 | 11579 | 11953 | 13566 | 22591 |
| 04/30/2023 | 12730 | 13141 | 13770 | 22858 |
| 05/31/2023 | 13418 | 13854 | 13414 | 22986 |
| 06/30/2023 | 13423 | 13867 | 13437 | 24539 |
| 07/31/2023 | 13618 | 14076 | 13612 | 25387 |
| 08/31/2023 | 12632 | 13053 | 13579 | 24939 |
| 09/30/2023 | 11587 | 11971 | 13057 | 23770 |
| 10/31/2023 | 10414 | 10764 | 12201 | 23189 |
| 11/30/2023 | 11200 | 11577 | 12808 | 25367 |
| 12/31/2023 | 14013 | 14495 | 14461 | 26624 |
| 01/31/2024 | 14102 | 14593 | 14508 | 26990 |
| 02/29/2024 | 15712 | 16253 | 14671 | 28458 |
| 03/31/2024 | 15256 | 15788 | 14689 | 29373 |
| 04/30/2024 | 13966 | 14453 | 13801 | 28107 |
| 05/31/2024 | 14192 | 14697 | 14615 | 29433 |
| 06/30/2024 | 14303 | 14815 | 15107 | 30417 |
| 07/31/2024 | 15938 | 16516 | 16099 | 30847 |
| 08/31/2024 | 15933 | 16505 | 16243 | 31555 |
| 09/30/2024 | 15989 | 16568 | 15876 | 32225 |
| 10/31/2024 | 16044 | 16632 | 15484 | 31979 |
| 11/30/2024 | 16521 | 17134 | 15480 | 34021 |
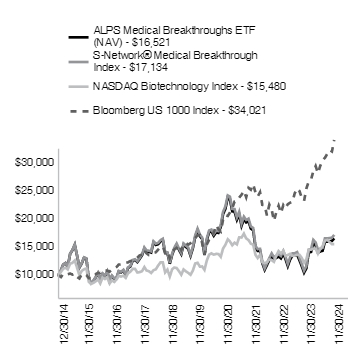
| ALPS Medical Breakthroughs ETF - NAV | 47.50% | -0.31% | 5.19% |
| S-Network® Medical Breakthrough Index | 48.00% | 0.11% | 5.58% |
| NASDAQ Biotechnology Index | 20.87% | 5.13% | 4.50% |
| Bloomberg US 1000 Index‡ | 34.11% | 15.45% | 13.14% |
For the most current month-end performance data please visit www.alpsfunds.com or call 1-866-759-5679.
| |
‡ | This index represents a broad measure of market performance and has been added to comply with new regulatory requirements. |
| Net Assets | $123,195,761 |
| Number of Portfolio Holdings | 99 |
| Portfolio Turnover Rate | 72% |
| Total Advisory Fees Paid | $546,749 |
| Corcept Therapeutics, Inc. | 3.88% |
| Krystal Biotech, Inc. | 3.73% |
| Avidity Biosciences, Inc. | 3.20% |
| Alkermes PLC | 3.09% |
| Arcellx, Inc. | 3.05% |
| Crinetics Pharmaceuticals, Inc. | 2.93% |
| Immunovant, Inc. | 2.69% |
| Denali Therapeutics, Inc. | 2.24% |
| Agios Pharmaceuticals, Inc. | 2.16% |
| PTC Therapeutics, Inc. | 2.16% |
| Total % of Top 10 Holdings | 29.13% |
| Biotechnology | 83.72% |
| Pharmaceuticals | 15.93% |
| Health Care Providers & Services | 0.35% |
| Total | 100.00% |
| |
* | % of Total Investments (excluding investments purchased with collateral from securities loaned). |
Holdings are subject to change.
If you wish to view additional information about the Fund, including but not limited to the Fund's prospectus, financial information, holdings, and proxy voting information, please visit https://www.alpsfunds.com/exchange-traded-funds/sbio.
The Funds send only one report to a household if more than one account has the same address. If you do not want this policy to apply to you, or if you wish to receive a copy of this document at a new address, contact 1-866-759-5679.
ALPS Sector Dividend Dogs ETF | ALPS ETF TRUST |
NYSE ARCA: SDOG | |
This annual shareholder report contains important information about ALPS Sector Dividend Dogs ETF (the "Fund" or "SDOG") for the period of December 1, 2023 to November 30, 2024 (the "Period"). You can find additional information about the Fund at https://www.alpsfunds.com/exchange-traded-funds/sdog. You can also request this information by contacting us at 1-866-759-5679.
| ALPS Sector Dividend Dogs ETF | $42 | 0.36% |
Performance Overview
The ALPS Sector Dividend Dogs ETF (SDOG), for the twelve-month period ended November 30, 2024, generated a NAV total return of 30.83%. The Fund underperformed the S&P 500® Index, which returned 33.89% for the same period.
Attribution
Top contributors to relative performance:
Overweight allocation to the Health care sector.
Security selection of dividend-paying stocks within the Energy sector, which outperformed.
Fiber optic company, Corning Inc. (GLW, 2.17% weight*), provided the best individual contribution to SDOG's performance over the 1-year period (+1.38%).
Top detractors from relative performance:
Underweight allocation to the Information Technology sector.
Security selection of dividend-paying stocks within the Consumer Staples sector, which underperformed.
Retail drugstore operator, Walgreen Boots Alliance Inc. (WBA, 1.85% weight), provided the worst individual contribution to SDOG's performance over the 1-year period (-1.21%).
*Weights as of 11/30/2024, Bloomberg
The Fund's past performance is not a good predictor of the Fund's future performance. The chart and the table below do not reflect the deduction of taxes that a shareholder would pay on Fund distributions or sale of Fund shares.
| 11/30/2014 | 10000 | 10000 | 10000 |
| 12/31/2014 | 9894 | 9900 | 9975 |
| 01/31/2015 | 9564 | 9570 | 9675 |
| 02/28/2015 | 10001 | 10012 | 10231 |
| 03/31/2015 | 9725 | 9738 | 10070 |
| 04/30/2015 | 10129 | 10147 | 10166 |
| 05/31/2015 | 10043 | 10061 | 10297 |
| 06/30/2015 | 9695 | 9715 | 10098 |
| 07/31/2015 | 9647 | 9675 | 10309 |
| 08/31/2015 | 9319 | 9346 | 9687 |
| 09/30/2015 | 9046 | 9072 | 9447 |
| 10/31/2015 | 9802 | 9836 | 10244 |
| 11/30/2015 | 9679 | 9717 | 10275 |
| 12/31/2015 | 9578 | 9620 | 10113 |
| 01/31/2016 | 9182 | 9223 | 9611 |
| 02/29/2016 | 9691 | 9742 | 9598 |
| 03/31/2016 | 10579 | 10644 | 10249 |
| 04/30/2016 | 10731 | 10803 | 10289 |
| 05/31/2016 | 10824 | 10900 | 10474 |
| 06/30/2016 | 10933 | 11014 | 10501 |
| 07/31/2016 | 11487 | 11577 | 10888 |
| 08/31/2016 | 11391 | 11485 | 10903 |
| 09/30/2016 | 11495 | 11596 | 10905 |
| 10/31/2016 | 11111 | 11209 | 10706 |
| 11/30/2016 | 11697 | 11808 | 11103 |
| 12/31/2016 | 11720 | 11837 | 11322 |
| 01/31/2017 | 11904 | 12025 | 11537 |
| 02/28/2017 | 12230 | 12360 | 11995 |
| 03/31/2017 | 12077 | 12209 | 12009 |
| 04/30/2017 | 12004 | 12140 | 12132 |
| 05/31/2017 | 11914 | 12052 | 12303 |
| 06/30/2017 | 12113 | 12260 | 12380 |
| 07/31/2017 | 12226 | 12379 | 12635 |
| 08/31/2017 | 12096 | 12250 | 12673 |
| 09/30/2017 | 12612 | 12779 | 12935 |
| 10/31/2017 | 12640 | 12814 | 13237 |
| 11/30/2017 | 13052 | 13239 | 13642 |
| 12/31/2017 | 13204 | 13397 | 13794 |
| 01/31/2018 | 13879 | 14088 | 14584 |
| 02/28/2018 | 13089 | 13289 | 14046 |
| 03/31/2018 | 12718 | 12917 | 13689 |
| 04/30/2018 | 12823 | 13029 | 13742 |
| 05/31/2018 | 12948 | 13160 | 14073 |
| 06/30/2018 | 13069 | 13288 | 14160 |
| 07/31/2018 | 13442 | 13673 | 14686 |
| 08/31/2018 | 13554 | 13792 | 15165 |
| 09/30/2018 | 13590 | 13833 | 15251 |
| 10/31/2018 | 12917 | 13152 | 14209 |
| 11/30/2018 | 13119 | 13360 | 14498 |
| 12/31/2018 | 11713 | 11932 | 13189 |
| 01/31/2019 | 12742 | 12988 | 14246 |
| 02/28/2019 | 12916 | 13169 | 14704 |
| 03/31/2019 | 12953 | 13211 | 14989 |
| 04/30/2019 | 13361 | 13634 | 15596 |
| 05/31/2019 | 12201 | 12452 | 14605 |
| 06/30/2019 | 13247 | 13530 | 15635 |
| 07/31/2019 | 13338 | 13627 | 15859 |
| 08/31/2019 | 12750 | 13029 | 15608 |
| 09/30/2019 | 13480 | 13781 | 15900 |
| 10/31/2019 | 13616 | 13924 | 16245 |
| 11/30/2019 | 14071 | 14395 | 16834 |
| 12/31/2019 | 14535 | 14882 | 17342 |
| 01/31/2020 | 13924 | 14260 | 17335 |
| 02/29/2020 | 12547 | 12845 | 15908 |
| 03/31/2020 | 9845 | 10080 | 13944 |
| 04/30/2020 | 11084 | 11356 | 15731 |
| 05/31/2020 | 11317 | 11600 | 16480 |
| 06/30/2020 | 11575 | 11866 | 16808 |
| 07/31/2020 | 11877 | 12179 | 17756 |
| 08/31/2020 | 12380 | 12690 | 19032 |
| 09/30/2020 | 12154 | 12462 | 18309 |
| 10/31/2020 | 12205 | 12521 | 17822 |
| 11/30/2020 | 14033 | 14406 | 19773 |
| 12/31/2020 | 14480 | 14876 | 20533 |
| 01/31/2021 | 14574 | 14977 | 20326 |
| 02/28/2021 | 15589 | 16027 | 20886 |
| 03/31/2021 | 16816 | 17305 | 21801 |
| 04/30/2021 | 17386 | 17898 | 22964 |
| 05/31/2021 | 17847 | 18379 | 23125 |
| 06/30/2021 | 17474 | 18001 | 23665 |
| 07/31/2021 | 17187 | 17710 | 24227 |
| 08/31/2021 | 17481 | 18017 | 24963 |
| 09/30/2021 | 17007 | 17531 | 23802 |
| 10/31/2021 | 17360 | 17900 | 25470 |
| 11/30/2021 | 16807 | 17335 | 25294 |
| 12/31/2021 | 18013 | 18596 | 26427 |
| 01/31/2022 | 18265 | 18862 | 25060 |
| 02/28/2022 | 18239 | 18843 | 24309 |
| 03/31/2022 | 18684 | 19310 | 25212 |
| 04/30/2022 | 18314 | 18928 | 23013 |
| 05/31/2022 | 18993 | 19641 | 23056 |
| 06/30/2022 | 17194 | 17774 | 21152 |
| 07/31/2022 | 17835 | 18446 | 23103 |
| 08/31/2022 | 17403 | 18001 | 22161 |
| 09/30/2022 | 15632 | 16164 | 20120 |
| 10/31/2022 | 17370 | 17967 | 21749 |
| 11/30/2022 | 18558 | 19208 | 22964 |
| 12/31/2022 | 17990 | 18624 | 21641 |
| 01/31/2023 | 19291 | 19983 | 23001 |
| 02/28/2023 | 18277 | 18936 | 22440 |
| 03/31/2023 | 18107 | 18762 | 23263 |
| 04/30/2023 | 18188 | 18853 | 23626 |
| 05/31/2023 | 16707 | 17317 | 23729 |
| 06/30/2023 | 17847 | 18512 | 25297 |
| 07/31/2023 | 18544 | 19239 | 26110 |
| 08/31/2023 | 18000 | 18663 | 25694 |
| 09/30/2023 | 17009 | 17635 | 24469 |
| 10/31/2023 | 16315 | 16920 | 23954 |
| 11/30/2023 | 17617 | 18265 | 26142 |
| 12/31/2023 | 18720 | 19428 | 27330 |
| 01/31/2024 | 18589 | 19296 | 27789 |
| 02/29/2024 | 18852 | 19575 | 29273 |
| 03/31/2024 | 19932 | 20706 | 30215 |
| 04/30/2024 | 19201 | 19955 | 28981 |
| 05/31/2024 | 20002 | 20796 | 30418 |
| 06/30/2024 | 19725 | 20512 | 31509 |
| 07/31/2024 | 21229 | 22088 | 31893 |
| 08/31/2024 | 21845 | 22735 | 32666 |
| 09/30/2024 | 22222 | 23139 | 33364 |
| 10/31/2024 | 22094 | 23015 | 33061 |
| 11/30/2024 | 23047 | 24018 | 35002 |
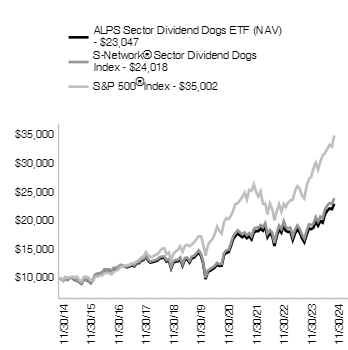
| ALPS Sector Dividend Dogs ETF - NAV | 30.83% | 10.37% | 8.71% |
| S-Network® Sector Dividend Dogs Index | 31.50% | 10.78% | 9.16% |
| S&P 500® Index‡ | 33.89% | 15.77% | 13.35% |
For the most current month-end performance data please visit www.alpsfunds.com or call 1-866-759-5679.
| |
‡ | This index represents a broad measure of market performance for purposes of new regulatory requirements. |
| Net Assets | $1,279,469,007 |
| Number of Portfolio Holdings | 50 |
| Portfolio Turnover Rate | 52% |
| Total Advisory Fees Paid | $4,199,624 |
If you wish to view additional information about the Fund, including but not limited to the Fund's prospectus, financial information, holdings, and proxy voting information, please visit https://www.alpsfunds.com/exchange-traded-funds/sdog.
The Funds send only one report to a household if more than one account has the same address. If you do not want this policy to apply to you, or if you wish to receive a copy of this document at a new address, contact 1-866-759-5679.
ALPS International Sector Dividend Dogs ETF | ALPS ETF TRUST |
NYSE ARCA: IDOG | |
This annual shareholder report contains important information about ALPS International Sector Dividend Dogs ETF (the "Fund" or "IDOG") for the period of December 1, 2023 to November 30, 2024 (the "Period"). You can find additional information about the Fund at https://www.alpsfunds.com/exchange-traded-funds/idog. You can also request this information by contacting us at 1-866-759-5679.
| ALPS International Sector Dividend Dogs ETF | $52 | 0.50% |
Performance Overview
The ALPS International Sector Dividend Dogs ETF (IDOG), for the twelve-month period ended November 30, 2024, generated a NAV total return of 7.86%. The Fund underperformed the Morningstar Developed Markets ex-North America Index, which returned 11.62% for the same period.
Attribution
Top contributors to relative performance:
Overweight allocation to stocks domiciled in Western Europe.
Security selection of dividend-paying stocks within the Consumer Staples sector, which outperformed.
Banking and financial services company, Natwest Group PLC. (NWG LN, 2.44% weight*), provided the best individual contribution to IDOG's performance over the 1-year period (+1.50%).
Top detractors from relative performance:
Underweight allocation to Asia Pacific stocks.
Security selection of dividend-paying stocks within the Industrials sector, which underperformed.
Health care product manufacturer, Bayer AG (BAYN GR, 1.44% weight*), provided the worst individual contribution to IDOG's performance over the 1-year period (-0.97%).
*Weights as of 11/30/2024, Bloomberg
The Fund's past performance is not a good predictor of the Fund's future performance. The chart and the table below do not reflect the deduction of taxes that a shareholder would pay on Fund distributions or sale of Fund shares.
| 11/30/2014 | 10000 | 10000 | 10000 |
| 12/31/2014 | 9654 | 9674 | 9682 |
| 01/31/2015 | 9709 | 9732 | 9725 |
| 02/28/2015 | 10220 | 10253 | 10307 |
| 03/31/2015 | 9974 | 10010 | 10156 |
| 04/30/2015 | 10441 | 10480 | 10576 |
| 05/31/2015 | 10167 | 10203 | 10523 |
| 06/30/2015 | 9780 | 9808 | 10244 |
| 07/31/2015 | 9919 | 9949 | 10481 |
| 08/31/2015 | 9293 | 9322 | 9754 |
| 09/30/2015 | 8847 | 8878 | 9243 |
| 10/31/2015 | 9391 | 9432 | 9943 |
| 11/30/2015 | 9224 | 9265 | 9808 |
| 12/31/2015 | 9061 | 9104 | 9709 |
| 01/31/2016 | 8544 | 8585 | 9003 |
| 02/29/2016 | 8425 | 8464 | 8854 |
| 03/31/2016 | 9113 | 9164 | 9437 |
| 04/30/2016 | 9379 | 9431 | 9704 |
| 05/31/2016 | 9124 | 9176 | 9639 |
| 06/30/2016 | 9065 | 9125 | 9294 |
| 07/31/2016 | 9442 | 9507 | 9778 |
| 08/31/2016 | 9387 | 9459 | 9772 |
| 09/30/2016 | 9535 | 9611 | 9906 |
| 10/31/2016 | 9282 | 9354 | 9694 |
| 11/30/2016 | 9056 | 9123 | 9489 |
| 12/31/2016 | 9420 | 9511 | 9807 |
| 01/31/2017 | 9551 | 9648 | 10095 |
| 02/28/2017 | 9807 | 9912 | 10251 |
| 03/31/2017 | 10237 | 10356 | 10509 |
| 04/30/2017 | 10273 | 10391 | 10800 |
| 05/31/2017 | 10799 | 10915 | 11199 |
| 06/30/2017 | 10747 | 10862 | 11170 |
| 07/31/2017 | 11077 | 11204 | 11500 |
| 08/31/2017 | 11110 | 11245 | 11504 |
| 09/30/2017 | 11395 | 11531 | 11792 |
| 10/31/2017 | 11592 | 11738 | 11977 |
| 11/30/2017 | 11600 | 11753 | 12109 |
| 12/31/2017 | 11851 | 12019 | 12310 |
| 01/31/2018 | 12202 | 12382 | 12931 |
| 02/28/2018 | 11781 | 11959 | 12370 |
| 03/31/2018 | 11473 | 11657 | 12141 |
| 04/30/2018 | 11899 | 12072 | 12417 |
| 05/31/2018 | 11623 | 11782 | 12159 |
| 06/30/2018 | 11464 | 11631 | 11999 |
| 07/31/2018 | 11748 | 11918 | 12262 |
| 08/31/2018 | 11333 | 11499 | 12050 |
| 09/30/2018 | 11485 | 11658 | 12137 |
| 10/31/2018 | 10755 | 10920 | 11144 |
| 11/30/2018 | 10733 | 10900 | 11131 |
| 12/31/2018 | 10300 | 10476 | 10567 |
| 01/31/2019 | 11104 | 11300 | 11275 |
| 02/28/2019 | 11289 | 11485 | 11548 |
| 03/31/2019 | 11387 | 11588 | 11617 |
| 04/30/2019 | 11548 | 11754 | 11935 |
| 05/31/2019 | 10952 | 11128 | 11358 |
| 06/30/2019 | 11535 | 11737 | 12001 |
| 07/31/2019 | 11371 | 11570 | 11860 |
| 08/31/2019 | 11105 | 11305 | 11558 |
| 09/30/2019 | 11579 | 11800 | 11890 |
| 10/31/2019 | 12007 | 12241 | 12341 |
| 11/30/2019 | 11998 | 12239 | 12498 |
| 12/31/2019 | 12449 | 12714 | 12920 |
| 01/31/2020 | 12013 | 12275 | 12636 |
| 02/29/2020 | 10835 | 11065 | 11477 |
| 03/31/2020 | 9217 | 9411 | 9911 |
| 04/30/2020 | 9713 | 9918 | 10594 |
| 05/31/2020 | 9897 | 10111 | 11104 |
| 06/30/2020 | 10280 | 10511 | 11438 |
| 07/31/2020 | 10303 | 10539 | 11710 |
| 08/31/2020 | 10763 | 11011 | 12363 |
| 09/30/2020 | 10111 | 10345 | 12085 |
| 10/31/2020 | 9732 | 9957 | 11611 |
| 11/30/2020 | 11629 | 11910 | 13368 |
| 12/31/2020 | 12282 | 12608 | 14029 |
| 01/31/2021 | 12324 | 12658 | 13894 |
| 02/28/2021 | 12592 | 12936 | 14205 |
| 03/31/2021 | 12971 | 13333 | 14522 |
| 04/30/2021 | 13199 | 13559 | 14967 |
| 05/31/2021 | 13760 | 14050 | 15424 |
| 06/30/2021 | 13500 | 13871 | 15241 |
| 07/31/2021 | 13544 | 13918 | 15373 |
| 08/31/2021 | 13611 | 13991 | 15688 |
| 09/30/2021 | 13378 | 13748 | 15229 |
| 10/31/2021 | 13442 | 13825 | 15561 |
| 11/30/2021 | 12901 | 13271 | 14821 |
| 12/31/2021 | 13677 | 14074 | 15565 |
| 01/31/2022 | 13971 | 14397 | 14741 |
| 02/28/2022 | 13790 | 14204 | 14484 |
| 03/31/2022 | 13960 | 14376 | 14566 |
| 04/30/2022 | 13504 | 13920 | 13607 |
| 05/31/2022 | 13950 | 14392 | 13677 |
| 06/30/2022 | 12576 | 12953 | 12387 |
| 07/31/2022 | 12651 | 13035 | 13034 |
| 08/31/2022 | 12174 | 12548 | 12425 |
| 09/30/2022 | 10931 | 11254 | 11211 |
| 10/31/2022 | 11683 | 12032 | 11788 |
| 11/30/2022 | 13148 | 13557 | 13097 |
| 12/31/2022 | 13098 | 13526 | 13223 |
| 01/31/2023 | 13989 | 14454 | 14180 |
| 02/28/2023 | 13943 | 14411 | 13871 |
| 03/31/2023 | 14262 | 14742 | 14158 |
| 04/30/2023 | 14755 | 15261 | 14546 |
| 05/31/2023 | 13920 | 14377 | 13943 |
| 06/30/2023 | 14783 | 15281 | 14557 |
| 07/31/2023 | 15361 | 15888 | 15061 |
| 08/31/2023 | 14868 | 15374 | 14500 |
| 09/30/2023 | 14580 | 15081 | 13988 |
| 10/31/2023 | 14088 | 14579 | 13398 |
| 11/30/2023 | 15345 | 15890 | 14651 |
| 12/31/2023 | 16063 | 16659 | 15455 |
| 01/31/2024 | 15756 | 16394 | 15504 |
| 02/29/2024 | 15751 | 16333 | 15751 |
| 03/31/2024 | 16100 | 16712 | 16283 |
| 04/30/2024 | 16035 | 16647 | 15856 |
| 05/31/2024 | 16959 | 17604 | 16466 |
| 06/30/2024 | 16416 | 17044 | 16164 |
| 07/31/2024 | 17010 | 17666 | 16712 |
| 08/31/2024 | 17538 | 18219 | 17219 |
| 09/30/2024 | 17802 | 18502 | 17409 |
| 10/31/2024 | 16972 | 17643 | 16437 |
| 11/30/2024 | 16551 | 17222 | 16354 |
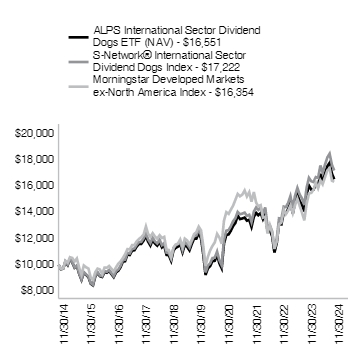
| ALPS International Sector Dividend Dogs ETF - NAV | 7.86% | 6.64% | 5.17% |
| S-Network® International Sector Dividend Dogs Index | 8.38% | 7.07% | 5.59% |
| Morningstar Developed Markets ex-North America Index‡ | 11.62% | 5.53% | 5.04% |
For the most current month-end performance data please visit www.alpsfunds.com or call 1-866-759-5679.
| |
‡ | This index represents a broad measure of market performance for purposes of new regulatory requirements. |
| Net Assets | $287,720,290 |
| Number of Portfolio Holdings | 50 |
| Portfolio Turnover Rate | 55% |
| Total Advisory Fees Paid | $1,398,519 |
| CITIC, Ltd. | 2.46% |
| NatWest Group PLC | 2.44% |
| WPP PLC | 2.36% |
| A P Moller-Maersk A/S | 2.35% |
| Norsk Hydro ASA | 2.33% |
| Imperial Brands PLC | 2.33% |
| Telefonaktiebolaget LM Ericsson | 2.30% |
| Fortescue, Ltd. | 2.21% |
| ACS Actividades de Construccion y Servicios SA | 2.16% |
| Rio Tinto PLC | 2.11% |
| Total % of Top 10 Holdings | 23.05% |
| Materials | 10.70% |
| Industrials | 10.65% |
| Information Technology | 10.54% |
| Consumer Staples | 10.36% |
| Communication Services | 10.06% |
| Financials | 10.00% |
| Utilities | 9.78% |
| Energy | 9.72% |
| Consumer Discretionary | 9.32% |
| Health Care | 8.79% |
| Money Market Fund | 0.08% |
| Total | 100.00% |
| |
* | % of Total Investments (excluding investments purchased with collateral from securities loaned). |
Holdings are subject to change.
If you wish to view additional information about the Fund, including but not limited to the Fund's prospectus, financial information, holdings, and proxy voting information, please visit https://www.alpsfunds.com/exchange-traded-funds/idog.
The Funds send only one report to a household if more than one account has the same address. If you do not want this policy to apply to you, or if you wish to receive a copy of this document at a new address, contact 1-866-759-5679.
ALPS Emerging Sector Dividend Dogs ETF | ALPS ETF TRUST |
NYSE ARCA: EDOG | |
This annual shareholder report contains important information about ALPS Emerging Sector Dividend Dogs ETF (the "Fund" or "EDOG") for the period of December 1, 2023 to November 30, 2024 (the "Period"). You can find additional information about the Fund at https://www.alpsfunds.com/exchange-traded-funds/edog. You can also request this information by contacting us at 1-866-759-5679.
| ALPS Emerging Sector Dividend Dogs ETF | $62 | 0.60% |
Performance Overview
The ALPS Emerging Sector Dividend Dogs ETF (EDOG), for the twelve-month period ended November 30, 2024, generated a NAV total return of 7.55%. The Fund underperformed the Morningstar Emerging Markets Index, which returned 11.89% for the same period.
Top contributors to relative performance:
Overweight allocation to stocks domiciled in South Africa, which outperformed.
Security selection of dividend-paying stocks within the Information Technology sector, which outperformed.
Electronic equipment manufacturer, Delta Electronics Thai PCL. (DELTA TB, 4.89% weight*), provided the best individual contribution to EDOG's performance over the 1-year period (+2.91%).
Top detractors from relative performance:
Overweight allocation to stocks domiciled in Mexico.
Security selection of dividend-paying names within the Materials sector, which underperformed.
Producer of health and wellness products, Orbia Advance Corp. (ORBIA MM, 1.83% weight*), provided the worst individual contribution to EDOG's performance over the 1-year period (-1.59%).
*Weights as of 11/30/2024, Bloomberg
The Fund's past performance is not a good predictor of the Fund's future performance. The chart and the table below do not reflect the deduction of taxes that a shareholder would pay on Fund distributions or sale of Fund shares.
| 11/30/2014 | 10000 | 10000 | 10000 |
| 12/31/2014 | 9273 | 9301 | 9588 |
| 01/31/2015 | 9092 | 9128 | 9692 |
| 02/28/2015 | 9519 | 9561 | 9950 |
| 03/31/2015 | 9156 | 9214 | 9832 |
| 04/30/2015 | 9788 | 9872 | 10584 |
| 05/31/2015 | 9263 | 9309 | 10222 |
| 06/30/2015 | 9127 | 9198 | 9933 |
| 07/31/2015 | 8848 | 8936 | 9241 |
| 08/31/2015 | 8461 | 8541 | 8429 |
| 09/30/2015 | 7950 | 8026 | 8210 |
| 10/31/2015 | 8408 | 8498 | 8789 |
| 11/30/2015 | 8134 | 8229 | 8466 |
| 12/31/2015 | 7718 | 7826 | 8294 |
| 01/31/2016 | 7607 | 7730 | 7752 |
| 02/29/2016 | 7789 | 7904 | 7731 |
| 03/31/2016 | 8831 | 8984 | 8719 |
| 04/30/2016 | 9164 | 9319 | 8809 |
| 05/31/2016 | 8202 | 8344 | 8474 |
| 06/30/2016 | 8654 | 8819 | 8843 |
| 07/31/2016 | 9131 | 9298 | 9285 |
| 08/31/2016 | 8939 | 9112 | 9489 |
| 09/30/2016 | 8989 | 9170 | 9580 |
| 10/31/2016 | 9138 | 9328 | 9596 |
| 11/30/2016 | 8549 | 8727 | 9171 |
| 12/31/2016 | 8860 | 9060 | 9204 |
| 01/31/2017 | 9083 | 9294 | 9674 |
| 02/28/2017 | 9351 | 9571 | 10000 |
| 03/31/2017 | 9454 | 9685 | 10272 |
| 04/30/2017 | 9669 | 9913 | 10452 |
| 05/31/2017 | 9808 | 10057 | 10713 |
| 06/30/2017 | 9727 | 9976 | 10785 |
| 07/31/2017 | 10144 | 10405 | 11332 |
| 08/31/2017 | 10329 | 10607 | 11570 |
| 09/30/2017 | 10207 | 10490 | 11519 |
| 10/31/2017 | 10257 | 10547 | 11924 |
| 11/30/2017 | 10119 | 10406 | 12000 |
| 12/31/2017 | 10618 | 10949 | 12473 |
| 01/31/2018 | 11191 | 11548 | 13422 |
| 02/28/2018 | 10882 | 11227 | 12817 |
| 03/31/2018 | 10422 | 10782 | 12589 |
| 04/30/2018 | 10123 | 10457 | 12604 |
| 05/31/2018 | 9669 | 9989 | 12123 |
| 06/30/2018 | 9130 | 9431 | 11590 |
| 07/31/2018 | 9560 | 9880 | 11853 |
| 08/31/2018 | 9113 | 9417 | 11594 |
| 09/30/2018 | 9151 | 9463 | 11505 |
| 10/31/2018 | 8969 | 9279 | 10527 |
| 11/30/2018 | 9233 | 9560 | 10988 |
| 12/31/2018 | 8942 | 9271 | 10786 |
| 01/31/2019 | 10024 | 10402 | 11670 |
| 02/28/2019 | 9861 | 10236 | 11719 |
| 03/31/2019 | 9580 | 9953 | 11798 |
| 04/30/2019 | 9803 | 10192 | 12019 |
| 05/31/2019 | 9278 | 9645 | 11236 |
| 06/30/2019 | 9890 | 10291 | 11884 |
| 07/31/2019 | 9768 | 10166 | 11715 |
| 08/31/2019 | 9229 | 9605 | 11180 |
| 09/30/2019 | 9416 | 9810 | 11408 |
| 10/31/2019 | 9558 | 9960 | 11901 |
| 11/30/2019 | 9480 | 9887 | 11892 |
| 12/31/2019 | 10077 | 10530 | 12741 |
| 01/31/2020 | 9744 | 10181 | 12147 |
| 02/29/2020 | 8806 | 9205 | 11476 |
| 03/31/2020 | 7066 | 7383 | 9588 |
| 04/30/2020 | 7666 | 8015 | 10518 |
| 05/31/2020 | 8238 | 8618 | 10681 |
| 06/30/2020 | 8531 | 8936 | 11472 |
| 07/31/2020 | 9037 | 9470 | 12447 |
| 08/31/2020 | 9160 | 9605 | 12755 |
| 09/30/2020 | 8773 | 9201 | 12506 |
| 10/31/2020 | 8707 | 9144 | 12772 |
| 11/30/2020 | 9972 | 10469 | 14044 |
| 12/31/2020 | 10875 | 11457 | 15086 |
| 01/31/2021 | 10589 | 11156 | 15462 |
| 02/28/2021 | 10784 | 11358 | 15661 |
| 03/31/2021 | 11130 | 11747 | 15468 |
| 04/30/2021 | 11332 | 11950 | 15930 |
| 05/31/2021 | 11898 | 12670 | 16289 |
| 06/30/2021 | 11899 | 12568 | 16342 |
| 07/31/2021 | 11552 | 12207 | 15329 |
| 08/31/2021 | 12323 | 13042 | 15700 |
| 09/30/2021 | 12148 | 12860 | 15160 |
| 10/31/2021 | 12104 | 12808 | 15274 |
| 11/30/2021 | 11649 | 12340 | 14707 |
| 12/31/2021 | 12189 | 12946 | 15036 |
| 01/31/2022 | 12140 | 12904 | 14701 |
| 02/28/2022 | 11399 | 12173 | 14379 |
| 03/31/2022 | 11720 | 12470 | 14143 |
| 04/30/2022 | 10995 | 11695 | 13427 |
| 05/31/2022 | 11165 | 11875 | 13451 |
| 06/30/2022 | 10020 | 10663 | 12485 |
| 07/31/2022 | 10235 | 10910 | 12518 |
| 08/31/2022 | 10281 | 10950 | 12644 |
| 09/30/2022 | 9402 | 10007 | 11243 |
| 10/31/2022 | 10036 | 10702 | 10963 |
| 11/30/2022 | 11043 | 11793 | 12437 |
| 12/31/2022 | 10919 | 11680 | 12286 |
| 01/31/2023 | 11417 | 12232 | 13145 |
| 02/28/2023 | 11082 | 11874 | 12390 |
| 03/31/2023 | 11392 | 12209 | 12722 |
| 04/30/2023 | 11471 | 12303 | 12625 |
| 05/31/2023 | 10960 | 11741 | 12462 |
| 06/30/2023 | 11426 | 12247 | 12930 |
| 07/31/2023 | 12233 | 13118 | 13723 |
| 08/31/2023 | 11632 | 12480 | 12997 |
| 09/30/2023 | 11260 | 12084 | 12715 |
| 10/31/2023 | 10921 | 11656 | 12181 |
| 11/30/2023 | 11582 | 12369 | 13171 |
| 12/31/2023 | 12157 | 13012 | 13703 |
| 01/31/2024 | 11877 | 12737 | 13166 |
| 02/29/2024 | 11877 | 12722 | 13735 |
| 03/31/2024 | 11882 | 12735 | 14007 |
| 04/30/2024 | 11803 | 12653 | 14100 |
| 05/31/2024 | 12062 | 12982 | 14202 |
| 06/30/2024 | 12076 | 12931 | 14730 |
| 07/31/2024 | 12372 | 13254 | 14783 |
| 08/31/2024 | 12806 | 13731 | 14992 |
| 09/30/2024 | 13346 | 14332 | 15918 |
| 10/31/2024 | 12677 | 13615 | 15222 |
| 11/30/2024 | 12456 | 13296 | 14737 |
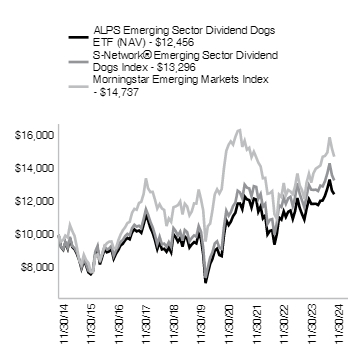
| ALPS Emerging Sector Dividend Dogs ETF - NAV | 7.55% | 5.61% | 2.22% |
| S-Network® Emerging Sector Dividend Dogs Index | 7.50% | 6.10% | 2.89% |
| Morningstar Emerging Markets Index‡ | 11.89% | 4.38% | 3.95% |
For the most current month-end performance data please visit www.alpsfunds.com or call 1-866-759-5679.
| |
‡ | This index represents a broad measure of market performance for purposes of new regulatory requirements. |
| Net Assets | $26,224,484 |
| Number of Portfolio Holdings | 52 |
| Portfolio Turnover Rate | 83% |
| Total Advisory Fees Paid | $161,861 |
| Delta Electronics Thailand PCL | 4.88% |
| Wipro, Ltd. | 3.66% |
| Infosys, Ltd. | 3.27% |
| Pepkor Holdings, Ltd. | 2.45% |
| Chongqing Rural Commercial Bank Co., Ltd. | 2.43% |
| China Zheshang Bank Co., Ltd. | 2.33% |
| Manila Electric Co. | 2.31% |
| Cencosud SA | 2.29% |
| COSCO SHIPPING Holdings Co., Ltd. | 2.20% |
| China Shenhua Energy Co., Ltd., Class H | 2.20% |
| Total % of Top 10 Holdings | 28.02% |
| Information Technology | 11.81% |
| Utilities | 10.57% |
| Financials | 10.52% |
| Consumer Staples | 10.51% |
| Industrials | 10.18% |
| Consumer Discretionary | 9.84% |
| Energy | 9.63% |
| Communication Services | 9.06% |
| Materials | 8.99% |
| Health Care | 8.69% |
| Money Market Fund | 0.20% |
| Total | 100.00% |
| |
* | % of Total Investments (excluding investments purchased with collateral from securities loaned). |
Holdings are subject to change.
If you wish to view additional information about the Fund, including but not limited to the Fund's prospectus, financial information, holdings, and proxy voting information, please visit https://www.alpsfunds.com/exchange-traded-funds/edog.
The Funds send only one report to a household if more than one account has the same address. If you do not want this policy to apply to you, or if you wish to receive a copy of this document at a new address, contact 1-866-759-5679.
ALPS REIT Dividend Dogs ETF | ALPS ETF TRUST |
NYSE ARCA: RDOG | |
This annual shareholder report contains important information about ALPS REIT Dividend Dogs ETF (the "Fund" or "RDOG") for the period of December 1, 2023 to November 30, 2024 (the "Period"). You can find additional information about the Fund at https://www.alpsfunds.com/exchange-traded-funds/rdog. You can also request this information by contacting us at 1-866-759-5679.
| ALPS REIT Dividend Dogs ETF | $39 | 0.35% |
Performance Overview
The ALPS REIT Dividend Dogs ETF (RDOG), for the twelve-month period ended November 30, 2024, generated a NAV total return of 24.51%. The Fund outperformed with the S-Network® US Composite REIT Index, which returned 24.06% for the same period.
Attribution
Top contributors to relative performance:
Overweight allocation to Office REITs
Security selection of Diversified REITs, which outperformed.
Manhattan office building operator, SL Green Realty Corp. (SLG, 2.53% weight*), provided the best individual contribution to RDOG's performance over the 1-year period (+2.12%).
Top detractors from relative performance:
Overweight allocation to Hotel & Resort REITs.
Security selection of Health Care REITs, which underperformed.
Hotel and servicing leaser, Service Properties Trust (SVC, portfolio deletion during June rebalance), provided the worst individual contribution to RDOG's performance over the 1-year period (-1.81%).
*Weights as of 11/30/2024, Bloomberg
The Fund's past performance is not a good predictor of the Fund's future performance. The chart and the table below do not reflect the deduction of taxes that a shareholder would pay on Fund distributions or sale of Fund shares.
| 11/30/2014 | 10000 | 10000 | 10000 |
| 12/31/2014 | 9998 | 10194 | 9976 |
| 01/31/2015 | 10506 | 10875 | 9704 |
| 02/28/2015 | 10444 | 10491 | 10262 |
| 03/31/2015 | 10445 | 10674 | 10135 |
| 04/30/2015 | 10378 | 10048 | 10201 |
| 05/31/2015 | 10207 | 10027 | 10340 |
| 06/30/2015 | 9775 | 9574 | 10144 |
| 07/31/2015 | 10099 | 10110 | 10341 |
| 08/31/2015 | 9514 | 9481 | 9720 |
| 09/30/2015 | 9665 | 9774 | 9454 |
| 10/31/2015 | 10209 | 10328 | 10214 |
| 11/30/2015 | 9962 | 10268 | 10249 |
| 12/31/2015 | 10113 | 10458 | 10071 |
| 01/31/2016 | 9646 | 10096 | 9525 |
| 02/29/2016 | 9580 | 10066 | 9518 |
| 03/31/2016 | 10523 | 11119 | 10176 |
| 04/30/2016 | 10499 | 10840 | 10231 |
| 05/31/2016 | 10475 | 11079 | 10421 |
| 06/30/2016 | 10827 | 11852 | 10445 |
| 07/31/2016 | 11337 | 12378 | 10845 |
| 08/31/2016 | 11015 | 11909 | 10860 |
| 09/30/2016 | 10913 | 11696 | 10871 |
| 10/31/2016 | 10321 | 11015 | 10657 |
| 11/30/2016 | 10023 | 10843 | 11074 |
| 12/31/2016 | 10289 | 11349 | 11281 |
| 01/31/2017 | 10367 | 11311 | 11509 |
| 02/28/2017 | 10693 | 11731 | 11953 |
| 03/31/2017 | 10561 | 11413 | 11964 |
| 04/30/2017 | 10693 | 11416 | 12093 |
| 05/31/2017 | 10836 | 11318 | 12251 |
| 06/30/2017 | 10884 | 11584 | 12341 |
| 07/31/2017 | 11104 | 11714 | 12584 |
| 08/31/2017 | 11154 | 11668 | 12619 |
| 09/30/2017 | 11036 | 11678 | 12890 |
| 10/31/2017 | 11021 | 11541 | 13189 |
| 11/30/2017 | 11303 | 11854 | 13590 |
| 12/31/2017 | 11426 | 11835 | 13738 |
| 01/31/2018 | 11431 | 11316 | 14499 |
| 02/28/2018 | 10647 | 10472 | 13968 |
| 03/31/2018 | 10907 | 10869 | 13654 |
| 04/30/2018 | 11114 | 11029 | 13697 |
| 05/31/2018 | 11183 | 11502 | 14049 |
| 06/30/2018 | 11377 | 11992 | 14139 |
| 07/31/2018 | 11473 | 12072 | 14626 |
| 08/31/2018 | 11574 | 12459 | 15115 |
| 09/30/2018 | 11360 | 12120 | 15167 |
| 10/31/2018 | 10952 | 11818 | 14083 |
| 11/30/2018 | 11469 | 12391 | 14384 |
| 12/31/2018 | 10875 | 11384 | 13069 |
| 01/31/2019 | 12005 | 12722 | 14174 |
| 02/28/2019 | 12023 | 12776 | 14660 |
| 03/31/2019 | 12549 | 13179 | 14907 |
| 04/30/2019 | 12356 | 13141 | 15509 |
| 05/31/2019 | 12388 | 13141 | 14534 |
| 06/30/2019 | 12558 | 13292 | 15546 |
| 07/31/2019 | 12547 | 13473 | 15796 |
| 08/31/2019 | 12803 | 13894 | 15514 |
| 09/30/2019 | 13000 | 14292 | 15775 |
| 10/31/2019 | 13168 | 14495 | 16106 |
| 11/30/2019 | 12960 | 14277 | 16713 |
| 12/31/2019 | 13100 | 14176 | 17186 |
| 01/31/2020 | 12948 | 14064 | 17216 |
| 02/29/2020 | 11929 | 12961 | 15812 |
| 03/31/2020 | 8657 | 9410 | 13728 |
| 04/30/2020 | 9748 | 10606 | 15542 |
| 05/31/2020 | 9740 | 10596 | 16376 |
| 06/30/2020 | 10156 | 11048 | 16741 |
| 07/31/2020 | 10195 | 11092 | 17698 |
| 08/31/2020 | 10335 | 11249 | 18996 |
| 09/30/2020 | 9749 | 10610 | 18307 |
| 10/31/2020 | 9348 | 10176 | 17878 |
| 11/30/2020 | 11437 | 12480 | 19980 |
| 12/31/2020 | 11744 | 12802 | 20817 |
| 01/31/2021 | 11735 | 12794 | 20661 |
| 02/28/2021 | 12292 | 13407 | 21273 |
| 03/31/2021 | 12737 | 13845 | 22052 |
| 04/30/2021 | 13619 | 14871 | 23232 |
| 05/31/2021 | 13663 | 14921 | 23318 |
| 06/30/2021 | 14060 | 15359 | 23944 |
| 07/31/2021 | 14573 | 15920 | 24455 |
| 08/31/2021 | 14828 | 16204 | 25172 |
| 09/30/2021 | 14098 | 15408 | 24022 |
| 10/31/2021 | 14896 | 16290 | 25694 |
| 11/30/2021 | 14754 | 16141 | 25354 |
| 12/31/2021 | 15904 | 17409 | 26337 |
| 01/31/2022 | 14914 | 16327 | 24807 |
| 02/28/2022 | 14580 | 15964 | 24115 |
| 03/31/2022 | 15322 | 16782 | 24908 |
| 04/30/2022 | 14211 | 15570 | 22655 |
| 05/31/2022 | 14005 | 15349 | 22598 |
| 06/30/2022 | 13090 | 14347 | 20734 |
| 07/31/2022 | 14112 | 15478 | 22675 |
| 08/31/2022 | 13178 | 14453 | 21806 |
| 09/30/2022 | 11600 | 12715 | 19779 |
| 10/31/2022 | 12348 | 13544 | 21351 |
| 11/30/2022 | 12827 | 14073 | 22493 |
| 12/31/2022 | 11861 | 13023 | 21180 |
| 01/31/2023 | 13349 | 14667 | 22607 |
| 02/28/2023 | 12396 | 13622 | 22061 |
| 03/31/2023 | 11550 | 12693 | 22764 |
| 04/30/2023 | 11125 | 12229 | 23033 |
| 05/31/2023 | 10953 | 12042 | 23162 |
| 06/30/2023 | 11668 | 12837 | 24727 |
| 07/31/2023 | 12285 | 13526 | 25581 |
| 08/31/2023 | 12019 | 13237 | 25129 |
| 09/30/2023 | 11112 | 12230 | 23952 |
| 10/31/2023 | 10664 | 11743 | 23367 |
| 11/30/2023 | 11909 | 13120 | 25561 |
| 12/31/2023 | 13081 | 14429 | 26827 |
| 01/31/2024 | 12144 | 13394 | 27197 |
| 02/29/2024 | 12110 | 13362 | 28675 |
| 03/31/2024 | 12654 | 13967 | 29597 |
| 04/30/2024 | 12221 | 13490 | 28322 |
| 05/31/2024 | 12575 | 13885 | 29658 |
| 06/30/2024 | 12754 | 14091 | 30650 |
| 07/31/2024 | 14063 | 15548 | 31083 |
| 08/31/2024 | 14356 | 15878 | 31796 |
| 09/30/2024 | 14845 | 16430 | 32471 |
| 10/31/2024 | 14116 | 15624 | 32224 |
| 11/30/2024 | 14827 | 16385 | 34281 |
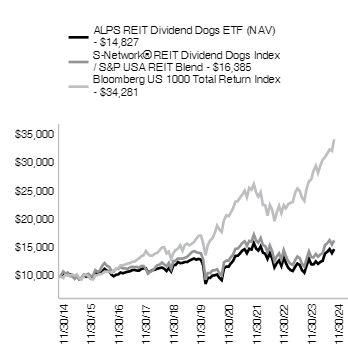
| ALPS REIT Dividend Dogs ETF - NAV | 24.51% | 2.73% | 4.02% |
| S-Network® REIT Dividend Dogs Index** | 25.15% | 2.78% | – |
| S-Network® US Composite REIT Index*** | 24.06% | 4.81% | – |
| S-Network® REIT Dividend Dogs Index / S&P USA REIT Blend* | 25.15% | 2.78% | 5.06% |
| Bloomberg US 1000 Total Return Index‡ | 34.11% | 15.45% | 13.11% |
For the most current month-end performance data please visit www.alpsfunds.com or call 1-866-759-5679.
| |
* | The performance shown reflects a combination of the S-Network® REIT Dividend Dogs Index, and for periods prior to January 2, 2020, the S&P United States REIT Index. Prior to January 2, 2020, the Fund used a different underlying index than the S&P United States REIT Index. Therefore, the historical returns shown for the periods prior to January 2, 2020, are not necessarily indicative of the historical strategy of the Fund. |
** | The Index commenced operations on October 29, 2019. |
*** | The Index commenced operations on February 12, 2016. |
| |
‡ | This index represents a broad measure of market performance and has been added to comply with new regulatory requirements. |
| Net Assets | $14,672,479 |
| Number of Portfolio Holdings | 45 |
| Portfolio Turnover Rate | 57% |
| Total Advisory Fees Paid | $43,945 |
| The Macerich Co. | 2.88% |
| Digital Realty Trust, Inc. | 2.76% |
| CBL & Associates Properties, Inc. | 2.72% |
| Braemar Hotels & Resorts, Inc. | 2.62% |
| Equinix, Inc. | 2.53% |
| Apple Hospitality REIT, Inc. | 2.53% |
| SL Green Realty Corp. | 2.53% |
| Outfront Media, Inc. | 2.51% |
| Simon Property Group, Inc. | 2.51% |
| Park Hotels & Resorts, Inc. | 2.48% |
| Total % of Top 10 Holdings | 26.07% |
| Retail REITs | 12.64% |
| Diversified REITs | 11.43% |
| Specialized REITs | 11.37% |
| Hotel & Resort REITs | 11.35% |
| Technology REITs | 11.35% |
| Residential REITs | 11.04% |
| Office REITs | 10.80% |
| Health Care REITs | 10.02% |
| Industrial REITs | 9.79% |
| Money Market Fund | 0.21% |
| Total | 100.00% |
| |
** | % of Total Investments (excluding investments purchased with collateral from securities loaned). |
Holdings are subject to change.
If you wish to view additional information about the Fund, including but not limited to the Fund's prospectus, financial information, holdings, and proxy voting information, please visit https://www.alpsfunds.com/exchange-traded-funds/rdog.
The Funds send only one report to a household if more than one account has the same address. If you do not want this policy to apply to you, or if you wish to receive a copy of this document at a new address, contact 1-866-759-5679.
ALPS | O'Shares U.S. Quality Dividend ETF | ALPS ETF TRUST |
Cboe BZX: OUSA | |
CboeBZX
This annual shareholder report contains important information about ALPS | O'Shares U.S. Quality Dividend ETF (the "Fund" or "OUSA") for the period of December 1, 2023 to November 30, 2024 (the "Period"). You can find additional information about the Fund at https://www.alpsfunds.com/exchange-traded-funds/ousa. You can also request this information by contacting us at 1-866-759-5679.
| ALPS | O'Shares U.S. Quality Dividend ETF | $54 | 0.48% |
The ALPS | O'Shares U.S. Quality Dividend ETF (OUSA), for the trailing twelve-month period ended November 30, 2024, generated a NAV total return of 26.90%. The Fund underperformed the Morningstar US Large-Mid Cap Broad Value Index, which returned 29.50% for the same period.
Top contributors to relative performance:
Underweight allocation to the Energy sector.
Security selection of quality stocks within the Information Technology sector, which overperformed.
Semiconductor and software developer, Broadcom Inc. (AVGO, 0.39% weight*), provided the best individual contribution to OUSA's performance over the 1-year period (+2.64%).
Top detractors from relative performance:
Underweight allocation to the Financials sector.
Security selection of quality names within the Financials and Industrials sectors, which underperformed.
Global health care company, Merck & Co. (MRK, 4.05% weight*), provided the worst individual contribution to OUSA's performance over the 1-year period (-0.44%).
*Weights as of 11/30/2024, Bloomberg
The Fund's past performance is not a good predictor of the Fund's future performance. The chart and the table below do not reflect the deduction of taxes that a shareholder would pay on Fund distributions or sale of Fund shares.
| 07/13/2015 | 10000 | 10000 | 10000 | 10000 |
| 07/31/2015 | 9968 | 9949 | 9968 | 10020 |
| 08/31/2015 | 9441 | 9379 | 9437 | 9418 |
| 09/30/2015 | 9404 | 9156 | 9405 | 9161 |
| 10/31/2015 | 10168 | 9836 | 10178 | 9897 |
| 11/30/2015 | 10144 | 9872 | 10160 | 9931 |
| 12/31/2015 | 10132 | 9737 | 10154 | 9758 |
| 01/31/2016 | 10037 | 9318 | 10062 | 9229 |
| 02/29/2016 | 10123 | 9373 | 10151 | 9222 |
| 03/31/2016 | 10757 | 10018 | 10797 | 9860 |
| 04/30/2016 | 10805 | 10158 | 10850 | 9913 |
| 05/31/2016 | 10934 | 10285 | 10983 | 10098 |
| 06/30/2016 | 11339 | 10414 | 11396 | 10121 |
| 07/31/2016 | 11548 | 10726 | 11617 | 10509 |
| 08/31/2016 | 11350 | 10809 | 11419 | 10522 |
| 09/30/2016 | 11272 | 10827 | 11339 | 10533 |
| 10/31/2016 | 10958 | 10670 | 11026 | 10326 |
| 11/30/2016 | 11085 | 11242 | 11159 | 10730 |
| 12/31/2016 | 11379 | 11520 | 11462 | 10931 |
| 01/31/2017 | 11431 | 11637 | 11519 | 11152 |
| 02/28/2017 | 11981 | 12091 | 12075 | 11582 |
| 03/31/2017 | 12016 | 12007 | 12112 | 11592 |
| 04/30/2017 | 12049 | 11973 | 12152 | 11717 |
| 05/31/2017 | 12312 | 12006 | 12425 | 11871 |
| 06/30/2017 | 12246 | 12160 | 12364 | 11958 |
| 07/31/2017 | 12426 | 12336 | 12548 | 12193 |
| 08/31/2017 | 12504 | 12309 | 12633 | 12227 |
| 09/30/2017 | 12726 | 12665 | 12865 | 12490 |
| 10/31/2017 | 12802 | 12884 | 12947 | 12780 |
| 11/30/2017 | 13333 | 13306 | 13492 | 13168 |
| 12/31/2017 | 13516 | 13494 | 13683 | 13312 |
| 01/31/2018 | 13867 | 14034 | 14047 | 14049 |
| 02/28/2018 | 13149 | 13385 | 13323 | 13535 |
| 03/31/2018 | 13000 | 13098 | 13174 | 13230 |
| 04/30/2018 | 12897 | 13067 | 13078 | 13271 |
| 05/31/2018 | 13082 | 13202 | 13269 | 13613 |
| 06/30/2018 | 13185 | 13225 | 13381 | 13700 |
| 07/31/2018 | 13689 | 13799 | 13902 | 14172 |
| 08/31/2018 | 13946 | 14097 | 14169 | 14646 |
| 09/30/2018 | 14195 | 14143 | 14434 | 14696 |
| 10/31/2018 | 13654 | 13444 | 13887 | 13646 |
| 11/30/2018 | 14244 | 13774 | 14496 | 13938 |
| 12/31/2018 | 13103 | 12479 | 13332 | 12663 |
| 01/31/2019 | 13833 | 13394 | 14084 | 13734 |
| 02/28/2019 | 14490 | 13815 | 14759 | 14205 |
| 03/31/2019 | 14771 | 13938 | 15053 | 14445 |
| 04/30/2019 | 14977 | 14426 | 15272 | 15027 |
| 05/31/2019 | 14242 | 13449 | 14526 | 14082 |
| 06/30/2019 | 15072 | 14414 | 15379 | 15063 |
| 07/31/2019 | 15213 | 14605 | 15530 | 15306 |
| 08/31/2019 | 15126 | 14268 | 15447 | 15033 |
| 09/30/2019 | 15446 | 14800 | 15782 | 15286 |
| 10/31/2019 | 15625 | 15096 | 15977 | 15605 |
| 11/30/2019 | 15970 | 15567 | 16335 | 16194 |
| 12/31/2019 | 16410 | 16007 | 16794 | 16653 |
| 01/31/2020 | 16178 | 15651 | 16566 | 16681 |
| 02/29/2020 | 14697 | 14130 | 15049 | 15321 |
| 03/31/2020 | 13072 | 11935 | 13379 | 13302 |
| 04/30/2020 | 14554 | 13284 | 14903 | 15059 |
| 05/31/2020 | 14998 | 13765 | 15367 | 15867 |
| 06/30/2020 | 15053 | 13807 | 15432 | 16221 |
| 07/31/2020 | 15871 | 14369 | 16281 | 17148 |
| 08/31/2020 | 16997 | 15071 | 17445 | 18406 |
| 09/30/2020 | 16506 | 14696 | 16945 | 17738 |
| 10/31/2020 | 15727 | 14362 | 16152 | 17322 |
| 11/30/2020 | 17128 | 16231 | 17599 | 19360 |
| 12/31/2020 | 17539 | 16877 | 18026 | 20170 |
| 01/31/2021 | 17156 | 16671 | 17642 | 20020 |
| 02/28/2021 | 17136 | 17457 | 17628 | 20612 |
| 03/31/2021 | 18328 | 18529 | 18863 | 21367 |
| 04/30/2021 | 18891 | 19223 | 19451 | 22511 |
| 05/31/2021 | 19149 | 19641 | 19726 | 22594 |
| 06/30/2021 | 19395 | 19553 | 19985 | 23200 |
| 07/31/2021 | 20055 | 19770 | 20679 | 23695 |
| 08/31/2021 | 20397 | 20148 | 21038 | 24390 |
| 09/30/2021 | 19316 | 19398 | 19930 | 23276 |
| 10/31/2021 | 20398 | 20421 | 21057 | 24896 |
| 11/30/2021 | 20280 | 20001 | 20945 | 24567 |
| 12/31/2021 | 21687 | 21344 | 22409 | 25519 |
| 01/31/2022 | 20709 | 20869 | 21404 | 24036 |
| 02/28/2022 | 19994 | 20456 | 20675 | 23366 |
| 03/31/2022 | 20572 | 21099 | 21281 | 24135 |
| 04/30/2022 | 19716 | 20004 | 20403 | 21951 |
| 05/31/2022 | 19868 | 20350 | 20568 | 21896 |
| 06/30/2022 | 18934 | 18667 | 19606 | 20090 |
| 07/31/2022 | 19733 | 19813 | 20447 | 21971 |
| 08/31/2022 | 18908 | 19279 | 19598 | 21129 |
| 09/30/2022 | 17483 | 17617 | 18121 | 19165 |
| 10/31/2022 | 19046 | 19532 | 19757 | 20688 |
| 11/30/2022 | 20498 | 20716 | 21275 | 21794 |
| 12/31/2022 | 19688 | 19865 | 20436 | 20522 |
| 01/31/2023 | 20180 | 20789 | 20956 | 21905 |
| 02/28/2023 | 19411 | 20068 | 20167 | 21376 |
| 03/31/2023 | 20112 | 20188 | 20902 | 22057 |
| 04/30/2023 | 20533 | 20516 | 21348 | 22318 |
| 05/31/2023 | 19966 | 19891 | 20769 | 22443 |
| 06/30/2023 | 21107 | 21114 | 21964 | 23959 |
| 07/31/2023 | 21518 | 21967 | 22403 | 24786 |
| 08/31/2023 | 21260 | 21437 | 22147 | 24349 |
| 09/30/2023 | 20208 | 20697 | 21058 | 23208 |
| 10/31/2023 | 20001 | 20083 | 20856 | 22641 |
| 11/30/2023 | 21469 | 21556 | 22399 | 24767 |
| 12/31/2023 | 22291 | 22713 | 23263 | 25994 |
| 01/31/2024 | 22843 | 22910 | 23853 | 26352 |
| 02/29/2024 | 23474 | 23763 | 24522 | 27785 |
| 03/31/2024 | 23994 | 24855 | 25078 | 28678 |
| 04/30/2024 | 22907 | 23855 | 23948 | 27442 |
| 05/31/2024 | 23754 | 24644 | 24844 | 28737 |
| 06/30/2024 | 24221 | 24807 | 25343 | 29698 |
| 07/31/2024 | 24918 | 25796 | 26085 | 30118 |
| 08/31/2024 | 25901 | 26492 | 27127 | 30809 |
| 09/30/2024 | 26459 | 26877 | 27724 | 31463 |
| 10/31/2024 | 26094 | 26550 | 27352 | 31223 |
| 11/30/2024 | 27244 | 27914 | 28569 | 33217 |
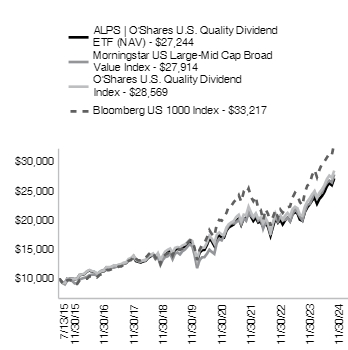
| ALPS O'Shares U.S. Quality Dividend ETF - NAV | 26.90% | 11.27% | 11.27% |
| O'Shares U.S. Quality Dividend Index* | 27.55% | 11.83% | 11.84% |
| Morningstar US Large-Mid Cap Broad Value Index | 29.50% | 12.39% | 11.56% |
| Bloomberg US 1000 Index‡ | 34.11% | 15.45% | 13.65% |
For the most current month-end performance data please visit www.alpsfunds.com or call 1-866-759-5679.
| |
* | The O'Shares U.S. Quality Dividend Index performance information reflects the blended performance of the FTSE USA Qual/Vol/Yield Factor 5% Capped Index through May 31, 2020 and the O'Shares U.S. Quality Dividend Index thereafter. |
‡ | This index represents a broad measure of market performance and has been added to comply with new regulatory requirements. |
| Net Assets | $822,180,163 |
| Number of Portfolio Holdings | 100 |
| Portfolio Turnover Rate | 32% |
| Total Advisory Fees Paid | $3,626,260 |
| Home Depot, Inc. | 5.47% |
| Visa, Inc. | 5.27% |
| Apple, Inc. | 5.09% |
| Microsoft Corp. | 4.74% |
| Johnson & Johnson | 4.17% |
| Merck & Co., Inc. | 4.05% |
| Mastercard, Inc. | 3.93% |
| Alphabet, Inc. | 3.78% |
| Comcast Corp. | 3.68% |
| McDonald's Corp. | 3.31% |
| Total % of Top 10 Holdings | 43.49% |
| Information Technology | 22.18% |
| Financials | 16.18% |
| Health Care | 15.46% |
| Consumer Discretionary | 14.47% |
| Industrials | 12.76% |
| Communication Services | 10.62% |
| Consumer Staples | 8.32% |
| Money Market Fund | 0.01% |
| Total | 100.00% |
| |
** | % of Total Investments. |
Holdings are subject to change.
If you wish to view additional information about the Fund, including but not limited to the Fund's prospectus, financial information, holdings, and proxy voting information, please visit https://www.alpsfunds.com/exchange-traded-funds/ousa.
The Funds send only one report to a household if more than one account has the same address. If you do not want this policy to apply to you, or if you wish to receive a copy of this document at a new address, contact 1-866-759-5679.
ALPS | O'Shares U.S. Small-Cap Quality Dividend ETF | ALPS ETF TRUST |
Cboe BZX: OUSM | |
CboeBZX
This annual shareholder report contains important information about ALPS | O'Shares U.S. Small-Cap Quality Dividend ETF (the "Fund" or "OUSM") for the period of December 1, 2023 to November 30, 2024 (the "Period"). You can find additional information about the Fund at https://www.alpsfunds.com/exchange-traded-funds/ousm. You can also request this information by contacting us at 1-866-759-5679.
| ALPS | O'Shares U.S. Small-Cap Quality Dividend ETF | $55 | 0.48% |
The ALPS | O'Shares U.S. Small-Cap Quality Dividend ETF (OUSM), for the trailing twelve-month period ended November 30, 2024, generated a NAV total return of 31.17%. The Fund underperformed the Morningstar US Small-Cap Broad Value Extended Index, which returned 32.48% for the same period.
Top contributors to relative performance:
Underweight allocation to the Energy sector.
Security selection of quality stocks within the Consumer Discretionary sector, which overperformed.
Home furnishing retailer, Williams-Sonoma Inc. (WSM, portfolio deletion during June rebalance), provided the best individual contribution to OUSM's performance over the 1-year period (+1.62%).
Top detractors from relative performance:
Underweight allocation to the Financials sector.
Security selection of quality names within the Information Technology and Health Care sectors, which underperformed.
Electronic circuit manufacturer, Power Integrations, Inc. (POWI, portfolio deletion during September rebalance), provided the worst individual contribution to OUSM's performance over the 1-year period (-0.26%).
*Weights as of 11/30/2024, Bloomberg
The Fund's past performance is not a good predictor of the Fund's future performance. The chart and the table below do not reflect the deduction of taxes that a shareholder would pay on Fund distributions or sale of Fund shares.
| 12/29/2016 | 10000 | 10000 | 10000 | 10000 |
| 12/31/2016 | 9984 | 9956 | 9983 | 9956 |
| 01/31/2017 | 10040 | 10011 | 10043 | 10157 |
| 02/28/2017 | 10220 | 10149 | 10222 | 10549 |
| 03/31/2017 | 10167 | 10055 | 10176 | 10558 |
| 04/30/2017 | 10310 | 10101 | 10323 | 10673 |
| 05/31/2017 | 10199 | 9728 | 10212 | 10812 |
| 06/30/2017 | 10252 | 10030 | 10273 | 10891 |
| 07/31/2017 | 10359 | 10104 | 10383 | 11106 |
| 08/31/2017 | 10230 | 9874 | 10258 | 11136 |
| 09/30/2017 | 10616 | 10495 | 10655 | 11376 |
| 10/31/2017 | 10778 | 10504 | 10821 | 11640 |
| 11/30/2017 | 11083 | 10843 | 11136 | 11994 |
| 12/31/2017 | 11051 | 10900 | 11107 | 12125 |
| 01/31/2018 | 11144 | 11042 | 11203 | 12796 |
| 02/28/2018 | 10535 | 10425 | 10594 | 12328 |
| 03/31/2018 | 10683 | 10495 | 10748 | 12051 |
| 04/30/2018 | 10703 | 10605 | 10774 | 12088 |
| 05/31/2018 | 11108 | 11140 | 11188 | 12399 |
| 06/30/2018 | 11215 | 11256 | 11299 | 12478 |
| 07/31/2018 | 11605 | 11443 | 11700 | 12908 |
| 08/31/2018 | 12018 | 11721 | 12121 | 13340 |
| 09/30/2018 | 11791 | 11438 | 11896 | 13386 |
| 10/31/2018 | 10728 | 10376 | 10828 | 12429 |
| 11/30/2018 | 11087 | 10503 | 11193 | 12695 |
| 12/31/2018 | 9915 | 9220 | 10013 | 11534 |
| 01/31/2019 | 10777 | 10355 | 10888 | 12509 |
| 02/28/2019 | 11309 | 10742 | 11428 | 12938 |
| 03/31/2019 | 11185 | 10425 | 11311 | 13156 |
| 04/30/2019 | 11735 | 10809 | 11869 | 13687 |
| 05/31/2019 | 10790 | 9841 | 10917 | 12826 |
| 06/30/2019 | 11624 | 10518 | 11767 | 13720 |
| 07/31/2019 | 11867 | 10594 | 12016 | 13941 |
| 08/31/2019 | 11502 | 9927 | 11649 | 13692 |
| 09/30/2019 | 11855 | 10419 | 12021 | 13923 |
| 10/31/2019 | 12068 | 10638 | 12238 | 14214 |
| 11/30/2019 | 12374 | 10960 | 12553 | 14750 |
| 12/31/2019 | 12654 | 11359 | 12846 | 15168 |
| 01/31/2020 | 12377 | 10786 | 12569 | 15194 |
| 02/29/2020 | 11188 | 9660 | 11365 | 13955 |
| 03/31/2020 | 9080 | 6953 | 9218 | 12116 |
| 04/30/2020 | 10197 | 8020 | 10362 | 13716 |
| 05/31/2020 | 10811 | 8383 | 10993 | 14453 |
| 06/30/2020 | 10831 | 8588 | 11023 | 14774 |
| 07/31/2020 | 11451 | 8803 | 11659 | 15619 |
| 08/31/2020 | 11842 | 9269 | 12063 | 16764 |
| 09/30/2020 | 11410 | 8886 | 11626 | 16156 |
| 10/31/2020 | 11645 | 9157 | 11871 | 15778 |
| 11/30/2020 | 12897 | 10989 | 13154 | 17634 |
| 12/31/2020 | 13614 | 11810 | 13893 | 18372 |
| 01/31/2021 | 13485 | 12250 | 13766 | 18234 |
| 02/28/2021 | 14200 | 13482 | 14503 | 18774 |
| 03/31/2021 | 14968 | 14284 | 15294 | 19462 |
| 04/30/2021 | 15523 | 14840 | 15869 | 20503 |
| 05/31/2021 | 15671 | 15297 | 16017 | 20579 |
| 06/30/2021 | 15466 | 15005 | 15812 | 21131 |
| 07/31/2021 | 15852 | 14527 | 16217 | 21582 |
| 08/31/2021 | 16031 | 14832 | 16407 | 22215 |
| 09/30/2021 | 15336 | 14579 | 15700 | 21201 |
| 10/31/2021 | 16138 | 15080 | 16530 | 22676 |
| 11/30/2021 | 15579 | 14638 | 15963 | 22376 |
| 12/31/2021 | 16550 | 15354 | 16967 | 23244 |
| 01/31/2022 | 15716 | 14751 | 16115 | 21893 |
| 02/28/2022 | 15454 | 15023 | 15852 | 21283 |
| 03/31/2022 | 15537 | 15235 | 15946 | 21983 |
| 04/30/2022 | 14723 | 14227 | 15117 | 19994 |
| 05/31/2022 | 15228 | 14582 | 15642 | 19943 |
| 06/30/2022 | 14210 | 13116 | 14601 | 18299 |
| 07/31/2022 | 15376 | 14389 | 15813 | 20012 |
| 08/31/2022 | 14766 | 13902 | 15190 | 19244 |
| 09/30/2022 | 13528 | 12456 | 13919 | 17456 |
| 10/31/2022 | 14918 | 14065 | 15357 | 18843 |
| 11/30/2022 | 15968 | 14718 | 16445 | 19851 |
| 12/31/2022 | 15241 | 13750 | 15699 | 18692 |
| 01/31/2023 | 16644 | 15236 | 17152 | 19952 |
| 02/28/2023 | 16192 | 14857 | 16695 | 19470 |
| 03/31/2023 | 16099 | 13849 | 16603 | 20090 |
| 04/30/2023 | 16163 | 13616 | 16670 | 20328 |
| 05/31/2023 | 15541 | 13149 | 16034 | 20441 |
| 06/30/2023 | 16801 | 14397 | 17345 | 21823 |
| 07/31/2023 | 17063 | 15420 | 17619 | 22576 |
| 08/31/2023 | 16793 | 14685 | 17347 | 22178 |
| 09/30/2023 | 16151 | 13912 | 16692 | 21139 |
| 10/31/2023 | 15591 | 13051 | 16115 | 20622 |
| 11/30/2023 | 16738 | 14288 | 17312 | 22559 |
| 12/31/2023 | 18105 | 15987 | 18739 | 23676 |
| 01/31/2024 | 17965 | 15351 | 18598 | 24002 |
| 02/29/2024 | 18815 | 15763 | 19488 | 25307 |
| 03/31/2024 | 19752 | 16611 | 20468 | 26121 |
| 04/30/2024 | 18643 | 15501 | 19327 | 24995 |
| 05/31/2024 | 19401 | 16216 | 20119 | 26174 |
| 06/30/2024 | 19173 | 15810 | 19889 | 27050 |
| 07/31/2024 | 20531 | 17377 | 21310 | 27432 |
| 08/31/2024 | 20563 | 17220 | 21355 | 28062 |
| 09/30/2024 | 21011 | 17418 | 21829 | 28657 |
| 10/31/2024 | 20608 | 17261 | 21419 | 28439 |
| 11/30/2024 | 21955 | 18929 | 22834 | 30255 |
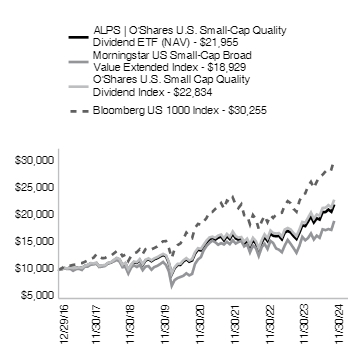
| ALPS O'Shares U.S. Small-Cap Quality Dividend ETF - NAV | 31.17% | 12.15% | 10.44% |
| O'Shares U.S. Small Cap Quality Dividend Index* | 31.90% | 12.71% | 10.99% |
| Morningstar US Small-Cap Broad Value Extended Index | 32.48% | 11.55% | 8.39% |
| Bloomberg US 1000 Index‡ | 34.11% | 15.45% | 15.00% |
For the most current month-end performance data please visit www.alpsfunds.com or call 1-866-759-5679.
| |
* | The O'Shares U.S. Small-Cap Quality Dividend Index performance information reflects the blended performance of the FTSE USA Small Cap Qual/Vol/Yield 3% Capped Factor Index through May 3, 2018, the FTSE USA Small Cap ex Real Estate 2Qual/Vol/Yield 3% Capped Factor Index from May 4, 2018 through May 31, 2020 and the O'Shares U.S. Small-Cap Quality Dividend Index thereafter. |
‡ | This index represents a broad measure of market performance and has been added to comply with new regulatory requirements. |
| Net Assets | $862,649,707 |
| Number of Portfolio Holdings | 110 |
| Portfolio Turnover Rate | 37% |
| Total Advisory Fees Paid | $2,937,900 |
| Houlihan Lokey, Inc. | 2.29% |
| SEI Investments Co. | 2.27% |
| Lincoln Electric Holdings, Inc. | 2.27% |
| Texas Roadhouse, Inc. | 2.21% |
| Robert Half, Inc. | 2.21% |
| Premier, Inc. | 2.12% |
| Dolby Laboratories, Inc. | 2.06% |
| Donaldson Co., Inc. | 2.04% |
| Encompass Health Corp. | 2.04% |
| Avnet, Inc. | 2.01% |
| Total % of Top 10 Holdings | 21.52% |
| Financials | 22.79% |
| Industrials | 22.60% |
| Consumer Discretionary | 19.25% |
| Information Technology | 14.53% |
| Health Care | 9.30% |
| Consumer Staples | 4.91% |
| Utilities | 3.78% |
| Communication Services | 2.82% |
| Money Market Fund | 0.02% |
| Total | 100.00% |
| |
** | % of Total Investments (excluding investments purchased with collateral from securities loaned). |
Holdings are subject to change.
If you wish to view additional information about the Fund, including but not limited to the Fund's prospectus, financial information, holdings, and proxy voting information, please visit https://www.alpsfunds.com/exchange-traded-funds/ousm.
The Funds send only one report to a household if more than one account has the same address. If you do not want this policy to apply to you, or if you wish to receive a copy of this document at a new address, contact 1-866-759-5679.
ALPS | O'Shares Global Internet Giants ETF | ALPS ETF TRUST |
Cboe BZX: OGIG | |
CboeBZX
This annual shareholder report contains important information about ALPS | O'Shares Global Internet Giants ETF (the "Fund" or "OGIG") for the period of December 1, 2023 to November 30, 2024 (the "Period"). You can find additional information about the Fund at https://www.alpsfunds.com/exchange-traded-funds/ogig. You can also request this information by contacting us at 1-866-759-5679.
| ALPS | O'Shares Global Internet Giants ETF | $57 | 0.48% |
The ALPS | O'Shares Global Internet Giants ETF (OGIG), for the trailing twelve-month period ended November 30, 2024, generated a NAV total return of 37.38%. The Fund outperformed the NASDAQ 100 Index, which returned 32.27% for the same period.
Top contributors to relative performance:
Underweight allocation to the Health Care sector,
Security selection of stocks in the United States, which overperformed.
Security selection of stocks within the Information Technology sector, which overperformed.
AI marketing solution provider, AppLovin Corp. (APP US, 3.30% weight*), provided the best individual contribution to OGIG's performance over the 1-year period (+4.10%).
Top detractors from relative performance:
Underweight allocation to the United States.
Security selection of names within the Communication Services sector, which underperformed.
E-commerce retailer, PDD Holdings, Inc. (PDD US, 1.88% weight*), provided the worst individual contribution to OGIG's performance over the 1-year period (-0.90%).
*Weights as of 11/30/2024, Bloomberg
The Fund's past performance is not a good predictor of the Fund's future performance. The chart and the table below do not reflect the deduction of taxes that a shareholder would pay on Fund distributions or sale of Fund shares.
| 06/04/2018 | 10000 | 10000 | 10000 | 10000 |
| 06/30/2018 | 9624 | 9860 | 9627 | 9912 |
| 07/31/2018 | 9480 | 10133 | 9486 | 10253 |
| 08/31/2018 | 9748 | 10741 | 9757 | 10596 |
| 09/30/2018 | 9440 | 10710 | 9454 | 10632 |
| 10/31/2018 | 8156 | 9787 | 8172 | 9872 |
| 11/30/2018 | 8356 | 9778 | 8377 | 10083 |
| 12/31/2018 | 7668 | 8914 | 7690 | 9161 |
| 01/31/2019 | 8844 | 9731 | 8874 | 9936 |
| 02/28/2019 | 9500 | 10016 | 9539 | 10277 |
| 03/31/2019 | 9660 | 10420 | 9704 | 10450 |
| 04/30/2019 | 10184 | 10993 | 10236 | 10872 |
| 05/31/2019 | 9380 | 10086 | 9429 | 10188 |
| 06/30/2019 | 10016 | 10863 | 10077 | 10898 |
| 07/31/2019 | 10204 | 11119 | 10268 | 11073 |
| 08/31/2019 | 9804 | 10912 | 9870 | 10876 |
| 09/30/2019 | 9360 | 11003 | 9431 | 11059 |
| 10/31/2019 | 9552 | 11483 | 9628 | 11290 |
| 11/30/2019 | 10212 | 11954 | 10297 | 11716 |
| 12/31/2019 | 10476 | 12432 | 10568 | 12048 |
| 01/31/2020 | 11160 | 12805 | 11264 | 12068 |
| 02/29/2020 | 10844 | 12066 | 10942 | 11084 |
| 03/31/2020 | 9896 | 11152 | 9994 | 9624 |
| 04/30/2020 | 11760 | 12851 | 11879 | 10895 |
| 05/31/2020 | 13572 | 13662 | 13716 | 11480 |
| 06/30/2020 | 15140 | 14532 | 15310 | 11735 |
| 07/31/2020 | 16448 | 15608 | 16641 | 12406 |
| 08/31/2020 | 18020 | 17350 | 18237 | 13316 |
| 09/30/2020 | 17580 | 16366 | 17809 | 12833 |
| 10/31/2020 | 17968 | 15849 | 18209 | 12532 |
| 11/30/2020 | 20308 | 17609 | 20591 | 14006 |
| 12/31/2020 | 21708 | 18508 | 22017 | 14593 |
| 01/31/2021 | 22564 | 18568 | 22896 | 14484 |
| 02/28/2021 | 22852 | 18561 | 23197 | 14912 |
| 03/31/2021 | 20792 | 18834 | 21116 | 15459 |
| 04/30/2021 | 21924 | 19948 | 22276 | 16286 |
| 05/31/2021 | 21176 | 19716 | 21524 | 16346 |
| 06/30/2021 | 22816 | 20977 | 23205 | 16785 |
| 07/31/2021 | 21876 | 21568 | 22254 | 17143 |
| 08/31/2021 | 22660 | 22485 | 23063 | 17645 |
| 09/30/2021 | 21196 | 21207 | 21563 | 16840 |
| 10/31/2021 | 22540 | 22890 | 22931 | 18012 |
| 11/30/2021 | 20852 | 23322 | 21217 | 17773 |
| 12/31/2021 | 19740 | 23599 | 20092 | 18463 |
| 01/31/2022 | 16776 | 21596 | 17078 | 17390 |
| 02/28/2022 | 15848 | 20614 | 16142 | 16905 |
| 03/31/2022 | 15092 | 21497 | 15383 | 17461 |
| 04/30/2022 | 12480 | 18629 | 12725 | 15881 |
| 05/31/2022 | 11348 | 18343 | 11576 | 15841 |
| 06/30/2022 | 10832 | 16702 | 11055 | 14535 |
| 07/31/2022 | 11584 | 18807 | 11832 | 15895 |
| 08/31/2022 | 11568 | 17846 | 11821 | 15286 |
| 09/30/2022 | 10168 | 15964 | 10396 | 13865 |
| 10/31/2022 | 9984 | 16604 | 10210 | 14967 |
| 11/30/2022 | 10044 | 17536 | 10273 | 15768 |
| 12/31/2022 | 9748 | 15957 | 9976 | 14847 |
| 01/31/2023 | 11080 | 17659 | 11345 | 15848 |
| 02/28/2023 | 10680 | 17593 | 10942 | 15465 |
| 03/31/2023 | 11528 | 19271 | 11816 | 15957 |
| 04/30/2023 | 10924 | 19372 | 11200 | 16146 |
| 05/31/2023 | 12244 | 20870 | 12562 | 16237 |
| 06/30/2023 | 12832 | 22236 | 13169 | 17334 |
| 07/31/2023 | 13808 | 23090 | 14179 | 17932 |
| 08/31/2023 | 13096 | 22744 | 13455 | 17616 |
| 09/30/2023 | 12388 | 21601 | 12731 | 16790 |
| 10/31/2023 | 11996 | 21161 | 12333 | 16380 |
| 11/30/2023 | 13804 | 23451 | 14201 | 17918 |
| 12/31/2023 | 14584 | 24754 | 15012 | 18806 |
| 01/31/2024 | 14672 | 25222 | 15108 | 19065 |
| 02/29/2024 | 15524 | 26585 | 15987 | 20102 |
| 03/31/2024 | 15376 | 26913 | 15846 | 20748 |
| 04/30/2024 | 14812 | 25720 | 15271 | 19854 |
| 05/31/2024 | 14836 | 27364 | 15302 | 20790 |
| 06/30/2024 | 15768 | 29079 | 16268 | 21485 |
| 07/31/2024 | 15148 | 28615 | 15639 | 21789 |
| 08/31/2024 | 15756 | 28953 | 16273 | 22289 |
| 09/30/2024 | 16776 | 29696 | 17334 | 22762 |
| 10/31/2024 | 17028 | 29454 | 17605 | 22589 |
| 11/30/2024 | 18964 | 31019 | 19613 | 24031 |
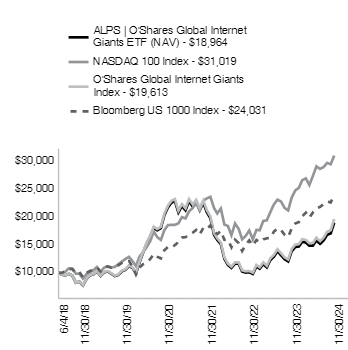
| ALPS O'Shares Global Internet Giants ETF - NAV | 37.38% | 13.18% | 10.36% |
| O'Shares Global Internet Giants Index | 38.11% | 13.75% | 10.94% |
| NASDAQ 100 Index | 32.27% | 21.01% | 19.05% |
| Bloomberg US 1000 Index‡ | 34.11% | 15.45% | 14.46% |
For the most current month-end performance data please visit www.alpsfunds.com or call 1-866-759-5679.
| |
‡ | This index represents a broad measure of market performance and has been added to comply with new regulatory requirements. |
| Net Assets | $135,110,351 |
| Number of Portfolio Holdings | 68 |
| Portfolio Turnover Rate | 44% |
| Total Advisory Fees Paid | $641,969 |
| Amazon.com, Inc. | 5.54% |
| Alphabet, Inc. | 5.45% |
| Meta Platforms, Inc. | 5.27% |
| Microsoft Corp. | 4.95% |
| AppLovin Corp. | 3.30% |
| Palantir Technologies, Inc. | 2.63% |
| Shopify, Inc. | 2.43% |
| ServiceNow, Inc. | 2.24% |
| Snowflake, Inc. | 1.95% |
| Crowdstrike Holdings, Inc. | 1.91% |
| Total % of Top 10 Holdings | 35.67% |
| Information Technology | 53.07% |
| Communication Services | 22.88% |
| Consumer Discretionary | 18.69% |
| Industrials | 2.57% |
| Real Estate | 1.93% |
| Health Care | 0.86% |
| Total | 100.00% |
| |
* | % of Total Investments (excluding investments purchased with collateral from securities loaned). |
Holdings are subject to change.
If you wish to view additional information about the Fund, including but not limited to the Fund's prospectus, financial information, holdings, and proxy voting information, please visit https://www.alpsfunds.com/exchange-traded-funds/ogig.
The Funds send only one report to a household if more than one account has the same address. If you do not want this policy to apply to you, or if you wish to receive a copy of this document at a new address, contact 1-866-759-5679.
ALPS | O'Shares Europe Quality Dividend ETF | ALPS ETF TRUST |
Cboe BZX: OEUR | |
CboeBZX
This annual shareholder report contains important information about ALPS | O'Shares Europe Quality Dividend ETF (the "Fund" or "OEUR") for the period of December 1, 2023 to November 30, 2024 (the "Period"). You can find additional information about the Fund at https://www.alpsfunds.com/exchange-traded-funds/oeur. You can also request this information by contacting us at 1-866-759-5679.
| ALPS | O'Shares Europe Quality Dividend ETF | $51 | 0.48% |
Performance Overview
The ALPS | O'Shares Europe Quality Dividend ETF (OEUR), for the trailing twelve-month period ended November 30, 2024, generated a NAV total return of 10.72%. The Fund outperformed the EURO STOXX 50 Index, which returned 8.80% for the same period.
Attribution
Top contributors to relative performance:
Underweight allocation to the Energy sector.
Overweight allocation to the United Kingdom, which overperformed.
Security selection of quality stocks within the Consumer Staples sector, which overperformed.
Software company, SAP SE (SAP GR, 4.56% weight*), provided the best individual contribution to OEUR's performance over the 1-year period (+1.86%).
Top detractors from relative performance:
Overweight allocation to the Consumer Staples sector.
Underweight allocation to Italy.
Security selection of quality names within the Consumer Discretionary sector, which underperformed.
Packaged food producer, Nestle S.A. (NESN SW, 3.87% weight*), provided the worst individual contribution to OEUR's performance over the 1-year period (-1.01%).
*Weights as of 11/30/2024, Bloomberg
The Fund's past performance is not a good predictor of the Fund's future performance. The chart and the table below do not reflect the deduction of taxes that a shareholder would pay on Fund distributions or sale of Fund shares.
| 08/18/2015 | 10000 | 10000 | 10000 | 10000 |
| 08/31/2015 | 9476 | 9499 | 9470 | 9522 |
| 09/30/2015 | 9187 | 8982 | 9179 | 9100 |
| 10/31/2015 | 9756 | 9808 | 9793 | 9725 |
| 11/30/2015 | 9536 | 9630 | 9544 | 9554 |
| 12/31/2015 | 9281 | 9237 | 9292 | 9335 |
| 01/31/2016 | 8939 | 8588 | 8948 | 8718 |
| 02/29/2016 | 8819 | 8346 | 8828 | 8594 |
| 03/31/2016 | 9315 | 8935 | 9332 | 9180 |
| 04/30/2016 | 9546 | 9098 | 9557 | 9409 |
| 05/31/2016 | 9519 | 9060 | 9534 | 9374 |
| 06/30/2016 | 9494 | 8482 | 9502 | 8931 |
| 07/31/2016 | 9644 | 8923 | 9664 | 9317 |
| 08/31/2016 | 9541 | 8989 | 9564 | 9355 |
| 09/30/2016 | 9541 | 9016 | 9573 | 9449 |
| 10/31/2016 | 8939 | 8959 | 8970 | |
| 11/30/2016 | 8568 | 8670 | 8602 | 8934 |
| 12/31/2016 | 8952 | 9302 | 8995 | 9413 |
| 01/31/2017 | 9036 | 9367 | 9082 | 9624 |
| 02/28/2017 | 9290 | 9475 | 9346 | 9735 |
| 03/31/2017 | 9631 | 10076 | 9689 | 10117 |
| 04/30/2017 | 9944 | 10460 | 10003 | 10529 |
| 05/31/2017 | 10574 | 10907 | 10636 | 11038 |
| 06/30/2017 | 10366 | 10734 | 10427 | 10925 |
| 07/31/2017 | 10461 | 11128 | 10528 | 11280 |
| 08/31/2017 | 10511 | 11141 | 10583 | 11311 |
| 09/30/2017 | 10713 | 11649 | 10814 | 11674 |
| 10/31/2017 | 10653 | 11739 | 10764 | 11723 |
| 11/30/2017 | 10759 | 11682 | 10878 | 11752 |
| 12/31/2017 | 10881 | 11559 | 11005 | 11954 |
| 01/31/2018 | 11252 | 12363 | 11385 | 12628 |
| 02/28/2018 | 10505 | 11546 | 10627 | 11918 |
| 03/31/2018 | 10522 | 11389 | 10639 | 11783 |
| 04/30/2018 | 10743 | 11838 | 10865 | 12077 |
| 05/31/2018 | 10402 | 11149 | 10514 | 11720 |
| 06/30/2018 | 10421 | 11129 | 10538 | 11646 |
| 07/31/2018 | 10839 | 11592 | 10976 | 12017 |
| 08/31/2018 | 10631 | 11099 | 10759 | 11691 |
| 09/30/2018 | 10610 | 11110 | 10770 | 11726 |
| 10/31/2018 | 9997 | 10202 | 10150 | 10812 |
| 11/30/2018 | 10069 | 10123 | 10225 | 10696 |
| 12/31/2018 | 9613 | 9681 | 9757 | 10201 |
| 01/31/2019 | 10177 | 10252 | 10343 | 10927 |
| 02/28/2019 | 10404 | 10624 | 10580 | 11262 |
| 03/31/2019 | 10590 | 10667 | 10763 | 11327 |
| 04/30/2019 | 10744 | 11214 | 10930 | 11750 |
| 05/31/2019 | 10331 | 10534 | 10494 | 11153 |
| 06/30/2019 | 10958 | 11411 | 11141 | 11895 |
| 07/31/2019 | 10751 | 11147 | 10931 | 11673 |
| 08/31/2019 | 10677 | 10907 | 10861 | 11358 |
| 09/30/2019 | 10927 | 11256 | 11136 | 11665 |
| 10/31/2019 | 11226 | 11644 | 11452 | 12083 |
| 11/30/2019 | 11360 | 11829 | 11598 | 12293 |
| 12/31/2019 | 11778 | 12187 | 12033 | 12819 |
| 01/31/2020 | 11640 | 11711 | 11897 | 12492 |
| 02/29/2020 | 10504 | 10626 | 10726 | 11316 |
| 03/31/2020 | 9344 | 8894 | 9504 | 9575 |
| 04/30/2020 | 9755 | 9351 | 9936 | 10221 |
| 05/31/2020 | 10104 | 9946 | 10296 | 10743 |
| 06/30/2020 | 10362 | 10685 | 10590 | 11152 |
| 07/31/2020 | 10818 | 11069 | 11063 | 11616 |
| 08/31/2020 | 11236 | 11552 | 11497 | 12122 |
| 09/30/2020 | 11066 | 11063 | 11346 | 11720 |
| 10/31/2020 | 10290 | 10186 | 10541 | 11054 |
| 11/30/2020 | 11433 | 12352 | 11734 | 12965 |
| 12/31/2020 | 11800 | 12858 | 12116 | 13666 |
| 01/31/2021 | 11719 | 12527 | 12031 | 13490 |
| 02/28/2021 | 11633 | 13085 | 11948 | 13839 |
| 03/31/2021 | 12138 | 13668 | 12469 | 14232 |
| 04/30/2021 | 12766 | 14255 | 13114 | 14925 |
| 05/31/2021 | 13418 | 14811 | 13755 | 15577 |
| 06/30/2021 | 13442 | 14464 | 13817 | 15346 |
| 07/31/2021 | 14017 | 14567 | 14418 | 15671 |
| 08/31/2021 | 14209 | 14883 | 14622 | 15963 |
| 09/30/2021 | 13234 | 14114 | 13637 | 15210 |
| 10/31/2021 | 13799 | 14819 | 14224 | 15866 |
| 11/30/2021 | 13401 | 13789 | 13822 | 15009 |
| 12/31/2021 | 14321 | 14741 | 14781 | 15951 |
| 01/31/2022 | 13038 | 14127 | 13457 | 15126 |
| 02/28/2022 | 12733 | 13317 | 13144 | 14536 |
| 03/31/2022 | 12729 | 13131 | 13125 | 14393 |
| 04/30/2022 | 12152 | 12191 | 12531 | 13547 |
| 05/31/2022 | 11971 | 12488 | 12348 | 13651 |
| 06/30/2022 | 11117 | 11119 | 11443 | 12233 |
| 07/31/2022 | 11815 | 11652 | 12201 | 12867 |
| 08/31/2022 | 10851 | 10905 | 11206 | 12045 |
| 09/30/2022 | 9996 | 10033 | 10331 | 10933 |
| 10/31/2022 | 10669 | 11041 | 11039 | 11737 |
| 11/30/2022 | 11980 | 12618 | 12405 | 13080 |
| 12/31/2022 | 11743 | 12521 | 12159 | 13127 |
| 01/31/2023 | 12736 | 14001 | 13201 | 14254 |
| 02/28/2023 | 12518 | 13932 | 12975 | 14181 |
| 03/31/2023 | 13420 | 14551 | 13910 | 14456 |
| 04/30/2023 | 14004 | 15029 | 14518 | 15062 |
| 05/31/2023 | 13510 | 14192 | 13993 | 14216 |
| 06/30/2023 | 14092 | 15154 | 14607 | 14885 |
| 07/31/2023 | 14213 | 15581 | 14732 | 15395 |
| 08/31/2023 | 13669 | 14750 | 14170 | 14784 |
| 09/30/2023 | 13032 | 13987 | 13521 | 14178 |
| 10/31/2023 | 12667 | 13594 | 13148 | |
| 11/30/2023 | 13896 | 15160 | 14445 | 15008 |
| 12/31/2023 | 14670 | 15841 | 15256 | 15798 |
| 01/31/2024 | 14774 | 16034 | 15419 | 15753 |
| 02/29/2024 | 15293 | 16779 | 15919 | 15971 |
| 03/31/2024 | 15594 | 17471 | 16238 | 16585 |
| 04/30/2024 | 15125 | 16875 | 15743 | 16326 |
| 05/31/2024 | 15823 | 17496 | 16466 | 17191 |
| 06/30/2024 | 15793 | 16973 | 16444 | 16780 |
| 07/31/2024 | 15966 | 17082 | 16625 | 17194 |
| 08/31/2024 | 16651 | 17787 | 17352 | 17828 |
| 09/30/2024 | 16688 | 18098 | 17409 | 17918 |
| 10/31/2024 | 15701 | 17016 | 16381 | 16841 |
| 11/30/2024 | 15386 | 16494 | 16080 | 16588 |
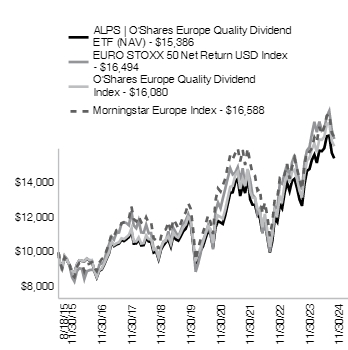
| ALPS O'Shares Europe Quality Dividend ETF - NAV | 10.72% | 6.26% | 4.75% |
| O'Shares Europe Quality Dividend Index* | 11.32% | 6.75% | 5.25% |
| EURO STOXX 50 Net Return USD Index | 8.80% | 6.88% | 5.54% |
| Morningstar Europe Index‡ | 10.52% | 6.17% | 5.60% |
For the most current month end performance data please visit www.alpsfunds.com or call 1-866-759-5679.
| |
* | The O'Shares Europe Quality Dividend Index performance information reflects the blended performance of the FTSE Developed Europe Qual/Vol/Yield 5% Capped Factor Index through May 31, 2020 and the O'Shares Europe Quality Dividend Index thereafter. |
‡ | This index represents a broad measure of market performance and has been added to comply with new regulatory requirements. |
| Net Assets | $35,170,980 |
| Number of Portfolio Holdings | 51 |
| Portfolio Turnover Rate | 29% |
| Total Advisory Fees Paid | $186,379 |
| SAP SE | 4.56% |
| Novo Nordisk A/S | 4.20% |
| Roche Holding AG | 3.99% |
| Novartis AG | 3.86% |
| Nestle SA | 3.86% |
| LVMH Moet Hennessy Louis Vuitton SE | 3.46% |
| Siemens AG | 3.32% |
| Unilever PLC | 3.32% |
| Deutsche Telekom AG | 2.92% |
| RELX PLC | 2.91% |
| Total % of Top 10 Holdings | 36.40% |
| Industrials | 28.40% |
| Health Care | 16.99% |
| Consumer Staples | 14.97% |
| Financials | 10.06% |
| Consumer Discretionary | 9.35% |
| Information Technology | 7.07% |
| Communication Services | 6.83% |
| Utilities | 6.21% |
| Money Market Fund | 0.12% |
| Total | 100.00% |
| Great Britain | 22.06% |
| France | 18.31% |
| Switzerland | 17.34% |
| Germany | 13.97% |
| Netherlands | 7.65% |
| Sweden | 6.24% |
| Spain | 5.65% |
| Denmark | 4.20% |
| Finland | 2.88% |
| Ireland | 1.57% |
| United States | 0.12% |
| Total | 100.00% |
| |
** | % of Total Investments (excluding investments purchased with collateral from securities loaned). |
Holdings are subject to change.
If you wish to view additional information about the Fund, including but not limited to the Fund's prospectus, financial information, holdings, and proxy voting information, please visit https://www.alpsfunds.com/exchange-traded-funds/oeur.
The Funds send only one report to a household if more than one account has the same address. If you do not want this policy to apply to you, or if you wish to receive a copy of this document at a new address, contact 1-866-759-5679.
Barron's 400SM ETF | ALPS ETF TRUST |
NYSE ARCA: BFOR NYSEARCA | |
This annual shareholder report contains important information about Barron's 400SM ETF (the "Fund" or "BFOR") for the period of December 1, 2023 to November 30, 2024 (the "Period"). You can find additional information about the Fund at https://www.alpsfunds.com/exchange-traded-funds/bfor. You can also request this information by contacting us at 1-866-759-5679.
The Barron's 400 ETF (Arca: BFOR) returned 38.15% at net asset value (NAV) for the 12 months ended November 30, 2024. The Fund outperformed its Bloomberg US 1000 Index, which returned 34.11% (on a total return basis) over the same period.
Top contributors to relative performance:
Overweight allocation to small cap growth stocks resulted in 5.33% of outperformance over the benchmark.
Overweight allocation to growth stocks, irrespective of size, resulted in 3.14% of outperformance relative to the benchmark.
Stock selection resulted in 204 basis points of additional performance over the benchmark.
Top detractors from relative performance:
Underweight allocation to large cap value stocks subtracted 2.19% of performance relative to the benchmark.
Underweight allocation to large cap growth stocks subtracted 2.20% of performance relative to the benchmark.
Underweight allocation to large cap stocks, irrespective of size, subtracted 4.39% of performance relative to the benchmark.
The Fund's past performance is not a good predictor of the Fund's future performance. The chart and the table below do not reflect the deduction of taxes that a shareholder would pay on Fund distributions or sale of Fund shares.
| 11/30/2014 | 10000 | 10000 | 10000 |
| 12/31/2014 | 10030 | 10036 | 9976 |
| 01/31/2015 | 9741 | 9751 | 9704 |
| 02/28/2015 | 10409 | 10427 | 10262 |
| 03/31/2015 | 10568 | 10596 | 10135 |
| 04/30/2015 | 10540 | 10572 | 10201 |
| 05/31/2015 | 10597 | 10634 | 10340 |
| 06/30/2015 | 10578 | 10620 | 10144 |
| 07/31/2015 | 10495 | 10542 | 10341 |
| 08/31/2015 | 9922 | 9971 | 9720 |
| 09/30/2015 | 9442 | 9495 | 9454 |
| 10/31/2015 | 10002 | 10063 | 10214 |
| 11/30/2015 | 10107 | 10176 | 10249 |
| 12/31/2015 | 9654 | 9725 | 10071 |
| 01/31/2016 | 8951 | 9021 | 9525 |
| 02/29/2016 | 9093 | 9167 | 9518 |
| 03/31/2016 | 9712 | 9800 | 10176 |
| 04/30/2016 | 9760 | 9855 | 10231 |
| 05/31/2016 | 9902 | 10004 | 10421 |
| 06/30/2016 | 9770 | 9876 | 10445 |
| 07/31/2016 | 10271 | 10391 | 10845 |
| 08/31/2016 | 10399 | 10525 | 10860 |
| 09/30/2016 | 10370 | 10501 | 10871 |
| 10/31/2016 | 10065 | 10196 | 10657 |
| 11/30/2016 | 11029 | 11180 | 11074 |
| 12/31/2016 | 11338 | 11500 | 11281 |
| 01/31/2017 | 11483 | 11653 | 11509 |
| 02/28/2017 | 11768 | 11947 | 11953 |
| 03/31/2017 | 11855 | 12043 | 11964 |
| 04/30/2017 | 12059 | 12255 | 12093 |
| 05/31/2017 | 12014 | 12215 | 12251 |
| 06/30/2017 | 12218 | 12430 | 12341 |
| 07/31/2017 | 12344 | 12564 | 12584 |
| 08/31/2017 | 12201 | 12426 | 12619 |
| 09/30/2017 | 12842 | 13086 | 12890 |
| 10/31/2017 | 13085 | 13340 | 13189 |
| 11/30/2017 | 13441 | 13707 | 13590 |
| 12/31/2017 | 13485 | 13761 | 13738 |
| 01/31/2018 | 14041 | 14335 | 14499 |
| 02/28/2018 | 13488 | 13775 | 13968 |
| 03/31/2018 | 13524 | 13819 | 13654 |
| 04/30/2018 | 13478 | 13780 | 13697 |
| 05/31/2018 | 14041 | 14364 | 14049 |
| 06/30/2018 | 14064 | 14391 | 14139 |
| 07/31/2018 | 14347 | 14687 | 14626 |
| 08/31/2018 | 14976 | 15341 | 15115 |
| 09/30/2018 | 14640 | 15006 | 15167 |
| 10/31/2018 | 13039 | 13371 | 14083 |
| 11/30/2018 | 13156 | 13499 | 14384 |
| 12/31/2018 | 11671 | 11978 | 13069 |
| 01/31/2019 | 12940 | 13284 | 14174 |
| 02/28/2019 | 13515 | 13878 | 14660 |
| 03/31/2019 | 13183 | 13545 | 14907 |
| 04/30/2019 | 13731 | 14117 | 15509 |
| 05/31/2019 | 12335 | 12686 | 14534 |
| 06/30/2019 | 13304 | 13693 | 15546 |
| 07/31/2019 | 13396 | 13795 | 15796 |
| 08/31/2019 | 12683 | 13066 | 15514 |
| 09/30/2019 | 13064 | 13472 | 15775 |
| 10/31/2019 | 13288 | 13709 | 16106 |
| 11/30/2019 | 13814 | 14260 | 16713 |
| 12/31/2019 | 14157 | 14622 | 17186 |
| 01/31/2020 | 13694 | 14152 | 17216 |
| 02/29/2020 | 12463 | 12886 | 15812 |
| 03/31/2020 | 10349 | 10704 | 13728 |
| 04/30/2020 | 11857 | 12274 | 15542 |
| 05/31/2020 | 12804 | 13264 | 16376 |
| 06/30/2020 | 12982 | 13454 | 16741 |
| 07/31/2020 | 13707 | 14215 | 17698 |
| 08/31/2020 | 14286 | 14827 | 18996 |
| 09/30/2020 | 13885 | 14419 | 18307 |
| 10/31/2020 | 14021 | 14566 | 17878 |
| 11/30/2020 | 15655 | 16276 | 19980 |
| 12/31/2020 | 16628 | 17298 | 20817 |
| 01/31/2021 | 16898 | 17593 | 20661 |
| 02/28/2021 | 17834 | 18578 | 21273 |
| 03/31/2021 | 18819 | 19617 | 22052 |
| 04/30/2021 | 19498 | 20334 | 23232 |
| 05/31/2021 | 19775 | 20634 | 23318 |
| 06/30/2021 | 19842 | 20712 | 23944 |
| 07/31/2021 | 20049 | 20938 | 24455 |
| 08/31/2021 | 20406 | 21323 | 25172 |
| 09/30/2021 | 19680 | 20576 | 24022 |
| 10/31/2021 | 20950 | 21918 | 25694 |
| 11/30/2021 | 20850 | 21819 | 25354 |
| 12/31/2021 | 21713 | 22738 | 26337 |
| 01/31/2022 | 19956 | 20910 | 24807 |
| 02/28/2022 | 19939 | 20903 | 24115 |
| 03/31/2022 | 19996 | 20988 | 24908 |
| 04/30/2022 | 18560 | 19484 | 22655 |
| 05/31/2022 | 19096 | 20058 | 22598 |
| 06/30/2022 | 16989 | 17845 | 20734 |
| 07/31/2022 | 18921 | 19897 | 22675 |
| 08/31/2022 | 18230 | 19177 | 21806 |
| 09/30/2022 | 16564 | 17430 | 19779 |
| 10/31/2022 | 18432 | 19413 | 21351 |
| 11/30/2022 | 19562 | 20615 | 22493 |
| 12/31/2022 | 18271 | 19265 | 21180 |
| 01/31/2023 | 19834 | 20918 | 22607 |
| 02/28/2023 | 19536 | 20608 | 22061 |
| 03/31/2023 | 18675 | 19724 | 22764 |
| 04/30/2023 | 18288 | 19321 | 23033 |
| 05/31/2023 | 17904 | 18908 | 23162 |
| 06/30/2023 | 19608 | 20728 | 24727 |
| 07/31/2023 | 20749 | 21947 | 25581 |
| 08/31/2023 | 20142 | 21308 | 25129 |
| 09/30/2023 | 19330 | 20458 | 23952 |
| 10/31/2023 | 18459 | 19544 | 23367 |
| 11/30/2023 | 19889 | 21066 | 25561 |
| 12/31/2023 | 21594 | 22895 | 26827 |
| 01/31/2024 | 21452 | 22755 | 27197 |
| 02/29/2024 | 22621 | 24008 | 28675 |
| 03/31/2024 | 23558 | 25021 | 29597 |
| 04/30/2024 | 22288 | 23672 | 28322 |
| 05/31/2024 | 23225 | 24681 | 29658 |
| 06/30/2024 | 23013 | 24468 | 30650 |
| 07/31/2024 | 24540 | 26112 | 31083 |
| 08/31/2024 | 24537 | 26123 | 31796 |
| 09/30/2024 | 24891 | 26514 | 32471 |
| 10/31/2024 | 24832 | 26466 | 32224 |
| 11/30/2024 | 27476 | 29304 | 34281 |
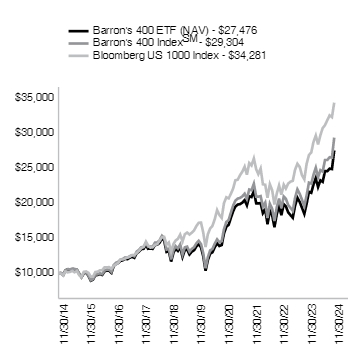
| Barron's 400 ETF - NAV | 38.15% | 14.74% | 10.64% |
| Barron's 400 IndexSM | 39.11% | 15.49% | 11.35% |
| Bloomberg US 1000 Index‡ | 34.11% | 15.45% | 13.11% |
For the most current month-end performance data please visit www.alpsfunds.com or call 1-866-759-5679.
| |
‡ | This index represents a broad measure of market performance and has been added to comply with new regulatory requirements. |
| Net Assets | $162,300,505 |
| Number of Portfolio Holdings | 400 |
| Portfolio Turnover Rate | 90% |
| Total Advisory Fees Paid | $918,924 |
| AppLovin Corp. | 0.64% |
| Sezzle, Inc. | 0.61% |
| Centrus Energy Corp. | 0.50% |
| IES Holdings, Inc. | 0.42% |
| Texas Pacific Land Corp. | 0.42% |
| United Airlines Holdings, Inc. | 0.42% |
| Palantir Technologies, Inc. | 0.41% |
| United States Lime & Minerals, Inc. | 0.40% |
| Paymentus Holdings, Inc. | 0.39% |
| Argan, Inc. | 0.38% |
| Total % of Top 10 Holdings | 4.59% |
| Financials | 21.84% |
| Industrials | 19.48% |
| Information Technology | 14.51% |
| Consumer Discretionary | 12.03% |
| Energy | 10.27% |
| Health Care | 8.07% |
| Consumer Staples | 4.72% |
| Materials | 4.56% |
| Communication Services | 2.48% |
| Utilities | 1.70% |
| Money Market Fund | 0.34% |
| Total | 100.00% |
| |
* | % of Total Investments (excluding investments purchased with collateral from securities loaned). |
Holdings are subject to change.
If you wish to view additional information about the Fund, including but not limited to the Fund's prospectus, financial information, holdings, and proxy voting information, please visit https://www.alpsfunds.com/exchange-traded-funds/bfor.
The Funds send only one report to a household if more than one account has the same address. If you do not want this policy to apply to you, or if you wish to receive a copy of this document at a new address, contact 1-866-759-5679.
Level Four Large Cap Growth Active ETF | ALPS ETF TRUST |
NASDAQ: LGRO | |
This annual shareholder report contains important information about Level Four Large Cap Growth Active ETF (the "Fund" or "LGRO") for the period of December 1, 2023 to November 30, 2024 (the "Period"). You can find additional information about the Fund at https://www.alpsfunds.com/exchange-traded-funds/lgro. You can also request this information by contacting us at 1-866-759-5679.
| Level Four Large Cap Growth Active ETF | $59 | 0.50% |
The Level Four Large Cap Growth Active ETF returned 34.63% for the 12 months ended November 30, 2024. The Fund underperformed the Bloomberg US 1000 Growth Index, which returned 36.48% for the Period.
Top contributors to relative performance:
Strong security selection across a diverse group of holdings, notably within the Real Estate and Consumer Discretionary sectors.
Underweight allocation to the Health Care sector, which underperformed.
Top detractors from relative performance:
The Fund's past performance is not a good predictor of the Fund's future performance. The chart and the table below do not reflect the deduction of taxes that a shareholder would pay on Fund distributions or sale of Fund shares.
| 08/22/2023 | 10000 | 10000 | 10000 |
| 08/31/2023 | 10344 | 10292 | 10342 |
| 09/30/2023 | 9740 | 9809 | 9777 |
| 10/31/2023 | 9408 | 9570 | 9559 |
| 11/30/2023 | 10536 | 10468 | 10580 |
| 12/31/2023 | 11301 | 10987 | 11081 |
| 01/31/2024 | 11441 | 11138 | 11294 |
| 02/29/2024 | 11850 | 11744 | 12033 |
| 03/31/2024 | 12241 | 12121 | 12272 |
| 04/30/2024 | 11571 | 11599 | 11739 |
| 05/31/2024 | 11964 | 12146 | 12380 |
| 06/30/2024 | 12519 | 12552 | 13031 |
| 07/31/2024 | 12603 | 12730 | 13017 |
| 08/31/2024 | 12776 | 13022 | 13314 |
| 09/30/2024 | 13255 | 13298 | 13666 |
| 10/31/2024 | 13239 | 13197 | 13555 |
| 11/30/2024 | 14185 | 14040 | 14440 |
| Level Four Large Cap Growth Active ETF - NAV | 34.63% | 31.57% |
| Bloomberg US 1000 Growth Index | 36.48% | 33.43% |
| Bloomberg US 1000 Index‡ | 34.11% | 30.52% |
For the most current month-end performance data please visit www.alpsfunds.com or call 1-866-759-5679.
| |
‡ | This index represents a broad measure of market performance and has been added to comply with new regulatory requirements. |
| Net Assets | $92,645,799 |
| Number of Portfolio Holdings | 47 |
| Portfolio Turnover Rate | 8% |
| Total Advisory Fees Paid | $403,937 |
| Apple, Inc. | 7.20% |
| Microsoft Corp. | 5.64% |
| Amazon.com, Inc. | 5.46% |
| Alphabet, Inc. | 4.62% |
| NVIDIA Corp. | 3.94% |
| Booking Holdings, Inc. | 3.69% |
| Snowflake, Inc. | 3.46% |
| Blackrock, Inc. | 3.34% |
| PayPal Holdings, Inc. | 3.30% |
| Meta Platforms, Inc. | 3.25% |
| Total % of Top 10 Holdings | 43.90% |
| Information Technology | 40.75% |
| Consumer Discretionary | 16.43% |
| Financials | 15.02% |
| Communication Services | 11.06% |
| Industrials | 7.40% |
| Health Care | 5.27% |
| Real Estate | 1.62% |
| Energy | 1.11% |
| Consumer Staples | 1.05% |
| Money Market Fund | 0.29% |
| Total | 100.00% |
Holdings are subject to change.
If you wish to view additional information about the Fund, including but not limited to the Fund's prospectus, financial information, holdings, and proxy voting information, please visit https://www.alpsfunds.com/exchange-traded-funds/lgro.
The Funds send only one report to a household if more than one account has the same address. If you do not want this policy to apply to you, or if you wish to receive a copy of this document at a new address, contact 1-866-759-5679.
RiverFront Dynamic Core Income ETF | ALPS ETF TRUST |
NYSE ARCA: RFCI | |
This annual shareholder report contains important information about RiverFront Dynamic Core Income ETF (the "Fund" or "RFCI") for the period of December 1, 2023 to November 30, 2024 (the "Period"). You can find additional information about the Fund at https://www.alpsfunds.com/exchange-traded-funds/rfci. You can also request this information by contacting us at 1-866-759-5679.
| RiverFront Dynamic Core Income ETF | $53 | 0.51% |
The RiverFront Dynamic Core Income Fund returned 7.80% at net asset value for the 12 months ended 11/30/24. The fund outperformed its benchmark, the Bloomberg US Aggregate Bond Index, which returned 6.88% over the same period.
• Top contributors to relative performance:
Overweight allocation to high yield bonds
Overweight allocation to investment grade corporate bonds
Treasury selection, longer maturities
• Top detractors from relative performance:
Corporate bond selection, shorter maturities
Underweight allocation to mortgage-backed securities
Cash was a drag on performance
The Fund's past performance is not a good predictor of the Fund's future performance. The chart and the table below do not reflect the deduction of taxes that a shareholder would pay on Fund distributions or sale of Fund shares.
| 06/13/2016 | 10000 | 10000 |
| 06/30/2016 | 10068 | 10072 |
| 07/31/2016 | 10145 | 10135 |
| 08/31/2016 | 10146 | 10124 |
| 09/30/2016 | 10114 | 10118 |
| 10/31/2016 | 10054 | 10040 |
| 11/30/2016 | 9823 | 9803 |
| 12/31/2016 | 9848 | 9817 |
| 01/31/2017 | 9876 | 9836 |
| 02/28/2017 | 9927 | 9902 |
| 03/31/2017 | 9918 | 9897 |
| 04/30/2017 | 9998 | 9973 |
| 05/31/2017 | 10056 | 10050 |
| 06/30/2017 | 10049 | 10040 |
| 07/31/2017 | 10116 | 10083 |
| 08/31/2017 | 10164 | 10173 |
| 09/30/2017 | 10140 | 10125 |
| 10/31/2017 | 10162 | 10131 |
| 11/30/2017 | 10132 | 10118 |
| 12/31/2017 | 10170 | 10164 |
| 01/31/2018 | 10069 | 10047 |
| 02/28/2018 | 9971 | 9952 |
| 03/31/2018 | 9983 | 10016 |
| 04/30/2018 | 9945 | 9941 |
| 05/31/2018 | 10005 | 10012 |
| 06/30/2018 | 9984 | 10000 |
| 07/31/2018 | 10017 | 10002 |
| 08/31/2018 | 10087 | 10067 |
| 09/30/2018 | 10039 | 10002 |
| 10/31/2018 | 9947 | 9923 |
| 11/30/2018 | 9956 | 9982 |
| 12/31/2018 | 10092 | 10165 |
| 01/31/2019 | 10247 | 10273 |
| 02/28/2019 | 10261 | 10267 |
| 03/31/2019 | 10448 | 10465 |
| 04/30/2019 | 10446 | 10467 |
| 05/31/2019 | 10612 | 10653 |
| 06/30/2019 | 10735 | 10787 |
| 07/31/2019 | 10755 | 10811 |
| 08/31/2019 | 11017 | 11091 |
| 09/30/2019 | 10959 | 11032 |
| 10/31/2019 | 10986 | 11065 |
| 11/30/2019 | 10973 | 11059 |
| 12/31/2019 | 10956 | 11052 |
| 01/31/2020 | 11147 | 11264 |
| 02/29/2020 | 11312 | 11467 |
| 03/31/2020 | 11159 | 11399 |
| 04/30/2020 | 11414 | 11602 |
| 05/31/2020 | 11490 | 11656 |
| 06/30/2020 | 11558 | 11730 |
| 07/31/2020 | 11687 | 11905 |
| 08/31/2020 | 11611 | 11809 |
| 09/30/2020 | 11611 | 11802 |
| 10/31/2020 | 11550 | 11750 |
| 11/30/2020 | 11628 | 11865 |
| 12/31/2020 | 11641 | 11881 |
| 01/31/2021 | 11547 | 11796 |
| 02/28/2021 | 11363 | 11626 |
| 03/31/2021 | 11250 | 11480 |
| 04/30/2021 | 11315 | 11571 |
| 05/31/2021 | 11372 | 11609 |
| 06/30/2021 | 11448 | 11691 |
| 07/31/2021 | 11565 | 11821 |
| 08/31/2021 | 11547 | 11799 |
| 09/30/2021 | 11451 | 11697 |
| 10/31/2021 | 11432 | 11693 |
| 11/30/2021 | 11452 | 11728 |
| 12/31/2021 | 11470 | 11698 |
| 01/31/2022 | 11209 | 11446 |
| 02/28/2022 | 11080 | 11318 |
| 03/31/2022 | 10859 | 11004 |
| 04/30/2022 | 10605 | 10586 |
| 05/31/2022 | 10661 | 10654 |
| 06/30/2022 | 10480 | 10487 |
| 07/31/2022 | 10722 | 10744 |
| 08/31/2022 | 10502 | 10440 |
| 09/30/2022 | 10177 | 9989 |
| 10/31/2022 | 10149 | 9860 |
| 11/30/2022 | 10419 | 10222 |
| 12/31/2022 | 10404 | 10176 |
| 01/31/2023 | 10629 | 10489 |
| 02/28/2023 | 10418 | 10218 |
| 03/31/2023 | 10614 | 10477 |
| 04/30/2023 | 10690 | 10541 |
| 05/31/2023 | 10581 | 10426 |
| 06/30/2023 | 10585 | 10389 |
| 07/31/2023 | 10622 | 10382 |
| 08/31/2023 | 10561 | 10315 |
| 09/30/2023 | 10342 | 10053 |
| 10/31/2023 | 10226 | 9895 |
| 11/30/2023 | 10640 | 10343 |
| 12/31/2023 | 11019 | 10739 |
| 01/31/2024 | 11004 | 10709 |
| 02/29/2024 | 10895 | 10558 |
| 03/31/2024 | 11005 | 10655 |
| 04/30/2024 | 10791 | 10386 |
| 05/31/2024 | 10948 | 10562 |
| 06/30/2024 | 11069 | 10662 |
| 07/31/2024 | 11245 | 10911 |
| 08/31/2024 | 11414 | 11068 |
| 09/30/2024 | 11532 | 11216 |
| 10/31/2024 | 11351 | 10938 |
| 11/30/2024 | 11471 | 11054 |
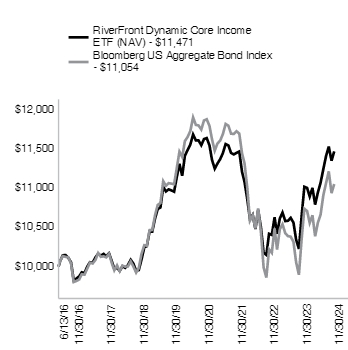
| RiverFront Dynamic Core Income ETF - NAV | 7.80% | 0.89% | 1.63% |
| Bloomberg US Aggregate Bond Index‡ | 6.88% | -0.01% | 1.19% |
For the most current month-end performance data please visit www.alpsfunds.com or call 1-866-759-5679.
| |
‡ | This index represents a broad measure of market performance for purposes of new regulatory requirements. |
| Net Assets | $22,626,468 |
| Number of Portfolio Holdings | 44 |
| Portfolio Turnover Rate | 17% |
| Total Advisory Fees Paid | $126,160 |
| U.S. Treasury Bond 11/15/2043 4.75% | 11.09% |
| Blue Owl Credit Income Corp. 01/15/2029 7.75% | 4.23% |
| U.S. Treasury Bond 11/15/2052 4.00% | 4.14% |
| Kinetik Holdings LP 12/15/2028 6.625% | 4.06% |
| U.S. Treasury Bond 08/15/2029 6.125% | 3.70% |
| General Motors Financial Co., Inc. 01/09/2033 6.40% | 3.61% |
| Ingersoll Rand, Inc. 08/14/2033 5.70% | 3.55% |
| Hyatt Hotels Corp. 04/23/2030 5.75% | 3.52% |
| Concentrix Corp. 08/02/2033 6.85% | 3.50% |
| Bank of America Corp. 12/31/9999 5Y US TI + 3.23% | 2.51% |
| Total % of Top 10 Holdings | 43.91% |
| Financials | 24.34% |
| Government | 21.80% |
| Consumer Discretionary | 15.34% |
| Energy | 8.48% |
| Utilities | 8.41% |
| Technology | 6.83% |
| Industrials | 5.11% |
| Consumer Staples | 1.80% |
| Health Care | 1.33% |
| Communications | 1.16% |
| Materials | 0.96% |
| Money Market Fund | 4.44% |
| Total | 100.00% |
| |
* | % of Total Investments. |
^ | Excludes Money Market Fund. |
Holdings are subject to change.
If you wish to view additional information about the Fund, including but not limited to the Fund's prospectus, financial information, holdings, and proxy voting information, please visit https://www.alpsfunds.com/exchange-traded-funds/rfci.
The Funds send only one report to a household if more than one account has the same address. If you do not want this policy to apply to you, or if you wish to receive a copy of this document at a new address, contact 1-866-759-5679.
RiverFront Dynamic US Dividend Advantage ETF | ALPS ETF TRUST |
NYSE ARCA: RFDA | |
This annual shareholder report contains important information about RiverFront Dynamic US Dividend Advantage ETF (the "Fund" or "RFDA") for the period of December 1, 2023 to November 30, 2024 (the "Period"). You can find additional information about the Fund at https://www.alpsfunds.com/exchange-traded-funds/rfda. You can also request this information by contacting us at 1-866-759-5679.
| RiverFront Dynamic US Dividend Advantage ETF | $60 | 0.52% |
Performance Highlights
The RiverFront Dynamic US Dividend Advantage Fund returned 30.90% at net asset value for the 12 months ended 11/30/24. The fund underperformed its benchmark, the S&P 500 Index, which returned 33.89% over the same period.
• Top contributors to relative performance:
Underweight allocation to the Healthcare sector
Security selection within the Energy sector
Security selection within the Technology sector
• Top detractors from relative performance:
Security selection within the Financials sector
Overweight allocation to the Energy Sector
Underweight allocation to the Technology Sector
The Fund's past performance is not a good predictor of the Fund's future performance. The chart and the table below do not reflect the deduction of taxes that a shareholder would pay on Fund distributions or sale of Fund shares.
| 06/06/2016 | 10000 | 10000 |
| 06/30/2016 | 10052 | 9964 |
| 07/31/2016 | 10337 | 10331 |
| 08/31/2016 | 10302 | 10345 |
| 09/30/2016 | 10383 | 10347 |
| 10/31/2016 | 10106 | 10159 |
| 11/30/2016 | 10664 | 10535 |
| 12/31/2016 | 10828 | 10743 |
| 01/31/2017 | 10984 | 10947 |
| 02/28/2017 | 11305 | 11381 |
| 03/31/2017 | 11250 | 11395 |
| 04/30/2017 | 11303 | 11512 |
| 05/31/2017 | 11426 | 11674 |
| 06/30/2017 | 11522 | 11747 |
| 07/31/2017 | 11796 | 11988 |
| 08/31/2017 | 11745 | 12025 |
| 09/30/2017 | 12240 | 12273 |
| 10/31/2017 | 12462 | 12559 |
| 11/30/2017 | 12849 | 12944 |
| 12/31/2017 | 12966 | 13088 |
| 01/31/2018 | 13624 | 13838 |
| 02/28/2018 | 13094 | 13328 |
| 03/31/2018 | 12887 | 12989 |
| 04/30/2018 | 12927 | 13039 |
| 05/31/2018 | 13271 | 13353 |
| 06/30/2018 | 13364 | 13435 |
| 07/31/2018 | 13664 | 13935 |
| 08/31/2018 | 14029 | 14389 |
| 09/30/2018 | 13868 | 14471 |
| 10/31/2018 | 12786 | 13482 |
| 11/30/2018 | 13036 | 13757 |
| 12/31/2018 | 11814 | 12515 |
| 01/31/2019 | 12904 | 13517 |
| 02/28/2019 | 13303 | 13951 |
| 03/31/2019 | 13529 | 14223 |
| 04/30/2019 | 13902 | 14798 |
| 05/31/2019 | 12784 | 13858 |
| 06/30/2019 | 13666 | 14835 |
| 07/31/2019 | 13794 | 15048 |
| 08/31/2019 | 13443 | 14809 |
| 09/30/2019 | 13918 | 15087 |
| 10/31/2019 | 14225 | 15413 |
| 11/30/2019 | 14507 | 15973 |
| 12/31/2019 | 14990 | 16455 |
| 01/31/2020 | 14844 | 16448 |
| 02/29/2020 | 13556 | 15094 |
| 03/31/2020 | 11667 | 13230 |
| 04/30/2020 | 13081 | 14926 |
| 05/31/2020 | 13690 | 15637 |
| 06/30/2020 | 14033 | 15948 |
| 07/31/2020 | 14740 | 16847 |
| 08/31/2020 | 15667 | 18058 |
| 09/30/2020 | 15148 | 17372 |
| 10/31/2020 | 14586 | 16910 |
| 11/30/2020 | 16092 | 18761 |
| 12/31/2020 | 16680 | 19482 |
| 01/31/2021 | 16474 | 19286 |
| 02/28/2021 | 16830 | 19818 |
| 03/31/2021 | 17688 | 20685 |
| 04/30/2021 | 18521 | 21789 |
| 05/31/2021 | 18703 | 21942 |
| 06/30/2021 | 19067 | 22454 |
| 07/31/2021 | 19538 | 22987 |
| 08/31/2021 | 19965 | 23686 |
| 09/30/2021 | 18908 | 22585 |
| 10/31/2021 | 20008 | 24167 |
| 11/30/2021 | 19814 | 23999 |
| 12/31/2021 | 20975 | 25075 |
| 01/31/2022 | 20823 | 23777 |
| 02/28/2022 | 20616 | 23065 |
| 03/31/2022 | 21424 | 23922 |
| 04/30/2022 | 20449 | 21836 |
| 05/31/2022 | 21080 | 21876 |
| 06/30/2022 | 19330 | 20070 |
| 07/31/2022 | 20652 | 21921 |
| 08/31/2022 | 19766 | 21027 |
| 09/30/2022 | 17623 | 19090 |
| 10/31/2022 | 19235 | 20636 |
| 11/30/2022 | 20381 | 21789 |
| 12/31/2022 | 19167 | 20534 |
| 01/31/2023 | 20360 | 21824 |
| 02/28/2023 | 19627 | 21291 |
| 03/31/2023 | 19839 | 22073 |
| 04/30/2023 | 19969 | 22418 |
| 05/31/2023 | 20018 | 22515 |
| 06/30/2023 | 21412 | 24003 |
| 07/31/2023 | 22107 | 24774 |
| 08/31/2023 | 21375 | 24379 |
| 09/30/2023 | 20447 | 23217 |
| 10/31/2023 | 19942 | 22729 |
| 11/30/2023 | 21392 | 24805 |
| 12/31/2023 | 22452 | 25931 |
| 01/31/2024 | 22235 | 26367 |
| 02/29/2024 | 22978 | 27775 |
| 03/31/2024 | 24074 | 28669 |
| 04/30/2024 | 23253 | 27498 |
| 05/31/2024 | 24563 | 28861 |
| 06/30/2024 | 25248 | 29897 |
| 07/31/2024 | 25963 | 30261 |
| 08/31/2024 | 26127 | 30995 |
| 09/30/2024 | 26493 | 31657 |
| 10/31/2024 | 26209 | 31370 |
| 11/30/2024 | 28002 | 33211 |
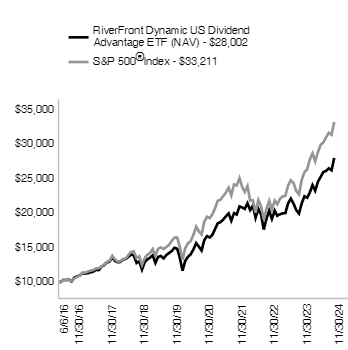
| RiverFront Dynamic US Dividend Advantage ETF - NAV | 30.90% | 14.06% | 12.90% |
| S&P 500® Index‡ | 33.89% | 15.77% | 15.20% |
For the most current month-end performance data please visit www.alpsfunds.com or call 1-866-759-5679.
| |
‡ | This index represents a broad measure of market performance for purposes of new regulatory requirements. |
| Net Assets | $78,555,643 |
| Number of Portfolio Holdings | 71 |
| Portfolio Turnover Rate | 28% |
| Total Advisory Fees Paid | $391,856 |
| NVIDIA Corp. | 9.80% |
| Apple, Inc. | 8.17% |
| Microsoft Corp. | 7.65% |
| Amazon.com, Inc. | 4.24% |
| Perdoceo Education Corp. | 2.41% |
| Alphabet, Inc. | 2.22% |
| International Business Machines Corp. | 1.87% |
| Cisco Systems, Inc. | 1.77% |
| Hewlett Packard Enterprise Co. | 1.77% |
| US Bancorp | 1.74% |
| Total % of Top 10 Holdings | 41.64% |
| Information Technology | 32.12% |
| Financials | 18.60% |
| Consumer Discretionary | 11.67% |
| Energy | 8.36% |
| Industrials | 6.68% |
| Real Estate | 6.61% |
| Communication Services | 3.64% |
| Utilities | 3.63% |
| Consumer Staples | 2.82% |
| Materials | 2.45% |
| Health Care | 1.70% |
| Money Market Fund | 1.72% |
| Total | 100.00% |
| |
* | % of Total Investments (excluding investments purchased with collateral from securities loaned). |
Holdings are subject to change.
If you wish to view additional information about the Fund, including but not limited to the Fund's prospectus, financial information, holdings, and proxy voting information, please visit https://www.alpsfunds.com/exchange-traded-funds/rfda.
The Funds send only one report to a household if more than one account has the same address. If you do not want this policy to apply to you, or if you wish to receive a copy of this document at a new address, contact 1-866-759-5679.
RiverFront Strategic Income Fund | ALPS ETF TRUST |
NYSE ARCA: RIGS | |
This annual shareholder report contains important information about RiverFront Strategic Income Fund (the "Fund" or "RIGS") for the period of December 1, 2023 to November 30, 2024 (the "Period"). You can find additional information about the Fund at https://www.alpsfunds.com/exchange-traded-funds/rigs. You can also request this information by contacting us at 1-866-759-5679.
| RiverFront Strategic Income Fund | $48 | 0.46% |
The RiverFront Strategic Income Fund returned 7.42% at net asset value for the 12 months ended 11/30/24. The fund outperformed its benchmark, the Bloomberg US Aggregate Bond Index, which returned 6.88% over the same period.
• Top contributors to relative performance:
Overweight allocation to high yield bonds
Overweight allocation to investment grade corporate bonds
Treasury selection, longer maturities
• Top detractors from relative performance:
Corporate bond selection, shorter maturities
Underweight allocation to mortgage-backed securities
Cash was a drag on performance
The Fund's past performance is not a good predictor of the Fund's future performance. The chart and the table below do not reflect the deduction of taxes that a shareholder would pay on Fund distributions or sale of Fund shares.
| 11/30/2014 | 10000 | 10000 |
| 12/31/2014 | 9977 | 10009 |
| 01/31/2015 | 10038 | 10219 |
| 02/28/2015 | 10167 | 10123 |
| 03/31/2015 | 10152 | 10170 |
| 04/30/2015 | 10231 | 10134 |
| 05/31/2015 | 10253 | 10109 |
| 06/30/2015 | 10161 | 9999 |
| 07/31/2015 | 10159 | 10069 |
| 08/31/2015 | 10106 | 10054 |
| 09/30/2015 | 9937 | 10122 |
| 10/31/2015 | 10148 | 10124 |
| 11/30/2015 | 10091 | 10097 |
| 12/31/2015 | 10039 | 10064 |
| 01/31/2016 | 10005 | 10203 |
| 02/29/2016 | 10122 | 10275 |
| 03/31/2016 | 10262 | 10370 |
| 04/30/2016 | 10419 | 10409 |
| 05/31/2016 | 10466 | 10412 |
| 06/30/2016 | 10573 | 10599 |
| 07/31/2016 | 10747 | 10666 |
| 08/31/2016 | 10857 | 10654 |
| 09/30/2016 | 10882 | 10648 |
| 10/31/2016 | 10892 | 10566 |
| 11/30/2016 | 10836 | 10316 |
| 12/31/2016 | 10919 | 10331 |
| 01/31/2017 | 10978 | 10351 |
| 02/28/2017 | 11046 | 10421 |
| 03/31/2017 | 11052 | 10415 |
| 04/30/2017 | | 10496 |
| 05/31/2017 | 11215 | 10576 |
| 06/30/2017 | 11237 | 10566 |
| 07/31/2017 | 11299 | 10611 |
| 08/31/2017 | 11348 | 10706 |
| 09/30/2017 | 11394 | 10655 |
| 10/31/2017 | 11415 | 10662 |
| 11/30/2017 | 11409 | 10648 |
| 12/31/2017 | 11431 | 10697 |
| 01/31/2018 | 11406 | 10574 |
| 02/28/2018 | 11315 | 10473 |
| 03/31/2018 | 11308 | 10540 |
| 04/30/2018 | 11325 | 10462 |
| 05/31/2018 | 11341 | 10537 |
| 06/30/2018 | 11348 | 10524 |
| 07/31/2018 | 11419 | 10526 |
| 08/31/2018 | 11493 | 10594 |
| 09/30/2018 | 11534 | 10526 |
| 10/31/2018 | 11469 | 10443 |
| 11/30/2018 | 11475 | 10505 |
| 12/31/2018 | 11424 | 10698 |
| 01/31/2019 | 11642 | 10812 |
| 02/28/2019 | 11731 | 10805 |
| 03/31/2019 | 11806 | 11013 |
| 04/30/2019 | 11858 | 11016 |
| 05/31/2019 | 11854 | 11211 |
| 06/30/2019 | 11969 | 11352 |
| 07/31/2019 | 12007 | 11377 |
| 08/31/2019 | 12068 | 11672 |
| 09/30/2019 | 12092 | 11610 |
| 10/31/2019 | 12139 | 11645 |
| 11/30/2019 | 12159 | 11639 |
| 12/31/2019 | 12214 | 11630 |
| 01/31/2020 | 12249 | 11854 |
| 02/29/2020 | 12190 | 12068 |
| 03/31/2020 | 11422 | 11997 |
| 04/30/2020 | 11904 | 12210 |
| 05/31/2020 | 12160 | 12267 |
| 06/30/2020 | 12263 | 12344 |
| 07/31/2020 | 12452 | 12528 |
| 08/31/2020 | 12499 | 12427 |
| 09/30/2020 | 12465 | 12420 |
| 10/31/2020 | 12492 | 12365 |
| 11/30/2020 | 12640 | 12486 |
| 12/31/2020 | 12712 | 12504 |
| 01/31/2021 | 12706 | 12414 |
| 02/28/2021 | 12675 | 12235 |
| 03/31/2021 | 12682 | 12082 |
| 04/30/2021 | 12751 | 12177 |
| 05/31/2021 | 12797 | 12217 |
| 06/30/2021 | 12852 | 12303 |
| 07/31/2021 | 12905 | 12440 |
| 08/31/2021 | 12931 | 12417 |
| 09/30/2021 | 12896 | 12309 |
| 10/31/2021 | 12871 | 12306 |
| 11/30/2021 | 12831 | 12342 |
| 12/31/2021 | 12903 | 12311 |
| 01/31/2022 | 12706 | 12046 |
| 02/28/2022 | 12634 | 11911 |
| 03/31/2022 | 12493 | 11580 |
| 04/30/2022 | 12248 | 11141 |
| 05/31/2022 | 12352 | 11213 |
| 06/30/2022 | 12016 | 11037 |
| 07/31/2022 | 12373 | 11306 |
| 08/31/2022 | 12173 | 10987 |
| 09/30/2022 | 11882 | 10512 |
| 10/31/2022 | 11951 | 10376 |
| 11/30/2022 | 12164 | 10758 |
| 12/31/2022 | 12158 | 10709 |
| 01/31/2023 | 12383 | 11039 |
| 02/28/2023 | 12209 | 10753 |
| 03/31/2023 | 12411 | 11026 |
| 04/30/2023 | 12495 | 11093 |
| 05/31/2023 | 12384 | 10972 |
| 06/30/2023 | 12414 | 10933 |
| 07/31/2023 | 12451 | 10926 |
| 08/31/2023 | 12426 | 10856 |
| 09/30/2023 | 12206 | 10580 |
| 10/31/2023 | 12098 | 10413 |
| 11/30/2023 | 12526 | 10884 |
| 12/31/2023 | 12917 | 11301 |
| 01/31/2024 | 12899 | 11270 |
| 02/29/2024 | 12805 | 11111 |
| 03/31/2024 | 12917 | 11213 |
| 04/30/2024 | 12732 | 10930 |
| 05/31/2024 | 12881 | 11116 |
| 06/30/2024 | 13000 | 11221 |
| 07/31/2024 | 13194 | 11483 |
| 08/31/2024 | 13399 | 11648 |
| 09/30/2024 | 13535 | 11804 |
| 10/31/2024 | 13322 | 11511 |
| 11/30/2024 | 13455 | 11633 |
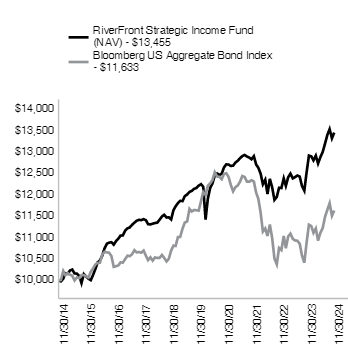
| RiverFront Strategic Income Fund - NAV | 7.42% | 2.05% | 3.01% |
| Bloomberg US Aggregate Bond Index‡ | 6.88% | -0.01% | 1.52% |
For the most current month-end performance data please visit www.alpsfunds.com or call 1-866-759-5679.
| |
‡ | This index represents a broad measure of market performance for purposes of new regulatory requirements. |
| Net Assets | $80,404,384 |
| Number of Portfolio Holdings | 90 |
| Portfolio Turnover Rate | 42% |
| Total Advisory Fees Paid | $442,596 |
| U.S. Treasury Bond 11/15/2052 4.00% | 7.55% |
| U.S. Treasury Bond 02/15/2044 4.50% | 5.35% |
| U.S. Treasury Bond 11/15/2043 4.75% | 4.58% |
| U.S. Treasury Bond 05/15/2044 4.625% | 1.70% |
| EQM Midstream Partners LP 04/01/2029 6.375% | 1.46% |
| Concentrix Corp. 08/02/2028 6.60% | 1.41% |
| T-Mobile USA, Inc. 02/01/2028 4.75% | 1.37% |
| JPMorgan Chase & Co. 10/01/2027 4.25% | 1.28% |
| U.S. Treasury Bond 05/15/2034 4.375% | 1.27% |
| Citigroup, Inc. 09/29/2027 4.45% | 1.27% |
| Total % of Top 10 Holdings | 27.24% |
| |
^ | Excludes Money Market Fund |
| Financials | 21.91% |
| Government | 20.05% |
| Consumer Discretionary | 14.13% |
| Materials | 9.06% |
| Energy | 8.09% |
| Industrials | 7.22% |
| Communications | 5.02% |
| Utilities | 3.90% |
| Health Care | 3.15% |
| Technology | 2.85% |
| Consumer Staples | 2.71% |
| Money Market Fund | 1.91% |
| Total | 100.00% |
Holdings are subject to change.
If you wish to view additional information about the Fund, including but not limited to the Fund's prospectus, financial information, holdings, and proxy voting information, please visit https://www.alpsfunds.com/exchange-traded-funds/rigs.
The Funds send only one report to a household if more than one account has the same address. If you do not want this policy to apply to you, or if you wish to receive a copy of this document at a new address, contact 1-866-759-5679.
ALPS | Smith Core Plus Bond ETF | ALPS ETF TRUST |
NYSEArcaNYSE ARCA: SMTH | |
This annual shareholder report contains important information about ALPS | Smith Core Plus Bond ETF (the "Fund" or "SMTH") for the period of December 5, 2023 (inception) to November 30, 2024 (the "Period"). You can find additional information about the Fund at https://www.alpsfunds.com/exchange-traded-funds/smth. You can also request this information by contacting us at 1-866-759-5679.
| ALPS | Smith Core Plus Bond ETF | $61^ | 0.59% |
Top contributors to relative performance:
Asset allocation, specifically an overweight allocation to corporate credit—generically including investment grade, high yield, and preferred securities—benefited from tightening risk asset spreads throughout the period.
Security selection across investment grade and high yield credit allocations.
Agency mortgage security selection, with a relative overweight allocation to high-coupon mortgage-backed securities, which outperformed during the period.
Top detractors from relative performance:
Yield curve positioning with U.S. Treasuries, with an overweight allocation to the short and long duration areas of the market and a relative underweight to the belly of the yield curve, which outperformed.
Underweight asset allocation to Agency mortgages during the period, which outperformed the broader index.
Allocations to longer duration Single A rated corporates, which underperformed compared to the broader investment grade corporate universe.
The Fund's past performance is not a good predictor of the Fund's future performance. The chart and the table below do not reflect the deduction of taxes that a shareholder would pay on Fund distributions or sale of Fund shares.
| 12/05/2023 | 10000 | 10000 |
| 12/31/2023 | 10381 | 10263 |
| 01/31/2024 | 10367 | 10235 |
| 02/29/2024 | 10286 | 10090 |
| 03/31/2024 | 10384 | 10183 |
| 04/30/2024 | 10153 | 9926 |
| 05/31/2024 | 10303 | 10094 |
| 06/30/2024 | 10420 | 10190 |
| 07/31/2024 | 10596 | 10428 |
| 08/31/2024 | 10772 | 10578 |
| 09/30/2024 | 10906 | 10720 |
| 10/31/2024 | 10712 | 10454 |
| 11/30/2024 | 10808 | 10564 |
| ALPS | Smith Core Plus Bond ETF - NAV | 4.91% | 8.08% |
| Bloomberg US Aggregate Bond Index‡ | 4.65% | 5.64% |
For the most current month-end performance data please visit www.alpsfunds.com or call 1-866-759-5679.
| |
‡ | This index represents a broad measure of market performance for purposes of new regulatory requirements. |
| Net Assets | $1,289,354,848 |
| Number of Portfolio Holdings | 707 |
| Portfolio Turnover Rate# | 169% |
| Total Advisory Fees Paid# | $3,886,637 |
| U.S. Treasury Note 10/31/2029 4.125% | 5.71% |
| U.S. Treasury Note 09/30/2029 3.50% | 4.94% |
| U.S. Treasury Bond 08/15/2044 4.125% | 4.88% |
| U.S. Treasury Note 08/31/2026 3.75% | 4.67% |
| U.S. Treasury Bond 11/15/2034 4.25% | 4.22% |
| United States Treasury Bond 08/15/2034 3.875% | 3.53% |
| U.S. Treasury Bond 11/15/2054 4.50% | 3.21% |
| U.S. Treasury Note 09/30/2026 3.50% | 2.88% |
| U.S. Treasury Note 10/31/2026 4.125% | 2.64% |
| U.S. - United States Treasury Notes 07/31/2026 4.375% | 2.31% |
| Total % of Top 10 Holdings | 38.99% |
| Government | 45.13% |
| Mortgage Securities | 18.87% |
| Financials | 10.35% |
| Energy | 5.41% |
| Industrials | 4.99% |
| Health Care | 4.26% |
| Consumer Discretionary | 3.95% |
| Communications | 2.41% |
| Consumer Staples | 2.40% |
| Utilities | 1.05% |
| Technology | 0.72% |
| Materials | 0.40% |
| Money Market Fund | 0.06% |
| Total | 100.00% |
Holdings are subject to change.
If you wish to view additional information about the Fund, including but not limited to the Fund's prospectus, financial information, holdings, and proxy voting information, please visit https://www.alpsfunds.com/exchange-traded-funds/smth.
The Funds send only one report to a household if more than one account has the same address. If you do not want this policy to apply to you, or if you wish to receive a copy of this document at a new address, contact 1-866-759-5679.
| (a) | The Registrant, as of the end of the period covered by this report, has adopted a code of ethics that applies to the Registrant's principal executive officer, principal financial officer, principal accounting officer or controller or any persons performing similar functions on behalf of the Registrant. |
| (c) | During the period covered by this report, no amendments to the provisions of the code of ethics adopted in 2(a) above were made. |
| (d) | During the period covered by this report, no implicit or explicit waivers to the provisions of the code of ethics adopted in 2(a) above were granted. |
| (f) | The Registrant's Code of Ethics is attached as an Exhibit hereto. |
| Item 3. | Audit Committee Financial Expert. |
The Board of Trustees of the Registrant has determined that the Registrant has at least one Audit Committee Financial Expert serving on its audit committee. The Board of Trustees of the Registrant has designated Jeremy W. Deems as the Registrant’s “Audit Committee Financial Expert”. Mr. Deems is “independent” as defined in paragraph (a)(2) of Item 3 to Form N-CSR.
| Item 4. | Principal Accountant Fees and Services. |
| (a) | Audit Fees: For the Registrant’s fiscal years ended November 30, 2024 and November 30, 2023, the aggregate fees billed for professional services rendered by the principal accountant for the audit of the Registrant’s annual financial statements were $344,300 and $318,000, respectively. |
| (b) | Audit-Related Fees: For the Registrant’s fiscal years ended November 30, 2024 and November 30, 2023, the aggregate fees billed for professional services rendered by the principal accountant that are reasonably related to the performance of the audit of the Registrant's financial statements and are not reported under paragraph (a) of this Item were $0 and $0, respectively. |
| (c) | Tax Fees: For the Registrant’s fiscal years ended November 30, 2024 and November 30, 2023, the aggregate fees billed for professional services rendered by the principal accountant for tax compliance, tax advice and tax planning were $85,250 and $85,250, respectively. The fiscal year 2024 and 2023 tax fees were for services pertaining to federal and state income tax return review, review of year end dividend distributions and excise tax preparation. |
| (d) | All Other Fees: For the Registrant’s fiscal years ended November 30, 2024 and November 30, 2023, aggregate fees billed to the Registrant by the principal accountant for services provided by the principal accountant other than the services reported in paragraphs (a) through (c) of this Item 4 were $0 and $0, respectively. |
| (1) | Audit Committee Pre-Approval Policies and Procedures: All services to be performed by the Registrant's principal accountant must be pre-approved by the Registrant's audit committee. |
| (2) | No services described in paragraphs (b) through (d) of this Item were approved by the Registrant’s audit committee pursuant to paragraph (c)(7)(i)(C) of Rule 2-01 of Regulation S-X. |
| (g) | The aggregate non-audit fees billed by the Registrant’s accountant for the fiscal years ended November 30, 2024 and November 30, 2023 of the Registrant were $85,250 and $85,250, respectively. These fees consisted of non-audit fees billed to (i) the Registrant of $85,250 and $85,250, respectively as described in response to paragraph (c) above. |
| (h) | The Registrant’s audit committee has considered whether the provision of non- audit services that were rendered to the Registrant’s investment adviser (not including any sub-adviser whose role is primarily portfolio management and is subcontracted with or overseen by another investment adviser), and any entity controlling, controlled by, or under common control with the investment adviser that provides ongoing services to the Registrant that were not pre-approved pursuant to paragraph (c)(7)(ii) of Rule 2-01 of Regulation S-X, is compatible with maintaining the principal accountant’s independence. The Registrant’s audit committee determined that the provision of such non-audit services is compatible with maintaining the principal accountant’s independence. |
| Item 5. | Audit Committee of Listed Registrants. |
Not applicable to the Registrant.
| (a) | Schedule of Investments is included as part of the Financial Statements and Financial Highlights filed under Item 7 of this Report. |
| Item 7. | Financial Statements and Financial Highlights for Open-End Management Investment Companies. |
| (a) | The registrant’s most recent annual financial statements required, and for the period covered by this report, by Regulation S-X are attached herewith. |
| (b) | The registrant’s financial highlights, audited for the latest 5 years as required in Regulation S-X, are attached herewith. |
Table of Contents
| Financial Statements and Financial Highlights for Open-End Management Investment Companies | |
| Alerian MLP ETF | |
| Schedule of Investments | 1 |
| Statement of Assets and Liabilities | 2 |
| Statement of Operations | 3 |
| Statements of Changes in Net Assets | 4 |
| Financial Highlights | 5 |
| Alerian Energy Infrastructure ETF | |
| Schedule of Investments | 6 |
| Statement of Assets and Liabilities | 8 |
| Statement of Operations | 9 |
| Statements of Changes in Net Assets | 10 |
| Financial Highlights | 11 |
| Notes to Financial Statements and Financial Highlights | 12 |
| Report of Independent Registered Public Accounting Firm | 22 |
| Additional Information | 23 |
| Changes in and Disagreements with Accountants for Open-End Management Investment Companies | 25 |
| Proxy Disclosures for Open-End Management Investment Companies | 26 |
| Remuneration Paid to Directors, Officers, and Others of Open-End Management Investment Companies | 27 |
| Statement Regarding Basis for Approval of Investment Advisory Contract | 28 |
alpsfunds.com
Alerian MLP ETF
| Schedule of Investments | November 30, 2024 |
| Security Description | | Shares | | | Value | |
| MASTER LIMITED PARTNERSHIPS (106.45%) | | | | | | | | |
| Compression (3.13%) | | | | | | | | |
| USA Compression Partners LP(a) | | | 13,363,849 | | | $ | 320,598,737 | |
| | | | | | | | | |
| Gathering + Processing (26.03%) | | | | | | | | |
| EnLink Midstream LLC(a) | | | 49,239,974 | | | | 788,331,984 | |
| Hess Midstream LP, Class A(a) | | | 17,205,686 | | | | 652,095,499 | |
| Western Midstream Partners LP(a) | | | 30,021,506 | | | | 1,222,175,509 | |
| Total Gathering + Processing | | | | | | | 2,662,602,992 | |
| | | | | | | | | |
| Liquefaction (4.36%) | | | | | | | | |
| Cheniere Energy Partners LP | | | 7,653,879 | | | | 445,838,452 | |
| | | | | | | | | |
| Marketing & Distribution (16.29%) | | | | | | | | |
| Global Partners LP(a) | | | 4,901,012 | | | | 276,662,128 | |
| Suburban Propane Partners LP(a) | | | 11,967,620 | | | | 237,557,257 | |
| Sunoco LP(a) | | | 20,404,759 | | | | 1,152,052,693 | |
| Total Marketing & Distribution | | | | | | | 1,666,272,078 | |
| | | | | | | | | |
| Pipeline Transportation | Natural Gas (27.50%) | | | | | | | | |
| Energy Transfer LP | | | 72,890,561 | | | | 1,447,606,541 | |
| Enterprise Products Partners LP | | | 39,668,974 | | | | 1,365,802,775 | |
| Total Pipeline Transportation | Natural Gas | | | | | | | 2,813,409,316 | |
| | | | | | | | | |
| Pipeline Transportation | Petroleum (29.14%) | | | | | | | | |
| Delek Logistics Partners LP | | | 2,386,868 | | | | 96,286,255 | |
| Genesis Energy LP(a) | | | 20,280,378 | | | | 242,958,928 | |
| MPLX LP | | | 26,930,278 | | | | 1,391,218,162 | |
| Plains All American Pipeline LP(a) | | | 67,007,216 | | | | 1,251,024,723 | |
| Total Pipeline Transportation | Petroleum | | | | | | | 2,981,488,068 | |
| | | | | | | | | |
| TOTAL MASTER LIMITED PARTNERSHIPS | | | | | | | | |
| (Cost $4,763,812,778) | | | | | | | 10,890,209,643 | |
| | | 7 Day Yield | | | Shares | | | Value | |
| SHORT TERM INVESTMENTS (0.01%) | | | | | | |
| Money Market Fund (0.01%) | | | | | | |
| State Street Institutional Treasury Plus Money Market Fund (Premier Class) | | | 4.59 | % | | | 1,487,674 | | | $ | 1,487,674 | |
| | | | | | | | | | | | | |
| TOTAL SHORT TERM INVESTMENTS | | | | | | | | | | | | |
| (Cost $1,487,674) | | | | | | | | | | | 1,487,674 | |
| | | | | | | | | | | | | |
| TOTAL INVESTMENTS (106.46%) | | | | | |
| (Cost $4,765,300,452) | | | $ | 10,891,697,317 | |
| LIABILITIES IN EXCESS OF OTHER ASSETS (-6.46%) | | | | (661,156,085 | ) |
| NET ASSETS - 100.00% | | | $ | 10,230,541,232 | |
| (a) | Affiliated Company. See Note 8 in Notes to Financial Statement. |
See Notes to Financial Statements and Financial Highlights.
Alerian MLP ETF
| Statement of Assets and Liabilities | November 30, 2024 |
| ASSETS: | | | | |
| Investments, at value | | $ | 4,748,239,859 | |
| Investments in affiliates, at value | | | 6,143,457,458 | |
| Receivable for investments sold | | | 47,869 | |
| Receivable for shares sold | | | 23,063,990 | |
| Total Assets | | | 10,914,809,176 | |
| | | | | |
| LIABILITIES: | | | | |
| Payable for investments purchased | | | 23,155,910 | |
| Income tax payable | | | 104,962,638 | |
| Deferred tax liability (Note 2) | | | 549,665,188 | |
| Payable to adviser | | | 6,484,208 | |
| Total Liabilities | | | 684,267,944 | |
| NET ASSETS | | $ | 10,230,541,232 | |
| | | | | |
| NET ASSETS CONSIST OF: | | | | |
| Paid-in capital | | $ | 9,683,598,034 | |
| Distributable earnings/(accumulated losses) | | | 546,943,198 | |
| NET ASSETS | | $ | 10,230,541,232 | |
| | | | | |
| INVESTMENTS, AT COST | | $ | 1,576,411,379 | |
| INVESTMENTS IN AFFILIATES, AT COST | | | 3,188,889,073 | |
| | | | | |
| PRICING OF SHARES | | | | |
| | | | | |
| Net Assets | | $ | 10,230,541,232 | |
| Shares of beneficial interest outstanding (Unlimited number of shares authorized, par value $0.01 per share) | | | 199,607,420 | |
| Net Asset Value, offering and redemption price per share | | $ | 51.25 | |
See Notes to Financial Statements and Financial Highlights.
Alerian MLP ETF
| Statement of Operations | For the Year Ended November 30, 2024 |
| INVESTMENT INCOME: | | | |
| Distributions from master limited partnerships | | $ | 660,574,581 | (a) |
| Less return of capital distributions | | | (643,965,334 | ) |
| Total Investment Income | | | 16,609,247 | |
| | | | | |
| EXPENSES: | | | | |
| Investment adviser fee | | | 70,761,336 | |
| Miscellaneous expense | | | 350,712 | |
| Total Expenses | | | 71,112,048 | |
| NET INVESTMENT LOSS, BEFORE INCOME TAXES | | | (54,502,801 | ) |
| Current income tax benefit/(expense) | | | 10,283,361 | |
| NET INVESTMENT LOSS | | | (44,219,440 | ) |
| | | | | |
| REALIZED AND UNREALIZED GAIN/(LOSS): | | | | |
| Net realized gain on investments, before income taxes | | | 58,793,232 | |
| Net realized gain on affiliated investments, before income taxes | | | 32,780,680 | |
| Current income tax benefit/(expense) | | | (17,277,783 | ) |
| Net realized gain | | | 74,296,129 | |
| Net change in unrealized appreciation on investments, before income taxes | | | 1,231,808,402 | |
| Net change in unrealized appreciation on affiliated investments, before income taxes | | | 1,200,556,021 | |
| Deferred income tax benefit/(expense) | | | (458,928,357 | ) |
| Net change in unrealized appreciation | | | 1,973,436,066 | |
| NET REALIZED AND UNREALIZED GAIN ON INVESTMENTS | | | 2,047,732,195 | |
| NET INCREASE IN NET ASSETS RESULTING FROM OPERATIONS | | $ | 2,003,512,755 | |
| (a) | Includes return of capital distributions and dividend income from affiliated investments in the amount of $370,025,787 and $16,609,247, respectively. |
See Notes to Financial Statements and Financial Highlights.
Alerian MLP ETF
Statements of Changes in Net Assets
| | | For the
Year Ended
November 30, 2024 | | | For the
Year Ended
November 30, 2023 | |
| OPERATIONS: | | | | | | |
| Net investment loss | | $ | (44,219,440 | ) | | $ | (39,353,289 | ) |
| Net realized gain | | | 74,296,129 | | | | 968,978,085 | |
| Net change in unrealized appreciation | | | 1,973,436,066 | | | | 321,187,085 | |
| Net increase in net assets resulting from operations | | | 2,003,512,755 | | | | 1,250,811,881 | |
| | | | | | | | | |
| DISTRIBUTIONS TO SHAREHOLDERS: | | | | | | | | |
| From distributable earnings | | | (647,326,416 | ) | | | (559,281,783 | ) |
| From tax return of capital | | | (35,219,362 | ) | | | – | |
| Total distributions | | | (682,545,778 | ) | | | (559,281,783 | ) |
| | | | | | | | | |
| CAPITAL SHARE TRANSACTIONS: | | | | | | | | |
| Proceeds from sale of shares | | | 2,517,052,803 | | | | 1,459,261,841 | |
| Cost of shares redeemed | | | (1,107,287,794 | ) | | | (1,330,182,900 | ) |
| Net increase from share transactions | | | 1,409,765,009 | | | | 129,078,941 | |
| | | | | | | | | |
| Net increase in net assets | | | 2,730,731,986 | | | | 820,609,039 | |
| | | | | | | | | |
| NET ASSETS: | | | | | | | | |
| Beginning of year | | | 7,499,809,246 | | | | 6,679,200,207 | |
| End of year | | $ | 10,230,541,232 | | | $ | 7,499,809,246 | |
| | | | | | | | | |
| OTHER INFORMATION: | | | | | | | | |
| SHARE TRANSACTIONS: | | | | | | | | |
| Beginning shares | | | 169,807,420 | | | | 166,932,420 | |
| Shares sold | | | 53,700,000 | | | | 36,325,000 | |
| Shares redeemed | | | (23,900,000 | ) | | | (33,450,000 | ) |
| Shares outstanding, end of year | | | 199,607,420 | | | | 169,807,420 | |
See Notes to Financial Statements and Financial Highlights.
Alerian MLP ETF
| Financial Highlights | For a Share Outstanding Throughout the Periods Presented |
| | | For the Year
Ended
November 30,
2024 | | | For the Year
Ended
November 30,
2023 | | | For the Year
Ended
November 30,
2022 | | | For the Year
Ended
November 30,
2021 | | | For the Year
Ended
November 30,
2020 (a) | |
| NET ASSET VALUE, BEGINNING OF PERIOD | | $ | 44.17 | | | $ | 40.01 | | | $ | 31.63 | | | $ | 25.02 | | | $ | 39.15 | |
| INCOME/(LOSS) FROM OPERATIONS: | | | | | | | | | | | | | | | | | | | | |
| Net investment loss(b) | | | (0.24 | ) | | | (0.24 | ) | | | (0.28 | ) | | | (0.27 | ) | | | (0.24 | ) |
| Net realized and unrealized gain/(loss) on investments | | | 11.03 | | | | 7.74 | | | | 11.59 | | | | 9.68 | | | | (10.73 | ) |
| Total from investment operations | | | 10.79 | | | | 7.50 | | | | 11.31 | | | | 9.41 | | | | (10.97 | ) |
| | | | | | | | | | | | | | | | | | | | | |
| DISTRIBUTIONS: | | | | | | | | | | | | | | | | | | | | |
| From net investment income | | | (3.52 | ) | | | (3.34 | ) | | | – | | | | – | | | | – | |
| From tax return of capital | | | (0.19 | ) | | | – | | | | (2.93 | ) | | | (2.80 | ) | | | (3.16 | ) |
| Total distributions | | | (3.71 | ) | | | (3.34 | ) | | | (2.93 | ) | | | (2.80 | ) | | | (3.16 | ) |
| | | | | | | | | | | | | | | | | | | | | |
| NET INCREASE/(DECREASE) IN NET ASSET VALUE | | | 7.08 | | | | 4.16 | | | | 8.38 | | | | 6.61 | | | | (14.13 | ) |
| NET ASSET VALUE, END OF PERIOD | | $ | 51.25 | | | $ | 44.17 | | | $ | 40.01 | | | $ | 31.63 | | | $ | 25.02 | |
| TOTAL RETURN(c) | | | 25.74 | % | | | 19.82 | % | | | 36.31 | % | | | 37.97 | % | | | (28.36 | )% |
| | | | | | | | | | | | | | | | | | | | | |
| RATIOS/SUPPLEMENTAL DATA: | | | | | | | | | | | | | | | | | | | | |
| Net assets, end of period (000s) | | $ | 10,230,541 | | | $ | 7,499,809 | | | $ | 6,679,200 | | | $ | 4,980,175 | | | $ | 3,880,137 | |
| | | | | | | | | | | | | | | | | | | | | |
| RATIO TO AVERAGE NET ASSETS: | | | | | | | | | | | | | | | | | | | | |
| Expenses (excluding net current and deferred tax expenses/benefits and franchise tax expense) | | | 0.85 | % | | | 0.85 | % | | | 0.85 | % | | | 0.85 | % | | | 0.85 | % |
| Expenses (including current and deferred tax expenses/benefits)(d) | | | 0.72 | % | | | 0.79 | % | | | 0.74 | % | | | 0.85 | % | | | 0.85 | % |
| Expenses (including net current and deferred tax expenses/benefits)(e) | | | 6.39 | % | | | 2.67 | % | | | 5.03 | % | | | 0.87 | % | | | 0.90 | % |
| Net investment loss (excluding deferred tax expenses/benefits and franchise tax expense) | | | (0.65 | )% | | | (0.65 | )% | | | (0.85 | )% | | | (0.85 | )% | | | (0.85 | )% |
| Net investment loss (including deferred tax expenses/benefits)(d) | | | (0.53 | )% | | | (0.59 | )% | | | (0.74 | )% | | | (0.85 | )% | | | (0.85 | )% |
| PORTFOLIO TURNOVER RATE(f) | | | 18 | % | | | 40 | % | | | 26 | % | | | 20 | % | | | 23 | % |
| (a) | On May 18, 2020, the Alerian MLP ETF underwent a one for five reverse stock split. The capital share activity presented here has been retroactively adjusted to reflect this reverse split. |
| (b) | Based on average shares outstanding during the period. |
| (c) | Total return is calculated assuming an initial investment made at the net assets value at the beginning of the period and redemption at the net asset value on the last day of the period and assuming all distributions are reinvested at actual reinvestment prices. Total return calculated for a period of less than one year is not annualized. |
| (d) | Includes amount of current and deferred tax benefit associated with net investment income/(loss). |
| (e) | Includes amount of current and deferred taxes/benefits for all components of the Statement of Operations. |
| (f) | Portfolio turnover for periods less than one year is not annualized and does not include securities received or delivered from processing creations or redemptions in-kind. |
See Notes to Financial Statements and Financial Highlights.
Alerian Energy Infrastructure ETF
| Schedule of Investments | November 30, 2024 |
| Security Description | | Shares | | | Value | |
| CANADIAN ENERGY INFRASTRUCTURE COMPANIES (23.38%) | | | | | | | | |
| Gathering + Processing (4.60%) | | | | | | | | |
| Keyera Corp. | | | 328,574 | | | $ | 10,835,514 | |
| | | | | | | | | |
| Pipeline Transportation | Natural Gas (4.48%) | | | | | | | | |
| TC Energy Corp.(a) | | | 216,307 | | | | 10,546,135 | |
| | | | | | | | | |
| Pipeline Transportation | Petroleum (12.12%) | | | | | | | | |
| Enbridge, Inc. | | | 400,955 | | | | 17,346,412 | |
| Pembina Pipeline Corp. | | | 244,336 | | | | 10,066,284 | |
| South Bow Corp.(a) | | | 43,257 | | | | 1,141,944 | |
| Total Pipeline Transportation | Petroleum | | | | | | | 28,554,640 | |
| | | | | | | | | |
| Storage (2.18%) | | | | | | | | |
| Gibson Energy, Inc.(a) | | | 304,083 | | | | 5,127,959 | |
| | | | | | | | | |
| TOTAL CANADIAN ENERGY INFRASTRUCTURE COMPANIES | | | | | | | | |
| (Cost $47,590,067) | | | | | | | 55,064,248 | |
| Security Description | | Shares | | | Value | |
| EXCHANGE TRADED FUND (1.01%) | | | | | | | | |
| Exchange Traded Fund (1.01%) | | | | | | | | |
| Energy Select Sector SPDR Fund | | | 25,000 | | | | 2,388,250 | |
| | | | | | | | | |
| TOTAL EXCHANGE TRADED FUND | | | | | | | | |
| (Cost $2,388,437) | | | | | | | 2,388,250 | |
| Security Description | | Shares | | | Value | |
| U.S. ENERGY INFRASTRUCTURE COMPANIES (30.14%) | | | | | | | | |
| Gathering + Processing (6.36%) | | | | | | | | |
| Aris Water Solutions, Inc. | | | 40,947 | | | | 1,101,474 | |
| Targa Resources Corp. | | | 67,937 | | | | 13,879,529 | |
| Total Gathering + Processing | | | | | | | 14,981,003 | |
| | | | | | | | | |
| Liquefaction (5.50%) | | | | | | | | |
| Cheniere Energy, Inc. | | | 51,749 | | | | 11,592,294 | |
| NextDecade Corp.(a)(b) | | | 187,652 | | | | 1,358,600 | |
| Total Liquefaction | | | | | | | 12,950,894 | |
| | | | | | | | | |
| Pipeline Transportation | Natural Gas (18.28%) | | | | | | | | |
| DT Midstream, Inc. | | | 131,977 | | | | 14,005,399 | |
| Kinder Morgan, Inc. | | | 475,990 | | | | 13,456,237 | |
| Kinetik Holdings, Inc. | | | 68,647 | | | | 4,051,546 | |
| ONEOK, Inc. | | | 101,631 | | | | 11,545,282 | |
| Total Pipeline Transportation | Natural Gas | | | | | | | 43,058,464 | |
| | | | | | | | | |
| TOTAL U.S. ENERGY INFRASTRUCTURE COMPANIES | | | | | | | | |
| (Cost $37,056,821) | | | | | | | 70,990,361 | |
| Security Description | | Shares | | | Value | |
| U.S. ENERGY INFRASTRUCTURE MLPS (27.57%) | | | | | | | | |
| Gathering + Processing (5.03%) | | | | | | | | |
| Delek Logistics Partners LP | | | 7,548 | | | $ | 304,486 | |
| Hess Midstream LP, Class A | | | 170,158 | | | | 6,448,988 | |
| Western Midstream Partners LP | | | 125,239 | | | | 5,098,480 | |
| Total Gathering + Processing | | | | | | | 11,851,954 | |
| | | | | | | | | |
| Pipeline Transportation | Natural Gas (17.35%) | | | | | | | | |
| Energy Transfer LP | | | 1,129,799 | | | | 22,437,808 | |
| Enterprise Products Partners LP | | | 535,396 | | | | 18,433,685 | |
| Total Pipeline Transportation | Natural Gas | | | | | | | 40,871,493 | |
| | | | | | | | | |
| Pipeline Transportation | Petroleum (5.19%) | | | | | | | | |
| Genesis Energy LP | | | 64,831 | | | | 776,675 | |
| MPLX LP | | | 221,507 | | | | 11,443,052 | |
| Total Pipeline Transportation | Petroleum | | | | | | | 12,219,727 | |
| | | | | | | | | |
| TOTAL U.S. ENERGY INFRASTRUCTURE MLPS | | | | | | | | |
| (Cost $47,199,227) | | | | | | | 64,943,174 | |
| Security Description | | Shares | | | Value | |
| U.S. GENERAL PARTNERS (17.80%) | | | | | | | | |
| Gathering + Processing (13.21%) | | | | | | | | |
| Antero Midstream Corp. | | | 639,310 | | | | 10,209,782 | |
| EnLink Midstream LLC | | | 486,955 | | | | 7,796,149 | |
| The Williams Cos., Inc. | | | 223,956 | | | | 13,105,905 | |
| Total Gathering + Processing | | | | | | | 31,111,836 | |
| | | | | | | | | |
| Pipeline Transportation | Petroleum (4.59%) | | | | | | | | |
| Plains GP Holdings LP, Class A | | | 540,812 | | | | 10,827,056 | |
| | | | | | | | | |
| TOTAL U.S. GENERAL PARTNERS | | | | | | | | |
| (Cost $25,719,794) | | | | | | | 41,938,892 | |
See Notes to Financial Statements and Financial Highlights.
Alerian Energy Infrastructure ETF
| Schedule of Investments | November 30, 2024 |
| | | 7 Day Yield | | | Shares | | | Value | |
| SHORT TERM INVESTMENTS (0.20%) | | | | | | | | | | | | |
| Money Market Fund (0.01%) | | | | | | | | | | | | |
| State Street Institutional Treasury Plus Money Market Fund (Premier Class) | | | | | | | | | | | | |
| (Cost $15,228) | | | 4.59 | % | | | 15,228 | | | $ | 15,228 | |
| | | | | | | | | | | | | |
| Investments Purchased with Collateral from Securities Loaned (0.19%) | | | | | | | | | | | | |
| State Street Navigator Securities Lending Government Money Market Portfolio, 4.63% | | | | | | | | | | | | |
| (Cost $445,871) | | | | | | | 445,871 | | | $ | 445,871 | |
| TOTAL SHORT TERM INVESTMENTS | | | | | | | | | | | | |
| (Cost $2,082,745) | | | | | | | | | | | 461,099 | |
| | | | | | | | | | | | | |
| TOTAL INVESTMENTS (100.10%) | | | | | | | | | | | | |
| (Cost $160,415,445) | | | | | | | | | | $ | 235,786,024 | |
| LIABILITIES IN EXCESS OF OTHER ASSETS (-0.10%) | | | | | | | | | | | (245,387 | ) |
| NET ASSETS - 100.00% | | | | | | | | | | $ | 235,540,637 | |
| (a) | Security, or a portion of the security position is currently on loan. The total market value of securities on loan is $2,457,288. |
| (b) | Non-income producing security. |
See Notes to Financial Statements and Financial Highlights.
Alerian Energy Infrastructure ETF
| Statement of Assets and Liabilities | November 30, 2024 |
| ASSETS: | | | |
| Investments, at value* | | $ | 235,786,024 | |
| Receivable for investments sold | | | 2,435,417 | |
| Dividends receivable | | | 215,438 | |
| Total Assets | | | 238,436,879 | |
| | | | | |
| LIABILITIES: | | | | |
| Payable for investments purchased | | | 2,388,438 | |
| Payable to adviser | | | 61,721 | |
| Foreign Currency Overdraft | | | 212 | |
| Payable for collateral upon return of securities loaned | | | 445,871 | |
| Total Liabilities | | | 2,896,242 | |
| NET ASSETS | | $ | 235,540,637 | |
| | | | | |
| NET ASSETS CONSIST OF: | | | | |
| Paid-in capital | | $ | 158,786,736 | |
| Distributable earnings | | | 76,753,901 | |
| NET ASSETS | | $ | 235,540,637 | |
| | | | | |
| INVESTMENTS, AT COST | | $ | 160,415,445 | |
| | | | | |
| PRICING OF SHARES | | | | |
| Net Assets | | $ | 235,540,637 | |
| Shares of beneficial interest outstanding (Unlimited number of shares authorized, par value $0.01 per share) | | | 7,125,000 | |
| Net Asset Value, offering and redemption price per share | | $ | 33.06 | |
| * | Includes $2,457,288 of securities on loan. |
See Notes to Financial Statements and Financial Highlights.
Alerian Energy Infrastructure ETF
| Statement of Operations | For the Year Ended November 30, 2024 |
| INVESTMENT INCOME: | | | | |
| Dividend income* | | $ | 7,543,868 | |
| Securities lending income | | | 25,872 | |
| Total Investment Income | | | 7,569,740 | |
| | | | | |
| EXPENSES: | | | | |
| Investment adviser fees | | | 545,871 | |
| Miscellaneous expenses | | | 6,231 | |
| Total expenses | | | 552,102 | |
| NET INVESTMENT INCOME | | | 7,017,638 | |
| | | | | |
| REALIZED AND UNREALIZED GAIN/(LOSS): | | | | |
| Net realized gain on investments(a) | | | 2,387,376 | |
| Net realized loss on foreign currency transactions | | | (8,013 | ) |
| Net realized gain | | | 2,379,363 | |
| Net change in unrealized appreciation on investments | | | 60,656,598 | |
| Net change in unrealized depreciation on translation of assets and liabilities denominated in foreign currencies | | | (1,042 | ) |
| Net change in unrealized appreciation | | | 60,655,556 | |
| NET REALIZED AND UNREALIZED GAIN ON INVESTMENTS AND FOREIGN CURRENCIES | | | 63,034,919 | |
| NET INCREASE IN NET ASSETS RESULTING FROM OPERATIONS | | $ | 70,052,557 | |
| * Net of foreign tax withholding. | | $ | 374,533 | |
| (a) | Includes realized gain or loss as a result of in-kind transactions (See Note 4 in Notes to Financial Statements and Financial Highlights). |
See Notes to Financial Statements and Financial Highlights.
Alerian Energy Infrastructure ETF
Statements of Changes in Net Assets
| | | For the Year Ended November 30, 2024 | | | For the Year Ended November 30, 2023 | |
| OPERATIONS: | | | | | | |
| Net investment income | | $ | 7,017,638 | | | $ | 5,563,949 | |
| Net realized gain | | | 2,379,363 | | | | 4,005,613 | |
| Net change in unrealized appreciation/(depreciation) | | | 60,655,556 | | | | (93,168 | ) |
| Net increase in net assets resulting from operations | | | 70,052,557 | | | | 9,476,394 | |
| | | | | | | | | |
| DISTRIBUTIONS: | | | | | | | | |
| From distributable earnings | | | (4,193,460 | ) | | | (1,902,116 | ) |
| From tax return of capital | | | (4,060,038 | ) | | | (5,303,713 | ) |
| Total distributions | | | (8,253,498 | ) | | | (7,205,829 | ) |
| | | | | | | | | |
| CAPITAL SHARE TRANSACTIONS: | | | | | | | | |
| Proceeds from sale of shares | | | 46,196,532 | | | | 8,337,471 | |
| Cost of shares redeemed | | | (4,729,155 | ) | | | (20,419,761 | ) |
| Net increase/(decrease) from share transactions | | | 41,467,377 | | | | (12,082,290 | ) |
| Net increase/(decrease) in net assets | | | 103,266,436 | | | | (9,811,725 | ) |
| | | | | | | | | |
| NET ASSETS: | | | | | | | | |
| Beginning of year | | | 132,274,201 | | | | 142,085,926 | |
| End of year | | $ | 235,540,637 | | | $ | 132,274,201 | |
| | | | | | | | | |
| OTHER INFORMATION: | | | | | | | | |
| CAPITAL SHARE TRANSACTIONS: | | | | | | | | |
| Beginning shares | | | 5,700,000 | | | | 6,275,000 | |
| Shares sold | | | 1,625,000 | | | | 375,000 | |
| Shares redeemed | | | (200,000 | ) | | | (950,000 | ) |
| Shares outstanding, end of year | | | 7,125,000 | | | | 5,700,000 | |
See Notes to Financial Statements and Financial Highlights.
Alerian Energy Infrastructure ETF
| Financial Highlights | For a Share Outstanding Throughout the Periods Presented |
| | | For the Year
Ended
November 30,
2024 | | | For the Year
Ended
November 30,
2023 | | | For the Year
Ended
November 30,
2022 | | | For the Year
Ended
November 30,
2021 | | | For the Year
Ended
November 30,
2020 | |
| NET ASSET VALUE, BEGINNING OF PERIOD | | $ | 23.21 | | | $ | 22.64 | | | $ | 18.59 | | | $ | 14.51 | | | $ | 19.19 | |
| | | | | | | | | | | | | | | | | | | | | |
| INCOME/(LOSS) FROM INVESTMENT OPERATIONS: | | | | | | | | | | | | | | | | | | | | |
| Net investment income(a) | | | 1.18 | | | | 0.97 | | | | 0.61 | | | | 1.08 | | | | 0.90 | |
| Net realized and unrealized gain/(loss) on investments | | | 10.04 | | | | 0.86 | | | | 4.57 | | | | 4.49 | | | | (4.50 | ) |
| Total from investment operations | | | 11.22 | | | | 1.83 | | | | 5.18 | | | | 5.57 | | | | (3.60 | ) |
| | | | | | | | | | | | | | | | | | | | | |
| DISTRIBUTIONS: | | | | | | | | | | | | | | | | | | | | |
| From net investment income | | | (0.70 | ) | | | (0.33 | ) | | | (0.21 | ) | | | (0.74 | ) | | | (0.45 | ) |
| Tax return of capital | | | (0.67 | ) | | | (0.93 | ) | | | (0.92 | ) | | | (0.75 | ) | | | (0.63 | ) |
| Total distributions | | | (1.37 | ) | | | (1.26 | ) | | | (1.13 | ) | | | (1.49 | ) | | | (1.08 | ) |
| | | | | | | | | | | | | | | | | | | | | |
| NET INCREASE/(DECREASE) IN NET ASSET VALUE | | | 9.85 | | | | 0.57 | | | | 4.05 | | | | 4.08 | | | | (4.68 | ) |
| NET ASSET VALUE, END OF PERIOD | | $ | 33.06 | | | $ | 23.21 | | | $ | 22.64 | | | $ | 18.59 | | | $ | 14.51 | |
| TOTAL RETURN(b) | | | 50.02 | % | | | 8.63 | % | | | 28.21 | % | | | 38.93 | % | | | (18.82 | )% |
| | | | | | | | | | | | | | | | | | | | | |
| RATIOS/SUPPLEMENTAL DATA: | | | | | | | | | | | | | | | | | | | | |
| Net assets, end of period (000s) | | $ | 235,541 | | | $ | 132,274 | | | $ | 142,086 | | | $ | 59,487 | | | $ | 36,988 | |
| Ratio of expenses to average net assets | | | 0.35 | % | | | 0.35 | % | | | 0.35 | % | | | 0.51 | %(c) | | | 0.65 | % |
| Ratio of net investment income to average net assets | | | 4.50 | % | | | 4.46 | % | | | 2.84 | % | | | 5.84 | % | | | 5.91 | % |
| PORTFOLIO TURNOVER RATE(d) | | | 33 | % | | | 28 | % | | | 26 | % | | | 34 | % | | | 34 | % |
| (a) | Based on average shares outstanding during the period. |
| (b) | Total return is calculated assuming an initial investment made at the net assets value at the beginning of the period and redemption at the net asset value on the last day of the period and assuming all distributions are reinvested at actual reinvestment prices. Total return calculated for a period of less than one year is not annualized. |
| (c) | Effective July 1, 2021, the Fund’s Advisory Fee changed from 0.65% to 0.35%. |
| (d) | Portfolio turnover for periods less than one year is not annualized and does not include securities received or delivered from processing creations or redemptions in-kind. |
See Notes to Financial Statements and Financial Highlights.
Alerian Exchange Traded Funds
| Notes to Financial Statements and Financial Highlights | November 30, 2024 |
1. ORGANIZATION
ALPS ETF Trust (the “Trust”), a Delaware statutory trust, is an open-end management investment company registered under the Investment Company Act of 1940, as amended (the “1940 Act”). As of November 30, 2024, the Trust consisted of twenty-three separate portfolios. Each portfolio represents a separate series of the Trust. This report pertains to the Alerian MLP ETF and the Alerian Energy Infrastructure ETF (each a “Fund” and collectively, the “Funds”).
The investment objective of the Alerian MLP ETF is to seek investment results that correspond (before fees and expenses) generally to the price and yield performance of its underlying index, the Alerian MLP Infrastructure Index. The investment objective of the Alerian Energy Infrastructure ETF is to seek investment results that correspond (before fees and expenses) generally to the price and yield performance of its underlying index, the Alerian Midstream Energy Select Index. The investment advisor uses a “passive management” or indexing investment approach to try to achieve each Fund’s investment objective. Each Fund is considered non-diversified and may invest a greater portion of assets in securities of individual issuers than a diversified fund. As a result, changes in the market value of a single investment could cause greater fluctuations in share price than would occur in a diversified fund.
Each Fund’s Shares (“Shares”) are listed on the NYSE Arca, Inc. (the “NYSE Arca”). Each Fund issues and redeems Shares, at net asset value (“NAV”), in blocks of 25,000 Shares, each of which is called a “Creation Unit”. Creation Units are issued and redeemed principally in-kind for securities included in the Underlying Index. Except when aggregated in Creation Units, Shares are not redeemable securities of the Fund.
Pursuant to the Trust’s organizational documents, its Officers and Trustees are indemnified against certain liability arising out of the performance of their duties to the Trust. Additionally, in the normal course of business, the Trust enters into contracts with service providers that contain general indemnification clauses. The Trust’s maximum exposure under these arrangements is unknown, as this would involve future claims that may be made against the Trust that have not yet occurred.
2. SIGNIFICANT ACCOUNTING POLICIES
The following is a summary of significant accounting policies consistently followed by the Funds in the preparation of the financial statements. The accompanying financial statements were prepared in accordance with accounting principles generally accepted in the United States of America (“U.S. GAAP”). The preparation of financial statements in conformity with U.S. GAAP requires management to make certain estimates and assumptions that affect the reported amounts of assets and liabilities and disclosures of contingent assets and liabilities at the date of the financial statements and the reported amounts of revenue and expenses during the period. Actual results could differ from those estimates. Each Fund is considered an investment company under U.S. GAAP and follows the accounting and reporting guidance applicable to investment companies in the Financial Accounting Standards Board (“FASB”) Accounting Standards Codification Topic 946.
A. Portfolio Valuation
Each Fund’s NAV is determined daily, as of the close of regular trading on the New York Stock Exchange (“NYSE”), normally 4:00 p.m. Eastern Time, on each day the NYSE is open for trading. The NAV is computed by dividing the value of all assets of the Fund (including accrued interest and dividends), less all liabilities (including accrued expenses and dividends declared but unpaid), by the total number of shares outstanding.
Portfolio securities listed on any exchange other than the NASDAQ Stock Market LLC (“NASDAQ”) are valued at the last sale price on the business day as of which such value is being determined. If there has been no sale on such day, the securities are valued at the mean of the most recent bid and ask prices on such day. Securities traded on the NASDAQ are valued at the NASDAQ Official Closing Price as determined by NASDAQ. Portfolio securities traded on more than one securities exchange are valued at the last sale price on the business day as of which such value is being determined at the close of the exchange representing the principal market for such securities. Portfolio securities traded in the over-the-counter market, but excluding securities traded on the NASDAQ, are valued at the last quoted sale price in such market.
The Funds’ investments are valued at market value or, in the absence of market value with respect to any portfolio securities, at fair value according to procedures adopted by the Trust’s Board of Trustees (the “Board”). Pursuant to Rule 2a-5 under the 1940 Act, the Board designated ALPS Advisors, Inc. (the “Adviser”) as the valuation designee (“Valuation Designee”) for each Fund to perform the fair value determinations relating to Fund investments. The Adviser may carry out its designated responsibilities as Valuation Designee through various teams and committees. When market quotations are not readily available or when events occur that make established valuation methods unreliable, securities of the Funds may be valued in good faith by the Valuation Designee. These securities generally include, but are not limited to, restricted securities (securities which may not be publicly sold without registration under the Securities Act of 1933) for which a pricing service is unable to provide a market price; securities whose trading has been formally suspended; a security whose market price is not available from a pre-established primary pricing source or the pricing source is not willing to provide a price; a security with respect to which an event has occurred that is most likely to materially affect the value of the security after the market has closed but before the calculation of the Funds’ NAV or make it difficult or impossible to obtain a reliable market quotation; or a security whose price, as provided by the pricing service, does not reflect the security’s “fair value” due to the security being de-listed from a national exchange or the security’s primary trading market is temporarily closed at a time when, under normal conditions, it would be open. As a general principle, the current “fair value” of a security would be the amount which the owner might reasonably expect to receive from the sale on the applicable exchange or principal market. A variety of factors may be considered in determining the fair value of such securities.
Alerian Exchange Traded Funds
| Notes to Financial Statements and Financial Highlights | November 30, 2024 |
B. Fair Value Measurements
Each Fund discloses the classification of its fair value measurements following a three-tier hierarchy based on the inputs used to measure fair value. Inputs refer broadly to the assumptions that market participants would use in pricing the asset or liability, including assumptions about risk. Inputs may be observable or unobservable. Observable inputs reflect the assumptions market participants would use in pricing the asset or liability that are developed based on market data obtained from sources independent of the reporting entity. Unobservable inputs reflect the reporting entity’s own assumptions about the assumptions market participants would use in pricing the asset or liability that are developed based on the best information available.
Valuation techniques used to value the Funds’ investments by major category are as follows:
Equity securities, including restricted securities, and Limited Partnerships for which market quotations are readily available, are valued at the last reported sale price or official closing price as reported by a third party pricing vendor on the primary market or exchange on which they are traded and are categorized as Level 1 in the hierarchy. In the event there were no sales during the day or closing prices are not available, securities are valued at the mean of the most recent quoted bid and ask prices on such day and are generally categorized as Level 2 in the hierarchy. Investments in open-end mutual funds are valued at their closing NAV each business day and are categorized as Level 1 in the hierarchy.
Changes in valuation techniques may result in transfers in or out of an assigned level within the disclosure hierarchy.
Various inputs are used in determining the value of the Funds’ investments as of the end of the reporting period. When inputs used fall into different levels of the fair value hierarchy, the level in the hierarchy within which the fair value measurement falls is determined based on the lowest level input that is significant to the fair value measurement in its entirety. The designated input levels are not necessarily an indication of the risk or liquidity associated with these investments.
These inputs are categorized in the following hierarchy under applicable financial accounting standards:
| Level 1 | – | Unadjusted quoted prices in active markets for identical investments, unrestricted assets or liabilities that a Fund has the ability to access at the measurement date; |
| Level 2 | – | Quoted prices which are not active, quoted prices for similar assets or liabilities in active markets or inputs other than quoted prices that are observable (either directly or indirectly) for substantially the full term of the asset or liability; and |
| Level 3 | – | Significant unobservable prices or inputs (including the Fund’s own assumptions in determining the fair value of investments) where there is little or no market activity for the asset or liability at the measurement date. |
The following is a summary of the inputs used to value each Fund’s investments as of November 30, 2024:
Alerian MLP ETF
| Investments in Securities at Value | | Level 1 - Quoted and
Unadjusted Prices | | | Level 2 - Other Significant Observable Inputs | | | Level 3 - Significant Unobservable Inputs | | | Total | |
| Master Limited Partnerships* | | $ | 10,890,209,643 | | | $ | – | | | $ | – | | | $ | 10,890,209,643 | |
| Short Term Investments | | | 1,487,674 | | | | – | | | | – | | | | 1,487,674 | |
| Total | | $ | 10,891,697,317 | | | $ | – | | | $ | – | | | $ | 10,891,697,317 | |
Alerian Exchange Traded Funds
| Notes to Financial Statements and Financial Highlights | November 30, 2024 |
Alerian Energy Infrastructure ETF
| Investments in Securities at Value | | Level 1 - Quoted and
Unadjusted Prices | | | Level 2 - Other Significant Observable Inputs | | | Level 3 - Significant Unobservable Inputs | | | Total | |
| Canadian Energy Infrastructure Companies* | | $ | 55,064,248 | | | $ | – | | | $ | – | | | $ | 55,064,248 | |
| Exchange Traded Fund | | | 2,388,250 | | | | – | | | | – | | | | 2,388,250 | |
| U.S. Energy Infrastructure Companies* | | | 70,990,361 | | | | – | | | | – | | | | 70,990,361 | |
| U.S. Energy Infrastructure MLPs* | | | 64,943,174 | | | | – | | | | – | | | | 64,943,174 | |
| U.S. General Partners* | | | 41,938,892 | | | | – | | | | – | | | | 41,938,892 | |
| Short Term Investments | | | 461,099 | | | | – | | | | – | | | | 461,099 | |
| Total | | $ | 235,786,024 | | | $ | – | | | $ | – | | | $ | 235,786,024 | |
| * | For a detailed breakdown of sectors, see the accompanying Schedule of Investments. |
The Funds did not have any securities that used significant unobservable inputs (Level 3) in determining fair value and there were no transfers into or out of Level 3 during the year ended November 30, 2024.
C. Foreign Currency Translation
The books and records of the Funds are maintained in U.S. dollars. Investment valuations and other assets and liabilities initially expressed in foreign currencies are converted each business day into U.S. dollars based upon current exchange rates. The portion of realized and unrealized gains or losses on investments due to fluctuations in foreign currency exchange rates is not separately disclosed and is included in realized and unrealized gains or losses on investments, when applicable.
D. Securities Transactions and Investment Income
Securities transactions are recorded as of the trade date. Realized gains and losses from securities transactions are recorded on the specific identification in accordance with GAAP. Dividend income and capital gains distributions, if any, are recorded on the ex-dividend date, net of any foreign taxes withheld. Interest income, if any, is recorded on the accrual basis, including amortization of premiums and accretion of discounts.
E. Dividends and Distributions to Shareholders
Each Fund intends to declare and make quarterly distributions, or as the Board may determine from time to time. Distributions of net realized capital gains earned by the Alerian Energy Infrastructure ETF, if any, are distributed at least annually. Distributions from net investment income and capital gains are determined in accordance with income tax regulations, which may differ from U.S. GAAP. These differences are primarily due to differing treatments of income and gains on various investment securities held by the Funds, timing differences and differing characterization of distributions made by the Funds.
Distributions received from each Fund’s investments in Master Limited Partnerships (“MLPs”) may be comprised of both income and return of capital. Each Fund records investment income and return of capital based on estimates made at the time such distributions are received. Such estimates are based on historical information available from each MLP and other industry sources. These estimates may subsequently be revised based on information received from MLPs after their tax reporting periods are concluded.
The Funds each expect a portion of its distributions to shareholders might be comprised of tax deferred return of capital. Return of capital distributions are not taxable income to the shareholder, but reduce the investor’s tax basis in the investor’s Fund Shares. Such a reduction in tax basis will result in larger taxable gains and/or lower tax losses on a subsequent sale of Fund Shares. Shareholders who periodically receive the payment of dividends or other distributions consisting of a return of capital may be under the impression that they are receiving net profits from the Funds when, in fact, they are not. Shareholders should not assume that the source of the distributions is from the net profits of the Funds.
F. Federal Income Taxation and Tax Basis Information
Alerian MLP ETF
The Fund is taxed as a regular C-corporation for federal income tax purposes and as such is obligated to pay federal and state income tax. This treatment differs from most investment companies, which elect to be treated as “regulated investment companies” under the Internal Revenue Code of 1986, as amended (the “Code”) in order to avoid paying entity level income taxes. Under current law, the Fund is not eligible to elect treatment as a regulated investment company due to its investments primarily in MLPs invested in energy assets. The Fund expects that substantially all of the distributions it receives from MLPs may be treated as a tax-deferred return of capital, thus reducing the Fund’s current tax liability. However, the amount of taxes paid by the Fund will vary depending on the amount of income and gains derived from investments and/or sales of MLP interests and such taxes will reduce your return from an investment in the Fund.
Alerian Exchange Traded Funds
| Notes to Financial Statements and Financial Highlights | November 30, 2024 |
Since the Fund will be subject to taxation on its taxable income, the NAV of the Fund shares will also be reduced by the accrual of any deferred tax liabilities. The Underlying Index however is calculated without any deductions for taxes. As a result, the Fund’s after tax performance could differ significantly from the Underlying Index even if the pretax performance of the Fund and the performance of Underlying Index are closely related.
Cash distributions from MLPs to the Fund that exceed the Fund’s allocable share of such MLP’s net taxable income are considered a tax deferred return of capital that will reduce the Fund’s adjusted tax basis in the equity securities of the MLP. These reductions in the Fund’s adjusted tax basis in the MLP equity securities will increase the amount of any taxable gain (or decrease the amount of any tax loss) recognized by the Fund on a subsequent sale of the securities. A portion of any gain or loss recognized by the Fund on a sale of an MLP equity security (or by an MLP on a sale of an underlying asset) may be separately computed and treated as ordinary income or loss under the Code to the extent attributable to assets of the MLP that give rise to depreciation recapture, intangible drilling and development cost recapture, or other “unrealized receivables” or “inventory items” under the Code. Any such gain may exceed net taxable gain realized on the sale and will be recognized even if there is a net taxable loss on the sale. The Fund’s net capital losses may only be used to offset capital gains and therefore cannot be used to offset gains that are treated as ordinary income. Thus, the Fund could recognize both gain that is treated as ordinary income and a capital loss on a sale of an MLP equity security (or on an MLP’s sale of an underlying asset) and would not be able to use the capital loss to offset that gain. The Fund will accrue deferred income taxes for any future tax liability associated with (i) that portion of MLP distributions considered to be a tax-deferred return of capital as well as (ii) capital appreciation of its investments. Upon the sale of an MLP security, the Fund may be liable for previously deferred taxes. The Fund will rely to some extent on information provided by the MLPs, which is not necessarily timely, to estimate the deferred tax liability for purposes of financial statement reporting and determining the Fund’s NAV. From time to time, the Adviser will modify the estimates or assumptions related to the Fund’s deferred tax liability as new information becomes available and may consider, among other matters, the duration of statutory carryforward periods, shareholder transactions, underlying index constituent changes and market conditions. The Fund will generally compute deferred income taxes based on the federal income tax rate applicable to corporations and an assumed rate attributable to state taxes.
The Fund’s income tax expense/(benefit) consists of the following:
| Alerian MLP ETF | | Year ended November 30, 2024 | |
| | | Current | | | Deferred | | | Total | |
| Federal | | $ | 166,481,272 | | | $ | 351,332,386 | | | $ | 517,813,658 | |
| State | | | 3,453,782 | | | | 23,660,141 | | | | 27,113,923 | |
| Valuation Allowance | | | – | | | | (79,004,802 | ) | | | (79,004,802 | ) |
| Total tax expense/(benefit) | | $ | 169,935,054 | | | $ | 295,987,725 | | | $ | 465,922,779 | |
Deferred income taxes reflect the net tax effect of temporary differences between the carrying amount of assets and liabilities for financial reporting and tax purposes.
Components of the Fund’s deferred tax assets and liabilities are as follows:
| Alerian MLP ETF | | As of November 30, 2024 | | | As of November 30, 2023 | |
| Deferred tax assets: | | | | | | | | |
| Capital loss carryforward | | $ | 443,596,517 | | | $ | 524,032,603 | |
| Net operating loss carryforward | | | 23,290,244 | | | | 24,884,154 | |
| Income recognized from MLP investments | | | 1,874,687,034 | | | | 1,632,443,967 | |
| Other deferred tax assets | | | 13,488,405 | | | | 9,788,597 | |
| Alternative Minimum Tax | | | 83,538,587 | | | | – | |
| Valuation allowance | | | (12,890,314 | ) | | | (91,895,116 | ) |
| Less Deferred tax liabilities: | | | | | | | | |
| Net unrealized gain on investment securities | | | (2,975,307,956 | ) | | | (2,352,863,780 | ) |
| Other deferred tax liabilities | | | (67,705 | ) | | | (67,889 | ) |
| Net Deferred Tax Asset/(Liability) | | $ | (549,665,188 | ) | | $ | (253,677,464 | ) |
Due to the activities of the MLPs that the Fund is invested in, the Fund is required to pay franchise tax in certain states. Generally speaking, franchise tax expense is a tax on equity of a corporation, or base minimum fees, imposed by various jurisdictions. The amounts of the tax are estimated throughout the year based upon the Fund’s estimate of underlying activities conducted in the states and reconciled to actual amounts paid upon the filing of the tax returns for the states. These taxes are paid as either estimated tax payments, extension payments, or with the tax return filings of the various states.
Alerian Exchange Traded Funds
| Notes to Financial Statements and Financial Highlights | November 30, 2024 |
The capital loss carryforward is available to offset future taxable income. The capital loss can be carried forward for 5 years and, accordingly, would begin to expire as of November 30, 2025. The Fund has net capital loss carryforwards for federal income tax purposes as follows:
| Alerian MLP ETF | | Period-Ended | | Amount | | | Expiration |
| Federal | | 11/30/2020 | | $ | 516,043,002 | | | 11/30/2025 |
| Federal | | 11/30/2021 | | | 673,784,686 | | | 11/30/2026 |
| Federal | | 11/30/2022 | | | 818,305,027 | | | 11/30/2027 |
| Total | | | | $ | 2,008,132,715 | | | |
The net operating loss carryforward is available to offset future taxable income. The Fund has no net operating loss carryforwards for federal income tax purposes and has state tax net operating loss carryforwards of various amounts per state. The Deferred Tax Assets associated with these state tax net operating losses are as follows:
| Alerian MLP ETF | | Period-Ended | | Amount | | | Expiration |
| State | | 11/30/2012 | | $ | 346,810 | | | Varies by State |
| State | | 11/30/2013 | | | 1,498,152 | | | Varies by State |
| State | | 11/30/2014 | | | 476,877 | | | Varies by State |
| State | | 11/30/2015 | | | 2,976,169 | | | Varies by State |
| State | | 11/30/2016 | | | 5,570,406 | | | Varies by State |
| State | | 11/30/2017 | | | 4,623,336 | | | Varies by State |
| State | | 11/30/2018 | | | 1,664,819 | | | Varies by State |
| State | | 11/30/2019 | | | 1,479,392 | | | Varies by State |
| State | | 11/30/2020 | | | 1,665,387 | | | Varies by State |
| State | | 11/30/2021 | | | 2,419,366 | | | Varies by State |
| State | | 11/30/2022 | | | 362,172 | | | Varies by State |
| State | | 11/30/2023 | | | 207,358 | | | Varies by State |
| Total | | | | $ | 23,290,244 | | | |
The Fund reviews the recoverability of its deferred tax assets based upon the weight of available evidence. When assessing the recoverability of its deferred tax assets, significant weight was given to the effects of potential future realized and unrealized gains on investments and the period over which these deferred tax assets can be realized. Currently, any capital losses that may be generated by the Fund are eligible to be carried back up to three years and can be carried forward for five years to offset capital gains recognized by the Fund in those years.
Based upon the Fund’s assessment, it has determined that it is “more-likely-than-not” that a portion of its deferred tax assets will not be realized through future taxable income of the appropriate character. Accordingly, a valuation allowance has been established for the Fund’s net operating losses in certain states. The Fund will continue to assess the need for a valuation allowance in the future.
Total income tax expense/(benefit) (current and deferred) differs from the amount computed by applying the federal statutory income tax rate of 21% to net investment income and realized and unrealized gain/(losses) on investment before taxes as follows:
| Alerian MLP ETF | | As of November 30, 2024 | |
| Income tax expense at statutory rate | | $ | 518,589,709 | |
| State income taxes (net of federal benefit) | | | 28,511,185 | |
| Permanent differences, net | | | (1,667,670 | ) |
| Effect of tax rate change (state level) | | | (505,643 | ) |
| Valuation allowance | | | (79,004,802 | ) |
| Net income tax expense | | $ | 465,922,779 | |
The Fund recognizes interest accrued related to unrecognized tax benefits and penalties as income tax expense. For the year ended November 30, 2024, the Fund paid no penalties and interest.
The Fund recognizes the tax benefits of uncertain tax positions only where the position is “more-likely-than-not” to be sustained assuming examination by tax authorities. Management has analyzed the Fund’s tax positions and has concluded that no liability for unrecognized tax benefits should be recorded related to uncertain tax positions taken on U.S. tax returns and state tax returns filed since inception of the Fund. Tax periods ended November 30, 2021 through November 30, 2023 remain subject to examination by tax authorities in the United States. Due to the nature of the Fund’s investments, the Fund may be required to file income tax returns in several states. The Fund is not aware of any tax positions for which it is reasonably possible that the total amounts of unrecognized tax benefits will change materially in the next 12 months.
Alerian Exchange Traded Funds
| Notes to Financial Statements and Financial Highlights | November 30, 2024 |
Under the Inflation Reduction Act of 2022, a 15% corporate alternative minimum tax on adjusted financial statement income is applicable to corporate entities with average annual adjusted financial statement income in excess of $1 billion for a three-taxable-year period. This corporate alternative minimum tax applies to the Fund for the current taxable year, the additional tax liability of approximately $83.5 million is the excess of the Fund’s corporate alternative minimum tax over regular income tax imposed for the year. The impact to current tax expense and amounts payable result in an offsetting deferred tax benefit, subject to realization.
A federal excise tax on stock repurchases is expected to apply to the Fund with respect to share redemptions occurring on or after January 1, 2023 in accordance with the provisions of the Inflation Reduction Act of 2022. The excise tax is one percent (1%) of the fair market value of Fund share redemptions (in excess of $1 million of fair market value) less the fair market value of Fund share issuances annually on a taxable year basis. For the year ended November 30, 2024, the Fund had no excise tax accrued.
Alerian Energy Infrastructure ETF
The timing and character of income and capital gain distributions are determined in accordance with income tax regulations, which may differ from U.S. GAAP. Reclassifications are made to the Fund’s capital accounts for permanent tax differences to reflect income and gains available for distribution (or available capital loss carryforwards) under income tax regulations.
No provision for income taxes is included in the accompanying financial statements, as the Alerian Energy Infrastructure ETF intends to distribute to shareholders all taxable investment income and realized gains and otherwise comply with Subchapter M of the Internal Revenue Code of 1986, as amended, applicable to regulated investment companies. The Alerian Energy Infrastructure ETF evaluates tax positions taken (or expected to be taken) in the course of preparing the Fund’s tax returns to determine whether these positions meet a “more-likely-than-not” standard that, based on the technical merits, have a more than fifty percent likelihood of being sustained by a taxing authority upon examination. A tax position that meets the “more-likely-than-not” recognition threshold is measured to determine the amount of benefit to recognize in the financial statements.
As of and during the year ended November 30, 2024, the Alerian Energy Infrastructure ETF did not have a liability for any unrecognized tax benefits. The Alerian Energy Infrastructure ETF files U.S. federal, state, and local tax returns as required. The Fund’s tax returns are subject to examination by the relevant tax authorities until expiration of the applicable statute of limitations, which is generally three years after the filing of the tax return, but may extend to four years in certain jurisdictions. The Fund’s tax returns for open years have incorporated no uncertain tax positions that require a provision for income taxes.
For the year ended November 30, 2024, permanent book and tax differences resulting primarily from differing treatment of investments in partnerships, redemptions in kind, REIT true-up adjustments and prior year tax return true-up were identified and reclassified among components of the Fund’s net assets as follows:
| Fund | | Paid-in Capital | | | Total Distributable Earnings | |
| Alerian Energy Infrastructure ETF | | $ | 1,543,963 | | | $ | (1,543,963 | ) |
The tax character of the distributions paid during the fiscal years ended November 30, 2024 and November 30, 2023 was as follows:
| | | Ordinary Income | | | Long-Term Capital Gain | | | Return of Capital | |
| November 30, 2024 | | | | | | | | | | | | |
| Alerian Energy Infrastructure ETF | | $ | 4,193,460 | | | $ | – | | | $ | 4,060,038 | |
| | | Ordinary Income | | | Long-Term Capital Gain | | | Return of Capital | |
| November 30, 2023 | | | | | | | | | | | | |
| Alerian Energy Infrastructure ETF | | $ | 1,902,116 | | | $ | – | | | $ | 5,303,713 | |
Under current law, capital losses maintain their character as short-term or long-term and are carried forward to the next tax year without expiration. As of November 30, 2024, the following amounts are available as carry forwards to the next tax year:
| | | Short-Term | | | Long-Term | |
| Alerian Energy Infrastructure ETF | | $ | – | | | $ | 812,221 | |
Alerian Exchange Traded Funds
| Notes to Financial Statements and Financial Highlights | November 30, 2024 |
During the year ended November 30, 2024, Alerian Energy Infrastructure ETF utilized $910,281 in capital loss carryovers.
As of November 30, 2024, the components of distributable earnings on a tax basis were as follows:
| | | Alerian Energy Infrastructure ETF | |
| Accumulated net realized loss on investments | | $ | (812,221 | ) |
| Net unrealized appreciation on investments | | | 77,566,122 | |
| Total | | $ | 76,753,901 | |
As of November 30, 2024, the costs of investments for federal income tax purposes and accumulated net unrealized appreciation/(depreciation) on investments were as follows:
| | | Alerian MLP ETF | | | Alerian Energy Infrastructure ETF | |
| Cost of investments for income tax purposes | | $ | 5,909,092,035 | | | $ | 158,218,032 | |
| Gross appreciation (excess of value over tax cost) | | $ | 5,153,422,244 | | | $ | 77,845,470 | |
| Gross depreciation (excess of tax cost over value) | | | (170,816,962 | ) | | | (277,478 | ) |
| Net appreciation (depreciation) of foreign currency | | | – | | | | (1,870 | ) |
| Net unrealized appreciation/(depreciation) | | $ | 4,982,605,282 | | | $ | 77,566,122 | |
The difference between cost amounts for financial statement purposes is due primarily to the recognition of pass-through income from a Funds’ investments in master limited partnerships, and wash sales.
G. Lending of Portfolio Securities
The Alerian Energy Infrastructure ETF has entered into a securities lending agreement with State Street Bank & Trust Co. (“SSB”), the Fund’s lending agent. The Fund may lend its portfolio securities only to borrowers that are approved by SSB. The Fund will limit such lending to not more than 33 1/3% of the value of its total assets. The Fund’s securities held at SSB as custodian shall be available to be lent except those securities the Fund or ALPS Advisors, Inc. specifically identifies in writing as not being available for lending. The borrower pledges and maintains with the Fund collateral consisting of cash (U.S. Dollars only), securities issued or guaranteed by the U.S. government or its agencies or instrumentalities, and cash equivalents (including irrevocable bank letters of credit) issued by a person other than the borrower or an affiliate of the borrower. The initial collateral received by the Fund is required to have a value of no less than 102% of the market value of the loaned securities for U.S equity securities and a value of no less than 105% of the market value for non-U.S. equity securities. The collateral is maintained thereafter, at a market value equal to not less than 102% of the current value of the U.S. equity securities on loan and not less than 105% of the current value of the non-U.S. equity securities on loan. The market value of the loaned securities is determined at the close of each business day and any additional required collateral is delivered to the Fund on the next business day. During the term of the loan, the Fund is entitled to all distributions made on or in respect of the loaned securities. Loans of securities are terminable at any time and the borrower, after notice, is required to return borrowed securities within the customary time period for settlement of securities transactions.
Any cash collateral received is reinvested in a money market fund managed by SSB as disclosed in the Fund’s Schedule of Investments and is reflected in the Statement of Assets and Liabilities as a payable for collateral upon return of securities loaned. Non-cash collateral, in the form of securities issued or guaranteed by the U.S. government or its agencies or instrumentalities, is not disclosed in the Fund’s Statement of Assets and Liabilities or the contractual maturity table below as it is held by the lending agent on behalf of the Fund, and the Fund does not have the ability to re-hypothecate these securities. Income earned by the Fund from securities lending activity is disclosed in the Statement of Operations.
The following is a summary of the Fund’s securities lending agreement and related cash and non-cash collateral received as of November 30, 2024:
Fund | | Market Value of
Securities on Loan | | | Cash
Collateral Received | | | Non-Cash
Collateral Received | | | Total
Collateral Received | |
| Alerian Energy Infrastructure ETF | | $ | 2,457,288 | | | $ | 445,871 | | | $ | 2,114,947 | | | $ | 2,560,818 | |
The risks of securities lending include the risk that the borrower may not provide additional collateral when required or may not return the securities when due. To mitigate these risks, the Fund benefits from a borrower default indemnity provided by SSB. SSB’s indemnity allows for full replacement of securities lent wherein SSB will purchase the unreturned loaned securities on the open market by applying the proceeds of the collateral, or to the extent such proceeds are insufficient or the collateral is unavailable, SSB will purchase the unreturned loan securities at SSB’s expense. However, the Fund could suffer a loss if the value of the investments purchased with cash collateral falls below the value of the cash collateral received.
Alerian Exchange Traded Funds
| Notes to Financial Statements and Financial Highlights | November 30, 2024 |
The following table reflects a breakdown of transactions accounted for as secured borrowings, the gross obligation by the type of collateral pledged or securities loaned, and the remaining contractual maturity of those transactions as of November 30, 2024:
| Alerian Energy Infrastructure ETF | | Remaining contractual maturity of the agreements | |
| | | | |
| Securities Lending Transactions | | Overnight &
Continuous | | | Up to 30 Days | | | 30-90 Days | | | Greater than 90 Days | | | Total | |
| Common Stocks | | $ | 445,871 | | | $ | – | | | $ | – | | | $ | – | | | $ | 445,871 | |
| Total Borrowings | | | | | | | | | | | | | | | | | | | 445,871 | |
| Gross amount of recognized liabilities for securities lending (collateral received) | | | | | | | | | | | $ | 445,871 | |
3. INVESTMENT ADVISORY FEE AND OTHER AFFILIATED TRANSACTIONS
ALPS Advisors, Inc. serves as the Funds’ investment adviser pursuant to an Investment Advisory Agreement with the Trust on behalf of each Fund (the “Advisory Agreement”). Pursuant to the Advisory Agreement, each Fund pays the Adviser an annual management fee for the services and facilities it provides, payable on a monthly basis as a percentage of the relevant Fund’s average daily net assets as set out below.
| Fund | | | | | Advisory Fee |
| Alerian MLP ETF | | | 0.85 | % | | Average net assets up to and including $7 billion |
| | | | 0.825 | % | | Average net assets greater than $7 billion up to and including $8.5 billion |
| | | | 0.80 | % | | Average net assets greater than $8.5 billion up to and including $10.5 billion |
| | | | 0.75 | % | | Average net assets greater than $10.5 billion up to and including $12.5 billion |
| | | | 0.70 | % | | Average net assets greater than $12.5 billion up to and including $14.5 billion |
| | | | 0.65 | % | | Average net assets greater than $14.5 billion up to and including $16.5 billion |
| | | | 0.60 | % | | Average net assets greater than $16.5 billion up to and including $18.5 billion |
| | | | 0.55 | % | | Average net assets greater than $18.5 billion up to and including $20.5 billion |
| | | | 0.50 | % | | Average net assets greater than $20.5 billion up to and including $22.5 billion |
| | | | 0.45 | % | | Average net assets greater than $22.5 billion up to and including $25 billion |
| | | | 0.40 | % | | Average net assets greater than $25 billion |
| Fund | | | | | Advisory Fee |
| Alerian Energy Infrastructure ETF | | | 0.35 | % | | |
Out of the unitary management fees, the Adviser pays substantially all expenses of each Fund, including the cost of transfer agency, custody, fund administration, legal, audit, trustees and other services, except for interest expenses, distribution fees or expenses, brokerage expenses, taxes and extraordinary expenses not incurred in the ordinary course of each Fund’s business. The Adviser’s unitary management fee is designed to pay substantially all of each Fund’s expenses and to compensate the Adviser for providing services for each Fund.
ALPS Fund Services, Inc., an affiliate of the Adviser, is the administrator of the Funds.
Each Trustee receives (1) a quarterly retainer of $25,000, (2) a per meeting fee of $15,000, (3) $2,500 for any special meeting held outside of a regularly scheduled board meeting, and (4) reimbursement for all reasonable out-of-pocket expenses relating to attendance at meetings. In addition, the Chairman of the Board receives a quarterly retainer of $5,000, the Chairman of the Audit Committee receives a quarterly retainer of $3,000, and the Chairman of the Nominating & Governance Committee receives a quarterly retainer of $2,000, each in connection with their respective roles.
Alerian Exchange Traded Funds
| Notes to Financial Statements and Financial Highlights | November 30, 2024 |
4. PURCHASES AND SALES OF SECURITIES
For the year ended November 30, 2024, the cost of purchases and proceeds from sales of investment securities, excluding short-term investments and in-kind transactions, were as follows:
| Fund | | Purchases | | | Sales | |
| Alerian MLP ETF | | $ | 1,609,824,411 | | | $ | 2,926,418,821 | |
| Alerian Energy Infrastructure ETF | | | 52,054,700 | | | | 52,320,958 | |
For the year ended ended November 30, 2024, the cost of in-kind purchases and proceeds from in-kind sales were as follows:
| Fund | | Purchases | | | Sales | |
| Alerian MLP ETF | | $ | 2,506,110,877 | | | $ | – | |
| Alerian Energy Infrastructure ETF | | | 46,187,950 | | | | 4,728,978 | |
For the year ended November 30, 2024, the in-kind net realized gains/(losses) were as follows:
| Fund | | Net Realized Gain/(Loss) | |
| Alerian Energy Infrastructure ETF | | $ | 1,300,780 | |
Gains on in-kind transactions are not considered taxable for federal income tax purposes and losses on in-kind transactions are also not deductible for tax purposes.
5. MASTER LIMITED PARTNERSHIPS
MLPs are publicly traded partnerships engaged in, among other things, the transportation, storage and processing of minerals and natural resources, and are treated as partnerships for U.S. federal income tax purposes. By confining their operations to these specific activities, their interests, or units, are able to trade on public securities exchanges exactly like the shares of a corporation, without entity level taxation. To qualify as a MLP and to not be taxed as a corporation, a partnership must receive at least 90% of its income from qualifying sources as set forth in Section 7704(d) of the Code. These qualifying sources include, among other things, natural resource-based activities such as the processing, transportation and storage of mineral or natural resources. MLPs generally have two classes of owners, the general partner and limited partners. The general partner of an MLP is typically owned by a major energy company, an investment fund, the direct management of the MLP, or is an entity owned by one or more of such parties. The general partner may be structured as a private or publicly traded corporation or other entity. The general partner typically controls the operations and management of the MLP through an up to 2% equity interest in the MLP plus, in many cases, ownership of common units and subordinated units. Limited partners typically own the remainder of the partnership, through ownership of common units, and have a limited role in the partnership’s operations and management.
MLPs are typically structured such that common units and general partner interests have first priority to receive quarterly cash distributions up to an established minimum amount (“minimum quarterly distributions” or “MQD”). Common and general partner interests also accrue arrearages in distributions to the extent the MQD is not paid. Once common and general partner interests have been paid, subordinated units receive distributions of up to the MQD; however, subordinated units do not accrue arrearages. Distributable cash in excess of the MQD is distributed to both common and subordinated units and generally on a pro rata basis. The general partner is also eligible to receive incentive distributions if the general partner operates the business in a manner which results in distributions paid per common unit surpassing specified target levels. As the general partner increases cash distributions to the limited partners, the general partner receives an increasingly higher percentage of the incremental cash distributions.
6. CAPITAL SHARE TRANSACTIONS
Shares are created and redeemed by each Fund only in Creation Unit size aggregations of 25,000 Shares. Only broker-dealers or large institutional investors with creation and redemption agreements called Authorized Participants (“AP”) are permitted to purchase or redeem Creation Units from the Funds. Such transactions are generally permitted on an in-kind basis, with a balancing cash component to equate the transaction to the NAV per unit of each Fund on the transaction date. Cash may be substituted equivalent to the value of certain securities generally when they are not available in sufficient quantity for delivery, not eligible for trading by the AP or as a result of other market circumstances.
Alerian Exchange Traded Funds
| Notes to Financial Statements and Financial Highlights | November 30, 2024 |
7. RELATED PARTY TRANSACTIONS
The Funds engaged in cross trades between other funds in the Trust during the year ended November 30, 2024 pursuant to Rule 17a-7 under the 1940 Act. Cross trading is the buying or selling of portfolio securities between funds to which the Adviser serves as the investment adviser. The Board previously adopted procedures that apply to transactions between the Funds of the Trust pursuant to Rule 17a-7. These transactions related to cross trades during the period complied with the requirements set forth by Rule 17a-7 and the Trust’s procedures.
Transactions related to cross trades during the year ended November 30, 2024, were as follows:
| Fund | | Purchase Cost Paid | | | Sale Proceeds Received | | | Realized Gain/(Loss) on Sales | |
| Alerian MLP ETF | | $ | 324,799 | | | $ | 7,788,399 | | | $ | 643,741 | |
| Alerian Energy Infrastructure ETF | | | 7,444,602 | | | | 267,158 | | | | 2,692 | |
8. AFFILIATED COMPANIES
As defined by the Investment Company Act of 1940, an affiliated person, including an affiliated company, is one in which a Fund owns 5% or more of the outstanding voting securities, or a company which is under common ownership or control with the Fund.
For the year ended November 30, 2024, the Alerian MLP ETF held shares in the following affiliates, as defined by the Investment Company Act of 1940.
| Security Name | | Share Balance as of November 30, 2024 | | | Market Value as of November 30, 2023 | | | Purchases | | | Purchases In-Kind | | | Sales | | | Market Value as of November 30, 2024 | | | Dividends | | | Change in Unrealized Appreciation / (Depreciation) | | | Realized Gain/(Loss) | |
| EnLink Midstream LLC | | | 49,239,974 | | | $ | 587,354,365 | | | $ | 62,311,157 | | | $ | 172,560,440 | | | $ | (136,608,453 | ) | | $ | 788,331,984 | | | $ | – | | | $ | 129,655,634 | | | $ | (3,814,898 | ) |
| Genesis Energy LP | | | 20,280,378 | | | | 241,891,872 | | | | 2,427,779 | | | | 66,890,373 | | | | (54,819,100 | ) | | | 242,958,928 | | | | – | | | | 249,511 | | | | (1,937,429 | ) |
| Global Partners LP | | | 4,901,012 | | | | – | | | | 178,603,147 | | | | 55,894,946 | | | | (35,057,382 | ) | | | 276,662,128 | | | | – | | | | 91,547,231 | | | | (1,160,815 | ) |
| Hess Midstream LP* | | | 17,205,686 | | | | 387,826,559 | | | | 140,937,364 | | | | 147,264,737 | | | | (97,311,772 | ) | | | 652,095,499 | | | | 16,609,247 | | | | 149,495,885 | | | | (2,175,841 | ) |
| NuStar Energy LP | | | – | | | | 387,503,318 | | | | 196,707 | | | | 37,584,243 | | | | (274,952,975 | ) | | | – | | | | – | | | | (136,828,141 | ) | | | (1,220,278 | ) |
| Plains All American Pipeline LP | | | 67,007,216 | | | | 1,094,573,909 | | | | 17,440,273 | | | | 306,031,916 | | | | (333,422,971 | ) | | | 1,251,024,723 | | | | – | | | | 255,762,225 | | | | (9,143,664 | ) |
| Suburban Propane Partners LP | | | 11,967,620 | | | | – | | | | 189,474,619 | | | | 55,556,185 | | | | (34,420,614 | ) | | | 237,557,257 | | | | – | | | | 42,777,514 | | | | (1,345,697 | ) |
| Sunoco LP | | | 20,404,759 | | | | – | | | | 835,074,441 | | | | 238,650,542 | | | | (142,562,207 | ) | | | 1,152,052,693 | | | | – | | | | 285,871,085 | | | | (6,930,806 | ) |
| USA Compression Partners LP | | | 13,363,849 | | | | – | | | | 299,468,040 | | | | 71,391,814 | | | | (41,192,086 | ) | | | 320,598,737 | | | | – | | | | 18,773,373 | | | | (4,662,423 | ) |
| Western Midstream Partners LP | | | 30,021,506 | | | | 1,024,380,576 | | | | 21,366,659 | | | | 302,001,241 | | | | (458,847,839 | ) | | | 1,222,175,509 | | | | – | | | | 363,251,704 | | | | 65,172,531 | |
| | | | | | | | | | | | | | | | | | | | | | | | | | | | | | | | | | | | | |
| | | | | | | | | | | | | | | | | | | | | | | $ | 6,143,457,458 | | | $ | 16,609,247 | | | $ | 1,200,556,021 | | | $ | 32,780,680 | |
| * | Not an Affiliated Investment as of November 30, 2023. |
9. MARKET RISK
The Funds are subject to investment and operational risks associated with financial, economic and other global market developments and disruptions, including including those arising from war, terrorism, market manipulation, government interventions, defaults and shutdowns, political changes or diplomatic developments, public health emergencies (such as the spread of infectious diseases, pandemics and epidemics) and natural/environmental disasters, which can negatively impact the securities markets and cause each Fund to lose value. Securities in each Fund’s portfolio may underperform in comparison to securities in general financial markets, a particular financial market or other asset classes due to a number of factors, including inflation (or expectations for inflation), deflation (or expectations for deflation), interest rates, global demand for particular products or resources, market instability, debt crises and downgrades, embargoes, tariffs, sanctions and other trade barriers, regulatory events, other governmental trade or market control programs and related geopolitical events. In addition, the value of the Fund’s investments may be negatively affected by the occurrence of global events such as war, terrorism, environmental disasters, natural disasters or events, country instability, and infectious disease epidemics or pandemics.
10. SUBSEQUENT EVENTS
Subsequent events, if any, after the date of the Statements of Assets and Liabilities have been evaluated through the date the financial statements were issued. Management has determined that there were no subsequent events to report through the issuance of these financial statements.
Alerian Exchange Traded Funds
Report of Independent Registered Public Accounting Firm
To the Shareholders of Alerian MLP ETF and Alerian Energy Infrastructure ETF
and Board of Trustees of ALPS ETF Trust
Opinion on the Financial Statements
We have audited the accompanying statements of assets and liabilities, including the schedules of investments, of Alerian MLP ETF and Alerian Energy Infrastructure ETF (the “Funds”), each a series of ALPS ETF Trust, as of November 30, 2024, the related statements of operations for the year then ended, the statements of changes in net assets and financial highlights for each of the two years in the period then ended, and the related notes (collectively referred to as the “financial statements”). In our opinion, the financial statements present fairly, in all material respects, the financial position of each of the Funds as of November 30, 2024, the results of their operations for the year then ended, and the changes in net assets and financial highlights for each of the two years in the period then ended, in conformity with accounting principles generally accepted in the United States of America.
The Funds’ financial highlights for the years ended November 30, 2022, and prior, were audited by other auditors whose report dated January 27, 2023, expressed an unqualified opinion on those financial highlights.
Basis for Opinion
These financial statements are the responsibility of the Funds’ management. Our responsibility is to express an opinion on the Funds’ financial statements based on our audits. We are a public accounting firm registered with the Public Company Accounting Oversight Board (United States) (“PCAOB”) and are required to be independent with respect to the Funds in accordance with the U.S. federal securities laws and the applicable rules and regulations of the Securities and Exchange Commission and the PCAOB.
We conducted our audits in accordance with the standards of the PCAOB. Those standards require that we plan and perform the audit to obtain reasonable assurance about whether the financial statements are free of material misstatement whether due to error or fraud.
Our audits included performing procedures to assess the risks of material misstatement of the financial statements, whether due to error or fraud, and performing procedures that respond to those risks. Such procedures included examining, on a test basis, evidence regarding the amounts and disclosures in the financial statements. Our procedures included confirmation of securities owned as of November 30, 2024, by correspondence with the custodian and brokers; when replies were not received from brokers, we performed other auditing procedures. Our audits also included evaluating the accounting principles used and significant estimates made by management, as well as evaluating the overall presentation of the financial statements. We believe that our audits provide a reasonable basis for our opinion.
We have served as the auditor of one or more investment companies advised by ALPS Advisors, Inc. since 2013.

COHEN & COMPANY, LTD.
Philadelphia, Pennsylvania
January 29, 2025
Alerian Exchange Traded Funds
| Additional Information | November 30, 2024 (Unaudited) |
TAX INFORMATION
The Funds report the following as a percentage of taxable ordinary income distributions, or up to the maximum amount allowable, for the calendar year ended December 31, 2023:
| | | Qualified Dividend Income | | | Dividend Received Deduction | |
| Alerian MLP ETF | | 100.00% | | | 100.00% | |
| Alerian Energy Infrastructure ETF | | 100.00% | | | 30.65% | |
In early 2024, if applicable, shareholders of record received this information for the distributions paid to them by the Funds during the calendar year 2023 via Form 1099. The Funds will notify shareholders in early 2025 of amounts paid to them by the Funds, if any, during the calendar year 2024.
LICENSING AGREEMENTS
Alerian (the “Licensor”) has entered into an index licensing agreement with ALPS Advisors Inc. (the “Adviser”) with respect to each of the Alerian MLP ETF and the Alerian Energy Infrastructure ETF, to allow the Adviser’s use of AMZI and AMEI. The following disclosure relates to the Licensor:
VettaFi is the designer of the construction and methodology for the Underlying Index. “Alerian,” “Alerian MLP Infrastructure Index,” “Alerian Midstream Energy Select Index,” “Alerian MLP Index,” “Alerian Index Series,” “AMZI,” “AMEI,” and “AMZ” are service marks or trademarks of VettaFi. VettaFi acts as brand licensor for each Underlying Index. VettaFi is not responsible for the descriptions of either Underlying Index or the Funds that appear herein. VettaFi is not affiliated with the Trust, the Adviser or the Distributor.
Neither Fund is issued, sponsored, endorsed, sold or promoted by VettaFi (“Licensor”) or its affiliates. Licensor makes no representation or warranty, express or implied, to the owners of the Fund or any member of the public regarding the advisability of investing in securities generally or in the Fund particularly or the ability of the Alerian MLP Infrastructure Index or the Alerian Midstream Energy Select Index to track general market performance. Licensor’s only relationship to the Licensee is the licensing of the Index which is determined, composed and calculated by Licensor without regard to the Licensee or the Fund. Licensor has no obligation to take the needs of the Licensee or the owners of the Fund into consideration in determining, composing or calculating the Index. Licensor is not responsible for and has not participated in the determination of the timing of, prices at, or quantities of the Fund to be issued or in the determination or calculation of the equation by which the Fund is to be converted into cash. Licensor has no obligation or liability in connection with the issuance, administration, marketing or trading of either Fund and is not responsible for and has not participated in the determination of pricing or the timing of the issuance or sale of the Shares of either Fund or in the determination or calculation of the NAV of the relevant Fund. Alerian MLP Infrastructure Index, Alerian MLP Infrastructure Total Return Index, AMZI, AMZIX, Alerian Midstream Energy Select Index, Alerian Midstream Energy Select Total Return Index, Alerian MLP Index, AMEI, AMEIX, AMNA and AMZ are trademarks of VettaFi and their general use is granted under a license from VettaFi.
LICENSOR DOES NOT GUARANTEE THE QUALITY, ACCURACY AND/OR THE COMPLETENESS OF EACH INDEX OR ANY DATA INCLUDED THEREIN AND SHALL HAVE NO LIABILITY FOR ERRORS OR OMISSIONS OF ANY KIND RELATED TO EACH INDEX OR DATA. LICENSOR MAKES NO WARRANTY, EXPRESS OR IMPLIED, AS TO RESULTS TO BE OBTAINED BY LICENSEE, OWNERS OF EITHER FUND, OR ANY OTHER PERSON OR ENTITY FROM THE USE OF EACH INDEX OR ANY DATA INCLUDED THEREIN IN CONNECTION WITH THE RIGHTS LICENSED TO LICENSEE OR FOR ANY OTHER USE. LICENSOR MAKES NO EXPRESS OR IMPLIED WARRANTIES, AND HEREBY EXPRESSLY DISCLAIMS ALL WARRANTIES OF MERCHANTABILITY OR FITNESS FOR A PARTICULAR PURPOSE OR USE WITH RESPECT TO EACH INDEX OR ANY DATA INCLUDED THEREIN. WITHOUT LIMITING ANY OF THE FOREGOING, IN NO EVENT SHALL LICENSOR HAVE ANY LIABILITY FOR ANY SPECIAL, PUNITIVE, INDIRECT, OR CONSEQUENTIAL DAMAGES (INCLUDING LOST PROFITS), EVEN IF NOTIFIED OF THE POSSIBILITY OF SUCH DAMAGES.
The Adviser does not guarantee the accuracy and/or the completeness of either Underlying Index or any data included therein, and the Adviser shall have no liability for any errors, omissions or interruptions therein. Errors in respect of the quality, accuracy and completeness of the data used to compile the Underlying Index may occur from time to time and may not be identified and corrected by the Index Provider for a period of time or at all, particularly where the indices are less commonly used as benchmarks by funds or managers. Such errors may negatively or positively impact the Fund and its shareholders. For example, during a period where the Underlying Index contains incorrect constituents, the Fund would have market exposure to such constituents and would be underexposed to the Underlying Index’s other constituents. The Adviser makes no warranty, express or implied, as to results to be obtained by either Fund, owners of the Shares of the relevant Fund or any other person or entity from the use of either Underlying Index or any data included therein. The Adviser makes no express or implied warranties, and expressly disclaims all warranties of merchantability or fitness for a particular purpose or use with respect to either Underlying Index or any data included therein. Without limiting any of the foregoing, in no event shall the Adviser have any liability for any special, punitive, direct, indirect, or consequential damages (including lost profits) arising out of matters relating to the use of either Underlying Index, even if notified of the possibility of such damages.
Alerian Exchange Traded Funds
| Additional Information | November 30, 2024 (Unaudited) |
Apart from scheduled rebalances, the Index Provider or its agents may carry out additional ad hoc rebalances to the Underlying Index in order, for example, to correct an error in the selection of index constituents. When the Underlying Index is rebalanced and the Fund in turn rebalances its portfolio to attempt to increase the correlation between the Fund’s portfolio and the Underlying Index, any transaction costs and market exposure arising from such portfolio rebalancing will be borne directly by the Fund and its shareholders. Therefore, errors and additional ad hoc rebalances carried out by the Index Provider or its agents to the Underlying Index may increase the costs to and the tracking error risk of the Fund.
Alerian Exchange Traded Funds
Changes in and Disagreements with Accountants
for Open-End Management Investment Companies | November 30, 2024 (Unaudited) |
On March 14, 2023, BBD LLP (“BBD”) ceased to serve as the independent registered public accounting firm of the Funds. The Board approved the replacement of BBD as a result of Cohen & Company, Ltd.’s (“Cohen”) acquisition of BBD’s investment management group.
The report of BBD on the financial statements of the Funds as of and for the fiscal year or period ended November 30, 2022 did not contain an adverse opinion or a disclaimer of opinion, and was not qualified or modified as to uncertainties, audit scope or accounting principles. During the fiscal year or period ended November 30, 2022, and during the subsequent interim period through March 14, 2023: (i) there were no disagreements between the registrant and BBD on any matter of accounting principles or practices, financial statement disclosure, or auditing scope or procedure, which disagreements, if not resolved to the satisfaction of BBD, would have caused it to make reference to the subject matter of the disagreements in its report on the financial statements of the Funds for such years or interim period; and (ii) there were no “reportable events,” as defined in Item 304(a)(1)(v) of Regulation S-K under the Securities Exchange Act of 1934, as amended.
On March 7, 2023, upon the recommendation of the Funds’ Audit Committee, the Board approved the appointment of Cohen, effective upon the resignation of BBD, as the Funds’ independent registered public accounting firm for the fiscal year ending November 30, 2023.
During the fiscal year or period ended November 30, 2022, and during the subsequent interim period through March 14, 2023, neither the registrant, nor anyone acting on its behalf, consulted with Cohen on behalf of the Funds regarding the application of accounting principles to a specified transaction (either completed or proposed), the type of audit opinion that might be rendered on the Funds’ financial statements, or any matter that was either: (i) the subject of a “disagreement,” as defined in Item 304(a)(1)(iv) of Regulation S-K and the instructions thereto; or (ii) “reportable events,” as defined in Item 304(a)(1)(v) of Regulation S-K.
Alerian Exchange Traded Funds
Proxy Disclosures
for Open-End Management Investment Companies | November 30, 2024 (Unaudited) |
A Special Meeting of Shareholders of the Funds, each a series of the Trust, was held on July 19, 2024. At the meeting, the following matters were voted on by the Shareholders. The results of the Special Meeting of Shareholders are noted below:
Proposal 1: To elect seven Trustees.
| | | Shares Voted in Favor | | | Shares Voted
Against/Withheld or Abstentions | | | Proposal Approved |
| Mary K. Anstine | | 223,143,090 | | | 2,894,793 | | | Yes |
| Edmund J. Burke | | 223,362,578 | | | 2,672,643 | | | Yes |
| Jeremy W. Deems | | 221,670,341 | | | 4,361,535 | | | Yes |
| Rick A. Pederson | | 213,137,140 | | | 12,259,226 | | | Yes |
| Joseph F. Keenan | | 223,547,500 | | | 2,483,867 | | | Yes |
| Susan K. Wold | | 223,460,006 | | | 2,571,857 | | | Yes |
| Laton Spahr | | 223,439,610 | | | 2,593,995 | | | Yes |
Alerian Exchange Traded Funds
Remuneration Paid to Directors, Officers,
and Others of Open-End Management Investment Companies | November 30, 2024 (Unaudited) |
The following chart provides certain information about the Trustee fees paid by the Trust for the year ended November 30, 2024:
| | | Aggregate Regular Compensation
From the Trust | | | Aggregate Special Compensation
From the Trust | | | Total Compensation From the Trust | |
| Mary K. Anstine, Trustee | | $ | 162,500 | | | $ | — | | | $ | 162,500 | |
| Edmund J. Burke, Trustee | | | 166,500 | | | | — | | | | 166,500 | |
| Jeremy W. Deems, Trustee | | | 174,500 | | | | — | | | | 174,500 | |
| Rick A. Pederson, Trustee | | | 186,500 | | | | — | | | | 186,500 | |
| Joseph F. Keenan, Trustee | | | 40,000 | | | | — | | | | 40,000 | |
| Susan K. Wold, Trustee | | | 40,000 | | | | — | | | | 40,000 | |
| Laton Spahr, President and Trustee* | | | — | | | | — | | | | — | |
| Total | | $ | 770,000 | | | $ | — | | | $ | 770,000 | |
| * | Mr. Spahr, the President of the Trust, is deemed an “interested person” by virtue of his position as an officer of the Trust and of ALPS Advisors, Inc. |
Officers who are employed by the Adviser receive no compensation or expense reimbursement from the Trust.
Alerian Exchange Traded Funds
Statement Regarding Basis
for Approval of Investment Advisory Contract | November 30, 2024 (Unaudited) |
At its meetings held on June 3, 2024 and June 18, 2024, the Board of Trustees of the Trust (the “Board” or the “Trustees”), where each Trustee was not an “interested person” of the Trust within the meaning of the Investment Company Act of 1940, as amended (the “Independent Trustees”), evaluated a proposal to approve the continuance of the Investment Advisory Agreement between the Trust and ALPS Advisors, Inc. (the “Adviser” or “AAI”) with respect to the Alerian MLP ETF (“AMLP”) and Alerian Energy Infrastructure ETF (“ENFR”) (each a “Fund” and collectively “the Funds”). In evaluating the renewal of the Investment Advisory Agreement with respect to each of the Funds, the Board, including the Independent Trustees considered various factors, including (i) the nature, extent and quality of the services provided by AAI with respect to the applicable Fund under the Investment Advisory Agreement; (ii) the advisory fees and other expenses paid by the Fund compared to those of similar funds managed by other investment advisers; (iii) the costs of the services provided to the Fund by AAI and the profits realized by AAI and its affiliates from its relationship to the Fund; (iv) the extent to which economies of scale have been or would be realized if and as the assets of the Fund grow and whether fees reflect the economies of scale for the benefit of shareholders; and (v) any additional benefits and other considerations.
With respect to the nature, extent and quality of the services provided by AAI under the Investment Advisory Agreement, the Board considered and reviewed information concerning the services provided under the Investment Advisory Agreement, the investment parameters of the index of each Fund, financial information regarding AAI and its parent company, information describing AAI’s current organization and the background and experience of the persons responsible for the day-to-day management of the Funds.
The Board reviewed information on the performance of each Fund and its applicable benchmark for the 1-, 3-, and 5-year periods, as applicable. The Board also evaluated the correlation and tracking error between each underlying index and its corresponding Fund’s performance. Based on this review, the Board, including the Independent Trustees found that the nature and extent of services provided to each Fund under the Investment Advisory Agreement was appropriate and that the quality of such services was satisfactory.
The Board noted that the advisory fees for each Fund were unitary fees pursuant to which AAI assumes all expenses of the Funds (including the cost of transfer agency, custody, fund administration, legal, audit and other services) other than the payments under the Advisory Agreement, brokerage expenses, taxes, interest, litigation expenses and other extraordinary expenses.
Based on the information available to them, including the Fund-specific summaries set forth below, the Board, including the Independent Trustees concluded that the advisory fee rate for each of the Funds was reasonable under the circumstances and in light of the quality of the services provided.
The Board, including the Independent Trustees considered other benefits available to AAI because of its relationship with the Funds and concluded that the advisory fees were reasonable taking into account any such benefits.
The Board, including the Independent Trustees, also considered with respect to each Fund the information provided by AAI about the costs and profitability of AAI with respect to each of the Funds, including the asset levels and other factors that influence the profitability and financial viability of the Funds. The Board, including the Independent Trustees reviewed and noted the relatively small sizes of the Funds (other than AMLP) and the analysis AAI had conducted to support AAI’s assertion that it was not realizing any economies of scale with respect to such Funds. The Independent Trustees determined that AAI should continue to keep the Board informed on an ongoing basis of any significant developments (e.g., material increases in asset levels) so as to facilitate the Independent Trustees’ evaluation of whether further economies of scale have been achieved.
The Board, including the Independent Trustees, also considered other potential benefits available to AAI because of its relationship with the Funds, known as fall-out benefits.
With respect to each Fund, the Board, including the Independent Trustees, noted the following:
The gross management fee rate for AMLP is higher than the median of its FUSE expense group. AMLP’s net expense ratio is higher than the median of its FUSE expense group. The Board took into account, among other things, supplemental information provided by the Adviser showing AMLP’s total expenses were in line with the total expenses of peer groups deemed by the Adviser to be more comparable, including peer groups comprised of (i) the master limited partnership (“MLP”) asset class as a whole; and (ii) exchange-traded products focused solely on MLP investments. The Board also considered the brand recognition of AMLP’s index provider and the fees charged by the index provider for licensing its indexes, the additional costs and expenses incurred by AAI in managing and administering AMLP and that AMLP’s investment advisory fee schedule included breakpoints, which have been periodically adjusted for the benefit of AMLP shareholders.
With respect to AAI profitability from AMLP, the Independent Trustees noted that AMLP’s asset levels have not recovered to their historic high and that it has breakpoints in its management fee. The Board considered, among other things, the brand recognition of AMLP’s index provider as well as the trading volumes of the Fund and the narrow trading spreads. The Board considered the breakpoint schedule previously adopted and whether breakpoints would benefit shareholders and appropriately reflect economies of scale achieved by AAI with respect to AMLP should AMLP’s assets increase, noting that AMLP’s assets were still below historical highs, but increasing. Upon discussion, the Board, including the Independent Trustees, determined that the advisory fee rate for AMLP, inclusive of the existing breakpoint schedule, reflects an appropriate sharing of economies of scale.
Alerian Exchange Traded Funds
Statement Regarding Basis
for Approval of Investment Advisory Contract | November 30, 2024 (Unaudited) |
The gross management fee rate for ENFR is lower than the median of its FUSE expense group. ENFR’s net expense ratio is lower than the median of its FUSE expense group.
The Board, including the Independent Trustees, reviewed and noted the relatively small size of ENFR and the analysis AAI had conducted to support AAI’s assertion that it was not realizing any economies of scale with respect to ENFR.
In voting to renew the Investment Advisory Agreement with AAI, the Board, including the Independent Trustees, concluded that the terms of the Investment Advisory Agreement are reasonable and fair in light of the services to be performed, the fees paid by certain other funds, expenses to be incurred and such other matters as the members of the Board, including the Independent Trustees, considered relevant in the exercise of their reasonable business judgment. The Independent Trustees did not identify any single factor or group of factors as all important or controlling and considered all factors together.

Table of Contents
| Financial Statements and Financial Highlights for Open-End Management Investment Companies | |
| Schedule of Investments | 1 |
| Statement of Assets and Liabilities | 3 |
| Statement of Operations | 4 |
| Statements of Changes in Net Assets | 5 |
| Financial Highlights | 6 |
| Notes to Financial Statements and Financial Highlights | 7 |
| Report of Independent Registered Public Accounting Firm | 13 |
| Additional Information | 14 |
| Changes in and Disagreements with Accountants for Open-End Management Investment Companies | 15 |
| Proxy Disclosures for Open-End Management Investment Companies | 16 |
| Remuneration Paid to Directors, Officers, and Others of Open-End Management Investment Companies | 17 |
| Statement Regarding Basis for Approval of Investment Advisory Contract | 18 |
alpsfunds.com
ALPS Active Equity Opportunity ETF
| Schedule of Investments | November 30, 2024 |
| Security Description | | Shares | | | Value | |
| COMMON STOCKS (96.65%) | | | | | | | | |
| Communication Services (8.48%) | | | | | | | | |
| Alphabet, Inc., Class A | | | 4,031 | | | $ | 681,038 | |
| AT&T, Inc. | | | 16,557 | | | | 383,460 | |
| Meta Platforms, Inc., Class A | | | 1,157 | | | | 664,488 | |
| Walt Disney Co. | | | 2,715 | | | | 318,931 | |
| Total Communication Services | | | | | | | 2,047,917 | |
| | | | | | | | | |
| Consumer Discretionary (9.05%) | | | | | | | | |
| Amazon.com, Inc.(a) | | | 4,791 | | | | 996,001 | |
| Lowe's Cos., Inc. | | | 1,275 | | | | 347,348 | |
| Marriott International, Inc., Class A | | | 905 | | | | 261,626 | |
| McDonald's Corp. | | | 1,064 | | | | 314,955 | |
| O'Reilly Automotive, Inc.(a) | | | 213 | | | | 264,806 | |
| Total Consumer Discretionary | | | | | | | 2,184,736 | |
| | | | | | | | | |
| Consumer Staples (7.22%) | | | | | | | | |
| Campbell Soup Co. | | | 5,189 | | | | 239,732 | |
| Costco Wholesale Corp. | | | 517 | | | | 502,462 | |
| Procter & Gamble Co. | | | 1,280 | | | | 229,453 | |
| Target Corp. | | | 1,044 | | | | 138,131 | |
| Walmart, Inc. | | | 6,838 | | | | 632,515 | |
| Total Consumer Staples | | | | | | | 1,742,293 | |
| | | | | | | | | |
| Energy (4.93%) | | | | | | | | |
| Baker Hughes Co. | | | 7,912 | | | | 347,732 | |
| ConocoPhillips | | | 4,013 | | | | 434,769 | |
| Enbridge, Inc.(b) | | | 9,414 | | | | 408,379 | |
| Total Energy | | | | | | | 1,190,880 | |
| | | | | | | | | |
| Financials (13.75%) | | | | | | | | |
| American Express Co. | | | 1,788 | | | | 544,768 | |
| Blackstone, Inc. | | | 1,585 | | | | 302,878 | |
| Goldman Sachs Group, Inc. | | | 555 | | | | 337,756 | |
| Intercontinental Exchange, Inc. | | | 2,725 | | | | 438,616 | |
| JPMorgan Chase & Co. | | | 3,035 | | | | 757,900 | |
| M&T Bank Corp. | | | 590 | | | | 129,794 | |
| Mastercard, Inc., Class A | | | 907 | | | | 483,377 | |
| Wells Fargo & Co. | | | 4,254 | | | | 324,027 | |
| Total Financials | | | | | | | 3,319,116 | |
| | | | | | | | | |
| Health Care (8.55%) | | | | | | | | |
| Boston Scientific Corp.(a) | | | 3,865 | | | | 350,401 | |
| HCA Healthcare, Inc. | | | 758 | | | | 248,033 | |
| IQVIA Holdings, Inc.(a) | | | 1,169 | | | | 234,782 | |
| Thermo Fisher Scientific, Inc. | | | 664 | | | | 351,674 | |
| UnitedHealth Group, Inc. | | | 996 | | | | 607,759 | |
| Vertex Pharmaceuticals, Inc.(a) | | | 578 | | | | 270,579 | |
| Total Health Care | | | | | | | 2,063,228 | |
| | | | | | | | | |
| Industrials (11.07%) | | | | | | | | |
| Caterpillar, Inc. | | | 1,262 | | | | 512,511 | |
| Deere & Co. | | | 670 | | | | 312,153 | |
| Lockheed Martin Corp. | | | 712 | | | | 376,940 | |
| Old Dominion Freight Line, Inc. | | | 1,640 | | | | 369,229 | |
| Schneider Electric SE, ADR | | | 6,640 | | | | 342,425 | |
| Security Description | | Shares | | | Value | |
| Industrials (continued) | | | | | | | | |
| Trane Technologies PLC | | | 960 | | | $ | 399,571 | |
| Waste Management, Inc. | | | 1,568 | | | | 357,849 | |
| Total Industrials | | | | | | | 2,670,678 | |
| | | | | | | | | |
| Information Technology (26.78%) | | | | | | | | |
| Adobe, Inc.(a) | | | 308 | | | | 158,906 | |
| Amphenol Corp., Class A | | | 3,345 | | | | 243,014 | |
| Apple, Inc. | | | 6,152 | | | | 1,460,054 | |
| Dell Technologies, Inc. | | | 1,855 | | | | 236,679 | |
| International Business Machines Corp. | | | 1,575 | | | | 358,171 | |
| Lam Research Corp. | | | 2,915 | | | | 215,360 | |
| Microsoft Corp. | | | 1,987 | | | | 841,415 | |
| Motorola Solutions, Inc. | | | 685 | | | | 342,295 | |
| NVIDIA Corp. | | | 8,030 | | | | 1,110,148 | |
| Salesforce.com, Inc. | | | 888 | | | | 293,031 | |
| Synopsys, Inc.(a) | | | 690 | | | | 385,358 | |
| Taiwan Semiconductor Manufacturing Co., Ltd., ADR | | | 3,160 | | | | 583,526 | |
| TE Connectivity PLC | | | 1,565 | | | | 236,503 | |
| Total Information Technology | | | | | | | 6,464,460 | |
| | | | | | | | | |
| Materials (1.81%) | | | | | | | | |
| Freeport-McMoRan, Inc. | | | 3,399 | | | | 150,236 | |
| Linde PLC | | | 620 | | | | 285,814 | |
| Total Materials | | | | | | | 436,050 | |
| | | | | | | | | |
| Real Estate (2.58%) | | | | | | | | |
| Equity LifeStyle Properties, Inc. | | | 3,656 | | | | 260,783 | |
| Prologis, Inc. | | | 1,554 | | | | 181,476 | |
| Welltower, Inc. | | | 1,300 | | | | 179,634 | |
| Total Real Estate | | | | | | | 621,893 | |
| | | | | | | | | |
| Utilities (2.43%) | | | | | | | | |
| Duke Energy Corp. | | | 1,960 | | | | 229,418 | |
| PPL Corp. | | | 10,200 | | | | 356,286 | |
| Total Utilities | | | | | | | 585,704 | |
| | | | | | | | | |
| TOTAL COMMON STOCKS | | | | | | | | |
| (Cost $16,132,445) | | | | | | | 23,326,955 | |
ALPS Active Equity Opportunity ETF
| Schedule of Investments (Continued) | November 30, 2024 |
| | | 7 Day Yield | | | Shares | | | Value | |
| SHORT TERM INVESTMENTS (4.84%) | | | | | | | | | | | | |
| Money Market Fund (3.30%) | | | | | | | | | | | | |
| State Street Institutional Treasury Plus Money Market Fund (Premier Class) | | | | | | | | | | | | |
| (Cost $796,463) | | | 4.59 | % | | | 796,463 | | | $ | 796,463 | |
| | | | | | | | | | | | | |
| Investments Purchased with Collateral from Securities Loaned (1.54%) | | | | | | | | | | | | |
| State Street Navigator Securities Lending Government Money Market Portfolio, 4.63% | | | | | | | | | | | | |
| (Cost $372,768) | | | | | | | 372,768 | | | $ | 372,768 | |
| | | | | | | | | | | | | |
| TOTAL SHORT TERM INVESTMENTS | | | | | | | | | | | | |
| (Cost $1,169,231) | | | | | | | | | | | 1,169,231 | |
| | | | | | | | | | | | | |
| TOTAL INVESTMENTS (101.49%) | | | | | | | | | | | | |
| (Cost $17,301,676) | | | | | | | | | | $ | 24,496,186 | |
| LIABILITIES IN EXCESS OF OTHER ASSETS (-1.49%) | | | | | | | | | | | (360,425 | ) |
| NET ASSETS - 100.00% | | | | | | | | | | $ | 24,135,761 | |
| (a) | Non-income producing security. |
| (b) | Security, or a portion of the security position is currently on loan. The total market value of securities on loan is $367,515. |
See Notes to Financial Statements and Financial Highlights.
ALPS Active Equity Opportunity ETF
| Statement of Assets and Liabilities | November 30, 2024 |
| ASSETS: | | | | |
| Investments, at value(a) | | $ | 24,496,186 | |
| Dividends receivable | | | 21,656 | |
| Total Assets | | | 24,517,842 | |
| | | | | |
| LIABILITIES: | | | | |
| Payable to adviser | | | 9,313 | |
| Payable for collateral upon return of securities loaned | | | 372,768 | |
| Total Liabilities | | | 382,081 | |
| NET ASSETS | | $ | 24,135,761 | |
| | | | | |
| NET ASSETS CONSIST OF: | | | | |
| Paid-in capital | | $ | 38,958,055 | |
| Total distributable earnings/(accumulated losses) | | | (14,822,294 | ) |
| NET ASSETS | | $ | 24,135,761 | |
| | | | | |
| INVESTMENTS, AT COST | | $ | 17,301,676 | |
| | | | | |
| PRICING OF SHARES | | | | |
| Net Assets | | $ | 24,135,761 | |
| Shares of beneficial interest outstanding (Unlimited number of shares authorized, par value $0.01 per share) | | | 400,002 | |
| Net Asset Value, offering and redemption price per share | | $ | 60.34 | |
| (a) | Includes $367,515 of securities on loan. |
See Notes to Financial Statements and Financial Highlights.
ALPS Active Equity Opportunity ETF
| Statement of Operations | For the Year Ended November 30, 2024 |
| INVESTMENT INCOME: | | | | |
| Dividend income* | | $ | 351,319 | |
| Securities lending income | | | 1,850 | |
| Total investment income | | | 353,169 | |
| | | | | |
| EXPENSES: | | | | |
| Investment adviser fees | | | 110,846 | |
| Other expenses | | | 979 | |
| Net expenses | | | 111,825 | |
| NET INVESTMENT INCOME | | | 241,344 | |
| | | | | |
| REALIZED AND UNREALIZED GAIN/(LOSS): | | | | |
| Net realized gain on investments | | | 2,089,254 | |
| Net realized gain on foreign currency transactions | | | 164 | |
| Total Net realized gain | | | 2,089,418 | |
| Net change in unrealized appreciation on investments | | | 4,576,214 | |
| Net change in unrealized depreciation on translation of assets and liabilities denominated in foreign currencies | | | (25 | ) |
| Total Net change in unrealized appreciation | | | 4,576,189 | |
| NET REALIZED AND UNREALIZED GAIN ON INVESTMENTS | | | 6,665,607 | |
| NET INCREASE IN NET ASSETS RESULTING FROM OPERATIONS | | $ | 6,906,951 | |
| * | Net of foreign tax withholding of $10,935. |
See Notes to Financial Statements and Financial Highlights.
ALPS Active Equity Opportunity ETF
Statements of Changes in Net Assets
| | | For the | | | For the | |
| | | Year Ended | | | Year Ended | |
| | | November 30, 2024 | | | November 30, 2023 | |
| OPERATIONS: | | | | | | |
| Net investment income | | $ | 241,344 | | | $ | 358,005 | |
| Net realized gain | | | 2,089,418 | | | | 311,875 | |
| Net change in unrealized appreciation/(depreciation) | | | 4,576,189 | | | | 856,275 | |
| Net increase in net assets resulting from operations | | | 6,906,951 | | | | 1,526,155 | |
| | | | | | | | | |
| DISTRIBUTIONS TO SHAREHOLDERS: | | | | | | | | |
| From distributable earnings | | | (217,594 | ) | | | (350,422 | ) |
| Total distributions | | | (217,594 | ) | | | (350,422 | ) |
| | | | | | | | | |
| CAPITAL SHARE TRANSACTIONS: | | | | | | | | |
| Proceeds from sale of shares | | | – | | | | 1,129,999 | |
| Cost of shares redeemed | | | (6,333,452 | ) | | | (7,324,460 | ) |
| Net decrease from capital share transactions | | | (6,333,452 | ) | | | (6,194,461 | ) |
| Net increase/(decrease) in net assets | | | 355,905 | | | | (5,018,728 | ) |
| | | | | | | | | |
| NET ASSETS: | | | | | | | | |
| Beginning of year | | | 23,779,856 | | | | 28,798,584 | |
| End of year | | $ | 24,135,761 | | | $ | 23,779,856 | |
| | | | | | | | | |
| OTHER INFORMATION: | | | | | | | | |
| CAPITAL SHARE TRANSACTIONS: | | | | | | | | |
| Beginning shares | | | 525,002 | | | | 675,002 | |
| Shares sold | | | – | | | | 25,000 | |
| Shares redeemed | | | (125,000 | ) | | | (175,000 | ) |
| Shares outstanding, end of year | | | 400,002 | | | | 525,002 | |
See Notes to Financial Statements and Financial Highlights.
ALPS Active Equity Opportunity ETF
| Financial Highlights | For a Share Outstanding Throughout the Periods Presented |
| | | For the Year | | | For the Year | | | For the Year | | | For the Year | | | For the Year | |
| | | Ended | | | Ended | | | Ended | | | Ended | | | Ended | |
| | | November 30, | | | November 30, | | | November 30, | | | November 30, | | | November 30, | |
| | | 2024 | | | 2023 | | | 2022 | | | 2021 | | | 2020 | |
| NET ASSET VALUE, BEGINNING OF PERIOD | | $ | 45.29 | | | $ | 42.66 | | | $ | 45.99 | | | $ | 37.58 | | | $ | 34.70 | |
| | | | | | | | | | | | | | | | | | | | | |
| INCOME FROM OPERATIONS: | | | | | | | | | | | | | | | | | | | | |
| Net investment income(a) | | | 0.54 | | | | 0.66 | | | | 0.48 | | | | 0.42 | | | | 0.45 | |
| Net realized and unrealized gain/(loss) | | | 15.02 | | | | 2.62 | | | | (3.23 | ) | | | 8.43 | | | | 2.87 | (b) |
| Total from investment operations | | | 15.56 | | | | 3.28 | | | | (2.75 | ) | | | 8.85 | | | | 3.32 | |
| | | | | | | | | | | | | | | | | | | | | |
| DISTRIBUTIONS: | | | | | | | | | | | | | | | | | | | | |
| From net investment income | | | (0.51 | ) | | | (0.65 | ) | | | (0.57 | ) | | | (0.44 | ) | | | (0.44 | ) |
| From tax return of capital | | | – | | | | – | | | | (0.01 | ) | | | – | | | | – | |
| Total distributions | | | (0.51 | ) | | | (0.65 | ) | | | (0.58 | ) | | | (0.44 | ) | | | (0.44 | ) |
| | | | | | | | | | | | | | | | | | | | | |
| NET INCREASE/(DECREASE) IN NET ASSET VALUE | | | 15.05 | | | | 2.63 | | | | (3.33 | ) | | | 8.41 | | | | 2.88 | |
| NET ASSET VALUE, END OF PERIOD | | $ | 60.34 | | | $ | 45.29 | | | $ | 42.66 | | | $ | 45.99 | | | $ | 37.58 | |
| TOTAL RETURN(c) | | | 34.50 | % | | | 7.81 | % | | | (5.98 | )% | | | 23.65 | % | | | 9.75 | % |
| | | | | | | | | | | | | | | | | | | | | |
| RATIOS/SUPPLEMENTAL DATA: | | | | | | | | | | | | | | | | | | | | |
| Net assets, end of period (in 000s) | | $ | 24,136 | | | $ | 23,780 | | | $ | 28,799 | | | $ | 51,735 | | | $ | 71,400 | |
| | | | | | | | | | | | | | | | | | | | | |
| Ratio of expenses to average net assets | | | 0.48 | % | | | 0.50 | %(d) | | | 0.52 | % | | | 0.52 | % | | | 0.52 | % |
| Ratio of net investment income to average net assets | | | 1.01 | % | | | 1.55 | % | | | 1.10 | % | | | 0.97 | % | | | 1.34 | % |
| Portfolio turnover rate(e) | | | 33 | % | | | 129 | % | | | 113 | % | | | 5 | % | | | 99 | % |
| (a) | Based on average shares outstanding during the period. |
| (b) | Net realized and unrealized gain on investments per share does not correlate to the aggregate of the net realized and unrealized gain/(loss) in the Statements of Operations for the period(s) presented, primarily due to the timing of the sales and repurchases of the Fund's shares in relation to the fluctuating market values for the Fund's portfolio. |
| (c) | Total return is calculated assuming an initial investment made at the net asset value at the beginning of the year and redemption at the net asset value on the last day of the year and assuming all distributions are reinvested at the reinvestment prices. Total return calculated for a period of less than one year is not annualized. |
| (d) | Effective June 1, 2023, the investment adviser fee changed from 0.52% to 0.48%. |
| (e) | Portfolio turnover for periods less than one year are not annualized and does not include securities received or delivered from processing creations or redemptions in-kind. |
See Notes to Financial Statements and Financial Highlights.
ALPS Active Equity Opportunity ETF
| Notes to Financial Statements and Financial Highlights | November 30, 2024 |
1. ORGANIZATION
ALPS ETF Trust (the “Trust”), a Delaware statutory trust, is an open-end management investment company registered under the Investment Company Act of 1940, as amended (the “1940 Act”). As of November 30, 2024, the Trust consisted of twenty-three separate portfolios. Each portfolio represents a separate series of the Trust. This report pertains solely to the ALPS Active Equity Opportunity ETF (formerly, Riverfront Dynamic US Flex-Cap ETF) (the “Fund”).
The investment objective of the Fund is to seek to provide capital appreciation. The Fund has elected to qualify as a diversified series of the Trust under the 1940 Act.
The Fund’s Shares (“Shares”) are listed on the NYSE Arca, Inc. (the “NYSE Arca”). The Fund issues and redeems Shares, at net asset value (“NAV”) in blocks of 25,000 Shares, each of which is called a “Creation Unit”. Creation Units are issued and redeemed principally in-kind for securities and/or cash. Except when aggregated in Creation Units, Shares are not redeemable securities of a Fund.
Pursuant to the Trust’s organizational documents, its Officers and Trustees are indemnified against certain liability arising out of the performance of their duties to the Trust. Additionally, in the normal course of business, the Trust enters into contracts with service providers that contain general indemnification clauses. The Trust’s maximum exposure under these arrangements is unknown, as this would involve future claims that may be made against the Trust that have not yet occurred.
2. SIGNIFICANT ACCOUNTING POLICIES
The following is a summary of significant accounting policies consistently followed by the Fund in the preparation of the financial statements. The accompanying financial statements were prepared in accordance with accounting principles generally accepted in the United States of America (“U.S. GAAP”). The preparation of financial statements in conformity with U.S. GAAP requires management to make certain estimates and assumptions that affect the reported amounts of assets and liabilities and disclosures of contingent assets and liabilities at the date of the financial statements and the reported amounts of revenue and expenses during the period. Actual results could differ from those estimates. The Fund is considered an investment company under U.S. GAAP and follows the accounting and reporting guidance applicable to investment companies in the Financial Accounting Standards Board (“FASB”) Accounting Standards Codification Topic 946.
A. Portfolio Valuation
The Fund’s NAV is determined daily, as of the close of regular trading on the New York Stock Exchange (the “NYSE”), normally 4:00 p.m. Eastern Time, on each day the NYSE is open for trading. The NAV is computed by dividing the value of all assets of the Fund (including accrued interest and dividends), less all liabilities (including accrued expenses and dividends declared but unpaid), by the total number of shares outstanding.
Portfolio securities listed on any exchange other than the NASDAQ Stock Market LLC (“NASDAQ”) are valued at the last sale price on the business day as of which such value is being determined. If there has been no sale on such day, the securities are valued at the mean of the most recent bid and ask prices on such day. Securities traded on the NASDAQ are valued at the NASDAQ Official Closing Price as determined by NASDAQ. Portfolio securities traded on more than one securities exchange are valued at the last sale price on the business day as of which such value is being determined at the close of the exchange representing the principal market for such securities. Portfolio securities traded in the over-the-counter market, but excluding securities traded on the NASDAQ, are valued at the last quoted sale price in such market.
The Fund’s investments are valued at market value or, in the absence of market value with respect to any portfolio securities, at fair value according to procedures adopted by the Trust’s Board of Trustees (the “Board”). Pursuant to Rule 2a-5 under the 1940 Act, the Board designated ALPS Advisors, Inc. (the "Adviser") as the valuation designee ("Valuation Designee") for the Fund to perform the fair value determinations relating to Fund investments. The Adviser may carry out its designated responsibilities as Valuation Designee through various teams and committees. When market quotations are not readily available or when events occur that make established valuation methods unreliable, securities of the Fund may be valued in good faith by the Valuation Designee. These securities generally include, but are not limited to, restricted securities (securities which may not be publicly sold without registration under the Securities Act of 1933) for which a pricing service is unable to provide a market price; securities whose trading has been formally suspended; a security whose market price is not available from a pre-established primary pricing source or the pricing source is not willing to provide a price; a security with respect to which an event has occurred that is most likely to materially affect the value of the security after the market has closed but before the calculation of a Fund’s NAV or make it difficult or impossible to obtain a reliable market quotation; or a security whose price, as provided by the pricing service, does not reflect the security’s “fair value” due to the security being de-listed from a national exchange or the security’s primary trading market is temporarily closed at a time when, under normal conditions, it would be open. As a general principle, the current “fair value” of a security would be the amount which the owner might reasonably expect to receive from the sale on the applicable exchange or principal market. A variety of factors may be considered in determining the fair value of such securities.
ALPS Active Equity Opportunity ETF
| Notes to Financial Statements and Financial Highlights | November 30, 2024 |
B. Fair Value Measurements
The Fund discloses the classification of its fair value measurements following a three-tier hierarchy based on the inputs used to measure fair value. Inputs refer broadly to the assumptions that market participants would use in pricing the asset or liability, including assumptions about risk. Inputs may be observable or unobservable. Observable inputs reflect the assumptions market participants would use in pricing the asset or liability that are developed based on market data obtained from sources independent of the reporting entity. Unobservable inputs reflect the reporting entity’s own assumptions about the assumptions market participants would use in pricing the asset or liability that are developed based on the best information available.
Valuation techniques used to value the Fund’s investments by major category are as follows:
Equity securities, including restricted securities, for which market quotations are readily available, are valued at the last reported sale price or official closing price as reported by a third party pricing vendor on the primary market or exchange on which they are traded and are categorized as Level 1 in the hierarchy. In the event there were no sales during the day or closing prices are not available, securities are valued at the mean of the most recent quoted bid and ask prices on such day and are generally categorized as Level 2 in the hierarchy. Investments in open-end mutual funds are valued at their closing NAV each business day and are categorized as Level 1 in the hierarchy.
Changes in valuation techniques may result in transfers in or out of an assigned level within the disclosure hierarchy.
Various inputs are used in determining the value of the Fund’s investments as of the end of the reporting period. When inputs used fall into different levels of the fair value hierarchy, the level in the hierarchy within which the fair value measurement falls is determined based on the lowest level input that is significant to the fair value measurement in its entirety. The designated input levels are not necessarily an indication of the risk or liquidity associated with these investments.
These inputs are categorized in the following hierarchy under applicable financial accounting standards:
| Level 1 | – | Unadjusted quoted prices in active markets for identical investments, unrestricted assets or liabilities that a Fund has the ability to access at the measurement date; |
| | | |
| Level 2 | – | Quoted prices which are not active, quoted prices for similar assets or liabilities in active markets or inputs other than quoted prices that are observable (either directly or indirectly) for substantially the full term of the asset or liability; and |
| | | |
| Level 3 | – | Significant unobservable prices or inputs (including the Fund’s own assumptions in determining the fair value of investments) where there is little or no market activity for the asset or liability at the measurement date. |
The following is a summary of the inputs used to value the Fund’s investments as of November 30, 2024:
ALPS Active Equity Opportunity ETF
| | | Level 1 - Quoted and | | | Level 2 - Other Significant | | | Level 3 - Significant | | | | |
| Investments in Securities at Value | | Unadjusted Prices | | | Observable Inputs | | | Unobservable Inputs | | | Total | |
| Common Stocks* | | $ | 23,326,955 | | | $ | – | | | $ | – | | | $ | 23,326,955 | |
| Short Term Investments | | | 1,169,231 | | | | – | | | | – | | | | 1,169,231 | |
| Total | | $ | 24,496,186 | | | $ | – | | | $ | – | | | $ | 24,496,186 | |
| * | For a detailed sector breakdown, see the accompanying Schedule of Investments. |
The Fund did not have any securities that used significant unobservable inputs (Level 3) in determining fair value and there were no transfers into or out of Level 3 during the year ended November 30, 2024.
C. Securities Transactions and Investment Income
Securities transactions are recorded as of the trade date. Realized gains and losses from securities transactions are recorded on the specific identification in accordance with GAAP. Dividend income and capital gains distributions, if any, are recorded on the ex-dividend date. Interest income, if any, is recorded on the accrual basis, including amortization of premiums and accretion of discounts.
ALPS Active Equity Opportunity ETF
| Notes to Financial Statements and Financial Highlights | November 30, 2024 |
D. Dividends and Distributions to Shareholders
Dividends from net investment income for the Fund, if any, are declared and paid quarterly or as the Board may determine from time to time. Distributions of net realized capital gains earned by the Fund, if any, are distributed at least annually.
E. Federal Tax and Tax Basis Information
The timing and character of income and capital gain distributions are determined in accordance with income tax regulations, which may differ from U.S. GAAP. Reclassifications are made to the Fund’s capital accounts for permanent tax differences to reflect income and gains available for distribution (or available capital loss carryforwards) under income tax regulations.
For the year ended November 30, 2024, the following reclassifications, which had no impact on results of operations or net assets, were recorded to reflect permanent tax differences resulting primarily from in-kind transactions and prior year tax return true-ups:
| Fund | | Paid-in Capital | | | Total Distributable Earnings/(Accumulated Losses) | |
| ALPS Active Equity Opportunity ETF | | $ | 1,582,897 | | | $ | (1,582,897 | ) |
The tax character of the distributions paid during the fiscal years ended November 30, 2024 and November 30, 2023 were as follows:
| Fund | | Ordinary Income | | | Long-Term Capital Gain | | | Return of Capital | |
| November 30, 2024 | | | | | | | | | | | | |
| ALPS Active Equity Opportunity ETF | | $ | 217,594 | | | $ | – | | | $ | – | |
| Fund | | Ordinary Income | | | Long-Term Capital Gain | | | Return of Capital | |
| November 30, 2023 | | | | | | | | | | | | |
| ALPS Active Equity Opportunity ETF | | $ | 350,422 | | | $ | – | | | $ | – | |
The character of distributions made during the year may differ from its ultimate characterization for federal income tax purposes.
Under current law, capital losses maintain their character as short-term or long-term and are carried forward to the next tax year without expiration.
As of November 30, 2024, the following amounts are available as carry forwards to the next tax year:
| Fund | | Short-Term | | | Long-Term | |
| ALPS Active Equity Opportunity ETF | | $ | 13,369,543 | | | $ | 8,659,220 | |
The Fund used capital loss carryovers during the year ended November 30, 2024, in the amount of $503,009.
As of November 30, 2024, the components of distributable earnings/(accumulated losses) on a tax basis for the Fund were as follows:
| | | ALPS Active Equity | |
| | | Opportunity ETF | |
| Accumulated net investment income | | $ | 25,752 | |
| Accumulated net realized loss on investments | | | (22,028,763 | ) |
| Net unrealized appreciation on investments | | | 7,180,717 | |
| Total | | | (14,822,294 | ) |
ALPS Active Equity Opportunity ETF
| Notes to Financial Statements and Financial Highlights | November 30, 2024 |
As of November 30, 2024, the cost of investments for federal income tax purposes and accumulated net unrealized appreciation/(depreciation) on investments were as follows:
| | | ALPS Active Equity | |
| | | Opportunity ETF | |
| Gross appreciation (excess of value over tax cost) | | $ | 7,233,767 | |
| Gross depreciation (excess of tax cost over value) | | | (53,035 | ) |
| Net appreciation/(depreciation) of foreign currency | | | (15 | ) |
| Net unrealized appreciation/(depreciation) | | | 7,180,717 | |
| Cost of investments for income tax purposes | | $ | 17,315,454 | |
The differences between book-basis and tax-basis are primarily due to the deferral of losses from wash sales.
F. Income Taxes
No provision for income taxes is included in the accompanying financial statements, as the Fund intends to distribute to shareholders all taxable investment income and realized gains and otherwise comply with Subchapter M of the Internal Revenue Code of 1986, as amended, applicable to regulated investment companies. The Fund evaluates tax positions taken (or expected to be taken) in the course of preparing the Fund’s tax returns to determine whether these positions meet a “more-likely-than-not” standard that, based on the technical merits, have a more than fifty percent likelihood of being sustained by a taxing authority upon examination. A tax position that meets the “more-likely-than-not” recognition threshold is measured to determine the amount of benefit to recognize in the financial statements.
As of and during the year ended November 30, 2024, the Fund did not have a liability for any unrecognized tax benefits. The Fund files U.S. federal, state, and local tax returns as required. The Fund’s tax returns are subject to examination by the relevant tax authorities until expiration of the applicable statute of limitations, which is generally three years after the filing of the tax return, but may extend to four years in certain jurisdictions. The Fund’s tax returns for open years have incorporated no uncertain tax positions that require a provision for income taxes.
G. Lending of Portfolio Securities
The Fund has entered into a securities lending agreement with State Street Bank & Trust Co. (“SSB”), the Fund’s lending agent. The Fund may lend its portfolio securities only to borrowers that are approved by SSB. The Fund will limit such lending to not more than 33 1/3% of the value of its total assets. The Fund’s securities held at SSB as custodian shall be available to be lent except those securities the Fund or ALPS Advisors, Inc. specifically identifies in writing as not being available for lending. The borrower pledges and maintains with the Fund collateral consisting of cash (U.S. Dollars only), securities issued or guaranteed by the U.S. government or its agencies or instrumentalities, and cash equivalents (including irrevocable bank letters of credit) issued by a person other than the borrower or an affiliate of the borrower. The initial collateral received by the Fund is required to have a value of no less than 102% of the market value of the loaned securities for U.S equity securities and a value of no less than 105% of the market value for non-U.S. equity securities. The collateral is maintained thereafter, at a market value equal to not less than 102% of the current value of the U.S. equity securities on loan and not less than 105% of the current value of the non-U.S. equity securities on loan. The market value of the loaned securities is determined at the close of each business day and any additional required collateral is delivered to the Fund on the next business day. During the term of the loan, the Fund is entitled to all distributions made on or in respect of the loaned securities. Loans of securities are terminable at any time and the borrower, after notice, is required to return borrowed securities within the customary time period for settlement of securities transactions.
Any cash collateral received is reinvested in a money market fund managed by SSB as disclosed in the Fund’s Schedule of Investments and is reflected in the Statement of Assets and Liabilities as a payable for collateral upon return of securities loaned. Non-cash collateral, in the form of securities issued or guaranteed by the U.S. government or its agencies or instrumentalities, is not disclosed in the Fund’s Statement of Assets and Liabilities or the contractual maturity table below as it is held by the lending agent on behalf of the Fund, and the Fund does not have the ability to re-hypothecate these securities. Income earned by the Fund from securities lending activity is disclosed in the Statement of Operations.
The following is a summary of the Fund’s securities lending agreement and related cash and non-cash collateral received as of November 30, 2024:
| | | Market Value of | | | Cash Collateral | | | Non-Cash Collateral | | | Total Collateral | |
| Fund | | Securities on Loan | | | Received | | | Received | | | Received | |
| ALPS Active Equity Opportunity ETF | | $ | 367,515 | | | $ | 372,768 | | | $ | – | | | $ | 372,768 | |
The risks of securities lending include the risk that the borrower may not provide additional collateral when required or may not return the securities when due. To mitigate these risks, the Fund benefits from a borrower default indemnity provided by SSB. SSB’s indemnity allows for full replacement of securities lent wherein SSB will purchase the unreturned loaned securities on the open market by applying the proceeds of the collateral, or to the extent such proceeds are insufficient or the collateral is unavailable, SSB will purchase the unreturned loan securities at SSB’s expense. However, the Fund could suffer a loss if the value of the investments purchased with cash collateral falls below the value of the cash collateral received.
ALPS Active Equity Opportunity ETF
| Notes to Financial Statements and Financial Highlights | November 30, 2024 |
The following table reflects a breakdown of transactions accounted for as secured borrowings, the gross obligation by the type of collateral pledged or securities loaned, and the remaining contractual maturity of those transactions as of November 30, 2024:
| ALPS Active Equity Opportunity | | Remaining Contractual Maturity of the Agreements | |
| | | Overnight & | | | | | | | | | Greater than | | | | |
| Securities Lending Transactions | | Continuous | | | Up to 30 Days | | | 30-90 Days | | | 90 Days | | | Total | |
| Common Stocks | | $ | 372,768 | | | $ | – | | | $ | – | | | $ | – | | | $ | 372,768 | |
| Total Borrowings | | | | | | | | | | | | | | | | | | | 372,768 | |
| Gross amount of recognized liabilities for securities lending (collateral received) | | | | | | | $ | 372,768 | |
3. INVESTMENT ADVISORY FEE AND OTHER AFFILIATED TRANSACTIONS
ALPS Advisors, Inc. serves as the Fund’s investment adviser pursuant to an Investment Advisory Agreement with the Trust on behalf of the Fund (the “Advisory Agreement”). Pursuant to the Advisory Agreement, the Fund pays the Adviser an annual management fee for the services and facilities it provides, payable on a monthly basis at the annual rate of 0.48% of the Fund’s average daily net assets.
Out of the unitary management fee, the Adviser pays substantially all expenses of the Fund, including the cost of transfer agency, custody, fund administration, legal, audit, trustees and other services, except for interest expenses, distribution fees or expenses, brokerage expenses, taxes and extraordinary expenses not incurred in the ordinary course of the Fund's business. The Adviser’s unitary management fee is designed to pay substantially all of the Fund's expenses and to compensate the Adviser for providing services for the Fund.
ALPS Fund Services, Inc., an affiliate of the Adviser, is the administrator for the Fund.
Each Trustee receives (1) a quarterly retainer of $25,000, (2) a per meeting fee of $15,000, (3) $2,500 for any special meeting held outside of a regularly scheduled board meeting, and (4) reimbursement for all reasonable out-of-pocket expenses relating to attendance at meetings. In addition, the Chairman of the Board receives a quarterly retainer of $5,000, the Chairman of the Audit Committee receives a quarterly retainer of $3,000, and the Chairman of the Nominating & Governance Committee receives a quarterly retainer of $2,000, each in connection with their respective roles.
4. PURCHASES AND SALES OF SECURITIES
For the year ended November 30, 2024, the cost of purchases and proceeds from sales of investment securities, excluding in-kind transactions and short-term investments, were as follows:
| Fund | | Purchases | | | Sales | |
| ALPS Active Equity Opportunity ETF | | $ | 7,324,201 | | | $ | 7,310,735 | |
For the year ended November 30, 2024, the cost of in-kind purchases and proceeds from in-kind sales were as follows:
| Fund | | Purchases | | | Sales | |
| ALPS Active Equity Opportunity ETF | | $ | – | | | $ | 6,175,447 | |
For the year ended November 30, 2024, the Fund had in-kind net realized gain of $1,580,907.
Gains on in-kind transactions are not considered taxable for federal income tax purposes and losses on in-kind transactions are also not deductible for tax purposes.
5. CAPITAL SHARE TRANSACTIONS
Shares are created and redeemed by the Fund only in Creation Unit size aggregations of 25,000 Shares. Only broker-dealers or large institutional investors with creation and redemption agreements called Authorized Participants (“AP”) are permitted to purchase or redeem Creation Units from the Fund. Such transactions are generally permitted on an in-kind basis, with a balancing cash component to equate the transaction to the NAV per unit of the Fund on the transaction date. Cash may be substituted equivalent to the value of certain securities generally when they are not available in sufficient quantity for delivery, not eligible for trading by the AP or as a result of other market circumstances.
ALPS Active Equity Opportunity ETF
| Notes to Financial Statements and Financial Highlights | November 30, 2024 |
6. RELATED PARTY TRANSACTIONS
The Fund did not engage in cross trades between other funds in the Trust during the year ended November 30, 2024 pursuant to Rule 17a-7 under the 1940 Act. Cross trading is the buying or selling of portfolio securities between funds to which the Adviser serves as the investment adviser. The Board previously adopted procedures that apply to transactions between the Funds of the Trust pursuant to Rule 17a-7.
7. MARKET RISK
The Fund is subject to investment and operational risks associated with financial, economic and other global market developments and disruptions, including those arising from war, terrorism, market manipulation, government interventions, defaults and shutdowns, political changes or diplomatic developments, public health emergencies (such as the spread of infectious diseases, pandemics and epidemics) and natural/environmental disasters, which can negatively impact the securities markets and cause the Fund to lose value. Securities in the Fund’s portfolio may underperform in comparison to securities in general financial markets, a particular financial market or other asset classes due to a number of factors, including inflation (or expectations for inflation), deflation (or expectations for deflation), interest rates, global demand for particular products or resources, market instability, debt crises and downgrades, embargoes, tariffs, sanctions and other trade barriers, regulatory events, other governmental trade or market control programs and related geopolitical events. In addition, the value of the Fund’s investments may be negatively affected by the occurrence of global events such as war, terrorism, environmental disasters, natural disasters or events, country instability, and infectious disease epidemics or pandemics.
8. SUBSEQUENT EVENTS
Subsequent events, if any, after the date of the Statement of Assets and Liabilities have been evaluated through the date the financial statements were issued. Management has determined that there were no subsequent events to report through the issuance of these financial statements.
ALPS Active Equity Opportunity ETF
Report of Independent Registered Public Accounting Firm
To the Shareholders of ALPS Active Equity Opportunity ETF
and Board of Trustees of ALPS ETF Trust
Opinion on the Financial Statements
We have audited the accompanying statement of assets and liabilities, including the schedule of investments, of ALPS Active Equity Opportunity ETF (the “Fund”), a series of ALPS ETF Trust, as of November 30, 2024, the related statement of operations for the year then ended, the statements of changes in net assets and financial highlights for each of the two years in the period then ended, and the related notes (collectively referred to as the “financial statements”). In our opinion, the financial statements present fairly, in all material respects, the financial position of the Fund as of November 30, 2024, the results of its operations for the year then ended, and the changes in net assets and financial highlights for each of the two years in the period then ended, in conformity with accounting principles generally accepted in the United States of America.
The Fund’s financial highlights for the years ended November 30, 2022, and prior, were audited by other auditors whose report dated January 27, 2023, expressed an unqualified opinion on those financial highlights.
Basis for Opinion
These financial statements are the responsibility of the Fund’s management. Our responsibility is to express an opinion on the Fund’s financial statements based on our audits. We are a public accounting firm registered with the Public Company Accounting Oversight Board (United States) (“PCAOB”) and are required to be independent with respect to the Fund in accordance with the U.S. federal securities laws and the applicable rules and regulations of the Securities and Exchange Commission and the PCAOB.
We conducted our audits in accordance with the standards of the PCAOB. Those standards require that we plan and perform the audit to obtain reasonable assurance about whether the financial statements are free of material misstatement whether due to error or fraud.
Our audits included performing procedures to assess the risks of material misstatement of the financial statements, whether due to error or fraud, and performing procedures that respond to those risks. Such procedures included examining, on a test basis, evidence regarding the amounts and disclosures in the financial statements. Our procedures included confirmation of securities owned as of November 30, 2024, by correspondence with the custodian. Our audits also included evaluating the accounting principles used and significant estimates made by management, as well as evaluating the overall presentation of the financial statements. We believe that our audits provide a reasonable basis for our opinion.
We have served as the auditor of one or more investment companies advised by ALPS Advisors, Inc. since 2013.

COHEN & COMPANY, LTD.
Philadelphia, Pennsylvania
January 29, 2025
ALPS Active Equity Opportunity ETF
| Additional Information | November 30, 2024 (Unaudited) |
TAX INFORMATION
The ALPS Active Equity Opportunity ETF designates the following as a percentage of taxable ordinary income distributions, or up to the maximum amount allowable, for the calendar year ended December 31, 2023:
| | Qualified Dividend Income | Dividend Received Deduction |
| ALPS Active Equity Opportunity ETF | 100.00% | 98.16% |
In early 2024, if applicable, shareholders of record received this information for the distributions paid to them by the Fund during the calendar year 2023 via Form 1099. The Fund will notify shareholders in early 2025 of amounts paid to them by the Fund, if any, during the calendar year 2024.
ALPS Active Equity Opportunity ETF
Changes in and Disagreements with Accountants
for Open-End Management Investment Companies | November 30, 2024 (Unaudited) |
On March 14, 2023, BBD LLP (“BBD”) ceased to serve as the independent registered public accounting firm of the Fund. The Board approved the replacement of BBD as a result of Cohen & Company, Ltd.’s (“Cohen”) acquisition of BBD’s investment management group.
The report of BBD on the financial statements of the Fund as of and for the fiscal year or period ended November 30, 2022 did not contain an adverse opinion or a disclaimer of opinion, and was not qualified or modified as to uncertainties, audit scope or accounting principles. During the fiscal year or period ended November 30, 2022, and during the subsequent interim period through March 14, 2023: (i) there were no disagreements between the registrant and BBD on any matter of accounting principles or practices, financial statement disclosure, or auditing scope or procedure, which disagreements, if not resolved to the satisfaction of BBD, would have caused it to make reference to the subject matter of the disagreements in its report on the financial statements of the Fund for such years or interim period; and (ii) there were no “reportable events,” as defined in Item 304(a)(1)(v) of Regulation S-K under the Securities Exchange Act of 1934, as amended.
On March 7, 2023, upon the recommendation of the Fund’s Audit Committee, the Board approved the appointment of Cohen, effective upon the resignation of BBD, as the Fund’s independent registered public accounting firm for the fiscal year ending November 30, 2023.
During the fiscal year or period ended November 30, 2022, and during the subsequent interim period through March 14, 2023, neither the registrant, nor anyone acting on its behalf, consulted with Cohen on behalf of the Fund regarding the application of accounting principles to a specified transaction (either completed or proposed), the type of audit opinion that might be rendered on the Fund’s financial statements, or any matter that was either: (i) the subject of a "disagreement," as defined in Item 304(a)(1)(iv) of Regulation S-K and the instructions thereto; or (ii) "reportable events," as defined in Item 304(a)(1)(v) of Regulation S-K.
ALPS Active Equity Opportunity ETF
Proxy Disclosures for Open-End
Management Investment Companies | November 30, 2024 (Unaudited) |
A Special Meeting of Shareholders of the Funds, each a series of the Trust, was held on July 19, 2024. At the meeting, the following matters were voted on by the Shareholders. The results of the Special Meeting of Shareholders are noted below:
Proposal 1: To elect seven Trustees.
| | | Shares Voted Against/ | |
| | Shares Voted in Favor | Withheld or Abstentions | Proposal Approved |
| Mary K. Anstine | 223,143,090 | 2,894,793 | Yes |
| Edmund J. Burke | 223,362,578 | 2,672,643 | Yes |
| Jeremy W. Deems | 221,670,341 | 4,361,535 | Yes |
| Rick A. Pederson | 213,137,140 | 12,259,226 | Yes |
| Joseph F. Keenan | 223,547,500 | 2,483,867 | Yes |
| Susan K. Wold | 223,460,006 | 2,571,857 | Yes |
| Laton Spahr | 223,439,610 | 2,593,995 | Yes |
ALPS Active Equity Opportunity ETF
Remuneration Paid to Directors, Officers, and Others
for Open-End Management Investment Companies | November 30, 2024 (Unaudited) |
The following chart provides certain information about the Trustee fees paid by the Trust for the year ended November 30, 2024:
| | | | | | | | | | |
| | | Aggregate Regular Compensation From the Trust | | | Aggregate Special Compensation From the Trust | | | Total Compensation From the Trust | |
| Mary K. Anstine, Trustee | | $ | 162,500 | | | $ | – | | | $ | 162,500 | |
| Edmund J. Burke, Trustee | | | 166,500 | | | | – | | | | 166,500 | |
| Jeremy W. Deems, Trustee | | | 174,500 | | | | – | | | | 174,500 | |
| Rick A. Pederson, Trustee | | | 186,500 | | | | – | | | | 186,500 | |
| Joseph F. Keenan, Trustee | | | 40,000 | | | | – | | | | 40,000 | |
| Susan K. Wold, Trustee | | | 40,000 | | | | – | | | | 40,000 | |
| Laton Spahr, President and Trustee* | | | – | | | | – | | | | – | |
| Total | | $ | 770,000 | | | $ | – | | | $ | 770,000 | |
| * | Mr. Spahr, the President of the Trust, is deemed an “interested person” by virtue of his position as an officer of the Trust and of ALPS Advisors, Inc. |
Officers who are employed by the Adviser receive no compensation or expense reimbursement from the Trust.
ALPS Active Equity Opportunity ETF
Statement Regarding Basis for Approval
of Investment Advisory Contract | November 30, 2024 (Unaudited) |
At its meetings held on June 3, 2024 and June 18, 2024, the Board of Trustees of the Trust (the “Board” or the “Trustees”), where each Trustee was not an "interested person" of the Trust within the meaning of the Investment Company Act of 1940, as amended (the “Independent Trustees”), evaluated a proposal to approve the continuance of the Investment Advisory Agreement between the Trust and ALPS Advisors, Inc. (the “Adviser” or “AAI”) with respect to the ALPS Active Equity Opportunity ETF ("RFFC" or the "Fund"). In evaluating the renewal of the Investment Advisory Agreement with respect to the Fund, the Board, including the Independent Trustees considered various factors, including (i) the nature, extent and quality of the services provided by AAI with respect to the Fund under the Investment Advisory Agreement; (ii) the advisory fees and other expenses paid by the Fund compared to those of similar funds managed by other investment advisers; (iii) the costs of the services provided to the Fund by AAI and the profits realized by AAI and its affiliates from its relationship to the Fund; (iv) the extent to which economies of scale have been or would be realized if and as the assets of the Fund grow and whether fees reflect the economies of scale for the benefit of shareholders; and (v) any additional benefits and other considerations.
With respect to the nature, extent and quality of the services provided by AAI under the Investment Advisory Agreement, the Board considered and reviewed information concerning the services provided under the Investment Advisory Agreement, financial information regarding AAI and its parent company, information describing AAI’s current organization and the background and experience of the persons responsible for the day-to-day management of the Fund.
The Board reviewed information on the performance of the Fund and its applicable benchmark for the 1-, 3-, and 5-year periods, as applicable, and against the appropriate FUSE performance universe. Based on this review, the Board, including the Independent Trustees found that the nature and extent of services provided to the Fund under the Investment Advisory Agreement was appropriate and that the quality of such services was satisfactory.
The Board noted that the advisory fees for the Fund were unitary fees pursuant to which AAI assumes all expenses of the Fund (including the cost of transfer agency, custody, fund administration, legal, audit and other services) other than the payments under the Advisory Agreement, brokerage expenses, taxes, interest, litigation expenses and other extraordinary expenses.
Based on the information available to them, including the Fund-specific summary set forth below, the Board, including the Independent Trustees concluded that the advisory fee rate for the Fund was reasonable under the circumstances and in light of the quality of the services provided.
The Board, including the Independent Trustees considered other benefits available to AAI because of its relationship with the Fund and concluded that the advisory fees were reasonable taking into account any such benefits.
The Board, including the Independent Trustees, also considered with respect to the Fund the information provided by AAI about the costs and profitability of AAI with respect to the Fund, including the asset levels and other factors that influence the profitability and financial viability of the Fund. The Board, including the Independent Trustees reviewed and noted the relatively small size of the Fund and the analysis AAI had conducted to support AAI’s assertion that it was not realizing any economies of scale with respect to the Fund. The Independent Trustees determined that AAI should continue to keep the Board informed on an ongoing basis of any significant developments (e.g., material increases in asset levels) so as to facilitate the Independent Trustees’ evaluation of whether further economies of scale have been achieved.
The Board, including the Independent Trustees, also considered other potential benefits available to AAI because of its relationship with the Fund, known as fall-out benefits.
With respect to the Fund, the Board, including the Independent Trustees, noted the following:
The gross management fee rate for RFFC is higher than the median of its FUSE expense group. RFFC’s net expense ratio is lower than the median of its FUSE expense group.
The Board, including the Independent Trustees, reviewed and noted the relatively small size of RFFC and the analysis AAI had conducted to support AAI’s assertion that it was not realizing any economies of scale with respect to RFFC.
In voting to renew the Investment Advisory Agreement with AAI, the Board, including the Independent Trustees, concluded that the terms of the Investment Advisory Agreement are reasonable and fair in light of the services to be performed, the fees paid by certain other funds, expenses to be incurred and such other matters as the members of the Board, including the Independent Trustees, considered relevant in the exercise of their reasonable business judgment. The Independent Trustees did not identify any single factor or group of factors as all important or controlling and considered all factors together.


Table of Contents
| Financial Statements and Financial Highlights for Open-End Management Investment Companies | |
| Schedule of Investments | 1 |
| Statement of Assets and Liabilities | 2 |
| Statement of Operations | 3 |
| Statements of Changes in Net Assets | 4 |
| Financial Highlights | 5 |
| Notes to Financial Statements and Financial Highlights | 6 |
| Report of Independent Registered Public Accounting Firm | 12 |
| Additional Information | 13 |
| Changes in and Disagreements with Accountants for Open-End Management Investment Companies | 14 |
| Proxy Disclosures for Open-End Management Investment Companies | 15 |
| Remuneration Paid to Directors, Officers, and Others of Open-End Management Investment Companies | 16 |
| Statement Regarding Basis for Approval of Investment Advisory Contract | 17 |
alpsfunds.com
ALPS Active REIT ETF
| Schedule of Investments | November 30, 2024 |
| Security Description | | Shares | | | Value | |
| COMMON STOCKS (98.08%) | | | | | | | | |
| Data Center REITs (13.06%) | | | | | | | | |
| Digital Realty Trust, Inc. | | | 7,539 | | | $ | 1,475,307 | |
| Equinix, Inc. | | | 4,005 | | | | 3,930,826 | |
| Total Data Center REITs | | | | | | | 5,406,133 | |
| | | | | | | | | |
| Diversified REITs (2.65%) | | | | | | | | |
| Essential Properties Realty Trust, Inc. | | | 32,174 | | | | 1,097,133 | |
| | | | | | | | | |
| Health Care REITs (11.62%) | | | | | | | | |
| Healthpeak Properties, Inc. | | | 74,454 | | | | 1,637,243 | |
| Sabra Health Care REIT, Inc. | | | 60,200 | | | | 1,127,546 | |
| Welltower, Inc. | | | 14,786 | | | | 2,043,130 | |
| Total Health Care REITs | | | | | | | 4,807,919 | |
| | | | | | | | | |
| Hotel & Resort REITs (3.06%) | | | | | | | | |
| Host Hotels & Resorts, Inc. | | | 68,810 | | | | 1,267,480 | |
| | | | | | | | | |
| Industrial REITs (12.82%) | | | | | | | | |
| Americold Realty Trust, Inc. | | | 30,830 | | | | 735,604 | |
| First Industrial Realty Trust, Inc. | | | 30,223 | | | | 1,615,419 | |
| Prologis, Inc. | | | 25,298 | | | | 2,954,301 | |
| Total Industrial REITs | | | | | | | 5,305,324 | |
| | | | | | | | |
| Multi-Family Residential REITs (9.55%) | | | | | | | | |
| AvalonBay Communities, Inc. | | | 5,296 | | | | 1,246,414 | |
| Equity Residential | | | 18,687 | | | | 1,432,545 | |
| UDR, Inc. | | | 27,752 | | | | 1,272,707 | |
| Total Multi-Family Residential REITs | | | | | | | 3,951,666 | |
| | | | | | | | |
| Office REITs (6.21%) | | | | | | | | |
| Cousins Properties, Inc. | | | 39,373 | | | | 1,249,699 | |
| JBG SMITH Properties | | | 38,759 | | | | 662,391 | |
| Kilroy Realty Corp. | | | 15,841 | | | | 657,877 | |
| Total Office REITs | | | | | | | 2,569,967 | |
| | | | | | | | |
| Other Specialized REITs (6.85%) | | | | | | | | |
| Iron Mountain, Inc. | | | 7,025 | | | | 868,782 | |
| VICI Properties, Inc. | | | 60,237 | | | | 1,964,329 | |
| Total Other Specialized REITs | | | | | | | 2,833,111 | |
| | | | | | | | |
| Retail REITs (16.36%) | | | | | | | | |
| Agree Realty Corp. | | | 7,794 | | | | 598,579 | |
| Curbline Properties Corp. | | | 32,832 | | | | 796,504 | |
| InvenTrust Properties Corp. | | | 35,499 | | | | 1,099,404 | |
| Macerich Co. | | | 54,520 | | | | 1,156,369 | |
| Realty Income Corp. | | | 25,658 | | | | 1,485,342 | |
| Security Description | | Shares | | | Value | |
| Retail REITs (continued) | | | | | | | | |
| Simon Property Group, Inc. | | | 8,876 | | | $ | 1,629,634 | |
| Total Retail REITs | | | | | | | 6,765,832 | |
| | | | | | | | |
| Self-Storage REITs (8.68%) | | | | | | | | |
| Extra Space Storage, Inc. | | | 9,259 | | | | 1,582,919 | |
| Public Storage | | | 5,761 | | | | 2,005,116 | |
| Total Self-Storage REITs | | | | | | | 3,588,035 | |
| | | | | | | | |
| Single-Family Residential REITs (6.20%) | | | | | | | | |
| Equity LifeStyle Properties, Inc. | | | 14,055 | | | | 1,002,543 | |
| Invitation Homes, Inc. | | | 45,659 | | | | 1,563,821 | |
| Total Single-Family Residential REITs | | | | | | | 2,566,364 | |
| | | | | | | | |
| Telecom Tower REITs (1.02%) | | | | | | | | |
| American Tower Corp. | | | 2,017 | | | | 421,553 | |
| | | | | | | | | |
| TOTAL COMMON STOCKS | | | | | | | | |
| (Cost $35,706,945) | | | | | | | 40,580,517 | |
| | | 7 Day Yield | | | Shares | | | Value | |
| SHORT TERM INVESTMENTS (1.90%) | | | | | | | | | | | | |
| State Street Institutional Treasury Plus Money Market Fund (Premier Class) | | | 4.59 | % | | | 786,288 | | | $ | 786,288 | |
| | | | | | | | | | | | | |
| TOTAL SHORT TERM INVESTMENTS | | | | | | | | | | | | |
| (Cost $786,288) | | | | | | | | | | | 786,288 | |
| | | | | | | | | | | | | |
| TOTAL INVESTMENTS (99.98%) | | | | | | | | | | | | |
| (Cost $36,493,233) | | | | | | | | | | $ | 41,366,805 | |
| OTHER ASSETS IN EXCESS OF LIABILITIES (0.02%) | | | | | | | | | | | 9,638 | |
| NET ASSETS - 100.00% | | | | | | | | | | $ | 41,376,443 | |
See Notes to Financial Statements and Financial Highlights.
ALPS Active REIT ETF
| Statement of Assets and Liabilities | November 30, 2024 |
| ASSETS: | | | |
| Investments, at value | | $ | 41,366,805 | |
| Dividends receivable | | | 31,514 | |
| Total Assets | | | 41,398,319 | |
| | | | | |
| LIABILITIES: | | | | |
| Payable to adviser | | | 21,876 | |
| Total Liabilities | | | 21,876 | |
| NET ASSETS | | $ | 41,376,443 | |
| | | | | |
| NET ASSETS CONSIST OF: | | | | |
| Paid-in capital | | $ | 37,625,418 | |
| Total distributable earnings/(accumulated losses) | | | 3,751,025 | |
| NET ASSETS | | $ | 41,376,443 | |
| | | | | |
| INVESTMENTS, AT COST | | $ | 36,493,233 | |
| | | | | |
| PRICING OF SHARES | | | | |
| Net Assets | | $ | 41,376,443 | |
| Shares of beneficial interest outstanding (Unlimited number of shares authorized, par value $0.01 per share) | | | 1,400,002 | |
| Net Asset Value, offering and redemption price per share | | $ | 29.55 | |
See Notes to Financial Statements and Financial Highlights.
ALPS Active REIT ETF
| Statement of Operations | For the Year Ended November 30, 2024 |
| INVESTMENT INCOME: | | | | |
| Dividend Income | | $ | 953,396 | |
| Securities lending income | | | 22 | |
| Total investment income | | | 953,418 | |
| | | | | |
| EXPENSES: | | | | |
| Investment adviser fees | | | 189,355 | |
| Other expenses | | | 1,088 | |
| Total expenses | | | 190,443 | |
| NET INVESTMENT INCOME | | | 762,975 | |
| | | | | |
| REALIZED AND UNREALIZED GAIN/(LOSS): | | | | |
| Net realized gain on investments(a) | | | 765,969 | |
| Net change in unrealized appreciation on investments | | | 5,270,770 | |
| NET REALIZED AND UNREALIZED GAIN ON INVESTMENTS | | | 6,036,739 | |
| NET INCREASE IN NET ASSETS RESULTING FROM OPERATIONS | | $ | 6,799,714 | |
| (a) | Includes realized gain or loss as a result of in-kind transactions (See Note 4 in Notes to Financial Statements and Financial Highlights). |
See Notes to Financial Statements and Financial Highlights.
ALPS Active REIT ETF
Statements of Changes in Net Assets
| | | For the
Year Ended
November 30,
2024 | | | For the
Year Ended
November 30,
2023 | |
| OPERATIONS: | | | | | | | | |
| Net investment income | | $ | 762,975 | | | $ | 543,715 | |
| Net realized gain/(loss) | | | 765,969 | | | | (839,274 | ) |
| Net change in unrealized appreciation | | | 5,270,770 | | | | 9,646 | |
| Net increase/(decrease) in net assets resulting from operations | | | 6,799,714 | | | | (285,913 | ) |
| | | | | | | | | |
| DISTRIBUTIONS TO SHAREHOLDERS: | | | | | | | | |
| From distributable earnings | | | (771,459 | ) | | | (519,658 | ) |
| Dividends to shareholders from tax return of capital | | | (103,014 | ) | | | (65,789 | ) |
| Total distributions | | | (874,473 | ) | | | (585,447 | ) |
| | | | | | | | | |
| CAPITAL SHARE TRANSACTIONS: | | | | | | | | |
| Proceeds from sale of shares | | | 17,722,714 | | | | 1,702,242 | |
| Cost of shares redeemed | | | (286,293 | ) | | | (856,387 | ) |
| Net increase from capital share transactions | | | 17,436,421 | | | | 845,855 | |
| Net increase/(decrease) in net assets | | | 23,361,662 | | | | (25,505 | ) |
| | | | | | | | | |
| NET ASSETS: | | | | | | | | |
| Beginning of year | | | 18,014,781 | | | | 18,040,286 | |
| End of year | | $ | 41,376,443 | | | $ | 18,014,781 | |
| | | | | | | | | |
| OTHER INFORMATION: | | | | | | | | |
| CAPITAL SHARE TRANSACTIONS: | | | | | | | | |
| Beginning shares | | | 750,002 | | | | 715,002 | |
| Shares sold | | | 660,000 | | | | 70,000 | |
| Shares redeemed | | | (10,000 | ) | | | (35,000 | ) |
| Shares outstanding, end of year | | | 1,400,002 | | | | 750,002 | |
See Notes to Financial Statements and Financial Highlights.
ALPS Active REIT ETF
| Financial Highlights | For a Share Outstanding Throughout the Periods Presented |
| | | For the Year
Ended
November 30,
2024 | | | For the Year
Ended
November 30,
2023 | | | For the Year
Ended
November 30,
2022 | | | For the Period
February 25,
2021
(Commencement
of Operations) to
November 30,
2021 | |
| NET ASSET VALUE, BEGINNING OF PERIOD | | $ | 24.02 | | | $ | 25.23 | | | $ | 29.56 | | | $ | 24.62 | |
| | | | | | | | | | | | | | | | | |
| INCOME FROM OPERATIONS: | | | | | | | | | | | | | | | | |
| Net investment income(a) | | | 0.73 | | | | 0.74 | | | | 0.54 | | | | 0.37 | |
| Net realized and unrealized gain/(loss) | | | 5.70 | | | | (1.16 | ) | | | (3.39 | ) | | | 5.01 | |
| Total from investment operations | | | 6.43 | | | | (0.42 | ) | | | (2.85 | ) | | | 5.38 | |
| | | | | | | | | | | | | | | | | |
| DISTRIBUTIONS: | | | | | | | | | | | | | | | | |
| From net investment income | | | (0.80 | ) | | | (0.70 | ) | | | (0.53 | ) | | | (0.38 | ) |
| From net realized gains | | | – | | | | – | | | | (0.83 | ) | | | (0.06 | ) |
| From tax return of capital | | | (0.10 | ) | | | (0.09 | ) | | | (0.12 | ) | | | – | |
| Total distributions | | | (0.90 | ) | | | (0.79 | ) | | | (1.48 | ) | | | (0.44 | ) |
| | | | | | | | | | | | | | | | | |
| NET INCREASE/(DECREASE) IN NET ASSET VALUE | | | 5.53 | | | | (1.21 | ) | | | (4.33 | ) | | | 4.94 | |
| NET ASSET VALUE, END OF PERIOD | | $ | 29.55 | | | $ | 24.02 | | | $ | 25.23 | | | $ | 29.56 | |
| TOTAL RETURN(b) | | | 27.28 | % | | | (1.54 | )% | | | (10.17 | )% | | | 22.01 | % |
| | | | | | | | | | | | | | | | | |
| RATIOS/SUPPLEMENTAL DATA: | | | | | | | | | | | | | | | | |
| Net assets, end of period (in 000s) | | $ | 41,376 | | | $ | 18,015 | | | $ | 18,040 | | | $ | 24,238 | |
| | | | | | | | | | | | | | | | | |
| RATIOS TO AVERAGE NET ASSETS | | | | | | | | | | | | | | | | |
| Ratio of expenses to average net assets | | | 0.68 | % | | | 0.68 | % | | | 0.68 | % | | | 0.68 | %(c) |
| Ratio of net investment income to average net assets | | | 2.74 | % | | | 3.04 | % | | | 1.96 | % | | | 1.69 | %(c) |
| Portfolio turnover rate(d) | | | 79 | % | | | 68 | % | | | 120 | % | | | 92 | % |
| (a) | Based on average shares outstanding during the period. |
| (b) | Total return is calculated assuming an initial investment made at the net asset value at the beginning of the year and redemption at the net asset value on the last day of the year and assuming all distributions are reinvested at the reinvestment prices. Total return calculated for a period of less than one year is not annualized. |
| (d) | Portfolio turnover for periods less than one year are not annualized and does not include securities received or delivered from processing creations or redemptions in-kind. |
See Notes to Financial Statements and Financial Highlights.
ALPS Active REIT ETF
| Notes to Financial Statements and Financial Highlights | November 30, 2024 |
1. ORGANIZATION
ALPS ETF Trust (the “Trust”), a Delaware statutory trust, is an open-end management investment company registered under the Investment Company Act of 1940, as amended (the “1940 Act”). As of November 30, 2024, the Trust consisted of twenty-three separate portfolios. Each portfolio represents a separate series of the Trust. This report pertains solely to the ALPS Active REIT ETF (the “Fund”). The investment objective of the Fund is to seek total return through dividends and capital appreciation. The Fund is considered non-diversified and may invest a greater portion of assets in securities of individual issuers than a diversified fund. As a result, changes in the market value of a single investment could cause greater fluctuations in share price than would occur in a diversified fund.
The Fund’s Shares (“Shares”) are listed on the Nasdaq Stock Market LLC (“Nasdaq Exchange”). The Fund issues and redeems Shares, at net asset value (“NAV”) in blocks of 5,000 Shares, each of which is called a “Creation Unit”. Creation Units are issued and redeemed principally in-kind for securities. Except when aggregated in Creation Units, Shares are not redeemable securities of the Fund.
Pursuant to the Trust’s organizational documents, its Officers and Trustees are indemnified against certain liability arising out of the performance of their duties to the Trust. Additionally, in the normal course of business, the Trust enters into contracts with service providers that contain general indemnification clauses. The Trust’s maximum exposure under these arrangements is unknown, as this would involve future claims that may be made against the Trust that have not yet occurred.
2. SIGNIFICANT ACCOUNTING POLICIES
The following is a summary of significant accounting policies consistently followed by the Fund in the preparation of the financial statements. The accompanying financial statements were prepared in accordance with accounting principles generally accepted in the United States of America (“U.S. GAAP”). The preparation of financial statements in conformity with U.S. GAAP requires management to make certain estimates and assumptions that affect the reported amounts of assets and liabilities and disclosures of contingent assets and liabilities at the date of the financial statements and the reported amounts of revenue and expenses during the period. Actual results could differ from those estimates. The Fund is considered an investment company under U.S. GAAP and follows the accounting and reporting guidance applicable to investment companies in the Financial Accounting Standards Board (“FASB”) Accounting Standards Codification Topic 946.
A. Portfolio Valuation
The Fund’s NAV is determined daily, as of the close of regular trading on the New York Stock Exchange ("NYSE"), normally 4:00 p.m. Eastern Time, on each day the NYSE is open for trading. The NAV is computed by dividing the value of all assets of the Fund (including accrued interest and dividends), less all liabilities (including accrued expenses and dividends declared but unpaid), by the total number of shares outstanding.
Portfolio securities listed on any exchange other than the NASDAQ Stock Market LLC (“NASDAQ”) are valued at the last sale price on the business day as of which such value is being determined. If there has been no sale on such day, the securities are valued at the mean of the most recent bid and ask prices on such day. Securities traded on the NASDAQ are valued at the NASDAQ Official Closing Price as determined by NASDAQ. Portfolio securities traded on more than one securities exchange are valued at the last sale price on the business day as of which such value is being determined at the close of the exchange representing the principal market for such securities. Portfolio securities traded in the over-the-counter market, but excluding securities traded on the NASDAQ, are valued at the last quoted sale price in such market.
The Fund’s investments are valued at market value or, in the absence of market value with respect to any portfolio securities, at fair value according to procedures adopted by the Trust’s Board of Trustees (the “Board”). Pursuant to Rule 2a-5 under the 1940 Act, the Board designated ALPS Advisors, Inc. (the "Adviser") as the valuation designee ("Valuation Designee") for the Fund to perform the fair value determinations relating to Fund investments. The Adviser may carry out its designated responsibilities as Valuation Designee through various teams and committees. When market quotations are not readily available or when events occur that make established valuation methods unreliable, securities of the Fund may be valued in good faith by the Valuation Designee. These securities generally include, but are not limited to, restricted securities (securities which may not be publicly sold without registration under the Securities Act of 1933) for which a pricing service is unable to provide a market price; securities whose trading has been formally suspended; a security whose market price is not available from a pre-established primary pricing source or the pricing source is not willing to provide a price; a security with respect to which an event has occurred that is most likely to materially affect the value of the security after the market has closed but before the calculation of the Fund’s NAV or make it difficult or impossible to obtain a reliable market quotation; or a security whose price, as provided by the pricing service, does not reflect the security’s “fair value” due to the security being de-listed from a national exchange or the security’s primary trading market is temporarily closed at a time when, under normal conditions, it would be open. As a general principle, the current “fair value” of a security would be the amount which the owner might reasonably expect to receive from the sale on the applicable exchange or principal market. A variety of factors may be considered in determining the fair value of such securities.
ALPS Active REIT ETF
| Notes to Financial Statements and Financial Highlights | November 30, 2024 |
B. Fair Value Measurements
The Fund discloses the classification of its fair value measurements following a three-tier hierarchy based on the inputs used to measure fair value. Inputs refer broadly to the assumptions that market participants would use in pricing the asset or liability, including assumptions about risk. Inputs may be observable or unobservable. Observable inputs reflect the assumptions market participants would use in pricing the asset or liability that are developed based on market data obtained from sources independent of the reporting entity. Unobservable inputs reflect the reporting entity’s own assumptions about the assumptions market participants would use in pricing the asset or liability that are developed based on the best information available.
Valuation techniques used to value the Fund’s investments by major category are as follows:
Equity securities, including restricted securities, for which market quotations are readily available, are valued at the last reported sale price or official closing price as reported by a third party pricing vendor on the primary market or exchange on which they are traded and are categorized as Level 1 in the hierarchy. In the event there were no sales during the day or closing prices are not available, securities are valued at the mean of the most recent quoted bid and ask prices on such day and are generally categorized as Level 2 in the hierarchy. Investments in open-end mutual funds are valued at their closing NAV each business day and are categorized as Level 1 in the hierarchy.
Changes in valuation techniques may result in transfers in or out of an assigned level within the disclosure hierarchy.
Various inputs are used in determining the value of the Fund’s investments as of the end of the reporting period. When inputs used fall into different levels of the fair value hierarchy, the level in the hierarchy within which the fair value measurement falls is determined based on the lowest level input that is significant to the fair value measurement in its entirety. The designated input levels are not necessarily an indication of the risk or liquidity associated with these investments.
These inputs are categorized in the following hierarchy under applicable financial accounting standards:
| Level 1 | – | Unadjusted quoted prices in active markets for identical investments, unrestricted assets or liabilities that a Fund has the ability to access at the measurement date; |
| Level 2 | – | Quoted prices which are not active, quoted prices for similar assets or liabilities in active markets or inputs other than quoted prices that are observable (either directly or indirectly) for substantially the full term of the asset or liability; and |
| Level 3 | – | Significant unobservable prices or inputs (including the Fund’s own assumptions in determining the fair value of investments) where there is little or no market activity for the asset or liability at the measurement date. |
The following is a summary of the inputs used to value the Fund’s investments as of November 30, 2024:
ALPS Active REIT ETF
Investments in Securities at Value | | Level 1 - Quoted and
Unadjusted Prices | | | Level 2 - Other Significant
Observable Inputs | | | Level 3 - Significant
Unobservable Inputs | | |
Total | |
| Common Stocks* | | $ | 40,580,517 | | | $ | – | | | $ | – | | | $ | 40,580,517 | |
| Short Term Investments | | | 786,288 | | | | – | | | | – | | | | 786,288 | |
| Total | | $ | 41,366,805 | | | $ | – | | | $ | – | | | $ | 41,366,805 | |
| * | For a detailed breakdown of sectors, see the accompanying Schedule of Investments. |
The Fund did not have any securities that used significant unobservable inputs (Level 3) in determining fair value and there were no transfers into or out of Level 3 during the year ended November 30, 2024.
C. Securities Transactions and Investment Income
Securities transactions are recorded as of the trade date. Realized gains and losses from securities transactions are recorded on the specific identification in accordance with GAAP. Dividend income and capital gains distributions, if any, are recorded on the ex-dividend date. Interest income, if any, is recorded on the accrual basis.
D. Dividends and Distributions to Shareholders
Dividends from net investment income of the Fund, if any, are declared and paid quarterly or as the Board may determine from time to time.
Distributions of net realized capital gains earned by the Fund, if any, are distributed at least annually.
ALPS Active REIT ETF
| Notes to Financial Statements and Financial Highlights | November 30, 2024 |
E. Federal Tax and Tax Basis Information
The timing and character of income and capital gain distributions are determined in accordance with income tax regulations, which may differ from U.S. GAAP. Reclassifications are made to the Fund’s capital accounts for permanent tax differences to reflect income and gains available for distribution (or available capital loss carryforwards) under income tax regulations.
For the year ended November 30, 2024, the following reclassifications, which had no impact on results of operations or net assets, were recorded to reflect permanent tax differences resulting primarily from in-kind transactions and prior year tax return true-up:
| Fund | | Paid-in Capital | | | Total Distributable Earnings/(Accumulated Losses) | |
| ALPS Active REIT ETF | | $ | 49,090 | | | $ | (49,090 | ) |
The tax character of the distributions paid during the fiscal year ended November 30, 2024 and November 30, 2023 was as follows:
| Fund | | Ordinary Income | | | Long-Term Capital Gain | | | Return of Capital | |
| November 30, 2024 | | | | | | | | | | | | |
| ALPS Active REIT ETF | | $ | 771,459 | | | $ | – | | | $ | 103,014 | |
| Fund | | Ordinary Income | | | Long-Term Capital Gain | | | Return of Capital | |
| November 30, 2023 | | | | | | | | | | | | |
| ALPS Active REIT ETF | | $ | 519,658 | | | $ | – | | | $ | 65,789 | |
Under current law, capital losses maintain their character as short-term or long-term and are carried forward to the next tax year without expiration.
As of November 30, 2024, the following amounts are available as carry forwards to the next tax year:
| Fund | | Short-Term | | | Long-Term | |
| ALPS Active REIT ETF | | $ | 184,480 | | | $ | 881,376 | |
The Fund used capital loss carryovers during the year ended November 30, 2024 in the amount of $704,143.
As of November 30, 2024, the components of distributable earnings/(accumulated losses) on a tax basis were as follows:
| | | | | | Accumulated Net | | | | | | | | | | |
| | | | | | Realized | | | | | | Net Unrealized | | | | |
| | | Accumulated Net | | | Gain/(Loss) on | | | Other Accumulated | | | Appreciation/(Depreciation) | | | | |
| Fund | | Investment Income | | | Investments | | | Losses | | | on Investments | | | Total | |
| ALPS Active REIT ETF | | $ | – | | | $ | (1,065,856 | ) | | $ | – | | | $ | 4,816,881 | | | $ | 3,751,025 | |
As of November 30, 2024, the cost of investments for federal income tax purposes and accumulated net unrealized appreciation/(depreciation) on investments were as follows:
| | | ALPS Active REIT ETF | |
| Gross appreciation (excess of value over tax cost) | | $ | 5,277,758 | |
| Gross depreciation (excess of tax cost over value) | | | (460,877 | ) |
| Net unrealized appreciation/(depreciation) | | $ | 4,816,881 | |
| Cost of investments for income tax purposes | | $ | 36,549,924 | |
The differences between book-basis and tax-basis are primarily due to the deferral of losses from wash sales.
F. Real Estate Investment Trusts (“REITs”)
As part of its investments in real estate related securities, the Fund will invest in REITs and is subject to certain risks associated with direct investment in REITs. REITs possess certain risks which differ from an investment in common stocks. REITs are financial vehicles that pool investors’ capital to acquire, develop and/or finance real estate and provide services to their tenants. REITs may concentrate their investments in specific geographic areas or in specific property types, e.g., regional malls, shopping centers, office buildings, apartment buildings and industrial warehouses. REITs may be affected by changes in the value of their underlying properties and by defaults by borrowers or tenants. REITs depend generally on their ability to generate cash flow to make distributions to shareowners or unitholders, and certain REITs have self-liquidation provisions by which mortgages held may be paid in full and distributions of capital returns may be made at any time.
ALPS Active REIT ETF
| Notes to Financial Statements and Financial Highlights | November 30, 2024 |
As REITs generally pay a higher rate of dividends than most other operating companies, to the extent application of the Fund's investment strategy results in the Fund investing in REIT shares, the percentage of the Fund's dividend income received from REIT shares will likely exceed the percentage of the Fund's portfolio that is comprised of REIT shares. Distributions received by the Fund from REITs may consist of dividends, capital gains and/or return of capital.
Dividend income from REITs is recognized on the ex-dividend date. The calendar year-end amounts of ordinary income, capital gains, and return of capital included in distributions received from the Fund's investments in REITs are reported to the Fund after the end of the calendar year; accordingly, the Fund estimates these amounts for accounting purposes until the characterization of REIT distributions is reported to the Fund after the end of the calendar year. Estimates are based on the most recent REIT distribution information available.
The performance of a REIT may be affected by its failure to qualify for tax-free pass-through of income under the Internal Revenue Code of 1986, as amended (the “Code”), or its failure to maintain exemption from registration under the 1940 Act. Due to the Fund's investments in REITs, the Fund may also make distributions in excess of the Fund's earnings and capital gains. Distributions, if any, in excess of the Fund's earnings and profits will first reduce the adjusted tax basis of a holder's shares and, after that basis has been reduced to zero, will constitute capital gains to the shareholder.
G. Income Taxes
No provision for income taxes is included in the accompanying financial statements, as the Fund intends to distribute to shareholders all taxable investment income and realized gains and otherwise comply with Subchapter M of the Code applicable to regulated investment companies. The Fund evaluates tax positions taken (or expected to be taken) in the course of preparing the Fund’s tax returns to determine whether these positions meet a “more-likely-than-not” standard that, based on the technical merits, have a more than fifty percent likelihood of being sustained by a taxing authority upon examination. A tax position that meets the “more-likely-than-not” recognition threshold is measured to determine the amount of benefit to recognize in the financial statements.
As of and during the year ended November 30, 2024, the Fund did not have a liability for any unrecognized tax benefits. The Fund files U.S. federal, state, and local tax returns as required. The Fund’s tax returns are subject to examination by the relevant tax authorities until expiration of the applicable statute of limitations, which is generally three years after the filing of the tax return, but may extend to four years in certain jurisdictions. Tax returns for open years have incorporated no uncertain tax positions that require a provision for income taxes.
H. Lending of Portfolio Securities
The Fund has entered into a securities lending agreement with State Street Bank & Trust Co. (“SSB”), the Fund’s lending agent. The Fund may lend its portfolio securities only to borrowers that are approved by SSB. The Fund will limit such lending to not more than 33 1/3% of the value of its total assets. The Fund’s securities held at SSB as custodian shall be available to be lent except those securities the Fund or ALPS Advisors, Inc. specifically identifies in writing as not being available for lending. The borrower pledges and maintains with the Fund collateral consisting of cash (U.S. Dollars only), securities issued or guaranteed by the U.S. government or its agencies or instrumentalities, and cash equivalents (including irrevocable bank letters of credit) issued by a person other than the borrower or an affiliate of the borrower. The initial collateral received by the Fund is required to have a value of no less than 102% of the market value of the loaned securities for U.S equity securities and a value of no less than 105% of the market value for non-U.S. equity securities. The collateral is maintained thereafter, at a market value equal to not less than 102% of the current value of the U.S. equity securities on loan and not less than 105% of the current value of the non-U.S. equity securities on loan. The market value of the loaned securities is determined at the close of each business day and any additional required collateral is delivered to the Fund on the next business day. During the term of the loan, the Fund is entitled to all distributions made on or in respect of the loaned securities. Loans of securities are terminable at any time and the borrower, after notice, is required to return borrowed securities within the customary time period for settlement of securities transactions.
Any cash collateral received is reinvested in a money market fund managed by SSB as disclosed in the Fund’s Schedule of Investments and is reflected in the Statement of Assets and Liabilities as a payable for collateral upon return of securities loaned. Non-cash collateral, in the form of securities issued or guaranteed by the U.S. government or its agencies or instrumentalities, is not disclosed in the Fund’s Statement of Assets and Liabilities as it is held by the lending agent on behalf of the Fund, and the Fund does not have the ability to re-hypothecate these securities. Income earned by the Fund from securities lending activity is disclosed in the Statement of Operations. During the year ended November 30, 2024, the Fund did not have any securities on loan.
ALPS Active REIT ETF
| Notes to Financial Statements and Financial Highlights | November 30, 2024 |
The risks of securities lending include the risk that the borrower may not provide additional collateral when required or may not return the securities when due. To mitigate these risks, the Fund benefits from a borrower default indemnity provided by SSB. SSB’s indemnity allows for full replacement of securities lent wherein SSB will purchase the unreturned loaned securities on the open market by applying the proceeds of the collateral, or to the extent such proceeds are insufficient or the collateral is unavailable, SSB will purchase the unreturned loan securities at SSB’s expense. However, the Fund could suffer a loss if the value of the investments purchased with cash collateral falls below the value of the cash collateral received.
As of November 30, 2024, the Fund did not have any securities on loan.
3. INVESTMENT ADVISORY FEE AND OTHER AFFILIATED TRANSACTIONS
ALPS Advisors, Inc. serves as the Fund’s investment adviser pursuant to an Investment Advisory Agreement with the Trust on behalf of the Fund (the “Advisory Agreement”). Pursuant to the Advisory Agreement, the Fund pays the Adviser an annual management fee for the services and facilities it provides, payable on a monthly basis at the annual rate of 0.68% of the Fund’s average daily net assets.
Out of the unitary management fee, the Adviser pays substantially all expenses of the Fund, including the cost of sub-advisory, transfer agency, custody, fund administration, legal, audit, trustees and other services, except for acquired fund fees and expenses, interest expenses, distribution fees or expenses, brokerage expenses, taxes and extraordinary expenses not incurred in the ordinary course of the Fund's business. The Adviser’s unitary management fee is designed to pay substantially all of the Fund’s expenses and to compensate the Adviser for providing services to the Fund.
GSI Capital Advisors LLC (the “Sub-Adviser”) serves as the Fund's sub-adviser pursuant to a sub-advisory agreement with the Trust (the ‘‘Sub-Advisory Agreement’’). Pursuant to the Sub-Advisory Agreement, the Adviser pays the Sub-Adviser a sub-advisory fee out of the Adviser’s advisory fee for the services it provides. The fee is payable on a monthly basis at the annual rate of 0.35% of the Fund's average daily net assets.
ALPS Fund Services, Inc., an affiliate of the Adviser, is the administrator of the Fund.
Each Trustee receives (1) a quarterly retainer of $25,000, (2) a per meeting fee of $15,000, (3) $2,500 for any special meeting held outside of a regularly scheduled board meeting, and (4) reimbursement for all reasonable out-of-pocket expenses relating to attendance at meetings. In addition, the Chairman of the Board receives a quarterly retainer of $5,000, the Chairman of the Audit Committee receives a quarterly retainer of $3,000, and the Chairman of the Nominating & Governance Committee receives a quarterly retainer of $2,000, each in connection with their respective roles.
4. PURCHASES AND SALES OF SECURITIES
For the year ended November 30, 2024, the cost of purchases and proceeds from sales of investment securities, excluding short-term investments and in-kind transactions, were as follows:
| Fund | | Purchases | | | Sales | |
| ALPS Active REIT ETF | | $ | 22,075,942 | | | $ | 22,177,559 | |
For the year ended November 30, 2024, the cost of in-kind purchases and proceeds from in-kind sales were as follows:
| Fund | | Purchases | | | Sales | |
| ALPS Active REIT ETF | | $ | 17,313,658 | | | $ | 278,450 | |
For the year ended November 30, 2024, the ALPS Active REIT ETF had in-kind net realized gain of $56,963.
Gains on in-kind transactions are not considered taxable for federal income tax purposes and losses on in-kind transactions are also not deductible for tax purposes.
5. CAPITAL SHARE TRANSACTIONS
Shares are created and redeemed by the Fund only in Creation Unit size aggregations of 5,000 Shares. Only broker-dealers or large institutional investors with creation and redemption agreements called Authorized Participants (“AP”) are permitted to purchase or redeem Creation Units from the Fund. Such transactions are generally permitted on an in-kind basis, with a balancing cash component to equate the transaction to the NAV per unit of the Fund on the transaction date. Cash may be substituted equivalent to the value of certain securities generally when they are not available in sufficient quantity for delivery, not eligible for trading by the AP or as a result of other market circumstances.
ALPS Active REIT ETF
| Notes to Financial Statements and Financial Highlights | November 30, 2024 |
6. MARKET RISK
The Fund is subject to investment and operational risks associated with financial, economic and other global market developments and disruptions, including those arising from war, terrorism, market manipulation, government interventions, defaults and shutdowns, political changes or diplomatic developments, public health emergencies (such as the spread of infectious diseases, pandemics and epidemics) and natural/environmental disasters, which can negatively impact the securities markets and cause the Fund to lose value. Securities in the Fund’s portfolio may underperform in comparison to securities in general financial markets, a particular financial market or other asset classes due to a number of factors, including inflation (or expectations for inflation), deflation (or expectations for deflation), interest rates, global demand for particular products or resources, market instability, debt crises and downgrades, embargoes, tariffs, sanctions and other trade barriers, regulatory events, other governmental trade or market control programs and related geopolitical events. In addition, the value of the Fund’s investments may be negatively affected by the occurrence of global events such as war, terrorism, environmental disasters, natural disasters or events, country instability, and infectious disease epidemics or pandemics.
7. SUBSEQUENT EVENTS
Subsequent events, if any, after the date of the Statement of Assets and Liabilities have been evaluated through the date the financial statements were issued. Management has determined that there were no subsequent events to report through the issuance of these financial statements.
ALPS Active REIT ETF
Report of Independent Registered Public Accounting Firm
To the Shareholders of ALPS Active REIT ETF
and Board of Trustees of ALPS ETF Trust
Opinion on the Financial Statements
We have audited the accompanying statement of assets and liabilities, including the schedule of investments, of ALPS Active REIT ETF (the “Fund”), a series of ALPS ETF Trust, as of November 30, 2024, the related statement of operations for the year then ended, the statements of changes in net assets and financial highlights for each of the two years in the period then ended, and the related notes (collectively referred to as the “financial statements”). In our opinion, the financial statements present fairly, in all material respects, the financial position of the Fund as of November 30, 2024, the results of its operations for the year then ended, and the changes in net assets and financial highlights for each of the two years in the period then ended, in conformity with accounting principles generally accepted in the United States of America.
The Fund’s financial highlights for the years ended November 30, 2022, and prior, were audited by other auditors whose report dated January 27, 2023, expressed an unqualified opinion on those financial highlights.
Basis for Opinion
These financial statements are the responsibility of the Fund’s management. Our responsibility is to express an opinion on the Fund’s financial statements based on our audits. We are a public accounting firm registered with the Public Company Accounting Oversight Board (United States) (“PCAOB”) and are required to be independent with respect to the Fund in accordance with the U.S. federal securities laws and the applicable rules and regulations of the Securities and Exchange Commission and the PCAOB.
We conducted our audits in accordance with the standards of the PCAOB. Those standards require that we plan and perform the audit to obtain reasonable assurance about whether the financial statements are free of material misstatement whether due to error or fraud.
Our audits included performing procedures to assess the risks of material misstatement of the financial statements, whether due to error or fraud, and performing procedures that respond to those risks. Such procedures included examining, on a test basis, evidence regarding the amounts and disclosures in the financial statements. Our procedures included confirmation of securities owned as of November 30, 2024, by correspondence with the custodian. Our audits also included evaluating the accounting principles used and significant estimates made by management, as well as evaluating the overall presentation of the financial statements. We believe that our audits provide a reasonable basis for our opinion.
We have served as the auditor of one or more investment companies advised by ALPS Advisors, Inc. since 2013.

COHEN & COMPANY, LTD.
Philadelphia, Pennsylvania
January 29, 2025
ALPS Active REIT ETF
| Additional Information | November 30, 2024 (Unaudited) |
TAX INFORMATION
The ALPS Active REIT ETF designates the following as a percentage of taxable ordinary income distributions, or up to the maximum amount allowable, for the calendar year ended December 31, 2023:
| | | | Qualified Dividend Income | | | Dividend Received Deduction | | | 199A | |
| ALPS Active REIT ETF | | | 2.82% | | | | 0.00% | | | | 89.34% | |
In early 2024, if applicable, shareholders of record received this information for the distributions paid to them by the Fund during the calendar year 2023 via Form 1099. The Fund will notify shareholders in early 2025 of amounts paid to them by the Fund, if any, during the calendar year 2024.
ALPS Active REIT ETF
Changes in and Disagreements with Accountants
for Open-End Management Investment Companies | November 30, 2024 (Unaudited) |
On March 14, 2023, BBD LLP (“BBD”) ceased to serve as the independent registered public accounting firm of the Fund. The Board approved the replacement of BBD as a result of Cohen & Company, Ltd.’s (“Cohen”) acquisition of BBD’s investment management group.
The report of BBD on the financial statements of the Fund as of and for the fiscal year or period ended November 30, 2022 did not contain an adverse opinion or a disclaimer of opinion, and was not qualified or modified as to uncertainties, audit scope or accounting principles. During the fiscal year or period ended November 30, 2022, and during the subsequent interim period through March 14, 2023: (i) there were no disagreements between the registrant and BBD on any matter of accounting principles or practices, financial statement disclosure, or auditing scope or procedure, which disagreements, if not resolved to the satisfaction of BBD, would have caused it to make reference to the subject matter of the disagreements in its report on the financial statements of the Fund for such years or interim period; and (ii) there were no “reportable events,” as defined in Item 304(a)(1)(v) of Regulation S-K under the Securities Exchange Act of 1934, as amended.
On March 7, 2023, upon the recommendation of the Fund’s Audit Committee, the Board approved the appointment of Cohen, effective upon the resignation of BBD, as the Fund’s independent registered public accounting firm for the fiscal year ending November 30, 2023.
During the fiscal year or period ended November 30, 2022, and during the subsequent interim period through March 14, 2023, neither the registrant, nor anyone acting on its behalf, consulted with Cohen on behalf of the Fund regarding the application of accounting principles to a specified transaction (either completed or proposed), the type of audit opinion that might be rendered on the Fund’s financial statements, or any matter that was either: (i) the subject of a "disagreement," as defined in Item 304(a)(1)(iv) of Regulation S-K and the instructions thereto; or (ii) "reportable events," as defined in Item 304(a)(1)(v) of Regulation S-K.
ALPS Active REIT ETF
Proxy Disclosures for Open-End
Management Investment Companies | November 30, 2024 (Unaudited) |
A Special Meeting of Shareholders of the Funds, each a series of the Trust, was held on July 19, 2024. At the meeting, the following matters were voted on by the Shareholders. The results of the Special Meeting of Shareholders are noted below:
Proposal 1: To elect seven Trustees.
| | Shares Voted in Favor | Shares Voted Against/Withheld or Abstentions | Proposal Approved |
| Mary K. Anstine | 223,143,090 | 2,894,793 | Yes |
| Edmund J. Burke | 223,362,578 | 2,672,643 | Yes |
| Jeremy W. Deems | 221,670,341 | 4,361,535 | Yes |
| Rick A. Pederson | 213,137,140 | 12,259,226 | Yes |
| Joseph F. Keenan | 223,547,500 | 2,483,867 | Yes |
| Susan K. Wold | 223,460,006 | 2,571,857 | Yes |
| Laton Spahr | 223,439,610 | 2,593,995 | Yes |
ALPS Active REIT ETF
Remuneration Paid to Directors, Officers, and Others
of Open-End Management Investment Companies | November 30, 2024 (Unaudited) |
The following chart provides certain information about the Trustee fees paid by the Trust for the year ended November 30, 2024:
| | | Aggregate Regular
Compensation From the Trust | | | Aggregate Special Compensation
From the Trust | | | Total Compensation From the Trust | |
| Mary K. Anstine, Trustee | | $ | 162,500 | | | $ | – | | | $ | 162,500 | |
| Edmund J. Burke, Trustee | | | 166,500 | | | | – | | | | 166,500 | |
| Jeremy W. Deems, Trustee | | | 174,500 | | | | – | | | | 174,500 | |
| Rick A. Pederson, Trustee | | | 186,500 | | | | – | | | | 186,500 | |
| Joseph F. Keenan, Trustee | | | 40,000 | | | | – | | | | 40,000 | |
| Susan K. Wold, Trustee | | | 40,000 | | | | – | | | | 40,000 | |
| Laton Spahr, President and Trustee* | | | – | | | | – | | | | – | |
| Total | | $ | 770,000 | | | $ | – | | | $ | 770,000 | |
| * | Mr. Spahr, the President of the Trust, is deemed an “interested person” by virtue of his position as an officer of the Trust and of ALPS Advisors, Inc. |
Officers who are employed by the Adviser receive no compensation or expense reimbursement from the Trust.
ALPS Active REIT ETF
Statement Regarding Basis for Approval
of Investment Advisory Contract | November 30, 2024 (Unaudited) |
At its meetings held on June 3, 2024 and June 18, 2024, the Board of Trustees of the Trust (the “Board” or the “Trustees”), where each Trustee was not an "interested person" of the Trust within the meaning of the Investment Company Act of 1940, as amended (the “Independent Trustees”), evaluated a proposal to approve the continuance of (i) the Investment Advisory Agreement between the Trust and ALPS Advisors, Inc. (the “Adviser” or “AAI”) with respect to the ALPS Active REIT ETF (“REIT” or the “Fund”) and (ii) the Investment Sub-Advisory Agreement between the Trust, AAI and GSI Capital Advisors LLC (the “Sub-Adviser” or “GSI”) with respect to the Fund (the “GSI Sub-Advisory Agreement”). In evaluating the renewal of the Investment Advisory Agreement with respect to the Fund, the Board, including the Independent Trustees considered various factors, including (i) the nature, extent and quality of the services provided by AAI with respect to the Fund under the Investment Advisory Agreement; (ii) the advisory fees and other expenses paid by the Fund compared to those of similar funds managed by other investment advisers; (iii) the costs of the services provided to the Fund by AAI and the profits realized by AAI and its affiliates from its relationship to the Fund; (iv) the extent to which economies of scale have been or would be realized if and as the assets of the Fund grow and whether fees reflect the economies of scale for the benefit of shareholders; and (v) any additional benefits and other considerations.
With respect to the nature, extent and quality of the services provided by AAI under the Investment Advisory Agreement, the Board considered and reviewed information concerning the services provided under the Investment Advisory Agreement, financial information regarding AAI and its parent company, information describing AAI’s current organization and the background and experience of the persons responsible for the day-to-day management of the Fund.
The Board reviewed information on the performance of the Fund and its applicable benchmark for the 1-, 3-, and 5-year periods, as applicable, and against the appropriate FUSE performance universe. Based on this review, the Board, including the Independent Trustees found that the nature and extent of services provided to the Fund under the Investment Advisory Agreement was appropriate and that the quality of such services was satisfactory.
The Board noted that the advisory fees for the Fund were unitary fees pursuant to which AAI assumes all expenses of the Fund (including the cost of transfer agency, custody, fund administration, legal, audit and other services) other than the payments under the Advisory Agreement, brokerage expenses, taxes, interest, litigation expenses and other extraordinary expenses.
Based on the information available to them, including the Fund-specific summary set forth below, the Board, including the Independent Trustees concluded that the advisory fee rate for the Fund was reasonable under the circumstances and in light of the quality of the services provided.
The Board, including the Independent Trustees considered other benefits available to AAI because of its relationship with the Fund and concluded that the advisory fees were reasonable taking into account any such benefits.
The Board, including the Independent Trustees, also considered with respect to the Fund the information provided by AAI about the costs and profitability of AAI with respect to the Fund, including the asset levels and other factors that influence the profitability and financial viability of the Fund. The Board, including the Independent Trustees reviewed and noted the relatively small size of the Fund and the analysis AAI had conducted to support AAI’s assertion that it was not realizing any economies of scale with respect to the Fund. The Independent Trustees determined that AAI should continue to keep the Board informed on an ongoing basis of any significant developments (e.g., material increases in asset levels) so as to facilitate the Independent Trustees’ evaluation of whether further economies of scale have been achieved.
The Board, including the Independent Trustees, also considered other potential benefits available to AAI because of its relationship with the Fund, known as fall-out benefits.
With respect to the Fund, the Board, including the Independent Trustees, noted the following:
The gross management fee rate for REIT is higher than the median of its FUSE expense group. REIT’s net expense ratio is higher than the median of its FUSE expense group.
The Board took into account, among other things, supplemental information provided by the Adviser showing REIT’s total expenses were in line with the total expenses of peer groups deemed by the Adviser to be more comparable, including peer groups comprised of a broad group of funds that invest in the real estate investment trust asset class, including comparable ETFs and mutual funds. The Board also considered the comparatively strong performance of the Fund relative to peers over the 1-year period and the Adviser’s assertion that, given the Fund’s current assets, any economies of scale were not yet a material benefit as REIT seeks further growth.
The Board, including the Independent Trustees, reviewed and noted the relatively small size of REIT and the analysis AAI had conducted to support AAI’s assertion that it was not realizing any economies of scale with respect to REIT.
ALPS Active REIT ETF
Statement Regarding Basis for Approval
of Investment Advisory Contract | November 30, 2024 (Unaudited) |
In voting to renew the Investment Advisory Agreement with AAI, the Board, including the Independent Trustees, concluded that the terms of the Investment Advisory Agreement are reasonable and fair in light of the services to be performed, the fees paid by certain other funds, expenses to be incurred and such other matters as the members of the Board, including the Independent Trustees, considered relevant in the exercise of their reasonable business judgment. The Independent Trustees did not identify any single factor or group of factors as all important or controlling and considered all factors together.
The Board, including the Independent Trustees, discussed the GSI Sub-Advisory Agreement.
In evaluating the GSI Sub-Advisory Agreement, the Board, including the Independent Trustees considered various factors, including (i) the nature, extent and quality of the services provided by GSI with respect to REIT under the GSI Sub-Advisory Agreement; (ii) the advisory fees and other expenses paid by REIT compared to those of similar funds managed by other investment advisers; (iii) the profitability to GSI of its sub-advisory relationship with REIT and the reasonableness of compensation to GSI; (iv) the extent to which economies of scale would be realized if, and as, REIT’s assets increase, and whether the fee level in the GSI Sub-Advisory Agreement reflects these economies of scale; and (v) any additional benefits and other considerations.
With respect to the nature, extent and quality of the services provided by GSI under the GSI Sub-Advisory Agreement, the Board, including the Independent Trustees considered and reviewed information concerning the services provided under the GSI Sub-Advisory Agreement, REIT’s performance, financial information regarding GSI, information describing GSI’s current organization and the background and experience of the persons responsible for the day-to-day management of REIT. Based upon their review, the Board, including the Independent Trustees concluded that GSI was qualified to oversee the portfolio management of REIT and that the services provided by GSI to REIT are satisfactory. The Board, including the Independent Trustees considered that the contractual sub-advisory fee to be paid to GSI with respect to REIT was 0.35% of REIT’s average daily net assets out of a total management fee of 0.68% of REIT’s average daily net assets.
In reviewing REIT’s profitability with respect to GSI, the Board, including the Independent Trustees, considered the costs and resources required to manage REIT.
The Board, including the Independent Trustees, also considered any other benefits that have been and may be realized by GSI from its relationship with REIT, known as fall-out benefits.
The Board, including the Independent Trustees, considered the extent to which economies of scale may be realized if REIT’s assets continue to grow in size and whether fee levels reflect a reasonable sharing of such economies of scale for the benefit of the Fund’s investors. The Board, including the Independent Trustees, noted that REIT launched in February 2021 and had not yet achieved economies of scale in terms of assets. The Independent Trustees determined that AAI should continue to keep the Board informed on an ongoing basis of any significant developments (e.g., material increases in asset levels) so as to facilitate the Independent Trustees’ evaluation of whether further economies of scale have been achieved with respect to REIT.
In voting to approve the GSI Sub-Advisory Agreement, the Board, including the Independent Trustees concluded that the terms of the GSI Sub- Advisory Agreement are reasonable and fair in light of the services performed, expenses incurred and such other matters as the Board, including the Independent Trustees considered relevant in the exercise of their reasonable business judgment. The Board, including the Independent Trustees did not identify any single factor or group of factors as all important or controlling and considered all factors together.

Table of Contents
| Financial Statements and Financial Highlights for Open-End Management Investment Companies | |
| Schedule of Investments | 1 |
| Statement of Assets and Liabilities | 2 |
| Statement of Operations | 3 |
| Statements of Changes in Net Assets | 4 |
| Financial Highlights | 5 |
| Notes to Financial Statements and Financial Highlights | 6 |
| Report of Independent Registered Public Accounting Firm | 12 |
| Additional Information | 13 |
| Changes in and Disagreements with Accountants for Open-End Management Investment Companies | 14 |
| Proxy Disclosures for Open-End Management Investment Companies | 15 |
| Remuneration Paid to Directors, Officers, and Others of Open-End Management Investment Companies | 16 |
| Statement Regarding Basis for Approval of Investment Advisory Contract | 17 |
alpsfunds.com
ALPS Equal Sector Weight ETF
| Schedule of Investments | November 30, 2024 |
| Security Description | | Shares | | | Value | |
| EXCHANGE TRADED FUNDS (100.00%)(a) | | | | | | | | |
| Communication Services (9.57%) | | | | | | | | |
| Communication Services Select Sector SPDR Fund | | | 411,143 | | | $ | 40,456,471 | |
| | | | | | | | | |
| Consumer Discretionary (9.77%) | | | | | | | | |
| Consumer Discretionary Select Sector SPDR Fund | | | 185,831 | | | | 41,310,231 | |
| | | | | | | | | |
| Consumer Staples (8.66%) | | | | | | | | |
| Consumer Staples Select Sector SPDR Fund | | | 440,104 | | | | 36,625,455 | |
| | | | | | | | | |
| Energy (9.30%) | | | | | | | | |
| Energy Select Sector SPDR Fund | | | 411,783 | | | | 39,337,630 | |
| | | | | | | | | |
| Financials (9.72%) | | | | | | | | |
| Financial Select Sector SPDR Fund | | | 800,490 | | | | 41,097,157 | |
| | | | | | | | | |
| Healthcare (8.20%) | | | | | | | | |
| Health Care Select Sector SPDR Fund | | | 235,383 | | | | 34,697,808 | |
| | | | | | | | | |
| Industrials (9.34%) | | | | | | | | |
| Industrial Select Sector SPDR Fund | | | 274,445 | | | | 39,517,336 | |
| | | | | | | | | |
| Materials (8.71%) | | | | | | | | |
| Materials Select Sector SPDR Fund | | | 388,543 | | | | 36,826,105 | |
| | | | | | | | | |
| Real Estate (8.70%) | | | | | | | | |
| Real Estate Select Sector SPDR Fund | | | 818,043 | | | | 36,811,935 | |
| | | | | | | | | |
| Technology (9.08%) | | | | | | | | |
| Technology Select Sector SPDR Fund | | | 164,244 | | | | 38,388,750 | |
| | | | | | | | | |
| Utilities (8.95%) | | | | | | | | |
| Utilities Select Sector SPDR Fund | | | 456,420 | | | | 37,850,911 | |
| | | | | | | | | |
| TOTAL EXCHANGE TRADED FUNDS | | | | | | | | |
| (Cost $331,254,712) | | | | | | | 422,919,789 | |
| | | 7 Day Yield | | | Shares | | | Value | |
| SHORT TERM INVESTMENTS (0.01%) | | | | | | | | | | | | |
| Money Market Fund (0.01%) | | | | | | | | | | | | |
| State Street Institutional Treasury Plus Money Market Fund (Premier Class) | | | 4.59 | % | | | 49,241 | | | $ | 49,241 | |
| TOTAL SHORT TERM INVESTMENTS | | | | | | | |
| (Cost $49,241) | | | | | | 49,241 | |
| | | | | | | | | | | | | |
| TOTAL INVESTMENTS (100.01%) | | | | | | |
| (Cost $331,303,953) | | | | | $ | 422,969,030 | |
| LIABILITIES IN EXCESS OF OTHER ASSETS (-0.01%) | | | | | (53,371 | ) |
| NET ASSETS - 100.00% | | | | $ | 422,915,659 | |
| (a) | The financial statements of the Underlying Sector ETFs, including the portfolio of investments, are included in The Select Sector SPDR Trust’s N-CSR filing dated September 30, 2024, available at www.sec.gov or can be found at www.ssga.com and should be read in conjunction with the Fund’s financial statements. |
Common Abbreviations:
SPDR® - Standard & Poor’s Depositary Receipts
See Notes to Financial Statements and Financial Highlights.
ALPS Equal Sector Weight ETF
| Statement of Assets and Liabilities | November 30, 2024 |
| ASSETS: | | | |
| Investments, at value | | $ | 422,969,030 | |
| Dividends receivable | | | 217 | |
| Total Assets | | | 422,969,247 | |
| | | | | |
| LIABILITIES: | | | | |
| Payable to adviser | | | 53,588 | |
| Total Liabilities | | | 53,588 | |
| NET ASSETS | | $ | 422,915,659 | |
| | | | | |
| NET ASSETS CONSIST OF: | | | | |
| Paid-in capital | | $ | 337,749,311 | |
| Total distributable earnings/(accumulated losses) | | | 85,166,348 | |
| NET ASSETS | | $ | 422,915,659 | |
| | | | | |
| INVESTMENTS, AT COST | | $ | 331,303,953 | |
| | | | | |
| PRICING OF SHARES | | | | |
| Net Assets | | $ | 422,915,659 | |
| Shares of beneficial interest outstanding (Unlimited number of shares authorized, par value $0.01 per share) | | | 3,175,000 | |
| Net Asset Value, offering and redemption price per share | | $ | 133.20 | |
See Notes to Financial Statements and Financial Highlights.
ALPS Equal Sector Weight ETF
| Statement of Operations | For the Year Ended November 30, 2024 |
| INVESTMENT INCOME: | | | |
| Dividend Income | | $ | 7,009,454 | |
| Securities lending income | | | 39,892 | |
| Total investment income | | | 7,049,346 | |
| | | | | |
| EXPENSES: | | | | |
| Investment adviser fees | | | 1,313,572 | |
| Other expenses | | | 14,707 | |
| Total Expenses before waiver/reimbursement | | | 1,328,279 | |
| Less fee waiver/reimbursement by investment adviser | | | (745,541 | ) |
| Net expenses | | | 582,738 | |
| NET INVESTMENT INCOME | | | 6,466,608 | |
| | | | | |
| REALIZED AND UNREALIZED GAIN/(LOSS): | | | | |
| Net realized gain on investments(a) | | | 11,379,895 | |
| Net change in unrealized appreciation/(depreciation) on investments | | | 72,485,686 | |
| NET REALIZED AND UNREALIZED GAIN ON INVESTMENTS | | | 83,865,581 | |
| NET INCREASE IN NET ASSETS RESULTING FROM OPERATIONS | | $ | 90,332,189 | |
| (a) | Includes realized gain or loss as a result of in-kind transactions (See Note 4 in Notes to Financial Statements and Financial Highlights). |
See Notes to Financial Statements and Financial Highlights.
ALPS Equal Sector Weight ETF
Statements of Changes in Net Assets
| | | For the
Year Ended
November 30, 2024 | | | For the
Year Ended
November 30, 2023 | |
| OPERATIONS: | | | | | | | | |
| Net investment income | | $ | 6,466,608 | | | $ | 6,423,890 | |
| Net realized gain | | | 11,379,895 | | | | 51,178,678 | |
| Net change in unrealized appreciation/(depreciation) | | | 72,485,686 | | | | (43,178,294 | ) |
| Net increase in net assets resulting from operations | | | 90,332,189 | | | | 14,424,274 | |
| | | | | | | | | |
| DISTRIBUTIONS TO SHAREHOLDERS: | | | | | | | | |
| From distributable earnings | | | (6,466,608 | ) | | | (6,423,890 | ) |
| From tax return of capital | | | (84,306 | ) | | | (82,622 | ) |
| Total distributions | | | (6,550,914 | ) | | | (6,506,512 | ) |
| | | | | | | | | |
| CAPITAL SHARE TRANSACTIONS: | | | | | | | | |
| Proceeds from sale of shares | | | 76,338,816 | | | | 159,340,355 | |
| Cost of shares redeemed | | | (61,468,556 | ) | | | (185,092,827 | ) |
| Net increase/(decrease) from capital share transactions | | | 14,870,260 | | | | (25,752,472 | ) |
| Net increase/(decrease) in net assets | | | 98,651,535 | | | | (17,834,710 | ) |
| | | | | | | | | |
| NET ASSETS: | | | | | | | | |
| Beginning of period | | | 324,264,124 | | | | 342,098,834 | |
| End of period | | $ | 422,915,659 | | | $ | 324,264,124 | |
| | | | | | | | | |
| OTHER INFORMATION: | | | | | | | | |
| CAPITAL SHARE TRANSACTIONS: | | | | | | | | |
| Beginning shares | | | 3,075,000 | | | | 3,375,000 | |
| Shares sold | | | 650,000 | | | | 1,600,000 | |
| Shares redeemed | | | (550,000 | ) | | | (1,900,000 | ) |
| Shares outstanding, end of period | | | 3,175,000 | | | | 3,075,000 | |
See Notes to Financial Statements and Financial Highlights.
ALPS Equal Sector Weight ETF
| Financial Highlights | For a Share Outstanding Throughout the Periods Presented |
| | | For the Year
Ended
November 30,
2024 | | | For the Year
Ended
November 30,
2023 | | | For the Year
Ended
November 30,
2022 | | | For the Year
Ended
November 30,
2021 | | | For the Year
Ended
November 30,
2020 | |
| NET ASSET VALUE, BEGINNING OF PERIOD | | $ | 105.45 | | | $ | 101.36 | | | $ | 103.95 | | | $ | 84.17 | | | $ | 78.33 | |
| | | | | | | | | | | | | | | | | | | | | |
| INCOME FROM OPERATIONS: | | | | | | | | | | | | | | | | | | | | |
| Net investment income(a) | | | 2.15 | | | | 2.14 | | | | 1.89 | | | | 1.76 | | | | 1.91 | |
| Net realized and unrealized gain/(loss) | | | 27.78 | | | | 4.20 | | | | (2.55 | ) | | | 19.82 | | | | 5.84 | |
| Total from investment operations | | | 29.93 | | | | 6.34 | | | | (0.66 | ) | | | 21.58 | | | | 7.75 | |
| | | | | | | | | | | | | | | | | | | | | |
| DISTRIBUTIONS: | | | | | | | | | | | | | | | | | | | | |
| From net investment income | | | (2.15 | ) | | | (2.22 | ) | | | (1.93 | ) | | | (1.78 | ) | | | (1.90 | ) |
| From tax return of capital | | | (0.03 | ) | | | (0.03 | ) | | | – | | | | (0.02 | ) | | | (0.01 | ) |
| Total distributions | | | (2.18 | ) | | | (2.25 | ) | | | (1.93 | ) | | | (1.80 | ) | | | (1.91 | ) |
| | | | | | | | | | | | | | | | | | | | | |
| NET INCREASE/(DECREASE) IN NET ASSET VALUE | | | 27.75 | | | | 4.09 | | | | (2.59 | ) | | | 19.78 | | | | 5.84 | |
| NET ASSET VALUE, END OF PERIOD | | $ | 133.20 | | | $ | 105.45 | | | $ | 101.36 | | | $ | 103.95 | | | $ | 84.17 | |
| TOTAL RETURN(b) | | | 28.68 | % | | | 6.43 | % | | | (0.59 | )% | | | 25.89 | % | | | 10.37 | % |
| | | | | | | | | | | | | | | | | | | | | |
| RATIOS/SUPPLEMENTAL DATA: | | | | | | | | | | | | | | | | | | | | |
| Net assets, end of period (in 000s) | | $ | 422,916 | | | $ | 324,264 | | | $ | 342,099 | | | $ | 207,896 | | | $ | 164,141 | |
| | | | | | | | | | | | | | | | | | | | | |
| Ratio of expenses excluding waiver/reimbursement to average net assets | | | 0.37 | % | | | 0.37 | % | | | 0.37 | % | | | 0.37 | % | | | 0.37 | % |
| Ratio of expenses including waiver/reimbursement to average net assets | | | 0.16 | % | | | 0.16 | % | | | 0.16 | % | | | 0.15 | % | | | 0.15 | % |
| Ratio of net investment income excluding waiver/reimbursement to average net assets | | | 1.61 | % | | | 1.91 | % | | | 1.68 | % | | | 1.59 | % | | | 2.31 | % |
| Ratio of net investment income including waiver/reimbursement to average net assets | | | 1.82 | % | | | 2.12 | % | | | 1.89 | % | | | 1.81 | % | | | 2.53 | % |
| Portfolio turnover rate(c) | | | 7 | % | | | 14 | % | | | 12 | % | | | 8 | % | | | 11 | % |
| (a) | Based on average shares outstanding during the period. |
| (b) | Total return is calculated assuming an initial investment made at the net asset value at the beginning of the year and redemption at the net asset value on the last day of the year and assuming all distributions are reinvested at the reinvestment prices. Total return calculated for a period of less than one year is not annualized. |
| (c) | Portfolio turnover for periods less than one year are not annualized and does not include securities received or delivered from processing creations or redemptions in-kind. |
See Notes to Financial Statements and Financial Highlights.
ALPS Equal Sector Weight ETF
| Notes to Financial Statements and Financial Highlights | November 30, 2024 |
1. ORGANIZATION
ALPS ETF Trust (the “Trust”), a Delaware statutory trust, is an open-end management investment company registered under the Investment Company Act of 1940, as amended (the “1940 Act”). As of November 30, 2024, the Trust consisted of twenty-three separate portfolios. Each portfolio represents a separate series of the Trust. This report pertains solely to the ALPS Equal Sector Weight ETF (the “Fund”). The investment objective of the Fund is to seek investment results that replicate as closely as possible, before fees and expenses, the performance of the NYSE® Equal Sector Weight Index (the “Underlying Index”). The Fund is considered non-diversified and may invest a greater portion of assets in securities of individual issuers than a diversified fund. As a result, changes in the market value of a single investment could cause greater fluctuations in share price than would occur in a diversified fund.
The Fund’s Shares (“Shares”) are listed on the NYSE Arca, Inc (the “NYSE Arca”). The Fund issues and redeems Shares, at net asset value (“NAV”) in blocks of 25,000 Shares, each of which is called a “Creation Unit”. Creation Units are issued and redeemed principally in-kind for securities included in the Underlying Index. Except when aggregated in Creation Units, Shares are not redeemable securities of the Fund.
Pursuant to the Trust’s organizational documents, its Officers and Trustees are indemnified against certain liability arising out of the performance of their duties to the Trust. Additionally, in the normal course of business, the Trust enters into contracts with service providers that contain general indemnification clauses. The Trust’s maximum exposure under these arrangements is unknown, as this would involve future claims that may be made against the Trust that have not yet occurred.
2. SIGNIFICANT ACCOUNTING POLICIES
The following is a summary of significant accounting policies consistently followed by the Fund in the preparation of the financial statements. The accompanying financial statements were prepared in accordance with accounting principles generally accepted in the United States of America (“U.S. GAAP”). The preparation of financial statements in conformity with U.S. GAAP requires management to make certain estimates and assumptions that affect the reported amounts of assets and liabilities and disclosures of contingent assets and liabilities at the date of the financial statements and the reported amounts of revenue and expenses during the period. Actual results could differ from those estimates. The Fund is considered an investment company under U.S. GAAP and follows the accounting and reporting guidance applicable to investment companies in the Financial Accounting Standards Board (“FASB”) Accounting Standards Codification Topic 946.
A. Portfolio Valuation
The Fund’s NAV is determined daily, as of the close of regular trading on the New York Stock Exchange (the “NYSE”), normally 4:00 p.m. Eastern Time, on each day the NYSE is open for trading. The NAV is computed by dividing the value of all assets of the Fund (including accrued interest and dividends), less all liabilities (including accrued expenses and dividends declared but unpaid), by the total number of shares outstanding.
Portfolio securities listed on any exchange other than the NASDAQ Stock Market LLC (“NASDAQ”) are valued at the last sale price on the business day as of which such value is being determined. If there has been no sale on such day, the securities are valued at the mean of the most recent bid and ask prices on such day. Securities traded on the NASDAQ are valued at the NASDAQ Official Closing Price as determined by NASDAQ. Portfolio securities traded on more than one securities exchange are valued at the last sale price on the business day as of which such value is being determined at the close of the exchange representing the principal market for such securities. Portfolio securities traded in the over-the-counter market, but excluding securities traded on the NASDAQ, are valued at the last quoted sale price in such market.
The Fund’s investments are valued at market value or, in the absence of market value with respect to any portfolio securities, at fair value according to procedures adopted by the Trust’s Board of Trustees (the “Board”). Pursuant to Rule 2a-5 under the 1940 Act, the Board designated ALPS Advisors, Inc. (the “Adviser”) as the valuation designee (“Valuation Designee”) for each Fund to perform the fair value determinations relating to Fund investments. The Adviser may carry out its designated responsibilities as Valuation Designee through various teams and committees. When market quotations are not readily available or when events occur that make established valuation methods unreliable, securities of the Fund may be valued in good faith by the Valuation Designee. These securities generally include, but are not limited to, restricted securities (securities which may not be publicly sold without registration under the Securities Act of 1933) for which a pricing service is unable to provide a market price; securities whose trading has been formally suspended; a security whose market price is not available from a pre-established primary pricing source or the pricing source is not willing to provide a price; a security with respect to which an event has occurred that is most likely to materially affect the value of the security after the market has closed but before the calculation of the Fund’s NAV or make it difficult or impossible to obtain a reliable market quotation; or a security whose price, as provided by the pricing service, does not reflect the security’s “fair value” due to the security being de-listed from a national exchange or the security’s primary trading market is temporarily closed at a time when, under normal conditions, it would be open. As a general principle, the current “fair value” of a security would be the amount which the owner might reasonably expect to receive from the sale on the applicable exchange or principal market. A variety of factors may be considered in determining the fair value of such securities.
ALPS Equal Sector Weight ETF
| Notes to Financial Statements and Financial Highlights | November 30, 2024 |
B. Fair Value Measurements
The Fund discloses the classification of its fair value measurements following a three-tier hierarchy based on the inputs used to measure fair value. Inputs refer broadly to the assumptions that market participants would use in pricing the asset or liability, including assumptions about risk. Inputs may be observable or unobservable. Observable inputs reflect the assumptions market participants would use in pricing the asset or liability that are developed based on market data obtained from sources independent of the reporting entity. Unobservable inputs reflect the reporting entity’s own assumptions about the assumptions market participants would use in pricing the asset or liability that are developed based on the best information available.
Valuation techniques used to value the Fund’s investments by major category are as follows:
Exchange Traded Funds, for which market quotations are readily available, are valued at the last reported sale price or official closing price as reported by a third party pricing vendor on the primary market or exchange on which they are traded and are categorized as Level 1 in the hierarchy. In the event there were no sales during the day or closing prices are not available, securities are valued at the mean of the most recent quoted bid and ask prices on such day and are generally categorized as Level 2 in the hierarchy. Investments in open-end mutual funds are valued at their closing NAV each business day and are categorized as Level 1 in the hierarchy.
Changes in valuation techniques may result in transfers in or out of an assigned level within the disclosure hierarchy.
Various inputs are used in determining the value of the Fund’s investments as of the end of the reporting period. When inputs used fall into different levels of the fair value hierarchy, the level in the hierarchy within which the fair value measurement falls is determined based on the lowest level input that is significant to the fair value measurement in its entirety. The designated input levels are not necessarily an indication of the risk or liquidity associated with these investments.
These inputs are categorized in the following hierarchy under applicable financial accounting standards:
| Level 1 – | Unadjusted quoted prices in active markets for identical investments, unrestricted assets or liabilities that a Fund has the ability to access at the measurement date; |
| Level 2 – | Quoted prices which are not active, quoted prices for similar assets or liabilities in active markets or inputs other than quoted prices that are observable (either directly or indirectly) for substantially the full term of the asset or liability; and |
| Level 3 – | Significant unobservable prices or inputs (including the Fund’s own assumptions in determining the fair value of investments) where there is little or no market activity for the asset or liability at the measurement date. |
The following is a summary of the inputs used to value the Fund’s investments as of November 30, 2024:
ALPS Equal Sector Weight ETF
| Investments in Securities at Value | | Level 1 - Quoted and
Unadjusted Prices | | | Level 2 - Other Significant
Observable Inputs | | | Level 3 – Significant
Unobservable Inputs | | | Total | |
| Exchange Traded Funds* | | $ | 422,919,789 | | | $ | – | | | $ | – | | | $ | 422,919,789 | |
| Short Term Investments | | | 49,241 | | | | – | | | | – | | | | 49,241 | |
| Total | | $ | 422,969,030 | | | $ | – | | | $ | – | | | $ | 422,969,030 | |
| * | For a detailed breakdown of sectors, see the accompanying Schedule of Investments. |
The Fund did not have any securities that used significant unobservable inputs (Level 3) in determining fair value and there were no transfers into or out of Level 3 during the year ended November 30, 2024
C. Securities Transactions and Investment Income
Securities transactions are recorded as of the trade date. Realized gains and losses from securities transactions are recorded on the specific identification in accordance with GAAP. Dividend income and capital gains distributions, if any, are recorded on the ex-dividend date. Interest income, if any, is recorded on the accrual basis.
D. Dividends and Distributions to Shareholders
Dividends from net investment income of the Fund, if any, are declared and paid quarterly or as the Board may determine from time to time. Distributions of net realized capital gains earned by the Fund, if any, are distributed at least annually.
ALPS Equal Sector Weight ETF
| Notes to Financial Statements and Financial Highlights | November 30, 2024 |
E. Federal Tax and Tax Basis Information
The timing and character of income and capital gain distributions are determined in accordance with income tax regulations, which may differ from U.S. GAAP. Reclassifications are made to the Fund’s capital accounts for permanent tax differences to reflect income and gains available for distribution (or available capital loss carryforwards) under income tax regulations.
For the year ended November 30, 2024, the following reclassifications, which had no impact on results of operations or net assets, were recorded to reflect permanent tax differences resulting primarily from in-kind transactions:
| Fund | | Paid-in Capital | | | Total Distributable
Earnings/(Accumulated
Losses) | |
| ALPS Equal Sector Weight ETF | | $ | 10,577,825 | | | $ | (10,577,825 | ) |
The tax character of the distributions paid during the fiscal years ended November 30, 2024 and November 30, 2023 was as follows:
| Fund | | Ordinary Income | | | Long-Term Capital Gain | | | Return of Capital | |
| November 30, 2024 | | | | | | | | | | | | |
| ALPS Equal Sector Weight ETF | | $ | 6,466,608 | | | $ | – | | | $ | 84,306 | |
| Fund | | Ordinary Income | | | Long-Term Capital Gain | | | Return of Capital | |
| November 30, 2023 | | | | | | | | | | | | |
| ALPS Equal Sector Weight ETF | | $ | 6,423,890 | | | $ | – | | | $ | 82,622 | |
The character of distributions made during the year may differ from its ultimate characterization for federal income tax purposes.
Under current law, capital losses maintain their character as short-term or long-term and are carried forward to the next tax year without expiration.
As of November 30, 2024, the following amounts are available as carry forwards to the next tax year:
| Fund | | Short-Term | | | Long-Term | |
| ALPS Equal Sector Weight ETF | | $ | 1,099,090 | | | $ | 4,708,245 | |
The Fund used capital loss carryovers during the year ended November 30, 2024, in the amount of $487,085.
As of November 30, 2024, the components of distributable earnings/(accumulated losses) on a tax basis were as follows:
| | | ALPS Equal Sector
Weight ETF | |
| Accumulated net realized loss on investments | | $ | (5,807,335 | ) |
| Net unrealized appreciation on investments | | | 90,973,683 | |
| Total | | $ | 85,166,348 | |
As of November 30, 2024, the cost of investments for federal income tax purposes and accumulated net unrealized appreciation/(depreciation) on investments were as follows:
| | | ALPS Equal Sector
Weight ETF | |
| Gross appreciation (excess of value over tax cost) | | $ | 91,063,325 | |
| Gross depreciation (excess of tax cost over value) | | | (89,642 | ) |
| Net unrealized appreciation/(depreciation) | | $ | 90,973,683 | |
| Cost of investments for income tax purposes | | $ | 331,995,347 | |
The differences between book-basis and tax-basis are primarily due to the deferral of losses from wash sales.
ALPS Equal Sector Weight ETF
| Notes to Financial Statements and Financial Highlights | November 30, 2024 |
F. Income Taxes
No provision for income taxes is included in the accompanying financial statements, as the Fund intends to distribute to shareholders all taxable investment income and realized gains and otherwise comply with Subchapter M of the Internal Revenue Code of 1986, as amended, applicable to regulated investment companies. The Fund evaluates tax positions taken (or expected to be taken) in the course of preparing the Fund’s tax returns to determine whether these positions meet a “more-likely-than-not” standard that, based on the technical merits, have a more than fifty percent likelihood of being sustained by a taxing authority upon examination. A tax position that meets the “more-likely-than-not” recognition threshold is measured to determine the amount of benefit to recognize in the financial statements.
As of and during the year ended November 30, 2024, the Fund did not have a liability for any unrecognized tax benefits. The Fund files U.S. federal, state, and local tax returns as required. The Fund’s tax returns are subject to examination by the relevant tax authorities until expiration of the applicable statute of limitations, which is generally three years after the filing of the tax return, but may extend to four years in certain jurisdictions. Tax returns for open years have incorporated no uncertain tax positions that require a provision for income taxes.
G. Lending of Portfolio Securities
The Fund has entered into a securities lending agreement with State Street Bank & Trust Co. (“SSB”), the Fund’s lending agent. The Fund may lend its portfolio securities only to borrowers that are approved by SSB. The Fund will limit such lending to not more than 33 1/3% of the value of its total assets. The Fund’s securities held at SSB as custodian shall be available to be lent except those securities the Fund or ALPS Advisors, Inc. specifically identifies in writing as not being available for lending. The borrower pledges and maintains with the Fund collateral consisting of cash (U.S. Dollars only), securities issued or guaranteed by the U.S. government or its agencies or instrumentalities, and cash equivalents (including irrevocable bank letters of credit) issued by a person other than the borrower or an affiliate of the borrower. The initial collateral received by the Fund is required to have a value of no less than 102% of the market value of the loaned securities for U.S equity securities and a value of no less than 105% of the market value for non-U.S. equity securities. The collateral is maintained thereafter, at a market value equal to not less than 102% of the current value of the U.S. equity securities on loan and not less than 105% of the current value of the non-U.S. equity securities on loan. The market value of the loaned securities is determined at the close of each business day and any additional required collateral is delivered to the Fund on the next business day. During the term of the loan, the Fund is entitled to all distributions made on or in respect of the loaned securities. Loans of securities are terminable at any time and the borrower, after notice, is required to return borrowed securities within the customary time period for settlement of securities transactions.
Any cash collateral received is reinvested in a money market fund managed by SSB as disclosed in the Fund’s Schedule of Investments and is reflected in the Statement of Assets and Liabilities as a payable for collateral upon return of securities loaned. Non-cash collateral, in the form of securities issued or guaranteed by the U.S. government or its agencies or instrumentalities, is not disclosed in the Fund’s Statement of Assets and Liabilities or the contractual maturity table below as it is held by the lending agent on behalf of the Fund, and the Fund does not have the ability to re-hypothecate these securities. Income earned by the Fund from securities lending activity is disclosed in the Statement of Operations.
The risks of securities lending include the risk that the borrower may not provide additional collateral when required or may not return the securities when due. To mitigate these risks, the Fund benefits from a borrower default indemnity provided by SSB. SSB’s indemnity allows for full replacement of securities lent wherein SSB will purchase the unreturned loaned securities on the open market by applying the proceeds of the collateral, or to the extent such proceeds are insufficient or the collateral is unavailable, SSB will purchase the unreturned loan securities at SSB’s expense. However, the Fund could suffer a loss if the value of the investments purchased with cash collateral falls below the value of the cash collateral received.
As of November 30, 2024, the Fund did not have any securities on loan.
3. INVESTMENT ADVISORY FEE AND OTHER AFFILIATED TRANSACTIONS
ALPS Advisors, Inc. serves as the Fund’s investment adviser pursuant to an Investment Advisory Agreement with the Trust on behalf of the Fund (the “Advisory Agreement”). Pursuant to the Advisory Agreement, the Fund pays the Adviser an annual management fee for the services and facilities it provides, payable on a monthly basis at the annual rate of 0.37% of the Fund’s average daily net assets.
The Adviser has contractually agreed to waive 0.19% of its annual unitary fee payable by the Fund until at least March 31, 2025. The waiver may only be terminated by the Fund’s Board of Trustees prior to such date.
ALPS Portfolio Solutions Distributor, Inc. (“APSD”) is both the distributor for the Fund as well as the Select Sector SPDR exchange traded funds (“Underlying Sector ETFs”) that the Fund invests in. As required by exemptive relief obtained by the Underlying Sector ETFs, the Adviser will reimburse the Fund an amount equal to the distribution fee received by APSD from the Underlying Sector ETFs attributable to the Fund’s investment in the Underlying Sector ETFs, for so long as APSD acts as the distributor to the Fund and the Underlying Sector ETFs. Such reimbursement is generally expected to be approximately 0.02% - 0.03% annually.
ALPS Equal Sector Weight ETF
| Notes to Financial Statements and Financial Highlights | November 30, 2024 |
Out of the unitary management fees, the Adviser pays substantially all expenses of the Fund, including licensing fees to the Underlying Index provider, the cost of transfer agency, custody, fund administration, legal, audit, trustees and other services, except for acquired fund fees and expenses, interest expenses, distribution fees or expenses, brokerage expenses, taxes and extraordinary expenses not incurred in the ordinary course of the Fund’s business. The Adviser’s unitary management fee is designed to pay substantially all of the Fund’s expenses and to compensate the Adviser for providing services to the Fund.
ALPS Fund Services, Inc., an affiliate of the Adviser, is the administrator of the Fund.
Each Trustee receives (1) a quarterly retainer of $25,000, (2) a per meeting fee of $15,000, (3) $2,500 for any special meeting held outside of a regularly scheduled board meeting, and (4) reimbursement for all reasonable out-of-pocket expenses relating to attendance at meetings. In addition, the Chairman of the Board receives a quarterly retainer of $5,000, the Chairman of the Audit Committee receives a quarterly retainer of $3,000, and the Chairman of the Nominating & Governance Committee receives a quarterly retainer of $2,000, each in connection with their respective roles.
4. PURCHASES AND SALES OF SECURITIES
For the year ended November 30, 2024, the cost of purchases and proceeds from sales of investment securities, excluding short-term investments and in-kind transactions, were as follows:
| Fund | | Purchases | | | Sales | |
| ALPS Equal Sector Weight ETF | | $ | 26,556,951 | | | $ | 26,620,972 | |
For the year ended November 30, 2024, the cost of in-kind purchases and proceeds from in-kind sales were as follows:
| Fund | | Purchases | | | Sales | |
| ALPS Equal Sector Weight ETF | | $ | 76,306,347 | | | $ | 61,468,091 | |
For the year ended November 30, 2024, the ALPS Equal Sector Weight ETF had in-kind net realized gain of $10,888,853.
Gains on in-kind transactions are not considered taxable for federal income tax purposes and losses on in-kind transactions are also not deductible for tax purposes.
5. CAPITAL SHARE TRANSACTIONS
Shares are created and redeemed by the Fund only in Creation Unit size aggregations of 25,000 Shares. Only broker-dealers or large institutional investors with creation and redemption agreements called Authorized Participants (“AP”) are permitted to purchase or redeem Creation Units from the Fund. Such transactions are generally permitted on an in-kind basis, with a balancing cash component to equate the transaction to the NAV per unit of the Fund on the transaction date. Cash may be substituted equivalent to the value of certain securities generally when they are not available in sufficient quantity for delivery, not eligible for trading by the AP or as a result of other market circumstances.
6. MARKET RISK
The Fund is subject to investment and operational risks associated with financial, economic and other global market developments and disruptions, including those arising from war, terrorism, market manipulation, government interventions, defaults and shutdowns, political changes or diplomatic developments, public health emergencies (such as the spread of infectious diseases, pandemics and epidemics) and natural/environmental disasters, which can negatively impact the securities markets and cause the Fund to lose value. Securities in the Fund’s portfolio may underperform in comparison to securities in general financial markets, a particular financial market or other asset classes due to a number of factors, including inflation (or expectations for inflation), deflation (or expectations for deflation), interest rates, global demand for particular products or resources, market instability, debt crises and downgrades, embargoes, tariffs, sanctions and other trade barriers, regulatory events, other governmental trade or market control programs and related geopolitical events. In addition, the value of the Fund’s investments may be negatively affected by the occurrence of global events such as war, terrorism, environmental disasters, natural disasters or events, country instability, and infectious disease epidemics or pandemics.
ALPS Equal Sector Weight ETF
| Notes to Financial Statements and Financial Highlights | November 30, 2024 |
7. SUBSEQUENT EVENTS
Subsequent events, if any, after the date of the Statement of Assets and Liabilities have been evaluated through the date the financial statements were issued. Management has determined that there were no subsequent events to report through the issuance of these financial statements.
ALPS Equal Sector Weight ETF
Report of Independent Registered Public Accounting Firm
To the Shareholders of ALPS Equal Sector Weight ETF
and Board of Trustees of ALPS ETF Trust
Opinion on the Financial Statements
We have audited the accompanying statement of assets and liabilities, including the schedule of investments, of ALPS Equal Sector Weight ETF (the “Fund”), a series of ALPS ETF Trust, as of November 30, 2024, the related statement of operations for the year then ended, the statements of changes in net assets and financial highlights for each of the two years in the period then ended, and the related notes (collectively referred to as the “financial statements”). In our opinion, the financial statements present fairly, in all material respects, the financial position of the Fund as of November 30, 2024, the results of its operations for the year then ended, and the changes in net assets and financial highlights for each of the two years in the period then ended, in conformity with accounting principles generally accepted in the United States of America.
The Fund’s financial highlights for the years ended November 30, 2022, and prior, were audited by other auditors whose report dated January 27, 2023, expressed an unqualified opinion on those financial highlights.
Basis for Opinion
These financial statements are the responsibility of the Fund’s management. Our responsibility is to express an opinion on the Fund’s financial statements based on our audits. We are a public accounting firm registered with the Public Company Accounting Oversight Board (United States) (“PCAOB”) and are required to be independent with respect to the Fund in accordance with the U.S. federal securities laws and the applicable rules and regulations of the Securities and Exchange Commission and the PCAOB.
We conducted our audits in accordance with the standards of the PCAOB. Those standards require that we plan and perform the audit to obtain reasonable assurance about whether the financial statements are free of material misstatement whether due to error or fraud.
Our audits included performing procedures to assess the risks of material misstatement of the financial statements, whether due to error or fraud, and performing procedures that respond to those risks. Such procedures included examining, on a test basis, evidence regarding the amounts and disclosures in the financial statements. Our procedures included confirmation of securities owned as of November 30, 2024, by correspondence with the custodian. Our audits also included evaluating the accounting principles used and significant estimates made by management, as well as evaluating the overall presentation of the financial statements. We believe that our audits provide a reasonable basis for our opinion.
We have served as the auditor of one or more investment companies advised by ALPS Advisors, Inc. since 2013.

COHEN & COMPANY, LTD.
Philadelphia, Pennsylvania
January 29, 2025
ALPS Equal Sector Weight ETF
| Additional Information | November 30, 2024 (Unaudited) |
TAX INFORMATION
The ALPS Equal Sector Weight ETF designates the following as a percentage of taxable ordinary income distributions, or up to the maximum amount allowable, for the calendar year ended December 31, 2023:
| | Qualified Dividend Income | Dividend Received Deduction | 199A Dividends |
| ALPS Equal Sector Weight ETF | 85.98% | 83.79% | 10.15% |
In early 2024, if applicable, shareholders of record received this information for the distributions paid to them by the Fund during the calendar year 2023 via Form 1099. The Fund will notify shareholders in early 2025 of amounts paid to them by the Fund, if any, during the calendar year 2024.
LICENSING AGREEMENT
ICE Data Indices, LLC (the “Index Provider”) is not affiliated with the ALPS Equal Sector Weight ETF (the “Fund”) or ALPS Advisors, Inc. (the “Adviser”). The Fund is entitled to use the Underlying Index pursuant to a licensing agreement with the Index Provider and the Adviser. The Adviser pays a licensing fee to the Index Provider out of the management fee.
The only relationship that the Index Provider has with the Fund, the Adviser or Distributor of the Fund in connection with the Fund is that the Index Provider has licensed certain of its intellectual property, including the determination of the component stocks of the Underlying Index and the name of the Underlying Index. The Underlying Index is selected and calculated without regard to the Adviser, Distributor or owners of the Fund. The Index Provider has no obligation to take the specific needs of the Adviser, Distributor or owners of the Fund into consideration in the determination and calculation of the Underlying Index. The Index Provider is not responsible for and has not participated in the determination of pricing or the timing of the issuance or sale of the Shares of the Fund or in the determination or calculation of the net asset value of the Fund. The Index Provider has no obligation or liability in connection with the administration or trading of the Fund.
NYSE® Equal Sector Weight Index is a service mark of ICE Data Indices, LLC or its affiliates (“ICE Data”) and has been licensed for use by the Adviser in connection with the Fund. Neither the Trust nor the Fund is sponsored, endorsed, sold or promoted by ICE Data. ICE Data makes no representations or warranties regarding the Adviser or the Fund or the ability of the NYSE® Equal Sector Weight Index to track general stock market performance.
ICE DATA MAKES NO EXPRESS OR IMPLIED WARRANTIES, AND HEREBY EXPRESSLY DISCLAIMS ALL WARRANTIES OF MERCHANTABILITY OR FITNESS FOR A PARTICULAR PURPOSE WITH RESPECT TO THE NYSE® EQUAL SECTOR WEIGHT INDEX OR ANY DATA INCLUDED THEREIN. IN NO EVENT SHALL ICE DATA HAVE ANY LIABILITY FOR ANY SPECIAL, PUNITIVE, INDIRECT, OR CONSEQUENTIAL DAMAGES (INCLUDING LOST PROFITS), EVEN IF NOTIFIED OF THE POSSIBILITY OF SUCH DAMAGES.
The Adviser does not guarantee the accuracy and/or the completeness of the Underlying Index or any data included therein, and the Adviser shall have no liability for any errors, omissions or interruptions therein. The Adviser makes no warranty, express or implied, as to results to be obtained by the Fund, owners of the Shares of the Fund or any other person or entity from the use of the Underlying Index or any data included therein. The Adviser makes no express or implied warranties, and expressly disclaims all warranties of merchantability or fitness for a particular purpose or use with respect to the Underlying Index or any data included therein. Without limiting any of the foregoing, in no event shall the Adviser have any liability for any special, punitive, direct, indirect or consequential damages (including lost profits) arising out of matters relating to the use of the Underlying Index even if notified of the possibility of such damages.
ALPS Equal Sector Weight ETF
Changes in and Disagreements with Accountants
for Open-End Management Investment Companies | November 30, 2024 (Unaudited) |
On March 14, 2023, BBD LLP (“BBD”) ceased to serve as the independent registered public accounting firm of the Fund. The Board approved the replacement of BBD as a result of Cohen & Company, Ltd.’s (“Cohen”) acquisition of BBD’s investment management group.
The report of BBD on the financial statements of the Fund as of and for the fiscal year or period ended November 30, 2022 did not contain an adverse opinion or a disclaimer of opinion, and was not qualified or modified as to uncertainties, audit scope or accounting principles. During the fiscal year or period ended November 30, 2022, and during the subsequent interim period through March 14, 2023: (i) there were no disagreements between the registrant and BBD on any matter of accounting principles or practices, financial statement disclosure, or auditing scope or procedure, which disagreements, if not resolved to the satisfaction of BBD, would have caused it to make reference to the subject matter of the disagreements in its report on the financial statements of the Fund for such years or interim period; and (ii) there were no “reportable events,” as defined in Item 304(a)(1)(v) of Regulation S-K under the Securities Exchange Act of 1934, as amended.
On March 7, 2023, upon the recommendation of the Fund’s Audit Committee, the Board approved the appointment of Cohen, effective upon the resignation of BBD, as the Fund’s independent registered public accounting firm for the fiscal year ending November 30, 2023.
During the fiscal year or period ended November 30, 2022, and during the subsequent interim period through March 14, 2023, neither the registrant, nor anyone acting on its behalf, consulted with Cohen on behalf of the Fund regarding the application of accounting principles to a specified transaction (either completed or proposed), the type of audit opinion that might be rendered on the Fund’s financial statements, or any matter that was either: (i) the subject of a “disagreement,” as defined in Item 304(a)(1)(iv) of Regulation S-K and the instructions thereto; or (ii) “reportable events,” as defined in Item 304(a)(1)(v) of Regulation S-K.
ALPS Equal Sector Weight ETF
Proxy Disclosures
for Open-End Management Investment Companies | November 30, 2024 (Unaudited) |
A Special Meeting of Shareholders of the Funds, each a series of the Trust, was held on July 19, 2024. At the meeting, the following matters were voted on by the Shareholders. The results of the Special Meeting of Shareholders are noted below:
Proposal 1: To elect seven Trustees.
| | Shares Voted in Favor | Shares Voted Against/Withheld or Abstentions | Proposal Approved |
| Mary K. Anstine | 223,143,090 | 2,894,793 | Yes |
| Edmund J. Burke | 223,362,578 | 2,672,643 | Yes |
| Jeremy W. Deems | 221,670,341 | 4,361,535 | Yes |
| Rick A. Pederson | 213,137,140 | 12,259,226 | Yes |
| Joseph F. Keenan | 223,547,500 | 2,483,867 | Yes |
| Susan K. Wold | 223,460,006 | 2,571,857 | Yes |
| Laton Spahr | 223,439,610 | 2,593,995 | Yes |
ALPS Equal Sector Weight ETF
Remuneration Paid to Directors, Officers,
and Others for Open-End Management Investment Companies | November 30, 2024 (Unaudited) |
The following chart provides certain information about the Trustee fees paid by the Trust for the year ended November 30, 2024:
| | | Aggregate Regular Compensation
From the Trust | | | Aggregate Special Compensation
From the Trust | | | Total Compensation
From the Trust | |
| Mary K. Anstine, Trustee | | $ | 162,500 | | | $ | – | | | $ | 162,500 | |
| Edmund J. Burke, Trustee | | | 166,500 | | | | – | | | | 166,500 | |
| Jeremy W. Deems, Trustee | | | 174,500 | | | | – | | | | 174,500 | |
| Rick A. Pederson, Trustee | | | 186,500 | | | | – | | | | 186,500 | |
| Joseph F. Keenan, Trustee | | | 40,000 | | | | – | | | | 40,000 | |
| Susan K. Wold, Trustee | | | 40,000 | | | | – | | | | 40,000 | |
| Laton Spahr, President and Trustee* | | | – | | | | – | | | | – | |
| Total | | $ | 770,000 | | | $ | – | | | $ | 770,000 | |
| * | Mr. Spahr, the President of the Trust, is deemed an “interested person” by virtue of his position as an officer of the Trust and of ALPS Advisors, Inc. |
Officers who are employed by the Adviser receive no compensation or expense reimbursement from the Trust.
ALPS Equal Sector Weight ETF
Statement Regarding Basis
for Approval of Investment Advisory Contract | November 30, 2024 (Unaudited) |
At its meetings held on June 3, 2024 and June 18, 2024, the Board of Trustees of the Trust (the “Board” or the “Trustees”), where each Trustee was not an “interested person” of the Trust within the meaning of the Investment Company Act of 1940, as amended (the “Independent Trustees”), evaluated a proposal to approve the continuance of the Investment Advisory Agreement between the Trust and ALPS Advisors, Inc. (the “Adviser” or “AAI”) with respect to the ALPS Equal Sector Weight ETF (“EQL” or the “Fund”). In evaluating the renewal of the Investment Advisory Agreement with respect to the Fund, the Board, including the Independent Trustees considered various factors, including (i) the nature, extent and quality of the services provided by AAI with respect to the Fund under the Investment Advisory Agreement; (ii) the advisory fees and other expenses paid by the Fund compared to those of similar funds managed by other investment advisers; (iii) the costs of the services provided to the Fund by AAI and the profits realized by AAI and its affiliates from its relationship to the Fund; (iv) the extent to which economies of scale have been or would be realized if and as the assets of the Fund grow and whether fees reflect the economies of scale for the benefit of shareholders; and (v) any additional benefits and other considerations.
With respect to the nature, extent and quality of the services provided by AAI under the Investment Advisory Agreement, the Board considered and reviewed information concerning the services provided under the Investment Advisory Agreement, the investment parameters of the index of the Fund, financial information regarding AAI and its parent company, information describing AAI’s current organization and the background and experience of the persons responsible for the day-to-day management of the Fund.
The Board reviewed information on the performance of the Fund and its applicable benchmark for the 1-, 3-, and 5-year periods, as applicable. The Board also evaluated the correlation and tracking error between the underlying index and the Fund’s performance. Based on this review, the Board, including the Independent Trustees found that the nature and extent of services provided to the Fund under the Investment Advisory Agreement was appropriate and that the quality of such services was satisfactory.
The Board noted that the advisory fees for the Fund were unitary fees pursuant to which AAI assumes all expenses of the Fund (including the cost of transfer agency, custody, fund administration, legal, audit and other services) other than the payments under the Advisory Agreement, brokerage expenses, taxes, interest, litigation expenses and other extraordinary expenses.
Based on the information available to them, including the Fund-specific summary set forth below, the Board, including the Independent Trustees concluded that the advisory fee rate for the Fund was reasonable under the circumstances and in light of the quality of the services provided.
The Board, including the Independent Trustees considered other benefits available to AAI because of its relationship with the Fund and concluded that the advisory fees were reasonable taking into account any such benefits.
The Board, including the Independent Trustees, also considered with respect to the Fund the information provided by AAI about the costs and profitability of AAI with respect to the Fund, including the asset levels and other factors that influence the profitability and financial viability of the Fund. The Board, including the Independent Trustees reviewed and noted the relatively small size of the Fund and the analysis AAI had conducted to support AAI’s assertion that it was not realizing any economies of scale with respect to such Fund. The Independent Trustees determined that AAI should continue to keep the Board informed on an ongoing basis of any significant developments (e.g., material increases in asset levels) so as to facilitate the Independent Trustees’ evaluation of whether further economies of scale have been achieved.
The Board, including the Independent Trustees, also considered other potential benefits available to AAI because of its relationship with the Fund, known as fall-out benefits.
With respect to the Fund, the Board, including the Independent Trustees, noted the following:
The gross management fee rate for EQL is higher than the median of its FUSE expense group. EQL’s net expense ratio is lower than the median of its FUSE expense group.
The Board, including the Independent Trustees, reviewed and noted the relatively small size of EQL and the analysis AAI had conducted to support AAI’s assertion that it was not realizing any economies of scale with respect to EQL.
In voting to renew the Investment Advisory Agreement with AAI, the Board, including the Independent Trustees, concluded that the terms of the Investment Advisory Agreement are reasonable and fair in light of the services to be performed, the fees paid by certain other funds, expenses to be incurred and such other matters as the members of the Board, including the Independent Trustees, considered relevant in the exercise of their reasonable business judgment. The Independent Trustees did not identify any single factor or group of factors as all important or controlling and considered all factors together.


Table of Contents
| Financial Statements and Financial Highlights for Open-End Management Investment Companies | |
| Schedule of Investments | 1 |
| Statement of Assets and Liabilities | 6 |
| Statement of Operations | 7 |
| Statements of Changes in Net Assets | 8 |
| Financial Highlights | 9 |
| Notes to Financial Statements and Financial Highlights | 10 |
| Report of Independent Registered Public Accounting Firm | 15 |
| Additional Information | 16 |
| Changes in and Disagreements with Accountants for Open-End Management Investment Companies | 17 |
| Proxy Disclosures for Open-End Management Investment Companies | 18 |
| Remuneration Paid to Directors, Officers, and Others of Open-End Management Investment Companies | 19 |
| Statement Regarding Basis for Approval of Investment Advisory Contract | 20 |
alpsfunds.com
ALPS Intermediate Municipal Bond ETF
| Schedule of Investments | November 30, 2024 |
| Security Description | | Shares | | | Value | |
| COMMERCIAL PAPER (1.13%) | | | | | | | | |
| Texas A&M Univ. 3.00%, 02/04/25(a) | | | 395,000 | | | $ | 395,000 | |
| | | | | | | | | |
| TOTAL COMMERCIAL PAPER | | | | | | | | |
| (Cost $395,000) | | | | | | | 395,000 | |
| | | | | | | | | |
| Security Description | | | Principal
Amount | | | | Value | |
| GOVERNMENT BONDS (4.25%) | | | | | | | | |
| United States Treasury Bill 4.79%, 12/10/2024 | | $ | 1,485,000 | | | $ | 1,483,508 | |
| Total | | | | | | | 1,483,508 | |
| | | | | | | | | |
| TOTAL GOVERNMENT BONDS | | | | | | | | |
| (Cost $1,483,325) | | | | | | | 1,483,508 | |
| | | | | | | | | |
| Security Description | | | Principal
Amount | | | | Value | |
| MUNICIPAL BONDS (98.41%) | | | | | | | | |
| General Obligation Limited (1.46%) | | | | | | | | |
| Pennsylvania (1.46%) | | | | | | | | |
| School District of Philadelphia | | | | | | | | |
| 5.00%, 09/01/2034 | | | 500,000 | | | | 511,138 | |
| Total Pennsylvania | | | | | | | 511,138 | |
| | | | | | | | | |
| Total General Obligation Limited | | | | | | | 511,138 | |
| | | | | | | | | |
| General Obligation Unlimited (17.91%) | | | | | | | | |
| Alaska (0.91%) | | | | | | | | |
| State of Alaska | | | | | | | | |
| 5.00%, 08/01/2028(b) | | | 300,000 | | | | 317,519 | |
| Total Alaska | | | | | | | 317,519 | |
| | | | | | | | | |
| California (5.83%) | | | | | | | | |
| Allan Hancock Joint Community College District | | | | | | | | |
| 0.00%, 08/01/2042(c) | | | 350,000 | | | | 300,012 | |
| Chaffey Joint Union High School District | | | | | | | | |
| 0.00%, 08/01/2044(c) | | | 250,000 | | | | 105,167 | |
| Chino Valley Unified School District | | | | | | | | |
| 0.00%, 08/01/2035(c) | | | 245,000 | | | | 167,639 | |
| Lake Tahoe Unified School District | | | | | | | | |
| 0.00%, 08/01/2045(c) | | | 150,000 | | | | 130,496 | |
| Mount San Antonio Community College District | | | | | | | | |
| 0.00%, 08/01/2043(c) | | | 275,000 | | | | 277,161 | |
| Rio Hondo Community College District | | | | | | | | |
| 0.00%, 08/01/2044(c) | | | 150,000 | | | | 61,258 | |
| San Diego Unified School District | | | | | | | | |
| 5.00%, 07/01/2034(b) | | | 300,000 | | | | 354,383 | |
| Security Description | | Principal
Amount | | | Value | |
| General Obligation Unlimited (continued) | | | | | | | | |
| San Mateo County Community College District | | | | | | | | |
| 0.00%, 09/01/2035(c) | | $ | 110,000 | | | $ | 77,563 | |
| San Mateo Union High School District | | | | | | | | |
| 0.00%, 09/01/2041(c) | | | 520,000 | | | | 562,602 | |
| Total California | | | | | | | 2,036,281 | |
| | | | | | | | | |
| Maryland (0.99%) | | | | | | | | |
| County of Baltimore MD | | | | | | | | |
| 5.00%, 01/01/2025 | | | 345,000 | | | | 345,530 | |
| Total Maryland | | | | | | | 345,530 | |
| | | | | | | | | |
| Minnesota (1.63%) | | | | | | | | |
| Morris Area Schools Independent School District No 2769 | | | | | | | | |
| 0.00%, 02/01/2033(b)(c) | | | 750,000 | | | | 564,020 | |
| Total Minnesota | | | | | | | 564,020 | |
| | | | | | | | | |
| Oregon (5.04%) | | | | | | | | |
| Clackamas & Washington Counties School District No 3 | | | | | | | | |
| 0.00%, 06/15/2036(c) | | | 600,000 | | | | 378,171 | |
| Multnomah County School District No 40 | | | | | | | | |
| 0.00%, 06/15/2043(c) | | | 1,000,000 | | | | 429,844 | |
| Multnomah County School District No 7 Reynolds | | | | | | | | |
| 0.00%, 06/15/2035(c) | | | 500,000 | | | | 317,582 | |
| Oregon Coast Community College District | | | | | | | | |
| 0.00%, 06/15/2040(b)(c) | | | 400,000 | | | | 429,114 | |
| Washington & Multnomah Counties School District No 48J Beaverton | | | | | | | | |
| 0.00%, 06/15/2034(c) | | | 200,000 | | | | 135,931 | |
| 0.00%, 06/15/2041(c) | | | 150,000 | | | | 70,771 | |
| Total Oregon | | | | | | | 1,761,413 | |
| | | | | | | | | |
| Texas (1.35%) | | | | | | | | |
| Fort Bend Independent School District | | | | | | | | |
| 0.72%, 08/01/2051(d) | | | 65,000 | | | | 61,436 | |
| 4.00%, 08/01/2054(b)(d) | | | 150,000 | | | | 153,359 | |
| North East Independent School District | | | | | | | | |
| 3.75%, 08/01/2049(d) | | | 250,000 | | | | 253,314 | |
| Total Texas | | | | | | | 468,109 | |
ALPS Intermediate Municipal Bond ETF
| Schedule of Investments | November 30, 2024 |
| Security Description | | Principal
Amount | | | Value | |
| General Obligation Unlimited (continued) | | | | | | | | |
| Washington (1.26%) | | | | | | | | |
| Washington Clackamas & Yamhill Counties School District No 88J | | | | | | | | |
| 0.00%, 06/15/2037(c) | | $ | 150,000 | | | $ | 86,668 | |
| 0.00%, 06/15/2039(c) | | | 255,000 | | | | 133,443 | |
| 0.00%, 06/15/2040(c) | | | 200,000 | | | | 101,644 | |
| 0.00%, 06/15/2041(c) | | | 250,000 | | | | 118,570 | |
| Total Washington | | | | | | | 440,325 | |
| | | | | | | | | |
| Wisconsin (0.90%) | | | | | | | | |
| State of Wisconsin | | | | | | | | |
| 5.00%, 05/01/2027(b) | | | 300,000 | | | | 315,500 | |
| Total Wisconsin | | | | | | | 315,500 | |
| | | | | | | | | |
| Total General Obligation Unlimited | | | | | | | 6,248,697 | |
| | | | | | | | | |
| Revenue Bonds (79.04%) | | | | | | | | |
| Alabama (0.97%) | | | | | | | | |
| Black Belt Energy Gas District 7D US MUNI + 0.65%, 04/01/2053(d) | | | 100,000 | | | | 97,306 | |
| Industrial Development Board of the City of Mobile Alabama | | | | | | | | |
| 3.92%, 06/01/2034(d) | | | 65,000 | | | | 65,610 | |
| Southeast Energy Authority A Cooperative District | | | | | | | | |
| 5.00%, 11/01/2055(b)(d) | | | 160,000 | | | | 173,013 | |
| Total Alabama | | | | | | | 335,929 | |
| | | | | | | | | |
| Arizona (3.54%) | | | | | | | | |
| Salt Verde Financial Corp. | | | | | | | | |
| 5.00%, 12/01/2032 | | | 675,000 | | | | 734,978 | |
| 5.00%, 12/01/2037 | | | 450,000 | | | | 498,189 | |
| Total Arizona | | | | | | | 1,233,167 | |
| | | | | | | | | |
| California (4.67%) | | | | | | | | |
| California Community Choice Financing Authority | | | | | | | | |
| 7D US MUNI + 0.45%, 02/01/2052(d) | | | 210,000 | | | | 198,680 | |
| Long Beach Bond Finance Authority 3M US SOFR + 1.45%, | | | | | | | | |
| 11/15/2027(d) | | | 430,000 | | | | 435,717 | |
| Modesto Irrigation District 3M US SOFR + 0.63%, | | | | | | | | |
| 09/01/2037(d) | | | 510,000 | | | | 490,088 | |
| Northern California Energy Authority | | | | | | | | |
| 5.00%, 12/01/2054(d) | | | 300,000 | | | | 321,491 | |
| Northern California Gas Authority No 1 3M US SOFR + 0.72%, | | | | | | | | |
| 07/01/2027(d) | | | 185,000 | | | | 185,131 | |
| Total California | | | | | | | 1,631,107 | |
| Security Description | | Principal
Amount | | | Value | |
| Revenue Bonds (continued) | | | | | | | | |
| Colorado (2.96%) | | | | | | | | |
| City & County of Denver Co. Airport System Revenue | | | | | | | | |
| 5.25%, 11/15/2035 | | $ | 250,000 | | | $ | 282,667 | |
| 5.75%, 11/15/2036 | | | 250,000 | | | | 302,329 | |
| E-470 Public Highway Authority | | | | | | | | |
| 0.00%, 09/01/2035(c) | | | 300,000 | | | | 178,966 | |
| 0.00%, 09/01/2037(c) | | | 500,000 | | | | 268,869 | |
| Total Colorado | | | | | | | 1,032,831 | |
| | | | | | | | | |
| Connecticut (1.49%) | | | | | | | | |
| Connecticut Housing Finance Authority | | | | | | | | |
| 4.00%, 11/15/2047 | | | 190,000 | | | | 190,244 | |
| 6.00%, 11/15/2054 | | | 295,000 | | | | 328,068 | |
| Total Connecticut | | | | | | | 518,312 | |
| | | | | | | | | |
| District of Columbia (2.07%) | | | | | | | | |
| District of Columbia | | | | | | | | |
| 5.00%, 07/15/2040 | | | 200,000 | | | | 202,317 | |
| Metropolitan Washington Airports Authority Aviation Revenue | | | | | | | | |
| 5.00%, 10/01/2031 | | | 245,000 | | | | 250,781 | |
| 5.00%, 10/01/2037 | | | 250,000 | | | | 269,088 | |
| Total District of Columbia | | | | | | | 722,186 | |
| | | | | | | | | |
| Florida (3.31%) | | | | | | | | |
| City Of South Miami Health Facilities Authority, Inc. | | | | | | | | |
| 5.00%, 08/15/2042 | | | 300,000 | | | | 309,699 | |
| County of Broward FL Airport System Revenue | | | | | | | | |
| 5.00%, 10/01/2031 | | | 200,000 | | | | 213,375 | |
| County of Miami-Dade FL Aviation Revenue | | | | | | | | |
| 5.00%, 10/01/2036(b) | | | 150,000 | | | | 163,029 | |
| Florida Housing Finance Corp. | | | | | | | | |
| 5.50%, 01/01/2054 | | | 140,000 | | | | 147,189 | |
| Greater Orlando Aviation Authority | | | | | | | | |
| 5.00%, 10/01/2033 | | | 300,000 | | | | 319,366 | |
| Total Florida | | | | | | | 1,152,658 | |
| | | | | | | | | |
| Georgia (3.58%) | | | | | | | | |
| Development Authority of Burke County | | | | | | | | |
| 1.50%, 01/01/2040(d) | | | 255,000 | | | | 253,357 | |
| Main Street Natural Gas, Inc. | | | | | | | | |
| 4.00%, 08/01/2049(d) | | | 500,000 | | | | 500,000 | |
| 5.00%, 12/01/2053(d) | | | 300,000 | | | | 323,348 | |
| 5.00%, 04/01/2054(b)(d) | | | 160,000 | | | | 172,386 | |
| Total Georgia | | | | | | | 1,249,091 | |
ALPS Intermediate Municipal Bond ETF
| Schedule of Investments | November 30, 2024 |
| | | Principal | | | | |
| Security Description | | Amount | | | Value | |
| Revenue Bonds (continued) | | | | | | | | |
| Hawaii (1.16%) | | | | | | | | |
| City & County Honolulu HI Wastewater System Revenue | | | | | | | | |
| 5.00%, 07/01/2035(b) | | $ | 350,000 | | | $ | 406,509 | |
| Total Hawaii | | | | | | | 406,509 | |
| | | | | | | | | |
| Illinois (2.47%) | | | | | | | | |
| Illinois Finance Authority | | | | | | | | |
| 5.00%, 08/15/2035 | | | 225,000 | | | | 245,605 | |
| 5.00%, 02/15/2036 | | | 400,000 | | | | 414,432 | |
| Illinois Housing Development Authority | | | | | | | | |
| 6.25%, 04/01/2054 | | | 185,000 | | | | 202,660 | |
| Total Illinois | | | | | | | 862,697 | |
| | | | | | | | | |
| Indiana (0.45%) | | | | | | | | |
| Indiana Finance Authority | | | | | | | | |
| 5.00%, 11/01/2043 | | | 150,000 | | | | 157,290 | |
| Total Indiana | | | | | | | 157,290 | |
| | | | | | | | | |
| Kentucky (2.20%) | | | | | | | | |
| County of Trimble KY | | | | | | | | |
| 4.70%, 06/01/2054(d) | | | 300,000 | | | | 306,543 | |
| Kentucky Public Energy Authority | | | | | | | | |
| 1D US SOFR + 1.20%, 08/01/2052(d) | | | 460,000 | | | | 461,853 | |
| Total Kentucky | | | | | | | 768,396 | |
| | | | | | | | | |
| Louisiana (0.15%) | | | | | | | | |
| Louisiana Public Facilities Authority | | | | | | | | |
| 3M US SOFR + 0.70%, 02/15/2036(d) | | | 55,000 | | | | 53,610 | |
| Total Louisiana | | | | | | | 53,610 | |
| | | | | | | | | |
| Massachusetts (1.21%) | | | | | | | | |
| Massachusetts Housing Finance Agency | | | | | | | | |
| 3.00%, 12/01/2050 | | | 125,000 | | | | 123,211 | |
| Massachusetts School Building Authority | | | | | | | | |
| 4.00%, 08/15/2032 | | | 300,000 | | | | 300,973 | |
| Total Massachusetts | | | | | | | 424,184 | |
| | | | | | | | | |
| Minnesota (2.54%) | | | | | | | | |
| Minnesota Housing Finance Agency | | | | | | | | |
| 2.47%, 01/01/2050 | | | 224,335 | | | | 184,893 | |
| 3.50%, 07/01/2050 | | | 705,000 | | | | 702,117 | |
| Total Minnesota | | | | | | | 887,010 | |
| Security Description | | Principal
Amount | | | Value | |
| Revenue Bonds (continued) | | | | | | | | |
| Missouri (1.01%) | | | | | | | | |
| Missouri Housing Development Commission | | | | | | | | |
| 4.00%, 05/01/2050 | | $ | 185,000 | | | $ | 186,245 | |
| 6.00%, 05/01/2055 | | | 150,000 | | | | 166,807 | |
| Total Missouri | | | | | | | 353,052 | |
| | | | | | | | | |
| Nebraska (2.58%) | | | | | | | | |
| Central Plains Energy Project | | | | | | | | |
| 5.00%, 05/01/2053(d) | | | 725,000 | | | | 765,442 | |
| Nebraska Investment Finance Authority | | | | | | | | |
| 3.50%, 09/01/2046 | | | 140,000 | | | | 139,249 | |
| Total Nebraska | | | | | | | 904,691 | |
| | | | | | | | | |
| New Jersey (2.29%) | | | | | | | | |
| New Jersey Health Care Facilities Financing Authority | | | | | | | | |
| 5.00%, 07/01/2045(d) | | | 220,000 | | | | 225,915 | |
| New Jersey Transportation Trust Fund Authority | | | | | | | | |
| 0.00%, 12/15/2031(c) | | | 725,000 | | | | 570,998 | |
| Total New Jersey | | | | | | | 796,913 | |
| | | | | | | | | |
| New Mexico (1.77%) | | | | | | | | |
| City of Farmington NM | | | | | | | | |
| 1.80%, 04/01/2029 | | | 375,000 | | | | 342,204 | |
| New Mexico Mortgage Finance Authority | | | | | | | | |
| 5.25%, 03/01/2053 | | | 260,000 | | | | 274,283 | |
| Total New Mexico | | | | | | | 616,487 | |
| | | | | | | | | |
| New York (7.40%) | | | | | | | | |
| Metropolitan Transportation Authority | | | | | | | | |
| 1D US SOFR + 0.43%, 11/01/2026(d) | | | 40,000 | | | | 39,921 | |
| 1D US SOFR + 0.80%, 11/01/2032(d) | | | 460,000 | | | | 460,264 | |
| New York State Dormitory Authority | | | | | | | | |
| 4.00%, 07/01/2038 | | | 100,000 | | | | 104,085 | |
| Port Authority of New York & New Jersey | | | | | | | | |
| 5.00%, 11/01/2030 | | | 1,100,000 | | | | 1,176,441 | |
| Triborough Bridge & Tunnel Authority | | | | | | | | |
| 1D US SOFR + 1.05%, 04/01/2026(d) | | | 250,000 | | | | 249,898 | |
| 0.00%, 11/15/2039(c) | | | 1,000,000 | | | | 549,892 | |
| Total New York | | | | | | | 2,580,501 | |
ALPS Intermediate Municipal Bond ETF
| Schedule of Investments | November 30, 2024 |
| Security Description | | Principal
Amount | | | Value | |
| Revenue Bonds (continued) | | | | | | | | |
| North Carolina (2.35%) | | | | | | | | |
| North Carolina Housing Finance Agency | | | | | | | | |
| 6.25%, 01/01/2055 | | $ | 750,000 | | | $ | 819,613 | |
| Total North Carolina | | | | | | | 819,613 | |
| | | | | | | | | |
| North Dakota (1.84%) | | | | | | | | |
| North Dakota Housing Finance Agency | | | | | | | | |
| 4.25%, 01/01/2049 | | | 325,000 | | | | 326,783 | |
| 5.75%, 07/01/2053 | | | 295,000 | | | | 314,028 | |
| Total North Dakota | | | | | | | 640,811 | |
| | | | | | | | | |
| Ohio (0.58%) | | | | | | | | |
| Lancaster Port Authority | | | | | | | | |
| 5.00%, 02/01/2055(b)(d) | | | 190,000 | | | | 203,814 | |
| Total Ohio | | | | | | | 203,814 | |
| | | | | | | | | |
| Oklahoma (1.32%) | | | | | | | | |
| Oklahoma Housing Finance Agency | | | | | | | | |
| 5.00%, 03/01/2052 | | | 445,000 | | | | 461,266 | |
| Total Oklahoma | | | | | | | 461,266 | |
| | | | | | | | | |
| Oregon (1.49%) | | | | | | | | |
| Port of Portland OR Airport Revenue | | | | | | | | |
| 5.00%, 07/01/2036 | | | 200,000 | | | | 217,977 | |
| 4.00%, 07/01/2038 | | | 305,000 | | | | 305,031 | |
| Total Oregon | | | | | | | 523,008 | |
| | | | | | | | | |
| Pennslyvania (2.58%) | | | | | | | | |
| Butler County General Authority | | | | | | | | |
| 3M US SOFR + 0.70%, 10/01/2034(d) | | | 350,000 | | | | 340,122 | |
| Pennsylvania Turnpike Commission | | | | | | | | |
| 0.00%, 12/01/2037(c) | | | 570,000 | | | | 557,799 | |
| Total Pennslyvania | | | | | | | 897,921 | |
| | | | | | | | | |
| South Carolina (3.40%) | | | | | | | | |
| South Carolina State Housing Finance & Development Authority | | | | | | | | |
| 5.75%, 01/01/2054 | | | 150,000 | | | | 163,264 | |
| 6.00%, 01/01/2054 | | | 930,000 | | | | 1,024,155 | |
| Total South Carolina | | | | | | | 1,187,419 | |
| | | | | | | | | |
| South Dakota (0.45%) | | | | | | | | |
| South Dakota Housing Development Authority | | | | | | | | |
| 6.00%, 05/01/2054 | | | 145,000 | | | | 155,704 | |
| Total South Dakota | | | | | | | 155,704 | |
| Security Description | | Principal
Amount | | | Value | |
| Revenue Bonds (continued) | | | | | | | | |
| Tennessee (0.94%) | | | | | | | | |
| New Memphis Arena Public Building Authority | | | | | | | | |
| 0.00%, 04/01/2030(c) | | $ | 350,000 | | | $ | 329,687 | |
| Total Tennessee | | | | | | | 329,687 | |
| | | | | | | | | |
| Texas (6.61%) | | | | | | | | |
| City of Austin TX Airport System Revenue | | | | | | | | |
| 5.00%, 11/15/2036 | | | 200,000 | | | | 216,170 | |
| City of Houston TX Airport System Revenue | | | | | | | | |
| 5.00%, 07/01/2036 | | | 135,000 | | | | 146,825 | |
| Texas Department of Housing & Community Affairs | | | | | | | | |
| 2.15%, 07/01/2037 | | | 215,000 | | | | 171,684 | |
| 3.50%, 07/01/2052 | | | 415,000 | | | | 410,080 | |
| Texas Municipal Gas Acquisition & Supply Corp. V | | | | | | | | |
| 5.00%, 01/01/2055(b) | | | 320,000 | | | | 347,642 | |
| Texas Municipal Gas Acquisition and Supply Corp. I | | | | | | | | |
| 3M US SOFR + 0.70%, 12/15/2026(d) | | | 480,000 | | | | 480,280 | |
| 6.25%, 12/15/2026 | | | 35,000 | | | | 35,901 | |
| Texas Municipal Gas Acquisition and Supply Corp. II | | | | | | | | |
| 3M US SOFR + 1.06%, 09/15/2027(d) | | | 330,000 | | | | 331,383 | |
| 3M US SOFR + 0.86%, 09/15/2027(d) | | | 165,000 | | | | 165,037 | |
| Total Texas | | | | | | | 2,305,002 | |
| | | | | | | | | |
| Virginia (3.30%) | | | | | | | | |
| City of Norfolk VA Water Revenue | | | | | | | | |
| 5.00%, 11/01/2033(b) | | | 300,000 | | | | 340,759 | |
| Freddie Mac Multifamily ML Certificates | | | | | | | | |
| 4.55%, 10/25/2040(d) | | | 149,530 | | | | 156,016 | |
| 4.16%, 05/25/2041(b)(d) | | | 349,379 | | | | 350,195 | |
| York County Economic Development Authority | | | | | | | | |
| 3.65%, 05/01/2033(d) | | | 300,000 | | | | 305,025 | |
| Total Virginia | | | | | | | 1,151,995 | |
| | | | | | | | | |
| Washington (1.27%) | | | | | | | | |
| County of King WA Sewer Revenue | | | | | | | | |
| 7D US MUNI + 0.23%, 01/01/2040(d) | | | 115,000 | | | | 113,899 | |
| Port of Seattle WA | | | | | | | | |
| 5.00%, 04/01/2027 | | | 250,000 | | | | 250,164 | |
ALPS Intermediate Municipal Bond ETF
| Schedule of Investments | November 30, 2024 |
| Security Description | | Principal
Amount | | | Value | |
| Revenue Bonds (continued) | | | | | | | | |
| Washington Health Care Facilities Authority | | | | | | | | |
| 4.00%, 10/01/2042(d) | | $ | 75,000 | | | $ | 76,811 | |
| Total Washington | | | | | | | 440,874 | |
| | | | | | | | | |
| Wisconsin (2.24%) | | | | | | | | |
| County of Milwaukee WI Airport Revenue | | | | | | | | |
| 5.00%, 12/01/2030 | | | 125,000 | | | | 128,314 | |
| Public Finance Authority | | | | | | | | |
| 3.70%, 10/01/2046(d) | | | 455,000 | | | | 458,373 | |
| Wisconsin Health & Educational Facilities Authority | | | | | | | | |
| 4.00%, 11/15/2043 | | | 200,000 | | | | 196,344 | |
| Total Wisconsin | | | | | | | 783,031 | |
| | | | | | | | | |
| Wyoming (2.85%) | | | | | | | | |
| Wyoming Community Development Authority | | | | | | | | |
| 3.50%, 06/01/2052 | | | 1,000,000 | | | | 995,698 | |
| Total Wyoming | | | | | | | 995,698 | |
| | | | | | | | | |
| Total Revenue Bonds | | | | | | | 27,582,464 | |
| | | | | | | | | |
| TOTAL MUNICIPAL BONDS | | | | | | | | |
| (Cost $33,670,531) | | | | | | | 34,342,299 | |
| | | 7 Day Yield | | | Shares | | | Value | |
| SHORT TERM INVESTMENTS (0.32%) | | | | | | | | | | | | |
| Money Market Fund | | | | | | | | | | | | |
| State Street Institutional US Government Money Market Fund (Premier Class) | | | 4.599 | % | | | 110,818 | | | | 110,818 | |
| | | | | | | | | | | | | |
| TOTAL SHORT TERM INVESTMENTS | | | | | | | |
| (Cost $110,818) | | | | | | 110,818 | |
| | | | | | | | | | | | | |
| TOTAL INVESTMENTS (104.11%) | | | | | | | |
| (Cost $35,659,674) | | | | | $ | 36,331,625 | |
| LIABILITIES IN EXCESS OF OTHER ASSETS (-4.11%) | | | | | | (1,435,607 | ) |
| NET ASSETS - 100.00% | | | | | $ | 34,896,018 | |
Investment Abbreviations:
SOFR - Secured Overnight Financing Rate
Reference Rates:
1D US SOFR - 1 Day SOFR as of November 30, 2024 was 4.59%
7D US MUNI- SIFMA Municipal Swap Index Yield as of November 30, 2024 was 2.86%
3M US SOFR - 3 Month SOFR as of November 30, 2024 was 4.47%
| (a) | As a result of the use of significant unobservable inputs to determine fair value, these investments have been classified as Level 3 securities under the fair value hierarchy. |
| (b) | Represents a security purchased on a when-issued basis. |
| (d) | Floating or variable rate security. Interest rate resets periodically on specific dates. The rate shown represents the coupon or interest rate in effect as of November 30, 2024. Security description includes the reference rate and spread if published and available. |
See Notes to Financial Statements and Financial Highlights.
ALPS Intermediate Municipal Bond ETF
| Statement of Assets and Liabilities | November 30, 2024 |
| ASSETS: | | | |
| Investments, at value | | $ | 36,331,625 | |
| Interest receivable | | | 299,765 | |
| Total Assets | | | 36,631,390 | |
| | | | | |
| LIABILITIES: | | | | |
| Payable for investments purchased | | | 1,721,390 | |
| Payable to adviser | | | 13,982 | |
| Total Liabilities | | | 1,735,372 | |
| NET ASSETS | | $ | 34,896,018 | |
| | | | | |
| NET ASSETS CONSIST OF: | | | | |
| Paid-in capital | | $ | 34,084,724 | |
| Total distributable earnings/(accumulated losses) | | | 811,294 | |
| NET ASSETS | | $ | 34,896,018 | |
| | | | | |
| INVESTMENTS, AT COST | | $ | 35,659,674 | |
| | | | | |
| PRICING OF SHARES | | | | |
| Net Assets | | $ | 34,896,018 | |
| Shares of beneficial interest outstanding (Unlimited number of shares authorized, par value $0.01 per share) | | | 1,350,002 | |
| Net Asset Value, offering and redemption price per share | | $ | 25.85 | |
See Notes to Financial Statements and Financial Highlights.
ALPS Intermediate Municipal Bond ETF
| Statement of Operations | For the Year Ended November 30, 2024 |
| INVESTMENT INCOME: | | | |
| Interest | | $ | 1,278,794 | |
| Dividend Income | | | 4,497 | |
| Total investment income | | | 1,283,291 | |
| | | | | |
| EXPENSES: | | | | |
| Investment adviser fees | | | 163,193 | |
| Other expenses | | | 1,375 | |
| Net expenses | | | 164,568 | |
| NET INVESTMENT INCOME | | | 1,118,723 | |
| | | | | |
| REALIZED AND UNREALIZED GAIN/(LOSS): | | | | |
| Net realized gain on investments | | | 137,317 | |
| Net change in unrealized appreciation on investments | | | 484,514 | |
| NET REALIZED AND UNREALIZED GAIN ON INVESTMENTS | | | 621,831 | |
| NET INCREASE IN NET ASSETS RESULTING FROM OPERATIONS | | $ | 1,740,554 | |
See Notes to Financial Statements and Financial Highlights.
ALPS Intermediate Municipal Bond ETF
Statements of Changes in Net Assets
| | | For the
Year Ended
November 30,
2024 | | | For the
Year Ended
November 30,
2023 | |
| OPERATIONS: | | | | | | | | |
| Net investment income | | $ | 1,118,723 | | | $ | 1,016,296 | |
| Net realized gain | | | 137,317 | | | | 68,236 | |
| Net change in unrealized appreciation | | | 484,514 | | | | 375,330 | |
| Net increase in net assets resulting from operations | | | 1,740,554 | | | | 1,459,862 | |
| | | | | | | | | |
| DISTRIBUTIONS TO SHAREHOLDERS: | | | | | | | | |
| From distributable earnings | | | (1,187,091 | ) | | | (1,244,614 | ) |
| Total distributions | | | (1,187,091 | ) | | | (1,244,614 | ) |
| | | | | | | | | |
| CAPITAL SHARE TRANSACTIONS: | | | | | | | | |
| Proceeds from sale of shares | | | 3,207,954 | | | | – | |
| Net increase from capital share transactions | | | 3,207,954 | | | | – | |
| Net increase in net assets | | | 3,761,417 | | | | 215,248 | |
| | | | | | | | | |
| NET ASSETS: | | | | | | | | |
| Beginning of year | | | 31,134,601 | | | | 30,919,353 | |
| End of year | | $ | 34,896,018 | | | $ | 31,134,601 | |
| | | | | | | | | |
| OTHER INFORMATION: | | | | | | | | |
| CAPITAL SHARE TRANSACTIONS: | | | | | | | | |
| Beginning shares | | | 1,225,002 | | | | 1,225,002 | |
| Shares sold | | | 125,000 | | | | – | |
| Shares outstanding, end of year | | | 1,350,002 | | | | 1,225,002 | |
See Notes to Financial Statements and Financial Highlights.
ALPS Intermediate Municipal Bond ETF
| Financial Highlights | For a Share Outstanding Throughout the Periods Presented |
| | | For the Year
Ended
November 30,
2024 | | | For the Year
Ended
November 30,
2023 | | | For the Period
May 19, 2022
(Commencement
of Operations) to
November 30,
2022 | |
| NET ASSET VALUE, BEGINNING OF PERIOD | | $ | 25.42 | | | $ | 25.24 | | | $ | 25.00 | |
| | | | | | | | | | | | | |
| INCOME FROM OPERATIONS: | | | | | | | | | | | | |
| Net investment income(a) | | | 0.88 | | | | 0.85 | | | | 0.36 | |
| Net realized and unrealized gain | | | 0.49 | | | | 0.34 | | | | 0.23 | |
| Total from investment operations | | | 1.37 | | | | 1.19 | | | | 0.59 | |
| | | | | | | | | | | | | |
| DISTRIBUTIONS: | | | | | | | | | | | | |
| From net investment income | | | (0.88 | ) | | | (1.01 | ) | | | (0.35 | ) |
| From net realized gains | | | (0.06 | ) | | | – | | | | – | |
| Total distributions | | | (0.94 | ) | | | (1.01 | ) | | | (0.35 | ) |
| | | | | | | | | | | | | |
| NET INCREASE IN NET ASSET VALUE | | | 0.43 | | | | 0.18 | | | | 0.24 | |
| NET ASSET VALUE, END OF PERIOD | | $ | 25.85 | | | $ | 25.42 | | | $ | 25.24 | |
| TOTAL RETURN(b) | | | 5.46 | % | | | 4.85 | % | | | 2.38 | % |
| | | | | | | | | | | | | |
| RATIOS/SUPPLEMENTAL DATA: | | | | | | | | | | | | |
| Net assets, end of period (in 000s) | | $ | 34,896 | | | $ | 31,135 | | | $ | 30,919 | |
| | | | | | | | | | | | | |
| RATIOS TO AVERAGE NET ASSETS | | | | | | | | | | | | |
| Ratio of expenses to average net assets | | | 0.50 | % | | | 0.50 | % | | | 0.50 | %(c) |
| Ratio of net investment income to average net assets | | | 3.43 | % | | | 3.28 | % | | | 2.67 | %(c) |
| Portfolio turnover rate(d) | | | 98 | %(e) | | | 129 | %(e) | | | 75 | % |
| (a) | Based on average shares outstanding during the period. |
| (b) | Total return is calculated assuming an initial investment made at the net asset value at the beginning of the period and redemption at the net asset value on the last day of the period and assuming all distributions are reinvested at the reinvestment prices. Total return calculated for a period of less than one year is not annualized. |
| (d) | Portfolio turnover for periods less than one year are not annualized and does not include securities received or delivered from processing creations or redemptions in-kind. |
| (e) | The portfolio turnover rate excluding variable rate demand notes was 27% during the year ended November 30, 2024, and 50% during the year ended November 30, 2023. |
See Notes to Financial Statements and Financial Highlights.
ALPS Intermediate Municipal Bond ETF
| Notes to Financial Statements and Financial Highlights | November 30, 2024 |
1. ORGANIZATION
ALPS ETF Trust (the “Trust”), a Delaware statutory trust, is an open-end management investment company registered under the Investment Company Act of 1940, as amended (the “1940 Act”). As of November 30, 2024, the Trust consisted of twenty-three separate portfolios. Each portfolio represents a separate series of the Trust. This report pertains solely to the ALPS Intermediate Municipal Bond ETF (the “Fund”). The investment objective of the Fund is to protect investor’s capital and generate attractive risk-adjusted returns. The Fund has elected to qualify as a diversified series of the Trust under the 1940 Act.
The Fund’s Shares (“Shares”) are listed on the NYSE Arca, Inc. (the “NYSE Arca”). The Fund issues and redeems Shares, at net asset value (“NAV”) in blocks of 25,000 Shares, each of which is called a “Creation Unit”. Creation Units are issued and redeemed principally in-kind for securities. Except when aggregated in Creation Units, Shares are not redeemable securities of the Fund.
Pursuant to the Trust’s organizational documents, its Officers and Trustees are indemnified against certain liability arising out of the performance of their duties to the Trust. Additionally, in the normal course of business, the Trust enters into contracts with service providers that contain general indemnification clauses. The Trust’s maximum exposure under these arrangements is unknown, as this would involve future claims that may be made against the Trust that have not yet occurred.
2. SIGNIFICANT ACCOUNTING POLICIES
The following is a summary of significant accounting policies consistently followed by the Fund in the preparation of the financial statements. The accompanying financial statements were prepared in accordance with accounting principles generally accepted in the United States of America (“U.S. GAAP”). The preparation of financial statements in conformity with U.S. GAAP requires management to make certain estimates and assumptions that affect the reported amounts of assets and liabilities and disclosures of contingent assets and liabilities at the date of the financial statements and the reported amounts of revenue and expenses during the period. Actual results could differ from those estimates. The Fund is considered an investment company under U.S. GAAP and follows the accounting and reporting guidance applicable to investment companies in the Financial Accounting Standards Board (“FASB”) Accounting Standards Codification Topic 946.
A. Portfolio Valuation
The Fund’s NAV is determined daily, as of the close of regular trading on the New York Stock Exchange (the "NYSE"), normally 4:00 p.m. Eastern Time, on each day the NYSE is open for trading. The NAV is computed by dividing the value of all assets of the Fund (including accrued interest and dividends), less all liabilities (including accrued expenses and dividends declared but unpaid), by the total number of shares outstanding.
Portfolio securities listed on any exchange other than the NASDAQ Stock Market LLC (“NASDAQ”) are valued at the last sale price on the business day as of which such value is being determined. If there has been no sale on such day, the securities are valued at the mean of the most recent bid and ask prices on such day. Securities traded on the NASDAQ are valued at the NASDAQ Official Closing Price as determined by NASDAQ. Portfolio securities traded on more than one securities exchange are valued at the last sale price on the business day as of which such value is being determined at the close of the exchange representing the principal market for such securities. Portfolio securities traded in the over-the-counter market, but excluding securities traded on the NASDAQ, are valued at the last quoted sale price in such market.
The market price for debt securities is generally the evaluated price supplied by an independent third-party pricing service approved by the Board, which references a combination of transactions and quotations for the same or other securities believed to be comparable in quality, coupon, maturity, type of issue, call provisions, trading characteristics and other features deemed to be relevant. To the extent the Fund’s debt securities are valued based on price quotations or other equivalent indications of value provided by a third-party pricing service, any such third-party pricing service may use a variety of methodologies to value some or all of the Fund’s debt securities to determine the market price.
The Fund’s investments are valued at market value or, in the absence of market value with respect to any portfolio securities, at fair value according to procedures adopted by the Trust’s Board. Pursuant to Rule 2a-5 under the 1940 Act, the Board of Trustees designated ALPS Advisors, Inc. (the “Adviser”) as the valuation designee ("Valuation Designee") for the Fund to perform the fair value determinations relating to all Fund investments. The Adviser may carry out its designated responsibilities as Valuation Designee through various teams and committees. When market quotations are not readily available or when events occur that make established valuation methods unreliable, securities of the Fund may be valued in good faith by the Valuation Designee. These securities generally include, but are not limited to, restricted securities (securities which may not be publicly sold without registration under the Securities Act of 1933) for which a pricing service is unable to provide a market price; securities whose trading has been formally suspended; a security whose market price is not available from a pre-established primary pricing source or the pricing source is not willing to provide a price; a security with respect to which an event has occurred that is most likely to materially affect the value of the security after the market has closed but before the calculation of the Fund’s NAV or make it difficult or impossible to obtain a reliable market quotation; or a security whose price, as provided by the pricing service, does not reflect the security’s “fair value” due to the security being de-listed from a national exchange or the security’s primary trading market is temporarily closed at a time when, under normal conditions, it would be open. As a general principle, the current “fair value” of a security would be the amount which the owner might reasonably expect to receive from the sale on the applicable exchange or principal market. A variety of factors may be considered in determining the fair value of such securities.
ALPS Intermediate Municipal Bond ETF
| Notes to Financial Statements and Financial Highlights | November 30, 2024 |
B. Fair Value Measurements
The Fund discloses the classification of its fair value measurements following a three-tier hierarchy based on the inputs used to measure fair value. Inputs refer broadly to the assumptions that market participants would use in pricing the asset or liability, including assumptions about risk. Inputs may be observable or unobservable. Observable inputs reflect the assumptions market participants would use in pricing the asset or liability that are developed based on market data obtained from sources independent of the reporting entity. Unobservable inputs reflect the reporting entity’s own assumptions about the assumptions market participants would use in pricing the asset or liability that are developed based on the best information available.
Valuation techniques used to value the Fund’s investments by major category are as follows:
Equity securities, including restricted securities, for which market quotations are readily available, are valued at the last reported sale price or official closing price as reported by a third party pricing vendor on the primary market or exchange on which they are traded and are categorized as Level 1 in the hierarchy. In the event there were no sales during the day or closing prices are not available, securities are valued at the mean of the most recent quoted bid and ask prices on such day and are generally categorized as Level 2 in the hierarchy. Investments in open-end mutual funds are valued at their closing NAV each business day and are categorized as Level 1 in the hierarchy.
Debt securities, including restricted securities, are valued based on evaluated prices received from third party pricing vendors or from brokers who make markets in such securities. For municipal bonds, pricing vendors utilize matrix pricing which considers yield or price of bonds of comparable quality, coupon, maturity and type as well as broker-supplied prices. When independent prices are unavailable or unreliable, debt securities may be valued utilizing pricing methodologies which consider similar factors that would be used by third party pricing vendors. Debt securities are generally categorized as Level 2 in the hierarchy but may be Level 3 depending on the circumstances.
Changes in valuation techniques may result in transfers in or out of an assigned level within the disclosure hierarchy.
Various inputs are used in determining the value of the Fund’s investments as of the end of the reporting period. When inputs used fall into different levels of the fair value hierarchy, the level in the hierarchy within which the fair value measurement falls is determined based on the lowest level input that is significant to the fair value measurement in its entirety. The designated input levels are not necessarily an indication of the risk or liquidity associated with these investments.
These inputs are categorized in the following hierarchy under applicable financial accounting standards:
| Level 1 – | Unadjusted quoted prices in active markets for identical investments, unrestricted assets or liabilities that a Fund has the ability to access at the measurement date; |
| Level 2 – | Quoted prices which are not active, quoted prices for similar assets or liabilities in active markets or inputs other than quoted prices that are observable (either directly or indirectly) for substantially the full term of the asset or liability; and |
| Level 3 – | Significant unobservable prices or inputs (including the Fund’s own assumptions in determining the fair value of investments) where there is little or no market activity for the asset or liability at the measurement date. |
ALPS Intermediate Municipal Bond ETF
| Notes to Financial Statements and Financial Highlights | November 30, 2024 |
The following is a summary of the inputs used to value the Fund’s investments as of November 30, 2024:
ALPS Intermediate Municipal Bond ETF
| Investments in Securities at Value | | Level 1 - Quoted and
Unadjusted Prices | | | Level 2 - Other Significant
Observable Inputs | | | Level 3 - Significant
Unobservable Inputs | | | Total | |
| Commercial Paper* | | $ | – | | | $ | – | | | $ | 395,000 | | | $ | 395,000 | |
| Government Bonds* | | | – | | | | 1,483,508 | | | | – | | | | 1,483,508 | |
| Municipal Bonds* | | | – | | | | 34,342,299 | | | | – | | | | 34,342,299 | |
| Short Term Investments | | | 110,818 | | | | – | | | | – | | | | 110,818 | |
| Total | | $ | 110,818 | | | $ | 35,825,807 | | | $ | 395,000 | | | $ | 36,331,625 | |
| * | For a detailed breakdown of sectors, see the accompanying Schedule of Investments. |
The Fund purchased one security that used the significant unobservable input (Level 3) of cost in determining fair value during the year ended November 30, 2024.
C. Securities Transactions and Investment Income
Securities transactions are recorded as of the trade date. Realized gains and losses from securities transactions are recorded on the specific identification in accordance with GAAP. Dividend income and capital gains distributions, if any, are recorded on the ex-dividend date. Interest income, if any, is recorded on the accrual basis, including amortization of premiums and accretion of discounts.
D. Dividends and Distributions to Shareholders
Dividends from net investment income of the Fund, if any, are declared and paid monthly or as the Board may determine from time to time.
Distributions of net realized capital gains earned by the Fund, if any, are distributed at least annually.
E. Federal Tax and Tax Basis Information
The timing and character of income and capital gain distributions are determined in accordance with income tax regulations, which may differ from U.S. GAAP. Reclassifications are made to the Fund’s capital accounts for permanent tax differences to reflect income and gains available for distribution (or available capital loss carryforwards) under income tax regulations. For the fiscal year ended November 30, 2024, there were no reclassifications between Paid-in-Capital and Total Distributable Earnings.
The tax character of the distributions paid during the fiscal year ended November 30, 2024 and fiscal year ended November 30, 2023 was as follows:
| Fund | | Ordinary
Income | | | Tax-Exempt
Income | | | Short-Term
Capital Gain | | | Long-Term
Capital Gain | | | Return of
Capital | |
| November 30, 2024 | | | | | | | | | | | | | | | | | | | | |
| ALPS Intermediate Municipal Bond ETF | | $ | 253,915 | | | $ | 933,176 | | | $ | – | | | $ | – | | | $ | – | |
| Fund | | Ordinary
Income | | | Tax-Exempt
Income | | | Short-Term
Capital Gain | | | Long-Term
Capital Gain | | | Return of
Capital | |
| November 30, 2023 | | | | | | | | | | | | | | | | | | | | |
| ALPS Intermediate Municipal Bond ETF | | $ | 446,400 | | | $ | 798,214 | | | $ | – | | | $ | – | | | $ | – | |
The character of distributions made during the period may differ from its ultimate characterization for federal income tax purposes.
Under current law, capital losses maintain their character as short-term or long-term and are carried forward to the next tax year without expiration. As of November 30, 2024, the Fund did not have any amounts available to carry forward to the next tax year.
ALPS Intermediate Municipal Bond ETF
| Notes to Financial Statements and Financial Highlights | November 30, 2024 |
As of November 30, 2024, the components of distributable earnings on a tax basis were as follows:
| Fund | | Undistributed
Ordinary
Income | | | Tax-Exempt
Undistributed
Income | | | Accumulated Net
Realized Gain/(Loss) on
Investments | | | Net Unrealized
Appreciation/(Depreciation)
on Investments | | | Total | |
| ALPS Intermediate Municipal Bond ETF | | $ | 19,226 | | | $ | 1,804 | | | $ | 118,431 | | | $ | 671,833 | | | $ | 811,294 | |
As of November 30, 2024, the cost of investments for federal income tax purposes and accumulated net unrealized appreciation/(depreciation) on investments were as follows:
| | | ALPS Intermediate
Municipal Bond ETF | |
| Gross appreciation (excess of value over tax cost) | | $ | 760,690 | |
| Gross depreciation (excess of tax cost over value) | | | (88,857 | ) |
| Net unrealized appreciation/(depreciation) | | $ | 671,833 | |
| Cost of investments for income tax purposes | | $ | 35,659,792 | |
The differences between book-basis and tax-basis are primarily due to the deferral of losses from wash sales.
G. Income Taxes
No provision for income taxes is included in the accompanying financial statements, as the Fund intends to distribute to shareholders all taxable investment income and realized gains and otherwise comply with Subchapter M of the Internal Revenue Code of 1986, as amended, applicable to regulated investment companies. The Fund evaluates tax positions taken (or expected to be taken) in the course of preparing the Fund’s tax returns to determine whether these positions meet a “more-likely-than-not” standard that, based on the technical merits, have a more than fifty percent likelihood of being sustained by a taxing authority upon examination. A tax position that meets the “more-likely-than-not” recognition threshold is measured to determine the amount of benefit to recognize in the financial statements.
As of and during the fiscal year ended November 30, 2024, the Fund did not have a liability for any unrecognized tax benefits. The Fund files U.S. federal, state, and local tax returns as required. The Fund’s tax returns are subject to examination by the relevant tax authorities until expiration of the applicable statute of limitations, which is generally three years after the filing of the tax return, but may extend to four years in certain jurisdictions. Tax returns for open years have incorporated no uncertain tax positions that require a provision for income taxes.
3. INVESTMENT ADVISORY FEE AND OTHER AFFILIATED TRANSACTIONS
ALPS Advisors, Inc. serves as the Fund’s investment adviser pursuant to an Investment Advisory Agreement with the Trust on behalf of the Fund (the “Advisory Agreement”). Pursuant to the Advisory Agreement, the Fund pays the Adviser an annual management fee for the services and facilities it provides, payable on a monthly basis at the annual rate of 0.50% of the Fund’s average daily net assets.
Out of the unitary management fee, the Adviser pays substantially all expenses of the Fund, including the cost of sub-advisory, transfer agency, custody, fund administration, legal, audit, trustees and other services, except for acquired fund fees and expenses, interest expenses, distribution fees or expenses, brokerage expenses, taxes and extraordinary expenses not incurred in the ordinary course of the Fund's business. The Adviser’s unitary management fee is designed to pay substantially all of the Fund’s expenses and to compensate the Adviser for providing services to the Fund.
Brown Brothers Harriman & Co. (the “Sub-Adviser”) serves as the Fund's sub-adviser pursuant to a sub-advisory agreement with the Trust (the ‘‘Sub-Advisory Agreement’’). Pursuant to the Sub-Advisory Agreement, the Adviser pays the Sub-Adviser a sub-advisory fee out of the Adviser's advisory fee for the services it provides. The fee is payable on a monthly basis at the annual rate of 0.25% of the Fund's average daily net assets. ALPS Fund Services, Inc., an affiliate of the Adviser, is the administrator of the Fund.
Each Trustee receives (1) a quarterly retainer of $25,000, (2) a per meeting fee of $15,000, (3) $2,500 for any special meeting held outside of a regularly scheduled board meeting, and (4) reimbursement for all reasonable out-of-pocket expenses relating to attendance at meetings. In addition, the Chairman of the Board receives a quarterly retainer of $5,000, the Chairman of the Audit Committee receives a quarterly retainer of $3,000, and the Chairman of the Nominating & Governance Committee receives a quarterly retainer of $2,000, each in connection with their respective roles.
ALPS Intermediate Municipal Bond ETF
| Notes to Financial Statements and Financial Highlights | November 30, 2024 |
4. PURCHASES AND SALES OF SECURITIES
For the year ended November 30, 2024, the cost of purchases and proceeds from sales of investment securities, excluding short-term investments and in-kind transactions, were as follows:
| Fund | | Purchases | | | Sales | |
| ALPS Intermediate Municipal Bond ETF | | $ | 40,220,090 | | | $ | 32,431,023 | |
For the year ended November 30, 2024, there were no in-kind transactions or realized gain/(loss) on in-kind transactions.
5. CAPITAL SHARE TRANSACTIONS
Shares are created and redeemed by the Fund only in Creation Unit size aggregations of 25,000 Shares. Only broker-dealers or large institutional investors with creation and redemption agreements called Authorized Participants (“AP”) are permitted to purchase or redeem Creation Units from the Fund. Such transactions are generally permitted on an in-kind basis, with a balancing cash component to equate the transaction to the NAV per unit of the Fund on the transaction date. Cash may be substituted equivalent to the value of certain securities generally when they are not available in sufficient quantity for delivery, not eligible for trading by the AP or as a result of other market circumstances.
6. MARKET RISK
The Fund is subject to investment and operational risks associated with financial, economic and other global market developments and disruptions, including those arising from war, terrorism, market manipulation, government interventions, defaults and shutdowns, political changes or diplomatic developments, public health emergencies (such as the spread of infectious diseases, pandemics and epidemics) and natural/environmental disasters, which can negatively impact the securities markets and cause the Fund to lose value. Securities in the Fund's portfolio may underperform in comparison to securities in general financial markets, a particular financial market or other asset classes due to a number of factors, including inflation (or expectations for inflation), deflation (or expectations for deflation), interest rates, global demand for particular products or resources, market instability, debt crises and downgrades, embargoes, tariffs, sanctions and other trade barriers, regulatory events, other governmental trade or market control programs and related geopolitical events. In addition, the value of the Fund's investments may be negatively affected by the occurrence of global events such as war, terrorism, environmental disasters, natural disasters or events, country instability, and infectious disease epidemics or pandemics.
7. SUBSEQUENT EVENTS
Subsequent events, if any, after the date of the Statement of Assets and Liabilities have been evaluated through the date the financial statements were issued. Management has determined that there were no subsequent events to report through the issuance of these financial statements.
ALPS Intermediate Municipal Bond ETF
Report of Independent Registered Public Accounting Firm
To the Shareholders of ALPS Intermediate Municipal Bond ETF
and Board of Trustees of ALPS ETF Trust
Opinion on the Financial Statements
We have audited the accompanying statement of assets and liabilities, including the schedule of investments, of ALPS Intermediate Municipal Bond ETF (the “Fund”), a series of ALPS ETF Trust, as of November 30, 2024, the related statement of operations for the year then ended, the statements of changes in net assets and financial highlights for each of the two years in the period then ended, and the related notes (collectively referred to as the “financial statements”). In our opinion, the financial statements present fairly, in all material respects, the financial position of the Fund as of November 30, 2024, the results of its operations for the year then ended, and the changes in net assets and financial highlights for each of the two years in the period then ended, in conformity with accounting principles generally accepted in the United States of America.
The Fund’s financial highlights for the year ended November 30, 2022, was audited by other auditors whose report dated January 27, 2023, expressed an unqualified opinion on those financial highlights.
Basis for Opinion
These financial statements are the responsibility of the Fund’s management. Our responsibility is to express an opinion on the Fund’s financial statements based on our audits. We are a public accounting firm registered with the Public Company Accounting Oversight Board (United States) (“PCAOB”) and are required to be independent with respect to the Fund in accordance with the U.S. federal securities laws and the applicable rules and regulations of the Securities and Exchange Commission and the PCAOB.
We conducted our audits in accordance with the standards of the PCAOB. Those standards require that we plan and perform the audit to obtain reasonable assurance about whether the financial statements are free of material misstatement whether due to error or fraud.
Our audits included performing procedures to assess the risks of material misstatement of the financial statements, whether due to error or fraud, and performing procedures that respond to those risks. Such procedures included examining, on a test basis, evidence regarding the amounts and disclosures in the financial statements. Our procedures included confirmation of securities owned as of November 30, 2024, by correspondence with the custodian and brokers; when replies were not received from brokers, we performed other auditing procedures. Our audits also included evaluating the accounting principles used and significant estimates made by management, as well as evaluating the overall presentation of the financial statements. We believe that our audits provide a reasonable basis for our opinion.
We have served as the auditor of one or more investment companies advised by ALPS Advisors, Inc. since 2013.

COHEN & COMPANY, LTD.
Philadelphia, Pennsylvania
January 29, 2025
ALPS Intermediate Municipal Bond ETF
| Additional Information | November 30, 2024 (Unaudited) |
TAX INFORMATION
The ALPS Intermediate Municipal Bond ETF designates the following as a percentage of taxable ordinary income distributions, or up to the maximum amount allowable, for the calendar year ended December 31, 2023:
| | Qualified Dividend Income | Dividend Received Deduction |
| ALPS Intermediate Municipal Bond ETF | 0% | 0% |
In early 2024, if applicable, shareholders of record received this information for the distributions paid to them by the Funds during the calendar year 2023 via Form 1099. The Funds will notify shareholders in early 2025 of amounts paid to them by the Funds, if any, during the calendar year 2024.
ALPS Intermediate Municipal Bond ETF
Changes in and Disagreements with Accountants for Open-End Management Investment Companies | November 30, 2024 (Unaudited) |
On March 14, 2023, BBD LLP (“BBD”) ceased to serve as the independent registered public accounting firm of the Fund. The Board approved the replacement of BBD as a result of Cohen & Company, Ltd.’s (“Cohen”) acquisition of BBD’s investment management group.
The report of BBD on the financial statements of the Fund as of and for the fiscal year or period ended November 30, 2022 did not contain an adverse opinion or a disclaimer of opinion, and was not qualified or modified as to uncertainties, audit scope or accounting principles. During the fiscal year or period ended November 30, 2022, and during the subsequent interim period through March 14, 2023: (i) there were no disagreements between the registrant and BBD on any matter of accounting principles or practices, financial statement disclosure, or auditing scope or procedure, which disagreements, if not resolved to the satisfaction of BBD, would have caused it to make reference to the subject matter of the disagreements in its report on the financial statements of the Fund for such years or interim period; and (ii) there were no “reportable events,” as defined in Item 304(a)(1)(v) of Regulation S-K under the Securities Exchange Act of 1934, as amended.
On March 7, 2023, upon the recommendation of the Fund’s Audit Committee, the Board approved the appointment of Cohen, effective upon the resignation of BBD, as the Fund’s independent registered public accounting firm for the fiscal year ending November 30, 2023.
During the fiscal year or period ended November 30, 2022, and during the subsequent interim period through March 14, 2023, neither the registrant, nor anyone acting on its behalf, consulted with Cohen on behalf of the Fund regarding the application of accounting principles to a specified transaction (either completed or proposed), the type of audit opinion that might be rendered on the Fund’s financial statements, or any matter that was either: (i) the subject of a "disagreement," as defined in Item 304(a)(1)(iv) of Regulation S-K and the instructions thereto; or (ii) "reportable events," as defined in Item 304(a)(1)(v) of Regulation S-K.
ALPS Intermediate Municipal Bond ETF
Proxy Disclosures
for Open-End Management Investment Companies | November 30, 2024 (Unaudited) |
A Special Meeting of Shareholders of the Funds, each a series of the Trust, was held on July 19, 2024. At the meeting, the following matters were voted on by the Shareholders. The results of the Special Meeting of Shareholders are noted below:
Proposal 1: To elect seven Trustees.
| | Shares Voted in Favor | Shares Voted Against/Withheld or Abstentions | Proposal Approved |
| Mary K. Anstine | 223,143,090 | 2,894,793 | Yes |
| Edmund J. Burke | 223,362,578 | 2,672,643 | Yes |
| Jeremy W. Deems | 221,670,341 | 4,361,535 | Yes |
| Rick A. Pederson | 213,137,140 | 12,259,226 | Yes |
| Joseph F. Keenan | 223,547,500 | 2,483,867 | Yes |
| Susan K. Wold | 223,460,006 | 2,571,857 | Yes |
| Laton Spahr | 223,439,610 | 2,593,995 | Yes |
ALPS Intermediate Municipal Bond ETF
Remuneration Paid to Directors, Officers,
and Others of Open-End Management Investment Companies | November 30, 2024 (Unaudited) |
The following chart provides certain information about the Trustee fees paid by the Trust for the year ended November 30, 2024:
| | | Aggregate Regular
Compensation From the Trust | | | Aggregate Special Compensation
From the Trust | | | Total Compensation
From the Trust | |
| Mary K. Anstine, Trustee | | $ | 162,500 | | | $ | — | | | $ | 162,500 | |
| Edmund J. Burke, Trustee | | | 166,500 | | | | — | | | | 166,500 | |
| Jeremy W. Deems, Trustee | | | 174,500 | | | | — | | | | 174,500 | |
| Rick A. Pederson, Trustee | | | 186,500 | | | | — | | | | 186,500 | |
| Joseph F. Keenan, Trustee | | | 40,000 | | | | — | | | | 40,000 | |
| Susan K. Wold, Trustee | | | 40,000 | | | | — | | | | 40,000 | |
| Laton Spahr, President and Trustee* | | | — | | | | — | | | | — | |
| Total | | $ | 770,000 | | | $ | — | | | $ | 770,000 | |
| * | Mr. Spahr, the President of the Trust, is deemed an “interested person” by virtue of his position as an officer of the Trust and of ALPS Advisors, Inc. |
Officers who are employed by the Adviser receive no compensation or expense reimbursement from the Trust.
ALPS Intermediate Municipal Bond ETF
Statement Regarding Basis
for Approval of Investment Advisory Contract | November 30, 2024 (Unaudited) |
At its meetings held on June 3, 2024 and June 18, 2024, the Board of Trustees of the Trust (the “Board” or the “Trustees”), where each Trustee was not an "interested person" of the Trust within the meaning of the Investment Company Act of 1940, as amended (the “Independent Trustees”), evaluated a proposal to approve the continuance of (i) the Investment Advisory Agreement between the Trust and ALPS Advisors, Inc. (the “Adviser” or “AAI”) with respect to the ALPS Intermediate Municipal Bond ETF ("MNBD" or the "Fund") and (ii) the Investment Sub-Advisory Agreement between the Trust, AAI and Brown Brothers Harriman & Co. (the “Sub-Adviser” or “BBH”) with respect to the Fund (the “BBH Sub-Advisory Agreement”). In evaluating the renewal of the Investment Advisory Agreement with respect to the Fund, the Board, including the Independent Trustees considered various factors, including (i) the nature, extent and quality of the services provided by AAI with respect to the Fund under the Investment Advisory Agreement; (ii) the advisory fees and other expenses paid by the Fund compared to those of similar funds managed by other investment advisers; (iii) the costs of the services provided to the Fund by AAI and the profits realized by AAI and its affiliates from its relationship to the Fund; (iv) the extent to which economies of scale have been or would be realized if and as the assets of the Fund grow and whether fees reflect the economies of scale for the benefit of shareholders; and (v) any additional benefits and other considerations.
With respect to the nature, extent and quality of the services provided by AAI under the Investment Advisory Agreement, the Board considered and reviewed information concerning the services provided under the Investment Advisory Agreement, financial information regarding AAI and its parent company, information describing AAI’s current organization and the background and experience of the persons responsible for the day-to-day management of the Fund.
The Board reviewed information on the performance of the Fund and its applicable benchmark for the 1-, 3-, and 5-year periods, as applicable, and against the appropriate FUSE performance universe. Based on this review, the Board, including the Independent Trustees found that the nature and extent of services provided to the Fund under the Investment Advisory Agreement was appropriate and that the quality of such services was satisfactory.
The Board noted that the advisory fees for the Fund were unitary fees pursuant to which AAI assumes all expenses of the Fund (including the cost of transfer agency, custody, fund administration, legal, audit and other services) other than the payments under the Advisory Agreement, brokerage expenses, taxes, interest, litigation expenses and other extraordinary expenses.
Based on the information available to them, including the Fund-specific summary set forth below, the Board, including the Independent Trustees concluded that the advisory fee rate for the Fund was reasonable under the circumstances and in light of the quality of the services provided.
The Board, including the Independent Trustees considered other benefits available to AAI because of its relationship with the Fund and concluded that the advisory fees were reasonable taking into account any such benefits.
The Board, including the Independent Trustees, also considered with respect to the Fund the information provided by AAI about the costs and profitability of AAI with respect to the Fund, including the asset levels and other factors that influence the profitability and financial viability of the Fund. The Board, including the Independent Trustees reviewed and noted the relatively small size of the Fund and the analysis AAI had conducted to support AAI’s assertion that it was not realizing any economies of scale with respect to the Fund. The Independent Trustees determined that AAI should continue to keep the Board informed on an ongoing basis of any significant developments (e.g., material increases in asset levels) so as to facilitate the Independent Trustees’ evaluation of whether further economies of scale have been achieved.
The Board, including the Independent Trustees, also considered other potential benefits available to AAI because of its relationship with the Fund, known as fall-out benefits.
With respect to the Fund, the Board, including the Independent Trustees, noted the following:
The gross management fee rate for MNBD is higher than the median of its FUSE expense group. MNBD’s net expense ratio is higher than the median of its FUSE expense group.
The Board took into account, among other things, supplemental information provided by the Adviser showing MNBD’s total expenses were in line with the total expenses of peer groups deemed by the Adviser to be more comparable, including peer groups comprised of a broad group of funds that invest in the national municipal bond intermediate term asset class, including comparable ETFs and mutual funds. The Board also considered the comparatively strong performance of the Fund relative to peers over the 1-year period and the Adviser’s assertion that, given the Fund’s current assets, any economies of scale were not yet a material benefit as MNBD seeks further growth.
The Board, including the Independent Trustees, reviewed and noted the relatively small size of MNBD and the analysis AAI had conducted to support AAI’s assertion that it was not realizing any economies of scale with respect to MNBD.
ALPS Intermediate Municipal Bond ETF
Statement Regarding Basis
for Approval of Investment Advisory Contract | November 30, 2024 (Unaudited) |
In voting to renew the Investment Advisory Agreement with AAI, the Board, including the Independent Trustees, concluded that the terms of the Investment Advisory Agreement are reasonable and fair in light of the services to be performed, the fees paid by certain other funds, expenses to be incurred and such other matters as the members of the Board, including the Independent Trustees, considered relevant in the exercise of their reasonable business judgment. The Independent Trustees did not identify any single factor or group of factors as all important or controlling and considered all factors together.
The Board, including the Independent Trustees, discussed the BBH Sub-Advisory Agreement.
In evaluating the BBH Sub-Advisory Agreement, the Board, including the Independent Trustees considered various factors, including (i) the nature, extent and quality of the services provided by BBH with respect to MNBD under the BBH Sub-Advisory Agreement; (ii) the advisory fees and other expenses paid by MNBD compared to those of similar funds managed by other investment advisers; (iii) the profitability to BBH of its sub-advisory relationship with MNBD and the reasonableness of compensation to BBH; (iv) the extent to which economies of scale would be realized if, and as, MNBD’s assets increase, and whether the fee level in the BBH Sub-Advisory Agreement reflects these economies of scale; and (v) any additional benefits and other considerations.
With respect to the nature, extent and quality of the services provided by BBH under the BBH Sub-Advisory Agreement, the Board, including the Independent Trustees considered and reviewed information concerning the services provided under the BBH Sub-Advisory Agreement, MNBD’s performance, financial information regarding BBH, information describing BBH’s current organization and the background and experience of the persons responsible for the day-to-day management of MNBD. Based upon their review, the Board, including the Independent Trustees concluded that BBH was qualified to oversee the portfolio management of BBH and that the services provided by BBH to MNBD are satisfactory. The Board, including the Independent Trustees considered that the contractual sub-advisory fee to be paid to BBH with respect to MNBD was 0.25% of MNBD’s average daily net assets out of a total management fee of 0.50% of MNBD’s average daily net assets.
In reviewing MNBD’s profitability with respect to BBH, the Board, including the Independent Trustees considered the resources involved in managing MNBD.
The Board, including the Independent Trustees also considered other benefits that have been and may be realized by BBH from its relationships with MNBD, known as fall-out benefits.
The Board, including the Independent Trustees considered the extent to which economies of scale may be realized if MNBD’s assets continue to grow in size and whether fee levels reflect a reasonable sharing of such economies of scale for the benefit of the Fund’s investors. The Board, including the Independent Trustees noted that MNBD commenced operations on May 19, 2022 and has not yet achieved scale in terms of assets. The Independent Trustees determined that AAI should continue to keep the Board informed on an ongoing basis of any significant developments (e.g., material increases in asset levels) so as to facilitate the Independent Trustees’ evaluation of whether further economies of scale have been achieved with respect to MNBD.
In voting to approve the BBH Sub-Advisory Agreement, the Board, including the Independent Trustees concluded that the terms of the BBH Sub- Advisory Agreement are reasonable and fair in light of the services performed, expenses incurred and such other matters as the Board, including the Independent Trustees considered relevant in the exercise of their reasonable business judgment. The Board, including the Independent Trustees did not identify any single factor or group of factors as all important or controlling and considered all factors together.

Table of Contents
| Financial Statements and Financial Highlights for Open-End Management Investment Companies | |
| Schedules of Investments | |
| ALPS Clean Energy ETF | 1 |
| ALPS Disruptive Technologies ETF | 3 |
| ALPS Medical Breakthroughs ETF | 5 |
| Statements of Assets and Liabilities | 7 |
| Statements of Operations | 8 |
| Statements of Changes in Net Assets | |
| ALPS Clean Energy ETF | 9 |
| ALPS Disruptive Technologies ETF | 10 |
| ALPS Medical Breakthroughs ETF | 11 |
| Financial Highlights | 12 |
| Notes to Financial Statements and Financial Highlights | 15 |
| Report of Independent Registered Public Accounting Firm | 24 |
| Additional Information | 25 |
| Changes in and Disagreements with Accountants for Open-End Management Investment Companies | 28 |
| Proxy Disclosures for Open-End Management Investment Companies | 29 |
| Remuneration Paid to Directors, Officers, and Others of Open-End Management Investment Companies | 30 |
| Statement Regarding Basis for Approval of Investment Advisory Contract | 31 |
alpsfunds.com
| ALPS Clean Energy ETF | |
| Schedule of Investments | November 30, 2024 |
| Security Description | | Shares | | | Value | |
| COMMON STOCKS (92.92%) | | | | | | | | |
| Consumer Discretionary (15.19%) | | | | | | | | |
| EVgo, Inc.(a)(b) | | | 149,026 | | | $ | 970,159 | |
| Lucid Group, Inc.(a)(b) | | | 1,346,799 | | | | 2,936,022 | |
| Rivian Automotive, Inc.(a) | | | 458,241 | | | | 5,604,287 | |
| Tesla, Inc.(a) | | | 28,775 | | | | 9,931,979 | |
| Total Consumer Discretionary | | | | | | | 19,442,447 | |
| | | | | | | | | |
| Consumer Staples (7.03%) | | | | | | | | |
| Andersons, Inc. | | | 48,057 | | | | 2,294,241 | |
| Darling Ingredients, Inc.(a) | | | 165,016 | | | | 6,688,098 | |
| Total Consumer Staples | | | | | | | 8,982,339 | |
| | | | | | | | | |
| Energy (2.17%) | | | | | | | | |
| Clean Energy Fuels Corp.(a)(b) | | | 249,441 | | | | 768,278 | |
| Green Plains, Inc.(a) | | | 93,384 | | | | 1,008,548 | |
| REX American Resources Corp.(a) | | | 23,013 | | | | 996,693 | |
| Total Energy | | | | | | | 2,773,519 | |
| | | | | | | | | |
| Financials (4.21%) | | | | | | | | |
| HA Sustainable Infrastructure Capital, Inc.(b) | | | 171,881 | | | | 5,390,188 | |
| | | | | | | | | |
| Industrials (18.28%) | | | | | | | | |
| Ameresco, Inc., Class A(a)(b) | | | 47,443 | | | | 1,336,469 | |
| American Superconductor Corp.(a)(b) | | | 54,857 | | | | 1,868,430 | |
| Array Technologies, Inc.(a)(b) | | | 215,896 | | | | 1,448,662 | |
| Ballard Power Systems, Inc.(a)(b) | | | 375,662 | | | | 559,736 | |
| ChargePoint Holdings, Inc.(a)(b) | | | 582,003 | | | | 710,044 | |
| Eos Energy Enterprises, Inc.(a)(b) | | | 314,674 | | | | 928,288 | |
| Fluence Energy, Inc.(a)(b) | | | 92,903 | | | | 1,747,505 | |
| NEXTracker, Inc.(a) | | | 175,263 | | | | 6,688,037 | |
| Nikola Corp.(a)(b) | | | 71,823 | | | | 144,364 | |
| Plug Power, Inc.(a)(b) | | | 1,302,366 | | | | 2,917,300 | |
| Shoals Technologies Group, Inc., Class A(a) | | | 251,428 | | | | 1,312,454 | |
| Sunrun, Inc.(a)(b) | | | 322,500 | | | | 3,718,425 | |
| Total Industrials | | | | | | | 23,379,714 | |
| | | | | | | | | |
| Information Technology (14.83%) | | | | | | | | |
| Enphase Energy, Inc.(a) | | | 55,730 | | | | 3,976,336 | |
| First Solar, Inc.(a) | | | 29,042 | | | | 5,787,199 | |
| Itron, Inc.(a) | | | 62,594 | | | | 7,419,267 | |
| Wolfspeed, Inc.(a)(b) | | | 187,434 | | | | 1,795,618 | |
| Total Information Technology | | | | | | | 18,978,420 | |
| | | | | | | | | |
| Materials (14.25%) | | | | | | | | |
| Albemarle Corp.(b) | | | 78,845 | | | | 8,491,607 | |
| Security Description | | Shares | | | Value | |
| Materials (continued) | | | | | | | | |
| Arcadium Lithium PLC, Class A(a) | | | 1,539,493 | | | $ | 8,082,338 | |
| Aspen Aerogels, Inc.(a)(b) | | | 111,750 | | | | 1,653,900 | |
| Total Materials | | | | | | | 18,227,845 | |
| | | | | | | | | |
| Utilities (16.96%) | | | | | | | | |
| Boralex, Inc., Class A(b) | | | 151,713 | | | | 3,266,048 | |
| Clearway Energy, Inc., Class C | | | 121,218 | | | | 3,574,719 | |
| Innergex Renewable Energy, Inc.(b) | | | 240,604 | | | | 1,500,284 | |
| Northland Power, Inc.(b) | | | 382,741 | | | | 5,552,280 | |
| Ormat Technologies, Inc.(b) | | | 83,276 | | | | 6,796,987 | |
| Sunnova Energy International, Inc.(a)(b) | | | 181,908 | | | | 1,007,770 | |
| Total Utilities | | | | | | | 21,698,088 | |
| | | | | | | | | |
| TOTAL COMMON STOCKS | | | | | | | | |
| (Cost $271,521,966) | | | | | | | 118,872,560 | |
| Security Description | | Shares | | | Value | |
| MASTER LIMITED PARTNERSHIPS (6.97%) | |
| Utilities (6.97%) | | | | | | | | |
| Brookfield Renewable Partners LP | | | 249,560 | | | $ | 6,482,981 | |
| NextEra Energy Partners LP | | | 139,047 | | | | 2,429,151 | |
| Total Utilities | | | | | | | 8,912,132 | |
| | | | | | | | | |
| TOTAL MASTER LIMITED PARTNERSHIPS | | |
| (Cost $15,998,652) | | | | | | | 8,912,132 | |
| ALPS Clean Energy ETF | |
| Schedule of Investments | November 30, 2024 |
| | | 7 Day Yield | | | Shares | | | Value | |
| SHORT TERM INVESTMENTS (9.95%) | | | | | | | | | |
| Money Market Fund (0.02%) |
| State Street Institutional Treasury Plus Money Market Fund (Premier Class) | | | | | | | | | | | | |
| (Cost $22,287) | | | 4.59 | % | | | 22,287 | | | $ | 22,287 | |
| | | | | | | | | | | | | |
| Investments Purchased with Collateral from Securities Loaned (9.93%) | | | | |
| State Street Navigator Securities Lending Government Money Market Portfolio, 4.63% | | | | | | | | | | | | |
| (Cost $12,700,867) | | | | | | | 12,700,867 | | | $ | 12,700,867 | |
| TOTAL SHORT TERM INVESTMENTS | | | |
| | | | | | | | | | | | | |
| (Cost $12,723,154) | | | | | | | | | | | 12,723,154 | |
| | | | | | | | | | | | | |
| TOTAL INVESTMENTS (109.85%) | | | |
| (Cost $300,243,772) | | | | | | | | | | $ | 140,507,846 | |
| LIABILITIES IN EXCESS OF OTHER ASSETS (-9.85%) | | (12,596,966 | ) |
| NET ASSETS - 100.00% | | | | | | | | | | $ | 127,910,880 | |
| (a) | Non-income producing security. |
| (b) | Security, or a portion of the security position is currently on loan. The total market value of securities on loan is $31,878,093. |
See Notes to Financial Statements and Financial Highlights.
ALPS Disruptive Technologies ETF
| Schedule of Investments | November 30, 2024 |
| Security Description | | Shares | | | Value | |
| COMMON STOCKS (98.85%) | | | | | | | | |
| Communication Services (1.17%) | | | | | | | | |
| Netflix, Inc.(a) | | | 1,231 | | | $ | 1,091,663 | |
| | | | | | | | | |
| Consumer Discretionary (3.41%) | | | | | | | | |
| ADT, Inc. | | | 122,054 | | | | 930,051 | |
| Garmin, Ltd. | | | 4,621 | | | | 982,425 | |
| Tesla, Inc.(a) | | | 3,674 | | | | 1,268,118 | |
| Total Consumer Discretionary | | | | | | | 3,180,594 | |
| | | | | | | | | |
| Financials (15.51%) | | | | | | | | |
| Adyen NV(a)(b)(c) | | | 587 | | | | 855,036 | |
| American Express Co. | | | 3,310 | | | | 1,008,491 | |
| Block, Inc., Class A(a) | | | 13,269 | | | | 1,174,970 | |
| Corpay, Inc.(a) | | | 2,758 | | | | 1,051,294 | |
| Fidelity National Information | | | | | | | | |
| Services, Inc. | | | 10,025 | | | | 855,133 | |
| Fiserv, Inc.(a) | | | 4,865 | | | | 1,074,970 | |
| Global Payments, Inc. | | | 7,725 | | | | 918,966 | |
| GMO Payment Gateway, Inc.(d) | | | 13,100 | | | | 690,395 | |
| Jack Henry & Associates, Inc. | | | 4,815 | | | | 848,307 | |
| LendingTree, Inc.(a)(d) | | | 15,525 | | | | 686,360 | |
| Mastercard, Inc., Class A | | | 1,719 | | | | 916,124 | |
| Moody's Corp. | | | 1,764 | | | | 881,965 | |
| Pagseguro Digital, Ltd., Class A(a)(d) | | | 93,325 | | | | 685,006 | |
| PayPal Holdings, Inc.(a) | | | 12,005 | | | | 1,041,674 | |
| S&P Global, Inc. | | | 1,628 | | | | 850,646 | |
| Visa, Inc., Class A | | | 2,960 | | | | 932,637 | |
| Total Financials | | | | | | | 14,471,974 | |
| | | | | | | | | |
| Health Care (11.77%) | | | | | | | | |
| Align Technology, Inc.(a) | | | 3,691 | | | | 859,154 | |
| Boston Scientific Corp.(a) | | | 10,078 | | | | 913,671 | |
| Dexcom, Inc.(a) | | | 12,272 | | | | 957,093 | |
| DiaSorin SpA(d) | | | 7,466 | | | | 834,728 | |
| Globus Medical, Inc.(a) | | | 12,055 | | | | 1,032,030 | |
| HealthEquity, Inc.(a) | | | 11,032 | | | | 1,120,189 | |
| Hologic, Inc.(a) | | | 10,500 | | | | 834,750 | |
| Insulet Corp.(a) | | | 3,665 | | | | 977,749 | |
| Intuitive Surgical, Inc.(a) | | | 1,711 | | | | 927,362 | |
| PROCEPT BioRobotics Corp.(a) | | | 10,507 | | | | 1,004,364 | |
| ResMed, Inc. | | | 3,369 | | | | 838,948 | |
| Smith & Nephew PLC, Sponsored ADR(d) | | | 26,942 | | | | 694,565 | |
| Total Health Care | | | | | | | 10,994,603 | |
| | | | | | | | | |
| Industrials (15.75%) | | | | | | | | |
| AeroVironment, Inc.(a)(d) | | | 4,552 | | | | 885,364 | |
| AutoStore Holdings, Ltd.(a)(b)(c) | | | 957,049 | | | | 1,072,253 | |
| Security Description | | Shares | | | Value | |
| Industrials (continued) | | | | | | | | |
| Experian PLC | | | 17,216 | | | $ | 821,708 | |
| FANUC Corp.(d) | | | 31,634 | | | | 821,852 | |
| Goldwind Science & Technology Co., Ltd., Class H | | | 1,467,800 | | | | 1,392,335 | |
| Proto Labs, Inc.(a) | | | 28,916 | | | | 1,191,050 | |
| RELX PLC, Sponsored ADR | | | 17,604 | | | | 828,796 | |
| Schneider Electric SE | | | 3,381 | | | | 869,993 | |
| Sensata Technologies Holding PLC | | | 24,733 | | | | 794,919 | |
| SS&C Technologies Holdings, Inc. | | | 11,458 | | | | 886,162 | |
| Stratasys, Ltd.(a) | | | 119,634 | | | | 1,150,879 | |
| Thomson Reuters Corp.(d) | | | 4,894 | | | | 798,532 | |
| TransUnion | | | 8,605 | | | | 873,408 | |
| Verisk Analytics, Inc. | | | 3,137 | | | | 922,936 | |
| Vestas Wind Systems A/S(a) | | | 36,702 | | | | 570,507 | |
| Wolters Kluwer NV | | | 4,937 | | | | 824,051 | |
| Total Industrials | | | | | | | 14,704,745 | |
| | | | | | | | | |
| Information Technology (48.23%) | | | | | | | | |
| Adobe, Inc.(a) | | | 1,439 | | | | 742,424 | |
| Alarm.com Holdings, Inc.(a) | | | 15,640 | | | | 1,018,790 | |
| Allegro MicroSystems, Inc.(a)(d) | | | 39,972 | | | | 868,592 | |
| ANSYS, Inc.(a) | | | 2,647 | | | | 929,362 | |
| Autodesk, Inc.(a) | | | 3,252 | | | | 949,259 | |
| Cadence Design Systems, Inc.(a) | | | 3,130 | | | | 960,315 | |
| Check Point Software Technologies, Ltd.(a) | | | 4,431 | | | | 806,442 | |
| Cognex Corp. | | | 22,050 | | | | 881,559 | |
| Crowdstrike Holdings, Inc., Class A(a) | | | 3,287 | | | | 1,137,203 | |
| CyberArk Software, Ltd.(a) | | | 3,098 | | | | 1,002,233 | |
| Dassault Systemes SE | | | 21,409 | | | | 738,670 | |
| Datadog, Inc., Class A(a) | | | 7,701 | | | | 1,176,327 | |
| Dynatrace, Inc.(a) | | | 16,700 | | | | 938,373 | |
| First Solar, Inc.(a) | | | 3,579 | | | | 713,187 | |
| Fortinet, Inc.(a) | | | 11,339 | | | | 1,077,772 | |
| Gen Digital, Inc. | | | 32,178 | | | | 992,691 | |
| Guidewire Software, Inc.(a) | | | 4,977 | | | | 1,009,784 | |
| Intuit, Inc. | | | 1,311 | | | | 841,308 | |
| Itron, Inc.(a)(d) | | | 8,485 | | | | 1,005,727 | |
| Keyence Corp. | | | 1,867 | | | | 807,621 | |
| Klaviyo, Inc.(a)(d) | | | 26,825 | | | | 996,281 | |
| Nemetschek SE | | | 8,580 | | | | 890,369 | |
| Okta, Inc.(a) | | | 11,491 | | | | 891,242 | |
| Omron Corp. | | | 20,000 | | | | 637,102 | |
| Open Text Corp.(d) | | | 26,130 | | | | 795,136 | |
| Palo Alto Networks, Inc.(a) | | | 2,447 | | | | 948,996 | |
| PTC, Inc.(a) | | | 4,939 | | | | 988,096 | |
3 | November 30, 2024
ALPS Disruptive Technologies ETF
| Schedule of Investments | November 30, 2024 |
| Security Description | | Shares | | | Value | |
| Information Technology (continued) | | | | | | | | |
| Qorvo, Inc.(a) | | | 8,000 | | | $ | 552,400 | |
| Qualys, Inc.(a) | | | 6,800 | | | | 1,044,480 | |
| Renishaw PLC | | | 18,872 | | | | 751,624 | |
| Salesforce, Inc. | | | 3,332 | | | | 1,099,527 | |
| Samsara, Inc., Class A(a) | | | 18,255 | | | | 976,460 | |
| SAP SE, Sponsored ADR | | | 3,819 | | | | 907,394 | |
| SenseTime Group, Inc.(a)(b)(c)(d) | | | 6,339,000 | | | | 1,214,024 | |
| ServiceNow, Inc.(a) | | | 954 | | | | 1,001,166 | |
| Silicon Laboratories, Inc.(a)(d) | | | 7,906 | | | | 874,798 | |
| Skyworks Solutions, Inc. | | | 8,413 | | | | 736,895 | |
| Snowflake, Inc., Class A(a) | | | 7,474 | | | | 1,306,455 | |
| SolarEdge Technologies, Inc.(a)(d) | | | 46,537 | | | | 735,285 | |
| SoundHound AI, Inc.(a) | | | 173,430 | | | | 1,614,632 | |
| Synopsys, Inc.(a) | | | 1,730 | | | | 966,188 | |
| Temenos AG(d) | | | 11,951 | | | | 784,795 | |
| Trend Micro, Inc. | | | 13,738 | | | | 755,606 | |
| Workday, Inc., Class A(a) | | | 3,363 | | | | 840,716 | |
| Xero, Ltd.(a) | | | 8,779 | | | | 995,486 | |
| Xinyi Solar Holdings, Ltd.(d) | | | 2,292,000 | | | | 1,013,429 | |
| Zoom Communications, Inc., Class A(a) | | | 12,694 | | | | 1,049,667 | |
| Zscaler, Inc.(a) | | | 5,069 | | | | 1,047,205 | |
| Total Information Technology | | | | | | | 45,013,093 | |
| | | | | | | | | |
| Real Estate (1.02%) | | | | | | | | |
| Equinix, Inc. | | | 973 | | | | 954,980 | |
| | | | | | | | | |
| Utilities (1.99%) | | | | | | | | |
| China Longyuan Power Group Corp., Ltd., Class H(d) | | | 1,239,000 | | | | 1,020,821 | |
| Enlight Renewable Energy, Ltd.(a) | | | 51,309 | | | | 844,239 | |
| Total Utilities | | | | | | | 1,865,060 | |
| | | | | | | | | |
| TOTAL COMMON STOCKS | | | | | |
| (Cost $80,938,324) | | | | | | | 92,276,712 | |
| | | | | | | |
| Security Description | | Shares | | | Value | |
| MASTER LIMITED PARTNERSHIPS (0.90%) | |
| Utilities (0.90%) | | | | | | | | |
| Brookfield Renewable Partners LP | | | 32,390 | | | $ | 841,416 | |
| | | | | | | | | |
| TOTAL MASTER LIMITED PARTNERSHIPS | | | | | |
| (Cost $935,654) | | | | | | | 841,416 | |
| | | 7 Day Yield | | Shares | | | Value | |
| SHORT TERM INVESTMENTS (8.94%) | | | | | |
| Money Market Fund (0.17%) | | | | |
| State Street Institutional Treasury Plus Money Market Fund (Premier Class) | | | | | | | | | | | | |
| (Cost $158,878) | | | 4.59 | % | | | 158,878 | | | $ | 158,878 | |
| | | | | | | | | | | | | |
| Investments Purchased with Collateral from Securities Loaned (8.77%) | | | | | | | | | |
| State Street Navigator Securities Lending Government Money Market Portfolio, 4.63% | | | | | | | | | | | | |
| (Cost $8,189,037) | | | | | | | 8,189,037 | | | $ | 8,189,037 | |
| | | | | | | | | | | | | |
| TOTAL SHORT TERM INVESTMENTS | | | | | |
| (Cost $8,347,915) | | | | | | | | | | | 8,347,915 | |
| | | | | | | | | | | | | |
| TOTAL INVESTMENTS (108.69%) | | | | | |
| (Cost $90,221,893) | | | | | | | | | | $ | 101,466,043 | |
| LIABILITIES IN EXCESS OF OTHER ASSETS (-8.69%) | | | | (8,112,644 | ) |
| NET ASSETS - 100.00% | | | | | | | | | | $ | 93,353,399 | |
| (a) | Non-income producing security. |
| (b) | Securities exempt from registration under Rule 144A of the Securities Act of 1933. These securities may be sold in the ordinary course of business in transactions exempt from registration, normally to qualified institutional buyers. At period end, the aggregate market value of those securities was $3,141,313, representing 3.36% of net assets. |
| (c) | Securities were purchased pursuant to Regulation S under the Securities Act of 1933, which exempts securities offered and sold outside of the United States from registration. Such securities cannot be sold in the United States without either an effective registration statement filed pursuant to the Securities Act of 1933, or pursuant to an exemption from registration. As of November 30, 2024, the market value of those securities was $3,141,313, representing 3.36% of net assets. |
| (d) | Security, or a portion of the security position is currently on loan. The total market value of securities on loan is $10,751,577. |
See Notes to Financial Statements and Financial Highlights.
4 | November 30, 2024
ALPS Medical Breakthroughs ETF
| Schedule of Investments | November 30, 2024 |
| Security Description | | Shares | | | Value | |
| COMMON STOCKS (100.05%) | | | | | | | | |
| Biotechnology (83.76%) | | | | | | | | |
| 4D Molecular Therapeutics, Inc.(a)(b) | | | 40,953 | | | $ | 321,073 | |
| 89bio, Inc.(a)(b) | | | 84,684 | | | | 761,309 | |
| AC Immune SA(a) | | | 79,770 | | | | 271,218 | |
| ACADIA Pharmaceuticals, Inc.(a) | | | 132,304 | | | | 2,159,201 | |
| ACELYRIN, Inc.(a)(b) | | | 80,411 | | | | 365,870 | |
| Agios Pharmaceuticals, Inc.(a) | | | 44,765 | | | | 2,658,593 | |
| Akero Therapeutics, Inc.(a) | | | 55,210 | | | | 1,772,241 | |
| Aldeyra Therapeutics, Inc.(a)(b) | | | 47,401 | | | | 232,265 | |
| Alector, Inc.(a)(b) | | | 80,397 | | | | 208,228 | |
| Alkermes PLC(a) | | | 131,394 | | | | 3,813,054 | |
| Allogene Therapeutics, Inc.(a)(b) | | | 182,467 | | | | 452,518 | |
| Altimmune, Inc.(a)(b) | | | 57,248 | | | | 490,615 | |
| Amicus Therapeutics, Inc.(a) | | | 236,355 | | | | 2,358,823 | |
| AnaptysBio, Inc.(a)(b) | | | 22,392 | | | | 558,904 | |
| Anavex Life Sciences Corp.(a)(b) | | | 66,598 | | | | 630,017 | |
| Annexon, Inc.(a) | | | 77,388 | | | | 417,121 | |
| Apogee Therapeutics, Inc.(a)(b) | | | 36,940 | | | | 1,667,841 | |
| Applied Therapeutics, Inc.(a) | | | 97,799 | | | | 198,532 | |
| Arcellx, Inc.(a) | | | 42,668 | | | | 3,757,771 | |
| Arcturus Therapeutics Holdings, Inc.(a)(b) | | | 22,733 | | | | 416,923 | |
| Arcus Biosciences, Inc.(a) | | | 71,161 | | | | 1,098,726 | |
| ArriVent Biopharma, Inc.(a) | | | 28,558 | | | | 855,598 | |
| ARS Pharmaceuticals, Inc.(a)(b) | | | 73,468 | | | | 1,066,021 | |
| Aura Biosciences, Inc.(a)(b) | | | 36,656 | | | | 341,267 | |
| Aurinia Pharmaceuticals, Inc.(a) | | | 113,188 | | | | 1,002,846 | |
| Avidity Biosciences, Inc.(a) | | | 91,677 | | | | 3,944,860 | |
| BioCryst Pharmaceuticals, Inc.(a) | | | 164,588 | | | | 1,234,410 | |
| Cargo Therapeutics, Inc.(a)(b) | | | 36,586 | | | | 665,133 | |
| Celcuity, Inc.(a) | | | 31,328 | | | | 400,998 | |
| Celldex Therapeutics, Inc.(a)(b) | | | 52,732 | | | | 1,446,966 | |
| CG oncology, Inc.(a)(b) | | | 56,064 | | | | 1,948,224 | |
| Cogent Biosciences, Inc.(a)(b) | | | 91,048 | | | | 865,866 | |
| Compass Pathways PLC, ADR(a)(b) | | | 54,552 | | | | 250,666 | |
| Crinetics Pharmaceuticals, Inc.(a) | | | 63,233 | | | | 3,616,928 | |
| Day One Biopharmaceuticals, Inc.(a)(b) | | | 72,149 | | | | 1,005,036 | |
| Denali Therapeutics, Inc.(a) | | | 110,601 | | | | 2,765,025 | |
| Dianthus Therapeutics, Inc.(a) | | | 23,212 | | | | 556,856 | |
| Disc Medicine, Inc.(a) | | | 23,827 | | | | 1,511,823 | |
| Enanta Pharmaceuticals, Inc.(a) | | | 16,693 | | | | 143,560 | |
| Erasca, Inc.(a)(b) | | | 226,075 | | | | 646,575 | |
| Galapagos NV, Sponsored ADR(a)(b) | | | 51,943 | | | | 1,435,705 | |
| Security Description | | Shares | | | Value | |
| Biotechnology (continued) | | | | | | | | |
| Geron Corp.(a) | | | 474,323 | | | $ | 1,954,211 | |
| HilleVax, Inc.(a) | | | 39,250 | | | | 75,753 | |
| Ideaya Biosciences, Inc.(a) | | | 67,550 | | | | 1,848,168 | |
| Immunocore Holdings PLC, ADR(a)(b) | | | 39,920 | | | | 1,306,981 | |
| Immunovant, Inc.(a) | | | 117,519 | | | | 3,314,036 | |
| Inhibrx Biosciences, Inc.(a)(b) | | | 11,402 | | | | 173,995 | |
| Inozyme Pharma, Inc.(a) | | | 46,387 | | | | 125,709 | |
| Intellia Therapeutics, Inc.(a)(b) | | | 79,334 | | | | 1,239,197 | |
| Ironwood Pharmaceuticals, Inc.(a) | | | 122,349 | | | | 430,668 | |
| iTeos Therapeutics, Inc.(a)(b) | | | 27,560 | | | | 235,638 | |
| Keros Therapeutics, Inc.(a) | | | 29,050 | | | | 1,677,347 | |
| Krystal Biotech, Inc.(a)(b) | | | 23,287 | | | | 4,597,319 | |
| Kura Oncology, Inc.(a) | | | 61,100 | | | | 674,544 | |
| Kyverna Therapeutics, Inc.(a) | | | 34,411 | | | | 198,551 | |
| MannKind Corp.(a)(b) | | | 216,868 | | | | 1,470,365 | |
| Merus NV(a) | | | 55,669 | | | | 2,496,198 | |
| Mineralys Therapeutics, Inc.(a) | | | 39,834 | | | | 508,680 | |
| Mirum Pharmaceuticals, Inc.(a)(b) | | | 38,770 | | | | 1,791,949 | |
| MoonLake Immunotherapeutics(a) | | | 45,623 | | | | 2,483,260 | |
| Newamsterdam Pharma Co. NV(a) | | | 72,515 | | | | 1,439,423 | |
| Olema Pharmaceuticals, Inc.(a)(b) | | | 47,563 | | | | 481,338 | |
| Praxis Precision Medicines, Inc.(a)(b) | | | 13,979 | | | | 1,120,696 | |
| ProKidney Corp.(a) | | | 101,385 | | | | 202,770 | |
| Protagonist Therapeutics, Inc.(a) | | | 46,097 | | | | 2,019,049 | |
| Prothena Corp. PLC(a)(b) | | | 43,332 | | | | 702,412 | |
| PTC Therapeutics, Inc.(a) | | | 60,554 | | | | 2,657,110 | |
| Replimune Group, Inc.(a) | | | 54,445 | | | | 766,586 | |
| Savara, Inc.(a) | | | 133,765 | | | | 449,450 | |
| Soleno Therapeutics, Inc.(a) | | | 30,363 | | | | 1,600,434 | |
| Sutro Biopharma, Inc.(a) | | | 67,726 | | | | 179,474 | |
| Syndax Pharmaceuticals, Inc.(a) | | | 69,123 | | | | 1,155,737 | |
| Tourmaline Bio, Inc.(a) | | | 20,583 | | | | 535,981 | |
| UroGen Pharma, Ltd.(a)(b) | | | 35,549 | | | | 451,472 | |
| Vanda Pharmaceuticals, Inc.(a)(b) | | | 45,841 | | | | 236,081 | |
| Vera Therapeutics, Inc.(a)(b) | | | 46,081 | | | | 2,292,530 | |
| Vericel Corp.(a)(b) | | | 38,607 | | | | 2,244,611 | |
| Viridian Therapeutics, Inc.(a) | | | 48,745 | | | | 1,050,455 | |
| Xencor, Inc.(a) | | | 50,053 | | | | 1,281,357 | |
| Xenon Pharmaceuticals, Inc.(a) | | | 59,324 | | | | 2,528,982 | |
| Y-mAbs Therapeutics, Inc.(a)(b) | | | 35,633 | | | | 424,745 | |
| Zai Lab, Ltd., ADR(a)(b) | | | 77,725 | | | | 2,242,366 | |
5 | November 30, 2024
ALPS Medical Breakthroughs ETF
| Schedule of Investments | November 30, 2024 |
| Security Description | | Shares | | | Value | |
| Biotechnology (continued) | | | | | | | | |
| Zentalis Pharmaceuticals, Inc.(a)(b) | | | 58,521 | | | $ | 211,261 | |
| Total Biotechnology | | | | | | | 103,192,095 | |
| | | | | | | | | |
| Health Care Providers & Services (0.35%) | | | | | | | | |
| Fulgent Genetics, Inc.(a)(b) | | | 23,882 | | | | 437,041 | |
| | | | | | | | | |
| Pharmaceuticals (15.94%) | | | | | | | | |
| Alto Neuroscience, Inc.(a) | | | 22,184 | | | | 97,831 | |
| Arvinas, Inc.(a)(b) | | | 55,611 | | | | 1,485,926 | |
| Atea Pharmaceuticals, Inc.(a) | | | 67,342 | | | | 230,310 | |
| Corcept Therapeutics, Inc.(a)(b) | | | 82,975 | | | | 4,785,997 | |
| Edgewise Therapeutics, Inc.(a) | | | 71,731 | | | | 2,367,123 | |
| Fulcrum Therapeutics, Inc.(a) | | | 128,048 | | | | 492,985 | |
| GH Research PLC(a)(b) | | | 39,932 | | | | 356,593 | |
| Liquidia Corp.(a)(b) | | | 63,996 | | | | 739,154 | |
| Longboard Pharmaceuticals, Inc.(a) | | | 27,617 | | | | 1,656,467 | |
| Neumora Therapeutics, Inc.(a)(b) | | | 123,006 | | | | 1,222,680 | |
| Pharvaris NV(a) | | | 44,043 | | | | 964,542 | |
| Pliant Therapeutics, Inc.(a)(b) | | | 50,212 | | | | 692,926 | |
| Tarsus Pharmaceuticals, Inc.(a)(b) | | | 30,442 | | | | 1,596,683 | |
| Theravance Biopharma, Inc.(a)(b) | | | 38,971 | | | | 360,482 | |
| Verona Pharma PLC, ADR(a)(b) | | | 65,143 | | | | 2,581,616 | |
| Total Pharmaceuticals | | | | | | | 19,631,315 | |
| | | | | | | | | |
| TOTAL COMMON STOCKS | | | | | | | | |
| (Cost $116,132,514) | | | | | | | 123,260,451 | |
| | | | | | | | | |
| 7 Day Yield | | Shares | | | Value | |
| SHORT TERM INVESTMENTS (11.58%) | | | | | | | | |
| Investments Purchased with Collateral from Securities Loaned (11.58%) | | | | | | | | |
| State Street Navigator Securities Lending Government Money Market Portfolio, 4.63% | | | | | | | | |
| (Cost $14,263,615) | | | 14,263,615 | | | $ | 14,263,615 | |
| TOTAL SHORT TERM INVESTMENTS | | | | | |
| | | | | | | | | |
| (Cost $14,263,615) | | | | | | | 14,263,615 | |
| | | | | | |
| TOTAL INVESTMENTS (111.63%) | | | | | |
| (Cost $130,396,129) | | | | | | $ | 137,524,066 | |
| LIABILITIES IN EXCESS OF OTHER ASSETS (-11.63%) | | | | (14,328,305 | ) |
| NET ASSETS - 100.00% | | | $ | 123,195,761 | |
| (a) | Non-income producing security. |
| (b) | Security, or a portion of the security position is currently on loan. The total market value of securities on loan is $29,525,587. |
See Notes to Financial Statements and Financial Highlights.
6 | November 30, 2024
ALPS ETF Trust
| Statements of Assets and Liabilities | November 30, 2024 |
| | | ALPS Clean
Energy ETF | | | ALPS Disruptive
Technologies
ETF | | | ALPS Medical
Breakthroughs
ETF | |
| ASSETS: | | | | | | | | | | | | |
| Investments, at value(a) | | $ | 140,507,846 | | | $ | 101,466,043 | | | $ | 137,524,066 | |
| Foreign Currency, at value (Cost $–, $3 and $–) | | | – | | | | 3 | | | | – | |
| Dividends receivable | | | 163,024 | | | | 113,675 | | | | 2,821 | |
| Receivable for investments sold | | | 276,859 | | | | – | | | | – | |
| Receivable for shares sold | | | 2,108,420 | | | | – | | | | – | |
| Total Assets | | | 143,056,149 | | | | 101,579,721 | | | | 137,526,887 | |
| | | | | | | | | | | | | |
| LIABILITIES: | | | | | | | | | | | | |
| Payable to adviser | | | 60,747 | | | | 37,285 | | | | 49,772 | |
| Payable for investments purchased | | | 2,383,655 | | | | – | | | | – | |
| Payable for collateral upon return of securities loaned | | | 12,700,867 | | | | 8,189,037 | | | | 14,263,615 | |
| Payable to custodian for overdraft | | | – | | | | – | | | | 17,739 | |
| Total Liabilities | | | 15,145,269 | | | | 8,226,322 | | | | 14,331,126 | |
| NET ASSETS | | $ | 127,910,880 | | | $ | 93,353,399 | | | $ | 123,195,761 | |
| | | | | | | | | | | | | |
| NET ASSETS CONSIST OF: | | | | | | | | | | | | |
| Paid-in capital | | $ | 584,524,361 | | | $ | 113,334,455 | | | $ | 255,662,926 | |
| Total distributable earnings/(accumulated losses) | | | (456,613,481 | ) | | | (19,981,056 | ) | | | (132,467,165 | ) |
| NET ASSETS | | $ | 127,910,880 | | | $ | 93,353,399 | | | $ | 123,195,761 | |
| | | | | | | | | | | | | |
| INVESTMENTS, AT COST | | $ | 300,243,772 | | | $ | 90,221,893 | | | $ | 130,396,129 | |
| | | | | | | | | | | | | |
| PRICING OF SHARES | | | | | | | | | | | | |
| Net Assets | | $ | 127,910,880 | | | $ | 93,353,399 | | | $ | 123,195,761 | |
| Shares of beneficial interest outstanding (Unlimited number of shares authorized, par value $0.01 per share) | | | 4,550,002 | | | | 2,000,002 | | | | 3,175,000 | |
| Net Asset Value, offering and redemption price per share | | $ | 28.11 | | | $ | 46.68 | | | $ | 38.80 | |
| (a) | Includes $31,878,093, $10,751,577 and $29,525,587 of securities on loan. |
See Notes to Financial Statements and Financial Highlights.
7 | November 30, 2024
ALPS ETF Trust
| Statements of Operations | For the Year Ended November 30, 2024 |
| | | ALPS Clean
Energy ETF | | | ALPS Disruptive
Technologies
ETF | | | ALPS Medical
Breakthroughs
ETF | |
| INVESTMENT INCOME: | | | | | | | | | | | | |
| Dividend income* | | $ | 1,728,747 | | | $ | 729,872 | | | $ | 1,898 | |
| Securities lending income | | | 1,293,355 | | | | 58,003 | | | | 148,579 | |
| Total investment income | | | 3,022,102 | | | | 787,875 | | | | 150,477 | |
| | | | | | | | | | | | | |
| EXPENSES: | | | | | | | | | | | | |
| Investment adviser fees | | | 1,185,832 | | | | 487,040 | | | | 546,749 | |
| Other expenses | | | 9,665 | | | | 4,193 | | | | 4,573 | |
| Total expenses | | | 1,195,497 | | | | 491,233 | | | | 551,322 | |
| NET INVESTMENT INCOME/(LOSS) | | | 1,826,605 | | | | 296,642 | | | | (400,845 | ) |
| | | | | | | | | | | | | |
| REALIZED AND UNREALIZED GAIN/(LOSS) | | | | | | | | | | | | |
| Net realized gain/(loss) on investments(a) | | | (147,608,664 | ) | | | 2,326,297 | | | | 7,550,987 | |
| Net realized loss on foreign currency transactions | | | (10,207 | ) | | | (773 | ) | | | – | |
| Total net realized gain/(loss) | | | (147,618,871 | ) | | | 2,325,524 | | | | 7,550,987 | |
| Net change in unrealized appreciation/(depreciation) on investments | | | 122,946,170 | | | | 16,075,284 | | | | 31,240,527 | |
| Net change in unrealized appreciation/(depreciation) on translation of assets and liabilities denominated in foreign currencies | | | (140 | ) | | | (1,059 | ) | | | – | |
| Total net change in unrealized appreciation/(depreciation) | | | 122,946,030 | | | | 16,074,225 | | | | 31,240,527 | |
| NET REALIZED AND UNREALIZED GAIN/(LOSS) ON INVESTMENTS | | | (24,672,841 | ) | | | 18,399,749 | | | | 38,791,514 | |
| NET INCREASE/(DECREASE) IN NET ASSETS RESULTING FROM OPERATIONS | | $ | (22,846,236 | ) | | $ | 18,696,391 | | | $ | 38,390,669 | |
| *Net of foreign tax withholding. | | $ | 204,334 | | | $ | 48,816 | | | $ | – | |
| (a) | Includes realized gain or loss as a result of in-kind transactions (See Note 4 in Notes to Financial Statements and Financial Highlights). |
See Notes to Financial Statements and Financial Highlights.
8 | November 30, 2024
ALPS Clean Energy ETF
Statements of Changes in Net Assets
| | | For the
Year Ended
November 30, 2024 | | | For the
Year Ended
November 30, 2023 | |
| OPERATIONS: | | | | | | | | |
| Net investment income | | $ | 1,826,605 | | | $ | 5,226,077 | |
| Net realized loss | | | (147,618,871 | ) | | | (93,867,475 | ) |
| Net change in unrealized appreciation/(depreciation) | | | 122,946,030 | | | | (179,381,813 | ) |
| Net decrease in net assets resulting from operations | | | (22,846,236 | ) | | | (268,023,211 | ) |
| | | | | | | | | |
| DISTRIBUTIONS TO SHAREHOLDERS: | | | | | | | | |
| From distributable earnings | | | (987,799 | ) | | | (4,542,388 | ) |
| From tax return of capital | | | (1,743,750 | ) | | | (973,150 | ) |
| Total distributions | | | (2,731,549 | ) | | | (5,515,538 | ) |
| | | | | | | | | |
| CAPITAL SHARE TRANSACTIONS: | | | | | | | | |
| Proceeds from sale of shares | | | 136,265,280 | | | | 172,062,512 | |
| Cost of shares redeemed | | | (250,753,573 | ) | | | (338,457,659 | ) |
| Net decrease from capital share transactions | | | (114,488,293 | ) | | | (166,395,147 | ) |
| Net decrease in net assets | | | (140,066,078 | ) | | | (439,933,896 | ) |
| | | | | | | | | |
| NET ASSETS: | | | | | | | | |
| Beginning of year | | | 267,976,958 | | | | 707,910,854 | |
| End of year | | $ | 127,910,880 | | | $ | 267,976,958 | |
| | | | | | | | | |
| OTHER INFORMATION: | | | | | | | | |
| CAPITAL SHARE TRANSACTIONS: | | | | | | | | |
| Beginning shares | | | 8,550,002 | | | | 12,700,002 | |
| Shares sold | | | 4,550,000 | | | | 4,250,000 | |
| Shares redeemed | | | (8,550,000 | ) | | | (8,400,000 | ) |
| Shares outstanding, end of year | | | 4,550,002 | | | | 8,550,002 | |
See Notes to Financial Statements and Financial Highlights.
9 | November 30, 2024
ALPS Disruptive Technologies ETF
Statements of Changes in Net Assets
| | | For the
Year Ended
November 30, 2024 | | | For the
Year Ended
November 30, 2023 | |
| OPERATIONS: | | | | | | | | |
| Net investment income | | $ | 296,642 | | | $ | 453,989 | |
| Net realized gain/(loss) | | | 2,325,524 | | | | (5,188,326 | ) |
| Net change in unrealized appreciation/(depreciation) | | | 16,074,225 | | | | 14,917,184 | |
| Net increase in net assets resulting from operations | | | 18,696,391 | | | | 10,182,847 | |
| | | | | | | | | |
| DISTRIBUTIONS TO SHAREHOLDERS: | | | | | | | | |
| From distributable earnings | | | (292,162 | ) | | | (25,708 | ) |
| Total distributions | | | (292,162 | ) | | | (25,708 | ) |
| | | | | | | | | |
| CAPITAL SHARE TRANSACTIONS: | | | | | | | | |
| Proceeds from sale of shares | | | 3,055,072 | | | | 1,675,949 | |
| Cost of shares redeemed | | | (25,339,217 | ) | | | (36,813,357 | ) |
| Net decrease from capital share transactions | | | (22,284,145 | ) | | | (35,137,408 | ) |
| Net decrease in net assets | | | (3,879,916 | ) | | | (24,980,269 | ) |
| | | | | | | | | |
| NET ASSETS: | | | | | | | | |
| Beginning of year | | | 97,233,315 | | | | 122,213,584 | |
| End of year | | $ | 93,353,399 | | | $ | 97,233,315 | |
| | | | | | | | | |
| OTHER INFORMATION: | | | | | | | | |
| CAPITAL SHARE TRANSACTIONS: | | | | | | | | |
| Beginning shares | | | 2,525,002 | | | | 3,500,002 | |
| Shares sold | | | 75,000 | | | | 50,000 | |
| Shares redeemed | | | (600,000 | ) | | | (1,025,000 | ) |
| Shares outstanding, end of year | | | 2,000,002 | | | | 2,525,002 | |
See Notes to Financial Statements and Financial Highlights.
10 | November 30, 2024
ALPS Medical Breakthroughs ETF
Statements of Changes in Net Assets
| | | For the
Year Ended
November 30, 2024 | | | For the
Year Ended
November 30, 2023 | |
| OPERATIONS: | | | | | | | | |
| Net investment loss | | $ | (400,845 | ) | | $ | (352,913 | ) |
| Net realized gain/(loss) | | | 7,550,987 | | | | (4,825,859 | ) |
| Net change in unrealized appreciation/(depreciation) | | | 31,240,527 | | | | (11,906,628 | ) |
| Net increase/(decrease) in net assets resulting from operations | | | 38,390,669 | | | | (17,085,400 | ) |
| | | | | | | | | |
| DISTRIBUTIONS TO SHAREHOLDERS: | | | | | | | | |
| From distributable earnings | | | (220,286 | ) | | | – | |
| Total distributions | | | (220,286 | ) | | | – | |
| | | | | | | | | |
| CAPITAL SHARE TRANSACTIONS: | | | | | | | | |
| Proceeds from sale of shares | | | 19,659,637 | | | | 5,897,730 | |
| Cost of shares redeemed | | | (18,323,776 | ) | | | (20,131,389 | ) |
| Net increase/(decrease) from capital share transactions | | | 1,335,861 | | | | (14,233,659 | ) |
| Net increase/(decrease) in net assets | | | 39,506,244 | | | | (31,319,059 | ) |
| | | | | | | | | |
| NET ASSETS: | | | | | | | | |
| Beginning of year | | | 83,689,517 | | | | 115,008,576 | |
| End of year | | $ | 123,195,761 | | | $ | 83,689,517 | |
| | | | | | | | | |
| OTHER INFORMATION: | | | | | | | | |
| CAPITAL SHARE TRANSACTIONS: | | | | | | | | |
| Beginning shares | | | 3,175,000 | | | | 3,675,000 | |
| Shares sold | | | 550,000 | | | | 200,000 | |
| Shares redeemed | | | (550,000 | ) | | | (700,000 | ) |
| Shares outstanding, end of year | | | 3,175,000 | | | | 3,175,000 | |
See Notes to Financial Statements and Financial Highlights.
11 | November 30, 2024
ALPS Clean Energy ETF
| Financial Highlights | For a Share Outstanding Throughout the Periods Presented |
| | | For the Year
Ended
November 30,
2024 | | | For the Year
Ended
November 30,
2023 | | | For the Year
Ended
November 30,
2022 | | | For the Year
Ended
November 30,
2021 | | | For the Year
Ended
November 30,
2020 | |
| NET ASSET VALUE, BEGINNING OF PERIOD | | $ | 31.34 | | | $ | 55.74 | | | $ | 73.94 | | | $ | 70.05 | | | $ | 32.23 | |
| | | | | | | | | | | | | | | | | | | | | |
| INCOME/(LOSS) FROM INVESTMENT OPERATIONS: | | | | | | | | | | | | | | | | | | | | |
| Net investment income(a) | | | 0.25 | | | | 0.47 | | | | 0.39 | | | | 0.20 | | | | 0.25 | |
| Net realized and unrealized gain/(loss) | | | (3.13 | ) | | | (24.38 | ) | | | (18.14 | ) | | | 4.11 | | | | 38.08 | |
| Total from investment operations | | | (2.88 | ) | | | (23.91 | ) | | | (17.75 | ) | | | 4.31 | | | | 38.33 | |
| DISTRIBUTIONS: | | | | | | | | | | | | | | | | | | | | |
| From net investment income | | | (0.13 | ) | | | (0.40 | ) | | | (0.19 | ) | | | (0.17 | ) | | | (0.18 | ) |
| Tax return of capital | | | (0.22 | ) | | | (0.09 | ) | | | (0.26 | ) | | | (0.25 | ) | | | (0.33 | ) |
| Total distributions | | | (0.35 | ) | | | (0.49 | ) | | | (0.45 | ) | | | (0.42 | ) | | | (0.51 | ) |
| | | | | | | | | | | | | | | | | | | | | |
| Net increase/(decrease) in net asset value | | | (3.23 | ) | | | (24.40 | ) | | | (18.20 | ) | | | 3.89 | | | | 37.82 | |
| NET ASSET VALUE, END OF PERIOD | | $ | 28.11 | | | $ | 31.34 | | | $ | 55.74 | | | $ | 73.94 | | | $ | 70.05 | |
| TOTAL RETURN(b) | | | (9.32 | )% | | | (43.11 | )% | | | (24.00 | )% | | | 6.16 | % | | | 120.45 | % |
| RATIOS/SUPPLEMENTAL DATA: | | | | | | | | | | | | | | | | | | | | |
| Net assets, end of period (000s) | | $ | 127,911 | | | $ | 267,977 | | | $ | 707,911 | | | $ | 1,014,767 | | | $ | 609,457 | |
| | | | | | | | | | | | | | | | | | | | | |
| Ratio of expenses to average net assets | | | 0.55 | % | | | 0.55 | % | | | 0.55 | % | | | 0.56 | %(c) | | | 0.65 | % |
| Ratio of net investment income to average net assets | | | 0.85 | % | | | 1.09 | % | | | 0.69 | % | | | 0.26 | % | | | 0.57 | % |
| Portfolio turnover rate(d) | | | 32 | % | | | 38 | % | | | 44 | % | | | 39 | % | | | 34 | % |
| (a) | Based on average shares outstanding during the period. |
| (b) | Total return is calculated assuming an initial investment made at the net asset value at the beginning of the period and redemption at the net asset value on the last day of the period and assuming all distributions are reinvested at reinvestment prices. Total return calculated for a period of less than one year is not annualized. |
| (c) | Effective January 1, 2021, the Fund's Advisory Fee changed from 0.65% to 0.55%. |
| (d) | Portfolio turnover for periods less than one year are not annualized and does not include securities received or delivered from processing creations or redemptions in-kind. |
See Notes to Financial Statements and Financial Highlights.
12 | November 30, 2024
ALPS Disruptive Technologies ETF
| Financial Highlights | For a Share Outstanding Throughout the Periods Presented |
| | | For the Year
Ended
November 30,
2024 | | | For the Year
Ended
November 30,
2023 | | | For the Year
Ended
November 30,
2022 | | | For the Year
Ended
November 30,
2021 | | | For the Year
Ended
November 30,
2020 | |
| NET ASSET VALUE, BEGINNING OF PERIOD | | $ | 38.51 | | | $ | 34.92 | | | $ | 48.23 | | | $ | 42.99 | | | $ | 31.88 | |
| | | | | | | | | | | | | | | | | | | | | |
| INCOME/(LOSS) FROM INVESTMENT OPERATIONS: | | | | | | | | | | |
| Net investment income/ (loss)(a) | | | 0.13 | | | | 0.15 | | | | (0.02 | ) | | | 0.15 | | | | 0.25 | |
| Net realized and unrealized gain/(loss) | | | 8.15 | | | | 3.45 | | | | (13.17 | ) | | | 5.26 | | | | 11.00 | |
| Total from investment operations | | | 8.28 | | | | 3.60 | | | | (13.19 | ) | | | 5.41 | | | | 11.25 | |
| DISTRIBUTIONS: | | | | | | | | | | | | | | | | | | | | |
| From net investment income | | | (0.11 | ) | | | (0.01 | ) | | | (0.12 | ) | | | (0.17 | ) | | | (0.14 | ) |
| Total distributions | | | (0.11 | ) | | | (0.01 | ) | | | (0.12 | ) | | | (0.17 | ) | | | (0.14 | ) |
| | | | | | | | | | | | | | | | | | | | | |
| Net increase/(decrease) in net asset value | | | 8.17 | | | | 3.59 | | | | (13.31 | ) | | | 5.24 | | | | 11.11 | |
| NET ASSET VALUE, END OF PERIOD | | $ | 46.68 | | | $ | 38.51 | | | $ | 34.92 | | | $ | 48.23 | | | $ | 42.99 | |
| TOTAL RETURN(b) | | | 21.54 | % | | | 10.31 | % | | | (27.41 | )% | | | 12.60 | % | | | 35.42 | % |
| RATIOS/SUPPLEMENTAL DATA: | | | | | | | | | | | | | | | | | | | | |
| Net assets, end of period (000s) | | $ | 93,353 | | | $ | 97,233 | | | $ | 122,214 | | | $ | 237,546 | | | $ | 150,459 | |
| | | | | | | | | | | | | | | | | | | | | |
| Ratio of expenses to average net assets | | | 0.50 | % | | | 0.50 | % | | | 0.50 | % | | | 0.50 | % | | | 0.50 | % |
| Ratio of net investment income/(loss) to average net assets | | | 0.30 | % | | | 0.42 | % | | | (0.05 | )% | | | 0.31 | % | | | 0.72 | % |
| Portfolio turnover rate(c) | | | 35 | % | | | 34 | % | | | 31 | % | | | 26 | % | | | 38 | % |
| (a) | Based on average shares outstanding during the period. |
| (b) | Total return is calculated assuming an initial investment made at the net asset value at the beginning of the period and redemption at the net asset value on the last day of the period and assuming all distributions are reinvested at reinvestment prices. Total return calculated for a period of less than one year is not annualized. |
| (c) | Portfolio turnover for periods less than one year are not annualized and does not include securities received or delivered from processing creations or redemptions in-kind. |
See Notes to Financial Statements and Financial Highlights.
13 | November 30, 2024
ALPS Medical Breakthroughs ETF
| Financial Highlights | For a Share Outstanding Throughout the Periods Presented |
| | | For the Year
Ended
November 30,
2024 | | | For the Year
Ended
November 30,
2023 | | | For the Year
Ended
November 30,
2022 | | | For the Year
Ended
November 30,
2021 | | | For the Year
Ended
November 30,
2020 | |
| NET ASSET VALUE, BEGINNING OF PERIOD | | $ | 26.36 | | | $ | 31.29 | | | $ | 42.94 | | | $ | 49.00 | | | $ | 39.51 | |
| | | | | | | | | | | | | | | | | | | | | |
| INCOME/(LOSS) FROM INVESTMENT OPERATIONS: | | | | | | | | | | | | | | | | | | | | |
| Net investment loss(a) | | | (0.13 | ) | | | (0.10 | ) | | | (0.13 | ) | | | (0.18 | ) | | | (0.13 | ) |
| Net realized and unrealized gain/(loss) | | | 12.64 | | | | (4.83 | ) | | | (11.52 | ) | | | (5.88 | ) | | | 9.64 | |
| Total from investment operations | | | 12.51 | | | | (4.93 | ) | | | (11.65 | ) | | | (6.06 | ) | | | 9.51 | |
| | | | | | | | | | | | | | | | | | | | | |
| DISTRIBUTIONS: | | | | | | | | | | | | | | | | | | | | |
| From net investment income | | | (0.07 | ) | | | – | | | | – | | | | – | | | | (0.02 | ) |
| Total distributions | | | (0.07 | ) | | | – | | | | – | | | | – | | | | (0.02 | ) |
| | | | | | | | | | | | | | | | | | | | | |
| Net increase/(decrease) in net asset value | | | 12.44 | | | | (4.93 | ) | | | (11.65 | ) | | | (6.06 | ) | | | 9.49 | |
| NET ASSET VALUE, END OF PERIOD | | $ | 38.80 | | | $ | 26.36 | | | $ | 31.29 | | | $ | 42.94 | | | $ | 49.00 | |
| TOTAL RETURN(b) | | | 47.50 | % | | | (15.76 | )% | | | (27.13 | )% | | | (12.37 | )% | | | 24.07 | % |
| | | | | | | | | | | | | | | | | | | | | |
| RATIOS/SUPPLEMENTAL DATA: | | | | | | | | | | | | | | | | | | | | |
| Net assets, end of period (000s) | | $ | 123,196 | | | $ | 83,690 | | | $ | 115,009 | | | $ | 188,929 | | | $ | 242,542 | |
| | | | | | | | | | | | | | | | | | | | | |
| Ratio of expenses to average net assets | | | 0.50 | % | | | 0.50 | % | | | 0.50 | % | | | 0.50 | % | | | 0.50 | % |
| Ratio of net investment loss to average net assets | | | (0.37 | )% | | | (0.34 | )% | | | (0.39 | )% | | | (0.36 | )% | | | (0.33 | )% |
| Portfolio turnover rate(c) | | | 72 | % | | | 81 | % | | | 88 | % | | | 81 | % | | | 68 | % |
| (a) | Based on average shares outstanding during the period. |
| (b) | Total return is calculated assuming an initial investment made at the net asset value at the beginning of the period and redemption at the net asset value on the last day of the period and assuming all distributions are reinvested at reinvestment prices. Total return calculated for a period of less than one year is not annualized. |
| (c) | Portfolio turnover for periods less than one year are not annualized and does not include securities received or delivered from processing creations or redemptions in-kind. |
See Notes to Financial Statements and Financial Highlights.
14 | November 30, 2024
ALPS ETF Trust
| Notes to Financial Statements and Financial Highlights | November 30, 2024 |
1. ORGANIZATION
ALPS ETF Trust (the “Trust”), a Delaware statutory trust, is an open-end management investment company registered under the Investment Company Act of 1940, as amended (the “1940 Act”). As of November 30, 2024, the Trust consisted of twenty-three separate portfolios. Each portfolio represents a separate series of the Trust. This report pertains to the ALPS Clean Energy ETF, ALPS Disruptive Technologies ETF and the ALPS Medical Breakthroughs ETF (each a “Fund” and collectively, the “Funds”).
The investment objective of the ALPS Clean Energy ETF is to seek investment results that correspond generally, before fees and expenses, to the performance of the CIBC Atlas Clean Energy Index. The investment objective of the ALPS Disruptive Technologies ETF is to seek investment results that correspond generally, before fees and expenses, to the performance of the Indxx Disruptive Technologies Index. The investment objective of the ALPS Medical Breakthroughs ETF is to seek investment results that correspond generally, before fees and expenses, to the performance of the S-Network Medical Breakthroughs Index.
ALPS Clean Energy ETF is considered non-diversified and may invest a greater portion of assets in securities of individual issuers than a diversified fund. As a result, changes in the market value of a single investment could cause greater fluctuations in share price than would occur in a diversified fund. ALPS Disruptive Technologies ETF and ALPS Medical Breakthroughs ETF have elected to qualify as a diversified series of the Trust under the 1940 Act.
Each Fund’s Shares (“Shares”) are listed on the NYSE Arca, Inc. (the “NYSE Arca”). Each Fund issues and redeems Shares, at net asset value (“NAV”) in blocks of 25,000 Shares, each of which is called a “Creation Unit”. Creation Units are issued and redeemed principally in-kind for securities included in the Underlying Index. Except when aggregated in Creation Units, Shares are not redeemable securities of the Fund.
Pursuant to the Trust’s organizational documents, its Officers and Trustees are indemnified against certain liability arising out of the performance of their duties to the Trust. Additionally, in the normal course of business, the Trust enters into contracts with service providers that contain general indemnification clauses. The Trust’s maximum exposure under these arrangements is unknown, as this would involve future claims that may be made against the Trust that have not yet occurred.
2. SIGNIFICANT ACCOUNTING POLICIES
The following is a summary of significant accounting policies consistently followed by the Funds in the preparation of the financial statements. The accompanying financial statements were prepared in accordance with accounting principles generally accepted in the United States of America (“U.S. GAAP”). The preparation of financial statements in conformity with U.S. GAAP requires management to make certain estimates and assumptions that affect the reported amounts of assets and liabilities and disclosures of contingent assets and liabilities at the date of the financial statements and the reported amounts of revenue and expenses during the period. Actual results could differ from those estimates. Each Fund is considered an investment company under U.S. GAAP and follows the accounting and reporting guidance applicable to investment companies in the Financial Accounting Standards Board (“FASB”) Accounting Standards Codification Topic 946.
A. Portfolio Valuation
Each Fund’s NAV is determined daily, as of the close of regular trading on the New York Stock Exchange (the “NYSE”), normally 4:00 p.m. Eastern time, on each day the NYSE is open for trading. The NAV is computed by dividing the value of all assets of the Fund (including accrued interest and dividends), less all liabilities (including accrued expenses and dividends declared but unpaid), by the total number of shares outstanding.
Portfolio securities listed on any exchange other than the NASDAQ Stock Market LLC (“NASDAQ”) are valued at the last sale price on the business day as of which such value is being determined. If there has been no sale on such day, the securities are valued at the mean of the most recent bid and ask prices on such day. Securities traded on the NASDAQ are valued at the NASDAQ Official Closing Price as determined by NASDAQ. Portfolio securities traded on more than one securities exchange are valued at the last sale price on the business day as of which such value is being determined at the close of the exchange representing the principal market for such securities. Portfolio securities traded in the over-the-counter market, but excluding securities traded on the NASDAQ, are valued at the last quoted sale price in such market.
The Funds’ investments are valued at market value or, in the absence of market value with respect to any portfolio securities, at fair value according to procedures adopted by the Trust’s Board of Trustees (the “Board”). Pursuant to Rule 2a-5 under the 1940 Act, the Board designated ALPS Advisors, Inc. (the "Adviser") as the valuation designee ("Valuation Designee") for each Fund to perform the fair value determinations relating to Fund investments. The Adviser may carry out its designated responsibilities as Valuation Designee through various teams and committees. When market quotations are not readily available or when events occur that make established valuation methods unreliable, securities of the Funds may be valued in good faith by the Valuation Designee. These securities generally include, but are not limited to, restricted securities (securities which may not be publicly sold without registration under the Securities Act of 1933) for which a pricing service is unable to provide a market price; securities whose trading has been formally suspended; a security whose market price is not available from a pre-established primary pricing source or the pricing source is not willing to provide a price; a security with respect to which an event has occurred that is most likely to materially affect the value of the security after the market has closed but before the calculation of the Funds’ NAV or make it difficult or impossible to obtain a reliable market quotation; or a security whose price, as provided by the pricing service, does not reflect the security’s “fair value” due to the security being de-listed from a national exchange or the security’s primary trading market is temporarily closed at a time when, under normal conditions, it would be open. As a general principle, the current “fair value” of a security would be the amount which the owner might reasonably expect to receive from the sale on the applicable exchange or principal market. A variety of factors may be considered in determining the fair value of such securities.
ALPS ETF Trust
| Notes to Financial Statements and Financial Highlights | November 30, 2024 |
B. Fair Value Measurements
Each Fund discloses the classification of its fair value measurements following a three-tier hierarchy based on the inputs used to measure fair value. Inputs refer broadly to the assumptions that market participants would use in pricing the asset or liability; including assumptions about risk. Inputs may be observable or unobservable. Observable inputs reflect the assumptions market participants would use in pricing the asset or liability that are developed based on market data obtained from sources independent of the reporting entity. Unobservable inputs reflect the reporting entity’s own assumptions about the assumptions market participants would use in pricing the asset or liability that are developed based on the best information available.
Valuation techniques used to value the Funds’ investments by major category are as follows:
Equity securities, including restricted securities, for which market quotations are readily available, are valued at the last reported sale price or official closing price as reported by a third party pricing vendor on the primary market or exchange on which they are traded and are categorized as Level 1 in the hierarchy. In the event there were no sales during the day or closing prices are not available, securities are valued at the mean of the most recent quoted bid and ask prices on such day and are generally categorized as Level 2 in the hierarchy. Investments in open-end mutual funds are valued at their closing NAV each business day and are categorized as Level 1 in the hierarchy.
Changes in valuation techniques may result in transfers in or out of an assigned level within the disclosure hierarchy.
Various inputs are used in determining the value of each Fund’s investments as of the end of the reporting period. When inputs used fall into different levels of the fair value hierarchy, the level in the hierarchy within which the fair value measurement falls is determined based on the lowest level input that is significant to the fair value measurement in its entirety. The designated input levels are not necessarily an indication of the risk or liquidity associated with these investments.
These inputs are categorized in the following hierarchy under applicable financial accounting standards:
| Level 1 – | Unadjusted quoted prices in active markets for identical investments, unrestricted assets or liabilities that a Fund has the ability to access at the measurement date; |
| Level 2 – | Quoted prices which are not active, quoted prices for similar assets or liabilities in active markets or inputs other than quoted prices that are observable (either directly or indirectly) for substantially the full term of the asset or liability; and |
| Level 3 – | Significant unobservable prices or inputs (including the Fund’s own assumptions in determining the fair value of investments) where there is little or no market activity for the asset or liability at the measurement date. |
ALPS ETF Trust
| Notes to Financial Statements and Financial Highlights | November 30, 2024 |
The following is a summary of the inputs used to value the Funds’ investments as of November 30, 2024:
ALPS Clean Energy ETF
| Investments in Securities at Value | | Level 1 - Quoted and
Unadjusted Prices | | | Level 2 - Other Significant
Observable Inputs | | | Level 3 - Significant
Unobservable Inputs | | | Total | |
| Common Stocks* | | $ | 118,872,560 | | | $ | – | | | $ | – | | | $ | 118,872,560 | |
| Master Limited Partnerships* | | | 8,912,132 | | | | – | | | | – | | | | 8,912,132 | |
| Short Term Investments | | | 12,723,154 | | | | – | | | | – | | | | 12,723,154 | |
| Total | | $ | 140,507,846 | | | $ | – | | | $ | – | | | $ | 140,507,846 | |
ALPS Disruptive Technologies ETF
| Investments in Securities at Value | | Level 1 - Quoted and
Unadjusted Prices | | | Level 2 - Other Significant
Observable Inputs | | | Level 3 - Significant
Unobservable Inputs | | | Total | |
| Common Stocks* | | $ | 92,276,712 | | | $ | – | | | $ | – | | | $ | 92,276,712 | |
| Master Limited Partnerships* | | | 841,416 | | | | – | | | | – | | | | 841,416 | |
| Short Term Investments | | | 8,347,915 | | | | – | | | | – | | | | 8,347,915 | |
| Total | | $ | 101,466,043 | | | $ | – | | | $ | – | | | $ | 101,466,043 | |
ALPS Medical Breakthroughs ETF
| Investments in Securities at Value | | Level 1 - Quoted and
Unadjusted Prices | | | Level 2 - Other Significant
Observable Inputs | | | Level 3 - Significant
Unobservable Inputs | | | Total | |
| Common Stocks* | | $ | 123,260,451 | | | $ | – | | | $ | – | | | $ | 123,260,451 | |
| Short Term Investments | | | 14,263,615 | | | | – | | | | – | | | | 14,263,615 | |
| Total | | $ | 137,524,066 | | | $ | – | | | $ | – | | | $ | 137,524,066 | |
| * | For a detailed sector breakdown, see the accompanying Schedule of Investments. |
The Funds did not have any securities that used significant unobservable inputs (Level 3) in determining fair value and there were no transfers into or out of Level 3 during the year ended November 30, 2024.
C. Foreign Investment Risk
The Funds may directly purchase securities of foreign issuers. Investments in non-U.S. issuers may involve unique risks compared to investing in securities of U.S. issuers, including, among others, less liquidity generally, greater market volatility than U.S. securities and less complete financial information and less stringent accounting, corporate governance and financial reporting standards than for U.S. issuers. In addition, adverse political, economic, social, regulatory, business or environmental developments could undermine the value of the Fund’s investments or prevent the Fund from realizing the full value of its investments. Financial reporting standards for companies based in foreign markets differ from those in the United States. Finally, the value of the currency of the country in which the Fund has invested could decline relative to the value of the U.S. dollar, which may affect the value of the investment to U.S. investors. The Fund will not enter into transactions to hedge against declines in the value of the Fund’s assets that are denominated in foreign currency.
Countries with emerging markets may have relatively unstable governments and may present the risks of nationalization of businesses, restrictions on foreign ownership and prohibitions on the repatriation of assets. The economies of emerging markets countries also may be based on only a few industries, making them more vulnerable to changes in local or global trade conditions and more sensitive to debt burdens, inflation rates or adverse news and events.
Because foreign markets may be open on different days than the days during which investors may purchase the shares of the Fund, the value of the Funds’ securities may change on the days when investors are not able to purchase the shares of the Fund. The value of securities denominated in foreign currencies is converted into U.S. dollars using exchange rates determined daily as of the close of regular trading on the NYSE. Any use of a different rate from the rates used by the Index may adversely affect a Fund's ability to track its Index.
ALPS ETF Trust
| Notes to Financial Statements and Financial Highlights | November 30, 2024 |
D. Foreign Currency Translation
The books and records of the Funds are maintained in U.S. dollars. Investment valuations and other assets and liabilities initially expressed in foreign currencies are converted each business day into U.S. dollars based upon current exchange rates. The portion of realized and unrealized gains or losses on investments due to fluctuations in foreign currency exchange rates is not separately disclosed and is included in realized and unrealized gains or losses on investments, when applicable.
E. Securities Transactions and Investment Income
Securities transactions are recorded as of the trade date. Realized gains and losses from securities transactions are recorded on the specific identification in accordance with GAAP. Dividend income and capital gains distributions, if any, are recorded on the ex-dividend date, net of any foreign taxes withheld. Interest income, if any, is recorded on the accrual basis.
F. Dividends and Distributions to Shareholders
Dividends from net investment income for the ALPS Disruptive Technologies ETF, the ALPS Global Travel Beneficiaries ETF and the ALPS Medical Breakthroughs ETF, if any, are declared and paid annually or as the Board may determine from time to time. Dividends from net investment income for ALPS Clean Energy ETF, if any, are declared and paid quarterly or as the Board may determine from time to time. Distributions of net realized capital gains earned by the Funds, if any, are distributed at least annually.
G. Federal Tax and Tax Basis Information
The timing and character of income and capital gain distributions are determined in accordance with income tax regulations, which may differ from U.S. GAAP. Reclassifications are made to the Funds’ capital accounts for permanent tax differences to reflect income and gains available for distribution (or available capital loss carryforwards) under income tax regulations.
For the year ended November 30, 2024, the following reclassifications, which had no impact on results of operations or net assets, were recorded to reflect permanent tax differences resulting primarily from in-kind transactions, REIT true-up adjustment, and prior year tax return true-ups:
| Fund | | Paid-in Capital | | | Total Distributable
Earnings/(Accumulated Losses) | |
| ALPS Clean Energy ETF | | $ | (48,168,655 | ) | | $ | 48,168,655 | |
| ALPS Disruptive Technologies ETF | | | 5,907,999 | | | | (5,907,999 | ) |
| ALPS Medical Breakthroughs ETF | | | 4,362,501 | | | | (4,362,501 | ) |
The tax character of the distributions paid during the fiscal years ended November 30, 2024 and November 30, 2023 was as follows:
| Fund | | Ordinary Income | | | Long-Term Capital Gain | | | Return of Capital | |
| November 30, 2024 | | | | | | | | | | | | |
| ALPS Clean Energy ETF | | $ | 987,799 | | | $ | – | | | $ | 1,743,750 | |
| ALPS Disruptive Technologies ETF | | | 292,162 | | | | – | | | | – | |
| ALPS Medical Breakthroughs ETF | | | 220,286 | | | | – | | | | – | |
| Fund | | Ordinary Income | | | Long-Term Capital Gain | | | Return of Capital | |
| November 30, 2023 | | | | | | | | | | | | |
| ALPS Clean Energy ETF | | $ | 4,542,388 | | | $ | – | | | $ | 973,150 | |
| ALPS Disruptive Technologies ETF | | | 25,708 | | | | – | | | | – | |
| ALPS Medical Breakthroughs ETF | | | – | | | | – | | | | – | |
The character of distributions made during the year may differ from its ultimate characterization for federal income tax purposes.
Under current law, capital losses maintain their character as short-term or long-term and are carried forward to the next tax year without expiration.
ALPS ETF Trust
| Notes to Financial Statements and Financial Highlights | November 30, 2024 |
As of November 30, 2024, the following amounts are available as carry forwards to the next tax year:
| Fund | | Short-Term | | | Long-Term | |
| ALPS Clean Energy ETF | | $ | 119,474,159 | | | $ | 167,576,848 | |
| ALPS Disruptive Technologies ETF | | | 9,750,719 | | | | 20,430,005 | |
| ALPS Medical Breakthroughs ETF | | | 80,707,854 | | | | 57,273,292 | |
The ALPS Medical Breakthroughs ETF used capital loss carryovers during the year ended November 30, 2024 in the amount of $3,338,180.
As of November 30, 2024, the components of distributable earnings/(accumulated losses) on a tax basis were as follows:
| Fund | | | Accumulated Net
Investment Income | | | | Accumulated Net
Realized Gain/(Loss) on Investments | | | | Other Accumulated Losses(a) | | | | Net Unrealized
Appreciation/(Depreciation)
on Investments | | | | Total | |
| ALPS Clean Energy ETF | | $ | – | | | $ | (287,051,007 | ) | | $ | – | | | $ | (169,562,474 | ) | | $ | (456,613,481 | ) |
| ALPS Disruptive Technologies ETF | | | 236,347 | | | | (30,180,724 | ) | | | – | | | | 9,963,321 | | | | (19,981,056 | ) |
| ALPS Medical Breakthroughs ETF | | | 1,450,405 | | | | (137,981,146 | ) | | | – | | | | 4,063,576 | | | | (132,467,165 | ) |
| (a) | Other accumulated losses represents late year ordinary losses the Fund elects to defer to the year ending November 30, 2025. |
As of November 30, 2024, the cost of investments for federal income tax purposes and accumulated net unrealized appreciation/(depreciation) on investments were as follows:
| Fund | | ALPS Clean Energy ETF | | | ALPS Disruptive
Technologies ETF | | | ALPS Medical
Breakthroughs ETF | |
| Gross appreciation (excess of value over tax cost) | | $ | 408,126 | | | $ | 22,514,414 | | | $ | 22,894,164 | |
| Gross depreciation (excess of tax cost over value) | | | (169,970,620 | ) | | | (12,551,133 | ) | | | (18,830,588 | ) |
| Net appreciation/(depreciation) of foreign currency | | | 20 | | | | 40 | | | | – | |
| Net unrealized appreciation/(depreciation) | | $ | (169,562,474 | ) | | $ | 9,963,321 | | | $ | 4,063,576 | |
| Cost of investments for income tax purposes | | $ | 310,070,340 | | | $ | 91,502,762 | | | $ | 133,460,490 | |
The differences between book-basis and tax-basis are primarily due to the deferral of losses from wash sales, investments in passive foreign investment companies (PFICs), and investments in partnerships.
H. Income Taxes
No provision for income taxes is included in the accompanying financial statements, as each Fund intends to distribute to shareholders all taxable investment income and realized gains and otherwise comply with Subchapter M of the Internal Revenue Code of 1986, as amended, applicable to regulated investment companies. Each Fund evaluates tax positions taken (or expected to be taken) in the course of preparing the Fund’s tax returns to determine whether these positions meet a “more-likely-than-not” standard that, based on the technical merits, have a more than fifty percent likelihood of being sustained by a taxing authority upon examination. A tax position that meets the “more-likely-than-not” recognition threshold is measured to determine the amount of benefit to recognize in the financial statements.
As of and during the year ended November 30, 2024, each Fund did not have a liability for any unrecognized tax benefits. Each Fund files U.S. federal, state, and local tax returns as required. Each Fund’s tax returns are subject to examination by the relevant tax authorities until expiration of the applicable statute of limitations, which is generally three years after the filing of the tax return, but may extend to four years in certain jurisdictions. Tax returns for open years have incorporated no uncertain tax positions that require a provision for income taxes.
ALPS ETF Trust
| Notes to Financial Statements and Financial Highlights | November 30, 2024 |
I. Lending of Portfolio Securities
The Funds have entered into a securities lending agreement with State Street Bank & Trust Co. (“SSB”), the Funds’ lending agent. Each Fund may lend their portfolio securities only to borrowers that are approved by SSB. Each Fund will limit such lending to not more than 33 1/3% of the value of its total assets. Each Funds’ securities held at SSB as custodian shall be available to be lent except those securities the Fund or ALPS Advisors, Inc. specifically identifies in writing as not being available for lending. The borrower pledges and maintains with each Fund collateral consisting of cash (U.S. Dollars only), securities issued or guaranteed by the U.S. government or its agencies or instrumentalities, and cash equivalents (including irrevocable bank letters of credit) issued by a person other than the borrower or an affiliate of the borrower. The initial collateral received by each Fund is required to have a value of no less than 102% of the market value of the loaned securities for U.S equity securities and a value of no less than 105% of the market value for non-U.S. equity securities. The collateral is maintained thereafter, at a market value equal to not less than 102% of the current value of the U.S. equity securities on loan and not less than 105% of the current value of the non-U.S. equity securities on loan. The market value of the loaned securities is determined at the close of each business day and any additional required collateral is delivered to each Fund on the next business day. During the term of the loan, each Fund is entitled to all distributions made on or in respect of the loaned securities. Loans of securities are terminable at any time and the borrower, after notice, is required to return borrowed securities within the customary time period for settlement of securities transactions.
Any cash collateral received is reinvested in a money market fund managed by SSB as disclosed in each Fund’s Schedule of Investments and is reflected in the Statements of Assets and Liabilities as a payable for collateral upon return of securities loaned. Non-cash collateral, in the form of securities issued or guaranteed by the U.S. government or its agencies or instrumentalities, is not disclosed in a Fund’s Statements of Assets and Liabilities or the contractual maturity table below as it is held by the lending agent on behalf of each Fund, and each Fund does not have the ability to re-hypothecate these securities. Income earned by each Fund from securities lending activity is disclosed in the Statement of Operations.
The following is a summary of each Fund's securities lending agreement and related cash and non-cash collateral received as of November 30, 2024:
| Fund | | Market Value of
Securities on Loan | | | Cash Collateral
Received | | | Non-Cash Collateral
Received | | | Total Collateral
Received | |
| ALPS Clean Energy ETF | | $ | 31,878,093 | | | $ | 12,700,867 | | | $ | 19,817,799 | | | $ | 32,518,666 | |
| ALPS Disruptive Technologies ETF | | | 10,751,577 | | | | 8,189,037 | | | | 2,926,130 | | | | 11,115,167 | |
| ALPS Medical Breakthroughs ETF | | | 29,525,587 | | | | 14,263,615 | | | | 15,868,715 | | | | 30,132,330 | |
The risks of securities lending include the risk that the borrower may not provide additional collateral when required or may not return the securities when due. To mitigate these risks, each Fund benefits from a borrower default indemnity provided by SSB. SSB’s indemnity allows for full replacement of securities lent wherein SSB will purchase the unreturned loaned securities on the open market by applying the proceeds of the collateral or to the extent such proceeds are insufficient or the collateral is unavailable, SSB will purchase the unreturned loan securities at SSB’s expense. However, the Funds could suffer a loss if the value of the investments purchased with cash collateral falls below the value of the cash collateral received.
ALPS ETF Trust
| Notes to Financial Statements and Financial Highlights | November 30, 2024 |
The following tables reflect a breakdown of transactions accounted for as secured borrowings, the gross obligation by the type of collateral pledged or securities loaned, and the remaining contractual maturity of those transactions as of November 30, 2024:
| ALPS Clean Energy ETF | | | | | Remaining Contractual Maturity of the Agreements | | | |
| Securities Lending Transactions | | Overnight &
Continuous | | | Up to 30 Days | | 30-90 Days | | | Greater than
90 Days | | | Total | |
| Common Stocks | | $ | 12,700,867 | | $ | – | | $ | – | | | $ | – | | | $ | 12,700,867 | |
| Total Borrowings | | | | | | | | | | | | | | | | | 12,700,867 | |
| Gross amount of recognized liabilities for securities lending (collateral received) | | | | | | | $ | 12,700,867 | |
| ALPS Disruptive Technologies ETF | | | | | Remaining Contractual Maturity of the Agreements | | | |
| Securities Lending Transactions | | Overnight &
Continuous | | | Up to 30 Days | | 30-90 Days | | | Greater than
90 Days | | | Total | |
| Common Stocks | | $ | 8,189,037 | | $ | – | | $ | – | | | $ | – | | | $ | 8,189,037 | |
| Total Borrowings | | | | | | | | | | | | | | | | | 8,189,037 | |
| Gross amount of recognized liabilities for securities lending (collateral received) | | | | | | | $ | 8,189,037 | |
| ALPS Medical Breakthroughs ETF | | | | | Remaining Contractual Maturity of the Agreements | | | |
| Securities Lending Transactions | | Overnight &
Continuous | | | Up to 30 Days | | 30-90 Days | | | Greater than
90 Days | | | Total | |
| Common Stocks | | $ | 14,263,615 | | $ | – | | $ | – | | | $ | – | | | $ | 14,263,615 | |
| Total Borrowings | | | | | | | | | | | | | | | | | 14,263,615 | |
| Gross amount of recognized liabilities for securities lending (collateral received) | | | | | | | $ | 14,263,615 | |
3. INVESTMENT ADVISORY FEE AND OTHER AFFILIATED TRANSACTIONS
ALPS Advisors, Inc. serves as the Funds’ investment adviser pursuant to an Investment Advisory Agreement with the Trust on behalf of each Fund (the “Advisory Agreement”). Pursuant to the Advisory Agreement, each Fund pays the Adviser an annual management fee for the services and facilities it provides, payable on a monthly basis as a percentage of the relevant Fund’s average daily net assets as set out below. From time to time, the Adviser may waive all or a portion of its fee.
| Fund | | Advisory Fee |
| ALPS Clean Energy ETF | | 0.55% |
| ALPS Disruptive Technologies ETF | | 0.50% |
| ALPS Medical Breakthroughs ETF | | 0.50% |
Out of the unitary management fee, the Adviser pays substantially all expenses of each Fund, including licensing fees to the Underlying Index provider, the cost of transfer agency, custody, fund administration, legal, audit, trustees and other services, except for interest expenses, distribution fees or expenses, brokerage expenses, taxes and extraordinary expenses not incurred in the ordinary course of each Fund's business. The Adviser’s unitary management fee is designed to pay substantially all of each Fund's expenses and to compensate the Adviser for providing services for each Fund.
ALPS Fund Services, Inc., an affiliate of the Adviser, is the administrator for the Funds.
Each Trustee receives (1) a quarterly retainer of $25,000, (2) a per meeting fee of $15,000, (3) $2,500 for any special meeting held outside of a regularly scheduled board meeting, and (4) reimbursement for all reasonable out-of-pocket expenses relating to attendance at meetings. In addition, the Chairman of the Board receives a quarterly retainer of $5,000, the Chairman of the Audit Committee receives a quarterly retainer of $3,000, and the Chairman of the Nominating & Governance Committee receives a quarterly retainer of $2,000, each in connection with their respective roles.
ALPS ETF Trust
| Notes to Financial Statements and Financial Highlights | November 30, 2024 |
4. PURCHASES AND SALES OF SECURITIES
For the year ended November 30, 2024, the cost of purchases and proceeds from sales of investment securities, excluding short-term investments and in-kind transactions, were as follows:
| Fund | | Purchases | | | Sales | |
| ALPS Clean Energy ETF | | $ | 68,902,012 | | | $ | 69,468,642 | |
| ALPS Disruptive Technologies ETF | | | 33,561,427 | | | | 34,379,993 | |
| ALPS Medical Breakthroughs ETF | | | 78,104,911 | | | | 78,486,206 | |
For the year ended November 30, 2024, the cost of in-kind purchases and proceeds from in-kind sales were as follows:
| Fund | | Purchases | | | Sales | |
| ALPS Clean Energy ETF | | $ | 135,993,970 | | | $ | 248,271,665 | |
| ALPS Disruptive Technologies ETF | | | 3,025,085 | | | | 24,396,018 | |
| ALPS Medical Breakthroughs ETF | | | 19,662,117 | | | | 18,326,815 | |
For the year ended November 30, 2024, the in-kind net realized gain/(losses) were as follows:
| Fund | | Net Realized Gain/(Loss) | |
| ALPS Clean Energy ETF | | $ | (42,946,925 | ) |
| ALPS Disruptive Technologies ETF | | | 6,249,596 | |
| ALPS Medical Breakthroughs ETF | | | 5,026,467 | |
Gains on in-kind transactions are not considered taxable for federal income tax purposes and losses on in-kind transactions are also not deductible for tax purposes.
5. CAPITAL SHARE TRANSACTIONS
Shares are created and redeemed by each Fund only in Creation Unit size aggregations of 25,000 Shares. Only broker-dealers or large institutional investors with creation and redemption agreements called Authorized Participants (“AP”) are permitted to purchase or redeem Creation Units from the Funds. Such transactions are generally permitted on an in-kind basis, with a balancing cash component to equate the transaction to the NAV per unit of each Fund on the transaction date. Cash may be substituted equivalent to the value of certain securities generally when they are not available in sufficient quantity for delivery, not eligible for trading by the AP or as a result of other market circumstances.
6. RELATED PARTY TRANSACTIONS
The ALPS Clean Energy ETF engaged in cross trades between other funds in the Trust during the year ended November 30, 2024 pursuant to Rule 17a-7 under the 1940 Act. Cross trading is the buying or selling of portfolio securities between funds to which the Adviser serves as the investment adviser. The Board previously adopted procedures that apply to transactions between the Funds of the Trust pursuant to Rule 17a-7. These transactions related to cross trades during the period complied with the requirements set forth by Rule 17a-7 and the Trust’s procedures.
Transactions related to cross trades during the year ended November 30, 2024, were as follows:
| | | | Purchase cost paid | | | Sale proceeds received | | | Realized gain/(loss) on sales |
| ALPS Clean Energy ETF | | $ | 164,502 | | $ | 147,253 | | $ | (229,029) |
ALPS ETF Trust
| Notes to Financial Statements and Financial Highlights | November 30, 2024 |
7. MARKET RISK
The Funds are subject to investment and operational risks associated with financial, economic and other global market developments and disruptions, including those arising from war, terrorism, market manipulation, government interventions, defaults and shutdowns, political changes or diplomatic developments, public health emergencies (such as the spread of infectious diseases, pandemics and epidemics) and natural/environmental disasters, which can negatively impact the securities markets and cause each Fund to lose value. Securities in each Fund's portfolio may underperform in comparison to securities in general financial markets, a particular financial market or other asset classes due to a number of factors, including inflation (or expectations for inflation), deflation (or expectations for deflation), interest rates, global demand for particular products or resources, market instability, debt crises and downgrades, embargoes, tariffs, sanctions and other trade barriers, regulatory events, other governmental trade or market control programs and related geopolitical events. In addition, the value of the Fund's investments may be negatively affected by the occurrence of global events such as war, terrorism, environmental disasters, natural disasters or events, country instability, and infectious disease epidemics or pandemics.
8. CONCENTRATION RISK
Each Fund seeks to track an underlying index, which itself may have concentration in certain regions, economies, countries, markets, industries or sectors. Underperformance or increased risk in such concentrated areas may result in underperformance or increased risk in the Funds.
9. SUBSEQUENT EVENTS
Subsequent events, if any, after the date of the Statements of Assets and Liabilities have been evaluated through the date the financial statements were issued. Management has determined that there were no subsequent events to report through the issuance of these financial statements.
| ALPS ETF Trust |
| Report of Independent Registered Public Accounting Firm |
To the Shareholders of ALPS Clean Energy ETF, ALPS Disruptive Technologies ETF
and ALPS Medical Breakthroughs ETF
and Board of Trustees of ALPS ETF Trust
Opinion on the Financial Statements
We have audited the accompanying statements of assets and liabilities, including the schedules of investments, of ALPS Clean Energy ETF, ALPS Disruptive Technologies ETF, and ALPS Medical Breakthroughs ETF (the “Funds”), each a series of ALPS ETF Trust, as of November 30, 2024, the related statements of operations for the year then ended, the statements of changes in net assets and financial highlights for each of the two years in the period then ended, and the related notes (collectively referred to as the “financial statements”). In our opinion, the financial statements present fairly, in all material respects, the financial position of each of the Funds as of November 30, 2024, the results of their operations for the year then ended, and the changes in net assets and financial highlights for each of the two years in the period then ended, in conformity with accounting principles generally accepted in the United States of America.
The Funds’ financial highlights for the years ended November 30, 2022, and prior, were audited by other auditors whose report dated January 27, 2023, expressed an unqualified opinion on those financial highlights.
Basis for Opinion
These financial statements are the responsibility of the Funds’ management. Our responsibility is to express an opinion on the Funds’ financial statements based on our audits. We are a public accounting firm registered with the Public Company Accounting Oversight Board (United States) (“PCAOB”) and are required to be independent with respect to the Funds in accordance with the U.S. federal securities laws and the applicable rules and regulations of the Securities and Exchange Commission and the PCAOB.
We conducted our audits in accordance with the standards of the PCAOB. Those standards require that we plan and perform the audit to obtain reasonable assurance about whether the financial statements are free of material misstatement whether due to error or fraud.
Our audits included performing procedures to assess the risks of material misstatement of the financial statements, whether due to error or fraud, and performing procedures that respond to those risks. Such procedures included examining, on a test basis, evidence regarding the amounts and disclosures in the financial statements. Our procedures included confirmation of securities owned as of November 30, 2024, by correspondence with the custodian and brokers; when replies were not received from brokers, we performed other auditing procedures. Our audits also included evaluating the accounting principles used and significant estimates made by management, as well as evaluating the overall presentation of the financial statements. We believe that our audits provide a reasonable basis for our opinion.
We have served as the auditor of one or more investment companies advised by ALPS Advisors, Inc. since 2013.

COHEN & COMPANY, LTD.
Philadelphia, Pennsylvania
January 29, 2025
| ALPS ETF Trust | |
| Additional Information | November 30, 2024 (Unaudited) |
TAX INFORMATION
The Funds designate the following as a percentage of taxable ordinary income distributions, or up to the maximum amount allowable, for the calendar year ended December 31, 2023:
| Fund | Qualified Dividend Income | Dividend Received Deduction |
| ALPS Clean Energy ETF | 46.93% | 0.00% |
| ALPS Disruptive Technologies ETF | 100.00% | 52.16% |
| ALPS Medical Breakthroughs ETF | 0.00% | 0.00% |
In early 2024, if applicable, shareholders of record received this information for the distributions paid to them by the Funds during the calendar year 2023 via Form 1099. The Funds will notify shareholders in early 2025 of amounts paid to them by the Funds, if any, during the calendar year 2024.
LICENSING AGREEMENT
ALPS Clean Energy ETF
CIBC NTC is the designer of the construction and methodology for the Underlying Index. “CIBC NTC” and “CIBC Atlas Clean Energy Index” are service marks or trademarks of the Index Provider. CIBC NTC acts as brand licensor for the Underlying Index and is not responsible for the descriptions of the Fund that appear herein.
The Fund is not sponsored by CIBC NTC or any of its affiliates. CIBC NTC makes no representation or warranty, express or implied, to the owners of the Fund or any member of the public regarding the advisability of investing in securities or commodities generally or in the Fund particularly. CIBC NTC does not guarantee the quality, accuracy or completeness of the Underlying Index or any Underlying Index data included herein or derived therefrom and assumes no liability in connection with their use. The Underlying Index is determined and composed without regard to the Adviser or the Fund. CIBC NTC has no obligation to take the needs of the Adviser, the Fund or the shareholders of the Fund into consideration in determining, composing or calculating the Underlying Index. CIBC NTC is not responsible for and has not participated in the determination of the timing of, prices at, or quantities of the Fund to be issued or in the determination or calculation of the equation by which the Fund is to be converted into cash. CIBC NTC has no obligation or liability in connection with the administration, marketing or trading of the Fund and is not responsible for and has not participated in the determination of pricing or the timing of the issuance or sale of the Shares of the Fund or in the determination or calculation of the NAV of the Fund.
CIBC NTC has no obligation or liability in connection with the administration, marketing or trading of the Fund. CIBC NTC makes no warranty, express or implied, as to results to be obtained by the Adviser, the Fund, Fund shareholders or any other person or entity from the use of the Underlying Index or any data included therein. CIBC NTC makes no express or implied warranties, and expressly disclaims all warranties of merchantability or fitness for a particular purpose or use with respect to the Underlying Index or any data included therein. Without limiting any of the foregoing, in no event shall CIBC NTC have any liability for any special, punitive, indirect, or consequential damages (including lost profits) arising out of matters relating to the use of the Underlying Index, even if notified of the possibility of such damages.
All intellectual property rights in the Underlying Index vests in CIBC NTC.
The Underlying Index is the property of CIBC NTC, which has contracted with S&P Opco, LLC (a subsidiary of S&P Dow Jones Indices LLC) to calculate and maintain the Underlying Index. The Underlying Index is not sponsored by S&P Dow Jones Indices or its affiliates or its third party licensors (collectively, “S&P Dow Jones Indices”). S&P Dow Jones Indices will not be liable for any errors or omissions in calculating the Underlying Index. “Calculated by S&P Dow Jones Indices” and the related stylized mark(s) are service marks of S&P Dow Jones Indices and have been licensed for use by CIBC NTC. S&P® is a registered trademark of Standard & Poor’s Financial Services LLC (“SPFS”), and Dow Jones® is a registered trademark of Dow Jones Trademark Holdings LLC (“Dow Jones”).
The Fund is not sponsored, endorsed, sold or promoted by S&P Dow Jones Indices. S&P Dow Jones Indices does not make any representation or warranty, express or implied, to the owners of the Fund or any member of the public regarding the advisability of investing in securities generally or in the Fund particularly or the ability of the Underlying Index to track general market performance. S&P Dow Jones Indices’ only relationship to CIBC NTC with respect to the Underlying Index is the licensing of certain trademarks, service marks and trade names of S&P Dow Jones Indices, and the provision of the calculation services related to the Underlying Index. S&P Dow Jones Indices is not responsible for and has not participated in the determination of the prices and amount of the Fund or the timing of the issuance or sale of the Fund or in the determination or calculation of the equation by which the Fund may be converted into cash or other redemption mechanics. S&P Dow Jones Indices has no obligation or liability in connection with the administration, marketing or trading of the Fund. S&P Dow Jones Indices LLC is not an investment advisor. Inclusion of a security within the Underlying Index is not a recommendation by S&P Dow Jones Indices to buy, sell, or hold such security, nor is it investment advice.
| ALPS ETF Trust | |
| Additional Information | November 30, 2024 (Unaudited) |
S&P DOW JONES INDICES DOES NOT GUARANTEE THE ADEQUACY, ACCURACY, TIMELINESS AND/OR THE COMPLETENESS OF THE UNDERLYING INDEX OR ANY DATA RELATED THERETO OR ANY COMMUNICATION WITH RESPECT THERETO, INCLUDING, ORAL, WRITTEN, OR ELECTRONIC COMMUNICATIONS. S&P DOW JONES INDICES SHALL NOT BE SUBJECT TO ANY DAMAGES OR LIABILITY FOR ANY ERRORS, OMISSIONS, OR DELAYS THEREIN. S&P DOW JONES INDICES MAKES NO EXPRESS OR IMPLIED WARRANTIES, AND EXPRESSLY DISCLAIMS ALL WARRANTIES, OF MERCHANTABILITY OR FITNESS FOR A PARTICULAR PURPOSE OR USE OR AS TO RESULTS TO BE OBTAINED BY CIBC NTC, OWNERS OF THE FUND, OR ANY OTHER PERSON OR ENTITY FROM THE USE OF THE UNDERLYING INDEX OR WITH RESPECT TO ANY DATA RELATED THERETO. WITHOUT LIMITING ANY OF THE FOREGOING, IN NO EVENT WHATSOEVER SHALL S&P DOW JONES INDICES BE LIABLE FOR ANY INDIRECT, SPECIAL, INCIDENTAL, PUNITIVE, OR CONSEQUENTIAL DAMAGES, INCLUDING BUT NOT LIMITED TO, LOSS OF PROFITS, TRADING LOSSES, LOST TIME, OR GOODWILL, EVEN IF THEY HAVE BEEN ADVISED OF THE POSSIBILITY OF SUCH DAMAGES, WHETHER IN CONTRACT, TORT, STRICT LIABILITY, OR OTHERWISE.
The Index Provider is not affiliated with the Trust, the Adviser or ALPS Portfolio Solutions Distributor, Inc. (the “Distributor”). The Index Provider has entered into a license agreement with the Adviser (the “License Agreement”). The use of the Underlying Index by the Adviser and the Fund is subject to the terms of the License Agreement, which impose certain limitations and conditions on the Fund’s ability to use the Underlying Index.
The Adviser does not guarantee the accuracy and/or the completeness of the Underlying Index or any data included therein, and the Adviser shall have no liability for any errors, omissions or interruptions therein. The Adviser makes no warranty, express or implied, as to results to be obtained by the Fund, owners of the Shares of the Fund or any other person or entity from the use of the Underlying Index or any data included therein. The Adviser makes no express or implied warranties, and expressly disclaims all warranties of merchantability or fitness for a particular purpose or use with respect to the Underlying Index or any data included therein. Without limiting any of the foregoing, in no event shall the Adviser have any liability for any special, punitive, direct, indirect, or consequential damages (including lost profits) arising out of matters relating to the use of the Underlying Index, even if notified of the possibility of such damages.
ALPS Disruptive Technologies ETF
“Indxx” is a service mark of Indxx, LLC (“Indxx” or the “Index Provider”) and has been licensed for use for certain purposes by ALPS Advisors, Inc. (the “Adviser”).
The ALPS Disruptive Technologies ETF is not sponsored, endorsed, sold or promoted by Indxx. Indxx makes no representation or warranty, express or implied, to the owners of the ALPS Disruptive Technologies ETF or any member of the public regarding the advisability of investing in securities generally or in the ALPS Disruptive Technologies ETF particularly. Indxx has no obligation to take the needs of ALPS Advisors, Inc. or the shareholders of ALPS Disruptive Technologies ETF into consideration in determining, composing, or calculating the Underlying Index. Indxx is not responsible for and has not participated in the determination of the timing, amount or pricing of the ALPS Disruptive Technologies ETF shares to be issued or in the determination or calculation of the equation by which the ALPS Disruptive Technologies ETF is to be converted into cash. Indxx has no obligation or liability in connection with the administration, marketing or trading of the ALPS Disruptive Technologies ETF.
INDXX MAKES NO WARRANTY, EXPRESS OR IMPLIED, AS TO THE RESULTS TO BE OBTAINED BY ANY PERSON OR ENTITY FROM THE USE OF THE INDEX(ES), TRADING BASED ON THE INDEX(ES), OR ANY DATA INCLUDED THEREIN IN CONNECTION WITH THE PRODUCTS, OR FOR ANY OTHER USE. INDXX EXPRESSLY DISCLAIMS ALL WARRANTIES AND CONDITIONS, EXPRESS, STATUTORY, OR IMPLIED, EXCEPT AS SET FORTH IN THIS AGREEMENT. EXCEPT AS OTHERWISE SPECIFICALLY SET FORTH IN THIS AGREEMENT, INDXX HEREBY EXPRESSLY DISCLAIMS ALL IMPLIED WARRANTIES AND CONDITIONS OF MERCHANTABILITY, TITLE, OR FITNESS FOR A PARTICULAR PURPOSE OR USE WITH RESPECT TO THE INDEX(ES) OR ANY DATA INCLUDED THEREIN. INDXX DOES NOT GUARANTEE THE ACCURACY AND/OR THE COMPLETENESS OF ANY DATA SUPPLIED BY IT OR ANY DATA INCLUDED THEREIN. INDXX MAKES NO WARRANTY, EXPRESS OR IMPLIED, AS TO RESULTS TO BE OBTAINED BY THE FUNDS, ITS SHAREHOLDERS OR AFFILIATES, OR ANY OTHER PERSON OR ENTITY FROM THE USE OF THE DATA SUPPLIED BY INDXX OR ANY DATA INCLUDED THEREIN. INDXX MAKES NO EXPRESS OR IMPLIED WARRANTIES, AND EXPRESSLY DISCLAIMS ALL WARRANTIES OF MERCHANTABILITY OR FITNESS FOR A PARTICULAR PURPOSE OR USE WITH RESPECT TO THE DATA SUPPLIED BY INDXX OR ANY DATA INCLUDED THEREIN. WITHOUT LIMITING ANY OF THE FOREGOING, IN NO EVENT SHALL INDXX HAVE ANY LIABILITY FOR ANY SPECIAL, PUNITIVE, INDIRECT, OR CONSEQUENTIAL DAMAGES (INCLUDING LOST PROFITS), EVEN IF NOTIFIED OF THE POSSIBILITY OF SUCH DAMAGES.
The Adviser does not guarantee the accuracy and/or the completeness of the Underlying Index or any data included therein, and the Adviser shall have no liability for any errors, omissions or interruptions therein. The Adviser makes no warranty, express or implied, as to results to be obtained by the Fund, owners of the Shares of the Fund or any other person or entity from the use of the Underlying Index or any data included therein. Adviser makes no express or implied warranties, and expressly disclaims all warranties of merchantability or fitness for a particular purpose or use with respect to the Underlying Index or any data included therein. Without limiting any of the foregoing, in no event shall the Adviser have any liability for any special, punitive, direct, indirect or consequential damages (including lost profits) arising out of matters relating to the use of the Underlying Index, even if notified of the possibility of such damages.
| ALPS ETF Trust | |
| Additional Information | November 30, 2024 (Unaudited) |
ALPS Medical Breakthroughs ETF
The Fund is not sponsored, endorsed, sold or promoted by S-Network Global Indexes, Inc. (“Licensor”). Licensor makes no representation or warranty, express or implied, to the owners of the Fund or any member of the public regarding the advisability of investing in securities generally or in the Fund particularly or the ability of the Underlying Index to track the performance of the physical commodities market. Licensor’s only relationship to the Licensee is the licensing of certain service marks and trade names of Licensor and of the Underlying Index that is determined, composed and calculated by Licensor without regard to the Licensee or the Fund. Licensor has no obligation to take the needs of the Licensee or the owners of the Fund into consideration in determining, composing or calculating the Underlying Index. Licensor is not responsible for and has not participated in the determination of the timing of, prices at, or quantities of the Fund to be issued or in the determination or calculation of the equation by which the Fund is to be converted into cash. Licensor has no obligation or liability in connection with the administration, marketing or trading of the Fund.
LICENSOR DOES NOT GUARANTEE THE ACCURACY AND/OR THE COMPLETENESS OF THE UNDERLYING INDEX OR ANY DATA INCLUDED THEREIN AND LICENSOR SHALL HAVE NO LIABILITY FOR ANY ERRORS, OMISSIONS, OR INTERRUPTIONS THEREIN. LICENSOR MAKES NO WARRANTY, EXPRESS OR IMPLIED, AS TO RESULTS TO BE OBTAINED BY LICENSEE, OWNERS OF THE FUND, OR ANY OTHER PERSON OR ENTITY FROM THE USE OF THE UNDERLYING INDEX OR ANY DATA INCLUDED THEREIN. LICENSOR MAKES NO EXPRESS OR IMPLIED WARRANTIES, AND EXPRESSLY DISCLAIMS ALL WARRANTIES OF MERCHANTABILITY OR FITNESS FOR A PARTICULAR PURPOSE OR USE WITH RESPECT TO THE UNDERLYING INDEX OR ANY DATA INCLUDED THEREIN. WITHOUT LIMITING ANY OF THE FOREGOING, IN NO EVENT SHALL LICENSOR HAVE ANY LIABILITY FOR ANY SPECIAL, PUNITIVE, INDIRECT, OR CONSEQUENTIAL DAMAGES (INCLUDING LOST PROFITS), EVEN IF NOTIFIED OF THE POSSIBILITY OF SUCH DAMAGES.
Standard & Poor’s Custom Indexes serves as calculation agent for the Index. The Fund is not sponsored, endorsed, sold or promoted by Standard & Poor’s, a division of The McGraw-Hill Companies, Inc. (“S&P”) or its third party licensors. Neither S&P nor its third party licensors make any representation or warranty, express or implied, to the owners of the Fund or any member of the public regarding the advisability of investing in securities generally or in the Fund particularly or the ability of the Underlying Index to track general stock market performance. S&P’s and its third party licensor’s only relationship to S-Network Global Indexes, Inc. is the licensing of certain trademarks, service marks and trade names of S&P and/or its third party licensors and for the providing of calculation and maintenance services related to the Underlying Index. Neither S&P nor its third party licensors is responsible for and has not participated in the determination of the prices and amount of the Fund or the timing of the issuance or sale of the Fund or in the determination or calculation of the equation by which the Fund is to be converted into cash. S&P has no obligation or liability in connection with the administration, marketing or trading of the Fund.
NEITHER S&P, ITS AFFILIATES NOR THEIR THIRD PARTY LICENSORS GUARANTEE THE ADEQUACY, ACCURACY, TIMELINESS OR COMPLETENESS OF THE UNDERLYING INDEX OR ANY DATA INCLUDED THEREIN OR ANY COMMUNICATIONS, INCLUDING BUT NOT LIMITED TO, ORAL OR WRITTEN COMMUNICATIONS (INCLUDING ELECTRONIC COMMUNICATIONS) WITH RESPECT THERETO. S&P, ITS AFFILIATES AND THEIR THIRD PARTY LICENSORS SHALL NOT BE SUBJECT TO ANY DAMAGES OR LIABILITY FOR ANY ERRORS, OMISSIONS OR DELAYS THEREIN. S&P MAKES NO EXPRESS OR IMPLIED WARRANTIES, AND EXPRESSLY DISCLAIMS ALL WARRANTIES OF MERCHANTABILITY OR FITNESS FOR A PARTICULAR PURPOSE OR USE WITH RESPECT TO ITS TRADEMARKS, THE UNDERLYING INDEX OR ANY DATA INCLUDED THEREIN. WITHOUT LIMITING ANY OF THE FOREGOING, IN NO EVENT WHATSOEVER SHALL S&P, ITS AFFILIATES OR THEIR THIRD PARTY LICENSORS BE LIABLE FOR ANY INDIRECT, SPECIAL, INCIDENTAL, PUNITIVE OR CONSEQUENTIAL DAMAGES, INCLUDING BUT NOT LIMITED TO, LOSS OF PROFITS, TRADING LOSSES, LOST TIME OR GOODWILL, EVEN IF THEY HAVE BEEN ADVISED OF THE POSSIBILITY OF SUCH DAMAGES, WHETHER IN CONTRACT, TORT, STRICT LIABILITY OR OTHERWISE.
Standard & Poor’s®, and S&P® are registered trademarks of The McGraw-Hill Companies, Inc.; “Calculated by S&P Custom Indices” and its related stylized mark are service marks of The McGraw-Hill Companies, Inc. These marks have been licensed for use by S-Network Global Indexes, Inc.
The Adviser does not guarantee the accuracy and/or the completeness of the Underlying Index or any data included therein, and the Adviser shall have no liability for any errors, omissions or interruptions therein. The Adviser makes no warranty, express or implied, as to results to be obtained by the Fund, owners of the Shares of the Fund or any other person or entity from the use of the Underlying Index or any data included therein. The Adviser makes no express or implied warranties, and expressly disclaims all warranties of merchantability or fitness for a particular purpose or use with respect to the Underlying Index or any data included therein. Without limiting any of the foregoing, in no event shall the Adviser have any liability for any special, punitive, direct, indirect, or consequential damages (including lost profits) arising out of matters relating to the use of the Underlying Index, even if notified of the possibility of such damages.
| ALPS ETF Trust | |
Changes in and Disagreements with Accountants
for Open-End Management Investment Companies | November 30, 2024 (Unaudited) |
On March 14, 2023, BBD LLP (“BBD”) ceased to serve as the independent registered public accounting firm of the Funds. The Board approved the replacement of BBD as a result of Cohen & Company, Ltd.’s (“Cohen”) acquisition of BBD’s investment management group.
The report of BBD on the financial statements of the Funds as of and for the fiscal year or period ended November 30, 2022 did not contain an adverse opinion or a disclaimer of opinion, and was not qualified or modified as to uncertainties, audit scope or accounting principles. During the fiscal year or period ended November 30, 2022, and during the subsequent interim period through March 14, 2023: (i) there were no disagreements between the registrant and BBD on any matter of accounting principles or practices, financial statement disclosure, or auditing scope or procedure, which disagreements, if not resolved to the satisfaction of BBD, would have caused it to make reference to the subject matter of the disagreements in its report on the financial statements of the Funds for such years or interim period; and (ii) there were no “reportable events,” as defined in Item 304(a)(1)(v) of Regulation S-K under the Securities Exchange Act of 1934, as amended.
On March 7, 2023, upon the recommendation of the Funds’ Audit Committee, the Board approved the appointment of Cohen, effective upon the resignation of BBD, as the Funds’ independent registered public accounting firm for the fiscal year ending November 30, 2023.
During the fiscal year or period ended November 30, 2022, and during the subsequent interim period through March 14, 2023, neither the registrant, nor anyone acting on its behalf, consulted with Cohen on behalf of the Funds regarding the application of accounting principles to a specified transaction (either completed or proposed), the type of audit opinion that might be rendered on the Funds’ financial statements, or any matter that was either: (i) the subject of a “disagreement,” as defined in Item 304(a)(1)(iv) of Regulation S-K and the instructions thereto; or (ii) “reportable events,” as defined in Item 304(a)(1)(v) of Regulation S-K.
| ALPS ETF Trust | |
Proxy Disclosures for
Open-End Management Investment Companies | November 30, 2024 (Unaudited) |
A Special Meeting of Shareholders of the Funds, each a series of the Trust was held on July 19, 2024. At the meeting, the following matters were voted on by the Shareholders. The results of the Special Meeting of Shareholders are noted below:
Proposal 1: To elect seven Trustees.
| Shares Voted in Favor | Shares Voted Against/
Withheld or Abstentions | Proposal Approved |
| Mary K. Anstine | 223,143,090 | 2,894,793 | Yes |
| Edmund J. Burke | 223,362,578 | 2,672,643 | Yes |
| Jeremy W. Deems | 221,670,341 | 4,361,535 | Yes |
| Rick A. Pederson | 213,137,140 | 12,259,226 | Yes |
| Joseph F. Keenan | 223,547,500 | 2,483,867 | Yes |
| Susan K. Wold | 223,460,006 | 2,571,857 | Yes |
| Laton Spahr | 223,439,610 | 2,593,995 | Yes |
| ALPS ETF Trust | |
Remuneration Paid to Directors, Officers, and
Others of Open-End Management Investment Companies | November 30, 2024 (Unaudited) |
The following chart provides certain information about the Trustee fees paid by the Trust for the year ended November 30, 2024:
| | | Aggregate Regular
Compensation From the Trust | | | Aggregate Special Compensation
From the Trust | | | Total Compensation From the Trust | |
| Mary K. Anstine, Trustee | | $ | 162,500 | | | $ | – | | | $ | 162,500 | |
| Edmund J. Burke, Trustee | | | 166,500 | | | | – | | | | 166,500 | |
| Jeremy W. Deems, Trustee | | | 174,500 | | | | – | | | | 174,500 | |
| Rick A. Pederson, Trustee | | | 186,500 | | | | – | | | | 186,500 | |
| Joseph F. Keenan, Trustee | | | 40,000 | | | | – | | | | 40,000 | |
| Susan K. Wold, Trustee | | | 40,000 | | | | – | | | | 40,000 | |
| Laton Spahr, President and Trustee* | | | – | | | | – | | | | – | |
| Total | | $ | 770,000 | | | $ | – | | | $ | 770,000 | |
| * | Mr. Spahr, the President of the Trust, is deemed an “interested person” by virtue of his position as an officer of the Trust and of ALPS Advisors, Inc. |
Officers who are employed by the Adviser receive no compensation or expense reimbursements from the Trust.
| ALPS ETF Trust | |
Statement Regarding Basis for
Approval of Investment Advisory Contract | November 30, 2024 (Unaudited) |
At its meetings held on June 3, 2024 and June 18, 2024, the Board of Trustees of the Trust (the “Board” or the “Trustees”), where each Trustee was not an “interested person” of the Trust within the meaning of the Investment Company Act of 1940, as amended (the “Independent Trustees”), evaluated a proposal to approve the continuance of the Investment Advisory Agreement between the Trust and ALPS Advisors, Inc. (the “Adviser” or “AAI”) with respect to the ALPS Clean Energy ETF (“ACES”), ALPS Disruptive Technologies ETF (“DTEC”), and ALPS Medical Breakthroughs ETF (“SBIO”) (each a “Fund” and collectively “the Funds”). In evaluating the renewal of the Investment Advisory Agreement with respect to each of the Funds, the Board, including the Independent Trustees considered various factors, including (i) the nature, extent and quality of the services provided by AAI with respect to the applicable Fund under the Investment Advisory Agreement; (ii) the advisory fees and other expenses paid by the Fund compared to those of similar funds managed by other investment advisers; (iii) the costs of the services provided to the Fund by AAI and the profits realized by AAI and its affiliates from its relationship to the Fund; (iv) the extent to which economies of scale have been or would be realized if and as the assets of the Fund grow and whether fees reflect the economies of scale for the benefit of shareholders; and (v) any additional benefits and other considerations.
With respect to the nature, extent and quality of the services provided by AAI under the Investment Advisory Agreement, the Board considered and reviewed information concerning the services provided under the Investment Advisory Agreement, the investment parameters of the index of each Fund, financial information regarding AAI and its parent company, information describing AAI’s current organization and the background and experience of the persons responsible for the day-to-day management of the Funds.
The Board reviewed information on the performance of each Fund and its applicable benchmark for the 1-, 3-, and 5-year periods, as applicable. The Board also evaluated the correlation and tracking error between each underlying index and its corresponding Fund’s performance. Based on this review, the Board, including the Independent Trustees found that the nature and extent of services provided to each Fund under the Investment Advisory Agreement was appropriate and that the quality of such services was satisfactory.
The Board noted that the advisory fees for each Fund were unitary fees pursuant to which AAI assumes all expenses of the Funds (including the cost of transfer agency, custody, fund administration, legal, audit and other services) other than the payments under the Advisory Agreement, brokerage expenses, taxes, interest, litigation expenses and other extraordinary expenses.
Based on the information available to them, including the Fund-specific summaries set forth below, the Board, including the Independent Trustees concluded that the advisory fee rate for each of the Funds was reasonable under the circumstances and in light of the quality of the services provided.
The Board, including the Independent Trustees considered other benefits available to AAI because of its relationship with the Funds and concluded that the advisory fees were reasonable taking into account any such benefits.
The Board, including the Independent Trustees, also considered with respect to each Fund the information provided by AAI about the costs and profitability of AAI with respect to each of the Funds, including the asset levels and other factors that influence the profitability and financial viability of the Funds. The Board, including the Independent Trustees reviewed and noted the relatively small sizes of the Funds (other than ACES) and the analysis AAI had conducted to support AAI’s assertion that it was not realizing any economies of scale with respect to such Funds. The Independent Trustees determined that AAI should continue to keep the Board informed on an ongoing basis of any significant developments (e.g., material increases in asset levels) so as to facilitate the Independent Trustees’ evaluation of whether further economies of scale have been achieved.
The Board, including the Independent Trustees, also considered other potential benefits available to AAI because of its relationship with the Funds, known as fall-out benefits.
With respect to each Fund, the Board, including the Independent Trustees, noted the following:
The gross management fee rate for SBIO is equal to the median of its FUSE expense group. SBIO’s net expense ratio is lower than the median of its FUSE expense group.
The Board, including the Independent Trustees, reviewed and noted the relatively small size of SBIO and the analysis AAI had conducted to support AAI’s assertion that it was not realizing any economies of scale with respect to SBIO.
The gross management fee rate for ACES is higher than the median of its FUSE expense group. ACES’ net expense ratio is lower than the median of its FUSE expense group.
| ALPS ETF Trust | |
Statement Regarding Basis for
Approval of Investment Advisory Contract | November 30, 2024 (Unaudited) |
With respect to AAI profitability from ACES, the Independent Trustees noted that current profitability levels were not unreasonable.
The gross management fee rate for DTEC is slightly higher than the median of its FUSE expense group. DTEC’s net expense ratio is slightly higher than the median of its FUSE expense group.
The Board, including the Independent Trustees, reviewed and noted the relatively small size of DTEC and the analysis AAI had conducted to support AAI’s assertion that it was not realizing any economies of scale with respect to DTEC.
In voting to renew the Investment Advisory Agreement with AAI, the Board, including the Independent Trustees, concluded that the terms of the Investment Advisory Agreement are reasonable and fair in light of the services to be performed, the fees paid by certain other funds, expenses to be incurred and such other matters as the members of the Board, including the Independent Trustees, considered relevant in the exercise of their reasonable business judgment. The Independent Trustees did not identify any single factor or group of factors as all important or controlling and considered all factors together.


Table of Contents
| Financial Statements and Financial Highlights for Open-End Management Investment Companies | |
| Schedule of Investments | |
| ALPS Sector Dividend Dogs ETF | 1 |
| ALPS International Sector Dividend Dogs ETF | 2 |
| ALPS Emerging Sector Dividend Dogs ETF | 4 |
| ALPS REIT Dividend Dogs ETF | 6 |
| Statements of Assets and Liabilities | 8 |
| Statements of Operations | 9 |
| Statements of Changes in Net Assets | |
| ALPS Sector Dividend Dogs ETF | 10 |
| ALPS International Sector Dividend Dogs ETF | 11 |
| ALPS Emerging Sector Dividend Dogs ETF | 12 |
| ALPS REIT Dividend Dogs ETF | 13 |
| Financial Highlights | 14 |
| Notes to Financial Statements and Financial Highlights | 18 |
| Report of Independent Registered Public Accounting Firm | 27 |
| Additional Information | 28 |
| Changes in and Disagreements with Accountants for Open-End Management Investment Companies | 30 |
| Proxy Disclosures for Open-End Management Investment Companies | 31 |
| Remuneration Paid to Directors, Officers, and Others of Open-End Management Investment Companies | 32 |
| Statement Regarding Basis for Approval of Investment Advisory Contract | 33 |
alpsfunds.com
| ALPS Sector Dividend Dogs ETF | |
| Schedule of Investments | November 30, 2024 |
| Security Description | | Shares | | | Value | |
| COMMON STOCKS (99.48%) | | | | | | | | |
| Communication Services (9.80%) | | | | | | | | |
| AT&T, Inc. | | | 1,112,301 | | | $ | 25,760,891 | |
| Comcast Corp., Class A | | | 608,652 | | | | 26,287,680 | |
| Interpublic Group of Cos., Inc. | | | 780,217 | | | | 24,038,486 | |
| Omnicom Group, Inc. | | | 240,790 | | | | 25,239,608 | |
| Verizon Communications, Inc. | | | 541,782 | | | | 24,022,614 | |
| Total Communication Services | | | | | | | 125,349,279 | |
| | | | | | | | | |
| Consumer Discretionary (9.61%) | | | | | | | | |
| Best Buy Co., Inc. | | | 243,984 | | | | 21,958,560 | |
| Darden Restaurants, Inc. | | | 150,163 | | | | 26,469,232 | |
| Ford Motor Co. | | | 2,251,687 | | | | 25,061,276 | |
| Genuine Parts Co. | | | 175,287 | | | | 22,214,122 | |
| Home Depot, Inc. | | | 63,394 | | | | 27,204,267 | |
| Total Consumer Discretionary | | | | | | | 122,907,457 | |
| | | | | | | | | |
| Consumer Staples (9.19%) | | | | | | | | |
| Altria Group, Inc. | | | 454,528 | | | | 26,244,447 | |
| Conagra Brands, Inc. | | | 751,055 | | | | 20,691,565 | |
| Kraft Heinz Co. | | | 676,293 | | | | 21,621,087 | |
| Philip Morris International, Inc. | | | 191,632 | | | | 25,498,554 | |
| Walgreens Boots Alliance, Inc. | | | 2,613,465 | | | | 23,573,454 | |
| Total Consumer Staples | | | | | | | 117,629,107 | |
| | | | | | | | | |
| Energy (11.46%) | | | | | | | | |
| Chevron Corp. | | | 170,854 | | | | 27,666,388 | |
| Exxon Mobil Corp. | | | 216,557 | | | | 25,545,064 | |
| Kinder Morgan, Inc. | | | 1,138,585 | | | | 32,187,799 | |
| ONEOK, Inc. | | | 263,441 | | | | 29,926,898 | |
| Williams Cos., Inc. | | | 534,516 | | | | 31,279,876 | |
| Total Energy | | | | | | | 146,606,025 | |
| | | | | | | | | |
| Financials (11.19%) | | | | | | | | |
| Citizens Financial Group, Inc. | | | 600,407 | | | | 28,903,593 | |
| Huntington Bancshares, Inc. | | | 1,673,838 | | | | 30,145,822 | |
| Prudential Financial, Inc. | | | 206,989 | | | | 26,786,446 | |
| Regions Financial Corp. | | | 1,095,580 | | | | 29,865,511 | |
| Truist Financial Corp. | | | 575,288 | | | | 27,429,732 | |
| Total Financials | | | | | | | 143,131,104 | |
| | | | | | | | | |
| Health Care (9.94%) | | | | | | | | |
| AbbVie, Inc. | | | 123,947 | | | | 22,673,625 | |
| Bristol-Myers Squibb Co. | | | 489,924 | | | | 29,013,299 | |
| Gilead Sciences, Inc. | | | 290,709 | | | | 26,913,839 | |
| Pfizer, Inc. | | | 822,363 | | | | 21,554,134 | |
| Viatris, Inc. | | | 2,064,373 | | | | 27,022,643 | |
| Total Health Care | | | | | | | 127,177,540 | |
| | | | | | | | | |
| Industrials (9.81%) | | | | | | | | |
| 3M Co. | | | 180,767 | | | | 24,137,818 | |
| Cummins, Inc. | | | 79,635 | | | | 29,866,310 | |
| RTX Corp. | | | 202,022 | | | | 24,612,340 | |
| Stanley Black & Decker, Inc. | | | 237,523 | | | | 21,246,432 | |
| Security Description | | Shares | | | Value | |
| Industrials (continued) | | | | | | | | |
| United Parcel Service, Inc., Class B | | | 189,144 | | | $ | 25,670,624 | |
| Total Industrials | | | | | | | 125,533,524 | |
| | | | | | | | | |
| Information Technology (9.91%) | | | | | | | | |
| Corning, Inc. | | | 566,368 | | | | 27,565,131 | |
| HP, Inc. | | | 722,367 | | | | 25,593,463 | |
| International Business Machines Corp. | | | 112,097 | | | | 25,491,979 | |
| Seagate Technology Holdings PLC | | | 235,634 | | | | 23,876,793 | |
| Texas Instruments, Inc. | | | 120,411 | | | | 24,206,223 | |
| Total Information Technology | | | | | | | 126,733,589 | |
| | | | | | | | | |
| Materials (9.09%) | | | | | | | | |
| Amcor PLC | | | 2,190,225 | | | | 23,303,994 | |
| International Flavors & Fragrances, Inc. | | | 232,437 | | | | 21,235,444 | |
| International Paper Co. | | | 494,239 | | | | 29,076,081 | |
| LyondellBasell Industries NV, Class A | | | 258,304 | | | | 21,527,055 | |
| The Dow Chemical Co. | | | 479,981 | | | | 21,219,960 | |
| Total Materials | | | | | | | 116,362,534 | |
| | | | | | | | | |
| Utilities (9.48%) | | | | | | | | |
| Dominion Resources, Inc. | | | 413,825 | | | | 24,312,219 | |
| Duke Energy Corp. | | | 205,064 | | | | 24,002,741 | |
| Edison International | | | 281,782 | | | | 24,726,370 | |
| Evergy, Inc. | | | 394,221 | | | | 25,478,503 | |
| Eversource Energy | | | 354,126 | | | | 22,837,586 | |
| Total Utilities | | | | | | | 121,357,419 | |
| | | | | | | | | |
| TOTAL COMMON STOCKS | | | | | | | | |
| (Cost $1,062,794,302) | | | | | | | 1,272,787,578 | |
| | | 7 Day Yield | | | Shares | | | Value | |
| SHORT TERM INVESTMENTS (0.09%) | | | | | | |
| Money Market Fund (0.09%) | | | | | | |
| State Street Institutional Treasury Plus Money Market Fund (Premier Class) | | | 4.59 | % | | | 1,127,981 | | | $ | 1,127,981 | |
| | | | | | | | | | | | | |
| TOTAL SHORT TERM INVESTMENTS | | | | | | | | | | | | |
| | | | | | | | | | | | | |
| (Cost $1,127,981) | | | | | | | | | | | 1,127,981 | |
| | | | | | | | | | | | | |
| TOTAL INVESTMENTS (99.57%) | | | | | | | | | | | | |
| (Cost $1,063,922,283) | | | | | | | | | | $ | 1,273,915,559 | |
| OTHER ASSETS IN EXCESS OF LIABILITIES (0.43%) | | | | | | | | | | | 5,553,448 | |
| NET ASSETS - 100.00% | | | | | | | | | | $ | 1,279,469,007 | |
See Notes to Financial Statements and Financial Highlights.
| ALPS International Sector Dividend Dogs ETF | |
| Schedule of Investments | November 30, 2024 |
| Security Description | | Shares | | | Value | |
| COMMON STOCKS (99.24%) | | | | | | | | |
| Australia (8.31%) | | | | | | | | |
| BHP Group, Ltd. | | | 225,552 | | | $ | 5,968,525 | |
| Coles Group, Ltd.(a) | | | 472,017 | | | | 5,723,378 | |
| Fortescue, Ltd. | | | 510,401 | | | | 6,321,961 | |
| Woodside Energy Group, Ltd.(a) | | | 368,336 | | | | 5,888,475 | |
| Total Australia | | | | | | | 23,902,339 | |
| | | | | | | | | |
| Austria (2.07%) | | | | | | | | |
| OMV AG | | | 148,295 | | | | 5,942,456 | |
| | | | | | | | | |
| Denmark (2.34%) | | | | | | | | |
| A P Moller-Maersk A/S | | | 3,962 | | | | 6,722,867 | |
| | | | | | | | | |
| Finland (4.10%) | | | | | | | | |
| Fortum Oyj(a) | | | 384,005 | | | | 5,788,684 | |
| Nokia Oyj | | | 1,432,205 | | | | 6,022,889 | |
| Total Finland | | | | | | | 11,811,573 | |
| | | | | | | | | |
| France (8.98%) | | | | | | | | |
| Cie Generale des Etablissements Michelin SCA | | | 149,955 | | | | 4,872,785 | |
| Credit Agricole SA | | | 380,705 | | | | 5,097,255 | |
| Engie SA | | | 341,599 | | | | 5,445,441 | |
| Orange SA | | | 498,626 | | | | 5,314,005 | |
| Sanofi SA | | | 52,378 | | | | 5,097,210 | |
| Total France | | | | | | | 25,826,696 | |
| | | | | | | | | |
| Germany (7.13%) | | | | | | | | |
| BASF SE | | | 124,329 | | | | 5,573,324 | |
| Bayer AG | | | 200,891 | | | | 4,115,898 | |
| Bayerische Motoren Werke AG | | | 73,988 | | | | 5,474,627 | |
| Mercedes-Benz Group AG | | | 95,539 | | | | 5,346,873 | |
| Total Germany | | | | | | | 20,510,722 | |
| | | | | | | | | |
| Great Britain (4.35%) | | | | | | | | |
| NatWest Group PLC | | | 1,361,785 | | | | 6,977,959 | |
| Unilever PLC | | | 92,583 | | | | 5,538,086 | |
| Total Great Britain | | | | | | | 12,516,045 | |
| | | | | | | | | |
| Hong Kong (4.42%) | | | | | | | | |
| CITIC, Ltd. | | | 6,331,000 | | | | 7,022,690 | |
| Hong Kong & China Gas Co., Ltd. | | | 7,510,996 | | | | 5,696,000 | |
| Total Hong Kong | | | | | | | 12,718,690 | |
| | | | | | | | | |
| Italy (7.58%) | | | | | | | | |
| Enel SpA | | | 761,392 | | | | 5,479,319 | |
| Eni SpA | | | 386,924 | | | | 5,481,457 | |
| Intesa Sanpaolo SpA | | | 1,443,257 | | | | 5,531,748 | |
| Mediobanca Banca di Credito Finanziario SpA(a) | | | 365,482 | | | | 5,331,797 | |
| Total Italy | | | | | | | 21,824,321 | |
| Security Description | | Shares | | | Value | |
| Japan (7.95%) | | | | | | |
| Canon, Inc. | | | 178,463 | | | $ | 5,806,623 | |
| Isuzu Motors, Ltd.(a) | | | 424,292 | | | | 5,663,276 | |
| Japan Tobacco, Inc. | | | 206,400 | | | | 5,820,283 | |
| Takeda Pharmaceutical Co., Ltd. | | | 204,200 | | | | 5,572,627 | |
| Total Japan | | | | | | | 22,862,809 | |
| | | | | | | | | |
| Netherlands (7.87%) | | | | | | | | |
| BE Semiconductor Industries NV(a) | | | 47,937 | | | | 5,724,275 | |
| NN Group NV(a) | | | 121,571 | | | | 5,648,818 | |
| NXP Semiconductors NV | | | 26,100 | | | | 5,986,557 | |
| Stellantis NV(a) | | | 398,093 | | | | 5,273,691 | |
| Total Netherlands | | | | | | | 22,633,341 | |
| | | | | | | | | |
| Norway (6.23%) | | | | | | | | |
| Aker BP ASA | | | 277,315 | | | | 5,686,478 | |
| Norsk Hydro ASA | | | 1,077,171 | | | | 6,663,446 | |
| Telenor ASA | | | 473,840 | | | | 5,579,158 | |
| Total Norway | | | | | | | 17,929,082 | |
| | | | | | | | | |
| Poland (1.66%) | | | | | | | | |
| ORLEN SA | | | 380,686 | | | | 4,783,244 | |
| | | | | | | | | |
| Singapore (1.95%) | | | | | | | | |
| Singapore Airlines, Ltd. | | | 1,192,801 | | | | 5,619,782 | |
| | | | | | | | | |
| Spain (4.16%) | | | | | | | | |
| ACS Actividades de Construccion y Servicios SA | | | 132,987 | | | | 6,177,859 | |
| Telefonica SA(a) | | | 1,278,597 | | | | 5,791,046 | |
| Total Spain | | | | | | | 11,968,905 | |
| | | | | | | | | |
| Sweden (2.29%) | | | | | | | | |
| Telefonaktiebolaget LM Ericsson, Class B | | | 808,855 | | | | 6,581,844 | |
| | | | | | | | | |
| Switzerland (3.63%) | | | | | | | | |
| Kuehne + Nagel International AG(a) | | | 20,464 | | | | 4,892,126 | |
| Roche Holding AG | | | 19,180 | | | | 5,562,733 | |
| Total Switzerland | | | | | | | 10,454,859 | |
| | | | | | | | | |
| United Kingdom (14.22%) | | | | | | | | |
| British American Tobacco PLC | | | 154,284 | | | | 5,865,968 | |
| GSK PLC | | | 280,031 | | | | 4,756,918 | |
| Imperial Brands PLC | | | 203,597 | | | | 6,655,393 | |
| National Grid Plc | | | 438,116 | | | | 5,533,522 | |
| Rio Tinto PLC | | | 96,143 | | | | 6,039,139 | |
| Vodafone Group PLC | | | 5,894,810 | | | | 5,316,573 | |
| ALPS International Sector Dividend Dogs ETF | |
| Schedule of Investments | November 30, 2024 |
| Security Description | | Shares | | | Value | |
| United Kingdom (continued) | | | | | | | | |
| WPP PLC | | | 617,057 | | | $ | 6,746,178 | |
| Total United Kingdom | | | | | | | 40,913,691 | |
| | | | | | | | | |
| TOTAL COMMON STOCKS | | | | | | | | |
| (Cost $280,623,435) | | | | | | | 285,523,266 | |
| | | 7 Day Yield | | | Shares | | | Value | |
| SHORT TERM INVESTMENTS (6.16%) | | | | | | | | | | | | |
| Money Market Fund (0.08%) | | | | | | | | | | | | |
| State Street Institutional Treasury Plus Money Market Fund (Premier Class) | | | | | | | | | | | | |
| (Cost $234,543) | | | 4.59 | % | | | 234,543 | | | $ | 234,543 | |
| | | | | | | | | | | | | |
| Investments Purchased with Collateral from Securities Loaned (6.08%) | | | | | | | | | | | | |
| State Street Navigator Securities Lending Government Money Market Portfolio, 4.63% | | | | | | | | | | | | |
| (Cost $17,504,375) | | | | | | | 17,504,375 | | | | 17,504,375 | |
| TOTAL SHORT TERM INVESTMENTS | | | | | | | | | | | | |
| | | | | | | | | | | | | |
| (Cost $17,738,918) | | | | | | | | | | | 17,738,918 | |
| | | | | | | | | | | | | |
| TOTAL INVESTMENTS (105.40%) | | | | | | | | | | | | |
| (Cost $298,362,353) | | | | | | | | | | $ | 303,262,184 | |
| LIABILITIES IN EXCESS OF OTHER ASSETS (-5.40%) | | | | | | | | | | | (15,541,894 | ) |
| NET ASSETS - 100.00% | | | | | | | | | | $ | 287,720,290 | |
| (a) | Security, or a portion of the security position is currently on loan. The total market value of securities on loan is $25,074,385. |
See Notes to Financial Statements and Financial Highlights.
ALPS Emerging Sector Dividend Dogs ETF
| Schedule of Investments | November 30, 2024 |
| Security Description | | Shares | | | Value | |
| COMMON STOCKS (96.90%) | | | | | | | | |
| Brazil (9.47%) | | | | | | | | |
| Ambev SA | | | 234,500 | | | $ | 496,142 | |
| BB Seguridade Participacoes SA | | | 82,900 | | | | 461,979 | |
| Cia Siderurgica Nacional SA | | | 250,883 | | | | 465,339 | |
| Gerdau SA | | | 158,383 | | | | 534,366 | |
| Petroleo Brasileiro SA | | | 81,292 | | | | 525,572 | |
| Total Brazil | | | | | | | 2,483,398 | |
| | | | | | | | | |
| Chile (6.37%) | | | | | | | | |
| Cencosud SA | | | 282,654 | | | | 594,878 | |
| Cia Sud Americana de Vapores SA | | | 9,688,351 | | | | 519,205 | |
| Enel Chile SA | | | 10,118,765 | | | | 556,815 | |
| Total Chile | | | | | | | 1,670,898 | |
| | | | | | | | | |
| China (11.12%) | | | | | | | | |
| China Shenhua Energy Co., Ltd., Class H | | | 138,000 | | | | 571,157 | |
| China Zheshang Bank Co., Ltd. | | | 2,188,000 | | | | 604,653 | |
| Chongqing Rural Commercial Bank Co., Ltd. | | | 1,148,500 | | | | 630,346 | |
| COSCO SHIPPING Holdings Co., Ltd. | | | 409,500 | | | | 572,668 | |
| Yankuang Energy Group Co., Ltd., Class H(a) | | | 466,200 | | | | 536,310 | |
| Total China | | | | | | | 2,915,134 | |
| | | | | | | | | |
| Colombia (4.02%) | | | | | | | | |
| Bancolombia SA, ADR | | | 16,844 | | | | 550,799 | |
| Interconexion Electrica SA ESP | | | 132,987 | | | | 503,970 | |
| Total Colombia | | | | | | | 1,054,769 | |
| | | | | | | | | |
| Czech Republic (2.18%) | | | | | | | | |
| CEZ AS | | | 14,187 | | | | 570,842 | |
| | | | | | | | | |
| Hungary (1.82%) | | | | | | | | |
| Richter Gedeon Nyrt | | | 17,906 | | | | 476,490 | |
| | | | | | | | | |
| India (8.67%) | | | | | | | | |
| Dr Reddy's Laboratories, Ltd., ADR | | | 33,310 | | | | 471,004 | |
| Infosys, Ltd., Sponsored ADR(a) | | | 38,519 | | | | 850,114 | |
| Wipro, Ltd., ADR | | | 136,216 | | | | 952,150 | |
| Total India | | | | | | | 2,273,268 | |
| | | | | | | | | |
| Indonesia (6.75%) | | | | | | | | |
| Alamtri Resources Indonesia Tbk PT | | | 2,260,000 | | | | 296,674 | |
| Indofood Sukses Makmur Tbk PT | | | 1,168,200 | | | | 556,637 | |
| Kalbe Farma Tbk PT | | | 4,864,700 | | | | 460,527 | |
| Security Description | | Shares | | | Value | |
| Indonesia (continued) | | | | | | | | |
| Telkom Indonesia Persero Tbk PT | | | 2,667,000 | | | $ | 456,142 | |
| Total Indonesia | | | | | | | 1,769,980 | |
| | | | | | | | | |
| Malaysia (9.33%) | | | | | | | | |
| Axiata Group Bhd | | | 926,700 | | | | 487,846 | |
| Genting Malaysia Bhd | | | 945,600 | | | | 459,504 | |
| Maxis Bhd | | | 603,300 | | | | 470,968 | |
| Petronas Gas Bhd | | | 128,900 | | | | 517,340 | |
| Sime Darby Bhd | | | 998,600 | | | | 512,218 | |
| Total Malaysia | | | | | | | 2,447,876 | |
| | | | | | | | | |
| Mexico (9.48%) | | | | | | | | |
| Grupo Aeroportuario del Centro Norte SAB de CV | | | 60,102 | | | | 468,732 | |
| Grupo Aeroportuario del Pacifico SAB de CV, Class B | | | 30,881 | | | | 571,144 | |
| Grupo Financiero Banorte SAB de CV, Class O | | | 72,785 | | | | 485,401 | |
| Grupo Mexico SAB de CV, Series B | | | 100,035 | | | | 484,486 | |
| Orbia Advance Corp. SAB de CV(a) | | | 525,684 | | | | 473,808 | |
| Total Mexico | | | | | | | 2,483,571 | |
| | | | | | | | | |
| Philippines (4.03%) | | | | | | | | |
| Manila Electric Co. | | | 73,530 | | | | 600,680 | |
| PLDT, Inc. | | | 20,655 | | | | 456,886 | |
| Total Philippines | | | | | | | 1,057,566 | |
| | | | | | | | | |
| Russia (0.00%)(b) | | | | | | | | |
| Mobile TeleSystems PJSC, Sponsored ADR(c)(d)(e) | | | 64,600 | | | | 646 | |
| Novolipetsk Steel PJSC, GDR(c)(d)(e)(f) | | | 17,594 | | | | 176 | |
| Severstal PAO, GDR(c)(d)(e)(f) | | | 23,283 | | | | 233 | |
| X5 Retail Group NV, GDR(c)(d)(e)(f) | | | 17,785 | | | | 178 | |
| Total Russia | | | | | | | 1,233 | |
| | | | | | | | | |
| South Africa (9.89%) | | | | | | | | |
| Exxaro Resources, Ltd. | | | 61,640 | | | | 571,093 | |
| Pepkor Holdings, Ltd.(f)(g) | | | 428,427 | | | | 635,640 | |
| Sasol, Ltd. | | | 77,251 | | | | 376,774 | |
| Vodacom Group, Ltd. | | | 85,503 | | | | 480,853 | |
| Woolworths Holdings, Ltd. | | | 151,904 | | | | 529,835 | |
| Total South Africa | | | | | | | 2,594,195 | |
| | | | | | | | | |
| Thailand (11.98%) | | | | | | | | |
| Bangkok Dusit Medical Services PCL | | | 613,700 | | | | 451,809 | |
| Bumrungrad Hospital Pcl | | | 65,500 | | | | 397,230 | |
| Delta Electronics Thailand PCL | | | 289,100 | | | | 1,268,593 | |
| Home Product Center PCL | | | 1,677,700 | | | | 462,257 | |
ALPS Emerging Sector Dividend Dogs ETF
| Schedule of Investments | November 30, 2024 |
| Security Description | | Shares | | | Value | |
| Thailand (continued) | | | | | | | | |
| Thai Beverage PCL | | | 1,332,500 | | | $ | 562,131 | |
| Total Thailand | | | | | | | 3,142,020 | |
| | | | | | | | | |
| Turkey (1.79%) | | | | | | | | |
| Tofas Turk Otomobil Fabrikasi A.S. | | | 82,214 | | | | 469,175 | |
| | | | | | | | | |
| TOTAL COMMON STOCKS | | | | | | | | |
| (Cost $26,929,936) | | | | | | | 25,410,415 | |
| Security Description | | Shares | | | Value | |
| PREFERRED STOCK (1.98%) | | | | | | | | |
| Chile (1.98%) | | | | | | | | |
| Embotelladora Andina SA ADR, Series B | | | 175,700 | | | | 519,497 | |
| | | | | | | | | |
| TOTAL PREFERRED STOCK | | | | | | | | |
| (Cost $558,688) | | | | | | | 519,497 | |
| | 7 Day Yield | | | Shares | | | Value | |
| SHORT TERM INVESTMENTS (0.39%) | | | | | | | | | |
| Money Market Fund (0.35%) | | | | | | | | | | | | |
| State Street Institutional Treasury Plus Money Market Fund (Premier Class) | | | | | | | | | | | | |
| (Cost $91,406) | | | 4.59 | % | | | 91,406 | | | $ | 91,406 | |
| | | | | | | | | | | | | |
| Investments Purchased with Collateral from Securities Loaned (0.04%) | | | | | | | | | |
| State Street Navigator Securities Lending Government Money Market Portfolio, 4.63% | | | | | | | | | | | | |
| (Cost $10,821) | | | | | | | 10,821 | | | | 10,821 | |
| TOTAL SHORT TERM INVESTMENTS | | | | | | | | | |
| | | | | | | | | | | | | |
| (Cost $102,227) | | | | | | | | | | | 102,227 | |
| | | | | | | | | | | | | |
| TOTAL INVESTMENTS (99.27%) | | | | | | | | | | | | |
| (Cost $27,590,851) | | | | | | | | | | $ | 26,032,139 | |
| OTHER ASSETS IN EXCESS OF LIABILITIES (0.73%) | | | | | | | | 192,345 | |
| NET ASSETS - 100.00% | | | | | | | | | | $ | 26,224,484 | |
| (a) | Security, or a portion of the security position is currently on loan. The total market value of securities on loan is $1,255,794. |
| (c) | Security deemed to be illiquid under the procedures utilized by the Valuation Designee. As of November 30, 2024, the fair value of illiquid securities in the aggregate was $1,233, representing less than 0.005% of the Fund's net assets. |
| (d) | Non-income producing security. |
| (e) | As a result of the use of significant unobservable inputs to determine fair value, these investments have been classified as Level 3 securities under the fair value hierarchy. |
| (f) | Securities were purchased pursuant to Regulation S under the Securities Act of 1933, which exempts securities offered and sold outside of the United States from registration. Such securities cannot be sold in the United States without either an effective registration statement filed pursuant to the Securities Act of 1933, or pursuant to an exemption from registration. As of November 30, 2024, the market value of those securities was $636,227, representing 2.43% of net assets. |
| (g) | Securities exempt from registration under Rule 144A of the Securities Act of 1933. These securities may be sold in the ordinary course of business in transactions exempt from registration, normally to qualified institutional buyers. At period end, the aggregate market value of those securities was $635,640, representing 2.42% of net assets. |
See Notes to Financial Statements and Financial Highlights.
ALPS REIT Dividend Dogs ETF
| Schedule of Investments | November 30, 2024 |
| Security Description | | Shares | | | Value | |
| COMMON STOCKS (99.49%) | | | | | | | | |
| Data Center REITs (2.52%) | | | | | | | | |
| Equinix, Inc. | | | 377 | | | $ | 370,018 | |
| | | | | | | | | |
| Diversified REITs (11.40%) | | | | | | | | |
| Armada Hoffler Properties, Inc. | | | 27,408 | | | | 302,858 | |
| Broadstone Net Lease, Inc. | | | 17,599 | | | | 308,159 | |
| CTO Realty Growth, Inc. | | | 17,212 | | | | 351,297 | |
| Gladstone Commercial Corp. | | | 20,466 | | | | 360,406 | |
| One Liberty Properties, Inc. | | | 11,620 | | | | 349,413 | |
| Total Diversified REITs | | | | | | | 1,672,133 | |
| | | | | | | | | |
| Health Care REITs (9.99%) | | | | | | | | |
| Global Medical REIT, Inc. | | | 32,787 | | | | 291,476 | |
| Healthcare Realty Trust, Inc. | | | 17,468 | | | | 320,014 | |
| Medical Properties Trust, Inc. | | | 51,473 | | | | 225,967 | |
| Sabra Health Care REIT, Inc. | | | 17,646 | | | | 330,510 | |
| Universal Health Realty Income Trust | | | 7,044 | | | | 297,186 | |
| Total Health Care REITs | | | | | | | 1,465,153 | |
| | | | | | | | | |
| Hotel & Resort REITs (11.33%) | | | | | | | | |
| Apple Hospitality REIT, Inc. | | | 22,956 | | | | 369,821 | |
| Braemar Hotels & Resorts, Inc. | | | 106,518 | | | | 383,465 | |
| Host Hotels & Resorts, Inc. | | | 18,834 | | | | 346,922 | |
| Park Hotels & Resorts, Inc. | | | 23,348 | | | | 363,061 | |
| Service Properties Trust | | | 71,102 | | | | 197,664 | |
| Total Hotel & Resort REITs | | | | | | | 1,660,933 | |
| | | | | | | | | |
| Industrial REITs (9.76%) | | | | | | | | |
| Innovative Industrial Properties, Inc. | | | 2,541 | | | | 277,020 | |
| LXP Industrial Trust | | | 32,258 | | | | 301,612 | |
| Plymouth Industrial REIT, Inc. | | | 14,203 | | | | 266,164 | |
| STAG Industrial, Inc. | | | 8,196 | | | | 301,531 | |
| Terreno Realty Corp. | | | 4,720 | | | | 286,174 | |
| Total Industrial REITs | | | | | | | 1,432,501 | |
| | | | | | | | | |
| Multi-Family Residential REITs (8.90%) | | | | | | | | |
| BRT Apartments Corp. | | | 17,267 | | | | 346,376 | |
| Elme Communities | | | 17,968 | | | | 304,378 | |
| NexPoint Residential Trust, Inc. | | | 7,142 | | | | 336,174 | |
| UDR, Inc. | | | 6,960 | | | | 319,185 | |
| Total Multi-Family Residential REITs | | | | | | | 1,306,113 | |
| | | | | | | | | |
| Office REITs (10.76%) | | | | | | | | |
| Brandywine Realty Trust | | | 61,206 | | | | 342,754 | |
| Easterly Government Properties, Inc. | | | 23,817 | | | | 293,425 | |
| Highwoods Properties, Inc. | | | 9,989 | | | | 324,243 | |
| Office Properties Income Trust(a) | | | 151,184 | | | | 249,454 | |
| SL Green Realty Corp. | | | 4,726 | | | | 369,526 | |
| Total Office REITs | | | | | | | 1,579,402 | |
| Security Description | | Shares | | | Value | |
| Retail REITs (12.60%) | | | | | | | | |
| CBL & Associates Properties, Inc. | | | 12,863 | | | $ | 397,467 | |
| Getty Realty Corp. | | | 10,137 | | | | 333,304 | |
| Saul Centers, Inc. | | | 7,990 | | | | 328,469 | |
| Simon Property Group, Inc. | | | 2,002 | | | | 367,567 | |
| The Macerich Co. | | | 19,894 | | | | 421,952 | |
| Total Retail REITs | | | | | | | 1,848,759 | |
| | | | | | | | | |
| Self-Storage REITs (2.12%) | | | | | | | | |
| National Storage Affiliates Trust | | | 6,883 | | | | 310,423 | |
| | | | | | | | | |
| Single-Family Residential REITs (2.10%) | | | | | | | | |
| UMH Properties, Inc. | | | 16,068 | | | | 308,506 | |
| | | | | | | | | |
| Specialized REITs (9.21%) | | | | | | | | |
| EPR Properties | | | 6,730 | | | | 305,340 | |
| Gaming and Leisure Properties, Inc. | | | 6,353 | | | | 327,878 | |
| Outfront Media, Inc. | | | 19,141 | | | | 367,699 | |
| Uniti Group, Inc.(a) | | | 59,432 | | | | 351,243 | |
| Total Specialized REITs | | | | | | | 1,352,160 | |
| | | | | | | | | |
| Technology REITs (4.75%) | | | | | | | | |
| Crown Castle, Inc. | | | 2,758 | | | | 293,038 | |
| Digital Realty Trust, Inc. | | | 2,063 | | | | 403,708 | |
| Total Technology REITs | | | | | | | 696,746 | |
| | | | | | | | | |
| Telecom Tower REITs (4.05%) | | | | | | | | |
| American Tower Corp. | | | 1,378 | | | | 288,002 | |
| SBA Communications Corp. | | | 1,351 | | | | 305,664 | |
| Total Telecom Tower REITs | | | | | | | 593,666 | |
| | | | | | | | | |
| TOTAL COMMON STOCKS | | | | | | | | |
| (Cost $14,343,567) | | | | | | | 14,596,513 | |
ALPS REIT Dividend Dogs ETF
| Schedule of Investments | November 30, 2024 |
| | | 7 Day Yield | | | Shares | | | Value | |
| SHORT TERM INVESTMENTS (0.73%) | | | | | | | | | |
| Money Market Fund (0.26%) | | | | | | | | | | | | |
| State Street Institutional Treasury Plus Money Market Fund (Premier Class) | | | | | | | | | | | | |
| (Cost $38,476) | | | 4.59 | % | | | 38,476 | | | $ | 38,476 | |
| | | | | | | | | | | | | |
| Investments Purchased with Collateral from Securities Loaned (0.46%) | | | | | | | | | | | | |
| State Street Navigator Securities Lending Government Money Market Portfolio, 4.63% | | | | | | | | | | | | |
| (Cost $67,900) | | | | | | | 67,900 | | | $ | 67,900 | |
| TOTAL SHORT TERM INVESTMENTS | | | | | | | | | |
| | | | | | | | | | | | | |
| (Cost $106,376) | | | | | | | | | | | 106,376 | |
| | | | | | | | | | | | | |
| TOTAL INVESTMENTS (100.21%) | | | | | | | | | |
| (Cost $14,449,943) | | | | | | | | | | $ | 14,702,889 | |
| LIABILITIES IN EXCESS OF OTHER ASSETS (-0.21%) | | | | | | | | (30,410 | ) |
| NET ASSETS - 100.00% | | | | | | | | | | $ | 14,672,479 | |
| (a) | Security, or a portion of the security position is currently on loan. The total market value of securities on loan is $380,134. |
See Notes to Financial Statements and Financial Highlights.
ALPS ETF Trust
| Statements of Assets and Liabilities | November 30, 2024 |
| | | ALPS Sector
Dividend Dogs
ETF | | | ALPS
International
Sector Dividend
Dogs ETF | | | ALPS Emerging
Sector Dividend
Dogs ETF | | | ALPS REIT
Dividend Dogs
ETF | |
| ASSETS: | | | | | | | | | | | | | | | | |
| Investments, at value* | | $ | 1,273,915,559 | | | $ | 303,262,184 | | | $ | 26,032,139 | | | $ | 14,702,889 | |
| Foreign currency, at value (Cost $–, $142,914, $246 and $–) | | | – | | | | 143,304 | | | | 225 | | | | – | |
| Foreign tax reclaims | | | – | | | | 951,873 | | | | 6,084 | | | | 1,242 | |
| Dividends receivable | | | 5,922,795 | | | | 987,038 | | | | 209,927 | | | | 40,325 | |
| Total Assets | | | 1,279,838,354 | | | | 305,344,399 | | | | 26,248,375 | | | | 14,744,456 | |
| | | | | | | | | | | | | | | | | |
| LIABILITIES: | | | | | | | | | | | | | | | | |
| Payable to adviser | | | 369,347 | | | | 119,734 | | | | 13,070 | | | | 4,077 | |
| Payable for collateral upon return of securities loaned | | | – | | | | 17,504,375 | | | | 10,821 | | | | 67,900 | |
| Total Liabilities | | | 369,347 | | | | 17,624,109 | | | | 23,891 | | | | 71,977 | |
| NET ASSETS | | $ | 1,279,469,007 | | | $ | 287,720,290 | | | $ | 26,224,484 | | | $ | 14,672,479 | |
| | | | | | | | | | | | | | | | | |
| NET ASSETS CONSIST OF: | | | | | | | | | | | | | | | | |
| Paid-in capital | | $ | 1,291,009,660 | | | $ | 328,798,419 | | | $ | 37,194,532 | | | $ | 24,531,799 | |
| Total Distributable earnings/(accumulated losses) | | | (11,540,653 | ) | | | (41,078,129 | ) | | | (10,970,048 | ) | | | (9,859,320 | ) |
| NET ASSETS | | $ | 1,279,469,007 | | | $ | 287,720,290 | | | $ | 26,224,484 | | | $ | 14,672,479 | |
| | | | | | | | | | | | | | | | | |
| INVESTMENTS, AT COST | | $ | 1,063,922,283 | | | $ | 298,362,353 | | | $ | 27,590,851 | | | $ | 14,449,943 | |
| | | | | | | | | | | | | | | | | |
| PRICING OF SHARES: | | | | | | | | | | | | | | | | |
| Net Assets | | $ | 1,279,469,007 | | | $ | 287,720,290 | | | $ | 26,224,484 | | | $ | 14,672,479 | |
| Shares of beneficial interest outstanding (Unlimited number of shares authorized, par value $0.01 per share) | | | 20,909,141 | | | | 9,750,000 | | | | 1,225,000 | | | | 350,000 | |
| Net Asset Value, offering and redemption price per share | | $ | 61.19 | | | $ | 29.51 | | | $ | 21.41 | | | $ | 41.92 | |
| * | Includes $-, $25,074,385, $1,255,794, and $380,134 respectively of securities on loan. |
See Notes to Financial Statements and Financial Highlights.
ALPS ETF Trust
| Statements of Operations | For the Year Ended November 30, 2024 |
| | | ALPS Sector
Dividend Dogs
ETF | | | ALPS
International
Sector Dividend
Dogs ETF | | | ALPS Emerging
Sector Dividend
Dogs ETF | | | ALPS REIT
Dividend Dogs
ETF | |
| INVESTMENT INCOME: | | | | | | | | | | | | | | | | |
| Dividend Income* | | $ | 50,980,105 | | | $ | 14,789,535 | | | $ | 1,567,834 | | | $ | 425,441 | |
| Securities lending income | | | 75,433 | | | | 21,827 | | | | 4,563 | | | | 1,768 | |
| Total investment income | | | 51,055,538 | | | | 14,811,362 | | | | 1,572,397 | | | | 427,209 | |
| | | | | | | | | | | | | | | | | |
| EXPENSES: | | | | | | | | | | | | | | | | |
| Investment adviser fees | | | 4,199,624 | | | | 1,398,519 | | | | 161,861 | | | | 43,945 | |
| Other expenses | | | 48,947 | | | | 11,738 | | | | 1,147 | | | | 518 | |
| Total expenses | | | 4,248,571 | | | | 1,410,257 | | | | 163,008 | | | | 44,463 | |
| NET INVESTMENT INCOME | | | 46,806,967 | | | | 13,401,105 | | | | 1,409,389 | | | | 382,746 | |
| | | | | | | | | | | | | | | | | |
| REALIZED AND UNREALIZED GAIN/(LOSS) | | | | | | | | | | | | | | | | |
| Net realized gain/(loss) on investments(a) | | | (33,976,902 | ) | | | 13,967,918 | | | | 938,923 | | | | (717,319 | ) |
| Net realized loss on foreign currency transactions | | | – | | | | (70,969 | ) | | | (23,199 | ) | | | – | |
| Total net realized gain/(loss) | | | (33,976,902 | ) | | | 13,896,949 | | | | 915,724 | | | | (717,319 | ) |
| Net change in unrealized appreciation/(depreciation) on investments | | | 301,432,766 | | | | (7,846,610 | ) | | | (317,354 | ) | | | 3,029,658 | |
| Net change in unrealized appreciation/(depreciation) on translation of assets and liabilities denominated in foreign currencies | | | – | | | | (50,729 | ) | | | (1,306 | ) | | | (37 | ) |
| Total net change in unrealized appreciation/(depreciation) | | | 301,432,766 | | | | (7,897,339 | ) | | | (318,660 | ) | | | 3,029,621 | |
| NET REALIZED AND UNREALIZED GAIN ON INVESTMENTS | | | 267,455,864 | | | | 5,999,610 | | | | 597,064 | | | | 2,312,302 | |
| NET INCREASE IN NET ASSETS RESULTING FROM OPERATIONS | | $ | 314,262,831 | | | $ | 19,400,715 | | | $ | 2,006,453 | | | $ | 2,695,048 | |
| *Net of foreign tax withholding: | | $ | – | | | $ | 1,666,336 | | | $ | 213,960 | | | $ | – | |
| (a) | Includes realized gain or loss as a result of in-kind transactions (See Note 4 in Notes to Financial Statements and Financial Highlights). |
See Notes to Financial Statements and Financial Highlights.
ALPS Sector Dividend Dogs ETF
Statements of Changes in Net Assets
| | | For the
Year Ended
November 30, 2024 | | | For the
Year Ended
November 30, 2023 | |
| OPERATIONS: | | | | | | | | |
| Net investment income | | $ | 46,806,967 | | | $ | 49,158,065 | |
| Net realized gain/(loss) | | | (33,976,902 | ) | | | 40,887,629 | |
| Net change in unrealized appreciation/(depreciation) | | | 301,432,766 | | | | (159,451,318 | ) |
| Net increase/(decrease) in net assets resulting from operations | | | 314,262,831 | | | | (69,405,624 | ) |
| | | | | | | | | |
| Net Equalization (Debits) | | | (870,038 | ) | | | (2,391,020 | ) |
| | | | | | | | | |
| DISTRIBUTIONS TO SHAREHOLDERS: | | | | | | | | |
| From distributable earnings | | | (47,603,187 | ) | | | (51,058,930 | ) |
| Total distributions | | | (47,603,187 | ) | | | (51,058,930 | ) |
| | | | | | | | | |
| CAPITAL SHARE TRANSACTIONS: | | | | | | | | |
| Proceeds from sale of shares | | | 22,489,013 | | | | 48,739,416 | |
| Cost of shares redeemed | | | (105,057,796 | ) | | | (135,465,114 | ) |
| Net income equalization (Note 2) | | | 870,038 | | | | 2,391,020 | |
| Net decrease from share transactions | | | (81,698,745 | ) | | | (84,334,678 | ) |
| Net increase/(decrease) in net assets | | | 184,090,861 | | | | (207,190,252 | ) |
| | | | | | | | | |
| NET ASSETS: | | | | | | | | |
| Beginning of year | | | 1,095,378,146 | | | | 1,302,568,398 | |
| End of year | | $ | 1,279,469,007 | | | $ | 1,095,378,146 | |
| | | | | | | | | |
| OTHER INFORMATION: | | | | | | | | |
| CAPITAL SHARE TRANSACTIONS: | | | | | | | | |
| Beginning shares | | | 22,484,141 | | | | 24,309,141 | |
| Shares sold | | | 425,000 | | | | 950,000 | |
| Shares redeemed | | | (2,000,000 | ) | | | (2,775,000 | ) |
| Shares outstanding, end of year | | | 20,909,141 | | | | 22,484,141 | |
See Notes to Financial Statements and Financial Highlights.
ALPS International Sector Dividend Dogs ETF
Statements of Changes in Net Assets
| | | For the Year Ended November 30, 2024 | | | For the Year Ended November 30, 2023 | |
| OPERATIONS: | | | | | | | | |
| Net investment income | | $ | 13,401,105 | | | $ | 10,480,699 | |
| Net realized gain/(loss) | | | 13,896,949 | | | | (3,493,809 | ) |
| Net change in unrealized appreciation/(depreciation) | | | (7,897,339 | ) | | | 24,007,949 | |
| Net increase in net assets resulting from operations | | | 19,400,715 | | | | 30,994,839 | |
| | | | | | | | | |
| Net Equalization Credits | | | 827,847 | | | | 1,593,144 | |
| | | | | | | | | |
| DISTRIBUTIONS TO SHAREHOLDERS: | | | | | | | | |
| From distributable earnings | | | (13,409,585 | ) | | | (10,066,812 | ) |
| Total distributions | | | (13,409,585 | ) | | | (10,066,812 | ) |
| | | | | | | | | |
| CAPITAL SHARE TRANSACTIONS: | | | | | | | | |
| Proceeds from sale of shares | | | 51,675,875 | | | | 60,732,845 | |
| Cost of shares redeemed | | | (6,612,472 | ) | | | (14,945,757 | ) |
| Net income equalization (Note 2) | | | (827,847 | ) | | | (1,593,144 | ) |
| Net increase from share transactions | | | 44,235,556 | | | | 44,193,944 | |
| Net increase in net assets | | | 51,054,533 | | | | 66,715,115 | |
| | | | | | | | | |
| NET ASSETS: | | | | | | | | |
| Beginning of year | | | 236,665,757 | | | | 169,950,642 | |
| End of year | | $ | 287,720,290 | | | $ | 236,665,757 | |
| | | | | | | | | |
| OTHER INFORMATION: | | | | | | | | |
| CAPITAL SHARE TRANSACTIONS: | | | | | | | | |
| Beginning shares | | | 8,250,000 | | | | 6,575,000 | |
| Shares sold | | | 1,725,000 | | | | 2,225,000 | |
| Shares redeemed | | | (225,000 | ) | | | (550,000 | ) |
| Shares outstanding, end of year | | | 9,750,000 | | | | 8,250,000 | |
See Notes to Financial Statements and Financial Highlights.
ALPS Emerging Sector Dividend Dogs ETF
Statements of Changes in Net Assets
| | | For the Year Ended November 30, 2024 | | | For the Year Ended November 30, 2023 | |
| OPERATIONS: | | | | | | | | |
| Net investment income | | $ | 1,409,389 | | | $ | 1,931,973 | |
| Net realized gain/(loss) | | | 915,724 | | | | (1,181,193 | ) |
| Net change in unrealized appreciation/(depreciation) | | | (318,660 | ) | | | 561,215 | |
| Net increase in net assets resulting from operations | | | 2,006,453 | | | | 1,311,995 | |
| | | | | | | | | |
| Net Equalization (Debits) | | | (15,965 | ) | | | (7,348 | ) |
| | | | | | | | | |
| DISTRIBUTIONS TO SHAREHOLDERS: | | | | | | | | |
| From distributable earnings | | | (1,258,329 | ) | | | (1,969,818 | ) |
| Total distributions | | | (1,258,329 | ) | | | (1,969,818 | ) |
| | | | | | | | | |
| CAPITAL SHARE TRANSACTIONS: | | | | | | | | |
| Proceeds from sale of shares | | | — | | | | 3,780,259 | |
| Cost of shares redeemed | | | (4,767,074 | ) | | | (1,060,988 | ) |
| Net income equalization (Note 2) | | | 15,965 | | | | 7,348 | |
| Net increase/(decrease) from share transactions | | | (4,751,109 | ) | | | 2,726,619 | |
| Net increase/(decrease) in net assets | | | (4,018,950 | ) | | | 2,061,448 | |
| | | | | | | | | |
| NET ASSETS: | | | | | | | | |
| Beginning of year | | | 30,243,434 | | | | 28,181,986 | |
| End of year | | $ | 26,224,484 | | | $ | 30,243,434 | |
| | | | | | | | | |
| OTHER INFORMATION: | | | | | | | | |
| CAPITAL SHARE TRANSACTIONS: | | | | | | | | |
| Beginning shares | | | 1,450,000 | | | | 1,325,000 | |
| Shares sold | | | — | | | | 175,000 | |
| Shares redeemed | | | (225,000 | ) | | | (50,000 | ) |
| Shares outstanding, end of year | | | 1,225,000 | | | | 1,450,000 | |
See Notes to Financial Statements and Financial Highlights.
ALPS REIT Dividend Dogs ETF
Statements of Changes in Net Assets
| | | For the Year Ended November 30, 2024 | | | For the Year Ended November 30, 2023 | |
| OPERATIONS: | | | | | | | | |
| Net investment income | | $ | 382,746 | | | $ | 630,900 | |
| Net realized loss | | | (717,319 | ) | | | (3,144,755 | ) |
| Net change in unrealized appreciation/(depreciation) | | | 3,029,621 | | | | 955,305 | |
| Net increase/(decrease) in net assets resulting from operations | | | 2,695,048 | | | | (1,558,550 | ) |
| | | | | | | | | |
| DISTRIBUTIONS TO SHAREHOLDERS: | | | | | | | | |
| From distributable earnings | | | (463,643 | ) | | | (651,314 | ) |
| From tax return of capital | | | (312,295 | ) | | | (442,862 | ) |
| Total distributions | | | (775,938 | ) | | | (1,094,176 | ) |
| | | | | | | | | |
| CAPITAL SHARE TRANSACTIONS: | | | | | | | | |
| Proceeds from sale of shares | | | 2,116,950 | | | | — | |
| Cost of shares redeemed | | | (1,019,933 | ) | | | (6,444,564 | ) |
| Net increase/(decrease) from share transactions | | | 1,097,017 | | | | (6,444,564 | ) |
| Net increase/(decrease) in net assets | | | 3,016,127 | | | | (9,097,290 | ) |
| | | | | | | | | |
| NET ASSETS: | | | | | | | | |
| Beginning of year | | | 11,656,352 | | | | 20,753,642 | |
| End of year | | $ | 14,672,479 | | | $ | 11,656,352 | |
| | | | | | | | | |
| OTHER INFORMATION: | | | | | | | | |
| CAPITAL SHARE TRANSACTIONS: | | | | | | | | �� |
| Beginning shares | | | 325,000 | | | | 500,000 | |
| Shares sold | | | 50,000 | | | | — | |
| Shares redeemed | | | (25,000 | ) | | | (175,000 | ) |
| Shares outstanding, end of year | | | 350,000 | | | | 325,000 | |
See Notes to Financial Statements and Financial Highlights.
| ALPS Sector Dividend Dogs ETF | |
| Financial Highlights | For a Share Outstanding Throughout the Periods Presented |
| | | For the Year Ended November 30, 2024 | | | For the Year Ended November 30, 2023 | | | For the Year Ended November 30, 2022 | | | For the Year Ended November 30, 2021 | | | For the Year Ended November 30, 2020 | |
| NET ASSET VALUE, BEGINNING OF PERIOD | | $ | 48.72 | | | $ | 53.58 | | | $ | 50.47 | | | $ | 43.69 | | | $ | 45.78 | |
| | | | | | | | | | | | | | | | | | | | | |
| INCOME/(LOSS) FROM INVESTMENT OPERATIONS: | | | | | | | | | | | | | | | | | | | | |
| Net investment income (a) | | | 2.18 | | | | 2.06 | | | | 2.02 | | | | 1.75 | | | | 1.70 | |
| Net realized and unrealized gain/(loss) | | | 12.49 | | | | (4.79 | ) | | | 3.11 | | | | 6.84 | | | | (2.14 | ) |
| Total from investment operations | | | 14.67 | | | | (2.73 | ) | | | 5.13 | | | | 8.59 | | | | (0.44 | ) |
| | | | | | | | | | | | | | | | | | | | | |
| DISTRIBUTIONS: | | | | | | | | | | | | | | | | | | | | |
| From net investment income | | | (2.20 | ) | | | (2.13 | ) | | | (2.02 | ) | | | (1.81 | ) | | | (1.65 | ) |
| Total distributions | | | (2.20 | ) | | | (2.13 | ) | | | (2.02 | ) | | | (1.81 | ) | | | (1.65 | ) |
| | | | | | | | | | | | | | | | | | | | | |
| Net increase/(decrease) in net asset value | | | 12.47 | | | | (4.86 | ) | | | 3.11 | | | | 6.78 | | | | (2.09 | ) |
| NET ASSET VALUE, END OF PERIOD | | $ | 61.19 | | | $ | 48.72 | | | $ | 53.58 | | | $ | 50.47 | | | $ | 43.69 | |
| TOTAL RETURN(b) | | | 30.83 | % | | | (5.07 | )% | | | 10.42 | % | | | 19.77 | % | | | (0.27 | )% |
| | | | | | | | | | | | | | | | | | | | | |
| RATIOS/SUPPLEMENTAL DATA: | | | | | | | | | | | | | | | | | | | | |
| Net assets, end of period (000s) | | $ | 1,279,469 | | | $ | 1,095,378 | | | $ | 1,302,568 | | | $ | 1,134,743 | | | $ | 1,007,514 | |
| | | | | | | | | | | | | | | | | | | | | |
| Ratio of expenses to average net assets | | | 0.36 | % | | | 0.37 | %(c) | | | 0.40 | % | | | 0.40 | % | | | 0.40 | % |
| Ratio of net investment income to average net assets | | | 4.01 | % | | | 4.10 | % | | | 3.84 | % | | | 3.43 | % | | | 4.27 | % |
| Portfolio turnover rate(d) | | | 52 | % | | | 51 | % | | | 53 | % | | | 54 | % | | | 77 | % |
| Undistributed net investment income included in price of units issued and redeemed(a)(e) | | $ | (0.04 | ) | | $ | (0.10 | ) | | $ | 0.06 | | | $ | (0.02 | ) | | $ | 0.12 | |
| (a) | Based on average shares outstanding during the period. |
| (b) | Total return is calculated assuming an initial investment made at the net asset value at the beginning of the period and redemption at the net asset value on the last day of the period and assuming all distributions are reinvested at reinvestment prices. Total return calculated for a period of less than one year is not annualized. |
| (c) | Effective April 1, 2023 the Advisory Fee changed from 0.40% to 0.36%. |
| (d) | Portfolio turnover for periods less than one year is not annualized and does not include securities received or delivered from processing creations or redemptions in-kind. |
| (e) | The per share amount of equalization is presented to show the impact of equalization on distributable earnings per share. |
See Notes to Financial Statements and Financial Highlights.
| ALPS International Sector Dividend Dogs ETF | |
| Financial Highlights | For a Share Outstanding Throughout the Periods Presented |
| | | For the Year Ended November 30, 2024 | | | For the Year Ended November 30, 2023 | | | For the Year Ended November 30, 2022 | | | For the Year Ended November 30, 2021 | | | For the Year Ended November 30, 2020 | |
| NET ASSET VALUE, BEGINNING OF PERIOD | | $ | 28.69 | | | $ | 25.85 | | | $ | 26.47 | | | $ | 24.82 | | | $ | 26.88 | |
| | | | | | | | | | | | | | | | | | | | | |
| INCOME/(LOSS) FROM INVESTMENT OPERATIONS: | | | | | | | | | | | | | | | | | | | | |
| Net investment income(a) | | | 1.44 | | | | 1.41 | | | | 1.15 | | | | 1.09 | | | | 0.75 | |
| Net realized and unrealized gain/(loss) | | | 0.82 | | | | 2.80 | | | | (0.68 | ) | | | 1.65 | | | | (1.66 | ) |
| Total from investment operations | | | 2.26 | | | | 4.21 | | | | 0.47 | | | | 2.74 | | | | (0.91 | ) |
| | | | | | | | | | | | | | | | | | | | | |
| DISTRIBUTIONS: | | | | | | | | | | | | | | | | | | | | |
| From net investment income | | | (1.44 | ) | | | (1.37 | ) | | | (1.07 | ) | | | (1.08 | ) | | | (1.11 | ) |
| Tax return of capital | | | — | | | | — | | | | (0.02 | ) | | | (0.01 | ) | | | (0.04 | ) |
| Total distributions | | | (1.44 | ) | | | (1.37 | ) | | | (1.09 | ) | | | (1.09 | ) | | | (1.15 | ) |
| | | | | | | | | | | | | | | | | | | | | |
| Net increase/(decrease) in net asset value | | | 0.82 | | | | 2.84 | | | | (0.62 | ) | | | 1.65 | | | | (2.06 | ) |
| NET ASSET VALUE, END OF PERIOD | | $ | 29.51 | | | $ | 28.69 | | | $ | 25.85 | | | $ | 26.47 | | | $ | 24.82 | |
| TOTAL RETURN(b) | | | 7.86 | % | | | 16.71 | % | | | 1.92 | % | | | 10.93 | % | | | (3.08 | )% |
| | | | | | | | | | | | | | | | | | | | | |
| RATIOS/SUPPLEMENTAL DATA: | | | | | | | | | | | | | | | | | | | | |
| Net assets, end of period (000s) | | $ | 287,720 | | | $ | 236,666 | | | $ | 169,951 | | | $ | 157,489 | | | $ | 146,431 | |
| | | | | | | | | | | | | | | | | | | | | |
| Ratio of expenses to average net assets | | | 0.50 | % | | | 0.50 | % | | | 0.50 | % | | | 0.50 | % | | | 0.50 | % |
| Ratio of net investment income to average net assets | | | 4.79 | % | | | 5.12 | % | | | 4.43 | % | | | 3.92 | % | | | 3.22 | % |
| Portfolio turnover rate(c) | | | 55 | % | | | 62 | % | | | 54 | % | | | 61 | % | | | 79 | % |
| Undistributed net investment income included in price of units issued and redeemed(a)(d) | | $ | 0.09 | | | $ | 0.21 | | | $ | 0.03 | | | $ | (0.25 | ) | | $ | 0.00 | (e) |
| (a) | Based on average shares outstanding during the period. |
| (b) | Total return is calculated assuming an initial investment made at the net asset value at the beginning of the period and redemption at the net asset value on the last day of the period and assuming all distributions are reinvested at reinvestment prices. Total return calculated for a period of less than one year is not annualized. |
| (c) | Portfolio turnover for periods less than one year is not annualized and does not include securities received or delivered from processing creations or redemptions in-kind. |
| (d) | The per share amount of equalization is presented to show the impact of equalization on distributable earnings per share. |
See Notes to Financial Statements and Financial Highlights.
| ALPS Emerging Sector Dividend Dogs ETF | |
| Financial Highlights | For a Share Outstanding Throughout the Periods Presented |
| | | For the Year Ended November 30, 2024 | | | For the Year Ended November 30, 2023 | | | For the Year Ended November 30, 2022 | | | For the Year Ended November 30, 2021 | | | For the Year Ended November 30, 2020 | |
| NET ASSET VALUE, BEGINNING OF PERIOD | | $ | 20.86 | | | $ | 21.27 | | | $ | 23.56 | | | $ | 20.96 | | | $ | 20.67 | |
| | | | | | | | | | | | | | | | | | | | | |
| INCOME/(LOSS) FROM INVESTMENT OPERATIONS: | | | | | | | | | | | | | | | | | | | | |
| Net investment income(a) | | | 1.12 | | | | 1.39 | | | | 1.11 | | | | 1.04 | | | | 0.56 | |
| Net realized and unrealized gain/(loss) | | | 0.43 | | | | (0.39 | ) | | | (2.41 | ) | | | 2.50 | | | | 0.42 | |
| Total from investment operations | | | 1.55 | | | | 1.00 | | | | (1.30 | ) | | | 3.54 | | | | 0.98 | |
| | | | | | | | | | | | | | | | | | | | | |
| DISTRIBUTIONS: | | | | | | | | | | | | | | | | | | | | |
| From net investment income | | | (1.00 | ) | | | (1.41 | ) | | | (0.99 | ) | | | (0.94 | ) | | | (0.69 | ) |
| Total distributions | | | (1.00 | ) | | | (1.41 | ) | | | (0.99 | ) | | | (0.94 | ) | | | (0.69 | ) |
| | | | | | | | | | | | | | | | | | | | | |
| Net increase/(decrease) in net asset value | | | 0.55 | | | | (0.41 | ) | | | (2.29 | ) | | | 2.60 | | | | 0.29 | |
| NET ASSET VALUE, END OF PERIOD | | $ | 21.41 | | | $ | 20.86 | | | $ | 21.27 | | | $ | 23.56 | | | $ | 20.96 | |
| TOTAL RETURN(b) | | | 7.55 | % | | | 4.88 | % | | | (5.20 | )% | | | 16.81 | % | | | 5.20 | % |
| | | | | | | | | | | | | | | | | | | | | |
| RATIOS/SUPPLEMENTAL DATA: | | | | | | | | | | | | | | | | | | | | |
| Net assets, end of period (000s) | | $ | 26,224 | | | $ | 30,243 | | | $ | 28,182 | | | $ | 24,742 | | | $ | 20,958 | |
| | | | | | | | | | | | | | | | | | | | | |
| Ratio of expenses to average net assets | | | 0.60 | % | | | 0.60 | % | | | 0.60 | % | | | 0.60 | % | | | 0.60 | % |
| Ratio of net investment income to average net assets | | | 5.22 | % | | | 6.54 | % | | | 5.17 | % | | | 4.32 | % | | | 2.92 | % |
| Portfolio turnover rate(c) | | | 83 | % | | | 85 | % | | | 90 | % | | | 84 | % | | | 93 | % |
| Undistributed net investment income included in price of units issued and redeemed(a)(d) | | $ | (0.01 | ) | | $ | (0.01 | ) | | $ | 0.06 | | | $ | 0.02 | | | $ | 0.02 | |
| (a) | Based on average shares outstanding during the period. |
| (b) | Total return is calculated assuming an initial investment made at the net asset value at the beginning of the period and redemption at the net asset value on the last day of the period and assuming all distributions are reinvested at reinvestment prices. Total return calculated for a period of less than one year is not annualized. |
| (c) | Portfolio turnover for periods less than one year is not annualized and does not include securities received or delivered from processing creations or redemptions in-kind. |
| (d) | The per share amount of equalization is presented to show the impact of equalization on distributable earnings per share. |
See Notes to Financial Statements and Financial Highlights.
| ALPS REIT Dividend Dogs ETF | |
| Financial Highlights | For a Share Outstanding Throughout the Periods Presented |
| | | For the Year Ended November 30, 2024 | | | For the Year Ended November 30, 2023 | | | For the Year Ended November 30, 2022 | | | For the Year Ended November 30, 2021 | | | For the Year Ended November 30, 2020 (a) | |
| NET ASSET VALUE, BEGINNING OF PERIOD | | $ | 35.87 | | | $ | 41.51 | | | $ | 49.89 | | | $ | 40.49 | | | $ | 48.42 | |
| | | | | | | | | | | | | | | | | | | | | |
| INCOME/(LOSS) FROM INVESTMENT OPERATIONS: | | | | | | | | | | | | | | | | | | | | |
| Net investment income (b) | | | 1.16 | | | | 1.51 | | | | 1.49 | | | | 1.21 | | | | 1.29 | |
| Net realized and unrealized gain/(loss) | | | 7.32 | | | | (4.62 | ) | | | (7.86 | ) | | | 10.25 | | | | (7.26 | ) |
| Total from investment operations | | | 8.48 | | | | (3.11 | ) | | | (6.37 | ) | | | 11.46 | | | | (5.97 | ) |
| | | | | | | | | | | | | | | | | | | | | |
| DISTRIBUTIONS: | | | | | | | | | | | | | | | | | | | | |
| From net investment income | | | (1.44 | ) | | | (1.46 | ) | | | (1.51 | ) | | | (1.36 | ) | | | (1.57 | ) |
| Tax return of capital | | | (0.99 | ) | | | (1.07 | ) | | | (0.50 | ) | | | (0.70 | ) | | | (0.39 | ) |
| Total distributions | | | (2.43 | ) | | | (2.53 | ) | | | (2.01 | ) | | | (2.06 | ) | | | (1.96 | ) |
| | | | | | | | | | | | | | | | | | | | | |
| Net increase/(decrease) in net asset value | | | 6.05 | | | | (5.64 | ) | | | (8.38 | ) | | | 9.40 | | | | (7.93 | ) |
| NET ASSET VALUE, END OF PERIOD | | $ | 41.92 | | | $ | 35.87 | | | $ | 41.51 | | | $ | 49.89 | | | $ | 40.49 | |
| TOTAL RETURN(c) | | | 24.51 | % | | | (7.16 | )% | | | (13.06 | )% | | | 29.03 | % | | | (11.77 | )% |
| | | | | | | | | | | | | | | | | | | | | |
| RATIOS/SUPPLEMENTAL DATA: | | | | | | | | | | | | | | | | | | | | |
| Net assets, end of period (000s) | | $ | 14,672 | | | $ | 11,656 | | | $ | 20,754 | | | $ | 28,689 | | | $ | 26,320 | |
| | | | | | | | | | | | | | | | | | | | | |
| Ratio of expenses to average net assets | | | 0.35 | % | | | 0.35 | % | | | 0.35 | % | | | 0.35 | % | | | 0.38 | %(d) |
| Ratio of net investment income to average net assets | | | 3.05 | % | | | 4.09 | % | | | 3.23 | % | | | 2.60 | % | | | 3.26 | % |
| Portfolio turnover rate(e) | | | 57 | % | | | 89 | % | | | 85 | % | | | 78 | % | | | 148 | % |
| (a) | Prior to January 2, 2020, the ALPS REIT Dividend Dogs ETF was known as the Cohen & Steers Global Realty Majors ETF. |
| (b) | Based on average shares outstanding during the period. |
| (c) | Total return is calculated assuming an initial investment made at the net asset value at the beginning of the period and redemption at the net asset value on the last day of the period and assuming all distributions are reinvested at reinvestment prices. Total return calculated for a period of less than one year is not annualized. |
| (d) | Effective January 2, 2020 the Fund's Advisory Fee changed from 0.55% to 0.35%. |
| (e) | Portfolio turnover for periods less than one year is not annualized and does not include securities received or delivered from processing creations or redemptions in-kind. |
See Notes to Financial Statements and Financial Highlights.
| ALPS ETF Trust | |
| Notes to Financial Statements and Financial Highlights | November 30, 2024 |
1. ORGANIZATION
ALPS ETF Trust (the “Trust”), a Delaware statutory trust, is an open-end management investment company registered under the Investment Company Act of 1940, as amended (the “1940 Act”). As of November 30, 2024, the Trust consisted of twenty-three separate portfolios. Each portfolio represents a separate series of the Trust. This report pertains to the ALPS Sector Dividend Dogs ETF, the ALPS International Sector Dividend Dogs ETF, the ALPS Emerging Sector Dividend Dogs ETF, and the ALPS REIT Dividend Dogs ETF (each a “Fund” and collectively, the “Funds”).
The investment objective of the ALPS Sector Dividend Dogs ETF is to seek investment results that replicate as closely as possible, before fees and expenses, the performance of the S-Network® Sector Dividend Dogs Index. The investment objective of the ALPS International Sector Dividend Dogs ETF is to seek investment results that replicate as closely as possible, before fees and expenses, the performance of the S-Network® International Sector Dividend Dogs Index. The investment objective of the ALPS Emerging Sector Dividend Dogs ETF is to seek investment results that replicate as closely as possible, before fees and expenses, the performance of the S-Network® Emerging Sector Dividend Dogs Index. The investment objective of the ALPS REIT Dividend Dogs ETF is to seek investment results that replicate as closely as possible, before fees and expenses, the performance of the S-Network® REIT Dividend Dogs Index. Each Fund has elected to qualify as a diversified series of the Trust under the 1940 Act.
Each Fund’s Shares (“Shares”) are listed on the NYSE Arca, Inc. (the “NYSE Arca”). Each Fund issues and redeems Shares, at net asset value (“NAV”) in blocks of 25,000 Shares, each of which is called a “Creation Unit”. Creation Units are issued and redeemed principally in-kind for securities included in the Underlying Index. Except when aggregated in Creation Units, Shares are not redeemable securities of the Fund.
Pursuant to the Trust’s organizational documents, its Officers and Trustees are indemnified against certain liability arising out of the performance of their duties to the Trust. Additionally, in the normal course of business, the Trust enters into contracts with service providers that contain general indemnification clauses. The Trust’s maximum exposure under these arrangements is unknown, as this would involve future claims that may be made against the Trust that have not yet occurred.
2. SIGNIFICANT ACCOUNTING POLICIES
The following is a summary of significant accounting policies consistently followed by the Funds in the preparation of the financial statements. The accompanying financial statements were prepared in accordance with accounting principles generally accepted in the United States of America (“U.S. GAAP”). The preparation of financial statements in conformity with U.S. GAAP requires management to make certain estimates and assumptions that affect the reported amounts of assets and liabilities and disclosures of contingent assets and liabilities at the date of the financial statements and the reported amounts of revenue and expenses during the period. Actual results could differ from those estimates. Each Fund is considered an investment company under U.S. GAAP and follows the accounting and reporting guidance applicable to investment companies in the Financial Accounting Standards Board (“FASB”) Accounting Standards Codification Topic 946.
A. Portfolio Valuation
Each Fund’s NAV is determined daily, as of the close of regular trading on the New York Stock Exchange (“NYSE”), normally 4:00 p.m. Eastern time, on each day the NYSE is open for trading. The NAV is computed by dividing the value of all assets of the Fund (including accrued interest and dividends), less all liabilities (including accrued expenses and dividends declared but unpaid), by the total number of shares outstanding.
Portfolio securities listed on any exchange other than the NASDAQ Stock Market LLC (“NASDAQ”) are valued at the last sale price on the business day as of which such value is being determined. If there has been no sale on such day, the securities are valued at the mean of the most recent bid and ask prices on such day. Securities traded on the NASDAQ are valued at the NASDAQ Official Closing Price as determined by NASDAQ. Portfolio securities traded on more than one securities exchange are valued at the last sale price on the business day as of which such value is being determined at the close of the exchange representing the principal market for such securities. Portfolio securities traded in the over-the-counter market, but excluding securities traded on the NASDAQ, are valued at the last quoted sale price in such market.
The Funds’ investments are valued at market value or, in the absence of market value with respect to any portfolio securities, at fair value according to procedures adopted by the Trust’s Board of Trustees (the “Board”). Pursuant to Rule 2a-5 under the 1940 Act, the Board designated ALPS Advisors, Inc. (the "Adviser") as the valuation designee ("Valuation Designee") for each Fund to perform the fair value determinations relating to Fund investments. The Adviser may carry out its designated responsibilities as Valuation Designee through various teams and committees. When market quotations are not readily available or when events occur that make established valuation methods unreliable, securities of the Funds may be valued in good faith by the Valuation Designee. These securities generally include, but are not limited to, restricted securities (securities which may not be publicly sold without registration under the Securities Act of 1933) for which a pricing service is unable to provide a market price; securities whose trading has been formally suspended; a security whose market price is not available from a pre-established primary pricing source or the pricing source is not willing to provide a price; a security with respect to which an event has occurred that is most likely to materially affect the value of the security after the market has closed but before the calculation of the Fund’s NAV or make it difficult or impossible to obtain a reliable market quotation; or a security whose price, as provided by the pricing service, does not reflect the security’s “fair value” due to the security being de-listed from a national exchange or the security’s primary trading market is temporarily closed at a time when, under normal conditions, it would be open. As a general principle, the current “fair value” of a security would be the amount which the owner might reasonably expect to receive from the sale on the applicable exchange or principal market. A variety of factors may be considered in determining the fair value of such securities.
| ALPS ETF Trust | |
| Notes to Financial Statements and Financial Highlights | November 30, 2024 |
B. Fair Value Measurements
Each Fund discloses the classification of its fair value measurements following a three-tier hierarchy based on the inputs used to measure fair value. Inputs refer broadly to the assumptions that market participants would use in pricing the asset or liability, including assumptions about risk. Inputs may be observable or unobservable. Observable inputs reflect the assumptions market participants would use in pricing the asset or liability that are developed based on market data obtained from sources independent of the reporting entity. Unobservable inputs reflect the reporting entity’s own assumptions about the assumptions market participants would use in pricing the asset or liability that are developed based on the best information available.
Valuation techniques used to value the Funds’ investments by major category are as follows:
Equity securities, including restricted securities, for which market quotations are readily available, are valued at the last reported sale price or official closing price as reported by a third party pricing vendor on the primary market or exchange on which they are traded and are categorized as Level 1 in the hierarchy. In the event there were no sales during the day or closing prices are not available, securities are valued at the mean of the most recent quoted bid and ask prices on such day and are generally categorized as Level 2 in the hierarchy. Investments in open-end mutual funds are valued at their closing NAV each business day and are categorized as Level 1 in the hierarchy.
Changes in valuation techniques may result in transfers in or out of an assigned level within the disclosure hierarchy.
Various inputs are used in determining the value of each Fund’s investments as of the end of the reporting period. When inputs used fall into different levels of the fair value hierarchy, the level in the hierarchy within which the fair value measurement falls is determined based on the lowest level input that is significant to the fair value measurement in its entirety. The designated input levels are not necessarily an indication of the risk or liquidity associated with these investments.
These inputs are categorized in the following hierarchy under applicable financial accounting standards:
| Level 1 – | Unadjusted quoted prices in active markets for identical investments, unrestricted assets or liabilities that a Fund has the ability to access at the measurement date; |
| Level 2 – | Quoted prices which are not active, quoted prices for similar assets or liabilities in active markets or inputs other than quoted prices that are observable (either directly or indirectly) for substantially the full term of the asset or liability; and |
| Level 3 – | Significant unobservable prices or inputs (including the Fund’s own assumptions in determining the fair value of investments) where there is little or no market activity for the asset or liability at the measurement date. |
| ALPS ETF Trust | |
| Notes to Financial Statements and Financial Highlights | November 30, 2024 |
The following is a summary of the inputs used to value the Funds’ investments as of November 30, 2024:
ALPS Sector Dividend Dogs ETF
| Investments in Securities at Value | | Level 1 - Quoted and Unadjusted Prices | | | Level 2 - Other Significant Observable Inputs | | | Level 3 - Significant Unobservable Inputs | | | Total | |
| Common Stocks* | | $ | 1,272,787,578 | | | $ | — | | | $ | — | | | $ | 1,272,787,578 | |
| Short Term Investments | | | 1,127,981 | | | | — | | | | — | | | | 1,127,981 | |
| Total | | $ | 1,273,915,559 | | | $ | — | | | $ | — | | | $ | 1,273,915,559 | |
ALPS International Sector Dividend Dogs ETF
| Investments in Securities at Value | | Level 1 - Quoted and Unadjusted Prices | | | Level 2 - Other Significant Observable Inputs | | | Level 3 - Significant Unobservable Inputs | | | Total | |
| Common Stocks* | | $ | 285,523,266 | | | $ | — | | | $ | — | | | $ | 285,523,266 | |
| Short Term Investments | | | 17,738,918 | | | | — | | | | — | | | | 17,738,918 | |
| Total | | $ | 303,262,184 | | | $ | — | | | $ | — | | | $ | 303,262,184 | |
ALPS Emerging Sector Dividend Dogs ETF
| Investments in Securities at Value | | Level 1 - Quoted and Unadjusted Prices | | | Level 2 - Other Significant Observable Inputs | | | Level 3 - Significant Unobservable Inputs | | | Total | |
| Common Stocks* | | | | | | | | | | | | | | | | |
| Russia | | $ | — | | | $ | — | | | $ | 1,233 | | | $ | 1,233 | |
| Other* | | | 25,409,182 | | | | — | | | | — | | | | 25,409,182 | |
| Preferred Stock* | | | 519,497 | | | | — | | | | — | | | | 519,497 | |
| Short Term Investments | | | 102,227 | | | | — | | | | — | | | | 102,227 | |
| Total | | $ | 26,030,906 | | | $ | — | | | $ | 1,233 | | | $ | 26,032,139 | |
ALPS REIT Dividend Dogs ETF
| Investments in Securities at Value | | Level 1 - Quoted and Unadjusted Prices | | | Level 2 - Other Significant Observable Inputs | | | Level 3 - Significant Unobservable Inputs | | | Total | |
| Common Stocks* | | $ | 14,596,513 | | | $ | — | | | $ | — | | | $ | 14,596,513 | |
| Short Term Investments | | | 106,376 | | | | — | | | | — | | | | 106,376 | |
| Total | | $ | 14,702,889 | | | $ | — | | | $ | — | | | $ | 14,702,889 | |
| * | For a detailed sector/country breakdown, see the accompanying Schedules of Investments. |
The Funds, except for the ALPS Emerging Sector Dividend Dogs ETF, did not have any securities that used significant unobservable inputs (Level 3) in determining fair value and there were no transfers into or out of Level 3 during the year ended November 30, 2024. The Adviser has determined that the value of Level 3 securities is not material; therefore, a reconciliation of assets of the ALPS Emerging Sector Dividend Dogs ETF for Level 3 investments for which significant unobservable inputs were used to determine fair value is not presented for the year ended November 30, 2024.
C. Foreign Securities
The ALPS International Sector Dividend Dogs ETF, the ALPS Emerging Sector Dividend Dogs ETF, and the ALPS REIT Dividend Dogs ETF may directly purchase securities of foreign issuers. Investments in non-U.S. issuers may involve unique risks compared to investing in securities of U.S. issuers, including, among others, less liquidity generally, greater market volatility than U.S. securities and less complete financial information and less stringent accounting, corporate governance and financial reporting standards than for U.S. issuers. In addition, adverse political, economic, social, regulatory, business or environmental developments could undermine the value of the Fund’s investments or prevent a Fund from realizing the full value of its investments. For example, the rights and remedies associated with investments in foreign securities may be different than investments in domestic securities. Financial reporting standards for companies based in foreign markets differ from those in the United States. Finally, the value of the currency of the country in which a Fund has invested could decline relative to the value of the U.S. dollar, which may affect the value of the investment to U.S. investors.
Because foreign markets may be open on different days than the days during which investors may purchase the shares of each Fund, the value of each Fund's securities may change on the days when investors are not able to purchase the shares of the Funds. The value of securities denominated in foreign currencies is converted into U.S. dollars using exchange rates determined daily as of the close of regular trading on the NYSE or NASDAQ. Any use of a different rate from the rates used by the Index may adversely affect a Fund's ability to track its Index.
| ALPS ETF Trust | |
| Notes to Financial Statements and Financial Highlights | November 30, 2024 |
D. Foreign Currency Translation
The books and records of the Funds are maintained in U.S. dollars. Investment valuations and other assets and liabilities initially expressed in foreign currencies are converted each business day into U.S. dollars based upon current exchange rates. The portion of realized and unrealized gains or losses on investments due to fluctuations in foreign currency exchange rates is not separately disclosed and is included in realized and unrealized gains or losses on investments, when applicable.
E. Securities Transactions and Investment Income
Securities transactions are recorded as of the trade date. Realized gains and losses from securities transactions are recorded on the specific identification in accordance with GAAP. Dividend income and capital gains distributions, if any, are recorded on the ex-dividend date, net of any foreign taxes withheld. Interest income, if any, is recorded on the accrual basis, including any amortization of premiums and accretion of discounts. Income received from foreign sources may result in withholding tax. Withholding taxes are accrued at the same time as the related income if the tax rate is fixed and known, unless a tax withheld is reclaimable from the local tax authorities in which case it is recorded as receivable. If the tax rate is not known or estimable, such expense or reclaim receivable is recorded when the net proceeds are received.
F. Dividends and Distributions to Shareholders
Dividends from net investment income for each Fund, if any, are declared and paid quarterly or as the Board may determine from time to time. Distributions of net realized capital gains earned by the Funds, if any, are distributed at least annually.
G. Equalization
The ALPS Sector Dividend Dogs ETF, the ALPS International Sector Dividend Dogs ETF, and the ALPS Emerging Sector Dividend Dogs ETF utilize the accounting practice known as “Equalization” by which a portion of the proceeds from sales and costs of reacquiring the Funds’ shares, equivalent on a per share basis to the amount of distributable net investment income on the date of the transaction, is credited or charged to undistributed net investment income. As a result, undistributed net investment income per share is unaffected by sales or reacquisitions of the Funds’ shares. Amounts related to Equalization can be found on the Statements of Changes in Net Assets.
H. Foreign Taxes
The ALPS International Sector Dividend Dogs ETF, the ALPS Emerging Sector Dividend Dogs ETF, and the ALPS REIT Dividend Dogs ETF may be subject to foreign taxes (a portion of which may be reclaimable) on income, corporate events, foreign currency exchanges and capital gains on investments. All foreign taxes are recorded in accordance with the applicable foreign tax regulations and rates that exist in foreign markets in which the Funds invest. These foreign taxes, if any, are paid by these Funds and are disclosed in each Fund’s Statement of Operations. Foreign taxes accrued as of November 30, 2024, if any, are reflected in each Fund’s Statement of Assets and Liabilities.
I. Real Estate Investment Trusts (“REITs”)
As part of its investments in real estate related securities, the ALPS REIT Dividend Dogs ETF (“RDOG”) will invest in REITs and is subject to certain risks associated with direct investment in REITs. REITs possess certain risks which differ from an investment in common stocks. REITs are financial vehicles that pool investors’ capital to acquire, develop and/or finance real estate and provide services to their tenants. REITs may concentrate their investments in specific geographic areas or in specific property types, e.g., regional malls, shopping centers, office buildings, apartment buildings and industrial warehouses. REITs may be affected by changes in the value of their underlying properties and by defaults by borrowers or tenants. REITs depend generally on their ability to generate cash flow to make distributions to shareowners or unitholders, and certain REITs have self-liquidation provisions by which mortgages held may be paid in full and distributions of capital returns may be made at any time.
As REITs generally pay a higher rate of dividends than most other operating companies, to the extent application of RDOG’s investment strategy results in RDOG investing in REIT shares, the percentage of RDOG’s dividend income received from REIT shares will likely exceed the percentage of RDOG’s portfolio that is comprised of REIT shares. Distributions received by RDOG from REITs may consist of dividends, capital gains and/or return of capital.
Dividend income from REITs is recognized on the ex-dividend date. The calendar year-end amounts of ordinary income, capital gains, and return of capital included in distributions received from RDOG’s investments in REITs are reported to RDOG after the end of the calendar year; accordingly, RDOG estimates these amounts for accounting purposes until the characterization of REIT distributions is reported to RDOG after the end of the calendar year. Estimates are based on the most recent REIT distribution information available.
The performance of a REIT may be affected by its failure to qualify for tax-free pass-through of income under the Internal Revenue Code of 1986, as amended (the “Code”), or its failure to maintain exemption from registration under the 1940 Act. Due to RDOG’s investments in REITs, RDOG may also make distributions in excess of RDOG’s earnings and capital gains. Distributions, if any, in excess of RDOG’s earnings and profits will first reduce the adjusted tax basis of a holder’s shares and, after that basis has been reduced to zero, will constitute capital gains to the shareholder.
| ALPS ETF Trust | |
| Notes to Financial Statements and Financial Highlights | November 30, 2024 |
J. Federal Tax and Tax Basis Information
The timing and character of income and capital gain distributions are determined in accordance with income tax regulations, which may differ from U.S. GAAP. Reclassifications are made to the Funds’ capital accounts for permanent tax differences to reflect income and gains available for distribution (or available capital loss carryforwards) under income tax regulations.
For the year ended November 30, 2024, the following reclassifications, which had no impact on results of operations or net assets, were recorded to reflect permanent tax differences resulting primarily from in-kind transactions, REIT true-up adjustments and prior year tax return true-ups:
| Fund | | Paid-in Capital | | | Total Distributable Earnings | |
| ALPS Sector Dividend Dogs ETF | | $ | 13,691,506 | | | $ | (13,691,506 | ) |
| ALPS International Sector Dividend Dogs ETF | | | 808,150 | | | | (808,150 | ) |
| ALPS Emerging Sector Dividend Dogs ETF | | | 332,148 | | | | (332,148 | ) |
| ALPS REIT Dividend Dogs ETF | | | 33,145 | | | | (33,145 | ) |
The tax character of distributions paid during the fiscal years ended November 30, 2024 and November 30, 2023 was as follows:
| Fund | | Ordinary Income | | | Return of Capital | |
| November 30, 2024 | | | | | | | | |
| ALPS Sector Dividend Dogs ETF | | $ | 47,603,187 | | | $ | — | |
| ALPS International Sector Dividend Dogs ETF | | | 13,409,585 | | | | — | |
| ALPS Emerging Sector Dividend Dogs ETF | | | 1,258,329 | | | | — | |
| ALPS REIT Dividend Dogs ETF | | | 463,643 | | | | 312,295 | |
| Fund | | Ordinary Income | | | Return of Capital | |
| November 30, 2023 | | | | | | | | |
| ALPS Sector Dividend Dogs ETF | | $ | 51,058,930 | | | $ | — | |
| ALPS International Sector Dividend Dogs ETF | | | 10,066,812 | | | | — | |
| ALPS Emerging Sector Dividend Dogs ETF | | | 1,969,818 | | | | — | |
| ALPS REIT Dividend Dogs ETF | | | 651,314 | | | | 442,862 | |
The character of distributions made during the year may differ from its ultimate characterization for federal income tax purposes.
Under current law, capital losses maintain their character as short-term or long-term and are carried forward to the next tax year without expiration. As of November 30, 2024, the following amounts are available as carry forwards to the next tax year:
| Fund | | Short-Term | | | Long-Term | |
| ALPS Sector Dividend Dogs ETF | | $ | 6,050,332 | | | $ | 211,995,387 | |
| ALPS International Sector Dividend Dogs ETF | | | — | | | | 45,792,374 | |
| ALPS Emerging Sector Dividend Dogs ETF | | | 931,990 | | | | 8,831,792 | |
| ALPS REIT Dividend Dogs ETF | | | 7,062,815 | | | | 2,852,957 | |
The ALPS International Sector Dividend Dogs ETF and ALPS Emerging Sector Dividend Dogs ETF used capital capital loss carryovers during the year ended November 30, 2024 in the amount of $12,180,923 and $238,888, respectively.
ALPS ETF Trust
| Notes to Financial Statements and Financial Highlights | November 30, 2024 |
As of November 30, 2024, the components of distributable earnings on a tax basis for each Fund were as follows:
| | | Undistributed net investment income | | | Accumulated net realized loss on investments | | | Net unrealized appreciation/ (depreciation) on investments | | | Total | |
| ALPS Sector Dividend Dogs ETF | | $ | 1,945,985 | | | $ | (218,045,719 | ) | | $ | 204,559,081 | | | $ | (11,540,653 | ) |
| ALPS International Sector Dividend Dogs ETF | | | 1,533,287 | | | | (45,792,374 | ) | | | 3,180,958 | | | | (41,078,129 | ) |
| ALPS Emerging Sector Dividend Dogs ETF | | | 592,873 | | | | (9,763,782 | ) | | | (1,799,139 | ) | | | (10,970,048 | ) |
| ALPS REIT Dividend Dogs ETF | | | – | | | | (9,915,772 | ) | | | 56,452 | | | | (9,859,320 | ) |
As of November 30, 2024, the cost of investments for federal income tax purposes and accumulated net unrealized appreciation/(depreciation) on investments were as follows:
| | | Gross Appreciation (excess of value over tax cost) | | | Gross Depreciation (excess of tax cost over value) | | | Net Appreciation/ (Depreciation) of Foreign Currency | | | Net Unrealized Appreciation/ (Depreciation) | | | Cost of Investments for Income Tax Purposes | |
| ALPS Sector Dividend Dogs ETF | | $ | 258,124,911 | | | $ | (53,565,830 | ) | | $ | – | | | $ | 204,559,081 | | | $ | 1,069,356,478 | |
| ALPS International Sector Dividend Dogs ETF | | | 24,362,694 | | | | (21,153,625 | ) | | | (28,111 | ) | | | 3,180,958 | | | | 300,053,115 | |
| ALPS Emerging Sector Dividend Dogs ETF | | | 2,973,380 | | | | (4,771,611 | ) | | | (908 | ) | | | (1,799,139 | ) | | | 27,830,370 | |
| ALPS REIT Dividend Dogs ETF | | | 1,861,405 | | | | (1,804,870 | ) | | | (83 | ) | | | 56,452 | | | | 14,646,354 | |
The differences between book-basis and tax-basis are primarily due to the deferral of losses from wash sales and investments in passive foreign investment companies.
K. Income Taxes
No provision for income taxes is included in the accompanying financial statements, as each Fund intends to distribute to shareholders all taxable investment income and realized gains and otherwise comply with Subchapter M of the Code, applicable to regulated investment companies. Each Fund evaluates tax positions taken (or expected to be taken) in the course of preparing the Fund’s tax returns to determine whether these positions meet a “more-likely-than-not” standard that, based on the technical merits, have a more than fifty percent likelihood of being sustained by a taxing authority upon examination. A tax position that meets the “more-likely-than-not” recognition threshold is measured to determine the amount of benefit to recognize in the financial statements.
As of and during the year ended November 30, 2024, each Fund did not have a liability for any unrecognized tax benefits. Each Fund files U.S. federal, state, and local tax returns as required. Each Fund’s tax returns are subject to examination by the relevant tax authorities until expiration of the applicable statute of limitations, which is generally three years after the filing of the tax return, but may extend to four years in certain jurisdictions. Each Fund’s tax returns for open years have incorporated no uncertain tax positions that require a provision for income taxes.
L. Lending of Portfolio Securities
The Funds have entered into a securities lending agreement with State Street Bank & Trust Co. (“SSB”), the Funds’ lending agent. Each Fund may lend its portfolio securities only to borrowers that are approved by SSB. Each Fund will limit such lending to not more than 33 1/3% of the value of its total assets. The Fund’s securities held at SSB as custodian shall be available to be lent except those securities the Fund or ALPS Advisors, Inc. specifically identifies in writing as not being available for lending. The borrower pledges and maintains with the Fund collateral consisting of cash (U.S. Dollars only), securities issued or guaranteed by the U.S. government or its agencies or instrumentalities, and cash equivalents (including irrevocable bank letters of credit) issued by a person other than the borrower or an affiliate of the borrower. The initial collateral received by the Fund is required to have a value of no less than 102% of the market value of the loaned securities for U.S equity securities and a value of no less than 105% of the market value for non-U.S. equity securities. The collateral is maintained thereafter, at a market value equal to not less than 102% of the current value of the U.S. equity securities on loan and not less than 105% of the current value of the non-U.S. equity securities on loan. The market value of the loaned securities is determined at the close of each business day and any additional required collateral is delivered to the Fund on the next business day. During the term of the loan, each Fund is entitled to all distributions made on or in respect of the loaned securities. Loans of securities are terminable at any time and the borrower, after notice, is required to return borrowed securities within the customary time period for settlement of securities transactions.
ALPS ETF Trust
| Notes to Financial Statements and Financial Highlights | November 30, 2024 |
Any cash collateral received is reinvested in a money market fund managed by SSB as disclosed in the Fund’s Schedule of Investments and is reflected in the Statements of Assets and Liabilities as a payable for collateral upon return of securities loaned. Non-cash collateral, in the form of securities issued or guaranteed by the U.S. government or its agencies or instrumentalities, is not disclosed in the Fund’s Statement of Assets and Liabilities or the contractual maturity table below as it is held by the lending agent on behalf of the Fund, and the Fund does not have the ability to re-hypothecate these securities. Income earned by the Fund from securities lending activity is disclosed in the Statements of Operations.
The following is a summary of a Fund's securities lending agreement and related cash and non-cash collateral received as of November 30, 2024:
| Fund | | Market Value of Securities on Loan | | | Cash Collateral Received | | | Non-Cash Collateral Received | | | Total Collateral Received | |
| ALPS International Sector Dividend Dogs ETF | | $ | 25,074,385 | | | $ | 17,504,375 | | | $ | 8,665,348 | | | $ | 26,169,723 | |
| ALPS Emerging Sector Dividend Dogs ETF | | | 1,255,794 | | | | 10,821 | | | | 1,313,030 | | | | 1,323,851 | |
| ALPS REIT Dividend Dogs ETF | | | 380,134 | | | | 67,900 | | | | 320,800 | | | | 388,700 | |
The risks of securities lending include the risk that the borrower may not provide additional collateral when required or may not return the securities when due. To mitigate these risks, the Funds benefit from a borrower default indemnity provided by SSB. SSB’s indemnity allows for full replacement of securities lent wherein SSB will purchase the unreturned loaned securities on the open market by applying the proceeds of the collateral, or to the extent such proceeds are insufficient or the collateral is unavailable, SSB will purchase the unreturned loan securities at SSB’s expense. However, the Funds could suffer a loss if the value of the investments purchased with cash collateral falls below the value of the cash collateral received.
The following table reflects a breakdown of transactions accounted for as secured borrowings, the gross obligation by the type of collateral pledged or securities loaned, and the remaining contractual maturity of those transactions as of November 30, 2024:
| ALPS International Sector Dividend Dogs ETF | Remaining contractual maturity of the agreements | |
| | | |
| Securities Lending Transactions | | Overnight & Continuous | | | Up to 30 Days | | 30-90 Days | | | Greater than 90 Days | | | Total | |
| Common Stocks | | $ | 17,504,375 | | $ | – | | $ | – | | | $ | – | | | $ | 17,504,375 | |
| Total Borrowings | | | | | | | | | | | | | | | | | 17,504,375 | |
| Gross amount of recognized liabilities for securities lending (collateral received) | | | | $ | 17,504,375 | |
| ALPS Emerging Sector Dividend Dogs ETF | | Remaining contractual maturity of the agreements | |
| | | | |
| Securities Lending Transactions | | Overnight & Continuous | | | Up to 30 Days | | 30-90 Days | | | Greater than 90 Days | | | Total | |
| Common Stocks | | $ | 10,821 | | $ | – | | $ | – | | | $ | – | | | $ | 10,821 | |
| Total Borrowings | | | | | | | | | | | | | | | | | 10,821 | |
| Gross amount of recognized liabilities for securities lending (collateral received) | | | | $ | 10,821 | |
| ALPS REIT Dividend Dogs ETF | | Remaining contractual maturity of the agreements | |
| | | | |
| Securities Lending Transactions | | Overnight & Continuous | | | Up to 30 Days | | 30-90 Days | | | Greater than 90 Days | | | Total | |
| Common Stocks | | $ | 67,900 | | $ | – | | $ | – | | | $ | – | | | $ | 67,900 | |
| Total Borrowings | | | | | | | | | | | | | | | | | 67,900 | |
| Gross amount of recognized liabilities for securities lending (collateral received) | | | | | $ | 67,900 | |
ALPS ETF Trust
| Notes to Financial Statements and Financial Highlights | November 30, 2024 |
3. INVESTMENT ADVISORY FEE AND OTHER AFFILIATED TRANSACTIONS
ALPS Advisors, Inc. serves as the Funds’ investment adviser pursuant to an Investment Advisory Agreement with the Trust on behalf of each Fund (the “Advisory Agreement”). Pursuant to the Advisory Agreement, each Fund pays the Adviser an annual management fee for the services and facilities it provides, payable on a monthly basis as a percentage of the relevant Fund’s average daily net assets as set out below. From time to time, the Adviser may waive all or a portion of its fee.
| Fund | Advisory Fee |
| ALPS Sector Dividend Dogs ETF | 0.36% |
| ALPS International Sector Dividend Dogs ETF | 0.50% |
| ALPS Emerging Sector Dividend Dogs ETF | 0.60% |
| ALPS REIT Dividend Dogs ETF | 0.35% |
Out of the unitary management fee, the Adviser pays substantially all expenses of each Fund, including licensing fees to the Underlying Index provider, the cost of transfer agency, custody, fund administration, legal, audit, trustees and other services, except for interest expenses, distribution fees or expenses, brokerage expenses, taxes and extraordinary expenses not incurred in the ordinary course of each Fund's business. The Adviser’s unitary management fee is designed to pay substantially all of each Fund's expenses and to compensate the Adviser for providing services for each Fund.
ALPS Fund Services, Inc., an affiliate of the Adviser, is the administrator of the Funds.
Each Trustee receives (1) a quarterly retainer of $25,000, (2) a per meeting fee of $15,000, (3) $2,500 for any special meeting held outside of a regularly scheduled board meeting, and (4) reimbursement for all reasonable out-of-pocket expenses relating to attendance at meetings. In addition, the Chairman of the Board receives a quarterly retainer of $5,000, the Chairman of the Audit Committee receives a quarterly retainer of $3,000, and the Chairman of the Nominating & Governance Committee receives a quarterly retainer of $2,000, each in connection with their respective roles.
4. PURCHASES AND SALES OF SECURITIES
For the year ended November 30, 2024, the cost of purchases and proceeds from sales of investment securities, excluding short-term investments and in-kind transactions, were as follows:
| Fund | | Purchases | | | Sales | |
| ALPS Sector Dividend Dogs ETF | | $ | 612,024,515 | | | $ | 614,454,531 | |
| ALPS International Sector Dividend Dogs ETF | | | 153,852,614 | | | | 152,073,687 | |
| ALPS Emerging Sector Dividend Dogs ETF | | | 22,283,632 | | | | 23,635,178 | |
| ALPS REIT Dividend Dogs ETF | | | 6,203,166 | | | | 6,244,125 | |
For the year ended November 30, 2024, the cost of in-kind purchases and proceeds from in-kind sales were as follows:
| Fund | | Purchases | | | Sales | |
| ALPS Sector Dividend Dogs ETF | | $ | 22,497,526 | | | $ | 105,041,475 | |
| ALPS International Sector Dividend Dogs ETF | | | 49,013,902 | | | | 6,330,528 | |
| ALPS Emerging Sector Dividend Dogs ETF | | | – | | | | 3,284,333 | |
| ALPS REIT Dividend Dogs ETF | | | 2,116,094 | | | | 1,019,033 | |
For the year ended November 30, 2024, the in-kind net realized gains/(losses) were as follows:
| Fund | | Net Realized Gain/ (Loss) | |
| ALPS Sector Dividend Dogs ETF | | $ | 13,743,933 | |
| ALPS International Sector Dividend Dogs ETF | | | 854,286 | |
| ALPS Emerging Sector Dividend Dogs ETF | | | 380,375 | |
| ALPS REIT Dividend Dogs ETF | | | 187,150 | |
Gains on in-kind transactions are not considered taxable for federal income tax purposes and losses on in-kind transactions are also not deductible for tax purposes.
ALPS ETF Trust
| Notes to Financial Statements and Financial Highlights | November 30, 2024 |
5. CAPITAL SHARE TRANSACTIONS
Shares are created and redeemed by each Fund only in Creation Unit size aggregations of 25,000 shares. Only broker-dealers or large institutional investors with creation and redemption agreements called Authorized Participants (“AP”) are permitted to purchase or redeem Creation Units from the Funds. Such transactions are generally permitted on an in-kind basis, with a balancing cash component to equate the transaction to the NAV per unit of each Fund on the transaction date. Cash may be substituted equivalent to the value of certain securities generally when they are not available in sufficient quantity for delivery, not eligible for trading by the AP or as a result of other market circumstances.
6. RELATED PARTY TRANSACTIONS
The ALPS Sector Dividend Dogs ETF and ALPS International Sector Dividend Dogs ETF engaged in cross trades between other funds in the Trust during the year ended November 30, 2024 pursuant to Rule 17a-7 under the 1940 Act. Cross trading is the buying or selling of portfolio securities between funds to which the Adviser serves as the investment adviser. The Board previously adopted procedures that apply to transactions between the Funds of the Trust pursuant to Rule 17a-7. These transactions related to cross trades during the period complied with the requirements set forth by Rule 17a-7 and the Trust’s procedures.
Transactions related to cross trades during the year ended November 30, 2024, were as follows:
| | | Purchase cost paid | | | Sale proceeds received | | | Realized gain/(loss) on
sales | |
| ALPS Sector Dividend Dogs ETF | | $ | 1,739,148 | | | $ | 8,789,442 | | | $ | 506,549 | |
| ALPS International Sector Dividend Dogs ETF | | | 711,146 | | | | – | | | | – | |
7. MARKET RISK
The Funds are subject to investment and operational risks associated with financial, economic and other global market developments and disruptions, including those arising from war, terrorism, market manipulation, government interventions, defaults and shutdowns, political changes or diplomatic developments, public health emergencies (such as the spread of infectious diseases, pandemics and epidemics) and natural/environmental disasters, which can negatively impact the securities markets and cause each Fund to lose value. Securities in each Fund’s portfolio may underperform in comparison to securities in general financial markets, a particular financial market or other asset classes due to a number of factors, including inflation (or expectations for inflation), deflation (or expectations for deflation), interest rates, global demand for particular products or resources, market instability, debt crises and downgrades, embargoes, tariffs, sanctions and other trade barriers, regulatory events, other governmental trade or market control programs and related geopolitical events. In addition, the value of the Fund’s investments may be negatively affected by the occurrence of global events such as war, terrorism, environmental disasters, natural disasters or events, country instability, and infectious disease epidemics or pandemics.
8. SUBSEQUENT EVENTS
Subsequent events, if any, after the date of the Statements of Assets and Liabilities have been evaluated through the date the financial statements were issued. Management has determined that there were no subsequent events to report through the issuance of these financial statements.
ALPS ETF Trust
Report of Independent Registered Public Accounting Firm
To the Shareholders of ALPS Sector Dividend Dogs ETF, ALPS International Sector Dividend Dogs ETF,
ALPS Emerging Sector Dividend Dogs ETF and ALPS REIT Dividend Dogs ETF
and Board of Trustees of ALPS ETF Trust
Opinion on the Financial Statements
We have audited the accompanying statements of assets and liabilities, including the schedules of investments, of ALPS Sector Dividend Dogs ETF, ALPS International Sector Dividend Dogs ETF, ALPS Emerging Sector Dividend Dogs ETF and ALPS REIT Dividend Dogs ETF (the “Funds”), each a series of ALPS ETF Trust, as of November 30, 2024, the related statements of operations for the year then ended, the statements of changes in net assets and financial highlights for each of the two years in the period then ended, and the related notes (collectively referred to as the “financial statements”). In our opinion, the financial statements present fairly, in all material respects, the financial position of each of the Funds as of November 30, 2024, the results of their operations for the year then ended, and the changes in net assets and financial highlights for each of the two years in the period then ended, in conformity with accounting principles generally accepted in the United States of America.
The Funds’ financial highlights for the years ended November 30, 2022, and prior, were audited by other auditors whose report dated January 27, 2023, expressed an unqualified opinion on those financial highlights.
Basis for Opinion
These financial statements are the responsibility of the Funds’ management. Our responsibility is to express an opinion on the Funds’ financial statements based on our audits. We are a public accounting firm registered with the Public Company Accounting Oversight Board (United States) (“PCAOB”) and are required to be independent with respect to the Funds in accordance with the U.S. federal securities laws and the applicable rules and regulations of the Securities and Exchange Commission and the PCAOB.
We conducted our audits in accordance with the standards of the PCAOB. Those standards require that we plan and perform the audit to obtain reasonable assurance about whether the financial statements are free of material misstatement whether due to error or fraud.
Our audits included performing procedures to assess the risks of material misstatement of the financial statements, whether due to error or fraud, and performing procedures that respond to those risks. Such procedures included examining, on a test basis, evidence regarding the amounts and disclosures in the financial statements. Our procedures included confirmation of securities owned as of November 30, 2024, by correspondence with the custodian. Our audits also included evaluating the accounting principles used and significant estimates made by management, as well as evaluating the overall presentation of the financial statements. We believe that our audits provide a reasonable basis for our opinion.
We have served as the auditor of one or more investment companies advised by ALPS Advisors, Inc. since 2013.

COHEN & COMPANY, LTD.
Philadelphia, Pennsylvania
January 29, 2025
ALPS ETF Trust
| Additional Information | November 30, 2024 (Unaudited) |
TAX INFORMATION
The Funds designate the following as a percentage of taxable ordinary income distributions, or up to the maximum amount allowable, for the calendar year ended December 31, 2023:
| | Qualified Dividend Income | Dividend Received Deduction | 199A |
| ALPS Sector Dividend Dogs ETF | 100.00% | 90.11% | 0.00% |
| ALPS International Sector Dividend Dogs ETF | 85.49% | 0.00% | 0.00% |
| ALPS Emerging Sector Dividend Dogs ETF | 48.41% | 0.00% | 0.00% |
| ALPS REIT Dividend Dogs ETF | 0.93% | 0.00% | 91.80% |
In early 2024, if applicable, shareholders of record received this information for the distributions paid to them by the Funds during the calendar year 2023 via Form 1099. The Funds will notify shareholders in early 2025 of amounts paid to them by the Funds, if any, during the calendar year 2024.
Pursuant to Section 853(c) of the Internal Revenue Code, the following Funds designated the following for the calendar year ended December 31, 2024:
| | | Foreign Taxes Paid | | | Foreign Source Income | |
| ALPS International Sector Dividend Dogs ETF | | $ | 1,407,364 | | | $ | 14,926,294 | |
| ALPS Emerging Sector Dividend Dogs ETF | | $ | 170,719 | | | $ | 1,661,154 | |
LICENSING AGREEMENTS
ALPS Sector Dividend Dogs ETF, ALPS International Sector Dividend Dogs ETF, ALPS Emerging Sector Dividend Dogs ETF, and ALPS REIT Dividend Dogs ETF
The Funds are not sponsored, endorsed, sold or promoted by S-Network Global Indexes, Inc.SM (“Licensor”). Licensor makes no representation or warranty, express or implied, to the owners of the Funds or any member of the public regarding the advisability of investing in securities generally or in the Funds particularly or the ability of the (i) in the case of SDOG, S-Network Sector Dividend DogsSM, (ii) in the case of IDOG, S-Network International Sector Dividend DogsSM, (iii) in the case of EDOG, S-Network Emerging Sector Dividend Dogs IndexSM, and (iv) in the case of RDOG, S-Network REIT Dividend Dogs IndexSM (each an “Underlying Index”) to track the performance of a market or sector. Licensor’s only relationship to the Licensee is the licensing of certain service marks and trade names of Licensor and of the Underlying Index that is determined, composed and calculated by Licensor without regard to the Licensee or the Fund. Licensor has no obligation to take the needs of the Licensee or the owners of the Fund into consideration in determining, composing or calculating the Underlying Index. Licensor is not responsible for and has not participated in the determination of the timing of, prices at, or quantities of the Fund to be issued or in the determination or calculation of the equation by which the Fund is to be converted into cash. Licensor has no obligation or liability in connection with the administration, marketing or trading of the Fund.
LICENSOR DOES NOT GUARANTEE THE ACCURACY AND/OR THE COMPLETENESS OF THE UNDERLYING INDEX OR ANY DATA INCLUDED THEREIN AND LICENSOR SHALL HAVE NO LIABILITY FOR ANY ERRORS, OMISSIONS, OR INTERRUPTIONS THEREIN. LICENSOR MAKES NO WARRANTY, EXPRESS OR IMPLIED, AS TO RESULTS TO BE OBTAINED BY LICENSEE, OWNERS OF THE FUND, OR ANY OTHER PERSON OR ENTITY FROM THE USE OF THE UNDERLYING INDEX OR ANY DATA INCLUDED THEREIN. LICENSOR MAKES NO EXPRESS OR IMPLIED WARRANTIES, AND EXPRESSLY DISCLAIMS ALL WARRANTIES OF MERCHANTABILITY OR FITNESS FOR A PARTICULAR PURPOSE OR USE WITH RESPECT TO THE UNDERLYING INDEX OR ANY DATA INCLUDED THEREIN. WITHOUT LIMITING ANY OF THE FOREGOING, IN NO EVENT SHALL LICENSOR HAVE ANY LIABILITY FOR ANY SPECIAL, PUNITIVE, INDIRECT, OR CONSEQUENTIAL DAMAGES (INCLUDING LOST PROFITS), EVEN IF NOTIFIED OF THE POSSIBILITY OF SUCH DAMAGES.
The Funds are not sponsored, endorsed, sold or promoted by Standard & Poor’s, a division of The McGraw-Hill Companies, Inc. (“S&P”) or its third party licensors. Neither S&P nor its third party licensors make any representation or warranty, express or implied, to the owners of each Fund or any member of the public regarding the advisability of investing in securities generally or in each Fund particularly or the ability of each Underlying Index to track general stock market performance. S&P’s and its third party licensor’s only relationship to the Index Provider is the licensing of certain trademarks, service marks and trade names of S&P and/or its third party licensors and for the providing of calculation and maintenance services related to the Underlying Index. Neither S&P nor its third party licensors is responsible for and has not participated in the determination of the prices and amount of each Fund or the timing of the issuance or sale of each Fund or in the determination or calculation of the equation by which each Fund is to be converted into cash. S&P has no obligation or liability in connection with the administration, marketing or trading of each Fund.
ALPS ETF Trust
| Additional Information | November 30, 2024 (Unaudited) |
NEITHER S&P, ITS AFFILIATES NOR THEIR THIRD PARTY LICENSORS GUARANTEE THE ADEQUACY, ACCURACY, TIMELINESS OR COMPLETENESS OF EACH UNDERLYING INDEX OR ANY DATA INCLUDED THEREIN OR ANY COMMUNICATIONS, INCLUDING BUT NOT LIMITED TO, ORAL OR WRITTEN COMMUNICATIONS (INCLUDING ELECTRONIC COMMUNICATIONS) WITH RESPECT THERETO. S&P, ITS AFFILIATES AND THEIR THIRD PARTY LICENSORS SHALL NOT BE SUBJECT TO ANY DAMAGES OR LIABILITY FOR ANY ERRORS, OMISSIONS OR DELAYS THEREIN. S&P MAKES NO EXPRESS OR IMPLIED WARRANTIES, AND EXPRESSLY DISCLAIMS ALL WARRANTIES OF MERCHANTABILITY OR FITNESS FOR A PARTICULAR PURPOSE OR USE WITH RESPECT TO ITS TRADEMARKS, EACH UNDERLYING INDEX OR ANY DATA INCLUDED THEREIN. WITHOUT LIMITING ANY OF THE FOREGOING, IN NO EVENT WHATSOEVER SHALL S&P, ITS AFFILIATES OR THEIR THIRD PARTY LICENSORS BE LIABLE FOR ANY INDIRECT, SPECIAL, INCIDENTAL, PUNITIVE OR CONSEQUENTIAL DAMAGES, INCLUDING BUT NOT LIMITED TO, LOSS OF PROFITS, TRADING LOSSES, LOST TIME OR GOODWILL, EVEN IF THEY HAVE BEEN ADVISED OF THE POSSIBILITY OF SUCH DAMAGES, WHETHER IN CONTRACT, TORT, STRICT LIABILITY OR OTHERWISE.
Standard & Poor’s® and S&P® are registered trademarks of The McGraw-Hill Companies, Inc.; “Calculated by S&P Custom Indices” and its related stylized mark are service marks of The McGraw-Hill Companies, Inc. These marks have been licensed for use by the Index Provider.
The Adviser does not guarantee the accuracy and/or the completeness of each Underlying Index or any data included therein, and the Adviser shall have no liability for any errors, omissions or interruptions therein. The Adviser makes no warranty, express or implied, as to results to be obtained by each Fund, owners of the Shares of each Fund or any other person or entity from the use of each Underlying Index or any data included therein. The Adviser makes no express or implied warranties, and expressly disclaims all warranties of merchantability or fitness for a particular purpose or use with respect to each Underlying Index or any data included therein. Without limiting any of the foregoing, in no event shall the Adviser have any liability for any special, punitive, direct, indirect or consequential damages (including lost profits) arising out of matters relating to the use of each Underlying Index, even if notified of the possibility of such damages.
| ALPS ETF Trust | |
Changes in and Disagreements with Accountants
for Open-End Management Investment Companies | November 30, 2024 (Unaudited) |
On March 14, 2023, BBD LLP (“BBD”) ceased to serve as the independent registered public accounting firm of the Funds. The Board approved the replacement of BBD as a result of Cohen & Company, Ltd.’s (“Cohen”) acquisition of BBD’s investment management group.
The report of BBD on the financial statements of the Funds as of and for the fiscal year or period ended November 30, 2022 did not contain an adverse opinion or a disclaimer of opinion, and was not qualified or modified as to uncertainties, audit scope or accounting principles. During the fiscal year or period ended November 30, 2022, and during the subsequent interim period through March 14, 2023: (i) there were no disagreements between the registrant and BBD on any matter of accounting principles or practices, financial statement disclosure, or auditing scope or procedure, which disagreements, if not resolved to the satisfaction of BBD, would have caused it to make reference to the subject matter of the disagreements in its report on the financial statements of the Funds for such years or interim period; and (ii) there were no “reportable events,” as defined in Item 304(a)(1)(v) of Regulation S-K under the Securities Exchange Act of 1934, as amended.
On March 7, 2023, upon the recommendation of the Funds’ Audit Committee, the Board approved the appointment of Cohen, effective upon the resignation of BBD, as the Funds’ independent registered public accounting firm for the fiscal year ending November 30, 2023.
During the fiscal year or period ended November 30, 2022, and during the subsequent interim period through March 14, 2023, neither the registrant, nor anyone acting on its behalf, consulted with Cohen on behalf of the Funds regarding the application of accounting principles to a specified transaction (either completed or proposed), the type of audit opinion that might be rendered on the Funds’ financial statements, or any matter that was either: (i) the subject of a "disagreement," as defined in Item 304(a)(1)(iv) of Regulation S-K and the instructions thereto; or (ii) "reportable events," as defined in Item 304(a)(1)(v) of Regulation S-K.
| ALPS ETF Trust | |
Proxy Disclosures for Open-End
Management Investment Companies | November 30, 2024 (Unaudited) |
A Special Meeting of Shareholders of the Funds, each a series of the Trust, was held on July 19, 2024. At the meeting, the following matters were voted on by the Shareholders. The results of the Special Meeting of Shareholders are noted below:
Proposal 1: To elect seven Trustees.
| Shares Voted in Favor | Shares Voted Against/Withheld
or Abstentions | Proposal Approved |
| Mary K. Anstine | 223,143,090 | 2,894,793 | Yes |
| Edmund J. Burke | 223,362,578 | 2,672,643 | Yes |
| Jeremy W. Deems | 221,670,341 | 4,361,535 | Yes |
| Rick A. Pederson | 213,137,140 | 12,259,226 | Yes |
| Joseph F. Keenan | 223,547,500 | 2,483,867 | Yes |
| Susan K. Wold | 223,460,006 | 2,571,857 | Yes |
| Laton Spahr | 223,439,610 | 2,593,995 | Yes |
| ALPS ETF Trust | |
Remuneration Paid to Directors, Officers, and Others
for Open-End Management Investment Companies | November 30, 2024 (Unaudited) |
The following chart provides certain information about the Trustee fees paid by the Trust for the year ended November 30, 2024:
| | | Aggregate Regular Compensation
From the Trust | | | Aggregate Special
Compensation From the Trust | | | Total Compensation
From the Trust | |
| Mary K. Anstine, Trustee | | $ | 162,500 | | | $ | – | | | $ | 162,500 | |
| Edmund J. Burke, Trustee | | | 166,500 | | | | – | | | | 166,500 | |
| Jeremy W. Deems, Trustee | | | 174,500 | | | | – | | | | 174,500 | |
| Rick A. Pederson, Trustee | | | 186,500 | | | | – | | | | 186,500 | |
| Joseph F. Keenan, Trustee | | | 40,000 | | | | – | | | | 40,000 | |
| Susan K. Wold, Trustee | | | 40,000 | | | | – | | | | 40,000 | |
| Laton Spahr, President and Trustee* | | | – | | | | – | | | | – | |
| Total | | $ | 770,000 | | | $ | – | | | $ | 770,000 | |
| * | Mr. Spahr, the President of the Trust, is deemed an “interested person” by virtue of his position as an officer of the Trust and of ALPS Advisors, Inc. |
Officers who are employed by the Adviser receive no compensation or expense reimbursement from the Trust.
| ALPS ETF Trust | |
Statement Regarding Basis for Approval
of Investment Advisory Contract | November 30, 2024 (Unaudited) |
At its meetings held on June 3, 2024 and June 18, 2024, the Board of Trustees of the Trust (the “Board” or the “Trustees”), where each Trustee was not an “interested person” of the Trust within the meaning of the Investment Company Act of 1940, as amended (the “Independent Trustees”), evaluated a proposal to approve the continuance of the Investment Advisory Agreement between the Trust and ALPS Advisors, Inc. (the “Adviser” or “AAI”) with respect to the ALPS REIT Dividend Dogs ETF (“RDOG”), ALPS Sector Dividend Dogs ETF (“SDOG”), ALPS International Sector Dividend Dogs ETF (“IDOG”), and ALPS Emerging Sector Dividend Dogs ETF (“EDOG”) (each a “Fund” and collectively “the Funds”). In evaluating the renewal of the Investment Advisory Agreement with respect to each of the Funds, the Board, including the Independent Trustees considered various factors, including (i) the nature, extent and quality of the services provided by AAI with respect to the applicable Fund under the Investment Advisory Agreement; (ii) the advisory fees and other expenses paid by the Fund compared to those of similar funds managed by other investment advisers; (iii) the costs of the services provided to the Fund by AAI and the profits realized by AAI and its affiliates from its relationship to the Fund; (iv) the extent to which economies of scale have been or would be realized if and as the assets of the Fund grow and whether fees reflect the economies of scale for the benefit of shareholders; and (v) any additional benefits and other considerations.
With respect to the nature, extent and quality of the services provided by AAI under the Investment Advisory Agreement, the Board considered and reviewed information concerning the services provided under the Investment Advisory Agreement, the investment parameters of the index of each Fund, financial information regarding AAI and its parent company, information describing AAI’s current organization and the background and experience of the persons responsible for the day-to-day management of the Funds.
The Board reviewed information on the performance of each Fund and its applicable benchmark for the 1-, 3-, and 5-year periods, as applicable. The Board also evaluated the correlation and tracking error between each underlying index and its corresponding Fund’s performance. Based on this review, the Board, including the Independent Trustees found that the nature and extent of services provided to each Fund under the Investment Advisory Agreement was appropriate and that the quality of such services was satisfactory.
The Board noted that the advisory fees for each Fund were unitary fees pursuant to which AAI assumes all expenses of the Funds (including the cost of transfer agency, custody, fund administration, legal, audit and other services) other than the payments under the Advisory Agreement, brokerage expenses, taxes, interest, litigation expenses and other extraordinary expenses.
Based on the information available to them, including the Fund-specific summaries set forth below, the Board, including the Independent Trustees concluded that the advisory fee rate for each of the Funds was reasonable under the circumstances and in light of the quality of the services provided.
The Board, including the Independent Trustees considered other benefits available to AAI because of its relationship with the Funds and concluded that the advisory fees were reasonable taking into account any such benefits.
The Board, including the Independent Trustees, also considered with respect to each Fund the information provided by AAI about the costs and profitability of AAI with respect to each of the Funds, including the asset levels and other factors that influence the profitability and financial viability of the Funds. The Board, including the Independent Trustees reviewed and noted the relatively small sizes of the Funds (other than SDOG) and the analysis AAI had conducted to support AAI’s assertion that it was not realizing any economies of scale with respect to such Funds. The Independent Trustees determined that AAI should continue to keep the Board informed on an ongoing basis of any significant developments (e.g., material increases in asset levels) so as to facilitate the Independent Trustees’ evaluation of whether further economies of scale have been achieved.
The Board, including the Independent Trustees, also considered other potential benefits available to AAI because of its relationship with the Funds, known as fall-out benefits.
With respect to each Fund, the Board, including the Independent Trustees, noted the following:
(i) RDOG
The gross management fee rate for RDOG is lower than the median of its FUSE expense group. RDOG’s net expense ratio is lower than the median of its FUSE expense group.
The Board, including the Independent Trustees, reviewed and noted the relatively small size of RDOG and the analysis AAI had conducted to support AAI’s assertion that it was not realizing any economies of scale with respect to RDOG.
| ALPS ETF Trust | |
Statement Regarding Basis for Approval
of Investment Advisory Contract | November 30, 2024 (Unaudited) |
(ii) SDOG
The gross management fee rate for SDOG is equal to the median of its FUSE expense group. SDOG’s net expense ratio is lower than the median of its FUSE expense group.
With respect to AAI profitability from SDOG, the Independent Trustees noted SDOG reduced its management fee from 0.40% to 0.36% in April 2023.
(iii) IDOG
The gross management fee rate for IDOG is higher than the median of its FUSE expense group. IDOG’s net expense ratio is lower than the median of its FUSE expense group.
The Board, including the Independent Trustees, reviewed and noted the relatively small size of IDOG and the analysis AAI had conducted to support AAI’s assertion that it was not realizing any economies of scale with respect to IDOG.
(iv) EDOG
The gross management fee rate for EDOG is equal to the median of its FUSE expense group. EDOG’s net expense ratio is equal to the median of its FUSE expense group.
The Board, including the Independent Trustees, reviewed and noted the relatively small size of EDOG and the analysis AAI had conducted to support AAI’s assertion that it was not realizing any economies of scale with respect to EDOG.
In voting to renew the Investment Advisory Agreement with AAI, the Board, including the Independent Trustees, concluded that the terms of the Investment Advisory Agreement are reasonable and fair in light of the services to be performed, the fees paid by certain other funds, expenses to be incurred and such other matters as the members of the Board, including the Independent Trustees, considered relevant in the exercise of their reasonable business judgment. The Independent Trustees did not identify any single factor or group of factors as all important or controlling and considered all factors together.

Table of Contents
| Financial Statements and Financial Highlights for Open-End Management Investment Companies | |
| Schedule of Investments | 1 |
| Statements of Assets and Liabilities | 11 |
| Statements of Operations | 12 |
| Statements of Changes in Net Assets | 13 |
| Financial Highlights | 17 |
| Notes to Financial Statements and Financial Highlights | 21 |
| Report of Independent Registered Public Accounting Firm | 30 |
| Additional Information | 31 |
| Changes in and Disagreements with Accountants for Open-End Management Investment Companies | 33 |
| Proxy Disclosures for Open-End Management Investment Companies | 34 |
| Remuneration Paid to Directors, Officers, and Others of Open-End Management Investment Companies | 35 |
| Statement Regarding Basis for Approval of Investment Advisory Contract | 36 |
alpsfunds.com
ALPS | O’Shares U.S. Quality Dividend ETF
| Schedule of Investments | November 30, 2024 |
| Security Description | | Shares | | | Value | |
| COMMON STOCKS (99.89%) | | | | | | | | |
| Aerospace & Defense (1.46%) | | | | | | | | |
| General Dynamics Corp. | | | 8,659 | | | $ | 2,459,243 | |
| Lockheed Martin Corp. | | | 16,024 | | | | 8,483,266 | |
| Northrop Grumman Corp. | | | 2,154 | | | | 1,054,706 | |
| Total Aerospace & Defense | | | | | | | 11,997,215 | |
| | | | | | | | | |
| Air Freight & Logistics (0.82%) | | | | | | | | |
| Expeditors International of Washington, Inc. | | | 10,513 | | | | 1,278,801 | |
| United Parcel Service, Inc., Class B | | | 40,049 | | | | 5,435,451 | |
| Total Air Freight & Logistics | | | | | | | 6,714,252 | |
| | | | | | | | | |
| Banks (0.47%) | | | | | | | | |
| JPMorgan Chase & Co. | | | 15,426 | | | | 3,852,181 | |
| | | | | | | | | |
| Beverages (1.57%) | | | | | | | | |
| Coca-Cola Co. | | | 98,908 | | | | 6,338,025 | |
| PepsiCo, Inc. | | | 39,969 | | | | 6,532,933 | |
| Total Beverages | | | | | | | 12,870,958 | |
| | | | | | | | | |
| Biotechnology (1.41%) | | | | | | | | |
| AbbVie, Inc. | | | 42,062 | | | | 7,694,401 | |
| Amgen, Inc. | | | 8,319 | | | | 2,353,196 | |
| Gilead Sciences, Inc. | | | 17,029 | | | | 1,576,545 | |
| Total Biotechnology | | | | | | | 11,624,142 | |
| | | | | | | | | |
| Broadline Retail (0.33%) | | | | | | | | |
| eBay, Inc. | | | 42,666 | | | | 2,700,331 | |
| | | | | | | | | |
| Building Products (0.25%) | | | | | | | | |
| Trane Technologies PLC | | | 4,988 | | | | 2,076,105 | |
| | | | | | | | | |
| Capital Markets (3.19%) | | | | | | | | |
| Blackrock, Inc. | | | 4,227 | | | | 4,323,376 | |
| Cboe Global Markets, Inc. | | | 12,503 | | | | 2,698,773 | |
| Moody's Corp. | | | 10,682 | | | | 5,340,786 | |
| MSCI, Inc. | | | 7,177 | | | | 4,375,315 | |
| S&P Global, Inc. | | | 6,871 | | | | 3,590,166 | |
| T Rowe Price Group, Inc. | | | 47,630 | | | | 5,898,498 | |
| Total Capital Markets | | | | | | | 26,226,914 | |
| | | | | | | | | |
| Commercial Services & Supplies (1.53%) | | | | | | | | |
| Cintas Corp. | | | 41,412 | | | | 9,350,415 | |
| Waste Management, Inc. | | | 14,136 | | | | 3,226,118 | |
| Total Commercial Services & Supplies | | | | | | | 12,576,533 | |
| | | | | | | | | |
| Communications Equipment (3.45%) | | | | | | | | |
| Cisco Systems, Inc. | | | 427,644 | | | | 25,320,801 | |
| Motorola Solutions, Inc. | | | 6,094 | | | | 3,045,172 | |
| Total Communications Equipment | | | | | | | 28,365,973 | |
| | | | | | | | | |
| Consumer Staples Distribution & Retail (1.53%) | | | | | | | | |
| Costco Wholesale Corp. | | | 7,241 | | | | 7,037,384 | |
| Security Description | | Shares | | | Value | |
| Consumer Staples Distribution & Retail (continued) | | | | | | | | |
| Kroger Co. | | | 11,177 | | | $ | 682,691 | |
| Target Corp. | | | 5,624 | | | | 744,111 | |
| Walmart, Inc. | | | 44,642 | | | | 4,129,385 | |
| Total Consumer Staples Distribution & Retail | | | | | | | 12,593,571 | |
| | | | | | | | | |
| Diversified Telecommunication Services (1.53%) | | | | | | | | |
| AT&T, Inc. | | | 271,087 | | | | 6,278,375 | |
| Verizon Communications, Inc. | | | 141,376 | | | | 6,268,612 | |
| Total Diversified Telecommunication Services | | | | | | | 12,546,987 | |
| | | | | | | | | |
| Electrical Equipment (0.47%) | | | | | | | | |
| AMETEK, Inc. | | | 6,070 | | | | 1,179,887 | |
| Eaton Corp. PLC | | | 7,202 | | | | 2,703,774 | |
| Total Electrical Equipment | | | | | | | 3,883,661 | |
| | | | | | | | | |
| Electronic Equipment, Instruments & Components (0.87%) | | | | | | | | |
| Amphenol Corp., Class A | | | 47,701 | | | | 3,465,478 | |
| TE Connectivity PLC | | | 24,511 | | | | 3,704,102 | |
| Total Electronic Equipment, Instruments & Components | | | | | | | 7,169,580 | |
| | | | | | | | | |
| Entertainment (0.55%) | | | | | | | | |
| Electronic Arts, Inc. | | | 27,551 | | | | 4,509,272 | |
| | | | | | | | | |
| Financial Services (9.18%) | | | | | | | | |
| Mastercard, Inc., Class A | | | 60,570 | | | | 32,280,176 | |
| Visa, Inc., Class A | | | 137,348 | | | | 43,275,608 | |
| Total Financial Services | | | | | | | 75,555,784 | |
| | | | | | | | | |
| Food Products (0.55%) | | | | | | | | |
| General Mills, Inc. | | | 13,305 | | | | 881,589 | |
| Hershey Co. | | | 10,311 | | | | 1,816,076 | |
| Mondelez International, Inc., Class A | | | 27,909 | | | | 1,812,690 | |
| Total Food Products | | | | | | | 4,510,355 | |
| | | | | | | | | |
| Ground Transportation (1.05%) | | | | | | | | |
| CSX Corp. | | | 66,319 | | | | 2,423,959 | |
| Union Pacific Corp. | | | 25,373 | | | | 6,207,759 | |
| Total Ground Transportation | | | | | | | 8,631,718 | |
| | | | | | | | | |
| Health Care Equipment & Supplies (2.07%) | | | | | | | | |
| Abbott Laboratories | | | 102,482 | | | | 12,171,787 | |
| Medtronic PLC | | | 26,552 | | | | 2,297,810 | |
| Stryker Corp. | | | 6,454 | | | | 2,530,936 | |
| Total Health Care Equipment & Supplies | | | | | | | 17,000,533 | |
ALPS | O’Shares U.S. Quality Dividend ETF
| Schedule of Investments | November 30, 2024 |
| Security Description | | Shares | | | Value | |
| Health Care Providers & Services (2.05%) | | | | | | | | |
| Elevance Health, Inc. | | | 3,725 | | | $ | 1,515,926 | |
| UnitedHealth Group, Inc. | | | 25,121 | | | | 15,328,834 | |
| Total Health Care Providers & Services | | | | | | | 16,844,760 | |
| | | | | | | | | |
| Hotels, Restaurants & Leisure (4.58%) | | | | | | | | |
| McDonald's Corp. | | | 91,762 | | | | 27,162,469 | |
| Starbucks Corp. | | | 56,110 | | | | 5,749,031 | |
| Yum! Brands, Inc. | | | 34,180 | | | | 4,748,969 | |
| Total Hotels, Restaurants & Leisure | | | | | | | 37,660,469 | |
| | | | | | | | | |
| Household Durables (0.51%) | | | | | | | | |
| Garmin, Ltd. | | | 19,869 | | | | 4,224,149 | |
| | | | | | | | | |
| Household Products (3.30%) | | | | | | | | |
| Church & Dwight Co., Inc. | | | 4,391 | | | | 483,581 | |
| Colgate-Palmolive Co. | | | 28,763 | | | | 2,779,369 | |
| Kimberly-Clark Corp. | | | 12,228 | | | | 1,703,972 | |
| Procter & Gamble Co. | | | 123,678 | | | | 22,170,518 | |
| Total Household Products | | | | | | | 27,137,440 | |
| | | | | | | | | |
| Industrial Conglomerates (0.71%) | | | | | | | | |
| Honeywell International, Inc. | | | 25,120 | | | | 5,851,202 | |
| | | | | | | | | |
| Insurance (3.32%) | | | | | | | | |
| Aon PLC, Class A | | | 8,252 | | | | 3,230,988 | |
| Chubb, Ltd. | | | 19,393 | | | | 5,599,341 | |
| Marsh & McLennan Cos., Inc. | | | 79,205 | | | | 18,472,982 | |
| Total Insurance | | | | | | | 27,303,311 | |
| | | | | | | | | |
| Interactive Media & Services (3.78%) | | | | | | | | |
| Alphabet, Inc., Class A | | | 183,710 | | | | 31,037,804 | |
| | | | | | | | | |
| IT Services (3.77%) | | | | | | | | |
| Accenture PLC, Class A | | | 62,710 | | | | 22,724,222 | |
| Cognizant Technology Solutions Corp., Class A | | | 41,136 | | | | 3,311,037 | |
| International Business Machines Corp. | | | 21,741 | | | | 4,944,121 | |
| Total IT Services | | | | | | | 30,979,380 | |
| | | | | | | | | |
| Life Sciences Tools & Services (0.30%) | | | | | | | | |
| Agilent Technologies, Inc. | | | 10,097 | | | | 1,393,083 | |
| Thermo Fisher Scientific, Inc. | | | 1,979 | | | | 1,048,138 | |
| Total Life Sciences Tools & Services | | | | | | | 2,441,221 | |
| | | | | | | | | |
| Machinery (3.88%) | | | | | | | | |
| Caterpillar, Inc. | | | 12,609 | | | | 5,120,641 | |
| Cummins, Inc. | | | 3,444 | | | | 1,291,638 | |
| Deere & Co. | | | 4,221 | | | | 1,966,564 | |
| Graco, Inc. | | | 14,092 | | | | 1,283,499 | |
| IDEX Corp. | | | 5,800 | | | | 1,337,654 | |
| Illinois Tool Works, Inc. | | | 39,481 | | | | 10,956,767 | |
| Otis Worldwide Corp. | | | 40,187 | | | | 4,138,457 | |
| PACCAR, Inc. | | | 29,450 | | | | 3,445,650 | |
| Security Description | | Shares | | | Value | |
| Machinery (continued) | | | | | | | | |
| Snap-on, Inc. | | | 6,090 | | | $ | 2,251,412 | |
| Total Machinery | | | | | | | 31,792,282 | |
| | | | | | | | | |
| Media (3.67%) | | | | | | | | |
| Comcast Corp., Class A | | | 699,340 | | | | 30,204,495 | |
| | | | | | | | | |
| Personal Care Products (0.08%) | | | | | | | | |
| Kenvue, Inc. | | | 27,981 | | | | 673,782 | |
| | | | | | | | | |
| Pharmaceuticals (9.62%) | | | | | | | | |
| Eli Lilly & Co. | | | 9,748 | | | | 7,753,072 | |
| Johnson & Johnson | | | 220,971 | | | | 34,252,714 | |
| Merck & Co., Inc. | | | 327,576 | | | | 33,294,825 | |
| Zoetis, Inc. | | | 21,663 | | | | 3,796,441 | |
| Total Pharmaceuticals | | | | | | | 79,097,052 | |
| | | | | | | | | |
| Professional Services (1.44%) | | | | | | | | |
| Automatic Data Processing, Inc. | | | 20,420 | | | | 6,267,511 | |
| Paychex, Inc. | | | 29,856 | | | | 4,367,037 | |
| Verisk Analytics, Inc. | | | 4,211 | | | | 1,238,918 | |
| Total Professional Services | | | | | | | 11,873,466 | |
| | | | | | | | | |
| Semiconductors & Semiconductor Equipment (3.43%) | | | | | | | | |
| Analog Devices, Inc. | | | 5,511 | | | | 1,201,674 | |
| Broadcom, Inc. | | | 19,938 | | | | 3,231,551 | |
| QUALCOMM, Inc. | | | 30,922 | | | | 4,902,065 | |
| Texas Instruments, Inc. | | | 93,866 | | | | 18,869,881 | |
| Total Semiconductors & Semiconductor Equipment | | | | | | | 28,205,171 | |
| | | | | | | | | |
| Software (5.54%) | | | | | | | | |
| Intuit, Inc. | | | 1,889 | | | | 1,212,228 | |
| Microsoft Corp. | | | 92,005 | | | | 38,960,437 | |
| Oracle Corp. | | | 29,402 | | | | 5,434,666 | |
| Total Software | | | | | | | 45,607,331 | |
| | | | | | | | | |
| Specialty Retail (8.65%) | | | | | | | | |
| Home Depot, Inc. | | | 104,635 | | | | 44,902,018 | |
| Lowe's Cos., Inc. | | | 43,995 | | | | 11,985,558 | |
| TJX Cos., Inc. | | | 92,778 | | | | 11,661,267 | |
| Tractor Supply Co. | | | 8,904 | | | | 2,525,798 | |
| Total Specialty Retail | | | | | | | 71,074,641 | |
| | | | | | | | | |
| Technology Hardware, Storage & Peripherals (5.09%) | | | | | | | | |
| Apple, Inc. | | | 176,281 | | | | 41,836,770 | |
| | | | | | | | | |
| Textiles, Apparel & Luxury Goods (0.39%) | | | | | | | | |
| NIKE, Inc., Class B | | | 40,987 | | | | 3,228,546 | |
| | | | | | | | | |
| Tobacco (1.28%) | | | | | | | | |
| Altria Group, Inc. | | | 94,894 | | | | 5,479,179 | |
ALPS | O’Shares U.S. Quality Dividend ETF
| Schedule of Investments | November 30, 2024 |
| Security Description | | Shares | | | Value | |
| Tobacco (continued) | | | | | | | | |
| Philip Morris International, Inc. | | | 37,713 | | | $ | 5,018,092 | |
| Total Tobacco | | | | | | | 10,497,271 | |
| | | | | | | | | |
| Trading Companies & Distributors (1.14%) | | | | | | | | |
| Fastenal Co. | | | 84,115 | | | | 7,028,650 | |
| WW Grainger, Inc. | | | 1,969 | | | | 2,373,314 | |
| Total Trading Companies & Distributors | | | | | | | 9,401,964 | |
| | | | | | | | | |
| Wireless Telecommunication Services (1.08%) | | | | | | | | |
| T-Mobile US, Inc. | | | 36,023 | | | | 8,895,520 | |
| | | | | | | | | |
| TOTAL COMMON STOCKS | | | | | | | | |
| (Cost $650,979,928) | | | | | | | 821,274,092 | |
| | | 7 Day Yield | | | Shares | | | Value | |
| SHORT TERM INVESTMENTS (0.01%) | | | | | | | | | | | | |
| State Street Institutional Treasury Plus Money Market Fund (Premier Class) | | | 4.59 | % | | | 107,007 | | | | 107,007 | |
| | | | | | | | | | | | | |
| TOTAL SHORT TERM INVESTMENTS | | | | | | | | | | | | |
| (Cost $107,007) | | | | | | | | | | | 107,007 | |
| | | | | | | | | | | | | |
| TOTAL INVESTMENTS (99.90%) | | | | | | | | | | | | |
| (Cost $651,086,935) | | | | | | | | | | $ | 821,381,099 | |
| OTHER ASSETS IN EXCESS OF LIABILITIES (0.10%) | | | | | | | | | | | 799,064 | |
| NET ASSETS - 100.00% | | | | | | | | | | $ | 822,180,163 | |
See Notes to the Financial Statements and Financial Highlights.
ALPS | O’Shares U.S. Small-Cap Quality Dividend ETF
| Schedule of Investments | November 30, 2024 |
| Security Description | | Shares | | | Value | |
| COMMON STOCKS (99.83%) | | | | | | | | |
| Automobile Components (4.29%) | | | | | | | | |
| BorgWarner, Inc. | | | 186,071 | | | $ | 6,385,957 | |
| Gentex Corp. | | | 548,611 | | | | 16,765,552 | |
| Lear Corp. | | | 91,438 | | | | 8,946,294 | |
| Phinia, Inc. | | | 88,687 | | | | 4,973,567 | |
| Total Automobile Components | | | | | | | 37,071,370 | |
| | | | | | | | | |
| Building Products (2.87%) | | | | | | | | |
| A O Smith Corp. | | | 198,939 | | | | 14,818,965 | |
| Simpson Manufacturing Co., Inc. | | | 17,569 | | | | 3,310,000 | |
| UFP Industries, Inc. | | | 48,993 | | | | 6,658,149 | |
| Total Building Products | | | | | | | 24,787,114 | |
| | | | | | | | | |
| Capital Markets (12.25%) | | | | | | | | |
| Artisan Partners Asset Management, Inc., Class A | | | 158,999 | | | | 7,757,561 | |
| Cohen & Steers, Inc. | | | 61,174 | | | | 6,402,471 | |
| Diamond Hill Investment Group, Inc. | | | 27,622 | | | | 4,567,298 | |
| Evercore, Inc., Class A | | | 30,549 | | | | 9,406,037 | |
| Federated Hermes, Inc. | | | 118,996 | | | | 5,087,079 | |
| Hamilton Lane, Inc., Class A | | | 37,882 | | | | 7,288,497 | |
| Houlihan Lokey, Inc. | | | 104,304 | | | | 19,722,843 | |
| MarketAxess Holdings, Inc. | | | 40,812 | | | | 10,557,656 | |
| SEI Investments Co. | | | 237,052 | | | | 19,587,607 | |
| Tradeweb Markets, Inc. | | | 45,563 | | | | 6,173,787 | |
| Victory Capital Holdings, Inc. | | | 131,975 | | | | 9,169,623 | |
| Total Capital Markets | | | | | | | 105,720,459 | |
| | | | | | | | | |
| Commercial Services & Supplies (1.09%) | | | | | | | | |
| Brady Corp., Class A | | | 86,742 | | | | 6,496,109 | |
| Ennis, Inc. | | | 137,474 | | | | 2,932,320 | |
| Total Commercial Services & Supplies | | | | | | | 9,428,429 | |
| | | | | | | | | |
| Communications Equipment (1.71%) | | | | | | | | |
| Juniper Networks, Inc. | | | 410,747 | | | | 14,754,032 | |
| | | | | | | | | |
| Consumer Finance (0.97%) | | | | | | | | |
| FirstCash Holdings, Inc. | | | 76,867 | | | | 8,367,742 | |
| | | | | | | | | |
| Consumer Staples Distribution & Retail (0.64%) | | | | | | | | |
| Casey's General Stores, Inc. | | | 7,414 | | | | 3,120,478 | |
| PriceSmart, Inc. | | | 15,874 | | | | 1,424,533 | |
| Weis Markets, Inc.(a) | | | 13,575 | | | | 988,667 | |
| Total Consumer Staples Distribution & Retail | | | | | | | 5,533,678 | |
| | | | | | | | | |
| Diversified Consumer Services (3.54%) | | | | | | | | |
| H&R Block, Inc. | | | 251,720 | | | | 14,921,962 | |
| Service Corp. International | | | 176,245 | | | | 15,613,544 | |
| Total Diversified Consumer Services | | | | | | | 30,535,506 | |
| Security Description | | Shares | | | Value | |
| Electric Utilities (1.34%) | | | | | | | | |
| ALLETE, Inc. | | | 17,550 | | | $ | 1,138,644 | |
| IDACORP, Inc. | | | 15,988 | | | | 1,894,098 | |
| MGE Energy, Inc. | | | 10,979 | | | | 1,144,890 | |
| OGE Energy Corp. | | | 53,508 | | | | 2,352,212 | |
| Otter Tail Corp. | | | 15,569 | | | | 1,255,484 | |
| Pinnacle West Capital Corp. | | | 27,344 | | | | 2,562,134 | |
| Portland General Electric Co. | | | 25,048 | | | | 1,200,300 | |
| Total Electric Utilities | | | | | | | 11,547,762 | |
| | | | | | | | | |
| Electronic Equipment, Instruments & Components (6.61%) | | | | | | | | |
| Avnet, Inc. | | | 315,791 | | | | 17,276,925 | |
| Badger Meter, Inc. | | | 35,601 | | | | 7,719,009 | |
| Littelfuse, Inc. | | | 44,720 | | | | 11,031,082 | |
| TD SYNNEX Corp. | | | 115,608 | | | | 13,756,196 | |
| Vishay Intertechnology, Inc. | | | 378,075 | | | | 7,221,233 | |
| Total Electronic Equipment, Instruments & Components | | | | | | | 57,004,445 | |
| | | | | | | | | |
| Entertainment (0.54%) | | | | | | | | |
| Warner Music Group Corp., | | | | | | | | |
| Class A(a) | | | 142,006 | | | | 4,618,035 | |
| | | | | | | | | |
| Financial Services (5.02%) | | | | | | | | |
| Essent Group, Ltd. | | | 126,090 | | | | 7,285,480 | |
| MGIC Investment Corp. | | | 381,480 | | | | 10,017,665 | |
| Radian Group, Inc. | | | 317,221 | | | | 11,353,340 | |
| Western Union Co. | | | 1,334,483 | | | | 14,692,657 | |
| Total Financial Services | | | | | | | 43,349,142 | |
| | | | | | | | | |
| Food Products (3.65%) | | | | | | | | |
| Cal-Maine Foods, Inc. | | | 81,496 | | | | 7,954,825 | |
| Flowers Foods, Inc. | | | 183,110 | | | | 4,141,948 | |
| Ingredion, Inc. | | | 89,912 | | | | 13,247,634 | |
| J & J Snack Foods Corp. | | | 10,013 | | | | 1,740,159 | |
| Lancaster Colony Corp. | | | 23,520 | | | | 4,370,957 | |
| Total Food Products | | | | | | | 31,455,523 | |
| | | | | | | | | |
| Gas Utilities (1.11%) | | | | | | | | |
| Chesapeake Utilities Corp. | | | 5,101 | | | | 672,057 | |
| National Fuel Gas Co. | | | 43,046 | | | | 2,753,653 | |
| New Jersey Resources Corp. | | | 25,906 | | | | 1,336,231 | |
| ONE Gas, Inc. | | | 16,005 | | | | 1,247,910 | |
| Spire, Inc. | | | 15,405 | | | | 1,127,492 | |
| UGI Corp. | | | 81,009 | | | | 2,460,243 | |
| Total Gas Utilities | | | | | | | 9,597,586 | |
| | | | | | | | | |
| Ground Transportation (1.05%) | | | | | | | | |
| Landstar System, Inc. | | | 48,809 | | | | 9,074,569 | |
| | | | | | | | | |
| Health Care Providers & Services (7.86%) | | | | | | | | |
| Chemed Corp. | | | 27,749 | | | | 15,883,250 | |
| Encompass Health Corp. | | | 170,561 | | | | 17,557,549 | |
| National HealthCare Corp. | | | 128,138 | | | | 16,042,878 | |
ALPS | O’Shares U.S. Small-Cap Quality Dividend ETF
| Schedule of Investments | November 30, 2024 |
| Security Description | | Shares | | | Value | |
| Health Care Providers & Services (continued) | | | | | | | | |
| Premier, Inc., Class A(a) | | | 798,204 | | | $ | 18,278,871 | |
| Total Health Care Providers & Services | | | | | | | 67,762,548 | |
| | | | | | | | | |
| Hotels, Restaurants & Leisure (5.85%) | | | | | | | | |
| Choice Hotels International, Inc. | | | 24,857 | | | | 3,759,373 | |
| Texas Roadhouse, Inc. | | | 92,617 | | | | 19,011,491 | |
| Vail Resorts, Inc. | | | 88,815 | | | | 15,919,201 | |
| Wendy's Co. | | | 322,454 | | | | 5,920,255 | |
| Wyndham Hotels & Resorts, Inc. | | | 60,306 | | | | 5,920,843 | |
| Total Hotels, Restaurants & Leisure | | | | | | | 50,531,163 | |
| | | | | | | | | |
| Household Durables (0.46%) | | | | | | | | |
| Whirlpool Corp.(a) | | | 35,246 | | | | 3,927,109 | |
| | | | | | | | | |
| Household Products (0.45%) | | | | | | | | |
| Reynolds Consumer Products, Inc. | | | 78,487 | | | | 2,173,305 | |
| WD-40 Co. | | | 6,103 | | | | 1,691,080 | |
| Total Household Products | | | | | | | 3,864,385 | |
| | | | | | | | | |
| Insurance (4.51%) | | | | | | | | |
| AMERISAFE, Inc. | | | 92,459 | | | | 5,456,930 | |
| Globe Life, Inc. | | | 42,158 | | | | 4,689,656 | |
| RenaissanceRe Holdings, Ltd. | | | 53,821 | | | | 15,400,879 | |
| RLI Corp. | | | 75,713 | | | | 13,317,917 | |
| Total Insurance | | | | | | | 38,865,382 | |
| | | | | | | | | |
| IT Services (1.87%) | | | | | | | | |
| Amdocs, Ltd. | | | 186,059 | | | | 16,135,036 | |
| | | | | | | | | |
| Leisure Products (0.51%) | | | | | | | | |
| Polaris, Inc. | | | 63,465 | | | | 4,379,085 | |
| | | | | | | | | |
| Machinery (9.76%) | | | | | | | | |
| Crane Co. | | | 34,329 | | | | 6,250,624 | |
| Donaldson Co., Inc. | | | 225,486 | | | | 17,599,183 | |
| Federal Signal Corp. | | | 38,384 | | | | 3,738,985 | |
| Franklin Electric Co., Inc. | | | 70,314 | | | | 7,615,006 | |
| ITT, Inc. | | | 80,006 | | | | 12,490,537 | |
| Lincoln Electric Holdings, Inc. | | | 89,553 | | | | 19,565,540 | |
| Mueller Industries, Inc. | | | 125,106 | | | | 10,104,812 | |
| Watts Water Technologies, Inc., Class A | | | 31,338 | | | | 6,762,427 | |
| Total Machinery | | | | | | | 84,127,114 | |
| | | | | | | | | |
| Media (2.27%) | | | | | | | | |
| New York Times Co., Class A | | | 219,649 | | | | 11,918,155 | |
| TEGNA, Inc.(a) | | | 411,232 | | | | 7,718,825 | |
| Total Media | | | | | | | 19,636,980 | |
| | | | | | | | | |
| Multi-Utilities (0.81%) | | | | | | | | |
| Avista Corp. | | | 18,987 | | | | 734,607 | |
| Black Hills Corp. | | | 15,902 | | | | 1,018,841 | |
| Security Description | | Shares | | | Value | |
| Multi-Utilities (continued) | | | | | | | | |
| NiSource, Inc. | | | 111,272 | | | $ | 4,238,351 | |
| Northwestern Energy Group, Inc. | | | 17,555 | | | | 969,738 | |
| Total Multi-Utilities | | | | | | | 6,961,537 | |
| | | | | | | | | |
| Pharmaceuticals (1.43%) | | | | | | | | |
| Organon & Co. | | | 778,778 | | | | 12,359,207 | |
| | | | | | | | | |
| Professional Services (5.16%) | | | | | | | | |
| Exponent, Inc. | | | 63,464 | | | | 6,264,531 | |
| Genpact, Ltd. | | | 368,041 | | | | 16,988,773 | |
| Kforce, Inc. | | | 36,853 | | | | 2,210,811 | |
| Robert Half, Inc. | | | 254,741 | | | | 19,006,226 | |
| Total Professional Services | | | | | | | 44,470,341 | |
| | | | | | | | | |
| Semiconductors & Semiconductor Equipment (0.47%) | | | | | | | | |
| Universal Display Corp. | | | 24,738 | | | | 4,069,896 | |
| | | | | | | | | |
| Software (3.85%) | | | | | | | | |
| Dolby Laboratories, Inc., Class A | | | 226,503 | | | | 17,739,716 | |
| InterDigital, Inc.(a) | | | 47,516 | | | | 9,311,235 | |
| Progress Software Corp. | | | 90,020 | | | | 6,158,268 | |
| Total Software | | | | | | | 33,209,219 | |
| | | | | | | | | |
| Specialty Retail (0.81%) | | | | | | | | |
| Dick's Sporting Goods, Inc. | | | 15,567 | | | | 3,226,105 | |
| Murphy USA, Inc. | | | 6,854 | | | | 3,754,621 | |
| Total Specialty Retail | | | | | | | 6,980,726 | |
| | | | | | | | | |
| Textiles, Apparel & Luxury Goods (3.76%) | | | | | | | | |
| Carter's, Inc. | | | 141,918 | | | | 7,744,465 | |
| Columbia Sportswear Co. | | | 70,447 | | | | 6,145,796 | |
| Ralph Lauren Corp. | | | 30,124 | | | | 6,970,694 | |
| Steven Madden, Ltd. | | | 117,522 | | | | 5,356,653 | |
| Tapestry, Inc. | | | 99,163 | | | | 6,175,872 | |
| Total Textiles, Apparel & Luxury Goods | | | | | | | 32,393,480 | |
| | | | | | | | | |
| Tobacco (0.16%) | | | | | | | | |
| Universal Corp. | | | 24,640 | | | | 1,407,437 | |
| | | | | | | | | |
| Trading Companies & Distributors (2.64%) | | | | | | | | |
| Applied Industrial Technologies, Inc. | | | 20,181 | | | | 5,544,124 | |
| MSC Industrial Direct Co., Inc., Class A | | | 201,085 | | | | 17,269,180 | |
| Total Trading Companies & Distributors | | | | | | | 22,813,304 | |
| | | | | | | | | |
| Water Utilities (0.52%) | | | | | | | | |
| American States Water Co. | | | 10,889 | | | | 928,941 | |
| California Water Service Group | | | 17,141 | | | | 877,448 | |
ALPS | O’Shares U.S. Small-Cap Quality Dividend ETF
| Schedule of Investments | November 30, 2024 |
| Security Description | | Shares | | | Value | |
| Water Utilities (continued) | | | | | | | | |
| Essential Utilities, Inc. | | | 66,537 | | | $ | 2,663,475 | |
| Total Water Utilities | | | | | | | 4,469,864 | |
| | | | | | | | | |
| TOTAL COMMON STOCKS | | | | | | | | |
| (Cost $748,074,153) | | | | | | | 861,209,205 | |
| | | 7 Day Yield | | | Shares | | | Value | |
| SHORT TERM INVESTMENTS (0.94%) | | | | | | | | | | | | |
| Money Market Fund (0.02%) | | | | | | | | | | | | |
| State Street Institutional Treasury Plus Money Market Fund (Premier Class) | | | | | | | | | | | | |
| (Cost $178,260) | | | 4.59 | % | | | 178,260 | | | $ | 178,260 | |
| | | | | | | | | | | | | |
| Investments Purchased with Collateral from Securities Loaned (0.92%) | | | | | | | | | | | | |
| State Street Navigator Securities Lending Government Money Market Portfolio, 4.63% | | | | | | | | | | | | |
| (Cost $7,925,782) | | | | | | | 7,925,782 | | | | 7,925,782 | |
| TOTAL SHORT TERM INVESTMENTS | | | | | | | | | | | | |
| (Cost $8,104,042) | | | | | | | | | | | 8,104,042 | |
| | | | | | | | | | | | | |
| TOTAL INVESTMENTS (100.77%) | | | | | | | | | | | | |
| (Cost $756,178,195) | | | | | | | | | | $ | 869,313,247 | |
| LIABILITIES IN EXCESS OF OTHER ASSETS (-0.77%) | | | | | | | | | | | (6,663,540 | ) |
| NET ASSETS - 100.00% | | | | | | | | | | $ | 862,649,707 | |
| (a) | Security, or a portion of the security position is currently on loan. The total market value of securities on loan is $8,453,697. |
See Notes to the Financial Statements and Financial Highlights.
ALPS | O’Shares Global Internet Giants ETF
| Schedule of Investments | November 30, 2024 |
| Security Description | | Shares | | | Value | |
| COMMON STOCKS (100.03%) | | | | | | | | |
| Broadline Retail (9.96%) | | | | | | | | |
| Alibaba Group Holding, Ltd., Sponsored ADR | | | 11,447 | | | $ | 1,000,124 | |
| Amazon.com, Inc.(a) | | | 36,012 | | | | 7,486,536 | |
| JD.com, Inc., ADR | | | 11,872 | | | | 443,775 | |
| MercadoLibre, Inc.(a) | | | 999 | | | | 1,983,185 | |
| PDD Holdings, Inc., ADR(a) | | | 26,299 | | | | 2,539,431 | |
| Total Broadline Retail | | | | | | | 13,453,051 | |
| | | | | | | | | |
| Diversified Consumer Services (1.79%) | | | | | | | | |
| Duolingo, Inc.(a) | | | 6,935 | | | | 2,415,252 | |
| | | | | | | | | |
| Entertainment (8.10%) | | | | | | | | |
| Electronic Arts, Inc. | | | 3,297 | | | | 539,620 | |
| NetEase, Inc., ADR | | | 8,425 | | | | 737,019 | |
| Netflix, Inc.(a) | | | 2,587 | | | | 2,294,178 | |
| Nexon Co., Ltd.(b) | | | 44,700 | | | | 615,012 | |
| ROBLOX Corp., Class A(a) | | | 30,348 | | | | 1,521,345 | |
| Spotify Technology SA(a) | | | 4,448 | | | | 2,121,518 | |
| Take-Two Interactive Software, Inc.(a) | | | 11,240 | | | | 2,117,391 | |
| Tencent Music Entertainment Group, ADR | | | 87,152 | | | | 994,404 | |
| Total Entertainment | | | | | | | 10,940,487 | |
| | | | | | | | | |
| Ground Transportation (1.60%) | | | | | | | | |
| Uber Technologies, Inc.(a) | | | 30,090 | | | | 2,165,276 | |
| | | | | | | | | |
| Health Care Technology (0.85%) | | | | | | | | |
| Veeva Systems, Inc., Class A(a) | | | 5,069 | | | | 1,154,972 | |
| | | | | | | | | |
| Hotels, Restaurants & Leisure (6.29%) | | | | | | | | |
| Airbnb, Inc., Class A(a) | | | 7,456 | | | | 1,014,836 | |
| Amadeus IT Group SA(b) | | | 10,366 | | | | 727,581 | |
| Booking Holdings, Inc. | | | 184 | | | | 957,164 | |
| DoorDash, Inc., Class A(a) | | | 11,634 | | | | 2,099,705 | |
| Meituan, Class B(a)(c)(d) | | | 78,717 | | | | 1,706,884 | |
| Trip.com Group, Ltd., ADR(a) | | | 30,859 | | | | 1,995,034 | |
| Total Hotels, Restaurants & Leisure | | | | | | | 8,501,204 | |
| | | | | | | | | |
| Interactive Media & Services (13.21%) | | | | | | | | |
| Alphabet, Inc., Class A | | | 43,590 | | | | 7,364,530 | |
| Meta Platforms, Inc., Class A | | | 12,404 | | | | 7,123,865 | |
| Pinterest, Inc., Class A(a) | | | 44,935 | | | | 1,362,429 | |
| Snap, Inc., Class A(a) | | | 100,448 | | | | 1,186,291 | |
| Tencent Holdings, Ltd. | | | 15,817 | | | | 809,147 | |
| Total Interactive Media & Services | | | | | | | 17,846,262 | |
| | | | | | | | | |
| IT Services (7.07%) | | | | | | | | |
| Cloudflare, Inc., Class A(a) | | | 21,655 | | | | 2,161,819 | |
| MongoDB, Inc.(a)(b) | | | 4,557 | | | | 1,469,587 | |
| Shopify, Inc., Class A(a) | | | 28,466 | | | | 3,290,669 | |
| Snowflake, Inc., Class A(a) | | | 15,085 | | | | 2,636,858 | |
| Total IT Services | | | | | | | 9,558,933 | |
| Security Description | | Shares | | | Value | |
| Media (2.24%) | | | | | | | | |
| Naspers Ltd(a) | | | 3,955 | | | $ | 893,024 | |
| Trade Desk, Inc., Class A(a) | | | 16,634 | | | | 2,138,301 | |
| Total Media | | | | | | | 3,031,325 | |
| | | | | | | | | |
| Professional Services (0.97%) | | | | | | | | |
| Paychex, Inc. | | | 2,866 | | | | 419,210 | |
| Recruit Holdings Co., Ltd. | | | 6,400 | | | | 444,234 | |
| Wolters Kluwer NV | | | 2,660 | | | | 443,989 | |
| Total Professional Services | | | | | | | 1,307,433 | |
| | | | | | | | | |
| Real Estate Management & Development (1.93%) | | | | | | | | |
| CoStar Group, Inc.(a) | | | 12,677 | | | | 1,031,147 | |
| Zillow Group, Inc.(a)(b) | | | 18,617 | | | | 1,577,046 | |
| Total Real Estate Management & Development | | | | | | | 2,608,193 | |
| | | | | | | | | |
| Software (46.02%) | | | | | | | | |
| Adobe, Inc.(a) | | | 2,873 | | | | 1,482,267 | |
| AppLovin Corp., Class A(a) | | | 13,257 | | | | 4,464,295 | |
| Atlassian Corp., Class A(a) | | | 9,033 | | | | 2,380,918 | |
| Crowdstrike Holdings, Inc., Class A(a) | | | 7,450 | | | | 2,577,477 | |
| CyberArk Software, Ltd.(a) | | | 5,408 | | | | 1,749,542 | |
| Datadog, Inc., Class A(a) | | | 15,573 | | | | 2,378,776 | |
| Dynatrace, Inc.(a) | | | 22,097 | | | | 1,241,630 | |
| Fair Isaac Corp.(a) | | | 625 | | | | 1,484,394 | |
| Fortinet, Inc.(a) | | | 13,907 | | | | 1,321,860 | |
| Gitlab, Inc., Class A(a) | | | 29,127 | | | | 1,856,846 | |
| Guidewire Software, Inc.(a) | | | 6,255 | | | | 1,269,077 | |
| HubSpot, Inc.(a) | | | 2,565 | | | | 1,849,493 | |
| Intuit, Inc. | | | 2,804 | | | | 1,799,411 | |
| Microsoft Corp. | | | 15,785 | | | | 6,684,317 | |
| Monday.com, Ltd.(a) | | | 6,240 | | | | 1,780,646 | |
| Nutanix, Inc.(a) | | | 19,543 | | | | 1,275,767 | |
| Oracle Corp. | | | 11,654 | | | | 2,154,125 | |
| Palantir Technologies, Inc., Class A(a) | | | 52,948 | | | | 3,551,752 | |
| Palo Alto Networks, Inc.(a) | | | 5,160 | | | | 2,001,151 | |
| PTC, Inc.(a) | | | 4,885 | | | | 977,293 | |
| Salesforce, Inc. | | | 4,407 | | | | 1,454,266 | |
| Samsara, Inc., Class A(a) | | | 36,704 | | | | 1,963,297 | |
| SAP SE | | | 7,355 | | | | 1,748,008 | |
| SentinelOne, Inc., Class A(a) | | | 70,234 | | | | 1,963,040 | |
| ServiceNow, Inc.(a) | | | 2,881 | | | | 3,023,437 | |
| Tyler Technologies, Inc.(a) | | | 1,303 | | | | 819,809 | |
| WiseTech Global, Ltd. | | | 19,428 | | | | 1,623,277 | |
| Workday, Inc., Class A(a) | | | 5,177 | | | | 1,294,198 | |
| Xero, Ltd.(a) | | | 16,321 | | | | 1,850,703 | |
| Zscaler, Inc.(a) | | | 10,379 | | | | 2,144,198 | |
| Total Software | | | | | | | 62,165,270 | |
| | | | | | | | | |
| TOTAL COMMON STOCKS | | | | | | | | |
| (Cost $94,853,802) | | | | | | | 135,147,658 | |
ALPS | O’Shares Global Internet Giants ETF
| Schedule of Investments | November 30, 2024 |
| | | 7 Day Yield | | | Shares | | | Value | |
| SHORT TERM INVESTMENTS (1.61%) | | | | | | | | | | | | |
| Investments Purchased with Collateral | | | | | | | | | | | | |
| from Securities Loaned (1.61%) | | | | | | | | | | | | |
| State Street Navigator Securities Lending Government Money Market Portfolio, 4.63% | | | | | | | | | | | | |
| (Cost $2,171,758) | | | | | | | 2,171,758 | | | $ | 2,171,758 | |
| TOTAL SHORT TERM INVESTMENTS | | | | | | | | | | | | |
| (Cost $2,171,758) | | | | | | | | | | | 2,171,758 | |
| | | | | | | | | | | | | |
| TOTAL INVESTMENTS (101.64%) | | | | | | | | | | | | |
| (Cost $97,025,560) | | | | | | | | | | $ | 137,319,416 | |
| LIABILITIES IN EXCESS OF OTHER ASSETS (-1.64%) | | | | | | | | | | | (2,209,065 | ) |
| NET ASSETS - 100.00% | | | | | | | | | | $ | 135,110,351 | |
| (a) | Non-income producing security. |
| (b) | Security, or a portion of the security position is currently on loan. The total market value of securities on loan is $2,091,429. |
| (c) | Securities exempt from registration under Rule 144A of the Securities Act of 1933. These securities may be sold in the ordinary course of business in transactions exempt from registration, normally to qualified institutional buyers. At period end, the aggregate market value of those securities was $1,706,884, representing 1.26% of net assets. |
| (d) | Securities were purchased pursuant to Regulation S under the Securities Act of 1933, which exempts securities offered and sold outside of the United States from registration. Such securities cannot be sold in the United States without either an effective registration statement filed pursuant to the Securities Act of 1933, or pursuant to an exemption from registration. As of November 30, 2024, the market value of those securities was $1,706,884, representing 1.26% of net assets. |
See Notes to the Financial Statements and Financial Highlights.
ALPS | O’Shares Europe Quality Dividend ETF
| Schedule of Investments | November 30, 2024 |
| Security Description | | Shares | | | Value | |
| COMMON STOCKS (99.11%) | | | | | | | | |
| Aerospace & Defense (2.32%) | | | | | | | | |
| BAE Systems PLC | | | 52,359 | | | $ | 817,474 | |
| | | | | | | | | |
| Air Freight & Logistics (1.74%) | | | | | | | | |
| Deutsche Post AG | | | 16,662 | | | | 612,214 | |
| | | | | | | | | |
| Automobile Components (1.95%) | | | | | | | | |
| Cie Generale des Etablissements Michelin SCA | | | 21,109 | | | | 685,937 | |
| | | | | | | | | |
| Banks (2.13%) | | | | | | | | |
| HSBC Holdings PLC | | | 80,400 | | | | 749,229 | |
| | | | | | | | | |
| Beverages (1.78%) | | | | | | | | |
| Diageo PLC | | | 16,509 | | | | 494,184 | |
| Pernod Ricard SA | | | 1,151 | | | | 128,808 | |
| Total Beverages | | | | | | | 622,992 | |
| | | | | | | | | |
| Building Products (1.06%) | | | | | | | | |
| Assa Abloy AB, Class B | | | 5,146 | | | | 158,138 | |
| Geberit AG | | | 354 | | | | 213,135 | |
| Total Building Products | | | | | | | 371,273 | |
| | | | | | | | | |
| Capital Markets (2.79%) | | | | | | | | |
| 3i Group PLC | | | 20,775 | | | | 980,474 | |
| | | | | | | | | |
| Construction & Engineering (2.05%) | | | | | | | | |
| Vinci SA | | | 6,836 | | | | 721,381 | |
| | | | | | | | | |
| Consumer Staples Distribution & Retail (0.55%) | | | | | | | | |
| Koninklijke Ahold Delhaize NV | | | 5,611 | | | | 193,595 | |
| | | | | | | | | |
| Diversified Telecommunication Services (6.78%) | | | | | | | | |
| Deutsche Telekom AG | | | 31,839 | | | | 1,018,794 | |
| Koninklijke KPN NV | | | 192,986 | | | | 748,654 | |
| Swisscom AG | | | 1,069 | | | | 617,046 | |
| Total Diversified Telecommunication Services | | | | | | | 2,384,494 | |
| | | | | | | | | |
| Electric Utilities (2.86%) | | | | | | | | |
| Iberdrola SA | | | 70,388 | | | | 1,003,418 | |
| | | | | | | | | |
| Electrical Equipment (6.78%) | | | | | | | | |
| ABB, Ltd. | | | 14,681 | | | | 837,914 | |
| Legrand SA | | | 6,029 | | | | 604,493 | |
| Schneider Electric SE | | | 3,667 | | | | 943,585 | |
| Total Electrical Equipment | | | | | | | 2,385,992 | |
| | | | | | | | | |
| Financial Services (3.19%) | | | | | | | | |
| Industrivarden AB, Class C(a) | | | 6,632 | | | | 217,556 | |
| Security Description | | Shares | | | Value | |
| Financial Services (continued) | | | | | | | | |
| Investor AB | | | 33,019 | | | $ | 906,670 | |
| Total Financial Services | | | | | | | 1,124,226 | |
| | | | | | | | | |
| Food Products (4.25%) | | | | | | | | |
| Danone SA | | | 2,170 | | | | 148,275 | |
| Nestle SA | | | 15,515 | | | | 1,346,939 | |
| Total Food Products | | | | | | | 1,495,214 | |
| | | | | | | | | |
| Health Care Equipment & Supplies (0.96%) | | | | | | | | |
| EssilorLuxottica SA | | | 1,386 | | | | 336,577 | |
| | | | | | | | | |
| Household Products (1.85%) | | | | | | | | |
| Essity AB, Class B | | | 4,040 | | | | 111,287 | |
| Reckitt Benckiser Group PLC | | | 8,725 | | | | 539,560 | |
| Total Household Products | | | | | | | 650,847 | |
| | | | | | | | | |
| Independent Power and Renewable Electricity Producers (1.40%) | | | | | | | | |
| RWE AG | | | 14,652 | | | | 493,458 | |
| | | | | | | | | |
| Industrial Conglomerates (3.30%) | | | | | | | | |
| Siemens AG | | | 5,992 | | | | 1,159,775 | |
| | | | | | | | | |
| Insurance (1.87%) | | | | | | | | |
| Sampo Oyj | | | 15,362 | | | | 658,116 | |
| | | | | | | | | |
| Machinery (3.22%) | | | | | | | | |
| Atlas Copco AB | | | 17,188 | | | | 274,663 | |
| Kone Oyj, Class B | | | 6,720 | | | | 348,392 | |
| Volvo AB | | | 20,435 | | | | 509,279 | |
| Total Machinery | | | | | | | 1,132,334 | |
| | | | | | | | | |
| Marine Transportation (0.84%) | | | | | | | | |
| Kuehne + Nagel International AG(a) | | | 1,243 | | | | 297,152 | |
| | | | | | | | | |
| Multi-Utilities (1.91%) | | | | | | | | |
| National Grid PLC | | | 53,102 | | | | 670,692 | |
| | | | | | | | | |
| Personal Care Products (5.89%) | | | | | | | | |
| L'Oreal SA | | | 2,619 | | | | 909,579 | |
| Unilever PLC | | | 19,384 | | | | 1,159,504 | |
| Total Personal Care Products | | | | | | | 2,069,083 | |
| | | | | | | | | |
| Pharmaceuticals (15.90%) | | | | | | | | |
| AstraZeneca PLC | | | 4,368 | | | | 589,819 | |
| GSK PLC | | | 28,900 | | | | 490,927 | |
| Novartis AG | | | 12,734 | | | | 1,348,204 | |
| Novo Nordisk A/S, Class B | | | 13,671 | | | | 1,467,009 | |
| Roche Holding AG | | | 4,799 | | | | 1,391,844 | |
| Sanofi SA | | | 3,123 | | | | 303,917 | |
| Total Pharmaceuticals | | | | | | | 5,591,720 | |
| | | | | | | | | |
| Professional Services (6.86%) | | | | | | | | |
| Experian PLC | | | 11,472 | | | | 547,551 | |
| RELX PLC | | | 21,514 | | | | 1,014,256 | |
ALPS | O’Shares Europe Quality Dividend ETF
| Schedule of Investments | November 30, 2024 |
| Security Description | | Shares | | | Value | |
| Professional Services (continued) | | | | | | | | |
| Wolters Kluwer NV | | | 5,104 | | | $ | 851,925 | |
| Total Professional Services | | | | | | | 2,413,732 | |
| | | | | | | | | |
| Semiconductors & Semiconductor Equipment (2.49%) | | | | | | | | |
| ASML Holding NV | | | 1,260 | | | | 876,661 | |
| | | | | | | | | |
| Software (4.52%) | | | | | | | | |
| SAP SE | | | 6,692 | | | | 1,590,437 | |
| | | | | | | | | |
| Specialty Retail (2.75%) | | | | | | | | |
| Industria de Diseno Textil SA(a) | | | 17,558 | | | | 968,167 | |
| | | | | | | | | |
| Textiles, Apparel & Luxury Goods (4.57%) | | | | | | | | |
| Hermes International SCA | | | 184 | | | | 401,521 | |
| LVMH Moet Hennessy Louis Vuitton SE | | | 1,926 | | | | 1,205,912 | |
| Total Textiles, Apparel & Luxury Goods | | | | | | | 1,607,433 | |
| | | | | | | | | |
| Tobacco (0.55%) | | | | | | | | |
| Imperial Brands PLC | | | 5,930 | | | | 193,846 | |
| | | | | | | | | |
| TOTAL COMMON STOCKS | | | | | | | | |
| (Cost $32,507,677) | | | | | | | 34,857,943 | |
| | | 7 Day Yield | | | Shares | | | Value | |
| SHORT TERM INVESTMENTS (3.31%) | | | | | | | | | | | | |
| Money Market Fund (0.07%) | | | | | | | | | | | | |
| State Street Institutional Treasury Plus Money Market Fund (Premier Class) | | | | | | | | | | | | |
| (Cost $40,858) | | | 4.59 | % | | | 40,858 | | | $ | 40,858 | |
| | | | | | | | | | | | | |
| Investments Purchased with Collateral from Securities Loaned (3.23%) | | | | | | | | | | | | |
| State Street Navigator Securities Lending Government Money Market Portfolio, 4.63% | | | | | | | | | | | | |
| (Cost $1,134,444) | | | | | | | 1,134,444 | | | | 1,134,444 | |
| TOTAL SHORT TERM INVESTMENTS | | | | | | | | | | | | |
| (Cost $1,175,302) | | | | | | | | | | | 1,175,302 | |
| | | | | | | | | | | | | |
| TOTAL INVESTMENTS (102.42%) | | | | | | | | | | | | |
| (Cost $33,682,979) | | | | | | | | | | $ | 36,033,245 | |
| LIABILITIES IN EXCESS OF OTHER ASSETS (-2.42%) | | | | | | | | | | | (862,265 | ) |
| NET ASSETS - 100.00% | | | | | | | | | | $ | 35,170,980 | |
| (a) | Security, or a portion of the security position is currently on loan. The total market value of securities on loan is $1,087,807. |
See Notes to the Financial Statements and Financial Highlights.
ALPS ETF Trust
| Statements of Assets and Liabilities | November 30, 2024 |
| | | ALPS | O'Shares
U.S. Quality
Dividend ETF | | | ALPS | O'Shares
U.S. Small-Cap
Quality Dividend
ETF | | | ALPS | O'Shares
Global Internet
Giants ETF | | | ALPS | O'Shares
Europe Quality
Dividend ETF | |
| ASSETS: | | | | | | | | | | | | | | | | |
| Investments, at value(a) | | $ | 821,381,099 | | | $ | 869,313,247 | | | $ | 137,319,416 | | | $ | 36,033,245 | |
| Foreign Currency, at value (Cost $–, $–, $133 and $2,839) | | | – | | | | – | | | | 133 | | | | 2,840 | |
| Dividends and foreign tax reclaims receivable | | | 1,116,346 | | | | 1,589,151 | | | | 18,144 | | | | 57,322 | |
| Tax reclaims receivable | | | – | | | | – | | | | 4,833 | | | | 226,756 | |
| Total Assets | | | 822,497,445 | | | | 870,902,398 | | | | 137,342,526 | | | | 36,320,163 | |
| | | | | | | | | | | | | | | | | |
| LIABILITIES: | | | | | | | | | | | | | | | | |
| Payable to custodian for overdraft | | | – | | | | – | | | | 8,730 | | | | – | |
| Payable to adviser | | | 317,282 | | | | 326,909 | | | | 51,687 | | | | 14,739 | |
| Payable for collateral upon return of securities loaned | | | – | | | | 7,925,782 | | | | 2,171,758 | | | | 1,134,444 | |
| Total Liabilities | | | 317,282 | | | | 8,252,691 | | | | 2,232,175 | | | | 1,149,183 | |
| NET ASSETS | | $ | 822,180,163 | | | $ | 862,649,707 | | | $ | 135,110,351 | | | $ | 35,170,980 | |
| | | | | | | | | | | | | | | | | |
| NET ASSETS CONSIST OF: | | | | | | | | | | | | | | | | |
| Paid-in capital | | $ | 686,362,991 | | | $ | 762,114,472 | | | $ | 297,344,885 | | | $ | 42,370,015 | |
| Total distributable earnings/(accumulated losses) | | | 135,817,172 | | | | 100,535,235 | | | | (162,234,534 | ) | | | (7,199,035 | ) |
| NET ASSETS | | $ | 822,180,163 | | | $ | 862,649,707 | | | $ | 135,110,351 | | | $ | 35,170,980 | |
| | | | | | | | | | | | | | | | | |
| INVESTMENTS, AT COST | | $ | 651,086,935 | | | $ | 756,178,195 | | | $ | 97,025,560 | | | $ | 33,682,979 | |
| | | | | | | | | | | | | | | | | |
| PRICING OF SHARES | | | | | | | | | | | | | | | | |
| Net Assets | | $ | 822,180,163 | | | $ | 862,649,707 | | | $ | 135,110,351 | | | $ | 35,170,980 | |
| Shares of beneficial interest outstanding (Unlimited number of shares authorized, par value $0.01 per share) | | | 14,825,000 | | | | 18,404,000 | | | | 2,850,000 | | | | 1,200,000 | |
| Net Asset Value, offering and redemption price per share | | $ | 55.46 | | | $ | 46.87 | | | $ | 47.41 | | | $ | 29.31 | |
| (a) | Includes $-, $8,453,697, $2,091,429 and $1,087,807 of securities on loan. |
See Notes to the Financial Statements and Financial Highlights.
ALPS ETF Trust
Statements of Operations
| | | ALPS | O'Shares U.S. Quality Dividend ETF | | | ALPS | O'Shares U.S. Small-Cap Quality Dividend ETF | | | ALPS | O'Shares Global Internet Giants ETF | | | ALPS | O'Shares Europe Quality Dividend ETF | |
| INVESTMENT INCOME: | | | | | | | | | | | | | | | | |
| Dividend Income* | | $ | 15,376,608 | | | $ | 12,532,536 | | | $ | 370,515 | | | $ | 1,080,913 | |
| Securities Lending Income | | | 5,032 | | | | 2,762 | | | | 2,811 | | | | 669 | |
| Total Investment Income | | | 15,381,640 | | | | 12,535,298 | | | | 373,326 | | | | 1,081,582 | |
| | | | | | | | | | | | | | | | | |
| EXPENSES: | | | | | | | | | | | | | | | | |
| Investment adviser fees | | | 3,626,260 | | | | 2,937,900 | | | | 641,969 | | | | 186,379 | |
| Other expenses | | | 31,662 | | | | 24,419 | | | | 5,734 | | | | 1,653 | |
| Total Expenses | | | 3,657,922 | | | | 2,962,319 | | | | 647,703 | | | | 188,032 | |
| NET INVESTMENT INCOME/(LOSS) | | | 11,723,718 | | | | 9,572,979 | | | | (274,377 | ) | | | 893,550 | |
| | | | | | | | | | | | | | | | | |
| REALIZED AND UNREALIZED GAIN/LOSS | | | | | | | | | | | | | | | | |
| Net realized gain on investments(a) | | | 81,467,840 | | | | 55,188,441 | | | | 1,648,153 | | | | 2,430,520 | |
| Net realized gain/(loss) on foreign currency transactions | | | – | | | | – | | | | (7,664 | ) | | | 4,647 | |
| Total net realized gain | | | 81,467,840 | | | | 55,188,441 | | | | 1,640,489 | | | | 2,435,167 | |
| Net change in unrealized appreciation on investments | | | 86,566,408 | | | | 95,906,052 | | | | 40,772,961 | | | | 425,769 | |
| Net change in unrealized depreciation on translation of assets and liabilities denominated in foreign currencies | | | – | | | | – | | | | (168 | ) | | | (8,187 | ) |
| Total net change in unrealized appreciation | | | 86,566,408 | | | | 95,906,052 | | | | 40,772,793 | | | | 417,582 | |
| NET REALIZED AND UNREALIZED GAIN ON INVESTMENTS | | | 168,034,248 | | | | 151,094,493 | | | | 42,413,282 | | | | 2,852,749 | |
| NET INCREASE IN NET ASSETS RESULTING FROM OPERATIONS | | $ | 179,757,966 | | | $ | 160,667,472 | | | $ | 42,138,905 | | | $ | 3,746,299 | |
| *Net of foreign tax withholding. | | $ | – | | | $ | – | | | $ | 18,121 | | | $ | 131,363 | |
| (a) | Includes realized gain or loss as a result of in-kind transactions (See Note 4 in Notes to Financial Statements and Financial Highlights). |
See Notes to the Financial Statements and Financial Highlights.
ALPS | O’Shares U.S. Quality Dividend ETF
Statements of Changes in Net Assets
| | | For the
Year Ended
November 30, 2024 | | | For the
Year Ended
November 30, 2023 | |
| OPERATIONS: | | | | | | | | |
| Net investment income | | $ | 11,723,718 | | | $ | 12,795,006 | |
| Net realized gain | | | 81,467,840 | | | | 23,476,172 | |
| Net change in unrealized appreciation/depreciation | | | 86,566,408 | | | | (8,472,160 | ) |
| Net increase in net assets resulting from operations | | | 179,757,966 | | | | 27,799,018 | |
| | | | | | | | | |
| DISTRIBUTIONS TO SHAREHOLDERS: | | | | | | | | |
| From distributable earnings | | | (12,150,470 | ) | | | (13,050,503 | ) |
| Total distributions | | | (12,150,470 | ) | | | (13,050,503 | ) |
| | | | | | | | | |
| CAPITAL SHARE TRANSACTIONS: | | | | | | | | |
| Proceeds from sale of shares | | | 131,293,184 | | | | 3,278,989 | |
| Cost of shares redeemed | | | (132,933,611 | ) | | | (109,935,912 | ) |
| Net decrease from capital share transactions | | | (1,640,427 | ) | | | (106,656,923 | ) |
| Net increase/(decrease) in net assets | | | 165,967,069 | | | | (91,908,408 | ) |
| | | | | | | | | |
| NET ASSETS: | | | | | | | | |
| Beginning of year | | | 656,213,094 | | | | 748,121,502 | |
| End of year | | $ | 822,180,163 | | | $ | 656,213,094 | |
| | | | | | | | | |
| OTHER INFORMATION: | | | | | | | | |
| CAPITAL SHARE TRANSACTIONS: | | | | | | | | |
| Beginning shares | | | 14,775,000 | | | | 17,300,000 | |
| Shares sold | | | 2,575,000 | | | | 75,000 | |
| Shares redeemed | | | (2,525,000 | ) | | | (2,600,000 | ) |
| Shares outstanding, end of year | | | 14,825,000 | | | | 14,775,000 | |
See Notes to the Financial Statements and Financial Highlights.
ALPS | O’Shares U.S. Small-Cap Quality Dividend ETF
Statements of Changes in Net Assets
| | | For the
Year Ended
November 30, 2024 | | | For the
Year Ended
November 30, 2023 | |
| OPERATIONS: | | | | | | | | |
| Net investment income | | $ | 9,572,979 | | | $ | 5,483,755 | |
| Net realized gain | | | 55,188,441 | | | | 9,694,745 | |
| Net change in unrealized appreciation/depreciation | | | 95,906,052 | | | | (1,765,903 | ) |
| Net increase in net assets resulting from operations | | | 160,667,472 | | | | 13,412,597 | |
| | | | | | | | | |
| DISTRIBUTIONS TO SHAREHOLDERS: | | | | | | | | |
| From distributable earnings | | | (9,548,300 | ) | | | (5,299,690 | ) |
| Total distributions | | | (9,548,300 | ) | | | (5,299,690 | ) |
| | | | | | | | | |
| CAPITAL SHARE TRANSACTIONS: | | | | | | | | |
| Proceeds from sale of shares | | | 497,341,585 | | | | 240,930,245 | |
| Cost of shares redeemed | | | (177,690,807 | ) | | | (39,107,309 | ) |
| Net increase from capital share transactions | | | 319,650,778 | | | | 201,822,936 | |
| Net increase in net assets | | | 470,769,950 | | | | 209,935,843 | |
| | | | | | | | | |
| NET ASSETS: | | | | | | | | |
| Beginning of year | | | 391,879,757 | | | | 181,943,914 | |
| End of year | | $ | 862,649,707 | | | $ | 391,879,757 | |
| | | | | | | | | |
| OTHER INFORMATION: | | | | | | | | |
| CAPITAL SHARE TRANSACTIONS: | | | | | | | | |
| Beginning shares | | | 10,804,000 | | | | 5,154,000 | |
| Shares sold | | | 11,650,000 | | | | 6,750,000 | |
| Shares redeemed | | | (4,050,000 | ) | | | (1,100,000 | ) |
| Shares outstanding, end of year | | | 18,404,000 | | | | 10,804,000 | |
See Notes to the Financial Statements and Financial Highlights.
ALPS | O’Shares Global Internet Giants ETF
Statements of Changes in Net Assets
| | | For the
Year Ended
November 30, 2024 | | | For the
Year Ended
November 30, 2023 | |
| OPERATIONS: | | | | | | |
| Net investment loss | | $ | (274,377 | ) | | $ | (407,384 | ) |
| Net realized gain/(loss) | | | 1,640,489 | | | | (47,732,850 | ) |
| Net change in unrealized appreciation/depreciation | | | 40,772,793 | | | | 91,319,441 | |
| Net increase in net assets resulting from operations | | | 42,138,905 | | | | 43,179,207 | |
| | | | | | | | | |
| CAPITAL SHARE TRANSACTIONS: | | | | | | | | |
| Proceeds from sale of shares | | | 11,587,640 | | | | 811,157 | |
| Cost of shares redeemed | | | (54,926,483 | ) | | | (60,193,182 | ) |
| Net decrease from capital share transactions | | | (43,338,843 | ) | | | (59,382,025 | ) |
| Net decrease in net assets | | | (1,199,938 | ) | | | (16,202,818 | ) |
| | | | | | | | | |
| NET ASSETS: | | | | | | | | |
| Beginning of year | | | 136,310,289 | | | | 152,513,107 | |
| End of year | | $ | 135,110,351 | | | $ | 136,310,289 | |
| | | | | | | | | |
| OTHER INFORMATION: | | | | | | | | |
| CAPITAL SHARE TRANSACTIONS: | | | | | | | | |
| Beginning shares | | | 3,950,000 | | | | 6,075,000 | |
| Shares sold | | | 325,000 | | | | 25,000 | |
| Shares redeemed | | | (1,425,000 | ) | | | (2,150,000 | ) |
| Shares outstanding, end of year | | | 2,850,000 | | | | 3,950,000 | |
See Notes to the Financial Statements and Financial Highlights.
ALPS | O’Shares Europe Quality Dividend ETF
Statements of Changes in Net Assets
| | | For the
Year Ended
November 30, 2024 | | | For the
Year Ended
November 30, 2023 | |
| OPERATIONS: | | | | | | | | |
| Net investment income | | $ | 893,550 | | | $ | 1,035,243 | |
| Net realized gain/(loss) | | | 2,435,167 | | | | (205,170 | ) |
| Net change in unrealized appreciation/depreciation | | | 417,582 | | | | 4,438,644 | |
| Net increase in net assets resulting from operations | | | 3,746,299 | | | | 5,268,717 | |
| | | | | | | | | |
| DISTRIBUTIONS TO SHAREHOLDERS: | | | | | | | | |
| From distributable earnings | | | (1,395,572 | ) | | | (795,232 | ) |
| Total distributions | | | (1,395,572 | ) | | | (795,232 | ) |
| | | | | | | | | |
| CAPITAL SHARE TRANSACTIONS: | | | | | | | | |
| Proceeds from sale of shares | | | 3,762,013 | | | | 3,889,048 | |
| Cost of shares redeemed | | | (7,357,597 | ) | | | (7,610,784 | ) |
| Net decrease from capital share transactions | | | (3,595,584 | ) | | | (3,721,736 | ) |
| Net increase/(decrease) in net assets | | | (1,244,857 | ) | | | 751,749 | |
| | | | | | | | | |
| NET ASSETS: | | | | | | | | |
| Beginning of year | | | 36,415,837 | | | | 35,664,088 | |
| End of year | | $ | 35,170,980 | | | $ | 36,415,837 | |
| | | | | | | | | |
| OTHER INFORMATION: | | | | | | | | |
| CAPITAL SHARE TRANSACTIONS: | | | | | | | | |
| Beginning shares | | | 1,325,000 | | | | 1,475,000 | |
| Shares sold | | | 125,000 | | | | 150,000 | |
| Shares redeemed | | | (250,000 | ) | | | (300,000 | ) |
| Shares outstanding, end of year | | | 1,200,000 | | | | 1,325,000 | |
See Notes to the Financial Statements and Financial Highlights.
ALPS | O’Shares U.S. Quality Dividend ETF
| Financial Highlights | For a Share Outstanding Throughout the Periods Presented |
| | | For the Year
Ended
November 30,
2024 | | | For the Year
Ended
November 30,
2023 | | | For the Period
July 1, 2022 to
November 30,
2022(a) | | | For the Year
Ended
June 30, 2022 | | | For the Year
Ended
June 30, 2021 | | | For the Year
Ended
June 30, 2020 | |
| NET ASSET VALUE, BEGINNING OF PERIOD | | $ | 44.41 | | | $ | 43.24 | | | $ | 40.29 | | | $ | 42.00 | | | $ | 33.16 | | | $ | 34.13 | |
| | | | | | | | | | | | | | | | | | | | | | | | | |
| INCOME FROM OPERATIONS: | | | | | | | | | | | | | | | | | | | | | | | | |
| Net investment income(b) | | | 0.78 | | | | 0.81 | | | | 0.36 | | | | 0.77 | | | | 0.69 | (c) | | | 0.93 | |
| Net realized and unrealized gain/(loss) | | | 11.07 | | | | 1.19 | | | | 2.95 | | | | (1.72 | ) | | | 8.81 | | | | (0.96 | ) |
| Total from investment operations | | | 11.85 | | | | 2.00 | | | | 3.31 | | | | (0.95 | ) | | | 9.50 | | | | (0.03 | ) |
| | | | | | | | | | | | | | | | | | | | | | | | | |
| DISTRIBUTIONS: | | | | | | | | | | | | | | | | | | | | | | | | |
| From net investment income | | | (0.80 | ) | | | (0.83 | ) | | | (0.36 | ) | | | (0.76 | ) | | | (0.66 | ) | | | (0.94 | ) |
| Total distributions | | | (0.80 | ) | | | (0.83 | ) | | | (0.36 | ) | | | (0.76 | ) | | | (0.66 | ) | | | (0.94 | ) |
| | | | | | | | | | | | | | | | | | | | | | | | | |
| NET INCREASE/(DECREASE) IN NET ASSET VALUE | | | 11.05 | | | | 1.17 | | | | 2.95 | | | | (1.71 | ) | | | 8.84 | | | | (0.97 | ) |
| NET ASSET VALUE, END OF PERIOD | | $ | 55.46 | | | $ | 44.41 | | | $ | 43.24 | | | $ | 40.29 | | | $ | 42.00 | | | $ | 33.16 | |
| TOTAL RETURN(d) | | | 26.90 | % | | | 4.74 | % | | | 8.27 | % | | | (2.38 | )% | | | 28.84 | % | | | (0.12 | )% |
| | | | | | | | | | | | | | | | | | | | | | | | | |
| RATIOS/SUPPLEMENTAL DATA: | | | | | | | | | | | | | | | | | | | | | | | | |
| Net assets, end of period (in 000s) | | $ | 822,180 | | | $ | 656,213 | | | $ | 748,122 | | | $ | 737,229 | | | $ | 688,720 | | | $ | 479,121 | |
| | | | | | | | | | | | | | | | | | | | | | | | | |
| Ratio of expenses to average net assets | | | 0.48 | % | | | 0.48 | % | | | 0.48 | %(e) | | | 0.48 | % | | | 0.48 | % | | | 0.48 | % |
| Ratio of net investment income to average net assets | | | 1.56 | % | | | 1.90 | % | | | 2.11 | %(e) | | | 1.78 | % | | | 1.81 | % | | | 2.71 | % |
| Portfolio turnover rate(f) | | | 32 | % | | | 34 | % | | | 25 | % | | | 15 | % | | | 26 | % | | | 64 | %(g) |
| (a) | Effective November 30, 2022, the Board approved changing the fiscal year-end of the Fund from June 30 to November 30. |
| (b) | Based on average shares outstanding during the period. |
| (c) | The net investment income per share excluding the impact of large, non-recurring dividends (special dividends) was $0.67 during the year ended June 30, 2021. |
| (d) | Total return is calculated assuming an initial investment made at the net asset value at the beginning of the year and redemption at the net asset value on the last day of the year and assuming all distributions are reinvested at the reinvestment prices. Total return calculated for a period of less than one year is not annualized. |
| (f) | Portfolio turnover for periods less than one year are not annualized and does not include securities received or delivered from processing creations or redemptions in-kind. |
| (g) | Increase in the Portfolio turnover was a result of the Index change that was effective on June 1, 2020. |
See Notes to the Financial Statements and Financial Highlights.
ALPS | O’Shares U.S. Small-Cap Quality Dividend ETF
| Financial Highlights | For a Share Outstanding Throughout the Periods Presented |
| | | For the Year
Ended
November 30,
2024 | | | For the Year
Ended
November 30,
2023 | | | For the Period
July 1, 2022 to
November 30,
2022(a) | | | For the Year
Ended
June 30, 2022 | | | For the Year
Ended
June 30, 2021 | | | For the Year
Ended
June 30, 2020 | |
| NET ASSET VALUE, BEGINNING OF PERIOD | | $ | 36.27 | | | $ | 35.30 | | | $ | 31.67 | | | $ | 35.08 | | | $ | 24.99 | | | $ | 27.45 | |
| | | | | | | | | | | | | | | | | | | | | | | | | |
| INCOME/(LOSS) FROM OPERATIONS: | | | | | | | | | | | | | | | | | | | | | | | | |
| Net investment income(b) | | | 0.68 | | | | 0.73 | | | | 0.31 | | | | 0.59 | | | | 0.64 | (c) | | | 0.64 | (c) |
| Net realized and unrealized gain/(loss) | | | 10.56 | | | | 0.94 | | | | 3.59 | | | | (3.38 | ) | | | 9.98 | | | | (2.48 | ) |
| Total from investment operations | | | 11.24 | | | | 1.67 | | | | 3.90 | | | | (2.79 | ) | | | 10.62 | | | | (1.84 | ) |
| | | | | | | | | | | | | | | | | | | | | | | | | |
| DISTRIBUTIONS: | | | | | | | | | | | | | | | | | | | | | | | | |
| From net investment income | | | (0.64 | ) | | | (0.70 | ) | | | (0.27 | ) | | | (0.62 | ) | | | (0.53 | ) | | | (0.57 | ) |
| From tax return of capital | | | – | | | | – | | | | – | | | | – | | | | – | | | | (0.05 | ) |
| Total distributions | | | (0.64 | ) | | | (0.70 | ) | | | (0.27 | ) | | | (0.62 | ) | | | (0.53 | ) | | | (0.62 | ) |
| | | | | | | | | | | | | | | | | | | | | | | | | |
| NET INCREASE/(DECREASE) IN NET ASSET VALUE | | | 10.60 | | | | 0.97 | | | | 3.63 | | | | (3.41 | ) | | | 10.09 | | | | (2.46 | ) |
| NET ASSET VALUE, END OF PERIOD | | $ | 46.87 | | | $ | 36.27 | | | $ | 35.30 | | | $ | 31.67 | | | $ | 35.08 | | | $ | 24.99 | |
| TOTAL RETURN(d) | | | 31.17 | % | | | 4.82 | % | | | 12.39 | % | | | (8.12 | )% | | | 42.79 | % | | | (6.82 | )% |
| | | | | | | | | | | | | | | | | | | | | | | | | |
| RATIOS/SUPPLEMENTAL DATA: | | | | | | | | | | | | | | | | | | | | | | | | |
| Net assets, end of period (in 000s) | | $ | 862,650 | | | $ | 391,880 | | | $ | 181,944 | | | $ | 155,318 | | | $ | 149,215 | | | $ | 93,812 | |
| | | | | | | | | | | | | | | | | | | | | | | | | |
| Ratio of expenses to average net assets | | | 0.48 | % | | | 0.48 | % | | | 0.48 | %(e) | | | 0.48 | % | | | 0.48 | % | | | 0.48 | % |
| Ratio of net investment income to average net assets | | | 1.63 | % | | | 2.05 | % | | | 2.28 | %(e) | | | 1.69 | % | | | 2.08 | %(f) | | | 2.38 | %(f) |
| Portfolio turnover rate(g) | | | 37 | % | | | 64 | % | | | 34 | % | | | 34 | % | | | 60 | % | | | 101 | %(h) |
| (a) | Effective November 30, 2022, the Board approved changing the fiscal year-end of the Fund from June 30 to November 30. |
| (b) | Based on average shares outstanding during the period. |
| (c) | The net investment income per share excluding the impact of large, non-recurring dividends (special dividends) was $0.57 during the year ended June 30, 2021 and $0.62 during the year ended June 30, 2020. |
| (d) | Total return is calculated assuming an initial investment made at the net asset value at the beginning of the year and redemption at the net asset value on the last day of the year and assuming all distributions are reinvested at the reinvestment prices. Total return calculated for a period of less than one year is not annualized. |
| (f) | The ratio of net investment income, including waiver/reimbursement and excluding the impact of large, non-recurring dividends (special dividends) was 1.84% during the year ended June 30, 2021 and 2.30% during the year ended June 30, 2020. |
| (g) | Portfolio turnover for periods less than one year are not annualized and does not include securities received or delivered from processing creations or redemptions in-kind. |
| (h) | Increase in the Portfolio turnover was a result of the Index change that was effective on June 1, 2020. |
See Notes to the Financial Statements and Financial Highlights.
ALPS | O’Shares Global Internet Giants ETF
| Financial Highlights | For a Share Outstanding Throughout the Periods Presented |
| | | For the Year
Ended
November 30,
2024 | | | For the Year
Ended
November 30,
2023 | | | For the Period
July 1, 2022 to
November 30,
2022(a) | | | For the Year
Ended
June 30, 2022 | | | For the Year
Ended
June 30, 2021 | | | For the Year
Ended
June 30, 2020 | |
| NET ASSET VALUE, BEGINNING OF PERIOD | | $ | 34.51 | | | $ | 25.11 | | | $ | 27.08 | | | $ | 57.04 | | | $ | 37.85 | | | $ | 25.04 | |
| | | | | | | | | | | | | | | | | | | | | | | | | |
| INCOME/(LOSS) FROM OPERATIONS: | | | | | | | | | | | | | | | | | | | | | | | | |
| Net investment loss(b) | | | (0.08 | ) | | | (0.09 | ) | | | (0.04 | ) | | | (0.15 | ) | | | (0.21 | ) | | | (0.10 | ) |
| Net realized and unrealized gain/(loss) | | | 12.98 | | | | 9.49 | | | | (1.93 | ) | | | (29.81 | ) | | | 19.40 | | | | 12.91 | |
| Total from investment operations | | | 12.90 | | | | 9.40 | | | | (1.97 | ) | | | (29.96 | ) | | | 19.19 | | | | 12.81 | |
| | | | | | | | | | | | | | | | | | | | | | | | | |
| NET INCREASE/(DECREASE) IN NET ASSET VALUE | | | 12.90 | | | | 9.40 | | | | (1.97 | ) | | | (29.96 | ) | | | 19.19 | | | | 12.81 | |
| NET ASSET VALUE, END OF PERIOD | | $ | 47.41 | | | $ | 34.51 | | | $ | 25.11 | | | $ | 27.08 | | | $ | 57.04 | | | $ | 37.85 | |
| TOTAL RETURN(c) | | | 37.38 | % | | | 37.44 | % | | | (7.27 | )% | | | (52.52 | )% | | | 50.70 | % | | | 51.16 | % |
| | | | | | | | | | | | | | | | | | | | | | | | | |
| RATIOS/SUPPLEMENTAL DATA: | | | | | | | | | | | | | | | | | | | | | | | | |
| Net assets, end of period (in 000s) | | $ | 135,110 | | | $ | 136,310 | | | $ | 152,513 | | | $ | 209,867 | | | $ | 718,766 | | | $ | 272,512 | |
| | | | | | | | | | | | | | | | | | | | | | | | | |
| Ratio of expenses to average net assets | | | 0.48 | % | | | 0.48 | % | | | 0.48 | %(d) | | | 0.48 | % | | | 0.48 | % | | | 0.48 | % |
| Ratio of net investment loss to average net assets | | | (0.21 | )% | | | (0.29 | )% | | | (0.37 | )%(d) | | | (0.32 | )% | | | (0.40 | )% | | | (0.34 | )% |
| Portfolio turnover rate(e) | | | 44 | % | | | 51 | % | | | 22 | % | | | 51 | % | | | 48 | % | | | 38 | % |
| (a) | Effective November 30, 2022, the Board approved changing the fiscal year-end of the Fund from June 30 to November 30. |
| (b) | Based on average shares outstanding during the period. |
| (c) | Total return is calculated assuming an initial investment made at the net asset value at the beginning of the year and redemption at the net asset value on the last day of the year and assuming all distributions are reinvested at the reinvestment prices. Total return calculated for a period of less than one year is not annualized. |
| (e) | Portfolio turnover for periods less than one year are not annualized and does not include securities received or delivered from processing creations or redemptions in-kind. |
See Notes to the Financial Statements and Financial Highlights.
ALPS | O’Shares Europe Quality Dividend ETF
| Financial Highlights | For a Share Outstanding Throughout the Periods Presented |
| | | For the Year
Ended
November 30,
2024 | | | For the Year
Ended
November 30,
2023 | | | For the Period
July 1, 2022 to
November 30,
2022(a) | | | For the Year
Ended
June 30, 2022 | | | For the Year
Ended
June 30, 2021 | | | For the Year
Ended
June 30, 2020 | |
| NET ASSET VALUE, BEGINNING OF PERIOD | | $ | 27.48 | | | $ | 24.18 | | | $ | 22.62 | | | $ | 28.00 | | | $ | 22.28 | | | $ | 24.28 | |
| | | | | | | | | | | | | | | | | | | | | | | | | |
| INCOME/(LOSS) FROM OPERATIONS: | | | | | | | | | | | | | | | | | | | | | | | | |
| Net investment income(b) | | | 0.69 | | | | 0.71 | | | | 0.03 | | | | 0.58 | | | | 0.55 | (c) | | | 0.64 | (c) |
| Net realized and unrealized gain/(loss) | | | 2.24 | | | | 3.13 | | | | 1.71 | | | | (5.33 | ) | | | 5.97 | | | | (1.95 | ) |
| Total from investment operations | | | 2.93 | | | | 3.84 | | | | 1.74 | | | | (4.75 | ) | | | 6.52 | | | | (1.31 | ) |
| | | | | | | | | | | | | | | | | | | | | | | | | |
| DISTRIBUTIONS: | | | | | | | | | | | | | | | | | | | | | | | | |
| From net investment income | | | (1.10 | ) | | | (0.54 | ) | | | (0.18 | ) | | | (0.63 | ) | | | (0.80 | ) | | | (0.69 | ) |
| Total distributions | | | (1.10 | ) | | | (0.54 | ) | | | (0.18 | ) | | | (0.63 | ) | | | (0.80 | ) | | | (0.69 | ) |
| | | | | | | | | | | | | | | | | | | | | | | | | |
| NET INCREASE/(DECREASE) IN NET ASSET VALUE | | | 1.83 | | | | 3.30 | | | | 1.56 | | | | (5.38 | ) | | | 5.72 | | | | (2.00 | ) |
| NET ASSET VALUE, END OF PERIOD | | $ | 29.31 | | | $ | 27.48 | | | $ | 24.18 | | | $ | 22.62 | | | $ | 28.00 | | | $ | 22.28 | |
| TOTAL RETURN(d) | | | 10.72 | % | | | 15.99 | % | | | 7.78 | % | | | (17.29 | )% | | | 29.72 | % | | | (5.44 | )% |
| | | | | | | | | | | | | | | | | | | | | | | | | |
| RATIOS/SUPPLEMENTAL DATA: | | | | | | | | | | | | | | | | | | | | | | | | |
| Net assets, end of period (in 000s) | | $ | 35,171 | | | $ | 36,416 | | | $ | 35,664 | | | $ | 40,716 | | | $ | 26,597 | | | $ | 17,821 | |
| | | | | | | | | | | | | | | | | | | | | | | | | |
| Ratio of expenses to average net assets | | | 0.48 | % | | | 0.48 | % | | | 0.48 | %(e) | | | 0.48 | % | | | 0.48 | % | | | 0.48 | % |
| Ratio of net investment income to average net assets | | | 2.30 | % | | | 2.68 | % | | | 0.29 | %(e) | | | 2.20 | % | | | 2.18 | % | | | 2.72 | % |
| Portfolio turnover rate(f) | | | 29 | % | | | 40 | % | | | 38 | % | | | 22 | % | | | 42 | % | | | 72 | %(g) |
| (a) | Effective November 30, 2022, the Board approved changing the fiscal year-end of the Fund from June 30 to November 30. |
| (b) | Based on average shares outstanding during the period. |
| (c) | The net investment income per share excluding the impact of large, non-recurring dividends (special dividends) was $0.54 during the year ended June 30, 2021 and $0.63 during the year ended June 30, 2020. |
| (d) | Total return is calculated assuming an initial investment made at the net asset value at the beginning of the year and redemption at the net asset value on the last day of the year and assuming all distributions are reinvested at the reinvestment prices. Total return calculated for a period of less than one year is not annualized. |
| (f) | Portfolio turnover for periods less than one year are not annualized and does not include securities received or delivered from processing creations or redemptions in-kind. |
| (g) | Increase in the Portfolio turnover was a result of the Index change that was effective on June 1, 2020. |
See Notes to the Financial Statements and Financial Highlights.
ALPS ETF Trust
| Notes to Financial Statements and Financial Highlights | November 30, 2024 |
1. ORGANIZATION
ALPS ETF Trust (the ‘‘Trust’’), a Delaware statutory trust, is an open-end management investment company registered under the Investment Company Act of 1940, as amended (the ‘‘1940 Act’’). As of November 30, 2024, the Trust consisted of twenty-three separate portfolios. Each portfolio represents a separate series of the Trust. This report pertains to the ALPS | O’Shares U.S. Quality Dividend ETF, the ALPS | O’Shares U.S. Small-Cap Quality Dividend ETF, the ALPS | O’Shares Global Internet Giants ETF and the ALPS | O’Shares Europe Quality Dividend ETF (each a “Fund” and collectively, the “Funds”).
The investment objective of the ALPS | O’Shares U.S. Quality Dividend ETF is to seek investment results that track the performance (before fees and expenses) of the O’Shares U.S. Quality Dividend Index. The investment objective of the ALPS | O’Shares U.S. Small-Cap Quality Dividend ETF is to seek investment results that track the performance (before fees and expenses) of the O’Shares U.S. Small-Cap Quality Dividend Index. The investment objective of the ALPS | O’Shares Global Internet Giants ETF is to seek investment results that track the performance (before fees and expenses) of the O’Shares Global Internet Giants Index. The investment objective of the ALPS | O’Shares Europe Quality Dividend ETF is to seek investment results that track the performance (before fees and expenses) of the O’Shares Europe Quality Dividend Index.
ALPS | O’Shares Global Internet Giants ETF is considered non-diversified and may invest a greater portion of assets in securities of individual issuers than a diversified fund. As a result, changes in the market value of a single investment could cause greater fluctuations in share price than would occur in a diversified fund. ALPS | O’Shares U.S. Quality Dividend ETF, ALPS | O’Shares U.S. Small-Cap Quality Dividend ETF and ALPS | O’Shares Europe Quality Dividend ETF have each elected to qualify as a diversified series of the Trust under the 1940 Act.
Each Fund’s Shares (“Shares”) are listed on the Cboe BZX Exchange, Inc. (the “Cboe BZX”). Each Fund issues and redeems Shares, at net asset value (“NAV”) in blocks of 25,000 Shares, each of which is called a “Creation Unit”. Creation Units are issued and redeemed principally in-kind for securities included in the Underlying Index. Except when aggregated in Creation Units, Shares are not redeemable securities of the Fund.
Pursuant to the Trust’s organizational documents, its Officers and Trustees are indemnified against certain liability arising out of the performance of their duties to the Trust. Additionally, in the normal course of business, the Trust enters into contracts with service providers that contain general indemnification clauses. The Trust’s maximum exposure under these arrangements is unknown, as this would involve future claims that may be made against the Trust that have not yet occurred.
2. SIGNIFICANT ACCOUNTING POLICIES
The following is a summary of significant accounting policies consistently followed by the Funds in the preparation of the financial statements. The accompanying financial statements were prepared in accordance with accounting principles generally accepted in the United States of America (“U.S. GAAP”). The preparation of financial statements in conformity with U.S. GAAP requires management to make certain estimates and assumptions that affect the reported amounts of assets and liabilities and disclosures of contingent assets and liabilities at the date of the financial statements and the reported amounts of revenue and expenses during the period. Actual results could differ from those estimates. Each Fund is considered an investment company under U.S. GAAP and follows the accounting and reporting guidance applicable to investment companies in the Financial Accounting Standards Board (“FASB”) Accounting Standards Codification Topic 946.
A. Portfolio Valuation
Each Fund’s NAV is determined daily, as of the close of regular trading on the New York Stock Exchange (the “NYSE”), normally 4:00 p.m. Eastern Time, on each day the NYSE is open for trading. The NAV is computed by dividing the value of all assets of each Fund (including accrued interest and dividends), less all liabilities (including accrued expenses and dividends declared but unpaid), by the total number of shares outstanding.
Portfolio securities listed on any exchange other than the NASDAQ Stock Market LLC (“NASDAQ”) are valued at the last sale price on the business day as of which such value is being determined. If there has been no sale on such day, the securities are valued at the mean of the most recent bid and ask prices on such day. Securities traded on the NASDAQ are valued at the NASDAQ Official Closing Price as determined by NASDAQ. Portfolio securities traded on more than one securities exchange are valued at the last sale price on the business day as of which such value is being determined at the close of the exchange representing the principal market for such securities. Portfolio securities traded in the over-the-counter market, but excluding securities traded on the NASDAQ, are valued at the last quoted sale price in such market.
The Funds’ investments are valued at market value or, in the absence of market value with respect to any portfolio securities, at fair value according to procedures adopted by the Trust’s Board. Pursuant to Rule 2a-5 under the 1940 Act, the Board designated ALPS Advisors, Inc. (the "Adviser") as the valuation designee ("Valuation Designee") for each Fund to perform the fair value determinations relating to Fund investments. The Adviser may carry out its designated responsibilities as Valuation Designee through various teams and committees. When market quotations are not readily available or when events occur that make established valuation methods unreliable, securities of the Funds may be valued in good faith by the Valuation Designee. These securities generally include, but are not limited to, restricted securities (securities which may not be publicly sold without registration under the Securities Act of 1933) for which a pricing service is unable to provide a market price; securities whose trading has been formally suspended; a security whose market price is not available from a pre-established primary pricing source or the pricing source is not willing to provide a price; a security with respect to which an event has occurred that is most likely to materially affect the value of the security after the market has closed but before the calculation of a Fund’s NAV or make it difficult or impossible to obtain a reliable market quotation; or a security whose price, as provided by the pricing service, does not reflect the security’s “fair value” due to the security being de-listed from a national exchange or the security’s primary trading market is temporarily closed at a time when, under normal conditions, it would be open. As a general principle, the current “fair value” of a security would be the amount which the owner might reasonably expect to receive from the sale on the applicable exchange or principal market. A variety of factors may be considered in determining the fair value of such securities.
ALPS ETF Trust
| Notes to Financial Statements and Financial Highlights | November 30, 2024 |
B. Fair Value Measurements
Each Fund discloses the classification of its fair value measurements following a three-tier hierarchy based on the inputs used to measure fair value. Inputs refer broadly to the assumptions that market participants would use in pricing the asset or liability, including assumptions about risk. Inputs may be observable or unobservable. Observable inputs reflect the assumptions market participants would use in pricing the asset or liability that are developed based on market data obtained from sources independent of the reporting entity. Unobservable inputs reflect the reporting entity’s own assumptions about the assumptions market participants would use in pricing the asset or liability that are developed based on the best information available.
Valuation techniques used to value the Funds’ investments by major category are as follows:
Equity securities, including restricted securities, for which market quotations are readily available, are valued at the last reported sale price or official closing price as reported by a third party pricing vendor on the primary market or exchange on which they are traded and are categorized as Level 1 in the hierarchy. In the event there were no sales during the day or closing prices are not available, securities are valued at the mean of the most recent quoted bid and ask prices on such day and are generally categorized as Level 2 in the hierarchy. Investments in open-end mutual funds are valued at their closing NAV each business day and are categorized as Level 1 in the hierarchy.
Changes in valuation techniques may result in transfers in or out of an assigned level within the disclosure hierarchy.
Various inputs are used in determining the value of each Fund’s investments as of the end of the reporting period. When inputs used fall into different levels of the fair value hierarchy, the level in the hierarchy within which the fair value measurement falls is determined based on the lowest level input that is significant to the fair value measurement in its entirety. The designated input levels are not necessarily an indication of the risk or liquidity associated with these investments.
These inputs are categorized in the following hierarchy under applicable financial accounting standards:
| Level 1 – | Unadjusted quoted prices in active markets for identical investments, unrestricted assets or liabilities that a Fund has the ability to access at the measurement date; |
| Level 2 – | Quoted prices which are not active, quoted prices for similar assets or liabilities in active markets or inputs other than quoted prices that are observable (either directly or indirectly) for substantially the full term of the asset or liability; and |
| Level 3 – | Significant unobservable prices or inputs (including the Fund’s own assumptions in determining the fair value of investments) where there is little or no market activity for the asset or liability at the measurement date. |
ALPS ETF Trust
| Notes to Financial Statements and Financial Highlights | November 30, 2024 |
The following is a summary of the inputs used to value the Funds’ investments as of November 30, 2024:
ALPS | O'Shares U.S. Quality Dividend ETF
| Investments in Securities at Value | | Level 1 - Quoted and
Unadjusted Prices | | | Level 2 - Other Significant
Observable Inputs | | | Level 3 - Significant
Unobservable Inputs | | | Total | |
| Common Stocks* | | $ | 821,274,092 | | | $ | – | | | $ | – | | | $ | 821,274,092 | |
| Short Term Investments | | | 107,007 | | | | – | | | | – | | | | 107,007 | |
| Total | | $ | 821,381,099 | | | $ | – | | | $ | – | | | $ | 821,381,099 | |
ALPS | O'Shares U.S. Small-Cap Quality Dividend ETF
| Investments in Securities at Value | | Level 1 - Quoted and
Unadjusted Prices | | | Level 2 - Other Significant
Observable Inputs | | | Level 3 – Significant
Unobservable Inputs | | | Total | |
| Common Stocks* | | $ | 861,209,205 | | | $ | – | | | $ | – | | | $ | 861,209,205 | |
| Short Term Investments | | | 8,104,042 | | | | – | | | | – | | | | 8,104,042 | |
| Total | | $ | 869,313,247 | | | $ | – | | | $ | – | | | $ | 869,313,247 | |
ALPS | O'Shares Global Internet Giants ETF
| Investments in Securities at Value | | Level 1 - Quoted and
Unadjusted Prices | | | Level 2 - Other Significant
Observable Inputs | | | Level 3 - Significant
Unobservable Inputs | | | Total | |
| Common Stocks* | | $ | 135,147,658 | | | $ | – | | | $ | – | | | $ | 135,147,658 | |
| Short Term Investments | | | 2,171,758 | | | | – | | | | – | | | | 2,171,758 | |
| Total | | $ | 137,319,416 | | | $ | – | | | $ | – | | | $ | 137,319,416 | |
ALPS | O'Shares Europe Quality Dividend ETF
| Investments in Securities at Value | | Level 1 - Quoted and
Unadjusted Prices | | | Level 2 - Other Significant
Observable Inputs | | | Level 3 - Significant
Unobservable Inputs | | | Total | |
| Common Stocks* | | $ | 34,857,943 | | | $ | – | | | $ | – | | | $ | 34,857,943 | |
| Short Term Investments | | | 1,175,302 | | | | – | | | | – | | | | 1,175,302 | |
| Total | | $ | 36,033,245 | | | $ | – | | | $ | – | | | $ | 36,033,245 | |
| * | For a detailed sector breakdown, see the accompanying Schedule of Investments. |
The Funds did not have any securities that used significant unobservable inputs (Level 3) in determining fair value and there were no transfers into or out of Level 3 during the year ended November 30, 2024.
C. Foreign Investment Risk
The ALPS | O’Shares Global Internet Giants ETF and the ALPS | O’Shares Europe Quality Dividend ETF may directly purchase securities of foreign issuers. Investments in non-U.S. issuers may involve unique risks compared to investing in securities of U.S. issuers, including, among others, less liquidity generally, greater market volatility than U.S. securities and less complete financial information and less stringent accounting, corporate governance and financial reporting standards than for U.S. issuers. In addition, adverse political, economic, social, regulatory, business or environmental developments could undermine the value of a Fund’s investments or prevent a Fund from realizing the full value of its investments. For example, the rights and remedies associated with investments in foreign securities may be different than investments in domestic securities. Financial reporting standards for companies based in foreign markets differ from those in the United States. Finally, the value of the currency of the country in which a Fund has invested could decline relative to the value of the U.S. dollar, which may affect the value of the investment to U.S. investors.
Countries with emerging markets may have relatively unstable governments and may present the risks of nationalization of businesses, restrictions on foreign ownership and prohibitions on the repatriation of assets. The economies of emerging markets countries also may be based on only a few industries, making them more vulnerable to changes in local or global trade conditions and more sensitive to debt burdens, inflation rates or adverse news and events.
Because foreign markets may be open on different days than the days during which investors may purchase the shares of each Fund, the value of each Fund's securities may change on the days when investors are not able to purchase the shares of the Funds. The value of securities denominated in foreign currencies is converted into U.S. dollars using exchange rates determined daily as of the close of regular trading on the NYSE or NASDAQ. Any use of a different rate from the rates used by the Index may adversely affect a Fund's ability to track its Index.
ALPS ETF Trust
| Notes to Financial Statements and Financial Highlights | November 30, 2024 |
D. Foreign Currency Translation
The books and records of the Funds are maintained in U.S. dollars. Investment valuations and other assets and liabilities initially expressed in foreign currencies are converted each business day into U.S. dollars based upon current exchange rates. The portion of realized and unrealized gains or losses on investments due to fluctuations in foreign currency exchange rates is not separately disclosed and is included in realized and unrealized gains or losses on investments, when applicable.
E. Securities Transactions and Investment Income
Securities transactions are recorded as of the trade date. Realized gains and losses from securities transactions are recorded on the specific identification in accordance with GAAP. Dividend income and capital gains distributions, if any, are recorded on the ex-dividend date, net of any foreign taxes withheld. Non-cash dividends, if any, are recorded at the fair market value of the asset received. Interest income, if any, is recorded on the accrual basis, including amortization of premiums and accretion of discounts. Income received from foreign sources may result in withholding tax. Withholding taxes are accrued at the same time as the related income if the tax rate is fixed and known, unless a tax withheld is reclaimable from the local tax authorities in which case it is recorded as receivable. If the tax rate is not known or estimable, such expense or reclaim receivable is recorded when the net proceeds are received.
F. Dividends and Distributions to Shareholders
Dividends from net investment income, if any, are declared and paid monthly, except for ALPS | O’Shares Europe Quality Dividend ETF, which declares and pays dividends from net investment income quarterly. Distributions of net realized capital gains earned by the Funds, if any, are distributed at least annually.
G. Federal Tax and Tax Basis Information
The timing and character of income and capital gain distributions are determined in accordance with income tax regulations, which may differ from U.S. GAAP. Reclassifications are made to the Funds’ capital accounts for permanent tax differences to reflect income and gains and net operating losses available for distribution (or available capital loss carryforwards) under income tax regulations.
For the fiscal year ended November 30, 2024, the following reclassifications, which had no impact on results of operations or net assets, were recorded to reflect permanent tax differences resulting primarily from in-kind transactions and net operating losses:
| | | Pain-in Capital | | | Total Distributable Earnings | |
| ALPS | O’Shares U.S. Quality Dividend ETF | | $ | 57,239,133 | | | $ | (57,239,133 | ) |
| ALPS | O’Shares U.S. Small-Cap Quality Dividend ETF | | | 55,704,378 | | | | (55,704,378 | ) |
| ALPS | O’Shares Global Internet Giants ETF | | | 12,967,929 | | | | (12,967,929 | ) |
| ALPS | O’Shares Europe Quality Dividend ETF | | | 1,259,664 | | | | (1,259,664 | ) |
The tax character of the distributions paid for the fiscal year ended November 30, 2024 and fiscal year ended November 30, 2023 were as follows:
| | | Ordinary Income | | | Long-Term Capital Gain | | | Return of Capital | |
| November 30, 2024 | | | | | | | | | | | | |
| ALPS | O'Shares U.S. Quality Dividend ETF | | $ | 12,150,470 | | | $ | – | | | $ | – | |
| ALPS | O'Shares U.S. Small-Cap Quality Dividend ETF | | | 9,548,300 | | | | – | | | | – | |
| ALPS | O'Shares Global Internet Giants ETF | | | – | | | | – | | | | – | |
| ALPS | O'Shares Europe Quality Dividend ETF | | | 1,395,572 | | | | – | | | | – | |
| | | Ordinary Income | | | Long-Term Capital Gain | | | Return of Capital | |
| November 30, 2023 | | | | | | | | | | | | |
| ALPS | O'Shares U.S. Quality Dividend ETF | | $ | 13,050,503 | | | $ | – | | | $ | – | |
| ALPS | O'Shares U.S. Small-Cap Quality Dividend ETF | | | 5,299,690 | | | | – | | | | – | |
| ALPS | O'Shares Global Internet Giants ETF | | | – | | | | – | | | | – | |
| ALPS | O'Shares Europe Quality Dividend ETF | | | 795,232 | | | | – | | | | – | |
The character of distributions made during the period may differ from its ultimate characterization for federal income tax purposes.
ALPS ETF Trust
| Notes to Financial Statements and Financial Highlights | November 30, 2024 |
As of November 30, 2024, the components of distributable earnings on a tax basis for each Fund were as follows:
| Fund | | Accumulated net
investment
income | | | Accumulated net
realized gain/(loss)
on investments | | | Other
accumulated gain/(loss) | | | Net unrealized
appreciation/(depreciation)
on investments | | | Total | |
| ALPS | O'Shares U.S. Quality Dividend ETF | | $ | - | | | $ | (34,246,728 | ) | | $ | - | | | $ | 170,063,900 | | | $ | 135,817,172 | |
| ALPS | O'Shares U.S. Small-Cap Quality Dividend ETF | | | 517,961 | | | | (12,742,236 | ) | | | - | | | | 112,759,510 | | | | 100,535,235 | |
| ALPS | O'Shares Global Internet Giants ETF | | | - | | | | (201,143,734 | ) | | | (238,172 | ) | | | 39,147,372 | | | | (162,234,534 | ) |
| ALPS | O'Shares Europe Quality Dividend ETF | | | 786,055 | | | | (9,763,342 | ) | | | - | | | | 1,778,252 | | | | (7,199,035 | ) |
Under current law, capital losses maintain their character as short-term or long-term and are carried forward to the next tax year without expiration.
As of November 30, 2024, the following amounts are available as carry forwards to the next tax year:
| Fund | | Short-Term | | | Long-Term | |
| ALPS | O'Shares U.S. Quality Dividend ETF | | $ | 7,724,349 | | | $ | 26,522,379 | |
| ALPS | O'Shares U.S. Small-Cap Quality Dividend ETF | | | 2,710,472 | | | | 10,031,764 | |
| ALPS | O'Shares Global Internet Giants ETF | | | 94,448,378 | | | | 106,695,356 | |
| ALPS | O'Shares Europe Quality Dividend ETF | | | 2,521,082 | | | | 7,242,260 | |
The ALPS O’Shares Global Internet Giants ETF elects to defer to the period ending November 30, 2025, late year ordinary losses in the amount of $238,172.
The ALPS O’Shares U.S. Quality Dividend ETF used capital loss carryovers during the year ended November 30, 2024, in the amount of $24,221,595.
The ALPS O’Shares Europe Quality Dividend ETF used capital loss carryovers during the year ended November 30, 2024, in the amount of 1,062,187.
As of November 30, 2024, the cost of investments for federal income tax purposes and accumulated net unrealized appreciation/(depreciation) on investments were as follows:
| | | ALPS | O'Shares U.S.
Quality Dividend ETF | | | ALPS | O'Shares U.S.
Small-Cap Quality
Dividend ETF | | | ALPS | O'Shares Global
Internet Giants ETF | | | ALPS | O'Shares Europe
Quality Dividend ETF | |
| Gross appreciation (excess of value over tax cost) | | $ | 181,164,450 | | | $ | 130,933,283 | | | $ | 41,731,535 | | | $ | 5,010,732 | |
| Gross depreciation (excess of tax cost over value) | | | (11,100,550 | ) | | | (18,173,773 | ) | | | (2,583,919 | ) | | | (3,229,664 | ) |
| Net depreciation of foreign currency | | | – | | | | – | | | | (244 | ) | | | (2,816 | ) |
| Net unrealized appreciation (depreciation) | | $ | 170,063,900 | | | $ | 112,759,510 | | | $ | 39,147,372 | | | $ | 1,778,252 | |
| Cost of investments for income tax purposes | | $ | 651,317,199 | | | $ | 756,553,737 | | | $ | 98,171,800 | | | $ | 34,252,177 | |
The differences between book-basis and tax basis are primarily due to the deferral of losses from wash sales and investments in Passive Foreign Investment Companies (PFICs).
H. Income Taxes
No provision for income taxes is included in the accompanying financial statements, as each Fund intends to distribute to shareholders all taxable investment income and realized gains and otherwise comply with Subchapter M of the Internal Revenue Code of 1986, as amended, applicable to regulated investment companies. Each Fund evaluates tax positions taken (or expected to be taken) in the course of preparing the Funds’ tax returns to determine whether these positions meet a “more-likely-than-not” standard that, based on the technical merits, have a more than fifty percent likelihood of being sustained by a taxing authority upon examination. A tax position that meets the “more-likely-than-not” recognition threshold is measured to determine the amount of benefit to recognize in the financial statements.
As of and during the year ended November 30, 2024, each Fund did not have a liability for any unrecognized tax benefits. Each Fund files U.S. federal, state, and local tax returns as required. Each Fund’s tax returns are subject to examination by the relevant tax authorities until expiration of the applicable statute of limitations, which is generally three years after the filing of the tax return, but may extend to four years in certain jurisdictions. Each Fund’s tax returns for open years have incorporated no uncertain tax positions that require a provision for income taxes.
ALPS ETF Trust
| Notes to Financial Statements and Financial Highlights | November 30, 2024 |
I. Lending of Portfolio Securities
Effective June 20, 2022, the Funds have entered into a securities lending agreement with State Street Bank & Trust Co. (“SSB”), the Funds’ lending agent. Each Fund may lend its portfolio securities only to borrowers that are approved by SSB. Each Fund will limit such lending to not more than 33 1/3% of the value of its total assets. The Funds' securities held at SSB as custodian shall be available to be lent except those securities the Funds or ALPS Advisors, Inc. specifically identifies in writing as not being available for lending. The borrower pledges and maintains with the Funds collateral consisting of cash (U.S. Dollars only), securities issued or guaranteed by the U.S. government or its agencies or instrumentalities, and cash equivalents (including irrevocable bank letters of credit) issued by a person other than the borrower or an affiliate of the borrower. The initial collateral received by the Fund is required to have a value of no less than 102% of the market value of the loaned securities for U.S equity securities and a value of no less than 105% of the market value for non-U.S. equity securities. The collateral is maintained thereafter, at a market value equal to not less than 102% of the current value of the U.S. equity securities on loan and not less than 105% of the current value of the non-U.S. equity securities on loan. The market value of the loaned securities is determined at the close of each business day and any additional required collateral is delivered to the Fund on the next business day. During the term of the loan, each Fund is entitled to all distributions made on or in respect of the loaned securities. Loans of securities are terminable at any time and the borrower, after notice, is required to return borrowed securities within the customary time period for settlement of securities transactions.
Any cash collateral received is reinvested in a money market fund managed by SSB as disclosed in the Fund’s Schedule of Investments and is reflected in the Statements of Assets and Liabilities as a payable for collateral upon return of securities loaned. Non-cash collateral, in the form of securities issued or guaranteed by the U.S. government or its agencies or instrumentalities, is not disclosed in the Funds' Statements of Assets and Liabilities or the contractual maturity table below as it is held by the lending agent on behalf of the Funds, and the Funds do not have the ability to re-hypothecate these securities. Income earned by the Fund from securities lending activity is disclosed in the Statement of Operations.
The following is a summary of the Funds' securities lending agreement and related cash and non-cash collateral received as of November 30, 2024:
| Fund | | Market Value of
Securities on Loan | | | Cash Collateral
Received | | | Non-Cash Collateral
Received | | | Total Collateral
Received | |
| ALPS | O'Shares U.S. Small-Cap Quality Dividend ETF | | $ | 8,453,697 | | | $ | 7,925,782 | | | $ | 733,549 | | | $ | 8,659,331 | |
| ALPS | O'Shares Global Internet Giants ETF | | | 2,091,429 | | | | 2,171,758 | | | | – | | | | 2,171,758 | |
| ALPS | O'Shares Europe Quality Dividend ETF | | | 1,087,807 | | | | 1,134,444 | | | | – | | | | 1,134,444 | |
The risks of securities lending include the risk that the borrower may not provide additional collateral when required or may not return the securities when due. To mitigate these risks, the Funds benefit from a borrower default indemnity provided by SSB. SSB’s indemnity allows for full replacement of securities lent wherein SSB will purchase the unreturned loaned securities on the open market by applying the proceeds of the collateral, or to the extent such proceeds are insufficient or the collateral is unavailable, SSB will purchase the unreturned loan securities at SSB’s expense. However, the Funds could suffer a loss if the value of the investments purchased with cash collateral falls below the value of the cash collateral received.
The following table reflects a breakdown of transactions accounted for as secured borrowings, the gross obligation by the type of collateral pledged or securities loaned, and the remaining contractual maturity of those transactions as of November 30, 2024:
| ALPS | O'Shares U.S. Small-Cap Quality Dividend ETF | | Remaining contractual maturity of the agreements | | | | |
| Securities Lending Transactions | | Overnight &
Continuous | | | Up to 30 Days | | | 30-90 Days | | | Greater than
90 Days | | | Total | |
| Common Stocks | | $ | 7,925,782 | | | $ | – | | | $ | – | | | $ | – | | | $ | 7,925,782 | |
| Total Borrowings | | | | | | | | | | | | | | | | | | | 7,925,782 | |
| Gross amount of recognized liabilities for securities lending (collateral received) | | | $ | 7,925,782 | |
| ALPS | O'Shares Global Internet Giants ETF | | | Remaining contractual maturity of the agreements | | | | |
| Securities Lending Transactions | | Overnight &
Continuous | | | Up to 30 Days | | | 30-90 Days | | | Greater than
90 Days | | | Total | |
| Common Stocks | | $ | 2,171,758 | | | $ | – | | | $ | – | | | $ | – | | | $ | 2,171,758 | |
| Total Borrowings | | | | | | | | | | | | | | | | | | | 2,171,758 | |
| Gross amount of recognized liabilities for securities lending (collateral received) | | | $ | 2,171,758 | |
ALPS ETF Trust
| Notes to Financial Statements and Financial Highlights | November 30, 2024 |
| ALPS | O'Shares Europe Quality Dividend ETF | | Remaining contractual maturity of the agreements | | | | |
| Securities Lending Transactions | | Overnight &
Continuous | | | Up to 30 Days | | | 30-90 Days | | | Greater than
90 Days | | | Total | |
| Common Stocks | | $ | 1,134,444 | | | $ | – | | | $ | – | | | $ | – | | | $ | 1,134,444 | |
| Total Borrowings | | | | | | | | | | | | | | | | | | | 1,134,444 | |
| Gross amount of recognized liabilities for securities lending (collateral received) | | | $ | 1,134,444 | |
3. INVESTMENT ADVISORY FEE AND OTHER AFFILIATED TRANSACTIONS
ALPS Advisors, Inc. serves as the Funds’ investment adviser pursuant to an Investment Advisory Agreement with the Trust on behalf of each Fund (the “Advisory Agreement”). Pursuant to the Advisory Agreement, each Fund pays the Adviser an annual management fee for the services and facilities it provides, payable on a monthly basis as a percentage of the relevant Fund’s average daily net assets as set out below. From time to time, the Adviser may waive all or a portion of its fee.
| Fund | Advisory Fee | |
| ALPS | O’Shares U.S. Quality Dividend ETF | Average net assets up to and including $2 billion | 0.48% |
| | Average net assets greater than $2 billion up to and including $3 billion | 0.44% |
| | Average net assets greater than $3 billion up to and including $4 billion | 0.40% |
| | Average net assets greater than $4 billion up to and including $5 billion | 0.36% |
| | Average net assets greater than $5 billion | 0.32% |
| ALPS | O’Shares U.S. Small-Cap Quality Dividend ETF | Average net assets up to and including $2 billion | 0.48% |
| | Average net assets greater than $2 billion up to and including $3 billion | 0.44% |
| | Average net assets greater than $3 billion up to and including $4 billion | 0.40% |
| | Average net assets greater than $4 billion up to and including $5 billion | 0.36% |
| | Average net assets greater than $5 billion | 0.32% |
| ALPS | O’Shares Global Internet Giants ETF | | 0.48% |
| ALPS | O’Shares Europe Quality Dividend ETF | | 0.48% |
Out of the unitary management fee, the Adviser pays substantially all expenses of each Fund, including licensing fees to the Underlying Index provider, the cost of transfer agency, custody, fund administration, legal, audit, trustees and other services, except for interest expenses, distribution fees or expenses, brokerage expenses, taxes and extraordinary expenses not incurred in the ordinary course of each Fund’s business. The Adviser’s unitary management fee is designed to pay substantially all of each Fund’s expenses and to compensate the Adviser for providing services for each Fund.
ALPS Fund Services, Inc., an affiliate of the Adviser, is the administrator of the Funds.
Each Trustee receives (1) a quarterly retainer of $25,000, (2) a per meeting fee of $15,000, (3) $2,500 for any special meeting held outside of a regularly scheduled board meeting, and (4) reimbursement for all reasonable out-of-pocket expenses relating to attendance at meetings. In addition, the Chairman of the Board receives a quarterly retainer of $5,000, the Chairman of the Audit Committee receives a quarterly retainer of $3,000, and the Chairman of the Nominating & Governance Committee receives a quarterly retainer of $2,000, each in connection with their respective roles.
ALPS ETF Trust
| Notes to Financial Statements and Financial Highlights | November 30, 2024 |
4. PURCHASES AND SALES OF SECURITIES
For the fiscal year ended November 30, 2024, the cost of purchases and proceeds from sales of investment securities, excluding short-term investments and in-kind transactions, were as follows:
| Fund | | Purchases | | | Sales | |
| ALPS | O'Shares U.S. Quality Dividend ETF | | $ | 238,113,282 | | | $ | 237,459,145 | |
| ALPS | O'Shares U.S. Small-Cap Quality Dividend ETF | | | 234,316,066 | | | | 226,448,353 | |
| ALPS | O'Shares Global Internet Giants ETF | | | 58,740,907 | | | | 60,032,959 | |
| ALPS | O'Shares Europe Quality Dividend ETF | | | 11,017,120 | | | | 11,412,423 | |
For the fiscal year ended November 30, 2024, the cost of in-kind purchases and proceeds from in-kind sales were as follows:
| Fund | | Purchases | | | Sales | |
| ALPS | O'Shares U.S. Quality Dividend ETF | | $ | 131,264,190 | | | $ | 133,780,095 | |
| ALPS | O'Shares U.S. Small-Cap Quality Dividend ETF | | | 497,299,980 | | | | 180,263,746 | |
| ALPS | O'Shares Global Internet Giants ETF | | | 11,313,856 | | | | 53,550,551 | |
| ALPS | O'Shares Europe Quality Dividend ETF | | | 3,687,194 | | | | 7,349,010 | |
For the fiscal year ended November 30, 2024, the in-kind net realized gains/(losses) were as follows:
| Fund | | Net Realized Gain/(Loss) | |
| ALPS | O'Shares U.S. Quality Dividend ETF | | $ | 57,238,969 | |
| ALPS | O'Shares U.S. Small-Cap Quality Dividend ETF | | | 55,690,200 | |
| ALPS | O'Shares Global Internet Giants ETF | | | 13,649,281 | |
| ALPS | O'Shares Europe Quality Dividend ETF | | | 1,360,625 | |
Gains on in-kind transactions are not considered taxable for federal income tax purposes and losses on in-kind transactions are also not deductible for tax purposes.
5. CAPITAL SHARE TRANSACTIONS
Shares are created and redeemed by each Fund only in Creation Unit size aggregations of 25,000 Shares. Only broker-dealers or large institutional investors with creation and redemption agreements called Authorized Participants (“AP”) are permitted to purchase or redeem Creation Units from the Funds. Such transactions are generally permitted on an in-kind basis, with a balancing cash component to equate the transaction to the NAV per unit of each Fund on the transaction date. Cash may be substituted equivalent to the value of certain securities generally when they are not available in sufficient quantity for delivery, not eligible for trading by the AP or as a result of other market circumstances.
6. RELATED PARTY TRANSACTIONS
The ALPS | O'Shares U.S. Quality Dividend ETF and ALPS | O'Shares Europe Quality Dividend ETF engaged in cross trades between other funds in the Trust during the year ended November 30, 2024 pursuant to Rule 17a-7 under the 1940 Act. Cross trading is the buying or selling of portfolio securities between funds to which the Adviser serves as the investment adviser. The Board previously adopted procedures that apply to transactions between the Funds of the Trust pursuant to Rule 17a-7. These transactions related to cross trades during the period complied with the requirements set forth by Rule 17a-7 and the Trust’s procedures.
Transactions related to cross trades during the year ended November 30, 2024, were as follows:
| | | Purchase cost paid | | | Sale proceeds received | | | Realized gain/(loss) on sales | |
| ALPS | O'Shares U.S. Quality Dividend ETF | | $ | 8,822,097 | | | $ | 1,373,622 | | | $ | (300,400 | ) |
| ALPS | O'Shares Europe Quality Dividend ETF | | | – | | | | 711,146 | | | | (127,825 | ) |
ALPS ETF Trust
| Notes to Financial Statements and Financial Highlights | November 30, 2024 |
7. MARKET RISK
The Funds are subject to investment and operational risks associated with financial, economic and other global market developments and disruptions, including those arising from war, terrorism, market manipulation, government interventions, defaults and shutdowns, political changes or diplomatic developments, public health emergencies (such as the spread of infectious diseases, pandemics and epidemics) and natural/environmental disasters, which can negatively impact the securities markets and cause each Fund to lose value. Securities in each Fund’s portfolio may underperform in comparison to securities in general financial markets, a particular financial market or other asset classes due to a number of factors, including inflation (or expectations for inflation), deflation (or expectations for deflation), interest rates, global demand for particular products or resources, market instability, debt crises and downgrades, embargoes, tariffs, sanctions and other trade barriers, regulatory events, other governmental trade or market control programs and related geopolitical events. In addition, the value of each Fund’s investments may be negatively affected by the occurrence of global events such as war, terrorism, environmental disasters, natural disasters or events, country instability, and infectious disease epidemics or pandemics.
8. SUBSEQUENT EVENTS
Subsequent events, if any, after the date of the Statements of Assets and Liabilities have been evaluated through the date the financial statements were issued. Management has determined that there were no subsequent events to report through the issuance of these financial statements.
ALPS ETF Trust
Report of Independent Registered Public Accounting Firm
To the Shareholders of ALPS | O’Shares U.S. Quality Dividend ETF, ALPS | O’Shares U.S. Small-Cap Quality Dividend ETF, ALPS | O’Shares Global Internet Giants ETF and ALPS | O’Shares Europe Quality Dividend ETF and Board of Trustees of ALPS ETF Trust
Opinion on the Financial Statements
We have audited the accompanying statements of assets and liabilities, including the schedules of investments, of ALPS | O’Shares U.S. Quality Dividend ETF, ALPS | O’Shares U.S. Small-Cap Quality Dividend ETF, ALPS | O’Shares Global Internet Giants ETF and ALPS | O’Shares Europe Quality Dividend ETF (the “Funds”), each a series of ALPS ETF Trust, as of November 30, 2024, the related statements of operations for the year then ended, the statements of changes in net assets and financial highlights for each of the two years in the period then ended, and the related notes (collectively referred to as the “financial statements”). In our opinion, the financial statements present fairly, in all material respects, the financial position of each of the Funds as of November 30, 2024, the results of their operations for the year then ended, and the changes in net assets and financial highlights for each of the two years in the period then ended, in conformity with accounting principles generally accepted in the United States of America.
The Funds’ financial highlights for the years ended November 30, 2022, and prior, were audited by other auditors whose report dated January 27, 2023, expressed an unqualified opinion on those financial highlights.
Basis for Opinion
These financial statements are the responsibility of the Funds’ management. Our responsibility is to express an opinion on the Funds’ financial statements based on our audits. We are a public accounting firm registered with the Public Company Accounting Oversight Board (United States) (“PCAOB”) and are required to be independent with respect to the Funds in accordance with the U.S. federal securities laws and the applicable rules and regulations of the Securities and Exchange Commission and the PCAOB.
We conducted our audits in accordance with the standards of the PCAOB. Those standards require that we plan and perform the audit to obtain reasonable assurance about whether the financial statements are free of material misstatement whether due to error or fraud.
Our audits included performing procedures to assess the risks of material misstatement of the financial statements, whether due to error or fraud, and performing procedures that respond to those risks. Such procedures included examining, on a test basis, evidence regarding the amounts and disclosures in the financial statements. Our procedures included confirmation of securities owned as of November 30, 2024, by correspondence with the custodian and brokers; when replies were not received from brokers, we performed other auditing procedures. Our audits also included evaluating the accounting principles used and significant estimates made by management, as well as evaluating the overall presentation of the financial statements. We believe that our audits provide a reasonable basis for our opinion.
We have served as the auditor of one or more investment companies advised by ALPS Advisors, Inc. since 2013.

COHEN & COMPANY, LTD.
Philadelphia, Pennsylvania
January 29, 2025
ALPS ETF Trust
| Additional Information | November 30, 2024 (Unaudited) |
TAX INFORMATION
The Funds designate the following as a percentage of taxable ordinary income distributions, or up to the maximum amount allowable, for the calendar year ended December 31, 2023:
| | Qualified Dividend Income | Dividend Received Deduction |
| ALPS | O’Shares U.S. Quality Dividend ETF | 100% | 100% |
| ALPS | O’Shares U.S. Small-Cap Quality Dividend ETF | 100% | 100% |
| ALPS | O’Shares Global Internet Giants ETF | 0% | 0% |
| ALPS | O’Shares Europe Quality Dividend ETF | 100% | 0% |
In early 2024, if applicable, shareholders of record received this information for the distributions paid to them by the Funds during the calendar year 2023 via Form 1099. The Funds will notify shareholders in early 2025 of amounts paid to them by the Funds, if any, during the calendar year 2024.
LICENSING AGREEMENTS
O’Shares Investment Advisers, LLC ( “O’Shares”) has entered into an index licensing agreement with ALPS Advisors Inc. (the “Adviser”) with respect to each of ALPS | O’Shares U.S. Quality Dividend ETF, ALPS | O’Shares U.S. Small-Cap Quality Dividend ETF, ALPS | O’Shares Global Internet Giants ETF, and ALPS | O’Shares Europe Quality Dividend ETF (each, a “Fund”), to allow the Adviser’s use of the O'Shares U.S. Quality Dividend Index, the O'Shares U.S. Small-Cap Quality Dividend Index, the O'Shares Global Internet Giants Index, and the O'Shares Europe Quality Dividend Index (each, an “Underlying Index”). The following disclosure relates to O’Shares.
The Funds are not sponsored, endorsed, sold or promoted by O’Shares or its third party licensors. Neither O’Shares nor its third party licensors make any representation or warranty, express or implied, to shareholders of a Fund or any member of the public regarding the advisability of investing in securities generally or in a Fund particularly or the ability of the Underlying Index to track general stock market performance. O’Shares’ and its third party licensor’s only relationship to the Adviser and each Fund is the licensing of certain trademarks, service marks and trade names of O’Shares and/or its third party licensors and for the providing the Underlying Index. Neither O’Shares nor its third party licensors is responsible for and has not participated in the determination of the prices and amount of a Fund or the timing of the issuance or sale of a Fund or in the determination or calculation of the equation by which a Fund is to be converted into cash. O’Shares has no obligation or liability in connection with the administration, marketing or trading of the Funds.
NEITHER O’SHARES, ITS AFFILIATES NOR THEIR THIRD PARTY LICENSORS GUARANTEE THE ADEQUACY, ACCURACY, TIMELINESS OR COMPLETENESS OF THE INDEX OR ANY DATA INCLUDED THEREIN OR ANY COMMUNICATIONS, INCLUDING BUT NOT LIMITED TO, ORAL OR WRITTEN COMMUNICATIONS (INCLUDING ELECTRONIC COMMUNICATIONS) WITH RESPECT THERETO. O’SHARES, ITS AFFILIATES AND THEIR THIRD PARTY LICENSORS SHALL NOT BE SUBJECT TO ANY DAMAGES OR LIABILITY FOR ANY ERRORS, OMISSIONS OR DELAYS THEREIN. O’SHARES MAKES NO EXPRESS OR IMPLIED WARRANTIES, AND EXPRESSLY DISCLAIMS ALL WARRANTIES OF MERCHANTABILITY OR FITNESS FOR A PARTICULAR PURPOSE OR USE WITH RESPECT TO ITS TRADEMARKS, THE INDEX OR ANY DATA INCLUDED THEREIN. WITHOUT LIMITING ANY OF THE FOREGOING, IN NO EVENT WHATSOEVER SHALL O’SHARES, ITS AFFILIATES OR THEIR THIRD PARTY LICENSORS BE LIABLE FOR ANY INDIRECT, SPECIAL, INCIDENTAL, PUNITIVE OR CONSEQUENTIAL DAMAGES, INCLUDING BUT NOT LIMITED TO, LOSS OF PROFITS, TRADING LOSSES, LOST TIME OR GOODWILL, EVEN IF THEY HAVE BEEN ADVISED OF THE POSSIBILITY OF SUCH DAMAGES, WHETHER IN CONTRACT, TORT, STRICT LIABILITY OR OTHERWISE.
O’Shares Investments is a registered trademark and registered service mark of O’Shares Investment, Inc. and has been licensed for use by the Adviser and the Funds.
The Funds are not sponsored, endorsed, sold or promoted by O’Shares, its affiliates or their third party licensors, and neither O’Shares, its affiliates nor its third party licensors make any representation regarding the advisability of investing in the Funds.
O’Shares has entered into an agreement with S-Network Global Indexes Inc. (“S-Network”), pursuant to which S-Network calculates each Underlying Index. The following disclosure relates to O’Shares.
The Funds are not sponsored, endorsed, sold or promoted by or its third party licensors. Neither S-Network nor its third party licensors make any representation or warranty, express or implied, to the owners of a Fund or any member of the public regarding the advisability of investing in securities generally or in a Fund particularly or the ability of the Underlying Index to track general stock market performance. S-Network's and its third party licensor’s only relationship to the Adviser is the licensing of certain trademarks, service marks and trade names of S-Network Global Indexes, Inc. and/or its third party licensors and for the providing of calculation and maintenance services related to the Underlying Index. Neither S-Network nor its third party licensors is responsible for and has not participated in the determination of the prices and amount of a Fund or the timing of the issuance or sale of a Fund or in the determination or calculation of the equation by which a Fund is to be converted into cash. S-Network has no obligation or liability in connection with the administration, marketing or trading of the Funds.
ALPS ETF Trust
| Additional Information | November 30, 2024 (Unaudited) |
NEITHER S-NETWORK GLOBAL INDEXES, INC. (“S-Network”), ITS AFFILIATES NOR THEIR THIRD PARTY LICENSORS GUARANTEE THE ADEQUACY, ACCURACY, TIMELINESS OR COMPLETENESS OF THE CUSTOM INDEX OR ANY DATA INCLUDED THEREIN OR ANY COMMUNICATIONS, INCLUDING BUT NOT LIMITED TO, ORAL OR WRITTEN COMMUNICATIONS (INCLUDING ELECTRONIC COMMUNICATIONS) WITH RESPECT THERETO. S-NETWORK, ITS AFFILIATES AND THEIR THIRD PARTY LICENSORS SHALL NOT BE SUBJECT TO ANY DAMAGES OR LIABILITY FOR ANY ERRORS, OMISSIONS OR DELAYS THEREIN. S-NETWORK MAKES NO EXPRESS OR IMPLIED WARRANTIES, AND EXPRESSLY DISCLAIMS ALL WARRANTIES OF MERCHANTABILITY OR FITNESS FOR A PARTICULAR PURPOSE OR USE WITH RESPECT TO ITS TRADEMARKS, THE CUSTOM INDEX OR ANY DATA INCLUDED THEREIN. WITHOUT LIMITING ANY OF THE FOREGOING, IN NO EVENT WHATSOEVER SHALL S-NETWORK, ITS AFFILIATES OR THEIR THIRD PARTY LICENSORS BE LIABLE FOR ANY INDIRECT, SPECIAL, INCIDENTAL, PUNITIVE OR CONSEQUENTIAL DAMAGES, INCLUDING BUT NOT LIMITED TO, LOSS OF PROFITS, TRADING LOSSES, LOST TIME OR GOODWILL, EVEN IF THEY HAVE BEEN ADVISED OF THE POSSIBILITY OF SUCH DAMAGES, WHETHER IN CONTRACT, TORT, STRICT LIABILITY OR OTHERWISE.
S-Network Global Indexes, Inc.SM, and SNGISM are registered trademarks and registered service marks of S-Network Global Indexes, Inc. “Calculated by S-Network Global Indexes, Inc.” and its related stylized mark are service marks of S-Network Global Indexes, Inc.SM, and have been licensed for use by the Adviser.
The Funds are not sponsored, endorsed, sold or promoted by SNGI, its affiliates or their third party licensors and neither SNGI, its affiliates nor their its third party licensors make any representation regarding the advisability of investing in a Fund.
ALPS ETF Trust
Changes in and Disagreements with Accountants
for Open-End Management Investment Companies | November 30, 2024 (Unaudited) |
On March 14, 2023, BBD LLP (“BBD”) ceased to serve as the independent registered public accounting firm of the Funds. The Board approved the replacement of BBD as a result of Cohen & Company, Ltd.’s (“Cohen”) acquisition of BBD’s investment management group.
The report of BBD on the financial statements of the Funds as of and for the fiscal year or period ended November 30, 2022 did not contain an adverse opinion or a disclaimer of opinion, and was not qualified or modified as to uncertainties, audit scope or accounting principles. During the fiscal year or period ended November 30, 2022, and during the subsequent interim period through March 14, 2023: (i) there were no disagreements between the registrant and BBD on any matter of accounting principles or practices, financial statement disclosure, or auditing scope or procedure, which disagreements, if not resolved to the satisfaction of BBD, would have caused it to make reference to the subject matter of the disagreements in its report on the financial statements of the Funds for such years or interim period; and (ii) there were no “reportable events,” as defined in Item 304(a)(1)(v) of Regulation S-K under the Securities Exchange Act of 1934, as amended.
On March 7, 2023, upon the recommendation of the Funds’ Audit Committee, the Board approved the appointment of Cohen, effective upon the resignation of BBD, as the Funds’ independent registered public accounting firm for the fiscal year ending November 30, 2023.
During the fiscal year or period ended November 30, 2022, and during the subsequent interim period through March 14, 2023, neither the registrant, nor anyone acting on its behalf, consulted with Cohen on behalf of the Funds regarding the application of accounting principles to a specified transaction (either completed or proposed), the type of audit opinion that might be rendered on the Funds’ financial statements, or any matter that was either: (i) the subject of a "disagreement," as defined in Item 304(a)(1)(iv) of Regulation S-K and the instructions thereto; or (ii) "reportable events," as defined in Item 304(a)(1)(v) of Regulation S-K.
ALPS ETF Trust
Proxy Disclosures
for Open-End Management Investment Companies | November 30, 2024 (Unaudited) |
A Special Meeting of Shareholders of the Funds, each a series of the Trust, was held on July 19, 2024. At the meeting, the following matters were voted on by the Shareholders. The results of the Special Meeting of Shareholders are noted below:
Proposal 1: To elect seven Trustees.
| | Shares Voted in Favor | Shares Voted Against/Withheld
or Abstentions | Proposal Approved |
| Mary K. Anstine | 223,143,090 | 2,894,793 | Yes |
| Edmund J. Burke | 223,362,578 | 2,672,643 | Yes |
| Jeremy W. Deems | 221,670,341 | 4,361,535 | Yes |
| Rick A. Pederson | 213,137,140 | 12,259,226 | Yes |
| Joseph F. Keenan | 223,547,500 | 2,483,867 | Yes |
| Susan K. Wold | 223,460,006 | 2,571,857 | Yes |
| Laton Spahr | 223,439,610 | 2,593,995 | Yes |
ALPS ETF Trust
Remuneration Paid to Directors, Officers, and Others
for Open-End Management Investment Companies | November 30, 2024 (Unaudited) |
The following chart provides certain information about the Trustee fees paid by the Trust for the year ended November 30, 2024:
| | | Aggregate Regular Compensation
From the Trust | | | Aggregate Special Compensation
From the Trust | | | Total Compensation From the Trust | |
| Mary K. Anstine, Trustee | | $ | 162,500 | | | $ | – | | | $ | 162,500 | |
| Edmund J. Burke, Trustee | | | 166,500 | | | | – | | | | 166,500 | |
| Jeremy W. Deems, Trustee | | | 174,500 | | | | – | | | | 174,500 | |
| Rick A. Pederson, Trustee | | | 186,500 | | | | – | | | | 186,500 | |
| Joseph F. Keenan, Trustee | | | 40,000 | | | | – | | | | 40,000 | |
| Susan K. Wold, Trustee | | | 40,000 | | | | – | | | | 40,000 | |
| Laton Spahr, President and Trustee* | | | – | | | | – | | | | – | |
| Total | | $ | 770,000 | | | $ | – | | | $ | 770,000 | |
| * | Mr. Spahr, the President of the Trust, is deemed an “interested person” by virtue of his position as an officer of the Trust and of ALPS Advisors, Inc. |
Officers who are employed by the Adviser receive no compensation or expense reimbursement from the Trust.
ALPS ETF Trust
Statement Regarding Basis for Approval
of Investment Advisory Contract | November 30, 2024 (Unaudited) |
At its meetings held on June 3, 2024 and June 18, 2024, the Board of Trustees of the Trust (the “Board” or the “Trustees”), where each Trustee was not an "interested person" of the Trust within the meaning of the Investment Company Act of 1940, as amended (the “Independent Trustees”), evaluated a proposal to approve the continuance of the Investment Advisory Agreement between the Trust and ALPS Advisors, Inc. (the “Adviser” or “AAI”) with respect to the ALPS | O’Shares U.S. Quality Dividend ETF (“OUSA”), ALPS | O’Shares U.S. Small-Cap Quality Dividend ETF (“OUSM”), ALPS | O’Shares Global Internet Giants ETF (“OGIG”), and ALPS | O’Shares Europe Quality Dividend ETF (“OEUR”) (each a “Fund” and collectively “the Funds”). In evaluating the renewal of the Investment Advisory Agreement with respect to each of the Funds, the Board, including the Independent Trustees considered various factors, including (i) the nature, extent and quality of the services provided by AAI with respect to the applicable Fund under the Investment Advisory Agreement; (ii) the advisory fees and other expenses paid by the Fund compared to those of similar funds managed by other investment advisers; (iii) the costs of the services provided to the Fund by AAI and the profits realized by AAI and its affiliates from its relationship to the Fund; (iv) the extent to which economies of scale have been or would be realized if and as the assets of the Fund grow and whether fees reflect the economies of scale for the benefit of shareholders; and (v) any additional benefits and other considerations.
With respect to the nature, extent and quality of the services provided by AAI under the Investment Advisory Agreement, the Board considered and reviewed information concerning the services provided under the Investment Advisory Agreement, the investment parameters of the index of each Fund, financial information regarding AAI and its parent company, information describing AAI’s current organization and the background and experience of the persons responsible for the day-to-day management of the Funds.
The Board reviewed information on the performance of each Fund and its applicable benchmark for the 1-, 3-, and 5-year periods, as applicable. The Board also evaluated the correlation and tracking error between each underlying index and its corresponding Fund’s performance. Based on this review, the Board, including the Independent Trustees found that the nature and extent of services provided to each Fund under the Investment Advisory Agreement was appropriate and that the quality of such services was satisfactory.
The Board noted that the advisory fees for each Fund were unitary fees pursuant to which AAI assumes all expenses of the Funds (including the cost of transfer agency, custody, fund administration, legal, audit and other services) other than the payments under the Advisory Agreement, brokerage expenses, taxes, interest, litigation expenses and other extraordinary expenses.
Based on the information available to them, including the Fund-specific summaries set forth below, the Board, including the Independent Trustees concluded that the advisory fee rate for each of the Funds was reasonable under the circumstances and in light of the quality of the services provided.
The Board, including the Independent Trustees considered other benefits available to AAI because of its relationship with the Funds and concluded that the advisory fees were reasonable taking into account any such benefits.
The Board, including the Independent Trustees, also considered with respect to each Fund the information provided by AAI about the costs and profitability of AAI with respect to each of the Funds, including the asset levels and other factors that influence the profitability and financial viability of the Funds. The Board, including the Independent Trustees reviewed and noted the relatively small sizes of the Funds (other than OUSA) and the analysis AAI had conducted to support AAI’s assertion that it was not realizing any economies of scale with respect to such Funds. The Independent Trustees determined that AAI should continue to keep the Board informed on an ongoing basis of any significant developments (e.g., material increases in asset levels) so as to facilitate the Independent Trustees’ evaluation of whether further economies of scale have been achieved.
The Board, including the Independent Trustees, also considered other potential benefits available to AAI because of its relationship with the Funds, known as fall-out benefits.
With respect to each Fund, the Board, including the Independent Trustees, noted the following:
The gross management fee rate for OEUR is lower than the median of its FUSE expense group. OEUR’s net expense ratio is lower than the median of its FUSE expense group.
The Board, including the Independent Trustees, reviewed and noted the relatively small size of OEUR and the analysis AAI had conducted to support AAI’s assertion that it was not realizing any economies of scale with respect to OEUR.
ALPS ETF Trust
Statement Regarding Basis for Approval
of Investment Advisory Contract | November 30, 2024 (Unaudited) |
The gross management fee rate for OGIG is lower than the median of its FUSE expense group. OGIG’s net expense ratio is lower than the median of its FUSE expense group.
The Board, including the Independent Trustees, reviewed and noted the relatively small size of OGIG and the analysis AAI had conducted to support AAI’s assertion that it was not realizing any economies of scale with respect to OGIG.
The gross management fee rate for OUSA is higher than the median of its FUSE expense group. OUSA’s net expense ratio is higher than the median of its FUSE expense group.
The Board took into account, among other things, the unique features and performance of OUSA’s underlying index, the management fee breakpoints for OUSA, and the costs and benefits of linkage to the O’Shares name.
With respect to AAI profitability from OUSA, the Independent Trustees noted that OUSA’s asset levels have not recovered to their historic high, and OUSA has breakpoints in its management fee.
The gross management fee rate for OUSM is higher than the median of its FUSE expense group. OUSM’s net expense ratio is higher than the median of its FUSE expense group.
The Board took into account, among other things, the unique features and performance of OUSM’s underlying index, the management fee breakpoints for OUSM, and the costs and benefits of linkage to the O’Shares name.
The Board, including the Independent Trustees, reviewed and noted the relatively small size of OUSM and the analysis AAI had conducted to support AAI’s assertion that it was not realizing any economies of scale with respect to OUSM.
In voting to renew the Investment Advisory Agreement with AAI, the Board, including the Independent Trustees, concluded that the terms of the Investment Advisory Agreement are reasonable and fair in light of the services to be performed, the fees paid by certain other funds, expenses to be incurred and such other matters as the members of the Board, including the Independent Trustees, considered relevant in the exercise of their reasonable business judgment. The Independent Trustees did not identify any single factor or group of factors as all important or controlling and considered all factors together.


Table of Contents
| Financial Statements and Financial Highlights for Open-End Management Investment Companies |
| Schedule of Investments | 1 |
| Statement of Assets and Liabilities | 6 |
| Statement of Operations | 7 |
| Statements of Changes in Net Assets | 8 |
| Financial Highlights | 9 |
| Notes to Financial Statements and Financial Highlights | 10 |
| Report of Independent Registered Public Accounting Firm | 16 |
| Additional Information | 17 |
| Changes in and Disagreements with Accountants for Open-End Management Investment Companies | 19 |
| Proxy Disclosures for Open-End Management Investment Companies | 20 |
| Remuneration Paid to Directors, Officers, and Others of Open-End Management Investment Companies | 21 |
| Statement Regarding Basis for Approval of Investment Advisory Contract | 22 |
alpsfunds.com
Barron’s 400SM ETF
| Schedule of Investments | November 30, 2024 |
| Security Description | | Shares | | | Value | |
| COMMON STOCKS (97.60%) | | | | | | |
| Communication Services (2.48%) | | | | | | |
| Alphabet, Inc., Class A | | | 2,280 | | | $ | 385,206 | |
| Charter Communications, Inc., Class A(a) | | | 1,050 | | | | 416,813 | |
| Electronic Arts, Inc. | | | 2,445 | | | | 400,173 | |
| Fox Corp. | | | 9,700 | | | | 433,881 | |
| Interpublic Group of Cos., Inc.(b) | | | 11,463 | | | | 353,175 | |
| Meta Platforms, Inc., Class A | | | 664 | | | | 381,349 | |
| Netflix, Inc.(a) | | | 519 | | | | 460,254 | |
| New York Times Co., Class A | | | 6,557 | | | | 355,783 | |
| T-Mobile US, Inc. | | | 1,750 | | | | 432,145 | |
| Yelp, Inc.(a) | | | 10,720 | | | | 409,718 | |
| Total Communication Services | | | | | | | 4,028,497 | |
| | | | | | | | | |
| Consumer Discretionary (12.24%) | | | | | | | | |
| Abercrombie & Fitch Co., Class A(a) | | | 2,679 | | | | 401,020 | |
| Amazon.com, Inc.(a) | | | 1,938 | | | | 402,891 | |
| Booking Holdings, Inc. | | | 89 | | | | 462,976 | |
| Boot Barn Holdings, Inc.(a)(b) | | | 2,332 | | | | 319,810 | |
| Build-A-Bear Workshop, Inc.(b) | | | 11,653 | | | | 442,697 | |
| Burlington Stores, Inc.(a) | | | 1,293 | | | | 364,471 | |
| Carnival Corp.(a) | | | 20,050 | | | | 509,871 | |
| Chewy, Inc., Class A(a) | | | 10,950 | | | | 365,839 | |
| Chipotle Mexican Grill, Inc.(a) | | | 6,194 | | | | 381,055 | |
| Churchill Downs, Inc. | | | 2,550 | | | | 362,380 | |
| Crocs, Inc.(a) | | | 2,645 | | | | 279,312 | |
| Darden Restaurants, Inc. | | | 2,231 | | | | 393,258 | |
| Deckers Outdoor Corp.(a) | | | 2,286 | | | | 447,965 | |
| Dick's Sporting Goods, Inc. | | | 1,686 | | | | 349,407 | |
| DR Horton, Inc. | | | 1,834 | | | | 309,543 | |
| Dream Finders Homes, Inc.(a)(b) | | | 10,264 | | | | 341,483 | |
| eBay, Inc. | | | 5,572 | | | | 352,652 | |
| Expedia, Inc.(a) | | | 2,650 | | | | 489,243 | |
| Frontdoor, Inc.(a) | | | 7,388 | | | | 432,937 | |
| Grand Canyon Education, Inc.(a) | | | 2,466 | | | | 405,879 | |
| Green Brick Partners, Inc.(a) | | | 4,473 | | | | 319,641 | |
| H&R Block, Inc. | | | 5,550 | | | | 329,004 | |
| Harley-Davidson, Inc.(b) | | | 9,399 | | | | 316,088 | |
| Installed Building Products, Inc. | | | 1,587 | | | | 363,010 | |
| Laureate Education, Inc.(a) | | | 21,450 | | | | 407,550 | |
| Lennar Corp., Class B(b) | | | 2,090 | | | | 344,495 | |
| Light & Wonder, Inc.(a) | | | 3,250 | | | | 308,880 | |
| M/I Homes, Inc.(a) | | | 2,150 | | | | 354,814 | |
| Modine Manufacturing Co.(a) | | | 3,148 | | | | 427,467 | |
| Monarch Casino & Resort, Inc. | | | 4,750 | | | | 399,048 | |
| Nordstrom, Inc.(b) | | | 15,850 | | | | 359,954 | |
| NVR, Inc.(a) | | | 38 | | | | 350,952 | |
| PulteGroup, Inc. | | | 2,532 | | | | 342,504 | |
| Ralph Lauren Corp. | | | 1,958 | | | | 453,081 | |
| Ross Stores, Inc. | | | 2,339 | | | | 362,241 | |
| Royal Caribbean Cruises, Ltd. | | | 2,121 | | | | 517,651 | |
| Signet Jewelers, Ltd.(b) | | | 3,906 | | | | 391,381 | |
| Skechers U.S.A., Inc., Class A(a) | | | 5,250 | | | | 335,055 | |
| Smith Douglas Homes Corp.(a)(b) | | | 9,950 | | | | 335,315 | |
| Security Description | | Shares | | | Value | |
| Consumer Discretionary (continued) | | | | | | |
| Steven Madden, Ltd. | | | 7,800 | | | $ | 355,524 | |
| Stride, Inc.(a)(b) | | | 4,327 | | | | 462,426 | |
| Target Hospitality Corp.(a)(b) | | | 35,650 | | | | 294,826 | |
| Texas Roadhouse, Inc. | | | 2,201 | | | | 451,799 | |
| TJX Cos., Inc. | | | 2,990 | | | | 375,813 | |
| Toll Brothers, Inc. | | | 2,363 | | | | 390,297 | |
| Tractor Supply Co.(b) | | | 1,272 | | | | 360,828 | |
| TRI Pointe Group, Inc.(a) | | | 8,050 | | | | 350,417 | |
| Universal Technical Institute, Inc.(a)(b) | | | 21,392 | | | | 553,411 | |
| Williams-Sonoma, Inc. | | | 2,490 | | | | 428,330 | |
| Wingstop, Inc. | | | 880 | | | | 289,318 | |
| XPEL, Inc.(a)(b) | | | 8,100 | | | | 352,350 | |
| YETI Holdings, Inc.(a) | | | 9,100 | | | | 367,367 | |
| Total Consumer Discretionary | | | | | | | 19,865,526 | |
| | | | | | | | | |
| Consumer Staples (4.28%) | | | | | | | | |
| Casey's General Stores, Inc. | | | 943 | | | | 396,899 | |
| Church & Dwight Co., Inc. | | | 3,390 | | | | 373,341 | |
| Coca-Cola Consolidated, Inc. | | | 274 | | | | 357,375 | |
| Colgate-Palmolive Co. | | | 3,374 | | | | 326,030 | |
| Costco Wholesale Corp. | | | 396 | | | | 384,864 | |
| Hershey Co. | | | 1,767 | | | | 311,222 | |
| Ingredion, Inc. | | | 2,655 | | | | 391,188 | |
| Inter Parfums, Inc.(b) | | | 3,000 | | | | 412,980 | |
| Kimberly-Clark Corp. | | | 2,500 | | | | 348,375 | |
| Mama's Creations, Inc.(a)(b) | | | 45,550 | | | | 445,023 | |
| National Beverage Corp. | | | 8,050 | | | | 397,589 | |
| PepsiCo, Inc. | | | 2,024 | | | | 330,823 | |
| Pilgrim's Pride Corp.(a) | | | 8,700 | | | | 449,007 | |
| Sprouts Farmers Market, Inc.(a) | | | 3,350 | | | | 517,508 | |
| Sysco Corp. | | | 4,650 | | | | 358,562 | |
| Target Corp. | | | 2,350 | | | | 310,929 | |
| Vita Coco Co., Inc.(a)(b) | | | 13,000 | | | | 462,020 | |
| Vital Farms, Inc.(a)(b) | | | 11,400 | | | | 378,480 | |
| Total Consumer Staples | | | | | | | 6,952,215 | |
| | | | | | | | | |
| Energy (8.43%) | | | | | | | | |
| Amplify Energy Corp.(a)(b) | | | 55,000 | | | | 369,050 | |
| APA Corp.(b) | | | 14,650 | | | | 331,822 | |
| Ardmore Shipping Corp. | | | 20,250 | | | | 225,990 | |
| Baker Hughes Co. | | | 10,510 | | | | 461,914 | |
| Cactus, Inc., Class A | | | 6,100 | | | | 418,826 | |
| Centrus Energy Corp.(a)(b) | | | 8,950 | | | | 814,450 | |
| ConocoPhillips | | | 3,417 | | | | 370,198 | |
| CONSOL Energy, Inc.(b) | | | 3,700 | | | | 483,590 | |
| Devon Energy Corp. | | | 9,000 | | | | 341,550 | |
| Diamondback Energy, Inc. | | | 2,053 | | | | 364,592 | |
| EOG Resources, Inc. | | | 2,950 | | | | 393,117 | |
| Exxon Mobil Corp. | | | 3,195 | | | | 376,882 | |
| Hess Corp. | | | 2,750 | | | | 404,745 | |
| International Seaways, Inc. | | | 7,075 | | | | 275,925 | |
| Kosmos Energy, Ltd.(a)(b) | | | 84,950 | | | | 334,703 | |
| Magnolia Oil & Gas Corp., Class A | | | 14,791 | | | | 410,302 | |
| Marathon Petroleum Corp. | | | 2,232 | | | | 348,527 | |
| Matador Resources Co. | | | 7,103 | | | | 426,251 | |
| Noble Corp. PLC | | | 10,100 | | | | 338,047 | |
1 | November 30, 2024
Barron’s 400SM ETF
| Schedule of Investments | November 30, 2024 |
| Security Description | | Shares | | | Value | |
| Energy (continued) | | | | | | |
| Northern Oil and Gas, Inc.(b) | | | 10,250 | | | $ | 445,773 | |
| NOV, Inc. | | | 22,250 | | | | 356,445 | |
| Oceaneering International, Inc.(a)(b) | | | 14,950 | | | | 448,201 | |
| ONEOK, Inc. | | | 3,800 | | | | 431,680 | |
| Sabine Royalty Trust(b) | | | 5,900 | | | | 383,500 | |
| SM Energy Co.(b) | | | 8,980 | | | | 405,806 | |
| Targa Resources Corp. | | | 2,364 | | | | 482,965 | |
| TechnipFMC PLC | | | 14,350 | | | | 450,160 | |
| Texas Pacific Land Corp.(b) | | | 428 | | | | 684,839 | |
| Tidewater, Inc.(a)(b) | | | 4,850 | | | | 250,842 | |
| VAALCO Energy, Inc.(b) | | | 62,500 | | | | 320,000 | |
| Valspar Corp.(a)(b) | | | 6,450 | | | | 297,926 | |
| Viper Energy, Inc.(b) | | | 8,274 | | | | 447,706 | |
| Weatherford International PLC | | | 3,859 | | | | 317,596 | |
| Williams Cos., Inc. | | | 7,871 | | | | 460,611 | |
| Total Energy | | | | | | | 13,674,531 | |
| | | | | | | | | |
| Financials (22.32%) | | | | | | | | |
| 1st Source Corp. | | | 5,995 | | | | 389,016 | |
| Aflac, Inc. | | | 3,250 | | | | 370,500 | |
| Allstate Corp. | | | 1,900 | | | | 394,041 | |
| Amalgamated Financial Corp. | | | 11,249 | | | | 400,802 | |
| American Express Co. | | | 1,346 | | | | 410,099 | |
| Ameriprise Financial, Inc. | | | 800 | | | | 459,176 | |
| Apollo Global Management, Inc. | | | 3,041 | | | | 532,266 | |
| Arch Capital Group, Ltd. | | | 3,132 | | | | 315,455 | |
| Assurant, Inc. | | | 1,850 | | | | 420,135 | |
| Axos Financial, Inc.(a) | | | 5,528 | | | | 457,995 | |
| Bancorp, Inc.(a) | | | 6,910 | | | | 403,751 | |
| Bank First Corp. | | | 3,900 | | | | 416,793 | |
| Bank OZK | | | 8,515 | | | | 425,495 | |
| Brown & Brown, Inc. | | | 3,423 | | | | 387,141 | |
| Byline Bancorp, Inc. | | | 13,404 | | | | 421,154 | |
| CBOE Holdings, Inc. | | | 1,700 | | | | 366,945 | |
| Cincinnati Financial Corp. | | | 2,607 | | | | 416,677 | |
| CME Group, Inc. | | | 1,650 | | | | 392,700 | |
| CNA Financial Corp. | | | 7,087 | | | | 357,468 | |
| CNO Financial Group, Inc. | | | 10,550 | | | | 420,945 | |
| Corpay, Inc.(a) | | | 1,161 | | | | 442,550 | |
| Customers Bancorp, Inc.(a) | | | 7,399 | | | | 417,674 | |
| Donnelley Financial Solutions, Inc.(a) | | | 5,150 | | | | 310,287 | |
| East West Bancorp, Inc. | | | 4,454 | | | | 488,515 | |
| Everest Group, Ltd. | | | 917 | | | | 355,393 | |
| FactSet Research Systems, Inc. | | | 797 | | | | 391,064 | |
| Fidelis Insurance Holdings, Ltd.(b) | | | 20,100 | | | | 412,653 | |
| Fifth Third Bancorp | | | 8,451 | | | | 406,155 | |
| First BanCorp | | | 17,676 | | | | 365,540 | |
| First Citizens BancShares, Inc., Class A | | | 192 | | | | 440,640 | |
| First Commonwealth Financial Corp. | | | 21,120 | | | | 397,690 | |
| First Mid Bancshares, Inc. | | | 9,000 | | | | 378,090 | |
| Fulton Financial Corp. | | | 19,600 | | | | 422,968 | |
| Globe Life, Inc. | | | 3,345 | | | | 372,098 | |
| Security Description | | Shares | | | Value | |
| Financials (continued) | | | | | | |
| Hamilton Insurance Group, Ltd.(a) | | | 20,100 | | | $ | 383,508 | |
| Hamilton Lane, Inc., Class A(b) | | | 2,350 | | | | 452,140 | |
| HCI Group, Inc.(b) | | | 3,500 | | | | 426,545 | |
| Heritage Insurance Holdings, Inc.(a) | | | 24,000 | | | | 298,320 | |
| Independent Bank Corp. | | | 10,550 | | | | 396,996 | |
| Interactive Brokers Group, Inc. | | | 2,768 | | | | 528,937 | |
| International Bancshares Corp. | | | 5,809 | | | | 424,812 | |
| Jack Henry & Associates, Inc. | | | 2,011 | | | | 354,298 | |
| JPMorgan Chase & Co. | | | 1,713 | | | | 427,770 | |
| Kinsale Capital Group, Inc. | | | 774 | | | | 393,533 | |
| Lakeland Financial Corp.(b) | | | 5,400 | | | | 396,684 | |
| M&T Bank Corp. | | | 2,090 | | | | 459,779 | |
| Mastercard, Inc., Class A | | | 729 | | | | 388,513 | |
| Mercantile Bank Corp. | | | 8,028 | | | | 401,801 | |
| Merchants Bancorp | | | 7,992 | | | | 329,910 | |
| Metropolitan Bank Holding Corp.(a) | | | 7,007 | | | | 455,035 | |
| Moody's Corp. | | | 737 | | | | 368,485 | |
| Mr Cooper Group, Inc.(a) | | | 3,750 | | | | 370,012 | |
| NewtekOne, Inc.(b) | | | 31,800 | | | | 461,100 | |
| Nicolet Bankshares, Inc. | | | 3,650 | | | | 406,610 | |
| Northern Trust Corp. | | | 4,000 | | | | 444,640 | |
| OFG Bancorp | | | 8,090 | | | | 367,448 | |
| Old Second Bancorp, Inc. | | | 21,390 | | | | 397,854 | |
| Orrstown Financial Services, Inc. | | | 10,200 | | | | 402,900 | |
| Palomar Holdings, Inc.(a) | | | 3,750 | | | | 406,125 | |
| Pathward Financial, Inc. | | | 5,273 | | | | 442,299 | |
| Paymentus Holdings, Inc.(a) | | | 16,550 | | | | 625,755 | |
| Payoneer Global, Inc.(a) | | | 48,400 | | | | 528,044 | |
| PayPal Holdings, Inc.(a) | | | 5,033 | | | | 436,713 | |
| Peoples Bancorp, Inc. | | | 11,500 | | | | 403,420 | |
| Preferred Bank(b) | | | 4,430 | | | | 417,882 | |
| Progressive Corp. | | | 1,400 | | | | 376,432 | |
| QCR Holdings, Inc. | | | 4,776 | | | | 439,917 | |
| Raymond James Financial, Inc. | | | 3,000 | | | | 507,840 | |
| Reinsurance Group of America, Inc. | | | 1,612 | | | | 368,181 | |
| RenaissanceRe Holdings, Ltd.(b) | | | 1,351 | | | | 386,589 | |
| S&P Global, Inc. | | | 680 | | | | 355,307 | |
| S&T Bancorp, Inc. | | | 8,336 | | | | 356,697 | |
| Sezzle, Inc.(a) | | | 2,350 | | | | 996,470 | |
| Shift4 Payments, Inc.(a)(b) | | | 4,295 | | | | 489,974 | |
| Skyward Specialty Insurance | | | | | | | | |
| Group, Inc.(a) | | | 9,150 | | | | 495,107 | |
| Synchrony Financial | | | 7,578 | | | | 511,667 | |
| The Hartford Financial Services Group, Inc. | | | 3,079 | | | | 379,671 | |
| Tradeweb Markets, Inc. | | | 3,010 | | | | 407,855 | |
| Trinity Capital, Inc. | | | 25,600 | | | | 375,552 | |
| Unum Group | | | 6,350 | | | | 488,315 | |
| Virtu Financial, Inc., Class A | | | 11,050 | | | | 412,276 | |
| Visa, Inc., Class A | | | 1,216 | | | | 383,137 | |
| Wells Fargo & Co. | | | 6,631 | | | | 505,083 | |
| Westamerica BanCorp | | | 7,050 | | | | 403,472 | |
| WisdomTree, Inc.(b) | | | 36,975 | | | | 441,851 | |
2 | November 30, 2024
Barron’s 400SM ETF
| Schedule of Investments | November 30, 2024 |
| Security Description | | Shares | | | Value | |
| Financials (continued) | | | | | | |
| WR Berkley Corp. | | | 6,082 | | | $ | 392,593 | |
| Total Financials | | | | | | | 36,231,725 | |
| | | | | | | | | |
| Health Care (8.25%) | | | | | | | | |
| ADMA Biologics, Inc.(a) | | | 19,650 | | | | 395,161 | |
| Amphastar Pharmaceuticals, Inc.(a)(b) | | | 7,395 | | | | 334,180 | |
| BioMarin Pharmaceutical, Inc.(a) | | | 5,100 | | | | 336,753 | |
| Catalyst Pharmaceuticals, Inc.(a) | | | 17,509 | | | | 386,424 | |
| Cencora, Inc. | | | 1,488 | | | | 374,306 | |
| Collegium Pharmaceutical, Inc.(a)(b) | | | 9,654 | | | | 294,447 | |
| Corcept Therapeutics, Inc.(a)(b) | | | 9,278 | | | | 535,155 | |
| DaVita, Inc.(a) | | | 2,164 | | | | 359,592 | |
| Doximity, Inc., Class A(a) | | | 9,077 | | | | 481,081 | |
| Eli Lilly & Co. | | | 380 | | | | 302,233 | |
| Exelixis, Inc.(a) | | | 13,000 | | | | 473,980 | |
| Halozyme Therapeutics, Inc.(a) | | | 5,687 | | | | 274,113 | |
| Harmony Biosciences Holdings, Inc.(a) | | | 9,244 | | | | 320,489 | |
| Hologic, Inc.(a) | | | 4,300 | | | | 341,850 | |
| Insulet Corp.(a) | | | 1,536 | | | | 409,774 | |
| Intuitive Surgical, Inc.(a) | | | 721 | | | | 390,782 | |
| IQVIA Holdings, Inc.(a) | | | 1,517 | | | | 304,674 | |
| iRadimed Corp. | | | 7,303 | | | | 393,851 | |
| Johnson & Johnson | | | 2,150 | | | | 333,271 | |
| Lantheus Holdings, Inc.(a) | | | 3,342 | | | | 298,340 | |
| Medpace Holdings, Inc.(a) | | | 998 | | | | 339,949 | |
| Molina Healthcare, Inc.(a) | | | 1,000 | | | | 297,900 | |
| Neurocrine Biosciences, Inc.(a) | | | 2,901 | | | | 367,702 | |
| Protagonist Therapeutics, Inc.(a) | | | 7,750 | | | | 339,450 | |
| Regeneron Pharmaceuticals, Inc.(a) | | | 310 | | | | 232,568 | |
| ResMed, Inc. | | | 1,399 | | | | 348,379 | |
| SIGA Technologies, Inc. | | | 44,750 | | | | 325,780 | |
| Stryker Corp. | | | 958 | | | | 375,680 | |
| Tactile Systems Technology, Inc.(a) | | | 25,550 | | | | 499,247 | |
| Tenet Healthcare Corp.(a) | | | 2,167 | | | | 309,188 | |
| TG Therapeutics, Inc.(a)(b) | | | 14,350 | | | | 499,380 | |
| UFP Technologies, Inc.(a) | | | 1,116 | | | | 360,379 | |
| United Therapeutics Corp.(a) | | | 1,016 | | | | 376,418 | |
| Universal Health Services, Inc., Class B | | | 1,500 | | | | 307,500 | |
| Veeva Systems, Inc., Class A(a) | | | 1,642 | | | | 374,130 | |
| Zimmer Biomet Holdings, Inc. | | | 3,350 | | | | 375,535 | |
| Zoetis, Inc. | | | 1,860 | | | | 325,965 | |
| Total Health Care | | | | | | | 13,395,606 | |
| | | | | | | | | |
| Industrials (19.73%) | | | | | | | | |
| 3M Co. | | | 2,650 | | | | 353,854 | |
| AAON, Inc. | | | 3,734 | | | | 509,094 | |
| Advanced Drainage Systems, Inc. | | | 2,427 | | | | 328,349 | |
| Security Description | | Shares | | | Value | |
| Industrials (continued) | | | | | | |
| Allison Transmission Holdings, Inc. | | | 4,082 | | | $ | 483,717 | |
| AO Smith Corp. | | | 4,385 | | | | 326,639 | |
| Apogee Enterprises, Inc. | | | 5,366 | | | | 451,871 | |
| Applied Industrial Technologies, Inc. | | | 1,722 | | | | 473,068 | |
| Argan, Inc. | | | 3,950 | | | | 615,963 | |
| Armstrong World Industries, Inc. | | | 2,800 | | | | 447,524 | |
| Automatic Data Processing, Inc. | | | 1,297 | | | | 398,088 | |
| Axon Enterprise, Inc.(a) | | | 920 | | | | 595,203 | |
| Blue Bird Corp.(a) | | | 7,100 | | | | 288,615 | |
| Brady Corp., Class A | | | 4,784 | | | | 358,274 | |
| Broadridge Financial Solutions, Inc. | | | 1,687 | | | | 398,166 | |
| Builders FirstSource, Inc.(a) | | | 1,915 | | | | 357,090 | |
| CACI International, Inc., Class A(a) | | | 720 | | | | 331,114 | |
| Carlisle Cos., Inc. | | | 850 | | | | 388,195 | |
| Caterpillar, Inc. | | | 1,019 | | | | 413,826 | |
| Cintas Corp. | | | 1,734 | | | | 391,520 | |
| Comfort Systems USA, Inc. | | | 1,030 | | | | 508,068 | |
| Copart, Inc.(a) | | | 7,212 | | | | 457,169 | |
| CSW Industrials, Inc. | | | 1,050 | | | | 443,509 | |
| Curtiss-Wright Corp. | | | 1,150 | | | | 429,674 | |
| Donaldson Co., Inc. | | | 5,012 | | | | 391,187 | |
| Dover Corp. | | | 1,898 | | | | 390,798 | |
| Dycom Industries, Inc.(a) | | | 1,920 | | | | 347,827 | |
| EMCOR Group, Inc. | | | 878 | | | | 447,885 | |
| Energy Recovery, Inc.(a) | | | 22,350 | | | | 347,766 | |
| Fastenal Co. | | | 5,096 | | | | 425,822 | |
| Federal Signal Corp. | | | 4,136 | | | | 402,888 | |
| FedEx Corp. | | | 1,200 | | | | 363,204 | |
| Ferguson Enterprises, Inc. | | | 1,800 | | | | 388,674 | |
| Franklin Covey Co.(a) | | | 9,050 | | | | 329,239 | |
| FTI Consulting, Inc.(a) | | | 1,575 | | | | 318,969 | |
| Genpact, Ltd. | | | 9,174 | | | | 423,472 | |
| Graco, Inc. | | | 4,272 | | | | 389,094 | |
| HEICO Corp., Class A | | | 1,750 | | | | 369,477 | |
| HNI Corp. | | | 6,850 | | | | 388,052 | |
| Howmet Aerospace, Inc. | | | 3,750 | | | | 443,925 | |
| Hubbell, Inc. | | | 882 | | | | 405,799 | |
| Hyster-Yale Materials Handling, Inc.(b) | | | 6,001 | | | | 337,496 | |
| IES Holdings, Inc.(a) | | | 2,221 | | | | 688,188 | |
| Interface, Inc. | | | 18,800 | | | | 499,140 | |
| ITT, Inc. | | | 2,650 | | | | 413,718 | |
| Lennox International, Inc. | | | 586 | | | | 390,938 | |
| Lindsay Corp. | | | 2,900 | | | | 385,033 | |
| Miller Industries, Inc. | | | 6,150 | | | | 452,763 | |
| MSA Safety, Inc. | | | 2,000 | | | | 347,620 | |
| Mueller Industries, Inc.(b) | | | 5,071 | | | | 409,585 | |
| Mueller Water Products, Inc. | | | 17,550 | | | | 439,452 | |
| NEXTracker, Inc.(a) | | | 9,650 | | | | 368,244 | |
| Old Dominion Freight Line, Inc. | | | 1,872 | | | | 421,462 | |
| Parker-Hannifin Corp. | | | 589 | | | | 414,008 | |
| Paychex, Inc. | | | 2,658 | | | | 388,786 | |
3 | November 30, 2024
Barron’s 400SM ETF
| Schedule of Investments | November 30, 2024 |
| Security Description | | Shares | | | Value | |
| Industrials (continued) | | | | | | |
| Paycom Software, Inc. | | | 2,094 | | | $ | 485,640 | |
| Paylocity Holding Corp.(a) | | | 2,272 | | | | 471,531 | |
| Powell Industries, Inc.(b) | | | 2,097 | | | | 560,696 | |
| RB Global, Inc.(b) | | | 4,200 | | | | 410,592 | |
| REV Group, Inc. | | | 13,050 | | | | 404,811 | |
| Rollins, Inc. | | | 7,015 | | | | 353,065 | |
| Snap-on, Inc. | | | 1,268 | | | | 468,767 | |
| SS&C Technologies Holdings, Inc. | | | 4,750 | | | | 367,365 | |
| Sterling Infrastructure, Inc.(a) | | | 2,795 | | | | 543,488 | |
| Terex Corp.(b) | | | 6,742 | | | | 369,394 | |
| Thermon Group Holdings, Inc.(a) | | | 12,347 | | | | 389,671 | |
| Trinity Industries, Inc. | | | 11,000 | | | | 414,700 | |
| UL Solutions, Inc. | | | 7,300 | | | | 392,229 | |
| United Airlines Holdings, Inc.(a) | | | 6,962 | | | | 674,130 | |
| United Rentals, Inc. | | | 476 | | | | 412,216 | |
| Upwork, Inc.(a)(b) | | | 35,350 | | | | 599,889 | |
| Veralto Corp. | | | 3,245 | | | | 351,077 | |
| Vertiv Holdings Co. | | | 4,095 | | | | 522,522 | |
| Watts Water Technologies, Inc., Class A | | | 1,850 | | | | 399,212 | |
| Willdan Group, Inc.(a) | | | 9,200 | | | | 402,132 | |
| Woodward, Inc. | | | 2,206 | | | | 397,786 | |
| Xylem, Inc. | | | 2,706 | | | | 342,986 | |
| Total Industrials | | | | | | | 32,013,000 | |
| | | | | | | | | |
| Information Technology (13.80%) | | | | | | | | |
| ACI Worldwide, Inc.(a) | | | 7,300 | | | | 414,786 | |
| ACM Research, Inc., Class A(a)(b) | | | 21,847 | | | | 375,550 | |
| Adobe, Inc.(a) | | | 689 | | | | 355,476 | |
| Akamai Technologies, Inc.(a) | | | 3,600 | | | | 338,472 | |
| Amphenol Corp., Class A | | | 5,663 | | | | 411,417 | |
| Apple, Inc. | | | 1,629 | | | | 386,611 | |
| Applied Materials, Inc. | | | 1,889 | | | | 330,027 | |
| AppLovin Corp., Class A(a) | | | 3,088 | | | | 1,039,884 | |
| Arista Networks, Inc.(a) | | | 1,009 | | | | 409,472 | |
| Autodesk, Inc.(a) | | | 1,324 | | | | 386,476 | |
| Badger Meter, Inc. | | | 1,665 | | | | 361,005 | |
| Bel Fuse, Inc., Class B(b) | | | 5,150 | | | | 412,927 | |
| BlackLine, Inc.(a)(b) | | | 7,150 | | | | 443,371 | |
| Cirrus Logic, Inc.(a) | | | 2,831 | | | | 295,698 | |
| Clear Secure, Inc.(b) | | | 11,500 | | | | 297,620 | |
| Cognizant Technology Solutions Corp., Class A | | | 4,585 | | | | 369,047 | |
| CommVault Systems, Inc.(a) | | | 2,400 | | | | 411,816 | |
| CompoSecure, Inc.(b) | | | 29,000 | | | | 462,550 | |
| Daktronics, Inc.(a)(b) | | | 28,250 | | | | 435,050 | |
| Dropbox, Inc.(a) | | | 14,350 | | | | 396,921 | |
| Dynatrace, Inc.(a) | | | 6,950 | | | | 390,520 | |
| F5, Inc.(a) | | | 1,657 | | | | 414,830 | |
| Fabrinet(a) | | | 1,600 | | | | 375,328 | |
| First Solar, Inc.(a) | | | 1,508 | | | | 300,499 | |
| Flex, Ltd.(a) | | | 11,950 | | | | 465,692 | |
| Fortinet, Inc.(a) | | | 4,680 | | | | 444,834 | |
| Gartner, Inc.(a) | | | 700 | | | | 362,551 | |
| GoDaddy, Inc., Class A(a) | | | 2,382 | | | | 470,612 | |
| Hackett Group, Inc. | | | 13,850 | | | | 434,059 | |
| Security Description | | Shares | | | Value | |
| Information Technology (continued) | | | | | | |
| Immersion Corp.(b) | | | 40,400 | | | $ | 361,176 | |
| InterDigital, Inc.(b) | | | 2,657 | | | | 520,666 | |
| International Business Machines Corp. | | | 1,625 | | | | 369,541 | |
| KLA Corp. | | | 480 | | | | 310,574 | |
| Manhattan Associates, Inc.(a) | | | 1,338 | | | | 381,919 | |
| Microsoft Corp. | | | 826 | | | | 349,778 | |
| Monolithic Power Systems, Inc. | | | 396 | | | | 224,785 | |
| Motorola Solutions, Inc. | | | 812 | | | | 405,756 | |
| Napco Security Technologies, Inc. | | | 9,064 | | | | 355,581 | |
| NetApp, Inc. | | | 3,021 | | | | 370,495 | |
| NVIDIA Corp. | | | 3,083 | | | | 426,225 | |
| ON Semiconductor Corp.(a) | | | 5,067 | | | | 360,365 | |
| Onto Innovation, Inc.(a) | | | 1,900 | | | | 311,942 | |
| Oracle Corp. | | | 2,100 | | | | 388,164 | |
| OSI Systems, Inc.(a)(b) | | | 2,489 | | | | 441,549 | |
| Palantir Technologies, Inc., Class A(a) | | | 9,850 | | | | 660,738 | |
| Palo Alto Networks, Inc.(a) | | | 1,055 | | | | 409,150 | |
| Pegasystems, Inc. | | | 5,323 | | | | 505,525 | |
| Photronics, Inc.(a) | | | 15,336 | | | | 382,020 | |
| QUALCOMM, Inc. | | | 2,146 | | | | 340,205 | |
| Qualys, Inc.(a) | | | 2,820 | | | | 433,152 | |
| Rambus, Inc.(a) | | | 9,000 | | | | 520,290 | |
| Teledyne Technologies, Inc.(a) | | | 850 | | | | 412,471 | |
| VeriSign, Inc.(a) | | | 1,950 | | | | 365,001 | |
| Workday, Inc., Class A(a) | | | 1,450 | | | | 362,486 | |
| Zoom Communications, Inc., Class A(a) | | | 5,302 | | | | 438,422 | |
| Total Information Technology | | | | | | | 22,401,077 | |
| | | | | | | | | |
| Materials (4.37%) | | | | | | | | |
| Air Products and Chemicals, Inc. | | | 1,250 | | | | 417,912 | |
| AptarGroup, Inc. | | | 2,350 | | | | 406,456 | |
| Cabot Corp. | | | 3,371 | | | | 369,529 | |
| Carpenter Technology Corp. | | | 2,550 | | | | 494,802 | |
| CF Industries Holdings, Inc. | | | 4,466 | | | | 400,422 | |
| Eagle Materials, Inc. | | | 1,303 | | | | 402,523 | |
| Ecolab, Inc. | | | 1,420 | | | | 353,253 | |
| FMC Corp. | | | 5,650 | | | | 333,858 | |
| Hawkins, Inc. | | | 3,050 | | | | 410,256 | |
| Louisiana-Pacific Corp. | | | 3,600 | | | | 425,520 | |
| Martin Marietta Materials, Inc. | | | 671 | | | | 402,600 | |
| NewMarket Corp. | | | 635 | | | | 338,811 | |
| Southern Copper Corp.(b) | | | 3,622 | | | | 363,468 | |
| Summit Materials, Inc., Class A(a) | | | 9,300 | | | | 473,742 | |
| Sylvamo Corp.(b) | | | 4,583 | | | | 422,965 | |
| United States Lime & Minerals, Inc. | | | 4,223 | | | | 646,119 | |
| Universal Stainless & Alloy Products, Inc.(a) | | | 9,700 | | | | 430,874 | |
| Total Materials | | | | | | | 7,093,110 | |
4 | November 30, 2024
Barron’s 400SM ETF
| Schedule of Investments | November 30, 2024 |
| Security Description | | Shares | | | Value | |
| Utilities (1.70%) | | | | | | |
| Brookfield Infrastructure Corp.(b) | | | 8,500 | | | $ | 381,565 | |
| Consolidated Water Co., Ltd. | | | 13,700 | | | | 368,941 | |
| Constellation Energy Corp. | | | 1,800 | | | | 461,808 | |
| NRG Energy, Inc. | | | 4,450 | | | | 452,164 | |
| Otter Tail Corp.(b) | | | 4,501 | | | | 362,961 | |
| Southern Co. | | | 4,000 | | | | 356,520 | |
| WEC Energy Group, Inc.(b) | | | 3,700 | | | | 373,885 | |
| Total Utilities | | | | | | | 2,757,844 | |
| | | | | | | | | |
| TOTAL COMMON STOCKS | | | | | | | | |
| (Cost $119,418,711) | | | | | | | 158,413,131 | |
| Security Description | | Shares | | | Value | |
| LIMITED PARTNERSHIPS (2.03%) | | | | | | | | |
| Energy (2.03%) | | | | | | | | |
| Alliance Resource Partners LP | | | 15,150 | | | | 427,685 | |
| Cheniere Energy Partners LP | | | 7,325 | | | | 426,681 | |
| Energy Transfer LP | | | 22,100 | | | | 438,906 | |
| Enterprise Products Partners LP | | | 12,025 | | | | 414,021 | |
| Hess Midstream LP, Class A | | | 9,616 | | | | 364,446 | |
| MPLX LP | | | 8,156 | | | | 421,339 | |
| Natural Resource Partners LP | | | 3,950 | | | | 432,486 | |
| Western Midstream Partners LP | | | 8,996 | | | | 366,227 | |
| Total Energy | | | | | | | 3,291,791 | |
| | | | | | | | | |
| TOTAL LIMITED PARTNERSHIPS | | | | | | | | |
| (Cost $2,561,064) | | | | | | | 3,291,791 | |
| | | 7 Day Yield | | | Shares | | | Value | |
| SHORT TERM INVESTMENTS (5.48%) | |
| Money Market Fund (0.34%) | | | | | | | | | |
| State Street Institutional Treasury Plus Money Market Fund (Premier Class) | | | | | | | | | |
| (Cost $549,004) | | | 4.59 | % | | | 549,004 | | | $ | 549,004 | |
| | | | | | | | | | | | | |
| Investments Purchased with Collateral from Securities Loaned (5.14%) | | | | | | | | | | | | |
| State Street Navigator Securities Lending Government Money Market Portfolio, 4.63% | | | | | | | | | | | | |
| (Cost $8,337,054) | | | | | | | 8,337,054 | | | | 8,337,054 | |
| TOTAL SHORT TERM INVESTMENTS | | | | |
| | | | | | | | | | | | | |
| (Cost $8,886,058) | | | | | | | | | | | 8,886,058 | |
| | | | | | | | | | | | | |
| TOTAL INVESTMENTS (105.11%) | | | | |
| (Cost $130,865,833) | | | | | | | | | | $ | 170,590,980 | |
| LIABILITIES IN EXCESS OF OTHER ASSETS (-5.11%) | | | (8,290,475 | ) |
| NET ASSETS - 100.00% | | $ | 162,300,505 | |
| (a) | Non-income producing security. |
| (b) | Security, or a portion of the security position is currently on loan. The total market value of securities on loan is $19,396,663. |
See Notes to Financial Statements and Financial Highlights.
5 | November 30, 2024
Barron’s 400SM ETF
| Statement of Assets and Liabilities | November 30, 2024 |
| ASSETS: | | | |
| Investments, at value* | | $ | 170,590,980 | |
| Dividends receivable | | | 129,877 | |
| Total Assets | | | 170,720,857 | |
| | | | | |
| LIABILITIES: | | | | |
| Payable to adviser | | | 83,298 | |
| Payable for collateral upon return of securities loaned | | | 8,337,054 | |
| Total Liabilities | | | 8,420,352 | |
| NET ASSETS | | $ | 162,300,505 | |
| | | | | |
| NET ASSETS CONSIST OF: | | | | |
| Paid-in capital | | $ | 158,013,758 | |
| Total distributable earnings/(accumulated losses) | | | 4,286,747 | |
| NET ASSETS | | $ | 162,300,505 | |
| | | | | |
| INVESTMENTS, AT COST | | $ | 130,865,833 | |
| | | | | |
| PRICING OF SHARES | | | | |
| Net Assets | | $ | 162,300,505 | |
| Shares of beneficial interest outstanding (Unlimited number of shares authorized, par value $0.01 per share) | | | 2,050,000 | |
| Net Asset Value, offering and redemption price per share | | $ | 79.17 | |
| * | Includes $19,396,663 of securities on loan. |
See Notes to Financial Statements and Financial Highlights.
6 | November 30, 2024
Barron’s 400SM ETF
| Statement of Operations | For the Year Ended November 30, 2024 |
| INVESTMENT INCOME: | | | |
| Dividend Income* | | $ | 2,327,780 | |
| Securities lending income | | | 38,817 | |
| Total investment income | | | 2,366,597 | |
| | | | | |
| EXPENSES: | | | | |
| Investment adviser fees | | | 918,924 | |
| Other expenses | | | 5,923 | |
| Net expenses | | | 924,847 | |
| NET INVESTMENT INCOME | | | 1,441,750 | |
| | | | | |
| REALIZED AND UNREALIZED GAIN/(LOSS): | | | | |
| Net realized gain on investments(a) | | | 20,657,427 | |
| Net change in unrealized appreciation/(depreciation) on investments | | | 24,282,171 | |
| NET REALIZED AND UNREALIZED GAIN ON INVESTMENTS | | | 44,939,598 | |
| NET INCREASE IN NET ASSETS RESULTING FROM OPERATIONS | | $ | 46,381,348 | |
| * | Net of foreign tax withholding of $4,018. |
| (a) | Includes realized gain or loss as a result of in-kind transactions (See Note 4 in Notes to Financial Statements and Financial Highlights). |
See Notes to Financial Statements and Financial Highlights.
7 | November 30, 2024
Barron’s 400SM ETF
Statements of Changes in Net Assets
| | | For the Year Ended November 30, 2024 | | | For the Year Ended November 30, 2023 | |
| OPERATIONS: | | | | | | | | |
| Net investment income | | $ | 1,441,750 | | | $ | 2,107,673 | |
| Net realized gain/(loss) | | | 20,657,427 | | | | (759,393 | ) |
| Net change in unrealized appreciation/(depreciation) | | | 24,282,171 | | | | 641,095 | |
| Net increase in net assets resulting from operations | | | 46,381,348 | | | | 1,989,375 | |
| | | | | | | | | |
| DISTRIBUTIONS TO SHAREHOLDERS: | | | | | | | | |
| From distributable earnings | | | (1,760,535 | ) | | | (2,124,271 | ) |
| Total distributions | | | (1,760,535 | ) | | | (2,124,271 | ) |
| | | | | | | | | |
| CAPITAL SHARE TRANSACTIONS: | | | | | | | | |
| Cost of shares redeemed | | | (14,307,311 | ) | | | (7,125,697 | ) |
| Net decrease from capital share transactions | | | (14,307,311 | ) | | | (7,125,697 | ) |
| Net increase/(decrease) in net assets | | | 30,313,502 | | | | (7,260,593 | ) |
| | | | | | | | | |
| NET ASSETS: | | | | | | | | |
| Beginning of year | | | 131,987,003 | | | | 139,247,596 | |
| End of year | | $ | 162,300,505 | | | $ | 131,987,003 | |
| | | | | | | | | |
| OTHER INFORMATION: | | | | | | | | |
| CAPITAL SHARE TRANSACTIONS: | | | | | | | | |
| Beginning shares | | | 2,275,000 | | | | 2,400,000 | |
| Shares sold | | | – | | | | – | |
| Shares redeemed | | | (225,000 | ) | | | (125,000 | ) |
| Shares outstanding, end of year | | | 2,050,000 | | | | 2,275,000 | |
See Notes to Financial Statements and Financial Highlights.
8 | November 30, 2024
Barron’s 400SM ETF
| Financial Highlights | For a Share Outstanding Throughout the Periods Presented |
| | | For the Year Ended November 30, 2024 | | | For the Year Ended November 30, 2023 | | | For the Year Ended November 30, 2022 | | | For the Year Ended November 30, 2021 | | | For the Year Ended November 30, 2020 | |
| NET ASSET VALUE, BEGINNING OF PERIOD | | $ | 58.02 | | | $ | 58.02 | | | $ | 62.39 | | | $ | 47.32 | | | $ | 42.04 | |
| | | | | | | | | | | | | | | | | | | | | |
| INCOME FROM OPERATIONS: | | | | | | | | | | | | | | | | | | | | |
| Net investment income(a) | | | 0.69 | | | | 0.91 | | | | 0.75 | | | | 0.52 | | | | 0.43 | |
| Net realized and unrealized gain/(loss) | | | 21.24 | | | | (0.02 | ) | | | (4.55 | ) | | | 15.05 | | | | 5.14 | |
| Total from investment operations | | | 21.93 | | | | 0.89 | | | | (3.80 | ) | | | 15.57 | | | | 5.57 | |
| | | | | | | | | | | | | | | | | | | | | |
| DISTRIBUTIONS: | | | | | | | | | | | | | | | | | | | | |
| From net investment income | | | (0.78 | ) | | | (0.89 | ) | | | (0.57 | ) | | | (0.50 | ) | | | (0.29 | ) |
| Total distributions | | | (0.78 | ) | | | (0.89 | ) | | | (0.57 | ) | | | (0.50 | ) | | | (0.29 | ) |
| | | | | | | | | | | | | | | | | | | | | |
| NET INCREASE/(DECREASE) IN NET ASSET VALUE | | | 21.15 | | | | 0.00 | | | | (4.37 | ) | | | 15.07 | | | | 5.28 | |
| NET ASSET VALUE, END OF PERIOD | | $ | 79.17 | | | $ | 58.02 | | | $ | 58.02 | | | $ | 62.39 | | | $ | 47.32 | |
| TOTAL RETURN(b) | | | 38.15 | % | | | 1.67 | % | | | (6.18 | )% | | | 33.18 | % | | | 13.33 | % |
| | | | | | | | | | | | | | | | | | | | | |
| RATIOS/SUPPLEMENTAL DATA: | | | | | | | | | | | | | | | | | | | | |
| Net assets, end of period (in 000s) | | $ | 162,301 | | | $ | 131,987 | | | $ | 139,248 | | | $ | 155,968 | | | $ | 118,293 | |
| | | | | | | | | | | | | | | | | | | | | |
| Ratio of expenses to average net assets | | | 0.65 | % | | | 0.65 | % | | | 0.65 | % | | | 0.65 | % | | | 0.65 | % |
| Ratio of net investment income to average net assets | | | 1.03 | % | | | 1.63 | % | | | 1.32 | % | | | 0.90 | % | | | 1.08 | % |
| Portfolio turnover rate(c) | | | 90 | % | | | 83 | % | | | 94 | % | | | 91 | % | | | 83 | % |
| (a) | Based on average shares outstanding during the period. |
| (b) | Total return is calculated assuming an initial investment made at the net asset value at the beginning of the year and redemption at the net asset value on the last day of the year and assuming all distributions are reinvested at the reinvestment prices. Total return calculated for a period of less than one year is not annualized. |
| (c) | Portfolio turnover for periods less than one year are not annualized and does not include securities received or delivered from processing creations or redemptions in-kind. |
See Notes to Financial Statements and Financial Highlights.
9 | November 30, 2024
Barron’s 400SM ETF
| Notes to Financial Statements and Financial Highlights | November 30, 2024 |
1. ORGANIZATION
ALPS ETF Trust (the “Trust”), a Delaware statutory trust, is an open-end management investment company registered under the Investment Company Act of 1940, as amended (the “1940 Act”). As of November 30, 2024, the Trust consisted of twenty-three separate portfolios. Each portfolio represents a separate series of the Trust. This report pertains solely to the Barron’s 400SM ETF (the “Fund”). The investment objective of the Fund is to seek investment results that correspond generally, before fees and expenses, to the performance of the Barron’s 400 IndexSM (the “Underlying Index”). The Fund has elected to qualify as a diversified series of the Trust under the 1940 Act.
The Fund’s Shares (“Shares”) are listed on the NYSE Arca, Inc. (the “NYSE Arca”). The Fund issues and redeems Shares, at net asset value (“NAV”) in blocks of 25,000 Shares, each of which is called a “Creation Unit”. Creation Units are issued and redeemed principally in-kind for securities included in the Underlying Index. Except when aggregated in Creation Units, Shares are not redeemable securities of the Fund.
Pursuant to the Trust’s organizational documents, its Officers and Trustees are indemnified against certain liability arising out of the performance of their duties to the Trust. Additionally, in the normal course of business, the Trust enters into contracts with service providers that contain general indemnification clauses. The Trust’s maximum exposure under these arrangements is unknown, as this would involve future claims that may be made against the Trust that have not yet occurred.
2. SIGNIFICANT ACCOUNTING POLICIES
The following is a summary of significant accounting policies consistently followed by the Fund in the preparation of the financial statements. The accompanying financial statements were prepared in accordance with accounting principles generally accepted in the United States of America (“U.S. GAAP”). The preparation of financial statements in conformity with U.S. GAAP requires management to make certain estimates and assumptions that affect the reported amounts of assets and liabilities and disclosures of contingent assets and liabilities at the date of the financial statements and the reported amounts of revenue and expenses during the period. Actual results could differ from those estimates. The Fund is considered an investment company under U.S. GAAP and follows the accounting and reporting guidance applicable to investment companies in the Financial Accounting Standards Board (“FASB”) Accounting Standards Codification Topic 946.
A. Portfolio Valuation
The Fund’s NAV is determined daily, as of the close of regular trading on the New York Stock Exchange (the “NYSE”), normally 4:00 p.m. Eastern time, on each day the NYSE is open for trading. The NAV is computed by dividing the value of all assets of the Fund (including accrued interest and dividends), less all liabilities (including accrued expenses and dividends declared but unpaid), by the total number of shares outstanding.
Portfolio securities listed on any exchange other than the NASDAQ Stock Market LLC (“NASDAQ”) are valued at the last sale price on the business day as of which such value is being determined. If there has been no sale on such day, the securities are valued at the mean of the most recent bid and ask prices on such day. Securities traded on the NASDAQ are valued at the NASDAQ Official Closing Price as determined by NASDAQ. Portfolio securities traded on more than one securities exchange are valued at the last sale price on the business day as of which such value is being determined at the close of the exchange representing the principal market for such securities. Portfolio securities traded in the over-the-counter market, but excluding securities traded on the NASDAQ, are valued at the last quoted sale price in such market.
The Fund’s investments are valued at market value or, in the absence of market value with respect to any portfolio securities, at fair value according to procedures adopted by the Trust’s Board of Trustees (the “Board”). Pursuant to Rule 2a-5 under the 1940 Act, the Board designated ALPS Advisors, Inc. (the "Adviser") as the valuation designee ("Valuation Designee") for the Fund to perform the fair value determinations relating to Fund investments. The Adviser may carry out its designated responsibilities as Valuation Designee through various teams and committees. When market quotations are not readily available or when events occur that make established valuation methods unreliable, securities of the Fund may be valued in good faith by the Valuation Designee. These securities generally include, but are not limited to, restricted securities (securities which may not be publicly sold without registration under the Securities Act of 1933) for which a pricing service is unable to provide a market price; securities whose trading has been formally suspended; a security whose market price is not available from a pre-established primary pricing source or the pricing source is not willing to provide a price; a security with respect to which an event has occurred that is most likely to materially affect the value of the security after the market has closed but before the calculation of the Fund’s NAV or make it difficult or impossible to obtain a reliable market quotation; or a security whose price, as provided by the pricing service, does not reflect the security’s “fair value” due to the security being de-listed from a national exchange or the security’s primary trading market is temporarily closed at a time when, under normal conditions, it would be open. As a general principle, the current “fair value” of a security would be the amount which the owner might reasonably expect to receive from the sale on the applicable exchange or principal market. A variety of factors may be considered in determining the fair value of such securities.
10 | November 30, 2024
Barron’s 400SM ETF
| Notes to Financial Statements and Financial Highlights | November 30, 2024 |
B. Fair Value Measurements
The Fund discloses the classification of its fair value measurements following a three-tier hierarchy based on the inputs used to measure fair value. Inputs refer broadly to the assumptions that market participants would use in pricing the asset or liability, including assumptions about risk. Inputs may be observable or unobservable. Observable inputs reflect the assumptions market participants would use in pricing the asset or liability that are developed based on market data obtained from sources independent of the reporting entity. Unobservable inputs reflect the reporting entity’s own assumptions about the assumptions market participants would use in pricing the asset or liability that are developed based on the best information available.
Valuation techniques used to value the Fund's investments by major category are as follows:
Equity securities and Limited Partnerships, including restricted securities, for which market quotations are readily available, are valued at the last reported sale price or official closing price as reported by a third party pricing vendor on the primary market or exchange on which they are traded and are categorized as Level 1 in the hierarchy. In the event there were no sales during the day or closing prices are not available, securities are valued at the mean of the most recent quoted bid and ask prices on such day and are generally categorized as Level 2 in the hierarchy. Investments in open-end mutual funds are valued at their closing NAV each business day and are categorized as Level 1 in the hierarchy.
Changes in valuation techniques may result in transfers in or out of an assigned level within the disclosure hierarchy.
Various inputs are used in determining the value of the Fund’s investments as of the end of the reporting period. When inputs used fall into different levels of the fair value hierarchy, the level in the hierarchy within which the fair value measurement falls is determined based on the lowest level input that is significant to the fair value measurement in its entirety. The designated input levels are not necessarily an indication of the risk or liquidity associated with these investments.
These inputs are categorized in the following hierarchy under applicable financial accounting standards:
| Level 1 – | Unadjusted quoted prices in active markets for identical investments, unrestricted assets or liabilities that a Fund has the ability to access at the measurement date; |
| | |
| Level 2 – | Quoted prices which are not active, quoted prices for similar assets or liabilities in active markets or inputs other than quoted prices that are observable (either directly or indirectly) for substantially the full term of the asset or liability; and |
| | |
| Level 3 – | Significant unobservable prices or inputs (including the Fund’s own assumptions in determining the fair value of investments) where there is little or no market activity for the asset or liability at the measurement date. |
The following is a summary of the inputs used to value the Fund’s investments as of November 30, 2024:
Barron's 400 ETF
| Investments in Securities at Value | | Level 1 - Quoted and Unadjusted Prices | | | Level 2 - Other Significant Observable Inputs | | | Level 3 - Significant Unobservable Inputs | | | Total | |
| Common Stocks* | | $ | 158,413,131 | | | $ | – | | | $ | – | | | $ | 158,413,131 | |
| Limited Partnerships* | | | 3,291,791 | | | | – | | | | – | | | | 3,291,791 | |
| Short Term Investments | | | 8,886,058 | | | | – | | | | – | | | | 8,886,058 | |
| Total | | $ | 170,590,980 | | | $ | – | | | $ | – | | | $ | 170,590,980 | |
| * | For a detailed sector breakdown, see the accompanying Schedule of Investments. |
The Fund did not have any securities that used significant unobservable inputs (Level 3) in determining fair value and there were no transfers into or out of Level 3 during the year ended November 30, 2024.
C. Securities Transactions and Investment Income
Securities transactions are recorded as of the trade date. Realized gains and losses from securities transactions are recorded on the specific identification in accordance with GAAP. Dividend income and capital gains distributions, if any, are recorded on the ex-dividend date. Interest income, if any, is recorded on the accrual basis.
11 | November 30, 2024
Barron’s 400SM ETF
| Notes to Financial Statements and Financial Highlights | November 30, 2024 |
D. Dividends and Distributions to Shareholders
Dividends from net investment income of the Fund, if any, are declared and paid annually or as the Board may determine from time to time. Distributions of net realized capital gains earned by the Fund, if any, are distributed at least annually.
E. Federal Tax and Tax Basis Information
The timing and character of income and capital gain distributions are determined in accordance with income tax regulations, which may differ from U.S. GAAP. Reclassifications are made to the Fund’s capital accounts for permanent tax differences to reflect income and gains available for distribution (or available capital loss carryforwards) under income tax regulations.
For the year ended November 30, 2024, the following reclassifications, which had no impact on results of operations or net assets, were recorded to reflect permanent tax differences resulting primarily from in-kind transactions, investment in partnerships, and prior year tax return true-up:
| Fund | | Paid-in Capital | | | Total Distributable Earnings/(Accumulated Losses) | |
| Barron’s 400SM ETF | | $ | 3,035,157 | | | $ | (3,035,157 | ) |
The tax character of the distributions paid during the fiscal years ended November 30, 2024 and November 30, 2023 was as follows:
| Fund | | Ordinary Income | | | Long-Term Capital Gain | | | Return of Capital | |
| November 30, 2024 | | | | | | | | | | | | |
| Barron’s 400SM ETF | | $ | 1,760,535 | | | $ | – | | | $ | – | |
| Fund | | Ordinary Income | | | Long-Term Capital Gain | | | Return of Capital | |
| November 30, 2023 | | | | | | | | | | | | |
| Barron’s 400SM ETF | | $ | 2,124,271 | | | $ | – | | | $ | – | |
The character of distributions made during the year may differ from its ultimate characterization for federal income tax purposes.
Under current law, capital losses maintain their character as short-term or long-term and are carried forward to the next tax year without expiration. As of November 30, 2024, the following amounts are available as carry forwards to the next tax year:
| Fund | | Short-Term | | | Long-Term | |
| Barron’s 400SM ETF | | $ | 36,595,146 | | | $ | – | |
The Fund used capital loss carryovers during the year ended November 30, 2024, in the amount of $17,765,236.
As of November 30, 2024, the components of distributable earnings/(accumulated losses) on a tax basis were as follows:
| | | Barron’s 400SM ETF | |
| Undistributed net investment income | | $ | 787,404 | |
| Accumulated net realized loss on investments | | | (36,595,146 | ) |
| Net unrealized appreciation on investments | | | 40,094,489 | |
| Total | | $ | 4,286,747 | |
As of November 30, 2024, the cost of investments for federal income tax purposes and accumulated net unrealized appreciation/(depreciation) on investments were as follows:
| | | Barron’s 400SM ETF | |
| Gross appreciation (excess of value over tax cost) | | $ | 42,663,346 | |
| Gross depreciation (excess of tax cost over value) | | | (2,568,857 | ) |
| Net depreciation of foreign currency | | | – | |
| Net unrealized appreciation/(depreciation) | | $ | 40,094,489 | |
| Cost of investments for income tax purposes | | $ | 130,496,491 | |
12 | November 30, 2024
Barron’s 400SM ETF
| Notes to Financial Statements and Financial Highlights | November 30, 2024 |
The differences between book-basis and tax-basis are primarily due to the deferral of losses from wash sales and investments in partnerships.
F. Income Taxes
No provision for income taxes is included in the accompanying financial statements, as the Fund intends to distribute to shareholders all taxable investment income and realized gains and otherwise comply with Subchapter M of the Internal Revenue Code of 1986, as amended, applicable to regulated investment companies. The Fund evaluates tax positions taken (or expected to be taken) in the course of preparing the Fund’s tax returns to determine whether these positions meet a “more-likely-than-not” standard that, based on the technical merits, have a more than fifty percent likelihood of being sustained by a taxing authority upon examination. A tax position that meets the “more-likely-than-not” recognition threshold is measured to determine the amount of benefit to recognize in the financial statements.
As of and during the year ended November 30, 2024, the Fund did not have a liability for any unrecognized tax benefits. The Fund files U.S. federal, state, and local tax returns as required. The Fund’s tax returns are subject to examination by the relevant tax authorities until expiration of the applicable statute of limitations, which is generally three years after the filing of the tax return, but may extend to four years in certain jurisdictions. Tax returns for open years have incorporated no uncertain tax positions that require a provision for income taxes.
G. Lending of Portfolio Securities
The Fund has entered into a securities lending agreement with State Street Bank & Trust Co. (“SSB”), the Fund’s lending agent. The Fund may lend its portfolio securities only to borrowers that are approved by SSB. The Fund will limit such lending to not more than 33 1/3% of the value of its total assets. The Fund’s securities held at SSB as custodian shall be available to be lent except those securities the Fund or ALPS Advisors, Inc. specifically identifies in writing as not being available for lending. The borrower pledges and maintains with the Fund collateral consisting of cash (U.S. Dollars only), securities issued or guaranteed by the U.S. government or its agencies or instrumentalities, and cash equivalents (including irrevocable bank letters of credit) issued by a person other than the borrower or an affiliate of the borrower. The initial collateral received by the Fund is required to have a value of no less than 102% of the market value of the loaned securities for U.S equity securities and a value of no less than 105% of the market value for non-U.S. equity securities. The collateral is maintained thereafter, at a market value equal to not less than 102% of the current value of the U.S. equity securities on loan and not less than 105% of the current value of the non-U.S. equity securities on loan. The market value of the loaned securities is determined at the close of each business day and any additional required collateral is delivered to the Fund on the next business day. During the term of the loan, the Fund is entitled to all distributions made on or in respect of the loaned securities. Loans of securities are terminable at any time and the borrower, after notice, is required to return borrowed securities within the customary time period for settlement of securities transactions.
Any cash collateral received is reinvested in a money market fund managed by SSB as disclosed in the Fund’s Schedule of Investments and is reflected in the Statement of Assets and Liabilities as a payable for collateral upon return of securities loaned. Non-cash collateral, in the form of securities issued or guaranteed by the U.S. government or its agencies or instrumentalities, is not disclosed in the Fund’s Statement of Assets and Liabilities or the contractual maturity table below as it is held by the lending agent on behalf of the Fund, and the Fund does not have the ability to re-hypothecate these securities. Income earned by the Fund from securities lending activity is disclosed in the Statement of Operations.
The following is a summary of the Fund's securities lending agreement and related cash and non-cash collateral received as of November 30, 2024:
| | | Market Value of Securities on Loan | | | Cash Collateral Received | | | Non-Cash Collateral Received | | | Total Collateral Received | |
| Barron's 400 SM ETF | | $ | 19,396,663 | | | $ | 8,337,054 | | | $ | 11,411,637 | | | $ | 19,748,691 | |
The risks of securities lending include the risk that the borrower may not provide additional collateral when required or may not return the securities when due. To mitigate these risks, the Fund benefits from a borrower default indemnity provided by SSB. SSB’s indemnity allows for full replacement of securities lent wherein SSB will purchase the unreturned loaned securities on the open market by applying the proceeds of the collateral, or to the extent such proceeds are insufficient or the collateral is unavailable, SSB will purchase the unreturned loan securities at SSB’s expense. However, the Fund could suffer a loss if the value of the investments purchased with cash collateral falls below the value of the cash collateral received.
13 | November 30, 2024
Barron’s 400SM ETF
| Notes to Financial Statements and Financial Highlights | November 30, 2024 |
The following table reflects a breakdown of transactions accounted for as secured borrowings, the gross obligation by the type of collateral pledged or securities loaned, and the remaining contractual maturity of those transactions as of November 30, 2024:
| Barron's 400 SM ETF | | Remaining contractual maturity of the agreements | |
| Securities Lending Transactions | | Overnight & Continuous | | | Up to 30 Days | | | 30-90 Days | | | Greater than 90 Days | | | Total | |
| Common Stocks | | $ | 8,337,054 | | | $ | | | | $ | – | | | $ | – | | | $ | 8,337,054 | |
| Total Borrowings | | | | | | | | | | | | | | | | | | | 8,337,054 | |
| Gross amount of recognized liabilities for securities lending (collateral received) | | | | $ | 8,337,054 | |
3. INVESTMENT ADVISORY FEE AND OTHER AFFILIATED TRANSACTIONS
ALPS Advisors, Inc. serves as the Fund’s investment adviser pursuant to an Investment Advisory Agreement with the Trust on behalf of the Fund (the “Advisory Agreement”). Pursuant to the Advisory Agreement, the Fund pays the Adviser an annual management fee for the services and facilities it provides, payable on a monthly basis at the annual rate of 0.65% of the Fund’s average daily net assets. From time to time, the Adviser may waive all or a portion of its fee.
Out of the unitary management fees, the Adviser pays substantially all expenses of the Fund, including the cost of transfer agency, custody, fund administration, legal, audit, trustees and other services, except for interest expenses, distribution fees or expenses, brokerage expenses, taxes and extraordinary expenses not incurred in the ordinary course of the Fund's business. The Adviser’s unitary management fee is designed to pay substantially all of the Fund’s expenses and to compensate the Adviser for providing services to the Fund.
ALPS Fund Services, Inc., an affiliate of the Adviser, is the administrator of the Fund.
Each Trustee receives (1) a quarterly retainer of $25,000, (2) a per meeting fee of $15,000, (3) $2,500 for any special meeting held outside of a regularly scheduled board meeting, and (4) reimbursement for all reasonable out-of-pocket expenses relating to attendance at meetings. In addition, the Chairman of the Board receives a quarterly retainer of $5,000, the Chairman of the Audit Committee receives a quarterly retainer of $3,000, and the Chairman of the Nominating & Governance Committee receives a quarterly retainer of $2,000, each in connection with their respective roles.
4. PURCHASES AND SALES OF SECURITIES
For the year ended November 30, 2024, the cost of purchases and proceeds from sales of investment securities, excluding in-kind transactions and short-term investments, were as follows:
| Fund | | Purchases | | | Sales | |
| Barron's 400 ETF | | $ | 127,235,988 | | | $ | 127,362,732 | |
For the year ended November 30, 2024, the cost of in-kind purchases and proceeds from in-kind sales were as follows:
| Fund | | Purchases | | | Sales | |
| Barron's 400 ETF | | $ | – | | | $ | 14,324,278 | |
For the year ended November 30, 2024, the Fund had in-kind net realized gains of $2,995,004.
Gains on in-kind transactions are not considered taxable for federal income tax purposes and losses on in-kind transactions are also not deductible for tax purposes.
5. CAPITAL SHARE TRANSACTIONS
Shares are created and redeemed by the Fund only in Creation Unit size aggregations of 25,000 Shares. Only broker-dealers or large institutional investors with creation and redemption agreements called Authorized Participants (“AP”) are permitted to purchase or redeem Creation Units from the Fund. Such transactions are generally permitted on an in-kind basis, with a balancing cash component to equate the transaction to the NAV per unit of the Fund on the transaction date. Cash may be substituted equivalent to the value of certain securities generally when they are not available in sufficient quantity for delivery, not eligible for trading by the AP or as a result of other market circumstances.
14 | November 30, 2024
Barron’s 400SM ETF
| Notes to Financial Statements and Financial Highlights | November 30, 2024 |
6. RELATED PARTY TRANSACTIONS
The Fund engaged in cross trades between other funds in the Trust during the year ended November 30, 2024 pursuant to Rule 17a-7 under the 1940 Act. Cross trading is the buying or selling of portfolio securities between funds to which the Adviser serves as the investment adviser. The Board previously adopted procedures that apply to transactions between the Funds of the Trust pursuant to Rule 17a-7. These transactions related to cross trades during the period complied with the requirements set forth by Rule 17a-7 and the Trust’s procedures.
Transactions related to cross trades during the year ended November 30, 2024, were as follows:
| Fund | | Purchase Cost Paid | | | Sale Proceeds Received | | | Realized Gain/(Loss) on Sales | |
| Barron's 400 SM ETF | | $ | 505,273 | | | $ | 634,548 | | | $ | (125,230 | ) |
7. MARKET RISK
The Fund is subject to investment and operational risks associated with financial, economic and other global market developments and disruptions, including those arising from war, terrorism, market manipulation, government interventions, defaults and shutdowns, political changes or diplomatic developments, public health emergencies (such as the spread of infectious diseases, pandemics and epidemics) and natural/environmental disasters, which can negatively impact the securities markets and cause the Fund to lose value. Securities in the Fund’s portfolio may underperform in comparison to securities in general financial markets, a particular financial market or other asset classes due to a number of factors, including inflation (or expectations for inflation), deflation (or expectations for deflation), interest rates, global demand for particular products or resources, market instability, debt crises and downgrades, embargoes, tariffs, sanctions and other trade barriers, regulatory events, other governmental trade or market control programs and related geopolitical events. In addition, the value of the Fund’s investments may be negatively affected by the occurrence of global events such as war, terrorism, environmental disasters, natural disasters or events, country instability, and infectious disease epidemics or pandemics.
8. SUBSEQUENT EVENTS
Subsequent events, if any, after the date of the Statement of Assets and Liabilities have been evaluated through the date the financial statements were issued. Management has determined that there were no subsequent events to report through the issuance of these financial statements.
15 | November 30, 2024
Barron’s 400SM ETF
Report of Independent Registered Public Accounting Firm
To the Shareholders of Barron’s 400SM ETF
and Board of Trustees of ALPS ETF Trust
Opinion on the Financial Statements
We have audited the accompanying statement of assets and liabilities, including the schedule of investments, of Barron’s 400SM ETF (the “Fund”), a series of ALPS ETF Trust, as of November 30, 2024, the related statement of operations for the year then ended, the statements of changes in net assets and financial highlights for each of the two years in the period then ended, and the related notes (collectively referred to as the “financial statements”). In our opinion, the financial statements present fairly, in all material respects, the financial position of the Fund as of November 30, 2024, the results of its operations for the year then ended, and the changes in net assets and financial highlights for each of the two years in the period then ended, in conformity with accounting principles generally accepted in the United States of America.
The Fund’s financial highlights for the years ended November 30, 2022, and prior, were audited by other auditors whose report dated January 27, 2023, expressed an unqualified opinion on those financial highlights.
Basis for Opinion
These financial statements are the responsibility of the Fund’s management. Our responsibility is to express an opinion on the Fund’s financial statements based on our audits. We are a public accounting firm registered with the Public Company Accounting Oversight Board (United States) (“PCAOB”) and are required to be independent with respect to the Fund in accordance with the U.S. federal securities laws and the applicable rules and regulations of the Securities and Exchange Commission and the PCAOB.
We conducted our audits in accordance with the standards of the PCAOB. Those standards require that we plan and perform the audit to obtain reasonable assurance about whether the financial statements are free of material misstatement whether due to error or fraud.
Our audits included performing procedures to assess the risks of material misstatement of the financial statements, whether due to error or fraud, and performing procedures that respond to those risks. Such procedures included examining, on a test basis, evidence regarding the amounts and disclosures in the financial statements. Our procedures included confirmation of securities owned as of November 30, 2024, by correspondence with the custodian. Our audits also included evaluating the accounting principles used and significant estimates made by management, as well as evaluating the overall presentation of the financial statements. We believe that our audits provide a reasonable basis for our opinion.
We have served as the auditor of one or more investment companies advised by ALPS Advisors, Inc. since 2013.

COHEN & COMPANY, LTD.
Philadelphia, Pennsylvania
January 29, 2025
16 | November 30, 2024
Barron’s 400SM ETF
| Additional Information | November 30, 2024 (Unaudited) |
TAX INFORMATION
The Barron’s 400 SM ETF designates the following as a percentage of taxable ordinary income distributions, or up to the maximum amount allowable, for the calendar year ended December 31, 2023:
| | Qualified Dividend Income | Dividend Received Deduction |
| Barron's 400 SM ETF | 100% | 100% |
In early 2024, if applicable, shareholders of record received this information for the distributions paid to them by the Fund during the calendar year 2023 via Form 1099. The Fund will notify shareholders in early 2025 of amounts paid to them by the Fund, if any, during the calendar year 2024.
LICENSING AGREEMENT
MarketGrader Capital, LLC (the “Index Provider”) has entered into a license agreement with Dow Jones & Company to use the “Barron’s” name and certain related intellectual property in connection with the Underlying Index. The Index Provider also has entered into a license and services agreement with its parent company, MarketGrader.com, to use the methodology for constructing the Underlying Index. The Index Provider in turn has entered into the Sublicense Agreement with the Adviser to use the Underlying Index. The following disclosure relates to such licensing agreements:
The Barron’s 400 SM ETF (the “Fund”) is not sponsored, managed or advised by the Index Provider. The Index Provider makes no representation or warranty, express or implied, to the owners of the Fund or any member of the public regarding the advisability of investing in securities generally or in the Fund particularly or the ability of the Underlying Index to track the performance of a market or sector. The Index Provider’s only relationship to the Adviser or the Fund is the licensing of certain service marks and trade names of the Index Provider and of the Underlying Index that is determined, composed and calculated by the Index Provider without regard to the Adviser or the Fund. The Index Provider has no obligation to take the needs of the Adviser or the Fund or the owners of the Fund into consideration in determining, composing or calculating the Underlying Index.
THE INDEX PROVIDER DOES NOT GUARANTEE THE ACCURACY AND/OR THE COMPLETENESS OF THE UNDERLYING INDEX OR ANY DATA INCLUDED THEREIN AND THE INDEX PROVIDER SHALL HAVE NO LIABILITY FOR ANY ERRORS, OMISSIONS, OR INTERRUPTIONS THEREIN. THE INDEX PROVIDER MAKES NO WARRANTY, EXPRESS OR IMPLIED, AS TO RESULTS TO BE OBTAINED BY THE ADVISER, THE FUND, OWNERS OF THE FUND, OR ANY OTHER PERSON OR ENTITY FROM THE USE OF THE UNDERLYING INDEX OR ANY DATA INCLUDED THEREIN. THE INDEX PROVIDER MAKES NO EXPRESS OR IMPLIED WARRANTIES, AND EXPRESSLY DISCLAIMS ALL WARRANTIES OF MERCHANTABILITY OR FITNESS FOR A PARTICULAR PURPOSE OR USE WITH RESPECT TO THE UNDERLYING INDEX OR ANY DATA INCLUDED THEREIN. WITHOUT LIMITING ANY OF THE FOREGOING, IN NO EVENT SHALL THE INDEX PROVIDER HAVE ANY LIABILITY FOR ANY SPECIAL, PUNITIVE, INDIRECT, OR CONSEQUENTIAL DAMAGES (INCLUDING LOST PROFITS), EVEN IF NOTIFIED OF THE POSSIBILITY OF SUCH DAMAGES.
“The Barron’s 400 Index℠” is calculated and published by the Index Provider. “Barron’s,” “Barron’s 400” and “Barron’s 400 Index” are trademarks or service marks of DJC & Company, Inc. (“DJC”) or its affiliates and have been licensed to the Index Provider and sublicensed for certain purposes by Barron’s 400 Exchange Traded Fund, a sub-fund of that certain ALPS ETF Trust, a Delaware Statutory Trust (the “Sub-Licensee”). The Barron’s 400℠ ETF (the “Product”) is not sponsored or advised by DJC or its affiliates. DJC and its affiliates make no representation or warranty, express or implied, to the Licensee or to the owners of the Product(s) or any member of the public regarding the advisability of trading in the Product. DJC and its affiliates’ only relationship to the Licensee is the licensing of certain trademarks and trade names of DJC. The Barron's 400 IndexSM is determined, composed and calculated by the Index Provider without regard to DJC. DJC has no obligation to take the needs of the Licensee or the owners of the Product into consideration in connection with its licensing of the Barron’s 400 IndexSM to the Index Provider or the Sub-Licensee to Licensee. DJC and its affiliates are not responsible for and have not participated in the calculation of the Barron's 400 IndexSM or in the determination of the timing of, prices at, or quantities of the Fund to be sold or in the determination or calculation of the equation by which the Product are to be converted into cash. DJC and its affiliates have no obligation or liability in connection with the administration, marketing or trading of the Barron’s 400 IndexSM or the Product.
DOW JONES DOES NOT GUARANTEE THE ACCURACY AND/OR THE COMPLETENESS OF THE BARRON’S 400 INDEXSM OR ANY DATA INCLUDED THEREIN AND DOW JONES AND ITS AFFILIATES SHALL HAVE NO LIABILITY FOR ANY ERRORS, OMISSIONS, OR INTERRUPTIONS THEREIN. DOW JONES AND ITS AFFILIATES MAKE NO WARRANTY, EXPRESS OR IMPLIED, AS TO RESULTS TO BE OBTAINED BY THE LICENSEE, OWNERS OF THE FUND, OR ANY OTHER PERSON OR ENTITY FROM THE USE OF THE BARRON’S 400 INDEXSM OR ANY DATA INCLUDED THEREIN. DOW JONES AND ITS AFFILIATES MAKE NO EXPRESS OR IMPLIED WARRANTIES. AND EXPRESSLY DISCLAIM ALL WARRANTIES, OF MERCHANTABILITY OR FITNESS FOR A PARTICULAR PURPOSE OR USE WITH RESPECT TO THE BARRON’S 400 INDEXSM OR ANY DATA INCLUDED THEREIN. WITHOUT LIMITING ANY OF THE FOREGOING, IN NO EVENT SHALL DOW JONES AND ITS AFFILIATES HAVE ANY LIABILITY FOR ANY LOST PROFITS OR INDIRECT, PUNITIVE, SPECIAL OR CONSEQUENTIAL DAMAGES OR LOSSES, EVEN IF NOTIFIED OF THE POSSIBILITY OF SUCH DAMAGES. THERE ARE NO THIRD PARTY BENEFICIARIES OF ANY AGREEMENTS OR ARRANGEMENTS BETWEEN DJC AND THE LICENSEE, OTHER THAN THE LICENSORS OF MARKETGRADER.
17 | November 30, 2024
Barron’s 400SM ETF
| Additional Information | November 30, 2024 (Unaudited) |
The Adviser does not guarantee the accuracy and/or the completeness of the Underlying Index or any data included therein, and the Adviser shall have no liability for any errors, omissions or interruptions therein. The Adviser makes no warranty, express or implied, as to results to be obtained by the Fund, owners of the Shares of the Fund or any other person or entity from the use of the Underlying Index or any data included therein. The Adviser makes no express or implied warranties, and expressly disclaims all warranties of merchantability or fitness for a particular purpose or use with respect to the Underlying Index or any data included therein. Without limiting any of the foregoing, in no event shall the Adviser have any liability for any special, punitive, direct, indirect or consequential damages (including lost profits) arising out of matters relating to the use of the Underlying Index, even if notified of the possibility of such damages.
18 | November 30, 2024
Barron’s 400SM ETF
Changes in and Disagreements with Accountants for Open-End Management Investment Companies | November 30, 2024 (Unaudited) |
On March 14, 2023, BBD LLP (“BBD”) ceased to serve as the independent registered public accounting firm of the Fund. The Board approved the replacement of BBD as a result of Cohen & Company, Ltd.’s (“Cohen”) acquisition of BBD’s investment management group.
The report of BBD on the financial statements of the Fund as of and for the fiscal year or period ended November 30, 2022 did not contain an adverse opinion or a disclaimer of opinion, and was not qualified or modified as to uncertainties, audit scope or accounting principles. During the fiscal year or period ended November 30, 2022, and during the subsequent interim period through March 14, 2023: (i) there were no disagreements between the registrant and BBD on any matter of accounting principles or practices, financial statement disclosure, or auditing scope or procedure, which disagreements, if not resolved to the satisfaction of BBD, would have caused it to make reference to the subject matter of the disagreements in its report on the financial statements of the Fund for such years or interim period; and (ii) there were no “reportable events,” as defined in Item 304(a)(1)(v) of Regulation S-K under the Securities Exchange Act of 1934, as amended.
On March 7, 2023, upon the recommendation of the Fund’s Audit Committee, the Board approved the appointment of Cohen, effective upon the resignation of BBD, as the Fund’s independent registered public accounting firm for the fiscal year ending November 30, 2023.
During the fiscal year or period ended November 30, 2022, and during the subsequent interim period through March 14, 2023, neither the registrant, nor anyone acting on its behalf, consulted with Cohen on behalf of the Fund regarding the application of accounting principles to a specified transaction (either completed or proposed), the type of audit opinion that might be rendered on the Fund’s financial statements, or any matter that was either: (i) the subject of a "disagreement," as defined in Item 304(a)(1)(iv) of Regulation S-K and the instructions thereto; or (ii) "reportable events," as defined in Item 304(a)(1)(v) of Regulation S-K.
19 | November 30, 2024
Barron’s 400SM ETF
Proxy Disclosures for Open-End Management Investment Companies | November 30, 2024 (Unaudited) |
A Special Meeting of Shareholders of the Funds, each a series of the Trust, was held on July 19, 2024. At the meeting, the following matters were voted on by the Shareholders. The results of the Special Meeting of Shareholders are noted below:
Proposal 1: To elect seven Trustees.
| | Shares Voted in Favor | Shares Voted Against/Withheld or Abstentions | Proposal Approved |
| Mary K. Anstine | 223,143,090 | 2,894,793 | Yes |
| Edmund J. Burke | 223,362,578 | 2,672,643 | Yes |
| Jeremy W. Deems | 221,670,341 | 4,361,535 | Yes |
| Rick A. Pederson | 213,137,140 | 12,259,226 | Yes |
| Joseph F. Keenan | 223,547,500 | 2,483,867 | Yes |
| Susan K. Wold | 223,460,006 | 2,571,857 | Yes |
| Laton Spahr | 223,439,610 | 2,593,995 | Yes |
20 | November 30, 2024
Barron’s 400SM ETF
Remuneration Paid to Directors, Officers, and Others for Open-End Management Investment Companies | November 30, 2024 (Unaudited) |
The following chart provides certain information about the Trustee fees paid by the Trust for the year ended November 30, 2024:
| | | Aggregate Regular Compensation From the Trust | | | Aggregate Special Compensation From the Trust | | | Total Compensation From the Trust | |
| Mary K. Anstine, Trustee | | $ | 162,500 | | | $ | – | | | $ | 162,500 | |
| Edmund J. Burke, Trustee | | | 166,500 | | | | – | | | | 166,500 | |
| Jeremy W. Deems, Trustee | | | 174,500 | | | | – | | | | 174,500 | |
| Rick A. Pederson, Trustee | | | 186,500 | | | | – | | | | 186,500 | |
| Joseph F. Keenan, Trustee | | | 40,000 | | | | – | | | | 40,000 | |
| Susan K. Wold, Trustee | | | 40,000 | | | | – | | | | 40,000 | |
| Laton Spahr, President and Trustee* | | | – | | | | – | | | | – | |
| Total | | $ | 770,000 | | | $ | – | | | $ | 770,000 | |
| * | Mr. Spahr, the President of the Trust, is deemed an “interested person” by virtue of his position as an officer of the Trust and of ALPS Advisors, Inc. |
Officers who are employed by the Adviser receive no compensation or expense reimbursement from the Trust.
21 | November 30, 2024
Barron’s 400SM ETF
Statement Regarding Basis for Approval of Investment Advisory Contract | November 30, 2024 (Unaudited) |
At its meetings held on June 3, 2024 and June 18, 2024, the Board of Trustees of the Trust (the “Board” or the “Trustees”), where each Trustee was not an "interested person" of the Trust within the meaning of the Investment Company Act of 1940, as amended (the “Independent Trustees”), evaluated a proposal to approve the continuance of the Investment Advisory Agreement between the Trust and ALPS Advisors, Inc. (the “Adviser” or “AAI”) with respect to the Barron’s 400 ETF ("BFOR" or the "Fund"). In evaluating the renewal of the Investment Advisory Agreement with respect to the Fund, the Board, including the Independent Trustees considered various factors, including (i) the nature, extent and quality of the services provided by AAI with respect to the Fund under the Investment Advisory Agreement; (ii) the advisory fees and other expenses paid by the Fund compared to those of similar funds managed by other investment advisers; (iii) the costs of the services provided to the Fund by AAI and the profits realized by AAI and its affiliates from its relationship to the Fund; (iv) the extent to which economies of scale have been or would be realized if and as the assets of the Fund grow and whether fees reflect the economies of scale for the benefit of shareholders; and (v) any additional benefits and other considerations.
With respect to the nature, extent and quality of the services provided by AAI under the Investment Advisory Agreement, the Board considered and reviewed information concerning the services provided under the Investment Advisory Agreement, the investment parameters of the index of the Fund, financial information regarding AAI and its parent company, information describing AAI’s current organization and the background and experience of the persons responsible for the day-to-day management of the Fund.
The Board reviewed information on the performance of the Fund and its applicable benchmark for the 1-, 3-, and 5-year periods, as applicable. The Board also evaluated the correlation and tracking error between the underlying index and the Fund's performance. Based on this review, the Board, including the Independent Trustees found that the nature and extent of services provided to the Fund under the Investment Advisory Agreement was appropriate and that the quality of such services was satisfactory.
The Board noted that the advisory fees for the Fund were unitary fees pursuant to which AAI assumes all expenses of the Fund (including the cost of transfer agency, custody, fund administration, legal, audit and other services) other than the payments under the Advisory Agreement, brokerage expenses, taxes, interest, litigation expenses and other extraordinary expenses.
Based on the information available to them, including the Fund-specific summary set forth below, the Board, including the Independent Trustees concluded that the advisory fee rate for the Fund was reasonable under the circumstances and in light of the quality of the services provided.
The Board, including the Independent Trustees considered other benefits available to AAI because of its relationship with the Fund and concluded that the advisory fees were reasonable taking into account any such benefits.
The Board, including the Independent Trustees, also considered with respect to the Fund the information provided by AAI about the costs and profitability of AAI with respect to the Fund, including the asset levels and other factors that influence the profitability and financial viability of the Fund. The Board, including the Independent Trustees reviewed and noted the relatively small size of the Fund and the analysis AAI had conducted to support AAI’s assertion that it was not realizing any economies of scale with respect to such Fund. The Independent Trustees determined that AAI should continue to keep the Board informed on an ongoing basis of any significant developments (e.g., material increases in asset levels) so as to facilitate the Independent Trustees’ evaluation of whether further economies of scale have been achieved.
The Board, including the Independent Trustees, also considered other potential benefits available to AAI because of its relationship with the Fund, known as fall-out benefits.
With respect to the Fund, the Board, including the Independent Trustees, noted the following:
The gross management fee rate for BFOR is higher than the median of its FUSE expense group. BFOR’s net expense ratio is higher than the median of its FUSE expense group.
The Board, including the Independent Trustees, reviewed and noted the relatively small size of BFOR and the analysis AAI had conducted to support AAI’s assertion that it was not realizing any economies of scale with respect to BFOR.
In voting to renew the Investment Advisory Agreement with AAI, the Board, including the Independent Trustees, concluded that the terms of the Investment Advisory Agreement are reasonable and fair in light of the services to be performed, the fees paid by certain other funds, expenses to be incurred and such other matters as the members of the Board, including the Independent Trustees, considered relevant in the exercise of their reasonable business judgment. The Independent Trustees did not identify any single factor or group of factors as all important or controlling and considered all factors together.
22 | November 30, 2024


Table of Contents
| Financial Statements and Financial Highlights for Open-End Management Investment Companies | |
| Schedule of Investments | 1 |
| Statement of Assets and Liabilities | 2 |
| Statement of Operations | 3 |
| Statements of Changes in Net Assets | 4 |
| Financial Highlights | 5 |
| Notes to Financial Statements and Financial Highlights | 6 |
| Report of Independent Registered Public Accounting Firm | 12 |
| Additional Information | 13 |
| Changes in and Disagreements with Accountants for Open-End Management Investment Companies | 14 |
| Proxy Disclosures for Open-End Management Investment Companies | 15 |
| Remuneration Paid to Directors, Officers, and Others of Open-End Management Investment Companies | 16 |
| Statement Regarding Basis for Approval of Investment Advisory Contract | 17 |
alpsfunds.com
Level Four Large Cap Growth Active ETF
| Schedule of Investments | November 30, 2024 |
| Security Description | | Shares | | | Value | |
| COMMON STOCKS (99.71%) | | | | | | | | |
| Communication Services (11.05%) | | | | | | | | |
| Alphabet, Inc., Class A | | | 25,326 | | | $ | 4,278,828 | |
| Meta Platforms, Inc., Class A | | | 5,244 | | | | 3,011,734 | |
| Netflix, Inc.(a) | | | 2,408 | | | | 2,135,439 | |
| Walt Disney Co. | | | 6,939 | | | | 815,124 | |
| Total Communication Services | | | | | | | 10,241,125 | |
| | | | | | | | | |
| Consumer Discretionary (16.44%) | | | | | | | | |
| Amazon.com, Inc.(a) | | | 24,352 | | | | 5,062,538 | |
| Booking Holdings, Inc. | | | 657 | | | | 3,417,701 | |
| Etsy, Inc.(a) | | | 11,558 | | | | 634,072 | |
| Home Depot, Inc. | | | 4,607 | | | | 1,977,002 | |
| McDonald's Corp. | | | 2,821 | | | | 835,044 | |
| PulteGroup, Inc. | | | 6,768 | | | | 915,507 | |
| RH(a) | | | 6,175 | | | | 2,378,239 | |
| Total Consumer Discretionary | | | | | | | 15,220,103 | |
| | | | | | | | | |
| Consumer Staples (1.05%) | | | | | | | | |
| Constellation Brands, Inc., Class A | | | 2,959 | | | | 712,971 | |
| Estee Lauder Cos., Inc., Class A | | | 3,591 | | | | 258,983 | |
| Total Consumer Staples | | | | | | | 971,954 | |
| | | | | | | | | |
| Energy (1.11%) | | | | | | | | |
| Phillips 66 | | | 7,700 | | | | 1,031,646 | |
| | | | | | | | | |
| Financials (15.02%) | | | | | | | | |
| Blackrock, Inc. | | | 3,021 | | | | 3,089,879 | |
| Fidelity National Information Services, Inc. | | | 10,979 | | | | 936,509 | |
| Mastercard, Inc., Class A | | | 3,356 | | | | 1,788,547 | |
| Morgan Stanley | | | 16,554 | | | | 2,178,672 | |
| MSCI, Inc. | | | 3,237 | | | | 1,973,372 | |
| PayPal Holdings, Inc.(a) | | | 35,234 | | | | 3,057,253 | |
| Visa, Inc., Class A | | | 2,823 | | | | 889,471 | |
| Total Financials | | | | | | | 13,913,703 | |
| | | | | | | | | |
| Health Care (5.27%) | | | | | | | | |
| AbbVie, Inc. | | | 5,553 | | | | 1,015,809 | |
| Biogen, Inc.(a) | | | 3,690 | | | | 592,725 | |
| UnitedHealth Group, Inc. | | | 3,893 | | | | 2,375,509 | |
| Vertex Pharmaceuticals, Inc.(a) | | | 1,927 | | | | 902,087 | |
| Total Health Care | | | | | | | 4,886,130 | |
| | | | | | | | | |
| Industrials (7.40%) | | | | | | | | |
| Fortive Corp. | | | 10,184 | | | | 807,897 | |
| Lockheed Martin Corp. | | | 1,794 | | | | 949,761 | |
| Paycom Software, Inc. | | | 4,095 | | | | 949,712 | |
| TransDigm Group, Inc. | | | 611 | | | | 765,565 | |
| Uber Technologies, Inc.(a) | | | 33,616 | | | | 2,419,008 | |
| United Rentals, Inc. | | | 1,115 | | | | 965,590 | |
| Total Industrials | | | | | | | 6,857,533 | |
| | | | | | | | | |
| Information Technology (40.75%) | | | | | | | | |
| Apple, Inc. | | | 28,108 | | | | 6,670,872 | |
| Applied Materials, Inc. | | | 7,608 | | | | 1,329,194 | |
| Security Description | | Shares | | | Value | |
| Information Technology (continued) | | | | | | | | |
| Broadcom, Inc. | | | 9,946 | | | $ | 1,612,048 | |
| Cognizant Technology Solutions Corp., Class A | | | 11,549 | | | | 929,579 | |
| DocuSign, Inc.(a) | | | 27,104 | | | | 2,159,918 | |
| Lam Research Corp. | | | 34,763 | | | | 2,568,290 | |
| Micron Technology, Inc. | | | 13,549 | | | | 1,327,125 | |
| Microsoft Corp. | | | 12,330 | | | | 5,221,261 | |
| Monolithic Power Systems, Inc. | | | 2,280 | | | | 1,294,219 | |
| NVIDIA Corp. | | | 26,377 | | | | 3,646,620 | |
| Palo Alto Networks, Inc.(a) | | | 2,638 | | | | 1,023,069 | |
| Salesforce, Inc. | | | 5,655 | | | | 1,866,093 | |
| ServiceNow, Inc.(a) | | | 2,131 | | | | 2,236,357 | |
| Snowflake, Inc., Class A(a) | | | 18,314 | | | | 3,201,287 | |
| Twilio, Inc., Class A(a) | | | 25,459 | | | | 2,661,484 | |
| Total Information Technology | | | | | | | 37,747,416 | |
| | | | | | | | | |
| Real Estate (1.62%) | | | | | | | | |
| Zillow Group, Inc.(a) | | | 17,705 | | | | 1,499,791 | |
| | | | | | | | | |
| TOTAL COMMON STOCKS | | | | | | | | |
| (Cost $68,026,801) | | | | | | | 92,369,401 | |
| | | 7 Day Yield | | | Shares | | | Value | |
| SHORT TERM INVESTMENTS (0.29%) | | | | | | |
| Money Market Fund (0.29%) | | | | | | | | | | | | |
| State Street Institutional Treasury Plus Money Market Fund (Premier Class) | | | 4.59 | % | | | 272,444 | | | $ | 272,444 | |
| | | | | | | | | | | | | |
| TOTAL SHORT TERM INVESTMENTS | | | | | | |
| | | | | | | | | | | | | |
| (Cost $272,444) | | | | | | | | | | | 272,444 | |
| | | | | | | | | | | | | |
| TOTAL INVESTMENTS (100.00%) | | | | | | |
| (Cost $68,299,245) | | | | | | | | | | $ | 92,641,845 | |
| OTHER ASSETS IN EXCESS OF LIABILITIES (0.00%) | | | | 3,954 | |
| NET ASSETS - 100.00% | | | | | | | | | | $ | 92,645,799 | |
| (a) | Non-income producing security. |
See Notes to Financial Statements and Financial Highlights.
1 | November 30, 2024
Level Four Large Cap Growth Active ETF
| Statement of Assets and Liabilities | November 30, 2024 |
| ASSETS: | | | |
| Investments, at value | | $ | 92,641,845 | |
| Dividends receivable | | | 40,907 | |
| Total Assets | | | 92,682,752 | |
| | | | | |
| LIABILITIES: | | | | |
| Payable to adviser | | | 36,953 | |
| Total Liabilities | | | 36,953 | |
| NET ASSETS | | $ | 92,645,799 | |
| | | | | |
| NET ASSETS CONSIST OF: | | | | |
| Paid-in capital | | $ | 68,388,880 | |
| Total distributable earnings/(accumulated losses) | | | 24,256,919 | |
| NET ASSETS | | $ | 92,645,799 | |
| | | | | |
| INVESTMENTS, AT COST | | $ | 68,299,245 | |
| | | | | |
| PRICING OF SHARES | | | | |
| Net Assets | | $ | 92,645,799 | |
| Shares of beneficial interest outstanding (Unlimited number of shares authorized, par value $0.01 per share) | | | 2,628,400 | |
| Net Asset Value, offering and redemption price per share | | $ | 35.25 | |
See Notes to Financial Statements and Financial Highlights.
2 | November 30, 2024
Level Four Large Cap Growth Active ETF
| Statement of Operations | For the Year Ended November 30, 2024 |
| INVESTMENT INCOME: | | | |
| Dividend income* | | $ | 766,298 | |
| Securities lending income | | | 8 | |
| Total investment income | | | 766,306 | |
| | | | | |
| EXPENSES: | | | | |
| Investment adviser fees | | | 403,937 | |
| Other expenses | | | 3,371 | |
| Total expenses | | | 407,308 | |
| NET INVESTMENT INCOME | | | 358,998 | |
| | | | | |
| REALIZED AND UNREALIZED GAIN/(LOSS): | | | | |
| Net realized gain on investments(a) | | | 3,807,783 | |
| Net realized loss on foreign currency transactions | | | (6 | ) |
| Total Net realized gain | | | 3,807,777 | |
| Net change in unrealized appreciation on investments | | | 19,683,905 | |
| NET REALIZED AND UNREALIZED GAIN ON INVESTMENTS | | | 23,491,682 | |
| NET INCREASE IN NET ASSETS RESULTING FROM OPERATIONS | | $ | 23,850,680 | |
| * | Net of foreign tax withholding of $47. |
| (a) | Includes realized gain or loss as a result of in-kind transactions (See Note 4 in Notes to Financial Statements and Financial Highlights). |
See Notes to Financial Statements and Financial Highlights.
3 | November 30, 2024
Level Four Large Cap Growth Active ETF
Statements of Changes in Net Assets
| | | For the Year Ended November 30, 2024 | | | For the Period August 22, 2023 (Commencement of Operations) to November 30, 2023 | |
| OPERATIONS: | | | | | | | | |
| Net investment income | | $ | 358,998 | | | $ | 159,824 | |
| Net realized gain | | | 3,807,777 | | | | 9,283,702 | |
| Net change in unrealized appreciation/(depreciation) | | | 19,683,905 | | | | (5,880,533 | ) |
| Net increase in net assets resulting from operations | | | 23,850,680 | | | | 3,562,993 | |
| | | | | | | | | |
| DISTRIBUTIONS TO SHAREHOLDERS: | | | | | | | | |
| From distributable earnings | | | (472,605 | ) | | | – | |
| Total distributions | | | (472,605 | ) | | | – | |
| | | | | | | | | |
| CAPITAL SHARE TRANSACTIONS: | | | | | | | | |
| Proceeds from sale of shares | | | 17,491,395 | | | | 79,064,503 | * |
| Cost of shares redeemed | | | (13,367,369 | ) | | | (17,483,798 | ) |
| Net increase from capital share transactions | | | 4,124,026 | | | | 61,580,705 | |
| Net increase in net assets | | | 27,502,101 | | | | 65,143,698 | |
| | | | | | | | | |
| NET ASSETS: | | | | | | | | |
| Beginning of period | | | 65,143,698 | | | | – | |
| End of period | | $ | 92,645,799 | | | $ | 65,143,698 | |
| | | | | | | | | |
| OTHER INFORMATION: | | | | | | | | |
| CAPITAL SHARE TRANSACTIONS: | | | | | | | | |
| Beginning shares | | | 2,473,400 | | | | – | |
| Shares sold | | | 605,000 | | | | 3,183,400 | |
| Shares redeemed | | | (450,000 | ) | | | (710,000 | ) |
| Shares outstanding, end of period | | | 2,628,400 | | | | 2,473,400 | |
| * | On August 22, 2023, the Fund received securities in connection with an in-kind subscription transaction. The seed shares totaled 883,398 with a NAV of $25. For financial reporting purposes, these transactions were treated as purchases of securities and recognized based on the market value of the securities. The value of the initial in-kind subscription was $22,084,950. |
See Notes to Financial Statements and Financial Highlights.
4 | November 30, 2024
Level Four Large Cap Growth Active ETF
| Financial Highlights | For a Share Outstanding Throughout the Periods Presented |
| | | For the Year Ended November 30, 2024 | | | For the Period August 22, 2023 (Commencement of Operations) to November 30, 2023 | |
| NET ASSET VALUE, BEGINNING OF PERIOD | | $ | 26.34 | | | $ | 25.00 | |
| | | | | | | | | |
| INCOME FROM OPERATIONS: | | | | | | | | |
| Net investment income(a) | | | 0.14 | | | | 0.07 | |
| Net realized and unrealized gain | | | 8.95 | | | | 1.27 | |
| Total from investment operations | | | 9.09 | | | | 1.34 | |
| | | | | | | | | |
| DISTRIBUTIONS: | | | | | | | | |
| From net investment income | | | (0.18 | ) | | | – | |
| Total distributions | | | (0.18 | ) | | | – | |
| | | | | | | | | |
| NET INCREASE IN NET ASSET VALUE | | | 8.91 | | | | 1.34 | |
| NET ASSET VALUE, END OF PERIOD | | $ | 35.25 | | | $ | 26.34 | |
| TOTAL RETURN(b) | | | 34.63 | % | | | 5.36 | % |
| | | | | | | | | |
| RATIOS/SUPPLEMENTAL DATA: | | | | | | | | |
| Net assets, end of period (in 000s) | | $ | 92,646 | | | $ | 65,144 | |
| | | | | | | | | |
| RATIOS TO AVERAGE NET ASSETS | | | | | | | | |
| Ratio of expenses to average net assets | | | 0.50 | % | | | 0.50 | %(c) |
| Ratio of net investment income to average net assets | | | 0.44 | % | | | 1.01 | %(c) |
| Portfolio turnover rate(d) | | | 8 | % | | | 0 | % |
| (a) | Based on average shares outstanding during the period. |
| (b) | Total return is calculated assuming an initial investment made at the net asset value at the beginning of the period and redemption at the net asset value on the last day of the period and assuming all distributions are reinvested at the reinvestment prices. Total return calculated for a period of less than one year is not annualized. |
| (c) | Annualized. |
| (d) | Portfolio turnover for periods less than one year are not annualized and does not include securities received or delivered from processing creations or redemptions in-kind. |
See Notes to Financial Statements and Financial Highlights.
5 | November 30, 2024
Level Four Large Cap Growth Active ETF
| Notes to Financial Statements and Financial Highlights | November 30, 2024 |
1. ORGANIZATION
ALPS ETF Trust (the “Trust”), a Delaware statutory trust, is an open-end management investment company registered under the Investment Company Act of 1940, as amended (the “1940 Act”). As of November 30, 2024, the Trust consisted of twenty-three separate portfolios. Each portfolio represents a separate series of the Trust. This report pertains solely to the Level Four Large Cap Growth Active ETF (the “Fund”). The investment objective of the Fund is to seek maximum total return and above peer average risk-adjusted return. The Fund has elected to qualify as a diversified series of the Trust under the 1940 Act.
The Fund’s Shares (“Shares”) are listed on the Nasdaq Stock Market LLC (“Nasdaq Exchange”). The Fund issues and redeems Shares, at net asset value (“NAV”) in blocks of 5,000 Shares, each of which is called a “Creation Unit”. Creation Units are issued and redeemed principally in-kind for securities. Except when aggregated in Creation Units, Shares are not redeemable securities of the Fund.
The Sub-Adviser manages multiple separately managed accounts (the “SMAs”) that contributed specific assets to the Fund (the “Contribution”). The Adviser and Sub-Adviser paid all costs surrounding the Contribution. The Contribution was tax free, and the cost basis of the SMAs were carried forward to the Fund for tax and financial reporting purposes. The Contribution resulted in seed shares totaling 883,398 with a Net Asset Value of $25. The details of the Contribution are shown below:
| Net Assets | Market Value of Investments | Cost of Investments | Unrealized Appreciation |
| $ 22,084,950 | $ 22,084,950 | $ 11,545,722 | $ 10,539,228 |
Pursuant to the Trust’s organizational documents, its Officers and Trustees are indemnified against certain liability arising out of the performance of their duties to the Trust. Additionally, in the normal course of business, the Trust enters into contracts with service providers that contain general indemnification clauses. The Trust’s maximum exposure under these arrangements is unknown, as this would involve future claims that may be made against the Trust that have not yet occurred.
2. SIGNIFICANT ACCOUNTING POLICIES
The following is a summary of significant accounting policies consistently followed by the Fund in the preparation of the financial statements. The accompanying financial statements were prepared in accordance with accounting principles generally accepted in the United States of America (“U.S. GAAP”). The preparation of financial statements in conformity with U.S. GAAP requires management to make certain estimates and assumptions that affect the reported amounts of assets and liabilities and disclosures of contingent assets and liabilities at the date of the financial statements and the reported amounts of revenue and expenses during the period. Actual results could differ from those estimates. The Fund is considered an investment company under U.S. GAAP and follows the accounting and reporting guidance applicable to investment companies in the Financial Accounting Standards Board (“FASB”) Accounting Standards Codification Topic 946.
A. Portfolio Valuation
The Fund’s NAV is determined daily, as of the close of regular trading on the New York Stock Exchange (the “NYSE”), normally 4:00 p.m. Eastern Time, on each day the NYSE is open for trading. The NAV is computed by dividing the value of all assets of the Fund (including accrued interest and dividends), less all liabilities (including accrued expenses and dividends declared but unpaid), by the total number of shares outstanding.
Portfolio securities listed on any exchange other than the NASDAQ Stock Market LLC (“NASDAQ”) are valued at the last sale price on the business day as of which such value is being determined. If there has been no sale on such day, the securities are valued at the mean of the most recent bid and ask prices on such day. Securities traded on the NASDAQ are valued at the NASDAQ Official Closing Price as determined by NASDAQ. Portfolio securities traded on more than one securities exchange are valued at the last sale price on the business day as of which such value is being determined at the close of the exchange representing the principal market for such securities. Portfolio securities traded in the over-the-counter market, but excluding securities traded on the NASDAQ, are valued at the last quoted sale price in such market.
The Fund’s investments are valued at market value or, in the absence of market value with respect to any portfolio securities, at fair value according to procedures adopted by the Trust’s Board of Trustees (the “Board”). Pursuant to Rule 2a-5 under the 1940 Act, the Board designated ALPS Advisors, Inc. (the "Adviser") as the valuation designee ("Valuation Designee") for the Fund to perform the fair value determinations relating to Fund investments. The Adviser may carry out its designated responsibilities as Valuation Designee through various teams and committees. When market quotations are not readily available or when events occur that make established valuation methods unreliable, securities of the Fund may be valued in good faith by the Valuation Designee. These securities generally include, but are not limited to, restricted securities (securities which may not be publicly sold without registration under the Securities Act of 1933) for which a pricing service is unable to provide a market price; securities whose trading has been formally suspended; a security whose market price is not available from a pre-established primary pricing source or the pricing source is not willing to provide a price; a security with respect to which an event has occurred that is most likely to materially affect the value of the security after the market has closed but before the calculation of the Fund’s NAV or make it difficult or impossible to obtain a reliable market quotation; or a security whose price, as provided by the pricing service, does not reflect the security’s “fair value” due to the security being de-listed from a national exchange or the security’s primary trading market is temporarily closed at a time when, under normal conditions, it would be open. As a general principle, the current “fair value” of a security would be the amount which the owner might reasonably expect to receive from the sale on the applicable exchange or principal market. A variety of factors may be considered in determining the fair value of such securities.
6 | November 30, 2024
Level Four Large Cap Growth Active ETF
| Notes to Financial Statements and Financial Highlights | November 30, 2024 |
B. Fair Value Measurements
The Fund discloses the classification of its fair value measurements following a three-tier hierarchy based on the inputs used to measure fair value. Inputs refer broadly to the assumptions that market participants would use in pricing the asset or liability, including assumptions about risk. Inputs may be observable or unobservable. Observable inputs reflect the assumptions market participants would use in pricing the asset or liability that are developed based on market data obtained from sources independent of the reporting entity. Unobservable inputs reflect the reporting entity’s own assumptions about the assumptions market participants would use in pricing the asset or liability that are developed based on the best information available.
Valuation techniques used to value the Fund’s investments by major category are as follows:
Equity securities, including restricted securities, for which market quotations are readily available, are valued at the last reported sale price or official closing price as reported by a third party pricing vendor on the primary market or exchange on which they are traded and are categorized as Level 1 in the hierarchy. In the event there were no sales during the day or closing prices are not available, securities are valued at the mean of the most recent quoted bid and ask prices on such day and are generally categorized as Level 2 in the hierarchy. Investments in open-end mutual funds are valued at their closing NAV each business day and are categorized as Level 1 in the hierarchy.
Changes in valuation techniques may result in transfers in or out of an assigned level within the disclosure hierarchy.
Various inputs are used in determining the value of the Fund’s investments as of the end of the reporting period. When inputs used fall into different levels of the fair value hierarchy, the level in the hierarchy within which the fair value measurement falls is determined based on the lowest level input that is significant to the fair value measurement in its entirety. The designated input levels are not necessarily an indication of the risk or liquidity associated with these investments.
These inputs are categorized in the following hierarchy under applicable financial accounting standards:
| Level 1 – | Unadjusted quoted prices in active markets for identical investments, unrestricted assets or liabilities that a Fund has the ability to access at the measurement date; |
| Level 2 – | Quoted prices which are not active, quoted prices for similar assets or liabilities in active markets or inputs other than quoted prices that are observable (either directly or indirectly) for substantially the full term of the asset or liability; and |
| Level 3 – | Significant unobservable prices or inputs (including the Fund’s own assumptions in determining the fair value of investments) where there is little or no market activity for the asset or liability at the measurement date. |
The following is a summary of the inputs used to value the Fund’s investments as of November 30, 2024:
Level Four Large Cap Growth Active ETF
| Investments in Securities at Value | | Level 1 - Quoted and Unadjusted Prices | | | Level 2 - Other Significant Observable Inputs | | | Level 3 – Significant Unobservable Inputs | | | Total | |
| Common Stocks* | | $ | 92,369,401 | | | $ | – | | | $ | – | | | $ | 92,369,401 | |
| Short Term Investments | | | 272,444 | | | | – | | | | – | | | | 272,444 | |
| Total | | $ | 92,641,845 | | | $ | – | | | $ | – | | | $ | 92,641,845 | |
| * | For a detailed breakdown of sectors, see the accompanying Schedule of Investments. |
The Fund did not have any securities that used significant unobservable inputs (Level 3) in determining fair value and there were no transfers into or out of Level 3 during the year ended November 30, 2024.
7 | November 30, 2024
Level Four Large Cap Growth Active ETF
| Notes to Financial Statements and Financial Highlights | November 30, 2024 |
C. Securities Transactions and Investment Income
Securities transactions are recorded as of the trade date. Realized gains and losses from securities transactions are recorded on the specific identification in accordance with GAAP. Dividend income and capital gains distributions, if any, are recorded on the ex-dividend date. Interest income, if any, is recorded on the accrual basis.
D. Dividends and Distributions to Shareholders
Dividends from net investment income of the Fund, if any, are declared and paid quarterly or as the Board may determine from time to time. Distributions of net realized capital gains earned by the Fund, if any, are distributed at least annually.
E. Federal Tax and Tax Basis Information
The timing and character of income and capital gain distributions are determined in accordance with income tax regulations, which may differ from U.S. GAAP. Reclassifications are made to the Fund’s capital accounts for permanent tax differences to reflect income and gains available for distribution (or available capital loss carryforwards) under income tax regulations.
For the year ended November 30, 2024, the following reclassifications, which had no impact on results of operations or net assets, were recorded to reflect permanent tax differences resulting primarily from in-kind transactions and prior year tax return true-up:
| Fund | | Paid-in Capital | | | Total Distributable Earnings/(Accumulated Losses) | |
| Level Four Large Cap Growth Active ETF | | $ | 3,705,864 | | | $ | (3,705,864 | ) |
The tax character of the distributions paid during the fiscal year ended November 30, 2024 was as follows:
| Fund | | Ordinary Income | | | Long-Term Capital Gain | | | Return of Capital | |
| November 30, 2024 | | | | | | | | | | | | |
| Level Four Large Cap Growth Active ETF | | $ | 472,605 | | | $ | – | | | $ | – | |
Under current law, capital losses maintain their character as short-term or long-term and are carried forward to the next tax year without expiration. As of November 30, 2024, the following amounts are available as carry forwards to the next tax year:
| Fund | | Short-Term | | | Long-Term | |
| Level Four Large Cap Growth Active ETF | | $ | – | | | $ | 131,843 | |
The Fund used capital loss carryovers during the year ended November 30, 2024 in the amount of $102,008.
As of November 30, 2024, the components of distributable earnings/(accumulated losses) on a tax basis were as follows:
| Fund | | Accumulated Net Investment Income | | | Accumulated Net Realized Gain/(Loss) on Investments | | | Other Accumulated Losses | | | Net Unrealized Appreciation/(Depreciation) on Investments | | | Total | |
| Level Four Large Cap Growth Active ETF | | $ | 46,201 | | | $ | (131,843 | ) | | $ | – | | | $ | 24,342,561 | | | $ | 24,256,919 | |
8 | November 30, 2024
Level Four Large Cap Growth Active ETF
| Notes to Financial Statements and Financial Highlights | November 30, 2024 |
As of November 30, 2024, the cost of investments for federal income tax purposes and accumulated net unrealized appreciation/(depreciation) on investments were as follows:
| | | Level Four Large Cap Growth Active ETF | |
| Gross appreciation (excess of value over tax cost) | | $ | 25,395,229 | |
| Gross depreciation (excess of tax cost over value) | | | (1,052,668 | ) |
| Net unrealized appreciation/(depreciation) | | $ | 24,342,561 | |
| Cost of investments for income tax purposes | | $ | 68,299,284 | |
The differences between book-basis and tax-basis are primarily due to the deferral of losses from wash sales.
F. Income Taxes
No provision for income taxes is included in the accompanying financial statements, as the Fund intends to distribute to shareholders all taxable investment income and realized gains and otherwise comply with Subchapter M of the Internal Revenue Code of 1986, as amended, applicable to regulated investment companies. The Fund evaluates tax positions taken (or expected to be taken) in the course of preparing the Fund’s tax returns to determine whether these positions meet a “more-likely-than-not” standard that, based on the technical merits, have a more than fifty percent likelihood of being sustained by a taxing authority upon examination. A tax position that meets the “more-likely-than-not” recognition threshold is measured to determine the amount of benefit to recognize in the financial statements.
As of and during the year ended November 30, 2024, the Fund did not have a liability for any unrecognized tax benefits. The Fund files U.S. federal, state, and local tax returns as required. The Fund’s tax returns are subject to examination by the relevant tax authorities until expiration of the applicable statute of limitations, which is generally three years after the filing of the tax return, but may extend to four years in certain jurisdictions. Tax returns for open years have incorporated no uncertain tax positions that require a provision for income taxes.
G. Lending of Portfolio Securities
The Fund has entered into a securities lending agreement with State Street Bank & Trust Co. (“SSB”), the Fund’s lending agent. The Fund may lend its portfolio securities only to borrowers that are approved by SSB. The Fund will limit such lending to not more than 33 1/3% of the value of its total assets. The Fund’s securities held at SSB as custodian shall be available to be lent except those securities the Fund or ALPS Advisors, Inc. specifically identifies in writing as not being available for lending. The borrower pledges and maintains with the Fund collateral consisting of cash (U.S. Dollars only), securities issued or guaranteed by the U.S. government or its agencies or instrumentalities, and cash equivalents (including irrevocable bank letters of credit) issued by a person other than the borrower or an affiliate of the borrower. The initial collateral received by the Fund is required to have a value of no less than 102% of the market value of the loaned securities for U.S equity securities and a value of no less than 105% of the market value for non-U.S. equity securities. The collateral is maintained thereafter, at a market value equal to not less than 102% of the current value of the U.S. equity securities on loan and not less than 105% of the current value of the non-U.S. equity securities on loan. The market value of the loaned securities is determined at the close of each business day and any additional required collateral is delivered to the Fund on the next business day. During the term of the loan, the Fund is entitled to all distributions made on or in respect of the loaned securities. Loans of securities are terminable at any time and the borrower, after notice, is required to return borrowed securities within the customary time period for settlement of securities transactions.
Any cash collateral received is reinvested in a money market fund managed by SSB as disclosed in the Fund’s Schedule of Investments and is reflected in the Statement of Assets and Liabilities as a payable for collateral upon return of securities loaned. Non-cash collateral, in the form of securities issued or guaranteed by the U.S. government or its agencies or instrumentalities, is not disclosed in the Fund’s Statement of Assets and Liabilities or the contractual maturity table below as it is held by the lending agent on behalf of the Fund, and the Fund does not have the ability to re-hypothecate these securities. Income earned by the Fund from securities lending activity is disclosed in the Statement of Operations. As of November 30, 2024, the Fund did not have any securities on loan.
3. INVESTMENT ADVISORY FEE AND OTHER AFFILIATED TRANSACTIONS
ALPS Advisors, Inc. serves as the Fund’s investment adviser pursuant to an Investment Advisory Agreement with the Trust on behalf of the Fund (the “Advisory Agreement”). Pursuant to the Advisory Agreement, the Fund pays the Adviser an annual management fee for the services and facilities it provides, payable on a monthly basis at the annual rate of 0.50% of the Fund’s average daily net assets.
Out of the unitary management fees, the Adviser pays substantially all expenses of the Fund, including licensing fees to the Underlying Index provider, the cost of transfer agency, custody, fund administration, legal, audit, trustees and other services, except for acquired fund fees and expenses, interest expenses, distribution fees or expenses, brokerage expenses, taxes and extraordinary expenses not incurred in the ordinary course of the Fund's business. The Adviser’s unitary management fee is designed to pay substantially all of the Fund’s expenses and to compensate the Adviser for providing services to the Fund.
9 | November 30, 2024
Level Four Large Cap Growth Active ETF
| Notes to Financial Statements and Financial Highlights | November 30, 2024 |
Level Four Capital Management, LLC (“Level Four” or the “Sub-Adviser”) serves as the Fund's sub-adviser pursuant to a sub-advisory agreement with the Trust (the ‘‘Sub-Advisory Agreement’’). Pursuant to the Sub-Advisory Agreement, the Adviser pays the Sub-Adviser a sub-advisory fee out of the Adviser's advisory fee for the services it provides. The fee is payable on a monthly basis at the annual rate of 0.25% of the Fund's average daily net assets.
ALPS Fund Services, Inc., an affiliate of the Adviser, is the administrator of the Fund.
Each Trustee receives (1) a quarterly retainer of $25,000, (2) a per meeting fee of $15,000, (3) $2,500 for any special meeting held outside of a regularly scheduled board meeting, and (4) reimbursement for all reasonable out-of-pocket expenses relating to attendance at meetings. In addition, the Chairman of the Board receives a quarterly retainer of $5,000, the Chairman of the Audit Committee receives a quarterly retainer of $3,000, and the Chairman of the Nominating & Governance Committee receives a quarterly retainer of $2,000, each in connection with their respective roles.
4. PURCHASES AND SALES OF SECURITIES
For the year ended November 30, 2024 the cost of purchases and proceeds from sales of investment securities, excluding short-term investments and in-kind transactions, were as follows:
| Fund | | Purchases | | | Sales | |
| Level Four Large Cap Growth Active ETF | | $ | 12,232,327 | | | $ | 6,344,478 | |
For the year ended November 30, 2024, the cost of in-kind purchases and proceeds from in-kind sales were as follows:
| Fund | | Purchases | | | Sales | |
| Level Four Large Cap Growth Active ETF | | $ | 15,131,349 | | | $ | 12,967,088 | |
For the year ended November 30, 2024, the Level Four Large Cap Growth Active ETF had in-kind net realized gain of $3,706,016.
Gains on in-kind transactions are not considered taxable for federal income tax purposes and losses on in-kind transactions are also not deductible for tax purposes.
5. CAPITAL SHARE TRANSACTIONS
Shares are created and redeemed by the Fund only in Creation Unit size aggregations of 5,000 Shares. Only broker-dealers or large institutional investors with creation and redemption agreements called Authorized Participants (“AP”) are permitted to purchase or redeem Creation Units from the Fund. Such transactions are generally permitted on an in-kind basis, with a balancing cash component to equate the transaction to the NAV per unit of the Fund on the transaction date. Cash may be substituted equivalent to the value of certain securities generally when they are not available in sufficient quantity for delivery, not eligible for trading by the AP or as a result of other market circumstances.
6. MARKET RISK
The Fund is subject to investment and operational risks associated with financial, economic and other global market developments and disruptions, including those arising from war, terrorism, market manipulation, government interventions, defaults and shutdowns, political changes or diplomatic developments, public health emergencies (such as the spread of infectious diseases, pandemics and epidemics) and natural/environmental disasters, which can negatively impact the securities markets and cause the Fund to lose value. Securities in the Fund’s portfolio may underperform in comparison to securities in general financial markets, a particular financial market or other asset classes due to a number of factors, including inflation (or expectations for inflation), deflation (or expectations for deflation), interest rates, global demand for particular products or resources, market instability, debt crises and downgrades, embargoes, tariffs, sanctions and other trade barriers, regulatory events, other governmental trade or market control programs and related geopolitical events. In addition, the value of the Fund’s investments may be negatively affected by the occurrence of global events such as war, terrorism, environmental disasters, natural disasters or events, country instability, and infectious disease epidemics or pandemics.
10 | November 30, 2024
Level Four Large Cap Growth Active ETF
| Notes to Financial Statements and Financial Highlights | November 30, 2024 |
7. SUBSEQUENT EVENTS
Subsequent events, if any, after the date of the Statement of Assets and Liabilities have been evaluated through the date the financial statements were issued. Management has determined that there were no subsequent events to report through the issuance of these financial statements.
11 | November 30, 2024
Level Four Large Cap Growth Active ETF
Report of Independent Registered Public Accounting Firm
To the Shareholders of Level Four Large Cap Growth Active ETF and Board of Trustees of ALPS ETF Trust
Opinion on the Financial Statements
We have audited the accompanying statement of assets and liabilities, including the schedule of investments, of Level Four Large Cap Growth Active ETF (the “Fund”), a series of ALPS ETF Trust, as of November 30, 2024, the related statement of operations for the year then ended, the statements of changes in net assets and financial highlights for the year then ended and for the period August 22, 2023 (commencement of operations) through November 30, 2023, and the related notes (collectively referred to as the “financial statements”). In our opinion, the financial statements present fairly, in all material respects, the financial position of the Fund as of November 30, 2024, the results of its operations for the year then ended, and the changes in net assets and financial highlights for the year then ended and for the period August 22, 2023 (commencement of operations) through November 30, 2023, in conformity with accounting principles generally accepted in the United States of America.
Basis for Opinion
These financial statements are the responsibility of the Fund’s management. Our responsibility is to express an opinion on the Fund’s financial statements based on our audits. We are a public accounting firm registered with the Public Company Accounting Oversight Board (United States) (“PCAOB”) and are required to be independent with respect to the Fund in accordance with the U.S. federal securities laws and the applicable rules and regulations of the Securities and Exchange Commission and the PCAOB.
We conducted our audits in accordance with the standards of the PCAOB. Those standards require that we plan and perform the audit to obtain reasonable assurance about whether the financial statements are free of material misstatement whether due to error or fraud.
Our audits included performing procedures to assess the risks of material misstatement of the financial statements, whether due to error or fraud, and performing procedures that respond to those risks. Such procedures included examining, on a test basis, evidence regarding the amounts and disclosures in the financial statements. Our procedures included confirmation of securities owned as of November 30, 2024, by correspondence with the custodian. Our audits also included evaluating the accounting principles used and significant estimates made by management, as well as evaluating the overall presentation of the financial statements. We believe that our audits provide a reasonable basis for our opinion.
We have served as the auditor of one or more investment companies advised by ALPS Advisors, Inc. since 2013.

COHEN & COMPANY, LTD.
Philadelphia, Pennsylvania
January 29, 2025
12 | November 30, 2024
Level Four Large Cap Growth Active ETF
| Additional Information | November 30, 2024 (Unaudited) |
TAX INFORMATION
The Level Four Large Cap Growth Active ETF designates the following as a percentage of taxable ordinary income distributions, or up to the maximum amount allowable, for the calendar year ended December 31, 2023:
| | Qualified Dividend Income | Dividend Received Deduction | 199A |
| Level Four Large Cap Growth Active ETF | 100.00% | 90.18% | 0.00% |
In early 2024, if applicable, shareholders of record received this information for the distributions paid to them by the Fund during the calendar year 2023 via Form 1099. The Fund will notify shareholders in early 2025 of amounts paid to them by the Fund, if any, during the calendar year 2024.
13 | November 30, 2024
Level Four Large Cap Growth Active ETF
Changes in and Disagreements with Accountants for Open-End Management Investment Companies | November 30, 2024 (Unaudited) |
Not applicable for this reporting period.
14 | November 30, 2024
Level Four Large Cap Growth Active ETF
Proxy Disclosures for Open-End Management Investment Companies | November 30, 2024 (Unaudited) |
A Special Meeting of Shareholders of the Funds, each a series of the Trust, was held on July 19, 2024. At the meeting, the following matters were voted on by the Shareholders. The results of the Special Meeting of Shareholders are noted below:
Proposal 1: To elect seven Trustees.
| | Shares Voted in Favor | Shares Voted Against/Withheld or Abstentions | Proposal Approved |
| Mary K. Anstine | 223,143,090 | 2,894,793 | Yes |
| Edmund J. Burke | 223,362,578 | 2,672,643 | Yes |
| Jeremy W. Deems | 221,670,341 | 4,361,535 | Yes |
| Rick A. Pederson | 213,137,140 | 12,259,226 | Yes |
| Joseph F. Keenan | 223,547,500 | 2,483,867 | Yes |
| Susan K. Wold | 223,460,006 | 2,571,857 | Yes |
| Laton Spahr | 223,439,610 | 2,593,995 | Yes |
15 | November 30, 2024
Level Four Large Cap Growth Active ETF
Remuneration Paid to Directors, Officers, and Others of Open-End Management Investment Companies | November 30, 2024 (Unaudited) |
The following chart provides certain information about the Trustee fees paid by the Trust for the year ended November 30, 2024:
| | | Aggregate Regular Compensation From the Trust | | | Aggregate Special Compensation From the Trust | | | Total Compensation From the Trust | |
| Mary K. Anstine, Trustee | | $ | 162,500 | | | $ | — | | | $ | 162,500 | |
| Edmund J. Burke, Trustee | | | 166,500 | | | | — | | | | 166,500 | |
| Jeremy W. Deems, Trustee | | | 174,500 | | | | — | | | | 174,500 | |
| Rick A. Pederson, Trustee | | | 186,500 | | | | — | | | | 186,500 | |
| Joseph F. Keenan, Trustee | | | 40,000 | | | | — | | | | 40,000 | |
| Susan K. Wold, Trustee | | | 40,000 | | | | — | | | | 40,000 | |
| Laton Spahr, President and Trustee* | | | — | | | | — | | | | — | |
| Total | | $ | 770,000 | | | $ | — | | | $ | 770,000 | |
| * | Mr. Spahr, the President of the Trust, is deemed an “interested person” by virtue of his position as an officer of the Trust and of ALPS Advisors, Inc. |
Officers who are employed by the Adviser receive no compensation or expense reimbursement from the Trust.
16 | November 30, 2024
Level Four Large Cap Growth Active ETF
Statement Regarding Basis for Approval of Investment Advisory Contract | November 30, 2024 (Unaudited) |
At its meetings held on June 3, 2024 and June 18, 2024, the Board of Trustees of the Trust (the “Board” or the “Trustees”), where each Trustee was not an "interested person" of the Trust within the meaning of the Investment Company Act of 1940, as amended (the “Independent Trustees”), evaluated a proposal to approve the continuance of (i) the Investment Advisory Agreement between the Trust and ALPS Advisors, Inc. (the “Adviser” or “AAI”) with respect to the Level Four Large Cap Growth Active ETF (the “Fund” or “LGRO”) and (ii) the Investment Sub-Advisory Agreement between the Trust, AAI and Level Four Capital Management, LLC (the “Sub-Adviser” or “Level Four”) with respect to the Fund (the “Level Four Sub-Advisory Agreement”).
In evaluating the renewal of the Investment Advisory Agreement with respect to the Fund, the Board, including the Independent Trustees considered various factors, including (i) the nature, extent and quality of the services provided by AAI with respect to the Fund under the Investment Advisory Agreement; (ii) the advisory fees and other expenses paid by the Fund compared to those of similar funds managed by other investment advisers; (iii) the costs of the services provided to the Fund by AAI and the profits realized by AAI and its affiliates from its relationship to the Fund; (iv) the extent to which economies of scale have been or would be realized if and as the assets of the Fund grow and whether fees reflect the economies of scale for the benefit of shareholders; and (v) any additional benefits and other considerations.
With respect to the nature, extent and quality of the services provided by AAI under the Investment Advisory Agreement, the Board considered and reviewed information concerning the services provided under the Investment Advisory Agreement, financial information regarding AAI and its parent company, information describing AAI’s current organization and the background and experience of the persons responsible for the day-to-day management of the Fund.
The Board reviewed information on the performance of the Fund and its applicable benchmark for the 3 month and since inception periods and against the appropriate FUSE performance universe. Based on this review, the Board, including the Independent Trustees found that the nature and extent of services provided to the Fund under the Investment Advisory Agreement was appropriate and that the quality of such services was satisfactory.
The Board noted that the advisory fees for the Fund were unitary fees pursuant to which AAI assumes all expenses of the Fund (including the cost of transfer agency, custody, fund administration, legal, audit and other services) other than the payments under the Advisory Agreement, brokerage expenses, taxes, interest, litigation expenses and other extraordinary expenses.
Based on the information available to them, including the Fund-specific summary set forth below, the Board, including the Independent Trustees concluded that the advisory fee rate for the Fund was reasonable under the circumstances and in light of the quality of the services provided.
The Board, including the Independent Trustees considered other benefits available to AAI because of its relationship with the Fund and concluded that the advisory fees were reasonable taking into account any such benefits.
The Board, including the Independent Trustees, also considered with respect to the Fund the information provided by AAI about the costs and profitability of AAI with respect to the Fund, including the asset levels and other factors that influence the profitability and financial viability of the Fund. The Board, including the Independent Trustees reviewed and noted the relatively small size of the Fund and the analysis AAI had conducted to support AAI’s assertion that it was not realizing any economies of scale with respect to the Fund. The Independent Trustees determined that AAI should continue to keep the Board informed on an ongoing basis of any significant developments (e.g., material increases in asset levels) so as to facilitate the Independent Trustees’ evaluation of whether further economies of scale have been achieved.
The Board, including the Independent Trustees, also considered other potential benefits available to AAI because of its relationship with the Fund, known as fall-out benefits.
With respect to the Fund, the Board, including the Independent Trustees, noted the following:
The gross management fee rate for LGRO is lower than the median of its FUSE expense group. LGRO’s net expense ratio is lower than the median of its FUSE expense group.
The Board, including the Independent Trustees, reviewed and noted the relatively small size of LGRO and the analysis AAI had conducted to support AAI’s assertion that it was not realizing any economies of scale with respect to LGRO.
17 | November 30, 2024
Level Four Large Cap Growth Active ETF
Statement Regarding Basis for Approval of Investment Advisory Contract | November 30, 2024 (Unaudited) |
In voting to renew the Investment Advisory Agreement with AAI, the Board, including the Independent Trustees, concluded that the terms of the Investment Advisory Agreement are reasonable and fair in light of the services to be performed, the fees paid by certain other funds, expenses to be incurred and such other matters as the members of the Board, including the Independent Trustees, considered relevant in the exercise of their reasonable business judgment. The Independent Trustees did not identify any single factor or group of factors as all important or controlling and considered all factors together.
The Board, including the Independent Trustees, discussed the Level Four Sub-Advisory Agreement.
In evaluating the Level Four Sub-Advisory Agreement the Board, including the Independent Trustees considered various factors, including (i) the nature, extent and quality of the services provided by Level Four with respect to LGRO under the Level Four Sub-Advisory Agreement; (ii) the advisory fees and other expenses paid by LGRO compared to those of similar funds managed by other investment advisers; (iii) the profitability to Level Four of its sub-advisory relationship with LGRO and the reasonableness of compensation to Level Four; (iv) the extent to which economies of scale would be realized if, and as, LGRO’s assets increase, and whether the fee level in the Level Four Sub-Advisory Agreement reflects these economies of scale; and (v) any additional benefits and other considerations.
With respect to the nature, extent and quality of the services provided by Level Four under the Level Four Sub-Advisory Agreement, the Board, including the Independent Trustees considered and reviewed information concerning the services provided under the Level Four Sub-Advisory Agreement, LGRO’s performance, financial information regarding Level Four, information describing Level Four’s current organization and the background and experience of the persons responsible for the day-to-day management of LGRO. Based upon their review, the Board, including the Independent Trustees concluded that Level Four was qualified to oversee the portfolio management of Level Four and that the services provided by Level Four to LGRO are satisfactory.
The Board, including the Independent Trustees considered that the contractual sub-advisory fee to be paid to Level Four with respect to LGRO was 0.25% of LGRO’s average daily net assets out of a total management fee of 0.50% of LGRO’s average daily net assets.
In reviewing LGRO’s profitability with respect to Level Four, the Board, including the Independent Trustees considered the resources involved in managing LGRO.
The Board, including the Independent Trustees also considered other benefits that have been and may be realized by Level Four from its relationships with LGRO, known as fall-out benefits.
The Board, including the Independent Trustees considered the extent to which economies of scale may be realized if LGRO’s assets continue to grow in size and whether fee levels reflect a reasonable sharing of such economies of scale for the benefit of the Fund’s investors. The Board, including the Independent Trustees noted that LGRO commenced operations on August 22, 2023 and has not yet achieved scale in terms of assets. The Independent Trustees determined that AAI should continue to keep the Board informed on an ongoing basis of any significant developments (e.g., material increases in asset levels) so as to facilitate the Independent Trustees’ evaluation of whether further economies of scale have been achieved with respect to LGRO.
In voting to approve the Level Four Sub-Advisory Agreement, the Board, including the Independent Trustees concluded that the terms of the Level Four Sub-Advisory Agreement are reasonable and fair in light of the services performed, expenses incurred and such other matters as the Board, including the Independent Trustees considered relevant in the exercise of their reasonable business judgment. The Board, including the Independent Trustees did not identify any single factor or group of factors as all important or controlling and considered all factors together.
At its meeting held on November 8, 2024, the Board, where certain Trustees were not an “interested person” of the Trust within the meaning of the Investment Company Act of 1940, as amended (the “Independent Trustees”), evaluated a proposal to approve a new Investment Sub-Advisory Agreement between the Trust, AAI and Level Four with respect to the Fund (the “New Level Four Sub-Advisory Agreement”) in advance of a transaction involving the transfer of a majority equity position in Carr, Riggs & Ingram, LLC (“CRI”), the parent company of Level Four, to a group of new investors which include Centerbridge Partners, L.P. and Bessemer Venture Partners (the “Transaction”). The Transaction closing constitutes a deemed “assignment” of the Level Four Sub-Advisory Agreement and therefore results in the automatic termination of such agreement under the Investment Company Act of 1940, as amended. The New Level Four Sub-Advisory Agreement contains materially identical terms as compared to the Level Four Sub-Advisory Agreement.
The Board, including the Independent Trustees, discussed the Transaction, Level Four, the Level Four Sub-Advisory Agreement and the New Level Four Sub-Advisory Agreement, as applicable. The Independent Trustees also met separately to consider the foregoing. At the Board meeting and throughout the process of considering the Transaction, the Board, including the Independent Trustees, was advised by counsel to the Independent Trustees and counsel to the Trust.
18 | November 30, 2024
Level Four Large Cap Growth Active ETF
Statement Regarding Basis for Approval of Investment Advisory Contract | November 30, 2024 (Unaudited) |
In their consideration of the New Level Four Sub-Advisory Agreement, counsel to the Independent Trustees and counsel to the Trust requested certain materials from Level Four and reviewed their responses thereto. The Board communicated with representatives of Level Four regarding their personnel, operations and financial condition. The Board also reviewed the terms of the Transaction and considered its possible effects on the Fund and its shareholders. In this regard, the Trustees spoke with representatives of AAI and Level Four during the Board meeting and, with respect to the Independent Trustees, in private session to discuss the anticipated effects of the Transaction.
During these meetings, the representatives of AAI and Level Four indicated their belief that the Transaction would not adversely affect (i) the continued operation of the Fund, or (ii) the capabilities of Level Four to continue to provide the same level of sub-advisory services to the Fund. AAI recommended that the Board approve the New Level Four Sub-Advisory Agreement.
In determining whether to approve the New Level Four Sub-Advisory Agreement, the Board received information and made inquiries into all matters as it deemed appropriate. The Board reviewed and analyzed various factors it deemed relevant, including the following factors, among others, none of which by itself was considered dispositive:
| | • | the terms of the New Level Four Sub-Advisory Agreement, including the fees payable by AAI to Level Four, are the same as the Level Four Sub-Advisory Agreement, but for the new commencement date; |
| | | |
| | • | assurances from Level Four that the manner in which the Fund’s assets are managed will not change as a result of the Transaction, that the same people who currently manage the Fund’s assets are expected to continue to do so after the Transaction, and that Level Four will seek to ensure that there is no diminution in the nature, quality and extent of the services provided to the Fund by Level Four; |
| | | |
| | • | Level Four’s financial condition, its parent company’s (CRI’s) financial condition, as well as the financial condition of the two new investors in CRI in connection with the Transaction; |
| | | |
| | • | that while the operations of Level Four are expected to continue without change following the Transaction, Level Four expects to benefit indirectly from the Transaction; |
| | | |
| | • | the potential adverse effects on the Fund in the event the Transaction is completed and the New Level Four Sub-Advisory Agreement is not approved; |
| | | |
| | • | the fact that Fund shareholders will not bear any costs in connection with the Transaction because Level Four or its affiliates have committed to pay the expenses of the Fund in connection with the Transaction; and |
| | | |
| | • | representations from Level Four that there are no other material updates to the information provided by Level Four to the Board in support of the Board’s consideration and approval of the continuance of the Level Four Sub-Advisory Agreement at its June 2024 meetings. |
In voting to approve the New Level Four Sub-Advisory Agreement, the Board, including the Independent Trustees, concluded that the terms of the New Level Four Sub-Advisory Agreement are reasonable and fair in light of the services performed, expenses incurred and such other matters as the Board, including the Independent Trustees, considered relevant in the exercise of their reasonable business judgment. The Board, including the Independent Trustees, did not identify any single factor or group of factors as all important or controlling and considered all factors together.
19 | November 30, 2024


Table of Contents
| Financial Statements and Financial Highlights for Open-End Management Investment Companies | |
| Schedule of Investments | |
| RiverFront Dynamic Core Income ETF | 1 |
| RiverFront Dynamic US Dividend Advantage ETF | 3 |
| RiverFront Strategic Income Fund | 5 |
| Statements of Assets and Liabilities | 8 |
| Statements of Operations | 9 |
| Statements of Changes in Net Assets | |
| RiverFront Dynamic Core Income ETF | 10 |
| RiverFront Dynamic US Dividend Advantage ETF | 11 |
| RiverFront Strategic Income Fund | 12 |
| Financial Highlights | 13 |
| Notes to Financial Statements and Financial Highlights | 16 |
| Report of Independent Registered Public Accounting Firm | 24 |
| Additional Information | 25 |
| Changes in and Disagreements with Accountants for Open-End Management Investment Companies | 26 |
| Proxy Disclosures for Open-End Management Investment Companies | 27 |
| Remuneration Paid to Directors, Officers, and Others of Open-End Management Investment Companies | 28 |
| Statement Regarding Basis for Approval of Investment Advisory Contract | 29 |
alpsfunds.com
RiverFront Dynamic Core Income ETF
| Schedule of Investments | November 30, 2024 |
| Security Description | | Principal Amount | | | Value | |
| CORPORATE BONDS (73.07%) | | | | | | | | |
| Communications (1.15%) | | | | | | | | |
| Charter Communications | | | | | | | | |
| Operating LLC / Charter Communications Operating Capital | | | | | | | | |
| 4.908%, 07/23/2025 | | $ | 50,000 | | | $ | 49,981 | |
| Comcast Corp. | | | | | | | | |
| 4.150%, 10/15/2028 | | | 214,000 | | | | 211,004 | |
| Total Communications | | | | | | | 260,985 | |
| | | | | | | | | |
| Consumer Discretionary (15.20%) | | | | | | | | |
| Ford Motor Co. | | | | | | | | |
| 9.625%, 04/22/2030 | | | 295,000 | | | | 345,679 | |
| Ford Motor Credit Co. LLC | | | | | | | | |
| 7.350%, 11/04/2027 | | | 480,000 | | | | 506,441 | |
| General Motors Financial Co., Inc. | | | | | | | | |
| 6.400%, 01/09/2033 | | | 729,000 | | | | 773,709 | |
| Goodyear Tire & Rubber Co. | | | | | | | | |
| 4.875%, 03/15/2027 | | | 213,000 | | | | 208,563 | |
| Hyatt Hotels Corp. | | | | | | | | |
| 5.750%, 04/23/2030 | | | 729,000 | | | | 754,633 | |
| Marriott International, Inc. | | | | | | | | |
| 4.000%, 04/15/2028(a) | | | 488,000 | | | | 478,571 | |
| Toyota Motor Credit Corp. | | | | | | | | |
| 3.950%, 06/30/2025 | | | 373,000 | | | | 371,548 | |
| Total Consumer Discretionary | | | | | | | 3,439,144 | |
| | | | | | | | | |
| Consumer Staples (1.78%) | | | | | | | | |
| Dollar Tree, Inc. | | | | | | | | |
| 4.000%, 05/15/2025 | | | 405,000 | | | | 403,102 | |
| Total Consumer Staples | | | | | | | 403,102 | |
| | | | | | | | | |
| Energy (8.40%) | | | | | | | | |
| Hess Midstream Operations LP | | | | | | | | |
| 4.250%, 02/15/2030(b) | | | 213,000 | | | | 200,430 | |
| Kinetik Holdings LP | | | | | | | | |
| 6.625%, 12/15/2028(b) | | | 848,000 | | | | 868,871 | |
| Marathon Oil Corp. | | | | | | | | |
| 4.400%, 07/15/2027 | | | 401,000 | | | | 399,513 | |
| Phillips 66 Co. | | | | | | | | |
| 5.250%, 06/15/2031 | | | 423,000 | | | | 430,827 | |
| Total Energy | | | | | | | 1,899,641 | |
| | | | | | | | | |
| Financials (24.12%) | | | | | | | | |
| Bank of America Corp. | | | | | | | | |
| 4.250%, 10/22/2026 | | | 298,000 | | | | 295,475 | |
| 5Y US TI + 3.23%(c)(d) | | | 525,000 | | | | 537,859 | |
| Blue Owl Credit Income Corp. | | | | | | | | |
| 7.750%, 01/15/2029 | | | 848,000 | | | | 906,347 | |
| Citigroup, Inc. | | | | | | | | |
| 4.450%, 09/29/2027 | | | 387,000 | | | | 382,963 | |
| 6.625%, 06/15/2032 | | | 126,000 | | | | 137,508 | |
| FNB Corp. | | | | | | | | |
| 5.150%, 08/25/2025 | | | 441,000 | | | | 440,684 | |
| Security Description | | Principal Amount | | | Value | |
| Financials (continued) | | | | | | |
| FS KKR Capital Corp. | | | | | | |
| 4.250%, 02/14/2025(b) | | $ | 405,000 | | | $ | 403,950 | |
| Host Hotels & Resorts LP | | | | | | | | |
| 4.000%, 06/15/2025 | | | 265,000 | | | | 263,341 | |
| Iron Mountain, Inc. | | | | | | | | |
| 4.875%, 09/15/2027(b) | | | 407,000 | | | | 401,108 | |
| JPMorgan Chase & Co. | | | | | | | | |
| 4.250%, 10/01/2027 | | | 252,000 | | | | 250,843 | |
| Morgan Stanley | | | | | | | | |
| 5.000%, 11/24/2025 | | | 443,000 | | | | 443,610 | |
| PNC Financial Services Group, Inc. | | | | | | | | |
| 5Y US TI + 3.238%(c)(d) | | | 525,000 | | | | 532,635 | |
| Royal Bank of Canada | | | | | | | | |
| 6.000%, 11/01/2027 | | | 443,000 | | | | 460,435 | |
| Total Financials | | | | | | | 5,456,758 | |
| | | | | | | | | |
| Health Care (1.32%) | | | | | | | | |
| CVS Health Corp. | | | | | | | | |
| 4.300%, 03/25/2028 | | | 86,000 | | | | 84,366 | |
| HCA, Inc. | | | | | | | | |
| 5.375%, 09/01/2026 | | | 213,000 | | | | 214,137 | |
| Total Health Care | | | | | | | 298,503 | |
| | | | | | | | | |
| Industrials (5.06%) | | | | | | | | |
| Boeing Co. | | | | | | | | |
| 4.875%, 05/01/2025 | | | 385,000 | | | | 384,585 | |
| Ingersoll Rand, Inc. | | | | | | | | |
| 5.700%, 08/14/2033 | | | 729,000 | | | | 760,586 | |
| Total Industrials | | | | | | | 1,145,171 | |
| | | | | | | | | |
| Materials (0.95%) | | | | | | | | |
| DuPont de Nemours, Inc. | | | | | | | | |
| 4.725%, 11/15/2028 | | | 213,000 | | | | 214,854 | |
| Total Materials | | | | | | | 214,854 | |
| | | | | | | | | |
| Technology (6.76%) | | | | | | | | |
| Concentrix Corp. | | | | | | | | |
| 6.850%, 08/02/2033 | | | 729,000 | | | | 748,808 | |
| Flex, Ltd. | | | | | | | | |
| 5.250%, 01/15/2032 | | | 300,000 | | | | 300,849 | |
| Micron Technology, Inc. | | | | | | | | |
| 5.375%, 04/15/2028 | | | 471,000 | | | | 480,018 | |
| Total Technology | | | | | | | 1,529,675 | |
| | | | | | | | | |
| Utilities (8.33%) | | | | | | | | |
| Dominion Energy, Inc. | | | | | | | | |
| 4.250%, 06/01/2028 | | | 488,000 | | | | 482,179 | |
| Public Service Enterprise Group, Inc. | | | | | | | | |
| 5.850%, 11/15/2027 | | | 480,000 | | | | 496,777 | |
| Southern California Gas Co. | | | | | | | | |
| 5.200%, 06/01/2033 | | | 429,000 | | | | 438,813 | |
See Notes to Financial Statements and Financial Highlights.
1 | November 30, 2024
RiverFront Dynamic Core Income ETF
| Schedule of Investments | November 30, 2024 |
| Security Description | | Principal Amount | | | Value | |
| Utilities (continued) | | | | | | |
| Vistra Operations Co. LLC | | | | | | | | |
| 7.750%, 10/15/2031(b) | | $ | 439,000 | | | $ | 466,715 | |
| Total Utilities | | | | | | | 1,884,484 | |
| | | | | | | | | |
| TOTAL CORPORATE BONDS | | | | | | | | |
| (Cost $16,440,912) | | | | | | | 16,532,317 | |
| | | | | | | | | |
| GOVERNMENT BONDS (21.59%) | | | | | | | | |
| United States Treasury Bond | | | | | | | | |
| 6.125%, 08/15/2029 | | | 729,000 | | | | 792,105 | |
| 4.375%, 05/15/2034 | | | 350,000 | | | | 354,840 | |
| 4.750%, 11/15/2043 | | | 2,289,000 | | | | 2,375,106 | |
| 4.000%, 11/15/2052 | | | 950,000 | | | | 885,986 | |
| 3.625%, 05/15/2053 | | | 547,000 | | | | 477,343 | |
| TOTAL GOVERNMENT BONDS | | | | | | | | |
| (Cost $5,027,831) | | | | | | | 4,885,380 | |
| | | 7 Day Yield | | | Shares | | | Value | |
| SHORT TERM INVESTMENTS (4.29%) | |
| Money Market Fund (4.29%) | | | | | | | | | |
| State Street Institutional | | | | | | | | | |
| Treasury Plus Money | | | | | | | | | | | | |
| Market Fund (Premier Class) | | | 4.59 | % | | | 969,566 | | | $ | 969,566 | |
| | | | | | | | | | | | | |
| TOTAL SHORT TERM INVESTMENTS | | | | | | |
| | | | | | | | | | | | | |
| (Cost $969,566) | | | | | | | | | | | 969,566 | |
| | | | | | | | | | | | | |
| TOTAL INVESTMENTS (98.94%) | | | | | | |
| (Cost $22,438,309) | | | | $ | 22,387,263 | |
| OTHER ASSETS IN EXCESS OF LIABILITIES (1.06%) | | | | 239,205 | |
| NET ASSETS - 100.00% | | | | $ | 22,626,468 | |
Investment Abbreviations:
TI - Treasury Index
Reference Rates:
5Y US TI - 5 Year US TI as of November 30, 2024 was 4.05%
| (a) | Securities were purchased pursuant to Regulation S under the Securities Act of 1933, which exempts securities offered and sold outside of the United States from registration. Such securities cannot be sold in the United States without either an effective registration statement filed pursuant to the Securities Act of 1933, or pursuant to an exemption from registration. As of November 30, 2024, the market value of those securities was $478,571, representing 2.12% of net assets. |
| (b) | Securities exempt from registration under Rule 144A of the Securities Act of 1933. These securities may be sold in the ordinary course of business in transactions exempt from registration, normally to qualified institutional buyers. At period end, the aggregate market value of those securities was $2,341,074, representing 10.35% of net assets. |
| (c) | Floating or variable rate security. Interest rate resets periodically on specific dates. The rate shown represents the coupon or interest rate in effect as of November 30, 2024. Security description includes the reference rate and spread if published and available. |
| (d) | Securities are perpetual and thus do not have a predetermined maturity date. |
See Notes to Financial Statements and Financial Highlights.
2 | November 30, 2024
RiverFront Dynamic US Dividend Advantage ETF
| Schedule of Investments | November 30, 2024 |
| Security Description | | Shares | | | Value | |
| COMMON STOCKS (98.21%) | | | | | | |
| Communication Services (3.64%) | | | | | | | | |
| Alphabet, Inc., Class A | | | 3,548 | | | $ | 599,434 | |
| Alphabet, Inc., Class C | | | 10,224 | | | | 1,743,090 | |
| TEGNA, Inc. | | | 27,435 | | | | 514,955 | |
| Total Communication Services | | | | | | | 2,857,479 | |
| | | | | | | | | |
| Consumer Discretionary (11.66%) | | | | | | | | |
| Amazon.com, Inc.(a) | | | 15,999 | | | | 3,326,032 | |
| Ethan Allen Interiors, Inc. | | | 16,052 | | | | 493,278 | |
| H&R Block, Inc. | | | 22,456 | | | | 1,331,192 | |
| Nordstrom, Inc. | | | 27,736 | | | | 629,884 | |
| Perdoceo Education Corp. | | | 68,967 | | | | 1,893,144 | |
| TJX Cos., Inc. | | | 7,994 | | | | 1,004,766 | |
| Upbound Group, Inc. | | | 13,915 | | | | 478,537 | |
| Total Consumer Discretionary | | | | | | | 9,156,833 | |
| | | | | | | | | |
| Consumer Staples (2.82%) | | | | | | | | |
| Altria Group, Inc. | | | 11,475 | | | | 662,566 | |
| B&G Foods, Inc.(b) | | | 104,878 | | | | 700,585 | |
| Coca-Cola Co. | | | 7,695 | | | | 493,096 | |
| Philip Morris International, Inc. | | | 2,680 | | | | 356,601 | |
| Total Consumer Staples | | | | | | | 2,212,848 | |
| | | | | | | | | |
| Energy (8.35%) | | | | | | | | |
| Antero Midstream Corp. | | | 83,002 | | | | 1,325,542 | |
| Crescent Energy Co. | | | 76,572 | | | | 1,138,625 | |
| Devon Energy Corp. | | | 8,293 | | | | 314,719 | |
| EOG Resources, Inc. | | | 8,426 | | | | 1,122,849 | |
| Exxon Mobil Corp. | | | 7,255 | | | | 855,800 | |
| Kinder Morgan, Inc. | | | 42,170 | | | | 1,192,146 | |
| VAALCO Energy, Inc.(b) | | | 119,297 | | | | 610,801 | |
| Total Energy | | | | | | | 6,560,482 | |
| | | | | | | | | |
| Financials (18.59%) | | | | | | | | |
| Fidelity National Information Services, Inc. | | | 14,296 | | | | 1,219,449 | |
| First Financial Corp. | | | 15,950 | | | | 778,998 | |
| First Horizon National Corp. | | | 41,047 | | | | 867,323 | |
| FNB Corp. | | | 28,665 | | | | 491,605 | |
| Fulton Financial Corp. | | | 27,698 | | | | 597,723 | |
| Hanmi Financial Corp. | | | 36,110 | | | | 955,109 | |
| Heritage Commerce Corp. | | | 68,960 | | | | 732,355 | |
| Old Republic International Corp. | | | 33,853 | | | | 1,319,251 | |
| OneMain Holdings, Inc. | | | 11,244 | | | | 644,843 | |
| Ready Capital Corp.(b) | | | 37,700 | | | | 277,849 | |
| Starwood Property Trust, Inc. | | | 15,633 | | | | 318,444 | |
| TrustCo Bank Corp. NY | | | 20,260 | | | | 754,482 | |
| Universal Insurance Holdings, Inc. | | | 35,866 | | | | 811,648 | |
| US Bancorp | | | 25,702 | | | | 1,369,660 | |
| Valley National Bancorp | | | 53,953 | | | | 574,060 | |
| Veritex Holdings, Inc. | | | 19,505 | | | | 593,147 | |
| Visa, Inc., Class A | | | 3,224 | | | | 1,015,818 | |
| Washington Trust Bancorp, Inc. | | | 22,450 | | | | 833,793 | |
| Security Description | | Shares | | | Value | |
| Financials (continued) | | | | | | | | |
| Western Union Co. | | | 40,474 | | | $ | 445,619 | |
| Total Financials | | | | | | | 14,601,176 | |
| | | | | | | | | |
| Health Care (1.70%) | | | | | | | | |
| Amgen, Inc. | | | 1,846 | | | | 522,178 | |
| National Research Corp. | | | 41,358 | | | | 813,098 | |
| Total Health Care | | | | | | | 1,335,276 | |
| | | | | | | | | |
| Industrials (6.67%) | | | | | | | | |
| Apogee Enterprises, Inc. | | | 13,375 | | | | 1,126,309 | |
| Deluxe Corp. | | | 37,679 | | | | 873,023 | |
| Genco Shipping & Trading, Ltd. | | | 37,669 | | | | 597,807 | |
| Lockheed Martin Corp. | | | 1,024 | | | | 542,116 | |
| MSC Industrial Direct Co. Inc, Class A, Class A(b) | | | 5,199 | | | | 446,490 | |
| Paychex, Inc. | | | 3,716 | | | | 543,539 | |
| Pitney Bowes, Inc. | | | 137,972 | | | | 1,112,054 | |
| Total Industrials | | | | | | | 5,241,338 | |
| | | | | | | | | |
| Information Technology (32.09%) | | | | | | | | |
| Apple, Inc. | | | 27,011 | | | | 6,410,521 | |
| Cisco Systems, Inc. | | | 23,434 | | | | 1,387,527 | |
| Hewlett Packard Enterprise Co. | | | 65,320 | | | | 1,386,090 | |
| International Business Machines Corp. | | | 6,440 | | | | 1,464,520 | |
| Microsoft Corp. | | | 14,182 | | | | 6,005,510 | |
| NVIDIA Corp. | | | 55,670 | | | | 7,696,378 | |
| QUALCOMM, Inc. | | | 5,422 | | | | 859,550 | |
| Total Information Technology | | | | | | | 25,210,096 | |
| | | | | | | | | |
| Materials (2.45%) | | | | | | | | |
| Greif, Inc. | | | 6,622 | | | | 501,550 | |
| Myers Industries, Inc. | | | 62,550 | | | | 725,580 | |
| Ramaco Resources, Inc. | | | 54,854 | | | | 699,389 | |
| Total Materials | | | | | | | 1,926,519 | |
| | | | | | | | | |
| Real Estate (6.61%) | | | | | | | | |
| Camden Property Trust | | | 4,040 | | | | 508,232 | |
| Curbline Properties Corp.(a) | | | 21,258 | | | | 515,719 | |
| Global Medical REIT, Inc. | | | 94,775 | | | | 842,550 | |
| Invitation Homes, Inc. | | | 13,743 | | | | 470,698 | |
| Medical Properties Trust, Inc. | | | 103,111 | | | | 452,657 | |
| Piedmont Office Realty Trust, Inc., Class A | | | 33,013 | | | | 314,284 | |
| SITE Centers Corp. | | | 10,436 | | | | 161,967 | |
| Tanger, Inc. | | | 27,351 | | | | 1,011,166 | |
| Universal Health Realty Income Trust | | | 21,627 | | | | 912,443 | |
| Total Real Estate | | | | | | | 5,189,716 | |
| | | | | | | | | |
| Utilities (3.63%) | | | | | | | | |
| Clearway Energy, Inc., Class C | | | 40,562 | | | | 1,196,174 | |
| Evergy, Inc. | | | 7,014 | | | | 453,315 | |
See Notes to Financial Statements and Financial Highlights.
3 | November 30, 2024
RiverFront Dynamic US Dividend Advantage ETF
| Schedule of Investments | November 30, 2024 |
| Security Description | | Shares | | | Value | |
| Utilities (continued) | | | | | | | | |
| Public Service Enterprise Group, Inc. | | | 12,766 | | | $ | 1,203,834 | |
| Total Utilities | | | | | | | 2,853,323 | |
| | | | | | | | | |
| TOTAL COMMON STOCKS | | | | | | | | |
| (Cost $61,447,368) | | | | | | | 77,145,086 | |
| | | 7 Day Yield | | | Shares | | | Value | |
| SHORT TERM INVESTMENTS (2.34%) | |
| State Street Institutional | | | | | | | | | |
| Treasury Plus Money | | | | | | | | | |
| Market Fund (Premier Class) | | | | | | | | | | | | |
| (Cost $1,351,731) | | | 4.59 | % | | | 1,351,731 | | | $ | 1,351,731 | |
| | | | | | | | | | | | | |
| Investments Purchased with Collateral from Securities Loaned (0.62%) | | | | | | | | | | | | |
| State Street Navigator | | | | | | | | | | | | |
| Securities Lending | | | | | | | | | | | | |
| Government Money Market Portfolio, 4.63% | | | | | | | | | | | | |
| (Cost $488,375) | | | | | | | 488,375 | | | | 488,375 | |
| TOTAL SHORT TERM INVESTMENTS | | | | | |
| | | | | | | | | | | | | |
| (Cost $1,840,106) | | | | 1,840,106 | |
| | | | | | | | | | | | | |
| TOTAL INVESTMENTS (100.55%) | | | | | |
| (Cost $63,287,474) | | | | | | | | | | $ | 78,985,192 | |
| LIABILITIES IN EXCESS OF OTHER ASSETS (-0.55%) | | | | (429,549 | ) |
| NET ASSETS - 100.00% | | | $ | 78,555,643 | |
| (a) | Non-income producing security. |
| (b) | Security, or a portion of the security position is currently on loan. The total market value of securities on loan is $1,227,393. |
See Notes to Financial Statements and Financial Highlights.
4 | November 30, 2024
RiverFront Strategic Income Fund
| Schedule of Investments | November 30, 2024 |
| Security Description | | Principal Amount | | | Value | |
| CORPORATE BONDS (77.20%) | | | | | | |
| Communications (4.97%) | | | | | | |
| CCO Holdings LLC / CCO Holdings Capital Corp. | | | | | | | | |
| 5.500%, 05/01/2026(a) | | $ | 341,000 | | | $ | 340,754 | |
| Charter Communications Operating LLC / Charter Communications Operating Capital | | | | | | | | |
| 6.150%, 11/10/2026 | | | 893,000 | | | | 912,231 | |
| Netflix, Inc. | | | | | | | | |
| 4.375%, 11/15/2026 | | | 616,000 | | | | 615,503 | |
| Sirius XM Radio, Inc. | | | | | | | | |
| 5.000%, 08/01/2027(a) | | | 720,000 | | | | 708,307 | |
| T-Mobile USA, Inc. | | | | | | | | |
| 4.750%, 02/01/2028 | | | 1,076,000 | | | | 1,072,714 | |
| Warnermedia Holdings, Inc. | | | | | | | | |
| 6.412%, 03/15/2026 | | | 343,000 | | | | 343,007 | |
| Total Communications | | | | | | | 3,992,516 | |
| | | | | | | | | |
| Consumer Discretionary (13.97%) | | | | | | | | |
| Brink's Co. | | | | | | | | |
| 6.500%, 06/15/2029(a) | | | 832,000 | | | | 851,150 | |
| Ford Motor Credit Co. LLC 6.950%, 03/06/2026 | | | 753,000 | | | | 767,215 | |
| General Motors Financial Co., Inc. | | | | | | | | |
| 5.400%, 04/06/2026 | | | 710,000 | | | | 715,145 | |
| Goodyear Tire & Rubber Co. | | | | | | | | |
| 5.000%, 05/31/2026 | | | 782,000 | | | | 774,164 | |
| Group 1 Automotive, Inc. | | | | | | | | |
| 6.375%, 01/15/2030(a) | | | 868,000 | | | | 879,965 | |
| Hilton Domestic Operating Co., Inc. | | | | | | | | |
| 5.750%, 05/01/2028(a) | | | 893,000 | | | | 894,402 | |
| Hyatt Hotels Corp. | | | | | | | | |
| 5.750%, 01/30/2027 | | | 735,000 | | | | 748,930 | |
| Las Vegas Sands Corp. | | | | | | | | |
| 6.000%, 08/15/2029 | | | 808,000 | | | | 828,106 | |
| Lennar Corp. | | | | | | | | |
| 4.750%, 11/29/2027 | | | 740,000 | | | | 742,824 | |
| Marriott International, Inc. | | | | | | | | |
| 4.900%, 04/15/2029 | | | 710,000 | | | | 715,590 | |
| MGM Resorts International | | | | | | | | |
| 5.500%, 04/15/2027 | | | 760,000 | | | | 760,255 | |
| Newell Brands, Inc. | | | | | | | | |
| 6.375%, 09/15/2027 | | | 893,000 | | | | 908,276 | |
| Service Corp. International | | | | | | | | |
| 5.750%, 10/15/2032 | | | 891,000 | | | | 888,811 | |
| Volkswagen Group of America Finance LLC | | | | | | | | |
| 6.450%, 11/16/2030(a) | | | 725,000 | | | | 761,333 | |
| Total Consumer Discretionary | | | | | | | 11,236,166 | |
| Security Description | | Principal Amount | | | Value | |
| Consumer Staples (2.68%) | | | | | | |
| Anheuser-Busch InBev Worldwide, Inc. | | | | | | | | |
| 4.750%, 01/23/2029 | | $ | 648,000 | | | $ | 654,634 | |
| JBS USA Holding Lux Sarl/ JBS USA Food Co./ JBS Lux Co Sarl | | | | | | | | |
| 5.125%, 02/01/2028 | | | 720,000 | | | | 722,152 | |
| Post Holdings, Inc. | | | | | | | | |
| 6.250%, 02/15/2032(a) | | | 772,000 | | | | 780,975 | |
| Total Consumer Staples | | | | | | | 2,157,761 | |
| | | | | | | | | |
| Energy (8.00%) | | | | | | | | |
| Columbia Pipelines Holding Co. LLC | | | | | | | | |
| 6.042%, 08/15/2028(a) | | | 753,000 | | | | 777,663 | |
| DCP Midstream Operating LP | | | | | | | | |
| 5.375%, 07/15/2025 | | | 393,000 | | | | 393,927 | |
| EQM Midstream Partners LP | | | | | | | | |
| 6.375%, 04/01/2029(a) | | | 1,116,000 | | | | 1,139,850 | |
| Hess Midstream Operations LP | | | | | | | | |
| 6.500%, 06/01/2029(a) | | | 808,000 | | | | 828,433 | |
| Hilcorp Energy I LP / Hilcorp Finance Co. | | | | | | | | |
| 7.250%, 02/15/2035(a) | | | 891,000 | | | | 872,852 | |
| Kinetik Holdings LP | | | | | | | | |
| 6.625%, 12/15/2028(a) | | | 753,000 | | | | 771,533 | |
| Murphy Oil Corp. | | | | | | | | |
| 6.000%, 10/01/2032 | | | 891,000 | | | | 873,068 | |
| Sunoco LP / Sunoco Finance Corp. | | | | | | | | |
| 7.000%, 09/15/2028(a) | | | 753,000 | | | | 775,733 | |
| Total Energy | | | | | | | 6,433,059 | |
| | | | | | | | | |
| Financials (21.67%) | | | | | | | | |
| Aircastle, Ltd. | | | | | | | | |
| 6.500%, 07/18/2028(a) | | | 753,000 | | | | 785,989 | |
| American Express Co. | | | | | | | | |
| 5.850%, 11/05/2027 | | | 796,000 | | | | 824,096 | |
| Ares Capital Corp. | | | | | | | | |
| 7.000%, 01/15/2027 | | | 720,000 | | | | 745,924 | |
| Avolon Holdings Funding, Ltd. | | | | | | | | |
| 6.375%, 05/04/2028(a) | | | 766,000 | | | | 795,301 | |
| Banco Santander SA | | | | | | | | |
| 5.147%, 08/18/2025 | | | 720,000 | | | | 721,361 | |
| Block, Inc. | | | | | | | | |
| 6.500%, 05/15/2032(a) | | | 784,000 | | | | 805,344 | |
| Blue Owl Credit Income Corp. | | | | | | | | |
| 7.750%, 01/15/2029 | | | 720,000 | | | | 769,540 | |
| Blue Owl Technology Finance Corp. II | | | | | | | | |
| 6.750%, 04/04/2029(a) | | | 760,000 | | | | 767,212 | |
| Capital One Financial Corp. | | | | | | | | |
| 4.200%, 10/29/2025 | | | 648,000 | | | | 643,963 | |
| Citigroup, Inc. | | | | | | | | |
| 4.450%, 09/29/2027 | | | 1,000,000 | | | | 989,569 | |
| EPR Properties | | | | | | | | |
| 4.750%, 12/15/2026 | | | 615,000 | | | | 611,661 | |
See Notes to Financial Statements and Financial Highlights.
5 | November 30, 2024
RiverFront Strategic Income Fund
| Schedule of Investments | November 30, 2024 |
| Security Description | | Principal Amount | | | Value | |
| Financials (continued) | | | | | | |
| HAT Holdings I LLC / HAT Holdings II LLC | | | | | | | | |
| 8.000%, 06/15/2027(a) | | $ | 832,000 | | | $ | 868,521 | |
| HSBC USA, Inc. | | | | | | | | |
| 5.294%, 03/04/2027 | | | 772,000 | | | | 783,954 | |
| Iron Mountain, Inc. | | | | | | | | |
| 4.875%, 09/15/2027(a) | | | 694,000 | | | | 683,951 | |
| JPMorgan Chase & Co. | | | | | | | | |
| 4.250%, 10/01/2027 | | | 1,000,000 | | | | 995,409 | |
| KeyBank NA/Cleveland OH | | | | | | | | |
| 5.850%, 11/15/2027 | | | 753,000 | | | | 774,567 | |
| Macquarie Airfinance Holdings, Ltd. | | | | | | | | |
| 6.400%, 03/26/2029(a) | | | 832,000 | | | | 861,004 | |
| Omega Healthcare Investors, Inc. | | | | | | | | |
| 5.250%, 01/15/2026 | | | 399,000 | | | | 399,678 | |
| OneMain Finance Corp. | | | | | | | | |
| 6.625%, 01/15/2028 | | | 808,000 | | | | 824,970 | |
| Penske Truck Leasing Co. Lp / PTL Finance Corp. | | | | | | | | |
| 6.050%, 08/01/2028(a) | | | 753,000 | | | | 783,088 | |
| Royal Bank of Canada | | | | | | | | |
| 6.000%, 11/01/2027 | | | 796,000 | | | | 827,328 | |
| Starwood Property Trust, Inc. | | | | | | | | |
| 4.750%, 03/15/2025 | | | 308,000 | | | | 308,706 | |
| VICI Properties LP / VICI Note Co., Inc. | | | | | | | | |
| 4.250%, 12/01/2026(a) | | | 871,000 | | | | 856,130 | |
| Total Financials | | | | | | | 17,427,266 | |
| | | | | | | | | |
| Health Care (3.12%) | | | | | | | | |
| DaVita, Inc. | | | | | | | | |
| 4.625%, 06/01/2030(a) | | | 694,000 | | | | 650,525 | |
| GE HealthCare Technologies, Inc. | | | | | | | | |
| 5.600%, 11/15/2025 | | | 753,000 | | | | 758,255 | |
| HCA, Inc. | | | | | | | | |
| 5.375%, 02/01/2025 | | | 320,000 | | | | 319,972 | |
| 5.625%, 09/01/2028 | | | 760,000 | | | | 776,314 | |
| Total Health Care | | | | | | | 2,505,066 | |
| | | | | | | | | |
| Industrials (7.14%) | | | | | | | | |
| Boeing Co. | | | | | | | | |
| 4.875%, 05/01/2025 | | | 740,000 | | | | 739,201 | |
| Hillenbrand, Inc. | | | | | | | | |
| 6.250%, 02/15/2029 | | | 760,000 | | | | 775,652 | |
| L3Harris Technologies, Inc. | | | | | | | | |
| 5.400%, 07/31/2033 | | | 956,000 | | | | 978,548 | |
| MasTec, Inc. | | | | | | | | |
| 4.500%, 08/15/2028(a) | | | 664,000 | | | | 648,400 | |
| TransDigm, Inc. | | | | | | | | |
| 6.375%, 03/01/2029(a) | | | 772,000 | | | | 785,546 | |
| Trinity Industries, Inc. | | | | | | | | |
| 7.750%, 07/15/2028(a) | | | 808,000 | | | | 843,874 | |
| Security Description | | Principal
Amount | | | Value | |
| Industrials (continued) | | | | | | |
| United Rentals North America, Inc. | | | | | | | | |
| 6.000%, 12/15/2029(a) | | $ | 954,000 | | | $ | 971,938 | |
| Total Industrials | | | | | | | 5,743,159 | |
| | | | | | | | | |
| Materials (8.97%) | | | | | | | | |
| Alcoa Nederland Holding BV | | | | | | | | |
| 7.125%, 03/15/2031(a) | | | 760,000 | | | | 795,868 | |
| ArcelorMittal SA | | | | | | | | |
| 6.550%, 11/29/2027 | | | 753,000 | | | | 788,134 | |
| Avient Corp. | | | | | | | | |
| 6.250%, 11/01/2031(a) | | | 891,000 | | | | 901,548 | |
| Ball Corp. | | | | | | | | |
| 6.000%, 06/15/2029 | | | 760,000 | | | | 774,060 | |
| Berry Global, Inc. | | | | | | | | |
| 4.875%, 07/15/2026(a) | | | 336,000 | | | | 334,975 | |
| Celanese US Holdings LLC | | | | | | | | |
| 6.800%, 11/15/2030 | | | 753,000 | | | | 793,334 | |
| Freeport-McMoRan, Inc. | | | | | | | | |
| 5.000%, 09/01/2027 | | | 343,000 | | | | 343,867 | |
| Methanex Corp. | | | | | | | | |
| 5.125%, 10/15/2027 | | | 625,000 | | | | 614,366 | |
| Sasol Financing USA LLC | | | | | | | | |
| 4.375%, 09/18/2026 | | | 399,000 | | | | 385,465 | |
| Sealed Air Corp./Sealed Air Corp US | | | | | | | | |
| 6.125%, 02/01/2028(a) | | | 760,000 | | | | 768,120 | |
| Standard Industries, Inc. | | | | | | | | |
| 5.000%, 02/15/2027(a) | | | 720,000 | | | | 708,226 | |
| Total Materials | | | | | | | 7,207,963 | |
| | | | | | | | | |
| Technology (2.82%) | | | | | | | | |
| CDW LLC / CDW Finance Corp. | | | | | | | | |
| 3.569%, 12/01/2031 | | | 8,000 | | | | 7,175 | |
| Concentrix Corp. | | | | | | | | |
| 6.600%, 08/02/2028 | | | 1,076,000 | | | | 1,102,930 | |
| Gen Digital, Inc. | | | | | | | | |
| 5.000%, 04/15/2025(a) | | | 499,000 | | | | 498,498 | |
| Microchip Technology, Inc. | | | | | | | | |
| 4.250%, 09/01/2025 | | | 664,000 | | | | 661,116 | |
| Total Technology | | | | | | | 2,269,719 | |
| | | | | | | | | |
| Utilities (3.86%) | | | | | | | | |
| American Electric Power Co., Inc. | | | | | | | | |
| 5.750%, 11/01/2027 | | | 796,000 | | | | 820,329 | |
| AmeriGas Partners LP / AmeriGas Finance Corp. | | | | | | | | |
| 5.875%, 08/20/2026 | | | 669,000 | | | | 658,095 | |
| Calpine Corp. | | | | | | | | |
| 5.250%, 06/01/2026(a) | | | 100,000 | | | | 99,520 | |
| NRG Energy, Inc. | | | | | | | | |
| 5.750%, 01/15/2028 | | | 720,000 | | | | 721,416 | |
See Notes to Financial Statements and Financial Highlights.
6 | November 30, 2024
RiverFront Strategic Income Fund
| Schedule of Investments | November 30, 2024 |
| Security Description | | Principal Amount | | | Value | |
| Utilities (continued) | | | | | | |
| Vistra Operations Co. LLC | | | | | | | | |
| 7.750%, 10/15/2031(a) | | $ | 753,000 | | | $ | 800,539 | |
| Total Utilities | | | | | | | 3,099,899 | |
| | | | | | | | | |
| TOTAL CORPORATE BONDS | | | | | | | | |
| (Cost $61,782,303) | | | | | | | 62,072,574 | |
| | | | | | | | | |
| GOVERNMENT BONDS (19.84%) | | | | | | | | |
| United States Treasury Bond | | | | | | | | |
| 4.375%, 05/15/2034 | | | 979,000 | | | | 992,538 | |
| 4.750%, 11/15/2043 | | | 3,444,000 | | | | 3,573,554 | |
| 4.500%, 02/15/2044 | | | 4,160,000 | | | | 4,172,350 | |
| 4.625%, 05/15/2044 | | | 1,299,000 | | | | 1,323,559 | |
| 4.000%, 11/15/2052 | | | 6,314,000 | | | | 5,888,545 | |
| TOTAL GOVERNMENT BONDS | | | | | | | | |
| (Cost $16,848,850) | | | | | | | 15,950,546 | |
| | | 7 Day Yield | | | Shares | | | Value | |
| SHORT TERM INVESTMENTS (1.80%) | |
| Money Market Fund (1.80%) | | | | | | | | | |
| State Street Institutional | | | | | | | | | |
| Treasury Plus Money | | | | | | | | | | | | |
| Market Fund (Premier Class) | | | 4.59 | % | | | 1,446,701 | | | $ | 1,446,701 | |
| | | | | | | | | | | | | |
| TOTAL SHORT TERM INVESTMENTS | | | | | |
| | | | | | | | | | | | | |
| (Cost $1,446,701) | | | | 1,446,701 | |
| | | | | | | | | | | | | |
| TOTAL INVESTMENTS (98.84%) | | | | | |
| (Cost $80,077,854) | | | $ | 79,469,821 | |
| OTHER ASSETS IN EXCESS OF LIABILITIES (1.16%) | | | | 934,563 | |
| NET ASSETS - 100.00% | | | $ | 80,404,384 | |
| (a) | Securities exempt from registration under Rule 144A of the Securities Act of 1933. These securities may be sold in the ordinary course of business in transactions exempt from registration, normally to qualified institutional buyers. At period end, the aggregate market value of those securities was $26,397,071, representing 32.83% of net assets. |
See Notes to Financial Statements and Financial Highlights.
7 | November 30, 2024
RiverFront ETFs
| Statements of Assets and Liabilities | November 30, 2024 |
| | | RiverFront Dynamic Core Income ETF | | | RiverFront Dynamic US Dividend Advantage ETF | | | RiverFront Strategic Income Fund | |
| ASSETS: | | | | | | | | | |
| Investments, at value(a) | | $ | 22,387,262 | | | $ | 78,985,192 | | | $ | 79,469,821 | |
| Dividend receivable | | | – | | | | 91,690 | | | | – | |
| Interest receivable | | | 247,548 | | | | – | | | | 962,959 | |
| Receivable for investments sold | | | 9,512 | | | | – | | | | 2,172 | |
| Total Assets | | | 22,644,322 | | | | 79,076,882 | | | | 80,434,952 | |
| | | | | | | | | | | | | |
| LIABILITIES: | | | | | | | | | | | | |
| Payable to adviser | | | 9,389 | | | | 32,864 | | | | 30,568 | |
| Payable for collateral upon return of securities loaned | | | – | | | | 488,375 | | | | – | |
| Other Payables | | | 8,465 | | | | – | | | | – | |
| Total Liabilities | | | 17,854 | | | | 521,239 | | | | 30,568 | |
| NET ASSETS | | $ | 22,626,468 | | | $ | 78,555,643 | | | $ | 80,404,384 | |
| | | | | | | | | | | | | |
| NET ASSETS CONSIST OF: | | | | | | | | | | | | |
| Paid-in capital | | $ | 26,230,819 | | | $ | 66,903,452 | | | $ | 96,470,903 | |
| Total distributable earnings/(accumulated losses) | | | (3,604,351 | ) | | | 11,652,191 | | | | (16,066,519 | ) |
| NET ASSETS | | $ | 22,626,468 | | | $ | 78,555,643 | | | $ | 80,404,384 | |
| | | | | | | | | | | | | |
| INVESTMENTS, AT COST | | $ | 22,438,309 | | | $ | 63,287,474 | | | $ | 80,077,854 | |
| | | | | | | | | | | | | |
| PRICING OF SHARES | | | | | | | | | | | | |
| Net Assets | | $ | 22,626,468 | | | $ | 78,555,643 | | | $ | 80,404,384 | |
| Shares of beneficial interest outstanding (Unlimited number of shares authorized, par value $0.01 per share) | | | 1,000,000 | | | | 1,350,002 | | | | 3,475,000 | |
| Net Asset Value, offering and redemption price per share | | $ | 22.63 | | | $ | 58.19 | | | $ | 23.14 | |
| (a) | Includes $-, $1,227,393, and $-, respectively, of securities on loan. |
See Notes to Financial Statements and Financial Highlights.
8 | November 30, 2024
RiverFront ETFs
| Statements of Operations | For the Year Ended November 30, 2024 |
| | | RiverFront Dynamic Core Income ETF | | | RiverFront Dynamic US Dividend Advantage ETF | | | RiverFront Strategic Income Fund | |
| INVESTMENT INCOME: | | | | | | | | | |
| Interest | | $ | 1,142,338 | | | $ | – | | | $ | 4,578,269 | |
| Dividend Income | | | 33,229 | | | | 2,462,613 | | | | 108,443 | |
| Securities Lending Income | | | – | | | | 6,097 | | | | – | |
| Total Investment Income | | | 1,175,567 | | | | 2,468,710 | | | | 4,686,712 | |
| | | | | | | | | | | | | |
EXPENSES: | | | | | | | | | | | | |
| Investment adviser and sub-adviser fees (Note 3) | | | 126,160 | | | | 391,856 | | | | 442,596 | |
| Other expenses | | | 1,069 | | | | 3,200 | | | | 4,191 | |
| Total expenses | | | 127,229 | | | | 395,056 | | | | 446,787 | |
| NET INVESTMENT INCOME | | | 1,048,338 | | | | 2,073,654 | | | | 4,239,925 | |
| | | | | | | | | | | | | |
| REALIZED AND UNREALIZED GAIN/(LOSS) | | | | | | | | | | | | |
| Net realized gain/(loss) on investments(a) | | | (362,460 | ) | | | 5,409,430 | | | | (2,090,548 | ) |
| NET REALIZED GAIN/(LOSS) | | | (362,460 | ) | | | 5,409,430 | | | | (2,090,548 | ) |
| Net change in unrealized appreciation on investments | | | 1,207,623 | | | | 12,905,982 | | | | 4,930,029 | |
| NET CHANGE IN UNREALIZED APPRECIATION/(DEPRECIATION) | | | 1,207,623 | | | | 12,905,982 | | | | 4,930,029 | |
| NET REALIZED AND UNREALIZED GAIN ON INVESTMENTS | | | 845,163 | | | | 18,315,412 | | | | 2,839,481 | |
| NET INCREASE IN NET ASSETS RESULTING FROM OPERATIONS | | $ | 1,893,501 | | | $ | 20,389,066 | | | $ | 7,079,406 | |
| (a) | Includes realized gain or loss as a result of in-kind transactions (See Note 4 in Notes to Financial Statements and financial highlights). |
See Notes to Financial Statements and Financial Highlights.
9 | November 30, 2024
RiverFront Dynamic Core Income ETF
| Statements of Changes in Net Assets | |
| | | For the Year Ended November 30, 2024 | | | For the Year Ended November 30, 2023 | |
| OPERATIONS: | | | | | | |
| Net investment income | | $ | 1,048,338 | | | $ | 1,118,562 | |
| Net realized loss | | | (362,460 | ) | | | (2,678,063 | ) |
| Net change in unrealized appreciation | | | 1,207,623 | | | | 2,316,487 | |
| Net increase in net assets resulting from operations | | | 1,893,501 | | | | 756,986 | |
| | | | | | | | | |
| DISTRIBUTIONS TO SHAREHOLDERS: | | | | | | | | |
| From distributable earnings | | | (1,052,360 | ) | | | (1,130,961 | ) |
| Total distributions | | | (1,052,360 | ) | | | (1,130,961 | ) |
| | | | | | | | | |
| CAPITAL SHARE TRANSACTIONS: | | | | | | | | |
| Proceeds from sale of shares | | | 554,488 | | | | – | |
| Shares redeemed | | | (4,507,572 | ) | | | (17,228,796 | ) |
| Net decrease from share transactions | | | (3,953,084 | ) | | | (17,228,796 | ) |
| | | | | | | | | |
| Net decrease in net assets | | | (3,111,943 | ) | | | (17,602,771 | ) |
| | | | | | | | | |
| NET ASSETS: | | | | | | | | |
| Beginning of period | | | 25,738,411 | | | | 43,341,182 | |
| End of period | | $ | 22,626,468 | | | $ | 25,738,411 | |
| | | | | | | | | |
| OTHER INFORMATION: | | | | | | | | |
| CAPITAL SHARE TRANSACTIONS: | | | | | | | | |
| Beginning shares | | | 1,175,000 | | | | 1,950,000 | |
| Shares sold | | | 25,000 | | | | – | |
| Shares redeemed | | | (200,000 | ) | | | (775,000 | ) |
| Shares outstanding, end of period | | | 1,000,000 | | | | 1,175,000 | |
See Notes to Financial Statements and Financial Highlights.
10 | November 30, 2024
RiverFront Dynamic US Dividend Advantage ETF
| Statements of Changes in Net Assets | |
| | | For the Year Ended November 30, 2024 | | | For the Year Ended November 30, 2023 | |
| OPERATIONS: | | | | | | |
| Net investment income | | $ | 2,073,654 | | | $ | 2,186,831 | |
| Net realized gain | | | 5,409,430 | | | | 554,903 | |
| Net change in unrealized appreciation | | | 12,905,982 | | | | 189,124 | |
| Net increase in net assets resulting from operations | | | 20,389,066 | | | | 2,930,858 | |
| | | | | | | | | |
| DISTRIBUTIONS TO SHAREHOLDERS: | | | | | | | | |
| From distributable earnings | | | (2,072,969 | ) | | | (2,143,621 | ) |
| Total distributions | | | (2,072,969 | ) | | | (2,143,621 | ) |
| | | | | | | | | |
| CAPITAL SHARE TRANSACTIONS: | | | | | | | | |
| Proceeds from sale of shares | | | 3,992,312 | | | | 2,355,358 | |
| Shares redeemed | | | (16,833,938 | ) | | | (22,942,546 | ) |
| Net decrease from share transactions | | | (12,841,626 | ) | | | (20,587,188 | ) |
| | | | | | | | | |
| Net increase/(decrease) in net assets | | | 5,474,471 | | | | (19,799,951 | ) |
| | | | | | | | | |
| NET ASSETS: | | | | | | | | |
| Beginning of period | | | 73,081,172 | | | | 92,881,123 | |
| End of period | | $ | 78,555,643 | | | $ | 73,081,172 | |
| | | | | | | | | |
| OTHER INFORMATION: | | | | | | | | |
| CAPITAL SHARE TRANSACTIONS: | | | | | | | | |
| Beginning shares | | | 1,600,002 | | | | 2,075,002 | |
| Shares sold | | | 75,000 | | | | 50,000 | |
| Shares redeemed | | | (325,000 | ) | | | (525,000 | ) |
| Shares outstanding, end of period | | | 1,350,002 | | | | 1,600,002 | |
See Notes to Financial Statements and Financial Highlights.
11 | November 30, 2024
RiverFront Strategic Income Fund
| Statements of Changes in Net Assets | |
| | | For the Year Ended November 30, 2024 | | | For the Year Ended November 30, 2023 | |
| OPERATIONS: | | | | | | |
| Net investment income | | $ | 4,239,925 | | | $ | 3,767,987 | |
| Net realized loss | | | (2,090,548 | ) | | | (1,911,709 | ) |
| Net change in unrealized appreciation | | | 4,930,029 | | | | 1,453,519 | |
| Net increase in net assets resulting from operations | | | 7,079,406 | | | | 3,309,797 | |
| | | | | | | | | |
| DISTRIBUTIONS TO SHAREHOLDERS: | | | | | | | | |
| From distributable earnings | | | (4,267,963 | ) | | | (3,786,149 | ) |
| Total distributions | | | (4,267,963 | ) | | | (3,786,149 | ) |
| | | | | | | | | |
| CAPITAL SHARE TRANSACTIONS: | | | | | | | | |
| Proceeds from sale of shares | | | 4,613,424 | | | | 23,160,799 | |
| Shares redeemed | | | (38,533,107 | ) | | | (15,931,141 | ) |
| Net increase/(decrease) from share transactions | | | (33,919,683 | ) | | | 7,229,658 | |
| | | | | | | | | |
| Net increase/(decrease) in net assets | | | (31,108,240 | ) | | | 6,753,306 | |
| | | | | | | | | |
| NET ASSETS: | | | | | | | | |
| Beginning of period | | | 111,512,624 | | | | 104,759,318 | |
| End of period | | $ | 80,404,384 | | | $ | 111,512,624 | |
| | | | | | | | | |
| OTHER INFORMATION: | | | | | | | | |
| CAPITAL SHARE TRANSACTIONS: | | | | | | | | |
| Beginning shares | | | 4,950,000 | | | | 4,625,000 | |
| Shares sold | | | 200,000 | | | | 1,025,000 | |
| Shares redeemed | | | (1,675,000 | ) | | | (700,000 | ) |
| Shares outstanding, end of period | | | 3,475,000 | | | | 4,950,000 | |
See Notes to Financial Statements and Financial Highlights.
12 | November 30, 2024
RiverFront Dynamic Core Income ETF
| Financial Highlights | For a Share Outstanding Throughout the Periods Presented |
| | | For the Year Ended November 30, 2024 | | | For the Year Ended November 30, 2023 | | | For the Year Ended November 30, 2022 | | | For the Year Ended November 30, 2021 | | | For the Year Ended November 30, 2020 | |
| NET ASSET VALUE, BEGINNING OF PERIOD | | $ | 21.91 | | | $ | 22.23 | | | $ | 25.35 | | | $ | 26.21 | | | $ | 25.22 | |
| | | | | | | | | | | | | | | | | | | | | |
| INCOME/(LOSS) FROM INVESTMENT OPERATIONS: | | | | | | | | | | | | | | | | | | | | |
| Net investment income(a) | | | 0.95 | | | | 0.75 | | | | 0.47 | | | | 0.47 | | | | 0.50 | |
| Net realized and unrealized gain/(loss) | | | 0.73 | | | | (0.29 | ) | | | (2.71 | ) | | | (0.87 | ) | | | 0.99 | |
| Total from investment operations | | | 1.68 | | | | 0.46 | | | | (2.24 | ) | | | (0.40 | ) | | | 1.49 | |
| | | | | | | | | | | | | | | | | | | | | |
| DISTRIBUTIONS: | | | | | | | | | | | | | | | | | | | | |
| From net investment income | | | (0.96 | ) | | | (0.78 | ) | | | (0.50 | ) | | | (0.46 | ) | | | (0.50 | ) |
| From net realized gains | | | – | | | | – | | | | (0.38 | ) | | | – | | | | – | |
| Total distributions | | | (0.96 | ) | | | (0.78 | ) | | | (0.88 | ) | | | (0.46 | ) | | | (0.50 | ) |
| | | | | | | | | | | | | | | | | | | | | |
| NET INCREASE/(DECREASE) IN NET ASSET VALUE | | | 0.72 | | | | (0.32 | ) | | | (3.12 | ) | | | (0.86 | ) | | | 0.99 | |
| NET ASSET VALUE, END OF PERIOD | | $ | 22.63 | | | $ | 21.91 | | | $ | 22.23 | | | $ | 25.35 | | | $ | 26.21 | |
| TOTAL RETURN(b) | | | 7.80 | % | | | 2.12 | % | | | (9.02 | )% | | | (1.51 | )% | | | 5.97 | % |
| | | | | | | | | | | | | | | | | | | | | |
| RATIOS/SUPPLEMENTAL DATA: | | | | | | | | | | | | | | | | | | | | |
| Net assets, end of period (000s) | | $ | 22,626 | | | $ | 25,738 | | | $ | 43,341 | | | $ | 117,873 | | | $ | 112,724 | |
| | | | | | | | | | | | | | | | | | | | | |
| Ratio of expenses to average net assets | | | 0.51 | % | | | 0.51 | % | | | 0.51 | % | | | 0.51 | % | | | 0.51 | % |
| Ratio of net investment income to average net assets | | | 4.24 | % | | | 3.40 | % | | | 2.03 | % | | | 1.83 | % | | | 1.94 | % |
| Portfolio turnover rate(c) | | | 17 | % | | | 54 | % | | | 50 | % | | | 45 | % | | | 11 | % |
| (a) | Based on average shares outstanding during the period. |
| (b) | Total return is calculated assuming an initial investment made at the net asset value at the beginning of the period and the redemption at the net asset value on the last day of the period and assuming all distributions are reinvested at the actual reinvestment prices. Total return calculated for a period of less than one year is not annualized. |
| (c) | Portfolio turnover for periods less than one year are not annualized and does not include securities received or delivered from processing creations or redemptions in-kind. |
See Notes to Financial Statements and Financial Highlights.
13 | November 30, 2024
RiverFront Dynamic US Dividend Advantage ETF
| Financial Highlights | For a Share Outstanding Throughout the Periods Presented |
| | | For the Year Ended November 30, 2024 | | | For the Year Ended November 30, 2023 | | | For the Year Ended November 30, 2022 | | | For the Year Ended November 30, 2021 | | | For the Year Ended November 30, 2020 | |
| NET ASSET VALUE, BEGINNING OF PERIOD | | $ | 45.68 | | | $ | 44.76 | | | $ | 44.92 | | | $ | 37.03 | | | $ | 33.98 | |
| | | | | | | | | | | | | | | | | | | | | |
| INCOME/(LOSS) FROM INVESTMENT OPERATIONS: | | | | | | | | | | | | | | | | | | | | |
| Net investment income(a) | | | 1.41 | | | | 1.25 | | | | 1.46 | | | | 0.62 | | | | 0.56 | |
| Net realized and unrealized gain/(loss) | | | 12.50 | | | | 0.89 | | | | (0.21 | ) | | | 7.90 | | | | 3.08 | |
| Total from investment operations | | | 13.91 | | | | 2.14 | | | | 1.25 | | | | 8.52 | | | | 3.64 | |
| | | | | | | | | | | | | | | | | | | | | |
| DISTRIBUTIONS: | | | | | | | | | | | | | | | | | | | | |
| From net investment income | | | (1.40 | ) | | | (1.22 | ) | | | (1.41 | ) | | | (0.63 | ) | | | (0.59 | ) |
| Total distributions | | | (1.40 | ) | | | (1.22 | ) | | | (1.41 | ) | | | (0.63 | ) | | | (0.59 | ) |
| | | | | | | | | | | | | | | | | | | | | |
| NET INCREASE/(DECREASE) IN NET ASSET VALUE | | | 12.51 | | | | 0.92 | | | | (0.16 | ) | | | 7.89 | | | | 3.05 | |
| NET ASSET VALUE, END OF PERIOD | | $ | 58.19 | | | $ | 45.68 | | | $ | 44.76 | | | $ | 44.92 | | | $ | 37.03 | |
| TOTAL RETURN(b) | | | 30.90 | % | | | 4.96 | % | | | 2.86 | % | | | 23.13 | % | | | 10.92 | % |
| | | | | | | | | | | | | | | | | | | | | |
| RATIOS/SUPPLEMENTAL DATA: | | | | | | | | | | | | | | | | | | | | |
| Net assets, end of period (000s) | | $ | 78,556 | | | $ | 73,081 | | | $ | 92,881 | | | $ | 132,524 | | | $ | 133,294 | |
| | | | | | | | | | | | | | | | | | | | | |
| Ratio of expenses to average net assets | | | 0.52 | % | | | 0.52 | % | | | 0.52 | % | | | 0.52 | % | | | 0.52 | % |
| Ratio of net investment income to average net assets | | | 2.75 | % | | | 2.84 | % | | | 3.23 | % | | | 1.47 | % | | | 1.68 | % |
| Portfolio turnover rate(c) | | | 28 | % | | | 50 | % | | | 104 | % | | | 0 | % | | | 75 | % |
| (a) | Based on average shares outstanding during the period. |
| (b) | Total return is calculated assuming an initial investment made at the net asset value at the beginning of the period and the redemption at the net asset value on the last day of the period and assuming all distributions are reinvested at the actual reinvestment prices. Total return calculated for a period of less than one year is not annualized. |
| (c) | Portfolio turnover for periods less than one year are not annualized and does not include securities received or delivered from processing creations or redemptions in-kind. |
See Notes to Financial Statements and Financial Highlights.
14 | November 30, 2024
RiverFront Strategic Income Fund
| Financial Highlights | For a Share Outstanding Throughout the Periods Presented |
| | | For the Year Ended November 30, 2024 | | | For the Year Ended November 30, 2023 | | | For the Year Ended November 30, 2022 | | | For the Year Ended November 30, 2021 | | | For the Year Ended November 30, 2020 | |
| NET ASSET VALUE, BEGINNING OF PERIOD | | $ | 22.53 | | | $ | 22.65 | | | $ | 24.53 | | | $ | 24.79 | | | $ | 24.69 | |
| | | | | | | | | | | | | | | | | | | | | |
| INCOME/(LOSS) FROM INVESTMENT OPERATIONS: | | | | | | | | | | | | | | | | | | | | |
| Net investment income(a) | | | 1.01 | | | | 0.78 | | | | 0.55 | | | | 0.55 | | | | 0.81 | |
| Net realized and unrealized gain/(loss) | | | 0.63 | | | | (0.12 | ) | | | (1.82 | ) | | | (0.18 | ) | | | 0.13 | (b) |
| Total from investment operations | | | 1.64 | | | | 0.66 | | | | (1.27 | ) | | | 0.37 | | | | 0.94 | |
| | | | | | | | | | | | | | | | | | | | | |
| DISTRIBUTIONS: | | | | | | | | | | | | | | | | | | | | |
| From net investment income | | | (1.03 | ) | | | (0.78 | ) | | | (0.61 | ) | | | (0.63 | ) | | | (0.84 | ) |
| Total distributions | | | (1.03 | ) | | | (0.78 | ) | | | (0.61 | ) | | | (0.63 | ) | | | (0.84 | ) |
| | | | | | | | | | | | | | | | | | | | | |
| NET INCREASE/(DECREASE) IN NET ASSET VALUE | | | 0.61 | | | | (0.12 | ) | | | (1.88 | ) | | | (0.26 | ) | | | 0.10 | |
| NET ASSET VALUE, END OF PERIOD | | $ | 23.14 | | | $ | 22.53 | | | $ | 22.65 | | | $ | 24.53 | | | $ | 24.79 | |
| TOTAL RETURN(c) | | | 7.42 | % | | | 2.98 | % | | | (5.20 | )% | | | 1.52 | % | | | 3.95 | % |
| | | | | | | | | | | | | | | | | | | | | |
| RATIOS/SUPPLEMENTAL DATA: | | | | | | | | | | | | | | | | | | | | |
| Net assets, end of period (000s) | | $ | 80,404 | | | $ | 111,513 | | | $ | 104,759 | | | $ | 142,893 | | | $ | 118,984 | |
| Ratio of expenses excluding waiver/reimbursement to average net assets | | | 0.46 | % | | | 0.46 | % | | | 0.46 | % | | | 0.46 | % | | | 0.46 | % |
| Ratio of expenses including waiver/reimbursement to average net assets | | | 0.46 | % | | | 0.46 | % | | | 0.46 | % | | | 0.46 | % | | | 0.46 | % |
| Ratio of net investment income including expenses waiver/reimbursement to average net assets | | | 4.41 | % | | | 3.47 | % | | | 2.35 | % | | | 2.23 | % | | | 3.32 | % |
| Portfolio turnover rate(d) | | | 42 | % | | | 52 | % | | | 24 | % | | | 50 | % | | | 54 | % |
| (a) | Based on average shares outstanding during the period. |
| (b) | Net realized and unrealized gain on investments per share does not correlate to the aggregate of the net realized and unrealized gain/(loss) in the Statements of Operations for the period(s) presented, primarily due to the timing of the sales and repurchases of the Fund's shares in relation to the fluctuating market values for the Fund's portfolio. |
| (c) | Total return is calculated assuming an initial investment made at the net asset value at the beginning of the period and the redemption at the net asset value on the last day of the period and assuming all distributions are reinvested at the actual reinvestment prices. Total return calculated for a period of less than one year is not annualized. |
| (d) | Portfolio turnover for periods less than one year are not annualized and does not include securities received or delivered from processing creations or redemptions in-kind. |
See Notes to Financial Statements and Financial Highlights.
15 | November 30, 2024
RiverFront ETFs
| Notes to Financial Statements and Financial Highlights | November 30, 2024 |
1. ORGANIZATION
ALPS ETF Trust (the “Trust”), a Delaware statutory trust, is an open-end management investment company registered under the Investment Company Act of 1940, as amended (the “1940 Act”). As of November 30, 2024, the Trust consisted of twenty-three separate portfolios. Each portfolio represents a separate series of the Trust. This report pertains solely to the RiverFront Dynamic Core Income ETF, the RiverFront Dynamic US Dividend Advantage ETF, and the RiverFront Strategic Income Fund (each a “Fund” and collectively, the “Funds”).
The investment objective of the RiverFront Dynamic Core Income ETF Fund is to seek total return, with an emphasis on income as the source of that total return. The investment objective of the RiverFront Dynamic US Dividend Advantage ETF Fund is to seek to provide capital appreciation and dividend income. The investment objective of the RiverFront Strategic Income Fund is to seek total return, with an emphasis on income as the source of that total return. Each Fund has elected to qualify as a diversified series of the Trust under the 1940 Act
Each Fund’s Shares (“Shares”) are listed on the NYSE Arca, Inc. (the “NYSE Arca”). Each Fund issues and redeems Shares, at net asset value (“NAV”) in blocks of 25,000 Shares, each of which is called a “Creation Unit”. Creation Units are issued and redeemed principally in-kind for securities and/or cash. Except when aggregated in Creation Units, Shares are not redeemable securities of a Fund.
Pursuant to the Trust’s organizational documents, its Officers and Trustees are indemnified against certain liability arising out of the performance of their duties to the Trust. Additionally, in the normal course of business, the Trust enters into contracts with service providers that contain general indemnification clauses. The Trust’s maximum exposure under these arrangements is unknown, as this would involve future claims that may be made against the Trust that have not yet occurred.
2. SIGNIFICANT ACCOUNTING POLICIES
The following is a summary of significant accounting policies consistently followed by the Funds in the preparation of the financial statements. The accompanying financial statements were prepared in accordance with accounting principles generally accepted in the United States of America (“U.S. GAAP”). The preparation of financial statements in conformity with U.S. GAAP requires management to make certain estimates and assumptions that affect the reported amounts of assets and liabilities and disclosures of contingent assets and liabilities at the date of the financial statements and the reported amounts of revenue and expenses during the period. Actual results could differ from those estimates. Each Fund is considered an investment company under U.S. GAAP and follows the accounting and reporting guidance applicable to investment companies in the Financial Accounting Standards Board (“FASB”) Accounting Standards Codification Topic 946.
A. Portfolio Valuation
Each Fund’s NAV is determined daily, as of the close of regular trading on the New York Stock Exchange (the “NYSE”), normally 4:00 p.m. Eastern Time, on each day the NYSE is open for trading. The NAV is computed by dividing the value of all assets of each Fund (including accrued interest and dividends), less all liabilities (including accrued expenses and dividends declared but unpaid), by the total number of shares outstanding.
Portfolio securities listed on any exchange other than the NASDAQ Stock Market LLC (“NASDAQ”) are valued at the last sale price on the business day as of which such value is being determined. If there has been no sale on such day, the securities are valued at the mean of the most recent bid and ask prices on such day. Securities traded on the NASDAQ are valued at the NASDAQ Official Closing Price as determined by NASDAQ. Portfolio securities traded on more than one securities exchange are valued at the last sale price on the business day as of which such value is being determined at the close of the exchange representing the principal market for such securities. Portfolio securities traded in the over-the-counter market, but excluding securities traded on the NASDAQ, are valued at the last quoted sale price in such market.
Corporate bonds and United States government bonds are typically valued at the mean between the evaluated bid and ask prices formulated by an independent pricing service.
Each Fund’s investments are valued at market value or, in the absence of market value with respect to any portfolio securities, at fair value according to procedures adopted by the Trust’s Board of Trustees (the “Board”). Pursuant to Rule 2a-5 under the 1940 Act, the Board designated ALPS Advisors, Inc. (the "Adviser") as the valuation designee ("Valuation Designee") for each Fund to perform the fair value determinations relating to Fund investments. The Adviser may carry out its designated responsibilities as Valuation Designee through various teams and committees. When market quotations are not readily available or when events occur that make established valuation methods unreliable, securities of the Funds may be valued in good faith by the Valuation Designee. These securities generally include, but are not limited to, restricted securities (securities which may not be publicly sold without registration under the Securities Act of 1933) for which a pricing service is unable to provide a market price; securities whose trading has been formally suspended; a security whose market price is not available from a pre-established primary pricing source or the pricing source is not willing to provide a price; a security with respect to which an event has occurred that is most likely to materially affect the value of the security after the market has closed but before the calculation of a Fund’s NAV or make it difficult or impossible to obtain a reliable market quotation; or a security whose price, as provided by the pricing service, does not reflect the security’s “fair value” due to the security being de-listed from a national exchange or the security’s primary trading market is temporarily closed at a time when, under normal conditions, it would be open. As a general principle, the current “fair value” of a security would be the amount which the owner might reasonably expect to receive from the sale on the applicable exchange or principal market. A variety of factors may be considered in determining the fair value of such securities.
16 | November 30, 2024
RiverFront ETFs
| Notes to Financial Statements and Financial Highlights | November 30, 2024 |
B. Fair Value Measurements
Each Fund discloses the classification of its fair value measurements following a three-tier hierarchy based on the inputs used to measure fair value. Inputs refer broadly to the assumptions that market participants would use in pricing the asset or liability, including assumptions about risk. Inputs may be observable or unobservable. Observable inputs reflect the assumptions market participants would use in pricing the asset or liability that are developed based on market data obtained from sources independent of the reporting entity. Unobservable inputs reflect the reporting entity’s own assumptions about the assumptions market participants would use in pricing the asset or liability that are developed based on the best information available.
Valuation techniques used to value the Funds’ investments by major category are as follows:
Equity securities, including restricted securities, for which market quotations are readily available, are valued at the last reported sale price or official closing price as reported by a third party pricing vendor on the primary market or exchange on which they are traded and are categorized as Level 1 in the hierarchy. In the event there were no sales during the day or closing prices are not available, securities are valued at the mean of the most recent quoted bid and ask prices on such day and are generally categorized as Level 2 in the hierarchy. Investments in open-end mutual funds are valued at their closing NAV each business day and are categorized as Level 1 in the hierarchy.
Debt securities, including restricted securities, are valued based on evaluated prices received from third party pricing vendors or from brokers who make markets in such securities. For corporate bonds, pricing vendors utilize matrix pricing which considers yield or price of bonds of comparable quality, coupon, maturity and type as well as broker-supplied prices. When independent prices are unavailable or unreliable, debt securities may be valued utilizing pricing methodologies which consider similar factors that would be used by third party pricing vendors. Debt securities are generally categorized as Level 2 in the hierarchy but may be Level 3 depending on the circumstances. The RiverFront Dynamic Core Income ETF and the RiverFront Strategic Income Fund may invest a significant portion of their assets in below investment grade securities. The value of these securities can be more volatile due to changes in the credit quality of the issuer and is sensitive to changes in economic, market and regulatory conditions.
Changes in valuation techniques may result in transfers in or out of an assigned level within the disclosure hierarchy.
Various inputs are used in determining the value of each Fund’s investments as of the end of the reporting period. When inputs used fall into different levels of the fair value hierarchy, the level in the hierarchy within which the fair value measurement falls is determined based on the lowest level input that is significant to the fair value measurement in its entirety. The designated input levels are not necessarily an indication of the risk or liquidity associated with these investments.
These inputs are categorized in the following hierarchy under applicable financial accounting standards:
| Level 1 – | Unadjusted quoted prices in active markets for identical investments, unrestricted assets or liabilities that a Fund has the ability to access at the measurement date; |
| | |
| Level 2 – | Quoted prices which are not active, quoted prices for similar assets or liabilities in active markets or inputs other than quoted prices that are observable (either directly or indirectly) for substantially the full term of the asset or liability; and |
| | |
| Level 3 – | Significant unobservable prices or inputs (including the Fund’s own assumptions in determining the fair value of investments) where there is little or no market activity for the asset or liability at the measurement date. |
17 | November 30, 2024
RiverFront ETFs
| Notes to Financial Statements and Financial Highlights | November 30, 2024 |
The following is a summary of the inputs used to value the Funds’ investments as of November 30, 2024:
| RiverFront Dynamic Core Income ETF | | | | | | | |
| Investments in Securities at Value | | Level 1 - Quoted and Unadjusted Prices | | | Level 2 - Other Significant Observable Inputs | | | Level 3 - Significant Unobservable Inputs | | | Total | |
| Corporate Bonds* | | $ | – | | | $ | 16,532,317 | | | $ | – | | | $ | 16,532,317 | |
| Government Bonds* | | | – | | | | 4,885,380 | | | | – | | | | 4,885,380 | |
| Short Term Investments | | | 969,566 | | | | – | | | | – | | | | 969,566 | |
| Total | | $ | 969,566 | | | $ | 21,417,697 | | | $ | – | | | $ | 22,387,263 | |
| RiverFront Dynamic US Dividend Advantage ETF | | | | | | | |
| Investments in Securities at Value | | Level 1 - Quoted and Unadjusted Prices | | | Level 2 - Other Significant Observable Inputs | | | Level 3 - Significant Unobservable Inputs | | | Total | |
| Common Stocks* | | $ | 77,145,086 | | | $ | – | | | $ | – | | | $ | 77,145,086 | |
| Short Term Investments | | | 1,840,106 | | | | – | | | | – | | | | 1,840,106 | |
| Total | | $ | 78,985,192 | | | $ | – | | | $ | – | | | $ | 78,985,192 | |
| RiverFront Strategic Income Fund | | | | | | | |
| Investments in Securities at Value | | Level 1 - Quoted and Unadjusted Prices | | | Level 2 - Other Significant Observable Inputs | | | Level 3 - Significant Unobservable Inputs | | | Total | |
| Corporate Bonds* | | $ | – | | | $ | 62,072,574 | | | $ | – | | | $ | 62,072,574 | |
| Government Bonds* | | | – | | | | 15,950,546 | | | | – | | | | 15,950,546 | |
| Short Term Investments | | | 1,446,701 | | | | – | | | | – | | | | 1,446,701 | |
| Total | | $ | 1,446,701 | | | $ | 78,023,120 | | | $ | – | | | $ | 79,469,821 | |
| * | For a detailed sector breakdown, see the accompanying Schedule of Investments. |
The Funds did not have any securities that used significant unobservable inputs (Level 3) in determining fair value and there were no transfers into or out of Level 3 during the year ended November 30, 2024.
C. Securities Transactions and Investment Income
Securities transactions are recorded as of the trade date. Realized gains and losses from securities transactions are recorded on the specific identification in accordance with GAAP. Dividend income and capital gains distributions, if any, are recorded on the ex-dividend date. Interest income, if any, is recorded on the accrual basis, including amortization of premiums and accretion of discounts.
D. Dividends and Distributions to Shareholders
Dividends from net investment income for each Fund, if any, are declared and paid monthly or as the Board may determine from time to time. Distributions of net realized capital gains earned by the Funds, if any, are distributed at least annually.
E. Federal Tax and Tax Basis Information
The timing and character of income and capital gain distributions are determined in accordance with income tax regulations, which may differ from U.S. GAAP. Reclassifications are made to the Funds’ capital accounts for permanent tax differences to reflect income and gains available for distribution (or available capital loss carryforwards) under income tax regulations.
For the year ended November 30, 2024, the following reclassifications, which had no impact on results of operations or net assets, were recorded to reflect permanent tax differences resulting primarily from in-kind transactions.
| | | Paid-in Capital | | | Total Distributable Earnings/(Accumulated Losses) | |
| RiverFront Dynamic Core Income ETF | | $ | (22,992 | ) | | $ | 22,992 | |
| RiverFront Dynamic US Dividend Advantage ETF | | | 2,686,265 | | | | (2,686,265 | ) |
| RiverFront Strategic Income Fund | | | 35,869 | | | | (35,869 | ) |
18 | November 30, 2024
RiverFront ETFs
| Notes to Financial Statements and Financial Highlights | November 30, 2024 |
The tax character of the distributions paid during the fiscal years ended November 30, 2024 and November 30, 2023 was as follows:
| Fund | | Ordinary Income | | | Long-Term Capital Gain | | | Return of Capital | |
| November 30, 2024 | | | | | | | | | |
| RiverFront Dynamic Core Income ETF | | $ | 1,052,360 | | | $ | – | | | $ | – | |
| RiverFront Dynamic US Dividend Advantage ETF | | | 2,072,969 | | | | – | | | | – | |
| RiverFront Strategic Income Fund | | | 4,267,963 | | | | – | | | | – | |
| Fund | | Ordinary Income | | | Long-Term Capital Gain | | | Return of Capital | |
| November 30, 2023 | | | | | | | | | |
| RiverFront Dynamic Core Income ETF | | $ | 1,130,961 | | | $ | – | | | $ | – | |
| RiverFront Dynamic US Dividend Advantage ETF | | | 2,143,621 | | | | – | | | | – | |
| RiverFront Strategic Income Fund | | | 3,786,149 | | | | – | | | | – | |
The character of distributions made during the year may differ from its ultimate characterization for federal income tax purposes.
Under current law, capital losses maintain their character as short-term or long-term and are carried forward to the next tax year without expiration.
As of November 30, 2024, the following amounts are available as carry forwards to the next tax year:
| Fund | | Short-Term | | | Long-Term | |
| RiverFront Dynamic Core Income ETF | | $ | 2,105,228 | | | $ | 1,435,351 | |
| RiverFront Dynamic US Dividend Advantage ETF | | | 4,335,814 | | | | – | |
| RiverFront Strategic Income Fund | | | 8,098,631 | | | | 7,258,685 | |
The RiverFront Dynamic US Dividend Advantage ETF used capital loss carryovers during the year ended November 30, 2024, in the amount of $2,213,951.
As of November 30, 2024, the components of distributable earnings/(accumulated losses) on a tax basis for each Fund were as follows:
| Fund | | RiverFront Dynamic Core
Income ETF | | | RiverFront Dynamic US
Dividend Advantage ETF | | | RiverFront Strategic
Income Fund | |
| Accumulated net investment income | | $ | 1,937 | | | $ | 290,287 | | | $ | 1,196 | |
| Accumulated net realized loss on investments | | | (3,540,579 | ) | | | (4,335,814 | ) | | | (15,357,316 | ) |
| Net unrealized appreciation/(depreciation) on Investments | | | (65,709 | ) | | | 15,697,718 | | | | (710,399 | ) |
| Other cumulative effect of timing differences | | | – | | | | – | | | | – | |
| Total | | $ | (3,604,351 | ) | | $ | 11,652,191 | | | $ | (16,066,519 | ) |
As of November 30, 2024, the cost of investments for federal income tax purposes and accumulated net unrealized appreciation/(depreciation) on investments were as follows:
| Fund | | RiverFront Dynamic Core
Income ETF | | | RiverFront Dynamic US
Dividend Advantage ETF | | | RiverFront Strategic
Income Fund | |
| Gross appreciation (excess of value over tax cost) | | $ | 364,897 | | | $ | 19,749,952 | | | $ | 842,196 | |
| Gross depreciation (excess of tax cost over value) | | | (430,606 | ) | | | (4,052,234 | ) | | | (1,552,595 | ) |
| Net unrealized appreciation/(depreciation) | | | (65,709 | ) | | | 15,697,718 | | | | (710,399 | ) |
| Cost of investments for income tax purposes | | $ | 22,452,971 | | | $ | 63,287,474 | | | $ | 80,180,218 | |
The difference between book-basis and tax-basis is primarily due to the difference between premium amortization due to Accounting Standards Update 2017-08.
19 | November 30, 2024
RiverFront ETFs
| Notes to Financial Statements and Financial Highlights | November 30, 2024 |
F. Income Taxes
No provision for income taxes is included in the accompanying financial statements, as each Fund intends to distribute to shareholders all taxable investment income and realized gains and otherwise comply with Subchapter M of the Internal Revenue Code of 1986, as amended, applicable to regulated investment companies. Each Fund evaluates tax positions taken (or expected to be taken) in the course of preparing the Funds’ tax returns to determine whether these positions meet a “more-likely-than-not” standard that, based on the technical merits, have a more than fifty percent likelihood of being sustained by a taxing authority upon examination. A tax position that meets the “more-likely-than-not” recognition threshold is measured to determine the amount of benefit to recognize in the financial statements.
As of and during the year ended November 30, 2024, each Fund did not have a liability for any unrecognized tax benefits. Each Fund files U.S. federal, state, and local tax returns as required. Each Fund’s tax returns are subject to examination by the relevant tax authorities until expiration of the applicable statute of limitations, which is generally three years after the filing of the tax return, but may extend to four years in certain jurisdictions. Each Fund’s tax returns for open years have incorporated no uncertain tax positions that require a provision for income taxes.
G. Lending of Portfolio Securities
The RiverFront Dynamic US Dividend Advantage ETF has entered into a securities lending agreement with State Street Bank & Trust Co. (“SSB”), the Fund's lending agent. The Fund may lend its portfolio securities only to borrowers that are approved by SSB. The Fund will limit such lending to not more than 33 1/3% of the value of its total assets. The Fund’s securities held at SSB as custodian shall be available to be lent except those securities the Fund or ALPS Advisors, Inc. specifically identifies in writing as not being available for lending. The borrower pledges and maintains with the Fund collateral consisting of cash (U.S. Dollars only), securities issued or guaranteed by the U.S. government or its agencies or instrumentalities, and cash equivalents (including irrevocable bank letters of credit) issued by a person other than the borrower or an affiliate of the borrower. The initial collateral received by the Fund is required to have a value of no less than 102% of the market value of the loaned securities for U.S equity securities and a value of no less than 105% of the market value for non-U.S. equity securities. The collateral is maintained thereafter, at a market value equal to not less than 102% of the current value of the U.S. equity securities on loan and not less than 105% of the current value of the non-U.S. equity securities on loan. The market value of the loaned securities is determined at the close of each business day and any additional required collateral is delivered to the Fund on the next business day. During the term of the loan, the Fund is entitled to all distributions made on or in respect of the loaned securities. Loans of securities are terminable at any time and the borrower, after notice, is required to return borrowed securities within the customary time period for settlement of securities transactions.
Any cash collateral received is reinvested in a money market fund managed by SSB as disclosed in the Fund’s Schedule of Investments and is reflected in the Statements of Assets and Liabilities as a payable for collateral upon return of securities loaned. Non-cash collateral, in the form of securities issued or guaranteed by the U.S. government or its agencies or instrumentalities, is not disclosed in the Fund’s Statements of Assets and Liabilities or the contractual maturity table below as it is held by the lending agent on behalf of the Fund, and the Fund does not have the ability to re-hypothecate these securities. Income earned by the Fund from securities lending activity is disclosed in the Statement of Operations.
The following is a summary of the Fund's securities lending agreement and related cash and non-cash collateral received as of November 30, 2024:
| Fund | | Market Value of
Securities on Loan | | | Cash Collateral
Received | | | Non-Cash Collateral
Received | | | Total Collateral
Received | |
| RiverFront Dynamic US Dividend Advantage ETF | | $ | 1,227,393 | | | $ | 488,375 | | | $ | 777,618 | | | $ | 1,265,993 | |
The risks of securities lending include the risk that the borrower may not provide additional collateral when required or may not return the securities when due. To mitigate these risks, the Funds benefit from a borrower default indemnity provided by SSB. SSB’s indemnity allows for full replacement of securities lent wherein SSB will purchase the unreturned loaned securities on the open market by applying the proceeds of the collateral, or to the extent such proceeds are insufficient or the collateral is unavailable, SSB will purchase the unreturned loan securities at SSB’s expense. However, the Funds could suffer a loss if the value of the investments purchased with cash collateral falls below the value of the cash collateral received. As of November 30, 2024, Riverfront Dynamic Core Income ETF and Riverfront Strategic Income ETF did not have any securities on loan.
The following table reflects a breakdown of transactions accounted for as secured borrowings, the gross obligation by the type of collateral pledged or securities loaned, and the remaining contractual maturity of those transactions as of November 30, 2024:
| RiverFront Dynamic US Dividend Advantage ETF | | Remaining Contractual Maturity of the Agreements | |
| Securities Lending Transactions | | Overnight &
Continuous | | | Up to 30 Days | | | 30-90 Days | | | Greater than
90 Days | | | Total | |
| Common Stocks | | $ | 488,375 | | | $ | – | | | $ | – | | | $ | – | | | $ | 488,375 | |
| Total Borrowings | | | | | | | | | | | | | | | | | | | 488,375 | |
| Gross amount of recognized liabilities for securities lending (collateral received) | | | | $ | 488,375 | |
20 | November 30, 2024
RiverFront ETFs
| Notes to Financial Statements and Financial Highlights | November 30, 2024 |
3. INVESTMENT ADVISORY FEE AND OTHER AFFILIATED TRANSACTIONS
ALPS Advisors, Inc. serves as the Funds’ investment adviser pursuant to an Investment Advisory Agreement with the Trust on behalf of each Fund (the “Advisory Agreement”). Pursuant to the Advisory Agreement, each Fund pays the Adviser an annual management fee for the services and facilities it provides, payable on a monthly basis as a percentage of the relevant Fund’s average daily net assets as set out below:
| Fund | Advisory Fee |
| RiverFront Dynamic Core Income ETF | 0.51%(a) |
| RiverFront Dynamic US Dividend Advantage ETF | 0.52%(b) |
| RiverFront Strategic Income Fund | 0.11% |
| (a) | The unitary advisory fee as a percentage of net assets is subject to the following breakpoints: (i) 0.51% for average net assets up to $600 million, (ii) 0.48% for average net assets equal to or greater than $600 million. |
| (b) | The unitary advisory fee as a percentage of net assets is subject to the following breakpoints: (i) 0.52% for average net assets up to $600 million, (ii) 0.49% for average net assets equal to or greater than $600 million. |
Out of the unitary management fee, the Adviser pays substantially all expenses of each Fund, including the cost of transfer agency, custody, fund administration, legal, audit, trustees and other services, except for interest expenses, distribution fees or expenses, brokerage expenses, taxes and extraordinary expenses not incurred in the ordinary course of each Fund's business. The Adviser’s unitary management fee is designed to pay substantially all of each Fund's expenses and to compensate the Adviser for providing services for each Fund.
RiverFront Investment Group, LLC (the “Sub-Adviser”) serves as each Fund’s sub-adviser pursuant to a sub-advisory agreement with the Trust (the ‘‘Sub-Advisory Agreement’’). Pursuant to the Sub-Advisory Agreement, the Adviser pays the Sub-Adviser a sub-advisory fee out of the Adviser’s advisory fee for the services it provides besides RiverFront Strategic Income Fund, in which the Fund directly pays the Sub-Adviser. The fee is payable on a monthly basis at the annual rate of the relevant Fund’s average daily net assets as set out below:
| Fund | Sub-Advisory Fee |
| RiverFront Dynamic Core Income ETF | 0.35% |
| RiverFront Dynamic US Dividend Advantage ETF | 0.35% |
| RiverFront Strategic Income Fund | 0.35% |
ALPS Fund Services, Inc., an affiliate of the Adviser, is the administrator for the Funds.
Each Trustee receives (1) a quarterly retainer of $25,000, (2) a per meeting fee of $15,000, (3) $2,500 for any special meeting held outside of a regularly scheduled board meeting, and (4) reimbursement for all reasonable out-of-pocket expenses relating to attendance at meetings. In addition, the Chairman of the Board receives a quarterly retainer of $5,000, the Chairman of the Audit Committee receives a quarterly retainer of $3,000, and the Chairman of the Nominating & Governance Committee receives a quarterly retainer of $2,000, each in connection with their respective roles.
21 | November 30, 2024
RiverFront ETFs
| Notes to Financial Statements and Financial Highlights | November 30, 2024 |
4. PURCHASES AND SALES OF SECURITIES
For the year ended November 30, 2024, the cost of purchases and proceeds from sales of investment securities, excluding in-kind transactions, U.S. Government securities and short-term investments, were as follows:
| Fund | | Purchases | | | Sales | |
| RiverFront Dynamic Core Income ETF | | $ | 1,819,796 | | | $ | 1,300,442 | |
| RiverFront Dynamic US Dividend Advantage ETF | | | 20,980,683 | | | | 21,949,835 | |
| RiverFront Strategic Income Fund | | | 26,880,409 | | | | 25,995,554 | |
For the year ended November 30, 2024, the cost of U.S. Government security purchases and proceeds from U.S. Government security sales were as follows:
| Fund | | Purchases | | | Sales | |
| RiverFront Dynamic Core Income ETF | | $ | 3,139,119 | | | $ | 2,785,911 | |
| RiverFront Strategic Income Fund | | | 12,027,008 | | | | 13,298,752 | |
For the year ended November 30, 2024, the cost of in-kind purchases and proceeds from in-kind sales were as follows:
| Fund | | Purchases | | | Sales | |
| RiverFront Dynamic Core Income ETF | | $ | 544,345 | | | $ | 4,425,833 | |
| RiverFront Dynamic US Dividend Advantage ETF | | | 4,258,217 | | | | 16,983,045 | |
| RiverFront Strategic Income Fund | | | 4,509,432 | | | | 36,302,909 | |
For the year ended November 30, 2024, the in-kind net realized gains/(losses) were as follows:
| Fund | | Net Realized Gain/(Loss) | |
| RiverFront Dynamic Core Income ETF | | $ | (20,674 | ) |
| RiverFront Dynamic US Dividend Advantage ETF | | | 3,102,496 | |
| RiverFront Strategic Income Fund | | | 57,780 | |
Gains on in-kind transactions are not considered taxable for federal income tax purposes and losses on in-kind transactions are also not deductible for tax purposes.
5. CAPITAL SHARE TRANSACTIONS
Shares are created and redeemed by each Fund only in Creation Unit size aggregations of 25,000 Shares. Only broker-dealers or large institutional investors with creation and redemption agreements called Authorized Participants (“AP”) are permitted to purchase or redeem Creation Units from each Fund. Such transactions are generally permitted on an in-kind basis, with a balancing cash component to equate the transaction to the NAV per unit of each Fund on the transaction date. Cash may be substituted equivalent to the value of certain securities generally when they are not available in sufficient quantity for delivery, not eligible for trading by the AP or as a result of other market circumstances.
6. MARKET RISK
The Funds are subject to investment and operational risks associated with financial, economic and other global market developments and disruptions, including those arising from war, terrorism, market manipulation, government interventions, defaults and shutdowns, political changes or diplomatic developments, public health emergencies (such as the spread of infectious diseases, pandemics and epidemics) and natural/environmental disasters, which can negatively impact the securities markets and cause each Fund to lose value. Securities in each Fund’s portfolio may underperform in comparison to securities in general financial markets, a particular financial market or other asset classes due to a number of factors, including inflation (or expectations for inflation), deflation (or expectations for deflation), interest rates, global demand for particular products or resources, market instability, debt crises and downgrades, embargoes, tariffs, sanctions and other trade barriers, regulatory events, other governmental trade or market control programs and related geopolitical events. In addition, the value of each Fund’s investments may be negatively affected by the occurrence of global events such as war, terrorism, environmental disasters, natural disasters or events, country instability, and infectious disease epidemics or pandemics.
22 | November 30, 2024
RiverFront ETFs
| Notes to Financial Statements and Financial Highlights | November 30, 2024 |
7. SUBSEQUENT EVENTS
Subsequent events, if any, after the date of the Statements of Assets and Liabilities have been evaluated through the date the financial statements were issued. Management has determined that there were no subsequent events to report through the issuance of these financial statements.
23 | November 30, 2024
RiverFront ETFs
| Report of Independent Registered Public Accounting Firm | |
To the Shareholders of RiverFront Dynamic Core Income ETF,
RiverFront Dynamic US Dividend Advantage ETF and RiverFront Strategic Income Fund
and Board of Trustees of ALPS ETF Trust
Opinion on the Financial Statements
We have audited the accompanying statements of assets and liabilities, including the schedules of investments, of RiverFront Dynamic Core Income ETF, RiverFront Dynamic US Dividend Advantage ETF and RiverFront Strategic Income Fund (the “Funds”), each a series of ALPS ETF Trust, as of November 30, 2024, the related statements of operations for the year then ended, the statements of changes in net assets and financial highlights for each of the two years in the period then ended, and the related notes (collectively referred to as the “financial statements”). In our opinion, the financial statements present fairly, in all material respects, the financial position of each of the Funds as of November 30, 2024, the results of their operations for the year then ended, and the changes in net assets and financial highlights for each of the two years in the period then ended, in conformity with accounting principles generally accepted in the United States of America.
The Funds’ financial highlights for the years ended November 30, 2022, and prior, were audited by other auditors whose report dated January 27, 2023, expressed an unqualified opinion on those financial highlights.
Basis for Opinion
These financial statements are the responsibility of the Funds’ management. Our responsibility is to express an opinion on the Funds’ financial statements based on our audits. We are a public accounting firm registered with the Public Company Accounting Oversight Board (United States) (“PCAOB”) and are required to be independent with respect to the Funds in accordance with the U.S. federal securities laws and the applicable rules and regulations of the Securities and Exchange Commission and the PCAOB.
We conducted our audits in accordance with the standards of the PCAOB. Those standards require that we plan and perform the audit to obtain reasonable assurance about whether the financial statements are free of material misstatement whether due to error or fraud.
Our audits included performing procedures to assess the risks of material misstatement of the financial statements, whether due to error or fraud, and performing procedures that respond to those risks. Such procedures included examining, on a test basis, evidence regarding the amounts and disclosures in the financial statements. Our procedures included confirmation of securities owned as of November 30, 2024, by correspondence with the custodian. Our audits also included evaluating the accounting principles used and significant estimates made by management, as well as evaluating the overall presentation of the financial statements. We believe that our audits provide a reasonable basis for our opinion.
We have served as the auditor of one or more investment companies advised by ALPS Advisors, Inc. since 2013.

COHEN & COMPANY, LTD.
Philadelphia, Pennsylvania
January 29, 2025
24 | November 30, 2024
RiverFront ETFs
| Additional Information | November 30, 2024 (Unaudited) |
TAX INFORMATION
The Funds designate the following as a percentage of taxable ordinary income distributions, or up to the maximum amount allowable, for the calendar year ended December 31, 2023:
| | Qualified Dividend Income | Dividend Received Deduction | 199A Dividends |
| RiverFront Dynamic Core Income ETF | 0.00% | 0.00% | 0.00% |
| RiverFront Dynamic US Dividend Advantage ETF | 90.82% | 83.38% | 9.37% |
| RiverFront Strategic Income Fund | 0.00% | 0.00% | 0.00% |
In early 2024, if applicable, shareholders of record received this information for the distributions paid to them by the Funds during the calendar year 2023 via Form 1099. The Funds will notify shareholders in early 2025 of amounts paid to them by the Funds, if any, during the calendar year 2024.
25 | November 30, 2024
RiverFront ETFs
Changes in and Disagreements with Accountants
for Open-End Management Investment Companies | November 30, 2024 (Unaudited) |
On March 14, 2023, BBD LLP (“BBD”) ceased to serve as the independent registered public accounting firm of the Funds. The Board approved the replacement of BBD as a result of Cohen & Company, Ltd.’s (“Cohen”) acquisition of BBD’s investment management group.
The report of BBD on the financial statements of the Funds as of and for the fiscal year or period ended November 30, 2022 did not contain an adverse opinion or a disclaimer of opinion, and was not qualified or modified as to uncertainties, audit scope or accounting principles. During the fiscal year or period ended November 30, 2022, and during the subsequent interim period through March 14, 2023: (i) there were no disagreements between the registrant and BBD on any matter of accounting principles or practices, financial statement disclosure, or auditing scope or procedure, which disagreements, if not resolved to the satisfaction of BBD, would have caused it to make reference to the subject matter of the disagreements in its report on the financial statements of the Funds for such years or interim period; and (ii) there were no “reportable events,” as defined in Item 304(a)(1)(v) of Regulation S-K under the Securities Exchange Act of 1934, as amended.
On March 7, 2023, upon the recommendation of the Funds’ Audit Committee, the Board approved the appointment of Cohen, effective upon the resignation of BBD, as the Funds’ independent registered public accounting firm for the fiscal year ending November 30, 2023.
During the fiscal year or period ended November 30, 2022, and during the subsequent interim period through March 14, 2023, neither the registrant, nor anyone acting on its behalf, consulted with Cohen on behalf of the Funds regarding the application of accounting principles to a specified transaction (either completed or proposed), the type of audit opinion that might be rendered on the Funds’ financial statements, or any matter that was either: (i) the subject of a "disagreement," as defined in Item 304(a)(1)(iv) of Regulation S-K and the instructions thereto; or (ii) "reportable events," as defined in Item 304(a)(1)(v) of Regulation S-K.
26 | November 30, 2024
RiverFront ETFs
Proxy Disclosures for Open-End
Management Investment Companies | November 30, 2024 (Unaudited) |
A Special Meeting of Shareholders of the Funds, each a series of the Trust, was held on July 19, 2024. At the meeting, the following matters were voted on by the Shareholders. The results of the Special Meeting of Shareholders are noted below:
Proposal 1: To elect seven Trustees.
| | Shares Voted in Favor | Shares Voted
Against/Withheld or Abstentions | Proposal Approved |
| Mary K. Anstine | 223,143,090 | 2,894,793 | Yes |
| Edmund J. Burke | 223,362,578 | 2,672,643 | Yes |
| Jeremy W. Deems | 221,670,341 | 4,361,535 | Yes |
| Rick A. Pederson | 213,137,140 | 12,259,226 | Yes |
| Joseph F. Keenan | 223,547,500 | 2,483,867 | Yes |
| Susan K. Wold | 223,460,006 | 2,571,857 | Yes |
| Laton Spahr | 223,439,610 | 2,593,995 | Yes |
27 | November 30, 2024
RiverFront ETFs
Remuneration Paid to Directors, Officers, and Others
of Open-End Management Investment Companies | November 30, 2024 (Unaudited) |
The following chart provides certain information about the Trustee fees paid by the Trust for the year ended November 30, 2024:
| | | Aggregate Regular
Compensation From the Trust | | | Aggregate Special
Compensation From the Trust | | | Total Compensation
From the Trust | |
| Mary K. Anstine, Trustee | | $ | 162,500 | | | $ | – | | | $ | 162,500 | |
| Edmund J. Burke, Trustee | | | 166,500 | | | | – | | | | 166,500 | |
| Jeremy W. Deems, Trustee | | | 174,500 | | | | – | | | | 174,500 | |
| Rick A. Pederson, Trustee | | | 186,500 | | | | – | | | | 186,500 | |
| Joseph F. Keenan, Trustee | | | 40,000 | | | | – | | | | 40,000 | |
| Susan K. Wold, Trustee | | | 40,000 | | | | – | | | | 40,000 | |
| Laton Spahr, President and Trustee* | | | – | | | | – | | | | – | |
| Total | | $ | 770,000 | | | $ | – | | | $ | 770,000 | |
| * | Mr. Spahr, the President of the Trust, is deemed an “interested person” by virtue of his position as an officer of the Trust and of ALPS Advisors, Inc. |
Officers who are employed by the Adviser receive no compensation or expense reimbursement from the Trust.
28 | November 30, 2024
RiverFront ETFs
Statement Regarding Basis for
Approval of Investment Advisory Contract | November 30, 2024 (Unaudited) |
At its meetings held on June 3, 2024 and June 18, 2024, the Board of Trustees of the Trust (the “Board” or the “Trustees”), where each Trustee was not an "interested person" of the Trust within the meaning of the Investment Company Act of 1940, as amended (the “Independent Trustees”), evaluated a proposal to approve the continuance of (i) the Investment Advisory Agreement between the Trust and ALPS Advisors, Inc. (the “Adviser” or “AAI”) with respect to the RiverFront Strategic Income Fund (“RIGS”), RiverFront Dynamic Core Income ETF (“RFCI”), and RiverFront Dynamic US Dividend Advantage ETF (“RFDA”) (each a “Fund” and collectively “the Funds” or the "RiverFront ETFs") and (ii) the Investment Sub-Advisory Agreements between the Trust or AAI and RiverFront Investment Group, LLC (the “Sub-Adviser” or “RiverFront”) with respect to the Funds (the “RiverFront Sub-Advisory Agreements”). In evaluating the renewal of the Investment Advisory Agreement with respect to each of the Funds, the Board, including the Independent Trustees considered various factors, including (i) the nature, extent and quality of the services provided by AAI with respect to the applicable Fund under the Investment Advisory Agreement; (ii) the advisory fees and other expenses paid by the Fund compared to those of similar funds managed by other investment advisers; (iii) the costs of the services provided to the Fund by AAI and the profits realized by AAI and its affiliates from its relationship to the Fund; (iv) the extent to which economies of scale have been or would be realized if and as the assets of the Fund grow and whether fees reflect the economies of scale for the benefit of shareholders; and (v) any additional benefits and other considerations.
With respect to the nature, extent and quality of the services provided by AAI under the Investment Advisory Agreement, the Board considered and reviewed information concerning the services provided under the Investment Advisory Agreement, financial information regarding AAI and its parent company, information describing AAI’s current organization and the background and experience of the persons responsible for the day-to-day management of the Funds.
The Board reviewed information on the performance of each Fund and its applicable benchmark for the 1-, 3-, and 5-year periods, as applicable, and against the appropriate FUSE performance universe. Based on this review, the Board, including the Independent Trustees found that the nature and extent of services provided to each Fund under the Investment Advisory Agreement was appropriate and that the quality of such services was satisfactory.
The Board noted that the advisory fees for each Fund were unitary fees pursuant to which AAI assumes all expenses of the Funds (including the cost of transfer agency, custody, fund administration, legal, audit and other services) other than the payments under the Advisory Agreement, brokerage expenses, taxes, interest, litigation expenses and other extraordinary expenses.
Based on the information available to them, including the Fund-specific summaries set forth below, the Board, including the Independent Trustees concluded that the advisory fee rate for each of the Funds was reasonable under the circumstances and in light of the quality of the services provided.
The Board, including the Independent Trustees considered other benefits available to AAI because of its relationship with the Funds and concluded that the advisory fees were reasonable taking into account any such benefits.
The Board, including the Independent Trustees, also considered with respect to each Fund the information provided by AAI about the costs and profitability of AAI with respect to each of the Funds, including the asset levels and other factors that influence the profitability and financial viability of the Funds. The Board, including the Independent Trustees reviewed and noted the relatively small sizes of the Funds and the analysis AAI had conducted to support AAI’s assertion that it was not realizing any economies of scale with respect to such Funds. The Independent Trustees determined that AAI should continue to keep the Board informed on an ongoing basis of any significant developments (e.g., material increases in asset levels) so as to facilitate the Independent Trustees’ evaluation of whether further economies of scale have been achieved.
The Board, including the Independent Trustees, also considered other potential benefits available to AAI because of its relationship with the Funds, known as fall-out benefits.
With respect to each Fund, the Board, including the Independent Trustees, noted the following:
The gross management fee rate for RIGS is lower than the median of its FUSE expense group. RIGS’s net expense ratio is lower than the median of its FUSE expense group.
The Board, including the Independent Trustees, reviewed and noted the relatively small size of RIGS and the analysis AAI had conducted to support AAI’s assertion that it was not realizing any economies of scale with respect to RIGS.
29 | November 30, 2024
RiverFront ETFs
Statement Regarding Basis for
Approval of Investment Advisory Contract | November 30, 2024 (Unaudited) |
The gross management fee rate for RFCI is higher than the median of its FUSE expense group. RFCI’s net expense ratio is higher than the median of its FUSE expense group.
The Board, including the Independent Trustees, reviewed and noted the relatively small size of RFCI and the analysis AAI had conducted to support AAI’s assertion that it was not realizing any economies of scale with respect to RFCI.
The gross management fee rate for RFDA is lower than the median of its FUSE expense group. RFDA’s net expense ratio is lower than the median of its FUSE expense group.
The Board, including the Independent Trustees, reviewed and noted the relatively small size of RFDA and the analysis AAI had conducted to support AAI’s assertion that it was not realizing any economies of scale with respect to RFDA.
In voting to renew the Investment Advisory Agreement with AAI, the Board, including the Independent Trustees, concluded that the terms of the Investment Advisory Agreement are reasonable and fair in light of the services to be performed, the fees paid by certain other funds, expenses to be incurred and such other matters as the members of the Board, including the Independent Trustees, considered relevant in the exercise of their reasonable business judgment. The Independent Trustees did not identify any single factor or group of factors as all important or controlling and considered all factors together.
The Board, including the Independent Trustees, discussed the RiverFront Sub-Advisory Agreements.
In evaluating the RiverFront Sub-Advisory Agreements, the Board, including the Independent Trustees considered various factors, including (i) the nature, extent and quality of the services provided by RiverFront with respect to the RiverFront ETFs under the RiverFront Sub-Advisory Agreements; (ii) the advisory fees and other expenses paid by the RiverFront ETFs compared to those of similar funds managed by other investment advisers; (iii) the profitability to RiverFront of its sub-advisory relationship with the RiverFront ETFs and the reasonableness of compensation to RiverFront; (iv) the extent to which economies of scale would be realized if, and as, the RiverFront ETFs’ assets increase, and whether the fee level in the RiverFront Sub-Advisory Agreements reflects these economies of scale; and (v) any additional benefits and other considerations.
With respect to the nature, extent and quality of the services provided by RiverFront under the RiverFront Sub-Advisory Agreements, the Board, including the Independent Trustees considered and reviewed information concerning the services provided under the RiverFront Sub-Advisory Agreements, the RiverFront ETFs’ respective performance, financial information regarding RiverFront, information describing RiverFront’s current organization and the background and experience of the persons responsible for the day-to-day management of the RiverFront ETFs. Based upon their review, the Board, including the Independent Trustees concluded that RiverFront was qualified to oversee the portfolio management of the RiverFront ETFs and that the services provided by RiverFront to the RiverFront ETFs are satisfactory. The Board, including the Independent Trustees considered that the contractual sub-advisory fee to be paid to RiverFront from RIGS was 0.35% of RIGS’ average daily net assets out of a total management fee of 0.46% of RIGS’ average daily net assets. The Board, including the Independent Trustees considered that the contractual sub- advisory fee to be paid to RiverFront with respect to each of RFCI and RFDA was 0.35% of each Fund’s average daily net assets out of a total management fee of 0.51% with respect to RFCI’s average daily net assets, and 0.52% with respect to RFDA’s average daily net assets, respectively.
In reviewing the Riverfront ETFs’ profitability with respect to RiverFront, the Board, including the Independent Trustees, considered the costs and resources required to manage the RiverFront ETFs.
The Board, including the Independent Trustees also considered other benefits that have been and may be realized by RiverFront from its relationships with each RiverFront ETF, known as fall-out benefits.
The Board, including the Independent Trustees considered the extent to which economies of scale may be realized if the RiverFront ETFs’ assets continue to grow in size and whether fee levels reflect a reasonable sharing of such economies of scale for the benefit of the Funds’ investors. They also noted that the RiverFront ETFs have experienced fluctuations in assets, which makes it difficult to quantify the potential variability in net assets and thus determine the sustainability of any potential economies of scale which may exist. The Independent Trustees determined that AAI should continue to keep the Board informed on an ongoing basis of any significant developments (e.g., material increases in asset levels) so as to facilitate the Independent Trustees’ evaluation of whether further economies of scale have been achieved with respect to each RiverFront ETF.
30 | November 30, 2024
RiverFront ETFs
Statement Regarding Basis for
Approval of Investment Advisory Contract | November 30, 2024 (Unaudited) |
In voting to approve each of the RiverFront Sub-Advisory Agreements, the Board, including the Independent Trustees concluded that the terms of each RiverFront Sub-Advisory Agreement are reasonable and fair in light of the services performed, expenses incurred and such other matters as the Board, including the Independent Trustees considered relevant in the exercise of their reasonable business judgment. The Board, including the Independent Trustees did not identify any single factor or group of factors as all important or controlling and considered all factors together.
31 | November 30, 2024


Table of Contents
| Financial Statements and Financial Highlights for Open-End Management Investment Companies | |
| Schedule of Investments | 1 |
| Statement of Assets and Liabilities | 16 |
| Statement of Operations | 17 |
| Statements of Changes in Net Assets | 18 |
| Financial Highlights | 19 |
| Notes to Financial Statements and Financial Highlights | 20 |
| Report of Independent Registered Public Accounting Firm | 25 |
| Additional Information | 26 |
| Changes in and Disagreements with Accountants for Open-End Management Investment Companies | 27 |
| Proxy Disclosures for Open-End Management Investment Companies | 28 |
| Remuneration Paid to Directors, Officers, and Others of Open-End Management Investment Companies | 29 |
| Statement Regarding Basis for Approval of Investment Advisory and Sub-Advisory Contract | 30 |
alpsfunds.com
ALPS | Smith Core Plus Bond ETF
| Schedule of Investments | November 30, 2024 |
| Security Description | | Principal
Amount | | | Value
(Note 2) | |
| BANK LOANS (1.94%) | | | | | | | | |
| | | | | | | | | |
| Aerospace & Defense (0.45%) | | | | | | | | |
| TransDigm, Inc. | | | | | | | | |
| 1M US SOFR + 3.25%, 02/28/2031(a) | | $ | 5,855,918 | | | $ | 5,861,159 | |
| | | | | | | | | |
| Casinos & Gaming (0.20%) | | | | | | | | |
| Caesars Entertainment, Inc. | | | | | | | | |
| 1M US SOFR + 2.75%, 02/06/2031(a) | | | 2,489,994 | | | | 2,505,942 | |
| | | | | | | | | |
| Consumer Finance (0.48%) | | | | | | | | |
| Boost Newco Borrower LLC | | | | | | | | |
| 3M US SOFR + 2.50%, 01/31/2031(a) | | | 6,095,000 | | | | 6,161,375 | |
| | | | | | | | | |
| Financial Services (0.04%) | | | | | | | | |
| Jane Street Group LLC | | | | | | | | |
| 3M US SOFR + 2.00%, 01/26/2028 | | | 524,276 | | | | 527,102 | |
| | | | | | | | | |
| Industrials (0.36%) | | | | | | | | |
| Chart Industries, Inc. | | | | | | | | |
| 3M US SOFR + 2.50%, 03/18/2030(a) | | | 2,326,426 | | | | 2,340,244 | |
| GFL Environmental, Inc. | | | | | | | | |
| 3M US SOFR + 2.00%, 06/27/2031 | | | 2,299,000 | | | | 2,308,736 | |
| Total Industrials | | | | | | | 4,648,980 | |
| Pipeline (0.23%) | | | | | | | | |
| Buckeye Partners LP | | | | | | | | |
| 1M US SOFR + 2.00%, 11/22/2030(a) | | | 2,974,233 | | | | 2,984,926 | |
| | | | | | | | | |
| Travel & Lodging (0.18%) | | | | | | | | |
| Carnival Corp. | | | | | | | | |
| 1M US SOFR + 2.75%, 08/09/2027(a) | | | 2,325,274 | | | | 2,349,015 | |
| | | | | | | | | |
| TOTAL BANK LOANS | | | | | | | | |
| (Cost $24,957,998) | | | | | | | 25,038,499 | |
| | | | | | | | | |
| Security Description | | Principal
Amount | | | Value
(Note 2) | |
| COLLATERALIZED MORTGAGE OBLIGATIONS (4.25%) | |
| | | | | | | | | |
| Fannie Mae | | | | | | | | |
| Series 2000-34, Class TZ, | | | | | | | | |
| 8.500%, 10/25/2030 | | $ | 103,282 | | | $ | 108,747 | |
| Security Description | | Principal
Amount | | | Value
(Note 2) | |
| Series 2001-51, Class PZ, | | | | | | | | |
| 6.500%, 10/25/2031 | | $ | 104,378 | | | $ | 108,247 | |
| Series 2002-60, Class FV, | | | | | | | | |
| 30D US SOFR + 1.114%, 04/25/2032(a) | | | 8,042 | | | | 8,120 | |
| Series 2002-90, Class A1, | | | | | | | | |
| 6.500%, 06/25/2042 | | | 187,445 | | | | 191,962 | |
| Series 2003-119, Class ZP, | | | | | | | | |
| 4.000%, 12/25/2033 | | | 38,640 | | | | 37,162 | |
| Series 2003-18, Class A1, | | | | | | | | |
| 6.500%, 12/25/2042 | | | 38,903 | | | | 39,321 | |
| Series 2003-30, Class JQ, | | | | | | | | |
| 5.500%, 04/25/2033 | | | 2,222 | | | | 2,278 | |
| Series 2003-47, Class PE, | | | | | | | | |
| 5.750%, 06/25/2033 | | | 36,252 | | | | 37,356 | |
| Series 2004-92, Class TB, | | | | | | | | |
| 5.500%, 12/25/2034 | | | 8,165 | | | | 8,419 | |
| Series 2005-122, Class PY, | | | | | | | | |
| 6.000%, 01/25/2036 | | | 26,282 | | | | 27,174 | |
| Series 2005-27, Class GH, | | | | | | | | |
| 5.500%, 04/25/2035 | | | 115,000 | | | | 114,895 | |
| Series 2005-3, Class CH, | | | | | | | | |
| 5.250%, 02/25/2035 | | | 4,345 | | | | 4,430 | |
| Series 2005-48, Class TD, | | | | | | | | |
| 5.500%, 06/25/2035 | | | 19,164 | | | | 19,803 | |
| Series 2005-75, Class ZP, | | | | | | | | |
| 5.750%, 09/25/2035 | | | 132,762 | | | | 137,176 | |
| Series 2005-99, Class AC, | | | | | | | | |
| 5.500%, 12/25/2035 | | | 38,000 | | | | 37,976 | |
| Series 2006-125, Class KY, | | | | | | | | |
| 5.500%, 01/25/2037 | | | 201,990 | | | | 211,147 | |
| Series 2006-78, Class BZ, | | | | | | | | |
| 6.500%, 08/25/2036 | | | 329,196 | | | | 347,000 | |
| Series 2007-36, Class PH, | | | | | | | | |
| 5.500%, 04/25/2037 | | | 109,464 | | | | 113,283 | |
| Series 2008-24, Class WD, | | | | | | | | |
| 5.500%, 02/25/2038 | | | 76,750 | | | | 76,822 | |
| Series 2008-6, Class A, | | | | | | | | |
| 5.000%, 02/25/2038 | | | 190,954 | | | | 189,280 | |
| Series 2009-106, Class LK, | | | | | | | | |
| 5.500%, 08/25/2037 | | | 667,404 | | | | 670,437 | |
| Series 2009-106, Class DZ, | | | | | | | | |
| 4.500%, 01/25/2040 | | | 218,773 | | | | 212,664 | |
| Series 2009-77, Class NX, | | | | | | | | |
| 5.500%, 10/25/2039 | | | 774,624 | | | | 776,707 | |
| Series 2010-123, Class BP, | | | | | | | | |
| 4.500%, 11/25/2040 | | | 98,674 | | | | 97,925 | |
| Series 2010-141, Class AL, | | | | | | | | |
| 4.000%, 12/25/2040 | | | 16,472 | | | | 15,960 | |
| Series 2010-2, Class GZ, | | | | | | | | |
| 5.000%, 01/25/2040 | | | 119,483 | | | | 117,099 | |
| Series 2010-41, Class NB, | | | | | | | | |
| 5.000%, 05/25/2040 | | | 78,051 | | | | 79,026 | |
| Series 2010-85, Class NJ, | | | | | | | | |
| 4.500%, 08/25/2040 | | | 342,800 | | | | 333,604 | |
1 | November 30, 2024
ALPS | Smith Core Plus Bond ETF
| Schedule of Investments | November 30, 2024 |
| Security Description | | Principal
Amount | | | Value
(Note 2) | |
| Series 2010-9, Class ME, | | | | | | | | |
| 5.000%, 02/25/2040 | | $ | 27,062 | | | $ | 27,256 | |
| Series 2011-110, Class ED, | | | | | | | | |
| 2.500%, 04/25/2041 | | | 114,125 | | | | 110,527 | |
| Series 2011-121, Class JP, | | | | | | | | |
| 4.500%, 12/25/2041 | | | 14,581 | | | | 14,134 | |
| Series 2011-145, Class JA, | | | | | | | | |
| 4.500%, 12/25/2041 | | | 4,186 | | | | 4,128 | |
| Series 2011-148, Class P, | | | | | | | | |
| 4.000%, 09/25/2041 | | | 159,460 | | | | 156,337 | |
| Series 2011-29, Class JC, | | | | | | | | |
| 4.000%, 03/25/2041 | | | 220,629 | | | | 210,181 | |
| Series 2012-103, Class PY, | | | | | | | | |
| 3.000%, 09/25/2042 | | | 8,000 | | | | 6,790 | |
| Series 2012-108, Class PL, | | | | | | | | |
| 3.000%, 10/25/2042 | | | 49,601 | | | | 44,971 | |
| Series 2012-111, Class PB, | | | | | | | | |
| 1.750%, 06/25/2042 | | | 130,436 | | | | 116,919 | |
| Series 2012-111, Class B, | | | | | | | | |
| 7.000%, 10/25/2042 | | | 214,750 | | | | 230,696 | |
| Series 2012-112, Class DA, | | | | | | | | |
| 3.000%, 10/25/2042 | | | 189,323 | | | | 171,640 | |
| Series 2012-120, Class QC, | | | | | | | | |
| 2.500%, 11/25/2042 | | | 151,000 | | | | 106,950 | |
| Series 2012-128, Class NP, | | | | | | | | |
| 2.500%, 11/25/2042 | | | 78,172 | | | | 52,221 | |
| Series 2012-128, Class JE, | | | | | | | | |
| 2.000%, 09/25/2042 | | | 147,193 | | | | 130,555 | |
| Series 2012-129, Class HT, | | | | | | | | |
| 2.000%, 12/25/2032 | | | 372,368 | | | | 328,003 | |
| Series 2012-133, Class KA, | | | | | | | | |
| 2.500%, 07/25/2042 | | | 129,259 | | | | 110,110 | |
| Series 2012-136, Class PL, | | | | | | | | |
| 3.500%, 12/25/2042 | | | 418,000 | | | | 387,151 | |
| Series 2012-137, Class CZ, | | | | | | | | |
| 4.000%, 12/25/2042 | | | 161,478 | | | | 151,673 | |
| Series 2012-139, Class GB, | | | | | | | | |
| 2.500%, 12/25/2042 | | | 50,000 | | | | 36,942 | |
| Series 2012-152, Class PB, | | | | | | | | |
| 3.500%, 01/25/2043 | | | 22,000 | | | | 21,069 | |
| Series 2012-154, Class PW, | | | | | | | | |
| 3.000%, 10/25/2042 | | | 204,497 | | | | 177,625 | |
| Series 2012-16, Class K, | | | | | | | | |
| 4.000%, 10/25/2041 | | | 90,536 | | | | 88,742 | |
| Series 2012-17, Class JA, | | | | | | | | |
| 3.500%, 12/25/2041 | | | 71,183 | | | | 66,611 | |
| Series 2012-19, Class CB, | | | | | | | | |
| 3.500%, 03/25/2042 | | | 265,000 | | | | 244,084 | |
| Series 2012-26, Class MA, | | | | | | | | |
| 3.500%, 03/25/2042 | | | 44,905 | | | | 42,022 | |
| Series 2012-28, Class PT, | | | | | | | | |
| 4.000%, 03/25/2042 | | | 314,257 | | | | 299,053 | |
| Series 2012-29, Class NM, | | | | | | | | |
| 3.500%, 04/25/2042 | | | 50,000 | | | | 41,432 | |
| Series 2012-30, Class DZ, | | | | | | | | |
| 4.000%, 04/25/2042 | | | 201,174 | | | | 194,197 | |
| Security Description | | Principal
Amount | | | Value
(Note 2) | |
| Series 2012-35, Class EP, | | | | | | | | |
| 2.000%, 11/25/2040 | | $ | 112,256 | | | $ | 108,550 | |
| Series 2012-36, Class MB, | | | | | | | | |
| 2.000%, 08/25/2041 | | | 515,053 | | | | 499,919 | |
| Series 2012-37, Class CA, | | | | | | | | |
| 2.000%, 01/25/2040 | | | 192,553 | | | | 185,683 | |
| Series 2012-39, Class NB, | | | | | | | | |
| 4.000%, 04/25/2042 | | | 32,000 | | | | 28,913 | |
| Series 2012-47, Class HF, | | | | | | | | |
| 30D US SOFR + 0.514%, 05/25/2027(a) | | | 7,803 | | | | 7,804 | |
| Series 2012-51, Class HJ, | | | | | | | | |
| 3.500%, 05/25/2042 | | | 62,156 | | | | 53,667 | |
| Series 2012-56, Class WB, | | | | | | | | |
| 3.500%, 05/25/2042 | | | 9,113 | | | | 8,428 | |
| Series 2012-83, Class AC, | | | | | | | | |
| 3.000%, 08/25/2042 | | | 85,000 | | | | 73,422 | |
| Series 2012-90, Class PB, | | | | | | | | |
| 2.500%, 01/25/2042 | | | 71,505 | | | | 67,911 | |
| Series 2013-10, Class GD, | | | | | | | | |
| 2.000%, 02/25/2033 | | | 151,834 | | | | 140,709 | |
| Series 2013-123, Class AG, | | | | | | | | |
| 2.500%, 02/25/2033 | | | 1,061,783 | | | | 1,037,463 | |
| Series 2013-14, Class PC, | | | | | | | | |
| 1.250%, 03/25/2043 | | | 226,616 | | | | 187,570 | |
| Series 2013-18, Class NG, | | | | | | | | |
| 2.000%, 12/25/2042 | | | 48,760 | | | | 43,058 | |
| Series 2013-35, Class KL, | | | | | | | | |
| 2.000%, 04/25/2033 | | | 100,021 | | | | 92,631 | |
| Series 2013-37, Class PK, | | | | | | | | |
| 3.500%, 04/25/2043 | | | 300,000 | | | | 272,944 | |
| Series 2013-41, Class JL, | | | | | | | | |
| 1.500%, 04/25/2038 | | | 194,849 | | | | 176,198 | |
| Series 2013-44, Class Z, | | | | | | | | |
| 3.000%, 05/25/2043 | | | 708,107 | | | | 543,749 | |
| Series 2013-67, Class KZ, | | | | | | | | |
| 2.500%, 04/25/2043 | | | 144,374 | | | | 117,456 | |
| Series 2013-7, Class PZ, | | | | | | | | |
| 2.000%, 02/25/2043 | | | 190,015 | | | | 112,638 | |
| Series 2013-86, Class Z, | | | | | | | | |
| 3.000%, 08/25/2043 | | | 174,284 | | | | 129,071 | |
| Series 2013-86, Class LG, | | | | | | | | |
| 3.500%, 08/25/2043 | | | 178,000 | | | | 152,547 | |
| Series 2013-86, Class CY, | | | | | | | | |
| 4.500%, 08/25/2043 | | | 1,320,900 | | | | 1,237,389 | |
| Series 2013-9, Class BC, | | | | | | | | |
| 6.500%, 07/25/2042 | | | 154,475 | | | | 162,547 | |
| Series 2014-14, Class PA, | | | | | | | | |
| 3.500%, 02/25/2044 | | | 103,529 | | | | 100,595 | |
| Series 2014-6, Class Z, | | | | | | | | |
| 2.500%, 02/25/2044 | | | 262,137 | | | | 226,718 | |
| Series 2014-8, Class Z, | | | | | | | | |
| 3.000%, 03/25/2034 | | | 126,155 | | | | 119,489 | |
| Series 2015-27, Class ME, | | | | | | | | |
| 3.500%, 10/25/2044 | | | 30,000 | | | | 27,861 | |
2 | November 30, 2024
ALPS | Smith Core Plus Bond ETF
| Schedule of Investments | November 30, 2024 |
| Security Description | | Principal
Amount | | | Value
(Note 2) | |
| Series 2015-47, Class AY, | | | | | | | | |
| 3.000%, 07/25/2045 | | $ | 84,099 | | | $ | 74,127 | |
| Series 2015-58, Class ZL, | | | | | | | | |
| 3.000%, 08/25/2045 | | | 264,534 | | | | 221,922 | |
| Series 2015-65, Class LD, | | | | | | | | |
| 3.500%, 01/25/2036 | | | 124,000 | | | | 117,095 | |
| Series 2016-26, Class PA, | | | | | | | | |
| 3.000%, 10/25/2045 | | | 120,008 | | | | 111,780 | |
| Series 2016-28, Class TA, | | | | | | | | |
| 3.250%, 07/25/2043 | | | 494,202 | | | | 387,255 | |
| Series 2016-37, Class BK, | | | | | | | | |
| 3.000%, 06/25/2046 | | | 63,447 | | | | 60,413 | |
| Series 2016-42, Class DA, | | | | | | | | |
| 3.000%, 07/25/2045 | | | 114,306 | | | | 107,468 | |
| Series 2016-6, Class PA, | | | | | | | | |
| 3.000%, 11/25/2044 | | | 123,588 | | | | 117,863 | |
| Series 2016-79, Class JC, | | | | | | | | |
| 2.500%, 11/25/2046 | | | 340,168 | | | | 267,602 | |
| Series 2017-10, Class FA, | | | | | | | | |
| 30D US SOFR + 0.514%, 03/25/2047(a) | | | 27,234 | | | | 26,896 | |
| Series 2017-15, Class PE, | | | | | | | | |
| 3.500%, 04/25/2046 | | | 48,031 | | | | 45,802 | |
| Series 2017-25, Class QH, | | | | | | | | |
| 3.000%, 04/25/2047 | | | 287,762 | | | | 252,848 | |
| Series 2017-38, Class JA, | | | | | | | | |
| 3.000%, 03/25/2047 | | | 62,583 | | | | 56,035 | |
| Series 2017-38, Class JG, | | | | | | | | |
| 2.500%, 03/25/2047 | | | 350,932 | | | | 307,049 | |
| Series 2017-98, Class JC, | | | | | | | | |
| 2.500%, 11/25/2047 | | | 154,067 | | | | 134,398 | |
| Series 2018-15, Class KG, | | | | | | | | |
| 2.500%, 01/25/2048 | | | 99,225 | | | | 84,027 | |
| Series 2018-2, Class BA, | | | | | | | | |
| 3.000%, 02/25/2045 | | | 103,675 | | | | 101,259 | |
| Series 2018-25, Class AL, | | | | | | | | |
| 3.500%, 04/25/2048 | | | 98,000 | | | | 86,214 | |
| Series 2018-28, Class CA, | | | | | | | | |
| 3.000%, 05/25/2048 | | | 104,510 | | | | 92,681 | |
| Series 2018-35, Class LB, | | | | | | | | |
| 3.500%, 05/25/2048 | | | 106,000 | | | | 92,811 | |
| Series 2018-6, Class PA, | | | | | | | | |
| 3.000%, 02/25/2048 | | | 66,691 | | | | 58,437 | |
| Series 2018-8, Class KL, | | | | | | | | |
| 2.500%, 03/25/2047 | | | 91,337 | | | | 81,170 | |
| Series 2018-94, Class KD, | | | | | | | | |
| 3.500%, 12/25/2048 | | | 70,366 | | | | 64,942 | |
| Series 2019-36, Class NJ, | | | | | | | | |
| 3.000%, 07/25/2049 | | | 100,000 | | | | 82,858 | |
| Series 2019-74, Class GL, | | | | | | | | |
| 3.500%, 12/25/2049 | | | 174,253 | | | | 128,991 | |
| Series 2019-81, Class ML, | | | | | | | | |
| 2.500%, 01/25/2050 | | | 119,847 | | | | 76,095 | |
| Series 2020-10, Class DA, | | | | | | | | |
| 3.500%, 03/25/2060 | | | 95,270 | | | | 85,123 | |
| Security Description | | Principal
Amount | | | Value
(Note 2) | |
| Series 2020-38, Class LC, | | | | | | | | |
| 1.500%, 06/25/2040 | | $ | 112,514 | | | $ | 102,494 | |
| Series 2021-6, Class KU, | | | | | | | | |
| 1.500%, 02/25/2051 | | | 191,229 | | | | 110,750 | |
| Series 2021-66, Class HU, | | | | | | | | |
| 1.500%, 10/25/2051 | | | 228,998 | | | | 112,907 | |
| Series 2021-72, Class NA, | | | | | | | | |
| 1.500%, 10/25/2051 | | | 98,025 | | | | 55,520 | |
| Series 2021-87, Class QB, | | | | | | | | |
| 2.000%, 12/25/2051 | | | 46,230 | | | | 27,845 | |
| Series 2021-94, Class PU, | | | | | | | | |
| 2.000%, 01/25/2052 | | | 39,318 | | | | 25,072 | |
| Series 2022-90, Class AY, | | | | | | | | |
| 4.500%, 12/25/2041 | | | 405,000 | | | | 388,572 | |
| Series 2024-39, Class AZ, | | | | | | | | |
| 3.000%, 11/25/2047 | | | 131,962 | | | | 103,860 | |
| | | | | | | | 17,861,150 | |
| Freddie Mac | | | | | | | | |
| Series 1998-2034, Class Z, | | | | | | | | |
| 6.500%, 02/15/2028 | | | 5,196 | | | | 5,282 | |
| Series 1998-2045, Class PD, | | | | | | | | |
| 6.750%, 04/15/2028 | | | 115,075 | | | | 116,241 | |
| Series 1998-2098, Class ZB, | | | | | | | | |
| 6.000%, 11/15/2028 | | | 109,450 | | | | 110,166 | |
| Series 1998-2104, Class QH, | | | | | | | | |
| 6.500%, 12/15/2028 | | | 148,221 | | | | 151,571 | |
| Series 2002-2412, Class OF, | | | | | | | | |
| 30D US SOFR + 1.064%, 12/15/2031(a) | | | 37,476 | | | | 37,854 | |
| Series 2002-2422, Class TA, | | | | | | | | |
| 6.500%, 02/15/2032 | | | 265,465 | | | | 276,553 | |
| Series 2002-2455, Class GK, | | | | | | | | |
| 6.500%, 05/15/2032 | | | 19,131 | | | | 19,929 | |
| Series 2002-2489, Class PE, | | | | | | | | |
| 6.000%, 08/15/2032 | | | 338,241 | | | | 349,186 | |
| Series 2002-2495, Class ZB, | | | | | | | | |
| 4.500%, 09/15/2032 | | | 2,603 | | | | 2,528 | |
| Series 2003-2554, Class MN, | | | | | | | | |
| 5.500%, 01/15/2033 | | | 4,996 | | | | 5,101 | |
| Series 2003-2646, Class ZN, | | | | | | | | |
| 5.000%, 07/15/2033 | | | 144,962 | | | | 143,966 | |
| Series 2003-2673, Class PE, | | | | | | | | |
| 5.500%, 09/15/2033 | | | 152,300 | | | | 155,794 | |
| Series 2003-2725, Class TA, | | | | | | | | |
| 4.500%, 12/15/2033 | | | 34,329 | | | | 34,143 | |
| Series 2004-2768, Class PW, | | | | | | | | |
| 4.250%, 03/15/2034 | | | 9,055 | | | | 8,900 | |
| Series 2005-2944, Class OH, | | | | | | | | |
| 5.500%, 03/15/2035 | | | 48,562 | | | | 50,216 | |
| Series 2005-2973, Class GE, | | | | | | | | |
| 5.500%, 05/15/2035 | | | 206,000 | | | | 208,318 | |
| Series 2005-2978, Class CN, | | | | | | | | |
| 5.500%, 05/15/2035 | | | 153,475 | | | | 158,652 | |
| Series 2005-3033, Class WY, | | | | | | | | |
| 5.500%, 09/15/2035 | | | 97,893 | | | | 100,969 | |
3 | November 30, 2024
ALPS | Smith Core Plus Bond ETF
| Schedule of Investments | November 30, 2024 |
| Security Description | | Principal
Amount | | | Value
(Note 2) | |
| Series 2006-3108, Class PZ, | | | | | | | | |
| 6.000%, 02/15/2036 | | $ | 191,489 | | | $ | 201,652 | |
| Series 2006-3137, Class XP, | | | | | | | | |
| 6.000%, 04/15/2036 | | | 3,201 | | | | 3,357 | |
| Series 2007-3388, Class DZ, | | | | | | | | |
| 5.500%, 11/15/2037 | | | 241,523 | | | | 241,716 | |
| Series 2008-3485, Class MA, | | | | | | | | |
| 5.500%, 07/15/2036 | | | 37,829 | | | | 39,218 | |
| Series 2009-3533, Class CB, | | | | | | | | |
| 4.500%, 05/15/2029 | | | 53,185 | | | | 52,760 | |
| Series 2009-3575, Class D, | | | | | | | | |
| 4.500%, 03/15/2037 | | | 181,796 | | | | 176,620 | |
| Series 2009-3587, Class DA, | | | | | | | | |
| 4.500%, 10/15/2039 | | | 75,501 | | | | 74,541 | |
| Series 2010-3626, Class ME, | | | | | | | | |
| 5.000%, 01/15/2040 | | | 32,492 | | | | 33,093 | |
| Series 2010-3638, Class DB, | | | | | | | | |
| 5.000%, 02/15/2040 | | | 75,000 | | | | 72,622 | |
| Series 2010-3645, Class WD, | | | | | | | | |
| 4.500%, 02/15/2040 | | | 15,000 | | | | 14,621 | |
| Series 2010-3662, Class QB, | | | | | | | | |
| 5.000%, 03/15/2038 | | | 107,596 | | | | 106,897 | |
| Series 2010-3674, Class QN, | | | | | | | | |
| 5.750%, 05/15/2036 | | | 363,142 | | | | 347,920 | |
| Series 2010-3681, Class MT, | | | | | | | | |
| 4.717%, 02/15/2038(a)(b) | | | 93,640 | | | | 84,178 | |
| Series 2010-3704, Class CT, | | | | | | | | |
| 7.000%, 12/15/2036 | | | 633,420 | | | | 669,620 | |
| Series 2010-3764, Class QY, | | | | | | | | |
| 4.000%, 11/15/2030 | | | 1,292,772 | | | | 1,281,273 | |
| Series 2010-3772, Class NE, | | | | | | | | |
| 4.500%, 12/15/2040 | | | 172,000 | | | | 158,333 | |
| Series 2011-3924, Class LC, | | | | | | | | |
| 4.000%, 09/15/2041 | | | 116,903 | | | | 112,242 | |
| Series 2011-3943, Class LA, | | | | | | | | |
| 3.000%, 10/15/2026 | | | 95,811 | | | | 94,359 | |
| Series 2011-3954, Class PG, | | | | | | | | |
| 2.500%, 07/15/2041 | | | 45,967 | | | | 43,646 | |
| Series 2011-3957, Class BZ, | | | | | | | | |
| 4.000%, 11/15/2041 | | | 171,729 | | | | 163,858 | |
| Series 2011-3966, Class NA, | | | | | | | | |
| 4.000%, 12/15/2041 | | | 134,540 | | | | 130,440 | |
| Series 2011-3968, Class G, | | | | | | | | |
| 3.000%, 12/15/2026 | | | 99,564 | | | | 98,069 | |
| Series 2012-3990, Class GY, | | | | | | | | |
| 3.500%, 01/15/2042 | | | 97,000 | | | | 84,316 | |
| Series 2012-3992, Class HZ, | | | | | | | | |
| 4.000%, 01/15/2042 | | | 592,376 | | | | 565,246 | |
| Series 2012-3994, Class HJ, | | | | | | | | |
| 2.000%, 06/15/2041 | | | 348,459 | | | | 331,931 | |
| Series 2012-3997, Class EC, | | | | | | | | |
| 3.500%, 02/15/2042 | | | 62,765 | | | | 53,727 | |
| Series 2012-4029, Class NE, | | | | | | | | |
| 2.500%, 03/15/2041 | | | 159,326 | | | | 154,515 | |
| Series 2012-4050, Class ND, | | | | | | | | |
| 2.500%, 09/15/2041 | | | 8,844 | | | | 8,659 | |
| Security Description | | Principal
Amount | | | Value
(Note 2) | |
| Series 2012-4068, Class PE, | | | | | | | | |
| 3.000%, 06/15/2042 | | $ | 10,000 | | | $ | 9,032 | |
| Series 2012-4075, Class PB, | | | | | | | | |
| 3.000%, 07/15/2042 | | | 24,273 | | | | 22,003 | |
| Series 2012-4077, Class BE, | | | | | | | | |
| 4.000%, 07/15/2042 | | | 15,000 | | | | 13,626 | |
| Series 2012-4093, Class PA, | | | | | | | | |
| 3.000%, 08/15/2042 | | | 68,392 | | | | 61,918 | |
| Series 2012-4096, Class BY, | | | | | | | | |
| 2.000%, 08/15/2042 | | | 190,000 | | | | 148,321 | |
| Series 2012-4101, Class QN, | | | | | | | | |
| 3.500%, 09/15/2042 | | | 5,809 | | | | 5,393 | |
| Series 2012-4112, Class CP, | | | | | | | | |
| 2.000%, 01/15/2042 | | | 126,030 | | | | 120,779 | |
| Series 2012-4116, Class UC, | | | | | | | | |
| 2.500%, 10/15/2042 | | | 40,000 | | | | 29,210 | |
| Series 2012-4117, Class EB, | | | | | | | | |
| 3.500%, 10/15/2042 | | | 83,000 | | | | 70,684 | |
| Series 2012-4118, Class PB, | | | | | | | | |
| 2.500%, 10/15/2042 | | | 146,513 | | | | 122,505 | |
| Series 2012-4125, Class KP, | | | | | | | | |
| 2.500%, 05/15/2041 | | | 100,079 | | | | 95,497 | |
| Series 2012-4135, Class AU, | | | | | | | | |
| 2.000%, 11/15/2042 | | | 107,799 | | | | 82,621 | |
| Series 2012-4138, Class HA, | | | | | | | | |
| 1.250%, 12/15/2027 | | | 146,017 | | | | 141,229 | |
| Series 2012-4147, Class LW, | | | | | | | | |
| 2.000%, 12/15/2032 | | | 190,733 | | | | 173,521 | |
| Series 2013-4160, Class HB, | | | | | | | | |
| 2.500%, 12/15/2032 | | | 8,809 | | | | 8,183 | |
| Series 2013-4161, Class BA, | | | | | | | | |
| 2.500%, 12/15/2041 | | | 63,872 | | | | 61,934 | |
| Series 2013-4161, Class ZW, | | | | | | | | |
| 2.500%, 02/15/2033 | | | 165,789 | | | | 137,895 | |
| Series 2013-4161, Class LT, | | | | | | | | |
| 2.500%, 08/15/2042 | | | 9,832 | | | | 8,936 | |
| Series 2013-4171, Class MN, | | | | | | | | |
| 3.000%, 02/15/2043 | | | 46,000 | | | | 34,985 | |
| Series 2013-4193, Class PK, | | | | | | | | |
| 3.000%, 04/15/2043 | | | 87,990 | | | | 83,350 | |
| Series 2013-4224, Class PA, | | | | | | | | |
| 3.000%, 12/15/2042 | | | 413,169 | | | | 398,024 | |
| Series 2013-4224, Class KC, | | | | | | | | |
| 3.000%, 05/15/2032 | | | 70,409 | | | | 69,449 | |
| Series 2013-4229, Class ZA, | | | | | | | | |
| 4.000%, 07/15/2043 | | | 131,480 | | | | 126,728 | |
| Series 2013-4247, Class AK, | | | | | | | | |
| 4.500%, 12/15/2042 | | | 77,669 | | | | 77,268 | |
| Series 2014-4330, Class PE, | | | | | | | | |
| 3.000%, 11/15/2043 | | | 159,513 | | | | 153,359 | |
| Series 2014-4391, Class MZ, | | | | | | | | |
| 3.000%, 09/15/2044 | | | 135,611 | | | | 120,639 | |
| Series 2014-4410, Class BH, | | | | | | | | |
| 2.500%, 07/15/2033 | | | 286,078 | | | | 283,305 | |
| Series 2015-4447, Class PA, | | | | | | | | |
| 3.000%, 12/15/2044 | | | 76,377 | | | | 71,287 | |
4 | November 30, 2024
ALPS | Smith Core Plus Bond ETF
| Schedule of Investments | November 30, 2024 |
| Security Description | | Principal
Amount | | | Value
(Note 2) | |
| Series 2015-4472, Class MA, | | | | | | | | |
| 3.000%, 05/15/2045 | | $ | 115,731 | | | $ | 107,220 | |
| Series 2015-4492, Class MA, | | | | | | | | |
| 4.000%, 07/15/2043 | | | 60,857 | | | | 60,697 | |
| Series 2016-4614, Class PB, | | | | | | | | |
| 3.000%, 01/15/2046 | | | 128,698 | | | | 118,169 | |
| Series 2016-4616, Class HP, | | | | | | | | |
| 3.000%, 09/15/2046 | | | 76,985 | | | | 69,014 | |
| Series 2016-4619, Class GP, | | | | | | | | |
| 3.000%, 10/15/2046 | | | 399,741 | | | | 354,396 | |
| Series 2016-4621, Class DA, | | | | | | | | |
| 3.000%, 12/15/2045 | | | 117,201 | | | | 109,020 | |
| Series 2016-4624, Class BA, | | | | | | | | |
| 2.000%, 04/15/2036 | | | 203,426 | | | | 184,353 | |
| Series 2017-4670, Class TY, | | | | | | | | |
| 3.000%, 03/15/2047 | | | 222,000 | | | | 180,999 | |
| Series 2018-4760, Class P, | | | | | | | | |
| 3.000%, 02/15/2044 | | | 85,391 | | | | 83,785 | |
| Series 2018-4792, Class BD, | | | | | | | | |
| 3.500%, 02/15/2048 | | | 104,170 | | | | 94,369 | |
| Series 2018-4813, Class CJ, | | | | | | | | |
| 3.000%, 08/15/2048 | | | 178,940 | | | | 155,601 | |
| Series 2018-4819, Class CB, | | | | | | | | |
| 4.000%, 08/15/2048 | | | 899,858 | | | | 847,072 | |
| Series 2018-4824, Class KQ, | | | | | | | | |
| 4.000%, 06/15/2046 | | | 152,597 | | | | 150,749 | |
| Series 2018-4825, Class B, | | | | | | | | |
| 4.000%, 07/15/2044 | | | 102,707 | | | | 102,256 | |
| Series 2018-4827, Class LA, | | | | | | | | |
| 3.500%, 08/15/2044 | | | 183,916 | | | | 181,464 | |
| Series 2018-4839, Class AE, | | | | | | | | |
| 4.000%, 04/15/2051 | | | 125,654 | | | | 120,603 | |
| Series 2019-4879, Class BC, | | | | | | | | |
| 3.000%, 04/15/2049 | | | 133,856 | | | | 118,788 | |
| Series 2019-4888, Class NW, | | | | | | | | |
| 3.000%, 05/15/2049 | | | 174,400 | | | | 132,833 | |
| Series 2019-4919, Class JL, | | | | | | | | |
| 2.500%, 09/25/2049 | | | 507,932 | | | | 429,938 | |
| Series 2019-4926, Class BP, | | | | | | | | |
| 3.000%, 10/25/2049 | | | 292,077 | | | | 253,895 | |
| Series 2019-4932, Class CB, | | | | | | | | |
| 3.500%, 03/25/2049 | | | 323,466 | | | | 306,970 | |
| Series 2020-4988, Class AK, | | | | | | | | |
| 1.000%, 07/25/2050 | | | 141,860 | | | | 111,091 | |
| Series 2020-4989, Class FA, | | | | | | | | |
| 30D US SOFR + 0.464%, 08/15/2040(a) | | | 36,644 | | | | 36,001 | |
| Series 2020-4989, Class FB, | | | | | | | | |
| 30D US SOFR + 0.464%, 10/15/2040(a) | | | 35,270 | | | | 34,644 | |
| Series 2020-5002, Class TJ, | | | | | | | | |
| 2.000%, 07/25/2050 | | | 139,696 | | | | 117,016 | |
| Series 2020-5058, Class LW, | | | | | | | | |
| 1.250%, 01/25/2051 | | | 48,315 | | | | 23,266 | |
| Series 2021-5080, Class CA, | | | | | | | | |
| 2.000%, 02/25/2051 | | | 30,270 | | | | 17,334 | |
| Security Description | | Principal
Amount | | | Value
(Note 2) | |
| Series 2021-5083, Class MA, | | | | | | | | |
| 2.000%, 03/25/2051 | | $ | 12,848 | | | $ | 7,729 | |
| Series 2021-5085, Class HA, | | | | | | | | |
| 1.500%, 03/25/2051 | | | 235,175 | | | | 129,841 | |
| Series 2021-5092, Class BC, | | | | | | | | |
| 2.500%, 06/25/2036 | | | 4,265 | | | | 4,217 | |
| Series 2021-5094, Class Z, | | | | | | | | |
| 2.000%, 07/25/2050 | | | 212,510 | | | | 145,393 | |
| Series 2021-5116, Class HJ, | | | | | | | | |
| 2.000%, 06/25/2051 | | | 31,738 | | | | 17,871 | |
| Series 2022-5206, Class ZY, | | | | | | | | |
| 3.500%, 03/25/2052 | | | 148,049 | | | | 115,288 | |
| Series 2022-5224, Class HL, | | | | | | | | |
| 4.000%, 04/25/2052 | | | 100,000 | | | | 91,081 | |
| Series 2024-5407, Class LB, | | | | | | | | |
| 6.000%, 05/25/2054 | | | 9,033,173 | | | | 9,235,351 | |
| | | | | | | | 24,314,793 | |
| Freddie Mac Strips | | | | | | | | |
| Series 2016-349, Class 300, | | | | | | | | |
| 3.000%, 05/15/2046 | | | 105,916 | | | | 99,469 | |
| | | | | | | | | |
| Freddie Mac Structured Pass-Through Certificates | | | | | | | | |
| Series 2002-41, Class 3A, | | | | | | | | |
| 4.351%, 07/25/2032(a) | | | 13,534 | | | | 12,465 | |
| | | | | | | | | |
| Ginnie Mae | | | | | | | | |
| Series 2003-40, Class PZ, | | | | | | | | |
| 5.500%, 05/16/2033 | | | 325,372 | | | | 324,538 | |
| Series 2003-52, Class AP, | | | | | | | | |
| –%, 06/16/2033(c) | | | 14,280 | | | | 12,360 | |
| Series 2004-1, Class TE, | | | | | | | | |
| 5.000%, 06/20/2033 | | | 45,886 | | | | 45,630 | |
| Series 2004-87, Class BC, | | | | | | | | |
| 4.500%, 10/20/2034 | | | 5,891 | | | | 5,871 | |
| Series 2005-13, Class BG, | | | | | | | | |
| 5.000%, 02/20/2035 | | | 71,713 | | | | 71,999 | |
| Series 2005-20, Class GZ, | | | | | | | | |
| 5.000%, 02/16/2035 | | | 193,686 | | | | 193,400 | |
| Series 2005-51, Class DC, | | | | | | | | |
| 5.000%, 07/20/2035 | | | 3,670 | | | | 3,686 | |
| Series 2005-73, Class PH, | | | | | | | | |
| 5.000%, 09/20/2035 | | | 124,379 | | | | 124,328 | |
| Series 2006-17, Class NZ, | | | | | | | | |
| 6.000%, 04/20/2036 | | | 188,548 | | | | 194,710 | |
| Series 2006-20, Class QB, | | | | | | | | |
| 6.000%, 04/20/2036 | | | 210,900 | | | | 213,337 | |
| Series 2006-38, Class ZK, | | | | | | | | |
| 6.500%, 08/20/2036 | | | 151,002 | | | | 150,566 | |
| Series 2008-38, Class PL, | | | | | | | | |
| 5.500%, 05/20/2038 | | | 16,016 | | | | 16,336 | |
| Series 2008-50, Class KB, | | | | | | | | |
| 6.000%, 06/20/2038 | | | 53,348 | | | | 54,805 | |
| Series 2008-55, Class PL, | | | | | | | | |
| 5.500%, 06/20/2038 | | | 17,561 | | | | 17,715 | |
5 | November 30, 2024
ALPS | Smith Core Plus Bond ETF
| Schedule of Investments | November 30, 2024 |
| Security Description | | Principal
Amount | | | Value
(Note 2) | |
| Series 2008-60, Class JP, | | | | | | | | |
| 5.500%, 07/20/2038 | | $ | 50,601 | | | $ | 51,036 | |
| Series 2008-7, Class PQ, | | | | | | | | |
| 5.000%, 02/20/2038 | | | 5,353 | | | | 5,332 | |
| Series 2008-7, Class PB, | | | | | | | | |
| 5.000%, 02/20/2038 | | | 156,250 | | | | 155,627 | |
| Series 2009-15, Class FM, | | | | | | | | |
| 1M CME TERM SOFR + 1.155%, 03/20/2039(a) | | | 39,124 | | | | 39,250 | |
| Series 2009-45, Class ZB, | | | | | | | | |
| 6.000%, 06/20/2039 | | | 377,409 | | | | 392,281 | |
| Series 2009-47, Class LT, | | | | | | | | |
| 5.000%, 06/20/2039 | | | 74,073 | | | | 74,057 | |
| Series 2009-61, Class AP, | | | | | | | | |
| 4.000%, 08/20/2039 | | | 38,558 | | | | 37,516 | |
| Series 2009-94, Class FA, | | | | | | | | |
| 1M CME TERM SOFR + 0.814%, 10/16/2039(a) | | | 20,870 | | | | 20,890 | |
| Series 2010-29, Class AD, | | | | | | | | |
| 3.500%, 10/20/2039 | | | 92,852 | | | | 89,554 | |
| Series 2010-H20, Class AF, | | | | | | | | |
| 1M CME TERM SOFR + 0.444%, 10/20/2060(a) | | | 18,175 | | | | 18,110 | |
| Series 2011-100, Class MY, | | | | | | | | |
| 4.000%, 07/20/2041 | | | 23,453 | | | | 22,690 | |
| Series 2011-150, Class DW, | | | | | | | | |
| 3.000%, 07/16/2041 | | | 136,884 | | | | 119,980 | |
| Series 2011-71, Class ZC, | | | | | | | | |
| 5.500%, 07/16/2034 | | | 48,330 | | | | 48,857 | |
| Series 2011-H11, Class FB, | | | | | | | | |
| 1M CME TERM SOFR + 0.614%, 04/20/2061(a) | | | 21,156 | | | | 21,125 | |
| Series 2012-108, Class PB, | | | | | | | | |
| 2.750%, 09/16/2042 | | | 38,000 | | | | 30,488 | |
| Series 2012-108, Class CB, | | | | | | | | |
| 2.500%, 09/20/2042 | | | 17,000 | | | | 13,668 | |
| Series 2012-116, Class BY, | | | | | | | | |
| 3.000%, 09/16/2042 | | | 10,000 | | | | 8,073 | |
| Series 2012-124, Class LD, | | | | | | | | |
| 2.000%, 10/20/2042 | | | 136,849 | | | | 103,999 | |
| Series 2012-32, Class PE, | | | | | | | | |
| 3.500%, 03/16/2042 | | | 144,000 | | | | 130,409 | |
| Series 2012-40, Class PW, | | | | | | | | |
| 4.000%, 01/20/2042 | | | 110,931 | | | | 107,735 | |
| Series 2012-61, Class MY, | | | | | | | | |
| 3.000%, 05/16/2042 | | | 25,000 | | | | 20,890 | |
| Series 2012-65, Class LM, | | | | | | | | |
| 3.000%, 05/20/2042 | | | 125,920 | | | | 115,386 | |
| Series 2012-77, Class MU, | | | | | | | | |
| 2.500%, 06/20/2042 | | | 156,704 | | | | 132,763 | |
| Series 2012-84, Class QH, | | | | | | | | |
| 2.500%, 07/16/2042 | | | 123,617 | | | | 109,066 | |
| Series 2012-97, Class BP, | | | | | | | | |
| 2.500%, 08/20/2042 | | | 146,000 | | | | 113,254 | |
| Security Description | | Principal
Amount | | | Value
(Note 2) | |
| Series 2012-H14, Class FK, | | | | | | | | |
| 1M CME TERM SOFR + 0.694%, 07/20/2062(a) | | $ | 29,430 | | | $ | 29,412 | |
| Series 2012-H20, Class PT, | | | | | | | | |
| 5.227%, 07/20/2062(a) | | | 247,464 | | | | 246,733 | |
| Series 2013-117, Class ED, | | | | | | | | |
| 4.000%, 08/20/2043 | | | 41,000 | | | | 38,109 | |
| Series 2013-149, Class BP, | | | | | | | | |
| 3.500%, 10/20/2043 | | | 24,000 | | | | 20,611 | |
| Series 2013-152, Class HL, | | | | | | | | |
| 4.000%, 06/20/2043 | | | 100,000 | | | | 91,903 | |
| Series 2013-22, Class GB, | | | | | | | | |
| 2.500%, 08/20/2042 | | | 78,152 | | | | 69,182 | |
| Series 2013-41, Class MY, | | | | | | | | |
| 3.000%, 03/20/2043 | | | 19,079 | | | | 17,109 | |
| Series 2013-44, Class CE, | | | | | | | | |
| 2.500%, 03/16/2043 | | | 215,730 | | | | 168,133 | |
| Series 2013-58, Class C, | | | | | | | | |
| 2.500%, 04/20/2043 | | | 161,384 | | | | 134,575 | |
| Series 2013-9, Class KY, | | | | | | | | |
| 3.000%, 01/20/2043 | | | 25,000 | | | | 21,958 | |
| Series 2013-H06, Class KB, | | | | | | | | |
| 4.700%, 01/20/2063(a) | | | 168,885 | | | | 167,736 | |
| Series 2014-129, Class KJ, | | | | | | | | |
| 3.000%, 07/16/2039 | | | 100,000 | | | | 84,544 | |
| Series 2014-21, Class PB, | | | | | | | | |
| 4.000%, 02/16/2044 | | | 22,000 | | | | 19,701 | |
| Series 2014-32, Class DA, | | | | | | | | |
| 3.500%, 02/20/2044 | | | 163,826 | | | | 140,988 | |
| Series 2014-H25, Class FB, | | | | | | | | |
| 1M CME TERM SOFR + 0.594%, 12/20/2064(a) | | | 122,424 | | | | 122,281 | |
| Series 2015-27, Class GA, | | | | | | | | |
| 2.481%, 12/20/2044(a) | | | 119,792 | | | | 120,861 | |
| Series 2015-31, Class B, | | | | | | | | |
| 3.000%, 02/20/2045 | | | 200,000 | | | | 177,856 | |
| Series 2015-H29, Class FA, | | | | | | | | |
| 1M CME TERM SOFR + 0.814%, 10/20/2065(a) | | | 726 | | | | 725 | |
| Series 2016-163, Class B, | | | | | | | | |
| 3.000%, 10/20/2046 | | | 40,000 | | | | 30,217 | |
| Series 2016-46, Class Z, | | | | | | | | |
| 3.000%, 04/20/2046 | | | 32,332 | | | | 21,670 | |
| Series 2016-66, Class AB, | | | | | | | | |
| 6.441%, 08/20/2034(a) | | | 764,958 | | | | 795,953 | |
| Series 2016-H08, Class FT, | | | | | | | | |
| 1M CME TERM SOFR + 0.834%, 02/20/2066(a) | | | 29,584 | | | | 29,604 | |
| Series 2017-107, Class T, | | | | | | | | |
| 3.000%, 01/20/2047 | | | 119,766 | | | | 118,270 | |
| Series 2017-11, Class PZ, | | | | | | | | |
| 4.000%, 01/20/2047 | | | 273,453 | | | | 217,097 | |
| Series 2017-134, Class CG, | | | | | | | | |
| 2.500%, 09/20/2047 | | | 160,000 | | | | 135,302 | |
6 | November 30, 2024
ALPS | Smith Core Plus Bond ETF
| Schedule of Investments | November 30, 2024 |
| Security Description | | Principal
Amount | | | Value
(Note 2) | |
| Series 2017-H14, Class FD, | | | | | | | | |
| 1M CME TERM SOFR + 0.584%, 06/20/2067(a) | | $ | 24,822 | | | $ | 24,708 | |
| Series 2018-115, Class CA, | | | | | | | | |
| 3.500%, 08/20/2048 | | | 108,715 | | | | 101,857 | |
| Series 2018-14, Class P, | | | | | | | | |
| 2.250%, 08/20/2046 | | | 651,530 | | | | 575,634 | |
| Series 2018-H07, Class FE, | | | | | | | | |
| 1M CME TERM SOFR + 0.464%, 02/20/2068(a) | | | 5,989 | | | | 5,970 | |
| Series 2019-108, Class NJ, | | | | | | | | |
| 3.500%, 08/20/2049 | | | 122,857 | | | | 109,739 | |
| Series 2019-119, Class JE, | | | | | | | | |
| 3.000%, 09/20/2049 | | | 68,377 | | | | 60,499 | |
| Series 2019-145, Class PA, | | | | | | | | |
| 3.500%, 08/20/2049 | | | 225,605 | | | | 213,247 | |
| Series 2019-153, Class JZ, | | | | | | | | |
| 3.000%, 12/20/2049 | | | 214,579 | | | | 189,003 | |
| Series 2019-158, Class LA, | | | | | | | | |
| 3.500%, 04/20/2049 | | | 310,319 | | | | 298,006 | |
| Series 2019-20, Class AB, | | | | | | | | |
| 3.250%, 02/20/2049 | | | 216,718 | | | | 202,530 | |
| Series 2019-85, Class KG, | | | | | | | | |
| 3.000%, 06/20/2043 | | | 132,864 | | | | 127,499 | |
| Series 2020-116, Class CA, | | | | | | | | |
| 1.000%, 08/20/2050 | | | 120,343 | | | | 54,889 | |
| Series 2020-149, Class WB, | | | | | | | | |
| 1.000%, 10/20/2050 | | | 54,095 | | | | 23,221 | |
| Series 2020-15, Class JH, | | | | | | | | |
| 2.500%, 02/20/2050 | | | 78,648 | | | | 66,579 | |
| Series 2020-67, Class UA, | | | | | | | | |
| 2.000%, 05/20/2050 | | | 126,605 | | | | 84,750 | |
| Series 2020-98, Class CE, | | | | | | | | |
| 3.000%, 07/20/2050 | | | 11,510 | | | | 10,197 | |
| Series 2020-H20, Class FA, | | | | | | | | |
| 1M CME TERM SOFR + 0.464%, 04/20/2070(a) | | | 164,605 | | | | 161,889 | |
| Series 2021-225, Class EU, | | | | | | | | |
| 2.000%, 12/20/2051 | | | 50,288 | | | | 30,653 | |
| Series 2021-76, Class ND, | | | | | | | | |
| 1.250%, 08/20/2050 | | | 2,429 | | | | 1,900 | |
| Series 2021-97, Class JT, | | | | | | | | |
| 2.000%, 06/20/2051 | | | 108,852 | | | | 57,984 | |
| Series 2021-H08, Class AF, | | | | | | | | |
| 30D US SOFR + 0.30%, 01/20/2068(a) | | | 935,603 | | | | 928,033 | |
| Series 2021-H19, Class FM, | | | | | | | | |
| 30D US SOFR + 0.82%, 12/20/2071(a) | | | 187,710 | | | | 186,964 | |
| Series 2022-24, Class BC, | | | | | | | | |
| 4.000%, 02/20/2052 | | | 187,956 | | | | 176,628 | |
| Series 2022-36, Class UP, | | | | | | | | |
| 2.000%, 11/20/2051 | | | 100,000 | | | | 62,710 | |
| Series 2023-113, Class JD, | | | | | | | | |
| 6.000%, 08/20/2053 | | | 175,000 | | | | 181,328 | |
| Security Description | | Principal
Amount | | | Value
(Note 2) | |
| Series 2023-173, Class DX, | | | | | | | | |
| 6.000%, 11/20/2053 | | $ | 780,000 | | | $ | 804,309 | |
| Series 2023-19, Class GZ, | | | | | | | | |
| 5.000%, 02/20/2053 | | | 567,936 | | | | 519,657 | |
| Series 2023-19, Class WB, | | | | | | | | |
| 5.665%, 11/20/2051(a) | | | 110,642 | | | | 113,214 | |
| Series 2023-81, Class AL, | | | | | | | | |
| 4.500%, 08/20/2040 | | | 275,000 | | | | 268,411 | |
| Series 2024-20, Class PL, | | | | | | | | |
| 7.500%, 02/20/2054 | | | 237,000 | | | | 273,852 | |
| Series 2024-22, Class EL, | | | | | | | | |
| 3.000%, 02/20/2054 | | | 120,000 | | | | 93,110 | |
| Series 2024-57, Class JL, | | | | | | | | |
| 1.000%, 05/20/2051 | | | 105,000 | | | | 53,668 | |
| | | | | | | | 12,494,485 | |
| TOTAL COLLATERALIZED MORTGAGE OBLIGATIONS | | |
| (Cost $54,010,811) | | | | | | | 54,782,362 | |
| | | | | | | | | |
| Security Description | | Principal
Amount | | | Value
(Note 2) | |
| COMMERCIAL MORTGAGE-BACKED SECURITIES (0.65%) |
| | | | | | | | | |
| Fannie Mae-Aces | | | | | | | | |
| Series 2016-M11, Class AL, | | | | | | | | |
| 2.944%, 07/25/2039 | | | 113,089 | | | | 101,603 | |
| Series 2018-M15, Class 1A2, | | | | | | | | |
| 3.700%, 01/25/2036 | | | 200,000 | | | | 187,711 | |
| Series 2020-M10, Class X2, | | | | | | | | |
| 1.843%, 12/25/2030(a)(b) | | | 5,473,153 | | | | 341,265 | |
| Series 2020-M15, Class X1, | | | | | | | | |
| 1.556%, 09/25/2031(a)(b) | | | 4,499,669 | | | | 284,971 | |
| Series 2021-M21, Class X, | | | | | | | | |
| 0.839%, 03/25/2028 | | | 58,968,636 | | | | 860,464 | |
| | | | | | | | 1,776,014 | |
| | | | | | | | | |
| Freddie Mac Multiclass Certificates Series 2020-P003 | | | | | | | | |
| Series 2020-P003, Class A3, | | | | | | | | |
| 1.956%, 09/25/2046 | | | 1,400,000 | | | | 1,061,515 | |
| | | | | | | | | |
| Freddie Mac Multifamily Structured Pass Through Certificates | | | | | | | | |
| Series 2017-KW03, Class X1, | | | | | | | | |
| 0.912%, 06/25/2027(a)(b) | | | 35,531,093 | | | | 545,477 | |
| Series 2017-Q006, Class A2, | | | | | | | | |
| 3.693%, 04/25/2028(a) | | | 1,995,336 | | | | 1,901,805 | |
| Series 2018-Q007, Class APT2, | | | | | | | | |
| 7.415%, 10/25/2047(a) | | | 798,841 | | | | 799,953 | |
| Series 2019-Q010, Class APT3, | | | | | | | | |
| 3.111%, 02/25/2027(a) | | | 907,247 | | | | 879,885 | |
| Series 2020-KG04, Class X1, | | | | | | | | |
| 0.935%, 11/25/2030(a)(b) | | | 4,947,788 | | | | 194,264 | |
| Series 2020-Q014, Class X, | | | | | | | | |
| 2.780%, 10/25/2055(a)(b) | | | 4,404,012 | | | | 673,953 | |
7 | November 30, 2024
ALPS | Smith Core Plus Bond ETF
| Schedule of Investments | November 30, 2024 |
| Security Description | | Principal
Amount | | | Value
(Note 2) | |
| Series 2023-KJ45, Class A2, | | | | | | | | |
| 4.660%, 01/25/2031 | | $ | 600,000 | | | $ | 600,880 | |
| | | | | | | | 5,596,217 | |
| TOTAL COMMERCIAL MORTGAGE-BACKED SECURITIES | | |
| (Cost $8,361,980) | | | | | | | 8,433,746 | |
| | | | | | | | | |
| Security Description | | Principal
Amount | | | Value
(Note 2) | |
| MORTGAGE-BACKED SECURITIES (13.72%) | |
| | | | | | | | | |
| Fannie Mae Pool | | | | | | | | |
| Series 2006-, | | | | | | | | |
| 5.500%, 01/01/2037 | | | 196,407 | | | | 197,913 | |
| Series 2007-, | | | | | | | | |
| 5.500%, 08/01/2037 | | | 373,959 | | | | 375,285 | |
| Series 2007-943003, | | | | | | | | |
| 5.500%, 08/01/2047 | | | 31,049 | | | | 30,988 | |
| Series 2008-, | | | | | | | | |
| 6.340%, 08/01/2038 | | | 1,233,697 | | | | 1,229,508 | |
| Series 2009-, | | | | | | | | |
| 5.000%, 12/01/2039 | | | 363,506 | | | | 359,848 | |
| 5.450%, 11/01/2037 | | | 150,702 | | | | 149,435 | |
| 5.500%, 02/01/2037 | | | 313,354 | | | | 315,960 | |
| Series 2012-AM1671, | | | | | | | | |
| 2.100%, 12/01/2027 | | | 13,942 | | | | 13,448 | |
| Series 2013-, | | | | | | | | |
| 3.000%, 01/01/2043 | | | 387,573 | | | | 352,203 | |
| Series 2015-, | | | | | | | | |
| 2.830%, 04/01/2030 | | | 221,440 | | | | 204,135 | |
| 3.410%, 01/01/2032 | | | 143,385 | | | | 134,300 | |
| 3.500%, 06/01/2030 | | | 187,220 | | | | 181,960 | |
| 3.600%, 02/01/2040 | | | 593,620 | | | | 554,511 | |
| 5.544%, 03/01/2038 | | | 594,321 | | | | 607,630 | |
| Series 2015-AM8674, | | | | | | | | |
| 2.810%, 04/01/2025 | | | 77,390 | | | | 76,656 | |
| Series 2016-, | | | | | | | | |
| 3.100%, 03/01/2033 | | | 189,105 | | | | 171,799 | |
| 4.500%, 01/01/2039 | | | 213,315 | | | | 211,540 | |
| Series 2017-, | | | | | | | | |
| 2.000%, 07/01/2032 | | | 196,698 | | | | 182,392 | |
| 2.500%, 01/01/2047 | | | 170,566 | | | | 143,873 | |
| 3.000%, 10/01/2027 | | | 1,351,427 | | | | 1,302,019 | |
| 3.210%, 11/01/2032 | | | 60,000 | | | | 54,130 | |
| 3.260%, 08/01/2029 | | | 145,026 | | | | 137,935 | |
| 3.630%, 01/01/2037 | | | 683,142 | | | | 622,881 | |
| 5.911%, 05/01/2048 | | | 767,084 | | | | 786,466 | |
| 7.000%, 02/01/2030 | | | 476,448 | | | | 487,944 | |
| Series 2017-AN6670, | | | | | | | | |
| 3.210%, 09/01/2027 | | | 27,955 | | | | 26,882 | |
| Series 2017-AN7060, | | | | | | | | |
| 2.930%, 10/01/2027 | | | 70,000 | | | | 66,948 | |
| Series 2018-, | | | | | | | | |
| 3.000%, 01/01/2048 | | | 282,283 | | | | 254,071 | |
| 3.485%, 04/01/2028 | | | 750,000 | | | | 728,876 | |
| 3.545%, 04/01/2028 | | | 488,667 | | | | 476,267 | |
| Security Description | | Principal
Amount | | | Value
(Note 2) | |
| 4.000%, 11/01/2040 | | $ | 453,324 | | | $ | 440,427 | |
| 4.220%, 11/01/2028 | | | 218,000 | | | | 217,288 | |
| 4.500%, 07/01/2040 | | | 107,368 | | | | 105,394 | |
| 4.500%, 02/01/2041 | | | 513,344 | | | | 503,909 | |
| 5.500%, 12/01/2048 | | | 85,127 | | | | 86,481 | |
| Series 2018-387770, | | | | | | | | |
| 3.625%, 07/01/2028 | | | 115,000 | | | | 111,776 | |
| Series 2018-387983, | | | | | | | | |
| 3.630%, 08/01/2028 | | | 201,159 | | | | 193,233 | |
| Series 2018-AN8272, | | | | | | | | |
| 3.170%, 02/01/2028 | | | 200,000 | | | | 192,771 | |
| Series 2019-, | | | | | | | | |
| 3.340%, 05/01/2031 | | | 235,094 | | | | 221,257 | |
| 3.800%, 01/01/2029 | | | 104,097 | | | | 101,308 | |
| 4.000%, 08/01/2048 | | | 131,189 | | | | 125,506 | |
| Series 2020-, | | | | | | | | |
| 2.010%, 04/01/2030 | | | 189,586 | | | | 168,194 | |
| Series 2021-, | | | | | | | | |
| 1.270%, 12/01/2029 | | | 187,006 | | | | 160,067 | |
| 2.000%, 09/01/2051 | | | 1,077,340 | | | | 877,584 | |
| 2.500%, 09/01/2051 | | | 1,335,701 | | | | 1,102,246 | |
| 6.000%, 01/01/2039 | | | 256,623 | | | | 260,252 | |
| Series 2022-, | | | | | | | | |
| 3.010%, 04/01/2032 | | | 105,000 | | | | 95,329 | |
| 3.680%, 04/01/2032 | | | 310,000 | | | | 289,090 | |
| 3.890%, 07/01/2032 | | | 200,000 | | | | 191,312 | |
| Series 2023-, | | | | | | | | |
| 4.070%, 07/01/2033 | | | 120,000 | | | | 115,815 | |
| 4.490%, 06/01/2028 | | | 40,000 | | | | 39,904 | |
| 4.520%, 07/01/2033 | | | 220,000 | | | | 219,358 | |
| 4.610%, 11/01/2030 | | | 177,999 | | | | 179,217 | |
| 4.670%, 07/01/2030 | | | 185,000 | | | | 185,708 | |
| 4.775%, 03/01/2035 | | | 350,000 | | | | 352,555 | |
| 4.790%, 03/01/2028 | | | 200,000 | | | | 201,362 | |
| 4.920%, 08/01/2028 | | | 200,000 | | | | 201,538 | |
| 4.980%, 08/01/2028 | | | 199,460 | | | | 200,737 | |
| 5.090%, 01/01/2029 | | | 274,000 | | | | 279,500 | |
| 5.130%, 10/01/2028 | | | 40,000 | | | | 40,756 | |
| 5.320%, 02/01/2033 | | | 250,000 | | | | 259,218 | |
| 5.350%, 07/01/2033 | | | 800,000 | | | | 811,655 | |
| 5.470%, 11/01/2033 | | | 1,973,927 | | | | 2,002,197 | |
| 5.555%, 01/01/2030 | | | 1,000,000 | | | | 1,027,628 | |
| 6.000%, 10/01/2028 | | | 3,295,000 | | | | 3,455,902 | |
| 6.220%, 06/01/2032 | | | 2,100,000 | | | | 2,209,833 | |
| 6.500%, 07/01/2053 | | | 4,569,941 | | | | 4,711,101 | |
| 6.500%, 08/01/2053 | | | 1,594,752 | | | | 1,638,843 | |
| 7.000%, 04/01/2053 | | | 1,011,401 | | | | 1,035,990 | |
| 7.500%, 01/01/2054 | | | 3,371,249 | | | | 3,649,863 | |
| Series 2024-, | | | | | | | | |
| 5.340%, 07/01/2029 | | | 4,500,000 | | | | 4,608,360 | |
| 5.790%, 01/01/2029 | | | 750,000 | | | | 775,048 | |
| 5.810%, 06/01/2031 | | | 937,000 | | | | 972,632 | |
| 5.810%, 03/01/2034 | | | 1,574,000 | | | | 1,596,709 | |
| 6.000%, 06/01/2054 | | | 1,365,088 | | | | 1,384,201 | |
| 6.000%, 07/01/2054 | | | 1,727,928 | | | | 1,748,977 | |
| 6.470%, 01/01/2034 | | | 1,170,000 | | | | 1,188,791 | |
| 7.000%, 02/01/2054 | | | 4,544,899 | | | | 4,861,490 | |
8 | November 30, 2024
ALPS | Smith Core Plus Bond ETF
| Schedule of Investments | November 30, 2024 |
| Security Description | | Principal
Amount | | | Value
(Note 2) | |
| 7.000%, 05/01/2054 | | $ | 1,964,738 | | | $ | 2,042,761 | |
| 7.500%, 12/01/2053 | | | 1,511,708 | | | | 1,583,742 | |
| 7.500%, 01/01/2054 | | | 508,205 | | | | 525,011 | |
| 7.500%, 03/01/2054 | | | 388,583 | | | | 401,433 | |
| | | | | | | | 60,389,062 | |
| Freddie Mac Gold Pool | | | | | | | | |
| Series 2004-, | | | | | | | | |
| 5.500%, 07/01/2034 | | | 73,406 | | | | 73,553 | |
| Series 2005-, | | | | | | | | |
| 5.500%, 11/01/2035 | | | 103,189 | | | | 105,374 | |
| Series 2013-, | | | | | | | | |
| 3.000%, 04/01/2043 | | | 1,362,020 | | | | 1,218,158 | |
| Series 2015-, | | | | | | | | |
| 4.500%, 06/01/2034 | | | 499,093 | | | | 496,728 | |
| Series 2024-, | | | | | | | | |
| 2.500%, 02/01/2047 | | | 2,294,178 | | | | 1,972,249 | |
| | | | | | | | 3,866,062 | |
| Freddie Mac Non Gold Pool | | | | | | | | |
| Series 2016-, | | | | | | | | |
| 5Y US TI + 1.24%, 06/01/2045(a) | | | 441,274 | | | | 429,419 | |
| | | | | | | | | |
| Freddie Mac Pool | | | | | | | | |
| Series 2018-, | | | | | | | | |
| 3.500%, 03/01/2043 | | | 327,220 | | | | 304,048 | |
| 4.500%, 01/01/2036 | | | 17,145 | | | | 16,616 | |
| 5.500%, 07/01/2033 | | | 112,517 | | | | 112,647 | |
| Series 2019-, | | | | | | | | |
| 3.000%, 10/01/2049 | | | 236,685 | | | | 205,506 | |
| Series 2020-, | | | | | | | | |
| 2.000%, 06/01/2050 | | | 670,612 | | | | 528,412 | |
| Series 2021-, | | | | | | | | |
| 1.000%, 11/01/2036 | | | 152,516 | | | | 130,463 | |
| 1.500%, 10/01/2036 | | | 4,228,311 | | | | 3,661,957 | |
| Series 2022-, | | | | | | | | |
| 3.000%, 12/01/2051 | | | 328,567 | | | | 282,051 | |
| Series 2023-, | | | | | | | | |
| 4.350%, 01/01/2033 | | | 1,000,000 | | | | 982,587 | |
| 4.450%, 04/01/2030 | | | 1,000,000 | | | | 988,871 | |
| 5.100%, 06/01/2028 | | | 1,150,000 | | | | 1,163,665 | |
| Series 2024-, | | | | | | | | |
| 5.030%, 02/01/2029 | | | 5,000,000 | | | | 5,029,729 | |
| 6.500%, 01/01/2054 | | | 3,439,128 | | | | 3,545,101 | |
| 7.000%, 08/01/2054 | | | 2,844,921 | | | | 2,903,637 | |
| | | | | | | | 19,855,290 | |
| Ginnie Mae I Pool | | | | | | | | |
| Series 2011-, | | | | | | | | |
| 4.500%, 03/15/2041 | | | 614,645 | | | | 606,042 | |
| Series 2013-, | | | | | | | | |
| 3.500%, 02/15/2043 | | | 575,881 | | | | 537,799 | |
| 3.500%, 06/15/2043 | | | 124,356 | | | | 116,622 | |
| Series 2015-, | | | | | | | | |
| 3.000%, 07/15/2045 | | | 677,213 | | | | 605,895 | |
| | | | | | | | 1,866,358 | |
| Security Description | | Principal
Amount | | | Value
(Note 2) | |
| Ginnie Mae II Pool | | | | | | | | |
| Series 2011-, | | | | | | | | |
| 4.000%, 10/20/2041 | | $ | 409,757 | | | $ | 389,422 | |
| Series 2012-, | | | | | | | | |
| 3.500%, 04/20/2042 | | | 130,489 | | | | 120,066 | |
| 3.500%, 05/20/2042 | | | 138,820 | | | | 127,249 | |
| 3.500%, 11/20/2042 | | | 177,225 | | | | 162,992 | |
| 4.500%, 03/20/2042 | | | 1,025,899 | | | | 1,034,216 | |
| Series 2013-, | | | | | | | | |
| 3.000%, 01/20/2043 | | | 688,406 | | | | 615,510 | |
| 3.000%, 03/20/2043 | | | 451,581 | | | | 412,659 | |
| Series 2016-, | | | | | | | | |
| 3.750%, 09/20/2046 | | | 123,454 | | | | 115,477 | |
| 3.750%, 10/20/2046 | | | 130,119 | | | | 121,793 | |
| Series 2017-, | | | | | | | | |
| 3.000%, 11/20/2047 | | | 1,082,560 | | | | 960,123 | |
| 3.750%, 07/20/2047 | | | 2,584,930 | | | | 2,357,053 | |
| Series 2018-, | | | | | | | | |
| 4.500%, 02/20/2048 | | | 709,448 | | | | 688,880 | |
| 4.500%, 05/20/2048 | | | 864,774 | | | | 832,925 | |
| 4.500%, 09/20/2048 | | | 48,178 | | | | 47,074 | |
| Series 2019-, | | | | | | | | |
| 4.500%, 11/20/2049 | | | 879,713 | | | | 849,450 | |
| 5.000%, 07/20/2049 | | | 681,968 | | | | 675,227 | |
| 6.000%, 05/20/2049 | | | 110,168 | | | | 113,416 | |
| Series 2020-, | | | | | | | | |
| 3.000%, 03/20/2050 | | | 301,650 | | | | 261,619 | |
| 3.500%, 12/20/2049 | | | 920,223 | | | | 822,760 | |
| 6.500%, 05/20/2039 | | | 221,273 | | | | 230,454 | |
| Series 2021-, | | | | | | | | |
| 2.000%, 03/20/2051 | | | 641,439 | | | | 511,719 | |
| 2.000%, 09/20/2051 | | | 2,959,440 | | | | 2,353,285 | |
| 2.500%, 09/20/2036 | | | 500,631 | | | | 449,909 | |
| 2.500%, 02/20/2051 | | | 2,874,285 | | | | 2,401,297 | |
| 2.500%, 12/20/2051 | | | 409,958 | | | | 346,540 | |
| 3.000%, 08/20/2051 | | | 31,662 | | | | 28,432 | |
| 3.500%, 02/20/2051 | | | 530,318 | | | | 488,962 | |
| 6.500%, 11/20/2036 | | | 176,594 | | | | 182,508 | |
| 6.500%, 09/20/2051 | | | 301,605 | | | | 314,122 | |
| Series 2022-, | | | | | | | | |
| 3.000%, 12/20/2044 | | | 8,747 | | | | 7,693 | |
| 3.500%, 01/20/2052 | | | 115,576 | | | | 103,599 | |
| 3.500%, 03/20/2052 | | | 2,007,360 | | | | 1,797,854 | |
| 4.000%, 12/20/2051 | | | 324,225 | | | | 299,887 | |
| 5.000%, 11/20/2052 | | | 277,009 | | | | 270,479 | |
| 5.500%, 07/20/2035 | | | 198,702 | | | | 205,319 | |
| 6.000%, 12/20/2037 | | | 109,013 | | | | 112,948 | |
| 7.000%, 11/20/2052 | | | 269,482 | | | | 279,828 | |
| Series 2023-, | | | | | | | | |
| 5.500%, 08/20/2053 | | | 142,134 | | | | 142,745 | |
| 6.000%, 09/20/2053 | | | 2,185,768 | | | | 2,239,870 | |
| 6.500%, 09/20/2053 | | | 647,926 | | | | 668,282 | |
| 6.500%, 10/20/2053 | | | 46,452 | | | | 47,918 | |
| 6.500%, 11/20/2053 | | | 1,857,635 | | | | 1,913,573 | |
| 7.000%, 11/20/2053 | | | 121,131 | | | | 123,475 | |
| 7.500%, 10/20/2063 | | | 226,050 | | | | 231,799 | |
| 8.000%, 12/20/2063 | | | 1,929,083 | | | | 2,014,296 | |
9 | November 30, 2024
ALPS | Smith Core Plus Bond ETF
| Schedule of Investments | November 30, 2024 |
| Security Description | | Principal
Amount | | | Value
(Note 2) | |
| Series 2024-, | | | | | | | | |
| 3.000%, 10/20/2050 | | $ | 4,590,928 | | | $ | 4,006,656 | |
| 6.000%, 01/20/2054 | | | 365,200 | | | | 374,305 | |
| 6.000%, 02/20/2054 | | | 3,359,888 | | | | 3,444,387 | |
| 6.000%, 06/20/2054 | | | 1,729,744 | | | | 1,769,398 | |
| 6.000%, 11/20/2064 | | | 18,581,013 | | | | 18,691,080 | |
| 6.500%, 01/20/2054 | | | 4,094,197 | | | | 4,211,897 | |
| 6.500%, 08/20/2054 | | | 5,504,046 | | | | 5,668,511 | |
| 6.500%, 04/20/2064 | | | 1,911,564 | | | | 1,931,306 | |
| 6.500%, 05/20/2064 | | | 4,157,691 | | | | 4,217,740 | |
| 6.500%, 09/20/2064 | | | 1,364,603 | | | | 1,376,649 | |
| 6.500%, 10/20/2064 | | | 4,397,014 | | | | 4,442,423 | |
| 7.000%, 12/20/2063 | | | 415,047 | | | | 425,364 | |
| 8.000%, 12/20/2053 | | | 665,522 | | | | 687,119 | |
| 8.000%, 08/20/2054 | | | 5,748,341 | | | | 6,042,545 | |
| 8.000%, 09/20/2054 | | | 1,706,468 | | | | 1,769,012 | |
| 8.000%, 10/20/2059 | | | 123,075 | | | | 127,318 | |
| 8.000%, 12/20/2063 | | | 2,712,188 | | | | 2,807,146 | |
| | | | | | | | 90,467,560 | |
| TOTAL MORTGAGE-BACKED SECURITIES | | | | |
| (Cost $176,108,706) | | | | | | | 176,873,751 | |
| | | | | | | | | |
| | | Principal | | | Value | |
| CORPORATE BONDS (31.67%) | | | | | | | | |
| | | | | | | | | |
| Aerospace & Defense (3.21%) | | | | | | | | |
| Boeing Co. | | | | | | | | |
| 2.20%, 02/04/2026 | | | 3,950,000 | | | | 3,818,293 | |
| 6.53%, 05/01/2034(d) | | | 5,604,000 | | | | 5,961,510 | |
| 7.01%, 05/01/2064(d) | | | 5,616,000 | | | | 6,120,956 | |
| Howmet Aerospace, Inc. | | | | | | | | |
| 3.00%, 01/15/2029 | | | 2,812,000 | | | | 2,627,137 | |
| L3Harris Technologies, Inc. | | | | | | | | |
| 5.35%, 06/01/2034 | | | 7,656,000 | | | | 7,817,316 | |
| 5.40%, 07/31/2033 | | | 3,000,000 | | | | 3,070,758 | |
| RTX Corp. | | | | | | | | |
| 6.10%, 03/15/2034 | | | 10,958,000 | | | | 11,793,613 | |
| Total Aerospace & Defense | | | | | | | 41,209,583 | |
| | | | | | | | | |
| Airlines (1.01%) | | | | | | | | |
| Alaska Airlines 2020-1 Class A Pass Through Trust | | | | | | | | |
| 4.80%, 08/15/2027(d) | | | 1,348,868 | | | | 1,339,193 | |
| AS Mileage Plan IP, Ltd. | | | | | | | | |
| 5.02%, 10/20/2029(d) | | | 4,125,000 | | | | 4,032,586 | |
| 5.31%, 10/20/2031(d) | | | 3,400,000 | | | | 3,333,273 | |
| British Airways 2020-1 Class A Pass Through Trust | | | | | | | | |
| 4.25%, 11/15/2032(d) | | | 370,583 | | | | 355,292 | |
| Southwest Airlines Co. | | | | | | | | |
| 5.25%, 05/04/2025 | | | 2,750,000 | | | | 2,750,675 | |
| United Airlines 2020-1 Class A Pass Through Trust | | | | | | | | |
| Series 20-1 | | | | | | | | |
| 5.88%, 10/15/2027 | | | 1,228,320 | | | | 1,259,137 | |
| Total Airlines | | | | | | | 13,070,156 | |
| Security Description | | Principal
Amount | | | Value
(Note 2) | |
| Automobiles Manufacturing (1.55%) | | | | | | | | |
| Ford Motor Credit Co. LLC | | | | | | | | |
| 3.38%, 11/13/2025 | | $ | 2,370,000 | | | $ | 2,329,955 | |
| 6.80%, 05/12/2028 | | | 3,700,000 | | | | 3,859,312 | |
| 7.35%, 03/06/2030 | | | 4,250,000 | | | | 4,561,336 | |
| General Motors Financial Co., Inc. | | | | | | | | |
| SOFRINDX + 1.30%, 04/07/2025(a)(e) | | | 3,510,000 | | | | 3,520,146 | |
| Hyundai Capital America | | | | | | | | |
| 5.45%, 06/24/2026(d) | | | 1,942,000 | | | | 1,959,229 | |
| Nissan Motor Acceptance Co. LLC | | | | | | | | |
| 7.05%, 09/15/2028(d) | | | 2,550,000 | | | | 2,606,482 | |
| Volkswagen Group of America Finance LLC | | | | | | | | |
| 3.95%, 06/06/2025(d) | | | 1,000,000 | | | | 995,149 | |
| Total Automobiles Manufacturing | | | | | | | 19,831,609 | |
| | | | | | | | | |
| Banks (2.26%) | | | | | | | | |
| Citizens Financial Group, Inc. | | | | | | | | |
| 1D US SOFR + 1.91%, 07/23/2032(a) | | | 3,000,000 | | | | 3,061,835 | |
| Cooperatieve Rabobank UA | | | | | | | | |
| 3.75%, 07/21/2026 | | | 1,750,000 | | | | 1,713,796 | |
| Danske Bank A/S | | | | | | | | |
| 1Y US TI + 0.95%, 03/01/2028(a)(d) | | | 2,588,000 | | | | 2,621,601 | |
| 1Y US TI + 1.35%, 09/11/2026(a)(d) | | | 2,000,000 | | | | 1,948,855 | |
| 1Y US TI + 1.40%, 03/01/2030(a)(d) | | | 1,870,000 | | | | 1,915,986 | |
| Discover Bank | | | | | | | | |
| 5Y US TI + 1.73%, 08/09/2028(a) | | | 1,394,000 | | | | 1,414,671 | |
| Goldman Sachs Bank USA | | | | | | | | |
| 1D US SOFR + 0.777%, 03/18/2027(a) | | | 1,393,000 | | | | 1,402,457 | |
| Intesa Sanpaolo SpA | | | | | | | | |
| 1Y US TI + 3.90%, 06/20/2054(a)(d) | | | 1,900,000 | | | | 2,116,769 | |
| Regions Financial Corp. | | | | | | | | |
| 1D US SOFR + 2.06%, 09/06/2035(a) | | | 2,770,000 | | | | 2,782,020 | |
| Synovus Financial Corp. | | | | | | | | |
| 1D US SOFR + 2.347%, 11/01/2030(a) | | | 1,150,000 | | | | 1,171,203 | |
| Truist Bank | | | | | | | | |
| 3.30%, 05/15/2026 | | | 1,950,000 | | | | 1,909,545 | |
| Truist Financial Corp. | | | | | | | | |
| 1D US SOFR + 1.571%, 08/05/2032(a) | | | 212,000 | | | | 213,016 | |
| 1D US SOFR + 2.361%, 06/08/2034(a) | | | 2,300,000 | | | | 2,397,430 | |
| Wells Fargo & Co. | | | | | | | | |
| 1D US SOFR + 2.02%, 04/24/2034(a) | | | 4,300,000 | | | | 4,357,121 | |
| Total Banks | | | | | | | 29,026,305 | |
10 | November 30, 2024
ALPS | Smith Core Plus Bond ETF
| Schedule of Investments | November 30, 2024 |
| Security Description | | Principal
Amount | | | Value
(Note 2) | |
| Biotechnology (1.39%) | | | | | | | | |
| Amgen, Inc. | | | | | | | | |
| 5.25%, 03/02/2033 | | $ | 5,450,000 | | | $ | 5,540,319 | |
| 5.51%, 03/02/2026 | | | 2,700,000 | | | | 2,700,043 | |
| 5.75%, 03/02/2063 | | | 5,300,000 | | | | 5,399,979 | |
| Royalty Pharma PLC | | | | | | | | |
| 5.40%, 09/02/2034 | | | 4,375,000 | | | | 4,355,613 | |
| Total Biotechnology | | | | | | | 17,995,954 | |
| | | | | | | | | |
| Cable & Satellite (0.88%) | | | | | | | | |
| CCO Holdings LLC / CCO Holdings Capital Corp. | | | | | | | | |
| 4.50%, 05/01/2032 | | | 1,250,000 | | | | 1,105,405 | |
| 4.50%, 06/01/2033(d) | | | 2,250,000 | | | | 1,953,445 | |
| 6.38%, 09/01/2029(d) | | | 1,900,000 | | | | 1,910,843 | |
| Cox Communications, Inc. | | | | | | | | |
| 5.45%, 09/01/2034(d) | | | 2,002,000 | | | | 1,979,689 | |
| 5.95%, 09/01/2054(d) | | | 1,752,000 | | | | 1,712,401 | |
| Sirius XM Radio, Inc. | | | | | | | | |
| 5.00%, 08/01/2027(d) | | | 2,806,000 | | | | 2,760,430 | |
| Total Cable & Satellite | | | | | | | 11,422,213 | |
| | | | | | | | | |
| Casinos & Gaming (0.06%) | | | | | | | | |
| Caesars Entertainment, Inc. | | | | | | | | |
| 8.13%, 07/01/2027(d) | | | 763,000 | | | | 778,791 | |
| | | | | | | | | |
| Commercial Finance (0.38%) | | | | | | | | |
| AerCap Ireland Capital DAC / AerCap Global Aviation Trust | | | | | | | | |
| 6.50%, 07/15/2025 | | | 4,791,000 | | | | 4,828,554 | |
| | | | | | | | | |
| Consumer Finance (1.05%) | | | | | | | | |
| American Express Co. | | | | | | | | |
| 1D US SOFR + 1.42%, 07/26/2035(a) | | | 1,338,000 | | | | 1,357,281 | |
| Boost Newco Borrower LLC | | | | | | | | |
| 7.50%, 01/15/2031(d) | | | 2,300,000 | | | | 2,431,312 | |
| Discover Financial Services | | | | | | | | |
| SOFRINDX + 3.37%, 11/02/2034(a)(e) | | | 6,161,000 | | | | 7,181,425 | |
| Fiserv, Inc. | | | | | | | | |
| 5.60%, 03/02/2033 | | | 1,500,000 | | | | 1,555,029 | |
| Synchrony Financial | | | | | | | | |
| 3.70%, 08/04/2026 | | | 1,000,000 | | | | 977,903 | |
| Total Consumer Finance | | | | | | | 13,502,950 | |
| | | | | | | | | |
| Containers & Packaging (0.21%) | | | | | | | | |
| Sonoco Products Co. | | | | | | | | |
| 5.00%, 09/01/2034 | | | 2,816,000 | | | | 2,749,498 | |
| | | | | | | | | |
| Diversified Banks (0.92%) | | | | | | | | |
| Bank of America Corp. | | | | | | | | |
| 1D US SOFR + 1.91%, 04/25/2034(a) | | | 3,117,000 | | | | 3,166,423 | |
| Security Description | | Principal
Amount | | | Value
(Note 2) | |
| JPMorgan Chase & Co. | | | | | | | | |
| 1D US SOFR + 0.93%, 04/22/2028(a) | | $ | 1,934,000 | | | $ | 1,970,606 | |
| 1D US SOFR + 1.07%, 12/15/2025(a) | | | 3,000,000 | | | | 3,000,320 | |
| 1D US SOFR + 1.62%, 01/23/2035(a) | | | 3,676,000 | | | | 3,745,198 | |
| Total Diversified Banks | | | | | | | 11,882,547 | |
| | | | | | | | | |
| Electrical Equipment Manufacturing (0.05%) | | | | | | | | |
| Trimble, Inc. | | | | | | | | |
| 4.75%, 12/01/2024 | | | 650,000 | | | | 650,000 | |
| | | | | | | | | |
| Entertainment Content (0.91%) | | | | | | | | |
| Paramount Global | | | | | | | | |
| 4.20%, 05/19/2032 | | | 10,175,000 | | | | 9,160,606 | |
| Warnermedia Holdings, Inc. | | | | | | | | |
| 4.28%, 03/15/2032 | | | 2,835,000 | | | | 2,559,350 | |
| Total Entertainment Content | | | | | | | 11,719,956 | |
| | | | | | | | | |
| Entertainment Resources (0.11%) | | | | | | | | |
| Six Flags Entertainment Corp. / Six Flags Theme Parks, Inc. | | | | | | | | |
| 6.63%, 05/01/2032(d) | | | 1,338,000 | | | | 1,372,184 | |
| | | | | | | | | |
| Exploration & Production (2.11%) | | | | | | | | |
| Devon Energy Corp. | | | | | | | | |
| 5.20%, 09/15/2034 | | | 1,080,000 | | | | 1,055,723 | |
| 5.75%, 09/15/2054 | | | 1,512,000 | | | | 1,458,450 | |
| Hilcorp Energy I LP / Hilcorp Finance Co. | | | | | | | | |
| 6.25%, 11/01/2028(d) | | | 3,000,000 | | | | 2,978,570 | |
| 7.25%, 02/15/2035(d) | | | 4,247,000 | | | | 4,160,498 | |
| Occidental Petroleum Corp. | | | | | | | | |
| 5.55%, 10/01/2034 | | | 4,194,000 | | | | 4,173,539 | |
| 7.88%, 09/15/2031 | | | 9,775,000 | | | | 11,039,142 | |
| Permian Resources Operating LLC | | | | | | | | |
| 9.88%, 07/15/2031(d) | | | 428,000 | | | | 474,787 | |
| Range Resources Corp. | | | | | | | | |
| 4.88%, 05/15/2025 | | | 1,952,000 | | | | 1,949,010 | |
| Total Exploration & Production | | | | | | | 27,289,719 | |
| | | | | | | | | |
| Financial Services (2.83%) | | | | | | | | |
| Charles Schwab Corp. | | | | | | | | |
| 1D US SOFR + 2.01%, 08/24/2034(a) | | | 4,500,000 | | | | 4,824,006 | |
| SOFRINDX + 1.05%, 03/03/2027(a)(e) | | | 3,218,000 | | | | 3,248,500 | |
| Goldman Sachs Group, Inc. | | | | | | | | |
| 1D US SOFR + 1.552%, 04/25/2035(a) | | | 1,095,000 | | | | 1,148,175 | |
| Jane Street Group / JSG Finance, Inc. | | | | | | | | |
| 6.13%, 11/01/2032(d) | | | 1,544,000 | | | | 1,551,526 | |
| 7.13%, 04/30/2031(d) | | | 2,100,000 | | | | 2,187,059 | |
11 | November 30, 2024
ALPS | Smith Core Plus Bond ETF
| Schedule of Investments | November 30, 2024 |
| Security Description | | Principal
Amount | | | Value
(Note 2) | |
| Morgan Stanley | | | | | | | | |
| 1D US SOFR + 2.05%, 11/01/2034(a) | | $ | 3,593,000 | | | $ | 3,969,462 | |
| 5Y US TI + 2.43%, 01/19/2038(a) | | | 2,761,000 | | | | 2,825,195 | |
| UBS Group AG | | | | | | | | |
| 1D US SOFR + 1.73%, 05/14/2032(a)(d) | | | 3,100,000 | | | | 2,752,329 | |
| 1D US SOFR + 3.92%, 08/12/2033(a)(d) | | | 11,230,000 | | | | 12,156,669 | |
| 1Y US TI + 1.80%, 09/22/2029(a)(d) | | | 1,750,000 | | | | 1,830,834 | |
| Total Financial Services | | | | | | | 36,493,755 | |
| | | | | | | | | |
| Food & Beverage (1.13%) | | | | | | | | |
| General Mills, Inc. | | | | | | | | |
| 5.25%, 01/30/2035 | | | 2,650,000 | | | | 2,677,298 | |
| J M Smucker Co. | | | | | | | | |
| 6.20%, 11/15/2033 | | | 2,750,000 | | | | 2,954,863 | |
| Pilgrim's Pride Corp. | | | | | | | | |
| 6.25%, 07/01/2033 | | | 3,600,000 | | | | 3,777,548 | |
| 6.88%, 05/15/2034 | | | 4,692,000 | | | | 5,130,789 | |
| Total Food & Beverage | | | | | | | 14,540,498 | |
| | | | | | | | | |
| Government Agencies (0.05%) | | | | | | | | |
| Tennessee Valley Authority | | | | | | | | |
| 2.22%, 05/01/2029(a) | | | 30,197 | | | | 682,452 | |
| | | | | | | | | |
| Health Care Facilities & Services (0.58%) | | | | | | | | |
| HCA, Inc. | | | | | | | | |
| 2.38%, 07/15/2031 | | | 4,100,000 | | | | 3,462,879 | |
| 5.38%, 02/01/2025 | | | 1,300,000 | | | | 1,299,888 | |
| 5.50%, 06/01/2033 | | | 2,700,000 | | | | 2,727,565 | |
| Total Health Care Facilities & Services | | | | | | | 7,490,332 | |
| | | | | | | | | |
| Industrial Other (0.14%) | | | | | | | | |
| Jacobs Engineering Group, Inc. | | | | | | | | |
| 5.90%, 03/01/2033 | | | 1,788,000 | | | | 1,841,504 | |
| | | | | | | | | |
| Integrated Oils (0.23%) | | | | | | | | |
| TotalEnergies Capital SA | | | | | | | | |
| 5.49%, 04/05/2054 | | | 2,892,000 | | | | 2,920,743 | |
| | | | | | | | | |
| Machinery Manufacturing (0.19%) | | | | | | | | |
| Nordson Corp. | | | | | | | | |
| 4.50%, 12/15/2029 | | | 2,556,000 | | | | 2,519,418 | |
| | | | | | | | | |
| Manufactured Goods (0.15%) | | | | | | | | |
| Chart Industries, Inc. | | | | | | | | |
| 7.50%, 01/01/2030(d) | | | 1,810,000 | | | | 1,893,096 | |
| | | | | | | | | |
| Medical Equipment & Devices Manufacturing (1.29%) | | | | | | | | |
| Alcon Finance Corp. | | | | | | | | |
| 5.38%, 12/06/2032(d) | | | 5,900,000 | | | | 6,047,425 | |
| Security Description | | Principal
Amount | | | Value
(Note 2) | |
| Solventum Corp. | | | | | | | | |
| 5.45%, 03/13/2031(d) | | $ | 2,850,000 | | | $ | 2,892,928 | |
| 5.60%, 03/23/2034(d) | | | 4,650,000 | | | | 4,722,818 | |
| 5.90%, 04/30/2054(d) | | | 2,855,000 | | | | 2,923,996 | |
| Total Medical Equipment & Devices Manufacturing | | | | | | | 16,587,167 | |
| | | | | | | | | |
| Metals & Mining (0.19%) | | | | | | | | |
| Steel Dynamics, Inc. | | | | | | | | |
| 5.00%, 12/15/2026 | | | 2,400,000 | | | | 2,398,610 | |
| | | | | | | | | |
| Oil & Gas Services & Equipment (0.05%) | | | | | | | | |
| Transocean Poseidon, Ltd. | | | | | | | | |
| 6.88%, 02/01/2027(d) | | | 618,000 | | | | 621,529 | |
| | | | | | | | | |
| Pharmaceuticals (0.95%) | | | | | | | | |
| AbbVie, Inc. | | | | | | | | |
| 5.05%, 03/15/2034 | | | 2,123,000 | | | | 2,150,759 | |
| Bristol-Myers Squibb Co. | | | | | | | | |
| 5.20%, 02/22/2034 | | | 2,750,000 | | | | 2,816,185 | |
| 5.55%, 02/22/2054 | | | 4,735,000 | | | | 4,900,225 | |
| Pfizer Investment Enterprises Pte, Ltd. | | | | | | | | |
| 4.75%, 05/19/2033 | | | 2,350,000 | | | | 2,326,139 | |
| Total Pharmaceuticals | | | | | | | 12,193,308 | |
| | | | | | | | | |
| Pipeline (2.18%) | | | | | | | | |
| Buckeye Partners LP | | | | | | | | |
| 4.50%, 03/01/2028(d) | | | 3,010,000 | | | | 2,900,389 | |
| 6.88%, 07/01/2029(d) | | | 3,475,000 | | | | 3,547,294 | |
| Energy Transfer LP | | | | | | | | |
| 7.38%, 02/01/2031(d) | | | 2,639,000 | | | | 2,783,100 | |
| EnLink Midstream LLC | | | | | | | | |
| 5.63%, 01/15/2028(d) | | | 1,212,000 | | | | 1,233,864 | |
| Flex Intermediate Holdco LLC | | | | | | | | |
| 3.36%, 06/30/2031(d) | | | 4,800,000 | | | | 4,183,492 | |
| 4.32%, 12/30/2039(d) | | | 3,250,000 | | | | 2,587,951 | |
| Gray Oak Pipeline LLC | | | | | | | | |
| 2.60%, 10/15/2025(d) | | | 2,998,000 | | | | 2,936,452 | |
| Targa Resources Partners LP / Targa Resources Partners Finance Corp. | | | | | | | | |
| 6.50%, 07/15/2027 | | | 4,800,000 | | | | 4,853,587 | |
| 6.88%, 01/15/2029 | | | 3,060,000 | | | | 3,135,016 | |
| Total Pipeline | | | | | | | 28,161,145 | |
| | | | | | | | | |
| Power Generation (0.50%) | | | | | | | | |
| Vistra Operations Co. LLC | | | | | | | | |
| 5.13%, 05/13/2025(d) | | | 2,700,000 | | | | 2,700,653 | |
| 5.50%, 09/01/2026(d) | | | 3,850,000 | | | | 3,845,975 | |
| Total Power Generation | | | | | | | 6,546,628 | |
| | | | | | | | | |
| Publishing & Broadcasting (0.35%) | | | | | | | | |
| Nexstar Media, Inc. | | | | | | | | |
| 4.75%, 11/01/2028(d) | | | 2,400,000 | | | | 2,268,020 | |
| 5.63%, 07/15/2027(d) | | | 2,225,000 | | | | 2,194,537 | |
| Total Publishing & Broadcasting | | | | | | | 4,462,557 | |
12 | November 30, 2024
ALPS | Smith Core Plus Bond ETF
| Schedule of Investments | November 30, 2024 |
| Security Description | | Principal
Amount | | | Value
(Note 2) | |
| Real Estate (0.82%) | | | | | | | | |
| CoStar Group, Inc. | | | | | | | | |
| 2.80%, 07/15/2030(d) | | $ | 2,700,000 | | | $ | 2,381,961 | |
| Cushman & Wakefield US Borrower LLC | | | | | | | | |
| 6.75%, 05/15/2028(d) | | | 1,885,000 | | | | 1,907,175 | |
| VICI Properties LP | | | | | | | | |
| 5.13%, 05/15/2032 | | | 3,389,000 | | | | 3,351,258 | |
| VICI Properties LP / VICI Note Co., Inc. | | | | | | | | |
| 4.63%, 06/15/2025(d) | | | 3,000,000 | | | | 2,987,745 | |
| Total Real Estate | | | | | | | 10,628,139 | |
| | | | | | | | | |
| Refining & Marketing (0.39%) | | | | | | | | |
| HF Sinclair Corp. | | | | | | | | |
| 4.50%, 10/01/2030 | | | 2,594,000 | | | | 2,489,986 | |
| 5.00%, 02/01/2028 | | | 1,000,000 | | | | 995,244 | |
| 5.88%, 04/01/2026 | | | 1,500,000 | | | | 1,513,640 | |
| Total Refining & Marketing | | | | | | | 4,998,870 | |
| | | | | | | | | |
| Retail - Consumer Discretionary (0.11%) | | | | | | | | |
| ERAC USA Finance LLC | | | | | | | | |
| 5.20%, 10/30/2034(d) | | | 1,455,000 | | | | 1,476,840 | |
| | | | | | | | | |
| Software & Services (0.71%) | | | | | | | | |
| Accenture Capital, Inc. | | | | | | | | |
| 4.50%, 10/04/2034 | | | 1,150,000 | | | | 1,118,669 | |
| Leidos, Inc. | | | | | | | | |
| 5.75%, 03/15/2033 | | | 2,834,000 | | | | 2,921,919 | |
| VMware LLC | | | | | | | | |
| 2.20%, 08/15/2031 | | | 1,550,000 | | | | 1,304,157 | |
| 4.70%, 05/15/2030 | | | 3,860,000 | | | | 3,817,121 | |
| Total Software & Services | | | | | | | 9,161,866 | |
| | | | | | | | | |
| Supermarkets & Pharmacies (1.23%) | | | | | | | | |
| Albertsons Cos. Inc / Safeway, Inc. / New Albertsons LP / Albertsons LLC | | | | | | | | |
| 6.50%, 02/15/2028(d) | | | 3,900,000 | | | | 3,981,046 | |
| Kroger Co. | | | | | | | | |
| 5.00%, 09/15/2034 | | | 8,839,000 | | | | 8,789,955 | |
| 5.50%, 09/15/2054 | | | 3,194,000 | | | | 3,168,633 | |
| Total Supermarkets & Pharmacies | | | | | | | 15,939,634 | |
| | | | | | | | | |
| Travel & Lodging (0.69%) | | | | | | | | |
| Carnival Corp. | | | | | | | | |
| 10.50%, 06/01/2030(d) | | | 5,728,000 | | | | 6,148,742 | |
| Royal Caribbean Cruises, Ltd. | | | | | | | | |
| 6.25%, 03/15/2032(d) | | | 2,721,000 | | | | 2,782,144 | |
| Total Travel & Lodging | | | | | | | 8,930,886 | |
| | | | | | | | | |
| Utilities (0.20%) | | | | | | | | |
| American Water Capital Corp. | | | | | | | | |
| 5.15%, 03/01/2034 | | | 2,487,000 | | | | 2,529,679 | |
| Security Description | | Principal
Amount | | | Value
(Note 2) | |
| Waste & Environment Services & Equipment (0.37%) | | | | | | | | |
| GFL Environmental, Inc. | | | | | | | | |
| 5.13%, 12/15/2026(d) | | $ | 3,657,000 | | | $ | 3,647,082 | |
| 6.75%, 01/15/2031(d) | | | 1,143,000 | | | | 1,186,770 | |
| Total Waste & Environment Services & Equipment | | | | 4,833,852 | |
| Wireless Telecommunications Services (0.24%) | | | | | |
| Verizon Communications, Inc. | | | | | | | | |
| 4.78%, 02/15/2035(d) | | | 3,174,000 | | | | 3,096,035 | |
| | | | | | | | | |
| TOTAL CORPORATE BONDS | | | | | | |
| (Cost $403,873,032) | | | | | | | 408,278,562 | |
| | | | | | | | | |
| GOVERNMENT BONDS (43.97%) | | | | | | | | |
| | | | | | | | | |
| U.S. Treasury Bonds (43.97%) | | | | | | | | |
| U.S. - United States Treasury Notes | | | | | | | | |
| 3.50%, 09/30/2026 | | | 37,123,000 | | | | 36,664,763 | |
| 3.50%, 09/30/2029 | | | 64,517,000 | | | | 62,861,232 | |
| 3.75%, 08/31/2026 | | | 59,943,000 | | | | 59,465,329 | |
| 4.13%, 10/31/2026 | | | 33,602,000 | | | | 33,557,373 | |
| 4.13%, 10/31/2029 | | | 72,558,000 | | | | 72,679,876 | |
| 4.38%, 07/31/2026 | | | 29,375,000 | | | | 29,441,553 | |
| 4.50%, 05/15/2027 | | | 27,148,000 | | | | 27,369,638 | |
| United States Treasury Bond | | | | | | | | |
| 3.88%, 08/15/2034 | | | 46,072,000 | | | | 44,902,203 | |
| 4.13%, 08/15/2044 | | | 65,257,000 | | | | 62,136,900 | |
| 4.25%, 11/15/2034 | | | 53,437,000 | | | | 53,683,311 | |
| 4.25%, 08/15/2054 | | | 15,157,000 | | | | 14,827,809 | |
| 4.50%, 11/15/2054 | | | 39,975,000 | | | | 40,815,099 | |
| 4.63%, 05/15/2044 | | | 14,545,000 | | | | 14,819,991 | |
| United States Treasury Inflation Indexed Bonds | | | | | | | | |
| 1.88%, 07/15/2034 | | | 7,143,986 | | | | 7,112,619 | |
| 2.13%, 02/15/2054 | | | 6,767,918 | | | | 6,724,013 | |
| Total U.S. Treasury Bonds | | | | | | | 567,061,709 | |
| TOTAL GOVERNMENT BONDS | | | | | | | | |
| (Cost $563,984,746) | | | | | | | 567,061,709 | |
| | | | | | | | | |
| | | Shares | | | Value
(Note 2) | |
| PREFERRED STOCK (2.44%) | | | | | | | | |
| | | | | | | | | |
| Energy (0.14%) | | | | | | | | |
| Pipeline (0.14%) | | | | | | | | |
| Energy Transfer LP, Series B, 6.625%(a)(f) | | | 600,000 | | | $ | 593,808 | |
| Energy Transfer LP, Series F, 5Y US TI + 5.134%(a)(f) | | | 1,250,000 | | | | 1,254,313 | |
| Total Energy | | | | | | | 1,848,121 | |
| | | | | | | | | |
| Financials (1.46%) | | | | | | | | |
| Banks (0.37%) | | | | | | | | |
| Bank of Hawaii., 8.000%(f) | | | 58,866 | | | | 1,565,836 | |
13 | November 30, 2024
ALPS | Smith Core Plus Bond ETF
| Schedule of Investments | November 30, 2024 |
| | | Shares | | | Value
(Note 2) | |
| Wells Fargo & Co., Series U, 5.875%(a)(f) | | | 3,108,000 | | | $ | 3,108,579 | |
| | | | | | | | 4,674,415 | |
| | | | | | | | | |
| Consumer Finance (0.10%) | | | | | | | | |
| American Express Co., 5Y US TI + 2.854%(a)(f) | | | 1,317,000 | | | | 1,260,821 | |
| | | | | | | | | |
| Diversified Banks (0.25%) | | | | | | | | |
| HSBC Holdings PLC, 5Y US TI + 3.298%(a)(f) | | | 1,589,000 | | | | 1,594,496 | |
| HSBC Holdings PLC, 5Y US TI + 3.191%(a)(f) | | | 1,589,000 | | | | 1,601,010 | |
| | | | | | | | | |
| Financial Services (0.50%) | | | | | | | | |
| Charles Schwab Corp., Series G, 5Y US TI + 4.971%(a)(f) | | | 4,619,000 | | | | 4,613,291 | |
| Goldman Sachs Group, Inc., Series Y, 10Y US TI + 2.40%(a)(f) | | | 670,000 | | | | 672,662 | |
| Goldman Sachs Group, Inc., Series X, 5Y US TI + 2.809%(a)(f) | | | 1,159,000 | | | | 1,215,683 | |
| | | | | | | | 6,501,636 | |
| | | | | | | | | |
| Life Insurance (0.24%) | | | | | | | | |
| Jackson Financial, Inc., 5Y US TI + 3.728%(a)(f) | | | 21,475 | | | | 589,918 | |
| Prudential Financial, Inc., 3M CME TERM SOFR + 3.031%(a) | | | 2,495,000 | | | | 2,492,375 | |
| | | | | | | | 3,082,293 | |
| | | | | | | | | |
| Total Financials | | | | | | | 18,714,671 | |
| | | | | | | | | |
| Government (0.51%) | | | | | | | | |
| Government Agencies (0.51%) | | | | | | | | |
| CoBank ACB(f)(g) | | | 2,545,000 | | | | 2,592,550 | |
| Farm Credit Bank of Texas, Series 4, 5Y US TI + 5.415%(a)(d)(f) | | | 2,910,000 | | | | 2,899,960 | |
| Farm Credit Bank of Texas, 5Y US TI + 3.291%(a)(f) | | | 1,008,000 | | | | 1,055,814 | |
| | | | | | | | 6,548,324 | |
| | | | | | | | | |
| Total Government | | | | | | | 6,548,324 | |
| | | | | | | | | |
| Utilities (0.33%) | | | | | | | | |
| Utilities (0.33%) | | | | | | | | |
| Entergy Corp., 5Y US TI + 2.67%(a) | | | 1,258,000 | | | | 1,293,399 | |
| National Rural Utilities Cooperative Finance Corp., 3M CME TERM SOFR + 3.172%(a) | | | 1,200,000 | | | | 1,200,160 | |
| National Rural Utilities Cooperative Finance Corp., | | | | | | | | |
| 5Y US TI + 3.533%(a) | | | 300,000 | | | | 313,176 | |
| | | | | | Shares | | | Value
(Note 2) | |
| Sempra, 5Y US TI + 2.868%(a) | | | 1,559,000 | | | $ | 1,484,590 | |
| | | | | | | | | | | | 4,291,325 | |
| | | | | | | | | | | | | |
| Total Utilities | | | | | | | 4,291,325 | |
| | | | | | | | | | | | | |
| TOTAL PREFERRED STOCK | | | | | | | | |
| (Cost $30,910,216) | | | | | | | 31,402,441 | |
| | | | | | | | | | | | | |
| | | 7-Day
Yield | | | Shares | | | Value
(Note 2) | |
| SHORT TERM INVESTMENTS (0.06%) | | | | |
| | | | | | | | | | | | | |
| Money Market Fund (0.06%) | | | | | | | | | | | | |
| Morgan Stanley Institutional Liquidity Funds - Government Portfolio | | | 4.58 | % | | | 763,875 | | | | 763,875 | |
| | | | | | | | | | | | | |
| TOTAL SHORT TERM INVESTMENTS | | | | |
| (Cost $763,875) | | | 763,875 | |
| | | | | | | | | | | | | |
| TOTAL INVESTMENTS (98.70%) | | | | |
| (Cost $1,262,971,364) | | $ | 1,272,634,945 | |
| | | | | | | | | | | | | |
| Other Assets In Excess Of Liabilities (1.30%) | | | 16,719,903 | |
| | | | | | | | | | | | | |
| NET ASSETS (100.00%) | | $ | 1,289,354,848 | |
Investment Abbreviations:
SOFR - Secured Overnight Financing Rate
TI - Treasury Index
SOFRINDX - US SOFR Secured Overnight Financing Rate Compounded Index
Reference Rates:
1D US SOFR - 1 Day SOFR as of November 30, 2024 was 4.59%
10Y US TI - 10 Year US TI as of November 30, 2024 was 4.18%
30D US SOFR - 30 Day SOFR as of November 30, 2024 was 4.67%
1M US SOFR - 1 Month SOFR as of November 30, 2024 was 4.53%
1M CME TERM SOFR – 1 Month CME TERM SOFR as of November 30, 2024 was 4.53%
3M US SOFR - 3 Month SOFR as of November 30, 2024 was 4.47%
3M CME TERM SOFR – 3 Month CME TERM SOFR as of November 30, 2024 was 4.47%
1Y US TI - 1 Year US Treasury Bill as of November 30, 2024 was 4.30%
5Y US TI - 5 Year US TI as of November 30, 2024 was 4.05%
14 | November 30, 2024
ALPS | Smith Core Plus Bond ETF
| Schedule of Investments | November 30, 2024 |
| (a) | Floating or variable rate security. The reference rate is described above. The rate in effect as of November 30, 2024 is based on the reference rate plus the displayed spread as of the security's last reset date. |
| (b) | Interest only security. |
| (c) | Issued with zero coupon. |
| (d) | Security exempt from registration under Rule 144A of the Securities Act of 1933. These securities may be resold in transactions exempt from registration, normally to qualified institutional buyers. As of November 30, 2024, the aggregate market value of those securities was $161,077,266, representing 12.49% of net assets. |
| (e) | The SOFRINDX is a compounded average of the daily Secured Overnight Financing Rate determined by reference to the SOFR Index for any interest period. |
| (f) | Perpetual maturity. This security has no contractual maturity date, is not redeemable and contractually pays an indefinite stream of interest. |
| (g) | Non-Income Producing Security. |
See Notes to Financial Statements and Financial Highlights.
15 | November 30, 2024
ALPS | Smith Core Plus Bond ETF
| Statement of Assets and Liabilities | November 30, 2024 |
| ASSETS: | | | |
| Investments, at value | | $ | 1,272,634,945 | |
| Cash | | | 108,934 | |
| Receivable for investments sold | | | 49,009 | |
| Interest receivable | | | 11,222,986 | |
| Receivable for shares sold | | | 14,239,793 | |
| Total Assets | | | 1,298,255,667 | |
| | | | | |
| LIABILITIES: | | | | |
| Payable for investments purchased | | | 8,332,603 | |
| Payable to adviser | | | 568,216 | |
| Total Liabilities | | | 8,900,819 | |
| NET ASSETS | | $ | 1,289,354,848 | |
| | | | | |
| NET ASSETS CONSIST OF: | | | | |
| Paid-in capital | | $ | 1,279,570,680 | |
| Total distributable earnings/(accumulated losses) | | | 9,784,168 | |
| NET ASSETS | | $ | 1,289,354,848 | |
| | | | | |
| INVESTMENTS, AT COST | | $ | 1,262,971,364 | |
| | | | | |
| PRICING OF SHARES | | | | |
| Net Assets | | $ | 1,289,354,848 | |
| Shares of beneficial interest outstanding (Unlimited number of shares authorized, par value $0.01 per share) | | | 49,800,000 | |
| Net Asset Value, offering and redemption price per share | | $ | 25.89 | |
See Notes to Financial Statements and Financial Highlights.
ALPS | Smith Core Plus Bond ETF
| Statement of Operations | For the Period December 05, 2023 |
| | (Commencement of Operations) to November 30, 2024 |
| INVESTMENT INCOME: | | | |
| Interest | | $ | 33,125,791 | |
| Dividend Income* | | | 867,945 | |
| Total investment income | | | 33,993,736 | |
| | | | | |
| EXPENSES: | | | | |
| Investment adviser fees | | | 3,886,637 | |
| Other expenses | | | 26,547 | |
| Net expenses | | | 3,913,184 | |
| NET INVESTMENT INCOME | | | 30,080,552 | |
| | | | | |
| REALIZED AND UNREALIZED GAIN/(LOSS): | | | | |
| Net realized gain on investments | | | 178,500 | |
| Net change in unrealized appreciation on investments | | | 9,663,581 | |
| NET REALIZED AND UNREALIZED GAIN ON INVESTMENTS | | | 9,842,081 | |
| NET INCREASE IN NET ASSETS RESULTING FROM OPERATIONS | | $ | 39,922,633 | |
| * | Net of foreign tax withholding of $555. |
See Notes to Financial Statements and Financial Highlights.
ALPS | Smith Core Plus Bond ETF
| Statement of Changes in Net Assets | |
| | | For the Period
December 05,
2023
(Commencement
of Operations)
to November 30,
2024 | |
| OPERATIONS: | | | |
| Net investment income | | $ | 30,080,552 | |
| Net realized gain | | | 178,500 | |
| Net change in unrealized appreciation | | | 9,663,581 | |
| Net increase in net assets resulting from operations | | | 39,922,633 | |
| | | | | |
| DISTRIBUTIONS TO SHAREHOLDERS: | | | | |
| From distributable earnings | | | (30,138,720 | ) |
| Total distributions | | | (30,138,720 | ) |
| | | | | |
| CAPITAL SHARE TRANSACTIONS: | | | | |
| Proceeds from sale of shares | | | 1,279,570,935 | |
| Net increase from capital share transactions | | | 1,279,570,935 | |
| Net increase in net assets | | | 1,289,354,848 | |
| | | | | |
| NET ASSETS: | | | | |
| Beginning of period | | | – | |
| End of period | | $ | 1,289,354,848 | |
| | | | | |
| OTHER INFORMATION: | | | | |
| CAPITAL SHARE TRANSACTIONS: | | | | |
| Beginning shares | | | – | |
| Shares sold | | | 49,800,000 | |
| Shares redeemed | | | – | |
| Shares outstanding, end of period | | | 49,800,000 | |
See Notes to Financial Statements and Financial Highlights.
ALPS | Smith Core Plus Bond ETF
| Financial Highlights | For a Share Outstanding Throughout the Periods Presented |
| | | For the Period
December 05,
2023
(Commencement
of Operations) to
November 30,
2024 | |
| NET ASSET VALUE, BEGINNING OF PERIOD | | $ | 25.00 | |
| | | | | |
| INCOME FROM OPERATIONS: | | | | |
| Net investment income(a) | | | 1.15 | |
| Net realized and unrealized gain | | | 0.84 | |
| Total from investment operations | | | 1.99 | |
| | | | | |
| DISTRIBUTIONS: | | | | |
| From net investment income | | | (1.10 | ) |
| Total distributions | | | (1.10 | ) |
| | | | | |
| NET INCREASE IN NET ASSET VALUE | | | 0.89 | |
| NET ASSET VALUE, END OF PERIOD | | $ | 25.89 | |
| TOTAL RETURN(b) | | | 8.08 | % |
| | | | | |
| RATIOS/SUPPLEMENTAL DATA: | | | | |
| Net assets, end of period (in 000s) | | $ | 1,289,355 | |
| | | | | |
| RATIOS TO AVERAGE NET ASSETS | | | | |
| Ratio of expenses to average net assets | | | 0.59% | (c) |
| Ratio of net investment income to average net assets | | | 4.57% | (c) |
| Portfolio turnover rate(d) | | | 169 | % |
| (a) | Based on average shares outstanding during the period. |
| (b) | Total return is calculated assuming an initial investment made at the net asset value at the beginning of the period and redemption at the net asset value on the last day of the period and assuming all distributions are reinvested at the reinvestment prices. Total return calculated for a period of less than one year is not annualized. |
| (d) | Portfolio turnover for periods less than one year are not annualized and does not include securities received or delivered from processing creations or redemptions in-kind. |
See Notes to Financial Statements and Financial Highlights.
| ALPS | Smith Core Plus Bond ETF | |
| Notes to Financial Statements and Financial Highlights | November 30, 2024 |
1. ORGANIZATION
ALPS ETF Trust (the “Trust”), a Delaware statutory trust, is an open-end management investment company registered under the Investment Company Act of 1940, as amended (the “1940 Act”). As of November 30, 2024, the Trust consisted of twenty-three separate portfolios. Each portfolio represents a separate series of the Trust. This report pertains solely to the ALPS | Smith Core Plus Bond ETF (the “Fund”). The investment objective of the Fund is to seek above average total return from a combination of current income and capital appreciation. The Fund has elected to qualify as a diversified series of the Trust under the 1940 Act.
The Fund’s Shares (“Shares”) are listed on the NYSE Arca, Inc. (the “NYSE Arca”). The Fund issues and redeems Shares, at net asset value (“NAV”) in blocks of 25,000 Shares, each of which is called a “Creation Unit”. The Fund primarily effects creations and redemptions partly or wholly for cash, rather than in-kind. Except when aggregated in Creation Units, Shares are not redeemable securities of the Fund.
Pursuant to the Trust’s organizational documents, its Officers and Trustees are indemnified against certain liability arising out of the performance of their duties to the Trust. Additionally, in the normal course of business, the Trust enters into contracts with service providers that contain general indemnification clauses. The Trust’s maximum exposure under these arrangements is unknown, as this would involve future claims that may be made against the Trust that have not yet occurred.
2. SIGNIFICANT ACCOUNTING POLICIES
The following is a summary of significant accounting policies consistently followed by the Fund in the preparation of the financial statements. The accompanying financial statements were prepared in accordance with accounting principles generally accepted in the United States of America (“U.S. GAAP”). The preparation of financial statements in conformity with U.S. GAAP requires management to make certain estimates and assumptions that affect the reported amounts of assets and liabilities and disclosures of contingent assets and liabilities at the date of the financial statements and the reported amounts of revenue and expenses during the period. Actual results could differ from those estimates. The Fund is considered an investment company under U.S. GAAP and follows the accounting and reporting guidance applicable to investment companies in the Financial Accounting Standards Board (“FASB”) Accounting Standards Codification Topic 946.
A. Portfolio Valuation
The Fund’s NAV is determined daily, as of the close of regular trading on the New York Stock Exchange (the “NYSE”), normally 4:00 p.m. Eastern Time, on each day the NYSE is open for trading. The NAV is computed by dividing the value of all assets of the Fund (including accrued interest and dividends), less all liabilities (including accrued expenses and dividends declared but unpaid), by the total number of shares outstanding.
Portfolio securities listed on any exchange other than the NASDAQ Stock Market LLC (“NASDAQ”) are valued at the last sale price on the business day as of which such value is being determined. If there has been no sale on such day, the securities are valued at the mean of the most recent bid and ask prices on such day. Securities traded on the NASDAQ are valued at the NASDAQ Official Closing Price as determined by NASDAQ. Portfolio securities traded on more than one securities exchange are valued at the last sale price on the business day as of which such value is being determined at the close of the exchange representing the principal market for such securities. Portfolio securities traded in the over-the-counter market, but excluding securities traded on the NASDAQ, are valued at the last quoted sale price in such market.
The market price for debt securities is generally the evaluated price supplied by an independent third-party pricing service approved by the Trust’s Board of Trustees (the “Board”), which references a combination of transactions and quotations for the same or other securities believed to be comparable in quality, coupon, maturity, type of issue, call provisions, trading characteristics and other features deemed to be relevant. To the extent the Fund’s debt securities are valued based on price quotations or other equivalent indications of value provided by a third-party pricing service, any such third-party pricing service may use a variety of methodologies to value some or all of the Fund’s debt securities to determine the market price.
The Fund’s investments are valued at market value or, in the absence of market value with respect to any portfolio securities, at fair value according to procedures adopted by the Board. Pursuant to Rule 2a-5 under the 1940 Act, the Board designated ALPS Advisors, Inc. (the “Adviser”) as the valuation designee (“Valuation Designee”) for the Fund to perform the fair value determinations relating to all Fund investments. The Adviser may carry out its designated responsibilities as Valuation Designee through various teams and committees. When market quotations are not readily available or when events occur that make established valuation methods unreliable, securities of the Fund may be valued in good faith by the Valuation Designee. These securities generally include, but are not limited to, restricted securities (securities which may not be publicly sold without registration under the Securities Act of 1933) for which a pricing service is unable to provide a market price; securities whose trading has been formally suspended; a security whose market price is not available from a pre-established primary pricing source or the pricing source is not willing to provide a price; a security with respect to which an event has occurred that is most likely to materially affect the value of the security after the market has closed but before the calculation of the Fund’s NAV or make it difficult or impossible to obtain a reliable market quotation; or a security whose price, as provided by the pricing service, does not reflect the security’s “fair value” due to the security being de-listed from a national exchange or the security’s primary trading market is temporarily closed at a time when, under normal conditions, it would be open. As a general principle, the current “fair value” of a security would be the amount which the owner might reasonably expect to receive from the sale on the applicable exchange or principal market. A variety of factors may be considered in determining the fair value of such securities.
| ALPS | Smith Core Plus Bond ETF | |
| Notes to Financial Statements and Financial Highlights | November 30, 2024 |
B. Fair Value Measurements
The Fund discloses the classification of its fair value measurements following a three-tier hierarchy based on the inputs used to measure fair value. Inputs refer broadly to the assumptions that market participants would use in pricing the asset or liability, including assumptions about risk. Inputs may be observable or unobservable. Observable inputs reflect the assumptions market participants would use in pricing the asset or liability that are developed based on market data obtained from sources independent of the reporting entity. Unobservable inputs reflect the reporting entity’s own assumptions about the assumptions market participants would use in pricing the asset or liability that are developed based on the best information available.
Valuation techniques used to value the Fund’s investments by major category are as follows:
Equity securities, including restricted securities, for which market quotations are readily available, are valued at the last reported sale price or official closing price as reported by a third party pricing vendor on the primary market or exchange on which they are traded and are categorized as Level 1 in the hierarchy. In the event there were no sales during the day or closing prices are not available, securities are valued at the mean of the most recent quoted bid and ask prices on such day and are generally categorized as Level 2 in the hierarchy. Investments in open-end mutual funds are valued at their closing NAV each business day and are categorized as Level 1 in the hierarchy.
Debt securities, including restricted securities, are valued based on evaluated prices received from third party pricing vendors or from brokers who make markets in such securities. For municipal bonds, pricing vendors utilize matrix pricing which considers yield or price of bonds of comparable quality, coupon, maturity and type as well as broker-supplied prices. When independent prices are unavailable or unreliable, debt securities may be valued utilizing pricing methodologies which consider similar factors that would be used by third party pricing vendors. Debt securities are generally categorized as Level 2 in the hierarchy but may be Level 3 depending on the circumstances.
Changes in valuation techniques may result in transfers in or out of an assigned level within the disclosure hierarchy.
Various inputs are used in determining the value of the Fund’s investments as of the end of the reporting period. When inputs used fall into different levels of the fair value hierarchy, the level in the hierarchy within which the fair value measurement falls is determined based on the lowest level input that is significant to the fair value measurement in its entirety. The designated input levels are not necessarily an indication of the risk or liquidity associated with these investments.
These inputs are categorized in the following hierarchy under applicable financial accounting standards:
| Level 1 – | Unadjusted quoted prices in active markets for identical investments, unrestricted assets or liabilities that a Fund has the ability to access at the measurement date; |
| Level 2 – | Quoted prices which are not active, quoted prices for similar assets or liabilities in active markets or inputs other than quoted prices that are observable (either directly or indirectly) for substantially the full term of the asset or liability; and |
| Level 3 – | Significant unobservable prices or inputs (including the Fund’s own assumptions in determining the fair value of investments) where there is little or no market activity for the asset or liability at the measurement date. |
| ALPS | Smith Core Plus Bond ETF | |
| Notes to Financial Statements and Financial Highlights | November 30, 2024 |
The following is a summary of the inputs used to value the Fund’s investments as of November 30, 2024:
| Investments in Securities at Value | | Level 1 - Unadjusted
Quoted Prices | | | Level 2 - Other Significant
Observable Inputs | | | Level 3 - Significant
Unobservable Inputs | | | Total | |
| ALPS | Smith Core Plus Bond ETF | | | | | | | | | | | | | | | | |
| Bank Loans | | $ | – | | | $ | 25,038,499 | | | $ | – | | | $ | 25,038,499 | |
| Collateralized Mortgage Obligations | | | – | | | | 54,782,362 | | | | – | | | | 54,782,362 | |
| Commercial Mortgage-Backed Securities | | | – | | | | 8,433,746 | | | | – | | | | 8,433,746 | |
| Mortgage-Backed Securities | | | – | | | | 176,873,751 | | | | – | | | | 176,873,751 | |
| Corporate Bonds | | | 682,452 | | | | 407,596,110 | | | | – | | | | 408,278,562 | |
| Government Bonds | | | – | | | | 567,061,709 | | | | – | | | | 567,061,709 | |
| Preferred Stock | | | 2,155,754 | | | | 29,246,687 | | | | – | | | | 31,402,441 | |
| Short Term Investments | | | 763,875 | | | | – | | | | – | | | | 763,875 | |
| Total | | $ | 3,602,081 | | | $ | 1,269,032,864 | | | $ | – | | | $ | 1,272,634,945 | |
| * | For a detailed breakdown of sectors, see the accompanying Schedule of Investments. |
The Fund did not have any securities that used significant unobservable inputs (Level 3) in determining fair value and there were no transfers into or out of Level 3 during the period ended November 30, 2024.
C. Securities Transactions and Investment Income
Securities transactions are recorded as of the trade date. Realized gains and losses from securities transactions are recorded on the specific identification in accordance with GAAP. Dividend income and capital gains distributions, if any, are recorded on the ex-dividend date. Interest income, if any, is recorded on the accrual basis, including amortization of premiums and accretion of discounts.
D. Dividends and Distributions to Shareholders
Dividends from net investment income of the Fund, if any, are declared and paid monthly or as the Board may determine from time to time. Distributions of net realized capital gains earned by the Fund, if any, are distributed at least annually.
E. Federal Tax and Tax Basis Information
The timing and character of income and capital gain distributions are determined in accordance with income tax regulations, which may differ from U.S. GAAP. Reclassifications are made to the Fund’s capital accounts for permanent tax differences to reflect income and gains available for distribution (or available capital loss carryforwards) under income tax regulations.
For the period ended November 30, 2024, the following reclassifications, which had no impact on results of operations or net assets, were recorded to reflect permanent tax differences resulting primarily from the Fund’s 2023 excise tax:
| Fund | | Paid-in Capital | | | Total Distributable
Earnings/(Accumulated
Losses) | |
| ALPS | Smith Core Plus Bond ETF | | $ | (255 | ) | | $ | 255 | |
The tax character of the distributions paid during the period ended November 30, 2024 was as follows:
| Fund | | Ordinary Income | | | Long-Term Capital Gain | | | Return of Capital | |
| November 30, 2024 | | | | | | | | | | | | |
| ALPS | Smith Core Plus Bond ETF | | $ | 30,138,720 | | | $ | – | | | $ | – | |
The character of distributions made during the year may differ from its ultimate characterization for federal income tax purposes.
Under current law, capital losses maintain their character as short-term or long-term and are carried forward to the next tax year without expiration. As of November 30, 2024, the Fund did not have available capital losses to carry forward to the next tax year.
| ALPS | Smith Core Plus Bond ETF | |
| Notes to Financial Statements and Financial Highlights | November 30, 2024 |
As of November 30, 2024, the components of distributable earnings/(accumulated losses) on a tax basis were as follows:
| | | ALPS | Smith Core Plus
Bond ETF | |
| Accumulated net investment income | | $ | 2,587,213 | |
| Net unrealized appreciation on investments | | | 7,196,955 | |
| Total | | $ | 9,784,168 | |
As of November 30, 2024, the cost of investments for federal income tax purposes and accumulated net unrealized appreciation/(depreciation) on investments were as follows:
| | | ALPS | Smith Core Plus
Bond ETF | |
| Gross appreciation (excess of value over tax cost) | | $ | 10,484,085 | |
| Gross depreciation (excess of tax cost over value) | | | (3,287,130 | ) |
| Net unrealized appreciation/(depreciation) | | $ | 7,196,955 | |
| Cost of investments for income tax purposes | | $ | 1,265,437,990 | |
The differences between book-basis and tax-basis are primarily due to the deferral of losses from wash sales.
G. Income Taxes
No provision for income taxes is included in the accompanying financial statements, as the Fund intends to distribute to shareholders all taxable investment income and realized gains and otherwise comply with Subchapter M of the Internal Revenue Code of 1986, as amended, applicable to regulated investment companies. The Fund evaluates tax positions taken (or expected to be taken) in the course of preparing the Fund’s tax returns to determine whether these positions meet a “more-likely-than-not” standard that, based on the technical merits, have a more than fifty percent likelihood of being sustained by a taxing authority upon examination. A tax position that meets the “more-likely-than-not” recognition threshold is measured to determine the amount of benefit to recognize in the financial statements.
As of and during the period ended November 30, 2024, the Fund did not have a liability for any unrecognized tax benefits. The Fund files U.S. federal, state, and local tax returns as required. The Fund’s tax returns are subject to examination by the relevant tax authorities until expiration of the applicable statute of limitations, which is generally three years after the filing of the tax return, but may extend to four years in certain jurisdictions.
3. INVESTMENT ADVISORY FEE AND OTHER AFFILIATED TRANSACTIONS
ALPS Advisors, Inc. serves as the Fund’s investment adviser pursuant to an Investment Advisory Agreement with the Trust on behalf of the Fund (the “Advisory Agreement”). Pursuant to the Advisory Agreement, the Fund pays the Adviser an annual management fee for the services and facilities it provides, payable on a monthly basis at the annual rate of 0.59% of the Fund’s average daily net assets.
Out of the unitary management fee, the Adviser pays substantially all expenses of the Fund, including the cost of sub-advisory, transfer agency, custody, fund administration, legal, audit, trustees and other services, except for acquired fund fees and expenses, interest expenses, distribution fees or expenses, brokerage expenses, taxes and extraordinary expenses not incurred in the ordinary course of the Fund’s business. The Adviser’s unitary management fee is designed to pay substantially all of the Fund’s expenses and to compensate the Adviser for providing services to the Fund.
Smith Capital Investors, LLC (the “Sub-Adviser”) serves as the Fund’s sub-adviser pursuant to a sub-advisory agreement with the Trust (the ‘‘Sub-Advisory Agreement’’). Pursuant to the Sub-Advisory Agreement, the Adviser pays the Sub-Adviser a sub-advisory fee out of the Adviser’s advisory fee for the services it provides. The fee is payable on a monthly basis at the annual rate of 0.30% of the Fund’s average daily net assets.
ALPS Fund Services, Inc., an affiliate of the Adviser, is the administrator of the Fund.
Each Trustee receives (1) a quarterly retainer of $25,000, (2) a per meeting fee of $15,000, (3) $2,500 for any special meeting held outside of a regularly scheduled board meeting, and (4) reimbursement for all reasonable out-of-pocket expenses relating to attendance at meetings. In addition, the Chairman of the Board receives a quarterly retainer of $5,000, the Chairman of the Audit Committee receives a quarterly retainer of $3,000, and the Chairman of the Nominating & Governance Committee receives a quarterly retainer of $2,000, each in connection with their respective roles.
| ALPS | Smith Core Plus Bond ETF | |
| Notes to Financial Statements and Financial Highlights | November 30, 2024 |
4. PURCHASES AND SALES OF SECURITIES
For the period ended November 30, 2024, the cost of purchases and proceeds from sales of investment securities, excluding short-term investments and in-kind transactions, were as follows:
| Fund | | Purchases | | | Sales | |
| ALPS | Smith Core Plus Bond ETF | | $ | 2,472,536,893 | | | $ | 1,177,257,304 | |
For the period ended November 30, 2024, the cost of U.S. Government security purchases and proceeds from U.S. Government security sales were as follows:
| Fund | | Purchases | | | Sales | |
| ALPS | Smith Core Plus Bond ETF | | $ | 1,549,419,722 | | | $ | 983,587,695 | |
For the period ended November 30, 2024, there were no in-kind transactions or realized gain/(loss) on in-kind transactions
5. CAPITAL SHARE TRANSACTIONS
Shares are created and redeemed by the Fund only in Creation Unit size aggregations of 25,000 Shares. Only broker-dealers or large institutional investors with creation and redemption agreements called Authorized Participants (“AP”) are permitted to purchase or redeem Creation Units from the Fund. An additional variable charge for cash creations, redemptions, partial cash creations or partial cash redemptions may also be imposed to compensate the Fund for the costs associated with buying or selling the applicable securities.
6. MARKET RISK
The Fund is subject to investment and operational risks associated with financial, economic and other global market developments and disruptions, including those arising from war, terrorism, market manipulation, government interventions, defaults and shutdowns, political changes or diplomatic developments, public health emergencies (such as the spread of infectious diseases, pandemics and epidemics) and natural/environmental disasters, which can negatively impact the securities markets and cause the Fund to lose value. Securities in the Fund’s portfolio may underperform in comparison to securities in general financial markets, a particular financial market or other asset classes due to a number of factors, including inflation (or expectations for inflation), deflation (or expectations for deflation), interest rates, global demand for particular products or resources, market instability, debt crises and downgrades, embargoes, tariffs, sanctions and other trade barriers, regulatory events, other governmental trade or market control programs and related geopolitical events. In addition, the value of the Fund’s investments may be negatively affected by the occurrence of global events such as war, terrorism, environmental disasters, natural disasters or events, country instability, and infectious disease epidemics or pandemics.
7. SUBSEQUENT EVENTS
Subsequent events, if any, after the date of the Statement of Assets and Liabilities have been evaluated through the date the financial statements were issued. Management has determined that there were no subsequent events to report through the issuance of these financial statements.
| ALPS | Smith Core Plus Bond ETF |
| Report of Independent Registered Public Accounting Firm |
To the Shareholders of ALPS | Smith Core Plus Bond ETF
and Board of Trustees of ALPS ETF Trust
Opinion on the Financial Statements
We have audited the accompanying statement of assets and liabilities, including the schedule of investments, of ALPS | Smith Core Plus Bond ETF (the “Fund”), a series of ALPS ETF Trust, as of November 30, 2024, the related statements of operations and changes in net assets, and the financial highlights for the period December 5, 2023 (commencement of operations) through November 30, 2024, and the related notes (collectively referred to as the “financial statements”). In our opinion, the financial statements present fairly, in all material respects, the financial position of the Fund as of November 30, 2024, the results of its operations, changes in net assets, and the financial highlights for the period December 5, 2023 (commencement of operations), through November 30, 2024, in conformity with accounting principles generally accepted in the United States of America.
Basis for Opinion
These financial statements are the responsibility of the Fund’s management. Our responsibility is to express an opinion on the Fund’s financial statements based on our audit. We are a public accounting firm registered with the Public Company Accounting Oversight Board (United States) (“PCAOB”) and are required to be independent with respect to the Fund in accordance with the U.S. federal securities laws and the applicable rules and regulations of the Securities and Exchange Commission and the PCAOB.
We conducted our audit in accordance with the standards of the PCAOB. Those standards require that we plan and perform the audit to obtain reasonable assurance about whether the financial statements are free of material misstatement whether due to error or fraud.
Our audit included performing procedures to assess the risks of material misstatement of the financial statements, whether due to error or fraud, and performing procedures that respond to those risks. Such procedures included examining, on a test basis, evidence regarding the amounts and disclosures in the financial statements. Our procedures included confirmation of securities owned as of November 30, 2024, by correspondence with the custodian, brokers, and agent banks; when replies were not received from brokers and agent banks, we performed other auditing procedures. Our audit also included evaluating the accounting principles used and significant estimates made by management, as well as evaluating the overall presentation of the financial statements. We believe that our audit provides a reasonable basis for our opinion.
We have served as the auditor of one or more investment companies advised by ALPS Advisors, Inc. since 2013.

COHEN & COMPANY, LTD.
Philadelphia, Pennsylvania
January 29, 2025
| ALPS | Smith Core Plus Bond ETF | |
| Additional Information | November 30, 2024 (Unaudited) |
TAX INFORMATION
The ALPS | Smith Core Plus Bond ETF designates the following as a percentage of taxable ordinary income distributions, or up to the maximum amount allowable, for the calendar year ended December 31, 2023:
| Qualified Dividend Income | Dividend Received Deduction |
| ALPS | Smith Core Plus Bond ETF | 0% | 0% |
In early 2024, if applicable, shareholders of record received this information for the distributions paid to them by the Fund during the calendar year 2024 via Form 1099. The Fund will notify shareholders in early 2025 of amounts paid to them by the Fund, if any, during the calendar year 2024.
| ALPS | Smith Core Plus Bond ETF | |
Changes in and Disagreements with Accountants
for Open-End Management Investment Companies | November 30, 2024 (Unaudited) |
Not applicable for this reporting period.
| ALPS | Smith Core Plus Bond ETF | |
Proxy Disclosures for
Open-End Management Investment Companies | November 30, 2024 (Unaudited) |
A Special Meeting of Shareholders of the Funds, each a series of the Trust, was held on July 19, 2024. At the meeting, the following matters were voted on by the Shareholders. The results of the Special Meeting of Shareholders are noted below:
Proposal 1: To elect seven Trustees.
| | | Shares Voted in Favor | | Shares Voted Against/
Withheld or Abstentions | | Proposal Approved |
| Mary K. Anstine | | 223,143,090 | | 2,894,793 | | Yes |
| Edmund J. Burke | | 223,362,578 | | 2,672,643 | | Yes |
| Jeremy W. Deems | | 221,670,341 | | 4,361,535 | | Yes |
| Rick A. Pederson | | 213,137,140 | | 12,259,226 | | Yes |
| Joseph F. Keenan | | 223,547,500 | | 2,483,867 | | Yes |
| Susan K. Wold | | 223,460,006 | | 2,571,857 | | Yes |
| Laton Spahr | | 223,439,610 | | 2,593,995 | | Yes |
| ALPS | Smith Core Plus Bond ETF | |
Remuneration Paid to Directors, Officers, and
Others of Open-End Management Investment Companies | November 30, 2024 (Unaudited) |
The following chart provides certain information about the Trustee fees paid by the Trust for the year ended November 30, 2024:
| | | Aggregate Regular
Compensation From the Trust | | | Aggregate Special Compensation
From the Trust | | | Total Compensation From the Trust | |
| Mary K. Anstine, Trustee | | $ | 162,500 | | | $ | – | | | $ | 162,500 | |
| Edmund J. Burke, Trustee | | | 166,500 | | | | – | | | | 166,500 | |
| Jeremy W. Deems, Trustee | | | 174,500 | | | | – | | | | 174,500 | |
| Rick A. Pederson, Trustee | | | 186,500 | | | | – | | | | 186,500 | |
| Joseph F. Keenan, Trustee | | | 40,000 | | | | – | | | | 40,000 | |
| Susan K. Wold, Trustee | | | 40,000 | | | | – | | | | 40,000 | |
| Laton Spahr, President and Trustee* | | | – | | | | – | | | | – | |
| Total | | $ | 770,000 | | | $ | – | | | $ | 770,000 | |
| * | Mr. Spahr, the President of the Trust, is deemed an “interested person” by virtue of his position as an officer of the Trust and of ALPS Advisors, Inc. |
Officers who are employed by the Adviser receive no compensation or expense reimbursement from the Trust.
| ALPS | Smith Core Plus Bond ETF | |
Statement Regarding Basis for Approval of
Investment Advisory and Sub-Advisory Contract | November 30, 2024 (Unaudited) |
At its meetings held on June 3, 2024 and June 18, 2024, the Board of Trustees of the Trust (the “Board” or the “Trustees”), where each Trustee was not an "interested person" of the Trust within the meaning of the Investment Company Act of 1940, as amended (the “Independent Trustees”), evaluated a proposal to approve the continuance of (i) the Investment Advisory Agreement between the Trust and ALPS Advisors, Inc. (the “Adviser” or “AAI”) with respect to the ALPS | Smith Core Plus Bond ETF ("SMTH" or the "Fund") and (ii) the Investment Sub-Advisory Agreement between the Trust, AAI and Smith Capital Investors, LLC (the “Sub-Adviser” or “Smith Capital”) with respect to the Fund (the “Smith Capital Sub-Advisory Agreement”). In evaluating the renewal of the Investment Advisory Agreement with respect to the Fund, the Board, including the Independent Trustees considered various factors, including (i) the nature, extent and quality of the services provided by AAI with respect to the Fund under the Investment Advisory Agreement; (ii) the advisory fees and other expenses paid by the Fund compared to those of similar funds managed by other investment advisers; (iii) the costs of the services provided to the Fund by AAI and the profits realized by AAI and its affiliates from its relationship to the Fund; (iv) the extent to which economies of scale have been or would be realized if and as the assets of the Fund grow and whether fees reflect the economies of scale for the benefit of shareholders; and (v) any additional benefits and other considerations.
With respect to the nature, extent and quality of the services provided by AAI under the Investment Advisory Agreement, the Board considered and reviewed information concerning the services provided under the Investment Advisory Agreement, financial information regarding AAI and its parent company, information describing AAI’s current organization and the background and experience of the persons responsible for the day-to-day management of the Fund.
The Board reviewed information on the performance of the Fund and its applicable benchmark for the 3 month and since inception periods and against the appropriate FUSE performance universe. Based on this review, the Board, including the Independent Trustees found that the nature and extent of services provided to the Fund under the Investment Advisory Agreement was appropriate and that the quality of such services was satisfactory.
The Board noted that the advisory fees for the Fund were unitary fees pursuant to which AAI assumes all expenses of the Fund (including the cost of transfer agency, custody, fund administration, legal, audit and other services) other than the payments under the Advisory Agreement, brokerage expenses, taxes, interest, litigation expenses and other extraordinary expenses.
Based on the information available to them, including the Fund-specific summary set forth below, the Board, including the Independent Trustees concluded that the advisory fee rate for the Fund was reasonable under the circumstances and in light of the quality of the services provided.
The Board, including the Independent Trustees considered other benefits available to AAI because of its relationship with the Fund and concluded that the advisory fees were reasonable taking into account any such benefits.
The Board, including the Independent Trustees, also considered with respect to the Fund the information provided by AAI about the costs and profitability of AAI with respect to the Fund, including the asset levels and other factors that influence the profitability and financial viability of the Fund. The Board, including the Independent Trustees reviewed and noted the relatively small size of the Fund and the analysis AAI had conducted to support AAI’s assertion that it was not realizing any economies of scale with respect to the Fund. The Independent Trustees determined that AAI should continue to keep the Board informed on an ongoing basis of any significant developments (e.g., material increases in asset levels) so as to facilitate the Independent Trustees’ evaluation of whether further economies of scale have been achieved.
The Board, including the Independent Trustees, also considered other potential benefits available to AAI because of its relationship with the Fund, known as fall-out benefits.
With respect to the Fund, the Board, including the Independent Trustees, noted the following:
The gross management fee rate for SMTH is higher than the median of its FUSE expense group. SMTH’s net expense ratio is higher than the median of its FUSE expense group.
With respect to AAI profitability from SMTH, the Independent Trustees noted that current profitability levels were not unreasonable.
In voting to renew the Investment Advisory Agreement with AAI, the Board, including the Independent Trustees, concluded that the terms of the Investment Advisory Agreement are reasonable and fair in light of the services to be performed, the fees paid by certain other funds, expenses to be incurred and such other matters as the members of the Board, including the Independent Trustees, considered relevant in the exercise of their reasonable business judgment. The Independent Trustees did not identify any single factor or group of factors as all important or controlling and considered all factors together.
| ALPS | Smith Core Plus Bond ETF | |
Statement Regarding Basis for Approval of
Investment Advisory and Sub-Advisory Contract | November 30, 2024 (Unaudited) |
The Board, including the Independent Trustees, discussed the Smith Capital Sub-Advisory Agreement.
In evaluating the Smith Capital Sub-Advisory Agreement, the Board, including the Independent Trustees considered various factors, including (i) the nature, extent and quality of the services provided by Smith Capital with respect to SMTH under the Smith Capital Sub-Advisory Agreement; (ii) the advisory fees and other expenses paid by SMTH compared to those of similar funds managed by other investment advisers; (iii) the profitability to Smith Capital of its sub-advisory relationship with SMTH and the reasonableness of compensation to Smith Capital; (iv) the extent to which economies of scale would be realized if, and as, SMTH’s assets increase, and whether the fee level in the Smith Capital Sub-Advisory Agreement reflects these economies of scale; and (v) any additional benefits and other considerations.
With respect to the nature, extent and quality of the services provided by Smith Capital under the Smith Capital Sub-Advisory Agreement, the Board, including the Independent Trustees considered and reviewed information concerning the services provided under the Smith Capital Sub-Advisory Agreement, SMTH’s performance, financial information regarding Smith Capital, information describing Smith Capital’s current organization and the background and experience of the persons responsible for the day-to-day management of SMTH. Based upon their review, the Board, including the Independent Trustees concluded that Smith Capital was qualified to oversee the portfolio management of Smith Capital and that the services provided by Smith Capital to SMTH are satisfactory. The Board, including the Independent Trustees considered that the contractual sub-advisory fee to be paid to Smith Capital with respect to SMTH was 0.30% of SMTH’s average daily net assets out of a total management fee of 0.59% of SMTH’s average daily net assets.
In reviewing Smith Capital’s profitability with respect to SMTH, the Board, including the Independent Trustees considered the resources involved in managing SMTH.
The Board, including the Independent Trustees also considered other benefits that have been and may be realized by Smith Capital from its relationships with SMTH, known as fall-out benefits.
The Board, including the Independent Trustees considered the extent to which economies of scale may be realized if SMTH’s assets continue to grow in size and whether fee levels reflect a reasonable sharing of such economies of scale for the benefit of the Fund’s investors. The Board, including the Independent Trustees noted that SMTH commenced operations on December 5, 2023 and has not yet achieved scale in terms of assets. The Independent Trustees determined that AAI should continue to keep the Board informed on an ongoing basis of any significant developments (e.g., material increases in asset levels) so as to facilitate the Independent Trustees’ evaluation of whether further economies of scale have been achieved with respect to SMTH.
In voting to approve the Smith Capital Sub-Advisory Agreement, the Board, including the Independent Trustees concluded that the terms of the Smith Capital Sub-Advisory Agreement are reasonable and fair in light of the services performed, expenses incurred and such other matters as the Board, including the Independent Trustees considered relevant in the exercise of their reasonable business judgment. The Board, including the Independent Trustees did not identify any single factor or group of factors as all important or controlling and considered all factors together.

| Item 8. | Changes in and Disagreements with Accountants for Open-End Management Investment Companies. |
Changes in and Disagreements with Accountants is included as part of the Financial Statements and Financial Highlights filed under Item 7 of this Report.
| Item 9. | Proxy Disclosures for Open-End Management Investment Companies. |
| | |
| | Proxy Disclosures for Open-End Management Investment Companies is included as part of the Financial Statements and Financial Highlights filed under Item 7 of this Report. |
| Item 10. | Remuneration Paid to Directors, Officers, and Others of Open-End Management Investment Companies. |
Any Remuneration Paid to Directors, Officers, and Others is included as part of the Financial Statements and Financial Highlights filed under Item 7 of this Report.
| Item 11. | Statement Regarding Basis for Approval of Investment Advisory Contract. |
Statement Regarding Basis for Approval of Investment Advisory Contract is included as part of the Financial Statements and Financial Highlights filed under Item 7 of this Report..
| Item 12. | Disclosure of Proxy Voting Policies and Procedures for Closed-End Management Investment Companies. |
Not applicable.
| Item 13. | Portfolio Managers of Closed-End Management Investment Companies. |
Not applicable.
| Item 14. | Purchases of Equity Securities by Closed-End Management Investment Company and Affiliated Purchasers. |
Not applicable.
| Item 15. | Submission of Matters to a Vote of Security Holders. |
There have not been any material changes to the procedures by which shareholders may recommend nominees to the registrant’s board of directors, since those procedures were last disclosed in response to the requirements of Item 407(c)(2)(iv) of Regulation S-K or this Item.
| Item 16. | Controls and Procedures. |
| (a) | The Registrant’s principal executive officer and principal financial officer have concluded that the Registrant’s disclosure controls and procedures (as defined in Rule 30a-3(c) under the Investment Company Act of 1940, as amended) are effective based on their evaluation of these controls and procedures as of a date within 90 days of the filing date of this report. |
| (b) | There was no change in the Registrant's internal control over financial reporting (as defined in Rule 30a-3(d) under the Investment Company Act of 1940, as amended) during the period covered by this report that has materially affected, or is reasonably likely to materially affect, the Registrant's internal control over financial reporting. |
| Item 17. | Disclosure of Securities Lending Activities for Closed-End Management Investment Companies. |
Not applicable.
| Item 18. | Recovery of Erroneously Awarded Compensation. |
SIGNATURES
Pursuant to the requirements of the Securities Exchange Act of 1934 and the Investment Company Act of 1940, the Registrant has duly caused this report to be signed on its behalf by the undersigned, thereunto duly authorized.
ALPS ETF TRUST
| By: | /s/ Laton Spahr | |
| | Laton Spahr (Principal Executive Officer) | |
| | President | |
| | | |
| Date: | February 7, 2025 | |
Pursuant to the requirements of the Securities Exchange Act of 1934 and the Investment Company Act of 1940, this report has been signed below by the following persons on behalf of the Registrant and in the capacities and on the dates indicated.
| By: | /s/ Laton Spahr | |
| | Laton Spahr (Principal Executive Officer) | |
| | President | |
| | | |
| Date: | February 7, 2025 | |
| | | |
| By: | /s/ Erich Rettinger | |
| | Erich Rettinger (Principal Financial Officer) | |
| | Treasurer | |
| | | |
| Date: | February 7, 2025 | |