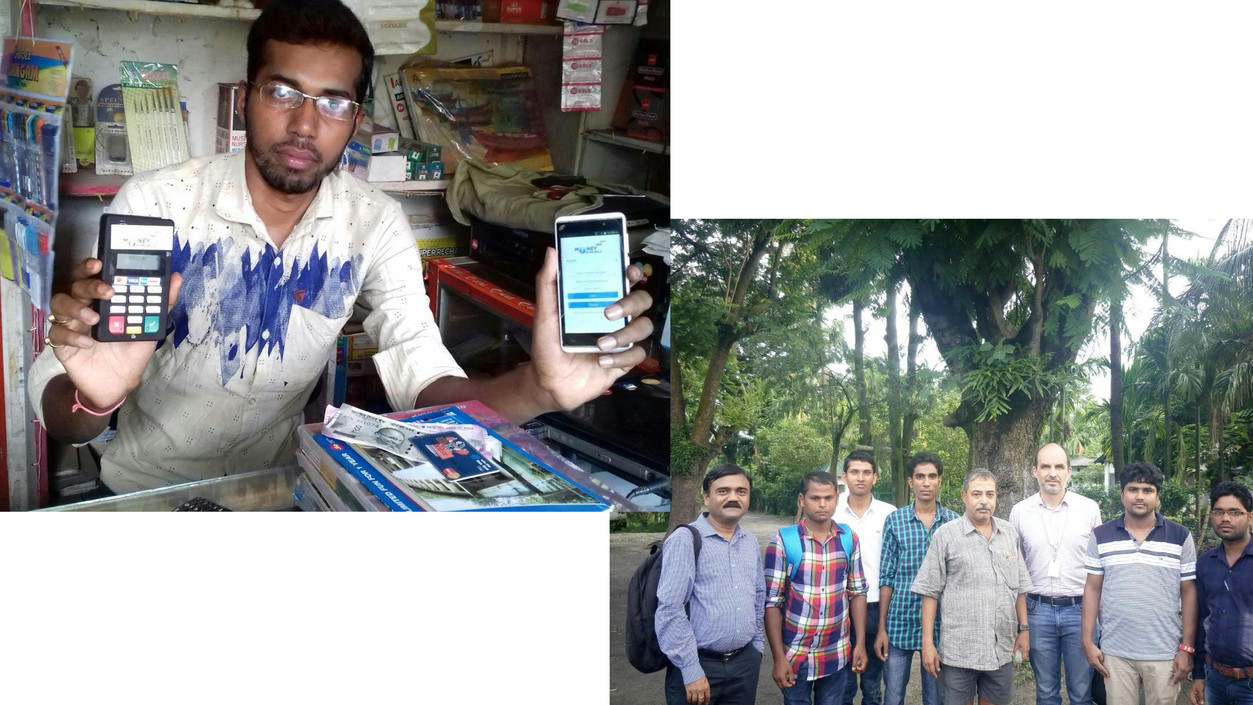
Q1 FY 2018 Earnings Call August 16th, 2017 DALLAS, TEXAS, USA OTCQX: MOMT | http://Investors.MoneyOnMobile.in
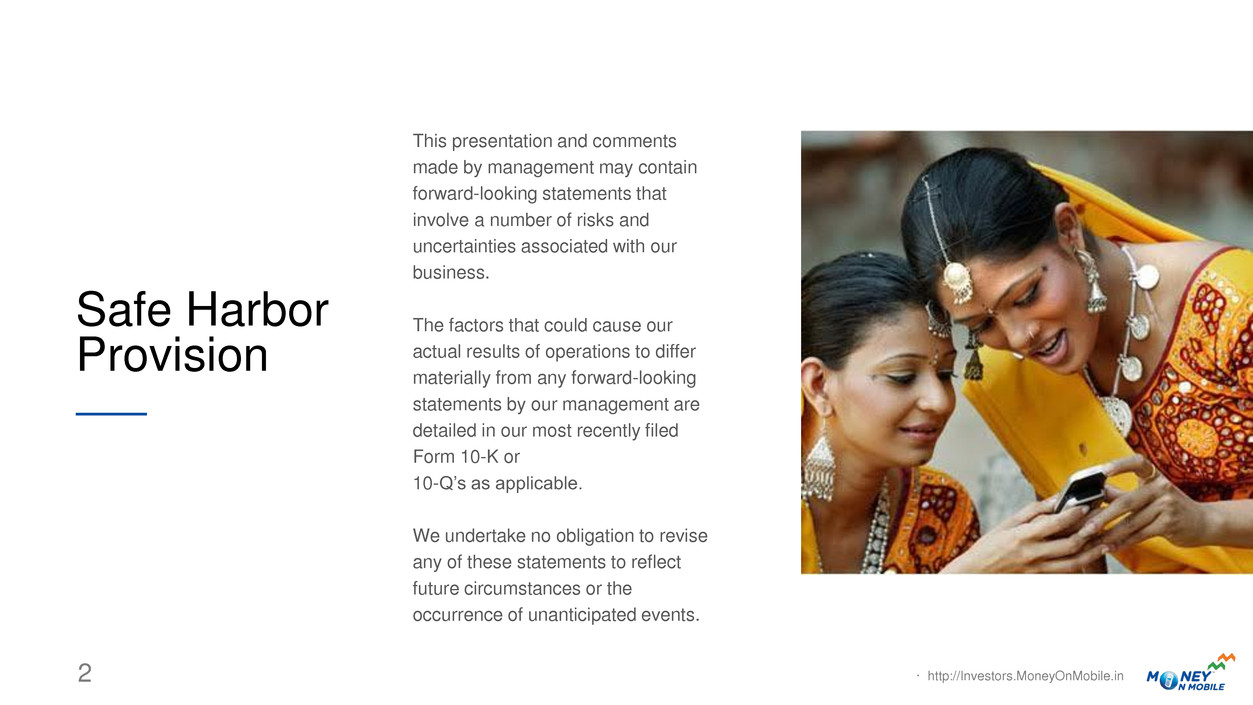
This presentation and comments made by management may contain forward-looking statements that involve a number of risks and uncertainties associated with our business. The factors that could cause our actual results of operations to differ materially from any forward-looking statements by our management are detailed in our most recently filed Form 10-K or 10-Q’s as applicable. We undertake no obligation to revise any of these statements to reflect future circumstances or the occurrence of unanticipated events. Safe Harbor Provision · http://Investors.MoneyOnMobile.in 2

Retailer Assisted Transactions ₹ CASH · http://Investors.MoneyOnMobile.in 3 Consumer A Needs to pay a bill or remit money across the country Retailer Uses MoneyOnMobile to perform financial transactions Consumer B Needs to withdraw cash from his bank account or payroll card ₹ CASH
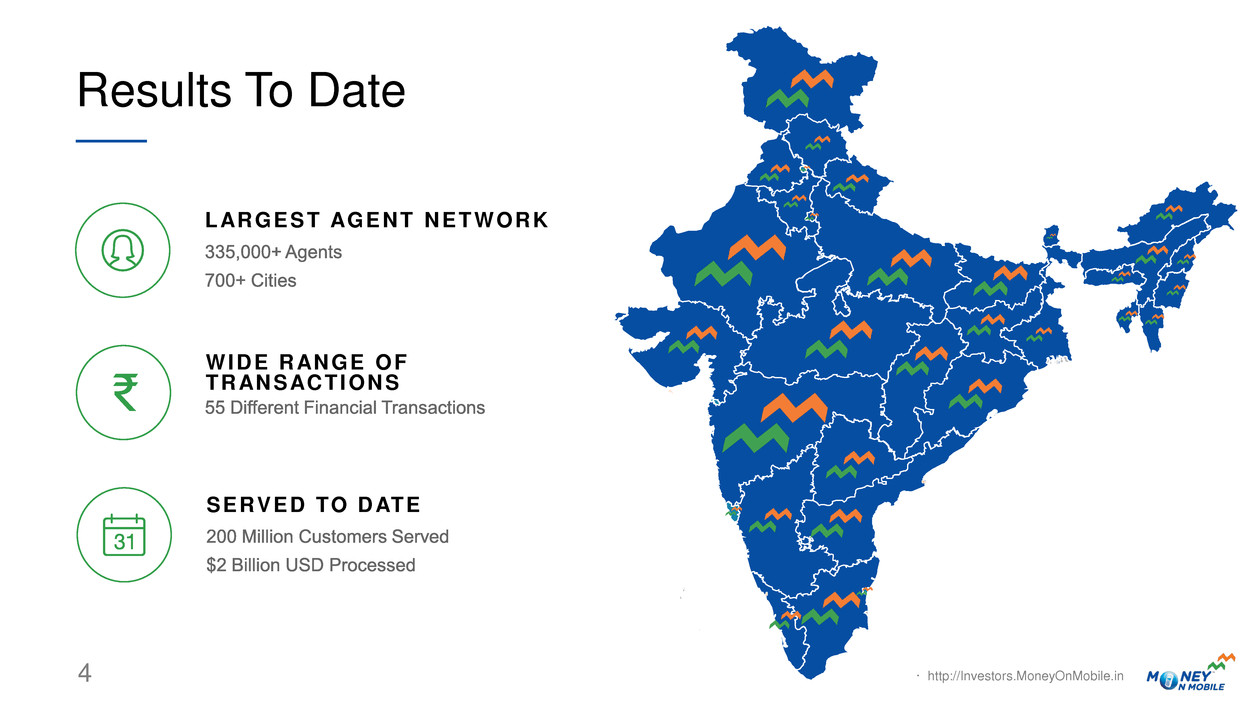
Results To Date LARGEST AGENT NETWORK SERVED TO DATE WIDE RANGE OF TRANSACTIONS ₹ · http://Investors.MoneyOnMobile.in 4
· http://Investors.MoneyOnMobile.in 5 ₹ 200 Million Mobile Numbers Served US$ 2 Billion Processed Volume Two Major Milestones
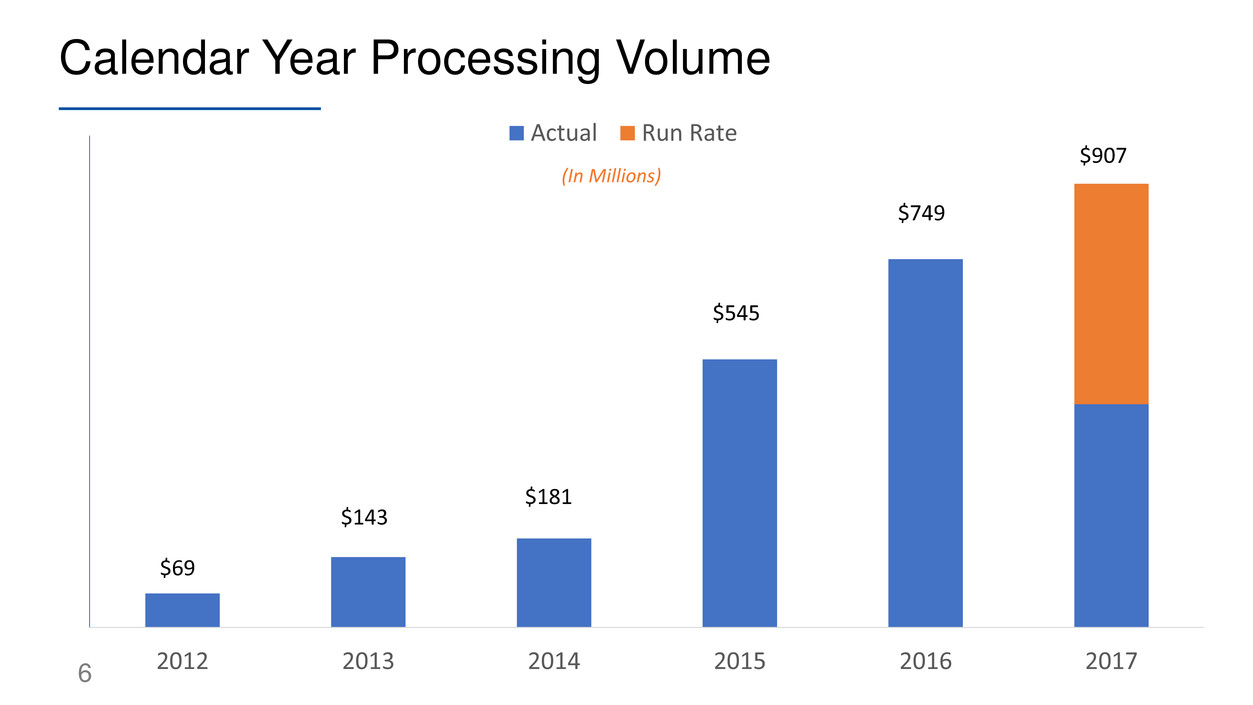
Calendar Year Processing Volume 2012 2013 2014 2015 2016 2017 Actual Run Rate $545 $181 $143 $749 $907 (In Millions) $69 6

Overview Margin Trend Selected Financial Overview Revenue Trend Change In Category Revenue http://Investors.MoneyOnMobile.in 7
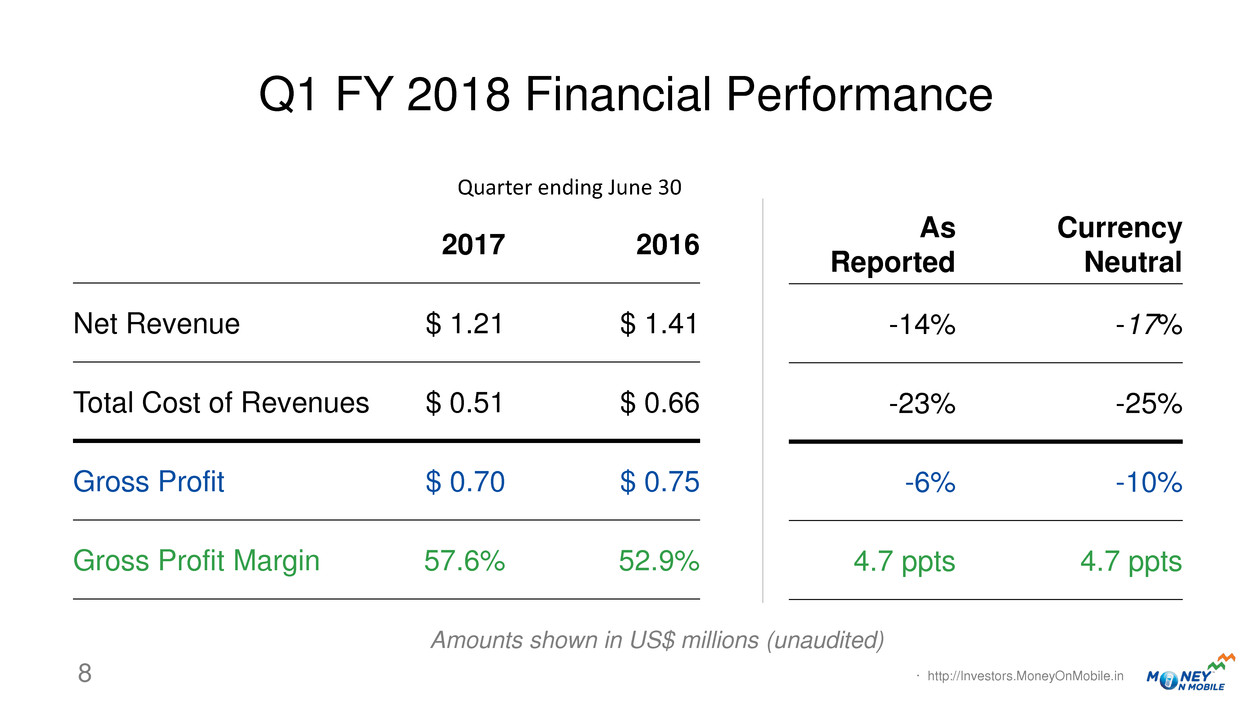
2017 2016 Net Revenue $ 1.21 $ 1.41 Total Cost of Revenues $ 0.51 $ 0.66 Gross Profit $ 0.70 $ 0.75 Gross Profit Margin 57.6% 52.9% Q1 FY 2018 Financial Performance As Reported Currency Neutral -14% -17% -23% -25% -6% -10% 4.7 ppts 4.7 ppts Amounts shown in US$ millions (unaudited) Quarter ending June 30 · http://Investors.MoneyOnMobile.in 8

Equity Expense in Q1-2018 $1.3 million - Non-cash - One-time · http://Investors.MoneyOnMobile.in 9 Difference from Q1 2017 to Q1 2018 in “Selling, general, and administrative”. (In millions) $3.1 $1.8 Q1 2018 Q1 2017 $1.8 $1.8 Q1 2018 Q1 2017

Feb '17 Mar '17 Apr '17 May '17 Jun '17 Jul '17 Margin Trend Monthly Gross Margin, February – July 2017 61.1% http://Investors.MoneyOnMobile.in 10 61.6% 59.7% 61.2% 55.4% 50%
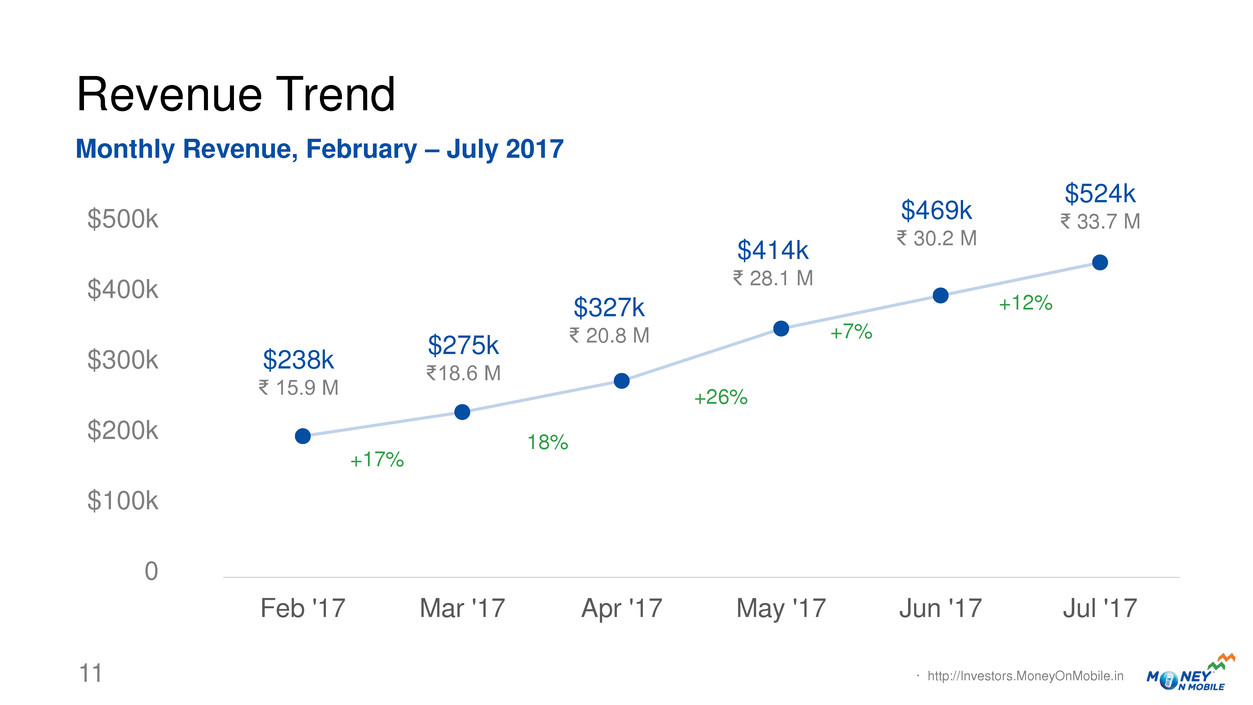
Revenue Trend Monthly Revenue, February – July 2017 $500k $400k $300k $200k $100k 0 Feb '17 Mar '17 Apr '17 May '17 Jun '17 Jul '17 $238k ₹ 15.9 M $275k ₹18.6 M $327k ₹ 20.8 M $414k ₹ 28.1 M $469k ₹ 30.2 M +17% 18% +26% +7% · http://Investors.MoneyOnMobile.in 11 $524k ₹ 33.7 M +12%
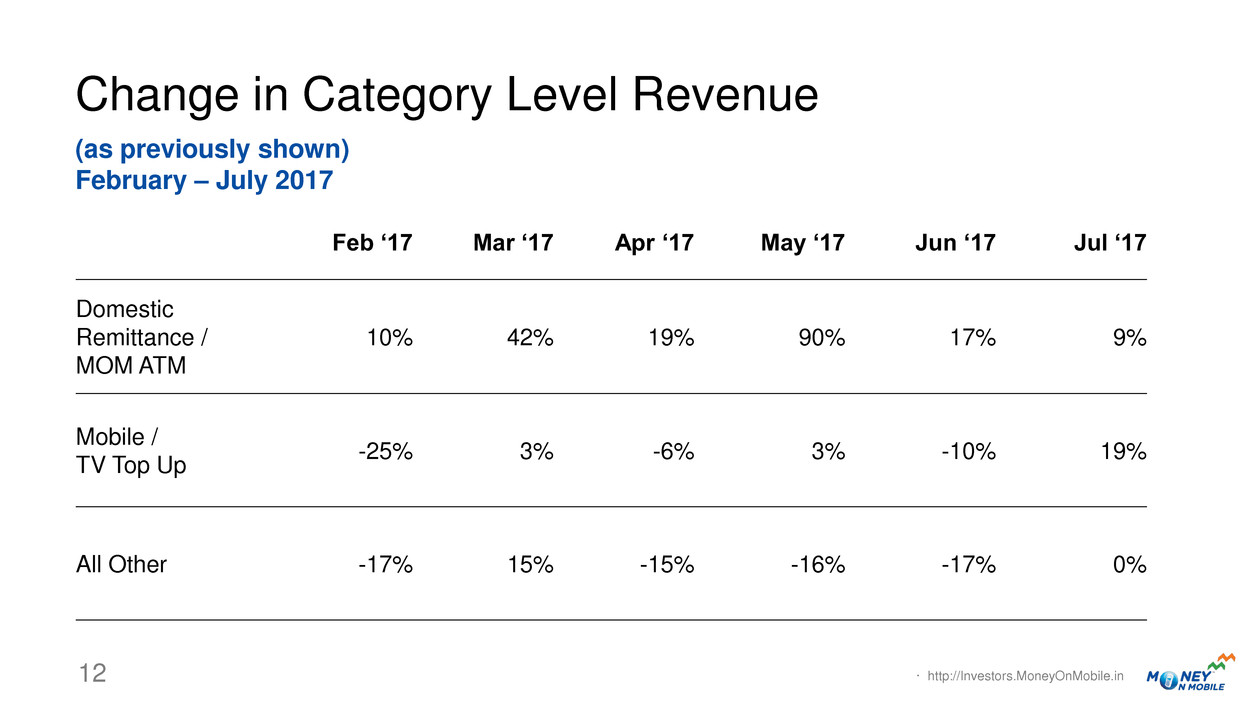
Change in Category Level Revenue Feb „17 Mar „17 Apr „17 May „17 Jun „17 Jul „17 Domestic Remittance / MOM ATM 10% 42% 19% 90% 17% 9% Mobile / TV Top Up -25% 3% -6% 3% -10% 19% All Other -17% 15% -15% -16% -17% 0% (as previously shown) February – July 2017 · http://Investors.MoneyOnMobile.in 12

Change in Category Level Revenue Feb „17 Mar „17 Apr „17 May „17 Jun „17 Jul „17 Domestic Remittance / MOM ATM 14% 44% 22% 85% 13% 12% Mobile / TV Top Up -25% 3% -6% 3% -10% 19% All Other -27% 9% -43% 42% 272% 57% (Revised format) February – July 2017 · http://Investors.MoneyOnMobile.in 13
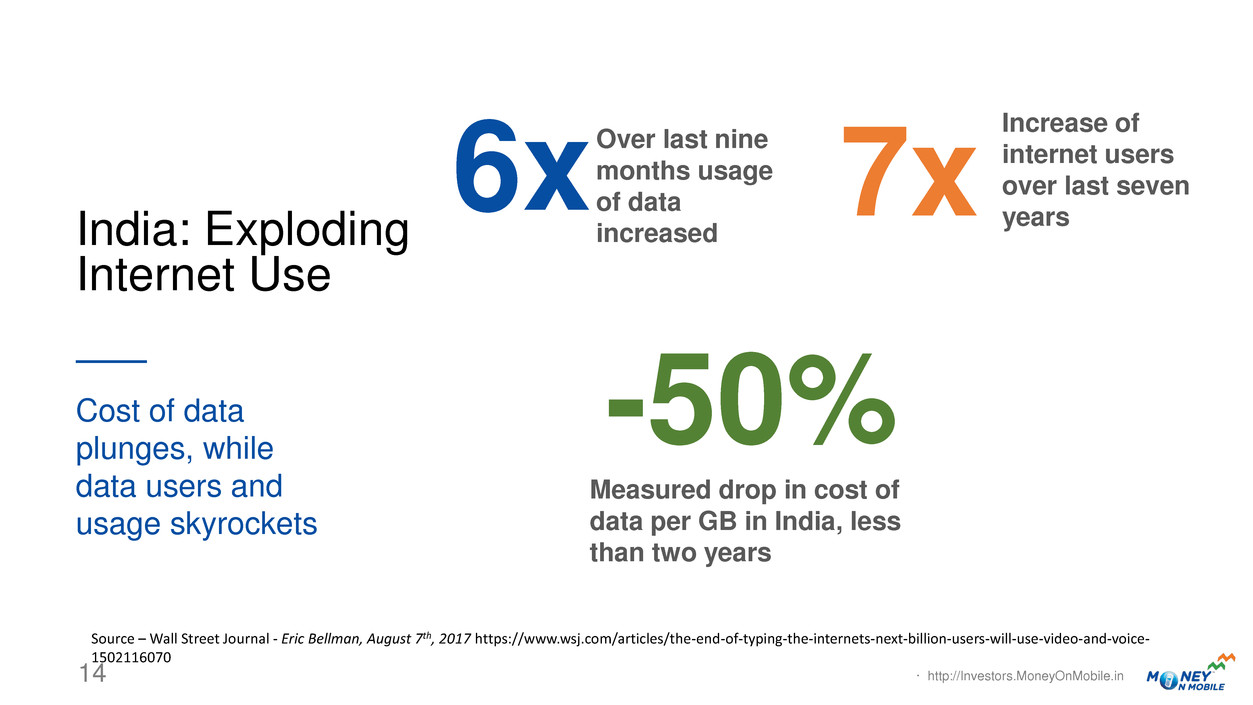
India: Exploding Internet Use Cost of data plunges, while data users and usage skyrockets · http://Investors.MoneyOnMobile.in 14 Increase of internet users over last seven years -50% 7x Source – Wall Street Journal - Eric Bellman, August 7th, 2017 https://www.wsj.com/articles/the-end-of-typing-the-internets-next-billion-users-will-use-video-and-voice- 1502116070 6x Over last nine months usage of data increased Measured drop in cost of data per GB in India, less than two years

MOMATM In Action Cash out, like an ATM In-store purchases ATM with no machines Cash comes from merchants till · http://Investors.MoneyOnMobile.in 15

India’s ATM Market Is Drastically Underserved · http://Investors.MoneyOnMobile.in 17 India currently has ~200,000 ATMs for it’s 1.3B citizens. If India were to have the same ratio of ATMs to people as the US, it would need almost 2M more. ATMs in India - Current ATMs in India - Needed
Questions and Answers Submit questions via Webex chat Send questions to investors@moneyonmobile.in Visit http://Investors.MoneyOnMobile.i n for more information · http://Investors.MoneyOnMobile.in 18
FY 2018 Earnings Call August 16th , 2017 DALLAS, TEXAS, USA OTCQX: MOMT | http://Investors.MoneyOnMobile.in


