
Exhibit 99.2 second quarter 2021 earnings presentation may 6, 2021 nasdaq: ocslExhibit 99.2 second quarter 2021 earnings presentation may 6, 2021 nasdaq: ocsl
Forward Looking Statements & Legal Disclosures Some of the statements in this presentation constitute forward-looking statements because they relate to future events or our future performance or financial condition. The forward-looking statements contained in this presentation may include statements as to: our future operating results and distribution projections; the ability of Oaktree Fund Advisors, LLC (“Oaktree”) to reposition our portfolio and to implement Oaktree’s future plans with respect to our business; the ability of Oaktree and its affiliates to attract and retain highly talented professionals; our business prospects and the prospects of our portfolio companies; the impact of the investments that we expect to make; the ability of our portfolio companies to achieve their objectives; our expected financings and investments and additional leverage we may seek to incur in the future; the adequacy of our cash resources and working capital; the timing of cash flows, if any, from the operations of our portfolio companies; and the cost or potential outcome of any litigation to which we may be a party. In addition, words such as “anticipate,” “believe,” “expect,” “seek,” “plan,” “should,” “estimate,” “project” and “intend” indicate forward-looking statements, although not all forward-looking statements include these words. The forward-looking statements contained in this presentation involve risks and uncertainties. Our actual results could differ materially from those implied or expressed in the forward-looking statements for any reason, including the factors set forth in “Risk Factors” and elsewhere in our annual report on Form 10-K for the fiscal year ended September 30, 2020 and our quarterly report on Form 10-Q for the quarter ended March 31, 2021. Other factors that could cause actual results to differ materially include: changes or potential disruptions in our operations, the economy, financial markets or political environment; risks associated with possible disruption in our operations or the economy generally due to terrorism, natural disasters or the COVID-19 pandemic; future changes in laws or regulations (including the interpretation of these laws and regulations by regulatory authorities) and conditions in our operating areas, particularly with respect to business development companies or regulated investment companies; general considerations associated with the COVID-19 pandemic; the ability to realize the anticipated benefits of the merger of Oaktree Strategic Income Corporation (“OCSI”) with and into us (the “Merger”); and other considerations that may be disclosed from time to time in our publicly disseminated documents and filings. We have based the forward-looking statements included in this presentation on information available to us on the date of this presentation, and we assume no obligation to update any such forward- looking statements. Although we undertake no obligation to revise or update any forward-looking statements, whether as a result of new information, future events or otherwise, you are advised to consult any additional disclosures that we may make directly to you or through reports that we in the future may file with the SEC, including annual reports on Form 10-K, quarterly reports on Form 10-Q and current reports on Form 8-K. Calculation of Assets Under Management References to total assets under management or AUM represent assets managed by Oaktree and a proportionate amount of the AUM reported by DoubleLine Capital LP ( DoubleLine Capital ), in which Oaktree owns a 20% minority interest. Oaktree's methodology for calculating AUM includes (i) the net asset value (“NAV”) of assets managed directly by Oaktree, (ii) the leverage on which management fees are charged, (iii) undrawn capital that Oaktree is entitled to call from investors in Oaktree funds pursuant to their capital commitments, (iv) for collateralized loan obligation vehicles ( CLOs ), the aggregate par value of collateral assets and principal cash, (v) for publicly-traded business development companies, gross assets (including assets acquired with leverage), net of cash, and (vi) Oaktree's pro rata portion (20%) of the AUM reported by DoubleLine Capital. This calculation of AUM is not based on the definitions of AUM that may be set forth in agreements governing the investment funds, vehicles or accounts managed and is not calculated pursuant to regulatory definitions. 1Forward Looking Statements & Legal Disclosures Some of the statements in this presentation constitute forward-looking statements because they relate to future events or our future performance or financial condition. The forward-looking statements contained in this presentation may include statements as to: our future operating results and distribution projections; the ability of Oaktree Fund Advisors, LLC (“Oaktree”) to reposition our portfolio and to implement Oaktree’s future plans with respect to our business; the ability of Oaktree and its affiliates to attract and retain highly talented professionals; our business prospects and the prospects of our portfolio companies; the impact of the investments that we expect to make; the ability of our portfolio companies to achieve their objectives; our expected financings and investments and additional leverage we may seek to incur in the future; the adequacy of our cash resources and working capital; the timing of cash flows, if any, from the operations of our portfolio companies; and the cost or potential outcome of any litigation to which we may be a party. In addition, words such as “anticipate,” “believe,” “expect,” “seek,” “plan,” “should,” “estimate,” “project” and “intend” indicate forward-looking statements, although not all forward-looking statements include these words. The forward-looking statements contained in this presentation involve risks and uncertainties. Our actual results could differ materially from those implied or expressed in the forward-looking statements for any reason, including the factors set forth in “Risk Factors” and elsewhere in our annual report on Form 10-K for the fiscal year ended September 30, 2020 and our quarterly report on Form 10-Q for the quarter ended March 31, 2021. Other factors that could cause actual results to differ materially include: changes or potential disruptions in our operations, the economy, financial markets or political environment; risks associated with possible disruption in our operations or the economy generally due to terrorism, natural disasters or the COVID-19 pandemic; future changes in laws or regulations (including the interpretation of these laws and regulations by regulatory authorities) and conditions in our operating areas, particularly with respect to business development companies or regulated investment companies; general considerations associated with the COVID-19 pandemic; the ability to realize the anticipated benefits of the merger of Oaktree Strategic Income Corporation (“OCSI”) with and into us (the “Merger”); and other considerations that may be disclosed from time to time in our publicly disseminated documents and filings. We have based the forward-looking statements included in this presentation on information available to us on the date of this presentation, and we assume no obligation to update any such forward- looking statements. Although we undertake no obligation to revise or update any forward-looking statements, whether as a result of new information, future events or otherwise, you are advised to consult any additional disclosures that we may make directly to you or through reports that we in the future may file with the SEC, including annual reports on Form 10-K, quarterly reports on Form 10-Q and current reports on Form 8-K. Calculation of Assets Under Management References to total assets under management or AUM represent assets managed by Oaktree and a proportionate amount of the AUM reported by DoubleLine Capital LP ( DoubleLine Capital ), in which Oaktree owns a 20% minority interest. Oaktree's methodology for calculating AUM includes (i) the net asset value (“NAV”) of assets managed directly by Oaktree, (ii) the leverage on which management fees are charged, (iii) undrawn capital that Oaktree is entitled to call from investors in Oaktree funds pursuant to their capital commitments, (iv) for collateralized loan obligation vehicles ( CLOs ), the aggregate par value of collateral assets and principal cash, (v) for publicly-traded business development companies, gross assets (including assets acquired with leverage), net of cash, and (vi) Oaktree's pro rata portion (20%) of the AUM reported by DoubleLine Capital. This calculation of AUM is not based on the definitions of AUM that may be set forth in agreements governing the investment funds, vehicles or accounts managed and is not calculated pursuant to regulatory definitions. 1
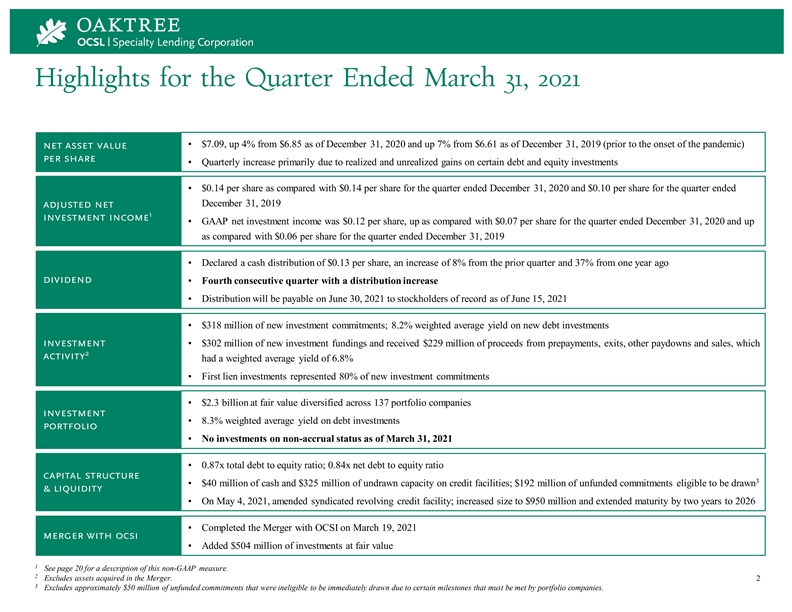
Highlights for the Quarter Ended March 31, 2021 • $7.09, up 4% from $6.85 as of December 31, 2020 and up 7% from $6.61 as of December 31, 2019 (prior to the onset of the pandemic) net asset value per share • Quarterly increase primarily due to realized and unrealized gains on certain debt and equity investments • $0.14 per share as compared with $0.14 per share for the quarter ended December 31, 2020 and $0.10 per share for the quarter ended December 31, 2019 adjusted net 1 investment income • GAAP net investment income was $0.12 per share, up as compared with $0.07 per share for the quarter ended December 31, 2020 and up as compared with $0.06 per share for the quarter ended December 31, 2019 • Declared a cash distribution of $0.13 per share, an increase of 8% from the prior quarter and 37% from one year ago dividend • Fourth consecutive quarter with a distribution increase • Distribution will be payable on June 30, 2021 to stockholders of record as of June 15, 2021 • $318 million of new investment commitments; 8.2% weighted average yield on new debt investments investment • $302 million of new investment fundings and received $229 million of proceeds from prepayments, exits, other paydowns and sales, which 2 activity had a weighted average yield of 6.8% • First lien investments represented 80% of new investment commitments • $2.3 billion at fair value diversified across 137 portfolio companies investment • 8.3% weighted average yield on debt investments portfolio • No investments on non-accrual status as of March 31, 2021 • 0.87x total debt to equity ratio; 0.84x net debt to equity ratio capital structure 3 • $40 million of cash and $325 million of undrawn capacity on credit facilities; $192 million of unfunded commitments eligible to be drawn & liquidity • On May 4, 2021, amended syndicated revolving credit facility; increased size to $950 million and extended maturity by two years to 2026 • Completed the Merger with OCSI on March 19, 2021 merger with ocsi • Added $504 million of investments at fair value 1 See page 20 for a description of this non-GAAP measure. 2 Excludes assets acquired in the Merger. 2 3 Excludes approximately $50 million of unfunded commitments that were ineligible to be immediately drawn due to certain milestones that must be met by portfolio companies.Highlights for the Quarter Ended March 31, 2021 • $7.09, up 4% from $6.85 as of December 31, 2020 and up 7% from $6.61 as of December 31, 2019 (prior to the onset of the pandemic) net asset value per share • Quarterly increase primarily due to realized and unrealized gains on certain debt and equity investments • $0.14 per share as compared with $0.14 per share for the quarter ended December 31, 2020 and $0.10 per share for the quarter ended December 31, 2019 adjusted net 1 investment income • GAAP net investment income was $0.12 per share, up as compared with $0.07 per share for the quarter ended December 31, 2020 and up as compared with $0.06 per share for the quarter ended December 31, 2019 • Declared a cash distribution of $0.13 per share, an increase of 8% from the prior quarter and 37% from one year ago dividend • Fourth consecutive quarter with a distribution increase • Distribution will be payable on June 30, 2021 to stockholders of record as of June 15, 2021 • $318 million of new investment commitments; 8.2% weighted average yield on new debt investments investment • $302 million of new investment fundings and received $229 million of proceeds from prepayments, exits, other paydowns and sales, which 2 activity had a weighted average yield of 6.8% • First lien investments represented 80% of new investment commitments • $2.3 billion at fair value diversified across 137 portfolio companies investment • 8.3% weighted average yield on debt investments portfolio • No investments on non-accrual status as of March 31, 2021 • 0.87x total debt to equity ratio; 0.84x net debt to equity ratio capital structure 3 • $40 million of cash and $325 million of undrawn capacity on credit facilities; $192 million of unfunded commitments eligible to be drawn & liquidity • On May 4, 2021, amended syndicated revolving credit facility; increased size to $950 million and extended maturity by two years to 2026 • Completed the Merger with OCSI on March 19, 2021 merger with ocsi • Added $504 million of investments at fair value 1 See page 20 for a description of this non-GAAP measure. 2 Excludes assets acquired in the Merger. 2 3 Excludes approximately $50 million of unfunded commitments that were ineligible to be immediately drawn due to certain milestones that must be met by portfolio companies.
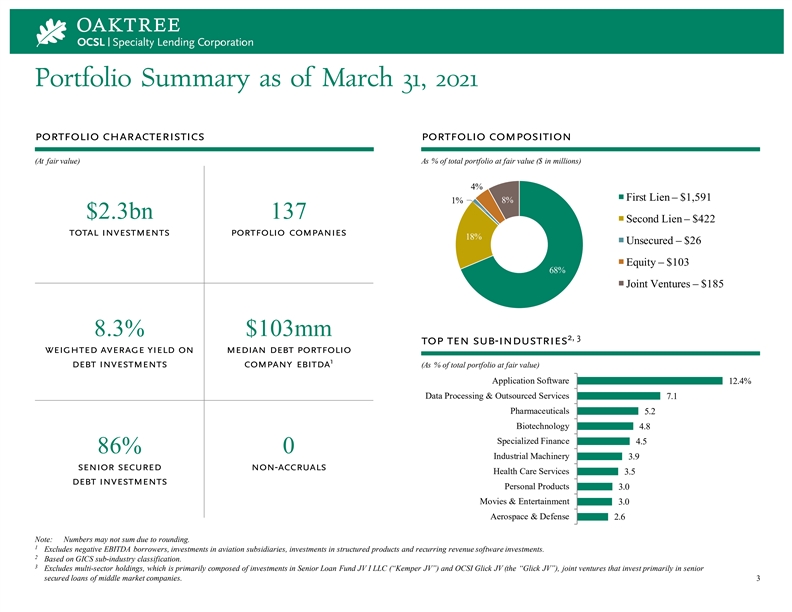
Portfolio Summary as of March 31, 2021 portfolio characteristics portfolio composition (At fair value) As % of total portfolio at fair value ($ in millions) 4% First Lien – $1,591 1% 8% $2.3bn 137 Second Lien – $422 total investments portfolio companies 18% Unsecured – $26 Equity – $103 68% Joint Ventures – $185 8.3% $103mm 2, 3 top ten sub-industries weighted average yield on median debt portfolio 1 debt investments company ebitda (As % of total portfolio at fair value) Application Software 12.4% Data Processing & Outsourced Services 7.1 Pharmaceuticals 5.2 Biotechnology 4.8 Specialized Finance 4.5 86% 0 Industrial Machinery 3.9 senior secured non-accruals Health Care Services 3.5 debt investments Personal Products 3.0 Movies & Entertainment 3.0 Aerospace & Defense 2.6 Note: Numbers may not sum due to rounding. 1 Excludes negative EBITDA borrowers, investments in aviation subsidiaries, investments in structured products and recurring revenue software investments. 2 Based on GICS sub-industry classification. 3 Excludes multi-sector holdings, which is primarily composed of investments in Senior Loan Fund JV I LLC (“Kemper JV”) and OCSI Glick JV (the “Glick JV”), joint ventures that invest primarily in senior secured loans of middle market companies. 3Portfolio Summary as of March 31, 2021 portfolio characteristics portfolio composition (At fair value) As % of total portfolio at fair value ($ in millions) 4% First Lien – $1,591 1% 8% $2.3bn 137 Second Lien – $422 total investments portfolio companies 18% Unsecured – $26 Equity – $103 68% Joint Ventures – $185 8.3% $103mm 2, 3 top ten sub-industries weighted average yield on median debt portfolio 1 debt investments company ebitda (As % of total portfolio at fair value) Application Software 12.4% Data Processing & Outsourced Services 7.1 Pharmaceuticals 5.2 Biotechnology 4.8 Specialized Finance 4.5 86% 0 Industrial Machinery 3.9 senior secured non-accruals Health Care Services 3.5 debt investments Personal Products 3.0 Movies & Entertainment 3.0 Aerospace & Defense 2.6 Note: Numbers may not sum due to rounding. 1 Excludes negative EBITDA borrowers, investments in aviation subsidiaries, investments in structured products and recurring revenue software investments. 2 Based on GICS sub-industry classification. 3 Excludes multi-sector holdings, which is primarily composed of investments in Senior Loan Fund JV I LLC (“Kemper JV”) and OCSI Glick JV (the “Glick JV”), joint ventures that invest primarily in senior secured loans of middle market companies. 3

OCSL’s Portfolio Diversity Provides Downside Protection 1 diversity by investment size portfolio by industry (As % of total portfolio at fair value) (As % of total portfolio at fair value) Industry % of Portfolio Joint Ventures Software 12.7% 8% Top 10 Investments IT Services 9.5 20% Pharmaceuticals 5.2 Health Care Providers & Services 5.0 Biotechnology 4.8 Chemicals 3.9 Machinery 3.9 Real Estate Management & Development 3.4 Next 15 Diversified Financial Services 3.3 Investments 21% Oil, Gas & Consumable Fuels 3.1 Remaining 110 Investments Personal Products 3.0 51% Entertainment 3.0 Remaining 29 Industries 31.1 Joint Ventures 8.0 OCSL’s portfolio is diverse across borrowers and industries As of March 31, 2021 Note: Numbers may not sum due to rounding. 1 Based on GICS industry classification. 4OCSL’s Portfolio Diversity Provides Downside Protection 1 diversity by investment size portfolio by industry (As % of total portfolio at fair value) (As % of total portfolio at fair value) Industry % of Portfolio Joint Ventures Software 12.7% 8% Top 10 Investments IT Services 9.5 20% Pharmaceuticals 5.2 Health Care Providers & Services 5.0 Biotechnology 4.8 Chemicals 3.9 Machinery 3.9 Real Estate Management & Development 3.4 Next 15 Diversified Financial Services 3.3 Investments 21% Oil, Gas & Consumable Fuels 3.1 Remaining 110 Investments Personal Products 3.0 51% Entertainment 3.0 Remaining 29 Industries 31.1 Joint Ventures 8.0 OCSL’s portfolio is diverse across borrowers and industries As of March 31, 2021 Note: Numbers may not sum due to rounding. 1 Based on GICS industry classification. 4

Investment Activity new investment highlights historical funded originations and exits ($ in millions) 350 $302 $300 $252 $242 $229 250 $199 $184 $318mm $302 million 200 $161 $154 $146 $128 150 new investment new investment 1 100 commitments fundings 50 0 3/31/20 6/30/20 9/30/20 12/31/20 3/31/21 1 2 New Funded Investments Investment Exits 8.2% 100% new investment composition weighted average yield on also held by other new debt commitments oaktree funds As % of new investment commitments ($ in millions) 1.6% 5% First Lien – $253 14% Second Lien – $44 $297mm $21mm Subordinated Debt – $5 new investment new investment Preferred Equity – $15 commitments in new commitments in existing 80% portfolio companies portfolio companies Equity – $0.5 Note: Numbers rounded to the nearest million or percentage point and may not sum as a result. 1 New funded investments includes drawdowns on existing revolver commitments. 2 Investment exits includes proceeds from prepayments, exits, other paydowns and sales. 5Investment Activity new investment highlights historical funded originations and exits ($ in millions) 350 $302 $300 $252 $242 $229 250 $199 $184 $318mm $302 million 200 $161 $154 $146 $128 150 new investment new investment 1 100 commitments fundings 50 0 3/31/20 6/30/20 9/30/20 12/31/20 3/31/21 1 2 New Funded Investments Investment Exits 8.2% 100% new investment composition weighted average yield on also held by other new debt commitments oaktree funds As % of new investment commitments ($ in millions) 1.6% 5% First Lien – $253 14% Second Lien – $44 $297mm $21mm Subordinated Debt – $5 new investment new investment Preferred Equity – $15 commitments in new commitments in existing 80% portfolio companies portfolio companies Equity – $0.5 Note: Numbers rounded to the nearest million or percentage point and may not sum as a result. 1 New funded investments includes drawdowns on existing revolver commitments. 2 Investment exits includes proceeds from prepayments, exits, other paydowns and sales. 5

Investment Activity (continued) new investment commitment detail ($ in millions) Security Type Market Investment Number of Unsecured & Private Primary Secondary Avg. Secondary Quarter Commitments Deals First Lien Second Lien Other Placement (Public) (Public) Purchase Price 2Q2020 $273 39 $210 $21 $42 $141 $58 $75 83% 3Q2020 261 18 177 8 76 154 71 35 74 4Q2020 148 10 123 25 0.5 90 57 2 96 1Q2021 286 21 196 90 -- 181 84 22 93 January 41 2 41 -- -- 41 -- -- -- February 102 10 73 11 18 64 28 10 93 March 174 8 139 33 2 139 35 -- -- Total 2Q2021 $318 20 $253 $44 $21 $245 $63 $10 93% Note: Numbers may not sum due to rounding. Excludes any positions originated, purchased and sold within the same quarter. 6Investment Activity (continued) new investment commitment detail ($ in millions) Security Type Market Investment Number of Unsecured & Private Primary Secondary Avg. Secondary Quarter Commitments Deals First Lien Second Lien Other Placement (Public) (Public) Purchase Price 2Q2020 $273 39 $210 $21 $42 $141 $58 $75 83% 3Q2020 261 18 177 8 76 154 71 35 74 4Q2020 148 10 123 25 0.5 90 57 2 96 1Q2021 286 21 196 90 -- 181 84 22 93 January 41 2 41 -- -- 41 -- -- -- February 102 10 73 11 18 64 28 10 93 March 174 8 139 33 2 139 35 -- -- Total 2Q2021 $318 20 $253 $44 $21 $245 $63 $10 93% Note: Numbers may not sum due to rounding. Excludes any positions originated, purchased and sold within the same quarter. 6
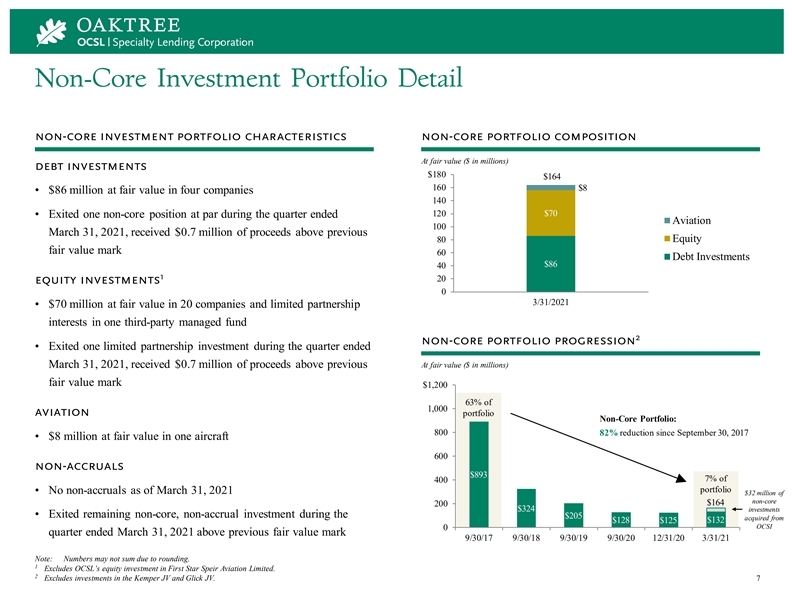
Non-Core Investment Portfolio Detail non-core investment portfolio characteristics non-core portfolio composition At fair value ($ in millions) debt investments $180 $164 160 $8 • $86 million at fair value in four companies 140 120 $70 • Exited one non-core position at par during the quarter ended Aviation 100 March 31, 2021, received $0.7 million of proceeds above previous Equity 80 fair value mark 60 Debt Investments $86 40 1 20 equity investments 0 3/31/2021 • $70 million at fair value in 20 companies and limited partnership interests in one third-party managed fund 2 non-core portfolio progression • Exited one limited partnership investment during the quarter ended March 31, 2021, received $0.7 million of proceeds above previous At fair value ($ in millions) fair value mark $1,200 63% of 1,000 aviation portfolio Non-Core Portfolio: 800 82% reduction since September 30, 2017 • $8 million at fair value in one aircraft 600 non-accruals $893 7% of 400 portfolio • No non-accruals as of March 31, 2021 $32 million of non-core $164 200 $324 investments • Exited remaining non-core, non-accrual investment during the $205 acquired from $128 $125 $132 OCSI 0 quarter ended March 31, 2021 above previous fair value mark 9/30/17 9/30/18 9/30/19 9/30/20 12/31/20 3/31/21 Note: Numbers may not sum due to rounding. 1 Excludes OCSL’s equity investment in First Star Speir Aviation Limited. 2 Excludes investments in the Kemper JV and Glick JV. 7Non-Core Investment Portfolio Detail non-core investment portfolio characteristics non-core portfolio composition At fair value ($ in millions) debt investments $180 $164 160 $8 • $86 million at fair value in four companies 140 120 $70 • Exited one non-core position at par during the quarter ended Aviation 100 March 31, 2021, received $0.7 million of proceeds above previous Equity 80 fair value mark 60 Debt Investments $86 40 1 20 equity investments 0 3/31/2021 • $70 million at fair value in 20 companies and limited partnership interests in one third-party managed fund 2 non-core portfolio progression • Exited one limited partnership investment during the quarter ended March 31, 2021, received $0.7 million of proceeds above previous At fair value ($ in millions) fair value mark $1,200 63% of 1,000 aviation portfolio Non-Core Portfolio: 800 82% reduction since September 30, 2017 • $8 million at fair value in one aircraft 600 non-accruals $893 7% of 400 portfolio • No non-accruals as of March 31, 2021 $32 million of non-core $164 200 $324 investments • Exited remaining non-core, non-accrual investment during the $205 acquired from $128 $125 $132 OCSI 0 quarter ended March 31, 2021 above previous fair value mark 9/30/17 9/30/18 9/30/19 9/30/20 12/31/20 3/31/21 Note: Numbers may not sum due to rounding. 1 Excludes OCSL’s equity investment in First Star Speir Aviation Limited. 2 Excludes investments in the Kemper JV and Glick JV. 7

Financial Highlights As of ($ and number of shares in thousands, except per share amounts) 3/31/2021 12/31/2020 9/30/2020 6/30/2020 3/31/2020 GAAP Net Investment Income per Share $0.12 $0.07 $0.17 $0.12 $0.16 1 Adjusted Net Investment Income per Share $0.14 $0.14 $0.17 $0.12 $0.12 Net Realized and Unrealized Gains (Losses), Net of Taxes per Share $0.48 $0.39 $0.33 $0.73 $(1.33) 1 Adjusted Net Realized and Unrealized Gains (Losses), Net of Taxes per Share $0.25 $0.39 $0.33 $0.73 $(1.33) Earnings (Loss) per Share $0.60 $0.46 $0.50 $0.85 $(1.17) 1 Adjusted Earnings (Loss) per Share $0.37 $0.46 $0.50 $0.85 $(1.17) Distributions per Share $0.120 $0.110 $0.105 $0.095 $0.095 NAV per Share $7.09 $6.85 $6.49 $6.09 $5.34 Weighted Average Shares Outstanding 146,652 140,961 140,961 140,961 140,961 Shares Outstanding, End of Period 180,361 140,961 140,961 140,961 140,961 Investment Portfolio (at Fair Value) $2,327,353 $1,712,324 $1,573,851 $1,561,153 $1,392,187 Cash and Cash Equivalents $39,872 $24,234 $39,096 $50,728 $89,509 Total Assets $2,433,413 $1,793,903 $1,640,712 $1,647,567 $1,501,627 2 Total Debt Outstanding $1,109,897 $694,827 $709,315 $761,002 $698,686 Net Assets $1,278,823 $964,917 $914,879 $859,063 $752,224 Total Debt to Equity Ratio 0.87x 0.73x 0.78x 0.89x 0.94x Net Debt to Equity Ratio 0.84x 0.70x 0.74x 0.83x 0.82x Weighted Average Interest Rate on Debt Outstanding 2.6% 2.7% 2.7% 2.7% 3.1% 1 See page 20 for a description of the non-GAAP measures. 2 Net of unamortized financing costs. 8Financial Highlights As of ($ and number of shares in thousands, except per share amounts) 3/31/2021 12/31/2020 9/30/2020 6/30/2020 3/31/2020 GAAP Net Investment Income per Share $0.12 $0.07 $0.17 $0.12 $0.16 1 Adjusted Net Investment Income per Share $0.14 $0.14 $0.17 $0.12 $0.12 Net Realized and Unrealized Gains (Losses), Net of Taxes per Share $0.48 $0.39 $0.33 $0.73 $(1.33) 1 Adjusted Net Realized and Unrealized Gains (Losses), Net of Taxes per Share $0.25 $0.39 $0.33 $0.73 $(1.33) Earnings (Loss) per Share $0.60 $0.46 $0.50 $0.85 $(1.17) 1 Adjusted Earnings (Loss) per Share $0.37 $0.46 $0.50 $0.85 $(1.17) Distributions per Share $0.120 $0.110 $0.105 $0.095 $0.095 NAV per Share $7.09 $6.85 $6.49 $6.09 $5.34 Weighted Average Shares Outstanding 146,652 140,961 140,961 140,961 140,961 Shares Outstanding, End of Period 180,361 140,961 140,961 140,961 140,961 Investment Portfolio (at Fair Value) $2,327,353 $1,712,324 $1,573,851 $1,561,153 $1,392,187 Cash and Cash Equivalents $39,872 $24,234 $39,096 $50,728 $89,509 Total Assets $2,433,413 $1,793,903 $1,640,712 $1,647,567 $1,501,627 2 Total Debt Outstanding $1,109,897 $694,827 $709,315 $761,002 $698,686 Net Assets $1,278,823 $964,917 $914,879 $859,063 $752,224 Total Debt to Equity Ratio 0.87x 0.73x 0.78x 0.89x 0.94x Net Debt to Equity Ratio 0.84x 0.70x 0.74x 0.83x 0.82x Weighted Average Interest Rate on Debt Outstanding 2.6% 2.7% 2.7% 2.7% 3.1% 1 See page 20 for a description of the non-GAAP measures. 2 Net of unamortized financing costs. 8

Portfolio Highlights As of ($ in thousands, at fair value) 3/31/2021 12/31/2020 9/30/2020 6/30/2020 3/31/2020 Investments at Fair Value $2,327,353 $1,712,324 $1,573,851 $1,561,153 $1,392,187 Number of Portfolio Companies 137 115 113 119 128 Average Portfolio Company Debt Investment Size $17,600 $16,200 $15,800 $14,600 $11,900 Asset Class: First Lien 68.3% 60.3% 62.3% 61.3% 62.3% Second Lien 18.2 25.4 21.7 19.6 19.7 Unsecured Debt 1.1 3.1 4.2 7.2 5.8 Equity 4.4 3.8 4.1 4.7 5.5 Limited Partnership Interests 0.0 0.1 0.2 0.2 0.2 Joint Venture Interests 8.0 7.3 7.5 7.0 6.6 Interest Rate Type for Debt Investments: % Floating-Rate 91.8% 88.8% 88.3% 86.2% 90.6% % Fixed-Rate 8.2 11.2 11.7 13.8 9.4 Yields: 1 Weighted Average Yield on Debt Investments 8.3% 8.5% 8.3% 8.1% 8.0% Cash Component of Weighted Average Yield on Debt Investments 7.1 7.1 7.0 6.9 6.9 2 Weighted Average Yield on Total Portfolio Investments 7.8 8.0 7.8 7.6 7.5 Note: Numbers may not sum due to rounding. 1 Annual stated yield earned plus net annual amortization of original issue discount or premium earned on accruing investments, including our share of the return on debt investments in the Kemper JV and Glick JV. 2 Annual stated yield earned plus net annual amortization of original issue discount or premium earned on accruing investments and dividend income, including our share of the return on debt investments in the Kemper JV and Glick JV. 9Portfolio Highlights As of ($ in thousands, at fair value) 3/31/2021 12/31/2020 9/30/2020 6/30/2020 3/31/2020 Investments at Fair Value $2,327,353 $1,712,324 $1,573,851 $1,561,153 $1,392,187 Number of Portfolio Companies 137 115 113 119 128 Average Portfolio Company Debt Investment Size $17,600 $16,200 $15,800 $14,600 $11,900 Asset Class: First Lien 68.3% 60.3% 62.3% 61.3% 62.3% Second Lien 18.2 25.4 21.7 19.6 19.7 Unsecured Debt 1.1 3.1 4.2 7.2 5.8 Equity 4.4 3.8 4.1 4.7 5.5 Limited Partnership Interests 0.0 0.1 0.2 0.2 0.2 Joint Venture Interests 8.0 7.3 7.5 7.0 6.6 Interest Rate Type for Debt Investments: % Floating-Rate 91.8% 88.8% 88.3% 86.2% 90.6% % Fixed-Rate 8.2 11.2 11.7 13.8 9.4 Yields: 1 Weighted Average Yield on Debt Investments 8.3% 8.5% 8.3% 8.1% 8.0% Cash Component of Weighted Average Yield on Debt Investments 7.1 7.1 7.0 6.9 6.9 2 Weighted Average Yield on Total Portfolio Investments 7.8 8.0 7.8 7.6 7.5 Note: Numbers may not sum due to rounding. 1 Annual stated yield earned plus net annual amortization of original issue discount or premium earned on accruing investments, including our share of the return on debt investments in the Kemper JV and Glick JV. 2 Annual stated yield earned plus net annual amortization of original issue discount or premium earned on accruing investments and dividend income, including our share of the return on debt investments in the Kemper JV and Glick JV. 9

Investment Activity As of ($ in thousands) 3/31/2021 12/31/2020 9/30/2020 6/30/2020 3/31/2020 New Investment Commitments $317,700 $286,300 $148,500 $260,500 $272,900 1 New Funded Investment Activity $301,800 $241,500 $146,300 $198,500 $251,700 Proceeds from Prepayments, Exits, Other Paydowns and Sales $228,900 $160,700 $184,200 $127,800 $154,500 2 Net New Investments $72,900 $80,800 $(37,900) $70,700 $97,200 New Investment Commitments in New Portfolio Companies 18 14 8 10 32 New Investment Commitments in Existing Portfolio Companies 2 7 3 8 8 Portfolio Company Exits 12 12 12 19 10 Weighted Average Yield at Cost on New Debt Investment Commitments 8.2% 8.7% 10.6% 10.5% 7.9% 1 New funded investment activity includes drawdowns on existing revolver commitments. Includes $103 million of unsettled purchases as of December 31, 2020. 2 Net new investments consists of new funded investment activity less proceeds from prepayments, exits, other paydowns and sales. 10Investment Activity As of ($ in thousands) 3/31/2021 12/31/2020 9/30/2020 6/30/2020 3/31/2020 New Investment Commitments $317,700 $286,300 $148,500 $260,500 $272,900 1 New Funded Investment Activity $301,800 $241,500 $146,300 $198,500 $251,700 Proceeds from Prepayments, Exits, Other Paydowns and Sales $228,900 $160,700 $184,200 $127,800 $154,500 2 Net New Investments $72,900 $80,800 $(37,900) $70,700 $97,200 New Investment Commitments in New Portfolio Companies 18 14 8 10 32 New Investment Commitments in Existing Portfolio Companies 2 7 3 8 8 Portfolio Company Exits 12 12 12 19 10 Weighted Average Yield at Cost on New Debt Investment Commitments 8.2% 8.7% 10.6% 10.5% 7.9% 1 New funded investment activity includes drawdowns on existing revolver commitments. Includes $103 million of unsettled purchases as of December 31, 2020. 2 Net new investments consists of new funded investment activity less proceeds from prepayments, exits, other paydowns and sales. 10

Net Asset Value Per Share Bridge adjusted net realized and unrealized gains (losses) $8.00 $0.25 adjusted nii $0.14 $0.01 7.50 ($0.23) ($0.02) ($0.12) $0.47 ($0.00) $0.02 7.00 $0.12 6.50 6.00 $7.09 $7.09 5.50 $6.85 5.00 4.50 4.00 12/31/20 NAV GAAP Net Interest Income Part II Incentive Net Unrealized Net Realized Gain Net Realized & Part II Incentive Distributions 3/31/21 NAV 1 Investment Accretion Related Fee Appreciation / / (Loss) Unrealized Gain Fee 1 Income to Merger (Depreciation) (Loss) Related to Accounting Merger Adjustments Accounting Adjustments Note: Net asset value per share amounts are based on the shares outstanding at each respective quarter end. Net investment income per share, net unrealized appreciation / (depreciation), and net realized gain / (loss) are based on the weighted average number of shares outstanding for the period. Numbers may not sum due to rounding. See page 20 for a description of the non-GAAP measures. 1 Excludes reclassifications of net unrealized appreciation / (depreciation) to net realized gains / (losses) as a result of investments exited during the quarter. 11Net Asset Value Per Share Bridge adjusted net realized and unrealized gains (losses) $8.00 $0.25 adjusted nii $0.14 $0.01 7.50 ($0.23) ($0.02) ($0.12) $0.47 ($0.00) $0.02 7.00 $0.12 6.50 6.00 $7.09 $7.09 5.50 $6.85 5.00 4.50 4.00 12/31/20 NAV GAAP Net Interest Income Part II Incentive Net Unrealized Net Realized Gain Net Realized & Part II Incentive Distributions 3/31/21 NAV 1 Investment Accretion Related Fee Appreciation / / (Loss) Unrealized Gain Fee 1 Income to Merger (Depreciation) (Loss) Related to Accounting Merger Adjustments Accounting Adjustments Note: Net asset value per share amounts are based on the shares outstanding at each respective quarter end. Net investment income per share, net unrealized appreciation / (depreciation), and net realized gain / (loss) are based on the weighted average number of shares outstanding for the period. Numbers may not sum due to rounding. See page 20 for a description of the non-GAAP measures. 1 Excludes reclassifications of net unrealized appreciation / (depreciation) to net realized gains / (losses) as a result of investments exited during the quarter. 11

Capital Structure Overview funding sources ($ in millions) 0.85x to 1.00x Principal target leverage ratio Committed Outstanding Interest Rate Maturity 1 2 Syndicated Credit Facility $800 $575 LIBOR + 2.00% 2/25/2024 2025 Notes 300 300 3.500% 2/25/2025 3 Citibank Facility 180 124 LIBOR + 1.70% / 2.25% 7/18/2023 Investment Facilities from OCSI 4 Deutsche Bank Facility 160 116 LIBOR + 2.65% 3/30/2022 Grade Rated Cash and Cash Equivalents -- (40) -- -- by moody’s and fitch Total $1,440 $1,075 Weighted Average Interest Rate 2.6% Net Debt to Equity Ratio 0.84x 27% unsecured maturities borrowings ($ in millions) $1,000 Extended and $225 500 Upsized $575 $56 $44 syndicated credit $300 $116 $124 facility on may 4, 2021 0 2020 2021 2022 2023 2024 2025 2026 Credit Facility Drawn Undrawn Credit Facility Unsecured Debt Diverse and flexible sources of debt capital As of March 31, 2021 Note: Numbers may not sum due to rounding. 1 On May 4, 2021, the Company amended the syndicated credit facility to, among other things, increase the total size to $950 million, extend the maturity to May 2026 and remove the pricing grid. 2 Interest rate spread can increase up to 2.75% depending on the senior coverage ratio and Obligor’s Net Worth. On May 4, 2021, the pricing grid was removed as part of an amendment. 12 3 Interest rate spread depends on asset type. 4 On May 4, 2021, the Company repaid all amounts outstanding under the Deutsche Bank Facility, following which the facility was terminated.Capital Structure Overview funding sources ($ in millions) 0.85x to 1.00x Principal target leverage ratio Committed Outstanding Interest Rate Maturity 1 2 Syndicated Credit Facility $800 $575 LIBOR + 2.00% 2/25/2024 2025 Notes 300 300 3.500% 2/25/2025 3 Citibank Facility 180 124 LIBOR + 1.70% / 2.25% 7/18/2023 Investment Facilities from OCSI 4 Deutsche Bank Facility 160 116 LIBOR + 2.65% 3/30/2022 Grade Rated Cash and Cash Equivalents -- (40) -- -- by moody’s and fitch Total $1,440 $1,075 Weighted Average Interest Rate 2.6% Net Debt to Equity Ratio 0.84x 27% unsecured maturities borrowings ($ in millions) $1,000 Extended and $225 500 Upsized $575 $56 $44 syndicated credit $300 $116 $124 facility on may 4, 2021 0 2020 2021 2022 2023 2024 2025 2026 Credit Facility Drawn Undrawn Credit Facility Unsecured Debt Diverse and flexible sources of debt capital As of March 31, 2021 Note: Numbers may not sum due to rounding. 1 On May 4, 2021, the Company amended the syndicated credit facility to, among other things, increase the total size to $950 million, extend the maturity to May 2026 and remove the pricing grid. 2 Interest rate spread can increase up to 2.75% depending on the senior coverage ratio and Obligor’s Net Worth. On May 4, 2021, the pricing grid was removed as part of an amendment. 12 3 Interest rate spread depends on asset type. 4 On May 4, 2021, the Company repaid all amounts outstanding under the Deutsche Bank Facility, following which the facility was terminated.

Funding and Liquidity Metrics leverage utilization liquidity rollforward ($ in millions) ($ in millions) $1,600 6/30/2020 9/30/2020 12/31/2020 3/31/2021 $1,440 1,400 Credit Facility Committed $700 $700 $800 $1,140 $325 Credit Facility Drawn (467) (415) (400) (815) 1,200 $1,100 $1,000 $1,000 Cash and Cash Equivalents 51 39 24 40 1,000 $400 Total Liquidity 284 324 424 365 $233 $285 800 1 Total Unfunded Commitments (155) (158) (198) (242) 600 Unavailable Unfunded 79 64 48 50 $1,115 2 Commitments 400 $767 $715 $700 Adjusted Liquidity $208 $230 $274 $173 200 0 3 Ample liquidity to support funding needs 6/30/2020 9/30/2020 12/31/2020 3/31/2021 Total Debt Outstanding Undrawn Capacity 6/30/2020 9/30/2020 12/31/2020 3/31/2021 Cash $51 $39 $24 $40 Net Assets $859 $915 $965 $1,279 Net Leverage 0.83x 0.74x 0.70x 0.84x Total Leverage 0.89x 0.78x 0.73x 0.87x 1 Excludes unfunded commitments to the Kemper JV and Glick JV. 2 Includes unfunded commitments ineligible to be drawn due to certain limitations in credit agreements. 3 As of March 31, 2021, we have analyzed cash and cash equivalents, availability under our credit facilities, the ability to rotate out of certain assets and amounts of unfunded commitments that could be drawn and believe our liquidity and capital resources are sufficient to take advantage of market opportunities in the current economic climate. 13Funding and Liquidity Metrics leverage utilization liquidity rollforward ($ in millions) ($ in millions) $1,600 6/30/2020 9/30/2020 12/31/2020 3/31/2021 $1,440 1,400 Credit Facility Committed $700 $700 $800 $1,140 $325 Credit Facility Drawn (467) (415) (400) (815) 1,200 $1,100 $1,000 $1,000 Cash and Cash Equivalents 51 39 24 40 1,000 $400 Total Liquidity 284 324 424 365 $233 $285 800 1 Total Unfunded Commitments (155) (158) (198) (242) 600 Unavailable Unfunded 79 64 48 50 $1,115 2 Commitments 400 $767 $715 $700 Adjusted Liquidity $208 $230 $274 $173 200 0 3 Ample liquidity to support funding needs 6/30/2020 9/30/2020 12/31/2020 3/31/2021 Total Debt Outstanding Undrawn Capacity 6/30/2020 9/30/2020 12/31/2020 3/31/2021 Cash $51 $39 $24 $40 Net Assets $859 $915 $965 $1,279 Net Leverage 0.83x 0.74x 0.70x 0.84x Total Leverage 0.89x 0.78x 0.73x 0.87x 1 Excludes unfunded commitments to the Kemper JV and Glick JV. 2 Includes unfunded commitments ineligible to be drawn due to certain limitations in credit agreements. 3 As of March 31, 2021, we have analyzed cash and cash equivalents, availability under our credit facilities, the ability to rotate out of certain assets and amounts of unfunded commitments that could be drawn and believe our liquidity and capital resources are sufficient to take advantage of market opportunities in the current economic climate. 13

Strategic Joint Ventures are Accretive to Earnings ocsl’s joint ventures are income-enhancing vehicles that primarily invest in senior secured loans of middle market companies and other corporate debt securities Key Attributes of Joint Ventures: • Equity ownership: 87.5% OCSL and 12.5% joint venture partner • Shared voting control: 50% OCSL and 50% joint venture partner kemper jv characteristics glick jv characteristics At fair value At fair value $130mm 5.6% $3.5mm $55mm 2.3% $1.3mm ocsl’s investments % of ocsl’s net investment ocsl’s investments % of ocsl’s net investment 1 2 in the kemper jv portfolio income in the glick jv portfolio income combined portfolio summary portfolio company wtd. avg. debt portfolio investment portfolio first lien count yield leverage ratio $454mm 94% 64 5.9% 1.3x As of March 31, 2021 1 Represents OCSL’s 87.5% share of the Kemper JV’s net investment income (excluding subordinated note interest expense) earned during the quarter ended March 31, 2021. 14 2 Represents 87.5% of the Glick JV’s net investment income (excluding subordinated note interest expense) earned during the quarter ended March 31, 2021 (including amounts accrued prior to the closing of the Merger). Strategic Joint Ventures are Accretive to Earnings ocsl’s joint ventures are income-enhancing vehicles that primarily invest in senior secured loans of middle market companies and other corporate debt securities Key Attributes of Joint Ventures: • Equity ownership: 87.5% OCSL and 12.5% joint venture partner • Shared voting control: 50% OCSL and 50% joint venture partner kemper jv characteristics glick jv characteristics At fair value At fair value $130mm 5.6% $3.5mm $55mm 2.3% $1.3mm ocsl’s investments % of ocsl’s net investment ocsl’s investments % of ocsl’s net investment 1 2 in the kemper jv portfolio income in the glick jv portfolio income combined portfolio summary portfolio company wtd. avg. debt portfolio investment portfolio first lien count yield leverage ratio $454mm 94% 64 5.9% 1.3x As of March 31, 2021 1 Represents OCSL’s 87.5% share of the Kemper JV’s net investment income (excluding subordinated note interest expense) earned during the quarter ended March 31, 2021. 14 2 Represents 87.5% of the Glick JV’s net investment income (excluding subordinated note interest expense) earned during the quarter ended March 31, 2021 (including amounts accrued prior to the closing of the Merger).
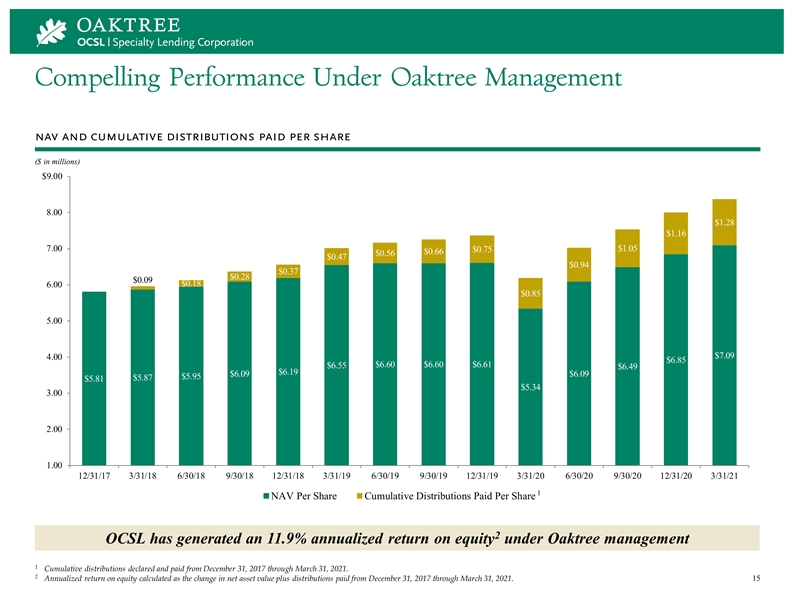
Compelling Performance Under Oaktree Management nav and cumulative distributions paid per share ($ in millions) $9.00 8.00 $1.28 $1.16 7.00 $1.05 $0.75 $0.66 $0.56 $0.47 $0.94 $0.37 $0.28 $0.09 $0.18 6.00 $0.85 5.00 $7.09 4.00 $6.85 $6.60 $6.60 $6.61 $6.55 $6.49 $6.19 $6.09 $6.09 $5.95 $5.87 $5.81 $5.34 3.00 2.00 1.00 12/31/17 3/31/18 6/30/18 9/30/18 12/31/18 3/31/19 6/30/19 9/30/19 12/31/19 3/31/20 6/30/20 9/30/20 12/31/20 3/31/21 1 NAV Per Share Cumulative Distributions Paid Per Share 2 OCSL has generated an 11.9% annualized return on equity under Oaktree management 1 Cumulative distributions declared and paid from December 31, 2017 through March 31, 2021. 2 Annualized return on equity calculated as the change in net asset value plus distributions paid from December 31, 2017 through March 31, 2021. 15Compelling Performance Under Oaktree Management nav and cumulative distributions paid per share ($ in millions) $9.00 8.00 $1.28 $1.16 7.00 $1.05 $0.75 $0.66 $0.56 $0.47 $0.94 $0.37 $0.28 $0.09 $0.18 6.00 $0.85 5.00 $7.09 4.00 $6.85 $6.60 $6.60 $6.61 $6.55 $6.49 $6.19 $6.09 $6.09 $5.95 $5.87 $5.81 $5.34 3.00 2.00 1.00 12/31/17 3/31/18 6/30/18 9/30/18 12/31/18 3/31/19 6/30/19 9/30/19 12/31/19 3/31/20 6/30/20 9/30/20 12/31/20 3/31/21 1 NAV Per Share Cumulative Distributions Paid Per Share 2 OCSL has generated an 11.9% annualized return on equity under Oaktree management 1 Cumulative distributions declared and paid from December 31, 2017 through March 31, 2021. 2 Annualized return on equity calculated as the change in net asset value plus distributions paid from December 31, 2017 through March 31, 2021. 15

Opportunities to Increase Return on Equity 1 2 3 4 optimization of realization of rotate into higher- operate within target joint ventures merger synergies yielding investments leverage range • $163 million at fair value of • Current target leverage range: • Opportunity to increase • Merger with OCSI closed on senior secured loans priced at 0.85x to 1.00x debt to equity underlying portfolio yields by March 19, 2021 1 rotating into higher spread in or below LIBOR + 4.50% • 0.87x total debt to equity; 0.84x • Operational synergies resulting investments – Acquired $102 million of from the elimination of net debt to equity – $76 million of investments these investments following duplicative expenses expected closing of merger with OCSI priced at or below L+375 in • $325 million of undrawn to result in near-term G&A the Kemper and Glick JVs 2 capacity under credit facilities savings • Exited $49 million of lower yielding senior secured loans • Utilize additional borrowings to • Would need to utilize • Streamlined capital structure operate within target leverage during the quarter ended March approximately $110 million of anticipated to result in interest range 31, 2021 additional borrowings to reach expense savings the midpoint of target leverage – Target leverage range: 1.25x • $318 million of new investment • Base management fee waiver range (0.925x) to 1.75x debt to equity commitments had a weighted totaling $6 million for two – 1.3x and 1.2x total debt to average yield of 8.2% during years ($0.75 million per equity at Kemper JV and the quarter ended March 31, quarter) Glick JV, respectively 2021 We believe OCSL is well-positioned to provide further improvements to return on equity As of March 31, 2021 1 For senior secured loans that have a cost basis above 92.5%. 2 Subject to borrowing base and other limitations. 16Opportunities to Increase Return on Equity 1 2 3 4 optimization of realization of rotate into higher- operate within target joint ventures merger synergies yielding investments leverage range • $163 million at fair value of • Current target leverage range: • Opportunity to increase • Merger with OCSI closed on senior secured loans priced at 0.85x to 1.00x debt to equity underlying portfolio yields by March 19, 2021 1 rotating into higher spread in or below LIBOR + 4.50% • 0.87x total debt to equity; 0.84x • Operational synergies resulting investments – Acquired $102 million of from the elimination of net debt to equity – $76 million of investments these investments following duplicative expenses expected closing of merger with OCSI priced at or below L+375 in • $325 million of undrawn to result in near-term G&A the Kemper and Glick JVs 2 capacity under credit facilities savings • Exited $49 million of lower yielding senior secured loans • Utilize additional borrowings to • Would need to utilize • Streamlined capital structure operate within target leverage during the quarter ended March approximately $110 million of anticipated to result in interest range 31, 2021 additional borrowings to reach expense savings the midpoint of target leverage – Target leverage range: 1.25x • $318 million of new investment • Base management fee waiver range (0.925x) to 1.75x debt to equity commitments had a weighted totaling $6 million for two – 1.3x and 1.2x total debt to average yield of 8.2% during years ($0.75 million per equity at Kemper JV and the quarter ended March 31, quarter) Glick JV, respectively 2021 We believe OCSL is well-positioned to provide further improvements to return on equity As of March 31, 2021 1 For senior secured loans that have a cost basis above 92.5%. 2 Subject to borrowing base and other limitations. 16
AppendixAppendix
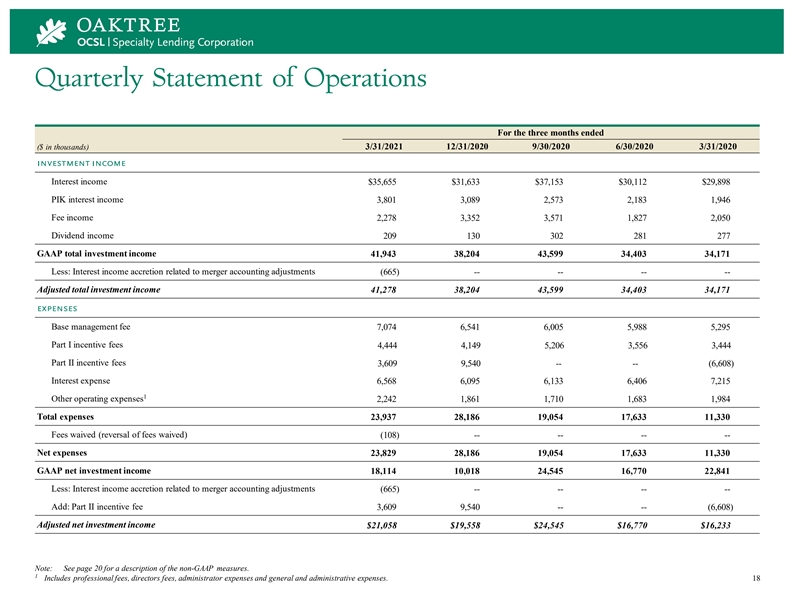
Quarterly Statement of Operations For the three months ended 3/31/2021 12/31/2020 9/30/2020 6/30/2020 3/31/2020 ($ in thousands) investment income Interest income $35,655 $31,633 $37,153 $30,112 $29,898 PIK interest income 3,801 3,089 2,573 2,183 1,946 Fee income 2,278 3,352 3,571 1,827 2,050 Dividend income 209 130 302 281 277 GAAP total investment income 41,943 38,204 43,599 34,403 34,171 Less: Interest income accretion related to merger accounting adjustments (665) -- -- -- -- Adjusted total investment income 41,278 38,204 43,599 34,403 34,171 expenses Base management fee 7,074 6,541 6,005 5,988 5,295 Part I incentive fees 4,444 4,149 5,206 3,556 3,444 Part II incentive fees 3,609 9,540 -- -- (6,608) Interest expense 6,568 6,095 6,133 6,406 7,215 1 Other operating expenses 2,242 1,861 1,710 1,683 1,984 Total expenses 23,937 28,186 19,054 17,633 11,330 Fees waived (reversal of fees waived) (108) -- -- -- -- Net expenses 23,829 28,186 19,054 17,633 11,330 GAAP net investment income 18,114 10,018 24,545 16,770 22,841 Less: Interest income accretion related to merger accounting adjustments (665) -- -- -- -- Add: Part II incentive fee 3,609 9,540 -- -- (6,608) Adjusted net investment income $21,058 $19,558 $24,545 $16,770 $16,233 Note: See page 20 for a description of the non-GAAP measures. 1 Includes professional fees, directors fees, administrator expenses and general and administrative expenses. 18Quarterly Statement of Operations For the three months ended 3/31/2021 12/31/2020 9/30/2020 6/30/2020 3/31/2020 ($ in thousands) investment income Interest income $35,655 $31,633 $37,153 $30,112 $29,898 PIK interest income 3,801 3,089 2,573 2,183 1,946 Fee income 2,278 3,352 3,571 1,827 2,050 Dividend income 209 130 302 281 277 GAAP total investment income 41,943 38,204 43,599 34,403 34,171 Less: Interest income accretion related to merger accounting adjustments (665) -- -- -- -- Adjusted total investment income 41,278 38,204 43,599 34,403 34,171 expenses Base management fee 7,074 6,541 6,005 5,988 5,295 Part I incentive fees 4,444 4,149 5,206 3,556 3,444 Part II incentive fees 3,609 9,540 -- -- (6,608) Interest expense 6,568 6,095 6,133 6,406 7,215 1 Other operating expenses 2,242 1,861 1,710 1,683 1,984 Total expenses 23,937 28,186 19,054 17,633 11,330 Fees waived (reversal of fees waived) (108) -- -- -- -- Net expenses 23,829 28,186 19,054 17,633 11,330 GAAP net investment income 18,114 10,018 24,545 16,770 22,841 Less: Interest income accretion related to merger accounting adjustments (665) -- -- -- -- Add: Part II incentive fee 3,609 9,540 -- -- (6,608) Adjusted net investment income $21,058 $19,558 $24,545 $16,770 $16,233 Note: See page 20 for a description of the non-GAAP measures. 1 Includes professional fees, directors fees, administrator expenses and general and administrative expenses. 18
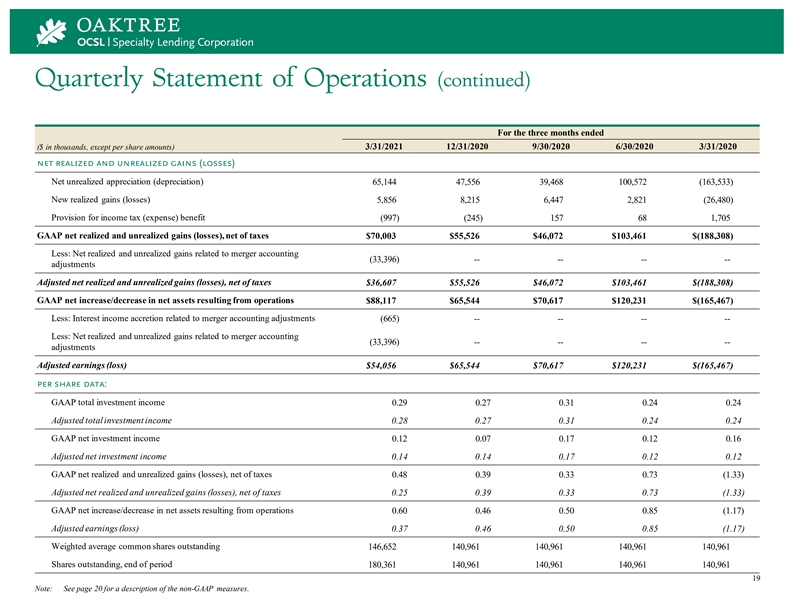
Quarterly Statement of Operations (continued) For the three months ended 3/31/2021 12/31/2020 9/30/2020 6/30/2020 3/31/2020 ($ in thousands, except per share amounts) net realized and unrealized gains (losses) Net unrealized appreciation (depreciation) 65,144 47,556 39,468 100,572 (163,533) New realized gains (losses) 5,856 8,215 6,447 2,821 (26,480) Provision for income tax (expense) benefit (997) (245) 157 68 1,705 GAAP net realized and unrealized gains (losses), net of taxes $70,003 $55,526 $46,072 $103,461 $(188,308) Less: Net realized and unrealized gains related to merger accounting (33,396) -- -- -- -- adjustments Adjusted net realized and unrealized gains (losses), net of taxes $36,607 $55,526 $46,072 $103,461 $(188,308) GAAP net increase/decrease in net assets resulting from operations $88,117 $65,544 $70,617 $120,231 $(165,467) Less: Interest income accretion related to merger accounting adjustments (665) -- -- -- -- Less: Net realized and unrealized gains related to merger accounting (33,396) -- -- -- -- adjustments Adjusted earnings (loss) $54,056 $65,544 $70,617 $120,231 $(165,467) per share data: GAAP total investment income 0.29 0.27 0.31 0.24 0.24 Adjusted total investment income 0.28 0.27 0.31 0.24 0.24 GAAP net investment income 0.12 0.07 0.17 0.12 0.16 Adjusted net investment income 0.14 0.14 0.17 0.12 0.12 GAAP net realized and unrealized gains (losses), net of taxes 0.48 0.39 0.33 0.73 (1.33) Adjusted net realized and unrealized gains (losses), net of taxes 0.25 0.39 0.33 0.73 (1.33) GAAP net increase/decrease in net assets resulting from operations 0.60 0.46 0.50 0.85 (1.17) Adjusted earnings (loss) 0.37 0.46 0.50 0.85 (1.17) Weighted average common shares outstanding 146,652 140,961 140,961 140,961 140,961 Shares outstanding, end of period 180,361 140,961 140,961 140,961 140,961 19 Note: See page 20 for a description of the non-GAAP measures.Quarterly Statement of Operations (continued) For the three months ended 3/31/2021 12/31/2020 9/30/2020 6/30/2020 3/31/2020 ($ in thousands, except per share amounts) net realized and unrealized gains (losses) Net unrealized appreciation (depreciation) 65,144 47,556 39,468 100,572 (163,533) New realized gains (losses) 5,856 8,215 6,447 2,821 (26,480) Provision for income tax (expense) benefit (997) (245) 157 68 1,705 GAAP net realized and unrealized gains (losses), net of taxes $70,003 $55,526 $46,072 $103,461 $(188,308) Less: Net realized and unrealized gains related to merger accounting (33,396) -- -- -- -- adjustments Adjusted net realized and unrealized gains (losses), net of taxes $36,607 $55,526 $46,072 $103,461 $(188,308) GAAP net increase/decrease in net assets resulting from operations $88,117 $65,544 $70,617 $120,231 $(165,467) Less: Interest income accretion related to merger accounting adjustments (665) -- -- -- -- Less: Net realized and unrealized gains related to merger accounting (33,396) -- -- -- -- adjustments Adjusted earnings (loss) $54,056 $65,544 $70,617 $120,231 $(165,467) per share data: GAAP total investment income 0.29 0.27 0.31 0.24 0.24 Adjusted total investment income 0.28 0.27 0.31 0.24 0.24 GAAP net investment income 0.12 0.07 0.17 0.12 0.16 Adjusted net investment income 0.14 0.14 0.17 0.12 0.12 GAAP net realized and unrealized gains (losses), net of taxes 0.48 0.39 0.33 0.73 (1.33) Adjusted net realized and unrealized gains (losses), net of taxes 0.25 0.39 0.33 0.73 (1.33) GAAP net increase/decrease in net assets resulting from operations 0.60 0.46 0.50 0.85 (1.17) Adjusted earnings (loss) 0.37 0.46 0.50 0.85 (1.17) Weighted average common shares outstanding 146,652 140,961 140,961 140,961 140,961 Shares outstanding, end of period 180,361 140,961 140,961 140,961 140,961 19 Note: See page 20 for a description of the non-GAAP measures.
Non-GAAP Disclosures On March 19, 2021, the Company completed the Merger. The Merger was accounted for as an asset acquisition in accordance with the asset acquisition method of accounting as detailed in ASC 805-50, Business Combinations—Related Issues ( ASC 805 ). The consideration paid to OCSI’s stockholders was allocated to the individual assets acquired and liabilities assumed based on the relative fair values of the net identifiable assets acquired other than non-qualifying assets, which established a new cost basis for the acquired OCSI investments under ASC 805 that, in aggregate, was significantly lower than the historical cost basis of the acquired OCSI investments prior to the Merger. Additionally, immediately following the completion of the Merger, the acquired OCSI investments were marked to their respective fair values under ASC 820, Fair Value Measurements, which resulted in unrealized appreciation. The new cost basis established by ASC 805 on debt investments acquired will accrete over the life of each respective debt investment through interest income, with a corresponding adjustment recorded to unrealized appreciation on such investment acquired through its ultimate disposition. The new cost basis established by ASC 805 on equity investments acquired will not accrete over the life of such investments through interest income and, assuming no subsequent change to the fair value of the equity investments acquired and disposition of such equity investments at fair value, the Company will recognize a realized gain with a corresponding reversal of the unrealized appreciation on disposition of such equity investments acquired. On March 19, 2021, in connection with the closing of the Merger, OCSL entered into an amended and restated investment advisory agreement (the “A&R Advisory Agreement”) with Oaktree Fund Advisors, LLC (the “Adviser”). The A&R Advisory Agreement amended and restated the existing investment advisory agreement, dated as of May 4, 2020, by and between the Company and the Adviser to (1) waive an aggregate of $6 million of base management fees otherwise payable to the Adviser in the two years following the closing of the Merger at a rate of $750,000 per quarter (with such amount appropriately prorated for any partial quarter) and (2) revise the calculation of the incentive fees to eliminate certain unintended consequences of the accounting treatment of the Merger on the incentive fees payable to the Adviser. The Company’s management uses the non-GAAP financial measures described above internally to analyze and evaluate financial results and performance and to compare its financial results with those of other business development companies that have not adjusted the cost basis of certain investments pursuant to ASC 805. The Company’s management believes Adjusted Total Investment Income , Adjusted Total Investment Income Per Share , Adjusted Net Investment Income and Adjusted Net Investment Income Per Share are useful to investors as an additional tool to evaluate ongoing results and trends for the Company without giving effect to the accretion income resulting from the new cost basis of the OCSI investments acquired in the Merger because these amounts do not impact the fees payable to the Adviser under the A&R Advisory Agreement, and specifically as its relates to Adjusted Net Investment Income and Adjusted Net Investment Income Per Share , without giving effect to Part II incentive fees. In addition, the Company’s management believes that “Adjusted Net Realized and Unrealized Gains (Losses), Net of Taxes”, “Adjusted Net Realized and Unrealized Gains (Losses), Net of Taxes Per Share”, “Adjusted Earnings (Loss)” and “Adjusted Earnings (Loss) Per Share” are useful to investors as they exclude the non-cash income/gain resulting from the Merger and used by management to evaluate the economic earnings of its investment portfolio. Moreover, these metrics align the Company's key financial measures with the calculation of incentive fees payable to the Adviser under with the A&R Advisory Agreement (i.e., excluding amounts resulting solely from the lower cost basis of the acquired OCSI investments established by ASC 805 that would have been to the benefit of the Adviser absent such exclusion). 20Non-GAAP Disclosures On March 19, 2021, the Company completed the Merger. The Merger was accounted for as an asset acquisition in accordance with the asset acquisition method of accounting as detailed in ASC 805-50, Business Combinations—Related Issues ( ASC 805 ). The consideration paid to OCSI’s stockholders was allocated to the individual assets acquired and liabilities assumed based on the relative fair values of the net identifiable assets acquired other than non-qualifying assets, which established a new cost basis for the acquired OCSI investments under ASC 805 that, in aggregate, was significantly lower than the historical cost basis of the acquired OCSI investments prior to the Merger. Additionally, immediately following the completion of the Merger, the acquired OCSI investments were marked to their respective fair values under ASC 820, Fair Value Measurements, which resulted in unrealized appreciation. The new cost basis established by ASC 805 on debt investments acquired will accrete over the life of each respective debt investment through interest income, with a corresponding adjustment recorded to unrealized appreciation on such investment acquired through its ultimate disposition. The new cost basis established by ASC 805 on equity investments acquired will not accrete over the life of such investments through interest income and, assuming no subsequent change to the fair value of the equity investments acquired and disposition of such equity investments at fair value, the Company will recognize a realized gain with a corresponding reversal of the unrealized appreciation on disposition of such equity investments acquired. On March 19, 2021, in connection with the closing of the Merger, OCSL entered into an amended and restated investment advisory agreement (the “A&R Advisory Agreement”) with Oaktree Fund Advisors, LLC (the “Adviser”). The A&R Advisory Agreement amended and restated the existing investment advisory agreement, dated as of May 4, 2020, by and between the Company and the Adviser to (1) waive an aggregate of $6 million of base management fees otherwise payable to the Adviser in the two years following the closing of the Merger at a rate of $750,000 per quarter (with such amount appropriately prorated for any partial quarter) and (2) revise the calculation of the incentive fees to eliminate certain unintended consequences of the accounting treatment of the Merger on the incentive fees payable to the Adviser. The Company’s management uses the non-GAAP financial measures described above internally to analyze and evaluate financial results and performance and to compare its financial results with those of other business development companies that have not adjusted the cost basis of certain investments pursuant to ASC 805. The Company’s management believes Adjusted Total Investment Income , Adjusted Total Investment Income Per Share , Adjusted Net Investment Income and Adjusted Net Investment Income Per Share are useful to investors as an additional tool to evaluate ongoing results and trends for the Company without giving effect to the accretion income resulting from the new cost basis of the OCSI investments acquired in the Merger because these amounts do not impact the fees payable to the Adviser under the A&R Advisory Agreement, and specifically as its relates to Adjusted Net Investment Income and Adjusted Net Investment Income Per Share , without giving effect to Part II incentive fees. In addition, the Company’s management believes that “Adjusted Net Realized and Unrealized Gains (Losses), Net of Taxes”, “Adjusted Net Realized and Unrealized Gains (Losses), Net of Taxes Per Share”, “Adjusted Earnings (Loss)” and “Adjusted Earnings (Loss) Per Share” are useful to investors as they exclude the non-cash income/gain resulting from the Merger and used by management to evaluate the economic earnings of its investment portfolio. Moreover, these metrics align the Company's key financial measures with the calculation of incentive fees payable to the Adviser under with the A&R Advisory Agreement (i.e., excluding amounts resulting solely from the lower cost basis of the acquired OCSI investments established by ASC 805 that would have been to the benefit of the Adviser absent such exclusion). 20