
Exhibit 99.2 second quarter 2023 earnings presentation may 4, 2023 nasdaq: ocsl

Forward Looking Statements & Legal Disclosures Some of the statements in this presentation constitute forward-looking statements because they relate to future events or our future performance or financial condition. The forward- looking statements contained in this presentation may include statements as to: our future operating results and distribution projections; the ability of Oaktree Fund Advisors, LLC (together with its affiliates, “Oaktree”) to reposition our portfolio and to implement Oaktree’s future plans with respect to our business; the ability of Oaktree and its affiliates to attract and retain highly talented professionals; our business prospects and the prospects of our portfolio companies; the impact of the investments that we expect to make; the ability of our portfolio companies to achieve their objectives; our expected financings and investments and additional leverage we may seek to incur in the future; the adequacy of our cash resources and working capital; the timing of cash flows, if any, from the operations of our portfolio companies; and the cost or potential outcome of any litigation to which we may be a party. In addition, words such as “anticipate,” “believe,” “expect,” “seek,” “plan,” “should,” “estimate,” “project” and “intend” indicate forward-looking statements, although not all forward-looking statements include these words. The forward-looking statements contained in this presentation involve risks and uncertainties. Our actual results could differ materially from those implied or expressed in the forward-looking statements for any reason, including the factors set forth in “Risk Factors” and elsewhere in our annual report on Form 10-K for the fiscal year ended September 30, 2022 and our quarterly report on Form 10-Q for the quarter ended March 31, 2023. Other factors that could cause actual results to differ materially include: changes in the economy, financial markets and political environment; risks associated with possible disruption in our operations or the economy generally due to terrorism, war or other geopolitical conflict (including the current conflict between Russia and Ukraine), natural disasters or pandemics; future changes in laws or regulations (including the interpretation of these laws and regulations by regulatory authorities) and conditions in our operating areas, particularly with respect to business development companies or regulated investment companies; and other considerations disclosed from time to time in our publicly disseminated documents and filings. We have based the forward-looking statements included in this presentation on information available to us on the date of this presentation, and we assume no obligation to update any such forward-looking statements. Although we undertake no obligation to revise or update any forward-looking statements, whether as a result of new information, future events or otherwise, you are advised to consult any additional disclosures that we may make directly to you or through reports that we in the future may file with the SEC, including annual reports on Form 10-K, quarterly reports on Form 10-Q and current reports on Form 8-K. Calculation of Assets Under Management References to total assets under management or AUM represent assets managed by Oaktree and a proportionate amount of the AUM reported by DoubleLine Capital LP ( DoubleLine Capital ), in which Oaktree owns a 20% minority interest. Oaktree's methodology for calculating AUM includes (i) the net asset value (“NAV”) of assets managed directly by Oaktree, (ii) the leverage on which management fees are charged, (iii) undrawn capital that Oaktree is entitled to call from investors in Oaktree funds pursuant to their capital commitments, (iv) for collateralized loan obligation vehicles ( CLOs ), the aggregate par value of collateral assets and principal cash, (v) for publicly-traded business development companies, gross assets (including assets acquired with leverage), net of cash, and (vi) Oaktree's pro rata portion (20%) of the AUM reported by DoubleLine Capital. This calculation of AUM is not based on the definitions of AUM that may be set forth in agreements governing the investment funds, vehicles or accounts managed and is not calculated pursuant to regulatory definitions. Unless otherwise indicated, data provided herein are dated as of March 31, 2023. 1
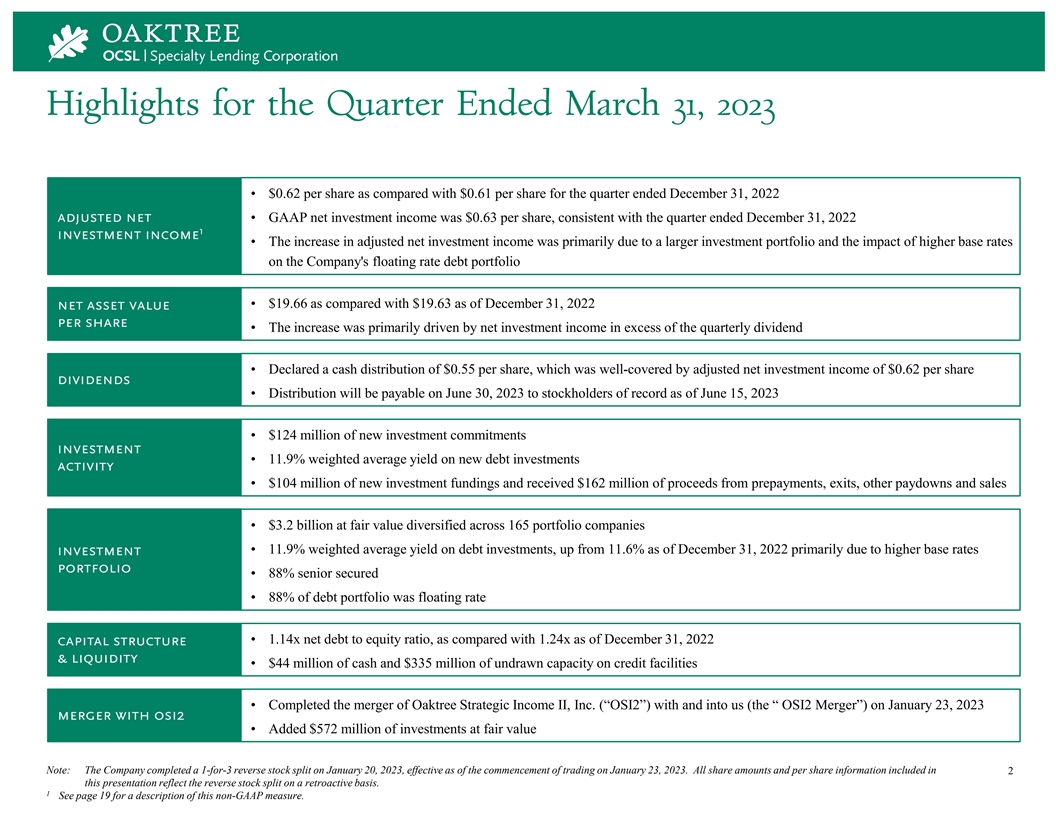
Highlights for the Quarter Ended March 31, 2023 • $0.62 per share as compared with $0.61 per share for the quarter ended December 31, 2022 adjusted net • GAAP net investment income was $0.63 per share, consistent with the quarter ended December 31, 2022 1 investment income • The increase in adjusted net investment income was primarily due to a larger investment portfolio and the impact of higher base rates on the Company's floating rate debt portfolio • $19.66 as compared with $19.63 as of December 31, 2022 net asset value per share • The increase was primarily driven by net investment income in excess of the quarterly dividend • Declared a cash distribution of $0.55 per share, which was well-covered by adjusted net investment income of $0.62 per share dividends • Distribution will be payable on June 30, 2023 to stockholders of record as of June 15, 2023 • $124 million of new investment commitments investment • 11.9% weighted average yield on new debt investments activity • $104 million of new investment fundings and received $162 million of proceeds from prepayments, exits, other paydowns and sales • $3.2 billion at fair value diversified across 165 portfolio companies • 11.9% weighted average yield on debt investments, up from 11.6% as of December 31, 2022 primarily due to higher base rates investment portfolio • 88% senior secured • 88% of debt portfolio was floating rate • 1.14x net debt to equity ratio, as compared with 1.24x as of December 31, 2022 capital structure & liquidity • $44 million of cash and $335 million of undrawn capacity on credit facilities • Completed the merger of Oaktree Strategic Income II, Inc. (“OSI2”) with and into us (the “ OSI2 Merger”) on January 23, 2023 merger with osi2 • Added $572 million of investments at fair value Note: The Company completed a 1-for-3 reverse stock split on January 20, 2023, effective as of the commencement of trading on January 23, 2023. All share amounts and per share information included in 2 this presentation reflect the reverse stock split on a retroactive basis. 1 See page 19 for a description of this non-GAAP measure.
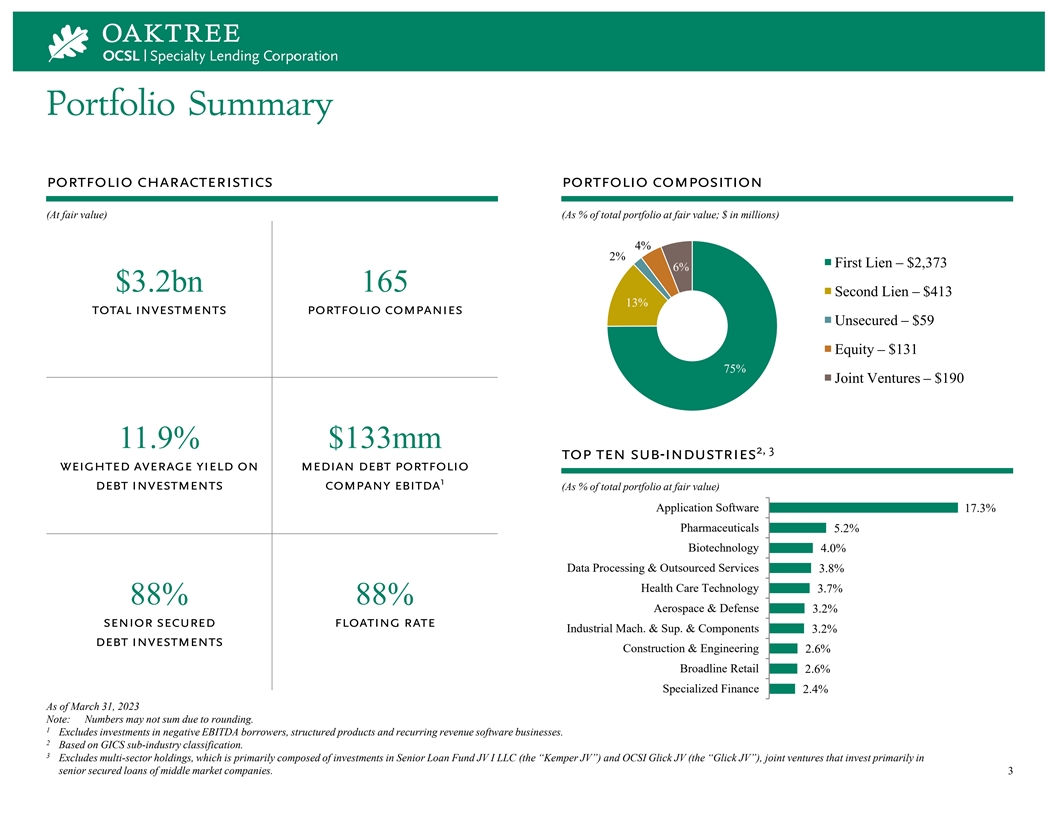
Portfolio Summary portfolio characteristics portfolio composition (At fair value) (As % of total portfolio at fair value; $ in millions) 4% 2% First Lien – $2,373 6% $3.2bn 165 Second Lien – $413 13% total investments portfolio companies Unsecured – $59 Equity – $131 75% Joint Ventures – $190 11.9% $133mm 2, 3 top ten sub-industries weighted average yield on median debt portfolio 1 debt investments company ebitda (As % of total portfolio at fair value) Application Software 17.3% Pharmaceuticals 5.2% Biotechnology 4.0% Data Processing & Outsourced Services 3.8% Health Care Technology 3.7% 88% 88% Aerospace & Defense 3.2% senior secured floating rate Industrial Mach. & Sup. & Components 3.2% debt investments Construction & Engineering 2.6% Broadline Retail 2.6% Specialized Finance 2.4% As of March 31, 2023 Note: Numbers may not sum due to rounding. 1 Excludes investments in negative EBITDA borrowers, structured products and recurring revenue software businesses. 2 Based on GICS sub-industry classification. 3 Excludes multi-sector holdings, which is primarily composed of investments in Senior Loan Fund JV I LLC (the “Kemper JV”) and OCSI Glick JV (the “Glick JV”), joint ventures that invest primarily in senior secured loans of middle market companies. 3
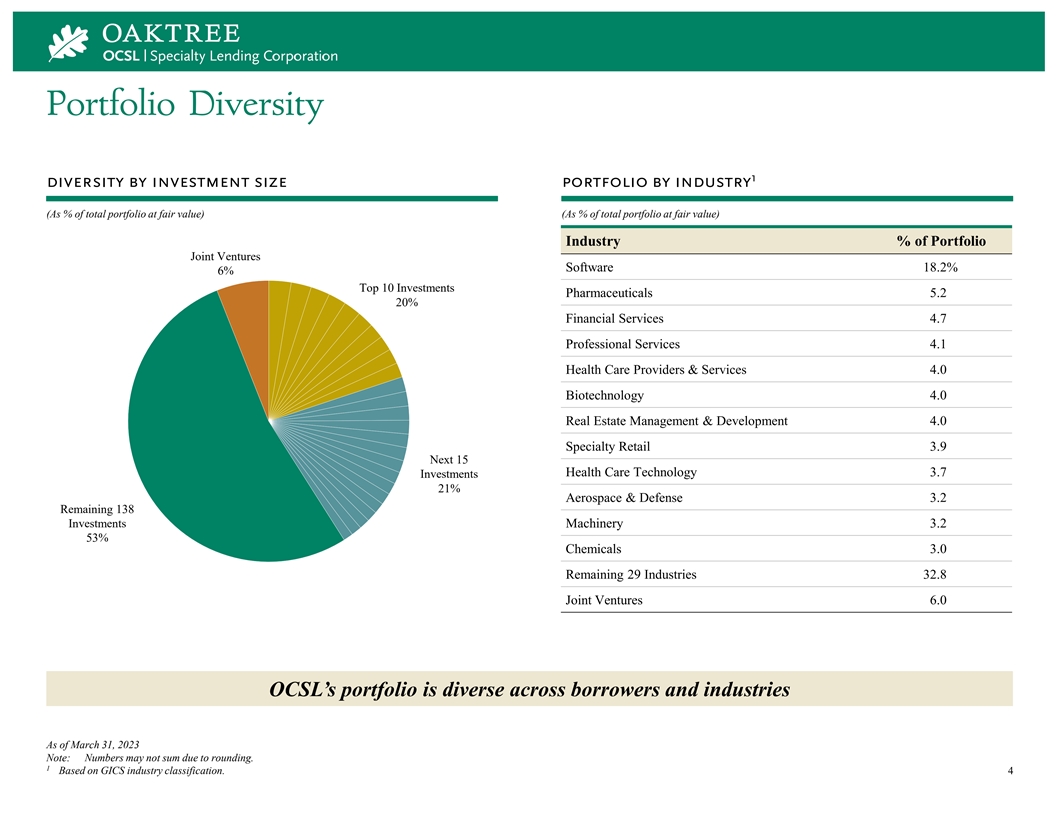
Portfolio Diversity 1 diversity by investment size portfolio by industry (As % of total portfolio at fair value) (As % of total portfolio at fair value) Industry % of Portfolio Joint Ventures Software 18.2% 6% Top 10 Investments Pharmaceuticals 5.2 20% Financial Services 4.7 Professional Services 4.1 Health Care Providers & Services 4.0 Biotechnology 4.0 Real Estate Management & Development 4.0 Specialty Retail 3.9 Next 15 Health Care Technology 3.7 Investments 21% Aerospace & Defense 3.2 Remaining 138 Investments Machinery 3.2 53% Chemicals 3.0 Remaining 29 Industries 32.8 Joint Ventures 6.0 OCSL’s portfolio is diverse across borrowers and industries As of March 31, 2023 Note: Numbers may not sum due to rounding. 1 Based on GICS industry classification. 4
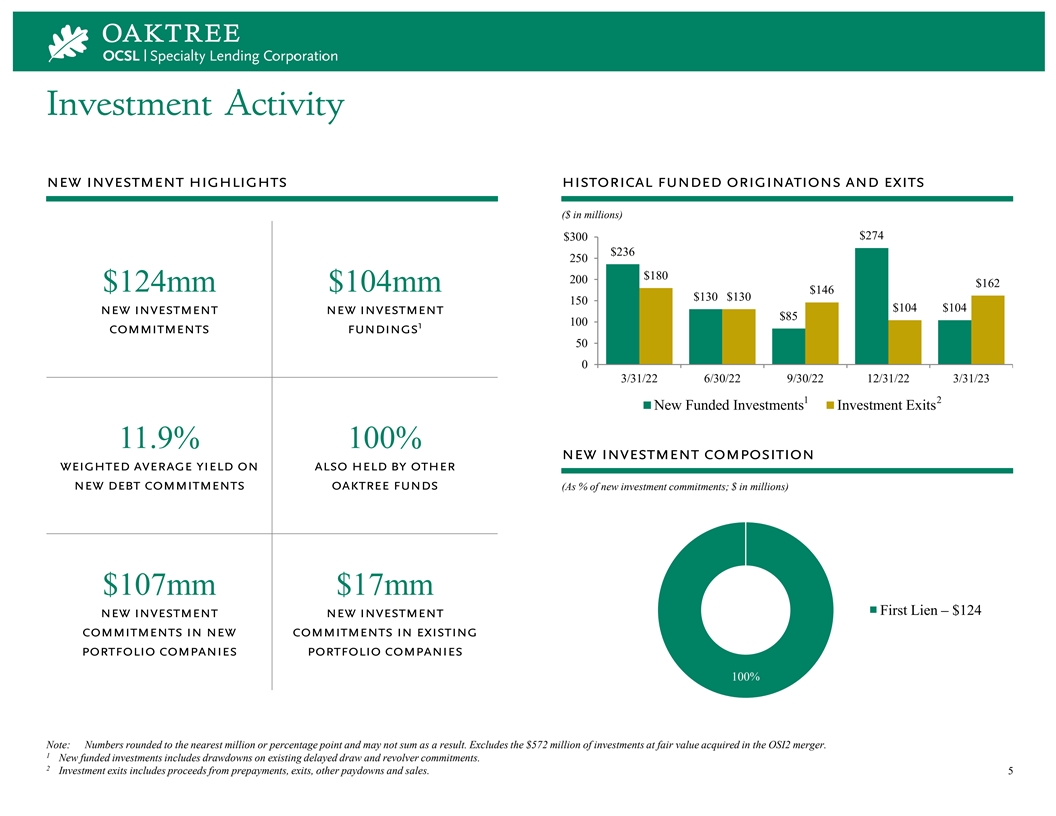
Investment Activity new investment highlights historical funded originations and exits ($ in millions) $274 $300 $236 250 $180 200 $162 $124mm $104mm $146 $130 $130 150 $104 $104 new investment new investment $85 100 1 commitments fundings 50 0 3/31/22 6/30/22 9/30/22 12/31/22 3/31/23 1 2 New Funded Investments Investment Exits 11.9% 100% new investment composition weighted average yield on also held by other new debt commitments oaktree funds (As % of new investment commitments; $ in millions) $107mm $17mm First Lien – $124 new investment new investment commitments in new commitments in existing portfolio companies portfolio companies 100% Note: Numbers rounded to the nearest million or percentage point and may not sum as a result. Excludes the $572 million of investments at fair value acquired in the OSI2 merger. 1 New funded investments includes drawdowns on existing delayed draw and revolver commitments. 2 Investment exits includes proceeds from prepayments, exits, other paydowns and sales. 5
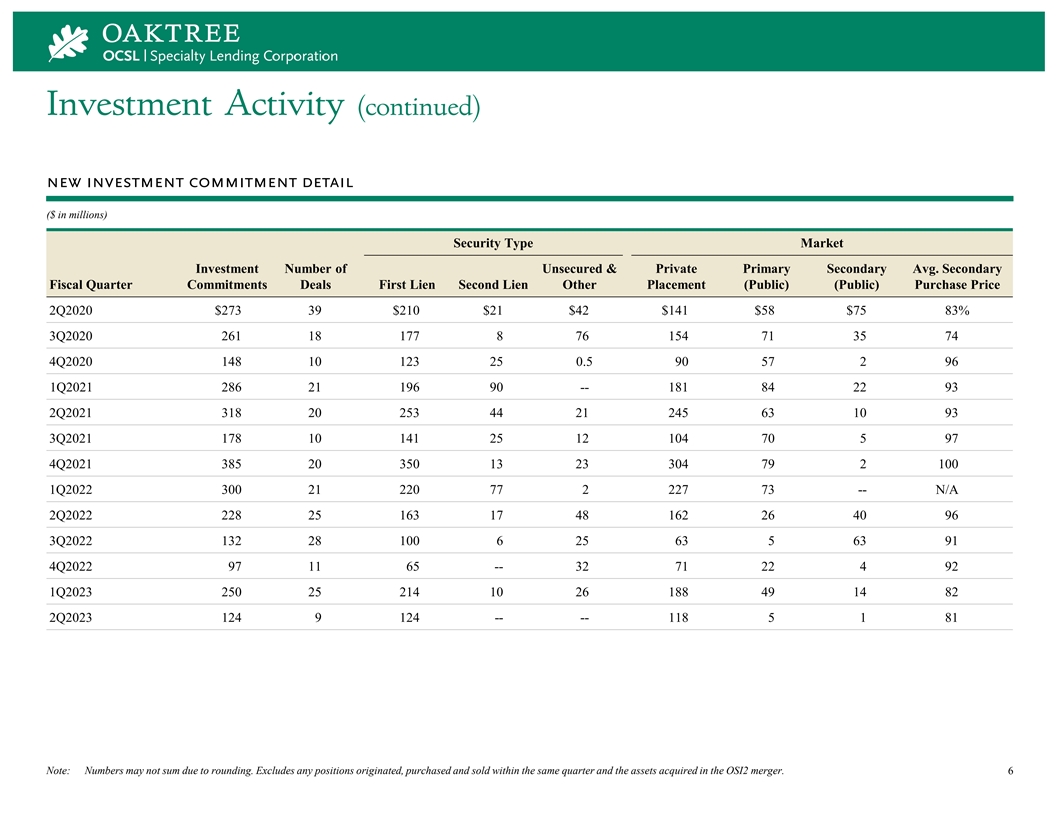
Investment Activity (continued) new investment commitment detail ($ in millions) Security Type Market Investment Number of Unsecured & Private Primary Secondary Avg. Secondary Fiscal Quarter Commitments Deals First Lien Second Lien Other Placement (Public) (Public) Purchase Price 2Q2020 $273 39 $210 $21 $42 $141 $58 $75 83% 3Q2020 261 18 177 8 76 154 71 35 74 4Q2020 148 10 123 25 0.5 90 57 2 96 1Q2021 286 21 196 90 -- 181 84 22 93 2Q2021 318 20 253 44 21 245 63 10 93 3Q2021 178 10 141 25 12 104 70 5 97 4Q2021 385 20 350 13 23 304 79 2 100 1Q2022 300 21 220 77 2 227 73 -- N/A 2Q2022 228 25 163 17 48 162 26 40 96 3Q2022 132 28 100 6 25 63 5 63 91 4Q2022 97 11 65 -- 32 71 22 4 92 1Q2023 250 25 214 10 26 188 49 14 82 2Q2023 124 9 124 -- -- 118 5 1 81 Note: Numbers may not sum due to rounding. Excludes any positions originated, purchased and sold within the same quarter and the assets acquired in the OSI2 merger. 6
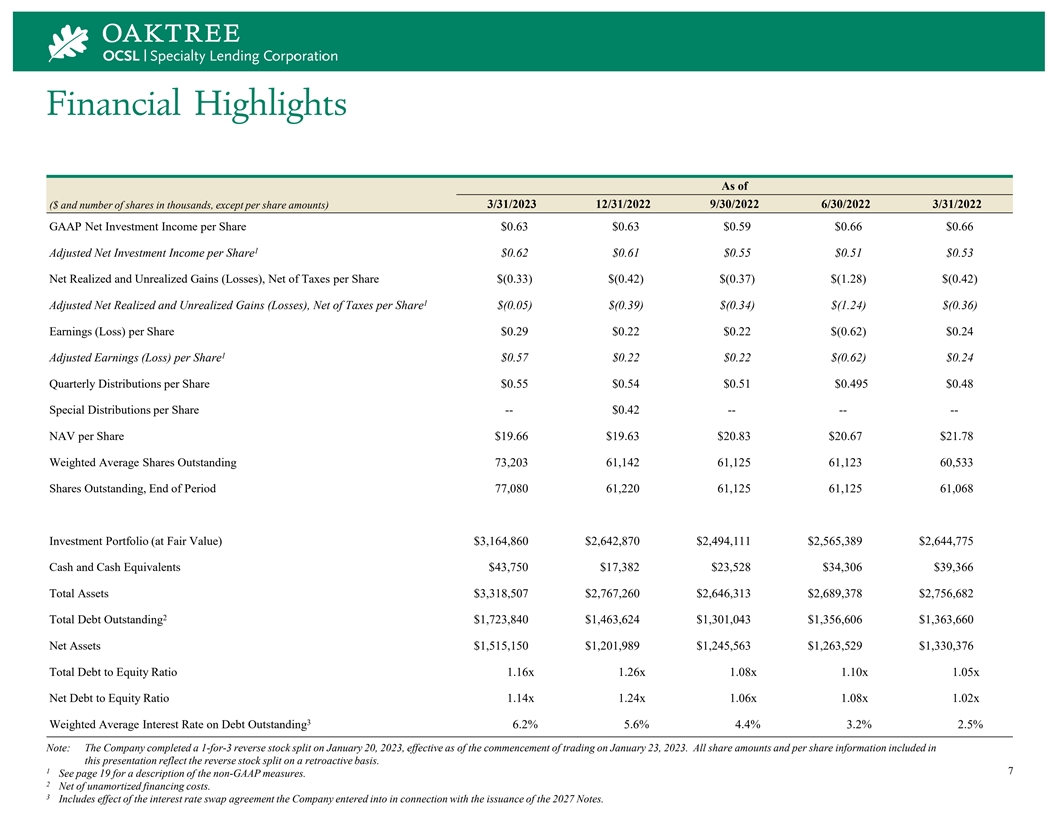
Financial Highlights As of ($ and number of shares in thousands, except per share amounts) 3/31/2023 12/31/2022 9/30/2022 6/30/2022 3/31/2022 GAAP Net Investment Income per Share $0.63 $0.63 $0.59 $0.66 $0.66 1 Adjusted Net Investment Income per Share $0.62 $0.61 $0.55 $0.51 $0.53 Net Realized and Unrealized Gains (Losses), Net of Taxes per Share $(0.33) $(0.42) $(0.37) $(1.28) $(0.42) 1 Adjusted Net Realized and Unrealized Gains (Losses), Net of Taxes per Share $(0.05) $(0.39) $(0.34) $(1.24) $(0.36) Earnings (Loss) per Share $0.29 $0.22 $0.22 $(0.62) $0.24 1 Adjusted Earnings (Loss) per Share $0.57 $0.22 $0.22 $(0.62) $0.24 Quarterly Distributions per Share $0.55 $0.54 $0.51 $0.495 $0.48 Special Distributions per Share -- $0.42 -- -- -- NAV per Share $19.66 $19.63 $20.83 $20.67 $21.78 Weighted Average Shares Outstanding 73,203 61,142 61,125 61,123 60,533 Shares Outstanding, End of Period 77,080 61,220 61,125 61,125 61,068 Investment Portfolio (at Fair Value) $3,164,860 $2,642,870 $2,494,111 $2,565,389 $2,644,775 Cash and Cash Equivalents $43,750 $17,382 $23,528 $34,306 $39,366 Total Assets $3,318,507 $2,767,260 $2,646,313 $2,689,378 $2,756,682 2 Total Debt Outstanding $1,723,840 $1,463,624 $1,301,043 $1,356,606 $1,363,660 Net Assets $1,515,150 $1,201,989 $1,245,563 $1,263,529 $1,330,376 Total Debt to Equity Ratio 1.16x 1.26x 1.08x 1.10x 1.05x Net Debt to Equity Ratio 1.14x 1.24x 1.06x 1.08x 1.02x 3 Weighted Average Interest Rate on Debt Outstanding 6.2% 5.6% 4.4% 3.2% 2.5% Note: The Company completed a 1-for-3 reverse stock split on January 20, 2023, effective as of the commencement of trading on January 23, 2023. All share amounts and per share information included in this presentation reflect the reverse stock split on a retroactive basis. 1 7 See page 19 for a description of the non-GAAP measures. 2 Net of unamortized financing costs. 3 Includes effect of the interest rate swap agreement the Company entered into in connection with the issuance of the 2027 Notes.
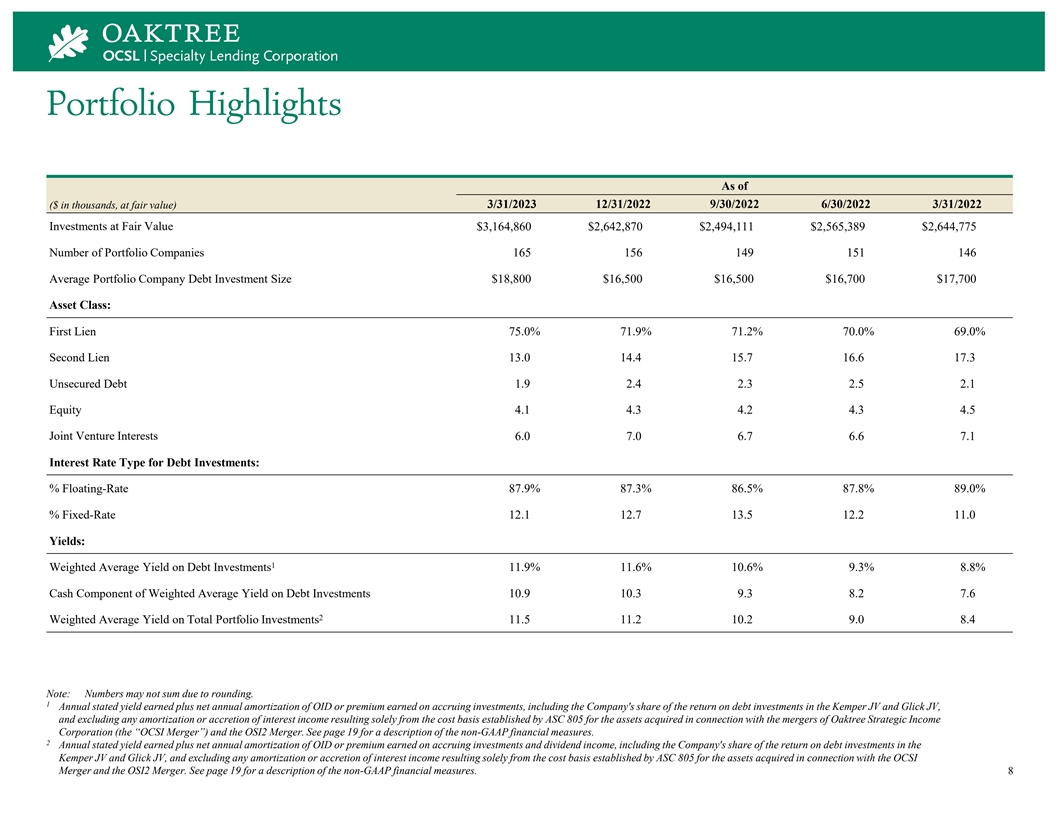
Portfolio Highlights As of ($ in thousands, at fair value) 3/31/2023 12/31/2022 9/30/2022 6/30/2022 3/31/2022 Investments at Fair Value $3,164,860 $2,642,870 $2,494,111 $2,565,389 $2,644,775 Number of Portfolio Companies 165 156 149 151 146 Average Portfolio Company Debt Investment Size $18,800 $16,500 $16,500 $16,700 $17,700 Asset Class: First Lien 75.0% 71.9% 71.2% 70.0% 69.0% Second Lien 13.0 14.4 15.7 16.6 17.3 Unsecured Debt 1.9 2.4 2.3 2.5 2.1 Equity 4.1 4.3 4.2 4.3 4.5 Joint Venture Interests 6.0 7.0 6.7 6.6 7.1 Interest Rate Type for Debt Investments: % Floating-Rate 87.9% 87.3% 86.5% 87.8% 89.0% % Fixed-Rate 12.1 12.7 13.5 12.2 11.0 Yields: 1 Weighted Average Yield on Debt Investments 11.9% 11.6% 10.6% 9.3% 8.8% Cash Component of Weighted Average Yield on Debt Investments 10.9 10.3 9.3 8.2 7.6 2 Weighted Average Yield on Total Portfolio Investments 11.5 11.2 10.2 9.0 8.4 Note: Numbers may not sum due to rounding. 1 Annual stated yield earned plus net annual amortization of OID or premium earned on accruing investments, including the Company's share of the return on debt investments in the Kemper JV and Glick JV, and excluding any amortization or accretion of interest income resulting solely from the cost basis established by ASC 805 for the assets acquired in connection with the mergers of Oaktree Strategic Income Corporation (the “OCSI Merger”) and the OSI2 Merger. See page 19 for a description of the non-GAAP financial measures. 2 Annual stated yield earned plus net annual amortization of OID or premium earned on accruing investments and dividend income, including the Company's share of the return on debt investments in the Kemper JV and Glick JV, and excluding any amortization or accretion of interest income resulting solely from the cost basis established by ASC 805 for the assets acquired in connection with the OCSI Merger and the OSI2 Merger. See page 19 for a description of the non-GAAP financial measures. 8
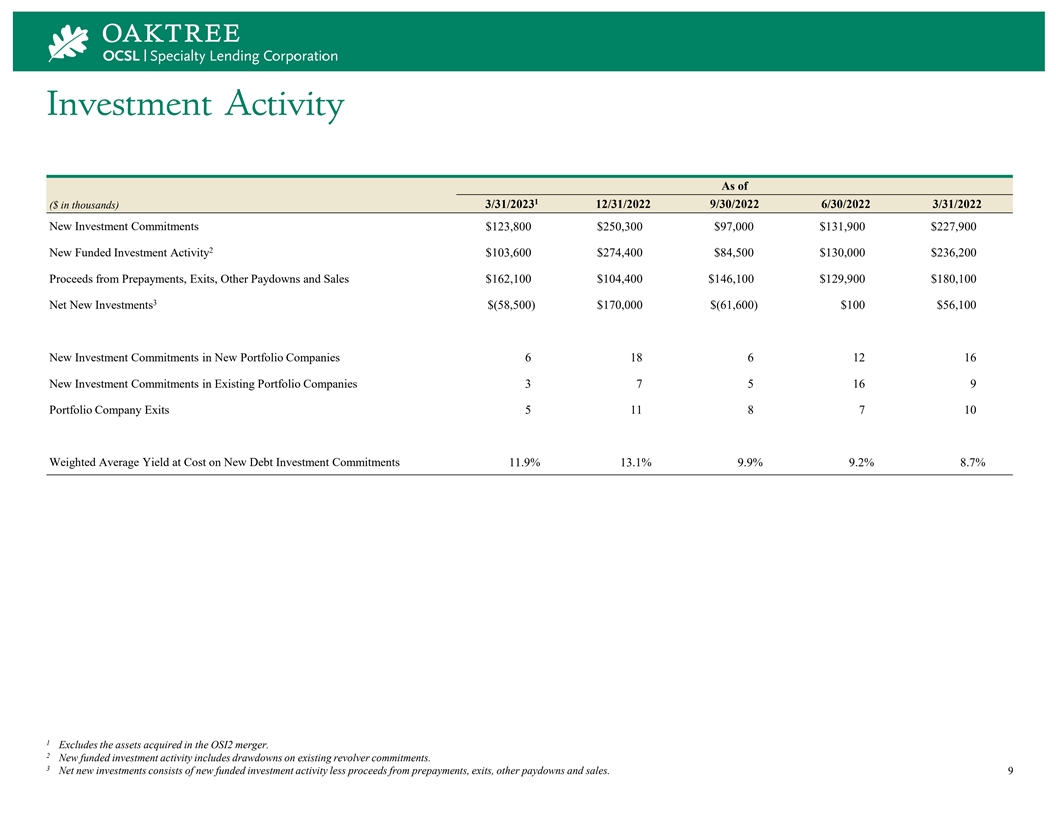
Investment Activity As of 1 ($ in thousands) 3/31/2023 12/31/2022 9/30/2022 6/30/2022 3/31/2022 New Investment Commitments $123,800 $250,300 $97,000 $131,900 $227,900 2 New Funded Investment Activity $103,600 $274,400 $84,500 $130,000 $236,200 Proceeds from Prepayments, Exits, Other Paydowns and Sales $162,100 $104,400 $146,100 $129,900 $180,100 3 Net New Investments $(58,500) $170,000 $(61,600) $100 $56,100 New Investment Commitments in New Portfolio Companies 6 18 6 12 16 New Investment Commitments in Existing Portfolio Companies 3 7 5 16 9 Portfolio Company Exits 5 11 8 7 10 Weighted Average Yield at Cost on New Debt Investment Commitments 11.9% 13.1% 9.9% 9.2% 8.7% 1 Excludes the assets acquired in the OSI2 merger. 2 New funded investment activity includes drawdowns on existing revolver commitments. 3 Net new investments consists of new funded investment activity less proceeds from prepayments, exits, other paydowns and sales. 9

Net Asset Value Per Share Bridge adjusted net realized and unrealized adjusted nii gains (losses), net of taxes $0.62 ($0.05) $21.00 ($0.01) ($0.25) ($0.08) $0.29 20.00 $0.63 ($0.55) 19.00 18.00 17.00 $19.66 $19.63 16.00 15.00 14.00 12/31/22 NAV GAAP Net Investment Interest Income Net Unrealized Net Realized Gain / Net Realized & Quarterly Distribution 3/31/23 NAV Income Accretion Related to Appreciation / (Loss) Unrealized Loss 1 Merger Accounting (Depreciation) Related to Merger 1 Adjustments Accounting Adjustments Note: Numbers may not sum due to rounding. Net asset value per share amounts are based on the shares outstanding at each respective quarter end. Net investment income per share, net unrealized appreciation / (depreciation), and net realized gain / (loss) are based on the weighted average number of shares outstanding for the period. Numbers may not sum due to rounding. See page 19 for a description of the non-GAAP measures. Per share amounts have been adjusted for the one-for-three reverse stock split which took effect before market open on January 23, 2023. 1 Excludes reclassifications of net unrealized appreciation / (depreciation) to net realized gains / (losses) as a result of investments exited during the quarter. 10

Capital Structure Overview funding sources ($ in millions) Principal 0.90x to 1.25x Committed Outstanding Interest Rate Maturity target leverage ratio Syndicated Credit Facility $1,000 $750 SOFR + 2.00% 5/4/2026 1 Citibank Facility 200 160 LIBOR + 1.25%-2.25% 11/18/2024 2 OSI2 Citibank Facility 250 205 LIBOR + 1.65%-2.25% 1/26/2025 Investment 2025 Notes 300 300 3.500% 2/25/2025 Grade Rated 3 2027 Notes 350 350 2.700% (LIBOR + 1.658%) 1/15/2027 by moody’s and fitch Cash and Cash Equivalents -- (44) -- -- Total $2,100 $1,721 Weighted Average Interest Rate 6.2% 37% Net Debt to Equity Ratio 1.14x unsecured maturities borrowings ($ in millions) $1,000 $250 $45 $379mm 500 $205 $750 4 $40 available liquidity $350 $300 $160 0 2023 2024 2025 2026 2027 2028 Unsecured Debt Credit Facility Drawn Credit Facility Undrawn Diverse and flexible sources of debt capital with no near-term maturities As of March 31, 2023 Note: Numbers may not sum due to rounding. 1 The interest rate on outstanding borrowings is LIBOR plus 1.25%-2.20% on broadly syndicated loans subject to observable market depth and LIBOR plus 2.25% on all other eligible loans. 2 The interest rate on outstanding borrowings is LIBOR plus 1.65% on broadly syndicated loans and LIBOR plus 2.25% on all other eligible loans. 3 The Company entered into an interest rate swap agreement under which the Company receives a fixed interest rate of 2.700% and pays a floating rate of the three-month LIBOR plus 1.658% on a notional 11 amount of $350 million. 4 Liquidity was composed of $43.8 million of unrestricted cash and cash equivalents and $335.0 million of undrawn capacity under the credit facilities (subject to borrowing base and other limitations).
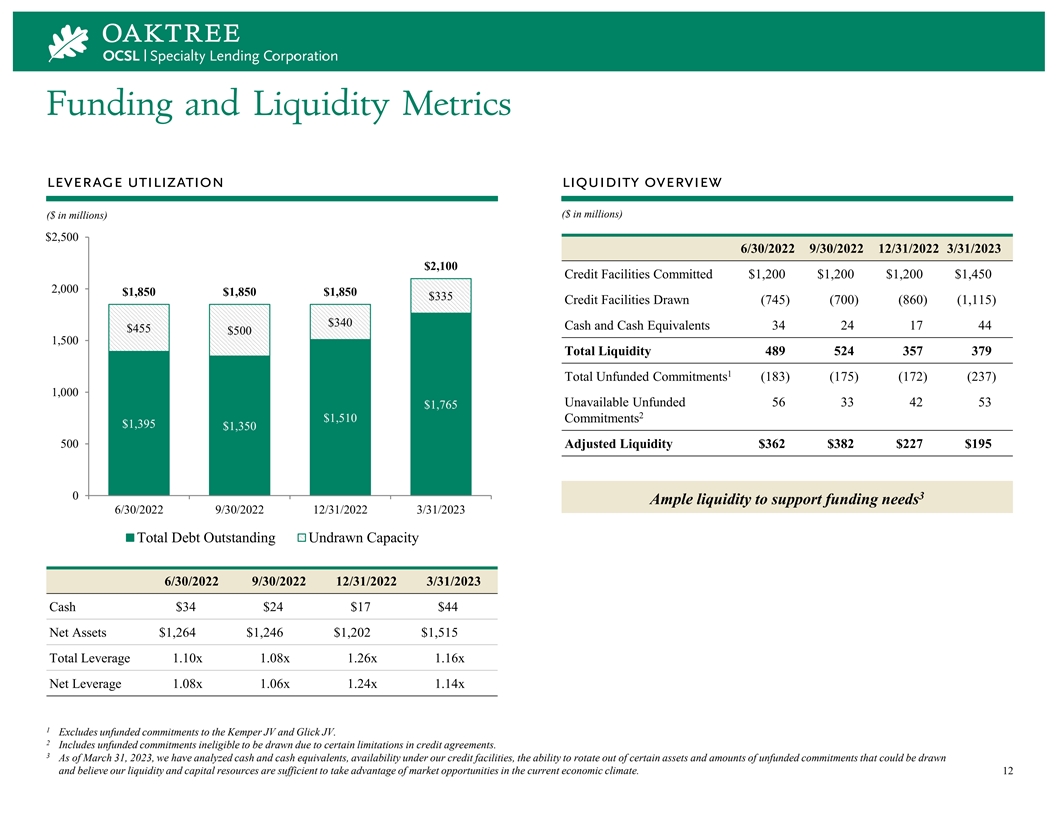
Funding and Liquidity Metrics leverage utilization liquidity overview ($ in millions) ($ in millions) $2,500 6/30/2022 9/30/2022 12/31/2022 3/31/2023 $2,100 Credit Facilities Committed $1,200 $1,200 $1,200 $1,450 2,000 $1,850 $1,850 $1,850 $335 Credit Facilities Drawn (745) (700) (860) (1,115) $340 Cash and Cash Equivalents 34 24 17 44 $455 $500 1,500 Total Liquidity 489 524 357 379 1 Total Unfunded Commitments (183) (175) (172) (237) 1,000 Unavailable Unfunded 56 33 42 53 $1,765 2 $1,510 Commitments $1,395 $1,350 500 Adjusted Liquidity $362 $382 $227 $195 0 3 Ample liquidity to support funding needs 6/30/2022 9/30/2022 12/31/2022 3/31/2023 Total Debt Outstanding Undrawn Capacity 6/30/2022 9/30/2022 12/31/2022 3/31/2023 Cash $34 $24 $17 $44 Net Assets $1,264 $1,246 $1,202 $1,515 Total Leverage 1.10x 1.08x 1.26x 1.16x Net Leverage 1.08x 1.06x 1.24x 1.14x 1 Excludes unfunded commitments to the Kemper JV and Glick JV. 2 Includes unfunded commitments ineligible to be drawn due to certain limitations in credit agreements. 3 As of March 31, 2023, we have analyzed cash and cash equivalents, availability under our credit facilities, the ability to rotate out of certain assets and amounts of unfunded commitments that could be drawn and believe our liquidity and capital resources are sufficient to take advantage of market opportunities in the current economic climate. 12
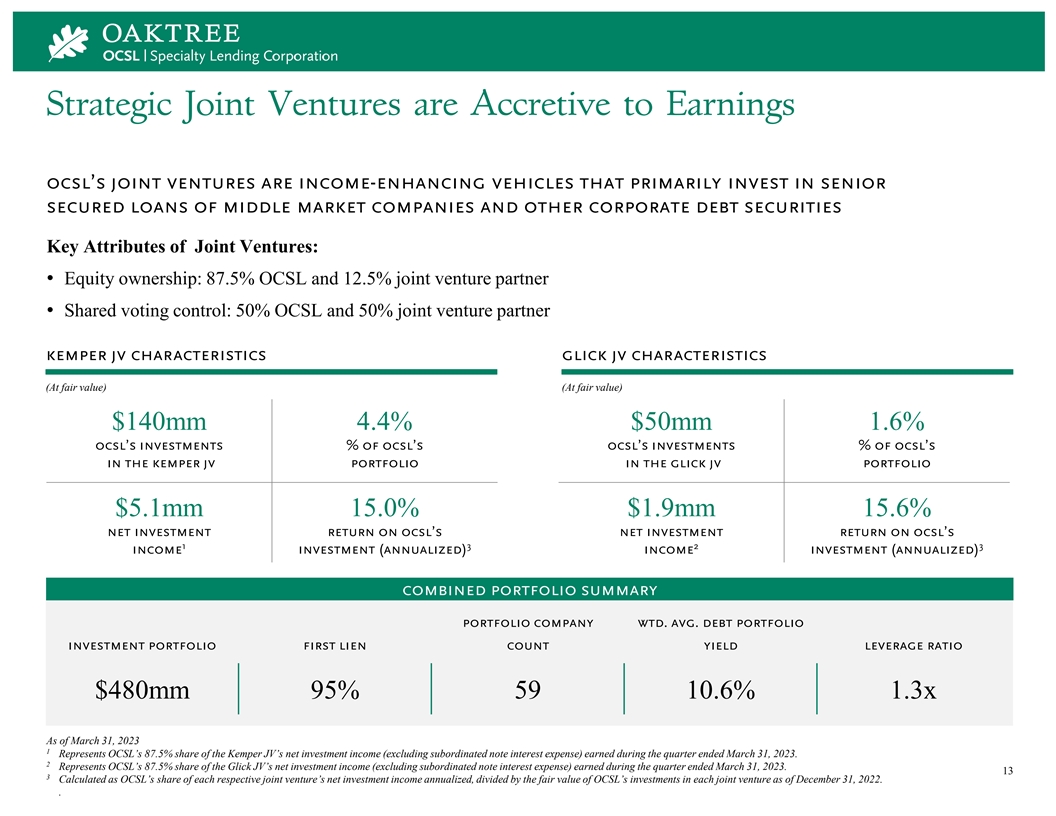
Strategic Joint Ventures are Accretive to Earnings ocsl’s joint ventures are income-enhancing vehicles that primarily invest in senior secured loans of middle market companies and other corporate debt securities Key Attributes of Joint Ventures: • Equity ownership: 87.5% OCSL and 12.5% joint venture partner • Shared voting control: 50% OCSL and 50% joint venture partner kemper jv characteristics glick jv characteristics (At fair value) (At fair value) $140mm 4.4% $50mm 1.6% ocsl’s investments % of ocsl’s ocsl’s investments % of ocsl’s in the kemper jv portfolio in the glick jv portfolio $5.1mm 15.0% $1.9mm 15.6% net investment return on ocsl’s net investment return on ocsl’s 1 3 2 3 income investment (annualized) income investment (annualized) combined portfolio summary portfolio company wtd. avg. debt portfolio investment portfolio first lien count yield leverage ratio $480mm 95% 59 10.6% 1.3x As of March 31, 2023 1 Represents OCSL’s 87.5% share of the Kemper JV’s net investment income (excluding subordinated note interest expense) earned during the quarter ended March 31, 2023. 2 Represents OCSL’s 87.5% share of the Glick JV’s net investment income (excluding subordinated note interest expense) earned during the quarter ended March 31, 2023. 13 3 Calculated as OCSL’s share of each respective joint venture’s net investment income annualized, divided by the fair value of OCSL’s investments in each joint venture as of December 31, 2022. .
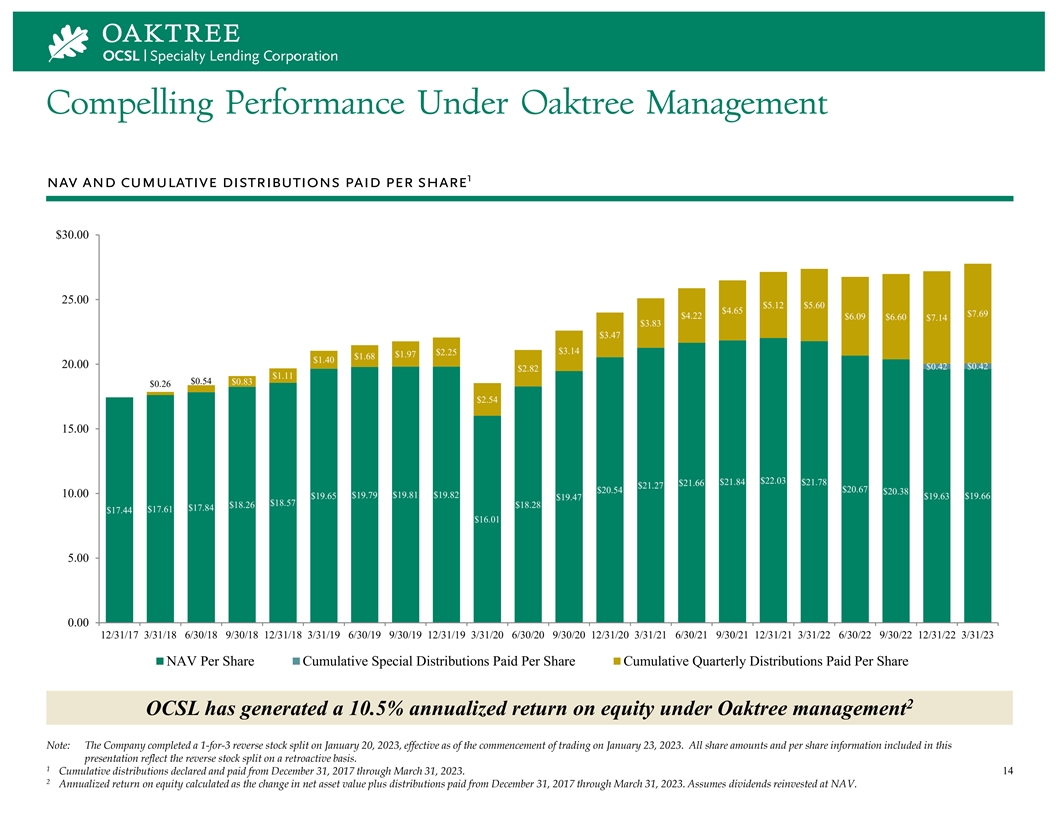
Compelling Performance Under Oaktree Management 1 nav and cumulative distributions paid per share $30.00 25.00 $5.12 $5.60 $4.65 $7.69 $4.22 $6.09 $6.60 $7.14 $3.83 $3.47 $3.14 $2.25 $1.97 $1.68 $1.40 20.00 $0.42 $0.42 $2.82 $1.11 $0.54 $0.83 $0.26 $2.54 15.00 $22.03 $21.84 $21.78 $21.66 $21.27 $20.54 $20.67 $20.38 10.00 $19.65 $19.79 $19.81 $19.82 $19.66 $19.47 $19.63 $18.57 $18.26 $18.28 $17.84 $17.61 $17.44 $16.01 5.00 0.00 12/31/17 3/31/18 6/30/18 9/30/18 12/31/18 3/31/19 6/30/19 9/30/19 12/31/19 3/31/20 6/30/20 9/30/20 12/31/20 3/31/21 6/30/21 9/30/21 12/31/21 3/31/22 6/30/22 9/30/22 12/31/22 3/31/23 NAV Per Share Cumulative Special Distributions Paid Per Share Cumulative Quarterly Distributions Paid Per Share 2 OCSL has generated a 10.5% annualized return on equity under Oaktree management Note: The Company completed a 1-for-3 reverse stock split on January 20, 2023, effective as of the commencement of trading on January 23, 2023. All share amounts and per share information included in this presentation reflect the reverse stock split on a retroactive basis. 1 Cumulative distributions declared and paid from December 31, 2017 through March 31, 2023. 14 2 Annualized return on equity calculated as the change in net asset value plus distributions paid from December 31, 2017 through March 31, 2023. Assumes dividends reinvested at NAV.
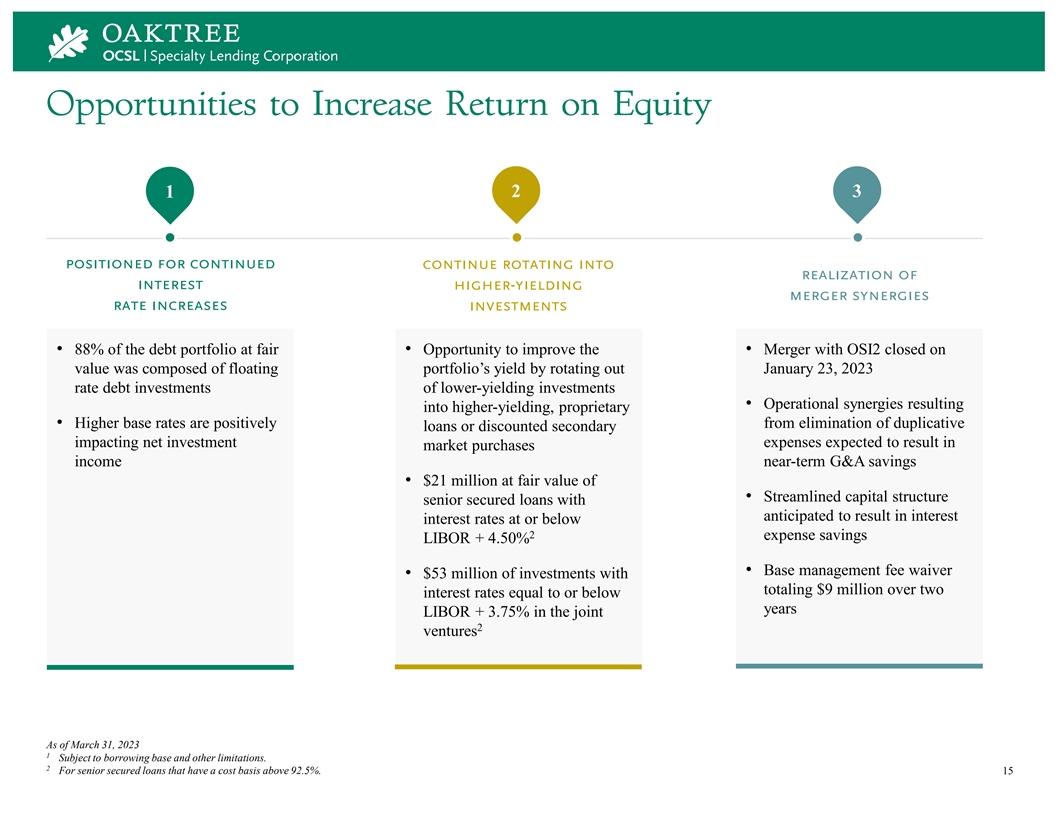
Opportunities to Increase Return on Equity 1 2 3 positioned for continued continue rotating into realization of interest higher-yielding merger synergies rate increases investments • 88% of the debt portfolio at fair • Opportunity to improve the • Merger with OSI2 closed on value was composed of floating portfolio’s yield by rotating out January 23, 2023 rate debt investments of lower-yielding investments • Operational synergies resulting into higher-yielding, proprietary • Higher base rates are positively from elimination of duplicative loans or discounted secondary impacting net investment expenses expected to result in market purchases income near-term G&A savings • $21 million at fair value of • Streamlined capital structure senior secured loans with anticipated to result in interest interest rates at or below 2 expense savings LIBOR + 4.50% • Base management fee waiver • $53 million of investments with totaling $9 million over two interest rates equal to or below years LIBOR + 3.75% in the joint 2 ventures As of March 31, 2023 1 Subject to borrowing base and other limitations. 2 For senior secured loans that have a cost basis above 92.5%. 15

Appendix
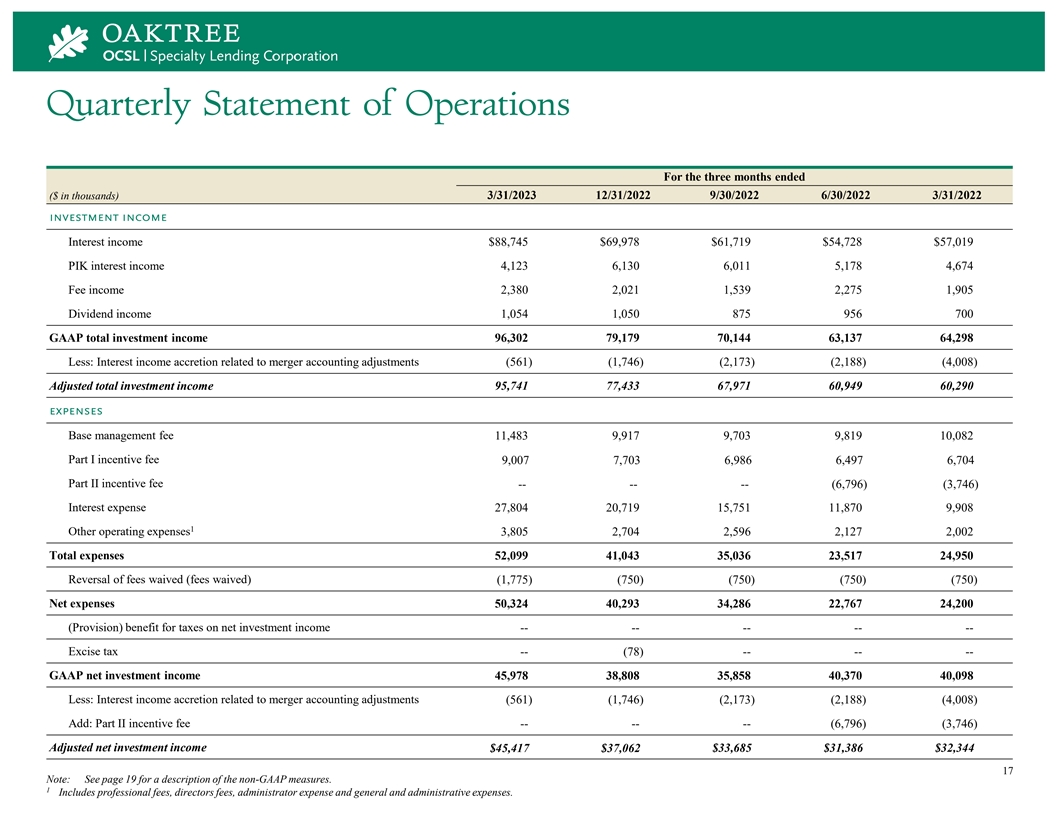
Quarterly Statement of Operations For the three months ended 3/31/2023 12/31/2022 9/30/2022 6/30/2022 3/31/2022 ($ in thousands) investment income Interest income $88,745 $69,978 $61,719 $54,728 $57,019 PIK interest income 4,123 6,130 6,011 5,178 4,674 Fee income 2,380 2,021 1,539 2,275 1,905 Dividend income 1,054 1,050 875 956 700 GAAP total investment income 96,302 79,179 70,144 63,137 64,298 Less: Interest income accretion related to merger accounting adjustments (561) (1,746) (2,173) (2,188) (4,008) Adjusted total investment income 95,741 77,433 67,971 60,949 60,290 expenses Base management fee 11,483 9,917 9,703 9,819 10,082 Part I incentive fee 9,007 7,703 6,986 6,497 6,704 Part II incentive fee -- -- -- (6,796) (3,746) Interest expense 27,804 20,719 15,751 11,870 9,908 1 Other operating expenses 3,805 2,704 2,596 2,127 2,002 Total expenses 52,099 41,043 35,036 23,517 24,950 Reversal of fees waived (fees waived) (1,775) (750) (750) (750) (750) Net expenses 50,324 40,293 34,286 22,767 24,200 (Provision) benefit for taxes on net investment income -- -- -- -- -- Excise tax -- (78) -- -- -- GAAP net investment income 45,978 38,808 35,858 40,370 40,098 Less: Interest income accretion related to merger accounting adjustments (561) (1,746) (2,173) (2,188) (4,008) Add: Part II incentive fee -- -- -- (6,796) (3,746) Adjusted net investment income $45,417 $37,062 $33,685 $31,386 $32,344 17 Note: See page 19 for a description of the non-GAAP measures. 1 Includes professional fees, directors fees, administrator expense and general and administrative expenses.
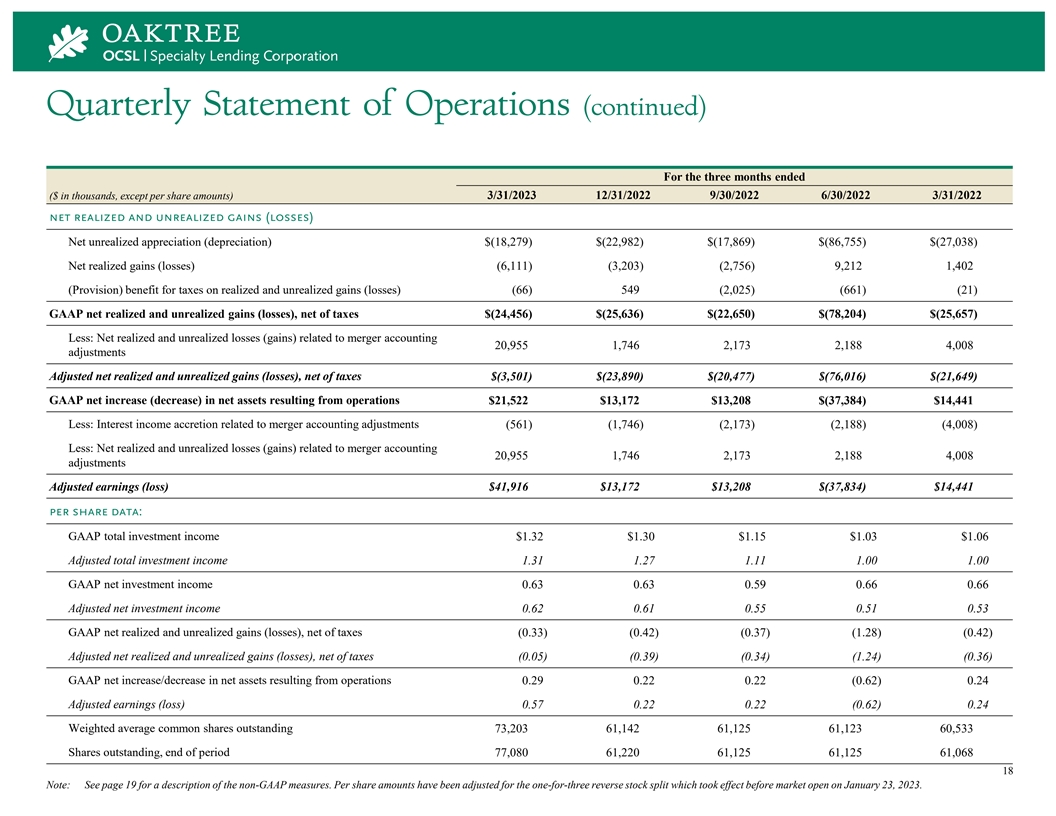
Quarterly Statement of Operations (continued) For the three months ended 3/31/2023 12/31/2022 9/30/2022 6/30/2022 3/31/2022 ($ in thousands, except per share amounts) net realized and unrealized gains (losses) Net unrealized appreciation (depreciation) $(18,279) $(22,982) $(17,869) $(86,755) $(27,038) Net realized gains (losses) (6,111) (3,203) (2,756) 9,212 1,402 (Provision) benefit for taxes on realized and unrealized gains (losses) (66) 549 (2,025) (661) (21) GAAP net realized and unrealized gains (losses), net of taxes $(24,456) $(25,636) $(22,650) $(78,204) $(25,657) Less: Net realized and unrealized losses (gains) related to merger accounting 20,955 1,746 2,173 2,188 4,008 adjustments Adjusted net realized and unrealized gains (losses), net of taxes $(3,501) $(23,890) $(20,477) $(76,016) $(21,649) GAAP net increase (decrease) in net assets resulting from operations $21,522 $13,172 $13,208 $(37,384) $14,441 Less: Interest income accretion related to merger accounting adjustments (561) (1,746) (2,173) (2,188) (4,008) Less: Net realized and unrealized losses (gains) related to merger accounting 20,955 1,746 2,173 2,188 4,008 adjustments Adjusted earnings (loss) $41,916 $13,172 $13,208 $(37,834) $14,441 per share data: GAAP total investment income $1.32 $1.30 $1.15 $1.03 $1.06 Adjusted total investment income 1.31 1.27 1.11 1.00 1.00 GAAP net investment income 0.63 0.63 0.59 0.66 0.66 Adjusted net investment income 0.62 0.61 0.55 0.51 0.53 GAAP net realized and unrealized gains (losses), net of taxes (0.33) (0.42) (0.37) (1.28) (0.42) Adjusted net realized and unrealized gains (losses), net of taxes (0.05) (0.39) (0.34) (1.24) (0.36) GAAP net increase/decrease in net assets resulting from operations 0.29 0.22 0.22 (0.62) 0.24 Adjusted earnings (loss) 0.57 0.22 0.22 (0.62) 0.24 Weighted average common shares outstanding 73,203 61,142 61,125 61,123 60,533 Shares outstanding, end of period 77,080 61,220 61,125 61,125 61,068 18 Note: See page 19 for a description of the non-GAAP measures. Per share amounts have been adjusted for the one-for-three reverse stock split which took effect before market open on January 23, 2023.
Non-GAAP Disclosures The OCSI Merger and the OSI2 Merger (the “Mergers”) were accounted for as asset acquisitions in accordance with the asset acquisition method of accounting as detailed in ASC 805-50, Business Combinations—Related Issues ( ASC 805 ). The consideration paid to each of the stockholders of Oaktree Strategic Income Corporation (“OCSI”) and OSI2 were allocated to the individual assets acquired and liabilities assumed based on the relative fair values of the net identifiable assets acquired other than non-qualifying assets, which established a new cost basis for the acquired investments under ASC 805 that, in aggregate, was different than the historical cost basis of the acquired investments prior to the OCSI Merger or OSI2 merger, as applicable. Additionally, immediately following the completion of the Mergers, the acquired investments were marked to their respective fair values under ASC 820, Fair Value Measurements, which resulted in unrealized appreciation / depreciation. The new cost basis established by ASC 805 on debt investments acquired will accrete / amortize over the life of each respective debt investment through interest income, with a corresponding adjustment recorded to unrealized appreciation / depreciation on such investment acquired through its ultimate disposition. The new cost basis established by ASC 805 on equity investments acquired will not accrete / amortize over the life of such investments through interest income and, assuming no subsequent change to the fair value of the equity investments acquired and disposition of such equity investments at fair value, the Company will recognize a realized gain / loss with a corresponding reversal of the unrealized appreciation / depreciation on disposition of such equity investments acquired. The Company’s management uses the non-GAAP financial measures described above internally to analyze and evaluate financial results and performance and to compare its financial results with those of other business development companies that have not adjusted the cost basis of certain investments pursuant to ASC 805. The Company’s management believes Adjusted Total Investment Income , Adjusted Total Investment Income Per Share , Adjusted Net Investment Income and Adjusted Net Investment Income Per Share are useful to investors as an additional tool to evaluate ongoing results and trends for the Company without giving effect to the accretion income resulting from the new cost basis of the investments acquired in the Mergers because these amounts do not impact the fees payable to Oaktree under its second amended and restated investment advisory agreement (the “A&R Advisory Agreement”), and specifically as its relates to Adjusted Net Investment Income and Adjusted Net Investment Income Per Share , without giving effect to Part II incentive fees. In addition, the Company’s management believes that “Adjusted Net Realized and Unrealized Gains (Losses), Net of Taxes”, “Adjusted Net Realized and Unrealized Gains (Losses), Net of Taxes Per Share”, “Adjusted Earnings (Loss)” and “Adjusted Earnings (Loss) Per Share” are useful to investors as they exclude the non-cash income/gain resulting from the Mergers and used by management to evaluate the economic earnings of its investment portfolio. Moreover, these metrics align the Company's key financial measures with the calculation of incentive fees payable to Oaktree under with the A&R Advisory Agreement (i.e., excluding amounts resulting solely from the lower cost basis of the acquired investments established by ASC 805 that would have been to the benefit of Oaktree absent such exclusion). 19

contact us: visit us: Investor Relations oaktreespecialtylending.com Michael Mosticchio (212) 284-1900 ocsl-ir@oaktreecapital.com