
NYSE:TC TSX:TCM First Quarter 2014 Financial Results Conference Call
2 Webcast Information Webcast: This Webcast can be accessed on the Thompson Creek Metals Company website under the Events Section: www.thompsoncreekmetals.com Q&A Instructions: If you would like to ask a question, please press star 1 on your telephone keypad. If you’re using a speakerphone, please make sure your mute function is turned off to allow your signal to reach the operator.

3 Cautionary Statements This document contains ‘‘forward-looking statements’’ within the meaning of the United States Private Securities Litigation Reform Act of 1995, Section 27A of the Securities Act of 1933, as amended, Section 21E of the Securities Act of 1934, as amended and applicable Canadian securities legislation, which are intended to be covered by the safe harbor created by those sections and other applicable laws. These forward-looking statements generally are identified by the words "believe," "project," "expect," "anticipate," "estimate," "intend," "future," "opportunity," "plan," "may," "should," "will," "would," "will be," "will continue," "will likely result," and similar expressions. Our forward-looking statements may include, without limitation, statements with respect to: future financial or operating performance of the Company or its subsidiaries and its projects; the availability of, and terms and costs related to, future borrowings, debt repayment, and refinancing; future inventory, production, sales, cash costs, capital expenditures and exploration expenditures; future earnings and operating results; expected concentrate and recovery grades; estimates of mineral reserves and resources, including estimated mine life and annual production; projected timing to ramp-up to design capacity at Mt. Milligan Mine; the potential development of our development properties and future exploration at our operations; future concentrate shipment dates and sizes; future operating plans and goals; and future molybdenum, copper and gold prices. Where we express an expectation or belief as to future events or results, such expectation or belief is expressed in good faith and believed to have a reasonable basis. However, our forward-looking statements are based on current expectations and assumptions that are subject to risks and uncertainties which may cause actual results to differ materially from future results expressed, projected or implied by those forward-looking statements. Important factors that could cause actual results and events to differ from those described in such forward-looking statements can be found in the section entitled ‘‘Risk Factors’’ in Thompson Creek’s Annual Report on Form 10-K for the year ended December 31, 2013, Quarterly Reports on Form 10-Q and other documents filed on EDGAR at www.sec.gov and on SEDAR at www.sedar.com. Although we have attempted to identify those material factors that could cause actual results or events to differ from those described in such forward-looking statements, there may be other factors, currently unknown to us or deemed immaterial at the present time, that could cause results or events to differ from those anticipated, estimated or intended. Many of these factors are beyond our ability to control or predict. Given these uncertainties, the reader is cautioned not to place undue reliance on our forward-looking statements. We undertake no obligation to update or revise publicly any forward-looking statements, whether as a result of new information, future events, or otherwise, and investors should not assume that any lack of update to a previously issued forward-looking statement constitutes a reaffirmation of that statement.

4 Management in Attendance Jacques Perron Chief Executive Officer and Director Pam Saxton Executive Vice President and Chief Financial Officer Scott Shellhaas President and Chief Operating Officer Mark Wilson Executive Vice President and Chief Commercial Officer
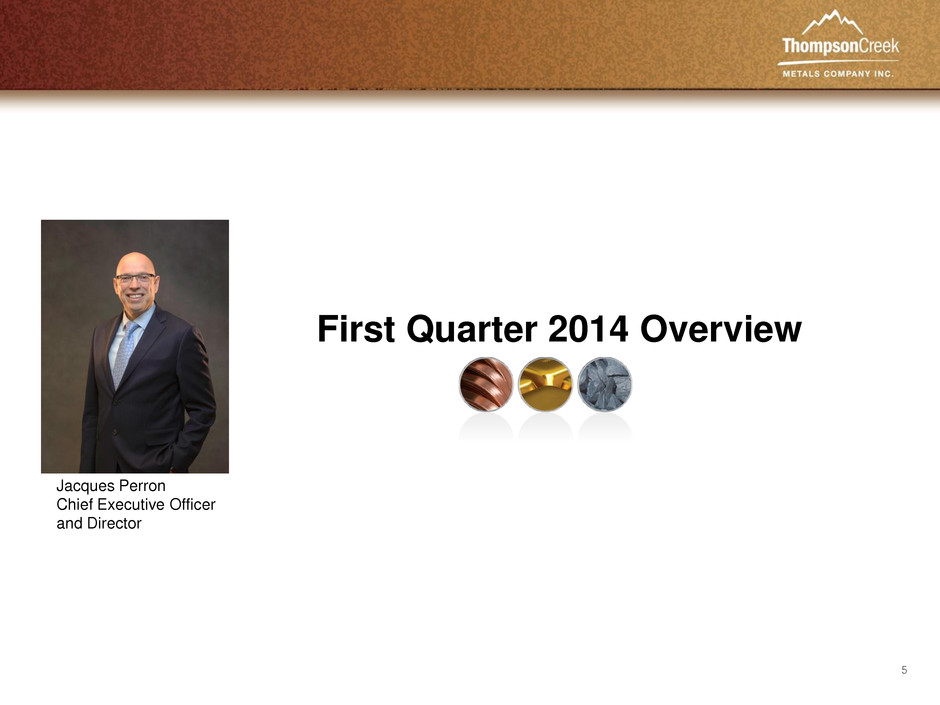
5 Jacques Perron Chief Executive Officer and Director First Quarter 2014 Overview

6 Q114 Highlights Focused on Execution Continued progress of Mt. Milligan ramp up, with new leadership team focused on the optimization of the mine and mill • Payable copper production increased 52% from previous quarter, by- product cash cost decreased 69% • Payable gold production increased 118% from previous quarter, co- product cash cost decreased 56% • Copper and gold sales contributed $54 million to total revenue Loaded three shipments during the quarter and received payment for two of those shipments Slight improvement in production and cash costs at our molybdenum operations and continue to track to 2014 guidance Ended the quarter with positive operating cash flow

7 Pam Saxton Executive Vice President and Chief Financial Officer Financial Review
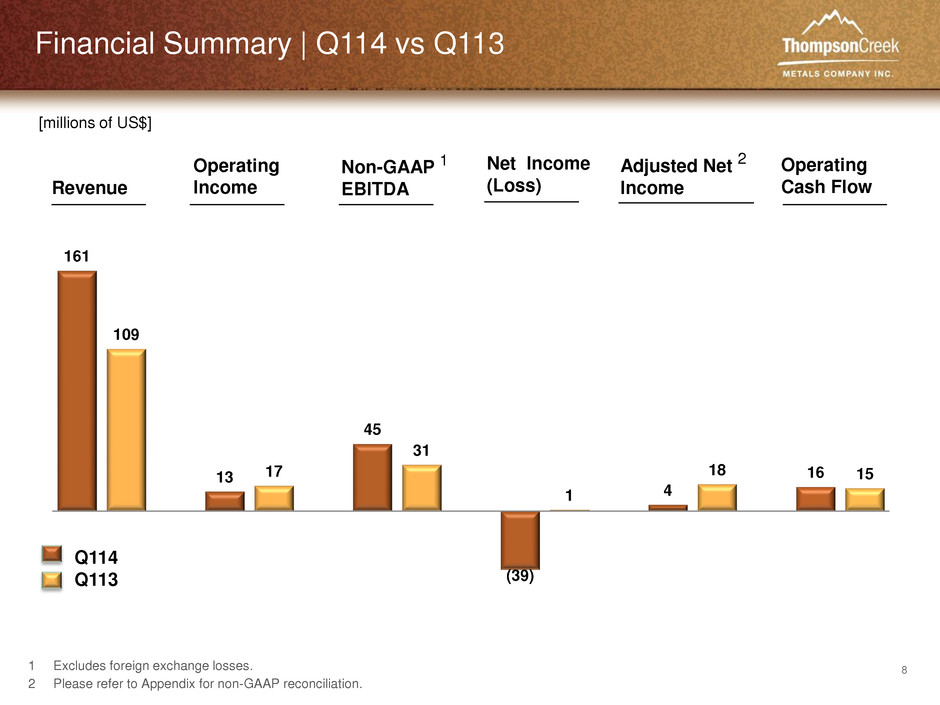
8 Financial Summary | Q114 vs Q113 161 109 13 17 45 31 (39) 1 4 18 16 15 [millions of US$] Revenue Operating Income Net Income (Loss) Adjusted Net Income Operating Cash Flow 1 Excludes foreign exchange losses. 2 Please refer to Appendix for non-GAAP reconciliation. Q114 Q113 2 Non-GAAP EBITDA 1

9 1Q 2014 (US$ in millions) Cash Flow from Operations 16.2 Cash (used) in Investing Activities (37.5) Cash (used) in Financing Activities (9.0) Increase (Decrease) in Cash and Cash Equivalents (31.2) Cash and Cash Equivalents, beginning of period 233.9 Cash and Cash Equivalents, end of period 202.7 Summary of Statement of Cash Flows
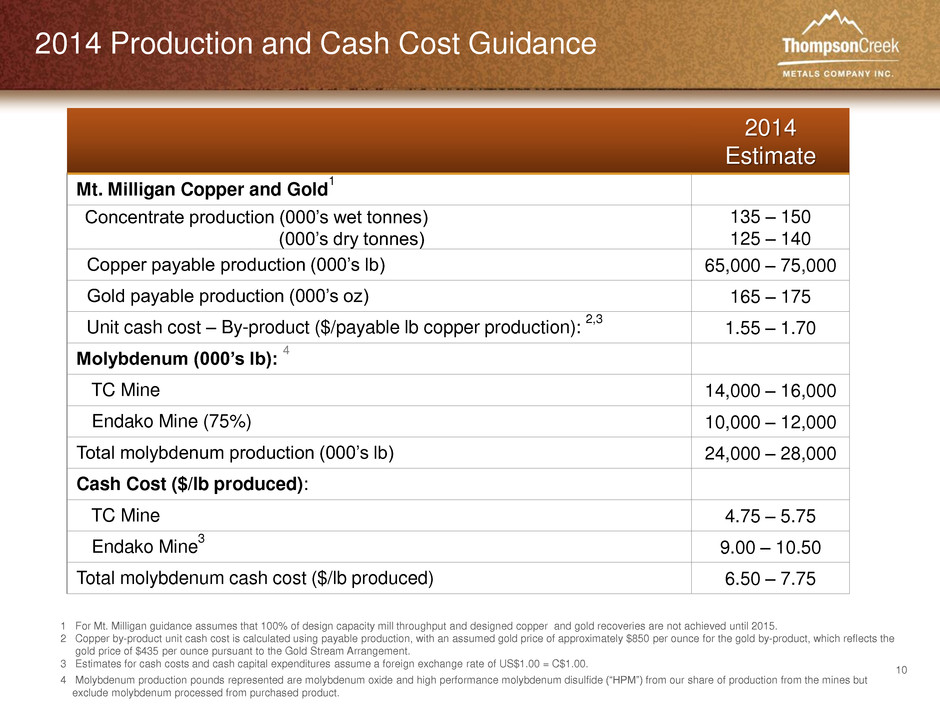
10 2014 Production and Cash Cost Guidance 2014 Estimate Mt. Milligan Copper and Gold 1 Concentrate production (000’s wet tonnes) (000’s dry tonnes) 135 – 150 125 – 140 Copper payable production (000’s lb) 65,000 – 75,000 Gold payable production (000’s oz) 165 – 175 Unit cash cost – By-product ($/payable lb copper production): 2,3 1.55 – 1.70 Molybdenum (000’s lb): 4 TC Mine 14,000 – 16,000 Endako Mine (75%) 10,000 – 12,000 Total molybdenum production (000’s lb) 24,000 – 28,000 Cash Cost ($/lb produced): TC Mine 4.75 – 5.75 Endako Mine 3 9.00 – 10.50 Total molybdenum cash cost ($/lb produced) 6.50 – 7.75 1 For Mt. Milligan guidance assumes that 100% of design capacity mill throughput and designed copper and gold recoveries are not achieved until 2015. 2 Copper by-product unit cash cost is calculated using payable production, with an assumed gold price of approximately $850 per ounce for the gold by-product, which reflects the gold price of $435 per ounce pursuant to the Gold Stream Arrangement. 3 Estimates for cash costs and cash capital expenditures assume a foreign exchange rate of US$1.00 = C$1.00. 4 Molybdenum production pounds represented are molybdenum oxide and high performance molybdenum disulfide (“HPM”) from our share of production from the mines but exclude molybdenum processed from purchased product.
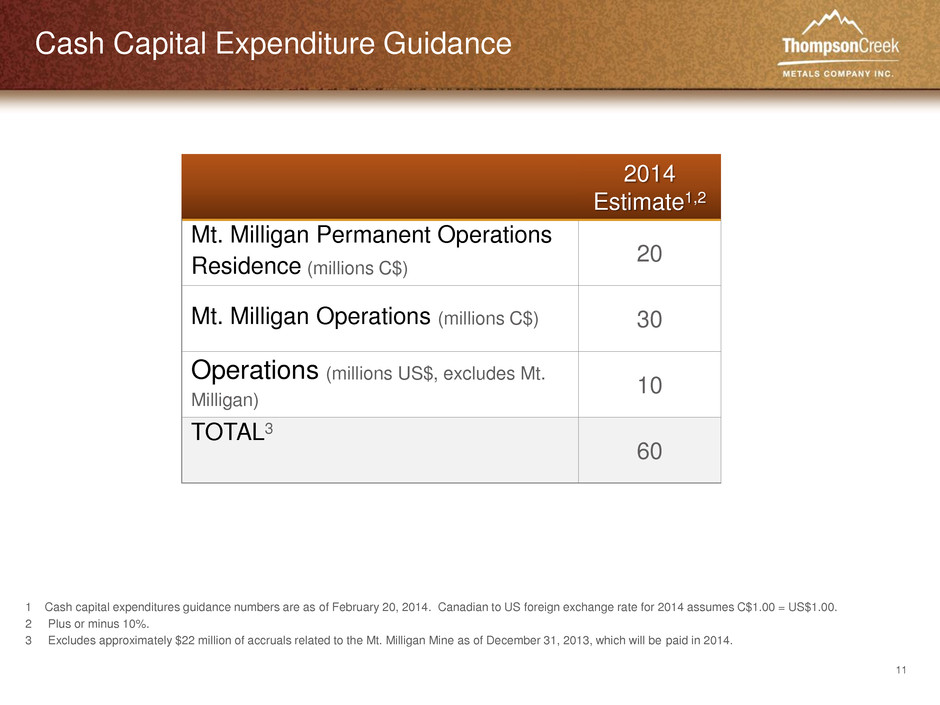
11 Cash Capital Expenditure Guidance 2014 Estimate1,2 Mt. Milligan Permanent Operations Residence (millions C$) 20 Mt. Milligan Operations (millions C$) 30 Operations (millions US$, excludes Mt. Milligan) 10 TOTAL3 60 1 Cash capital expenditures guidance numbers are as of February 20, 2014. Canadian to US foreign exchange rate for 2014 assumes C$1.00 = US$1.00. 2 Plus or minus 10%. 3 Excludes approximately $22 million of accruals related to the Mt. Milligan Mine as of December 31, 2013, which will be paid in 2014.

12 Mark Wilson Executive Vice President and Chief Commercial Officer Sales Summary
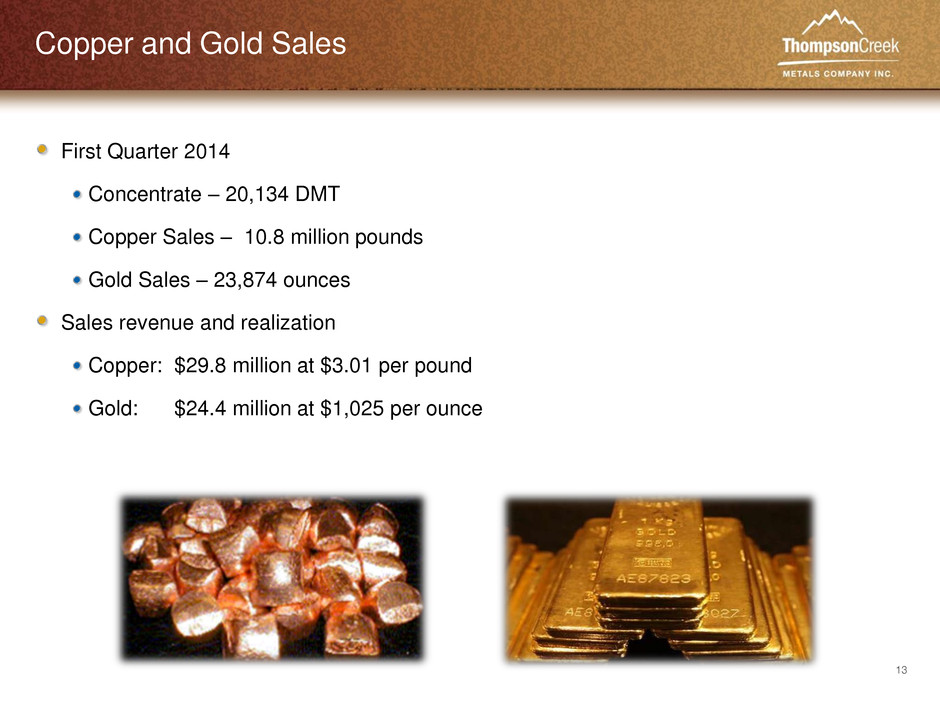
13 Copper and Gold Sales First Quarter 2014 Concentrate – 20,134 DMT Copper Sales – 10.8 million pounds Gold Sales – 23,874 ounces Sales revenue and realization Copper: $29.8 million at $3.01 per pound Gold: $24.4 million at $1,025 per ounce
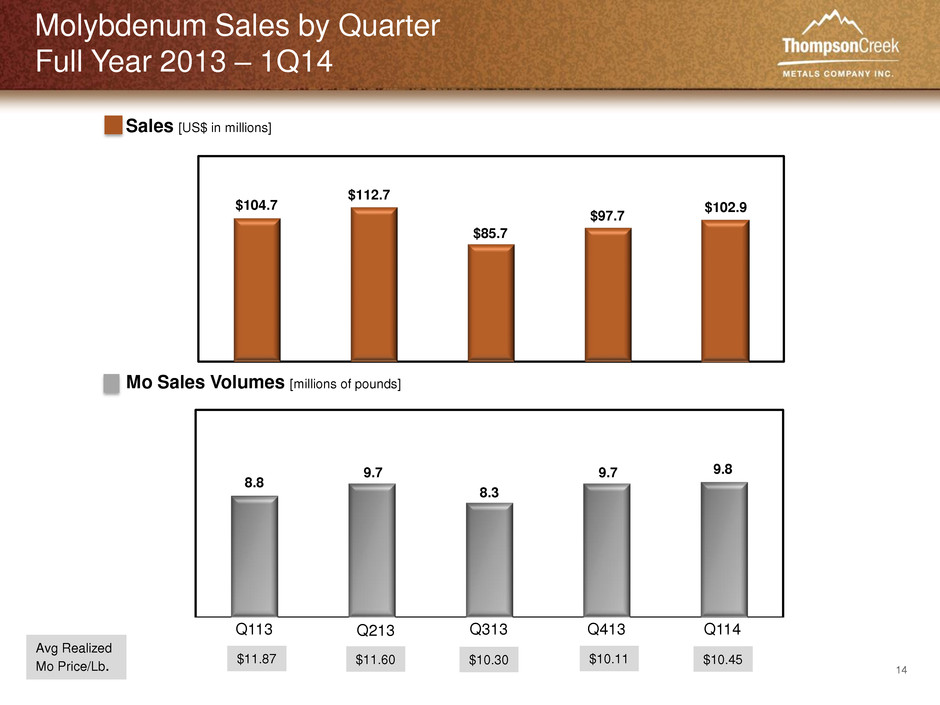
14 Molybdenum Sales by Quarter Full Year 2013 – 1Q14 Sales [US$ in millions] Mo Sales Volumes [millions of pounds] $104.7 $112.7 $85.7 $97.7 8.8 9.7 8.3 9.7 9.8 Avg Realized Mo Price/Lb. $11.87 $11.60 $10.30 $10.11 Q113 Q213 Q313 Q413 $102.9 Q114 $10.45
15 Scott Shellhaas President and Chief Operating Officer Operations Review
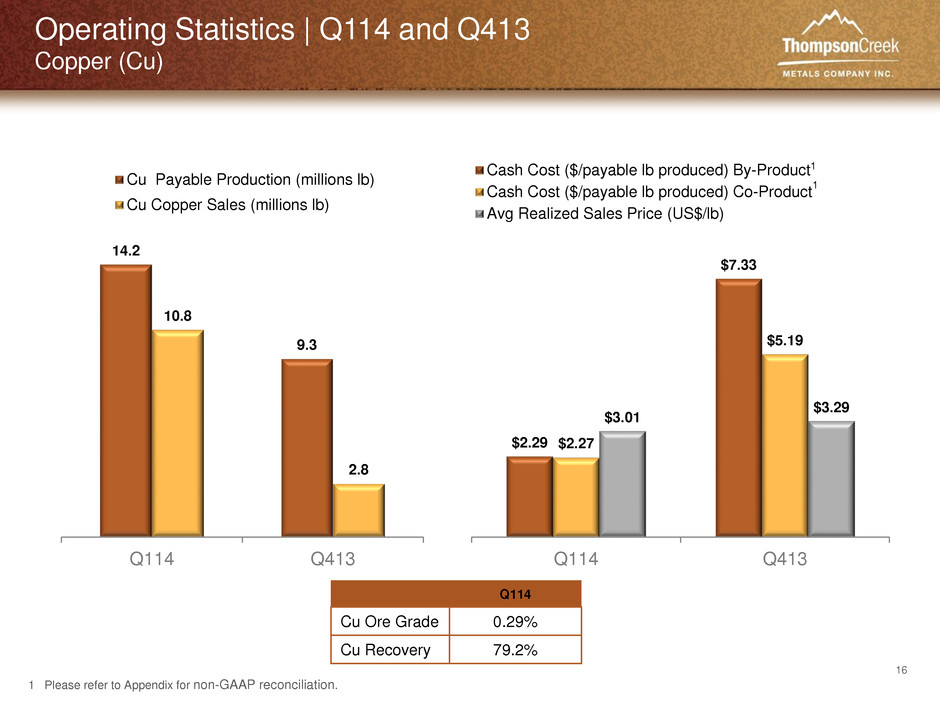
16 Operating Statistics | Q114 and Q413 Copper (Cu) 14.2 9.3 10.8 2.8 Q114 Q413 Cu Payable Production (millions lb) Cu Copper Sales (millions lb) $2.29 $7.33 $2.27 $5.19 $3.01 $3.29 Q114 Q413 Cash Cost ($/payable lb produced) By-Product Cash Cost ($/payable lb produced) Co-Product Avg Realized Sales Price (US$/lb) 1 1 Q114 Cu Ore Grade 0.29% Cu Recovery 79.2% 1 Please refer to Appendix for non-GAAP reconciliation.

17 Operating Statistics | Q114 and Q413 Gold (Au) 39,181 17,952 23,874 5,541 Q114 Q413 Au Payable Production (000's oz) Au Gold Sales (000's oz) $606 $1,385 $1,025 $1,006 Q114 Q413 Cash Cost ($/payable oz produced) Co-Product Avg Realized Sales Price ($/oz) Q114 Au Ore Grade (g/tonne) 0.72 Au Recovery 59.0% 1 Please refer to Appendix for non-GAAP reconciliation. 1
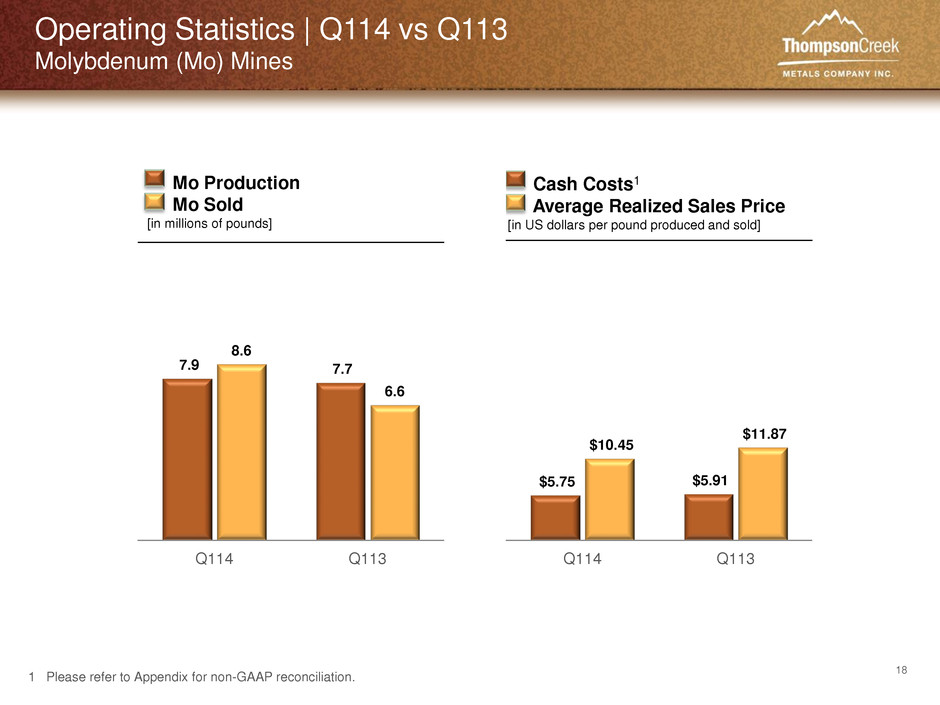
18 Operating Statistics | Q114 vs Q113 Molybdenum (Mo) Mines 7.9 7.7 8.6 6.6 Q114 Q113 Mo Production Mo Sold [in millions of pounds] $5.75 $5.91 $10.45 $11.87 Q114 Q113 Cash Costs1 Average Realized Sales Price [in US dollars per pound produced and sold] 1 Please refer to Appendix for non-GAAP reconciliation.
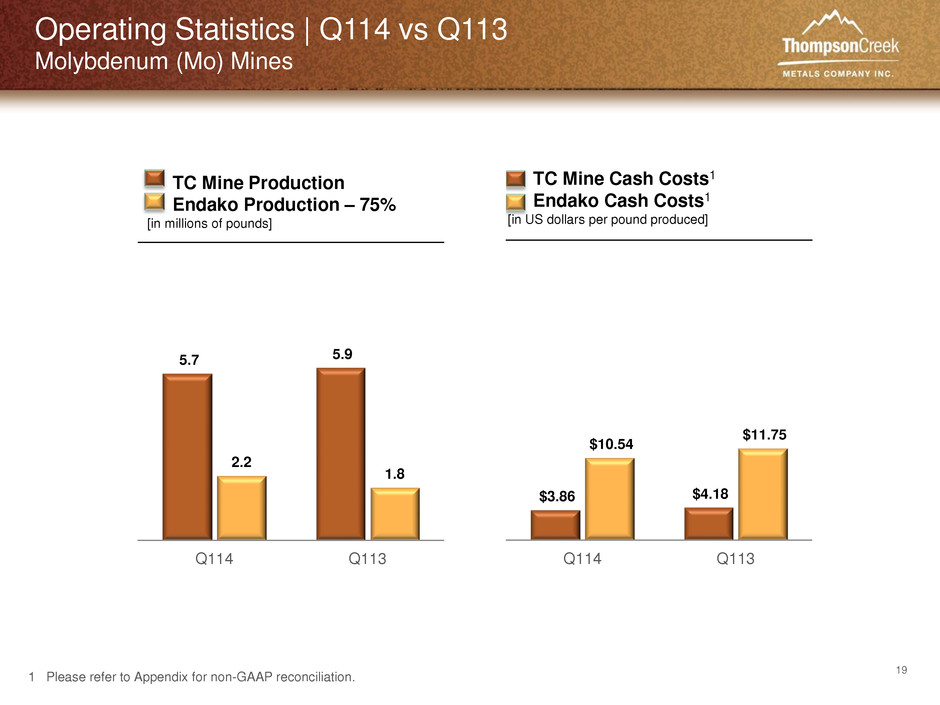
19 Operating Statistics | Q114 vs Q113 Molybdenum (Mo) Mines 5.7 5.9 2.2 1.8 Q114 Q113 TC Mine Production Endako Production – 75% [in millions of pounds] $3.86 $4.18 $10.54 $11.75 Q114 Q113 TC Mine Cash Costs1 Endako Cash Costs1 [in US dollars per pound produced] 1 Please refer to Appendix for non-GAAP reconciliation.
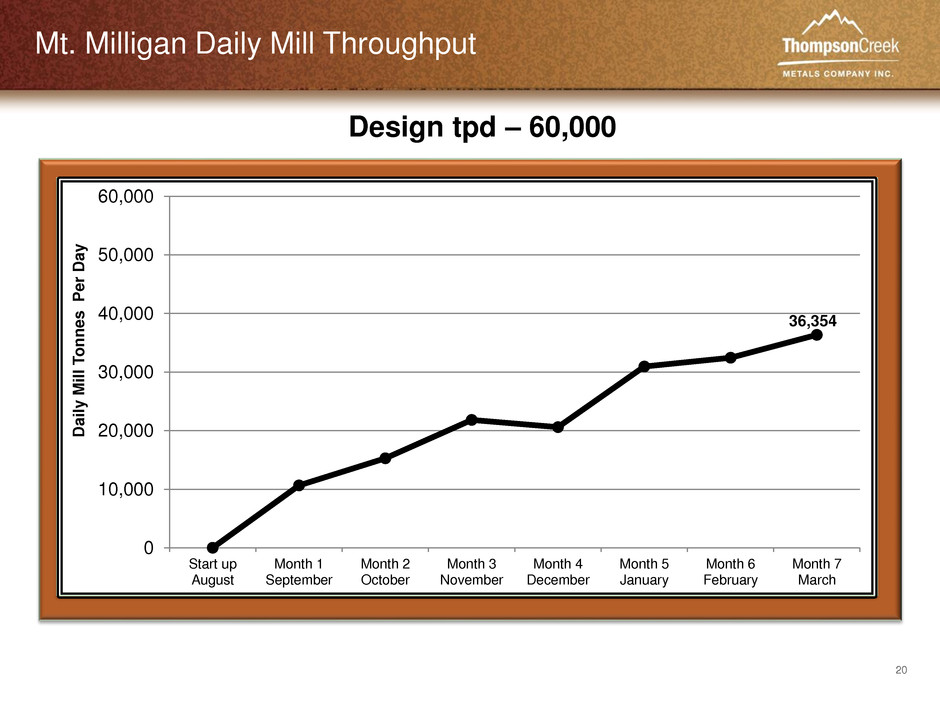
20 Mt. Milligan Daily Mill Throughput 0 10,000 20,000 30,000 40,000 50,000 60,000 Start up August Month 1 September Month 2 October Month 3 November Month 4 December Month 5 January Month 6 February Month 7 March Da il y M il l T onne s P e r Da y Design tpd – 60,000 36,354
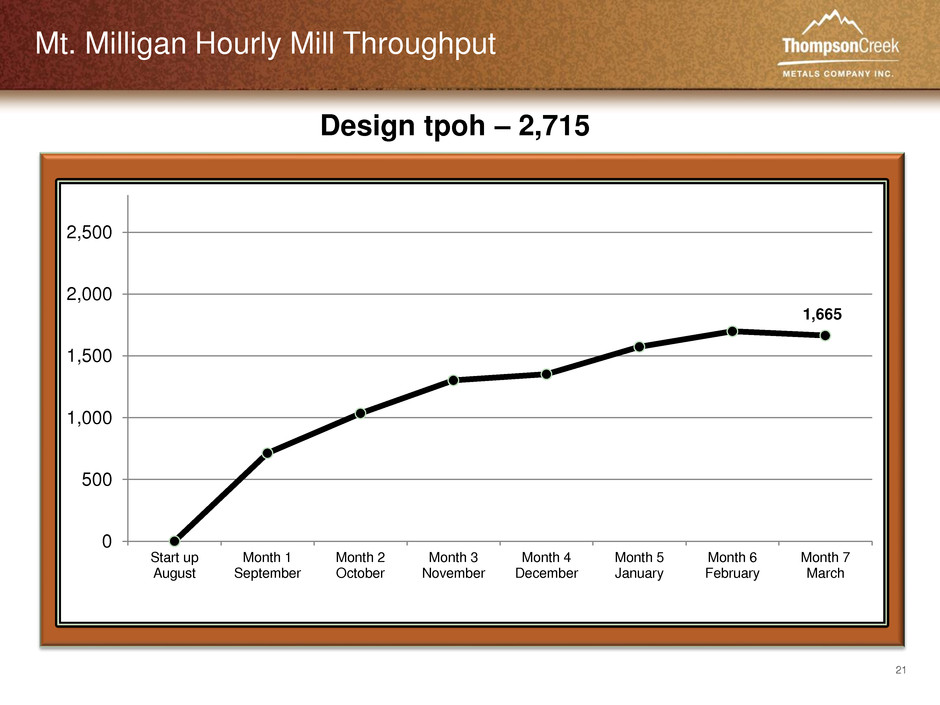
21 Mt. Milligan Hourly Mill Throughput 0 500 1,000 1,500 2,000 2,500 Start up August Month 1 September Month 2 October Month 3 November Month 4 December Month 5 January Month 6 February Month 7 March 1,665 Design tpoh – 2,715
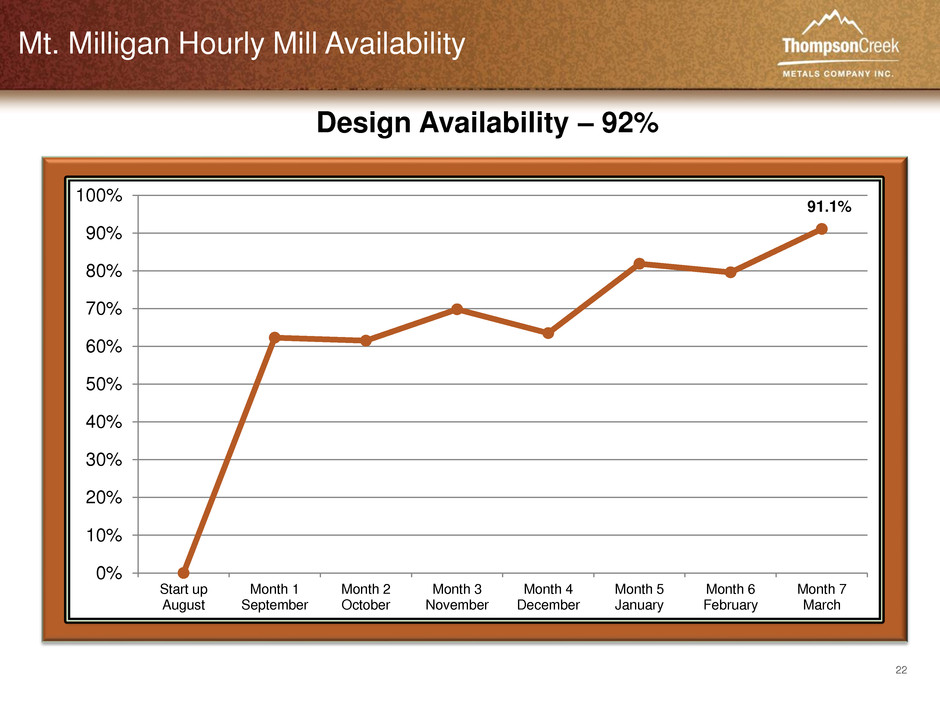
22 Mt. Milligan Hourly Mill Availability 0% 10% 20% 30% 40% 50% 60% 70% 80% 90% 100% Start up August Month 1 September Month 2 October Month 3 November Month 4 December Month 5 January Month 6 February Month 7 March 91.1% Design Availability – 92%
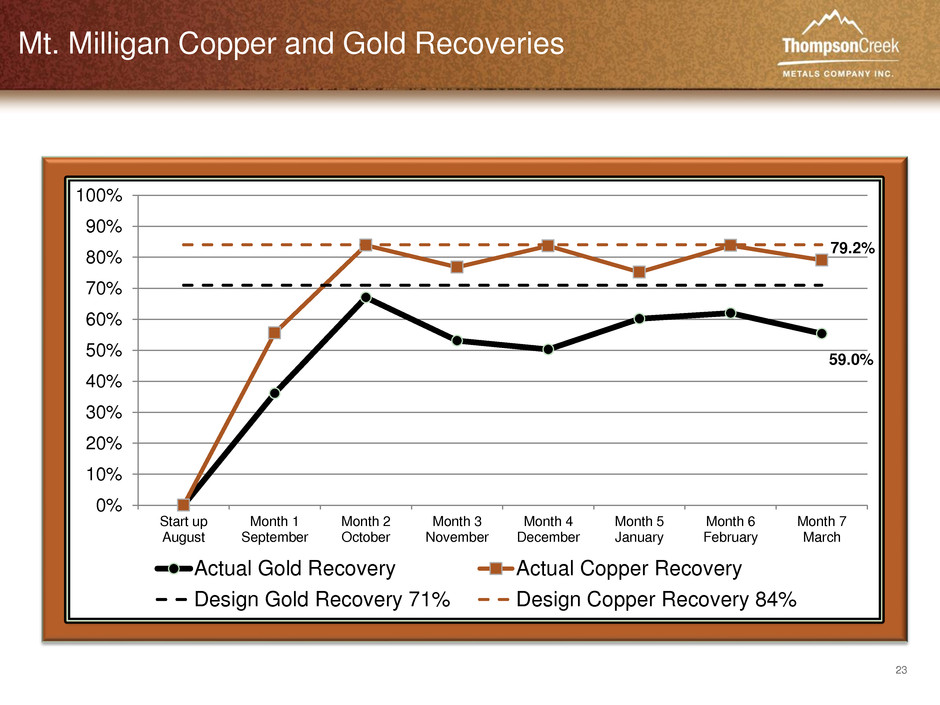
23 Mt. Milligan Copper and Gold Recoveries 0% 10% 20% 30% 40% 50% 60% 70% 80% 90% 100% Start up August Month 1 September Month 2 October Month 3 November Month 4 December Month 5 January Month 6 February Month 7 March Actual Gold Recovery Actual Copper Recovery Design Gold Recovery 71% Design Copper Recovery 84% 79.2% 59.0%
24 Jacques Perron Chief Executive Officer and Director Conclusion
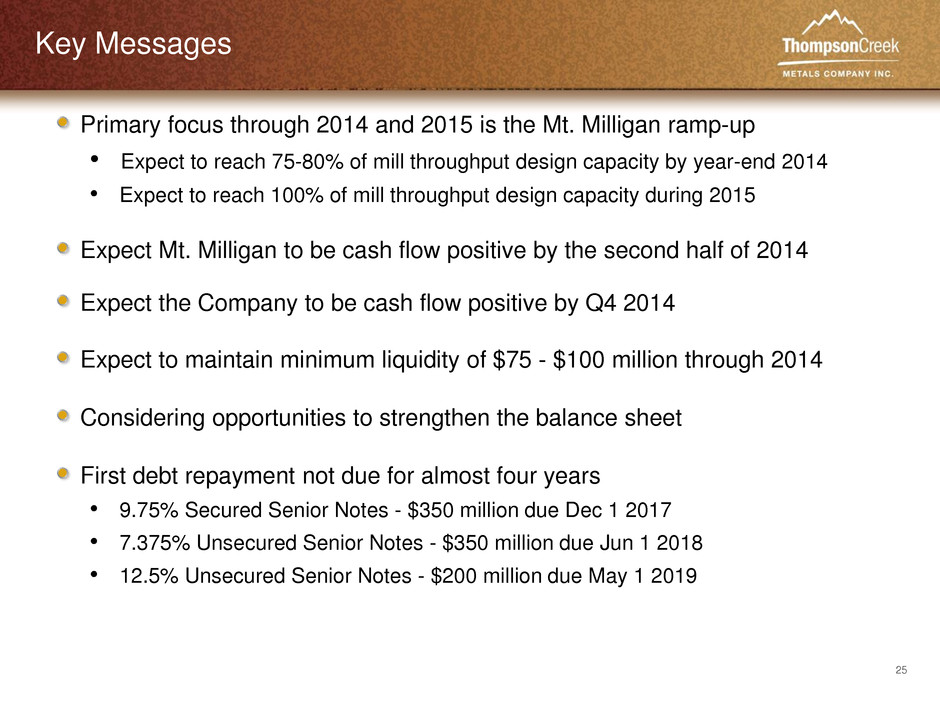
25 Key Messages Primary focus through 2014 and 2015 is the Mt. Milligan ramp-up • Expect to reach 75-80% of mill throughput design capacity by year-end 2014 • Expect to reach 100% of mill throughput design capacity during 2015 Expect Mt. Milligan to be cash flow positive by the second half of 2014 Expect the Company to be cash flow positive by Q4 2014 Expect to maintain minimum liquidity of $75 - $100 million through 2014 Considering opportunities to strengthen the balance sheet First debt repayment not due for almost four years • 9.75% Secured Senior Notes - $350 million due Dec 1 2017 • 7.375% Unsecured Senior Notes - $350 million due Jun 1 2018 • 12.5% Unsecured Senior Notes - $200 million due May 1 2019
26 NYSE:TC TSX:TCM Thompson Creek Metals Company www.thompsoncreekmetals.com Pamela Solly Director, Investor Relations and Corporate Responsibility Phone (303) 762-3526 Email psolly@tcrk.com
27 Appendix
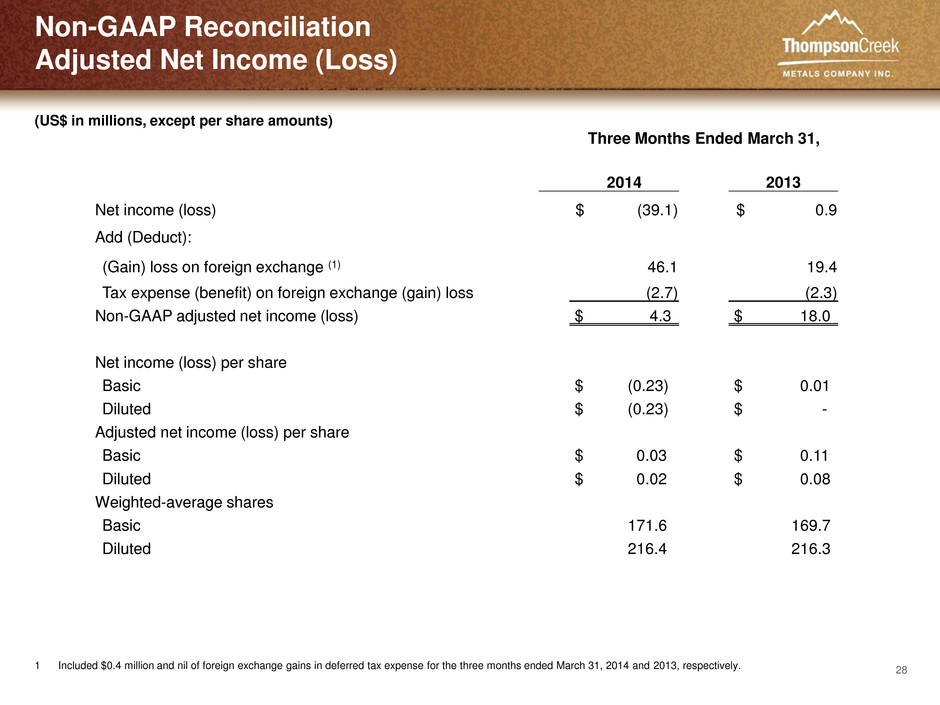
28 Non-GAAP Reconciliation Adjusted Net Income (Loss) 1 Included $0.4 million and nil of foreign exchange gains in deferred tax expense for the three months ended March 31, 2014 and 2013, respectively. Three Months Ended March 31, 2014 2013 Net income (loss) $ (39.1) $ 0.9 Add (Deduct): (Gain) loss on foreign exchange (1) 46.1 19.4 Tax expense (benefit) on foreign exchange (gain) loss (2.7) (2.3) Non-GAAP adjusted net income (loss) $ 4.3 $ 18.0 Net income (loss) per share Basic $ (0.23) $ 0.01 Diluted $ (0.23) $ - Adjusted net income (loss) per share Basic $ 0.03 $ 0.11 Diluted $ 0.02 $ 0.08 Weighted-average shares Basic 171.6 169.7 Diluted 216.4 216.3 (US$ in millions, except per share amounts)
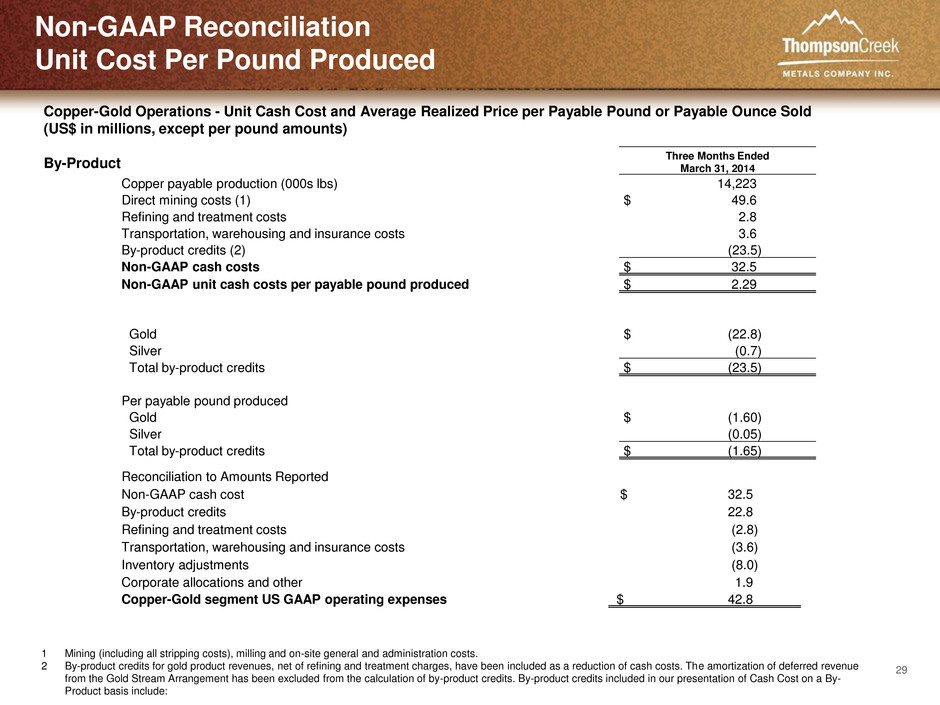
29 Non-GAAP Reconciliation Unit Cost Per Pound Produced Copper-Gold Operations - Unit Cash Cost and Average Realized Price per Payable Pound or Payable Ounce Sold (US$ in millions, except per pound amounts) By-Product 1 Mining (including all stripping costs), milling and on-site general and administration costs. 2 By-product credits for gold product revenues, net of refining and treatment charges, have been included as a reduction of cash costs. The amortization of deferred revenue from the Gold Stream Arrangement has been excluded from the calculation of by-product credits. By-product credits included in our presentation of Cash Cost on a By- Product basis include: Three Months Ended March 31, 2014 Copper payable production (000s lbs) 14,223 Direct mining costs (1) $ 49.6 Refining and treatment costs 2.8 Transportation, warehousing and insurance costs 3.6 By-product credits (2) (23.5) Non-GAAP cash costs $ 32.5 Non-GAAP unit cash costs per payable pound produced $ 2.29 Gold $ (22.8) Silver (0.7) Total by-product credits $ (23.5) Per payable pound produced Gold $ (1.60) Silver (0.05) Total by-product credits $ (1.65) Reconciliation to Amounts Reported Non-GAAP cash cost $ 32.5 By-product credits 22.8 Refining and treatment costs (2.8) Transportation, warehousing and insurance costs (3.6) Inventory adjustments (8.0) Corporate allocations and other 1.9 Copper-Gold segment US GAAP operating expenses $ 42.8
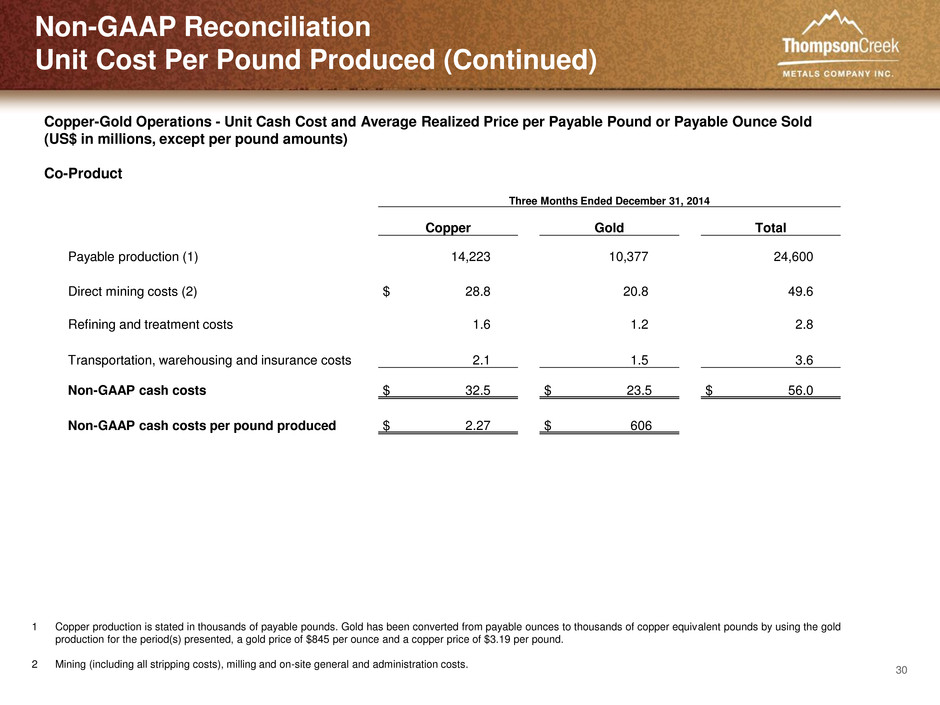
30 Non-GAAP Reconciliation Unit Cost Per Pound Produced (Continued) 1 Copper production is stated in thousands of payable pounds. Gold has been converted from payable ounces to thousands of copper equivalent pounds by using the gold production for the period(s) presented, a gold price of $845 per ounce and a copper price of $3.19 per pound. 2 Mining (including all stripping costs), milling and on-site general and administration costs. Three Months Ended December 31, 2014 Copper Gold Total Payable production (1) 14,223 10,377 24,600 Direct mining costs (2) $ 28.8 20.8 49.6 Refining and treatment costs 1.6 1.2 2.8 Transportation, warehousing and insurance costs 2.1 1.5 3.6 Non-GAAP cash costs $ 32.5 $ 23.5 $ 56.0 Non-GAAP cash costs per pound produced $ 2.27 $ 606 Copper-Gold Operations - Unit Cash Cost and Average Realized Price per Payable Pound or Payable Ounce Sold (US$ in millions, except per pound amounts) Co-Product
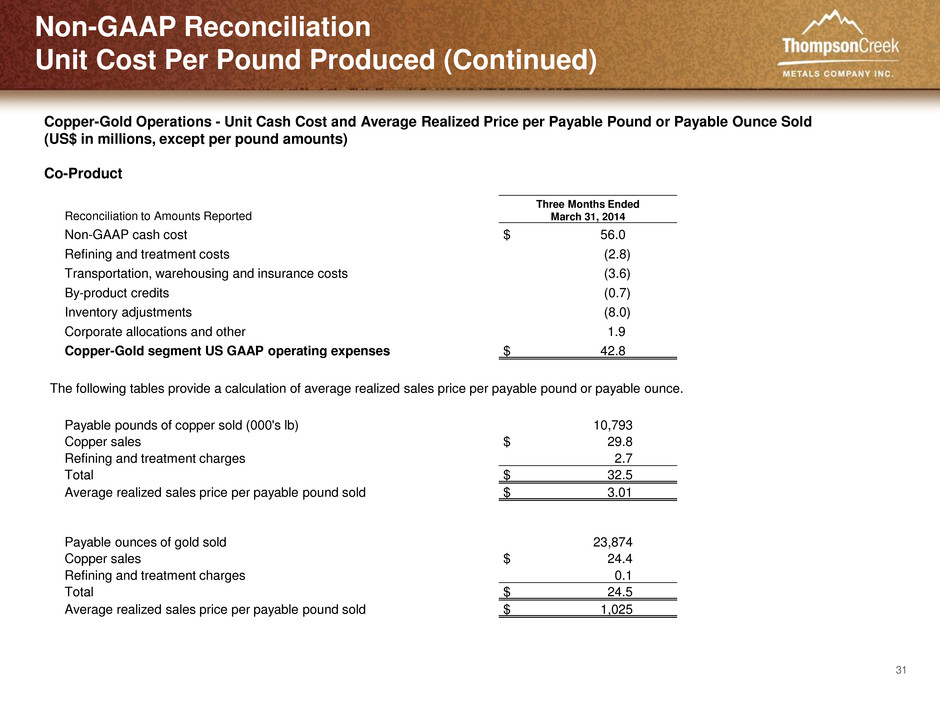
31 Non-GAAP Reconciliation Unit Cost Per Pound Produced (Continued) The following tables provide a calculation of average realized sales price per payable pound or payable ounce. Reconciliation to Amounts Reported Three Months Ended March 31, 2014 Non-GAAP cash cost $ 56.0 Refining and treatment costs (2.8) Transportation, warehousing and insurance costs (3.6) By-product credits (0.7) Inventory adjustments (8.0) Corporate allocations and other 1.9 Copper-Gold segment US GAAP operating expenses $ 42.8 Payable pounds of copper sold (000's lb) 10,793 Copper sales $ 29.8 Refining and treatment charges 2.7 Total $ 32.5 Average realized sales price per payable pound sold $ 3.01 Payable ounces of gold sold 23,874 Copper sales $ 24.4 Refining and treatment charges 0.1 Total $ 24.5 Average realized sales price per payable pound sold $ 1,025 Copper-Gold Operations - Unit Cash Cost and Average Realized Price per Payable Pound or Payable Ounce Sold (US$ in millions, except per pound amounts) Co-Product
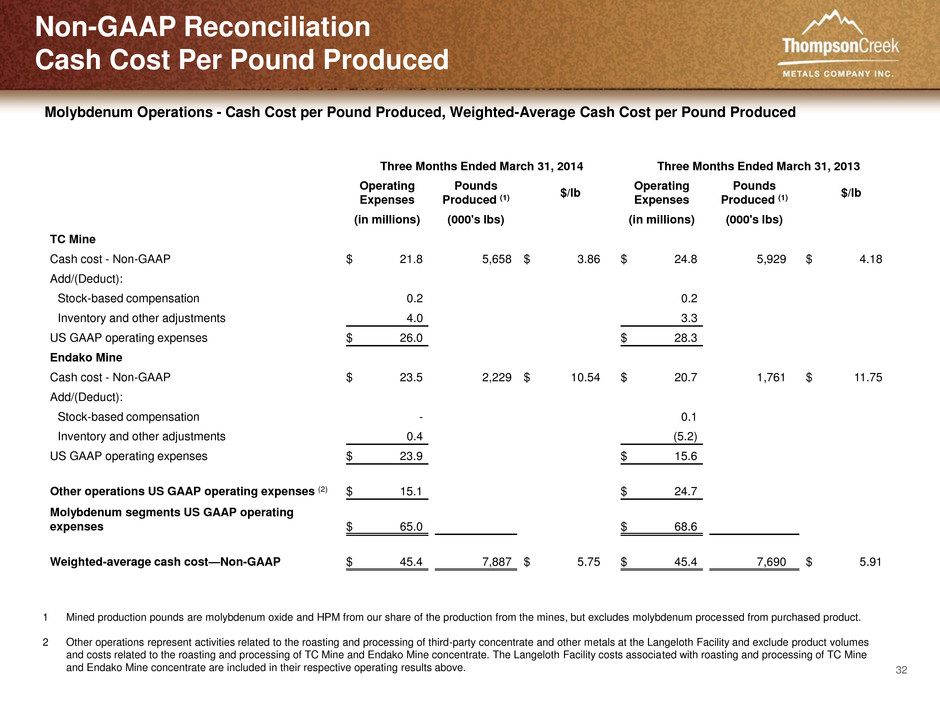
32 Non-GAAP Reconciliation Cash Cost Per Pound Produced 1 Mined production pounds are molybdenum oxide and HPM from our share of the production from the mines, but excludes molybdenum processed from purchased product. 2 Other operations represent activities related to the roasting and processing of third-party concentrate and other metals at the Langeloth Facility and exclude product volumes and costs related to the roasting and processing of TC Mine and Endako Mine concentrate. The Langeloth Facility costs associated with roasting and processing of TC Mine and Endako Mine concentrate are included in their respective operating results above. Molybdenum Operations - Cash Cost per Pound Produced, Weighted-Average Cash Cost per Pound Produced Three Months Ended March 31, 2014 Three Months Ended March 31, 2013 Operating Expenses Pounds Produced (1) $/lb Operating Expenses Pounds Produced (1) $/lb (in millions) (000's lbs) (in millions) (000's lbs) TC Mine Cash cost - Non-GAAP $ 21.8 5,658 $ 3.86 $ 24.8 5,929 $ 4.18 Add/(Deduct): Stock-based compensation 0.2 0.2 Inventory and other adjustments 4.0 3.3 US GAAP operating expenses $ 26.0 $ 28.3 Endako Mine Cash cost - Non-GAAP $ 23.5 2,229 $ 10.54 $ 20.7 1,761 $ 11.75 Add/(Deduct): Stock-based compensation - 0.1 Inventory and other adjustments 0.4 (5.2) US GAAP operating expenses $ 23.9 $ 15.6 Other operations US GAAP operating expenses (2) $ 15.1 $ 24.7 Molybdenum segments US GAAP operating expenses $ 65.0 $ 68.6 Weighted-average cash cost—Non-GAAP $ 45.4 7,887 $ 5.75 $ 45.4 7,690 $ 5.91


