UNITED STATES
SECURITIES AND EXCHANGE COMMISSION
Washington, D.C. 20549
FORM N-CSR
CERTIFIED SHAREHOLDER REPORT OF REGISTERED
MANAGEMENT INVESTMENT COMPANIES
Investment Company Act file number 811-22135
Innovator ETFs Trust
(Exact name of registrant as specified in charter)
109 North Hale Street
Wheaton, IL 60187
(Address of principal executive offices) (Zip code)
Chapman and Cutler LLP
320 South Canal Street, 27th Floor
Chicago, IL 60606
(Name and address of agent for service)
800-208-5212
Registrant's telephone number, including area code
Date of fiscal year end: October 31, 2022
Date of reporting period: April 30, 2022
Item 1. Reports to Stockholders.
(a) |
|
TABLE OF CONTENTS
Letter to Shareholders | 3 |
Fund Performance | 7 |
Expense Example | 93 |
Schedules of Investments and Options Written | 96 |
Statements of Assets and Liabilities | 182 |
Statements of Operations | 208 |
Statements of Changes in Net Assets | 234 |
Financial Highlights | 260 |
Notes to Financial Statements | 286 |
Trustees and Officers | 319 |
Board Considerations Regarding Approval of Investment Management Agreement | 321 |
Additional Information | 327 |
Letter to Shareholders (Unaudited)
Dear Valued Shareholders,
Thank you for your interest in Innovator ETFs.
The six-month period ended April 30, 2022 was marked by a number of confounding challenges. Just when much of the world was beginning to move beyond many of the constraints imposed from the Covid pandemic, a war broke out in Europe and inflation climbed to its highest level in 40 years. Central banks began to tighten monetary policy even as disruptions to global supply chains persisted.
In recent years, prior to the 2022 bond market selloff, historically-low bond yields meant that one of the few remaining portfolio benefits from a bond allocation was as a diversifier against a downturn in stocks. In 2022, however, we believe the traditional bond allocation that investors have relied on for decades has not lived up to the task. In the face of these economic challenges, not only did the stock market fall 10%, but the bond market also suffered a 9.5% loss, its worst six-month return since March 1980.1
At Innovator, we have been focused for several years on the challenges posed by bonds and the potential solution that Defined Outcome ETFs™ can provide - and the industry has been listening. During the six months ended April 30, 2022, Defined Outcome ETFs™ saw $3.3 billion in net flows, representing industry growth of 38%. Not surprisingly, ETFs with 15% and 30% buffers garnered the lion’s share of flows as investors sought out higher levels of risk management.
Among the 148 ETFs receiving Morningstar’s “Defined Outcome ETF” designation, Innovator remains the leader with a total of 79 ETFs and more than $6.2 billion in assets.
During this period, Innovator rounded out its industry-first suite of US Equity Accelerated ETFs®, which seek to offer 2x or 3x the upside of the SPDR S&P 500 ETF (SPY) to a cap, with 1-to-1 exposure on the downside over the outcome period.
I’m also pleased to be able to report that Innovator’s Buffer ETFs™ have performed as they were designed to, mitigating equity market drawdown and volatility during this period. On average, our 36 US Equity Buffer ETFs™ exhibited just 43% participation in the downside of the SPY and only 48% of its volatility.
Letter to Shareholders (Unaudited) (Continued)
Amidst these challenging market conditions, Innovator remains committed to providing products that enable investors to redefine the risk and reward of their market exposures. We intend to continue striving to earn your trust and look forward to working together to bring meaningful solutions to the ever-changing investment landscape.
On behalf of the team at Innovator, thank you for your confidence in us and in the products we offer. May the Lord grant all of us wisdom and peace in the months ahead.

Bruce Bond
Chief Executive Officer
The views in this report were those of the Fund’s CEO as of April 30, 2022 and may not reflect his views on the date that this report is first published or anytime thereafter. These views are intended to assist shareholders in understanding their investments and do not constitute investment advice.
1. | Source: Bloomberg LP. Stock and bond market measured by the S&P 500 Index and Bloomberg US Aggregate Bond Index, respectively. |
Letter to Shareholders (Unaudited) (Continued)
The funds only seek to provide their investment objective, which is not guaranteed, over the course of an entire outcome period. Investors who purchase shares after or sell shares before the end of an outcome period will experience very different outcomes than the funds seek to provide.
The Funds have characteristics unlike many other traditional investment products and may not be suitable for all investors. For more information regarding whether an investment in the Fund is right for you, please see Investor Suitability" in the prospectus.
The Funds are designed to provide point-to-point exposure to the price return of a reference asset via a basket of Flex Options. As a result, the ETFs are not expected to move directly in line with the reference asset during the interim period. Additionally, FLEX Options may be less liquid than standard options. In a less liquid market for the FLEX Options, the Fund may have difficulty closing out certain FLEX Options positions at desired times and prices.
Fund shareholders are subject to an upside return cap (Cap) that represents the maximum percentage return an investor can achieve from an investment in the funds' for the Outcome Period, before fees and expenses. If the Outcome Period has begun and the Fund has increased in value to a level near to the Cap, an investor purchasing at that price has little or no ability to achieve gains but remains vulnerable to downside risks. Additionally, the Cap may rise or fall from one Outcome Period to the next. The Cap, and the Fund's position relative to it, should be considered before investing in the Fund. The Funds' website, www.innovatoretfs.com, provides important Fund information as well information relating to the potential outcomes of an investment in a Fund on a daily basis.
Buffer ETFs: The Funds only seek to provide shareholders that hold shares for the entire Outcome Period with their respective buffer level against reference asset losses during the Outcome Period. You will bear all reference asset losses exceeding the buffer. Depending upon market conditions at the time of purchase, a shareholder that purchases shares after the Outcome Period has begun may also lose their entire investment. For instance, if the Outcome Period has begun and the Fund has decreased in value beyond the pre-determined buffer, an investor purchasing shares at that price may not benefit from the buffer. Similarly, if the Outcome Period has begun and the Fund has increased in value, an investor purchasing shares at that price may not benefit from the buffer until the Fund's value has decreased to its value at the commencement of the Outcome Period.
Letter to Shareholders (Unaudited) (Continued)
Accelerated ETFs: If the Outcome Period has begun and the Fund has experienced an accelerated return, an investor purchasing Shares at that price may be subject to losses that exceed any losses of the Underlying ETF for the remainder of the Outcome Period and may have diminished or no ability to experience further accelerated return, therefore exposing the investor to greater downside risks.
This material must be preceded by or accompanied with a prospectus. The Funds' investment objectives, risks, charges and expenses should be considered carefully before investing. The prospectus contains this and other important information, and it may be obtained at innovatoretfs.com. Read it carefully before investing.
Innovator ETFs are distributed by Foreside Fund Services, LLC.
INNOVATOR INTERNATIONAL DEVELOPED POWER BUFFER ETF - JANUARY
Fund Performance
April 30, 2022 (Unaudited)
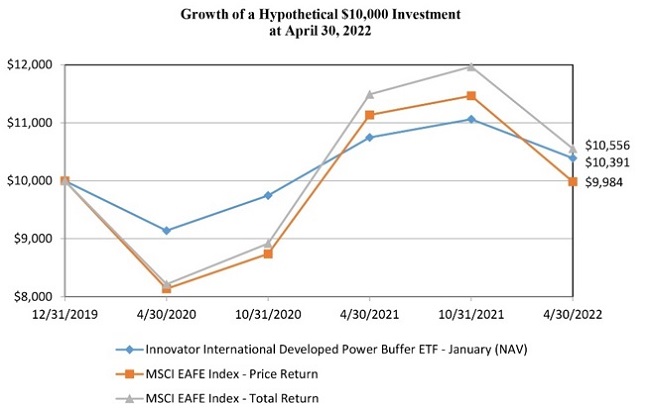
The following chart compares the value of a hypothetical $10,000 investment in the Innovator International Developed Power Buffer ETF - January from its inception (December 31, 2019) to April 30, 2022 as compared with the MSCI EAFE Index - Price Return and Total Return.
Average Annual Total Returns as of April 30, 2022 | ||||||||
One Year | Since Inception (a) | |||||||
Innovator International Developed Power Buffer ETF - January | ||||||||
NAV Return | -3.30 | % | 1.66 | % | ||||
Market Return | -3.71 | % | 1.73 | % | ||||
MSCI EAFE Index - Price Return | -10.35 | % | -0.07 | % | ||||
MSCI EAFE Index - Total Return | -8.15 | % | 2.35 | % | ||||
(a) Inception date is December 31, 2019.
Performance data quoted represents past performance and does not guarantee future results. The investment return and principal value of an investment will fluctuate so that an investor’s shares, when redeemed, may be worth more or less than their original cost. Current performance of the Fund may be lower or higher than the performance quoted. As of the latest prospectus, the net expense ratio of the Fund was 0.85%. For the most recent performance, please visit the Fund’s website at innovatoretfs.com.
INNOVATOR INTERNATIONAL DEVELOPED POWER BUFFER ETF - JANUARY
Fund Performance
April 30, 2022 (Unaudited) (Continued)
The line graph and performance table do not reflect the deduction of taxes that a shareholder may pay on fund distributions or the redemption of Fund shares. Returns shown for the Fund and MSCI EAFE Index - Total Return include the reinvestment of all dividends, if any. Returns shown for the MSCI EAFE Index - Price Return do not include the reinvestment of dividends, if any.
The MSCI EAFE Index is a free float-adjusted market capitalization weighted index that is designed to measure the equity market performance of developed markets, excluding the United States and Canada.
The Fund’s portfolio holdings may differ significantly from the securities held in the relevant index and, unlike an exchange-traded fund, the performance of an unmanaged index does not reflect deductions for transaction costs, taxes, management fees or other expenses.
You cannot invest directly in an index.
Premium/Discount Information:
Information regarding the differences between the price of the Fund’s shares on the secondary market and the Fund’s net asset value is available atInnovatoretfs.com/IJAN.
INNOVATOR INTERNATIONAL DEVELOPED POWER BUFFER ETF - APRIL
Fund Performance |
April 30, 2022 (Unaudited) |
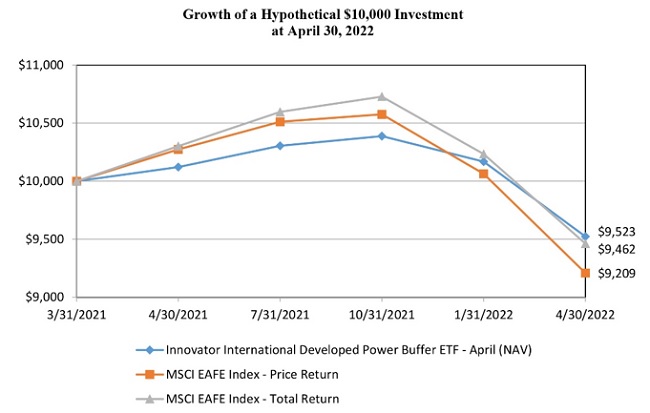
The following chart compares the value of a hypothetical $10,000 investment in the Innovator International Developed Power Buffer ETF - April from its inception (March 31, 2021) to April 30, 2022 as compared with the MSCI EAFE Index - Price Return and Total Return. |
Average Annual Total Returns as of April 30, 2022 | ||||||||
One Year | Since Inception (a) | |||||||
Innovator International Developed Power Buffer ETF - April | ||||||||
NAV Return | -5.92 | % | -4.42 | % | ||||
Market Return | -6.40 | % | -4.36 | % | ||||
MSCI EAFE Index - Price Return | -10.35 | % | -7.33 | % | ||||
MSCI EAFE Index - Total Return | -8.15 | % | -4.98 | % | ||||
(a) Inception date is March 31, 2021. |
Performance data quoted represents past performance and does not guarantee future results. The investment return and principal value of an investment will fluctuate so that an investor’s shares, when redeemed, may be worth more or less than their original cost. Current performance of the Fund may be lower or higher than the performance quoted. As of the latest prospectus, the net expense ratio of the Fund was 0.85%. For the most recent performance, please visit the Fund’s website at innovatoretfs.com. |
INNOVATOR INTERNATIONAL DEVELOPED POWER BUFFER ETF - APRIL
Fund Performance |
April 30, 2022 (Unaudited) (Continued) |
The line graph and performance table does not reflect the deduction of taxes that a shareholder may pay on fund distributions or the redemption of Fund shares. Returns shown for the Fund and MSCI EAFE Index - Total Return include the reinvestment of all dividends, if any. Returns shown for the MSCI EAFE Index - Price Return do not include the reinvestment of dividends, if any.
The MSCI EAFE Index is a free float-adjusted market capitalization weighted index that is designed to measure the equity market performance of developed markets, excluding the United States and Canada.
The Fund’s portfolio holdings may differ significantly from the securities held in the relevant index and, unlike an exchange-traded fund, the performance of an unmanaged index does not reflect deductions for transaction costs, taxes, management fees or other expenses.
You cannot invest directly in an index.
Premium/Discount Information:
Information regarding the differences between the price of the Fund’s shares on the secondary market and the Fund’s net asset value is available atInnovatoretfs.com/IAPR.
INNOVATOR INTERNATIONAL DEVELOPED POWER BUFFER ETF - JULY
Fund Performance
April 30, 2022 (Unaudited)
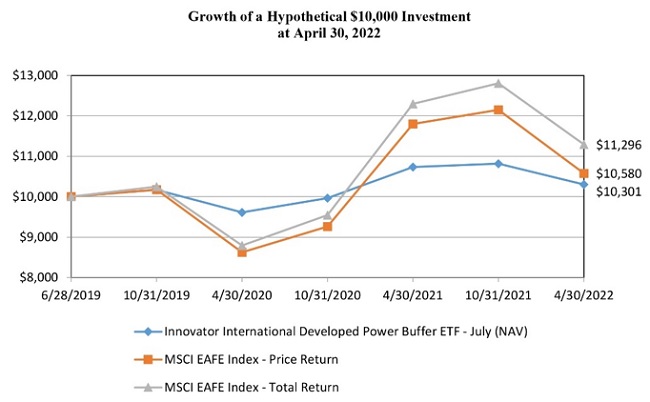
The following chart compares the value of a hypothetical $10,000 investment in the Innovator International Developed Power Buffer ETF - July from its inception (June 28, 2019) to April 30, 2022 as compared with the MSCI EAFE Index – Price Return and Total Return.
Average Annual Total Returns as of April 30, 2022 | ||||||||
One Year | Since Inception (a) | |||||||
Innovator International Developed Power Buffer ETF - July | ||||||||
NAV Return | -4.05 | % | 1.05 | % | ||||
Market Return | -3.64 | % | 1.02 | % | ||||
MSCI EAFE Index - Price Return | -10.35 | % | 2.00 | % | ||||
MSCI EAFE Index - Total Return | -8.15 | % | 4.38 | % | ||||
(a) Inception date is June 28, 2019.
Performance data quoted represents past performance and does not guarantee future results. The investment return and principal value of an investment will fluctuate so that an investor’s shares, when redeemed, may be worth more or less than their original cost. Current performance of the Fund may be lower or higher than the performance quoted. As of the latest prospectus, the net expense ratio of the Fund was 0.85%. For the most recent performance, please visit the Fund’s website at innovatoretfs.com.
INNOVATOR INTERNATIONAL DEVELOPED POWER BUFFER ETF - JULY
Fund Performance
April 30, 2022 (Unaudited) (Continued)
The line graph and performance table do not reflect the deduction of taxes that a shareholder may pay on fund distributions or the redemption of Fund shares. Returns shown for the Fund and MSCI EAFE Index – Total Return include the reinvestment of all dividends, if any. Returns shown for the MSCI EAFE Index – Price Return do not include the reinvestment of dividends, if any.
The MSCI EAFE Index is a free float-adjusted market capitalization weighted index that is designed to measure the equity market performance of developed markets, excluding the United States and Canada.
The Fund’s portfolio holdings may differ significantly from the securities held in the relevant index and, unlike an exchange-traded fund, the performance of an unmanaged index does not reflect deductions for transaction costs, taxes, management fees or other expenses.
You cannot invest directly in an index.
Premium/Discount Information:
Information regarding the differences between the price of the Fund’s shares on the secondary market and the Fund’s net asset value is available at Innovatoretfs.com/IJUL.
INNOVATOR INTERNATIONAL DEVELOPED POWER BUFFER ETF - OCTOBER
Fund Performance | |
April 30, 2022 (Unaudited) | |
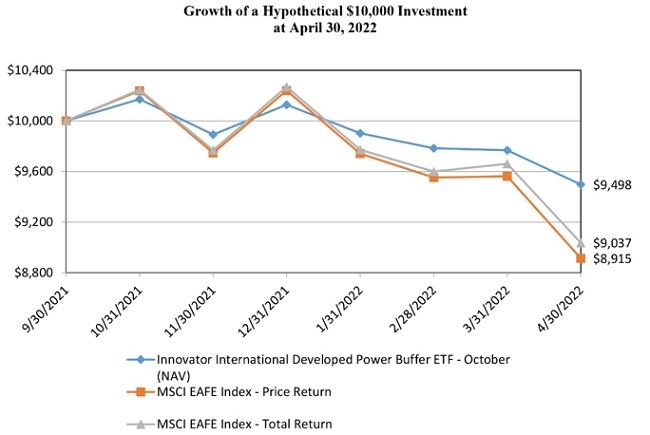
The following chart compares the value of a hypothetical $10,000 investment in the Innovator International Developed Power Buffer ETF - October from its inception (September 30, 2021) to April 30, 2022 as compared with the MSCI EAFE Index - Price Return and Total Return.
Total Returns as of April 30, 2022 | ||||
Since Inception (a) | ||||
Innovator International Developed Power Buffer ETF - October | ||||
NAV Return | -5.02 | % | ||
Market Return | -4.87 | % | ||
MSCI EAFE Index - Price Return | -10.85 | % | ||
MSCI EAFE Index - Total Return | -9.63 | % | ||
(a) Inception date is September 30, 2021. |
Performance data quoted represents past performance and does not guarantee future results. The investment return and principal value of an investment will fluctuate so that an investor’s shares, when redeemed, may be worth more or less than their original cost. Current performance of the Fund may be lower or higher than the performance quoted. As of the latest prospectus, the net expense ratio of the Fund was 0.85%. For the most recent performance, please visit the Fund’s website at innovatoretfs.com. |
INNOVATOR INTERNATIONAL DEVELOPED POWER BUFFER ETF - OCTOBER
Fund Performance | |
April 30, 2022 (Unaudited) (Continued) | |
The line graph and performance table does not reflect the deduction of taxes that a shareholder may pay on fund distributions or the redemption of Fund shares. Returns shown for the Fund and MSCI EAFE Index - Total Return include the reinvestment of all dividends, if any. Returns shown for the MSCI EAFE Index - Price Return do not include the reinvestment of dividends, if any.
The MSCI EAFE Index is a free float-adjusted market capitalization weighted index that is designed to measure the equity market performance of developed markets, excluding the United States and Canada.
The Fund’s portfolio holdings may differ significantly from the securities held in the relevant index and, unlike an exchange-traded fund, the performance of an unmanaged index does not reflect deductions for transaction costs, taxes, management fees or other expenses.
You cannot invest directly in an index.
Premium/Discount Information:
Information regarding the differences between the price of the Fund’s shares on the secondary market and the Fund’s net asset value is available atInnovatoretfs.com/IOCT.
INNOVATOR EMERGING MARKETS POWER BUFFER ETF - JANUARY
Fund Performance
April 30, 2022 (Unaudited)
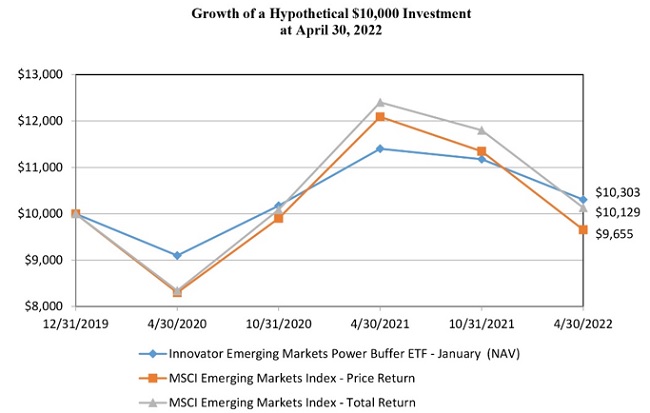
The following chart compares the value of a hypothetical $10,000 investment in the Innovator Emerging Markets Power Buffer ETF - January from its inception (December 31, 2019) to April 30, 2022 as compared with the MSCI Emerging Markets Index - Price Return and Total Return.
Average Annual Total Returns as of April 30, 2022 | ||||||||
One Year | Since Inception (a) | |||||||
Innovator Emerging Markets Power Buffer ETF - January | ||||||||
NAV Return | -9.63 | % | 1.29 | % | ||||
Market Return | -9.82 | % | 1.25 | % | ||||
MSCI Emerging Markets Index - Price Return | -20.14 | % | -1.50 | % | ||||
MSCI Emerging Markets Index - Total Return | -18.33 | % | 0.55 | % | ||||
(a) Inception date is December 31, 2019.
Performance data quoted represents past performance and does not guarantee future results. The investment return and principal value of an investment will fluctuate so that an investor’s shares, when redeemed, may be worth more or less than their original cost. Current performance of the Fund may be lower or higher than the performance quoted. As of the latest prospectus, the net expense ratio of the Fund was 0.89%. For the most recent performance, please visit the Fund’s website at innovatoretfs.com.
INNOVATOR EMERGING MARKETS POWER BUFFER ETF - JANUARY
Fund Performance
April 30, 2022 (Unaudited) (Continued)
The line graph and performance table do not reflect the deduction of taxes that a shareholder may pay on fund distributions or the redemption of Fund shares. Returns shown for the Fund and MSCI Emerging Markets Index - Total Return include the reinvestment of all dividends, if any. Returns shown for the MSCI Emerging Markets Index - Price Return do not include the reinvestment of dividends, if any.
The MSCI Emerging Markets Index is a free float-adjusted market capitalization index that is designed to measure equity market performance of emerging markets.
The Fund’s portfolio holdings may differ significantly from the securities held in the relevant index and, unlike an exchange-traded fund, the performance of an unmanaged index does not reflect deductions for transaction costs, taxes, management fees or other expenses.
You cannot invest directly in an index.
Premium/Discount Information:
Information regarding the differences between the price of the Fund’s shares on the secondary market and the Fund’s net asset value is available at Innovatoretfs.com/EJAN.
INNOVATOR EMERGING MARKETS POWER BUFFER ETF - APRIL
Fund Performance |
April 30, 2022 (Unaudited) |
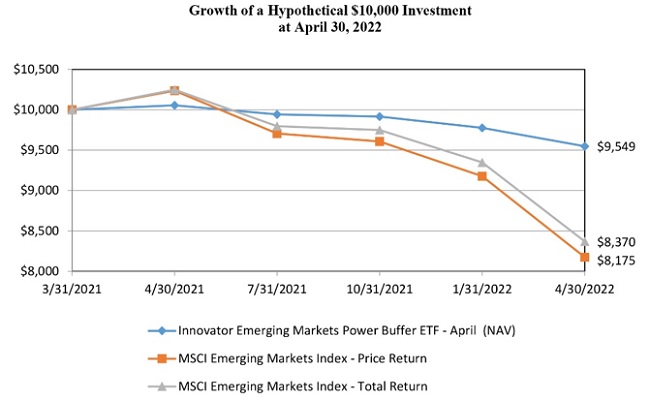
The following chart compares the value of a hypothetical $10,000 investment in the Innovator Emerging Markets Power Buffer ETF - April from its inception (March 31, 2021) to April 30, 2022 as compared with the MSCI Emerging Markets Index - Price Return and Total Return. |
Average Annual Total Returns as of April 30, 2022 | ||||||||
One Year | Since Inception (a) | |||||||
Innovator Emerging Markets Power Buffer ETF - April | ||||||||
NAV Return | -5.05 | % | -4.18 | % | ||||
Market Return | -5.97 | % | -4.55 | % | ||||
MSCI Emerging Markets Index - Price Return | -20.14 | % | -16.99 | % | ||||
MSCI Emerging Markets Index - Total Return | -18.33 | % | -15.16 | % | ||||
(a) Inception date is March 31, 2021. |
Performance data quoted represents past performance and does not guarantee future results. The investment return and principal value of an investment will fluctuate so that an investor’s shares, when redeemed, may be worth more or less than their original cost. Current performance of the Fund may be lower or higher than the performance quoted. As of the latest prospectus, the net expense ratio of the Fund was 0.89%. For the most recent performance, please visit the Fund’s website at innovatoretfs.com. |
INNOVATOR EMERGING MARKETS POWER BUFFER ETF - APRIL
Fund Performance |
April 30, 2022 (Unaudited) (Continued) |
The line graph and performance table does not reflect the deduction of taxes that a shareholder may pay on fund distributions or the redemption of Fund shares. Returns shown for the Fund and MSCI Emerging Markets Index - Total Return include the reinvestment of all dividends, if any. Returns shown for the MSCI Emerging Markets Index - Price Return do not include the reinvestment of dividends, if any.
The MSCI Emerging Markets Index is a free float-adjusted market capitalization weighted index that is designed to measure the equity market performance of emerging markets.
The Fund’s portfolio holdings may differ significantly from the securities held in the relevant index and, unlike an exchange-traded fund, the performance of an unmanaged index does not reflect deductions for transaction costs, taxes, management fees or other expenses.
You cannot invest directly in an index.
Premium/Discount Information:
Information regarding the differences between the price of the Fund’s shares on the secondary market and the Fund’s net asset value is available atInnovatoretfs.com/EAPR.
INNOVATOR EMERGING MARKETS POWER BUFFER ETF - JULY
Fund Performance
April 30, 2022 (Unaudited)
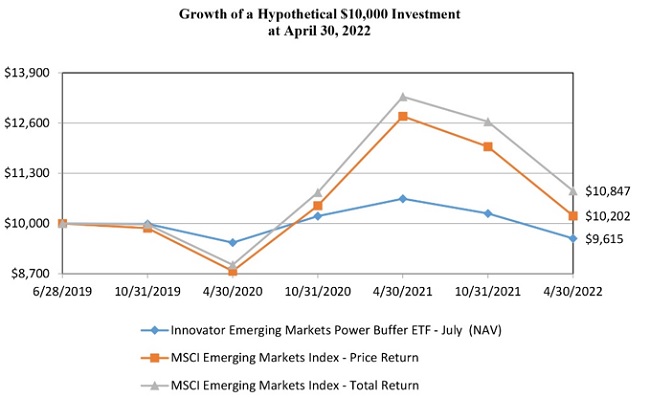
The following chart compares the value of a hypothetical $10,000 investment in the Innovator Emerging Markets Power Buffer ETF - July from its inception (June 28, 2019) to April 30, 2022 as compared with the MSCI Emerging Markets Index – Price Return and Total Return.
Average Annual Total Returns as of April 30, 2022 | ||||||||
One Year | Since Inception (a) | |||||||
Innovator Emerging Markets Power Buffer ETF - July | ||||||||
NAV Return | -9.65 | % | -1.37 | % | ||||
Market Return | -9.49 | % | -1.39 | % | ||||
MSCI Emerging Markets Index - Price Return | -20.14 | % | 0.71 | % | ||||
MSCI Emerging Markets Index - Total Return | -18.33 | % | 2.90 | % | ||||
(a) Inception date is June 28, 2019.
Performance data quoted represents past performance and does not guarantee future results. The investment return and principal value of an investment will fluctuate so that an investor’s shares, when redeemed, may be worth more or less than their original cost. Current performance of the Fund may be lower or higher than the performance quoted. As of the latest prospectus, the net expense ratio of the Fund was 0.89%. For the most recent performance, please visit the Fund’s website at innovatoretfs.com.
INNOVATOR EMERGING MARKETS POWER BUFFER ETF - JULY
Fund Performance
April 30, 2022 (Unaudited) (Continued)
The line graph and performance table do not reflect the deduction of taxes that a shareholder may pay on fund distributions or the redemption of Fund shares. Returns shown for the Fund and MSCI Emerging Markets Index – Total Return include the reinvestment of all dividends, if any. Returns shown for the MSCI Emerging Markets Index – Price Return do not include the reinvestment of dividends, if any.
The MSCI Emerging Markets Index is a free float-adjusted market capitalization index that is designed to measure equity market performance of emerging markets.
The Fund’s portfolio holdings may differ significantly from the securities held in the relevant index and, unlike an exchange-traded fund, the performance of an unmanaged index does not reflect deductions for transaction costs, taxes, management fees or other expenses.
You cannot invest directly in an index.
Premium/Discount Information:
Information regarding the differences between the price of the Fund’s shares on the secondary market and the Fund’s net asset value is available at Innovatoretfs.com/EJUL.
INNOVATOR EMERGING MARKETS POWER BUFFER ETF - OCTOBER
Fund Performance | |||
April 30, 2022 (Unaudited) | |||
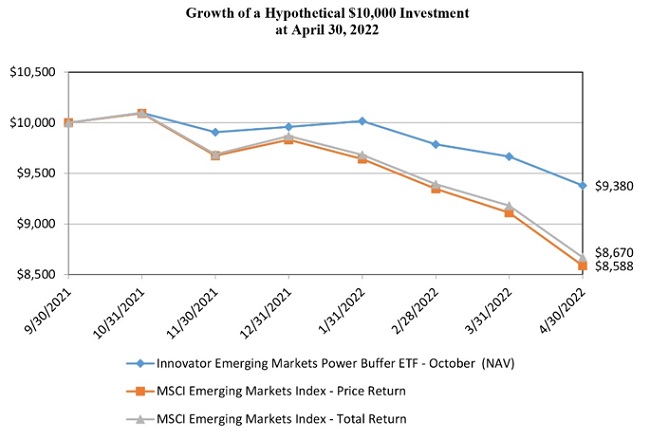
The following chart compares the value of a hypothetical $10,000 investment in the Innovator Emerging Markets Power Buffer ETF - October from its inception (September 30, 2021) to April 30, 2022 as compared with the MSCI Emerging Markets Index - Price Return and Total Return.
Total Returns as of April 30, 2022 | ||||
Since Inception (a) | ||||
Innovator Emerging Markets Power Buffer ETF - October | ||||
NAV Return | -6.20 | % | ||
Market Return | -6.50 | % | ||
MSCI Emerging Markets Index - Price Return | -14.12 | % | ||
MSCI Emerging Markets Index - Total Return | -13.30 | % | ||
(a) Inception date is September 30, 2021. |
Performance data quoted represents past performance and does not guarantee future results. The investment return and principal value of an investment will fluctuate so that an investor’s shares, when redeemed, may be worth more or less than their original cost. Current performance of the Fund may be lower or higher than the performance quoted. As of the latest prospectus, the net expense ratio of the Fund was 0.89%. For the most recent performance, please visit the Fund’s website at innovatoretfs.com. |
INNOVATOR EMERGING MARKETS POWER BUFFER ETF - OCTOBER
Fund Performance | ||
April 30, 2022 (Unaudited) (Continued) | ||
The line graph and performance table does not reflect the deduction of taxes that a shareholder may pay on fund distributions or the redemption of Fund shares. Returns shown for the Fund and MSCI Emerging Markets Index - Total Return include the reinvestment of all dividends, if any. Returns shown for the MSCI Emerging Markets Index - Price Return do not include the reinvestment of dividends, if any.
The MSCI Emerging Markets Index is a free float-adjusted market capitalization weighted index that is designed to measure the equity market performance of emerging markets.
The Fund’s portfolio holdings may differ significantly from the securities held in the relevant index and, unlike an exchange-traded fund, the performance of an unmanaged index does not reflect deductions for transaction costs, taxes, management fees or other expenses.
You cannot invest directly in an index.
Premium/Discount Information:
Information regarding the differences between the price of the Fund’s shares on the secondary market and the Fund’s net asset value is available atInnovatoretfs.com/EOCT.
INNOVATOR GROWTH-100 POWER BUFFER ETF – JANUARY
Fund Performance
April 30, 2022 (Unaudited)
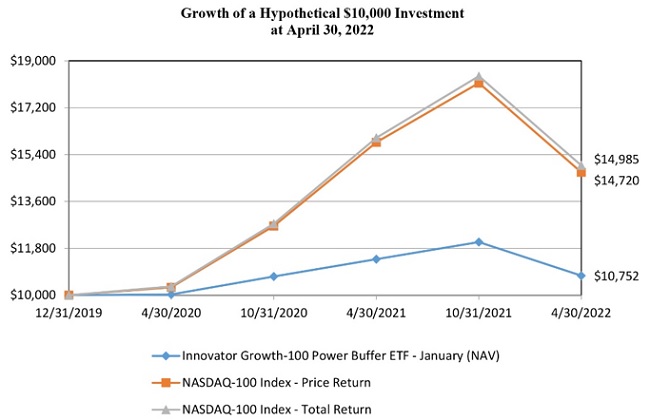
The following chart compares the value of a hypothetical $10,000 investment in the Innovator Growth-100 Power Buffer ETF - January from its inception (December 31, 2019) to April 30, 2022 as compared with the NASDAQ-100 Index - Price Return and Total Return.
Average Annual Total Returns as of April 30, 2022 | ||||||||
One Year | Since Inception (a) | |||||||
Innovator Growth-100 Power Buffer ETF - January | ||||||||
NAV Return | -5.53 | % | 3.16 | % | ||||
Market Return | -5.44 | % | 3.15 | % | ||||
NASDAQ-100 Index - Price Return | -7.26 | % | 18.04 | % | ||||
NASDAQ-100 Index - Total Return | -6.61 | % | 18.94 | % | ||||
(a) Inception date is December 31, 2019.
Performance data quoted represents past performance and does not guarantee future results. The investment return and principal value of an investment will fluctuate so that an investor’s shares, when redeemed, may be worth more or less than their original cost. Current performance of the Fund may be lower or higher than the performance quoted. As of the latest prospectus, the net expense ratio of the Fund was 0.79%. For the most recent performance, please visit the Fund’s website at innovatoretfs.com.
INNOVATOR GROWTH-100 POWER BUFFER ETF – JANUARY
Fund Performance
April 30, 2022 (Unaudited) (Continued)
The line graph and performance table do not reflect the deduction of taxes that a shareholder may pay on fund distributions or the redemption of Fund shares. Returns shown for the Fund and NASDAQ-100 Index - Total Return include the reinvestment of all dividends, if any. Returns shown for the NASDAQ-100 Index - Price Return do not include the reinvestment of dividends, if any.
The NASDAQ-100 Index includes 100 of the largest domestic and international non-financial companies listed on the Nasdaq Stock Market based on market capitalization. The NASDAQ-100 Price Index reflects companies across major industry groups including computer hardware and software, telecommunications, retail/wholesale trade and biotechnologies. It does not contain securities of financial companies including investment companies.
The Fund’s portfolio holdings may differ significantly from the securities held in the relevant index and, unlike an exchange-traded fund, the performance of an unmanaged index does not reflect deductions for transaction costs, taxes, management fees or other expenses.
You cannot invest directly in an index.
Premium/Discount Information:
Information regarding the differences between the price of the Fund’s shares on the secondary market and the Fund’s net asset value is available at Innovatoretfs.com/NJAN.
INNOVATOR GROWTH-100 POWER BUFFER ETF – APRIL
Fund Performance | ||
April 30, 2022 (Unaudited) | ||
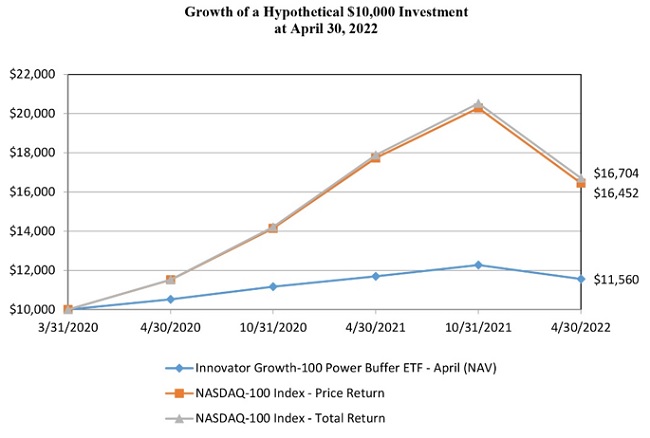
The following chart compares the value of a hypothetical $10,000 investment in the Innovator Growth-100 Power Buffer ETF - April from its inception (March 31, 2020) to April 30, 2022 as compared with the NASDAQ-100 Index - Price Return and Total Return.
Average Annual Total Returns as of April 30, 2022 | ||||||||
One Year | Since Inception (a) | |||||||
Innovator Growth-100 Power Buffer ETF - April | ||||||||
NAV Return | -1.12 | % | 7.21 | % | ||||
Market Return | -1.00 | % | 7.20 | % | ||||
NASDAQ-100 Index - Price Return | -7.26 | % | 27.01 | % | ||||
NASDAQ-100 Index - Total Return | -6.61 | % | 27.94 | % | ||||
(a) Inception date is March 31, 2020.
Performance data quoted represents past performance and does not guarantee future results. The investment return and principal value of an investment will fluctuate so that an investor’s shares, when redeemed, may be worth more or less than their original cost. Current performance of the Fund may be lower or higher than the performance quoted. As of the latest prospectus, the net expense ratio of the Fund was 0.79%. For the most recent performance, please visit the Fund’s website at innovatoretfs.com.
INNOVATOR GROWTH-100 POWER BUFFER ETF – APRIL
Fund Performance
April 30, 2022 (Unaudited) (Continued)
The line graph and performance table do not reflect the deduction of taxes that a shareholder may pay on fund distributions or the redemption of Fund shares. Returns shown for the Fund and NASDAQ-100 Index - Total Return include the reinvestment of all dividends, if any. Returns shown for the NASDAQ-100 Index - Price Return do not include the reinvestment of dividends, if any.
The NASDAQ-100 Index includes 100 of the largest domestic and international non-financial companies listed on the Nasdaq Stock Market based on market capitalization. The NASDAQ-100 Price Index reflects companies across major industry groups including computer hardware and software, telecommunications, retail/wholesale trade and biotechnologies. It does not contain securities of financial companies including investment companies.
The Fund’s portfolio holdings may differ significantly from the securities held in the relevant index and, unlike an exchange-traded fund, the performance of an unmanaged index does not reflect deductions for transaction costs, taxes, management fees or other expenses.
You cannot invest directly in an index.
Premium/Discount Information:
Information regarding the differences between the price of the Fund’s shares on the secondary market and the Fund’s net asset value is available at Innovatoretfs.com/NAPR.
INNOVATOR GROWTH-100 POWER BUFFER ETF – JULY
Fund Performance |
April 30, 2022 (Unaudited) |
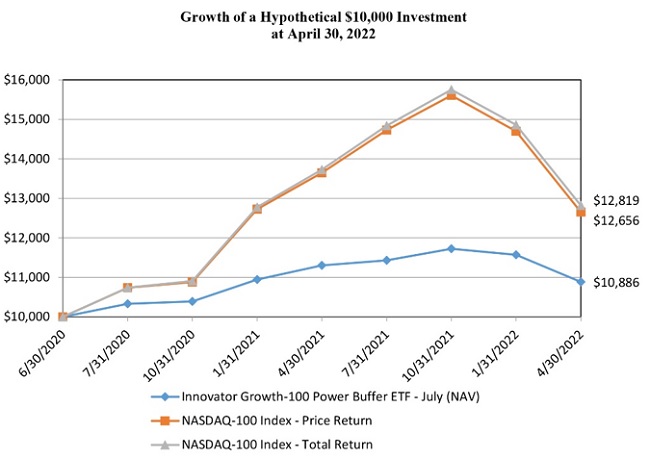
The following chart compares the value of a hypothetical $10,000 investment in the Innovator Growth-100 Power Buffer ETF - July from its inception (June 30, 2020) to April 30, 2022 as compared with the NASDAQ-100 Index - Price Return and Total Return.
Average Annual Total Returns as of April 30, 2022 | ||||||||
One Year | Since Inception (a) | |||||||
Innovator Growth-100 Power Buffer ETF - July | ||||||||
NAV Return | -3.70 | % | 4.74 | % | ||||
Market Return | -3.49 | % | 4.78 | % | ||||
NASDAQ-100 Index - Price Return | -7.26 | % | 13.71 | % | ||||
NASDAQ-100 Index - Total Return | -6.61 | % | 14.51 | % | ||||
(a) Inception date is June 30, 2020.
Performance data quoted represents past performance and does not guarantee future results. The investment return and principal value of an investment will fluctuate so that an investor’s shares, when redeemed, may be worth more or less than their original cost. Current performance of the Fund may be lower or higher than the performance quoted. As of the latest prospectus, the net expense ratio of the Fund was 0.79%. For the most recent performance, please visit the Fund’s website at innovatoretfs.com.
INNOVATOR GROWTH-100 POWER BUFFER ETF – JULY
Fund Performance |
April 30, 2022 (Unaudited) (Continued) |
The line graph and performance table do not reflect the deduction of taxes that a shareholder may pay on fund distributions or the redemption of Fund shares. Returns shown for the Fund and NASDAQ-100 Index - Total Return include the reinvestment of all dividends, if any. Returns shown for the NASDAQ-100 Index - Price Return do not include the reinvestment of dividends, if any.
The NASDAQ-100 Index includes 100 of the largest domestic and international non-financial companies listed on the Nasdaq Stock Market based on market capitalization. The NASDAQ-100 Price Index reflects companies across major industry groups including computer hardware and software, telecommunications, retail/wholesale trade and biotechnologies. It does not contain securities of financial companies including investment companies.
The Fund’s portfolio holdings may differ significantly from the securities held in the relevant index and, unlike an exchange-traded fund, the performance of an unmanaged index does not reflect deductions for transaction costs, taxes, management fees or other expenses.
You cannot invest directly in an index.
Premium/Discount Information:
Information regarding the differences between the price of the Fund’s shares on the secondary market and the Fund’s net asset value is available at Innovatoretfs.com/NJUL.
INNOVATOR GROWTH-100 POWER BUFFER ETF – OCTOBER
Fund Performance
April 30, 2022 (Unaudited)
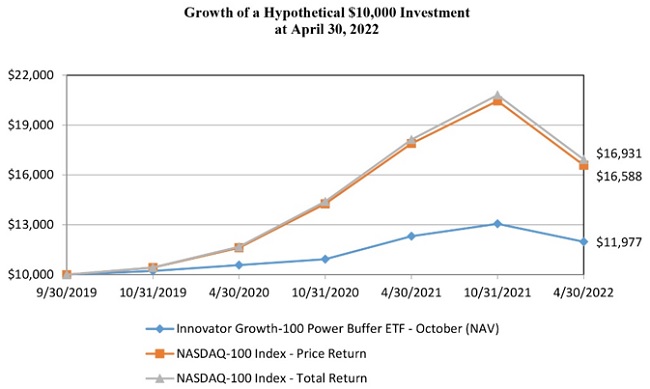
The following chart compares the value of a hypothetical $10,000 investment in the Innovator Growth-100 Power Buffer ETF - October from its inception (September 30, 2019) to April 30, 2022 as compared with the NASDAQ-100 Index - Price Return and Total Return.
Average Annual Total Returns as of April 30, 2022 | ||||||||
One Year | Since Inception (a) | |||||||
Innovator Growth-100 Power Buffer ETF - October | ||||||||
NAV Return | -2.70 | % | 7.23 | % | ||||
Market Return | -2.55 | % | 7.20 | % | ||||
NASDAQ-100 Index - Price Return | -7.26 | % | 21.64 | % | ||||
NASDAQ-100 Index - Total Return | -6.61 | % | 22.61 | % | ||||
(a) Inception date is September 30, 2019.
Performance data quoted represents past performance and does not guarantee future results. The investment return and principal value of an investment will fluctuate so that an investor’s shares, when redeemed, may be worth more or less than their original cost. Current performance of the Fund may be lower or higher than the performance quoted. As of the latest prospectus, the net expense ratio of the Fund was 0.79%. For the most recent performance, please visit the Fund’s website at innovatoretfs.com.
INNOVATOR GROWTH-100 POWER BUFFER ETF – OCTOBER
Fund Performance
April 30, 2022 (Unaudited) (Continued)
The line graph and performance table do not reflect the deduction of taxes that a shareholder may pay on fund distributions or the redemption of Fund shares. Returns shown for the Fund and NASDAQ-100 Index - Total Return include the reinvestment of all dividends, if any. Returns shown for the NASDAQ-100 Index - Price Return do not include the reinvestment of dividends, if any.
The NASDAQ-100 Index includes 100 of the largest domestic and international non-financial companies listed on the Nasdaq Stock Market based on market capitalization. The NASDAQ-100 Price Index reflects companies across major industry groups including computer hardware and software, telecommunications, retail/wholesale trade and biotechnologies. It does not contain securities of financial companies including investment companies.
The Fund’s portfolio holdings may differ significantly from the securities held in the relevant index and, unlike an exchange-traded fund, the performance of an unmanaged index does not reflect deductions for transaction costs, taxes, management fees or other expenses.
You cannot invest directly in an index.
Premium/Discount Information:
Information regarding the differences between the price of the Fund’s shares on the secondary market and the Fund’s net asset value is available at Innovatoretfs.com/NOCT.
INNOVATOR U.S. SMALL CAP POWER BUFFER ETF – JANUARY
Fund Performance
April 30, 2022 (Unaudited)
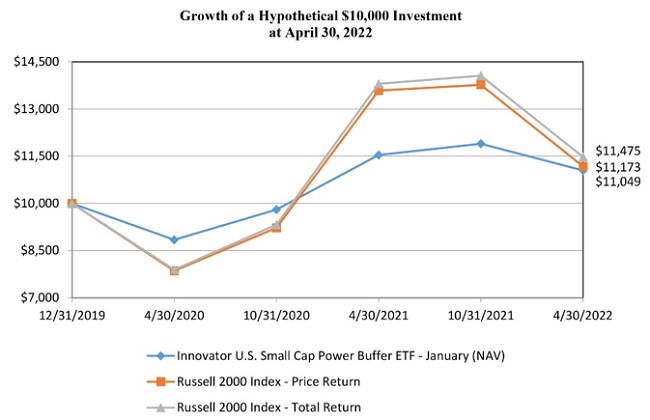
The following chart compares the value of a hypothetical $10,000 investment in the Innovator U.S. Small Cap Power Buffer ETF - January from its inception (December 31, 2019) to April 30, 2022 as compared with the Russell 2000 Index - Price Return and Total Return.
Average Annual Total Returns as of April 30, 2022 | ||||||||
One Year | Since Inception (a) | |||||||
Innovator U.S. Small Cap Power Buffer ETF - January | ||||||||
NAV Return | -4.26 | % | 4.37 | % | ||||
Market Return | -4.24 | % | 4.29 | % | ||||
Russell 2000 Index - Price Return | -17.75 | % | 4.87 | % | ||||
Russell 2000 Index - Total Return | -16.87 | % | 6.08 | % | ||||
(a) Inception date is December 31, 2019.
Performance data quoted represents past performance and does not guarantee future results. The investment return and principal value of an investment will fluctuate so that an investor’s shares, when redeemed, may be worth more or less than their original cost. Current performance of the Fund may be lower or higher than the performance quoted. As of the latest prospectus, the net expense ratio of the Fund was 0.79%. For the most recent performance, please visit the Fund’s website at innovatoretfs.com.
INNOVATOR U.S. SMALL CAP POWER BUFFER ETF – JANUARY
Fund Performance |
April 30, 2022 (Unaudited) (Continued) |
The line graph and performance table do not reflect the deduction of taxes that a shareholder may pay on fund distributions or the redemption of Fund shares. Returns shown for the Fund and Russell 2000 Index - Total Return include the reinvestment of all dividends, if any. Returns shown for the Russell 2000 Index - Price Return do not include the reinvestment of dividends, if any. |
The Russell 2000 Index is a float-adjusted capitalization-weighted index of equity securities issued by the approximately 2,000 smallest issuers in the Russell 3000 Index. The Russell 2000 Price Index measures the performance of the small-capitalization sector of the U.S. equity market, as defined by FTSE Russell. The Russell 2000 Price Index is a subset of the Russell 3000 Index, which measures the performance of the broad U.S. equity market, as defined by FTSE Russell. |
The Fund’s portfolio holdings may differ significantly from the securities held in the relevant index and, unlike an exchange-traded fund, the performance of an unmanaged index does not reflect deductions for transaction costs, taxes, management fees or other expenses. |
You cannot invest directly in an index. |
Premium/Discount Information: |
Information regarding the differences between the price of the Fund’s shares on the secondary market and the Fund’s net asset value is available at Innovatoretfs.com/KJAN. |
INNOVATOR U.S. SMALL CAP POWER BUFFER ETF – APRIL
Fund Performance |
April 30, 2022 (Unaudited) |
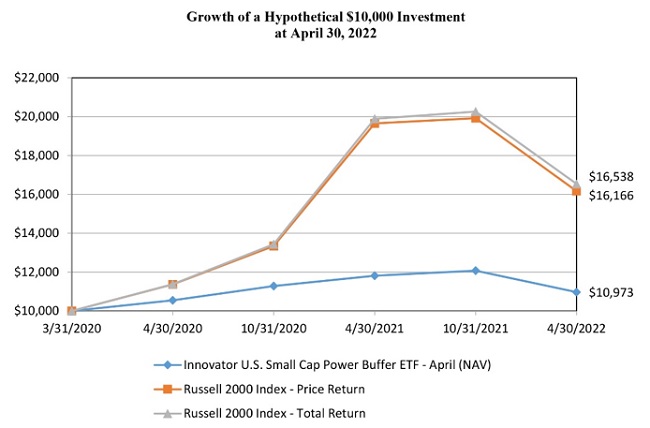
The following chart compares the value of a hypothetical $10,000 investment in the Innovator U.S. Small Cap Power Buffer ETF - April from its inception (March 31, 2020) to April 30, 2022 as compared with the Russell 2000 Index - Price Return and Total Return.
Average Annual Total Returns as of April 30, 2022 | ||||||||
One Year | Since Inception (a) | |||||||
Innovator U.S. Small Cap Power Buffer ETF - April | ||||||||
NAV Return | -7.14 | % | 4.56 | % | ||||
Market Return | -7.23 | % | 4.53 | % | ||||
Russell 2000 Index - Price Return | -17.75 | % | 25.95 | % | ||||
Russell 2000 Index - Total Return | -16.87 | % | 27.33 | % | ||||
(a) Inception date is March 31, 2020.
Performance data quoted represents past performance and does not guarantee future results. The investment return and principal value of an investment will fluctuate so that an investor’s shares, when redeemed, may be worth more or less than their original cost. Current performance of the Fund may be lower or higher than the performance quoted. As of the latest prospectus, the net expense ratio of the Fund was 0.79%. For the most recent performance, please visit the Fund’s website at innovatoretfs.com.
INNOVATOR U.S. SMALL CAP POWER BUFFER ETF – APRIL
Fund Performance |
April 30, 2022 (Unaudited) (Continued) |
The line graph and performance table do not reflect the deduction of taxes that a shareholder may pay on fund distributions or the redemption of Fund shares. Returns shown for the Fund and Russell 2000 Index - Total Return include the reinvestment of all dividends, if any. Returns shown for the Russell 2000 Index - Price Return do not include the reinvestment of dividends, if any. |
The Russell 2000 Index is a float-adjusted capitalization-weighted index of equity securities issued by the approximately 2,000 smallest issuers in the Russell 3000 Index. The Russell 2000 Price Index measures the performance of the small-capitalization sector of the U.S. equity market, as defined by FTSE Russell. The Russell 2000 Price Index is a subset of the Russell 3000 Index, which measures the performance of the broad U.S. equity market, as defined by FTSE Russell. |
The Fund’s portfolio holdings may differ significantly from the securities held in the relevant index and, unlike an exchange-traded fund, the performance of an unmanaged index does not reflect deductions for transaction costs, taxes, management fees or other expenses. |
You cannot invest directly in an index. |
Premium/Discount Information: |
Information regarding the differences between the price of the Fund’s shares on the secondary market and the Fund’s net asset value is available at Innovatoretfs.com/KAPR. |
INNOVATOR U.S. SMALL CAP POWER BUFFER ETF – JULY
Fund Performance | |
April 30, 2022 (Unaudited) | |
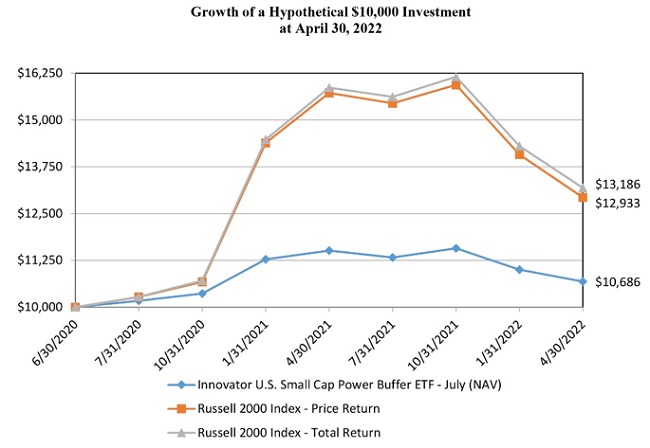
The following chart compares the value of a hypothetical $10,000 investment in the Innovator U.S. Small Cap Power Buffer ETF - July from its inception (June 30, 2020) to April 30, 2022 as compared with the Russell 2000 Index - Price Return and Total Return.
Average Annual Total Returns as of April 30, 2022 | ||||||||
One Year | Since Inception (a) | |||||||
Innovator U.S. Small Cap Power Buffer ETF - July | ||||||||
NAV Return | -7.19 | % | 3.68 | % | ||||
Market Return | -7.18 | % | 3.50 | % | ||||
Russell 2000 Index - Price Return | -17.75 | % | 15.06 | % | ||||
Russell 2000 Index - Total Return | -16.87 | % | 16.29 | % | ||||
(a) Inception date is June 30, 2020.
Performance data quoted represents past performance and does not guarantee future results. The investment return and principal value of an investment will fluctuate so that an investor’s shares, when redeemed, may be worth more or less than their original cost. Current performance of the Fund may be lower or higher than the performance quoted. As of the latest prospectus, the net expense ratio of the Fund was 0.79%. For the most recent performance, please visit the Fund’s website at innovatoretfs.com.
INNOVATOR U.S. SMALL CAP POWER BUFFER ETF – JULY
Fund Performance | |
April 30, 2022 (Unaudited) (Continued) | |
The line graph and performance table do not reflect the deduction of taxes that a shareholder may pay on fund distributions or the redemption of Fund shares. Returns shown for the Fund and Russell 2000 Index - Total Return include the reinvestment of all dividends, if any. Returns shown for the Russell 2000 Index - Price Return do not include the reinvestment of dividends, if any.
The Russell 2000 Index is a float-adjusted capitalization-weighted index of equity securities issued by the approximately 2,000 smallest issuers in the Russell 3000 Index. The Russell 2000 Price Index measures the performance of the small-capitalization sector of the U.S. equity market, as defined by FTSE Russell. The Russell 2000 Price Index is a subset of the Russell 3000 Index, which measures the performance of the broad U.S. equity market, as defined by FTSE Russell.
The Fund’s portfolio holdings may differ significantly from the securities held in the relevant index and, unlike an exchange-traded fund, the performance of an unmanaged index does not reflect deductions for transaction costs, taxes, management fees or other expenses.
You cannot invest directly in an index.
Premium/Discount Information:
Information regarding the differences between the price of the Fund’s shares on the secondary market and the Fund’s net asset value is available at Innovatoretfs.com/KJUL.
INNOVATOR U.S. SMALL CAP POWER BUFFER ETF – OCTOBER
Fund Performance |
April 30, 2022 (Unaudited) |
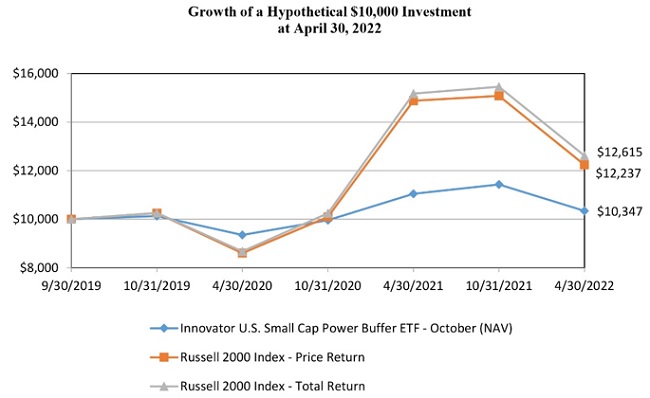
The following chart compares the value of a hypothetical $10,000 investment in the Innovator U.S. Small Cap Power Buffer ETF - October from its inception (September 30, 2019) to April 30, 2022 as compared with the Russell 2000 Index - Price Return and Total Return. |
Average Annual Total Returns as of April 30, 2022 | ||||||||
One Year | Since Inception (a) | |||||||
Innovator U.S. Small Cap Power Buffer ETF- October | ||||||||
NAV Return | -6.34 | % | 1.33 | % | ||||
Market Return | -6.26 | % | 1.27 | % | ||||
Russell 2000 Index - Price Return | -17.75 | % | 8.13 | % | ||||
Russell 2000 Index - Total Return | -16.87 | % | 9.41 | % | ||||
(a) Inception date is September 30, 2019. |
Performance data quoted represents past performance and does not guarantee future results. The investment return and principal value of an investment will fluctuate so that an investor’s shares, when redeemed, may be worth more or less than their original cost. Current performance of the Fund may be lower or higher than the performance quoted. As of the latest prospectus, the net expense ratio of the Fund was 0.79%. For the most recent performance, please visit the Fund’s website at innovatoretfs.com. |
INNOVATOR U.S. SMALL CAP POWER BUFFER ETF – OCTOBER
Fund Performance |
April 30, 2022 (Unaudited) (Continued) |
The line graph and performance table do not reflect the deduction of taxes that a shareholder may pay on fund distributions or the redemption of Fund shares. Returns shown for the Fund and Russell 2000 Index - Total Return include the reinvestment of all dividends, if any. Returns shown for the Russell 2000 Index - Price Return do not include the reinvestment of dividends, if any. |
The Russell 2000 Index is a float-adjusted capitalization-weighted index of equity securities issued by the approximately 2,000 smallest issuers in the Russell 3000 Index. The Russell 2000 Price Index measures the performance of the small-capitalization sector of the U.S. equity market, as defined by FTSE Russell. The Russell 2000 Price Index is a subset of the Russell 3000 Index, which measures the performance of the broad U.S. equity market, as defined by FTSE Russell. |
The Fund’s portfolio holdings may differ significantly from the securities held in the relevant index and, unlike an exchange-traded fund, the performance of an unmanaged index does not reflect deductions for transaction costs, taxes, management fees or other expenses. |
You cannot invest directly in an index. |
Premium/Discount Information: |
Information regarding the differences between the price of the Fund’s shares on the secondary market and the Fund’s net asset value is available at Innovatoretfs.com/KOCT. |
INNOVATOR DOUBLE STACKER ETF – JANUARY
Fund Performance |
April 30, 2022 (Unaudited) |
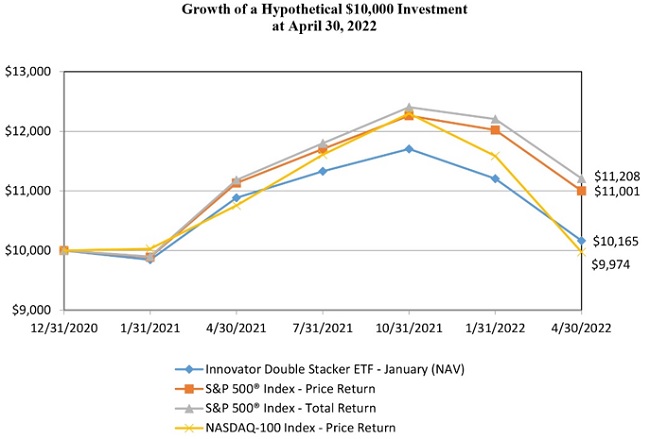
The following chart compares the value of a hypothetical $10,000 investment in the Innovator Double Stacker ETF - January from its inception (December 31, 2020) to April 30, 2022 as compared with the S&P 500® Index - Total Return, S&P 500® Index - Price Return and NASDAQ-100 Index - Price Return.
Average Annual Total Returns as of April 30, 2022 | ||||||||
One Year | Since Inception (a) | |||||||
Innovator Double Stacker ETF - January | ||||||||
NAV Return | -6.61 | % | 1.24 | % | ||||
Market Return | -6.73 | % | 1.11 | % | ||||
S&P 500® Index - Price Return | -1.18 | % | 7.44 | % | ||||
S&P 500® Index - Total Return | 0.21 | % | 8.96 | % | ||||
NASDAQ-100 Index - Price Return | -7.26 | % | -0.20 | % | ||||
(a) Inception date is December 31, 2020. |
Performance data quoted represents past performance and does not guarantee future results. The investment return and principal value of an investment will fluctuate so that an investor’s shares, when redeemed, may be worth more or less than their original cost. Current performance of the Fund may be lower or higher than the performance quoted. As of the latest prospectus, the net expense ratio of the Fund was 0.79%. For the most recent performance, please visit the Fund’s website at innovatoretfs.com. |
INNOVATOR DOUBLE STACKER ETF – JANUARY
Fund Performance |
April 30, 2022 (Unaudited) |
The line graph and performance table do not reflect the deduction of taxes that a shareholder may pay on fund distributions or the redemption of Fund shares. Returns shown for the Fund and S&P 500® Index - Total Return include the reinvestment of all dividends, if any. Returns shown for the S&P 500® Index - Price Return and NASDAQ-100 Index - Price Return do not include the reinvestment of dividends, if any. |
The S&P 500® Index is an unmanaged, capitalization-weighted index generally representative of the U.S. market for large capitalization stocks. |
The NASDAQ-100 Index includes 100 of the largest domestic and international non-financial companies listed on the Nasdaq Stock Market based on market capitalization. The NASDAQ-100 Price Index reflects companies across major industry groups including computer hardware and software, telecommunications, retail/wholesale trade and biotechnologies. It does not contain securities of financial companies including investment companies. |
The Fund’s portfolio holdings may differ significantly from the securities held in the relevant index and, unlike an exchange-traded fund, the performance of an unmanaged index does not reflect deductions for transaction costs, taxes, management fees or other expenses. |
You cannot invest directly in an index. |
Premium/Discount Information: |
Information regarding the differences between the price of the Fund’s shares on the secondary market and the Fund’s net asset value is available at Innovatoretfs.com/DSJA. |
INNOVATOR DOUBLE STACKER ETF – OCTOBER
Fund Performance | |
April 30, 2022 (Unaudited) | |
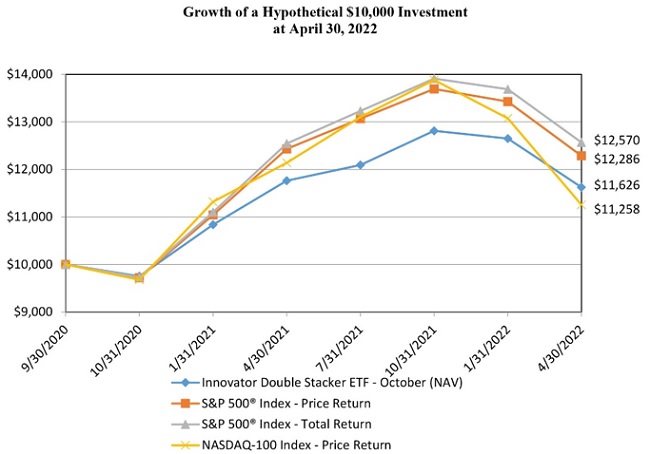
The following chart compares the value of a hypothetical $10,000 investment in the Innovator Double Stacker ETF - October from its inception (September 30, 2020) to April 30, 2022 as compared with the S&P 500® Index - Total Return, S&P 500® Index - Price Return and NASDAQ-100 Index - Price Return. |
Average Annual Total Returns as of April 30, 2022 | ||||||||
One Year | Since Inception (a) | |||||||
Innovator Double Stacker ETF - October | ||||||||
NAV Return | -1.17 | % | 10.00 | % | ||||
Market Return | -1.48 | % | 9.86 | % | ||||
S&P 500® Index - Price Return | -1.18 | % | 13.91 | % | ||||
S&P 500® Index - Total Return | 0.21 | % | 15.57 | % | ||||
NASDAQ-100 Index - Price Return | -7.26 | % | 7.79 | % | ||||
(a) Inception date is September 30, 2020. |
Performance data quoted represents past performance and does not guarantee future results. The investment return and principal value of an investment will fluctuate so that an investor’s shares, when redeemed, may be worth more or less than their original cost. Current performance of the Fund may be lower or higher than the performance quoted. As of the latest prospectus, the net expense ratio of the Fund was 0.79%. For the most recent performance, please visit the Fund’s website at innovatoretfs.com.
INNOVATOR DOUBLE STACKER ETF – OCTOBER
Fund Performance | |
April 30, 2022 (Unaudited) | |
The line graph and performance table does not reflect the deduction of taxes that a shareholder may pay on fund distributions or the redemption of Fund shares. Returns shown for the Fund and S&P 500® Index - Total Return include the reinvestment of all dividends, if any. Returns shown for the S&P 500® Index - Price Return and NASDAQ-100 Index - Price Return do not include the reinvestment of dividends, if any.
The S&P 500® Index is an unmanaged, capitalization-weighted index generally representative of the U.S. market for large capitalization stocks.
The NASDAQ-100 Index includes 100 of the largest domestic and international non-financial companies listed on the Nasdaq Stock Market based on market capitalization. The NASDAQ-100 Price Index reflects companies across major industry groups including computer hardware and software, telecommunications, retail/wholesale trade and biotechnologies. It does not contain securities of financial companies including investment companies.
The Fund’s portfolio holdings may differ significantly from the securities held in the relevant index and, unlike an exchange-traded fund, the performance of an unmanaged index does not reflect deductions for transaction costs, taxes, management fees or other expenses.
You cannot invest directly in an index.
Premium/Discount Information:
Information regarding the differences between the price of the Fund’s shares on the secondary market and the Fund’s net asset value is available at Innovatoretfs.com/DSOC.
INNOVATOR TRIPLE STACKER ETF – JANUARY
Fund Performance |
April 30, 2022 (Unaudited) |
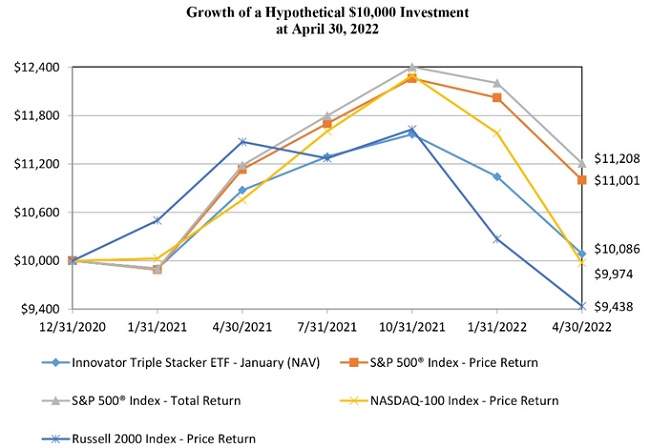
The following chart compares the value of a hypothetical $10,000 investment in the Innovator Triple Stacker ETF - January from its inception (December 31, 2020) to April 30, 2022 as compared with the S&P 500® Index - Total Return, S&P 500® Index - Price Return, NASDAQ-100 Index - Price Return and Russell 2000 Index - Price Return.
Average Annual Total Returns as of April 30, 2022 | ||||||||
One Year | Since Inception (a) | |||||||
Innovator Triple Stacker ETF - January | ||||||||
NAV Return | -7.26 | % | 0.64 | % | ||||
Market Return | -7.67 | % | 0.59 | % | ||||
S&P 500® Index - Price Return | -1.18 | % | 7.44 | % | ||||
S&P 500® Index - Total Return | 0.21 | % | 8.96 | % | ||||
NASDAQ-100 Index - Price Return | -7.26 | % | -0.20 | % | ||||
Russell 2000 Index - Price Return | -17.75 | % | -4.25 | % | ||||
(a) Inception date is December 31, 2020. |
Performance data quoted represents past performance and does not guarantee future results. The investment return and principal value of an investment will fluctuate so that an investor’s shares, when redeemed, may be worth more or less than their original cost. Current performance of the Fund may be lower or higher than the performance quoted. As of the latest prospectus, the net expense ratio of the Fund was 0.79%. For the most recent performance, please visit the Fund’s website at innovatoretfs.com. |
INNOVATOR TRIPLE STACKER ETF – JANUARY
Fund Performance |
April 30, 2022 (Unaudited) |
The line graph and performance table do not reflect the deduction of taxes that a shareholder may pay on fund distributions or the redemption of Fund shares. Returns shown for the Fund and S&P 500® Index - Total Return include the reinvestment of all dividends, if any. Returns shown for the S&P 500® Index - Price Return, NASDAQ 100 Index - Price Return and Russell 2000 Index - Price Return do not include the reinvestment of dividends, if any. |
The S&P 500® Index is an unmanaged, capitalization-weighted index generally representative of the U.S. market for large capitalization stocks. |
The NASDAQ-100 Index includes 100 of the largest domestic and international non-financial companies listed on the Nasdaq Stock Market based on market capitalization. The NASDAQ-100 Price Index reflects companies across major industry groups including computer hardware and software, telecommunications, retail/wholesale trade and biotechnologies. It does not contain securities of financial companies including investment companies. |
The Russell 2000 Index is a float-adjusted capitalization-weighted index of equity securities issued by the approximately 2,000 smallest issuers in the Russell 3000 Index. The Russell 2000 Price Index measures the performance of the small-capitalization sector of the U.S. equity market, as defined by FTSE Russell. The Russell 2000 Price Index is a subset of the Russell 3000 Index, which measures the performance of the broad U.S. equity market, as defined by FTSE Russell. |
The Fund’s portfolio holdings may differ significantly from the securities held in the relevant index and, unlike an exchange-traded fund, the performance of an unmanaged index does not reflect deductions for transaction costs, taxes, management fees or other expenses. |
You cannot invest directly in an index. |
Premium/Discount Information: |
Information regarding the differences between the price of the Fund’s shares on the secondary market and the Fund’s net asset value is available at Innovatoretfs.com/TSJA. |
INNOVATOR TRIPLE STACKER ETF – OCTOBER
Fund Performance |
April 30, 2022 (Unaudited) |
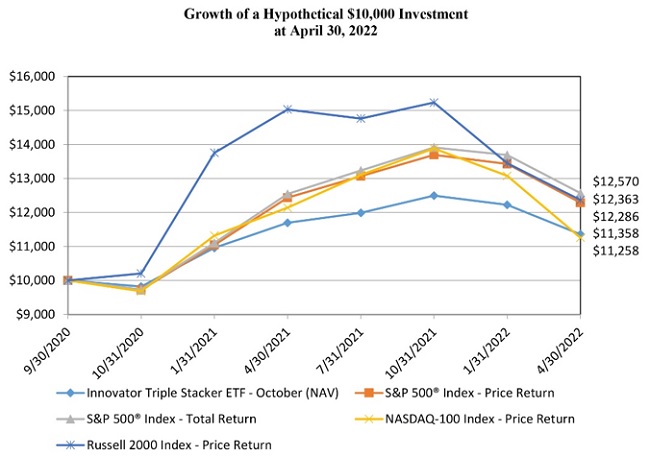
The following chart compares the value of a hypothetical $10,000 investment in the Innovator Triple Stacker ETF - October from its inception (September 30, 2020) to April 30, 2022 as compared with the S&P 500® Index - Total Return, S&P 500® Index - Price Return, NASDAQ-100 Index - Price Return and Russell 2000 Index - Price Return. |
Average Annual Total Returns as of April 30, 2022 | ||||||||
One Year | Since Inception (a) | |||||||
Innovator Triple Stacker ETF - October | ||||||||
NAV Return | -2.89 | % | 8.39 | % | ||||
Market Return | -3.06 | % | 8.26 | % | ||||
S&P 500® Index - Price Return | -1.18 | % | 13.91 | % | ||||
S&P 500® Index - Total Return | 0.21 | % | 15.57 | % | ||||
NASDAQ-100 Index - Price Return | -7.26 | % | 7.79 | % | ||||
Russell 2000 Index - Price Return | -17.75 | % | -14.37 | % | ||||
(a) Inception date is September 30, 2020. |
Performance data quoted represents past performance and does not guarantee future results. The investment return and principal value of an investment will fluctuate so that an investor’s shares, when redeemed, may be worth more or less than their original cost. Current performance of the Fund may be lower or higher than the performance quoted. As of the latest prospectus, the net expense ratio of the Fund was 0.79%. For the most recent performance, please visit the Fund’s website at innovatoretfs.com. |
INNOVATOR TRIPLE STACKER ETF – OCTOBER
Fund Performance | |
April 30, 2022 (Unaudited) (Continued) | |
The line graph and performance table do not reflect the deduction of taxes that a shareholder may pay on fund distributions or the redemption of Fund shares. Returns shown for the Fund and S&P 500® Index - Total Return include the reinvestment of all dividends, if any. Returns shown for the S&P 500® Index - Price Return, NASDAQ 100 Index - Price Return and Russell 2000 Index - Price Return do not include the reinvestment of dividends, if any.
The S&P 500® Index is an unmanaged, capitalization-weighted index generally representative of the U.S. market for large capitalization stocks.
The NASDAQ-100 Index includes 100 of the largest domestic and international non-financial companies listed on the Nasdaq Stock Market based on market capitalization. The NASDAQ-100 Price Index reflects companies across major industry groups including computer hardware and software, telecommunications, retail/wholesale trade and biotechnologies. It does not contain securities of financial companies including investment companies.
The Russell 2000 Index is a float-adjusted capitalization-weighted index of equity securities issued by the approximately 2,000 smallest issuers in the Russell 3000 Index. The Russell 2000 Price Index measures the performance of the small-capitalization sector of the U.S. equity market, as defined by FTSE Russell. The Russell 2000 Price Index is a subset of the Russell 3000 Index, which measures the performance of the broad U.S. equity market, as defined by FTSE Russell.
The Fund’s portfolio holdings may differ significantly from the securities held in the relevant index and, unlike an exchange-traded fund, the performance of an unmanaged index does not reflect deductions for transaction costs, taxes, management fees or other expenses.
You cannot invest directly in an index.
Premium/Discount Information:
Information regarding the differences between the price of the Fund’s shares on the secondary market and the Fund’s net asset value is available at Innovatoretfs.com/TSOC.
INNOVATOR DOUBLE STACKER 9 BUFFER ETF – JANUARY
Fund Performance |
April 30, 2022 (Unaudited) |
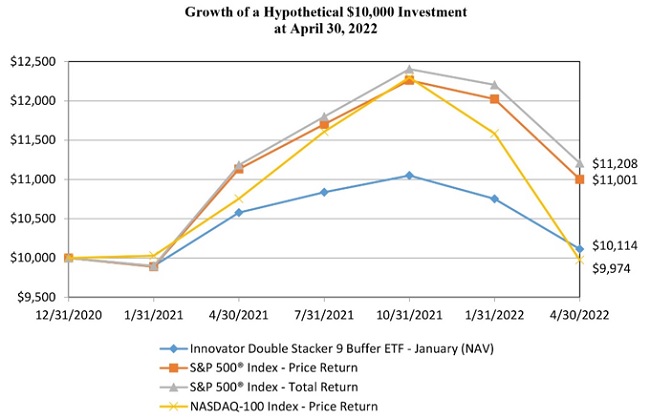
The following chart compares the value of a hypothetical $10,000 investment in the Innovator Double Stacker 9 Buffer ETF - January from its inception (December 31, 2020) to April 30, 2022 as compared with the S&P 500® Index - Total Return, S&P 500® Index - Price Return and NASDAQ-100 Index - Price Return.
Average Annual Total Returns as of April 30, 2022 | ||||||||
One Year | Since Inception (a) | |||||||
Innovator Double Stacker 9 Buffer ETF - January | ||||||||
NAV Return | -4.38 | % | 0.86 | % | ||||
Market Return | -4.52 | % | 0.75 | % | ||||
S&P 500® Index - Price Return | -1.18 | % | 7.44 | % | ||||
S&P 500® Index - Total Return | 0.21 | % | 8.96 | % | ||||
NASDAQ-100 Index - Price Return | -7.26 | % | -0.20 | % | ||||
(a) Inception date is December 31, 2020. | |||||
Performance data quoted represents past performance and does not guarantee future results. The investment return and principal value of an investment will fluctuate so that an investor’s shares, when redeemed, may be worth more or less than their original cost. Current performance of the Fund may be lower or higher than the performance quoted. As of the latest prospectus, the net expense ratio of the Fund was 0.79%. For the most recent performance, please visit the Fund’s website at innovatoretfs.com. | |||||
INNOVATOR DOUBLE STACKER 9 BUFFER ETF – JANUARY
Fund Performance |
April 30, 2022 (Unaudited) |
The line graph and performance table do not reflect the deduction of taxes that a shareholder may pay on fund distributions or the redemption of Fund shares. Returns shown for the Fund and S&P 500® Index - Total Return include the reinvestment of all dividends, if any. Returns shown for the S&P 500® Index - Price Return and NASDAQ 100 Index - Price Return do not include the reinvestment of dividends, if any. |
The S&P 500® Index is an unmanaged, capitalization-weighted index generally representative of the U.S. market for large capitalization stocks. |
The NASDAQ-100 Index includes 100 of the largest domestic and international non-financial companies listed on the Nasdaq Stock Market based on market capitalization. The NASDAQ-100 Price Index reflects companies across major industry groups including computer hardware and software, telecommunications, retail/wholesale trade and biotechnologies. It does not contain securities of financial companies including investment companies. |
The Fund’s portfolio holdings may differ significantly from the securities held in the relevant index and, unlike an exchange-traded fund, the performance of an unmanaged index does not reflect deductions for transaction costs, taxes, management fees or other expenses. |
You cannot invest directly in an index. |
Premium/Discount Information: |
Information regarding the differences between the price of the Fund’s shares on the secondary market and the Fund’s net asset value is available at Innovatoretfs.com/DBJA. |
INNOVATOR DOUBLE STACKER 9 BUFFER ETF – OCTOBER
Fund Performance | |||||
April 30, 2022 (Unaudited) | |||||
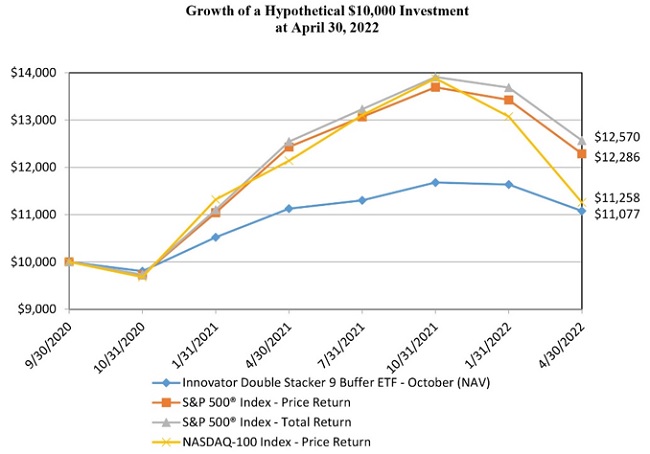
The following chart compares the value of a hypothetical $10,000 investment in the Innovator Double Stacker 9 Buffer ETF - October from its inception (September 30, 2020) to April 30, 2022 as compared with the S&P 500® Index - Total Return, S&P 500® Index - Price Return and NASDAQ-100 Index - Price Return. | |||||
Average Annual Total Returns as of April 30, 2022 | ||||||||
One Year | Since Inception (a) | |||||||
Innovator Double Stacker 9 Buffer ETF - October | ||||||||
NAV Return | -0.45 | % | 6.69 | % | ||||
Market Return | -0.57 | % | 6.64 | % | ||||
S&P 500® Index - Price Return | -1.18 | % | 13.91 | % | ||||
S&P 500® Index - Total Return | 0.21 | % | 15.57 | % | ||||
NASDAQ-100 Index - Price Return | -7.26 | % | 7.79 | % | ||||
(a) Inception date is September 30, 2020. |
Performance data quoted represents past performance and does not guarantee future results. The investment return and principal value of an investment will fluctuate so that an investor’s shares, when redeemed, may be worth more or less than their original cost. Current performance of the Fund may be lower or higher than the performance quoted. As of the latest prospectus, the net expense ratio of the Fund was 0.79%. For the most recent performance, please visit the Fund’s website at innovatoretfs.com. |
INNOVATOR DOUBLE STACKER 9 BUFFER ETF – OCTOBER
Fund Performance | |||||
April 30, 2022 (Unaudited) (Continued) |
The line graph and performance table do not reflect the deduction of taxes that a shareholder may pay on fund distributions or the redemption of Fund shares. Returns shown for the Fund and S&P 500® Index - Total Return include the reinvestment of all dividends, if any. Returns shown for the S&P 500® Index - Price Return and NASDAQ 100 Index - Price Return do not include the reinvestment of dividends, if any.
The S&P 500® Index is an unmanaged, capitalization-weighted index generally representative of the U.S. market for large capitalization stocks.
The NASDAQ-100 Index includes 100 of the largest domestic and international non-financial companies listed on the Nasdaq Stock Market based on market capitalization. The NASDAQ-100 Price Index reflects companies across major industry groups including computer hardware and software, telecommunications, retail/wholesale trade and biotechnologies. It does not contain securities of financial companies including investment companies.
The Fund’s portfolio holdings may differ significantly from the securities held in the relevant index and, unlike an exchange-traded fund, the performance of an unmanaged index does not reflect deductions for transaction costs, taxes, management fees or other expenses.
You cannot invest directly in an index.
Premium/Discount Information:
Information regarding the differences between the price of the Fund’s shares on the secondary market and the Fund’s net asset value is available at Innovatoretfs.com/DBOC.
INNOVATOR U.S. EQUITY ACCELERATED ETF - JANUARY
Fund Performance | ||
April 30, 2022 (Unaudited) | ||
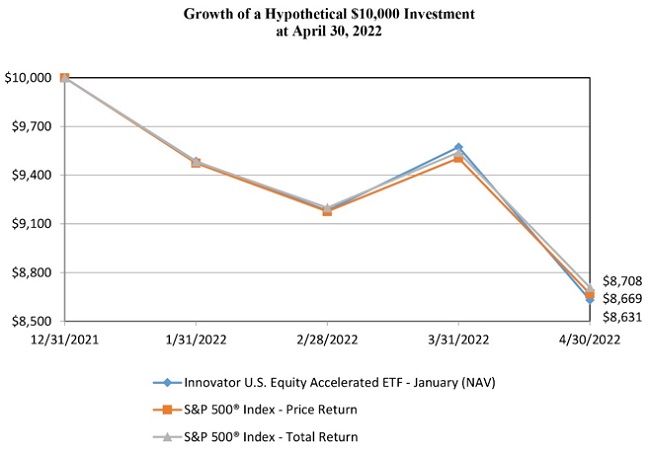
The following chart compares the value of a hypothetical $10,000 investment in the Innovator U.S. Equity Accelerated ETF - January from its inception (December 31, 2021) to April 30, 2022 as compared with the S&P 500® Index - Price Return and Total Return. |
Total Returns as of April 30, 2022 | ||||
Since Inception (a) | ||||
Innovator U.S. Equity Accelerated ETF - January | ||||
NAV Return | -13.69 | % | ||
Market Return | -13.86 | % | ||
S&P 500® Index - Price Return | -13.31 | % | ||
S&P 500® Index - Total Return | -12.92 | % | ||
(a) Inception date is December 31, 2021. |
Performance data quoted represents past performance and does not guarantee future results. The investment return and principal value of an investment will fluctuate so that an investor’s shares, when redeemed, may be worth more or less than their original cost. Current performance of the Fund may be lower or higher than the performance quoted. As of the latest prospectus, the net expense ratio of the Fund was 0.79%. For the most recent performance, please visit the Fund’s website at innovatoretfs.com. |
INNOVATOR U.S. EQUITY ACCELERATED ETF - JANUARY
Fund Performance | |
April 30, 2022 (Unaudited) (Continued) | |
The line graph and performance table does not reflect the deduction of taxes that a shareholder may pay on fund distributions or the redemption of Fund shares. Returns shown for the Fund and S&P 500® Index - Total Return include the reinvestment of all dividends, if any. Returns shown for the S&P 500® Index - Price Return do not include the reinvestment of dividends, if any. |
The S&P 500® Index is an unmanaged, capitalization-weighted index generally representative of the U.S. market for large capitalization stocks. |
The Fund’s portfolio holdings may differ significantly from the securities held in the relevant index and, unlike an exchange-traded fund, the performance of an unmanaged index does not reflect deductions for transaction costs, taxes, management fees or other expenses. |
You cannot invest directly in an index. |
Premium/Discount Information: |
Information regarding the differences between the price of the Fund’s shares on the secondary market and the Fund’s net asset value is available at Innovatoretfs.com/XDJA. |
INNOVATOR U.S. EQUITY ACCELERATED ETF - APRIL
Fund Performance | ||
April 30, 2022 (Unaudited) | ||
The following chart compares the value of a hypothetical $10,000 investment in the Innovator U.S. Equity Accelerated ETF - April from its inception (March 31, 2021) to April 30, 2022 as compared with the S&P 500® Index - Price Return and Total Return. |

Average Annual Total Returns as of April 30, 2022 | ||||||||
One Year | Since Inception (a) | |||||||
Innovator U.S. Equity Accelerated ETF - April | ||||||||
NAV Return | 2.25 | % | 5.75 | % | ||||
Market Return | 1.83 | % | 5.51 | % | ||||
S&P 500® Index - Price Return | -1.18 | % | 3.69 | % | ||||
S&P 500® Index - Total Return | 0.21 | % | 5.13 | % | ||||
(a) Inception date is March 31, 2021. |
Performance data quoted represents past performance and does not guarantee future results. The investment return and principal value of an investment will fluctuate so that an investor’s shares, when redeemed, may be worth more or less than their original cost. Current performance of the Fund may be lower or higher than the performance quoted. As of the latest prospectus, the net expense ratio of the Fund was 0.79%. For the most recent performance, please visit the Fund’s website at innovatoretfs.com. |
INNOVATOR U.S. EQUITY ACCELERATED ETF - APRIL
Fund Performance | |
April 30, 2022 (Unaudited) (Continued) | |
The line graph and performance table do not reflect the deduction of taxes that a shareholder may pay on fund distributions or the redemption of Fund shares. Returns shown for the Fund and S&P 500® Index - Total Return include the reinvestment of all dividends, if any. Returns shown for the S&P 500® Index - Price Return do not include the reinvestment of dividends, if any. |
The S&P 500® Index is an unmanaged, capitalization-weighted index generally representative of the U.S. market for large capitalization stocks. |
The Fund’s portfolio holdings may differ significantly from the securities held in the relevant index and, unlike an exchange-traded fund, the performance of an unmanaged index does not reflect deductions for transaction costs, taxes, management fees or other expenses. |
You cannot invest directly in an index. |
Premium/Discount Information: |
Information regarding the differences between the price of the Fund’s shares on the secondary market and the Fund’s net asset value is available at Innovatoretfs.com/XDAP. |
INNOVATOR U.S. EQUITY ACCELERATED ETF - JULY
Fund Performance | ||
April 30, 2022 (Unaudited) | ||
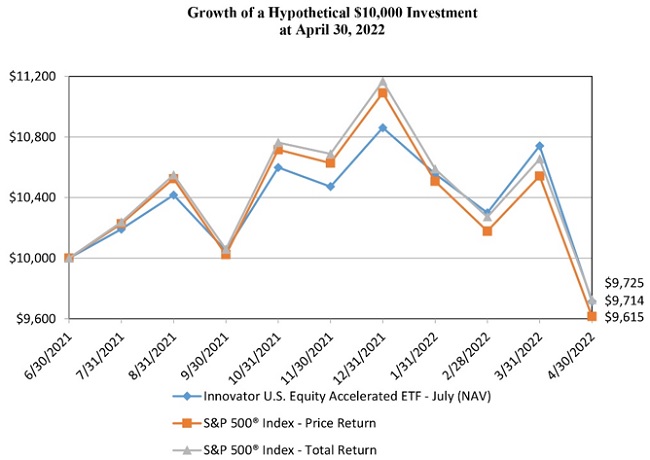
The following chart compares the value of a hypothetical $10,000 investment in the Innovator U.S. Equity Accelerated ETF - July from its inception (June 30, 2021) to April 30, 2022 as compared with the S&P 500® Index - Price Return and Total Return. |
Total Returns as of April 30, 2022 | |||
Since Inception (a) | |||
Innovator U.S. Equity Accelerated ETF - July | |||
NAV Return | -2.86 | % | |
Market Return | -3.05 | % | |
S&P 500® Index - Price Return | -3.85 | % | |
S&P 500® Index - Total Return | -2.75 | % | |
(a) Inception date is June 30, 2021. | |||||
Performance data quoted represents past performance and does not guarantee future results. The investment return and principal value of an investment will fluctuate so that an investor’s shares, when redeemed, may be worth more or less than their original cost. Current performance of the Fund may be lower or higher than the performance quoted. As of the latest prospectus, the net expense ratio of the Fund was 0.79%. For the most recent performance, please visit the Fund’s website at innovatoretfs.com. | |||||
INNOVATOR U.S. EQUITY ACCELERATED ETF - JULY
Fund Performance | |
April 30, 2022 (Unaudited) (Continued) | |
The line graph and performance table do not reflect the deduction of taxes that a shareholder may pay on fund distributions or the redemption of Fund shares. Returns shown for the Fund and S&P 500® Index - Total Return include the reinvestment of all dividends, if any. Returns shown for the S&P 500® Index - Price Return do not include the reinvestment of dividends, if any. |
The S&P 500® Index is an unmanaged, capitalization-weighted index generally representative of the U.S. market for large capitalization stocks. |
The Fund’s portfolio holdings may differ significantly from the securities held in the relevant index and, unlike an exchange-traded fund, the performance of an unmanaged index does not reflect deductions for transaction costs, taxes, management fees or other expenses. |
You cannot invest directly in an index. |
Premium/Discount Information: |
Information regarding the differences between the price of the Fund’s shares on the secondary market and the Fund’s net asset value is available at Innovatoretfs.com/XDJL. |
INNOVATOR U.S. EQUITY ACCELERATED ETF - OCTOBER
Fund Performance | |
April 30, 2022 (Unaudited) | |
The following chart compares the value of a hypothetical $10,000 investment in the Innovator U.S. Equity Accelerated ETF - October from its inception (September 30, 2021) to April 30, 2022 as compared with the S&P 500® Index - Price Return and Total Return.
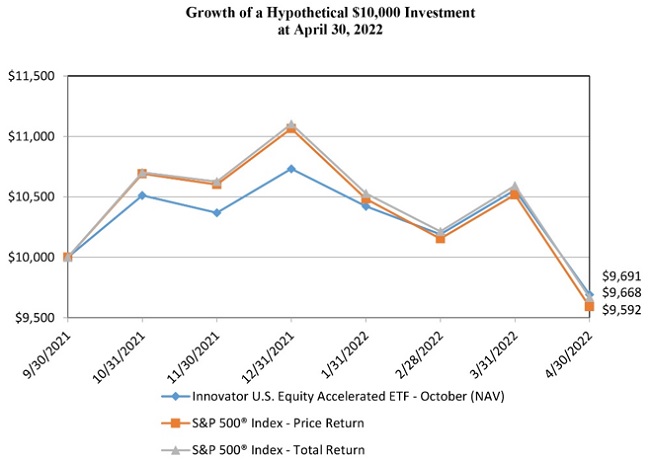
Total Returns as of April 30, 2022 | ||||
Since Inception (a) | ||||
Innovator U.S. Equity Accelerated ETF - October | ||||
NAV Return | -3.09 | % | ||
Market Return | -3.10 | % | ||
S&P 500® Index - Price Return | -4.08 | % | ||
S&P 500® Index - Total Return | -3.32 | % | ||
(a) Inception date is September 30, 2021. | |||||
Performance data quoted represents past performance and does not guarantee future results. The investment return and principal value of an investment will fluctuate so that an investor’s shares, when redeemed, may be worth more or less than their original cost. Current performance of the Fund may be lower or higher than the performance quoted. As of the latest prospectus, the net expense ratio of the Fund was 0.79%. For the most recent performance, please visit the Fund’s website at innovatoretfs.com. | |||||
INNOVATOR U.S. EQUITY ACCELERATED ETF - OCTOBER
Fund Performance | ||
April 30, 2022 (Unaudited) (Continued) | ||
The line graph and performance table does not reflect the deduction of taxes that a shareholder may pay on fund distributions or the redemption of Fund shares. Returns shown for the Fund and S&P 500® Index - Total Return include the reinvestment of all dividends, if any. Returns shown for the S&P 500® Index - Price Return do not include the reinvestment of dividends, if any. |
The S&P 500® Index is an unmanaged, capitalization-weighted index generally representative of the U.S. market for large capitalization stocks. |
The Fund’s portfolio holdings may differ significantly from the securities held in the relevant index and, unlike an exchange-traded fund, the performance of an unmanaged index does not reflect deductions for transaction costs, taxes, management fees or other expenses. |
You cannot invest directly in an index. |
Premium/Discount Information: |
Information regarding the differences between the price of the Fund’s shares on the secondary market and the Fund’s net asset value is available at Innovatoretfs.com/XDOC. |
INNOVATOR U.S. EQUITY ACCELERATED PLUS ETF - JANUARY
Fund Performance | |
April 30, 2022 (Unaudited) | |
The following chart compares the value of a hypothetical $10,000 investment in the Innovator U.S. Equity Accelerated Plus ETF - January from its inception (December 31, 2021) to April 30, 2022 as compared with the S&P 500® Index - Price Return and Total Return. |
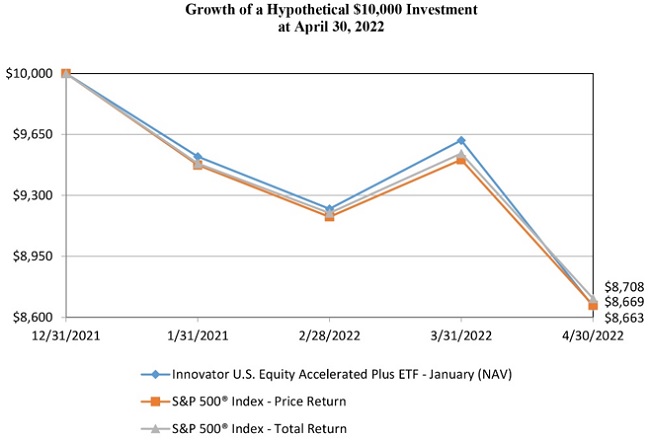
Total Returns as of April 30, 2022 | ||||
Since Inception (a) | ||||
Innovator U.S. Equity Accelerated Plus ETF - January | ||||
NAV Return | -13.37 | % | ||
Market Return | -13.55 | % | ||
S&P 500® Index - Price Return | -13.31 | % | ||
S&P 500® Index - Total Return | -12.92 | % | ||
(a) Inception date is December 31, 2021. | |||||
Performance data quoted represents past performance and does not guarantee future results. The investment return and principal value of an investment will fluctuate so that an investor’s shares, when redeemed, may be worth more or less than their original cost. Current performance of the Fund may be lower or higher than the performance quoted. As of the latest prospectus, the net expense ratio of the Fund was 0.79%. For the most recent performance, please visit the Fund’s website at innovatoretfs.com. | |||||
INNOVATOR U.S. EQUITY ACCELERATED PLUS ETF - JANUARY
Fund Performance | ||
April 30, 2022 (Unaudited) (Continued) | ||
The line graph and performance table does not reflect the deduction of taxes that a shareholder may pay on fund distributions or the redemption of Fund shares. Returns shown for the Fund and S&P 500® Index - Total Return include the reinvestment of all dividends, if any. Returns shown for the S&P 500® Index - Price Return do not include the reinvestment of dividends, if any. |
The S&P 500® Index is an unmanaged, capitalization-weighted index generally representative of the U.S. market for large capitalization stocks. |
The Fund’s portfolio holdings may differ significantly from the securities held in the relevant index and, unlike an exchange-traded fund, the performance of an unmanaged index does not reflect deductions for transaction costs, taxes, management fees or other expenses. |
You cannot invest directly in an index. |
Premium/Discount Information: |
Information regarding the differences between the price of the Fund’s shares on the secondary market and the Fund’s net asset value is available at Innovatoretfs.com/XTJA. |
INNOVATOR U.S. EQUITY ACCELERATED PLUS ETF - APRIL
Fund Performance | |
April 30, 2022 (Unaudited) | |
The following chart compares the value of a hypothetical $10,000 investment in the Innovator U.S. Equity Accelerated Plus ETF - April from its inception (March 31, 2021) to April 30, 2022 as compared with the S&P 500® Index - Price Return and Total Return. |
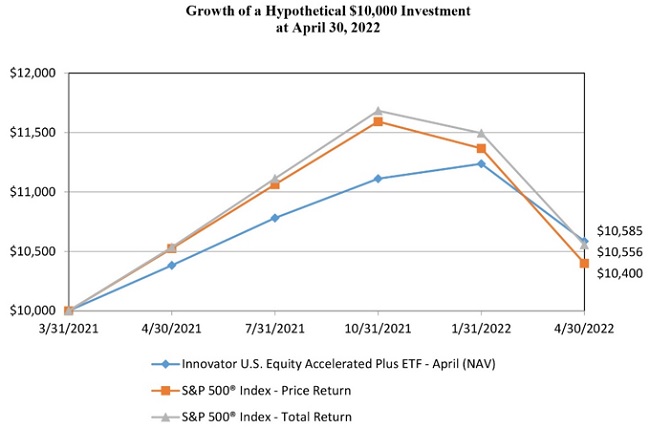
Average Annual Total Returns as of April 30, 2022 | ||||||||
One Year | Since Inception (a) | |||||||
Innovator U.S. Equity Accelerated Plus ETF - April | ||||||||
NAV Return | 1.96 | % | 5.40 | % | ||||
Market Return | 1.33 | % | 5.15 | % | ||||
S&P 500® Index - Price Return | -1.18 | % | 3.69 | % | ||||
S&P 500® Index - Total Return | 0.21 | % | 5.13 | % | ||||
(a) Inception date is March 31, 2021. |
Performance data quoted represents past performance and does not guarantee future results. The investment return and principal value of an investment will fluctuate so that an investor’s shares, when redeemed, may be worth more or less than their original cost. Current performance of the Fund may be lower or higher than the performance quoted. As of the latest prospectus, the net expense ratio of the Fund was 0.79%. For the most recent performance, please visit the Fund’s website at innovatoretfs.com. |
INNOVATOR U.S. EQUITY ACCELERATED PLUS ETF - APRIL
Fund Performance | ||
April 30, 2022 (Unaudited) (Continued) | ||
The line graph and performance table do not reflect the deduction of taxes that a shareholder may pay on fund distributions or the redemption of Fund shares. Returns shown for the Fund and S&P 500® Index - Total Return include the reinvestment of all dividends, if any. Returns shown for the S&P 500® Index - Price Return do not include the reinvestment of dividends, if any. |
The S&P 500® Index is an unmanaged, capitalization-weighted index generally representative of the U.S. market for large capitalization stocks. |
The Fund’s portfolio holdings may differ significantly from the securities held in the relevant index and, unlike an exchange-traded fund, the performance of an unmanaged index does not reflect deductions for transaction costs, taxes, management fees or other expenses. |
You cannot invest directly in an index. |
Premium/Discount Information: |
Information regarding the differences between the price of the Fund’s shares on the secondary market and the Fund’s net asset value is available at Innovatoretfs.com/XTAP. |
INNOVATOR U.S. EQUITY ACCELERATED PLUS ETF - JULY
Fund Performance | |
April 30, 2022 (Unaudited) | |
The following chart compares the value of a hypothetical $10,000 investment in the Innovator U.S. Equity Accelerated Plus ETF - July from its inception (June 30, 2021) to April 30, 2022 as compared with the S&P 500® Index - Price Return and Total Return. |
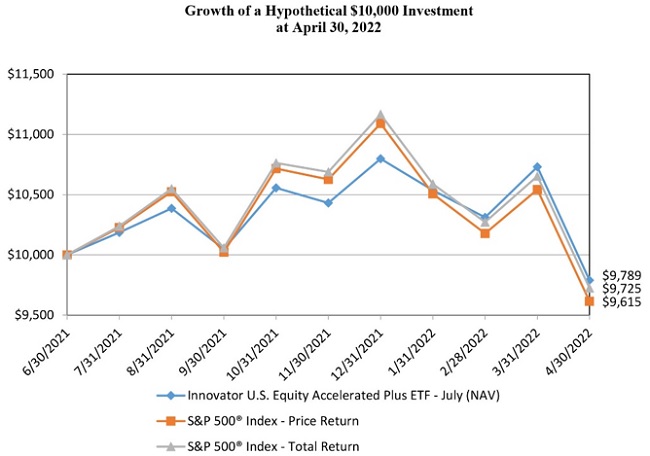
Total Returns as of April 30, 2022 | ||||
Since Inception (a) | ||||
Innovator U.S. Equity Accelerated Plus ETF - July | ||||
NAV Return | -2.11 | % | ||
Market Return | -2.10 | % | ||
S&P 500® Index - Price Return | -3.85 | % | ||
S&P 500® Index - Total Return | -2.75 | % | ||
(a) Inception date is June 30, 2021. | |||||
Performance data quoted represents past performance and does not guarantee future results. The investment return and principal value of an investment will fluctuate so that an investor’s shares, when redeemed, may be worth more or less than their original cost. Current performance of the Fund may be lower or higher than the performance quoted. As of the latest prospectus, the net expense ratio of the Fund was 0.79%. For the most recent performance, please visit the Fund’s website at innovatoretfs.com. | |||||
INNOVATOR U.S. EQUITY ACCELERATED PLUS ETF - JULY
Fund Performance | ||
April 30, 2022 (Unaudited) (Continued) | ||
The line graph and performance table do not reflect the deduction of taxes that a shareholder may pay on fund distributions or the redemption of Fund shares. Returns shown for the Fund and S&P 500® Index - Total Return include the reinvestment of all dividends, if any. Returns shown for the S&P 500® Index - Price Return do not include the reinvestment of dividends, if any. |
The S&P 500® Index is an unmanaged, capitalization-weighted index generally representative of the U.S. market for large capitalization stocks. |
The Fund’s portfolio holdings may differ significantly from the securities held in the relevant index and, unlike an exchange-traded fund, the performance of an unmanaged index does not reflect deductions for transaction costs, taxes, management fees or other expenses. |
You cannot invest directly in an index. |
Premium/Discount Information: |
Information regarding the differences between the price of the Fund’s shares on the secondary market and the Fund’s net asset value is available at Innovatoretfs.com/XTJL. |
INNOVATOR U.S. EQUITY ACCELERATED PLUS ETF - OCTOBER
Fund Performance | |||
April 30, 2022 (Unaudited) | |||
The following chart compares the value of a hypothetical $10,000 investment in the Innovator U.S. Equity Accelerated Plus ETF - October from its inception (September 30, 2021) to April 30, 2022 as compared with the S&P 500® Index - Price Return and Total Return.
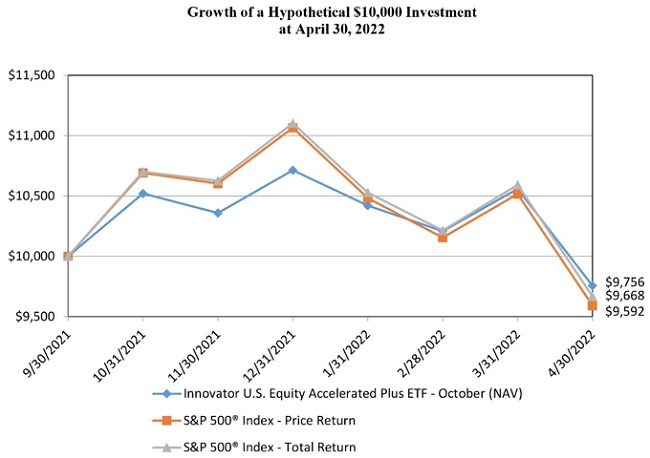
Total Returns as of April 30, 2022 | ||||
Since Inception (a) | ||||
Innovator U.S. Equity Accelerated Plus ETF - October | ||||
NAV Return | -2.44 | % | ||
Market Return | -2.55 | % | ||
S&P 500® Index - Price Return | -4.08 | % | ||
S&P 500® Index - Total Return | -3.32 | % | ||
(a) Inception date is September 30, 2021. |
Performance data quoted represents past performance and does not guarantee future results. The investment return and principal value of an investment will fluctuate so that an investor’s shares, when redeemed, may be worth more or less than their original cost. Current performance of the Fund may be lower or higher than the performance quoted. As of the latest prospectus, the net expense ratio of the Fund was 0.79%. For the most recent performance, please visit the Fund’s website at innovatoretfs.com. |
INNOVATOR U.S. EQUITY ACCELERATED PLUS ETF - OCTOBER
Fund Performance | ||
April 30, 2022 (Unaudited) (Continued) | ||
The line graph and performance table does not reflect the deduction of taxes that a shareholder may pay on fund distributions or the redemption of Fund shares. Returns shown for the Fund and S&P 500® Index - Total Return include the reinvestment of all dividends, if any. Returns shown for the S&P 500® Index - Price Return do not include the reinvestment of dividends, if any. |
The S&P 500® Index is an unmanaged, capitalization-weighted index generally representative of the U.S. market for large capitalization stocks. |
The Fund’s portfolio holdings may differ significantly from the securities held in the relevant index and, unlike an exchange-traded fund, the performance of an unmanaged index does not reflect deductions for transaction costs, taxes, management fees or other expenses. |
You cannot invest directly in an index. |
Premium/Discount Information: |
Information regarding the differences between the price of the Fund’s shares on the secondary market and the Fund’s net asset value is available at Innovatoretfs.com/XTOC. |
INNOVATOR U.S. EQUITY ACCELERATED 9 BUFFER ETF - JANUARY
Fund Performance | |||
April 30, 2022 (Unaudited) | |||
The following chart compares the value of a hypothetical $10,000 investment in the Innovator U.S. Equity Accelerated 9 Buffer ETF - January from its inception (December 31, 2021) to April 30, 2022 as compared with the S&P 500® Index - Price Return and Total Return. |
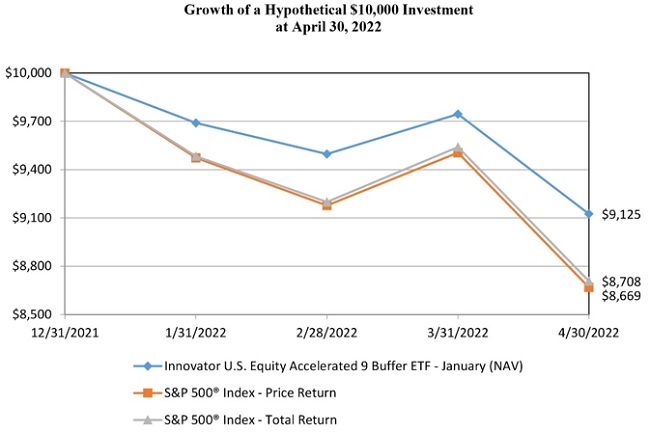
Total Returns as of April 30, 2022 | ||||
Since Inception (a) | ||||
Innovator U.S. Equity Accelerated 9 Buffer ETF - January | ||||
NAV Return | -8.75 | % | ||
Market Return | -8.78 | % | ||
S&P 500® Index - Price Return | -13.31 | % | ||
S&P 500® Index - Total Return | -12.92 | % | ||
(a) Inception date is December 31, 2021. |
Performance data quoted represents past performance and does not guarantee future results. The investment return and principal value of an investment will fluctuate so that an investor’s shares, when redeemed, may be worth more or less than their original cost. Current performance of the Fund may be lower or higher than the performance quoted. As of the latest prospectus, the net expense ratio of the Fund was 0.79%. For the most recent performance, please visit the Fund’s website at innovatoretfs.com. |
INNOVATOR U.S. EQUITY ACCELERATED 9 BUFFER ETF - JANUARY
Fund Performance | |
April 30, 2022 (Unaudited) (Continued) | |
The line graph and performance table does not reflect the deduction of taxes that a shareholder may pay on fund distributions or the redemption of Fund shares. Returns shown for the Fund and S&P 500® Index - Total Return include the reinvestment of all dividends, if any. Returns shown for the S&P 500® Index - Price Return do not include the reinvestment of dividends, if any. |
The S&P 500® Index is an unmanaged, capitalization-weighted index generally representative of the U.S. market for large capitalization stocks. |
The Fund’s portfolio holdings may differ significantly from the securities held in the relevant index and, unlike an exchange-traded fund, the performance of an unmanaged index does not reflect deductions for transaction costs, taxes, management fees or other expenses. |
You cannot invest directly in an index. |
Premium/Discount Information: |
Information regarding the differences between the price of the Fund’s shares on the secondary market and the Fund’s net asset value is available at Innovatoretfs.com/XBJA. |
INNOVATOR U.S. EQUITY ACCELERATED 9 BUFFER ETF - APRIL
Fund Performance |
April 30, 2022 (Unaudited) |
The following chart compares the value of a hypothetical $10,000 investment in the Innovator U.S. Equity Accelerated 9 Buffer ETF - April from its inception (March 31, 2021) to April 30, 2022 as compared with the S&P 500® Index - Price Return and Total Return. |
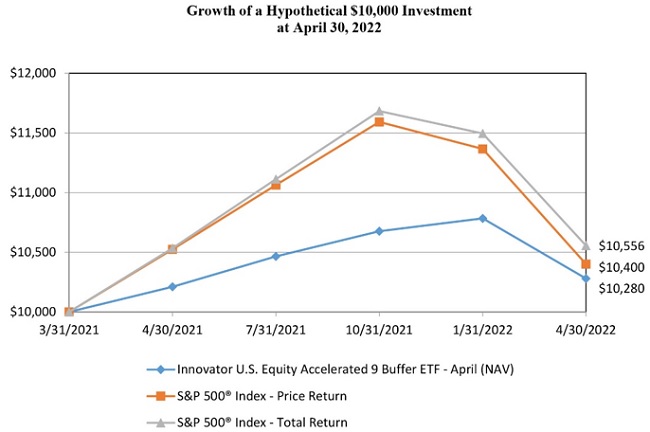
Average Annual Total Returns as of April 30, 2022 | ||||||||
One Year | Since Inception (a) | |||||||
Innovator U.S. Equity Accelerated 9 Buffer ETF - April | ||||||||
NAV Return | 0.68 | % | 2.58 | % | ||||
Market Return | 0.50 | % | 2.66 | % | ||||
S&P 500® Index - Price Return | -1.18 | % | 3.69 | % | ||||
S&P 500® Index - Total Return | 0.21 | % | 5.13 | % | ||||
(a) Inception date is March 31, 2021. |
Performance data quoted represents past performance and does not guarantee future results. The investment return and principal value of an investment will fluctuate so that an investor’s shares, when redeemed, may be worth more or less than their original cost. Current performance of the Fund may be lower or higher than the performance quoted. As of the latest prospectus, the net expense ratio of the Fund was 0.79%. For the most recent performance, please visit the Fund’s website at innovatoretfs.com. |
INNOVATOR U.S. EQUITY ACCELERATED 9 BUFFER ETF - APRIL
Fund Performance | |
April 30, 2022 (Unaudited) (Continued) | |
The line graph and performance table do not reflect the deduction of taxes that a shareholder may pay on fund distributions or the redemption of Fund shares. Returns shown for the Fund and S&P 500® Index - Total Return include the reinvestment of all dividends, if any. Returns shown for the S&P 500® Index - Price Return do not include the reinvestment of dividends, if any. |
The S&P 500® Index is an unmanaged, capitalization-weighted index generally representative of the U.S. market for large capitalization stocks. |
The Fund’s portfolio holdings may differ significantly from the securities held in the relevant index and, unlike an exchange-traded fund, the performance of an unmanaged index does not reflect deductions for transaction costs, taxes, management fees or other expenses. |
You cannot invest directly in an index. |
Premium/Discount Information: |
Information regarding the differences between the price of the Fund’s shares on the secondary market and the Fund’s net asset value is available at Innovatoretfs.com/XBAP. |
INNOVATOR U.S. EQUITY ACCELERATED 9 BUFFER ETF - JULY
Fund Performance | |||
April 30, 2022 (Unaudited) | |||
The following chart compares the value of a hypothetical $10,000 investment in the Innovator U.S. Equity Accelerated 9 Buffer ETF - July from its inception (June 30, 2021) to April 30, 2022 as compared with the S&P 500® Index - Price Return and Total Return. |
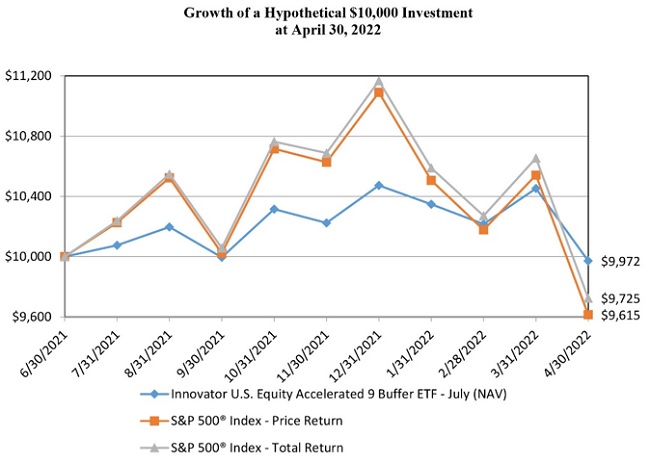
Total Returns as of April 30, 2022 | ||||
Since Inception (a) | ||||
Innovator U.S. Equity Accelerated 9 Buffer ETF - July | ||||
NAV Return | -0.28 | % | ||
Market Return | -0.39 | % | ||
S&P 500® Index - Price Return | -3.85 | % | ||
S&P 500® Index - Total Return | -2.75 | % | ||
(a) Inception date is June 30, 2021. | |||||
Performance data quoted represents past performance and does not guarantee future results. The investment return and principal value of an investment will fluctuate so that an investor’s shares, when redeemed, may be worth more or less than their original cost. Current performance of the Fund may be lower or higher than the performance quoted. As of the latest prospectus, the net expense ratio of the Fund was 0.79%. For the most recent performance, please visit the Fund’s website at innovatoretfs.com. | |||||
INNOVATOR U.S. EQUITY ACCELERATED 9 BUFFER ETF - JULY
Fund Performance | ||
April 30, 2022 (Unaudited) (Continued) | ||
The line graph and performance table do not reflect the deduction of taxes that a shareholder may pay on fund distributions or the redemption of Fund shares. Returns shown for the Fund and S&P 500® Index - Total Return include the reinvestment of all dividends, if any. Returns shown for the S&P 500® Index - Price Return do not include the reinvestment of dividends, if any. |
The S&P 500® Index is an unmanaged, capitalization-weighted index generally representative of the U.S. market for large capitalization stocks. |
The Fund’s portfolio holdings may differ significantly from the securities held in the relevant index and, unlike an exchange-traded fund, the performance of an unmanaged index does not reflect deductions for transaction costs, taxes, management fees or other expenses. |
You cannot invest directly in an index. |
Premium/Discount Information: |
Information regarding the differences between the price of the Fund’s shares on the secondary market and the Fund’s net asset value is available at Innovatoretfs.com/XBJL. |
INNOVATOR U.S. EQUITY ACCELERATED 9 BUFFER ETF - OCTOBER
Fund Performance | ||
April 30, 2022 (Unaudited) | ||
The following chart compares the value of a hypothetical $10,000 investment in the Innovator U.S. Equity Accelerated 9 Buffer ETF - October from its inception (September 30, 2021) to April 30, 2022 as compared with the S&P 500® Index - Price Return and Total Return.
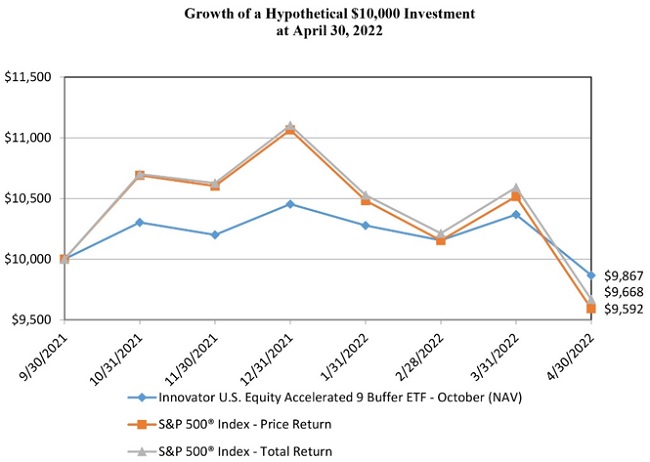
Total Returns as of April 30, 2022 | ||||
Since Inception (a) | ||||
Innovator U.S. Equity Accelerated 9 Buffer ETF - October | ||||
NAV Return | -1.33 | % | ||
Market Return | -1.40 | % | ||
S&P 500® Index - Price Return | -4.08 | % | ||
S&P 500® Index - Total Return | -3.32 | % | ||
(a) Inception date is September 30, 2021. | |||||
Performance data quoted represents past performance and does not guarantee future results. The investment return and principal value of an investment will fluctuate so that an investor’s shares, when redeemed, may be worth more or less than their original cost. Current performance of the Fund may be lower or higher than the performance quoted. As of the latest prospectus, the net expense ratio of the Fund was 0.79%. For the most recent performance, please visit the Fund’s website at innovatoretfs.com. | |||||
INNOVATOR U.S. EQUITY ACCELERATED 9 BUFFER ETF - OCTOBER
Fund Performance | ||
April 30, 2022 (Unaudited) (Continued) | ||
The line graph and performance table does not reflect the deduction of taxes that a shareholder may pay on fund distributions or the redemption of Fund shares. Returns shown for the Fund and S&P 500® Index - Total Return include the reinvestment of all dividends, if any. Returns shown for the S&P 500® Index - Price Return do not include the reinvestment of dividends, if any. |
The S&P 500® Index is an unmanaged, capitalization-weighted index generally representative of the U.S. market for large capitalization stocks. |
The Fund’s portfolio holdings may differ significantly from the securities held in the relevant index and, unlike an exchange-traded fund, the performance of an unmanaged index does not reflect deductions for transaction costs, taxes, management fees or other expenses. |
You cannot invest directly in an index. |
Premium/Discount Information: |
Information regarding the differences between the price of the Fund’s shares on the secondary market and the Fund’s net asset value is available at Innovatoretfs.com/XBOC. |
INNOVATOR GROWTH ACCELERATED PLUS ETF - JANUARY
Fund Performance | |||
April 30, 2022 (Unaudited) | |||
The following chart compares the value of a hypothetical $10,000 investment in the Innovator Growth Accelerated Plus ETF - January from its inception (December 31, 2021) to April 30, 2022 as compared with the NASDAQ-100 Index - Price Return and Total Return. |
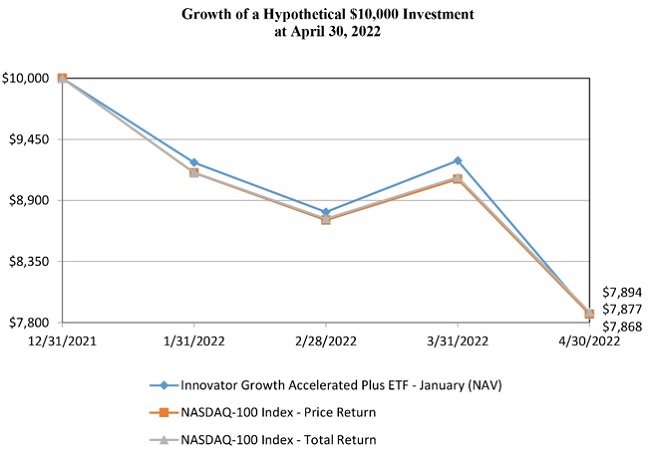
Total Returns as of April 30, 2022 | ||||
Since Inception (a) | ||||
Innovator Growth Accelerated Plus ETF - January | ||||
NAV Return | -21.32 | % | ||
Market Return | -21.48 | % | ||
NASDAQ-100 Index - Price Return | -21.23 | % | ||
NASDAQ-100 Index - Total Return | -21.06 | % | ||
(a) Inception date is December 31, 2021. |
Performance data quoted represents past performance and does not guarantee future results. The investment return and principal value of an investment will fluctuate so that an investor’s shares, when redeemed, may be worth more or less than their original cost. Current performance of the Fund may be lower or higher than the performance quoted. As of the latest prospectus, the net expense ratio of the Fund was 0.79%. For the most recent performance, please visit the Fund’s website at innovatoretfs.com. |
INNOVATOR GROWTH ACCELERATED PLUS ETF - JANUARY
Fund Performance | ||
April 30, 2022 (Unaudited) (Continued) | ||
The line graph and performance table does not reflect the deduction of taxes that a shareholder may pay on fund distributions or the redemption of Fund shares. Returns shown for the Fund and NASDAQ-100 Index - Total Return include the reinvestment of all dividends, if any. Returns shown for the NASDAQ-100 Index - Price Return do not include the reinvestment of dividends, if any. |
The NASDAQ-100 Index includes 100 of the largest domestic and international non-financial companies listed on the Nasdaq Stock Market based on market capitalization. The NASDAQ-100 Price Index reflects companies across major industry groups including computer hardware and software, telecommunications, retail/wholesale trade and biotechnologies. It does not contain securities of financial companies including investment companies. |
The Fund’s portfolio holdings may differ significantly from the securities held in the relevant index and, unlike an exchange-traded fund, the performance of an unmanaged index does not reflect deductions for transaction costs, taxes, management fees or other expenses. |
You cannot invest directly in an index. |
Premium/Discount Information: |
Information regarding the differences between the price of the Fund’s shares on the secondary market and the Fund’s net asset value is available at Innovatoretfs.com/QTJA. |
INNOVATOR GROWTH ACCELERATED PLUS ETF - APRIL
Fund Performance | |||
April 30, 2022 (Unaudited) | |||
The following chart compares the value of a hypothetical $10,000 investment in the Innovator Growth Accelerated Plus ETF - April from its inception (March 31, 2021) to April 30, 2022 as compared with the NASDAQ-100 Index - Price Return and Total Return. |
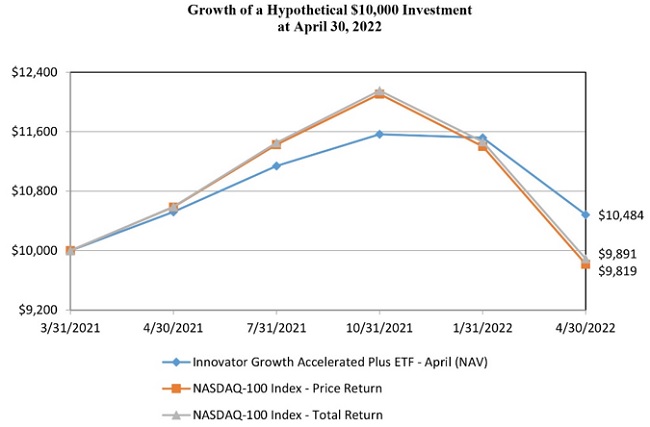
Average Annual Total Returns as of April 30, 2022 | ||||||||
One Year | Since Inception (a) | |||||||
Innovator Growth Accelerated Plus ETF - April | ||||||||
NAV Return | -0.36 | % | 4.46 | % | ||||
Market Return | -0.58 | % | 4.20 | % | ||||
NASDAQ-100 Index - Price Return | -7.26 | % | -1.67 | % | ||||
NASDAQ-100 Index - Total Return | -6.61 | % | -1.01 | % | ||||
(a) Inception date is March 31, 2021. | |||||
Performance data quoted represents past performance and does not guarantee future results. The investment return and principal value of an investment will fluctuate so that an investor’s shares, when redeemed, may be worth more or less than their original cost. Current performance of the Fund may be lower or higher than the performance quoted. As of the latest prospectus, the net expense ratio of the Fund was 0.79%. For the most recent performance, please visit the Fund’s website at innovatoretfs.com. | |||||
INNOVATOR GROWTH ACCELERATED PLUS ETF - APRIL
Fund Performance | ||
April 30, 2022 (Unaudited) (Continued) | ||
The line graph and performance table do not reflect the deduction of taxes that a shareholder may pay on fund distributions or the redemption of Fund shares. Returns shown for the Fund and NASDAQ-100 Index - Total Return include the reinvestment of all dividends, if any. Returns shown for the NASDAQ-100 Index - Price Return do not include the reinvestment of dividends, if any. |
The NASDAQ-100 Index includes 100 of the largest domestic and international non-financial companies listed on the Nasdaq Stock Market based on market capitalization. The NASDAQ-100 Price Index reflects companies across major industry groups including computer hardware and software, telecommunications, retail/wholesale trade and biotechnologies. It does not contain securities of financial companies including investment companies. |
The Fund’s portfolio holdings may differ significantly from the securities held in the relevant index and, unlike an exchange-traded fund, the performance of an unmanaged index does not reflect deductions for transaction costs, taxes, management fees or other expenses. |
You cannot invest directly in an index. |
Premium/Discount Information: |
Information regarding the differences between the price of the Fund’s shares on the secondary market and the Fund’s net asset value is available at Innovatoretfs.com/QTAP. |
INNOVATOR GROWTH ACCELERATED PLUS ETF - JULY
Fund Performance | ||
April 30, 2022 (Unaudited) | ||
The following chart compares the value of a hypothetical $10,000 investment in the Innovator Growth Accelerated Plus ETF - July from its inception (June 30, 2021) to April 30, 2022 as compared with the NASDAQ-100 Index - Price Return and Total Return. |
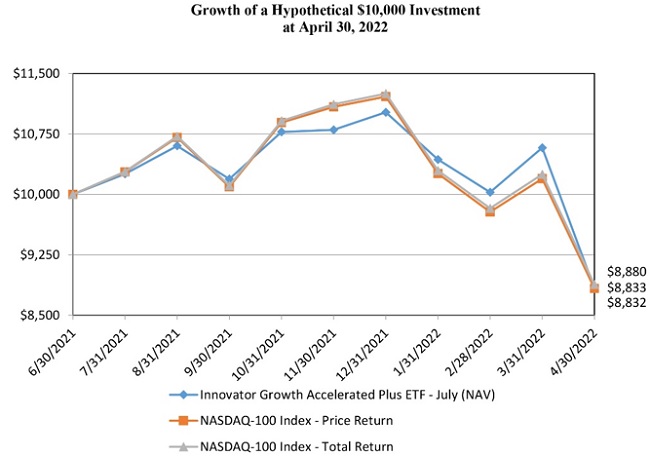
Total Returns as of April 30, 2022 | ||||
Since Inception (a) | ||||
Innovator Growth Accelerated Plus ETF - July | ||||
NAV Return | -11.67 | % | ||
Market Return | -11.67 | % | ||
NASDAQ-100 Index - Price Return | -11.68 | % | ||
NASDAQ-100 Index - Total Return | -11.20 | % | ||
(a) Inception date is June 30, 2021. |
Performance data quoted represents past performance and does not guarantee future results. The investment return and principal value of an investment will fluctuate so that an investor’s shares, when redeemed, may be worth more or less than their original cost. Current performance of the Fund may be lower or higher than the performance quoted. As of the latest prospectus, the net expense ratio of the Fund was 0.79%. For the most recent performance, please visit the Fund’s website at innovatoretfs.com. |
INNOVATOR GROWTH ACCELERATED PLUS ETF - JULY
Fund Performance | ||
April 30, 2022 (Unaudited) (Continued) | ||
The line graph and performance table do not reflect the deduction of taxes that a shareholder may pay on fund distributions or the redemption of Fund shares. Returns shown for the Fund and NASDAQ-100 Index - Total Return include the reinvestment of all dividends, if any. Returns shown for the NASDAQ-100 Index - Price Return do not include the reinvestment of dividends, if any. |
The NASDAQ-100 Index includes 100 of the largest domestic and international non-financial companies listed on the Nasdaq Stock Market based on market capitalization. The NASDAQ-100 Price Index reflects companies across major industry groups including computer hardware and software, telecommunications, retail/wholesale trade and biotechnologies. It does not contain securities of financial companies including investment companies. |
The Fund’s portfolio holdings may differ significantly from the securities held in the relevant index and, unlike an exchange-traded fund, the performance of an unmanaged index does not reflect deductions for transaction costs, taxes, management fees or other expenses. |
You cannot invest directly in an index. |
Premium/Discount Information: |
Information regarding the differences between the price of the Fund’s shares on the secondary market and the Fund’s net asset value is available at Innovatoretfs.com/QTJL. |
INNOVATOR GROWTH ACCELERATED PLUS ETF - OCTOBER
Fund Performance | ||
April 30, 2022 (Unaudited) | ||
The following chart compares the value of a hypothetical $10,000 investment in the Innovator Growth Accelerated Plus ETF - October from its inception (September 30, 2021) to April 30, 2022 as compared with the NASDAQ-100 Index - Price Return and Total Return.
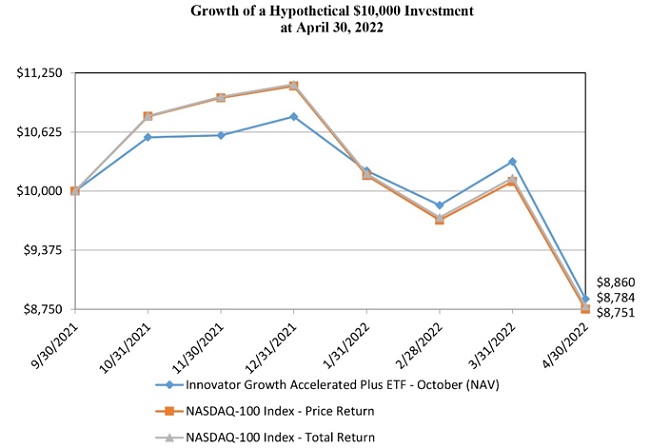
Total Returns as of April 30, 2022 | ||||
Since Inception (a) | ||||
Innovator Growth Accelerated Plus ETF - October | ||||
NAV Return | -11.40 | % | ||
Market Return | -11.65 | % | ||
NASDAQ-100 Index - Price Return | -12.49 | % | ||
NASDAQ-100 Index - Total Return | -12.16 | % | ||
(a) Inception date is September 30, 2021. |
Performance data quoted represents past performance and does not guarantee future results. The investment return and principal value of an investment will fluctuate so that an investor’s shares, when redeemed, may be worth more or less than their original cost. Current performance of the Fund may be lower or higher than the performance quoted. As of the latest prospectus, the net expense ratio of the Fund was 0.79%. For the most recent performance, please visit the Fund’s website at innovatoretfs.com. |
INNOVATOR GROWTH ACCELERATED PLUS ETF - OCTOBER
Fund Performance | ||
April 30, 2022 (Unaudited) (Continued) | ||
The line graph and performance table does not reflect the deduction of taxes that a shareholder may pay on fund distributions or the redemption of Fund shares. Returns shown for the Fund and NASDAQ-100 Index - Total Return include the reinvestment of all dividends, if any. Returns shown for the NASDAQ-100 Index - Price Return do not include the reinvestment of dividends, if any. |
The NASDAQ-100 Index includes 100 of the largest domestic and international non-financial companies listed on the Nasdaq Stock Market based on market capitalization. The NASDAQ-100 Price Index reflects companies across major industry groups including computer hardware and software, telecommunications, retail/wholesale trade and biotechnologies. It does not contain securities of financial companies including investment companies. |
The Fund’s portfolio holdings may differ significantly from the securities held in the relevant index and, unlike an exchange-traded fund, the performance of an unmanaged index does not reflect deductions for transaction costs, taxes, management fees or other expenses. |
You cannot invest directly in an index. |
Premium/Discount Information: |
Information regarding the differences between the price of the Fund’s shares on the secondary market and the Fund’s net asset value is available at Innovatoretfs.com/QTOC. |
INNOVATOR 20+ YEAR TREASURY BOND 9 BUFFER ETF – JULY
Fund Performance |
April 30, 2022 (Unaudited) |
The following chart compares the value of a hypothetical $10,000 investment in the Innovator 20+ Year Treasury Bond 9 Buffer ETF - July from its inception (August 17, 2020) to April 30, 2022 as compared with the ICE U.S. Treasury 20+ Year Index - Total Return.
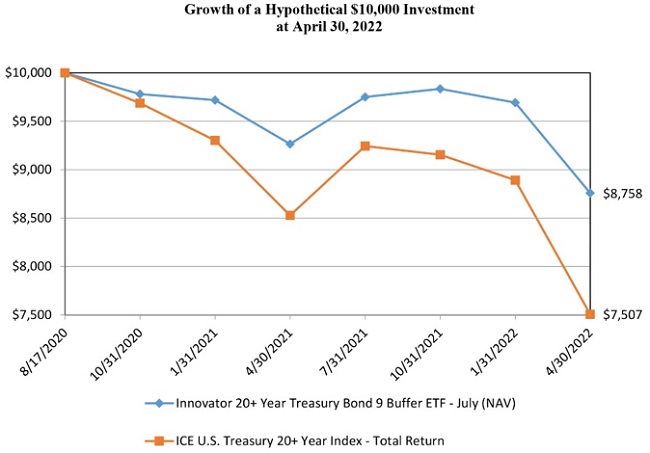
Average Annual Total Returns as of April 30, 2022 | ||||||||
One Year | Since Inception (a) | |||||||
Innovator 20+ Year Treasury Bond 9 Buffer ETF - July | ||||||||
NAV Return | -5.49 | % | -7.50 | % | ||||
Market Return | -5.51 | % | -7.65 | % | ||||
ICE U.S. Treasury 20+ Year Index - Total Return | -11.99 | % | -15.51 | % | ||||
(a) Inception date is August 17, 2020.
Performance data quoted represents past performance and does not guarantee future results. The investment return and principal value of an investment will fluctuate so that an investor’s shares, when redeemed, may be worth more or less than their original cost. Current performance of the Fund may be lower or higher than the performance quoted. As of the latest prospectus, the net expense ratio of the Fund was 0.79%. For the most recent performance, please visit the Fund’s website at innovatoretfs.com.
INNOVATOR 20+ YEAR TREASURY BOND 9 BUFFER ETF – JULY
Fund Performance |
April 30, 2022 (Unaudited) (Continued) |
The line graph and performance table do not reflect the deduction of taxes that a shareholder may pay on fund distributions or the redemption of Fund shares. Returns shown for the Fund and ICE U.S. Treasury 20+ Year Index - Total Return include the reinvestment of all dividends, if any.
The ICE U.S. Treasury 20+ Year Bond Index is market value weighted and is designed to include U.S. dollar denominated, fixed rate U.S. Treasury market securities with minimum term to maturity greater than or equal to twenty years.
The Fund’s portfolio holdings may differ significantly from the securities held in the relevant index and, unlike an exchange-traded fund, the performance of an unmanaged index does not reflect deductions for transaction costs, taxes, management fees or other expenses.
You cannot invest directly in an index.
Premium/Discount Information:
Information regarding the differences between the price of the Fund’s shares on the secondary market and the Fund’s net asset value is available at Innovatoretfs.com/TBJL.
INNOVATOR 20+ YEAR TREASURY BOND 5 FLOOR ETF – QUARTERLY
Fund Performance | |
April 30, 2022 (Unaudited) | |
The following chart compares the value of a hypothetical $10,000 investment in the Innovator 20+ Year Treasury Bond 5 Floor ETF - Quarterly from its inception (August 17, 2020) to April 30, 2022 as compared with the ICE U.S. Treasury 20+ Year Index - Total Return.
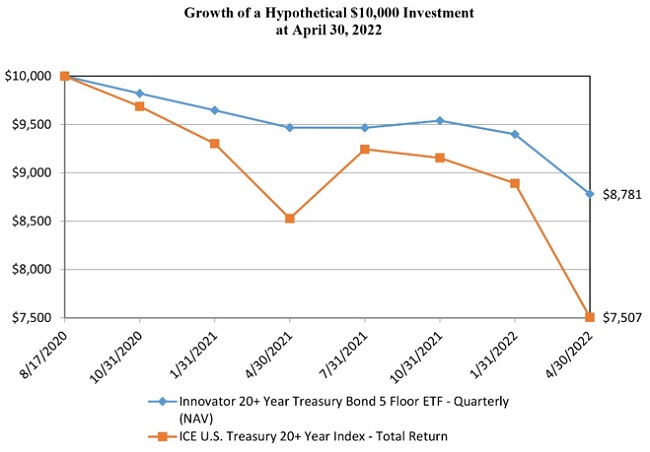
Average Annual Total Returns as of April 30, 2022 | ||||||||
One Year | Since Inception (a) | |||||||
Innovator 20+ Year Treasury Bond 5 Floor ETF - Quarterly | ||||||||
NAV Return | -7.25 | % | -7.36 | % | ||||
Market Return | -6.86 | % | -7.30 | % | ||||
ICE U.S. Treasury 20+ Year Index - Total Return | -11.99 | % | -15.51 | % | ||||
(a) Inception date is August 17, 2020.
Performance data quoted represents past performance and does not guarantee future results. The investment return and principal value of an investment will fluctuate so that an investor’s shares, when redeemed, may be worth more or less than their original cost. Current performance of the Fund may be lower or higher than the performance quoted. As of the latest prospectus, the net expense ratio of the Fund was 0.79%. For the most recent performance, please visit the Fund’s website at innovatoretfs.com.
INNOVATOR 20+ YEAR TREASURY BOND 5 FLOOR ETF – QUARTERLY
Fund Performance | |
April 30, 2022 (Unaudited) (Continued) | |
The line graph and performance table do not reflect the deduction of taxes that a shareholder may pay on fund distributions or the redemption of Fund shares. Returns shown for the Fund and ICE U.S. Treasury 20+ Year Index - Total Return include the reinvestment of all dividends, if any.
The ICE U.S. Treasury 20+ Year Bond Index is market value weighted and is designed to include U.S. dollar denominated, fixed rate U.S. Treasury market securities with minimum term to maturity greater than or equal to twenty years.
The Fund’s portfolio holdings may differ significantly from the securities held in the relevant index and, unlike an exchange-traded fund, the performance of an unmanaged index does not reflect deductions for transaction costs, taxes, management fees or other expenses.
You cannot invest directly in an index.
Premium/Discount Information:
Information regarding the differences between the price of the Fund’s shares on the secondary market and the Fund’s net asset value is available at Innovatoretfs.com/TFJL.
INNOVATOR DEFINED WEALTH SHIELD ETF
Fund Performance | ||
April 30, 2022 (Unaudited) | ||
The following chart compares the value of a hypothetical $10,000 investment in the Innovator Defined Wealth Shield ETF from its inception (June 30, 2021) to April 30, 2022 as compared with the S&P 500® Index - Price Return and Total Return. |
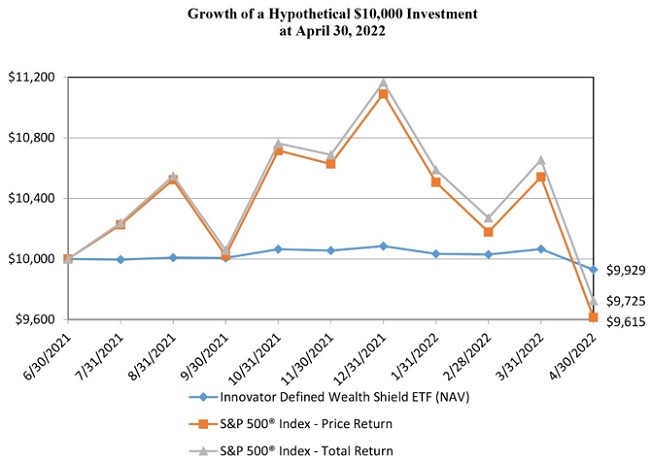
Total Returns as of April 30, 2022 | ||||
Since Inception (a) | ||||
Innovator Defined Wealth Shield ETF | ||||
NAV Return | -0.71 | % | ||
Market Return | -0.58 | % | ||
S&P 500® Index - Price Return | -3.85 | % | ||
S&P 500® Index - Total Return | -2.75 | % | ||
(a) Inception date is June 30, 2021. |
Performance data quoted represents past performance and does not guarantee future results. The investment return and principal value of an investment will fluctuate so that an investor’s shares, when redeemed, may be worth more or less than their original cost. Current performance of the Fund may be lower or higher than the performance quoted. As of the latest prospectus, the net expense ratio of the Fund was 0.69%. For the most recent performance, please visit the Fund’s website at innovatoretfs.com. |
INNOVATOR DEFINED WEALTH SHIELD ETF
Fund Performance | ||
April 30, 2022 (Unaudited) (Continued) | ||
The line graph and performance table do not reflect the deduction of taxes that a shareholder may pay on fund distributions or the redemption of Fund shares. Returns shown for the Fund and S&P 500® Index - Total Return include the reinvestment of all dividends, if any. Returns shown for the S&P 500® Index - Price Return do not include the reinvestment of dividends, if any. |
The S&P 500® Index is an unmanaged, capitalization-weighted index generally representative of the U.S. market for large capitalization stocks. |
The Fund’s portfolio holdings may differ significantly from the securities held in the relevant index and, unlike an exchange-traded fund, the performance of an unmanaged index does not reflect deductions for transaction costs, taxes, management fees or other expenses. |
You cannot invest directly in an index. |
Premium/Discount Information: |
Information regarding the differences between the price of the Fund’s shares on the secondary market and the Fund’s net asset value is available at Innovatoretfs.com/BALT. |
INNOVATOR U.S. EQUITY ACCELERATED ETF – QUARTERLY
Fund Performance | ||
April 30, 2022 (Unaudited) | ||
The following chart compares the value of a hypothetical $10,000 investment in the Innovator U.S. Equity Accelerated ETF - Quarterly from its inception (March 31, 2021) to April 30, 2022 as compared with the S&P 500® Index - Price Return and Total Return. |
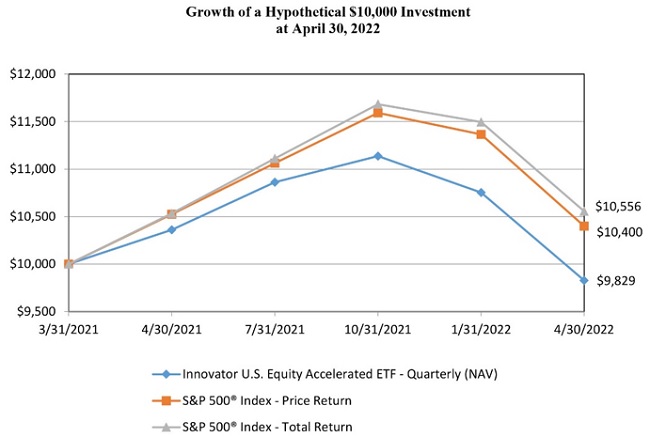
Average Annual Total Returns as of April 30, 2022 | ||||||||
One Year | Since Inception (a) | |||||||
Innovator U.S. Equity Accelerated ETF - Quarterly | ||||||||
NAV Return | -5.14 | % | -1.58 | % | ||||
Market Return | -5.35 | % | -1.77 | % | ||||
S&P 500® Index - Price Return | -1.18 | % | 3.69 | % | ||||
S&P 500® Index - Total Return | 0.21 | % | 5.13 | % | ||||
(a) Inception date is March 31, 2021. | |||||
Performance data quoted represents past performance and does not guarantee future results. The investment return and principal value of an investment will fluctuate so that an investor’s shares, when redeemed, may be worth more or less than their original cost. Current performance of the Fund may be lower or higher than the performance quoted. As of the latest prospectus, the net expense ratio of the Fund was 0.79%. For the most recent performance, please visit the Fund’s website at innovatoretfs.com. | |||||
INNOVATOR U.S. EQUITY ACCELERATED ETF – QUARTERLY
Fund Performance | ||
April 30, 2022 (Unaudited) (Continued) | ||
The line graph and performance table do not reflect the deduction of taxes that a shareholder may pay on fund distributions or the redemption of Fund shares. Returns shown for the Fund and S&P 500® Index - Total Return include the reinvestment of all dividends, if any. Returns shown for the S&P 500® Index - Price Return do not include the reinvestment of dividends, if any. |
The S&P 500® Index is an unmanaged, capitalization-weighted index generally representative of the U.S. market for large capitalization stocks. |
The Fund’s portfolio holdings may differ significantly from the securities held in the relevant index and, unlike an exchange-traded fund, the performance of an unmanaged index does not reflect deductions for transaction costs, taxes, management fees or other expenses. |
You cannot invest directly in an index. |
Premium/Discount Information: |
Information regarding the differences between the price of the Fund’s shares on the secondary market and the Fund’s net asset value is available at Innovatoretfs.com/XDSQ. |
INNOVATOR GROWTH ACCELERATED ETF – QUARTERLY
Fund Performance | |
April 30, 2022 (Unaudited) | |
The following chart compares the value of a hypothetical $10,000 investment in the Innovator Growth Accelerated ETF - Quarterly from its inception (March 31, 2021) to April 30, 2022 as compared with the NASDAQ-100 Index - Price Return and Total Return. |
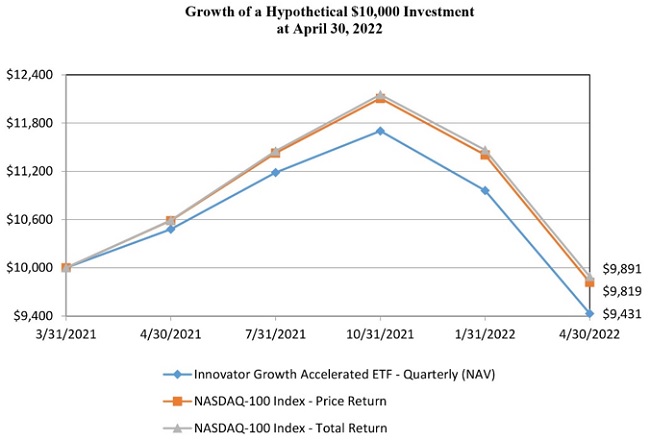
Average Annual Total Returns as of April 30, 2022 | ||||||||
One Year | Since Inception (a) | |||||||
Innovator Growth Accelerated ETF - Quarterly | ||||||||
NAV Return | -10.02 | % | -5.27 | % | ||||
Market Return | -10.21 | % | -5.40 | % | ||||
NASDAQ-100 Index - Price Return | -7.26 | % | -1.67 | % | ||||
NASDAQ-100 Index - Total Return | -6.61 | % | -1.01 | % | ||||
(a) Inception date is March 31, 2021. | |||||
Performance data quoted represents past performance and does not guarantee future results. The investment return and principal value of an investment will fluctuate so that an investor’s shares, when redeemed, may be worth more or less than their original cost. Current performance of the Fund may be lower or higher than the performance quoted. As of the latest prospectus, the net expense ratio of the Fund was 0.79%. For the most recent performance, please visit the Fund’s website at innovatoretfs.com. | |||||
INNOVATOR GROWTH ACCELERATED ETF – QUARTERLY
Fund Performance | ||
April 30, 2022 (Unaudited) (Continued) | ||
The line graph and performance table do not reflect the deduction of taxes that a shareholder may pay on fund distributions or the redemption of Fund shares. Returns shown for the Fund and NASDAQ-100 Index - Total Return include the reinvestment of all dividends, if any. Returns shown for the NASDAQ-100 Index - Price Return do not include the reinvestment of dividends, if any. |
The NASDAQ-100 Index includes 100 of the largest domestic and international non-financial companies listed on the Nasdaq Stock Market based on market capitalization. The NASDAQ-100 Price Index reflects companies across major industry groups including computer hardware and software, telecommunications, retail/wholesale trade and biotechnologies. It does not contain securities of financial companies including investment companies. |
The Fund’s portfolio holdings may differ significantly from the securities held in the relevant index and, unlike an exchange-traded fund, the performance of an unmanaged index does not reflect deductions for transaction costs, taxes, management fees or other expenses. |
You cannot invest directly in an index. |
Premium/Discount Information: |
Information regarding the differences between the price of the Fund’s shares on the secondary market and the Fund’s net asset value is available at Innovatoretfs.com/XDQQ. |
Expense Example
For the Period Ended April 30, 2022 (Unaudited)
As a shareholder of the Funds, you incur two types of costs: (1) ongoing costs, including management fees, and other Fund expenses; and (2) transaction costs, including brokerage commissions on the purchase and sale of Fund shares. This Example is intended to help you understand your ongoing costs (in dollars) of investing in the Funds and to compare these costs with the ongoing costs of investing in other funds.
The Example is based on an investment of $1,000 invested at the beginning of the respective period and held for the entire respective period to April 30, 2022 for each Fund.
Actual Expenses
The following table provides information about actual account values and actual expenses. You may use the information in this table, together with the amount you invested, to estimate the expenses you paid over the period. Simply divide your account value by $1,000 (for example, an $8,600 account value divided by $1,000 equals 8.6), then multiply the result by the number in the applicable line under the heading titled “Expenses Paid During the Period” to estimate the expenses you paid on your account during the period.
Beginning Account Value | Ending Account Value | Expenses Paid During the Period | Annualized Expense Ratio for the Period | ||||||||||||||
Innovator International Developed Power Buffer ETF - January (NAV) | $ | 1,000.00 | $ | 939.40 | $ | 4.09 | (a) | 0.85 | % | ||||||||
Innovator International Developed Power Buffer ETF - April (NAV) | 1,000.00 | 916.70 | 4.04 | (a) | 0.85 | % | |||||||||||
Innovator International Developed Power Buffer ETF - July (NAV) | 1,000.00 | 952.20 | 4.11 | (a) | 0.85 | % | |||||||||||
Innovator International Developed Power Buffer ETF - October (NAV) | 1,000.00 | 933.70 | 4.08 | (a) | 0.85 | % | |||||||||||
Innovator Emerging Markets Power Buffer ETF - January (NAV) | 1,000.00 | 922.00 | 4.24 | (a) | 0.89 | % | |||||||||||
Innovator Emerging Markets Power Buffer ETF - April (NAV) | 1,000.00 | 963.00 | 4.33 | (a) | 0.89 | % | |||||||||||
Innovator Emerging Markets Power Buffer ETF - July (NAV) | 1,000.00 | 937.00 | 4.27 | (a) | 0.89 | % | |||||||||||
Innovator Emerging Markets Power Buffer ETF - October (NAV) | 1,000.00 | 929.00 | 4.26 | (a) | 0.89 | % | |||||||||||
Innovator Growth-100 Power Buffer ETF - January (NAV) | 1,000.00 | 893.00 | 3.71 | (a) | 0.79 | % | |||||||||||
Innovator Growth-100 Power Buffer ETF - April (NAV) | 1,000.00 | 941.90 | 3.80 | (a) | 0.79 | % | |||||||||||
Innovator Growth-100 Power Buffer ETF - July (NAV) | 1,000.00 | 928.50 | 3.78 | (a) | 0.79 | % | |||||||||||
Innovator Growth-100 Power Buffer ETF - October (NAV) | 1,000.00 | 917.00 | 3.75 | (a) | 0.79 | % | |||||||||||
Innovator U.S. Small Cap Power Buffer ETF - January (NAV) | 1,000.00 | 928.90 | 3.78 | (a) | 0.79 | % | |||||||||||
Innovator U.S. Small Cap Power Buffer ETF - April (NAV) | 1,000.00 | 908.90 | 3.74 | (a) | 0.79 | % | |||||||||||
Innovator U.S. Small Cap Power Buffer ETF - July (NAV) | 1,000.00 | 923.40 | 3.77 | (a) | 0.79 | % | |||||||||||
Innovator U.S. Small Cap Power Buffer ETF - October (NAV) | 1,000.00 | 905.10 | 3.73 | (a) | 0.79 | % | |||||||||||
Innovator Double Stacker ETF - January (NAV) | 1,000.00 | 868.50 | 3.66 | (a) | 0.79 | % | |||||||||||
Innovator Double Stacker ETF - October (NAV) | 1,000.00 | 907.40 | 3.74 | (a) | 0.79 | % | |||||||||||
Innovator Triple Stacker ETF - January (NAV) | 1,000.00 | 871.90 | 3.67 | (a) | 0.79 | % | |||||||||||
Innovator Triple Stacker ETF - October (NAV) | 1,000.00 | 909.00 | 3.74 | (a) | 0.79 | % | |||||||||||
Innovator Double Stacker 9 Buffer ETF - January (NAV) | 1,000.00 | 915.30 | 3.75 | (a) | 0.79 | % | |||||||||||
Innovator Double Stacker 9 Buffer ETF - October (NAV) | 1,000.00 | 948.30 | 3.82 | (a) | 0.79 | % | |||||||||||
Innovator U.S. Equity Accelerated ETF - January (NAV) | 1,000.00 | 863.10 | 2.36 | (b) | 0.79 | % | |||||||||||
Innovator U.S. Equity Accelerated ETF - April (NAV) | 1,000.00 | 949.80 | 3.82 | (a) | 0.79 | % | |||||||||||
Innovator U.S. Equity Accelerated ETF - July (NAV) | 1,000.00 | 916.60 | 3.75 | (a) | 0.79 | % | |||||||||||
Innovator U.S. Equity Accelerated ETF - October (NAV) | 1,000.00 | 922.00 | 3.76 | (a) | 0.79 | % | |||||||||||
Innovator U.S. Equity Accelerated Plus ETF - January (NAV) | 1,000.00 | 866.30 | 2.36 | (b) | 0.79 | % | |||||||||||
Innovator U.S. Equity Accelerated Plus ETF - April (NAV) | 1,000.00 | 952.60 | 3.82 | (a) | 0.79 | % | |||||||||||
Innovator U.S. Equity Accelerated Plus ETF - July (NAV) | 1,000.00 | 927.40 | 3.78 | (a) | 0.79 | % | |||||||||||
Innovator U.S. Equity Accelerated Plus ETF - October (NAV) | 1,000.00 | 927.40 | 3.78 | (a) | 0.79 | % | |||||||||||
Expense Example
For the Period Ended April 30, 2022 (Unaudited) (Continued)
Beginning Account Value | Ending Account Value | Expenses Paid During the Period | Annualized Expense Ratio for the Period | ||||||||||||||
Innovator U.S. Equity Accelerated 9 Buffer ETF - January (NAV) | 1,000.00 | 912.50 | 2.42 | (b) | 0.79 | % | |||||||||||
Innovator U.S. Equity Accelerated 9 Buffer ETF - April (NAV) | 1,000.00 | 962.80 | 3.84 | (a) | 0.79 | % | |||||||||||
Innovator U.S. Equity Accelerated 9 Buffer ETF - July (NAV) | 1,000.00 | 966.60 | 3.85 | (a) | 0.79 | % | |||||||||||
Innovator U.S. Equity Accelerated 9 Buffer ETF - October (NAV) | 1,000.00 | 957.70 | 3.83 | (a) | 0.79 | % | |||||||||||
Innovator Growth Accelerated Plus ETF - January (NAV) | 1,000.00 | 786.80 | 2.26 | (b) | 0.79 | % | |||||||||||
Innovator Growth Accelerated Plus ETF - April (NAV) | 1,000.00 | 906.50 | 3.73 | (a) | 0.79 | % | |||||||||||
Innovator Growth Accelerated Plus ETF - July (NAV) | 1,000.00 | 819.70 | 3.56 | (a) | 0.79 | % | |||||||||||
Innovator Growth Accelerated Plus ETF - October (NAV) | 1,000.00 | 838.30 | 3.60 | (a) | 0.79 | % | |||||||||||
Innovator 20+ Year Treasury Bond 9 Buffer ETF - July (NAV) | 1,000.00 | 890.50 | 3.70 | (a) | 0.79 | % | |||||||||||
Innovator 20+ Year Treasury Bond 5 Floor ETF - Quarterly (NAV) | 1,000.00 | 920.50 | 3.76 | (a) | 0.79 | % | |||||||||||
Innovator Defined Wealth Shield ETF (NAV) | 1,000.00 | 986.50 | 3.40 | (a) | 0.69 | % | |||||||||||
Innovator U.S. Equity Accelerated ETF - Quarterly (NAV) | 1,000.00 | 882.50 | 3.69 | (a) | 0.79 | % | |||||||||||
Innovator Growth Accelerated ETF - Quarterly (NAV) | 1,000.00 | 805.90 | 3.54 | (a) | 0.79 | % | |||||||||||
(a) | Expenses are equal to the Fund’s annualized expense ratio, multiplied by the average account value over the period, multiplied by 181/365 (to reflect the six month period). |
(b) | Expenses are equal to the Fund’s annualized expense ratio, multiplied by the average account value over the period, multiplied by 117/365 (to reflect the period since the Fund's inception). |
Hypothetical Example for Comparison Purposes
The following table provides information about hypothetical account values and hypothetical expenses based on the Funds’ actual expense ratios and an assumed rate of return of 5% per year before expenses, which are not the Funds’ actual returns. The hypothetical account values and expenses may not be used to estimate the actual ending account balance or expenses you paid for the period. You may use this information to compare the ongoing costs of investing in the Funds with other funds. To do so, compare this 5% hypothetical example with the 5% hypothetical examples that appear in the shareholder reports of other funds.
Please note that the expenses shown in the table are meant to highlight your ongoing costs only and do not reflect any transactional costs, such as brokerage commissions on the purchase and sale of Fund shares with respect to the Funds. Therefore, the table below is useful in comparing the ongoing costs only, and will not help you determine the relative total costs of owning different funds. In addition, if these transactional costs were included, your costs could have been higher.
Expense Example
For the Period Ended April 30, 2022 (Unaudited) (Continued)
Beginning Account Value | Ending Account Value | Expenses Paid During the Period (a) | Annualized Expense Ratio for the Period | ||||||||||||||
Innovator International Developed Power Buffer ETF - January (NAV) | $ | 1,000.00 | $ | 1,020.58 | $ | 4.26 | 0.85 | % | |||||||||
Innovator International Developed Power Buffer ETF - April (NAV) | 1,000.00 | 1,020.58 | 4.26 | 0.85 | % | ||||||||||||
Innovator International Developed Power Buffer ETF - July (NAV) | 1,000.00 | 1,020.58 | 4.26 | 0.85 | % | ||||||||||||
Innovator International Developed Power Buffer ETF - October (NAV) | 1,000.00 | 1,020.58 | 4.26 | 0.85 | % | ||||||||||||
Innovator Emerging Markets Power Buffer ETF - January (NAV) | 1,000.00 | 1,020.38 | 4.46 | 0.89 | % | ||||||||||||
Innovator Emerging Markets Power Buffer ETF - April (NAV) | 1,000.00 | 1,020.38 | 4.46 | 0.89 | % | ||||||||||||
Innovator Emerging Markets Power Buffer ETF - July (NAV) | 1,000.00 | 1,020.38 | 4.46 | 0.89 | % | ||||||||||||
Innovator Emerging Markets Power Buffer ETF - October (NAV) | 1,000.00 | 1,020.38 | 4.46 | 0.89 | % | ||||||||||||
Innovator Growth-100 Power Buffer ETF - January (NAV) | 1,000.00 | 1,020.88 | 3.96 | 0.79 | % | ||||||||||||
Innovator Growth-100 Power Buffer ETF - April (NAV) | 1,000.00 | 1,020.88 | 3.96 | 0.79 | % | ||||||||||||
Innovator Growth-100 Power Buffer ETF - July (NAV) | 1,000.00 | 1,020.88 | 3.96 | 0.79 | % | ||||||||||||
Innovator Growth-100 Power Buffer ETF - October (NAV) | 1,000.00 | 1,020.88 | 3.96 | 0.79 | % | ||||||||||||
Innovator U.S. Small Cap Power Buffer ETF - January (NAV) | 1,000.00 | 1,020.88 | 3.96 | 0.79 | % | ||||||||||||
Innovator U.S. Small Cap Power Buffer ETF - April (NAV) | 1,000.00 | 1,020.88 | 3.96 | 0.79 | % | ||||||||||||
Innovator U.S. Small Cap Power Buffer ETF - July (NAV) | 1,000.00 | 1,020.88 | 3.96 | 0.79 | % | ||||||||||||
Innovator U.S. Small Cap Power Buffer ETF - October (NAV) | 1,000.00 | 1,020.88 | 3.96 | 0.79 | % | ||||||||||||
Innovator Double Stacker ETF - January (NAV) | 1,000.00 | 1,020.88 | 3.96 | 0.79 | % | ||||||||||||
Innovator Double Stacker ETF - October (NAV) | 1,000.00 | 1,020.88 | 3.96 | 0.79 | % | ||||||||||||
Innovator Triple Stacker ETF - January (NAV) | 1,000.00 | 1,020.88 | 3.96 | 0.79 | % | ||||||||||||
Innovator Triple Stacker ETF - October (NAV) | 1,000.00 | 1,020.88 | 3.96 | 0.79 | % | ||||||||||||
Innovator Double Stacker 9 Buffer ETF - January (NAV) | 1,000.00 | 1,020.88 | 3.96 | 0.79 | % | ||||||||||||
Innovator Double Stacker 9 Buffer ETF - October (NAV) | 1,000.00 | 1,020.88 | 3.96 | 0.79 | % | ||||||||||||
Innovator U.S. Equity Accelerated ETF - January (NAV) | 1,000.00 | 1,020.88 | 3.96 | (b) | 0.79 | % | |||||||||||
Innovator U.S. Equity Accelerated ETF - April (NAV) | 1,000.00 | 1,020.88 | 3.96 | 0.79 | % | ||||||||||||
Innovator U.S. Equity Accelerated ETF - July (NAV) | 1,000.00 | 1,020.88 | 3.96 | 0.79 | % | ||||||||||||
Innovator U.S. Equity Accelerated ETF - October (NAV) | 1,000.00 | 1,020.88 | 3.96 | 0.79 | % | ||||||||||||
Innovator U.S. Equity Accelerated Plus ETF - January (NAV) | 1,000.00 | 1,020.88 | 3.96 | (b) | 0.79 | % | |||||||||||
Innovator U.S. Equity Accelerated Plus ETF - April (NAV) | 1,000.00 | 1,020.88 | 3.96 | 0.79 | % | ||||||||||||
Innovator U.S. Equity Accelerated Plus ETF - July (NAV) | 1,000.00 | 1,020.88 | 3.96 | 0.79 | % | ||||||||||||
Innovator U.S. Equity Accelerated Plus ETF - October (NAV) | 1,000.00 | 1,020.88 | 3.96 | 0.79 | % | ||||||||||||
Innovator U.S. Equity Accelerated 9 Buffer ETF - January (NAV) | 1,000.00 | 1,020.88 | 3.96 | (b) | 0.79 | % | |||||||||||
Innovator U.S. Equity Accelerated 9 Buffer ETF - April (NAV) | 1,000.00 | 1,020.88 | 3.96 | 0.79 | % | ||||||||||||
Innovator U.S. Equity Accelerated 9 Buffer ETF - July (NAV) | 1,000.00 | 1,020.88 | 3.96 | 0.79 | % | ||||||||||||
Innovator U.S. Equity Accelerated 9 Buffer ETF - October (NAV) | 1,000.00 | 1,020.88 | 3.96 | 0.79 | % | ||||||||||||
Innovator Growth Accelerated Plus ETF - January (NAV) | 1,000.00 | 1,020.88 | 3.96 | (b) | 0.79 | % | |||||||||||
Innovator Growth Accelerated Plus ETF - April (NAV) | 1,000.00 | 1,020.88 | 3.96 | 0.79 | % | ||||||||||||
Innovator Growth Accelerated Plus ETF - July (NAV) | 1,000.00 | 1,020.88 | 3.96 | 0.79 | % | ||||||||||||
Innovator Growth Accelerated Plus ETF - October (NAV) | 1,000.00 | 1,020.88 | 3.96 | 0.79 | % | ||||||||||||
Innovator 20+ Year Treasury Bond 9 Buffer ETF - July (NAV) | 1,000.00 | 1,020.88 | 3.96 | 0.79 | % | ||||||||||||
Innovator 20+ Year Treasury Bond 5 Floor ETF - Quarterly (NAV) | 1,000.00 | 1,020.88 | 3.96 | 0.79 | % | ||||||||||||
Innovator Defined Wealth Shield ETF (NAV) | 1,000.00 | 1,021.37 | 3.46 | 0.69 | % | ||||||||||||
Innovator U.S. Equity Accelerated ETF - Quarterly (NAV) | 1,000.00 | 1,020.88 | 3.96 | 0.79 | % | ||||||||||||
Innovator Growth Accelerated ETF - Quarterly (NAV) | 1,000.00 | 1,020.88 | 3.96 | 0.79 | % | ||||||||||||
(a) Expenses are equal to the Fund’s annualized expense ratio, multiplied by the average account value over the period, multiplied by 181/365 (to reflect the six month period). |
(b) For comparative purposes only as the Fund was not in operation for the full six month period. |
INNOVATOR INTERNATIONAL DEVELOPED POWER BUFFER ETF - JANUARY
Schedule of Investments
April 30, 2022 (Unaudited)
Contracts | Notional Amount | Value | ||||||||||
PURCHASED OPTIONS - 109.14% (a)(b) | ||||||||||||
CALL OPTIONS - 90.46% | ||||||||||||
EFA iShares MSCI EAFE ETF, Expires 12/30/2022, Strike Price $0.67 | 12,153 | $ | 83,418,192 | $ | 80,411,946 | |||||||
| 80,411,946 | ||||||||||||
PUT OPTIONS - 18.68% | ||||||||||||
EFA iShares MSCI EAFE ETF, Expires 12/30/2022, Strike Price $78.68 | 12,153 | 83,418,192 | 16,604,232 | |||||||||
| 16,604,232 | ||||||||||||
TOTAL PURCHASED OPTIONS (Cost $99,040,927) | 97,016,178 | |||||||||||
SHORT TERM INVESTMENTS - 0.64% | Principal Amount | |||||||||||
Money Market Deposit Account - 0.64% | ||||||||||||
U.S. Bank Money Market Deposit Account, 0.130% (c) | $ | 568,862 | 568,862 | |||||||||
TOTAL SHORT TERM INVESTMENTS (Cost $568,862) | 568,862 | |||||||||||
Total Investments (Cost $99,609,789) - 109.78% | 97,585,040 | |||||||||||
Liabilities in Excess of Other Assets - (9.78)% | (8,697,115 | ) | ||||||||||
TOTAL NET ASSETS - 100.00% | $ | 88,887,925 | ||||||||||
Asset Type | % of Net Assets | |||||||||||
Purchased Options | 109.14 | % | ||||||||||
Short Term Investments | 0.64 | |||||||||||
Total Investments | 109.78 | |||||||||||
Liabilities in Excess of Other Assets | (9.78 | ) | ||||||||||
Net Assets | 100.00 | % | ||||||||||
Percentages are stated as a percent of net assets.
(a) Exchange-Traded. |
(b) Purchased option contracts are held in connection with corresponding option contracts written short. |
(c) The U.S. Bank Money Market Deposit Account (the “MMDA”) is a short-term investment vehicle in which the Fund holds cash balances. The MMDA will bear interest at a variable rate that is determined based on conditions and may change daily and by any amount. The rate shown is as of April 30, 2022. |
INNOVATOR INTERNATIONAL DEVELOPED POWER BUFFER ETF - JANUARY
Schedule of Options Written (a) | ||||||||||||||||||||
April 30, 2022 (Unaudited) | ||||||||||||||||||||
Description | Expiration | Strike Price | Contracts | Notional Amount | Value | |||||||||||||||
Call Options | ||||||||||||||||||||
EFA iShares MSCI EAFE ETF | 12/30/2022 | $ | 85.08 | 12,153 | $ | (83,418,192 | ) | $ | (2,888,833 | ) | ||||||||||
(2,888,833 | ) | |||||||||||||||||||
Put Options | ||||||||||||||||||||
EFA iShares MSCI EAFE ETF | 12/30/2022 | 66.88 | 12,153 | (83,418,192 | ) | (5,747,029 | ) | |||||||||||||
(5,747,029 | ) | |||||||||||||||||||
Total Options Written (Premiums Received $5,095,208) | $ | (8,635,862 | ) | |||||||||||||||||
(a) Exchange-Traded. | ||||||||||||||||||||
INNOVATOR INTERNATIONAL DEVELOPED POWER BUFFER ETF - APRIL
Schedule of Investments | ||||
April 30, 2022 (Unaudited) |
Contracts | Notional Amount | Value | ||||||||||
PURCHASED OPTIONS - 106.20% (a)(b) | ||||||||||||
CALL OPTIONS - 93.52% | ||||||||||||
EFA iShares MSCI EAFE ETF, Expires 3/31/2023, Strike Price $0.63 | 7,709 | $ | 52,914,576 | $ | 51,003,595 | |||||||
51,003,595 | ||||||||||||
PUT OPTIONS - 12.68% | ||||||||||||
EFA iShares MSCI EAFE ETF, Expires 3/31/2023, Strike Price $73.60 | 7,709 | 52,914,576 | 6,913,367 | |||||||||
6,913,367 | ||||||||||||
TOTAL PURCHASED OPTIONS (Cost $58,391,429) | 57,916,962 | |||||||||||
SHORT TERM INVESTMENTS - 0.83% | Principal Amount | |||||||||||
Money Market Deposit Account - 0.83% | ||||||||||||
U.S. Bank Money Market Deposit Account, 0.130% (c) | $ | 453,537 | 453,537 | |||||||||
TOTAL SHORT TERM INVESTMENTS (Cost $453,537) | 453,537 | |||||||||||
Total Investments (Cost $58,844,966) - 107.03% | 58,370,499 | |||||||||||
Liabilities in Excess of Other Assets - (7.03)% | (3,833,649 | ) | ||||||||||
TOTAL NET ASSETS - 100.00% | $ | 54,536,850 | ||||||||||
Asset Type | % of Net Assets | |||||||||||
Purchased Options | 106.20 | % | ||||||||||
Short Term Investments | 0.83 | |||||||||||
Total Investments | 107.03 | |||||||||||
Liabilities in Excess of Other Assets | (7.03 | ) | ||||||||||
Net Assets | 100.00 | % | ||||||||||
Percentages are stated as a percent of net assets. |
(a) Exchange-Traded. |
(b) Purchased option contracts are held in connection with corresponding option contracts written short. |
(c) The U.S. Bank Money Market Deposit Account (the “MMDA”) is a short-term investment vehicle in which the Fund holds cash balances. The MMDA will bear interest at a variable rate that is determined based on conditions and may change daily and by any amount. The rate shown is as of April 30, 2022. |
INNOVATOR INTERNATIONAL DEVELOPED POWER BUFFER ETF - APRIL
Schedule of Options Written (a) | |||
April 30, 2022 (Unaudited) |
Description | Expiration | Strike Price | Contracts | Notional Amount | Value | |||||||||||||||
Call Options | ||||||||||||||||||||
EFA iShares MSCI EAFE ETF | 3/31/2023 | $ | 84.17 | 7,709 | $ | (52,914,576 | ) | $ | (1,367,676 | ) | ||||||||||
(1,367,676 | ) | |||||||||||||||||||
Put Options | ||||||||||||||||||||
EFA iShares MSCI EAFE ETF | 3/31/2023 | 62.56 | 7,709 | (52,914,576 | ) | (2,436,907 | ) | |||||||||||||
(2,436,907 | ) | |||||||||||||||||||
Total Options Written (Premiums Received 2,848,149) | $ | (3,804,583 | ) | |||||||||||||||||
(a) Exchange-Traded. |
INNOVATOR INTERNATIONAL DEVELOPED POWER BUFFER ETF - JULY
Schedule of Investments |
April 30, 2022 (Unaudited) |
Contracts | Notional Amount | Value | ||||||||||
PURCHASED OPTIONS - 106.10% (a)(b) | ||||||||||||
CALL OPTIONS - 88.11% | ||||||||||||
EFA iShares MSCI EAFE ETF, Expires 6/30/2022, Strike Price $0.63 | 7,735 | $ | 53,093,040 | $ | 51,760,610 | |||||||
51,760,610 | ||||||||||||
PUT OPTIONS - 17.99% | ||||||||||||
EFA iShares MSCI EAFE ETF, Expires 6/30/2022, Strike Price $78.88 | 7,735 | 53,093,040 | 10,567,335 | |||||||||
10,567,335 | ||||||||||||
TOTAL PURCHASED OPTIONS (Cost $63,145,044) | 62,327,945 | |||||||||||
SHORT TERM INVESTMENTS - 0.21% | Principal Amount | |||||||||||
Money Market Deposit Account - 0.21% | ||||||||||||
U.S. Bank Money Market Deposit Account, 0.130% (c) | $ | 120,651 | 120,651 | |||||||||
TOTAL SHORT TERM INVESTMENTS (Cost $120,651) | 120,651 | |||||||||||
Total Investments (Cost $63,265,695) - 106.31% | 62,448,596 | |||||||||||
Liabilities in Excess of Other Assets - (6.31)% | (3,704,009 | ) | ||||||||||
TOTAL NET ASSETS - 100.00% | $ | 58,744,587 | ||||||||||
Asset Type | % of Net Assets | |||||||||||
Purchased Options | 106.10 | % | ||||||||||
Short Term Investments | 0.21 | |||||||||||
Total Investments | 106.31 | |||||||||||
Liabilities in Excess of Other Assets | (6.31 | ) | ||||||||||
Net Assets | 100.00 | % | ||||||||||
Percentages are stated as a percent of net assets. |
(a) Exchange-Traded. |
(b) Purchased option contracts are held in connection with corresponding option contracts written short. |
(c) The U.S. Bank Money Market Deposit Account (the “MMDA”) is a short-term investment vehicle in which the Fund holds cash balances. The MMDA will bear interest at a variable rate that is determined based on conditions and may change daily and by any amount. The rate shown is as of April 30, 2022. |
INNOVATOR INTERNATIONAL DEVELOPED POWER BUFFER ETF - JULY
Schedule of Options Written (a) | |||
April 30, 2022 (Unaudited) |
Description | Expiration | Strike Price | Contracts | Notional Amount | Value | |||||||||||||||
Call Options | ||||||||||||||||||||
EFA iShares MSCI EAFE ETF | 6/30/2022 | $ | 84.22 | 7,735 | $ | (53,093,040 | ) | $ | (1,659,945 | ) | ||||||||||
(1,659,945 | ) | |||||||||||||||||||
Put Options | ||||||||||||||||||||
EFA iShares MSCI EAFE ETF | 6/30/2022 | 67.05 | 7,735 | (53,093,040 | ) | (2,003,987 | ) | |||||||||||||
(2,003,987 | ) | |||||||||||||||||||
Total Options Written (Premiums Received $2,826,840) | $ | (3,663,932 | ) | |||||||||||||||||
(a) Exchange-Traded. | ||||||||||||||||||||
INNOVATOR INTERNATIONAL DEVELOPED POWER BUFFER ETF - OCTOBER
Schedule of Investments | |||||
April 30, 2022 (Unaudited) |
Contracts | Notional Amount | Value | ||||||||||
PURCHASED OPTIONS - 107.54% (a)(b) | ||||||||||||
CALL OPTIONS - 90.42% | ||||||||||||
EFA iShares MSCI EAFE ETF, Expires 9/30/2022, Strike Price $0.62 | 2,319 | $ | 15,917,616 | $ | 15,548,260 | |||||||
15,548,260 | ||||||||||||
PUT OPTIONS - 17.12% | ||||||||||||
EFA iShares MSCI EAFE ETF, Expires 9/30/2022, Strike Price $78.01 | 2,319 | 15,917,616 | 2,943,135 | |||||||||
2,943,135 | ||||||||||||
TOTAL PURCHASED OPTIONS (Cost $18,853,764) | 18,491,395 | |||||||||||
SHORT TERM INVESTMENTS - 0.42% | Principal Amount | |||||||||||
Money Market Deposit Account - 0.42% | ||||||||||||
U.S. Bank Money Market Deposit Account, 0.130% (c) | $ | 72,575 | 72,575 | |||||||||
TOTAL SHORT TERM INVESTMENTS (Cost $72,575) | 72,575 | |||||||||||
Total Investments (Cost $18,926,339) - 107.96% | 18,563,970 | |||||||||||
Liabilities in Excess of Other Assets - (7.96)% | (1,368,872 | ) | ||||||||||
TOTAL NET ASSETS - 100.00% | $ | 17,195,098 | ||||||||||
Asset Type | % of Net Assets | |||||||||||
Purchased Options | 107.54 | % | ||||||||||
Short Term Investments | 0.42 | |||||||||||
Total Investments | 107.96 | |||||||||||
Liabilities in Excess of Other Assets | (7.96 | ) | ||||||||||
Net Assets | 100.00 | % | ||||||||||
Percentages are stated as a percent of net assets. |
(a) Exchange-Traded. |
(b) Purchased option contracts are held in connection with corresponding option contracts written short. |
(c) The U.S. Bank Money Market Deposit Account (the “MMDA”) is a short-term investment vehicle in which the Fund holds cash balances. The MMDA will bear interest at a variable rate that is determined based on conditions and may change daily and by any amount. The rate shown is as of April 30, 2022. |
INNOVATOR INTERNATIONAL DEVELOPED POWER BUFFER ETF - OCTOBER
Schedule of Options Written (a) | |||
April 30, 2022 (Unaudited) |
Description | Expiration | Strike Price | Contracts | Notional Amount | Value | |||||||||||||||
Call Options | ||||||||||||||||||||
EFA iShares MSCI EAFE ETF | 9/30/2022 | $ | 85.81 | 2,319 | $ | (15,917,616 | ) | $ | (552,813 | ) | ||||||||||
(552,813 | ) | |||||||||||||||||||
Put Options | ||||||||||||||||||||
EFA iShares MSCI EAFE ETF | 9/30/2022 | 66.31 | 2,319 | (15,917,616 | ) | (804,064 | ) | |||||||||||||
(804,064 | ) | |||||||||||||||||||
Total Options Written (Premiums Received $814,590) | $ | (1,356,877 | ) | |||||||||||||||||
(a) Exchange-Traded. | ||||||||||||||||||||
INNOVATOR EMERGING MARKETS POWER BUFFER ETF – JANUARY
Schedule of Investments |
April 30, 2022 (Unaudited) |
Contracts | Notional Amount | Value | ||||||||||
PURCHASED OPTIONS - 109.78% (a)(b) | ||||||||||||
CALL OPTIONS - 90.01% | ||||||||||||
EEM iShares MSCI Emerging Markets ETF, Expires 12/30/2022, Strike Price $0.43 | 18,201 | $ | 77,135,838 | $ | 74,562,266 | |||||||
74,562,266 | ||||||||||||
PUT OPTIONS - 19.77% | ||||||||||||
EEM iShares MSCI Emerging Markets ETF, Expires 12/30/2022, Strike Price $48.85 | 18,201 | 77,135,838 | 16,381,014 | |||||||||
16,381,014 | ||||||||||||
TOTAL PURCHASED OPTIONS (Cost $94,805,318) | 90,943,280 | |||||||||||
SHORT TERM INVESTMENTS - 0.66% | Principal Amount | |||||||||||
Money Market Deposit Account - 0.66% | ||||||||||||
U.S. Bank Money Market Deposit Account, 0.130% (c) | $ | 547,488 | 547,488 | |||||||||
TOTAL SHORT TERM INVESTMENTS (Cost $547,488) | 547,488 | |||||||||||
Total Investments (Cost $95,352,806) - 110.44% | 91,490,768 | |||||||||||
Liabilities in Excess of Other Assets - (10.44)% | (8,652,377 | ) | ||||||||||
TOTAL NET ASSETS - 100.00% | $ | 82,838,391 | ||||||||||
Asset Type | % of Net Assets | |||||||||||
Purchased Options | 109.78 | % | ||||||||||
Short Term Investments | 0.66 | |||||||||||
Total Investments | 110.44 | |||||||||||
Liabilities in Excess of Other Assets | (10.44 | ) | ||||||||||
Net Assets | 100.00 | % | ||||||||||
Percentages are stated as a percent of net assets. |
(a) Exchange-Traded. |
(b) Purchased option contracts are held in connection with corresponding option contracts written short. |
(c) The U.S. Bank Money Market Deposit Account (the “MMDA”) is a short-term investment vehicle in which the Fund holds cash balances. The MMDA will bear interest at a variable rate that is determined based on conditions and may change daily and by any amount. The rate shown is as of April 30, 2022. |
INNOVATOR EMERGING MARKETS POWER BUFFER ETF – JANUARY
Schedule of Options Written (a) | |||
April 30, 2022 (Unaudited) |
Description | Expiration | Strike Price | Contracts | Notional Amount | Value | |||||||||||||||
Call Options | ||||||||||||||||||||
EEM iShares MSCI Emerging Markets ETF | 12/30/2022 | $ | 54.38 | 18,201 | $ | (77,135,838 | ) | $ | (2,520,693 | ) | ||||||||||
(2,520,693 | ) | |||||||||||||||||||
Put Options | ||||||||||||||||||||
EEM iShares MSCI Emerging Markets ETF | 12/30/2022 | 41.52 | 18,201 | (77,135,838 | ) | (6,067,703 | ) | |||||||||||||
(6,067,703 | ) | |||||||||||||||||||
Total Options Written (Premiums Received $6,643,632) | $ | (8,588,396 | ) | |||||||||||||||||
(a) Exchange-Traded. | ||||||||||||||||||||
INNOVATOR EMERGING MARKETS POWER BUFFER ETF – APRIL
Schedule of Investments | ||||
April 30, 2022 (Unaudited) |
Contracts | Notional Amount | Value | ||||||||||
PURCHASED OPTIONS - 111.07% (a)(b) | ||||||||||||
CALL OPTIONS - 93.72% | ||||||||||||
EEM iShares MSCI Emerging Markets ETF, Expires 3/31/2023, Strike Price $0.40 | 8,446 | $ | 35,794,148 | $ | 34,622,273 | |||||||
34,622,273 | ||||||||||||
PUT OPTIONS - 17.35% | ||||||||||||
EEM iShares MSCI Emerging Markets ETF, Expires 3/31/2023, Strike Price $45.15 | 8,446 | 35,794,148 | 6,410,072 | |||||||||
6,410,072 | ||||||||||||
TOTAL PURCHASED OPTIONS (Cost $40,122,580) | 41,032,345 | |||||||||||
SHORT TERM INVESTMENTS - 0.86% | Principal Amount | |||||||||||
Money Market Deposit Account - 0.86% | ||||||||||||
U.S. Bank Money Market Deposit Account, 0.130% (c) | $ | 318,058 | 318,058 | |||||||||
TOTAL SHORT TERM INVESTMENTS (Cost $318,058) | 318,058 | |||||||||||
Total Investments (Cost $40,440,638) - 111.93% | 41,350,403 | |||||||||||
Liabilities in Excess of Other Assets - (11.93)% | (4,408,743 | ) | ||||||||||
TOTAL NET ASSETS - 100.00% | $ | 36,941,660 | ||||||||||
Asset Type | % of Net Assets | |||||||||||
Purchased Options | 111.07 | % | ||||||||||
Short Term Investments | 0.86 | |||||||||||
Total Investments | 111.93 | |||||||||||
Liabilities in Excess of Other Assets | (11.93 | ) | ||||||||||
Net Assets | 100.00 | % | ||||||||||
Percentages are stated as a percent of net assets. |
(a) Exchange-Traded. |
(b) Purchased option contracts are held in connection with corresponding option contracts written short. |
(c) The U.S. Bank Money Market Deposit Account (the “MMDA”) is a short-term investment vehicle in which the Fund holds cash balances. The MMDA will bear interest at a variable rate that is determined based on conditions and may change daily and by any amount. The rate shown is as of April 30, 2022. |
INNOVATOR EMERGING MARKETS POWER BUFFER ETF – APRIL
Schedule of Options Written (a) | |||
April 30, 2022 (Unaudited) |
Description | Expiration | Strike Price | Contracts | Notional Amount | Value | |||||||||||||||
Call Options | ||||||||||||||||||||
EEM iShares MSCI Emerging Markets ETF | 3/31/2023 | $ | 51.48 | 8,446 | $ | (35,794,148 | ) | $ | (2,298,073 | ) | ||||||||||
(2,298,073 | ) | |||||||||||||||||||
Put Options | ||||||||||||||||||||
EEM iShares MSCI Emerging Markets ETF | 3/31/2023 | 38.38 | 8,446 | (35,794,148 | ) | (2,090,465 | ) | |||||||||||||
(2,090,465 | ) | |||||||||||||||||||
Total Options Written (Premiums Received $2,719,189) | $ | (4,388,538 | ) | |||||||||||||||||
(a) Exchange-Traded. | ||||||||||||||||||||
INNOVATOR EMERGING MARKETS POWER BUFFER ETF – JULY
Schedule of Investments |
April 30, 2022 (Unaudited) |
Contracts | Notional Amount | Value | ||||||||||
PURCHASED OPTIONS - 109.83% (a)(b) | ||||||||||||
CALL OPTIONS - 83.33% | ||||||||||||
EEM iShares MSCI Emerging Markets ETF, Expires 6/30/2022, Strike Price $0.44 | 6,425 | $ | 27,229,150 | $ | 26,663,863 | |||||||
26,663,863 | ||||||||||||
PUT OPTIONS - 26.50% | ||||||||||||
EEM iShares MSCI Emerging Markets ETF, Expires 6/30/2022, Strike Price $55.15 | 6,425 | 27,229,150 | 8,477,541 | |||||||||
8,477,541 | ||||||||||||
TOTAL PURCHASED OPTIONS (Cost $36,801,039) | 35,141,404 | |||||||||||
SHORT TERM INVESTMENTS - 0.21% | Principal Amount | |||||||||||
Money Market Deposit Account - 0.21% | ||||||||||||
U.S. Bank Money Market Deposit Account, 0.130% (c) | $ | 67,901 | 67,901 | |||||||||
TOTAL SHORT TERM INVESTMENTS (Cost $67,901) | 67,901 | |||||||||||
Total Investments (Cost $36,868,940) - 110.04% | 35,209,305 | |||||||||||
Liabilities in Excess of Other Assets - (10.04)% | (3,212,331 | ) | ||||||||||
TOTAL NET ASSETS - 100.00% | $ | 31,996,974 | ||||||||||
Asset Type | % of Net Assets | |||||||||||
Purchased Options | 109.83 | % | ||||||||||
Short Term Investments | 0.21 | |||||||||||
Total Investments | 110.04 | |||||||||||
Liabilities in Excess of Other Assets | (10.04 | ) | ||||||||||
Net Assets | 100.00 | % | ||||||||||
Percentages are stated as a percent of net assets. |
(a) Exchange-Traded. |
(b) Purchased option contracts are held in connection with corresponding option contracts written short. |
(c) The U.S. Bank Money Market Deposit Account (the “MMDA”) is a short-term investment vehicle in which the Fund holds cash balances. The MMDA will bear interest at a variable rate that is determined based on conditions and may change daily and by any amount. The rate shown is as of April 30, 2022. |
INNOVATOR EMERGING MARKETS POWER BUFFER ETF – JULY
Schedule of Options Written (a) | |||
April 30, 2022 (Unaudited) |
Description | Expiration | Strike Price | Contracts | Notional Amount | Value | |||||||||||||||
Call Options | ||||||||||||||||||||
EEM iShares MSCI Emerging Markets ETF | 6/30/2022 | $ | 59.99 | 6,425 | $ | (27,229,150 | ) | $ | (6,398 | ) | ||||||||||
(6,398 | ) | |||||||||||||||||||
Put Options | ||||||||||||||||||||
EEM iShares MSCI Emerging Markets ETF | 6/30/2022 | 46.88 | 6,425 | (27,229,150 | ) | (3,181,310 | ) | |||||||||||||
(3,181,310 | ) | |||||||||||||||||||
Total Options Written (Premiums Received $2,463,263) | $ | (3,187,708 | ) | |||||||||||||||||
(a) Exchange-Traded. | ||||||||||||||||||||
INNOVATOR EMERGING MARKETS POWER BUFFER ETF – OCTOBER
Schedule of Investments | |||||
April 30, 2022 (Unaudited) |
Contracts | Notional Amount | Value | ||||||||||
PURCHASED OPTIONS - 110.36% (a)(b) | ||||||||||||
CALL OPTIONS - 87.82% | ||||||||||||
EEM iShares MSCI Emerging Markets ETF, Expires 9/30/2022, Strike Price $0.40 | 1,858 | $ | 7,874,204 | $ | 7,719,939 | |||||||
7,719,939 | ||||||||||||
PUT OPTIONS - 22.54% | ||||||||||||
EEM iShares MSCI Emerging Markets ETF, Expires 9/30/2022, Strike Price $50.38 | 1,858 | 7,874,204 | 1,981,099 | |||||||||
1,981,099 | ||||||||||||
TOTAL PURCHASED OPTIONS (Cost $9,853,260) | 9,701,038 | |||||||||||
SHORT TERM INVESTMENTS - 0.42% | Principal Amount | |||||||||||
Money Market Deposit Account - 0.42% | ||||||||||||
U.S. Bank Money Market Deposit Account, 0.130% (c) | $ | 36,824 | 36,824 | |||||||||
TOTAL SHORT TERM INVESTMENTS (Cost $36,824) | 36,824 | |||||||||||
Total Investments (Cost $9,890,084) - 110.78% | 9,737,862 | |||||||||||
Liabilities in Excess of Other Assets - (10.78)% | (947,434 | ) | ||||||||||
TOTAL NET ASSETS - 100.00% | $ | 8,790,428 | ||||||||||
Asset Type | % of Net Assets | |||||||||||
Purchased Options | 110.36 | % | ||||||||||
Short Term Investments | 0.42 | |||||||||||
Total Investments | 110.78 | |||||||||||
Liabilities in Excess of Other Assets | (10.78 | ) | ||||||||||
Net Assets | 100.00 | % | ||||||||||
Percentages are stated as a percent of net assets. |
(a) Exchange-Traded. |
(b) Purchased option contracts are held in connection with corresponding option contracts written short. |
(c) The U.S. Bank Money Market Deposit Account (the “MMDA”) is a short-term investment vehicle in which the Fund holds cash balances. The MMDA will bear interest at a variable rate that is determined based on conditions and may change daily and by any amount. The rate shown is as of April 30, 2022. |
INNOVATOR EMERGING MARKETS POWER BUFFER ETF – OCTOBER
Schedule of Options Written (a) | |||||||||||
April 30, 2022 (Unaudited) | |||||||||||
Description | Expiration | Strike Price | Contracts | Notional Amount | Value | |||||||||||||||
Call Options | ||||||||||||||||||||
EEM iShares MSCI Emerging Markets ETF | 9/30/2022 | $ | 57.38 | 1,858 | $ | (7,874,204 | ) | $ | (396,580 | ) | ||||||||||
(396,580 | ) | |||||||||||||||||||
Put Options | ||||||||||||||||||||
EEM iShares MSCI Emerging Markets ETF | 9/30/2022 | 42.82 | 1,858 | (7,874,204 | ) | (544,887 | ) | |||||||||||||
(544,887 | ) | |||||||||||||||||||
Total Options Written (Premiums Received $643,307) | $ | (941,467 | ) | |||||||||||||||||
(a) Exchange-Traded. | ||||||||||||||||||||
INNOVATOR GROWTH-100 POWER BUFFER ETF – JANUARY
Schedule of Investments |
April 30, 2022 (Unaudited) |
Contracts | Notional Amount | Value | ||||||||||
PURCHASED OPTIONS - 111.37% (a)(b) | ||||||||||||
CALL OPTIONS - 87.58% | ||||||||||||
QQQ Invesco QQQ Trust Series 1, Expires 12/30/2022, Strike Price $3.18 | 3,524 | $ | 110,389,300 | $ | 108,575,139 | |||||||
108,575,139 | ||||||||||||
PUT OPTIONS - 23.79% | ||||||||||||
QQQ Invesco QQQ Trust Series 1, Expires 12/30/2022, Strike Price $397.85 | 3,524 | 110,389,300 | 29,500,830 | |||||||||
29,500,830 | ||||||||||||
TOTAL PURCHASED OPTIONS (Cost $148,137,884) | 138,075,969 | |||||||||||
SHORT TERM INVESTMENTS - 0.62% | Principal Amount | |||||||||||
Money Market Deposit Account- 0.62% | ||||||||||||
U.S. Bank Money Market Deposit Account, 0.130% (c) | $ | 764,141 | 764,141 | |||||||||
TOTAL SHORT TERM INVESTMENTS (Cost $764,141) | 764,141 | |||||||||||
Total Investments (Cost $148,902,025) - 111.99% | 138,840,110 | |||||||||||
Liabilities in Excess of Other Assets - (11.99)% | (14,863,582 | ) | ||||||||||
TOTAL NET ASSETS - 100.00% | $ | 123,976,528 | ||||||||||
Asset Type | % of Net Assets | |||||||||||
Purchased Options | 111.37 | % | ||||||||||
Short Term Investments | 0.62 | |||||||||||
Total Investments | 111.99 | |||||||||||
Liabilities in Excess of Other Assets | (11.99 | ) | ||||||||||
Net Assets | 100.00 | % | ||||||||||
Percentages are stated as a percent of net assets. |
(a) Exchange-Traded. |
(b) Purchased option contracts are held in connection with corresponding option contracts written short. |
(c) The U.S. Bank Money Market Deposit Account (the “MMDA”) is a short-term investment vehicle in which the Fund holds cash balances. The MMDA will bear interest at a variable rate that is determined based on conditions and may change daily and by any amount. The rate shown is as of April 30, 2022. |
INNOVATOR GROWTH-100 POWER BUFFER ETF – JANUARY
Schedule of Options Written (a) | |||
April 30, 2022 (Unaudited) |
Description | Expiration | Strike Price | Contracts | Notional Amount | Value | |||||||||||||||
Call Options | ||||||||||||||||||||
QQQ Invesco QQQ Trust Series 1 | 12/30/2022 | $ | 441.02 | 3,524 | $ | (110,389,300 | ) | $ | (337,560 | ) | ||||||||||
(337,560 | ) | |||||||||||||||||||
Put Options | ||||||||||||||||||||
QQQ Invesco QQQ Trust Series 1 | 12/30/2022 | 338.17 | 3,524 | (110,389,300 | ) | (14,440,896 | ) | |||||||||||||
(14,440,896 | ) | |||||||||||||||||||
Total Options Written (Premiums Received $12,739,277) | $ | (14,778,456 | ) | |||||||||||||||||
(a) Exchange-Traded. | ||||||||||||||||||||
INNOVATOR GROWTH-100 POWER BUFFER ETF – APRIL
Schedule of Investments |
April 30, 2022 (Unaudited) |
Contracts | Notional Amount | Value | ||||||||||
PURCHASED OPTIONS - 109.41% (a)(b) | ||||||||||||
CALL OPTIONS - 92.05% | ||||||||||||
QQQ Invesco QQQ Trust Series 1, Expires 3/31/2023, Strike Price $2.90 | 1,784 | $ | 55,883,800 | $ | 54,901,225 | |||||||
54,901,225 | ||||||||||||
PUT OPTIONS - 17.36% | ||||||||||||
QQQ Invesco QQQ Trust Series 1, Expires 3/31/2023, Strike Price $362.54 | 1,784 | 55,883,800 | 10,357,585 | |||||||||
10,357,585 | ||||||||||||
TOTAL PURCHASED OPTIONS (Cost $69,241,155) | 65,258,810 | |||||||||||
SHORT TERM INVESTMENTS - 0.80% | Principal Amount | |||||||||||
Money Market Deposit Account- 0.80% | ||||||||||||
U.S. Bank Money Market Deposit Account, 0.130% (c) | $ | 476,803 | 476,803 | |||||||||
TOTAL SHORT TERM INVESTMENTS (Cost $476,803) | 476,803 | |||||||||||
Total Investments (Cost $69,717,958) - 110.21% | 65,735,613 | |||||||||||
Liabilities in Excess of Other Assets - (10.21)% | (6,091,943 | ) | ||||||||||
TOTAL NET ASSETS - 100.00% | $ | 59,643,670 | ||||||||||
Asset Type | % of Net Assets | |||||||||||
Purchased Options | 109.41 | % | ||||||||||
Short Term Investments | 0.80 | |||||||||||
Total Investments | 110.21 | |||||||||||
Liabilities in Excess of Other Assets | (10.21 | ) | ||||||||||
Net Assets | 100.00 | % | ||||||||||
Percentages are stated as a percent of net assets. |
(a) Exchange-Traded. |
(b) Purchased option contracts are held in connection with corresponding option contracts written short. |
(c) The U.S. Bank Money Market Deposit Account (the “MMDA”) is a short-term investment vehicle in which the Fund holds cash balances. The MMDA will bear interest at a variable rate that is determined based on conditions and may change daily and by any amount. The rate shown is as of April 30, 2022. |
INNOVATOR GROWTH-100 POWER BUFFER ETF – APRIL
Schedule of Options Written (a) | |||
April 30, 2022 (Unaudited) |
Description | Expiration | Strike Price | Contracts | Notional Amount | Value | |||||||||||||||
Call Options | ||||||||||||||||||||
QQQ Invesco QQQ Trust Series 1 | 3/31/2023 | $ | 412.61 | 1,784 | $ | (55,883,800 | ) | $ | (784,362 | ) | ||||||||||
(784,362 | ) | |||||||||||||||||||
Put Options | ||||||||||||||||||||
QQQ Invesco QQQ Trust Series 1 | 3/31/2023 | 308.16 | 1,784 | (55,883,800 | ) | (5,271,736 | ) | |||||||||||||
(5,271,736 | ) | |||||||||||||||||||
Total Options Written (Premiums Received $5,825,140) | $ | (6,056,098 | ) | |||||||||||||||||
(a) Exchange-Traded. | ||||||||||||||||||||
INNOVATOR GROWTH-100 POWER BUFFER ETF – JULY
Schedule of Investments |
April 30, 2022 (Unaudited) |
Contracts | Notional Amount | Value | ||||||||||
PURCHASED OPTIONS - 103.60% (a)(b) | ||||||||||||
CALL OPTIONS - 91.13% | ||||||||||||
QQQ Invesco QQQ Trust Series 1, Expires 6/30/2022, Strike Price $2.84 | 1,627 | $ | 50,965,775 | $ | 50,395,861 | |||||||
50,395,861 | ||||||||||||
PUT OPTIONS - 12.47% | ||||||||||||
QQQ Invesco QQQ Trust Series 1, Expires 6/30/2022, Strike Price $354.45 | 1,627 | 50,965,775 | 6,893,595 | |||||||||
6,893,595 | ||||||||||||
TOTAL PURCHASED OPTIONS (Cost $61,288,689) | 57,289,456 | |||||||||||
SHORT TERM INVESTMENTS - 0.22% | Principal Amount | |||||||||||
Money Market Deposit Account- 0.22% | ||||||||||||
U.S. Bank Money Market Deposit Account, 0.130% (c) | $ | 122,844 | 122,844 | |||||||||
TOTAL SHORT TERM INVESTMENTS (Cost $122,844) | 122,844 | |||||||||||
Total Investments (Cost $61,411,533) - 103.82% | 57,412,300 | |||||||||||
Liabilities in Excess of Other Assets - (3.82)% | (2,111,973 | ) | ||||||||||
TOTAL NET ASSETS - 100.00% | $ | 55,300,327 | ||||||||||
Asset Type | % of Net Assets | |||||||||||
Purchased Options | 103.60 | % | ||||||||||
Short Term Investments | 0.22 | |||||||||||
Total Investments | 103.82 | |||||||||||
Liabilities in Excess of Other Assets | (3.82 | ) | ||||||||||
Net Assets | 100.00 | % | ||||||||||
Percentages are stated as a percent of net assets. |
(a) Exchange-Traded. |
(b) Purchased option contracts are held in connection with corresponding option contracts written short. |
(c) The U.S. Bank Money Market Deposit Account (the “MMDA”) is a short-term investment vehicle in which the Fund holds cash balances. The MMDA will bear interest at a variable rate that is determined based on conditions and may change daily and by any amount. The rate shown is as of April 30, 2022. |
INNOVATOR GROWTH-100 POWER BUFFER ETF – JULY
Schedule of Options Written (a) | |||
April 30, 2022 (Unaudited) |
Description | Expiration | Strike Price | Contracts | Notional Amount | Value | |||||||||||||||
Call Options | ||||||||||||||||||||
QQQ Invesco QQQ Trust Series 1 | 6/30/2022 | $ | 386.39 | 1,627 | $ | (50,965,775 | ) | $ | (56,257 | ) | ||||||||||
(56,257 | ) | |||||||||||||||||||
Put Options | ||||||||||||||||||||
QQQ Invesco QQQ Trust Series 1 | 6/30/2022 | 301.28 | 1,627 | (50,965,775 | ) | (2,020,304 | ) | |||||||||||||
(2,020,304 | ) | |||||||||||||||||||
Total Options Written (Premiums Received $4,273,562) | $ | (2,076,561 | ) | |||||||||||||||||
(a) Exchange-Traded. | ||||||||||||||||||||
INNOVATOR GROWTH-100 POWER BUFFER ETF – OCTOBER
Schedule of Investments |
April 30, 2022 (Unaudited) |
Contracts | Notional Amount | Value | ||||||||||
PURCHASED OPTIONS - 106.25% (a)(b) | ||||||||||||
CALL OPTIONS - 91.64% | ||||||||||||
QQQ Invesco QQQ Trust Series 1, Expires 9/30/2022, Strike Price $2.86 | 1,852 | $ | 58,013,900 | $ | 57,244,107 | |||||||
57,244,107 | ||||||||||||
PUT OPTIONS - 14.61% | ||||||||||||
QQQ Invesco QQQ Trust Series 1, Expires 9/30/2022, Strike Price $357.53 | 1,852 | 58,013,900 | 9,123,577 | |||||||||
9,123,577 | ||||||||||||
TOTAL PURCHASED OPTIONS (Cost $71,395,965) | 66,367,684 | |||||||||||
SHORT TERM INVESTMENTS - 0.45% | Principal Amount | |||||||||||
Money Market Deposit Account- 0.45% | ||||||||||||
U.S. Bank Money Market Deposit Account, 0.130% (c) | $ | 278,529 | 278,529 | |||||||||
TOTAL SHORT TERM INVESTMENTS (Cost $278,529) | 278,529 | |||||||||||
Total Investments (Cost $71,674,494) - 106.70% | 66,646,213 | |||||||||||
Liabilities in Excess of Other Assets - (6.70)% | (4,184,765 | ) | ||||||||||
TOTAL NET ASSETS - 100.00% | $ | 62,461,448 | ||||||||||
Asset Type | % of Net Assets | |||||||||||
Purchased Options | 106.25 | % | ||||||||||
Short Term Investments | 0.45 | |||||||||||
Total Investments | 106.70 | |||||||||||
Liabilities in Excess of Other Assets | (6.70 | ) | ||||||||||
Net Assets | 100.00 | % | ||||||||||
Percentages are stated as a percent of net assets. |
(a) Exchange-Traded. |
(b) Purchased option contracts are held in connection with corresponding option contracts written short. |
(c) The U.S. Bank Money Market Deposit Account (the “MMDA”) is a short-term investment vehicle in which the Fund holds cash balances. The MMDA will bear interest at a variable rate that is determined based on conditions and may change daily and by any amount. The rate shown is as of April 30, 2022. |
INNOVATOR GROWTH-100 POWER BUFFER ETF – OCTOBER
Schedule of Options Written (a) | |||
April 30, 2022 (Unaudited) |
Description | Expiration | Strike Price | Contracts | Notional Amount | Value | |||||||||||||||
Call Options | ||||||||||||||||||||
QQQ Invesco QQQ Trust Series 1 | 9/30/2022 | $ | 395.64 | 1,852 | $ | (58,013,900 | ) | $ | (275,154 | ) | ||||||||||
(275,154 | ) | |||||||||||||||||||
Put Options | ||||||||||||||||||||
QQQ Invesco QQQ Trust Series 1 | 9/30/2022 | 303.90 | 1,852 | (58,013,900 | ) | (3,867,016 | ) | |||||||||||||
(3,867,016 | ) | |||||||||||||||||||
Total Options Written (Premiums Received $5,806,198) | $ | (4,142,170 | ) | |||||||||||||||||
(a) Exchange-Traded. | ||||||||||||||||||||
INNOVATOR U.S. SMALL CAP POWER BUFFER ETF - JANUARY
Schedule of Investments |
April 30, 2022 (Unaudited) |
Contracts | Notional Amount | Value | ||||||||||
PURCHASED OPTIONS - 108.99% (a)(b) | ||||||||||||
CALL OPTIONS - 89.43% | ||||||||||||
IWM iShares Russell 2000 ETF, Expires 12/30/2022, Strike Price $1.78 | 6,143 | $ | 113,614,785 | $ | 111,464,431 | |||||||
111,464,431 | ||||||||||||
PUT OPTIONS - 19.56% | ||||||||||||
IWM iShares Russell 2000 ETF, Expires 12/30/2022, Strike Price $222.45 | 6,143 | 113,614,785 | 24,375,890 | |||||||||
24,375,890 | ||||||||||||
TOTAL PURCHASED OPTIONS (Cost $145,161,038) | 135,840,321 | |||||||||||
SHORT TERM INVESTMENTS - 0.61% | Principal Amount | |||||||||||
Money Market Deposit Account - 0.61% | ||||||||||||
U.S. Bank Money Market Deposit Account, 0.130% (c) | $ | 765,520 | 765,520 | |||||||||
TOTAL SHORT TERM INVESTMENTS (Cost $765,520) | 765,520 | |||||||||||
Total Investments (Cost $145,926,558) - 109.60% | 136,605,841 | |||||||||||
Liabilities in Excess of Other Assets - (9.60)% | (11,966,110 | ) | ||||||||||
TOTAL NET ASSETS - 100.00% | $ | 124,639,731 | ||||||||||
Asset Type | % of Net Assets | |||||||||||
Purchased Options | 108.99 | % | ||||||||||
Short Term Investments | 0.61 | |||||||||||
Total Investments | 109.60 | |||||||||||
Liabilities in Excess of Other Assets | (9.60 | ) | ||||||||||
Net Assets | 100.00 | % | ||||||||||
Percentages are stated as a percent of net assets. |
(a) Exchange-Traded. |
(b) Purchased option contracts are held in connection with corresponding option contracts written short. |
(c) The U.S. Bank Money Market Deposit Account (the “MMDA”) is a short-term investment vehicle in which the Fund holds cash balances. The MMDA will bear interest at a variable rate that is determined based on conditions and may change daily and by any amount. The rate shown is as of April 30, 2022. |
INNOVATOR U.S. SMALL CAP POWER BUFFER ETF - JANUARY
Schedule of Options Written (a) | |||
April 30, 2022 (Unaudited) |
Description | Expiration | Strike Price | Contracts | Notional Amount | Value | |||||||||||||||
Call Options | ||||||||||||||||||||
IWM iShares Russell 2000 ETF | 12/30/2022 | $ | 248.01 | 6,143 | $ | (113,614,785 | ) | $ | (556,155 | ) | ||||||||||
(556,155 | ) | |||||||||||||||||||
Put Options | ||||||||||||||||||||
IWM iShares Russell 2000 ETF | 12/30/2022 | 189.08 | 6,143 | (113,614,785 | ) | (11,332,722 | ) | |||||||||||||
(11,332,722 | ) | |||||||||||||||||||
Total Options Written (Premiums Received $10,956,836) | $ | (11,888,877 | ) | |||||||||||||||||
(a) Exchange-Traded. | ||||||||||||||||||||
INNOVATOR U.S. SMALL CAP POWER BUFFER ETF - APRIL
Schedule of Investments |
April 30, 2022 (Unaudited) |
Contracts | Notional Amount | Value | ||||||||||
PURCHASED OPTIONS - 108.11% (a)(b) | ||||||||||||
CALL OPTIONS - 93.23% | ||||||||||||
IWM iShares Russell 2000 ETF, Expires 3/31/2023, Strike Price $1.64 | 3,748 | $ | 69,319,260 | $ | 67,797,828 | |||||||
67,797,828 | ||||||||||||
PUT OPTIONS - 14.88% | ||||||||||||
IWM iShares Russell 2000 ETF, Expires 3/31/2023, Strike Price $205.27 | 3,748 | 69,319,260 | 10,817,651 | |||||||||
10,817,651 | ||||||||||||
TOTAL PURCHASED OPTIONS (Cost $82,530,496) | 78,615,479 | |||||||||||
SHORT TERM INVESTMENTS - 0.80% | Principal Amount | |||||||||||
Money Market Deposit Account - 0.80% | ||||||||||||
U.S. Bank Money Market Deposit Account, 0.130% (c) | $ | 583,285 | 583,285 | |||||||||
TOTAL SHORT TERM INVESTMENTS (Cost $583,285) | 583,285 | |||||||||||
Total Investments (Cost $83,113,781) - 108.91% | 79,198,764 | |||||||||||
Liabilities in Excess of Other Assets - (8.91)% | (6,482,532 | ) | ||||||||||
TOTAL NET ASSETS - 100.00% | $ | 72,716,232 | ||||||||||
Asset Type | % of Net Assets | |||||||||||
Purchased Options | 108.11 | % | ||||||||||
Short Term Investments | 0.80 | |||||||||||
Total Investments | 108.91 | |||||||||||
Liabilities in Excess of Other Assets | (8.91 | ) | ||||||||||
Net Assets | 100.00 | % | ||||||||||
Percentages are stated as a percent of net assets. |
(a) Exchange-Traded. |
(b) Purchased option contracts are held in connection with corresponding option contracts written short. |
(c) The U.S. Bank Money Market Deposit Account (the “MMDA”) is a short-term investment vehicle in which the Fund holds cash balances. The MMDA will bear interest at a variable rate that is determined based on conditions and may change daily and by any amount. The rate shown is as of April 30, 2022. |
INNOVATOR U.S. SMALL CAP POWER BUFFER ETF - APRIL
Schedule of Options Written (a) | |||
April 30, 2022 (Unaudited) |
Description | Expiration | Strike Price | Contracts | Notional Amount | Value | |||||||||||||||
Call Options | ||||||||||||||||||||
IWM iShares Russell 2000 ETF | 3/31/2023 | $ | 235.30 | 3,748 | $ | (69,319,260 | ) | $ | (1,103,386 | ) | ||||||||||
(1,103,386 | ) | |||||||||||||||||||
Put Options | ||||||||||||||||||||
IWM iShares Russell 2000 ETF | 3/31/2023 | 174.48 | 3,748 | (69,319,260 | ) | (5,332,201 | ) | |||||||||||||
(5,332,201 | ) | |||||||||||||||||||
Total Options Written (Premiums Received $6,325,183) | $ | (6,435,587 | ) | |||||||||||||||||
(a) Exchange-Traded. | ||||||||||||||||||||
INNOVATOR U.S. SMALL CAP POWER BUFFER ETF - JULY
Schedule of Investments |
April 30, 2022 (Unaudited) |
Contracts | Notional Amount | Value | ||||||||||
PURCHASED OPTIONS - 106.77% (a)(b) | ||||||||||||
CALL OPTIONS - 85.82% | ||||||||||||
IWM iShares Russell 2000 ETF, Expires 6/30/2022, Strike Price $1.83 | 2,925 | $ | 54,097,875 | $ | 53,416,670 | |||||||
53,416,670 | ||||||||||||
PUT OPTIONS - 20.95% | ||||||||||||
IWM iShares Russell 2000 ETF, Expires 6/30/2022, Strike Price $229.37 | 2,925 | 54,097,875 | 13,043,334 | |||||||||
13,043,334 | ||||||||||||
TOTAL PURCHASED OPTIONS (Cost $70,994,688) | 66,460,004 | |||||||||||
SHORT TERM INVESTMENTS - 0.20% | Principal Amount | |||||||||||
Money Market Deposit Account - 0.20% | ||||||||||||
U.S. Bank Money Market Deposit Account, 0.130% (c) | $ | 125,775 | 125,775 | |||||||||
TOTAL SHORT TERM INVESTMENTS (Cost $125,775) | 125,775 | |||||||||||
Total Investments (Cost $71,120,463) - 106.97% | 66,585,779 | |||||||||||
Liabilities in Excess of Other Assets - (6.97)% | (4,339,847 | ) | ||||||||||
TOTAL NET ASSETS - 100.00% | $ | 62,245,932 | ||||||||||
Asset Type | % of Net Assets | |||||||||||
Purchased Options | 106.77 | % | ||||||||||
Short Term Investments | 0.20 | |||||||||||
Total Investments | 106.97 | |||||||||||
Liabilities in Excess of Other Assets | (6.97 | ) | ||||||||||
Net Assets | 100.00 | % | ||||||||||
Percentages are stated as a percent of net assets. |
(a) Exchange-Traded. |
(b) Purchased option contracts are held in connection with corresponding option contracts written short. |
(c) The U.S. Bank Money Market Deposit Account (the “MMDA”) is a short-term investment vehicle in which the Fund holds cash balances. The MMDA will bear interest at a variable rate that is determined based on conditions and may change daily and by any amount. The rate shown is as of April 30, 2022. |
INNOVATOR U.S. SMALL CAP POWER BUFFER ETF - JULY
Schedule of Options Written (a) | |||
April 30, 2022 (Unaudited) |
Description | Expiration | Strike Price | Contracts | Notional Amount | Value | |||||||||||||||
Call Options | ||||||||||||||||||||
IWM iShares Russell 2000 ETF | 6/30/2022 | $ | 251.50 | 2,925 | $ | (54,097,875 | ) | $ | - | |||||||||||
- | ||||||||||||||||||||
Put Options | ||||||||||||||||||||
IWM iShares Russell 2000 ETF | 6/30/2022 | 194.96 | 2,925 | (54,097,875 | ) | (4,298,636 | ) | |||||||||||||
(4,298,636 | ) | |||||||||||||||||||
Total Options Written (Premiums Received $4,673,443) | $ | (4,298,636 | ) | |||||||||||||||||
(a) Exchange-Traded. | ||||||||||||||||||||
INNOVATOR U.S. SMALL CAP POWER BUFFER ETF - OCTOBER
Schedule of Investments |
April 30, 2022 (Unaudited) |
Contracts | Notional Amount | Value | ||||||||||
PURCHASED OPTIONS - 106.91% (a)(b) | ||||||||||||
CALL OPTIONS - 89.50% | ||||||||||||
IWM iShares Russell 2000 ETF, Expires 9/30/2022, Strike Price $1.75 | 1,969 | $ | 36,416,655 | $ | 35,835,386 | |||||||
35,835,386 | ||||||||||||
PUT OPTIONS - 17.41% | ||||||||||||
IWM iShares Russell 2000 ETF, Expires 9/30/2022, Strike Price $218.75 | 1,969 | 36,416,655 | 6,971,257 | |||||||||
6,971,257 | ||||||||||||
TOTAL PURCHASED OPTIONS (Cost $46,248,381) | 42,806,643 | |||||||||||
SHORT TERM INVESTMENTS - 0.41% | Principal Amount | |||||||||||
Money Market Deposit Account - 0.41% | ||||||||||||
U.S. Bank Money Market Deposit Account, 0.130% (c) | $ | 162,186 | 162,186 | |||||||||
TOTAL SHORT TERM INVESTMENTS (Cost $162,186) | 162,186 | |||||||||||
Total Investments (Cost $46,410,567) - 107.32% | 42,968,829 | |||||||||||
Liabilities in Excess of Other Assets - (7.32)% | (2,930,796 | ) | ||||||||||
TOTAL NET ASSETS - 100.00% | $ | 40,038,033 | ||||||||||
Asset Type | % of Net Assets | |||||||||||
Purchased Options | 106.91 | % | ||||||||||
Short Term Investments | 0.41 | |||||||||||
Total Investments | 107.32 | |||||||||||
Liabilities in Excess of Other Assets | (7.32 | ) | ||||||||||
Net Assets | 100.00 | % | ||||||||||
Percentages are stated as a percent of net assets. | |||||||||||
(a) Exchange-Traded. | |||||||||||
(b) Purchased option contracts are held in connection with corresponding option contracts written short. | |||||||||||
(c) The U.S. Bank Money Market Deposit Account (the “MMDA”) is a short-term investment vehicle in which the Fund holds cash balances. The MMDA will bear interest at a variable rate that is determined based on conditions and may change daily and by any amount. The rate shown is as of April 30, 2022. | |||||||||||
INNOVATOR U.S. SMALL CAP POWER BUFFER ETF - OCTOBER
Schedule of Options Written (a) | |||
April 30, 2022 (Unaudited) |
Description | Expiration | Strike Price | Contracts | Notional Amount | Value | |||||||||||||||
Call Options | ||||||||||||||||||||
IWM iShares Russell 2000 ETF | 9/30/2022 | $ | 247.34 | 1,969 | $ | (36,416,655 | ) | $ | (60,786 | ) | ||||||||||
(60,786 | ) | |||||||||||||||||||
Put Options | ||||||||||||||||||||
IWM iShares Russell 2000 ETF | 9/30/2022 | 185.94 | 1,969 | (36,416,655 | ) | (2,842,826 | ) | |||||||||||||
(2,842,826 | ) | |||||||||||||||||||
Total Options Written (Premiums Received $3,662,476) | $ | (2,903,612 | ) | |||||||||||||||||
(a) Exchange-Traded. | ||||||||||||||||||||
INNOVATOR DOUBLE STACKER ETF - JANUARY
Schedule of Investments |
April 30, 2022 (Unaudited) |
Contracts | Notional Amount | Value | ||||||||||
PURCHASED OPTIONS - 100.00% (a)(b) | ||||||||||||
CALL OPTIONS - 100.00% | ||||||||||||
QQQ Invesco QQQ Trust Series 1, Expires 12/30/2022, Strike Price $397.86 | 133 | $ | 4,166,225 | $ | 47,861 | |||||||
SPY SPDR S&P 500® Trust ETF, Expires 12/30/2022, Strike Price $3.84 | 111 | 4,573,200 | 4,475,870 | |||||||||
TOTAL PURCHASED OPTIONS (Cost $5,671,027) | 4,523,731 | |||||||||||
SHORT TERM INVESTMENTS - 0.78% | Principal Amount | |||||||||||
Money Market Deposit Account - 0.78% | ||||||||||||
U.S. Bank Money Market Deposit Account, 0.130% (c) | $ | 35,193 | 35,193 | |||||||||
TOTAL SHORT TERM INVESTMENTS (Cost $35,193) | 35,193 | |||||||||||
Total Investments (Cost $5,706,220) - 100.78% | 4,558,924 | |||||||||||
Liabilities in Excess of Other Assets - (0.78)% | (35,104 | ) | ||||||||||
TOTAL NET ASSETS - 100.00% | $ | 4,523,820 | ||||||||||
Asset Type | % of Net Assets | |||||||||||
Purchased Options | 100.00 | % | ||||||||||
Short Term Investments | 0.78 | |||||||||||
Total Investments | 100.78 | |||||||||||
Liabilities in Excess of Other Assets | (0.78 | ) | ||||||||||
Net Assets | 100.00 | % | ||||||||||
Percentages are stated as a percent of net assets. |
(a) Exchange-Traded. |
(b) Purchased option contracts are held in connection with corresponding option contracts written short. |
(c) The U.S. Bank Money Market Deposit Account (the “MMDA”) is a short-term investment vehicle in which the Fund holds cash balances. The MMDA will bear interest at a variable rate that is determined based on conditions and may change daily and by any amount. The rate shown is as of April 30, 2022. |
INNOVATOR DOUBLE STACKER ETF - JANUARY
Schedule of Options Written (a) | |||
April 30, 2022 (Unaudited) |
Description | Expiration | Strike Price | Contracts | Notional Amount | Value | |||||||||||||||
Call Options | ||||||||||||||||||||
QQQ Invesco QQQ Trust Series 1 | 12/30/2022 | $ | 431.67 | 133 | $ | (4,166,225 | ) | $ | (15,977 | ) | ||||||||||
SPY SPDR S&P 500® Trust ETF | 12/30/2022 | 515.33 | 111 | (4,573,200 | ) | (16,069 | ) | |||||||||||||
Total Options Written (Premiums Received $440,408) | $ | (32,046 | ) | |||||||||||||||||
(a) Exchange-Traded. | ||||||||||||||||||||
INNOVATOR DOUBLE STACKER ETF - OCTOBER
Schedule of Investments |
April 30, 2022 (Unaudited) |
Contracts | Notional Amount | Value | ||||||||||
PURCHASED OPTIONS - 101.21% (a)(b) | ||||||||||||
CALL OPTIONS - 101.21% | ||||||||||||
QQQ Invesco QQQ Trust Series 1, Expires 9/30/2022, Strike Price $357.98 | 217 | $ | 6,797,525 | $ | 155,710 | |||||||
SPY SPDR S&P 500® Trust ETF, Expires 9/30/2022, Strike Price $3.47 | 181 | 7,457,200 | 7,337,029 | |||||||||
TOTAL PURCHASED OPTIONS (Cost $8,255,626) | 7,492,739 | |||||||||||
SHORT TERM INVESTMENTS - 0.50% | Principal Amount | |||||||||||
Money Market Deposit Account - 0.50% | ||||||||||||
U.S. Bank Money Market Deposit Account, 0.130% (c) | $ | 37,188 | 37,188 | |||||||||
TOTAL SHORT TERM INVESTMENTS (Cost $37,188) | 37,188 | |||||||||||
Total Investments (Cost $8,292,814) - 101.71% | 7,529,927 | |||||||||||
Liabilities in Excess of Other Assets - (1.71)% | (126,997 | ) | ||||||||||
TOTAL NET ASSETS - 100.00% | $ | 7,402,930 | ||||||||||
Asset Type | % of Net Assets | |||||||||||
Purchased Options | 101.21 | % | ||||||||||
Short Term Investments | 0.50 | |||||||||||
Total Investments | 101.71 | |||||||||||
Liabilities in Excess of Other Assets | (1.71 | ) | ||||||||||
Net Assets | 100.00 | % | ||||||||||
Percentages are stated as a percent of net assets. |
(a) Exchange-Traded. |
(b) Purchased option contracts are held in connection with corresponding option contracts written short. |
(c) The U.S. Bank Money Market Deposit Account (the “MMDA”) is a short-term investment vehicle in which the Fund holds cash balances. The MMDA will bear interest at a variable rate that is determined based on conditions and may change daily and by any amount. The rate shown is as of April 30, 2022. |
INNOVATOR DOUBLE STACKER ETF - OCTOBER
Schedule of Options Written (a) | |||
April 30, 2022 (Unaudited) |
Description | Expiration | Strike Price | Contracts | Notional Amount | Value | |||||||||||||
Call Options | ||||||||||||||||||
QQQ Invesco QQQ Trust Series 1 | 9/30/2022 | $ | 389.78 | 217 | $ | (6,797,525 | ) | $ | (41,289 | ) | ||||||||
SPY SPDR S&P 500® Trust ETF | 9/30/2022 | 467.29 | 181 | (7,457,200 | ) | (81,121 | ) | |||||||||||
Total Options Written (Premiums Received $573,829) | $ | (122,410 | ) | |||||||||||||||
(a) Exchange-Traded. | ||||||||||||||||||
INNOVATOR TRIPLE STACKER ETF – JANUARY
Schedule of Investments |
April 30, 2022 (Unaudited) |
Contracts | Notional Amount | Value | ||||||||||
PURCHASED OPTIONS - 101.41% (a)(b) | ||||||||||||
CALL OPTIONS - 101.41% | ||||||||||||
IWM iShares Russell 2000 ETF, Expires 12/30/2022, Strike Price $222.45 | 568 | $ | 10,505,160 | $ | 208,691 | |||||||
QQQ Invesco QQQ Trust Series 1, Expires 12/30/2022, Strike Price $397.85 | 318 | 9,961,350 | 114,473 | |||||||||
SPY SPDR S&P 500® Trust ETF, Expires 12/30/2022, Strike Price $3.83 | 266 | 10,959,200 | 10,726,222 | |||||||||
TOTAL PURCHASED OPTIONS (Cost $14,677,387) | 11,049,386 | |||||||||||
SHORT TERM INVESTMENTS - 0.89% | Principal Amount | |||||||||||
Money Market Deposit Account - 0.89% | ||||||||||||
U.S. Bank Money Market Deposit Account, 0.130% (c) | $ | 97,533 | 97,533 | |||||||||
TOTAL SHORT TERM INVESTMENTS (Cost $97,533) | 97,533 | |||||||||||
Total Investments (Cost $14,774,920) - 102.30% | 11,146,919 | |||||||||||
Liabilities in Excess of Other Assets - (2.30)% | (250,894 | ) | ||||||||||
TOTAL NET ASSETS - 100.00% | $ | 10,896,025 | ||||||||||
Asset Type | % of Net Assets | |||||||||||
Purchased Options | 101.41 | % | ||||||||||
Short Term Investments | 0.89 | |||||||||||
Total Investments | 102.30 | |||||||||||
Liabilities in Excess of Other Assets | (2.30 | ) | ||||||||||
Net Assets | 100.00 | % | ||||||||||
Percentages are stated as a percent of net assets. |
(a) Exchange-Traded. |
(b) Purchased option contracts are held in connection with corresponding option contracts written short. |
(c) The U.S. Bank Money Market Deposit Account (the “MMDA”) is a short-term investment vehicle in which the Fund holds cash balances. The MMDA will bear interest at a variable rate that is determined based on conditions and may change daily and by any amount. The rate shown is as of April 30, 2022. |
INNOVATOR TRIPLE STACKER ETF – JANUARY
Schedule of Options Written (a) | |||
April 30, 2022 (Unaudited) |
Description | Expiration | Strike Price | Contracts | Notional Amount | Value | |||||||||||||||
Call Options | ||||||||||||||||||||
IWM iShares Russell 2000 ETF | 12/30/2022 | $ | 233.91 | 568 | $ | (10,505,160 | ) | $ | (111,617 | ) | ||||||||||
QQQ Invesco QQQ Trust Series 1 | 12/30/2022 | 418.34 | 318 | (9,961,350 | ) | (58,509 | ) | |||||||||||||
SPY SPDR S&P 500® Trust ETF | 12/30/2022 | 499.42 | 266 | (10,959,200 | ) | (73,027 | ) | |||||||||||||
Total Options Written (Premiums Received $2,211,802) | $ | (243,153 | ) | |||||||||||||||||
(a) Exchange-Traded. | ||||||||||||||||||||
INNOVATOR TRIPLE STACKER ETF – OCTOBER
Schedule of Investments |
April 30, 2022 (Unaudited) |
Contracts | Notional Amount | Value | ||||||||||
PURCHASED OPTIONS - 103.15% (a)(b) | ||||||||||||
CALL OPTIONS - 103.15% | ||||||||||||
IWM iShares Russell 2000 ETF, Expires 9/30/2022, Strike Price $218.75 | 384 | $ | 7,102,080 | $ | 89,362 | |||||||
QQQ Invesco QQQ Trust Series 1, Expires 9/30/2022, Strike Price $357.97 | 234 | 7,330,050 | 167,974 | |||||||||
SPY SPDR S&P 500® Trust ETF, Expires 9/30/2022, Strike Price $3.46 | 196 | 8,075,200 | 7,945,265 | |||||||||
TOTAL PURCHASED OPTIONS (Cost $9,755,146) | 8,202,601 | |||||||||||
SHORT TERM INVESTMENTS - 0.41% | Principal Amount | |||||||||||
Money Market Deposit Account - 0.41% | ||||||||||||
U.S. Bank Money Market Deposit Account, 0.130% (c) | $ | 32,850 | 32,850 | |||||||||
TOTAL SHORT TERM INVESTMENTS (Cost $32,850) | 32,850 | |||||||||||
Total Investments (Cost $9,787,996) - 103.56% | 8,235,451 | |||||||||||
Liabilities in Excess of Other Assets - (3.56)% | (283,083 | ) | ||||||||||
TOTAL NET ASSETS - 100.00% | $ | 7,952,368 | ||||||||||
Asset Type | % of Net Assets | |||||||||||
Purchased Options | 103.15 | % | ||||||||||
Short Term Investments | 0.41 | |||||||||||
Total Investments | 103.56 | |||||||||||
Liabilities in Excess of Other Assets | (3.56 | ) | ||||||||||
Net Assets | 100.00 | % | ||||||||||
Percentages are stated as a percent of net assets. | |||||||||||
(a) Exchange-Traded. | |||||||||||
(b) Purchased option contracts are held in connection with corresponding option contracts written short. | |||||||||||
(c) The U.S. Bank Money Market Deposit Account (the “MMDA”) is a short-term investment vehicle in which the Fund holds cash balances. The MMDA will bear interest at a variable rate that is determined based on conditions and may change daily and by any amount. The rate shown is as of April 30, 2022. | |||||||||||
INNOVATOR TRIPLE STACKER ETF – OCTOBER
Schedule of Options Written (a) | |||
April 30, 2022 (Unaudited) |
Description | Expiration | Strike Price | Contracts | Notional Amount | Value | |||||||||||||||
Call Options | ||||||||||||||||||||
IWM iShares Russell 2000 ETF | 9/30/2022 | $ | 230.87 | 384 | $ | (7,102,080 | ) | $ | (38,002 | ) | ||||||||||
QQQ Invesco QQQ Trust Series 1 | 9/30/2022 | 377.79 | 234 | (7,330,050 | ) | (74,531 | ) | |||||||||||||
SPY SPDR S&P 500® Trust ETF | 9/30/2022 | 452.91 | 196 | (8,075,200 | ) | (164,631 | ) | |||||||||||||
Total Options Written (Premiums Received $1,588,335) | $ | (277,164 | ) | |||||||||||||||||
(a) Exchange-Traded. | ||||||||||||||||||||
INNOVATOR DOUBLE STACKER 9 BUFFER ETF - JANUARY
Schedule of Investments |
April 30, 2022 (Unaudited) |
Contracts | Notional Amount | Value | ||||||||||
PURCHASED OPTIONS - 109.91% (a)(b) | ||||||||||||
CALL OPTIONS - 94.42% | ||||||||||||
QQQ Invesco QQQ Trust Series 1, Expires 12/30/2022, Strike Price $397.84 | 320 | $ | 10,024,000 | $ | 115,234 | |||||||
SPY SPDR S&P 500® Trust ETF, Expires 12/30/2022, Strike Price $3.77 | 268 | 11,041,600 | 10,808,454 | |||||||||
10,923,688 | ||||||||||||
PUT OPTIONS - 15.49% | ||||||||||||
SPY SPDR S&P 500® Trust ETF, Expires 12/30/2022, Strike Price $474.95 | 268 | 11,041,600 | 1,791,909 | |||||||||
1,791,909 | ||||||||||||
TOTAL PURCHASED OPTIONS (Cost $14,585,378) | 12,715,597 | |||||||||||
SHORT TERM INVESTMENTS - 0.74% | Principal Amount | |||||||||||
Money Market Deposit Account - 0.74% | ||||||||||||
U.S. Bank Money Market Deposit Account, 0.130% (c) | $ | 85,873 | 85,873 | |||||||||
TOTAL SHORT TERM INVESTMENTS (Cost $85,873) | 85,873 | |||||||||||
Total Investments (Cost $14,671,251) - 110.65% | 12,801,470 | |||||||||||
Liabilities in Excess of Other Assets - (10.65)% | (1,231,960 | ) | ||||||||||
TOTAL NET ASSETS - 100.00% | $ | 11,569,510 | ||||||||||
Asset Type | % of Net Assets | |||||||||||
Purchased Options | 109.91 | % | ||||||||||
Short Term Investments | 0.74 | |||||||||||
Total Investments | 110.65 | |||||||||||
Liabilities in Excess of Other Assets | (10.65 | ) | ||||||||||
Net Assets | 100.00 | % | ||||||||||
Percentages are stated as a percent of net assets. |
(a) Exchange-Traded. |
(b) Purchased option contracts are held in connection with corresponding option contracts written short. |
(c) The U.S. Bank Money Market Deposit Account (the “MMDA”) is a short-term investment vehicle in which the Fund holds cash balances. The MMDA will bear interest at a variable rate that is determined based on conditions and may change daily and by any amount. The rate shown is as of April 30, 2022. |
INNOVATOR DOUBLE STACKER 9 BUFFER ETF - JANUARY
Schedule of Options Written (a) | |||
April 30, 2022 (Unaudited) |
Description | Expiration | Strike Price | Contracts | Notional Amount | Value | |||||||||||||||
Call Options | ||||||||||||||||||||
QQQ Invesco QQQ Trust Series 1 | 12/30/2022 | $ | 418.94 | 320 | $ | (10,024,000 | ) | $ | (57,718 | ) | ||||||||||
SPY SPDR S&P 500® Trust ETF | 12/30/2022 | 500.13 | 268 | (11,041,600 | ) | (72,649 | ) | |||||||||||||
(130,367 | ) | |||||||||||||||||||
Put Options | ||||||||||||||||||||
SPY SPDR S&P 500® Trust ETF | 12/30/2022 | 432.20 | 268 | (11,041,600 | ) | (1,093,617 | ) | |||||||||||||
(1,093,617 | ) | |||||||||||||||||||
Total Options Written (Premiums Received $2,084,977) | $ | (1,223,984 | ) | |||||||||||||||||
(a) Exchange-Traded. | ||||||||||||||||||||
INNOVATOR DOUBLE STACKER 9 BUFFER ETF - OCTOBER
Schedule of Investments |
April 30, 2022 (Unaudited) |
Contracts | Notional Amount | Value | ||||||||||
PURCHASED OPTIONS - 107.05% (a)(b) | ||||||||||||
CALL OPTIONS - 98.89% | ||||||||||||
QQQ Invesco QQQ Trust Series 1, Expires 9/30/2022, Strike Price $357.95 | 505 | $ | 15,819,125 | $ | 362,791 | |||||||
SPY SPDR S&P 500® Trust ETF, Expires 9/30/2022, Strike Price $3.41 | 421 | 17,345,200 | 17,068,195 | |||||||||
17,430,986 | ||||||||||||
PUT OPTIONS - 8.16% | ||||||||||||
SPY SPDR S&P 500® Trust ETF, Expires 9/30/2022, Strike Price $429.13 | 421 | 17,345,200 | 1,439,121 | |||||||||
1,439,121 | ||||||||||||
TOTAL PURCHASED OPTIONS (Cost $20,897,932) | 18,870,107 | |||||||||||
SHORT TERM INVESTMENTS - 0.59% | Principal Amount | |||||||||||
Money Market Deposit Account - 0.59% | ||||||||||||
U.S. Bank Money Market Deposit Account, 0.130% (c) | $ | 103,482 | 103,482 | |||||||||
TOTAL SHORT TERM INVESTMENTS (Cost $103,482) | 103,482 | |||||||||||
Total Investments (Cost $21,001,414) - 107.64% | 18,973,589 | |||||||||||
Liabilities in Excess of Other Assets - (7.64)% | (1,346,828 | ) | ||||||||||
TOTAL NET ASSETS - 100.00% | $ | 17,626,761 | ||||||||||
Asset Type | % of Net Assets | |||||||||||
Purchased Options | 107.05 | % | ||||||||||
Short Term Investments | 0.59 | |||||||||||
Total Investments | 107.64 | |||||||||||
Liabilities in Excess of Other Assets | (7.64 | ) | ||||||||||
Net Assets | 100.00 | % | ||||||||||
Percentages are stated as a percent of net assets. | |||||||||||
(a) Exchange-Traded. | |||||||||||
(b) Purchased option contracts are held in connection with corresponding option contracts written short. | |||||||||||
(c) The U.S. Bank Money Market Deposit Account (the “MMDA”) is a short-term investment vehicle in which the Fund holds cash balances. The MMDA will bear interest at a variable rate that is determined based on conditions and may change daily and by any amount. The rate shown is as of April 30, 2022. | |||||||||||
INNOVATOR DOUBLE STACKER 9 BUFFER ETF - OCTOBER
Schedule of Options Written (a) | |||
April 30, 2022 (Unaudited) |
Description | Expiration | Strike Price | Contracts | Notional Amount | Value | |||||||||||||||
Call Options | ||||||||||||||||||||
QQQ Invesco QQQ Trust Series 1 | 9/30/2022 | $ | 377.36 | 505 | $ | (15,819,125 | ) | $ | (163,947 | ) | ||||||||||
SPY SPDR S&P 500® Trust ETF | 9/30/2022 | 452.40 | 421 | (17,345,200 | ) | (360,868 | ) | |||||||||||||
(524,815 | ) | |||||||||||||||||||
Put Options | ||||||||||||||||||||
SPY SPDR S&P 500® Trust ETF | 9/30/2022 | 390.50 | 421 | (17,345,200 | ) | (810,175 | ) | |||||||||||||
(810,175 | ) | |||||||||||||||||||
Total Options Written (Premiums Received $3,097,855) | $ | (1,334,990 | ) | |||||||||||||||||
(a) Exchange-Traded. | ||||||||||||||||||||
INNOVATOR U.S. EQUITY ACCELERATED ETF – JANUARY
Schedule of Investments | ||||
April 30, 2022 (Unaudited) |
Contracts | Notional Amount | Value | ||||||||||
PURCHASED OPTIONS - 100.01% (a)(b) | ||||||||||||
CALL OPTIONS - 100.01% | ||||||||||||
SPY SPDR S&P 500® Trust ETF, Expires 12/30/2022, Strike Price $474.95 | 104 | $ | 4,284,800 | $ | 71,265 | |||||||
SPY SPDR S&P 500® Trust ETF, Expires 12/30/2022, Strike Price $3.74 | 104 | 4,284,800 | 4,194,633 | |||||||||
TOTAL PURCHASED OPTIONS (Cost $4,834,903) | 4,265,898 | |||||||||||
SHORT TERM INVESTMENTS - 0.77% | Principal Amount | |||||||||||
Money Market Deposit Account - 0.77% | ||||||||||||
U.S. Bank Money Market Deposit Account, 0.130% (c) | $ | 33,109 | 33,109 | |||||||||
TOTAL SHORT TERM INVESTMENTS (Cost $33,109) | 33,109 | |||||||||||
Total Investments (Cost $4,868,012) - 100.78% | 4,299,007 | |||||||||||
Liabilities in Excess of Other Assets - (0.78)% | (33,393 | ) | ||||||||||
TOTAL NET ASSETS - 100.00% | $ | 4,265,614 | ||||||||||
Asset Type | % of Net Assets | |||||||||||
Purchased Options | 100.01 | % | ||||||||||
Short Term Investments | 0.77 | |||||||||||
Total Investments | 100.78 | |||||||||||
Liabilities in Excess of Other Assets | (0.78 | ) | ||||||||||
Net Assets | 100.00 | % | ||||||||||
Percentages are stated as a percent of net assets. |
(a) Exchange-Traded. |
(b) Purchased option contracts are held in connection with corresponding option contracts written short. |
(c) The U.S. Bank Money Market Deposit Account (the “MMDA”) is a short-term investment vehicle in which the Fund holds cash balances. The MMDA will bear interest at a variable rate that is determined based on conditions and may change daily and by any amount. The rate shown is as of April 30, 2022. |
INNOVATOR U.S. EQUITY ACCELERATED ETF – JANUARY
Schedule of Options Written (a) | |||
April 30, 2022 (Unaudited) |
Description | Expiration | Strike Price | Contracts | Notional Amount | Value | |||||||||||||||
Call Options | ||||||||||||||||||||
SPY SPDR S&P 500® Trust ETF | 12/30/2022 | $ | 515.05 | 208 | $ | (8,569,600 | ) | $ | (30,405 | ) | ||||||||||
Total Options Written (Premiums Received $152,714) | $ | (30,405 | ) | |||||||||||||||||
(a) Exchange-Traded. | ||||||||||||||||||||
INNOVATOR U.S. EQUITY ACCELERATED ETF – APRIL
Schedule of Investments | |||||
April 30, 2022 (Unaudited) |
Contracts | Notional Amount | Value | ||||||||||
PURCHASED OPTIONS - 102.16% (a)(b) | ||||||||||||
CALL OPTIONS - 102.16% | ||||||||||||
SPY SPDR S&P 500® Trust ETF, Expires 3/31/2023, Strike Price $451.63 | 163 | $ | 6,715,600 | $ | 330,896 | |||||||
SPY SPDR S&P 500® Trust ETF, Expires 3/31/2023, Strike Price $3.57 | 163 | 6,715,600 | 6,552,838 | |||||||||
TOTAL PURCHASED OPTIONS (Cost $7,858,961) | 6,883,734 | |||||||||||
SHORT TERM INVESTMENTS - 1.04% | Principal Amount | |||||||||||
Money Market Deposit Account - 1.04% | ||||||||||||
U.S. Bank Money Market Deposit Account, 0.130% (c) | $ | 69,937 | 69,937 | |||||||||
TOTAL SHORT TERM INVESTMENTS (Cost $69,937) | 69,937 | |||||||||||
Total Investments (Cost $7,928,898) - 103.20% | 6,953,671 | |||||||||||
Liabilities in Excess of Other Assets - (3.20)% | (215,419 | ) | ||||||||||
TOTAL NET ASSETS - 100.00% | $ | 6,738,252 | ||||||||||
Asset Type | % of Net Assets | |||||||||||
Purchased Options | 102.16 | % | ||||||||||
Short Term Investments | 1.04 | |||||||||||
Total Investments | 103.20 | |||||||||||
Liabilities in Excess of Other Assets | (3.20 | ) | ||||||||||
Net Assets | 100.00 | % | ||||||||||
Percentages are stated as a percent of net assets. |
(a) Exchange-Traded. |
(b) Purchased option contracts are held in connection with corresponding option contracts written short. |
(c) The U.S. Bank Money Market Deposit Account (the “MMDA”) is a short-term investment vehicle in which the Fund holds cash balances. The MMDA will bear interest at a variable rate that is determined based on conditions and may change daily and by any amount. The rate shown is as of April 30, 2022. |
INNOVATOR U.S. EQUITY ACCELERATED ETF – APRIL
Schedule of Options Written (a) | |||
April 30, 2022 (Unaudited) |
Description | Expiration | Strike Price | Contracts | Notional Amount | Value | |||||||||||||||
Call Options | ||||||||||||||||||||
SPY SPDR S&P 500® Trust ETF | 3/31/2023 | $ | 493.64 | 326 | $ | (13,431,200 | ) | $ | (210,948 | ) | ||||||||||
Total Options Written (Premiums Received $555,549) | $ | (210,948 | ) | |||||||||||||||||
(a) Exchange-Traded. | ||||||||||||||||||||
INNOVATOR U.S. EQUITY ACCELERATED ETF – JULY
Schedule of Investments | |||||
April 30, 2022 (Unaudited) |
Contracts | Notional Amount | Value | ||||||||||
PURCHASED OPTIONS - 99.42% (a)(b) | ||||||||||||
CALL OPTIONS - 99.42% | ||||||||||||
SPY SPDR S&P 500® Trust ETF, Expires 6/30/2022, Strike Price $428.05 | 119 | $ | 4,902,800 | $ | 118,776 | |||||||
SPY SPDR S&P 500® Trust ETF, Expires 6/30/2022, Strike Price $3.40 | 119 | 4,902,800 | 4,843,536 | |||||||||
TOTAL PURCHASED OPTIONS (Cost $5,715,188) | 4,962,312 | |||||||||||
SHORT TERM INVESTMENTS - 1.13% | Principal Amount | |||||||||||
Money Market Deposit Account - 1.13% | ||||||||||||
U.S. Bank Money Market Deposit Account, 0.130% (c) | $ | 56,521 | 56,521 | |||||||||
TOTAL SHORT TERM INVESTMENTS (Cost $56,521) | 56,521 | |||||||||||
Total Investments (Cost $5,771,709) - 100.55% | 5,018,833 | |||||||||||
Liabilities in Excess of Other Assets - (0.55)% | (27,575 | ) | ||||||||||
TOTAL NET ASSETS - 100.00% | $ | 4,991,258 | ||||||||||
Asset Type | % of Net Assets | |||||||||||
Purchased Options | 99.42 | % | ||||||||||
Short Term Investments | 1.13 | |||||||||||
Total Investments | 100.55 | |||||||||||
Liabilities in Excess of Other Assets | (0.55 | ) | ||||||||||
Net Assets | 100.00 | % | ||||||||||
Percentages are stated as a percent of net assets. | |||||||||||
(a) Exchange-Traded. | |||||||||||
(b) Purchased option contracts are held in connection with corresponding option contracts written short. | |||||||||||
(c) The U.S. Bank Money Market Deposit Account (the “MMDA”) is a short-term investment vehicle in which the Fund holds cash balances. The MMDA will bear interest at a variable rate that is determined based on conditions and may change daily and by any amount. The rate shown is as of April 30, 2022. | |||||||||||
INNOVATOR U.S. EQUITY ACCELERATED ETF – JULY
Schedule of Options Written (a) | |||
April 30, 2022 (Unaudited) |
Description | Expiration | Strike Price | Contracts | Notional Amount | Value | |||||||||||||||
Call Options | ||||||||||||||||||||
SPY SPDR S&P 500® Trust ETF | 6/30/2022 | $ | 462.30 | 238 | $ | (9,805,600 | ) | $ | (24,072 | ) | ||||||||||
Total Options Written (Premiums Received $479,180) | $ | (24,072 | ) | |||||||||||||||||
(a) Exchange-Traded. | ||||||||||||||||||||
INNOVATOR U.S. EQUITY ACCELERATED ETF – OCTOBER
Schedule of Investments | |||||
April 30, 2022 (Unaudited) |
Contracts | Notional Amount | Value | ||||||||||
PURCHASED OPTIONS - 101.89% (a)(b) | ||||||||||||
CALL OPTIONS - 101.89% | ||||||||||||
SPY SPDR S&P 500® Trust ETF, Expires 9/30/2022, Strike Price $429.13 | 42 | $ | 1,730,400 | $ | 78,159 | |||||||
SPY SPDR S&P 500® Trust ETF, Expires 9/30/2022, Strike Price $3.38 | 42 | 1,730,400 | 1,702,891 | |||||||||
TOTAL PURCHASED OPTIONS (Cost $1,922,683) | 1,781,050 | |||||||||||
SHORT TERM INVESTMENTS - 0.43% | Principal Amount | |||||||||||
Money Market Deposit Account - 0.43% | ||||||||||||
U.S. Bank Money Market Deposit Account, 0.130% (c) | $ | 7,607 | 7,607 | |||||||||
TOTAL SHORT TERM INVESTMENTS (Cost $7,607) | 7,607 | |||||||||||
Total Investments (Cost $1,930,290) - 102.32% | 1,788,657 | |||||||||||
Liabilities in Excess of Other Assets - (2.32)% | (40,597 | ) | ||||||||||
TOTAL NET ASSETS - 100.00% | $ | 1,748,060 | ||||||||||
Asset Type | % of Net Assets | |||||||||||
Purchased Options | 101.89 | % | ||||||||||
Short Term Investments | 0.43 | |||||||||||
Total Investments | 102.32 | |||||||||||
Liabilities in Excess of Other Assets | (2.32 | ) | ||||||||||
Net Assets | 100.00 | % | ||||||||||
Percentages are stated as a percent of net assets. |
(a) Exchange-Traded. |
(b) Purchased option contracts are held in connection with corresponding option contracts written short. |
(c) The U.S. Bank Money Market Deposit Account (the “MMDA”) is a short-term investment vehicle in which the Fund holds cash balances. The MMDA will bear interest at a variable rate that is determined based on conditions and may change daily and by any amount. The rate shown is as of April 30, 2022. |
INNOVATOR U.S. EQUITY ACCELERATED ETF – OCTOBER
Schedule of Options Written (a) | |||
April 30, 2022 (Unaudited) |
Description | Expiration | Strike Price | Contracts | Notional Amount | Value | |||||||||||||||
Call Options | ||||||||||||||||||||
SPY SPDR S&P 500® Trust ETF | 9/30/2022 | $ | 466.26 | 84 | $ | (3,460,800 | ) | $ | (39,484 | ) | ||||||||||
Total Options Written (Premiums Received $124,927) | $ | (39,484 | ) | |||||||||||||||||
(a) Exchange-Traded. | ||||||||||||||||||||
INNOVATOR U.S. EQUITY ACCELERATED PLUS ETF – JANUARY
Schedule of Investments | |||||
April 30, 2022 (Unaudited) |
Contracts | Notional Amount | Value | ||||||||||
PURCHASED OPTIONS - 101.30% (a)(b) | ||||||||||||
CALL OPTIONS - 101.30% | ||||||||||||
SPY SPDR S&P 500® Trust ETF, Expires 12/30/2022, Strike Price $474.96 | 312 | $ | 12,854,400 | $ | 213,721 | |||||||
SPY SPDR S&P 500® Trust ETF, Expires 12/30/2022, Strike Price $3.76 | 156 | 6,427,200 | 6,291,642 | |||||||||
TOTAL PURCHASED OPTIONS (Cost $8,052,050) | 6,505,363 | |||||||||||
SHORT TERM INVESTMENTS - 0.77% | Principal Amount | |||||||||||
Money Market Deposit Account - 0.77% | ||||||||||||
U.S. Bank Money Market Deposit Account, 0.130% (c) | $ | 49,248 | 49,248 | |||||||||
TOTAL SHORT TERM INVESTMENTS (Cost $49,248) | 49,248 | |||||||||||
Total Investments (Cost $8,101,298) - 102.07% | 6,554,611 | |||||||||||
Liabilities in Excess of Other Assets - (2.07)% | (132,892 | ) | ||||||||||
TOTAL NET ASSETS - 100.00% | $ | 6,421,719 | ||||||||||
Asset Type | % of Net Assets | |||||||||||
Purchased Options | 101.30 | % | ||||||||||
Short Term Investments | 0.77 | |||||||||||
Total Investments | 102.07 | |||||||||||
Liabilities in Excess of Other Assets | (2.07 | ) | ||||||||||
Net Assets | 100.00 | % | ||||||||||
Percentages are stated as a percent of net assets. |
(a) Exchange-Traded. |
(b) Purchased option contracts are held in connection with corresponding option contracts written short. |
(c) The U.S. Bank Money Market Deposit Account (the “MMDA”) is a short-term investment vehicle in which the Fund holds cash balances. The MMDA will bear interest at a variable rate that is determined based on conditions and may change daily and by any amount. The rate shown is as of April 30, 2022. |
INNOVATOR U.S. EQUITY ACCELERATED PLUS ETF – JANUARY
Schedule of Options Written (a) | |||
April 30, 2022 (Unaudited) |
Description | Expiration | Strike Price | Contracts | Notional Amount | Value | ||||||||||||||
Call Options | |||||||||||||||||||
SPY SPDR S&P 500® Trust ETF | 12/30/2022 | $ | 499.47 | 468 | $ | (19,281,600 | ) | $ | (128,514 | ) | |||||||||
Total Options Written (Premiums Received $754,041) | $ | (128,514 | ) | ||||||||||||||||
(a) Exchange-Traded. | |||||||||||||||||||
INNOVATOR U.S. EQUITY ACCELERATED PLUS ETF – APRIL
Schedule of Investments | |||||
April 30, 2022 (Unaudited) |
Contracts | Notional Amount | Value | ||||||||||
PURCHASED OPTIONS - 106.42% (a)(b) | ||||||||||||
CALL OPTIONS - 106.42% | ||||||||||||
SPY SPDR S&P 500® Trust ETF, Expires 3/31/2023, Strike Price $451.64 | 678 | $ | 27,933,600 | $ | 1,375,450 | |||||||
SPY SPDR S&P 500® Trust ETF, Expires 3/31/2023, Strike Price $3.59 | 339 | 13,966,800 | 13,627,633 | |||||||||
TOTAL PURCHASED OPTIONS (Cost $17,677,091) | 15,003,083 | |||||||||||
SHORT TERM INVESTMENTS - 1.07% | Principal Amount | |||||||||||
Money Market Deposit Account - 1.07% | ||||||||||||
U.S. Bank Money Market Deposit Account, 0.130% (c) | $ | 151,024 | 151,024 | |||||||||
TOTAL SHORT TERM INVESTMENTS (Cost $151,024) | 151,024 | |||||||||||
Total Investments (Cost $17,828,115) - 107.49% | 15,154,107 | |||||||||||
Liabilities in Excess of Other Assets - (7.49)% | (1,055,398 | ) | ||||||||||
TOTAL NET ASSETS - 100.00% | $ | 14,098,709 | ||||||||||
Asset Type | % of Net Assets | |||||||||||
Purchased Options | 106.42 | % | ||||||||||
Short Term Investments | 1.07 | |||||||||||
Total Investments | 107.49 | |||||||||||
Liabilities in Excess of Other Assets | (7.49 | ) | ||||||||||
Net Assets | 100.00 | % | ||||||||||
Percentages are stated as a percent of net assets. |
(a) Exchange-Traded. |
(b) Purchased option contracts are held in connection with corresponding option contracts written short. |
(c) The U.S. Bank Money Market Deposit Account (the “MMDA”) is a short-term investment vehicle in which the Fund holds cash balances. The MMDA will bear interest at a variable rate that is determined based on conditions and may change daily and by any amount. The rate shown is as of April 30, 2022. |
INNOVATOR U.S. EQUITY ACCELERATED PLUS ETF – APRIL
Schedule of Options Written (a) | |||
April 30, 2022 (Unaudited) |
Description | Expiration | Strike Price | Contracts | Notional Amount | Value | |||||||||||||||
Call Options | ||||||||||||||||||||
SPY SPDR S&P 500® Trust ETF | 3/31/2023 | $ | 477.97 | 1,017 | $ | (41,900,400 | ) | $ | (1,045,684 | ) | ||||||||||
Total Options Written (Premiums Received $2,477,211) | $ | (1,045,684 | ) | |||||||||||||||||
(a) Exchange-Traded. | ||||||||||||||||||||
INNOVATOR U.S. EQUITY ACCELERATED PLUS ETF – JULY
Schedule of Investments | |||||
April 30, 2022 (Unaudited) |
Contracts | Notional Amount | Value | ||||||||||
PURCHASED OPTIONS - 101.59% (a)(b) | ||||||||||||
CALL OPTIONS - 101.59% | ||||||||||||
SPY SPDR S&P 500® Trust ETF, Expires 6/30/2022, Strike Price $428.06 | 658 | $ | 27,109,600 | $ | 656,463 | |||||||
SPY SPDR S&P 500® Trust ETF, Expires 6/30/2022, Strike Price $3.45 | 329 | 13,554,800 | 13,389,307 | |||||||||
TOTAL PURCHASED OPTIONS (Cost $15,903,304) | 14,045,770 | |||||||||||
SHORT TERM INVESTMENTS - 0.50% | Principal Amount | |||||||||||
Money Market Deposit Account - 0.50% | ||||||||||||
U.S. Bank Money Market Deposit Account, 0.130% (c) | $ | 69,452 | 69,452 | |||||||||
TOTAL SHORT TERM INVESTMENTS (Cost $69,452) | 69,452 | |||||||||||
Total Investments (Cost $15,972,756) - 102.09% | 14,115,222 | |||||||||||
Liabilities in Excess of Other Assets - (2.09)% | (289,067 | ) | ||||||||||
TOTAL NET ASSETS - 100.00% | $ | 13,826,155 | ||||||||||
Asset Type | % of Net Assets | |||||||||||
Purchased Options | 101.59 | % | ||||||||||
Short Term Investments | 0.50 | |||||||||||
Total Investments | 102.09 | |||||||||||
Liabilities in Excess of Other Assets | (2.09 | ) | ||||||||||
Net Assets | 100.00 | % | ||||||||||
Percentages are stated as a percent of net assets. |
(a) Exchange-Traded. |
(b) Purchased option contracts are held in connection with corresponding option contracts written short. |
(c) The U.S. Bank Money Market Deposit Account (the “MMDA”) is a short-term investment vehicle in which the Fund holds cash balances. The MMDA will bear interest at a variable rate that is determined based on conditions and may change daily and by any amount. The rate shown is as of April 30, 2022. |
INNOVATOR U.S. EQUITY ACCELERATED PLUS ETF – JULY
Schedule of Options Written (a) | |||
April 30, 2022 (Unaudited) |
Description | Expiration | Strike Price | Contracts | Notional Amount | Value | |||||||||||||||
Call Options | ||||||||||||||||||||
SPY SPDR S&P 500® Trust ETF | 6/30/2022 | $ | 449.16 | 987 | $ | (40,664,400 | ) | $ | (279,662 | ) | ||||||||||
Total Options Written (Premiums Received $1,709,188) | $ | (279,662 | ) | |||||||||||||||||
(a) Exchange-Traded. | ||||||||||||||||||||
INNOVATOR U.S. EQUITY ACCELERATED PLUS ETF – OCTOBER
Schedule of Investments | |||||
April 30, 2022 (Unaudited) |
Contracts | Notional Amount | Value | ||||||||||
PURCHASED OPTIONS - 105.65% (a)(b) | ||||||||||||
CALL OPTIONS - 105.65% | ||||||||||||
SPY SPDR S&P 500® Trust ETF, Expires 9/30/2022, Strike Price $429.14 | 448 | $ | 18,457,600 | $ | 833,470 | |||||||
SPY SPDR S&P 500® Trust ETF, Expires 9/30/2022, Strike Price $3.39 | 224 | 9,228,800 | 9,081,860 | |||||||||
TOTAL PURCHASED OPTIONS (Cost $11,666,223) | 9,915,330 | |||||||||||
SHORT TERM INVESTMENTS - 0.47% | Principal Amount | |||||||||||
Money Market Deposit Account - 0.47% | ||||||||||||
U.S. Bank Money Market Deposit Account, 0.130% (c) | $ | 44,101 | 44,101 | |||||||||
TOTAL SHORT TERM INVESTMENTS (Cost $44,101) | 44,101 | |||||||||||
Total Investments (Cost $11,710,324) - 106.12% | 9,959,431 | |||||||||||
Liabilities in Excess of Other Assets - (6.12)% | (574,310 | ) | ||||||||||
TOTAL NET ASSETS - 100.00% | $ | 9,385,121 | ||||||||||
Asset Type | % of Net Assets | |||||||||||
Purchased Options | 105.65 | % | ||||||||||
Short Term Investments | 0.47 | |||||||||||
Total Investments | 106.12 | |||||||||||
Liabilities in Excess of Other Assets | (6.12 | ) | ||||||||||
Net Assets | 100.00 | % | ||||||||||
Percentages are stated as a percent of net assets. |
(a) Exchange-Traded. |
(b) Purchased option contracts are held in connection with corresponding option contracts written short. |
(c) The U.S. Bank Money Market Deposit Account (the “MMDA”) is a short-term investment vehicle in which the Fund holds cash balances. The MMDA will bear interest at a variable rate that is determined based on conditions and may change daily and by any amount. The rate shown is as of April 30, 2022. |
INNOVATOR U.S. EQUITY ACCELERATED PLUS ETF – OCTOBER
Schedule of Options Written (a) | |||
April 30, 2022 (Unaudited) |
Description | Expiration | Strike Price | Contracts | Notional Amount | Value | |||||||||||||||
Call Options | ||||||||||||||||||||
SPY SPDR S&P 500® Trust ETF | 9/30/2022 | $ | 452.75 | 672 | $ | (27,686,400 | ) | $ | (568,045 | ) | ||||||||||
Total Options Written (Premiums Received $1,771,514) | $ | (568,045 | ) | |||||||||||||||||
(a) Exchange-Traded. | ||||||||||||||||||||
INNOVATOR U.S. EQUITY ACCELERATED 9 BUFFER ETF – JANUARY
Schedule of Investments | ||||
April 30, 2022 (Unaudited) |
Contracts | Notional Amount | Value | ||||||||||
PURCHASED OPTIONS - 110.04% (a)(b) | ||||||||||||
CALL OPTIONS - 94.61% | ||||||||||||
SPY SPDR S&P 500® Trust ETF, Expires 12/30/2022, Strike Price $474.97 | 260 | $ | 10,712,000 | $ | 178,037 | |||||||
SPY SPDR S&P 500® Trust ETF, Expires 12/30/2022, Strike Price $3.86 | 260 | 10,712,000 | 10,483,508 | |||||||||
10,661,545 | ||||||||||||
PUT OPTIONS - 15.43% | ||||||||||||
SPY SPDR S&P 500® Trust ETF, Expires 12/30/2022, Strike Price $474.99 | 260 | 10,712,000 | 1,739,206 | |||||||||
1,739,206 | ||||||||||||
TOTAL PURCHASED OPTIONS (Cost $13,839,000) | 12,400,751 | |||||||||||
SHORT TERM INVESTMENTS - 0.70% | Principal Amount | |||||||||||
Money Market Deposit Account - 0.70% | ||||||||||||
U.S. Bank Money Market Deposit Account, 0.130% (c) | $ | 78,775 | 78,775 | |||||||||
TOTAL SHORT TERM INVESTMENTS (Cost $78,775) | 78,775 | |||||||||||
Total Investments (Cost $13,917,775) - 110.74% | 12,479,526 | |||||||||||
Liabilities in Excess of Other Assets - (10.74)% | (1,210,359 | ) | ||||||||||
TOTAL NET ASSETS - 100.00% | $ | 11,269,167 | ||||||||||
Asset Type | % of Net Assets | |||||||||||
Purchased Options | 110.04 | % | ||||||||||
Short Term Investments | 0.70 | |||||||||||
Total Investments | 110.74 | |||||||||||
Liabilities in Excess of Other Assets | (10.74 | ) | ||||||||||
Net Assets | 100.00 | % | ||||||||||
Percentages are stated as a percent of net assets. |
(a) Exchange-Traded. |
(b) Purchased option contracts are held in connection with corresponding option contracts written short. |
(c) The U.S. Bank Money Market Deposit Account (the “MMDA”) is a short-term investment vehicle in which the Fund holds cash balances. The MMDA will bear interest at a variable rate that is determined based on conditions and may change daily and by any amount. The rate shown is as of April 30, 2022. |
INNOVATOR U.S. EQUITY ACCELERATED 9 BUFFER ETF – JANUARY
Schedule of Options Written (a) | |||
April 30, 2022 (Unaudited) |
Description | Expiration | Strike Price | Contracts | Notional Amount | Value | |||||||||||||||
Call Options | ||||||||||||||||||||
SPY SPDR S&P 500® Trust ETF | 12/30/2022 | $ | 500.09 | 520 | $ | (21,424,000 | ) | $ | (141,282 | ) | ||||||||||
(141,282 | ) | |||||||||||||||||||
Put Options | ||||||||||||||||||||
SPY SPDR S&P 500® Trust ETF | 12/30/2022 | 432.23 | 260 | (10,712,000 | ) | (1,061,347 | ) | |||||||||||||
(1,061,347 | ) | |||||||||||||||||||
Total Options Written (Premiums Received $1,453,438) | $ | (1,202,629 | ) | |||||||||||||||||
(a) Exchange-Traded. | ||||||||||||||||||||
INNOVATOR U.S. EQUITY ACCELERATED 9 BUFFER ETF – APRIL
Schedule of Investments | ||||
April 30, 2022 (Unaudited) |
Contracts | Notional Amount | Value | ||||||||||
PURCHASED OPTIONS - 112.18% (a)(b) | ||||||||||||
CALL OPTIONS - 99.36% | ||||||||||||
SPY SPDR S&P 500® Trust ETF, Expires 3/31/2023, Strike Price $451.65 | 537 | $ | 22,124,400 | $ | 1,088,680 | |||||||
SPY SPDR S&P 500® Trust ETF, Expires 3/31/2023, Strike Price $3.64 | 537 | 22,124,400 | 21,584,516 | |||||||||
22,673,196 | ||||||||||||
PUT OPTIONS - 12.82% | ||||||||||||
SPY SPDR S&P 500® Trust ETF, Expires 3/31/2023, Strike Price $451.67 | 537 | 22,124,400 | 2,925,917 | |||||||||
2,925,917 | ||||||||||||
TOTAL PURCHASED OPTIONS (Cost $27,678,916) | 25,599,113 | |||||||||||
SHORT TERM INVESTMENTS - 0.85% | Principal Amount | |||||||||||
Money Market Deposit Account - 0.85% | ||||||||||||
U.S. Bank Money Market Deposit Account, 0.130% (c) | $ | 194,913 | 194,913 | |||||||||
TOTAL SHORT TERM INVESTMENTS (Cost $194,913) | 194,913 | |||||||||||
Total Investments (Cost $27,873,829) - 113.03% | 25,794,026 | |||||||||||
Liabilities in Excess of Other Assets - (13.03)% | (2,974,063 | ) | ||||||||||
TOTAL NET ASSETS - 100.00% | $ | 22,819,963 | ||||||||||
Asset Type | % of Net Assets | |||||||||||
Purchased Options | 112.18 | % | ||||||||||
Short Term Investments | 0.85 | �� | ||||||||||
Total Investments | 113.03 | |||||||||||
Liabilities in Excess of Other Assets | (13.03 | ) | ||||||||||
Net Assets | 100.00 | % | ||||||||||
Percentages are stated as a percent of net assets. |
(a) Exchange-Traded. |
(b) Purchased option contracts are held in connection with corresponding option contracts written short. |
(c) The U.S. Bank Money Market Deposit Account (the “MMDA”) is a short-term investment vehicle in which the Fund holds cash balances. The MMDA will bear interest at a variable rate that is determined based on conditions and may change daily and by any amount. The rate shown is as of April 30, 2022. |
INNOVATOR U.S. EQUITY ACCELERATED 9 BUFFER ETF – APRIL
Schedule of Options Written (a) | |||
April 30, 2022 (Unaudited) |
Description | Expiration | Strike Price | Contracts | Notional Amount | Value | |||||||||||||||
Call Options | ||||||||||||||||||||
SPY SPDR S&P 500® Trust ETF | 3/31/2023 | $ | 480.14 | 1,074 | $ | (44,248,800 | ) | $ | (1,038,990 | ) | ||||||||||
(1,038,990 | ) | |||||||||||||||||||
Put Options | ||||||||||||||||||||
SPY SPDR S&P 500® Trust ETF | 3/31/2023 | 411.01 | 537 | (22,124,400 | ) | (1,920,912 | ) | |||||||||||||
(1,920,912 | ) | |||||||||||||||||||
Total Options Written (Premiums Received $3,677,450) | $ | (2,959,902 | ) | |||||||||||||||||
(a) Exchange-Traded. | ||||||||||||||||||||
INNOVATOR U.S. EQUITY ACCELERATED 9 BUFFER ETF – JULY
Schedule of Investments | |||||
April 30, 2022 (Unaudited) |
Contracts | Notional Amount | Value | ||||||||||
PURCHASED OPTIONS - 103.40% (a)(b) | ||||||||||||
CALL OPTIONS - 97.30% | ||||||||||||
SPY SPDR S&P 500® Trust ETF, Expires 6/30/2022, Strike Price $428.07 | 359 | $ | 14,790,800 | $ | 334,229 | |||||||
SPY SPDR S&P 500® Trust ETF, Expires 6/30/2022, Strike Price $3.46 | 359 | 14,790,800 | 14,614,890 | |||||||||
14,949,119 | ||||||||||||
PUT OPTIONS - 6.10% | ||||||||||||
SPY SPDR S&P 500® Trust ETF, Expires 6/30/2022, Strike Price $428.05 | 359 | 14,790,800 | 937,708 | |||||||||
937,708 | ||||||||||||
TOTAL PURCHASED OPTIONS (Cost $17,293,641) | 15,886,827 | |||||||||||
SHORT TERM INVESTMENTS - 0.44% | Principal Amount | |||||||||||
Money Market Deposit Account - 0.44% | ||||||||||||
U.S. Bank Money Market Deposit Account, 0.130% (c) | $ | 67,933 | 67,933 | |||||||||
TOTAL SHORT TERM INVESTMENTS (Cost $67,933) | 67,933 | |||||||||||
Total Investments (Cost $17,361,574) - 103.84% | 15,954,760 | |||||||||||
Liabilities in Excess of Other Assets - (3.84)% | (589,815 | ) | ||||||||||
TOTAL NET ASSETS - 100.00% | $ | 15,364,945 | ||||||||||
Asset Type | % of Net Assets | |||||||||||
Purchased Options | 103.40 | % | ||||||||||
Short Term Investments | 0.44 | |||||||||||
Total Investments | 103.84 | |||||||||||
Liabilities in Excess of Other Assets | (3.84 | ) | ||||||||||
Net Assets | 100.00 | % | ||||||||||
Percentages are stated as a percent of net assets. |
(a) Exchange-Traded. |
(b) Purchased option contracts are held in connection with corresponding option contracts written short. |
(c) The U.S. Bank Money Market Deposit Account (the “MMDA”) is a short-term investment vehicle in which the Fund holds cash balances. The MMDA will bear interest at a variable rate that is determined based on conditions and may change daily and by any amount. The rate shown is as of April 30, 2022. |
INNOVATOR U.S. EQUITY ACCELERATED 9 BUFFER ETF – JULY
Schedule of Options Written (a) | |||
April 30, 2022 (Unaudited) |
Description | Expiration | Strike Price | Contracts | Notional Amount | Value | |||||||||||||||
Call Options | ||||||||||||||||||||
SPY SPDR S&P 500® Trust ETF | 6/30/2022 | $ | 447.75 | 718 | $ | (29,581,600 | ) | $ | (196,732 | ) | ||||||||||
(196,732 | ) | |||||||||||||||||||
Put Options | ||||||||||||||||||||
SPY SPDR S&P 500® Trust ETF | 6/30/2022 | 389.55 | 359 | (14,790,800 | ) | (385,566 | ) | |||||||||||||
(385,566 | ) | |||||||||||||||||||
Total Options Written (Premiums Received $1,882,914) | $ | (582,298 | ) | |||||||||||||||||
(a) Exchange-Traded. | ||||||||||||||||||||
INNOVATOR U.S. EQUITY ACCELERATED 9 BUFFER ETF – OCTOBER
Schedule of Investments | |||||
April 30, 2022 (Unaudited) |
Contracts | Notional Amount | Value | ||||||||||
PURCHASED OPTIONS - 108.17% (a)(b) | ||||||||||||
CALL OPTIONS - 100.09% | ||||||||||||
SPY SPDR S&P 500® Trust ETF, Expires 9/30/2022, Strike Price $429.15 | 196 | $ | 8,075,200 | $ | 364,543 | |||||||
SPY SPDR S&P 500® Trust ETF, Expires 9/30/2022, Strike Price $3.48 | 196 | 8,075,200 | 7,944,876 | |||||||||
8,309,419 | ||||||||||||
PUT OPTIONS - 8.08% | ||||||||||||
SPY SPDR S&P 500® Trust ETF, Expires 9/30/2022, Strike Price $429.17 | 196 | 8,075,200 | 670,379 | |||||||||
670,379 | ||||||||||||
TOTAL PURCHASED OPTIONS (Cost $9,828,939) | 8,979,798 | |||||||||||
SHORT TERM INVESTMENTS - 0.43% | Principal Amount | |||||||||||
Money Market Deposit Account - 0.43% | ||||||||||||
U.S. Bank Money Market Deposit Account, 0.130% (c) | $ | 36,066 | 36,066 | |||||||||
TOTAL SHORT TERM INVESTMENTS (Cost $36,066) | 36,066 | |||||||||||
Total Investments (Cost $9,865,005) - 108.60% | 9,015,864 | |||||||||||
Liabilities in Excess of Other Assets - (8.60)% | (713,949 | ) | ||||||||||
TOTAL NET ASSETS - 100.00% | $ | 8,301,915 | ||||||||||
Asset Type | % of Net Assets | |||||||||||
Purchased Options | 108.17 | % | ||||||||||
Short Term Investments | 0.43 | |||||||||||
Total Investments | 108.60 | |||||||||||
Liabilities in Excess of Other Assets | (8.60 | ) | ||||||||||
Net Assets | 100.00 | % | ||||||||||
Percentages are stated as a percent of net assets. |
(a) Exchange-Traded. |
(b) Purchased option contracts are held in connection with corresponding option contracts written short. |
(c) The U.S. Bank Money Market Deposit Account (the “MMDA”) is a short-term investment vehicle in which the Fund holds cash balances. The MMDA will bear interest at a variable rate that is determined based on conditions and may change daily and by any amount. The rate shown is as of April 30, 2022. |
INNOVATOR U.S. EQUITY ACCELERATED 9 BUFFER ETF – OCTOBER
Schedule of Options Written (a) | |||
April 30, 2022 (Unaudited) |
Description | Expiration | Strike Price | Contracts | Notional Amount | Value | |||||||||||||||
Call Options | ||||||||||||||||||||
SPY SPDR S&P 500® Trust ETF | 9/30/2022 | $ | 452.74 | 392 | $ | (16,150,400 | ) | $ | (331,491 | ) | ||||||||||
(331,491 | ) | |||||||||||||||||||
Put Options | ||||||||||||||||||||
SPY SPDR S&P 500® Trust ETF | 9/30/2022 | 390.53 | 196 | (8,075,200 | ) | (377,348 | ) | |||||||||||||
(377,348 | ) | |||||||||||||||||||
Total Options Written (Premiums Received $1,315,565) | $ | (708,839 | ) | |||||||||||||||||
(a) Exchange-Traded. | ||||||||||||||||||||
INNOVATOR GROWTH ACCELERATED PLUS ETF – JANUARY
Schedule of Investments | ||||
April 30, 2022 (Unaudited) |
Contracts | Notional Amount | Value | ||||||||||
PURCHASED OPTIONS - 100.73% (a)(b) | ||||||||||||
CALL OPTIONS - 100.73% | ||||||||||||
QQQ Invesco QQQ Trust Series 1, Expires 12/30/2022, Strike Price $397.87 | 544 | $ | 17,040,800 | $ | 195,687 | |||||||
QQQ Invesco QQQ Trust Series 1, Expires 12/30/2022, Strike Price $3.19 | 272 | 8,520,400 | 8,380,105 | |||||||||
TOTAL PURCHASED OPTIONS (Cost $11,438,572) | 8,575,792 | |||||||||||
SHORT TERM INVESTMENTS - 0.77% | Principal Amount | |||||||||||
Money Market Deposit Account - 0.77% | ||||||||||||
U.S. Bank Money Market Deposit Account, 0.130% (c) | $ | 65,725 | 65,725 | |||||||||
TOTAL SHORT TERM INVESTMENTS (Cost $65,725) | 65,725 | |||||||||||
Total Investments (Cost $11,504,297) - 101.50% | 8,641,517 | |||||||||||
Liabilities in Excess of Other Assets - (1.50)% | (127,656 | ) | ||||||||||
TOTAL NET ASSETS - 100.00% | $ | 8,513,861 | ||||||||||
Asset Type | % of Net Assets | |||||||||||
Purchased Options | 100.73 | % | ||||||||||
Short Term Investments | 0.77 | |||||||||||
Total Investments | 101.50 | |||||||||||
Liabilities in Excess of Other Assets | (1.50 | ) | ||||||||||
Net Assets | 100.00 | % | ||||||||||
Percentages are stated as a percent of net assets. |
(a) Exchange-Traded. |
(b) Purchased option contracts are held in connection with corresponding option contracts written short. |
(c) The U.S. Bank Money Market Deposit Account (the “MMDA”) is a short-term investment vehicle in which the Fund holds cash balances. The MMDA will bear interest at a variable rate that is determined based on conditions and may change daily and by any amount. The rate shown is as of April 30, 2022. |
INNOVATOR GROWTH ACCELERATED PLUS ETF – JANUARY
Schedule of Options Written (a) | |||
April 30, 2022 (Unaudited) |
Description | Expiration | Strike Price | Contracts | Notional Amount | Value | |||||||||||||||
Call Options | ||||||||||||||||||||
QQQ Invesco QQQ Trust Series 1 | 12/30/2022 | $ | 424.78 | 816 | $ | (25,561,200 | ) | $ | (121,665 | ) | ||||||||||
Total Options Written (Premiums Received $1,149,866) | $ | (121,665 | ) | |||||||||||||||||
(a) Exchange-Traded. | ||||||||||||||||||||
INNOVATOR GROWTH ACCELERATED PLUS ETF – APRIL
Schedule of Investments | ||||
April 30, 2022 (Unaudited) |
Contracts | Notional Amount | Value | ||||||||||
PURCHASED OPTIONS - 106.76% (a)(b) | ||||||||||||
CALL OPTIONS - 106.76% | ||||||||||||
QQQ Invesco QQQ Trust Series 1, Expires 3/31/2023, Strike Price $362.54 | 676 | $ | 21,175,700 | $ | 1,028,094 | |||||||
QQQ Invesco QQQ Trust Series 1, Expires 3/31/2023, Strike Price $2.91 | 338 | 10,587,850 | 10,401,359 | |||||||||
TOTAL PURCHASED OPTIONS (Cost $14,736,022) | 11,429,453 | |||||||||||
SHORT TERM INVESTMENTS - 1.13% | Principal Amount | |||||||||||
Money Market Deposit Account- 1.13% | ||||||||||||
U.S. Bank Money Market Deposit Account, 0.130% (c) | $ | 121,434 | 121,434 | |||||||||
TOTAL SHORT TERM INVESTMENTS (Cost $121,434) | 121,434 | |||||||||||
Total Investments (Cost $14,857,456) - 107.89% | 11,550,887 | |||||||||||
Liabilities in Excess of Other Assets - (7.89)% | (844,633 | ) | ||||||||||
TOTAL NET ASSETS - 100.00% | $ | 10,706,254 | ||||||||||
Asset Type | % of Net Assets | |||||||||||
Purchased Options | 106.76 | % | ||||||||||
Short Term Investments | 1.13 | |||||||||||
Total Investments | 107.89 | |||||||||||
Liabilities in Excess of Other Assets | (7.89 | ) | ||||||||||
Net Assets | 100.00 | % | ||||||||||
Percentages are stated as a percent of net assets. |
(a) Exchange-Traded. |
(b) Purchased option contracts are held in connection with corresponding option contracts written short. |
(c) The U.S. Bank Money Market Deposit Account (the “MMDA”) is a short-term investment vehicle in which the Fund holds cash balances. The MMDA will bear interest at a variable rate that is determined based on conditions and may change daily and by any amount. The rate shown is as of April 30, 2022. |
INNOVATOR GROWTH ACCELERATED PLUS ETF – APRIL
Schedule of Options Written (a) | |||
April 30, 2022 (Unaudited) |
Description | Expiration | Strike Price | Contracts | Notional Amount | Value | |||||||||||||||
Call Options | ||||||||||||||||||||
QQQ Invesco QQQ Trust Series 1 | 3/31/2023 | $ | 388.24 | 1,014 | $ | (31,763,550 | ) | $ | (836,878 | ) | ||||||||||
Total Options Written (Premiums Received $2,576,441) | $ | (836,878 | ) | |||||||||||||||||
(a) Exchange-Traded. | ||||||||||||||||||||
INNOVATOR GROWTH ACCELERATED PLUS ETF – JULY
Schedule of Investments | |||||
April 30, 2022 (Unaudited) |
Contracts | Notional Amount | Value | ||||||||||
PURCHASED OPTIONS - 100.23% (a)(b) | ||||||||||||
CALL OPTIONS - 100.23% | ||||||||||||
QQQ Invesco QQQ Trust Series 1, Expires 6/30/2022, Strike Price $354.45 | 1,006 | $ | 31,512,950 | $ | 234,589 | |||||||
QQQ Invesco QQQ Trust Series 1, Expires 6/30/2022, Strike Price $2.85 | 503 | 15,756,475 | 15,579,779 | |||||||||
TOTAL PURCHASED OPTIONS (Cost $20,259,111) | 15,814,368 | |||||||||||
SHORT TERM INVESTMENTS - 0.38% | Principal Amount | |||||||||||
Money Market Deposit Account- 0.38% | ||||||||||||
U.S. Bank Money Market Deposit Account, 0.130% (c) | $ | 60,505 | 60,505 | |||||||||
TOTAL SHORT TERM INVESTMENTS (Cost $60,505) | 60,505 | |||||||||||
Total Investments (Cost $20,319,616) - 100.61% | 15,874,873 | |||||||||||
Liabilities in Excess of Other Assets - (0.61)% | (96,409 | ) | ||||||||||
TOTAL NET ASSETS - 100.00% | $ | 15,778,464 | ||||||||||
Asset Type | % of Net Assets | |||||||||||
Purchased Options | 100.23 | % | ||||||||||
Short Term Investments | 0.38 | |||||||||||
Total Investments | 100.61 | |||||||||||
Liabilities in Excess of Other Assets | (0.61 | ) | ||||||||||
Net Assets | 100.00 | % | ||||||||||
Percentages are stated as a percent of net assets. |
(a) Exchange-Traded. |
(b) Purchased option contracts are held in connection with corresponding option contracts written short. |
(c) The U.S. Bank Money Market Deposit Account (the “MMDA”) is a short-term investment vehicle in which the Fund holds cash balances. The MMDA will bear interest at a variable rate that is determined based on conditions and may change daily and by any amount. The rate shown is as of April 30, 2022. |
INNOVATOR GROWTH ACCELERATED PLUS ETF – JULY
Schedule of Options Written (a) | |||
April 30, 2022 (Unaudited) |
Description | Expiration | Strike Price | Contracts | Notional Amount | Value | |||||||||||||||
Call Options | ||||||||||||||||||||
QQQ Invesco QQQ Trust Series 1 | 6/30/2022 | $ | 377.31 | 1,509 | $ | (47,269,425 | ) | $ | (84,868 | ) | ||||||||||
Total Options Written (Premiums Received $2,400,415) | $ | (84,868 | ) | |||||||||||||||||
(a) Exchange-Traded. | ||||||||||||||||||||
INNOVATOR GROWTH ACCELERATED PLUS ETF – OCTOBER
Schedule of Investments | |||||
April 30, 2022 (Unaudited) |
Contracts | Notional Amount | Value | ||||||||||
PURCHASED OPTIONS - 102.15% (a)(b) | ||||||||||||
CALL OPTIONS - 102.15% | ||||||||||||
QQQ Invesco QQQ Trust Series 1, Expires 9/30/2022, Strike Price $357.53 | 340 | $ | 10,650,500 | $ | 248,272 | |||||||
QQQ Invesco QQQ Trust Series 1, Expires 9/30/2022, Strike Price 2.87 | 170 | 5,325,250 | 5,254,420 | |||||||||
TOTAL PURCHASED OPTIONS (Cost $7,815,635) | 5,502,692 | |||||||||||
SHORT TERM INVESTMENTS - 0.52% | Principal Amount | |||||||||||
Money Market Deposit Account- 0.52% | ||||||||||||
U.S. Bank Money Market Deposit Account, 0.130% (c) | $ | 28,178 | 28,178 | |||||||||
TOTAL SHORT TERM INVESTMENTS (Cost $28,178) | 28,178 | |||||||||||
Total Investments (Cost $7,843,813) - 102.67% | 5,530,870 | |||||||||||
Liabilities in Excess of Other Assets - (2.67)% | (143,958 | ) | ||||||||||
TOTAL NET ASSETS - 100.00% | $ | 5,386,912 | ||||||||||
Asset Type | % of Net Assets | |||||||||||
Purchased Options | 102.15 | % | ||||||||||
Short Term Investments | 0.52 | |||||||||||
Total Investments | 102.67 | |||||||||||
Liabilities in Excess of Other Assets | (2.67 | ) | ||||||||||
Net Assets | 100.00 | % | ||||||||||
Percentages are stated as a percent of net assets. |
(a) Exchange-Traded. |
(b) Purchased option contracts are held in connection with corresponding option contracts written short. |
(c) The U.S. Bank Money Market Deposit Account (the “MMDA”) is a short-term investment vehicle in which the Fund holds cash balances. The MMDA will bear interest at a variable rate that is determined based on conditions and may change daily and by any amount. The rate shown is as of April 30, 2022. |
INNOVATOR GROWTH ACCELERATED PLUS ETF – OCTOBER
Schedule of Options Written (a) | |||
April 30, 2022 (Unaudited) |
Description | Expiration | Strike Price | Contracts | Notional Amount | Value | |||||||||||||||
Call Options | ||||||||||||||||||||
QQQ Invesco QQQ Trust Series 1 | 9/30/2022 | $ | 381.13 | 510 | $ | (15,975,750 | ) | $ | (140,175 | ) | ||||||||||
Total Options Written (Premiums Received $1,565,527) | $ | (140,175 | ) | |||||||||||||||||
(a) Exchange-Traded. | ||||||||||||||||||||
INNOVATOR 20+ YEAR TREASURY BOND 9 BUFFER ETF - JULY
Schedule of Investments | |||||
April 30, 2022 (Unaudited) |
Contracts | Notional Amount | Value | ||||||||||
PURCHASED OPTIONS - 110.39% (a)(b) | ||||||||||||
CALL OPTIONS - 90.49% | ||||||||||||
TLT iShares 20+ Year Treasury Bond ETF, Expires 6/30/2022, Strike Price $1.15 | 460 | $ | 5,494,700 | $ | 5,420,180 | |||||||
5,420,180 | ||||||||||||
PUT OPTIONS - 19.90% | ||||||||||||
TLT iShares 20+ Year Treasury Bond ETF, Expires 6/30/2022, Strike Price $144.35 | 460 | 5,494,700 | 1,191,738 | |||||||||
1,191,738 | ||||||||||||
TOTAL PURCHASED OPTIONS (Cost $7,021,914) | 6,611,918 | |||||||||||
Total Investments (Cost 7,021,914) - 110.39% | 6,611,918 | |||||||||||
Liabilities in Excess of Other Assets - (10.39)% | (622,315 | ) | ||||||||||
TOTAL NET ASSETS - 100.00% | $ | 5,989,603 | ||||||||||
Asset Type | % of Net Assets | |||||||||||
Purchased Options | 110.39 | % | ||||||||||
Total Investments | 110.39 | |||||||||||
Liabilities in Excess of Other Assets | (10.39 | ) | ||||||||||
Net Assets | 100.00 | % | ||||||||||
Percentages are stated as a percent of net assets. |
(a) Exchange-Traded. |
(b) Purchased option contracts are held in connection with corresponding option contracts written short. |
INNOVATOR 20+ YEAR TREASURY BOND 9 BUFFER ETF - JULY
Schedule of Options Written (a) | |||
April 30, 2022 (Unaudited) |
Description | Expiration | Strike Price | Contracts | Notional Amount | Value | |||||||||||||||
Call Options | ||||||||||||||||||||
TLT iShares 20+ Year Treasury Bond ETF | 6/30/2022 | $ | 157.34 | 460 | $ | (5,494,700 | ) | $ | (15,688 | ) | ||||||||||
(15,688 | ) | |||||||||||||||||||
Put Options | ||||||||||||||||||||
TLT iShares 20+ Year Treasury Bond ETF | 6/30/2022 | 131.36 | 460 | (5,494,700 | ) | (599,903 | ) | |||||||||||||
(599,903 | ) | |||||||||||||||||||
Total Options Written (Premiums Received $273,175) | $ | (615,591 | ) | |||||||||||||||||
(a) Exchange-Traded. | ||||||||||||||||||||
INNOVATOR 20+ YEAR TREASURY BOND 5 FLOOR ETF - QUARTERLY
Schedule of Investments | |||||
April 30, 2022 (Unaudited) |
Contracts | Notional Amount | Value | ||||||||||
PURCHASED OPTIONS - 99.95% (a)(b) | ||||||||||||
CALL OPTIONS - 93.19% | ||||||||||||
TLT iShares 20+ Year Treasury Bond ETF, Expires 6/30/2022, Strike Price $0.26 | 900 | $ | 10,750,500 | $ | 10,684,684 | |||||||
10,684,684 | ||||||||||||
PUT OPTIONS - 6.76% | ||||||||||||
TLT iShares 20+ Year Treasury Bond ETF, Expires 6/30/2022, Strike Price $125.76 | 900 | 10,750,500 | 774,757 | |||||||||
774,757 | ||||||||||||
TOTAL PURCHASED OPTIONS (Cost $11,883,457) | 11,459,441 | |||||||||||
SHORT TERM INVESTMENTS - 0.26% | Principal Amount | |||||||||||
Money Market Deposit Account - 0.26% | ||||||||||||
U.S. Bank Money Market Deposit Account, 0.130% (c) | $ | 29,784 | 29,784 | |||||||||
TOTAL SHORT TERM INVESTMENTS (Cost $29,784) | 29,784 | |||||||||||
Total Investments (Cost $11,913,241) - 100.21% | 11,489,225 | |||||||||||
Liabilities in Excess of Other Assets - (0.21)% | (24,458 | ) | ||||||||||
TOTAL NET ASSETS - 100.00% | $ | 11,464,767 | ||||||||||
Asset Type | % of Net Assets | |||||||||||
Purchased Options | 99.95 | % | ||||||||||
Short Term Investments | 0.26 | |||||||||||
Total Investments | 100.21 | |||||||||||
Liabilities in Excess of Other Assets | (0.21 | ) | ||||||||||
Net Assets | 100.00 | % | ||||||||||
Percentages are stated as a percent of net assets. |
(a) Exchange-Traded. |
(b) Purchased option contracts are held in connection with corresponding option contracts written short. |
(c) The U.S. Bank Money Market Deposit Account (the “MMDA”) is a short-term investment vehicle in which the Fund holds cash balances. The MMDA will bear interest at a variable rate that is determined based on conditions and may change daily and by any amount. The rate shown is as of April 30, 2022. |
INNOVATOR 20+ YEAR TREASURY BOND 5 FLOOR ETF - QUARTERLY
Schedule of Options Written (a) | |||
April 30, 2022 (Unaudited) |
Description | Expiration | Strike Price | Contracts | Notional Amount | Value | |||||||||||||||
Call Options | ||||||||||||||||||||
TLT iShares 20+ Year Treasury Bond ETF | 6/30/2022 | $ | 140.92 | 900 | $ | (10,750,500 | ) | $ | (18,450 | ) | ||||||||||
Total Options Written (Premiums Received $109,772) | $ | (18,450 | ) | |||||||||||||||||
(a) Exchange-Traded. | ||||||||||||||||||||
INNOVATOR DEFINED WEALTH SHIELD ETF
Schedule of Investments | |||||
April 30, 2022 (Unaudited) |
Contracts | Notional Amount | Value | ||||||||||
PURCHASED OPTIONS - 101.33% (a)(b) | ||||||||||||
CALL OPTIONS - 91.91% | ||||||||||||
SPY SPDR S&P 500® Trust ETF, Expires 6/30/2022, Strike Price $0.78 | 2,332 | $ | 96,078,400 | $ | 95,527,089 | |||||||
95,527,089 | ||||||||||||
PUT OPTIONS - 9.42% | ||||||||||||
SPY SPDR S&P 500® Trust ETF, Expires 6/30/2022, Strike Price $451.64 | 2,332 | 96,078,400 | 9,793,532 | |||||||||
9,793,532 | ||||||||||||
TOTAL PURCHASED OPTIONS (Cost $108,498,641) | 105,320,621 | |||||||||||
SHORT TERM INVESTMENTS - 0.20% | Principal Amount | |||||||||||
Money Market Deposit Account - 0.20% | ||||||||||||
U.S. Bank Money Market Deposit Account, 0.130% (c) | $ | 212,368 | 212,368 | |||||||||
TOTAL SHORT TERM INVESTMENTS (Cost $212,368) | 212,368 | |||||||||||
Total Investments (Cost $108,711,009) - 101.53% | 105,532,989 | |||||||||||
Liabilities in Excess of Other Assets - (1.53)% | (1,591,350 | ) | ||||||||||
TOTAL NET ASSETS - 100.00% | $ | 103,941,639 | ||||||||||
Asset Type | % of Net Assets | |||||||||||
Purchased Options | 101.33 | % | ||||||||||
Short Term Investments | 0.20 | |||||||||||
Total Investments | 101.53 | |||||||||||
Liabilities in Excess of Other Assets | (1.53 | ) | ||||||||||
Net Assets | 100.00 | % | ||||||||||
Percentages are stated as a percent of net assets. |
(a) Exchange-Traded. |
(b) Purchased option contracts are held in connection with corresponding option contracts written short. |
(c) The U.S. Bank Money Market Deposit Account (the “MMDA”) is a short-term investment vehicle in which the Fund holds cash balances. The MMDA will bear interest at a variable rate that is determined based on conditions and may change daily and by any amount. The rate shown is as of April 30, 2022. |
INNOVATOR DEFINED WEALTH SHIELD ETF
Schedule of Options Written (a) | |||
April 30, 2022 (Unaudited) |
Description | Expiration | Strike Price | Contracts | Notional Amount | Value | |||||||||||||||
Call Options | ||||||||||||||||||||
SPY SPDR S&P 500® Trust ETF | 6/30/2022 | $ | 456.74 | 2,332 | $ | (96,078,400 | ) | $ | (302,180 | ) | ||||||||||
(302,180 | ) | |||||||||||||||||||
Put Options | ||||||||||||||||||||
SPY SPDR S&P 500® Trust ETF | 6/30/2022 | 361.31 | 2,332 | (96,078,400 | ) | (1,233,025 | ) | |||||||||||||
(1,233,025 | ) | |||||||||||||||||||
Total Options Written (Premiums Received $3,415,665) | $ | (1,535,205 | ) | |||||||||||||||||
(a) Exchange-Traded. | ||||||||||||||||||||
INNOVATOR U.S. EQUITY ACCELERATED ETF – QUARTERLY
Schedule of Investments | |||||
April 30, 2022 (Unaudited) |
Contracts | Notional Amount | Value | ||||||||||
PURCHASED OPTIONS - 99.99% (a)(b) | ||||||||||||
CALL OPTIONS - 99.99% | ||||||||||||
SPY SPDR S&P 500® Trust ETF, Expires 6/30/2022, Strike Price $451.64 | 227 | $ | 9,352,400 | $ | 53,509 | |||||||
SPY SPDR S&P 500® Trust ETF, Expires 6/30/2022, Strike Price $0.89 | 227 | 9,352,400 | 9,296,241 | |||||||||
TOTAL PURCHASED OPTIONS (Cost $10,536,227) | 9,349,750 | |||||||||||
SHORT TERM INVESTMENTS - 0.34% | Principal Amount | |||||||||||
Money Market Deposit Account - 0.34% | ||||||||||||
U.S. Bank Money Market Deposit Account, 0.130% (c) | $ | 31,793 | 31,793 | |||||||||
TOTAL SHORT TERM INVESTMENTS (Cost $31,793) | 31,793 | |||||||||||
Total Investments (Cost $10,568,020) - 100.33% | 9,381,543 | |||||||||||
Liabilities in Excess of Other Assets - (0.33)% | (30,539 | ) | ||||||||||
TOTAL NET ASSETS - 100.00% | $ | 9,351,004 | ||||||||||
Asset Type | % of Net Assets | |||||||||||
Purchased Options | 99.99 | % | ||||||||||
Short Term Investments | 0.34 | |||||||||||
Total Investments | 100.33 | |||||||||||
Liabilities in Excess of Other Assets | (0.33 | ) | ||||||||||
Net Assets | 100.00 | % | ||||||||||
Percentages are stated as a percent of net assets. |
(a) Exchange-Traded. |
(b) Purchased option contracts are held in connection with corresponding option contracts written short. |
(c) The U.S. Bank Money Market Deposit Account (the “MMDA”) is a short-term investment vehicle in which the Fund holds cash balances. The MMDA will bear interest at a variable rate that is determined based on conditions and may change daily and by any amount. The rate shown is as of April 30, 2022. |
INNOVATOR U.S. EQUITY ACCELERATED ETF – QUARTERLY
Schedule of Options Written (a) | |||
April 30, 2022 (Unaudited) |
Description | Expiration | Strike Price | Contracts | Notional Amount | Value | |||||||||||||||
Call Options | ||||||||||||||||||||
SPY SPDR S&P 500 Trust ETF | 6/30/2022 | $ | 470.07 | 454 | $ | (18,704,800 | ) | $ | (23,858 | ) | ||||||||||
Total Options Written (Premiums Received $301,432) | $ | (23,858 | ) | |||||||||||||||||
(a) Exchange-Traded. | ||||||||||||||||||||
INNOVATOR GROWTH ACCELERATED ETF – QUARTERLY
Schedule of Investments | ||||
April 30, 2022 (Unaudited) |
Contracts | Notional Amount | Value | ||||||||||
PURCHASED OPTIONS - 100.03% (a)(b) | ||||||||||||
CALL OPTIONS - 100.03% | ||||||||||||
QQQ Invesco QQQ Trust Series 1, Expires 6/30/2022, Strike Price $362.54 | 346 | $ | 10,838,450 | $ | 47,552 | |||||||
QQQ Invesco QQQ Trust Series 1, Expires 6/30/2022, Strike Price $0.72 | 346 | 10,838,450 | 10,790,495 | |||||||||
TOTAL PURCHASED OPTIONS (Cost $13,112,984) | 10,838,047 | |||||||||||
SHORT TERM INVESTMENTS - 0.35% | Principal Amount | |||||||||||
Money Market Deposit Account- 0.35% | ||||||||||||
U.S. Bank Money Market Deposit Account, 0.130% (c) | $ | 37,835 | 37,835 | |||||||||
TOTAL SHORT TERM INVESTMENTS (Cost $37,835) | 37,835 | |||||||||||
Total Investments (Cost $13,150,819) - 100.38% | 10,875,882 | |||||||||||
Liabilities in Excess of Other Assets - (0.38)% | (41,139 | ) | ||||||||||
TOTAL NET ASSETS - 100.00% | $ | 10,834,743 | ||||||||||
Asset Type | % of Net Assets | |||||||||||
Purchased Options | 100.03 | % | ||||||||||
Short Term Investments | 0.35 | |||||||||||
Total Investments | 100.38 | |||||||||||
Liabilities in Excess of Other Assets | (0.38 | ) | ||||||||||
Net Assets | 100.00 | % | ||||||||||
Percentages are stated as a percent of net assets. |
(a) Exchange-Traded. |
(b) Purchased option contracts are held in connection with corresponding option contracts written short. |
(c) The U.S. Bank Money Market Deposit Account (the “MMDA”) is a short-term investment vehicle in which the Fund holds cash balances. The MMDA will bear interest at a variable rate that is determined based on conditions and may change daily and by any amount. The rate shown is as of April 30, 2022. |
INNOVATOR GROWTH ACCELERATED ETF – QUARTERLY
Schedule of Options Written (a) | |||
April 30, 2022 (Unaudited) |
Description | Expiration | Strike Price | Contracts | Notional Amount | Value | |||||||||||||||
Call Options | ||||||||||||||||||||
QQQ Invesco QQQ Trust Series 1 | 6/30/2022 | $ | 379.83 | 692 | $ | (21,676,900 | ) | $ | (33,483 | ) | ||||||||||
Total Options Written (Premiums Received $591,727) | $ | (33,483 | ) | |||||||||||||||||
(a) Exchange-Traded. | ||||||||||||||||||||
Statements of Assets and Liabilities
April 30, 2022 (Unaudited)
| |
Assets: | |
Investments, at value (a) | |
Interest receivable | |
Deposit at broker for options | |
Total Assets | |
Liabilities: | |
Options written, at value (b) | |
Payable to Adviser | |
Total Liabilities | |
Net Assets | |
Net Assets Consist of: | |
Capital stock | |
Total distributable earnings/(accumulated deficit) | |
Net Assets | |
Net Asset Value: | |
Net assets | |
Shares of beneficial interest outstanding (unlimted shares without par value authorized) | |
Net asset value price per share | |
(a) | Cost of investments |
(b) | Premiums received |
Innovator International Developed Power Buffer ETF - January | Innovator International Developed Power Buffer ETF - April | Innovator International Developed Power Buffer ETF - July | Innovator International Developed Power Buffer ETF - October | ||||||||||||
$ | 97,585,040 | $ | 58,370,499 | $ | 62,448,596 | $ | 18,563,970 | ||||||||
36 | 23 | 8 | 5 | ||||||||||||
137 | 200 | 201 | 100 | ||||||||||||
97,585,213 | 58,370,722 | 62,448,805 | 18,564,075 | ||||||||||||
8,635,862 | 3,804,583 | 3,663,932 | 1,356,877 | ||||||||||||
61,426 | 29,289 | 40,286 | 12,100 | ||||||||||||
8,697,288 | 3,833,872 | 3,704,218 | 1,368,977 | ||||||||||||
$ | 88,887,925 | $ | 54,536,850 | $ | 58,744,587 | $ | 17,195,098 | ||||||||
$ | 91,004,157 | $ | 56,725,683 | $ | 60,740,494 | $ | 18,075,744 | ||||||||
(2,116,232 | ) | (2,188,833 | ) | (1,995,907 | ) | (880,646 | ) | ||||||||
$ | 88,887,925 | $ | 54,536,850 | $ | 58,744,587 | $ | 17,195,098 | ||||||||
$ | 88,887,925 | $ | 54,536,850 | $ | 58,744,587 | $ | 17,195,098 | ||||||||
| 3,500,000 | 2,300,000 | 2,500,000 | 725,000 | |||||||||||
$ | 25.40 | $ | 23.71 | $ | 23.50 | $ | 23.72 | ||||||||
$ | 99,609,789 | $ | 58,844,966 | $ | 63,265,695 | $ | 18,926,339 | ||||||||
5,095,208 | 2,848,149 | 2,826,840 | 814,590 | ||||||||||||
Statements of Assets and Liabilities
April 30, 2022 (Unaudited)
| |
Assets: | |
Investments, at value (a) | |
Interest receivable | |
Deposit at broker for options | |
Total Assets | |
Liabilities: | |
Options written, at value (b) | |
Payable to Adviser | |
Total Liabilities | |
Net Assets | |
Net Assets Consist of: | |
Capital stock | |
Total distributable earnings/(accumulated deficit) | |
Net Assets | |
Net Asset Value: | |
Net assets | |
Shares of beneficial interest outstanding (unlimted shares without par value authorized) | |
Net asset value price per share | |
(a) | Cost of investments |
(b) | Premiums received |
Innovator Emerging Markets Power Buffer ETF - January | Innovator Emerging Markets Power Buffer ETF - April | Innovator Emerging Markets Power Buffer ETF - July | Innovator Emerging Markets Power Buffer ETF - October | ||||||||||||
$ | 91,490,768 | $ | 41,350,403 | $ | 35,209,305 | $ | 9,737,862 | ||||||||
37 | 17 | 5 | 2 | ||||||||||||
93 | 200 | 200 | 100 | ||||||||||||
91,490,898 | 41,350,620 | 35,209,510 | 9,737,964 | ||||||||||||
8,588,396 | 4,388,538 | 3,187,708 | 941,467 | ||||||||||||
64,111 | 20,422 | 24,828 | 6,069 | ||||||||||||
8,652,507 | 4,408,960 | 3,212,536 | 947,536 | ||||||||||||
$ | 82,838,391 | $ | 36,941,660 | $ | 31,996,974 | $ | 8,790,428 | ||||||||
$ | 91,811,747 | $ | 38,991,121 | $ | 37,192,107 | $ | 9,275,207 | ||||||||
(8,973,356 | ) | (2,049,461 | ) | (5,195,133 | ) | (484,779 | ) | ||||||||
$ | 82,838,391 | $ | 36,941,660 | $ | 31,996,974 | $ | 8,790,428 | ||||||||
$ | 82,838,391 | $ | 36,941,660 | $ | 31,996,974 | $ | 8,790,428 | ||||||||
| 3,000,000 | 1,550,000 | 1,325,000 | 375,000 | |||||||||||
$ | 27.61 | $ | 23.83 | $ | 24.15 | $ | 23.44 | ||||||||
$ | 95,352,806 | $ | 40,440,638 | $ | 36,868,940 | $ | 9,890,084 | ||||||||
6,643,632 | 2,719,189 | 2,463,263 | 643,307 | ||||||||||||
Statements of Assets and Liabilities
April 30, 2022 (Unaudited)
| |
Assets: | |
Investments, at value (a) | |
Interest receivable | |
Deposit at broker for options | |
Total Assets | |
Liabilities: | |
Payable to Adviser | |
Options written, at value (b) | |
Total Liabilities | |
Net Assets | |
Net Assets Consist of: | |
Capital stock | |
Total distributable earnings/(accumulated deficit) | |
Net Assets | |
Net Asset Value: | |
Net assets | |
Shares of beneficial interest outstanding (unlimted shares without par value authorized) | |
Net asset value price per share | |
(a) | Cost of investments |
(b) | Premiums received |
Innovator Growth-100 Power Buffer ETF - January | Innovator Growth-100 Power Buffer ETF - April | Innovator Growth-100 Power Buffer ETF - July | Innovator Growth-100 Power Buffer ETF - October | ||||||||||||
$ | 138,840,110 | $ | 65,735,613 | $ | 57,412,300 | $ | 66,646,213 | ||||||||
50 | 29 | 7 | 18 | ||||||||||||
181 | 200 | 155 | 100 | ||||||||||||
138,840,341 | 65,735,842 | 57,412,462 | 66,646,331 | ||||||||||||
85,357 | 36,074 | 35,574 | 42,713 | ||||||||||||
14,778,456 | 6,056,098 | 2,076,561 | 4,142,170 | ||||||||||||
14,863,813 | 6,092,172 | 2,112,135 | 4,184,883 | ||||||||||||
$ | 123,976,528 | $ | 59,643,670 | $ | 55,300,327 | $ | 62,461,448 | ||||||||
$ | 127,659,974 | $ | 60,323,812 | $ | 57,320,687 | $ | 66,020,825 | ||||||||
(3,683,446 | ) | (680,142 | ) | (2,020,360 | ) | (3,559,377 | ) | ||||||||
$ | 123,976,528 | $ | 59,643,670 | $ | 55,300,327 | $ | 62,461,448 | ||||||||
$ | 123,976,528 | $ | 59,643,670 | $ | 55,300,327 | $ | 62,461,448 | ||||||||
| 3,300,000 | 1,650,000 | 1,250,000 | 1,700,000 | |||||||||||
$ | 37.57 | $ | 36.15 | $ | 44.24 | $ | 36.74 | ||||||||
$ | 148,902,025 | $ | 69,717,958 | $ | 61,411,533 | $ | 71,674,494 | ||||||||
12,739,277 | 5,825,140 | 4,273,562 | 5,806,198 | ||||||||||||
Statements of Assets and Liabilities
April 30, 2022 (Unaudited)
| |
Assets: | |
Investments, at value (a) | |
Interest receivable | |
Deposit at broker for options | |
Total Assets | |
Liabilities: | |
Payable to Adviser | |
Options written, at value (b) | |
Total Liabilities | |
Net Assets | |
Net Assets Consist of: | |
Capital stock | |
Total distributable earnings/(accumulated deficit) | |
Net Assets | |
Net Asset Value: | |
Net assets | |
Shares of beneficial interest outstanding (unlimted shares without par value authorized) | |
Net asset value price per share | |
(a) | Cost of investments |
(b) | Premiums received |
Innovator U.S. Small Cap Power Buffer ETF - January | Innovator U.S. Small Cap Power Buffer ETF - April | Innovator U.S. Small Cap Power Buffer ETF - July | Innovator U.S. Small Cap Power Buffer ETF - October | |||||||||||
$ | 136,605,841 | $ | 79,198,764 | $ | 66,585,779 | $ | 42,968,829 | |||||||
45 | 36 | 9 | 11 | |||||||||||
162 | 200 | 194 | 99 | |||||||||||
136,612,373 | 79,199,000 | 66,585,982 | 42,968,939 | |||||||||||
83,765 | 47,181 | 41,414 | 27,294 | |||||||||||
11,888,877 | 6,435,587 | 4,298,636 | 2,903,612 | |||||||||||
11,972,642 | 6,482,768 | 4,340,050 | 2,930,906 | |||||||||||
$ | 124,639,731 | $ | 72,716,232 | $ | 62,245,932 | $ | 40,038,033 | |||||||
$ | 123,582,722 | $ | 77,219,979 | $ | 66,577,616 | $ | 43,353,405 | |||||||
1,057,009 | (4,503,747 | ) | (4,331,684 | ) | (3,315,372 | ) | ||||||||
$ | 124,639,731 | $ | 72,716,232 | $ | 62,245,932 | $ | 40,038,033 | |||||||
$ | 124,639,731 | $ | 72,716,232 | $ | 62,245,932 | $ | 40,038,033 | |||||||
| 4,225,000 | 2,875,000 | 2,525,000 | 1,600,000 | ||||||||||
$ | 29.50 | $ | 25.29 | $ | 24.65 | $ | 25.02 | |||||||
$ | 145,926,558 | $ | 83,113,781 | $ | 71,120,463 | $ | 46,410,567 | |||||||
10,956,836 | 6,325,183 | 4,673,443 | 3,662,476 | |||||||||||
Statements of Assets and Liabilities
April 30, 2022 (Unaudited)
| |
Assets: | |
Investments, at value (a) | |
Interest receivable | |
Deposit at broker for options | |
Total Assets | |
Liabilities: | |
Payable to Adviser | |
Options written, at value (b) | |
Total Liabilities | |
Net Assets | |
Net Assets Consist of: | |
Capital stock | |
Total distributable earnings/(accumulated deficit) | |
Net Assets | |
Net Asset Value: | |
Net assets | |
Shares of beneficial interest outstanding (unlimted shares without par value authorized) | |
Net asset value price per share | |
(a) | Cost of investments |
(b) | Premiums received |
Innovator Double Stacker ETF - January | Innovator Double Stacker ETF - October | |||||||
| $ | 4,558,924 | $ | 7,529,927 | |||||
| 2 | 2 | |||||||
| 103 | 100 | |||||||
| 4,559,029 | 7,530,029 | |||||||
| 3,163 | 4,689 | |||||||
| 32,046 | 122,410 | |||||||
| 35,209 | 127,099 | |||||||
| $ | 4,523,820 | $ | 7,402,930 | |||||
| $ | 4,546,562 | $ | 13,318,654 | |||||
| (22,742 | ) | (5,915,724 | ) | |||||
| $ | 4,523,820 | $ | 7,402,930 | |||||
| $ | 4,523,820 | $ | 7,402,930 | |||||
| 175,000 | 250,000 | |||||||
| $ | 25.85 | $ | 29.61 | |||||
| $ | 5,706,220 | $ | 8,292,814 | |||||
| 440,408 | 573,829 | |||||||
Statements of Assets and Liabilities
April 30, 2022 (Unaudited)
| |
Assets: | |
Investments, at value (a) | |
Interest receivable | |
Deposit at broker for options | |
Total Assets | |
Liabilities: | |
Payable to Adviser | |
Options written, at value (b) | |
Total Liabilities | |
Net Assets | |
Net Assets Consist of: | |
Capital stock | |
Total distributable earnings/(accumulated deficit) | |
Net Assets | |
Net Asset Value: | |
Net assets | |
Shares of beneficial interest outstanding (unlimted shares without par value authorized) | |
Net asset value price per share | |
(a) | Cost of investments |
(b) | Premiums received |
Innovator Triple Stacker ETF - January | Innovator Triple Stacker ETF - October | |||||||
| $ | 11,146,919 | $ | 8,235,451 | |||||
| 6 | 3 | |||||||
| 105 | 102 | |||||||
| 11,147,030 | 8,235,556 | |||||||
| 7,852 | 6,024 | |||||||
| 243,153 | 277,164 | |||||||
| 251,005 | 283,188 | |||||||
| $ | 10,896,025 | $ | 7,952,368 | |||||
| $ | 9,825,115 | $ | 16,389,523 | |||||
| 1,070,910 | (8,437,155 | ) | ||||||
| $ | 10,896,025 | $ | 7,952,368 | |||||
| $ | 10,896,025 | $ | 7,952,368 | |||||
| 425,000 | 275,000 | |||||||
| $ | 25.64 | $ | 28.92 | |||||
| $ | 14,774,920 | $ | 9,787,996 | |||||
| 2,211,802 | 1,588,335 | |||||||
Statements of Assets and Liabilities
April 30, 2022 (Unaudited)
| |
Assets: | |
Investments, at value (a) | |
Interest receivable | |
Deposit at broker for options | |
Total Assets | |
Liabilities: | |
Payable to Adviser | |
Options written, at value (b) | |
Total Liabilities | |
Net Assets | |
Net Assets Consist of: | |
Capital stock | |
Total distributable earnings/(accumulated deficit) | |
Net Assets | |
Net Asset Value: | |
Net assets | |
Shares of beneficial interest outstanding (unlimted shares without par value authorized) | |
Net asset value price per share | |
(a) | Cost of investments |
(b) | Premiums received |
Innovator Double Stacker 9 Buffer ETF - January | Innovator Double Stacker 9 Buffer ETF - October | |||||||
| $ | 12,801,470 | $ | 18,973,589 | |||||
| 6 | 7 | |||||||
| 47 | 99 | |||||||
| 12,801,523 | 18,973,695 | |||||||
| 8,029 | 11,944 | |||||||
| 1,223,984 | 1,334,990 | |||||||
| 1,232,013 | 1,346,934 | |||||||
| $ | 11,569,510 | $ | 17,626,761 | |||||
| $ | 12,056,232 | $ | 32,883,326 | |||||
| (486,722 | ) | (15,256,565 | ) | |||||
| $ | 11,569,510 | $ | 17,626,761 | |||||
| $ | 11,569,510 | $ | 17,626,761 | |||||
| 450,000 | 625,000 | |||||||
| $ | 25.71 | $ | 28.20 | |||||
| $ | 14,671,251 | $ | 21,001,414 | |||||
| 2,084,977 | 3,097,855 | |||||||
Statements of Assets and Liabilities
April 30, 2022 (Unaudited)
| |
Assets: | |
Investments, at value (a) | |
Interest receivable | |
Deposit at broker for options | |
Total Assets | |
Liabilities: | |
Options written, at value (b) | |
Payable to Adviser | |
Total Liabilities | |
Net Assets | |
Net Assets Consist of: | |
Capital stock | |
Total distributable earnings/(accumulated deficit) | |
Net Assets | |
Net Asset Value: | |
Net assets | |
Shares of beneficial interest outstanding (unlimted shares without par value authorized) | |
Net asset value price per share | |
(a) | Cost of investments |
(b) | Premiums received |
Innovator U.S. Equity Accelerated ETF - January | Innovator U.S. Equity Accelerated ETF - April | Innovator U.S. Equity Accelerated ETF - July | Innovator U.S. Equity Accelerated ETF - October | |||||||||||||
$ | 4,299,007 | $ | 6,953,671 | $ | 5,018,833 | $ | 1,788,657 | |||||||||
2 | 5 | 4 | 1 | |||||||||||||
- | 200 | 2 | 100 | |||||||||||||
4,299,009 | 6,953,876 | 5,018,839 | 1,788,758 | |||||||||||||
30,405 | 210,948 | 24,072 | 39,484 | |||||||||||||
2,990 | 4,676 | 3,509 | 1,214 | |||||||||||||
33,395 | 215,624 | 27,581 | 40,698 | |||||||||||||
$ | 4,265,614 | $ | 6,738,252 | $ | 4,991,258 | $ | 1,748,060 | |||||||||
$ | 4,720,524 | $ | 6,251,492 | $ | 5,315,718 | $ | 1,812,710 | |||||||||
(454,910 | ) | 486,760 | (324,460 | ) | (64,650 | ) | ||||||||||
$ | 4,265,614 | $ | 6,738,252 | $ | 4,991,258 | $ | 1,748,060 | |||||||||
| $ | 4,265,614 | $ | 6,738,252 | $ | 4,991,258 | $ | 1,748,060 | ||||||||
| 200,000 | 250,000 | 200,000 | 75,000 | ||||||||||||
$ | 21.33 | $ | 26.95 | $ | 24.96 | $ | 23.31 | |||||||||
$ | 4,868,012 | $ | 7,928,898 | $ | 5,771,709 | $ | 1,930,290 | |||||||||
152,714 | 555,549 | 479,180 | 124,927 | |||||||||||||
Statements of Assets and Liabilities
April 30, 2022 (Unaudited)
| |
Assets: | |
Investments, at value (a) | |
Interest receivable | |
Deposit at broker for options | |
Total Assets | |
Liabilities: | |
Options written, at value (b) | |
Payable to Adviser | |
Total Liabilities | |
Net Assets | |
Net Assets Consist of: | |
Capital stock | |
Total distributable earnings/(accumulated deficit) | |
Net Assets | |
Net Asset Value: | |
Net assets | |
Shares of beneficial interest outstanding (unlimted shares without par value authorized) | |
Net asset value price per share | |
(a) | Cost of investments |
(b) | Premiums received |
Innovator U.S. Equity Accelerated Plus ETF - January | Innovator U.S. Equity Accelerated Plus ETF - April | Innovator U.S. Equity Accelerated Plus ETF - July | Innovator U.S. Equity Accelerated Plus ETF - October | ||||||||||||
$ | 6,554,611 | $ | 15,154,107 | $ | 14,115,222 | $ | 9,959,431 | ||||||||
3 | 10 | 4 | 3 | ||||||||||||
- | 200 | 13 | 100 | ||||||||||||
6,554,614 | 15,154,317 | 14,115,239 | 9,959,534 | ||||||||||||
128,514 | 1,045,684 | 279,662 | 568,045 | ||||||||||||
4,381 | 9,924 | 9,422 | 6,368 | ||||||||||||
132,895 | 1,055,608 | 289,084 | 574,413 | ||||||||||||
$ | 6,421,719 | $ | 14,098,709 | $ | 13,826,155 | $ | 9,385,121 | ||||||||
$ | 7,289,594 | $ | 13,240,290 | $ | 14,315,505 | $ | 9,954,857 | ||||||||
(867,875 | ) | 858,419 | (489,350 | ) | (569,736 | ) | |||||||||
$ | 6,421,719 | $ | 14,098,709 | $ | 13,826,155 | $ | 9,385,121 | ||||||||
$ | 6,421,719 | $ | 14,098,709 | $ | 13,826,155 | $ | 9,385,121 | ||||||||
| 300,000 | 525,000 | 550,000 | 400,000 | |||||||||||
$ | 21.41 | $ | 26.85 | $ | 25.14 | $ | 23.46 | ||||||||
$ | 8,101,298 | $ | 17,828,115 | $ | 15,972,756 | $ | 11,710,324 | ||||||||
754,041 | 2,477,211 | 1,709,188 | 1,771,514 | ||||||||||||
Statements of Assets and Liabilities
April 30, 2022 (Unaudited)
| |
Assets: | |
Investments, at value (a) | |
Interest receivable | |
ETF variable fee receivable | |
Receivable for investments sold | |
Receivable for fund shares sold | |
Deposit at broker for options | |
Total Assets | |
Liabilities: | |
Options written, at value (b) | |
Payable to Adviser | |
Payable for investments purchased | |
Total Liabilities | |
Net Assets | |
Net Assets Consist of: | |
Capital stock | |
Total distributable earnings/(accumulated deficit) | |
Net Assets | |
Net Asset Value: | |
Net assets | |
Shares of beneficial interest outstanding (unlimted shares without par value authorized) | |
Net asset value price per share | |
(a) | Cost of investments |
(b) | Premiums received |
Innovator U.S. Equity Accelerated 9 Buffer ETF - January | Innovator U.S. Equity Accelerated 9 Buffer ETF - April | Innovator U.S. Equity Accelerated 9 Buffer ETF - July | Innovator U.S. Equity Accelerated 9 Buffer ETF - October | ||||||||||||
$ | 12,479,526 | $ | 25,794,026 | $ | 15,954,760 | $ | 9,015,864 | ||||||||
5 | 13 | 4 | 2 | ||||||||||||
- | - | 640 | - | ||||||||||||
- | - | 48,475 | - | ||||||||||||
- | - | 1,280,390 | - | ||||||||||||
- | 200 | 20 | 100 | ||||||||||||
12,479,531 | 25,794,239 | 17,284,289 | 9,015,966 | ||||||||||||
1,202,629 | 2,959,902 | 582,298 | 708,839 | ||||||||||||
7,735 | 14,374 | 9,272 | 5,212 | ||||||||||||
- | - | 1,327,774 | - | ||||||||||||
1,210,364 | 2,974,276 | 1,919,344 | 714,051 | ||||||||||||
$ | 11,269,167 | $ | 22,819,963 | $ | 15,364,945 | $ | 8,301,915 | ||||||||
$ | 12,118,710 | $ | 23,040,659 | $ | 15,544,182 | $ | 8,570,318 | ||||||||
(849,543 | ) | (220,696 | ) | (179,237 | ) | (268,403 | ) | ||||||||
$ | 11,269,167 | $ | 22,819,963 | $ | 15,364,945 | $ | 8,301,915 | ||||||||
$ | 11,269,167 | $ | 22,819,963 | $ | 15,364,945 | $ | 8,301,915 | ||||||||
| 500,000 | 875,000 | 600,000 | 350,000 | |||||||||||
$ | 22.54 | $ | 26.08 | $ | 25.61 | $ | 23.72 | ||||||||
$ | 13,917,775 | $ | 27,873,829 | $ | 17,361,574 | $ | 9,865,005 | ||||||||
1,453,438 | 3,677,450 | 1,882,914 | 1,315,565 | ||||||||||||
Statements of Assets and Liabilities
April 30, 2022 (Unaudited)
| |
Assets: | |
Investments, at value (a) | |
Interest receivable | |
Deposit at broker for options | |
Total Assets | |
Liabilities: | |
Payable to Adviser | |
Options written, at value (b) | |
Total Liabilities | |
Net Assets | |
Net Assets Consist of: | |
Capital stock | |
Total distributable earnings/(accumulated deficit) | |
Net Assets | |
Net Asset Value: | |
Net assets | |
Shares of beneficial interest outstanding (unlimted shares without par value authorized) | |
Net asset value price per share | |
(a) | Cost of investments |
(b) | Premiums received |
Innovator Growth Accelerated Plus ETF - January | Innovator Growth Accelerated Plus ETF - April | Innovator Growth Accelerated Plus ETF - July | Innovator Growth Accelerated Plus ETF - October | ||||||||||||
$ | 8,641,517 | $ | 11,550,887 | $ | 15,874,873 | $ | 5,530,870 | ||||||||
4 | 8 | 4 | 2 | ||||||||||||
- | 200 | 3 | 100 | ||||||||||||
8,641,521 | 11,551,095 | 15,874,880 | 5,530,972 | ||||||||||||
5,995 | 7,963 | 11,548 | 3,885 | ||||||||||||
121,665 | 836,878 | 84,868 | 140,175 | ||||||||||||
127,660 | 844,841 | 96,416 | 144,060 | ||||||||||||
$ | 8,513,861 | $ | 10,706,254 | $ | 15,778,464 | $ | 5,386,912 | ||||||||
$ | 10,254,129 | $ | 11,549,160 | $ | 17,974,391 | $ | 6,295,977 | ||||||||
(1,740,268 | ) | (842,906 | ) | (2,195,927 | ) | (909,065 | ) | ||||||||
$ | 8,513,861 | $ | 10,706,254 | $ | 15,778,464 | $ | 5,386,912 | ||||||||
$ | 8,513,861 | $ | 10,706,254 | $ | 15,778,464 | $ | 5,386,912 | ||||||||
| 425,000 | 400,000 | 700,000 | 250,000 | |||||||||||
$ | 20.03 | $ | 26.77 | $ | 22.54 | $ | 21.55 | ||||||||
$ | 11,504,297 | $ | 14,857,456 | $ | 20,319,616 | $ | 7,843,813 | ||||||||
1,149,866 | 2,576,441 | 2,400,415 | 1,565,527 | ||||||||||||
Statements of Assets and Liabilities
April 30, 2022 (Unaudited)
| |
Assets: | |
Investments, at value (a) | |
Interest receivable | |
Deposit at broker for options | |
Total Assets | |
Liabilities: | |
Options written, at value (b) | |
Payable to Adviser | |
Due to broker for options | |
Total Liabilities | |
Net Assets | |
Net Assets Consist of: | |
Capital stock | |
Total distributable earnings/(accumulated deficit) | |
Net Assets | |
Net Asset Value: | |
Net assets | |
Shares of beneficial interest outstanding (unlimted shares without par value authorized) | |
Net asset value price per share | |
(a) | Cost of investments |
(b) | Premiums received |
Innovator 20+ Year Treasury Bond 9 Buffer ETF - July | Innovator 20+ Year Treasury Bond 5 Floor ETF - Quarterly | |||||||
| $ | 6,611,918 | $ | 11,489,225 | |||||
| - | 2 | |||||||
| - | 200 | |||||||
| 6,611,918 | 11,489,427 | |||||||
| 615,591 | 18,450 | |||||||
| 4,291 | 6,210 | |||||||
| 2,433 | - | |||||||
| 622,315 | 24,660 | |||||||
| $ | 5,989,603 | $ | 11,464,767 | |||||
| $ | 7,027,218 | $ | 13,268,625 | |||||
| (1,037,615 | ) | (1,803,858 | ) | |||||
| $ | 5,989,603 | $ | 11,464,767 | |||||
| $ | 5,989,603 | $ | 11,464,767 | |||||
| 275,000 | 525,000 | |||||||
| $ | 21.78 | $ | 21.84 | |||||
| $ | 7,021,914 | $ | 11,913,241 | |||||
| 273,175 | 109,772 | |||||||
Statements of Assets and Liabilities
April 30, 2022 (Unaudited)
| |
Assets: | |
Investments, at value (a) | |
Interest receivable | |
Deposit at broker for options | |
Total Assets | |
Liabilities: | |
Options written, at value (b) | |
Payable to Adviser | |
Total Liabilities | |
Net Assets | |
Net Assets Consist of: | |
Capital stock | |
Total distributable earnings/(accumulated deficit) | |
Net Assets | |
Net Asset Value: | |
Net assets | |
Shares of beneficial interest outstanding (unlimted shares without par value authorized) | |
Net asset value price per share | |
(a) | Cost of investments |
(b) | Premiums received |
Innovator Defined Wealth Shield ETF | Innovator U.S. Equity Accelerated ETF - Quarterly | Innovator Growth Accelerated ETF - Quarterly | ||||||||||
| $ | 105,532,989 | $ | 9,381,543 | $ | 10,875,882 | |||||||
| 15 | 2 | 2 | ||||||||||
| 200 | 100 | 101 | ||||||||||
| 105,533,204 | 9,381,645 | 10,875,985 | ||||||||||
| 1,535,205 | 23,858 | 33,483 | ||||||||||
| 56,360 | 6,783 | 7,759 | ||||||||||
| 1,591,565 | 30,641 | 41,242 | ||||||||||
| $ | 103,941,639 | $ | 9,351,004 | $ | 10,834,743 | |||||||
| $ | 105,270,877 | $ | 10,497,413 | $ | 12,873,672 | |||||||
| (1,329,238 | ) | (1,146,409 | ) | (2,038,929 | ) | |||||||
| $ | 103,941,639 | $ | 9,351,004 | $ | 10,834,743 | |||||||
| $ | 103,941,639 | $ | 9,351,004 | $ | 10,834,743 | |||||||
| 4,075,000 | 375,000 | 450,000 | ||||||||||
| $ | 25.51 | $ | 24.94 | $ | 24.08 | |||||||
| $ | 108,711,009 | $ | 10,568,020 | $ | 13,150,819 | |||||||
| 3,415,665 | 301,432 | 591,727 | ||||||||||
Statements of Operations
For the Period Ended April 30, 2022 (Unaudited)
| |
Investment Income: | |
Interest | |
Total Investment Income | |
Expenses: | |
Investment advisory fee | |
Total Expenses | |
Net Investment Income/(Loss) | |
Realized & Unrealized Gain/(Loss): | |
Net realized gain/(loss) on: | |
Investments | |
Redemptions sold in-kind on investments | |
Redemptions sold in-kind on options written | |
Options written | |
Net change in unrealized appreciation/(depreciation) on: | |
Investments | |
Options written | |
Net Realized and Unrealized Gain/(Loss) on Investments and Options Written | |
Net Increase/(Decrease) in Net Assets Resulting From Operations | |
Innovator International Developed Power Buffer ETF - January | Innovator International Developed Power Buffer ETF - April | Innovator International Developed Power Buffer ETF - July | Innovator International Developed Power Buffer ETF - October | ||||||||||||
$ | 52 | $ | 25 | $ | 14 | $ | 8 | ||||||||
52 | 25 | 14 | 8 | ||||||||||||
297,095 | 114,383 | 232,462 | 62,464 | ||||||||||||
297,095 | 114,383 | 232,462 | 62,464 | ||||||||||||
(297,043 | ) | (114,358 | ) | (232,448 | ) | (62,456 | ) | ||||||||
(2,965,546 | ) | (1,500,717 | ) | (166,159 | ) | - | |||||||||
3,470,371 | 36,150 | 124,181 | 61,804 | ||||||||||||
3,089,836 | 1,050,650 | 81,043 | 29,563 | ||||||||||||
151,553 | 22,094 | 14,889 | - | ||||||||||||
(3,879,317 | ) | (649,967 | ) | (931,299 | ) | (467,111 | ) | ||||||||
(5,158,659 | ) | (1,449,501 | ) | (1,631,838 | ) | (606,590 | ) | ||||||||
(5,291,762 | ) | (2,491,291 | ) | (2,509,183 | ) | (982,334 | ) | ||||||||
$ | (5,588,805 | ) | $ | (2,605,649 | ) | $ | (2,741,631 | ) | $ | (1,044,790 | ) | ||||
Statements of Operations
For the Period Ended April 30, 2022 (Unaudited)
| |
Investment Income: | |
Interest | |
Total Investment Income | |
Expenses: | |
Investment advisory fee | |
Total Expenses | |
Net Investment Income/(Loss) | |
Realized & Unrealized Gain/(Loss): | |
Net realized gain/(loss) on: | |
Investments | |
Redemptions sold in-kind on investments | |
Redemptions sold in-kind on options written | |
Options written | |
Net change in unrealized appreciation/(depreciation) on: | |
Investments | |
Options written | |
Net Realized and Unrealized Gain/(Loss) on Investments and Options Written | |
Net Increase/(Decrease) in Net Assets Resulting From Operations | |
Innovator Emerging Markets Power Buffer ETF - January | Innovator Emerging Markets Power Buffer ETF - April | Innovator Emerging Markets Power Buffer ETF - July | Innovator Emerging Markets Power Buffer ETF - October | ||||||||||||
$ | 55 | $ | 18 | $ | 9 | $ | 4 | ||||||||
55 | 18 | 9 | 4 | ||||||||||||
449,312 | 140,047 | 168,054 | 31,825 | ||||||||||||
449,312 | 140,047 | 168,054 | 31,825 | ||||||||||||
(449,257 | ) | (140,029 | ) | (168,045 | ) | (31,821 | ) | ||||||||
(10,053,167 | ) | (4,709,333 | ) | (817,592 | ) | - | |||||||||
(5,734 | ) | 2,552,606 | 116,555 | - | |||||||||||
229,456 | 604,303 | 74,430 | - | ||||||||||||
7,904,807 | 839,787 | 1,412 | - | ||||||||||||
3,695,949 | 2,330,303 | (84,530 | ) | (140,358 | ) | ||||||||||
(9,383,394 | ) | (2,805,632 | ) | (1,344,259 | ) | (345,045 | ) | ||||||||
(7,612,083 | ) | (1,187,966 | ) | (2,053,984 | ) | (485,403 | ) | ||||||||
$ | (8,061,340 | ) | $ | (1,327,995 | ) | $ | (2,222,029 | ) | $ | (517,224 | ) | ||||
Statements of Operations
For the Period Ended April 30, 2022 (Unaudited)
| |
Investment Income: | |
Interest | |
Total Investment Income | |
Expenses: | |
Investment advisory fee | |
Total Expenses | |
Net Investment Income/(Loss) | |
Realized & Unrealized Gain/(Loss): | |
Net realized gain/(loss) on: | |
Investments | |
Redemptions sold in-kind on investments | |
Redemptions sold in-kind on options written | |
Options written | |
Net change in unrealized appreciation/(depreciation) on: | |
Investments | |
Options written | |
Net Realized and Unrealized Gain/(Loss) on Investments and Options Written | |
Net Increase/(Decrease) in Net Assets Resulting From Operations | |
Innovator Growth-100 Power Buffer ETF - January | Innovator Growth-100 Power Buffer ETF - April | Innovator Growth-100 Power Buffer ETF - July | Innovator Growth-100 Power Buffer ETF - October | ||||||||||||
$ | 73 | $ | 29 | $ | 13 | $ | 30 | ||||||||
73 | 29 | 13 | 30 | ||||||||||||
432,426 | 163,731 | 206,839 | 275,305 | ||||||||||||
432,426 | 163,731 | 206,839 | 275,305 | ||||||||||||
(432,353 | ) | (163,702 | ) | (206,826 | ) | (275,275 | ) | ||||||||
(6,315,599 | ) | (297,563 | ) | (311,207 | ) | (325,517 | ) | ||||||||
17,821,190 | 2,640,609 | 435,482 | 529,114 | ||||||||||||
3,641,629 | 2,750,154 | 59,702 | 188,703 | ||||||||||||
(6,297,219 | ) | (1,158,268 | ) | (195,279 | ) | (312,149 | ) | ||||||||
(21,614,483 | ) | (8,969,172 | ) | (6,459,791 | ) | (8,341,873 | ) | ||||||||
(753,594 | ) | 1,775,684 | 2,826,358 | 2,926,636 | |||||||||||
(13,518,076 | ) | (3,258,556 | ) | (3,644,735 | ) | (5,335,086 | ) | ||||||||
| $ | (13,950,429 | ) | $ | (3,422,258 | ) | $ | (3,851,561 | ) | $ | (5,610,361 | ) | |||
Statements of Operations
For the Period Ended April 30, 2022 (Unaudited)
| |
Investment Income: | |
Interest | |
Total Investment Income | |
Expenses: | |
Investment advisory fee | |
Total Expenses | |
Net Investment Income/(Loss) | |
Realized & Unrealized Gain/(Loss): | |
Net realized gain/(loss) on: | |
Investments | |
Redemptions sold in-kind on investments | |
Redemptions sold in-kind on options written | |
Options written | |
Net change in unrealized appreciation/(depreciation) on: | |
Investments | |
Options written | |
Net Realized and Unrealized Gain/(Loss) on Investments and Options Written | |
Net Increase/(Decrease) in Net Assets Resulting From Operations | |
Innovator U.S. Small Cap Power Buffer ETF - January | Innovator U.S. Small Cap Power Buffer ETF - April | Innovator U.S. Small Cap Power Buffer ETF - July | Innovator U.S. Small Cap Power Buffer ETF - October | ||||||||||||
$ | 65 | $ | 40 | $ | 15 | $ | 19 | ||||||||
65 | 40 | 15 | 19 | ||||||||||||
421,286 | 328,403 | 265,961 | 164,143 | ||||||||||||
421,286 | 328,403 | 265,961 | 164,143 | ||||||||||||
(421,221 | ) | (328,363 | ) | (265,946 | ) | (164,124 | ) | ||||||||
(8,069,928 | ) | (6,445,587 | ) | (522,231 | ) | (420,643 | ) | ||||||||
10,586,872 | (497,544 | ) | 247,914 | - | |||||||||||
6,735,738 | 6,382,627 | 406,054 | - | ||||||||||||
2,478,306 | 545,595 | (37,598 | ) | (47,731 | ) | ||||||||||
(16,412,317 | ) | (3,333,775 | ) | (4,203,116 | ) | (4,242,674 | ) | ||||||||
(5,133,779 | ) | (3,865,569 | ) | (936,960 | ) | 633,842 | |||||||||
(9,815,108 | ) | (7,214,253 | ) | (5,045,937 | ) | (4,077,206 | ) | ||||||||
| $ | (10,236,329 | ) | $ | (7,542,616 | ) | $ | (5,311,883 | ) | $ | (4,241,330 | ) | |||
Statements of Operations
For the Period Ended April 30, 2022 (Unaudited)
| |
Investment Income: | |
Interest | |
Total Investment Income | |
Expenses: | |
Investment advisory fee | |
Total Expenses | |
Net Investment Income/(Loss) | |
Realized & Unrealized Gain/(Loss): | |
Net realized gain/(loss) on: | |
Investments | |
Redemptions sold in-kind on investments | |
Redemptions sold in-kind on options written | |
Options written | |
Net change in unrealized appreciation/(depreciation) on: | |
Investments | |
Options written | |
Net Realized and Unrealized Gain/(Loss) on Investments and Options Written | |
Net Increase/(Decrease) in Net Assets Resulting From Operations | |
Innovator Double Stacker ETF - January | Innovator Double Stacker ETF - October | |||||||
| $ | 4 | $ | 3 | |||||
| 4 | 3 | |||||||
| 23,367 | 32,552 | |||||||
| 23,367 | 32,552 | |||||||
| (23,363 | ) | (32,549 | ) | |||||
| 493,150 | 22,624 | |||||||
| 1,644,734 | (25,038 | ) | ||||||
| 33,515 | 24,467 | |||||||
| (1,400,768 | ) | 1,632 | ||||||
| (2,830,425 | ) | (1,755,547 | ) | |||||
| 1,347,585 | 1,018,626 | |||||||
| (712,209 | ) | (713,236 | ) | |||||
| $ | (735,572 | ) | $ | (745,785 | ) | |||
Statements of Operations
For the Period Ended April 30, 2022 (Unaudited)
| |
Investment Income: | |
Interest | |
Total Investment Income | |
Expenses: | |
Investment advisory fee | |
Total Expenses | |
Net Investment Income/(Loss) | |
Realized & Unrealized Gain/(Loss): | |
Net realized gain/(loss) on: | |
Investments | |
Redemptions sold in-kind on investments | |
Redemptions sold in-kind on options written | |
Options written | |
Net change in unrealized appreciation/(depreciation) on: | |
Investments | |
Options written | |
Net Realized and Unrealized Gain/(Loss) on Investments and Options Written | |
Net Increase/(Decrease) in Net Assets Resulting From Operations | |
Innovator Triple Stacker ETF - January | Innovator Triple Stacker ETF - October | |||||||
| $ | 10 | $ | 6 | |||||
| 10 | 6 | |||||||
| 111,419 | 54,407 | |||||||
| 111,419 | 54,407 | |||||||
| (111,409 | ) | (54,401 | ) | |||||
| (2,919,508 | ) | (225,772 | ) | |||||
| 11,302,990 | 12,347 | |||||||
| 2,077,068 | 134,469 | |||||||
| (7,413,634 | ) | 65,495 | ||||||
| (15,046,421 | ) | (3,666,232 | ) | |||||
| 9,247,541 | 2,755,256 | |||||||
| (2,751,964 | ) | (924,437 | ) | |||||
| $ | (2,863,373 | ) | $ | (978,838 | ) | |||
Statements of Operations
For the Period Ended April 30, 2022 (Unaudited)
| |
Investment Income: | |
Interest | |
Total Investment Income | |
Expenses: | |
Investment advisory fee | |
Total Expenses | |
Net Investment Income/(Loss) | |
Realized & Unrealized Gain/(Loss): | |
Net realized gain/(loss) on: | |
Investments | |
Redemptions sold in-kind on investments | |
Redemptions sold in-kind on options written | |
Options written | |
Net change in unrealized appreciation/(depreciation) on: | |
Investments | |
Options written | |
Net Realized and Unrealized Gain/(Loss) on Investments and Options Written | |
Net Increase/(Decrease) in Net Assets Resulting From Operations | |
Innovator Double Stacker 9 Buffer ETF - January | Innovator Double Stacker 9 Buffer ETF - October | |||||||
| $ | 8 | $ | 10 | |||||
| 8 | 10 | |||||||
| 53,601 | 79,231 | |||||||
| 53,601 | 79,231 | |||||||
| (53,593 | ) | (79,221 | ) | |||||
| (1,233,107 | ) | (43,568 | ) | |||||
| 4,215,403 | - | |||||||
| 557,072 | - | |||||||
| (2,696,002 | ) | (49,750 | ) | |||||
| (4,869,350 | ) | (2,059,081 | ) | |||||
| 2,876,622 | 1,222,579 | |||||||
| (1,149,362 | ) | (929,820 | ) | |||||
| $ | (1,202,955 | ) | $ | (1,009,041 | ) | |||
Statements of Operations
For the Period Ended April 30, 2022 (Unaudited)
| |
Investment Income: | |
Interest | |
Total Investment Income | |
Expenses: | |
Investment advisory fee | |
Total Expenses | |
Net Investment Income/(Loss) | |
Realized & Unrealized Gain/(Loss): | |
Net realized gain/(loss) on: | |
Investments | |
Redemptions sold in-kind on investments | |
Redemptions sold in-kind on options written | |
Options written | |
Net change in unrealized appreciation/(depreciation) on: | |
Investments | |
Options written | |
Net Realized and Unrealized Gain/(Loss) on Investments and Options Written | |
Net Increase/(Decrease) in Net Assets Resulting From Operations | |
(a) Since Commencement of Operations on December 31, 2021. | |
Innovator U.S. Equity Accelerated ETF - January | (a) | Innovator U.S. Equity Accelerated ETF - April | Innovator U.S. Equity Accelerated ETF - July | Innovator U.S. Equity Accelerated ETF - October | ||||||||||||
$ | 3 | $ | 5 | $ | 5 | $ | 1 | |||||||||
3 | 5 | 5 | 1 | |||||||||||||
8,217 | 29,945 | 18,552 | 7,363 | |||||||||||||
8,217 | 29,945 | 18,552 | 7,363 | |||||||||||||
(8,214 | ) | (29,940 | ) | (18,547 | ) | (7,362 | ) | |||||||||
- | 1,011,976 | - | - | |||||||||||||
- | 410,766 | - | - | |||||||||||||
- | 308,646 | - | - | |||||||||||||
- | (551,713 | ) | - | - | ||||||||||||
(569,005 | ) | (2,557,103 | ) | (1,117,994 | ) | (325,288 | ) | |||||||||
122,309 | 1,219,105 | 627,451 | 184,829 | |||||||||||||
(446,696 | ) | (158,323 | ) | (490,543 | ) | (140,459 | ) | |||||||||
| $ | (454,910 | ) | $ | (188,263 | ) | $ | (509,090 | ) | $ | (147,821 | ) | ||||
Statements of Operations
For the Period Ended April 30, 2022 (Unaudited)
| |
Investment Income: | |
Interest | |
Total Investment Income | |
Expenses: | |
Investment advisory fee | |
Total Expenses | |
Net Investment Income/(Loss) | |
Realized & Unrealized Gain/(Loss): | |
Net realized gain/(loss) on: | |
Investments | |
Redemptions sold in-kind on investments | |
Redemptions sold in-kind on options written | |
Options written | |
Net change in unrealized appreciation/(depreciation) on: | |
Investments | |
Options written | |
Net Realized and Unrealized Gain/(Loss) on Investments and Options Written | |
Net Increase/(Decrease) in Net Assets Resulting From Operations | |
(a) Since Commencement of Operations on December 31, 2021. | |
Innovator U.S. Equity Accelerated Plus ETF - January | (a) | Innovator U.S. Equity Accelerated Plus ETF - April | Innovator U.S. Equity Accelerated Plus ETF - July | Innovator U.S. Equity Accelerated Plus ETF - October | ||||||||||||
$ | 4 | $ | 11 | $ | 6 | $ | 4 | |||||||||
4 | 11 | 6 | 4 | |||||||||||||
14,920 | 48,914 | 43,253 | 21,523 | |||||||||||||
14,920 | 48,914 | 43,253 | 21,523 | |||||||||||||
(14,916 | ) | (48,903 | ) | (43,247 | ) | (21,519 | ) | |||||||||
- | 1,653,911 | - | - | |||||||||||||
1,309 | 2,638,399 | - | - | |||||||||||||
66,892 | 315,611 | - | - | |||||||||||||
- | (2,432,204 | ) | - | - | ||||||||||||
(1,546,687 | ) | (4,561,579 | ) | (2,995,936 | ) | (1,930,507 | ) | |||||||||
625,527 | 2,792,274 | 2,181,656 | 1,325,541 | |||||||||||||
(852,959 | ) | 406,412 | (814,280 | ) | (604,966 | ) | ||||||||||
| $ | (867,875 | ) | $ | 357,509 | $ | (857,527 | ) | $ | (626,485 | ) | |||||
Statements of Operations
For the Period Ended April 30, 2022 (Unaudited)
| |
Investment Income: | |
Interest | |
Total Investment Income | |
Expenses: | |
Investment advisory fee | |
Total Expenses | |
Net Investment Income/(Loss) | |
Realized & Unrealized Gain/(Loss): | |
Net realized gain/(loss) on: | |
Investments | |
Redemptions sold in-kind on investments | |
Redemptions sold in-kind on options written | |
Options written | |
Net change in unrealized appreciation/(depreciation) on: | |
Investments | |
Options written | |
Net Realized and Unrealized Gain/(Loss) on Investments and Options Written | |
Net Increase/(Decrease) in Net Assets Resulting From Operations | |
(a) Since Commencement of Operations on December 31, 2021. | |
Innovator U.S. Equity Accelerated 9 Buffer ETF - January | (a) | Innovator U.S. Equity Accelerated 9 Buffer ETF - April | Innovator U.S. Equity Accelerated 9 Buffer ETF - July | Innovator U.S. Equity Accelerated 9 Buffer ETF - October | ||||||||||||
$ | 8 | $ | 15 | $ | 7 | $ | 4 | |||||||||
8 | 15 | 7 | 4 | |||||||||||||
29,982 | 89,946 | 47,913 | 24,053 | |||||||||||||
29,982 | 89,946 | 47,913 | 24,053 | |||||||||||||
(29,974 | ) | (89,931 | ) | (47,906 | ) | (24,049 | ) | |||||||||
- | 202,849 | - | - | |||||||||||||
157,846 | 1,170,491 | - | - | |||||||||||||
210,025 | 1,332,986 | - | - | |||||||||||||
- | (1,385,753 | ) | - | - | ||||||||||||
(1,438,249 | ) | (5,045,531 | ) | (2,165,088 | ) | (1,120,266 | ) | |||||||||
250,809 | 3,052,889 | 1,751,714 | 789,929 | |||||||||||||
(819,569 | ) | (672,069 | ) | (413,374 | ) | (330,337 | ) | |||||||||
| $ | (849,543 | ) | $ | (762,000 | ) | $ | (461,280 | ) | $ | (354,386 | ) | ||||
Statements of Operations
For the Period Ended April 30, 2022 (Unaudited)
| |
Investment Income: | |
Interest | |
Total Investment Income | |
Expenses: | |
Investment advisory fee | |
Total Expenses | |
Net Investment Income/(Loss) | |
Realized & Unrealized Gain/(Loss): | |
Net realized gain/(loss) on: | |
Investments | |
Redemptions sold in-kind on investments | |
Redemptions sold in-kind on options written | |
Options written | |
Net change in unrealized appreciation/(depreciation) on: | |
Investments | |
Options written | |
Net Realized and Unrealized Gain/(Loss) on Investments and Options Written | |
Net Increase/(Decrease) in Net Assets Resulting From Operations | |
(a) Since Commencement of Operations on December 31, 2021. | |
Innovator Growth Accelerated Plus ETF - January | (a) | Innovator Growth Accelerated Plus ETF - April | Innovator Growth Accelerated Plus ETF - July | Innovator Growth Accelerated Plus ETF - October | ||||||||||||
$ | 6 | $ | 9 | $ | 6 | $ | 3 | |||||||||
6 | 9 | 6 | 3 | |||||||||||||
19,774 | 68,795 | 51,571 | 20,322 | |||||||||||||
19,774 | 68,795 | 51,571 | 20,322 | |||||||||||||
(19,768 | ) | (68,786 | ) | (51,565 | ) | (20,319 | ) | |||||||||
- | (1,954,568 | ) | - | - | ||||||||||||
32,652 | 1,341,608 | - | - | |||||||||||||
81,427 | 3,837,889 | - | - | |||||||||||||
- | (2,347,337 | ) | - | - | ||||||||||||
(2,862,780 | ) | (6,112,429 | ) | (5,516,684 | ) | (2,705,865 | ) | |||||||||
1,028,201 | 5,187,424 | 2,954,442 | 1,698,883 | |||||||||||||
(1,720,500 | ) | (47,413 | ) | (2,562,242 | ) | (1,006,982 | ) | |||||||||
| $ | (1,740,268 | ) | $ | (116,199 | ) | $ | (2,613,807 | ) | $ | (1,027,301 | ) | ||||
Statements of Operations
For the Period Ended April 30, 2022 (Unaudited)
| |
Investment Income: | |
Interest | |
Total Investment Income | |
Expenses: | |
Investment advisory fee | |
Total Expenses | |
Net Investment Income/(Loss) | |
Realized & Unrealized Gain/(Loss): | |
Net realized gain/(loss) on: | |
Investments | |
Redemptions sold in-kind on investments | |
Redemptions sold in-kind on options written | |
Options written | |
Net change in unrealized appreciation/(depreciation) on: | |
Investments | |
Options written | |
Net Realized and Unrealized Gain/(Loss) on Investments and Options Written | |
Net Increase/(Decrease) in Net Assets Resulting From Operations | |
Innovator 20+ Year Treasury Bond 9 Buffer ETF - July | Innovator 20+ Year Treasury Bond 5 Floor ETF - Quarterly | |||||||
| $ | - | $ | 2 | |||||
| - | 2 | |||||||
| 23,450 | 38,080 | |||||||
| 23,450 | 38,080 | |||||||
| (23,450 | ) | (38,078 | ) | |||||
| - | (469,124 | ) | ||||||
| 27,128 | (40,109 | ) | ||||||
| (12,314 | ) | 82,942 | ||||||
| - | 61,562 | |||||||
| (356,628 | ) | (605,021 | ) | |||||
| (388,352 | ) | 129,973 | ||||||
| (730,166 | ) | (839,777 | ) | |||||
| $ | (753,616 | ) | $ | (877,855 | ) | |||
Statements of Operations
For the Period Ended April 30, 2022 (Unaudited)
| |
Investment Income: | |
Interest | |
Total Investment Income | |
Expenses: | |
Investment advisory fee | |
Total Expenses | |
Net Investment Income/(Loss) | |
Realized & Unrealized Gain/(Loss): | |
Net realized gain/(loss) on: | |
Investments | |
Redemptions sold in-kind on investments | |
Redemptions sold in-kind on options written | |
Options written | |
Net change in unrealized appreciation/(depreciation) on: | |
Investments | |
Options written | |
Net Realized and Unrealized Gain/(Loss) on Investments and Options Written | |
Net Increase/(Decrease) in Net Assets Resulting From Operations | |
Innovator Defined Wealth Shield ETF | Innovator U.S. Equity Accelerated ETF - Quarterly | Innovator Growth Accelerated ETF - Quarterly | ||||||||||
| $ | 18 | $ | 3 | $ | 3 | |||||||
| 18 | 3 | 3 | ||||||||||
| 248,551 | 48,596 | 54,325 | ||||||||||
| 248,551 | 48,596 | 54,325 | ||||||||||
| (248,533 | ) | (48,593 | ) | (54,322 | ) | |||||||
| (5,124,818 | ) | 44,466 | (694,149 | ) | ||||||||
| 4,865,440 | 1,921,388 | 2,145,444 | ||||||||||
| 2,339,727 | 5,682 | 75,502 | ||||||||||
| (1,640,406 | ) | (1,534,255 | ) | (1,485,576 | ) | |||||||
| (4,197,373 | ) | (2,662,185 | ) | (4,140,801 | ) | |||||||
| 2,752,217 | 1,183,456 | 1,613,145 | ||||||||||
| (1,005,213 | ) | (1,041,448 | ) | (2,486,435 | ) | |||||||
| $ | (1,253,746 | ) | $ | (1,090,041 | ) | $ | (2,540,757 | ) | ||||
Statements of Changes in Net Assets
Innovator International Developed Power Buffer ETF - | ||||||||
Period Ended | Year Ended | |||||||
April 30, 2022 | October 31, 2021 | |||||||
(Unaudited) | ||||||||
Operations: | ||||||||
Net investment income/(loss) | $ | (297,043 | ) | $ | (639,373 | ) | ||
Net realized gain/(loss) | 3,746,214 | (129,492 | ) | |||||
Net change in unrealized appreciation/(depreciation) | (9,037,976 | ) | 9,423,414 | |||||
Net Increase/(Decrease) in Net Assets Resulting from Operations | (5,588,805 | ) | 8,654,549 | |||||
Capital Share Transactions: | ||||||||
Proceeds from shares sold | 98,311,822 | 117,183,723 | ||||||
Cost of shares redeemed | (61,309,487 | ) | (120,840,580 | ) | ||||
Transaction fees (see Note 5) | 24,801 | 37,205 | ||||||
Net Increase/(Decrease) in Net Assets from Capital Share Transactions | 37,027,136 | (3,619,652 | ) | |||||
Total Increase/(Decrease) in Net Assets | $ | 31,438,331 | $ | 5,034,897 | ||||
Net Assets: | ||||||||
Beginning of period | $ | 57,449,594 | $ | 52,414,697 | ||||
End of period | $ | 88,887,925 | $ | 57,449,594 | ||||
Change in Shares Outstanding: | ||||||||
Shares sold | 3,675,000 | 4,650,000 | ||||||
Shares redeemed | (2,300,000 | ) | (4,725,000 | ) | ||||
Net Increase/(Decrease) | 1,375,000 | (75,000 | ) | |||||
(a) Since Commencement of Operations on March 31, 2021. |
(b) Since Commencement of Operations on Spetember 30, 2021. |
Innovator International Developed Power Buffer ETF - April | Innovator International Developed Power Buffer ETF - July | Innovator International Developed Power Buffer ETF - October | |||||||||||||||||||||||
Period Ended | Period Ended | Period Ended | Year Ended | Period Ended | Period Ended | ||||||||||||||||||||
April 30, 2022 | October 31, 2021 | (a) | April 30, 2022 | October 31, 2021 | April 30, 2022 | October 31, 2021 | (b) | ||||||||||||||||||
(Unaudited) | (Unaudited) | (Unaudited) | |||||||||||||||||||||||
$ | (114,358 | ) | $ | (107,854 | ) | $ | (232,448 | ) | $ | (442,845 | ) | $ | (62,456 | ) | $ | (4,901 | ) | ||||||||
(391,823 | ) | (83,171 | ) | 53,954 | 4,876,158 | 91,367 | - | ||||||||||||||||||
(2,099,468 | ) | 668,567 | (2,563,137 | ) | 737,007 | (1,073,701 | ) | 169,045 | |||||||||||||||||
| (2,605,649 | ) | 477,542 | (2,741,631 | ) | 5,170,320 | (1,044,790 | ) | 164,144 | ||||||||||||||||
82,147,535 | 27,887,895 | 11,985,068 | 55,548,080 | 9,974,822 | 9,359,728 | ||||||||||||||||||||
(45,090,110 | ) | (8,335,145 | ) | (6,646,730 | ) | (74,492,673 | ) | (1,264,080 | ) | - | |||||||||||||||
38,271 | 16,511 | 7,181 | 31,757 | 4,031 | 1,243 | ||||||||||||||||||||
| 37,095,696 | 19,569,261 | 5,345,519 | (18,912,836 | ) | 8,714,773 | 9,360,971 | ||||||||||||||||||
$ | 34,490,047 | $ | 20,046,803 | $ | 2,603,888 | $ | (13,742,516 | ) | $ | 7,669,983 | $ | 9,525,115 | |||||||||||||
$ | 20,046,803 | $ | - | $ | 56,140,699 | $ | 69,883,215 | $ | 9,525,115 | $ | - | ||||||||||||||
$ | 54,536,850 | $ | 20,046,803 | $ | 58,744,587 | $ | 56,140,699 | $ | 17,195,098 | $ | 9,525,115 | ||||||||||||||
3,350,000 | 1,100,000 | 500,000 | 2,275,000 | 400,000 | 375,000 | ||||||||||||||||||||
(1,825,000 | ) | (325,000 | ) | (275,000 | ) | (3,075,000 | ) | (50,000 | ) | - | |||||||||||||||
1,525,000 | 775,000 | 225,000 | 350,000 | 350,000 | 375,000 | ||||||||||||||||||||
Statements of Changes in Net Assets
Innovator Emerging Markets Power Buffer ETF - January | ||||||||
Period Ended | Year Ended | |||||||
April 30, 2022 | October 31, 2021 | |||||||
(Unaudited) | ||||||||
Operations: | ||||||||
Net investment income/(loss) | $ | (449,257 | ) | $ | (845,506 | ) | ||
Net realized gain/(loss) | (1,924,638 | ) | 142,266 | |||||
Net change in unrealized appreciation/(depreciation) | (5,687,445 | ) | 3,517,067 | |||||
Net Increase/(Decrease) in Net Assets Resulting from Operations | (8,061,340 | ) | 2,813,827 | |||||
Capital Share Transactions: | ||||||||
Proceeds from shares sold | 18,399,455 | 153,950,840 | ||||||
Cost of shares redeemed | (33,841,955 | ) | (78,448,160 | ) | ||||
Transaction fees (see Note 5) | 22,547 | 63,524 | ||||||
Net Increase/(Decrease) in Net Assets from Capital Share Transactions | (15,419,953 | ) | 75,566,204 | |||||
Total Increase/(Decrease) in Net Assets | $ | (23,481,293 | ) | $ | 78,380,031 | |||
Net Assets: | ||||||||
Beginning of period | $ | 106,319,684 | $ | 27,939,653 | ||||
End of period | $ | 82,838,391 | $ | 106,319,684 | ||||
Change in Shares Outstanding: | ||||||||
Shares sold | 625,000 | 5,150,000 | ||||||
Shares redeemed | (1,175,000 | ) | (2,625,000 | ) | ||||
Net Increase/(Decrease) | (550,000 | ) | 2,525,000 | |||||
(a) Since Commencement of Operations on March 31, 2021. |
(b) Since Commencement of Operations on September 30, 2021. |
Innovator Emerging Markets Power Buffer ETF - April | Innovator Emerging Markets Power Buffer ETF - July | Innovator Emerging Markets Power Buffer ETF - October | |||||||||||||||||||||||
Period Ended | Period Ended | Period Ended | Year Ended | Period Ended | Period Ended | ||||||||||||||||||||
April 30, 2022 | October 31, 2021 | (a) | April 30, 2022 | October 31, 2021 | April 30, 2022 | October 31, 2021 | (b) | ||||||||||||||||||
(Unaudited) | (Unaudited) | (Unaudited) | |||||||||||||||||||||||
$ | (140,029 | ) | $ | (135,817 | ) | $ | (168,045 | ) | $ | (246,717 | ) | $ | (31,821 | ) | $ | (2,576 | ) | ||||||||
(712,637 | ) | (259,419 | ) | (625,195 | ) | 2,059,886 | - | - | |||||||||||||||||
(475,329 | ) | (284,255 | ) | (1,428,789 | ) | (1,622,015 | ) | (485,403 | ) | 35,021 | |||||||||||||||
| (1,327,995 | ) | (679,491 | ) | (2,222,029 | ) | 191,154 | (517,224 | ) | 32,445 | |||||||||||||||
42,077,650 | 39,049,253 | 1,896,937 | 28,219,658 | 4,259,405 | 5,013,670 | ||||||||||||||||||||
(37,849,520 | ) | (4,355,405 | ) | (8,919,520 | ) | (22,384,255 | ) | - | - | ||||||||||||||||
10,533 | 16,635 | 4,460 | 13,475 | 1,500 | 632 | ||||||||||||||||||||
| 4,238,663 | 34,710,483 | (7,018,123 | ) | 5,848,878 | 4,260,905 | 5,014,302 | ||||||||||||||||||
$ | 2,910,668 | $ | 34,030,992 | $ | (9,240,152 | ) | $ | 6,040,032 | $ | 3,743,681 | $ | 5,046,747 | |||||||||||||
$ | 34,030,992 | $ | - | $ | 41,237,126 | $ | 35,197,094 | $ | 5,046,747 | $ | - | ||||||||||||||
$ | 36,941,660 | $ | 34,030,992 | $ | 31,996,974 | $ | 41,237,126 | $ | 8,790,428 | $ | 5,046,747 | ||||||||||||||
1,750,000 | 1,550,000 | 75,000 | 1,075,000 | 175,000 | 200,000 | ||||||||||||||||||||
(1,575,000 | ) | (175,000 | ) | (350,000 | ) | (850,000 | ) | - | - | ||||||||||||||||
175,000 | 1,375,000 | (275,000 | ) | 225,000 | 175,000 | 200,000 | |||||||||||||||||||
Statements of Changes in Net Assets
Innovator Growth-100 Power Buffer ETF - January | ||||||||
Period Ended | Year Ended | |||||||
April 30, 2022 | October 31, 2021 | |||||||
(Unaudited) | ||||||||
Operations: | ||||||||
Net investment income/(loss) | $ | (432,353 | ) | $ | (743,793 | ) | ||
Net realized gain/(loss) | 8,850,001 | (25,357,578 | ) | |||||
Net change in unrealized appreciation/(depreciation) | (22,368,077 | ) | 37,986,539 | |||||
Net Increase/(Decrease) in Net Assets Resulting from Operations | (13,950,429 | ) | 11,885,168 | |||||
Capital Share Transactions: | ||||||||
Proceeds from shares sold | 149,255,880 | 93,359,980 | ||||||
Cost of shares redeemed | (98,670,103 | ) | (57,334,337 | ) | ||||
Transaction fees (see Note 5) | 44,029 | 71,233 | ||||||
Net Increase/(Decrease) in Net Assets from Capital Share Transactions | 50,629,806 | 36,096,876 | ||||||
Total Increase/(Decrease) in Net Assets | $ | 36,679,377 | $ | 47,982,044 | ||||
Net Assets: | ||||||||
Beginning of period | $ | 87,297,151 | $ | 39,315,107 | ||||
End of period | $ | 123,976,528 | $ | 87,297,151 | ||||
Change in Shares Outstanding: | ||||||||
Shares sold | 3,575,000 | 2,450,000 | ||||||
Shares redeemed | (2,350,000 | ) | (1,425,000 | ) | ||||
Net Increase/(Decrease) | 1,225,000 | 1,025,000 | ||||||
Innovator Growth-100 Power Buffer ETF - April | Innovator Growth-100 Power Buffer ETF - July | Innovator Growth-100 Power Buffer ETF - October | |||||||||||||||||||||
Period Ended | Year Ended | Period Ended | Year Ended | Period Ended | Year Ended | ||||||||||||||||||
April 30, 2022 | October 31, 2021 | April 30, 2022 | October 31, 2021 | April 30, 2022 | October 31, 2021 | ||||||||||||||||||
(Unaudited) | (Unaudited) | (Unaudited) | |||||||||||||||||||||
$ | (163,702 | ) | $ | (259,193 | ) | $ | (206,826 | ) | $ | (353,207 | ) | $ | (275,275 | ) | $ | (473,273 | ) | ||||||
3,934,932 | (5,192,739 | ) | (11,302 | ) | (8,900,142 | ) | 80,151 | 8,113,007 | |||||||||||||||
(7,193,488 | ) | 8,891,577 | (3,633,433 | ) | 15,325,242 | (5,415,237 | ) | 2,671,177 | |||||||||||||||
| (3,422,258 | ) | 3,439,645 | (3,851,561 | ) | 6,071,893 | (5,610,361 | ) | 10,310,911 | ||||||||||||||
71,263,450 | 45,954,157 | 15,058,420 | 43,936,683 | 10,977,218 | 105,332,633 | ||||||||||||||||||
(49,475,553 | ) | (23,886,215 | ) | (11,903,205 | ) | (51,069,408 | ) | (20,842,118 | ) | (78,309,172 | ) | ||||||||||||
24,350 | 28,936 | 10,498 | 35,903 | 8,214 | 28,393 | ||||||||||||||||||
| 21,812,247 | 22,096,878 | 3,165,713 | (7,096,822 | ) | (9,856,686 | ) | 27,051,854 | |||||||||||||||
$ | 18,389,989 | $ | 25,536,523 | $ | (685,848 | ) | $ | (1,024,929 | ) | $ | (15,467,047 | ) | $ | 37,362,765 | |||||||||
$ | 41,253,681 | $ | 15,717,158 | $ | 55,986,175 | $ | 57,011,104 | $ | 77,928,495 | $ | 40,565,730 | ||||||||||||
$ | 59,643,670 | $ | 41,253,681 | $ | 55,300,327 | $ | 55,986,175 | $ | 62,461,448 | $ | 77,928,495 | ||||||||||||
1,875,000 | 1,275,000 | 325,000 | 950,000 | 280,000 | 2,765,000 | ||||||||||||||||||
(1,300,000 | ) | (650,000 | ) | (250,000 | ) | (1,125,000 | ) | (525,000 | ) | (2,030,000 | ) | ||||||||||||
575,000 | 625,000 | 75,000 | (175,000 | ) | (245,000 | ) | 735,000 | ||||||||||||||||
Statements of Changes in Net Assets
Innovator U.S. Small Cap Power Buffer ETF - January | |||||||||
Period Ended | Year Ended | ||||||||
April 30, 2022 | October 31, 2021 | ||||||||
(Unaudited) | |||||||||
Operations: | |||||||||
Net investment income/(loss) | $ | (421,221 | ) | $ | (816,225 | ) | |||
Net realized gain/(loss) | 11,730,988 | (15,176,409 | ) | ||||||
Net change in unrealized appreciation/(depreciation) | (21,546,096 | ) | 37,851,116 | ||||||
Net Increase/(Decrease) in Net Assets Resulting from Operations | (10,236,329 | ) | 21,858,482 | ||||||
Capital Share Transactions: | |||||||||
Proceeds from shares sold | 141,403,510 | 76,744,195 | |||||||
Cost of shares redeemed | (91,519,795 | ) | (179,357,805 | ) | |||||
Transaction fees (see Note 5) | 34,003 | 125,315 | |||||||
Net Increase/(Decrease) in Net Assets from Capital Share Transactions | 49,917,718 | (102,488,295 | ) | ||||||
Total Increase/(Decrease) in Net Assets | $ | 39,681,389 | $ | (80,629,813 | ) | ||||
Net Assets: | |||||||||
Beginning of period | $ | 84,958,342 | $ | 165,588,155 | |||||
End of period | $ | 124,639,731 | $ | 84,958,342 | |||||
Change in Shares Outstanding: | |||||||||
Shares sold | 4,450,000 | 2,625,000 | |||||||
Shares redeemed | (2,900,000 | ) | (6,275,000 | ) | |||||
Net Increase/(Decrease) | 1,550,000 | (3,650,000 | ) | ||||||
Innovator U.S. Small Cap Power Buffer ETF - April | Innovator U.S. Small Cap Power Buffer ETF - July | Innovator U.S. Small Cap Power Buffer ETF - October | |||||||||||||||||||||
Period Ended | Year Ended | Period Ended | Year Ended | Period Ended | Year Ended | ||||||||||||||||||
April 30, 2022 | October 31, 2021 | April 30, 2022 | October 31, 2021 | April 30, 2022 | October 31, 2021 | ||||||||||||||||||
(Unaudited) | (Unaudited) | (Unaudited) | |||||||||||||||||||||
$ | (328,363 | ) | $ | (420,234 | ) | $ | (265,946 | ) | $ | (277,526 | ) | $ | (164,124 | ) | $ | (353,995 | ) | ||||||
(14,909 | ) | (13,477,350 | ) | 94,139 | (2,478,038 | ) | (468,374 | ) | 5,704,801 | ||||||||||||||
(7,199,344 | ) | 17,637,722 | (5,140,076 | ) | 6,142,194 | (3,608,832 | ) | 1,008,753 | |||||||||||||||
| (7,542,616 | ) | 3,740,138 | (5,311,883 | ) | 3,386,630 | (4,241,330 | ) | 6,359,559 | ||||||||||||||
94,175,210 | 78,380,790 | 9,108,090 | 74,488,070 | 11,651,702 | 52,802,615 | ||||||||||||||||||
(98,809,083 | ) | (30,438,550 | ) | (15,640,173 | ) | (27,119,307 | ) | (4,011,483 | ) | (70,724,897 | ) | ||||||||||||
17,069 | 46,320 | 6,454 | 12,499 | 7,485 | 24,735 | ||||||||||||||||||
| (4,616,804 | ) | 47,988,560 | (6,525,629 | ) | 47,381,262 | 7,647,704 | (17,897,547 | ) | ||||||||||||||
$ | (12,159,420 | ) | $ | 51,728,698 | $ | (11,837,512 | ) | $ | 50,767,892 | $ | 3,406,374 | $ | (11,537,988 | ) | |||||||||
$ | 84,875,652 | $ | 33,146,954 | $ | 74,083,444 | $ | 23,315,552 | $ | 36,631,659 | $ | 48,169,647 | ||||||||||||
$ | 72,716,232 | $ | 84,875,652 | $ | 62,245,932 | $ | 74,083,444 | $ | 40,038,033 | $ | 36,631,659 | ||||||||||||
3,525,000 | 2,900,000 | 350,000 | 2,825,000 | 425,000 | 1,975,000 | ||||||||||||||||||
(3,700,000 | ) | (1,125,000 | ) | (600,000 | ) | (1,025,000 | ) | (150,000 | ) | (2,650,000 | ) | ||||||||||||
(175,000 | ) | 1,775,000 | (250,000 | ) | 1,800,000 | 275,000 | (675,000 | ) | |||||||||||||||
Statements of Changes in Net Assets
Operations: | |
Net investment income/(loss) | |
Net realized gain/(loss) | |
Net change in unrealized appreciation/(depreciation) | |
Net Increase/(Decrease) in Net Assets Resulting from Operations | |
Capital Share Transactions: | |
Proceeds from shares sold | |
Cost of shares redeemed | |
Transaction fees (see Note 5) | |
Net Increase/(Decrease) in Net Assets from Capital Share Transactions | |
Total Increase/(Decrease) in Net Assets | |
Net Assets: | |
Beginning of period | |
End of period | |
Change in Shares Outstanding: | |
Shares sold | |
Shares redeemed | |
Net Increase/(Decrease) |
(a) Since Commencement of Operations on December 31, 2020. |
Innovator Double Stacker ETF - January | Innovator Double Stacker ETF - October | |||||||||||||||
Period Ended | Period Ended | Period Ended | Year Ended | |||||||||||||
April 30, 2022 | October 31, 2020 | (a) | April 30, 2022 | October 31, 2021 | ||||||||||||
(Unaudited) | (Unaudited) | |||||||||||||||
$ | (23,363 | ) | $ | (31,076 | ) | $ | (32,549 | ) | $ | (146,729 | ) | |||||
770,631 | - | 23,685 | 3,658,901 | |||||||||||||
(1,482,840 | ) | 743,906 | (736,921 | ) | 628,446 | |||||||||||
(735,572 | ) | 712,830 | (745,785 | ) | 4,140,618 | |||||||||||
6,696,136 | 5,982,432 | 747,269 | 27,220,648 | |||||||||||||
(8,133,733 | ) | - | (1,574,045 | ) | (34,197,275 | ) | ||||||||||
353 | 1,374 | 774 | 9,655 | |||||||||||||
(1,437,244 | ) | 5,983,806 | (826,002 | ) | (6,966,972 | ) | ||||||||||
$ | (2,172,816 | ) | $ | 6,696,636 | $ | (1,571,787 | ) | $ | (2,826,354 | ) | ||||||
$ | 6,696,636 | $ | - | $ | 8,974,717 | $ | 11,801,071 | |||||||||
$ | 4,523,820 | $ | 6,696,636 | $ | 7,402,930 | $ | 8,974,717 | |||||||||
225,000 | 225,000 | 25,000 | 900,000 | |||||||||||||
(275,000 | ) | - | (50,000 | ) | (1,100,000 | ) | ||||||||||
(50,000 | ) | 225,000 | (25,000 | ) | (200,000 | ) | ||||||||||
Statements of Changes in Net Assets
Operations: | |
Net investment income/(loss) | |
Net realized gain/(loss) | |
Net change in unrealized appreciation/(depreciation) | |
Net Increase/(Decrease) in Net Assets Resulting from Operations | |
Capital Share Transactions: | |
Proceeds from shares sold | |
Cost of shares redeemed | |
Transaction fees (see Note 5) | |
Net Increase/(Decrease) in Net Assets from Capital Share Transactions | |
Total Increase/(Decrease) in Net Assets | |
Net Assets: | |
Beginning of period | |
End of period | |
Change in Shares Outstanding: | |
Shares sold | |
Shares redeemed | |
Net Increase/(Decrease) |
(a) Since Commencement of Operations on December 31, 2020. |
Innovator Triple Stacker ETF - January | Innovator Triple Stacker ETF - October | |||||||||||||||
Period Ended | Period Ended | Period Ended | Year Ended | |||||||||||||
April 30, 2022 | October 31, 2021 | (a) | April 30, 2022 | October 31, 2021 | ||||||||||||
(Unaudited) | (Unaudited) | |||||||||||||||
$ | (111,409 | ) | $ | (205,245 | ) | $ | (54,401 | ) | $ | (147,376 | ) | |||||
3,046,916 | 286,847 | (13,461 | ) | 2,658,174 | ||||||||||||
(5,798,880 | ) | 4,139,528 | (910,976 | ) | 886,143 | |||||||||||
(2,863,373 | ) | 4,221,130 | (978,838 | ) | 3,396,941 | |||||||||||
48,692,803 | 40,589,770 | 3,100,377 | 33,894,632 | |||||||||||||
(79,058,020 | ) | (722,005 | ) | (10,877,880 | ) | (27,477,210 | ) | |||||||||
17,734 | 17,986 | 6,601 | 12,359 | |||||||||||||
(30,347,483 | ) | 39,885,751 | (7,770,902 | ) | 6,429,781 | |||||||||||
$ | (33,210,856 | ) | $ | 44,106,881 | $ | (8,749,740 | ) | $ | 9,826,722 | |||||||
$ | 44,106,881 | $ | - | $ | 16,702,108 | $ | 6,875,386 | |||||||||
$ | 10,896,025 | $ | 44,106,881 | $ | 7,952,368 | $ | 16,702,108 | |||||||||
1,650,000 | 1,525,000 | 100,000 | 1,150,000 | |||||||||||||
(2,725,000 | ) | (25,000 | ) | (350,000 | ) | (900,000 | ) | |||||||||
(1,075,000 | ) | 1,500,000 | (250,000 | ) | 250,000 | |||||||||||
Statements of Changes in Net Assets
Operations: | |
Net investment income/(loss) | |
Net realized gain/(loss) | |
Net change in unrealized appreciation/(depreciation) | |
Net Increase/(Decrease) in Net Assets Resulting from Operations | |
Capital Share Transactions: | |
Proceeds from shares sold | |
Cost of shares redeemed | |
Transaction fees (see Note 5) | |
Net Increase/(Decrease) in Net Assets from Capital Share Transactions | |
Total Increase/(Decrease) in Net Assets | |
Net Assets: | |
Beginning of period | |
End of period | |
Change in Shares Outstanding: | |
Shares sold | |
Shares redeemed | |
Net Increase/(Decrease) |
(a) Since Commencement of Operations on December 31, 2020. | |||||||
Innovator Double Stacker 9 Buffer ETF - January | Innovator Double Stacker 9 Buffer ETF - October | |||||||||||||||
Period Ended | Period Ended | Period Ended | Year Ended | |||||||||||||
April 30, 2022 | October 31, 2021 | (a) | April 30, 2022 | October 31, 2021 | ||||||||||||
(Unaudited) | (Unaudited) | |||||||||||||||
$ | (53,593 | ) | $ | (85,113 | ) | $ | (79,221 | ) | $ | (296,560 | ) | |||||
843,366 | 421,370 | (93,318 | ) | 5,046,668 | ||||||||||||
(1,992,728 | ) | 983,940 | (836,502 | ) | 1,224,826 | |||||||||||
(1,202,955 | ) | 1,320,197 | (1,009,041 | ) | 5,974,934 | |||||||||||
16,214,852 | 16,804,323 | 1,477,845 | 42,706,835 | |||||||||||||
(16,788,185 | ) | (4,790,635 | ) | (4,406,600 | ) | (58,341,173 | ) | |||||||||
3,779 | 8,134 | 2,943 | 16,769 | |||||||||||||
(569,554 | ) | 12,021,822 | (2,925,812 | ) | (15,617,569 | ) | ||||||||||
$ | (1,772,509 | ) | $ | 13,342,019 | $ | (3,934,853 | ) | $ | (9,642,635 | ) | ||||||
$ | 13,342,019 | $ | - | $ | 21,561,614 | $ | 31,204,249 | |||||||||
$ | 11,569,510 | $ | 13,342,019 | $ | 17,626,761 | $ | 21,561,614 | |||||||||
575,000 | 650,000 | 50,000 | 1,500,000 | |||||||||||||
(600,000 | ) | (175,000 | ) | (150,000 | ) | (2,025,000 | ) | |||||||||
(25,000 | ) | 475,000 | (100,000 | ) | (525,000 | ) | ||||||||||
Statements of Changes in Net Assets
Innovator U.S. Equity Accelerated ETF - January | |||||
Period Ended | |||||
April 30, 2022 | (a) | ||||
(Unaudited) | |||||
Operations: | |||||
Net investment income/(loss) | $ | (8,214 | ) | ||
Net realized gain/(loss) | - | ||||
Net change in unrealized appreciation/(depreciation) | (446,696 | ) | |||
Net Increase/(Decrease) in Net Assets Resulting from Operations | (454,910 | ) | |||
Capital Share Transactions: | |||||
Proceeds from shares sold | 4,718,782 | ||||
Cost of shares redeemed | - | ||||
Transaction fees (see Note 5) | 1,742 | ||||
Net Increase/(Decrease) in Net Assets from Capital Share Transactions | 4,720,524 | ||||
Total Increase/(Decrease) in Net Assets | $ | 4,265,614 | |||
Net Assets: | |||||
Beginning of period | $ | - | |||
End of period | $ | 4,265,614 | |||
Change in Shares Outstanding: | |||||
Shares sold | 200,000 | ||||
Shares redeemed | - | ||||
Net Increase/(Decrease) | 200,000 | ||||
(a) Since Commencement of Operations on December 31, 2021. |
(b) Since Commencement of Operations on March 31, 2021. |
(c) Since Commencement of Operations on June 30, 2021. |
(d) Since Commencement of Operations on September 30, 2021. |
Innovator U.S. Equity Accelerated ETF - April | Innovator U.S. Equity Accelerated ETF - July | Innovator U.S. Equity Accelerated ETF - October | |||||||||||||||||||||||||
Period Ended | Period Ended | Period Ended | Period Ended | Period Ended | Period Ended | ||||||||||||||||||||||
April 30, 2022 | October 31, 2021 | (b) | April 30, 2022 | October 31, 2021 | (c) | April 30, 2022 | October 31, 2021 | (d) | |||||||||||||||||||
(Unaudited) | (Unaudited) | (Unaudited) | |||||||||||||||||||||||||
$ | (29,940 | ) | $ | (32,349 | ) | $ | (18,547 | ) | $ | (8,145 | ) | $ | (7,362 | ) | $ | (1,098 | ) | ||||||||||
1,179,675 | - | - | - | - | - | ||||||||||||||||||||||
(1,337,998 | ) | 707,372 | (490,543 | ) | 192,775 | (140,459 | ) | 84,269 | |||||||||||||||||||
(188,263 | ) | 675,023 | (509,090 | ) | 184,630 | (147,821 | ) | 83,171 | |||||||||||||||||||
6,852,325 | 7,125,955 | 2,095,928 | 3,218,420 | - | 1,812,710 | ||||||||||||||||||||||
(7,729,717 | ) | - | - | - | - | - | |||||||||||||||||||||
- | 2,929 | 1,048 | 322 | - | - | ||||||||||||||||||||||
(877,392 | ) | 7,128,884 | 2,096,976 | 3,218,742 | - | 1,812,710 | |||||||||||||||||||||
$ | (1,065,655 | ) | $ | 7,803,907 | $ | 1,587,886 | $ | 3,403,372 | $ | (147,821 | ) | $ | 1,895,881 | ||||||||||||||
$ | 7,803,907 | $ | - | $ | 3,403,372 | $ | - | $ | 1,895,881 | $ | - | ||||||||||||||||
$ | 6,738,252 | $ | 7,803,907 | $ | 4,991,258 | $ | 3,403,372 | $ | 1,748,060 | $ | 1,895,881 | ||||||||||||||||
250,000 | 275,000 | 75,000 | 125,000 | - | 75,000 | ||||||||||||||||||||||
(275,000 | ) | - | - | - | - | - | |||||||||||||||||||||
(25,000 | ) | 275,000 | 75,000 | 125,000 | - | 75,000 | |||||||||||||||||||||
Statements of Changes in Net Assets
Innovator U.S. Equity Accelerated Plus ETF - January | ||||||
Period Ended | ||||||
April 30, 2022 | (a) | |||||
(Unaudited) | ||||||
Operations: | ||||||
Net investment income/(loss) | $ | (14,916 | ) | |||
Net realized gain/(loss) | 68,201 | |||||
Net change in unrealized appreciation/(depreciation) | (921,160 | ) | ||||
Net Increase/(Decrease) in Net Assets Resulting from Operations | (867,875 | ) | ||||
Capital Share Transactions: | ||||||
Proceeds from shares sold | 8,481,172 | |||||
Cost of shares redeemed | (1,195,510 | ) | ||||
Transaction fees (see Note 5) | 3,932 | |||||
Net Increase/(Decrease) in Net Assets from Capital Share Transactions | 7,289,594 | |||||
Total Increase/(Decrease) in Net Assets | $ | 6,421,719 | ||||
Net Assets: | ||||||
Beginning of period | $ | - | ||||
End of period | $ | 6,421,719 | ||||
Change in Shares Outstanding: | ||||||
Shares sold | 350,000 | |||||
Shares redeemed | (50,000 | ) | ||||
Net Increase/(Decrease) | 300,000 | |||||
(a) Since Commencement of Operations on December 31, 2021. |
(b) Since Commencement of Operations on March 31, 2021. |
(c) Since Commencement of Operations on June 30, 2021. |
(d) Since Commencement of Operations on September 30, 2021. |
Innovator U.S. Equity Accelerated Plus ETF - April | Innovator U.S. Equity Accelerated Plus ETF - July | Innovator U.S. Equity Accelerated Plus ETF - October | ||||||||||||||||||||||||
Period Ended | Period Ended | Period Ended | Period Ended | Period Ended | Period Ended | |||||||||||||||||||||
April 30, 2022 | October 31, 2021 | (b) | April 30, 2022 | October 31, 2021 | (c) | April 30, 2022 | October 31, 2021 | (d) | ||||||||||||||||||
(Unaudited) | (Unaudited) | (Unaudited) | ||||||||||||||||||||||||
$ | (48,903 | ) | $ | (25,914 | ) | $ | (43,247 | ) | $ | (18,095 | ) | $ | (21,519 | ) | $ | (793 | ) | |||||||||
2,175,717 | - | - | - | - | - | |||||||||||||||||||||
(1,769,305 | ) | 526,824 | (814,280 | ) | 386,272 | (604,966 | ) | 57,542 | ||||||||||||||||||
357,509 | 500,910 | (857,527 | ) | 368,177 | (626,485 | ) | 56,749 | |||||||||||||||||||
41,673,345 | 7,953,698 | 5,193,465 | 9,116,830 | 7,478,035 | 2,473,085 | |||||||||||||||||||||
(36,397,855 | ) | - | - | - | - | - | ||||||||||||||||||||
8,766 | 2,336 | 2,597 | 2,613 | 3,737 | - | |||||||||||||||||||||
5,284,256 | 7,956,034 | 5,196,062 | 9,119,443 | 7,481,772 | 2,473,085 | |||||||||||||||||||||
$ | 5,641,765 | $ | 8,456,944 | $ | 4,338,535 | $ | 9,487,620 | $ | 6,855,287 | $ | 2,529,834 | |||||||||||||||
$ | 8,456,944 | $ | - | $ | 9,487,620 | $ | - | $ | 2,529,834 | $ | - | |||||||||||||||
$ | 14,098,709 | $ | 8,456,944 | $ | 13,826,155 | $ | 9,487,620 | $ | 9,385,121 | $ | 2,529,834 | |||||||||||||||
1,500,000 | 300,000 | 200,000 | 350,000 | 300,000 | 100,000 | |||||||||||||||||||||
(1,275,000 | ) | - | - | - | - | - | ||||||||||||||||||||
225,000 | 300,000 | 200,000 | 350,000 | 300,000 | 100,000 | |||||||||||||||||||||
Statements of Changes in Net Assets
Innovator U.S. Equity Accelerated 9 Buffer ETF - January | ||||||
Period Ended | ||||||
April 30, 2022 | (a) | |||||
(Unaudited) | ||||||
Operations: | ||||||
Net investment income/(loss) | $ | (29,974 | ) | |||
Net realized gain/(loss) | 367,871 | |||||
Net change in unrealized appreciation/(depreciation) | (1,187,440 | ) | ||||
Net Increase/(Decrease) in Net Assets Resulting from Operations | (849,543 | ) | ||||
Capital Share Transactions: | ||||||
Proceeds from shares sold | 15,130,050 | |||||
Cost of shares redeemed | (3,018,288 | ) | ||||
Transaction fees (see Note 5) | 6,948 | |||||
Net Increase/(Decrease) in Net Assets from Capital Share Transactions | 12,118,710 | |||||
Total Increase/(Decrease) in Net Assets | $ | 11,269,167 | ||||
Net Assets: | ||||||
Beginning of period | $ | - | ||||
End of period | $ | 11,269,167 | ||||
Change in Shares Outstanding: | ||||||
Shares sold | 625,000 | |||||
Shares redeemed | (125,000 | ) | ||||
Net Increase/(Decrease) | 500,000 | |||||
(a) Since Commencement of Operations on December 31, 2021. |
(b) Since Commencement of Operations on March 31, 2021. |
(c) Since Commencement of Operations on June 30, 2021. |
(d) Since Commencement of Operations on September 30, 2021. |
Innovator U.S. Equity Accelerated 9 Buffer ETF - April | Innovator U.S. Equity Accelerated 9 Buffer ETF - July | Innovator U.S. Equity Accelerated 9 Buffer ETF - October | ||||||||||||||||||||||||
Period Ended | Period Ended | Period Ended | Period Ended | Period Ended | Period Ended | |||||||||||||||||||||
April 30, 2022 | October 31, 2021 | (b) | April 30, 2022 | October 31, 2021 | (c) | April 30, 2022 | October 31, 2021 | (d) | ||||||||||||||||||
(Unaudited) | (Unaudited) | (Unaudited) | ||||||||||||||||||||||||
$ | (89,931 | ) | $ | (109,217 | ) | $ | (47,906 | ) | $ | (25,133 | ) | $ | (24,049 | ) | $ | (1,939 | ) | |||||||||
1,320,573 | 778,138 | - | - | - | - | |||||||||||||||||||||
(1,992,642 | ) | 630,387 | (413,374 | ) | 307,176 | (330,337 | ) | 87,922 | ||||||||||||||||||
(762,000 | ) | 1,299,308 | (461,280 | ) | 282,043 | (354,386 | ) | 85,983 | ||||||||||||||||||
34,831,015 | 28,287,998 | 5,226,860 | 10,311,808 | 4,319,650 | 4,247,592 | |||||||||||||||||||||
(30,895,445 | ) | (9,961,575 | ) | - | - | - | - | |||||||||||||||||||
7,476 | 13,186 | 2,613 | 2,901 | 2,160 | 916 | |||||||||||||||||||||
3,943,046 | 18,339,609 | 5,229,473 | 10,314,709 | 4,321,810 | 4,248,508 | |||||||||||||||||||||
$ | 3,181,046 | $ | 19,638,917 | $ | 4,768,193 | $ | 10,596,752 | $ | 3,967,424 | $ | 4,334,491 | |||||||||||||||
$ | 19,638,917 | $ | - | $ | 10,596,752 | $ | - | $ | 4,334,491 | $ | - | |||||||||||||||
$ | 22,819,963 | $ | 19,638,917 | $ | 15,364,945 | $ | 10,596,752 | $ | 8,301,915 | $ | 4,334,491 | |||||||||||||||
1,275,000 | 1,100,000 | 200,000 | 400,000 | 175,000 | 175,000 | |||||||||||||||||||||
(1,125,000 | ) | (375,000 | ) | - | - | - | - | |||||||||||||||||||
150,000 | 725,000 | 200,000 | 400,000 | 175,000 | 175,000 | |||||||||||||||||||||
Statements of Changes in Net Assets
Innovator Growth Accelerated Plus ETF - January | ||||||
Period Ended | ||||||
April 30, 2022 | (a) | |||||
(Unaudited) | ||||||
Operations: | ||||||
Net investment income/(loss) | $ | (19,768 | ) | |||
Net realized gain/(loss) | 114,079 | |||||
Net change in unrealized appreciation/(depreciation) | (1,834,579 | ) | ||||
Net Increase/(Decrease) in Net Assets Resulting from Operations | (1,740,268 | ) | ||||
Capital Share Transactions: | ||||||
Proceeds from shares sold | 10,825,393 | |||||
Cost of shares redeemed | (576,358 | ) | ||||
Transaction fees (see Note 5) | 5,094 | |||||
Net Increase/(Decrease) in Net Assets from Capital Share Transactions | 10,254,129 | |||||
Total Increase/(Decrease) in Net Assets | $ | 8,513,861 | ||||
Net Assets: | ||||||
Beginning of period | $ | - | ||||
End of period | $ | 8,513,861 | ||||
Change in Shares Outstanding: | ||||||
Shares sold | 450,000 | |||||
Shares redeemed | (25,000 | ) | ||||
Net Increase/(Decrease) | 425,000 | |||||
(a) Since Commencement of Operations on December 31, 2021. |
(b) Since Commencement of Operations on March 31, 2021. |
(c) Since Commencement of Operations on June 30, 2021. |
(d) Since Commencement of Operations on September 30, 2021. |
Innovator Growth Accelerated Plus ETF - April | Innovator Growth Accelerated Plus ETF - July | Innovator Growth Accelerated Plus ETF - October | ||||||||||||||||||||||||
Period Ended | Period Ended | Period Ended | Period Ended | Period Ended | Period Ended | |||||||||||||||||||||
April 30, 2022 | October 31, 2021 | (b) | April 30, 2022 | October 31, 2021 | (c) | April 30, 2022 | October 31, 2021 | (d) | ||||||||||||||||||
(Unaudited) | (Unaudited) | (Unaudited) | ||||||||||||||||||||||||
$ | (68,786 | ) | $ | (84,706 | ) | $ | (51,565 | ) | $ | (15,166 | ) | $ | (20,319 | ) | $ | (1,155 | ) | |||||||||
877,592 | 2,084,328 | - | - | - | - | |||||||||||||||||||||
(925,005 | ) | (642,001 | ) | (2,562,242 | ) | 433,046 | (1,006,982 | ) | 119,391 | |||||||||||||||||
(116,199 | ) | 1,357,621 | (2,613,807 | ) | 417,880 | (1,027,301 | ) | 118,236 | ||||||||||||||||||
19,390,638 | 36,990,110 | 10,137,840 | 7,831,830 | 3,842,185 | 2,451,895 | |||||||||||||||||||||
(27,024,408 | ) | (19,903,855 | ) | - | - | - | - | |||||||||||||||||||
1,853 | 10,494 | 4,721 | - | 1,595 | 302 | |||||||||||||||||||||
(7,631,917 | ) | 17,096,749 | 10,142,561 | 7,831,830 | 3,843,780 | 2,452,197 | ||||||||||||||||||||
$ | (7,748,116 | ) | $ | 18,454,370 | $ | 7,528,754 | $ | 8,249,710 | $ | 2,816,479 | $ | 2,570,433 | ||||||||||||||
$ | 18,454,370 | $ | - | $ | 8,249,710 | $ | - | $ | 2,570,433 | $ | - | |||||||||||||||
$ | 10,706,254 | $ | 18,454,370 | $ | 15,778,464 | $ | 8,249,710 | $ | 5,386,912 | $ | 2,570,433 | |||||||||||||||
725,000 | 1,325,000 | 400,000 | 300,000 | 150,000 | 100,000 | |||||||||||||||||||||
(950,000 | ) | (700,000 | ) | - | - | - | - | |||||||||||||||||||
(225,000 | ) | 625,000 | 400,000 | 300,000 | 150,000 | 100,000 | ||||||||||||||||||||
Statements of Changes in Net Assets
Operations: | |
Net investment income/(loss) | |
Net realized gain/(loss) | |
Net change in unrealized appreciation/(depreciation) | |
Net Increase/(Decrease) in Net Assets Resulting from Operations | |
Capital Share Transactions: | |
Proceeds from shares sold | |
Cost of shares redeemed | |
Transaction fees (see Note 5) | |
Net Increase/(Decrease) in Net Assets from Capital Share Transactions | |
Total Increase/(Decrease) in Net Assets | |
Net Assets: | |
Beginning of period | |
End of period | |
Change in Shares Outstanding: | |
Shares sold | |
Shares redeemed | |
Net Increase/(Decrease) |
Innovator 20+ Year Treasury Bond 9 Buffer ETF - July | Innovator 20+ Year Treasury Bond 5 Floor ETF - Quarterly | ||||||||||||||
Period Ended | Year Ended | Period Ended | Year Ended | ||||||||||||
April 30, 2022 | October 31, 2021 | April 30, 2022 | October 31, 2021 | ||||||||||||
(Unaudited) | (Unaudited) | ||||||||||||||
$ | (23,450 | ) | $ | (31,134 | ) | $ | (38,078 | ) | $ | (97,060 | ) | ||||
14,814 | (175,573 | ) | (364,729 | ) | (958,106 | ) | |||||||||
(744,980 | ) | 102,436 | (475,048 | ) | 204,383 | ||||||||||
(753,616 | ) | (104,271 | ) | (877,855 | ) | (850,783 | ) | ||||||||
2,394,898 | 4,293,060 | 14,798,980 | 24,917,011 | ||||||||||||
(544,608 | ) | (4,772,485 | ) | (11,950,225 | ) | (17,650,788 | ) | ||||||||
1,198 | 2,409 | 4,557 | 20,696 | ||||||||||||
1,851,488 | (477,016 | ) | 2,853,312 | 7,286,919 | |||||||||||
$ | 1,097,872 | $ | (581,287 | ) | $ | 1,975,457 | $ | 6,436,136 | |||||||
$ | 4,891,731 | $ | 5,473,018 | $ | 9,489,310 | $ | 3,053,174 | ||||||||
$ | 5,989,603 | $ | 4,891,731 | $ | 11,464,767 | $ | 9,489,310 | ||||||||
100,000 | 175,000 | 650,000 | 1,025,000 | ||||||||||||
(25,000 | ) | (200,000 | ) | (525,000 | ) | (750,000 | ) | ||||||||
75,000 | (25,000 | ) | 125,000 | 275,000 | |||||||||||
Statements of Changes in Net Assets
Innovator Defined Wealth Shield ETF | ||||||||||
Period Ended | Period Ended | |||||||||
April 30, 2022 | October 31, 2021 | (a) | ||||||||
(Unaudited) | ||||||||||
Operations: | ||||||||||
Net investment income/(loss) | $ | (248,533 | ) | $ | (24,714 | ) | ||||
Net realized gain/(loss) | 439,943 | (3,059 | ) | |||||||
Net change in unrealized appreciation/(depreciation) | (1,445,156 | ) | 147,596 | |||||||
Net Increase/(Decrease) in Net Assets Resulting from Operations | (1,253,746 | ) | 119,823 | |||||||
Capital Share Transactions: | ||||||||||
Proceeds from shares sold | 237,689,390 | 36,050,398 | ||||||||
Cost of shares redeemed | (161,635,390 | ) | (7,095,248 | ) | ||||||
Transaction fees (see Note 5) | 53,868 | 12,544 | ||||||||
Net Increase/(Decrease) in Net Assets from Capital Share Transactions | 76,107,868 | 28,967,694 | ||||||||
Total Increase/(Decrease) in Net Assets | $ | 74,854,122 | $ | 29,087,517 | ||||||
Net Assets: | ||||||||||
Beginning of period | $ | 29,087,517 | $ | - | ||||||
End of period | $ | 103,941,639 | $ | 29,087,517 | ||||||
Change in Shares Outstanding: | ||||||||||
Shares sold | 9,200,000 | 1,400,000 | ||||||||
Shares redeemed | (6,250,000 | ) | (275,000 | ) | ||||||
Net Increase/(Decrease) | 2,950,000 | 1,125,000 | ||||||||
(a) Since Commencement of Operations on June 30, 2021. |
(b) Since Commencement of Operations on March 31, 2021. |
Innovator U.S. Equity Accelerated ETF - Quarterly | Innovator Growth Accelerated ETF - Quarterly | ||||||||||||||||
Period Ended | Period Ended | Period Ended | Period Ended | ||||||||||||||
April 30, 2022 | October 31, 2021 | (b) | April 30, 2022 | October 31, 2021 | (b) | ||||||||||||
(Unaudited) | (Unaudited) | ||||||||||||||||
$ | (48,593 | ) | $ | (49,539 | ) | $ | (54,322 | ) | $ | (57,511 | ) | ||||||
437,281 | 544,033 | 41,221 | 1,165,038 | ||||||||||||||
(1,478,729 | ) | 569,826 | (2,527,656 | ) | 810,963 | ||||||||||||
| (1,090,041 | ) | 1,064,320 | (2,540,757 | ) | 1,918,490 | |||||||||||
17,007,160 | 36,522,835 | 16,278,350 | 42,864,637 | ||||||||||||||
(19,991,810 | ) | (24,171,698 | ) | (18,588,265 | ) | (29,104,648 | ) | ||||||||||
4,628 | 5,610 | 658 | 6,278 | ||||||||||||||
| (2,980,022 | ) | 12,356,747 | (2,309,257 | ) | 13,766,267 | |||||||||||
$ | (4,070,063 | ) | $ | 13,421,067 | $ | (4,850,014 | ) | $ | 15,684,757 | ||||||||
$ | 13,421,067 | $ | - | $ | 15,684,757 | $ | - | ||||||||||
$ | 9,351,004 | $ | 13,421,067 | $ | 10,834,743 | $ | 15,684,757 | ||||||||||
600,000 | 1,350,000 | 550,000 | 1,550,000 | ||||||||||||||
(700,000 | ) | (875,000 | ) | (625,000 | ) | (1,025,000 | ) | ||||||||||
(100,000 | ) | 475,000 | (75,000 | ) | 525,000 | ||||||||||||
Financial Highlights
| Per Share Operating Performance (For a share outstanding throughout each period) | |||||||||||||||||||||||||
Investment Operations: | Capital Share Transactions: | Less Distributions: | |||||||||||||||||||||||
Net Asset Value, Beginning of Period | Net investment income/(loss) (c) | Net realized and unrealized gain/(loss) | Total From Investment Operations | Transaction fees (see Note 5) | Distributions from realized gains | ||||||||||||||||||||
Innovator International Developed Power Buffer ETF - January | |||||||||||||||||||||||||
For the period ended 4/30/2022 | $ | 27.04 | (0.11 | ) | (1.54 | ) | (1.65 | ) | 0.01 | - | |||||||||||||||
For the year ended 10/31/2021 | $ | 23.82 | (0.22 | ) | 3.43 | 3.21 | 0.01 | - | |||||||||||||||||
For the period 12/31/2019(d) - 10/31/2020 | $ | 24.44 | (0.17 | ) | (0.47 | ) | (0.64 | ) | 0.02 | - | |||||||||||||||
Innovator International Developed Power Buffer ETF - April | |||||||||||||||||||||||||
For the period ended 4/30/2022 | $ | 25.87 | (0.11 | ) | (2.09 | ) | (2.20 | ) | 0.04 | - | |||||||||||||||
For the period 3/31/2021(d) - 10/31/2021 | $ | 24.90 | (0.13 | ) | 1.08 | 0.95 | 0.02 | - | |||||||||||||||||
Innovator International Developed Power Buffer ETF - July | |||||||||||||||||||||||||
For the period ended 4/30/2022 | $ | 24.68 | (0.10 | ) | (1.08 | ) | (1.18 | ) | - | (f) | - | ||||||||||||||
For the year ended 10/31/2021 | $ | 22.73 | (0.21 | ) | 2.15 | 1.94 | 0.01 | - | |||||||||||||||||
For the year ended 10/31/2020 | $ | 23.43 | (0.19 | ) | (0.30 | ) | (0.49 | ) | 0.02 | (0.23 | ) | ||||||||||||||
For the period 6/28/2019(d) - 10/31/2019 | $ | 23.04 | (0.06 | ) | 0.43 | 0.37 | 0.02 | - | |||||||||||||||||
Innovator International Developed Power Buffer ETF - October | |||||||||||||||||||||||||
For the period ended 4/30/2022 | $ | 25.40 | (0.10 | ) | (1.59 | ) | (1.69 | ) | 0.01 | - | |||||||||||||||
For the period 9/30/2021(d) - 10/31/2021 | $ | 24.97 | (0.02 | ) | 0.45 | 0.43 | - | (f) | - | ||||||||||||||||
(a) Annualized for periods less than one year. |
(b) Not annualized for periods less than one year. |
(c) Net investment income/(loss) per share has been calculated based on average shares outstanding during the period. |
(d) Commencement of operations. |
(e) Includes broker interest expense of 0.01%. |
(f) Amount represents less than $0.01 per share. |
| Ratios/Supplemental Data: | ||||||||||||||||||||||||||||
| Ratio to Average Net Assets of: (a) | |||||||||||||||||||||||||||
Change in Net Asset Value for the Period | Net Asset Value, End of Period | Total return (b) | Net assets, end of period (000) | Expenses | Net investment income/(loss) | Portfolio turnover rate (b) | ||||||||||||||||||||||
| (1.64 | ) | $ | 25.40 | (6.06 | )% | $ | 88,888 | 0.85 | % | (0.85 | )% | 0 | % | ||||||||||||||
| 3.22 | $ | 27.04 | 13.47 | % | $ | 57,450 | 0.85 | % | (0.85 | )% | 0 | % | |||||||||||||||
| (0.62 | ) | $ | 23.82 | (2.52 | )% | $ | 52,415 | 0.85 | % | (0.85 | )% | 0 | % | ||||||||||||||
| ||||||||||||||||||||||||||||
| (2.16 | ) | $ | 23.71 | (8.33 | )% | $ | 54,537 | 0.85 | % | (0.85 | )% | 0 | % | ||||||||||||||
| 0.97 | $ | 25.87 | 3.88 | % | $ | 20,047 | 0.85 | % | (0.85 | )% | 0 | % | |||||||||||||||
| ||||||||||||||||||||||||||||
| (1.18 | ) | $ | 23.50 | (4.78 | )% | $ | 58,745 | 0.85 | % | (0.85 | )% | 0 | % | ||||||||||||||
| 1.95 | $ | 24.68 | 8.58 | % | $ | 56,141 | 0.85 | % | (0.85 | )% | 0 | % | |||||||||||||||
| (0.70 | ) | $ | 22.73 | (2.04 | )% | $ | 69,883 | 0.86 | % | (e) | (0.86 | )% | 0 | % | |||||||||||||
| 0.39 | $ | 23.43 | 1.70 | % | $ | 63,851 | 0.85 | % | (0.85 | )% | 99 | % | |||||||||||||||
| ||||||||||||||||||||||||||||
| (1.68 | ) | $ | 23.72 | (6.63 | )% | $ | 17,195 | 0.85 | % | (0.85 | )% | 0 | % | ||||||||||||||
| 0.43 | $ | 25.40 | 1.72 | % | $ | 9,525 | 0.85 | % | (0.85 | )% | 0 | % | |||||||||||||||
Financial Highlights
| Per Share Operating Performance (For a share outstanding throughout each period) | ||||||||||||||||||||||||||
Investment Operations: | Capital Share Transactions: | Less Distributions: | ||||||||||||||||||||||||
Net Asset Value, Beginning of Period | Net investment income/(loss) (c) | Net realized and unrealized gain/(loss) | Total From Investment Operations | Transaction fees (see Note 5) | Distributions from realized gains | |||||||||||||||||||||
Innovator Emerging Markets Power Buffer ETF - January | ||||||||||||||||||||||||||
For the period ended 4/30/2022 | $ | 29.95 | (0.13 | ) | (2.22 | ) | (2.35 | ) | 0.01 | - | ||||||||||||||||
For the year ended 10/31/2021 | $ | 27.26 | (0.27 | ) | 2.94 | (e) | 2.67 | 0.02 | - | |||||||||||||||||
For the period 12/31/2019(d) - 10/31/2020 | $ | 26.80 | (0.19 | ) | 0.62 | (e) | 0.43 | 0.03 | - | |||||||||||||||||
Innovator Emerging Markets Power Buffer ETF - April | ||||||||||||||||||||||||||
For the period ended 4/30/2022 | $ | 24.75 | (0.11 | ) | (0.82 | ) | (0.93 | ) | 0.01 | - | ||||||||||||||||
For the period 3/31/2021(d) - 10/31/2021 | $ | 24.96 | (0.13 | ) | (0.10 | ) | (e) | (0.23 | ) | 0.02 | - | |||||||||||||||
Innovator Emerging Markets Power Buffer ETF - July | ||||||||||||||||||||||||||
For the period ended 4/30/2022 | $ | 25.77 | (0.11 | ) | (1.51 | ) | (1.62 | ) | - | (g) | - | |||||||||||||||
For the year ended 10/31/2021 | $ | 25.60 | (0.23 | ) | 0.39 | 0.16 | 0.01 | - | ||||||||||||||||||
For the year ended 10/31/2020 | $ | 25.25 | (0.22 | ) | 0.71 | (e) | 0.49 | 0.03 | (0.17 | ) | ||||||||||||||||
For the period 6/28/2019(d) - 10/31/2019 | $ | 25.28 | (0.07 | ) | 0.02 | (e) | (0.05 | ) | 0.02 | - | ||||||||||||||||
Innovator Emerging Markets Power Buffer ETF - October | ||||||||||||||||||||||||||
For the period ended 4/30/2022 | $ | 25.23 | (0.11 | ) | (1.69 | ) | (1.80 | ) | 0.01 | - | ||||||||||||||||
For the period 9/30/2021(d) - 10/31/2021 | $ | 24.99 | (0.02 | ) | 0.26 | 0.24 | - | (g) | - | |||||||||||||||||
(a) Annualized for periods less than one year. |
(b) Not annualized for periods less than one year. |
(c) Net investment income/(loss) per share has been calculated based on average shares outstanding during the period. |
(d) Commencement of operations. |
(e) Net realized and unrealized gain/(loss) per share includes balancing amounts necessary to reconcile the change in net asset value per share for the period, and may not reconcile with the aggregate gain/(loss) in the Statement of Operations due to share transactions for the period. |
(f) Includes broker interest expense of 0.01%. |
(g) Amount represents less than $0.01 per share. |
| Ratios/Supplemental Data: | ||||||||||||||||||||||||||||
| Ratio to Average Net Assets of: (a) | |||||||||||||||||||||||||||
Change in Net Asset Value for the Period | Net Asset Value, End of Period | Total return (b) | Net assets, end of period (000) | Expenses | Net investment income/(loss) | Portfolio turnover rate (b) | ||||||||||||||||||||||
| (2.34 | ) | $ | 27.61 | (7.80 | )% | $ | 82,838 | 0.89 | % | (0.89 | )% | 0 | % | ||||||||||||||
| 2.69 | $ | 29.95 | 9.87 | % | $ | 106,320 | 0.89 | % | (0.89 | )% | 0 | % | |||||||||||||||
| 0.46 | $ | 27.26 | 1.71 | % | $ | 27,940 | 0.89 | % | (0.89 | )% | 0 | % | |||||||||||||||
| ||||||||||||||||||||||||||||
| (0.92 | ) | $ | 23.83 | (3.70 | )% | $ | 36,942 | 0.89 | % | (0.89 | )% | 0 | % | ||||||||||||||
| (0.21 | ) | $ | 24.75 | (0.84 | )% | $ | 34,031 | 0.89 | % | (0.89 | )% | 0 | % | ||||||||||||||
| ||||||||||||||||||||||||||||
| (1.62 | ) | $ | 24.15 | (6.30 | )% | $ | 31,997 | 0.89 | % | (0.89 | )% | 0 | % | ||||||||||||||
| 0.17 | $ | 25.77 | 0.68 | % | $ | 41,237 | 0.89 | % | (0.89 | )% | 0 | % | |||||||||||||||
| 0.35 | $ | 25.60 | 2.04 | % | $ | 35,197 | 0.90 | % | (f) | (0.90 | )% | 0 | % | ||||||||||||||
| (0.03 | ) | $ | 25.25 | (0.11 | )% | $ | 43,559 | 0.89 | % | (0.89 | )% | 31 | % | ||||||||||||||
| ||||||||||||||||||||||||||||
| (1.79 | ) | $ | 23.44 | (7.10 | )% | $ | 8,790 | 0.89 | % | (0.89 | )% | 0 | % | ||||||||||||||
| 0.24 | $ | 25.23 | 0.98 | % | $ | 5,047 | 0.89 | % | (0.89 | )% | 0 | % | |||||||||||||||
Financial Highlights
| Per Share Operating Performance (For a share outstanding throughout each period) | ||||||||||||||||||||||||
Investment Operations: | Capital Share Transactions: | Less Distributions: | ||||||||||||||||||||||
Net Asset Value, Beginning of Period | Net investment income/(loss) (c) | Net realized and unrealized gain/(loss) | Total From Investment Operations | Transaction fees (see Note 5) | Distributions from net realized gains | |||||||||||||||||||
Innovator Growth-100 Power Buffer ETF - January | ||||||||||||||||||||||||
For the period ended 4/30/2022 | $ | 42.07 | (0.16 | ) | (4.36 | ) | (4.52 | ) | 0.02 | - | ||||||||||||||
For the year ended 10/31/2021 | $ | 37.44 | (0.31 | ) | 4.91 | 4.60 | 0.03 | - | ||||||||||||||||
For the period 12/31/2019(d) - 10/31/2020 | $ | 34.94 | (0.24 | ) | 2.69 | 2.45 | 0.05 | - | ||||||||||||||||
Innovator Growth-100 Power Buffer ETF - April | ||||||||||||||||||||||||
For the period ended 4/30/2022 | $ | 38.38 | (0.15 | ) | (2.10 | ) | (2.25 | ) | 0.02 | - | ||||||||||||||
For the year ended 10/31/2021 | $ | 34.93 | (0.29 | ) | 3.71 | 3.42 | 0.03 | - | ||||||||||||||||
For the period 3/31/2020(d) - 10/31/2020 | $ | 31.27 | (0.16 | ) | 3.77 | 3.61 | 0.05 | - | ||||||||||||||||
Innovator Growth-100 Power Buffer ETF - July | ||||||||||||||||||||||||
For the period ended 4/30/2022 | $ | 47.65 | (0.18 | ) | (3.24 | ) | (3.42 | ) | 0.01 | - | ||||||||||||||
For the year ended 10/31/2021 | $ | 42.23 | (0.36 | ) | 5.74 | 5.38 | 0.04 | - | ||||||||||||||||
For the period 6/30/2020(d) - 10/31/2020 | $ | 40.64 | (0.11 | ) | 1.67 | 1.56 | 0.03 | - | ||||||||||||||||
Innovator Growth-100 Power Buffer ETF - October | ||||||||||||||||||||||||
For the period ended 4/30/2022 | $ | 40.07 | (0.15 | ) | (3.18 | ) | (3.33 | ) | - | - | ||||||||||||||
For the year ended 10/31/2021 | $ | 33.53 | (0.30 | ) | 6.82 | 6.52 | 0.02 | - | ||||||||||||||||
For the year ended 10/31/2020 | $ | 31.70 | (0.26 | ) | 2.39 | 2.13 | 0.05 | (0.35 | ) | |||||||||||||||
For the period 9/30/2019(d) - 10/31/2019 | $ | 31.01 | (0.02 | ) | 0.70 | 0.68 | 0.01 | - | ||||||||||||||||
(a) Annualized for periods less than one year. |
(b) Not annualized for periods less than one year. |
(c) Net investment income/(loss) per share has been calculated based on average shares outstanding during the period. |
(d) Commencement of operations. |
(e) Includes broker interest expense of 0.02%. |
| Ratios/Supplemental Data: | ||||||||||||||||||||||||||||
| Ratio to Average Net Assets of: (a) | |||||||||||||||||||||||||||
Change in Net Asset Value for the Period | Net Asset Value, End of Period | Total return (b) | Net assets, end of period (000) | Expenses | Net investment income/(loss) | Portfolio turnover rate (b) | ||||||||||||||||||||||
| ||||||||||||||||||||||||||||
| (4.50 | ) | $ | 37.57 | (10.70 | )% | $ | 123,977 | 0.79 | % | (0.79 | )% | 0 | % | ||||||||||||||
| 4.63 | $ | 42.07 | 12.36 | % | $ | 87,297 | 0.79 | % | (0.79 | )% | 0 | % | |||||||||||||||
| 2.50 | $ | 37.44 | 7.16 | % | $ | 39,315 | 0.79 | % | (0.79 | )% | 0 | % | |||||||||||||||
| ||||||||||||||||||||||||||||
| (2.23 | ) | $ | 36.15 | (5.81 | )% | $ | 59,644 | 0.79 | % | (0.79 | )% | 0 | % | ||||||||||||||
| 3.45 | $ | 38.38 | 9.87 | % | $ | 41,254 | 0.79 | % | (0.79 | )% | 0 | % | |||||||||||||||
| 3.66 | $ | 34.93 | 11.69 | % | $ | 15,717 | 0.79 | % | (0.79 | )% | 0 | % | |||||||||||||||
| ||||||||||||||||||||||||||||
| (3.41 | ) | $ | 44.24 | (7.15 | )% | $ | 55,300 | 0.79 | % | (0.79 | )% | 0 | % | ||||||||||||||
| 5.42 | $ | 47.65 | 12.83 | % | $ | 55,986 | 0.79 | % | (0.79 | )% | 0 | % | |||||||||||||||
| 1.59 | $ | 42.23 | 3.91 | % | $ | 57,011 | 0.79 | % | (0.79 | )% | 0 | % | |||||||||||||||
| ||||||||||||||||||||||||||||
| (3.33 | ) | $ | 36.74 | (8.30 | )% | $ | 62,461 | 0.79 | % | (0.79 | )% | 0 | % | ||||||||||||||
| 6.54 | $ | 40.07 | 19.51 | % | $ | 77,928 | 0.79 | % | (0.79 | )% | 0 | % | |||||||||||||||
| 1.83 | $ | 33.53 | 6.92 | % | $ | 40,566 | 0.81 | % | (e) | (0.81 | )% | 0 | % | ||||||||||||||
| 0.69 | $ | 31.70 | 2.21 | % | $ | 26,149 | 0.79 | % | (0.79 | )% | 0 | % | |||||||||||||||
Financial Highlights
| Per Share Operating Performance (For a share outstanding throughout each period) | |||||||||||||||||||||||||
Investment Operations: | Capital Share Transactions: | Less Distributions: | |||||||||||||||||||||||
Net Asset Value, Beginning of Period | Net investment income/(loss) (c) | Net realized and unrealized gain/(loss) | Total From Investment Operations | Transaction fees (see Note 5) | Distributions from realized gains | ||||||||||||||||||||
Innovator U.S. Small Cap Power Buffer ETF - January | |||||||||||||||||||||||||
For the period ended 4/30/2022 | $ | 31.76 | (0.12 | ) | (2.15 | ) | (2.27 | ) | 0.01 | - | |||||||||||||||
For the year ended 10/31/2021 | $ | 26.18 | (0.24 | ) | 5.78 | 5.54 | 0.04 | - | |||||||||||||||||
For the period 12/31/2019(d) - 10/31/2020 | $ | 26.70 | (0.17 | ) | (0.40 | ) | (0.57 | ) | 0.05 | - | |||||||||||||||
Innovator U.S. Small Cap Power Buffer ETF - April | |||||||||||||||||||||||||
For the period ended 4/30/2022 | $ | 27.83 | (0.11 | ) | (2.44 | ) | (2.55 | ) | 0.01 | - | |||||||||||||||
For the year ended 10/31/2021 | $ | 26.00 | (0.22 | ) | 2.03 | 1.81 | 0.02 | - | |||||||||||||||||
For the period 3/31/2020(d) - 10/31/2020 | $ | 23.05 | (0.12 | ) | 3.05 | 2.93 | 0.02 | - | |||||||||||||||||
Innovator U.S. Small Cap Power Buffer ETF - July | |||||||||||||||||||||||||
For the period ended 4/30/2022 | $ | 26.70 | (0.10 | ) | (1.95 | ) | (2.05 | ) | - | (e) | - | ||||||||||||||
For the year ended 10/31/2021 | $ | 23.91 | (0.21 | ) | 2.99 | 2.78 | 0.01 | - | |||||||||||||||||
For the period 6/30/2020(d) - 10/31/2020 | $ | 23.07 | (0.06 | ) | 0.89 | 0.83 | 0.01 | - | |||||||||||||||||
Innovator U.S. Small Cap Power Buffer ETF - October | |||||||||||||||||||||||||
For the period ended 4/30/2022 | $ | 27.65 | (0.10 | ) | (2.53 | ) | (2.63 | ) | - | (e) | - | ||||||||||||||
For the year ended 10/31/2021 | $ | 24.08 | (0.21 | ) | 3.77 | 3.56 | 0.01 | - | |||||||||||||||||
For the year ended 10/31/2020 | $ | 24.71 | (0.19 | ) | (0.26 | ) | (0.45 | ) | 0.02 | (0.20 | ) | ||||||||||||||
For the period 9/30/2019(d) - 10/31/2019 | $ | 24.38 | (0.01 | ) | 0.33 | 0.32 | 0.01 | - | |||||||||||||||||
(a) Annualized for periods less than one year. |
(b) Not annualized for periods less than one year. |
(c) Net investment income/(loss) per share has been calculated based on average shares outstanding during the period. |
(d) Commencement of operations. |
(e) Amount represents less than $0.01 per share. |
| Ratios/Supplemental Data: | |||||||||||||||||||||||||||
| Ratio to Average Net Assets of: (a) | ||||||||||||||||||||||||||
Change in Net Asset Value for the Period | Net Asset Value, End of Period | Total return (b) | Net assets, end of period (000) | Expenses | Net investment income/(loss) | Portfolio turnover rate (b) | |||||||||||||||||||||
| |||||||||||||||||||||||||||
| (2.26 | ) | $ | 29.50 | (7.11 | )% | $ | 124,640 | 0.79 | % | (0.79 | )% | 0 | % | |||||||||||||
| 5.58 | $ | 31.76 | 21.31 | % | $ | 84,958 | 0.79 | % | (0.79 | )% | 0 | % | ||||||||||||||
| (0.52 | ) | $ | 26.18 | (1.95 | )% | $ | 165,588 | 0.79 | % | (0.79 | )% | 0 | % | |||||||||||||
| |||||||||||||||||||||||||||
| (2.54 | ) | $ | 25.29 | (9.11 | )% | $ | 72,716 | 0.79 | % | (0.79 | )% | 0 | % | |||||||||||||
| 1.83 | $ | 27.83 | 7.04 | % | $ | 84,876 | 0.79 | % | (0.79 | )% | 0 | % | ||||||||||||||
| 2.95 | $ | 26.00 | 12.79 | % | $ | 33,147 | 0.79 | % | (0.79 | )% | 0 | % | ||||||||||||||
| |||||||||||||||||||||||||||
| (2.05 | ) | $ | 24.65 | (7.66 | )% | $ | 62,246 | 0.79 | % | (0.79 | )% | 0 | % | |||||||||||||
| 2.79 | $ | 26.70 | 11.64 | % | $ | 74,083 | 0.79 | % | (0.79 | )% | 0 | % | ||||||||||||||
| 0.84 | $ | 23.91 | 3.66 | % | $ | 23,316 | 0.79 | % | (0.79 | )% | 0 | % | ||||||||||||||
| |||||||||||||||||||||||||||
| (2.63 | ) | $ | 25.02 | (9.49 | )% | $ | 40,038 | 0.79 | % | (0.79 | )% | 0 | % | |||||||||||||
| 3.57 | $ | 27.65 | 14.79 | % | $ | 36,632 | 0.79 | % | (0.79 | )% | 0 | % | ||||||||||||||
| (0.63 | ) | $ | 24.08 | (1.73 | )% | $ | 48,170 | 0.79 | % | (0.79 | )% | 0 | % | |||||||||||||
| 0.33 | $ | 24.71 | 1.35 | % | $ | 27,179 | 0.79 | % | (0.74 | )% | 0 | % | ||||||||||||||
Financial Highlights
| Per Share Operating Performance (For a share outstanding throughout each period) | ||||||||||||||||||||||
Investment Operations: | Capital Share Transactions: | |||||||||||||||||||||
Net Asset Value, Beginning of Period | Net investment income/(loss) (c) | Net realized and unrealized gain/(loss) | Total From Investment Operations | Transaction fees (see Note 5) | ||||||||||||||||||
Innovator Double Stacker ETF - January | ||||||||||||||||||||||
For the period ended 4/30/2022 | $ | 29.76 | (0.11 | ) | (3.80 | ) | (3.91 | ) | - | (e) | ||||||||||||
For the period 12/31/2020(d) - 10/31/2021 | $ | 25.43 | (0.18 | ) | 4.50 | 4.32 | 0.01 | |||||||||||||||
Innovator Double Stacker ETF - October | ||||||||||||||||||||||
For the period ended 4/30/2022 | $ | 32.64 | (0.13 | ) | (2.90 | ) | (3.03 | ) | - | (e) | ||||||||||||
For the year ended 10/31/2021 | $ | 24.84 | (0.23 | ) | 8.01 | 7.78 | 0.02 | |||||||||||||||
For the period 9/30/2020(d) - 10/31/2020 | $ | 25.47 | (0.02 | ) | (0.64 | ) | (0.66 | ) | 0.03 | |||||||||||||
(a) Annualized for periods less than one year. |
(b) Not annualized for periods less than one year. |
(c) Net investment income/(loss) per share has been calculated based on average shares outstanding during the period. |
(d) Commencement of operations. |
(e) Amount represents less than $0.01 per share. |
(f) Includes broker interest expense of 0.01%. |
| Ratios/Supplemental Data: | ||||||||||||||||||||||||||
Ratio to Average Net Assets of: (a) | ||||||||||||||||||||||||||
Change in Net Asset Value for the Period | Net Asset Value, End of Period | Total return (b) | Net assets, end of period (000) | Expenses | Net investment income/(loss) | Portfolio turnover rate (b) | ||||||||||||||||||||
| (3.91 | ) | $ | 25.85 | (13.15 | )% | $ | 4,524 | 0.79 | % | (0.79 | )% | 0 | % | |||||||||||||
| 4.33 | $ | 29.76 | 17.04 | % | $ | 6,697 | 0.79 | % | (0.79 | )% | 0 | % | ||||||||||||||
| (3.03 | ) | $ | 29.61 | (9.26 | )% | $ | 7,403 | 0.79 | % | (0.79 | )% | 0 | % | |||||||||||||
| 7.80 | $ | 32.64 | 31.36 | % | $ | 8,975 | 0.79 | % | (0.79 | )% | 0 | % | ||||||||||||||
| (0.63 | ) | $ | 24.84 | (2.46 | )% | $ | 11,801 | 0.80 | % | (f) | (0.80 | )% | 0 | % | ||||||||||||
Financial Highlights
| Per Share Operating Performance (For a share outstanding throughout each period) | |||||||||||||||||||||
Investment Operations: | Capital Share Transactions: | ||||||||||||||||||||
Net Asset Value, Beginning of Period | Net investment income/(loss) (c) | Net realized and unrealized gain/(loss) | Total From Investment Operations | Transaction fees (see Note 5) | |||||||||||||||||
Innovator Triple Stacker ETF - January | |||||||||||||||||||||
For the period ended 4/30/2022 | $ | 29.40 | (0.11 | ) | (3.67 | ) | (3.78 | ) | 0.02 | ||||||||||||
For the period 12/31/2020(d) - 10/31/2021 | $ | 25.42 | (0.18 | ) | 4.14 | 3.96 | 0.02 | ||||||||||||||
Innovator Triple Stacker ETF - October | |||||||||||||||||||||
For the period ended 4/30/2022 | $ | 31.81 | (0.12 | ) | (2.78 | ) | (2.90 | ) | 0.01 | ||||||||||||
For the year ended 10/31/2021 | $ | 25.00 | (0.23 | ) | 7.02 | 6.79 | 0.02 | ||||||||||||||
For the period 9/30/2020(d) - 10/31/2020 | $ | 25.46 | (0.02 | ) | (0.45 | ) | (0.47 | ) | 0.01 | ||||||||||||
(a) Annualized for periods less than one year. |
(b) Not annualized for periods less than one year. |
(c) Net investment income/(loss) per share has been calculated based on average shares outstanding during the period. |
(d) Commencement of operations. |
| Ratios/Supplemental Data: | |||||||||||||||||||||||||||
| Ratio to Average Net Assets of: (a) | ||||||||||||||||||||||||||
Change in Net Asset Value for the Period | Net Asset Value, End of Period | Total return (b) | Net assets, end of period (000) | Expenses | Net investment income/(loss) | Portfolio turnover rate (b) | |||||||||||||||||||||
| |||||||||||||||||||||||||||
| (3.76 | ) | $ | 25.64 | (12.81 | )% | $ | 10,896 | 0.79 | % | (0.79 | )% | 0 | % | |||||||||||||
| 3.98 | $ | 29.40 | 15.68 | % | $ | 44,107 | 0.79 | % | (0.79 | )% | 0 | % | ||||||||||||||
| |||||||||||||||||||||||||||
| (2.89 | ) | $ | 28.92 | (9.10 | )% | $ | 7,952 | 0.79 | % | (0.79 | )% | 0 | % | |||||||||||||
| 6.81 | $ | 31.81 | 27.25 | % | $ | 16,702 | 0.79 | % | (0.79 | )% | 0 | % | ||||||||||||||
| (0.46 | ) | $ | 25.00 | (1.80 | )% | $ | 6,875 | 0.79 | % | (0.79 | )% | 0 | % | |||||||||||||
Financial Highlights
| Per Share Operating Performance (For a share outstanding throughout each period) | ||||||||||||||||||||||
Investment Operations: | Capital Share Transactions: | |||||||||||||||||||||
Net Asset Value, Beginning of Period | Net investment income/(loss) (c) | Net realized and unrealized gain/(loss) | Total From Investment Operations | Transaction fees (see Note 5) | ||||||||||||||||||
Innovator Double Stacker 9 Buffer ETF - January | ||||||||||||||||||||||
For the period ended 4/30/2022 | $ | 28.09 | (0.11 | ) | (2.28 | ) | (2.39 | ) | 0.01 | |||||||||||||
For the period 12/31/2020(d) - 10/31/2021 | $ | 25.42 | (0.18 | ) | 2.83 | 2.65 | 0.02 | |||||||||||||||
Innovator Double Stacker 9 Buffer ETF - October | ||||||||||||||||||||||
For the period ended 4/30/2022 | $ | 29.74 | (0.12 | ) | (1.42 | ) | (1.54 | ) | - | (e) | ||||||||||||
For the year ended 10/31/2021 | $ | 24.96 | (0.22 | ) | 4.99 | 4.77 | 0.01 | |||||||||||||||
For the period 9/30/2020(d) - 10/31/2020 | $ | 25.46 | (0.02 | ) | (0.51 | ) | (0.53 | ) | 0.03 | |||||||||||||
(a) Annualized for periods less than one year. |
(b) Not annualized for periods less than one year. |
(c) Net investment income/(loss) per share has been calculated based on average shares outstanding during the period. |
(d) Commencement of operations. |
(e) Amount represents less than $0.01 per share. |
| Ratios/Supplemental Data: | |||||||||||||||||||||||||||
| Ratio to Average Net Assets of: (a) | ||||||||||||||||||||||||||
Change in Net Asset Value for the Period | Net Asset Value, End of Period | Total return (b) | Net assets, end of period (000) | Expenses | Net investment income/(loss) | Portfolio turnover rate (b) | |||||||||||||||||||||
| |||||||||||||||||||||||||||
| (2.38 | ) | $ | 25.71 | (8.47 | )% | $ | 11,570 | 0.79 | % | (0.79 | )% | 0 | % | |||||||||||||
| 2.67 | $ | 28.09 | 10.50 | % | $ | 13,342 | 0.79 | % | (0.79 | )% | 0 | % | ||||||||||||||
| |||||||||||||||||||||||||||
| (1.54 | ) | $ | 28.20 | (5.17 | )% | $ | 17,627 | 0.79 | % | (0.79 | )% | 0 | % | |||||||||||||
| 4.78 | $ | 29.74 | 19.14 | % | $ | 21,562 | 0.79 | % | (0.79 | )% | 0 | % | ||||||||||||||
| (0.50 | ) | $ | 24.96 | (1.95 | )% | $ | 31,204 | 0.79 | % | (0.79 | )% | 0 | % | |||||||||||||
Financial Highlights
| Per Share Operating Performance (For a share outstanding throughout each period) | |||||||||||||||||||||
Investment Operations: | Capital Share Transactions: | ||||||||||||||||||||
Net Asset Value, Beginning of Period | Net investment income/(loss) (c) | Net realized and unrealized gain/(loss) | Total From Investment Operations | Transaction fees (see Note 5) | |||||||||||||||||
Innovator U.S. Equity Accelerated ETF - January | |||||||||||||||||||||
For the period 12/31/2021(d) - 4/30/2022 | $ | 24.71 | (0.06 | ) | (3.33 | ) | (3.39 | ) | 0.01 | ||||||||||||
Innovator U.S. Equity Accelerated ETF - April | |||||||||||||||||||||
For the period ended 4/30/2022 | $ | 28.38 | (0.11 | ) | (1.32 | ) | (1.43 | ) | - | ||||||||||||
For the period 3/31/2021(d) - 10/31/2021 | $ | 25.37 | (0.13 | ) | 3.13 | 3.00 | 0.01 | ||||||||||||||
Innovator U.S. Equity Accelerated ETF - July | |||||||||||||||||||||
For the period ended 4/30/2022 | $ | 27.23 | (0.11 | ) | (2.17 | ) | (2.28 | ) | 0.01 | ||||||||||||
For the period 6/30/2021(d) - 10/31/2021 | $ | 25.69 | (0.07 | ) | 1.61 | 1.54 | - | (e) | |||||||||||||
Innovator U.S. Equity Accelerated ETF - October | |||||||||||||||||||||
For the period ended 4/30/2022 | $ | 25.28 | (0.10 | ) | (1.87 | ) | (1.97 | ) | - | ||||||||||||
For the period 9/30/2021(d) - 10/31/2021 | $ | 24.05 | (0.02 | ) | 1.25 | 1.23 | - | ||||||||||||||
(a) Annualized for periods less than one year. |
(b) Not annualized for periods less than one year. |
(c) Net investment income/(loss) per share has been calculated based on average shares outstanding during the period. |
(d) Commencement of operations. |
(e) Amount represents less than $0.01 per share. |
| Ratios/Supplemental Data: | |||||||||||||||||||||||||||
| Ratio to Average Net Assets of: (a) | ||||||||||||||||||||||||||
Change in Net Asset Value for the Period | Net Asset Value, End of Period | Total return (b) | Net assets, end of period (000) | Expenses | Net investment income/(loss) | Portfolio turnover rate (b) | |||||||||||||||||||||
| |||||||||||||||||||||||||||
| (3.38 | ) | $ | 21.33 | (13.69 | )% | $ | 4,266 | 0.79 | % | (0.79 | )% | 0 | % | |||||||||||||
| |||||||||||||||||||||||||||
| (1.43 | ) | $ | 26.95 | (5.02 | )% | $ | 6,738 | 0.79 | % | (0.79 | )% | 0 | % | |||||||||||||
| 3.01 | $ | 28.38 | 11.86 | % | $ | 7,804 | 0.79 | % | (0.79 | )% | 0 | % | ||||||||||||||
| |||||||||||||||||||||||||||
| (2.27 | ) | $ | 24.96 | (8.34 | )% | $ | 4,991 | 0.79 | % | (0.79 | )% | 0 | % | |||||||||||||
| 1.54 | $ | 27.23 | 5.98 | % | $ | 3,403 | 0.79 | % | (0.79 | )% | 0 | % | ||||||||||||||
| |||||||||||||||||||||||||||
| (1.97 | ) | $ | 23.31 | (7.80 | )% | $ | 1,748 | 0.79 | % | (0.79 | )% | 0 | % | |||||||||||||
| 1.23 | $ | 25.28 | 5.11 | % | $ | 1,896 | 0.79 | % | (0.85 | )% | 0 | % | ||||||||||||||
Financial Highlights
| Per Share Operating Performance (For a share outstanding throughout each period) | ||||||||||||||||||||
Investment Operations: | Capital Share Transactions: | |||||||||||||||||||
Net Asset Value, Beginning of Period | Net investment income/(loss) (c) | Net realized and unrealized gain/(loss) | Total From Investment Operations | Transaction fees (see Note 5) | ||||||||||||||||
Innovator U.S. Equity Accelerated Plus ETF - January | ||||||||||||||||||||
For the period 12/31/2021(d) - 4/30/2022 | $ | 24.71 | (0.06 | ) | (3.26 | ) | (3.32 | ) | 0.02 | |||||||||||
Innovator U.S. Equity Accelerated Plus ETF - April | ||||||||||||||||||||
For the period ended 4/30/2022 | $ | 28.19 | (0.11 | ) | (1.25 | ) | (1.36 | ) | 0.02 | |||||||||||
For the period 3/31/2021(d) - 10/31/2021 | $ | 25.37 | (0.13 | ) | 2.94 | 2.81 | 0.01 | |||||||||||||
Innovator U.S. Equity Accelerated Plus ETF - July | ||||||||||||||||||||
For the period ended 4/30/2022 | $ | 27.11 | (0.11 | ) | (1.87 | ) | (1.98 | ) | 0.01 | |||||||||||
For the period 6/30/2021(d) - 10/31/2021 | $ | 25.68 | (0.07 | ) | 1.49 | 1.42 | 0.01 | |||||||||||||
Innovator U.S. Equity Accelerated Plus ETF - October | ||||||||||||||||||||
For the period ended 4/30/2022 | $ | 25.30 | (0.10 | ) | (1.76 | ) | (1.86 | ) | 0.02 | |||||||||||
For the period 9/30/2021(d) - 10/31/2021 | $ | 24.05 | (0.02 | ) | 1.27 | 1.25 | - | |||||||||||||
(a) Annualized for periods less than one year. |
(b) Not annualized for periods less than one year. |
(c) Net investment income/(loss) per share has been calculated based on average shares outstanding during the period. |
(d) Commencement of operations. |
| Ratios/Supplemental Data: | |||||||||||||||||||||||||||
| Ratio to Average Net Assets of: (a) | ||||||||||||||||||||||||||
Change in Net Asset Value for the Period | Net Asset Value, End of Period | Total return (b) | Net assets, end of period (000) | Expenses | Net investment income/(loss) | Portfolio turnover rate (b) | |||||||||||||||||||||
| |||||||||||||||||||||||||||
| (3.30 | ) | $ | 21.41 | (13.37 | )% | $ | 6,422 | 0.79 | % | (0.79 | )% | 0 | % | |||||||||||||
| |||||||||||||||||||||||||||
| (1.34 | ) | $ | 26.85 | (4.74 | )% | $ | 14,099 | 0.79 | % | (0.79 | )% | 0 | % | |||||||||||||
| 2.82 | $ | 28.19 | 11.11 | % | $ | 8,457 | 0.79 | % | (0.79 | )% | 0 | % | ||||||||||||||
| |||||||||||||||||||||||||||
| (1.97 | ) | $ | 25.14 | (7.26 | )% | $ | 13,826 | 0.79 | % | (0.79 | )% | 0 | % | |||||||||||||
| 1.43 | $ | 27.11 | 5.56 | % | $ | 9,488 | 0.79 | % | (0.79 | )% | 0 | % | ||||||||||||||
| |||||||||||||||||||||||||||
| (1.84 | ) | $ | 23.46 | (7.26 | )% | $ | 9,385 | 0.79 | % | (0.79 | )% | 0 | % | |||||||||||||
| 1.25 | $ | 25.30 | 5.20 | % | $ | 2,530 | 0.79 | % | (0.83 | )% | 0 | % | ||||||||||||||
Financial Highlights
| Per Share Operating Performance (For a share outstanding throughout each period) | ||||||||||||||||||||
Investment Operations: | Capital Share Transactions: | |||||||||||||||||||
Net Asset Value, Beginning of Period | Net investment income/(loss) (c) | Net realized and unrealized gain/(loss) | Total From Investment Operations | Transaction fees (see Note 5) | ||||||||||||||||
Innovator U.S. Equity Accelerated 9 Buffer ETF - January | ||||||||||||||||||||
For the period 12/31/2021(d) - 4/30/2022 | $ | 24.70 | (0.06 | ) | (2.11 | ) | (2.17 | ) | 0.01 | |||||||||||
Innovator U.S. Equity Accelerated 9 Buffer ETF - April | ||||||||||||||||||||
For the period ended 4/30/2022 | $ | 27.09 | (0.11 | ) | (0.91 | ) | (1.02 | ) | 0.01 | |||||||||||
For the period 3/31/2021(d) - 10/31/2021 | $ | 25.37 | (0.12 | ) | 1.83 | 1.71 | 0.01 | |||||||||||||
Innovator U.S. Equity Accelerated 9 Buffer ETF - July | ||||||||||||||||||||
For the period ended 4/30/2022 | $ | 26.49 | (0.10 | ) | (0.79 | ) | (0.89 | ) | 0.01 | |||||||||||
For the period 6/30/2021(d) - 10/31/2021 | $ | 25.68 | (0.07 | ) | 0.87 | 0.80 | 0.01 | |||||||||||||
Innovator U.S. Equity Accelerated 9 Buffer ETF - October | ||||||||||||||||||||
For the period ended 4/30/2022 | $ | 24.77 | (0.10 | ) | (0.96 | ) | (1.06 | ) | 0.01 | |||||||||||
For the period 9/30/2021(d) - 10/31/2021 | $ | 24.04 | (0.02 | ) | 0.74 | 0.72 | 0.01 | |||||||||||||
(a) Annualized for periods less than one year. |
(b) Not annualized for periods less than one year. |
(c) Net investment income/(loss) per share has been calculated based on average shares outstanding during the period. |
(d) Commencement of operations. |
| Ratios/Supplemental Data: | |||||||||||||||||||||||||||
| Ratio to Average Net Assets of: (a) | ||||||||||||||||||||||||||
Change in Net Asset Value for the Period | Net Asset Value, End of Period | Total return (b) | Net assets, end of period (000) | Expenses | Net investment income/(loss) | Portfolio turnover rate (b) | |||||||||||||||||||||
| |||||||||||||||||||||||||||
| (2.16 | ) | $ | 22.54 | (8.75 | )% | $ | 11,269 | 0.79 | % | (0.79 | )% | 0 | % | |||||||||||||
| |||||||||||||||||||||||||||
| (1.01 | ) | $ | 26.08 | (3.72 | )% | $ | 22,820 | 0.79 | % | (0.79 | )% | 0 | % | |||||||||||||
| 1.72 | $ | 27.09 | 6.77 | % | $ | 19,639 | 0.79 | % | (0.79 | )% | 0 | % | ||||||||||||||
| |||||||||||||||||||||||||||
| (0.88 | ) | $ | 25.61 | (3.34 | )% | $ | 15,365 | 0.79 | % | (0.79 | )% | 0 | % | |||||||||||||
| 0.81 | $ | 26.49 | 3.16 | % | $ | 10,597 | 0.79 | % | (0.79 | )% | 0 | % | ||||||||||||||
| |||||||||||||||||||||||||||
| (1.05 | ) | $ | 23.72 | (4.23 | )% | $ | 8,302 | 0.79 | % | (0.79 | )% | 0 | % | |||||||||||||
| 0.73 | $ | 24.77 | 3.03 | % | $ | 4,334 | 0.79 | % | (0.82 | )% | 0 | % | ||||||||||||||
Financial Highlights
| Per Share Operating Performance (For a share outstanding throughout each period) | |||||||||||||||||||||
Investment Operations: | Capital Share Transactions: | ||||||||||||||||||||
Net Asset Value, Beginning of Period | Net investment income/(loss) (c) | Net realized and unrealized gain/(loss) | Total From Investment Operations | Transaction fees (see Note 5) | |||||||||||||||||
Innovator Growth Accelerated Plus ETF - January | |||||||||||||||||||||
For the period 12/31/2021(d) - 4/30/2022 | $ | 25.45 | (0.06 | ) | (5.37 | ) | (5.43 | ) | 0.01 | ||||||||||||
Innovator Growth Accelerated Plus ETF - April | |||||||||||||||||||||
For the period ended 4/30/2022 | $ | 29.53 | (0.11 | ) | (2.65 | ) | (2.76 | ) | - | (e) | |||||||||||
For the period 3/31/2021(d) - 10/31/2021 | $ | 25.53 | (0.13 | ) | 4.11 | 3.98 | 0.02 | ||||||||||||||
Innovator Growth Accelerated Plus ETF - July | |||||||||||||||||||||
For the period ended 4/30/2022 | $ | 27.50 | (0.10 | ) | (4.87 | ) | (4.97 | ) | 0.01 | ||||||||||||
For the period 6/30/2021(d) - 10/31/2021 | $ | 25.52 | (0.07 | ) | 2.05 | 1.98 | - | ||||||||||||||
Innovator Growth Accelerated Plus ETF - October | |||||||||||||||||||||
For the period ended 4/30/2022 | $ | 25.70 | (0.10 | ) | (4.06 | ) | (4.16 | ) | 0.01 | ||||||||||||
For the period 9/30/2021(d) - 10/31/2021 | $ | 24.32 | (0.02 | ) | 1.40 | 1.38 | - | (e) | |||||||||||||
(a) Annualized for periods less than one year. |
(b) Not annualized for periods less than one year. |
(c) Net investment income/(loss) per share has been calculated based on average shares outstanding during the period. |
(d) Commencement of operations. |
(e) Amount represents less than $0.01 per share. |
| Ratios/Supplemental Data: | |||||||||||||||||||||||||||
| Ratio to Average Net Assets of: (a) | ||||||||||||||||||||||||||
Change in Net Asset Value for the Period | Net Asset Value, End of Period | Total return (b) | Net assets, end of period (000) | Expenses | Net investment income/(loss) | Portfolio turnover rate (b) | |||||||||||||||||||||
| |||||||||||||||||||||||||||
| (5.42 | ) | $ | 20.03 | (21.32 | )% | $ | 8,514 | 0.79 | % | (0.79 | )% | 0 | % | |||||||||||||
| |||||||||||||||||||||||||||
| (2.76 | ) | $ | 26.77 | (9.35 | )% | $ | 10,706 | 0.79 | % | (0.79 | )% | 0 | % | |||||||||||||
| 4.00 | $ | 29.53 | 15.66 | % | $ | 18,454 | 0.79 | % | (0.79 | )% | 0 | % | ||||||||||||||
| |||||||||||||||||||||||||||
| (4.96 | ) | $ | 22.54 | (18.03 | )% | $ | 15,778 | 0.79 | % | (0.79 | )% | 0 | % | |||||||||||||
| 1.98 | $ | 27.50 | 7.75 | % | $ | 8,250 | 0.79 | % | (0.79 | )% | 0 | % | ||||||||||||||
| |||||||||||||||||||||||||||
| (4.15 | ) | $ | 21.55 | (16.17 | )% | $ | 5,387 | 0.79 | % | (0.79 | )% | 0 | % | |||||||||||||
| 1.38 | $ | 25.70 | 5.69 | % | $ | 2,570 | 0.79 | % | (0.82 | )% | 0 | % | ||||||||||||||
Financial Highlights
| Per Share Operating Performance (For a share outstanding throughout each period) | ||||||||||||||||||||||
Investment Operations: | Capital Share Transactions: | |||||||||||||||||||||
Net Asset Value, Beginning of Period | Net investment income/(loss) (c) | Net realized and unrealized gain/(loss) | Total From Investment Operations | Transaction fees (see Note 5) | ||||||||||||||||||
Innovator 20+ Year Treasury Bond 9 Buffer ETF - July | ||||||||||||||||||||||
For the period ended 4/30/2022 | $ | 24.46 | (0.09 | ) | (2.59 | ) | (2.68 | ) | - | (g) | ||||||||||||
For the year ended 10/31/2021 | $ | 24.32 | (0.17 | ) | 0.30 | (f) | 0.13 | 0.01 | ||||||||||||||
For the period 8/17/2019(d) - 10/31/2020 | $ | 24.87 | (0.04 | ) | (0.52 | ) | (0.56 | ) | 0.01 | |||||||||||||
Innovator 20+ Year Treasury Bond 5 Floor ETF - Quarterly | ||||||||||||||||||||||
For the period ended 4/30/2022 | $ | 23.72 | (0.09 | ) | (1.80 | ) | (1.89 | ) | 0.01 | |||||||||||||
For the year ended 10/31/2021 | $ | 24.43 | (0.19 | ) | (0.56 | ) | (f) | (0.75 | ) | 0.04 | ||||||||||||
For the period 8/17/2020(d) - 10/31/2020 | $ | 24.87 | (0.04 | ) | (0.42 | ) | (0.46 | ) | 0.02 | |||||||||||||
(a) Annualized for periods less than one year. |
(b) Not annualized for periods less than one year. |
(c) Net investment income/(loss) per share has been calculated based on average shares outstanding during the period. |
(d) Commencement of operations. |
(e) Includes broker interest expense of 0.01%. |
(f) Net realized and unrealized gain/(loss) per share includes balancing amounts necessary to reconcile the change in net asset value per share for the period, and may not reconcile with the aggregate gain/(loss) in the Statement of Operations due to share transactions for the period. |
(g) Amount represents less than $0.01 per share. |
| Ratios/Supplemental Data: | |||||||||||||||||||||||||
Ratio to Average Net Assets of: (a) | |||||||||||||||||||||||||
Change in Net Asset Value for the Period | Net Asset Value, End of Period | Total return (b) | Net assets, end of period (000) | Expenses | Net investment income/(loss) | Portfolio turnover rate (b) | |||||||||||||||||||
| (2.68 | ) | $ | 21.78 | (10.95 | )% | $ | 5,990 | 0.78 | % | (0.79 | )% | 0 | % | ||||||||||||
| 0.14 | $ | 24.46 | 0.55 | % | $ | 4,892 | 0.79 | % | (0.72 | )% | 0 | % | |||||||||||||
| (0.55 | ) | $ | 24.32 | (2.19 | )% | $ | 5,473 | 0.79 | % | (0.79 | )% | 0 | % | ||||||||||||
| (1.88 | ) | $ | 21.84 | (7.95 | )% | $ | 11,465 | 0.79 | % | (0.79 | )% | 0 | % | ||||||||||||
| (0.71 | ) | $ | 23.72 | (2.87 | )% | $ | 9,489 | 0.79 | % | (0.79 | )% | 0 | % | ||||||||||||
| (0.44 | ) | $ | 24.43 | (1.79 | )% | $ | 3,053 | 0.80 | %(e) | (0.80 | )% | 0 | % | ||||||||||||
Financial Highlights
| Per Share Operating Performance (For a share outstanding throughout each period) | ||||||||||||||||||||||
Investment Operations: | Capital Share Transactions: | |||||||||||||||||||||
Net Asset Value, Beginning of Period | Net investment income/(loss) (c) | Net realized and unrealized gain/(loss) | Total From Investment Operations | Transaction fees (see Note 5) | ||||||||||||||||||
Innovator Defined Wealth Shield ETF | ||||||||||||||||||||||
For the period ended 4/30/2022 | $ | 25.86 | (0.09 | ) | (0.28 | ) | (0.37 | ) | 0.02 | |||||||||||||
For the period 6/30/2021(d) - 10/31/2021 | $ | 25.69 | (0.06 | ) | 0.20 | (e) | 0.14 | 0.03 | ||||||||||||||
Innovator U.S. Equity Accelerated ETF - Quarterly | ||||||||||||||||||||||
For the period ended 4/30/2022 | $ | 28.25 | (0.11 | ) | (3.21 | ) | (3.32 | ) | 0.01 | |||||||||||||
For the period 3/31/2021(d) - 10/31/2021 | $ | 25.37 | (0.13 | ) | 3.00 | 2.87 | 0.01 | |||||||||||||||
Innovator Growth Accelerated ETF - Quarterly | ||||||||||||||||||||||
For the period ended 4/30/2022 | $ | 29.88 | (0.11 | ) | (5.69 | ) | (5.80 | ) | - | (f) | ||||||||||||
For the period 3/31/2021(d) - 10/31/2021 | $ | 25.53 | (0.13 | ) | 4.47 | 4.34 | 0.01 | |||||||||||||||
(a) Annualized for periods less than one year. |
(b) Not annualized for periods less than one year. |
(c) Net investment income/(loss) per share has been calculated based on average shares outstanding during the period. |
(d) Commencement of operations. |
(e) Net realized and unrealized gain/(loss) per share includes balancing amounts necessary to reconcile the change in net asset value per share for the period, and may not reconcile with the aggregate gain/(loss) in the Statement of Operations due to share transactions for the period. |
(f) Amount represents less than $0.01 per share. |
| Ratios/Supplemental Data: | |||||||||||||||||||||||||||
| Ratio to Average Net Assets of: (a) | ||||||||||||||||||||||||||
Change in Net Asset Value for the Period | Net Asset Value, End of Period | Total return (b) | Net assets, end of period (000) | Expenses | Net investment income/(loss) | Portfolio turnover rate (b) | |||||||||||||||||||||
| |||||||||||||||||||||||||||
| (0.35 | ) | $ | 25.51 | (1.35 | )% | $ | 103,942 | 0.69 | % | (0.69 | )% | 0 | % | |||||||||||||
| 0.17 | $ | 25.86 | 0.65 | % | $ | 29,088 | 0.69 | % | (0.69 | )% | 0 | % | ||||||||||||||
| |||||||||||||||||||||||||||
| (3.31 | ) | $ | 24.94 | (11.75 | )% | $ | 9,351 | 0.79 | % | (0.79 | )% | 0 | % | |||||||||||||
| 2.88 | $ | 28.25 | 11.37 | % | $ | 13,421 | 0.79 | % | (0.79 | )% | 0 | % | ||||||||||||||
| |||||||||||||||||||||||||||
| (5.80 | ) | $ | 24.08 | (19.41 | )% | $ | 10,835 | 0.79 | % | (0.79 | )% | 0 | % | |||||||||||||
| 4.35 | $ | 29.88 | 17.02 | % | $ | 15,685 | 0.79 | % | (0.79 | )% | 0 | % | ||||||||||||||
Notes to Financial Statements (Unaudited)
1. | ORGANIZATION |
Innovator ETFs Trust (the “Trust”) was organized under Delaware law as a Delaware statutory trust on October 17, 2007, and is registered with the Securities and Exchange Commission (“SEC”) under the Investment Company Act of 1940, as amended (the “1940 Act”) as an open-end management investment company. The Trust currently consists of multiple operational series, of which forty-three are covered in this report, collectively the (“Funds”):
Name | Ticker | Commencement of Operations | Tracking Fund | |||
Innovator International Developed Power Buffer ETF - January | IJAN | December 31, 2019 | iShares MSCI EAFE ETF | |||
Innovator International Developed Power Buffer ETF - April | IAPR | March 31, 2021 | iShares MSCI EAFE ETF | |||
Innovator International Developed Power Buffer ETF - July | IJUL | June 28, 2019 | iShares MSCI EAFE ETF | |||
Innovator International Developed Power Buffer ETF - October | IOCT | September 30, 2021 | iShares MSCI EAFE ETF | |||
Innovator Emerging Markets Power Buffer ETF - January | EJAN | December 31, 2019 | iShares MSCI Emerging Markets ETF | |||
Innovator Emerging Markets Power Buffer ETF - April | EAPR | March 31, 2021 | iShares MSCI Emerging Markets ETF | |||
Innovator Emerging Markets Power Buffer ETF - July | EJUL | June 28, 2019 | iShares MSCI Emerging Markets ETF | |||
Innovator Emerging Markets Power Buffer ETF - October | EOCT | September 30, 2021 | iShares MSCI Emerging Markets ETF | |||
Innovator Growth-100 Power Buffer ETF - January | NJAN | December 31, 2019 | Invesco QQQ Trust | |||
Innovator Growth-100 Power Buffer ETF - April | NAPR | March 31, 2020 | Invesco QQQ Trust | |||
Innovator Growth-100 Power Buffer ETF - July | NJUL | June 30, 2020 | Invesco QQQ Trust | |||
Innovator Growth-100 Power Buffer ETF - October | NOCT | September 30, 2019 | Invesco QQQ Trust | |||
Innovator U.S. Small Cap Power Buffer ETF - January | KJAN | December 31, 2019 | iShares Russell 2000 ETF | |||
Innovator U.S. Small Cap Power Buffer ETF - April | KAPR | March 31, 2020 | iShares Russell 2000 ETF | |||
Innovator U.S. Small Cap Power Buffer ETF - July | KJUL | June 30, 2020 | iShares Russell 2000 ETF | |||
Innovator U.S. Small Cap Power Buffer ETF - October | KOCT | September 30, 2019 | iShares Russell 2000 ETF | |||
Innovator Double Stacker ETF - January | DSJA | December 31, 2020 | SPDR S&P 500® ETF Trust and Invesco QQQ Trust | |||
Innovator Double Stacker ETF - October | DSOC | September 30, 2020 | SPDR S&P 500® ETF Trust and Invesco QQQ Trust | |||
Innovator Triple Stacker ETF - January | TSJA | December 31, 2020 | SPDR S&P 500® ETF Trust, Invesco QQQ Trust and iShares Russell 2000 ETF | |||
Innovator Triple Stacker ETF - October | TSOC | September 30, 2020 | SPDR S&P 500® ETF Trust, Invesco QQQ Trust and iShares Russell 2000 ETF | |||
Innovator Double Stacker 9 Buffer ETF - January | DBJA | December 31, 2020 | SPDR S&P 500® ETF Trust and Invesco QQQ Trust | |||
Innovator Double Stacker 9 Buffer ETF - October | DBOC | September 30, 2020 | SPDR S&P 500® ETF Trust and Invesco QQQ Trust | |||
Innovator U.S. Equity Accelerated ETF - January | XDJA | December 31, 2021 | SPDR S&P 500® ETF Trust | |||
Innovator U.S. Equity Accelerated ETF - April | XDAP | March 31, 2021 | SPDR S&P 500® ETF Trust | |||
Innovator U.S. Equity Accelerated ETF - July | XDJL | June 30, 2021 | SPDR S&P 500® ETF Trust | |||
Innovator U.S. Equity Accelerated ETF - October | XDOC | September 30, 2021 | SPDR S&P 500® ETF Trust | |||
Innovator U.S. Equity Accelerated Plus ETF - January | XTJA | December 31, 2021 | SPDR S&P 500® ETF Trust | |||
Innovator U.S. Equity Accelerated Plus ETF - April | XTAP | March 31, 2021 | SPDR S&P 500® ETF Trust | |||
Innovator U.S. Equity Accelerated Plus ETF - July | XTJL | June 30, 2021 | SPDR S&P 500® ETF Trust | |||
Innovator U.S. Equity Accelerated Plus ETF - October | XTOC | September 30, 2021 | SPDR S&P 500® ETF Trust | |||
Innovator U.S. Equity Accelerated 9 Buffer ETF - January | XBJA | December 31, 2021 | SPDR S&P 500® ETF Trust | |||
Innovator U.S. Equity Accelerated 9 Buffer ETF - April | XBAP | March 31, 2021 | SPDR S&P 500® ETF Trust | |||
Innovator U.S. Equity Accelerated 9 Buffer ETF - July | XBJL | June 30, 2021 | SPDR S&P 500® ETF Trust | |||
Innovator U.S. Equity Accelerated 9 Buffer ETF - October | XBOC | September 30, 2021 | SPDR S&P 500® ETF Trust | |||
Innovator Growth Accelerated Plus ETF - January | QTJA | December 31, 2021 | Invesco QQQ Trust | |||
Innovator Growth Accelerated Plus ETF - April | QTAP | March 31, 2021 | Invesco QQQ Trust | |||
Innovator Growth Accelerated Plus ETF - July | QTJL | June 30, 2021 | Invesco QQQ Trust | |||
Innovator Growth Accelerated Plus ETF - October | QTOC | September 30, 2021 | Invesco QQQ Trust | |||
Innovator 20+ Year Treasury Bond 9 Buffer ETF - July | TBJL | August 17, 2020 | iShares 20+ Year Treasury Bond ETF | |||
Innovator 20+ Year Treasury Bond 5 Floor ETF - Quarterly | TFJL | August 17, 2020 | iShares 20+ Year Treasury Bond ETF | |||
Innovator Defined Wealth Shield ETF | BALT | June 30, 2021 | SPDR S&P 500® ETF Trust | |||
Innovator U.S. Equity Accelerated ETF - Quarterly | XDSQ | March 31, 2021 | SPDR S&P 500® ETF Trust | |||
Innovator Growth Accelerated ETF - Quarterly | XDQQ | March 31, 2021 | Invesco QQQ Trust | |||
The operational series of the Trust covered outside of this report consist of:
Name | Ticker | Commencement of Operations | Tracking Index/Fund | |||
Innovator IBD® 50 ETF | FFTY | April 8, 2015 | IBD® 50 Index | |||
Innovator IBD® Breakout Opportunities ETF | BOUT | September 12, 2018 | IBD® Breakout Stocks Index | |||
Innovator Loup Frontier Tech ETF | LOUP | July 24, 2018 | Loup Frontier Tech Index | |||
Innovator S&P Investment Grade Preferred ETF | EPRF | May 23, 2016 | S&P U.S. High Quality Preferred Stock Index | |||
Innovator Laddered Allocation Buffer ETF | BUFB | February 8, 2022 | MerQube U.S. Large Cap Equity Buffer Laddered Index | |||
Innovator Laddered Allocation Power Buffer ETF | BUFF | October 19, 2016 | Refinitiv Laddered Power Buffer Strategy Index | |||
Innovator U.S. Equity Buffer ETF – January | BJAN | December 31, 2018 | SPDR S&P 500® ETF Trust | |||
Innovator U.S. Equity Buffer ETF – February | BFEB | January 31, 2020 | SPDR S&P 500® ETF Trust | |||
Innovator U.S. Equity Buffer ETF – March | BMAR | February 28, 2020 | SPDR S&P 500® ETF Trust | |||
Innovator U.S. Equity Buffer ETF – April | BAPR | March 29, 2019 | SPDR S&P 500® ETF Trust | |||
Innovator U.S. Equity Buffer ETF – May | BMAY | April 30, 2020 | SPDR S&P 500® ETF Trust | |||
Innovator U.S. Equity Buffer ETF – June | BJUN | May 31, 2019 | SPDR S&P 500® ETF Trust | |||
Innovator U.S. Equity Buffer ETF – July | BJUL | August 28, 2018 | SPDR S&P 500® ETF Trust | |||
Innovator U.S. Equity Buffer ETF – August | BAUG | July 31, 2019 | SPDR S&P 500® ETF Trust | |||
Innovator U.S. Equity Buffer ETF – September | BSEP | August 30, 2019 | SPDR S&P 500® ETF Trust | |||
Innovator U.S. Equity Buffer ETF – October | BOCT | September 28, 2018 | SPDR S&P 500® ETF Trust | |||
Innovator U.S. Equity Buffer ETF – November | BNOV | October 31, 2019 | SPDR S&P 500® ETF Trust | |||
Innovator U.S. Equity Buffer ETF – December | BDEC | November 29, 2019 | SPDR S&P 500® ETF Trust | |||
Innovator U.S. Equity Power Buffer ETF – January | PJAN | December 31, 2018 | SPDR S&P 500® ETF Trust | |||
Innovator U.S. Equity Power Buffer ETF – February | PFEB | January 31, 2020 | SPDR S&P 500® ETF Trust | |||
Innovator U.S. Equity Power Buffer ETF – March | PMAR | February 28, 2020 | SPDR S&P 500® ETF Trust | |||
Innovator U.S. Equity Power Buffer ETF – April | PAPR | March 29, 2019 | SPDR S&P 500® ETF Trust | |||
Innovator U.S. Equity Power Buffer ETF – May | PMAY | April 30, 2020 | SPDR S&P 500® ETF Trust | |||
Innovator U.S. Equity Power Buffer ETF – June | PJUN | May 31, 2019 | SPDR S&P 500® ETF Trust | |||
Innovator U.S. Equity Power Buffer ETF – July | PJUL | August 7, 2018 | SPDR S&P 500® ETF Trust | |||
Innovator U.S. Equity Power Buffer ETF – August | PAUG | July 31, 2019 | SPDR S&P 500® ETF Trust | |||
Innovator U.S. Equity Power Buffer ETF – September | PSEP | August 30, 2019 | SPDR S&P 500® ETF Trust | |||
Innovator U.S. Equity Power Buffer ETF – October | POCT | September 28, 2018 | SPDR S&P 500® ETF Trust | |||
Innovator U.S. Equity Power Buffer ETF – November | PNOV | October 31, 2019 | SPDR S&P 500® ETF Trust | |||
Innovator U.S. Equity Power Buffer ETF – December | PDEC | November 29, 2019 | SPDR S&P 500® ETF Trust | |||
Innovator U.S. Equity Ultra Buffer ETF – January | UJAN | December 31, 2018 | SPDR S&P 500® ETF Trust | |||
Innovator U.S. Equity Ultra Buffer ETF – February | UFEB | January 31, 2020 | SPDR S&P 500® ETF Trust | |||
Innovator U.S. Equity Ultra Buffer ETF – March | UMAR | February 28, 2020 | SPDR S&P 500® ETF Trust | |||
Innovator U.S. Equity Ultra Buffer ETF – April | UAPR | March 29, 2019 | SPDR S&P 500® ETF Trust | |||
Innovator U.S. Equity Ultra Buffer ETF – May | UMAY | April 30, 2020 | SPDR S&P 500® ETF Trust | |||
Innovator U.S. Equity Ultra Buffer ETF – June | UJUN | May 31, 2019 | SPDR S&P 500® ETF Trust | |||
Innovator U.S. Equity Ultra Buffer ETF – July | UJUL | August 7, 2018 | SPDR S&P 500® ETF Trust | |||
Innovator U.S. Equity Ultra Buffer ETF – August | UAUG | July 31, 2019 | SPDR S&P 500® ETF Trust | |||
Innovator U.S. Equity Ultra Buffer ETF – September | USEP | August 30, 2019 | SPDR S&P 500® ETF Trust | |||
Innovator U.S. Equity Ultra Buffer ETF – October | UOCT | September 28, 2018 | SPDR S&P 500® ETF Trust | |||
Innovator U.S. Equity Ultra Buffer ETF – November | UNOV | October 31, 2019 | SPDR S&P 500® ETF Trust | |||
Innovator U.S. Equity Ultra Buffer ETF – December | UDEC | November 29, 2019 | SPDR S&P 500® ETF Trust | |||
Innovator Buffer Step-Up Strategy ETF | BSTP | March 7, 2022 | SPDR S&P 500® ETF Trust | |||
Innovator Power Buffer Step-Up Strategy ETF | PSTP | March 7, 2022 | SPDR S&P 500® ETF Trust |
The Funds are exchange traded funds that offer one class of shares, do not charge a sales load, do not have a redemption fee and currently do not charge a 12b-1 fee to their shareholders. The Innovator International Developed and Emerging Markets ETFs list and principally trade their shares on NYSE Arca (“NYSE”). All other Innovator ETFs included in this report each, respectively, list and principally trade their shares on Cboe BZX Exchange, Inc. (“Cboe BZX”).
Each Fund employs a specific “defined outcome strategy.” Defined outcome strategies generally seek to produce pre-determined investment outcomes based upon the performance of an index or one or more underlying securities. The Funds’ pre-determined outcomes (“Outcomes”) are based upon the price performance of a benchmark index or one or more underlying exchange-traded fund (the “Benchmark”) over a period of approximately one year or another predetermined period (“Outcome Period”). The Funds’ investment strategy provides shareholders with participation in any gains experienced by the applicable Benchmark over the course of the Outcome Period, subject to a cap on upside returns (a “Cap”), and, if applicable, a predetermined buffer (a “Buffer”) against Benchmark losses for the Outcome Period. These defined outcomes are managed by purchasing and selling call and put FLexible EXchange Options (“FLEX Options”) to create layers within a Fund’s portfolio. Each Fund’s FLEX Option has the same reference asset and expiration date, with uniquely selected strike prices for the Fund’s Outcome Period. Due to the customizable nature of FLEX Options that allows for specific strike prices to be selected for the same reference asset and expiration date, when each of the FLEX Options expire on the last day of the Outcome Period, the Funds are expected to achieve a Benchmark investment return with the applicable Buffer and Cap investment parameters.
The Funds are investment companies and accordingly follow the investment company accounting and reporting guidance of the Financial Accounting Standards Board (“FASB”) Accounting Standards Codification (“ASC”) Topic 946 “Financial Services — Investment Companies”.
2. | SIGNIFICANT ACCOUNTING POLICIES |
The following is a summary of significant accounting policies consistently followed by the Trust in the preparation of its financial statements. These policies are in conformity with accounting principles generally accepted in the United States of America (“U.S. GAAP”).
Valuation:
The net asset values (“NAV”) of the Funds are determined as of the close of regular trading on the NYSE (normally 4:00 p.m. ET). If the NYSE closes early on a valuation day, the Funds shall determine NAV as of that time.
Portfolio securities generally shall be valued utilizing prices provided by independent pricing services. The Trust’s Pricing Committee (“Pricing Committee”) is responsible for establishing valuation of portfolio securities and other instruments held by the Funds in accordance with the Trust’s valuation procedures.
Common stocks, preferred stocks and other equity securities listed on any national or foreign exchange (excluding the NASDAQ National Market (“NASDAQ”) and the London Stock Exchange Alternative Investment Market (“AIM”)) are generally valued at the last sale price on the exchange on which they are principally traded or, for NASDAQ and AIM securities, the official closing price. Securities traded on more than one securities exchange are valued at the last sale price or official closing price, as applicable, at the close of the exchange representing the principal market for such securities. Securities traded in the over-the-counter market are valued at the mean of the bid and the asked price, if available, and otherwise at their closing bid price. Redeemable securities issued by open-end investment companies shall be valued at the investment company’s applicable net asset value, with the exception of exchange-traded open-end investment companies which are priced as equity securities. Fixed income securities, swaps, currency-, credit- and commodity-linked notes, and other similar instruments will be valued using a pricing service. Fixed income securities having a remaining maturity of 60 days or less when purchased will be valued at cost adjusted for amortization of premiums and accretion of discounts, provided the Pricing Committee has determined that the use of amortized cost is an appropriate reflection of fair value given market and issuer specific conditions existing at the time of the determination. Deposit accounts are valued at acquisition cost. Foreign securities and other assets denominated in foreign currencies are translated into U.S. dollars at the exchange rate of such currencies against the U.S. dollar as provided by the pricing service. All assets denominated in foreign currencies will be converted into U.S. dollars at the exchange rates in effect at the time of valuation. Restricted securities (with the exception of Rule 144A Securities for which market quotations are available) will normally be valued at fair value as determined by the Pricing Committee.
Exchange-traded option contracts (other than FLEX Option contracts) will be valued at the closing price in the market where such contracts are principally traded. If no closing price is available, they will be fair valued at the mean of their most recent bid and asked price, if available, and otherwise at their closing bid price. OTC options are fair valued at the mean of the most recent bid and asked price, if available, and otherwise at their closing bid price. FLEX Options will be valued at a model-based price provided by the exchange on which the option is traded at the official close of that exchange’s trading date. If the exchange on which the option is traded is unable to provide a model price, FLEX Options prices will be provided by backup provider Super Derivatives. Otherwise, the value of a FLEX Option will be determined by the Pricing Committee in accordance with the Trust’s valuation procedures.
If no quotation can be obtained from a pricing service, then the Pricing Committee will then attempt to obtain one or more broker quotes for the security. If no quotation is available from either a pricing service or one or more brokers or if the Pricing Committee has reason to question the reliability or accuracy of a quotation supplied or the use of amortized cost, the value of any portfolio security held by the Funds for which reliable market quotations are not readily available will be determined by the Pricing Committee in a manner that most appropriately reflects fair market value of the security on the valuation date. The use of a fair valuation method may be appropriate if, for example: (i) market quotations do not accurately reflect fair value of an investment; (ii) an investment’s value has been materially affected by events occurring after the close of the exchange or market on which the investment is principally traded (for example, a foreign exchange or market); (iii) a trading halt closes an exchange or market early; or (iv) other events result in an exchange or market delaying its normal close.
Fair Valuation Measurement:
FASB established a framework for measuring fair value in accordance with U.S. GAAP. Under ASC Topic 820, Fair Value Measurement (“ASC 820”), various inputs are used in determining the value of the Funds’ investments. The inputs or methodology used for valuing securities are not necessarily an indication of the risk associated with investing in those securities. The three Levels of inputs of the fair value hierarchy are defined as follows:
• | Level 1 – | Unadjusted quoted prices in active markets for identical assets or liabilities that the Funds have the ability to access. | |
• | Level 2 – | Observable inputs other than quoted prices included in level 1 that are observable for the asset or liability, either directly or indirectly. These inputs may include quoted prices for the identical instrument on an inactive market, prices for similar instruments, interest rates, prepayment speeds, credit risk, yield curves, default rates and similar data. | |
• | Level 3 – | Unobservable inputs for the asset or liability, to the extent relevant observable inputs are not available, representing the Funds’ own assumptions about the assumptions a market participant would use in valuing the asset or liability, and would be based on the best information available. |
The availability of observable inputs can vary from security to security and is affected by a wide variety of factors, including, for example, the type of security, whether the security is new and not yet established in the marketplace, the liquidity of markets, and other characteristics particular to the security. To the extent that valuation is based on models or inputs that are less observable or unobservable in the market, the determination of fair value requires more judgement. Accordingly, the degree of judgement exercised in determining fair value is greatest for instruments categorized in Level 3.
The inputs used to measure fair value may fall into different levels of the fair value hierarchy. In such cases, for disclosure purposes, the level in the fair value hierarchy within which the fair value measurement falls in its entirety, is determined based on the lowest level input that is significant to the fair value measurement in its entirety.
The following table summarizes valuation of the Funds’ investments under the fair value hierarchy levels as of April 30, 2022:
IJAN | ||||||||||||||||
Level 1 | Level 2 | Level 3 | Total | |||||||||||||
Assets | ||||||||||||||||
Purchased Options | $ | - | $ | 97,016,178 | $ | - | $ | 97,016,178 | ||||||||
Short Term Investments | 568,862 | - | - | 568,862 | ||||||||||||
Total Assets | $ | 568,862 | $ | 97,016,178 | $ | - | $ | 97,585,040 | ||||||||
Liabilities | ||||||||||||||||
Options Written | $ | - | $ | 8,635,862 | $ | - | $ | 8,635,862 | ||||||||
Total Liabilities | $ | - | $ | 8,635,862 | $ | - | $ | 8,635,862 | ||||||||
IAPR | ||||||||||||||||
Level 1 | Level 2 | Level 3 | Total | |||||||||||||
Assets | ||||||||||||||||
Purchased Options | $ | - | $ | 57,916,962 | $ | - | $ | 57,916,962 | ||||||||
Short Term Investments | 453,537 | - | - | 453,537 | ||||||||||||
Total Assets | $ | 453,537 | $ | 57,916,962 | $ | - | $ | 58,370,499 | ||||||||
Liabilities | ||||||||||||||||
Options Written | $ | - | $ | 3,804,583 | $ | - | $ | 3,804,583 | ||||||||
Total Liabilities | $ | - | $ | 3,804,583 | $ | - | $ | 3,804,583 | ||||||||
IJUL | ||||||||||||||||
Level 1 | Level 2 | Level 3 | Total | |||||||||||||
Assets | ||||||||||||||||
Purchased Options | $ | - | $ | 62,327,945 | $ | - | $ | 62,327,945 | ||||||||
Short Term Investments | 120,651 | - | - | 120,651 | ||||||||||||
Total Assets | $ | 120,651 | $ | 62,327,945 | $ | - | $ | 62,448,596 | ||||||||
Liabilities | ||||||||||||||||
Options Written | $ | - | $ | 3,663,932 | $ | - | $ | 3,663,932 | ||||||||
Total Liabilities | $ | - | $ | 3,663,932 | $ | - | $ | 3,663,932 | ||||||||
IOCT | ||||||||||||||||
Level 1 | Level 2 | Level 3 | Total | |||||||||||||
Assets | ||||||||||||||||
Purchased Options | $ | - | $ | 18,491,395 | $ | - | $ | 18,491,395 | ||||||||
Short Term Investments | 72,575 | - | - | 72,575 | ||||||||||||
Total Assets | $ | 72,575 | $ | 18,491,395 | $ | - | $ | 18,563,970 | ||||||||
Liabilities | ||||||||||||||||
Options Written | $ | - | $ | 1,356,877 | $ | - | $ | 1,356,877 | ||||||||
Total Liabilities | $ | - | $ | 1,356,877 | $ | - | $ | 1,356,877 | ||||||||
EJAN | ||||||||||||||||
Level 1 | Level 2 | Level 3 | Total | |||||||||||||
Assets | ||||||||||||||||
Purchased Options | $ | - | $ | 90,943,280 | $ | - | $ | 90,943,280 | ||||||||
Short Term Investments | 547,488 | - | - | 547,488 | ||||||||||||
Total Assets | $ | 547,488 | $ | 90,943,280 | $ | - | $ | 91,490,768 | ||||||||
Liabilities | ||||||||||||||||
Options Written | $ | - | $ | 8,588,396 | $ | - | $ | 8,588,396 | ||||||||
Total Liabilities | $ | - | $ | 8,588,396 | $ | - | $ | 8,588,396 | ||||||||
EAPR | ||||||||||||||||
Level 1 | Level 2 | Level 3 | Total | |||||||||||||
Assets | ||||||||||||||||
Purchased Options | $ | - | $ | 41,032,345 | $ | - | $ | 41,032,345 | ||||||||
Short Term Investments | 318,058 | - | - | 318,058 | ||||||||||||
Total Assets | $ | 318,058 | $ | 41,032,345 | $ | - | $ | 41,350,403 | ||||||||
Liabilities | ||||||||||||||||
Options Written | $ | - | $ | 4,388,538 | $ | - | $ | 4,388,538 | ||||||||
Total Liabilities | $ | - | $ | 4,388,538 | $ | - | $ | 4,388,538 | ||||||||
EJUL | ||||||||||||||||
Level 1 | Level 2 | Level 3 | Total | |||||||||||||
Assets | ||||||||||||||||
Purchased Options | $ | - | $ | 35,141,404 | $ | - | $ | 35,141,404 | ||||||||
Short Term Investments | 67,901 | - | - | 67,901 | ||||||||||||
Total Assets | $ | 67,901 | $ | 35,141,404 | $ | - | $ | 35,209,305 | ||||||||
Liabilities | ||||||||||||||||
Options Written | $ | - | $ | 3,187,708 | $ | - | $ | 3,187,708 | ||||||||
Total Liabilities | $ | - | $ | 3,187,708 | $ | - | $ | 3,187,708 | ||||||||
EOCT | ||||||||||||||||
Level 1 | Level 2 | Level 3 | Total | |||||||||||||
Assets | ||||||||||||||||
Purchased Options | $ | - | $ | 9,701,038 | $ | - | $ | 9,701,038 | ||||||||
Short Term Investments | 36,824 | - | - | 36,824 | ||||||||||||
Total Assets | $ | 36,824 | $ | 9,701,038 | $ | - | $ | 9,737,862 | ||||||||
Liabilities | ||||||||||||||||
Options Written | $ | - | $ | 941,467 | $ | - | $ | 941,467 | ||||||||
Total Liabilities | $ | - | $ | 941,467 | $ | - | $ | 941,467 | ||||||||
NJAN | ||||||||||||||||
Level 1 | Level 2 | Level 3 | Total | |||||||||||||
Assets | ||||||||||||||||
Purchased Options | $ | - | $ | 138,075,969 | $ | - | $ | 138,075,969 | ||||||||
Short Term Investments | 764,141 | - | - | 764,141 | ||||||||||||
Total Assets | $ | 764,141 | $ | 138,075,969 | $ | - | $ | 138,840,110 | ||||||||
Liabilities | ||||||||||||||||
Options Written | $ | - | $ | 14,778,456 | $ | - | $ | 14,778,456 | ||||||||
Total Liabilities | $ | - | $ | 14,778,456 | $ | - | $ | 14,778,456 | ||||||||
NAPR | ||||||||||||||||
Level 1 | Level 2 | Level 3 | Total | |||||||||||||
Assets | ||||||||||||||||
Purchased Options | $ | - | $ | 65,258,810 | $ | - | $ | 65,258,810 | ||||||||
Short Term Investments | 476,803 | - | - | 476,803 | ||||||||||||
Total Assets | $ | 476,803 | $ | 65,258,810 | $ | - | $ | 65,735,613 | ||||||||
Liabilities | ||||||||||||||||
Options Written | $ | - | $ | 6,056,098 | $ | - | $ | 6,056,098 | ||||||||
Total Liabilities | $ | - | $ | 6,056,098 | $ | - | $ | 6,056,098 | ||||||||
NJUL | ||||||||||||||||
Level 1 | Level 2 | Level 3 | Total | |||||||||||||
Assets | ||||||||||||||||
Purchased Options | $ | - | $ | 57,289,456 | $ | - | $ | 57,289,456 | ||||||||
Short Term Investments | 122,844 | - | - | 122,844 | ||||||||||||
Total Assets | $ | 122,844 | $ | 57,289,456 | $ | - | $ | 57,412,300 | ||||||||
Liabilities | ||||||||||||||||
Options Written | $ | - | $ | 2,076,561 | $ | - | $ | 2,076,561 | ||||||||
Total Liabilities | $ | - | $ | 2,076,561 | $ | - | $ | 2,076,561 | ||||||||
NOCT | ||||||||||||||||
Level 1 | Level 2 | Level 3 | Total | |||||||||||||
Assets | ||||||||||||||||
Purchased Options | $ | - | $ | 66,367,684 | $ | - | $ | 66,367,684 | ||||||||
Short Term Investments | 278,529 | - | - | 278,529 | ||||||||||||
Total Assets | $ | 278,529 | $ | 66,367,684 | $ | - | $ | 66,646,213 | ||||||||
Liabilities | ||||||||||||||||
Options Written | $ | - | $ | 4,142,170 | $ | - | $ | 4,142,170 | ||||||||
Total Liabilities | $ | - | $ | 4,142,170 | $ | - | $ | 4,142,170 | ||||||||
KJAN | ||||||||||||||||
Level 1 | Level 2 | Level 3 | Total | |||||||||||||
Assets | ||||||||||||||||
Purchased Options | $ | - | $ | 135,840,321 | $ | - | $ | 135,840,321 | ||||||||
Short Term Investments | 765,520 | - | - | 765,520 | ||||||||||||
Total Assets | $ | 765,520 | $ | 135,840,321 | $ | - | $ | 136,605,841 | ||||||||
Liabilities | ||||||||||||||||
Options Written | $ | - | $ | 11,888,877 | $ | - | $ | 11,888,877 | ||||||||
Total Liabilities | $ | - | $ | 11,888,877 | $ | - | $ | 11,888,877 | ||||||||
KAPR | ||||||||||||||||
Level 1 | Level 2 | Level 3 | Total | |||||||||||||
Assets | ||||||||||||||||
Purchased Options | $ | - | $ | 78,615,479 | $ | - | $ | 78,615,479 | ||||||||
Short Term Investments | 583,285 | - | - | 583,285 | ||||||||||||
Total Assets | $ | 583,285 | $ | 78,615,479 | $ | - | $ | 79,198,764 | ||||||||
Liabilities | ||||||||||||||||
Options Written | $ | - | $ | 6,435,587 | $ | - | $ | 6,435,587 | ||||||||
Total Liabilities | $ | - | $ | 6,435,587 | $ | - | $ | 6,435,587 | ||||||||
KJUL | ||||||||||||||||
Level 1 | Level 2 | Level 3 | Total | |||||||||||||
Assets | ||||||||||||||||
Purchased Options | $ | - | $ | 66,460,004 | $ | - | $ | 66,460,004 | ||||||||
Short Term Investments | 125,775 | - | - | 125,775 | ||||||||||||
Total Assets | $ | 125,775 | $ | 66,460,004 | $ | - | $ | 66,585,779 | ||||||||
Liabilities | ||||||||||||||||
Options Written | $ | - | $ | 4,298,636 | $ | - | $ | 4,298,636 | ||||||||
Total Liabilities | $ | - | $ | 4,298,636 | $ | - | $ | 4,298,636 | ||||||||
KOCT | ||||||||||||||||
Level 1 | Level 2 | Level 3 | Total | |||||||||||||
Assets | ||||||||||||||||
Purchased Options | $ | - | $ | 42,806,643 | $ | - | $ | 42,806,643 | ||||||||
Short Term Investments | 162,186 | - | - | 162,186 | ||||||||||||
Total Assets | $ | 162,186 | $ | 42,806,643 | $ | - | $ | 42,968,829 | ||||||||
Liabilities | ||||||||||||||||
Options Written | $ | - | $ | 2,903,612 | $ | - | $ | 2,903,612 | ||||||||
Total Liabilities | $ | - | $ | 2,903,612 | $ | - | $ | 2,903,612 | ||||||||
DSJA | ||||||||||||||||
Level 1 | Level 2 | Level 3 | Total | |||||||||||||
Assets | ||||||||||||||||
Purchased Options | $ | - | $ | 4,523,731 | $ | - | $ | 4,523,731 | ||||||||
Short Term Investments | 35,193 | - | - | 35,193 | ||||||||||||
Total Assets | $ | 35,193 | $ | 4,523,731 | $ | - | $ | 4,558,924 | ||||||||
Liabilities | ||||||||||||||||
Options Written | $ | - | $ | 32,046 | $ | - | $ | 32,046 | ||||||||
Total Liabilities | $ | - | $ | 32,046 | $ | - | $ | 32,046 | ||||||||
DSOC | ||||||||||||||||
Level 1 | Level 2 | Level 3 | Total | |||||||||||||
Assets | ||||||||||||||||
Purchased Options | $ | - | $ | 7,492,739 | $ | - | $ | 7,492,739 | ||||||||
Short Term Investments | 37,188 | - | - | 37,188 | ||||||||||||
Total Assets | $ | 37,188 | $ | 7,492,739 | $ | - | $ | 7,529,927 | ||||||||
Liabilities | ||||||||||||||||
Options Written | $ | - | $ | 122,410 | $ | - | $ | 122,410 | ||||||||
Total Liabilities | $ | - | $ | 122,410 | $ | - | $ | 122,410 | ||||||||
TSJA | ||||||||||||||||
Level 1 | Level 2 | Level 3 | Total | |||||||||||||
Assets | ||||||||||||||||
Purchased Options | $ | - | $ | 11,049,386 | $ | - | $ | 11,049,386 | ||||||||
Short Term Investments | 97,533 | - | - | 97,533 | ||||||||||||
Total Assets | $ | 97,533 | $ | 11,049,386 | $ | - | $ | 11,146,919 | ||||||||
Liabilities | ||||||||||||||||
Options Written | $ | - | $ | 243,153 | $ | - | $ | 243,153 | ||||||||
Total Liabilities | $ | - | $ | 243,153 | $ | - | $ | 243,153 | ||||||||
TSOC | ||||||||||||||||
Level 1 | Level 2 | Level 3 | Total | |||||||||||||
Assets | ||||||||||||||||
Purchased Options | $ | - | $ | 8,202,601 | $ | - | $ | 8,202,601 | ||||||||
Short Term Investments | 32,850 | - | - | 32,850 | ||||||||||||
Total Assets | $ | 32,850 | $ | 8,202,601 | $ | - | $ | 8,235,451 | ||||||||
Liabilities | ||||||||||||||||
Options Written | $ | - | $ | 277,164 | $ | - | $ | 277,164 | ||||||||
Total Liabilities | $ | - | $ | 277,164 | $ | - | $ | 277,164 | ||||||||
DBJA | ||||||||||||||||
Level 1 | Level 2 | Level 3 | Total | |||||||||||||
Assets | ||||||||||||||||
Purchased Options | $ | - | $ | 12,715,597 | $ | - | $ | 12,715,597 | ||||||||
Short Term Investments | 85,873 | - | - | 85,873 | ||||||||||||
Total Assets | $ | 85,873 | $ | 12,715,597 | $ | - | $ | 12,801,470 | ||||||||
Liabilities | ||||||||||||||||
Options Written | $ | - | $ | 1,223,984 | $ | - | $ | 1,223,984 | ||||||||
Total Liabilities | $ | - | $ | 1,223,984 | $ | - | $ | 1,223,984 | ||||||||
DBOC | ||||||||||||||||
Level 1 | Level 2 | Level 3 | Total | |||||||||||||
Assets | ||||||||||||||||
Purchased Options | $ | - | $ | 18,870,107 | $ | - | $ | 18,870,107 | ||||||||
Short Term Investments | 103,482 | - | - | 103,482 | ||||||||||||
Total Assets | $ | 103,482 | $ | 18,870,107 | $ | - | $ | 18,973,589 | ||||||||
Liabilities | ||||||||||||||||
Options Written | $ | - | $ | 1,334,990 | $ | - | $ | 1,334,990 | ||||||||
Total Liabilities | $ | - | $ | 1,334,990 | $ | - | $ | 1,334,990 | ||||||||
XDJA | ||||||||||||||||
Level 1 | Level 2 | Level 3 | Total | |||||||||||||
Assets | ||||||||||||||||
Purchased Options | $ | - | $ | 4,265,898 | $ | - | $ | 4,265,898 | ||||||||
Short Term Investments | 33,109 | - | - | 33,109 | ||||||||||||
Total Assets | $ | 33,109 | $ | 4,265,898 | $ | - | $ | 4,299,007 | ||||||||
Liabilities | ||||||||||||||||
Options Written | $ | - | $ | 30,405 | $ | - | $ | 30,405 | ||||||||
Total Liabilities | $ | - | $ | 30,405 | $ | - | $ | 30,405 | ||||||||
XDAP | ||||||||||||||||
Level 1 | Level 2 | Level 3 | Total | |||||||||||||
Assets | ||||||||||||||||
Purchased Options | $ | - | $ | 6,883,734 | $ | - | $ | 6,883,734 | ||||||||
Short Term Investments | 69,937 | - | - | 69,937 | ||||||||||||
Total Assets | $ | 69,937 | $ | 6,883,734 | $ | - | $ | 6,953,671 | ||||||||
Liabilities | ||||||||||||||||
Options Written | $ | - | $ | 210,948 | $ | - | $ | 210,948 | ||||||||
Total Liabilities | $ | - | $ | 210,948 | $ | - | $ | 210,948 | ||||||||
XDJL | ||||||||||||||||
Level 1 | Level 2 | Level 3 | Total | |||||||||||||
Assets | ||||||||||||||||
Purchased Options | $ | - | $ | 4,962,312 | $ | - | $ | 4,962,312 | ||||||||
Short Term Investments | 56,521 | - | - | 56,521 | ||||||||||||
Total Assets | $ | 56,521 | $ | 4,962,312 | $ | - | $ | 5,018,833 | ||||||||
Liabilities | ||||||||||||||||
Options Written | $ | - | $ | 24,072 | $ | - | $ | 24,072 | ||||||||
Total Liabilities | $ | - | $ | 24,072 | $ | - | $ | 24,072 | ||||||||
XDOC | ||||||||||||||||
Level 1 | Level 2 | Level 3 | Total | |||||||||||||
Assets | ||||||||||||||||
Purchased Options | $ | - | $ | 1,781,050 | $ | - | $ | 1,781,050 | ||||||||
Short Term Investments | 7,607 | - | - | 7,607 | ||||||||||||
Total Assets | $ | 7,607 | $ | 1,781,050 | $ | - | $ | 1,788,657 | ||||||||
Liabilities | ||||||||||||||||
Options Written | $ | - | $ | 39,484 | $ | - | $ | 39,484 | ||||||||
Total Liabilities | $ | - | $ | 39,484 | $ | - | $ | 39,484 | ||||||||
XTJA | ||||||||||||||||
Level 1 | Level 2 | Level 3 | Total | |||||||||||||
Assets | ||||||||||||||||
Purchased Options | $ | - | $ | 6,505,363 | $ | - | $ | 6,505,363 | ||||||||
Short Term Investments | 49,248 | - | - | 49,248 | ||||||||||||
Total Assets | $ | 49,248 | $ | 6,505,363 | $ | - | $ | 6,554,611 | ||||||||
Liabilities | ||||||||||||||||
Options Written | $ | - | $ | 128,514 | $ | - | $ | 128,514 | ||||||||
Total Liabilities | $ | - | $ | 128,514 | $ | - | $ | 128,514 | ||||||||
XTAP | ||||||||||||||||
Level 1 | Level 2 | Level 3 | Total | |||||||||||||
Assets | ||||||||||||||||
Purchased Options | $ | - | $ | 15,003,083 | $ | - | $ | 15,003,083 | ||||||||
Short Term Investments | 151,024 | - | - | 151,024 | ||||||||||||
Total Assets | $ | 151,024 | $ | 15,003,083 | $ | - | $ | 15,154,107 | ||||||||
Liabilities | ||||||||||||||||
Options Written | $ | - | $ | 1,045,684 | $ | - | $ | 1,045,684 | ||||||||
Total Liabilities | $ | - | $ | 1,045,684 | $ | - | $ | 1,045,684 | ||||||||
XTJL | ||||||||||||||||
Level 1 | Level 2 | Level 3 | Total | |||||||||||||
Assets | ||||||||||||||||
Purchased Options | $ | - | $ | 14,045,770 | $ | - | $ | 14,045,770 | ||||||||
Short Term Investments | 69,452 | - | - | 69,452 | ||||||||||||
Total Assets | $ | 69,452 | $ | 14,045,770 | $ | - | $ | 14,115,222 | ||||||||
Liabilities | ||||||||||||||||
Options Written | $ | - | $ | 279,662 | $ | - | $ | 279,662 | ||||||||
Total Liabilities | $ | - | $ | 279,662 | $ | - | $ | 279,662 | ||||||||
XTOC | ||||||||||||||||
Level 1 | Level 2 | Level 3 | Total | |||||||||||||
Assets | ||||||||||||||||
Purchased Options | $ | - | $ | 9,915,330 | $ | - | $ | 9,915,330 | ||||||||
Short Term Investments | 44,101 | - | - | 44,101 | ||||||||||||
Total Assets | $ | 44,101 | $ | 9,915,330 | $ | - | $ | 9,959,431 | ||||||||
Liabilities | ||||||||||||||||
Options Written | $ | - | $ | 568,045 | $ | - | $ | 568,045 | ||||||||
Total Liabilities | $ | - | $ | 568,045 | $ | - | $ | 568,045 | ||||||||
XBJA | ||||||||||||||||
Level 1 | Level 2 | Level 3 | Total | |||||||||||||
Assets | ||||||||||||||||
Purchased Options | $ | - | $ | 12,400,751 | $ | - | $ | 12,400,751 | ||||||||
Short Term Investments | 78,775 | - | - | 78,775 | ||||||||||||
Total Assets | $ | 78,775 | $ | 12,400,751 | $ | - | $ | 12,479,526 | ||||||||
Liabilities | ||||||||||||||||
Options Written | $ | - | $ | 1,202,629 | $ | - | $ | 1,202,629 | ||||||||
Total Liabilities | $ | - | $ | 1,202,629 | $ | - | $ | 1,202,629 | ||||||||
XBAP | ||||||||||||||||
Level 1 | Level 2 | Level 3 | Total | |||||||||||||
Assets | ||||||||||||||||
Purchased Options | $ | - | $ | 25,599,113 | $ | - | $ | 25,599,113 | ||||||||
Short Term Investments | 194,913 | - | - | 194,913 | ||||||||||||
Total Assets | $ | 194,913 | $ | 25,599,113 | $ | - | $ | 25,794,026 | ||||||||
Liabilities | ||||||||||||||||
Options Written | $ | - | $ | 2,959,902 | $ | - | $ | 2,959,902 | ||||||||
Total Liabilities | $ | - | $ | 2,959,902 | $ | - | $ | 2,959,902 | ||||||||
XBJL | ||||||||||||||||
Level 1 | Level 2 | Level 3 | Total | |||||||||||||
Assets | ||||||||||||||||
Purchased Options | $ | - | $ | 15,886,827 | $ | - | $ | 15,886,827 | ||||||||
Short Term Investments | 67,933 | - | - | 67,933 | ||||||||||||
Total Assets | $ | 67,933 | $ | 15,886,827 | $ | - | $ | 15,954,760 | ||||||||
Liabilities | ||||||||||||||||
Options Written | $ | - | $ | 582,298 | $ | - | $ | 582,298 | ||||||||
Total Liabilities | $ | - | $ | 582,298 | $ | - | $ | 582,298 | ||||||||
XBOC | ||||||||||||||||
Level 1 | Level 2 | Level 3 | Total | |||||||||||||
Assets | ||||||||||||||||
Purchased Options | $ | - | $ | 8,979,798 | $ | - | $ | 8,979,798 | ||||||||
Short Term Investments | 36,066 | - | - | 36,066 | ||||||||||||
Total Assets | $ | 36,066 | $ | 8,979,798 | $ | - | $ | 9,015,864 | ||||||||
Liabilities | ||||||||||||||||
Options Written | $ | - | $ | 708,839 | $ | - | $ | 708,839 | ||||||||
Total Liabilities | $ | - | $ | 708,839 | $ | - | $ | 708,839 | ||||||||
QTJA | ||||||||||||||||
Level 1 | Level 2 | Level 3 | Total | |||||||||||||
Assets | ||||||||||||||||
Purchased Options | $ | - | $ | 8,575,792 | $ | - | $ | 8,575,792 | ||||||||
Short Term Investments | 65,725 | - | - | 65,725 | ||||||||||||
Total Assets | $ | 65,725 | $ | 8,575,792 | $ | - | $ | 8,641,517 | ||||||||
Liabilities | ||||||||||||||||
Options Written | $ | - | $ | 121,665 | $ | - | $ | 121,665 | ||||||||
Total Liabilities | $ | - | $ | 121,665 | $ | - | $ | 121,665 | ||||||||
QTAP | ||||||||||||||||
Level 1 | Level 2 | Level 3 | Total | |||||||||||||
Assets | ||||||||||||||||
Purchased Options | $ | - | $ | 11,429,453 | $ | - | $ | 11,429,453 | ||||||||
Short Term Investments | 121,434 | - | - | 121,434 | ||||||||||||
Total Assets | $ | 121,434 | $ | 11,429,453 | $ | - | $ | 11,550,887 | ||||||||
Liabilities | ||||||||||||||||
Options Written | $ | - | $ | 836,878 | $ | - | $ | 836,878 | ||||||||
Total Liabilities | $ | - | $ | 836,878 | $ | - | $ | 836,878 | ||||||||
QTJL | ||||||||||||||||
Level 1 | Level 2 | Level 3 | Total | |||||||||||||
Assets | ||||||||||||||||
Purchased Options | $ | - | $ | 15,814,368 | $ | - | $ | 15,814,368 | ||||||||
Short Term Investments | 60,505 | - | - | 60,505 | ||||||||||||
Total Assets | $ | 60,505 | $ | 15,814,368 | $ | - | $ | 15,874,873 | ||||||||
Liabilities | ||||||||||||||||
Options Written | $ | - | $ | 84,868 | $ | - | $ | 84,868 | ||||||||
Total Liabilities | $ | - | $ | 84,868 | $ | - | $ | 84,868 | ||||||||
QTOC | ||||||||||||||||
Level 1 | Level 2 | Level 3 | Total | |||||||||||||
Assets | ||||||||||||||||
Purchased Options | $ | - | $ | 5,502,692 | $ | - | $ | 5,502,692 | ||||||||
Short Term Investments | 28,178 | - | - | 28,178 | ||||||||||||
Total Assets | $ | 28,178 | $ | 5,502,692 | $ | - | $ | 5,530,870 | ||||||||
Liabilities | ||||||||||||||||
Options Written | $ | - | $ | 140,175 | $ | - | $ | 140,175 | ||||||||
Total Liabilities | $ | - | $ | 140,175 | $ | - | $ | 140,175 | ||||||||
TBJL | ||||||||||||||||
Level 1 | Level 2 | Level 3 | Total | |||||||||||||
Assets | ||||||||||||||||
Purchased Options | $ | - | $ | 6,611,918 | $ | - | $ | 6,611,918 | ||||||||
Total Assets | $ | - | $ | 6,611,918 | $ | - | $ | 6,611,918 | ||||||||
Liabilities | ||||||||||||||||
Options Written | $ | - | $ | 615,591 | $ | - | $ | 615,591 | ||||||||
Total Liabilities | $ | - | $ | 615,591 | $ | - | $ | 615,591 | ||||||||
TFJL | ||||||||||||||||
Level 1 | Level 2 | Level 3 | Total | |||||||||||||
Assets | ||||||||||||||||
Purchased Options | $ | - | $ | 11,459,441 | $ | - | $ | 11,459,441 | ||||||||
Short Term Investments | 29,784 | - | - | 29,784 | ||||||||||||
Total Assets | $ | 29,784 | $ | 11,459,441 | $ | - | $ | 11,489,225 | ||||||||
Liabilities | ||||||||||||||||
Options Written | $ | - | $ | 18,450 | $ | - | $ | 18,450 | ||||||||
Total Liabilities | $ | - | $ | 18,450 | $ | - | $ | 18,450 | ||||||||
BALT | ||||||||||||||||
Level 1 | Level 2 | Level 3 | Total | |||||||||||||
Assets | ||||||||||||||||
Purchased Options | $ | - | $ | 105,320,621 | $ | - | $ | 105,320,621 | ||||||||
Short Term Investments | 212,368 | - | - | 212,368 | ||||||||||||
Total Assets | $ | 212,368 | $ | 105,320,621 | $ | - | $ | 105,532,989 | ||||||||
Liabilities | ||||||||||||||||
Options Written | $ | - | $ | 1,535,205 | $ | - | $ | 1,535,205 | ||||||||
Total Liabilities | $ | - | $ | 1,535,205 | $ | - | $ | 1,535,205 | ||||||||
XDSQ | ||||||||||||||||
Level 1 | Level 2 | Level 3 | Total | |||||||||||||
Assets | ||||||||||||||||
Purchased Options | $ | - | $ | 9,349,750 | $ | - | $ | 9,349,750 | ||||||||
Short Term Investments | 31,793 | - | - | 31,793 | ||||||||||||
Total Assets | $ | 31,793 | $ | 9,349,750 | $ | - | $ | 9,381,543 | ||||||||
Liabilities | ||||||||||||||||
Options Written | $ | - | $ | 23,858 | $ | - | $ | 23,858 | ||||||||
Total Liabilities | $ | - | $ | 23,858 | $ | - | $ | 23,858 | ||||||||
XDQQ | ||||||||||||||||
Level 1 | Level 2 | Level 3 | Total | |||||||||||||
Assets | ||||||||||||||||
Purchased Options | $ | - | $ | 10,838,047 | $ | - | $ | 10,838,047 | ||||||||
Short Term Investments | 37,835 | - | - | 37,835 | ||||||||||||
Total Assets | $ | 37,835 | $ | 10,838,047 | $ | - | $ | 10,875,882 | ||||||||
Liabilities | ||||||||||||||||
Options Written | $ | - | $ | 33,483 | $ | - | $ | 33,483 | ||||||||
Total Liabilities | $ | - | $ | 33,483 | $ | - | $ | 33,483 | ||||||||
There were no Level 3 investments for the Funds during the period ended April 30, 2022.
Option Contracts:
In general, an option contract is an agreement between a buyer and seller that gives the purchaser of the option the right to buy or sell a particular asset at a specified future date at an agreed upon price (commonly known as the “strike price”).
The Funds invest primarily in FLEX Option contracts. FLEX Options are customized option contracts that trade on an exchange but provide investors with the ability to customize key contract terms like strike price, style and expiration date while achieving price discovery in competitive, transparent auctions markets and avoiding the counterparty exposure of over-the-counter options positions. Like traditional exchange-traded options, FLEX Options are guaranteed for settlement by the OCC, a market clearinghouse that guarantees performance by counterparties to certain derivatives contracts. The FLEX Options in which the Funds will invest are all European style options (options that are exercisable only on the expiration date). The FLEX Options are listed on the Chicago Board Options Exchange.
The Funds will purchase and sell call and put FLEX Options. In general, put options give the holder (i.e., the buyer) the right to sell an asset (or deliver the cash value of the index, in case of an index put option) and the seller (i.e., the writer) of the put has the obligation to buy the asset (or receive cash value of the index, in case of an index put option) at a certain defined price. Call options give the holder (i.e., the buyer) the right to buy an asset (or receive cash value of the index, in case of an index call option) and the seller (i.e., the writer) the obligation to sell the asset (or deliver cash value of the index, in case of an index call option) at a certain defined price.
When the Funds purchase an option, an amount equal to the premium paid by the Funds are recorded as an investment and is subsequently adjusted to the current value of the option purchased. If an option expires on the stipulated expiration date or if the Funds enter into a closing sale transaction, a gain or loss is realized. If a call option is exercised, the cost of the security acquired is increased by the premium paid for the call. If a put option is exercised, a gain or loss is realized from the sale of the underlying security, and the proceeds from such sale are decreased by the premium originally paid. Purchased options are non-income producing securities.
When the Funds write an option, an amount equal to the premium received by the Funds are recorded as a liability and is subsequently adjusted to the current value of the option written. Premiums received from writing options that expire unexercised are treated by the Funds on the expiration date as realized gain from written options. The difference between the premium and the amount paid on effecting a closing purchase transaction, including brokerage commissions, is also treated as a realized gain, or if the premium is less than the amount paid for the closing purchase transaction, as a realized loss. If a call option is exercised, the premium is added to the proceeds from the sale of the underlying security in determining whether the Funds have realized a gain or loss. If a put option is exercised, the premium reduces the cost basis of the securities purchased by the Funds. The Funds, as writers of an option, bear the market risk of an unfavorable change in the price of the security underlying the written option.
All of the FLEX Option contracts held by the Funds are fully funded and cash settled, therefore balance sheet offsetting under ASC 210 does not apply.
The Funds bear the risk that the OCC will be unable or unwilling to perform its obligations under the FLEX Options contracts. In the unlikely event that the OCC becomes insolvent or is otherwise unable to meet its settlement obligations, the Funds could suffer significant losses. Additionally, FLEX Options may be less liquid than certain other securities such as standardized options. In less liquid market for the FLEX Options, the Funds may have difficulty closing out certain FLEX Options positions at desired times and prices. The Funds may experience substantial downside from specific FLEX Option positions and certain FLEX Option positions may expire worthless. The value of the underlying FLEX Options will be affected by, among others, changes in the value of the exchange, changes in interest rates, changes in the actual and implied volatility of the Index and the remaining time to until the FLEX Options expire. The value of the FLEX Options does not increase or decrease at the same rate as the level of the Index (although they generally move in the same direction). However, as a FLEX Option approaches its expiration date, its value typically increasingly moves with the value of the Index.
The value of derivative instruments on the Statements of Assets and Liabilities for the Funds as of April 30, 2022 are as follows:
Equity Risk - Call and Put Options not Accounted for as Hedging Instruments | ||||||||
Asset Derivatives | Liability Derivatives | |||||||
Investments, at value | Options written, at value | |||||||
IJAN | $ | 97,016,178 | $ | 8,635,862 | ||||
IAPR | 57,916,962 | 3,804,583 | ||||||
IJUL | 62,327,945 | 3,663,932 | ||||||
IOCT | 18,491,395 | 1,356,877 | ||||||
EJAN | 90,943,280 | 8,588,396 | ||||||
EAPR | 41,032,345 | 4,388,538 | ||||||
EJUL | 35,141,404 | 3,187,708 | ||||||
EOCT | 9,701,038 | 941,467 | ||||||
NJAN | 138,075,969 | 14,778,456 | ||||||
NAPR | 65,258,810 | 6,056,098 | ||||||
NJUL | 57,289,456 | 2,076,561 | ||||||
NOCT | 66,367,684 | 4,142,170 | ||||||
KJAN | 135,840,321 | 11,888,877 | ||||||
KAPR | 78,615,479 | 6,435,587 | ||||||
KJUL | 66,460,004 | 4,298,636 | ||||||
KOCT | 42,806,643 | 2,903,612 | ||||||
DSJA | 4,523,731 | 32,046 | ||||||
DSOC | 7,492,739 | 122,410 | ||||||
TSJA | 11,049,386 | 243,153 | ||||||
TSOC | 8,202,601 | 277,164 | ||||||
DBJA | 12,715,597 | 1,223,984 | ||||||
DBOC | 18,870,107 | 1,334,990 | ||||||
XDJA | 4,265,898 | 30,405 | ||||||
XDAP | 6,883,734 | 210,948 | ||||||
XDJL | 4,962,312 | 24,072 | ||||||
XDOC | 1,781,050 | 39,484 | ||||||
XTJA | 6,505,363 | 128,514 | ||||||
XTAP | 15,003,083 | 1,045,684 | ||||||
XTJL | 14,045,770 | 279,662 | ||||||
XTOC | 9,915,330 | 568,045 | ||||||
XBJA | 12,400,751 | 1,202,629 | ||||||
XBAP | 25,599,113 | 2,959,902 | ||||||
XBJL | 15,886,827 | 582,298 | ||||||
XBOC | 8,979,798 | 708,839 | ||||||
QTJA | 8,575,792 | 121,665 | ||||||
QTAP | 11,429,453 | 836,878 | ||||||
QTJL | 15,814,368 | 84,868 | ||||||
QTOC | 5,502,692 | 140,175 | ||||||
TBJL | 6,611,918 | 615,591 | ||||||
TFJL | 11,459,441 | 18,450 | ||||||
BALT | 105,320,621 | 1,535,205 | ||||||
XDSQ | 9,349,750 | 23,858 | ||||||
XDQQ | 10,838,047 | 33,483 | ||||||
The effect of derivative instruments on the Statements of Operations for the period ended April 30, 2022:
Equity Risk - Call and Put Options not Accounted for as Hedging Instruments | ||||||||||||||||
Amount of Realized Gain/(Loss) on Derivatives Recognized in Income | ||||||||||||||||
Investments | Investments in-kind | Options written | Options written in-kind | |||||||||||||
IJAN | $ | (2,965,546 | ) | $ | 3,470,371 | $ | 151,553 | $ | 3,089,836 | |||||||
IAPR | (1,500,717 | ) | 36,150 | 22,094 | 1,050,650 | |||||||||||
IJUL | (166,159 | ) | 124,181 | 14,889 | 81,043 | |||||||||||
IOCT | - | 61,804 | - | 29,563 | ||||||||||||
EJAN | (10,053,167 | ) | (5,734 | ) | 7,904,807 | 229,456 | ||||||||||
EAPR | (4,709,333 | ) | 2,552,606 | 839,787 | 604,303 | |||||||||||
EJUL | (817,592 | ) | 116,555 | 1,412 | 74,430 | |||||||||||
EOCT | - | - | - | - | ||||||||||||
NJAN | (6,315,599 | ) | 17,821,190 | (6,297,219 | ) | 3,641,629 | ||||||||||
NAPR | (297,563 | ) | 2,640,609 | (1,158,268 | ) | 2,750,154 | ||||||||||
NJUL | (311,207 | ) | 435,482 | (195,279 | ) | 59,702 | ||||||||||
NOCT | (325,517 | ) | 529,114 | (312,149 | ) | 188,703 | ||||||||||
KJAN | (8,069,928 | ) | 10,586,872 | 2,478,306 | 6,735,738 | |||||||||||
KAPR | (6,445,587 | ) | (497,544 | ) | 545,595 | 6,382,627 | ||||||||||
KJUL | (522,231 | ) | 247,914 | (37,598 | ) | 406,054 | ||||||||||
KOCT | (420,643 | ) | - | (47,731 | ) | - | ||||||||||
DSJA | 493,150 | 1,644,734 | (1,400,768 | ) | 33,515 | |||||||||||
DSOC | 22,624 | (25,038 | ) | 1,632 | 24,467 | |||||||||||
TSJA | (2,919,508 | ) | 11,302,990 | (7,413,634 | ) | 2,077,068 | ||||||||||
TSOC | (225,772 | ) | 12,347 | 65,495 | 134,469 | |||||||||||
DBJA | (1,233,107 | ) | 4,215,403 | (2,696,002 | ) | 557,072 | ||||||||||
DBOC | (43,568 | ) | - | (49,750 | ) | - | ||||||||||
XDJA | - | - | - | - | ||||||||||||
XDAP | 1,011,976 | 410,766 | (551,713 | ) | 308,646 | |||||||||||
XDJL | - | - | - | - | ||||||||||||
XDOC | - | - | - | - | ||||||||||||
XTJA | - | 1,309 | - | 66,892 | ||||||||||||
XTAP | 1,653,911 | 2,638,399 | (2,432,204 | ) | 315,611 | |||||||||||
XTJL | - | - | - | - | ||||||||||||
XTOC | - | - | - | - | ||||||||||||
XBJA | - | 157,846 | - | 210,025 | ||||||||||||
XBAP | 202,849 | 1,170,491 | (1,385,753 | ) | 1,332,986 | |||||||||||
XBJL | - | - | - | - | ||||||||||||
XBOC | - | - | - | - | ||||||||||||
QTJA | - | 32,652 | - | 81,427 | ||||||||||||
QTAP | (1,954,568 | ) | 1,341,608 | (2,347,337 | ) | 3,837,889 | ||||||||||
QTJL | - | - | - | - | ||||||||||||
QTOC | - | - | - | - | ||||||||||||
TBJL | - | 27,128 | - | (12,314 | ) | |||||||||||
TFJL | (469,124 | ) | (40,109 | ) | 61,562 | 82,942 | ||||||||||
BALT | (5,124,818 | ) | 4,865,440 | (1,640,406 | ) | 2,339,727 | ||||||||||
XDSQ | 44,466 | 1,921,388 | (1,534,255 | ) | 5,682 | |||||||||||
XDQQ | (694,149 | ) | 2,145,444 | (1,485,576 | ) | 75,502 | ||||||||||
Equity Risk - Call and Put Options not Accounted for as Hedging Instruments | ||||||||
Change in Unrealized Appreciation/(Depreciation) on Derivatives Recognized in Income | ||||||||
Investments | Options written | |||||||
IJAN | $ | (3,879,317 | ) | $ | (5,158,659 | ) | ||
IAPR | (649,967 | ) | (1,449,501 | ) | ||||
IJUL | (931,299 | ) | (1,631,838 | ) | ||||
IOCT | (467,111 | ) | (606,590 | ) | ||||
EJAN | 3,695,949 | (9,383,394 | ) | |||||
EAPR | 2,330,303 | (2,805,632 | ) | |||||
EJUL | (84,530 | ) | (1,344,259 | ) | ||||
EOCT | (140,358 | ) | (345,045 | ) | ||||
NJAN | (21,614,483 | ) | (753,594 | ) | ||||
NAPR | (8,969,172 | ) | 1,775,684 | |||||
NJUL | (6,459,791 | ) | 2,826,358 | |||||
NOCT | (8,341,873 | ) | 2,926,636 | |||||
KJAN | (16,412,317 | ) | (5,133,779 | ) | ||||
KAPR | (3,333,775 | ) | (3,865,569 | ) | ||||
KJUL | (4,203,116 | ) | (936,960 | ) | ||||
KOCT | (4,242,674 | ) | 633,842 | |||||
DSJA | (2,830,425 | ) | �� | 1,347,585 | ||||
DSOC | (1,755,547 | ) | 1,018,626 | |||||
TSJA | (15,046,421 | ) | 9,247,541 | |||||
TSOC | (3,666,232 | ) | 2,755,256 | |||||
DBJA | (4,869,350 | ) | 2,876,622 | |||||
DBOC | (2,059,081 | ) | 1,222,579 | |||||
XDJA | (569,005 | ) | 122,309 | |||||
XDAP | (2,557,103 | ) | 1,219,105 | |||||
XDJL | (1,117,994 | ) | 627,451 | |||||
XDOC | (325,288 | ) | 184,829 | |||||
XTJA | (1,546,687 | ) | 625,527 | |||||
XTAP | (4,561,579 | ) | 2,792,274 | |||||
XTJL | (2,995,936 | ) | 2,181,656 | |||||
XTOC | (1,930,507 | ) | 1,325,541 | |||||
XBJA | (1,438,249 | ) | 250,809 | |||||
XBAP | (5,045,531 | ) | 3,052,889 | |||||
XBJL | (2,165,088 | ) | 1,751,714 | |||||
XBOC | (1,120,266 | ) | 789,929 | |||||
QTJA | (2,862,780 | ) | 1,028,201 | |||||
QTAP | (6,112,429 | ) | 5,187,424 | |||||
QTJL | (5,516,684 | ) | 2,954,442 | |||||
QTOC | (2,705,865 | ) | 1,698,883 | |||||
TBJL | (356,628 | ) | (388,352 | ) | ||||
TFJL | (605,021 | ) | 129,973 | |||||
BALT | (4,197,373 | ) | 2,752,217 | |||||
XDSQ | (2,662,185 | ) | 1,183,456 | |||||
XDQQ | (4,140,801 | ) | 1,613,145 | |||||
The average volume of derivative activity during the period ended April 30, 2022, is as follows:
Purchased Options | Options Written | |||||||
Average Monthly Market Value | Average Monthly Market Value | |||||||
IJAN | $ | 75,702,045 | $ | (4,199,978 | ) | |||
IAPR | 33,721,093 | (1,217,837 | ) | |||||
IJUL | 56,826,543 | (1,891,021 | ) | |||||
IOCT | 16,177,349 | (718,593 | ) | |||||
EJAN | 107,023,182 | (6,637,894 | ) | |||||
EAPR | 33,744,791 | (1,616,015 | ) | |||||
EJUL | 39,236,292 | (2,354,808 | ) | |||||
EOCT | 8,013,443 | (518,678 | ) | |||||
NJAN | 124,037,129 | (10,752,472 | ) | |||||
NAPR | 47,164,402 | (4,308,543 | ) | |||||
NJUL | 56,320,987 | (3,366,934 | ) | |||||
NOCT | 75,812,224 | (6,022,160 | ) | |||||
KJAN | 116,978,876 | (8,347,896 | ) | |||||
KAPR | 83,298,557 | (3,310,559 | ) | |||||
KJUL | 69,318,203 | (3,376,487 | ) | |||||
KOCT | 44,758,273 | (2,659,488 | ) | |||||
DSJA | 6,131,561 | (463,768 | ) | |||||
DSOC | 9,028,588 | (820,933 | ) | |||||
TSJA | 28,800,144 | (4,477,798 | ) | |||||
TSOC | 15,870,565 | (2,329,611 | ) | |||||
DBJA | 15,225,167 | (2,011,570 | ) | |||||
DBOC | 23,124,472 | (3,352,843 | ) | |||||
XDJA | 3,240,984 | (69,067 | ) | |||||
XDAP | 8,315,153 | (898,655 | ) | |||||
XDJL | 5,317,656 | (331,392 | ) | |||||
XDOC | 2,022,240 | (167,493 | ) | |||||
XTJA | 5,392,259 | (273,900 | ) | |||||
XTAP | 15,645,438 | (2,659,471 | ) | |||||
XTJL | 12,749,011 | (1,546,383 | ) | |||||
XTOC | 7,263,610 | (1,013,175 | ) | |||||
XBJA | 11,671,043 | (1,122,439 | ) | |||||
XBAP | 27,239,981 | (4,312,429 | ) | |||||
XBJL | 14,318,916 | (1,519,602 | ) | |||||
XBOC | 7,487,537 | (990,956 | ) | |||||
QTJA | 7,148,708 | (372,978 | ) | |||||
QTAP | 21,250,962 | (4,712,568 | ) | |||||
QTJL | 16,395,477 | (1,766,781 | ) | |||||
QTOC | 6,410,318 | (951,843 | ) | |||||
TBJL | 6,261,572 | (269,469 | ) | |||||
TFJL | 10,192,295 | (74,591 | ) | |||||
BALT | 80,178,815 | (1,670,106 | ) | |||||
XDSQ | 11,610,026 | (311,594 | ) | |||||
XDQQ | 14,182,510 | (582,883 | ) | |||||
Use of Estimates:
In preparing financial statements in conformity with U.S. GAAP, management is required to make estimates and assumptions that affect the reported amounts of assets and liabilities and disclosure of contingent assets and liabilities as of the date of the financial statements and the reported amounts of increases and decreases in net assets from operations during the reporting period. Actual results could differ from these estimates.
Guarantees and Indemnifications:
In the normal course of business, the Trust may enter into a contract with service providers that contain general indemnification clauses. The Trust’s maximum exposure under these arrangements is unknown as this would involve future claims against the Trust that have not yet occurred. Based on experience, the Trust expects the risk of loss to be remote.
Tax Information:
The Funds are treated as separate entities for federal income tax purposes. The Funds intend to qualify as regulated investment companies (“RICs”) under Subchapter M of the Internal Revenue Code of 1986, as amended (the “Internal Revenue Code”). To qualify and remain eligible for the special tax treatment accorded to RICs, the Funds must meet certain annual income and quarterly asset diversification requirements and must distribute annually at least 90% of the sum of (i) its investment company taxable income (which includes dividends, interest and net short-term capital gains) and (ii) certain net tax-exempt income, if any. If so qualified, the Funds will not be subject to federal income tax to the extent the Funds distribute substantially all of their net investment income and capital gains to shareholders.
Management evaluates the Funds’ tax positions to determine if the tax positions taken meet the minimum recognition threshold in connection with accounting for uncertainties in income tax positions taken or expected to be taken for the purposes of measuring and recognizing tax liabilities in the financial statements. Tax benefits associated with an uncertain tax position can be recognized only when the position is “more likely than not” to be sustained assuming examination by taxing authorities. Interest and penalties related to income taxes would be recorded as tax expense in the Statements of Operations. During the year or period ended April 30, 2022, the Funds did not incur any interest or penalties. The Funds’ federal income tax returns are subject to examination by the Internal Revenue Service (IRS) for a period of three fiscal years after they are filed. State and local tax returns may be subject to examination for an additional fiscal year depending on the jurisdiction. As of April 30, 2022, the Funds did not have a liability for any unrecognized tax benefits. As of April 30, 2022, the Funds have no examinations in progress and management is not aware of any tax positions for which it is reasonably possible that the amounts of unrecognized tax benefits will significantly change in the next twelve months. The Funds are subject to examination by U.S. Federal tax authorities for all tax years since inception.
U.S. GAAP requires that certain components of net assets be reclassified between distributable earnings/(accumulated deficit) and additional paid-in capital. These reclassifications have no effect on net assets or net asset value per share. For the year or period ended October 31, 2021, the Funds made the following permanent book-to-tax reclassifications due to deemed distributions, net operating losses, and redemption in-kind transactions:
Distributable Earnings/ (Accumulated Deficit) | Paid-In Capital | |||||||
IJAN | $ | (4,416,809 | ) | $ | 4,416,809 | |||
IAPR | (60,726 | ) | 60,726 | |||||
IJUL | (987,094 | ) | 987,094 | |||||
IOCT | - | - | ||||||
EJAN | (3,159,241 | ) | 3,159,241 | |||||
EAPR | (41,975 | ) | 41,975 | |||||
EJUL | 336,822 | (336,822 | ) | |||||
EOCT | - | - | ||||||
NJAN | (1,618,185 | ) | 1,618,185 | |||||
NAPR | (697,529 | ) | 697,529 | |||||
NJUL | (4,240,692 | ) | 4,240,692 | |||||
NOCT | (8,259,927 | ) | 8,259,927 | |||||
KJAN | (9,316,019 | ) | 9,316,019 | |||||
KAPR | (701,269 | ) | 701,269 | |||||
KJUL | (2,406,431 | ) | 2,406,431 | |||||
KOCT | (4,927,998 | ) | 4,927,998 | |||||
DJSA | - | - | ||||||
DSOC | (9,104,385 | ) | 9,104,385 | |||||
TSJA | (286,847 | ) | 286,847 | |||||
TSOC | (10,634,976 | ) | 10,634,976 | |||||
DBJA | (603,964 | ) | 603,964 | |||||
DBOC | (19,560,466 | ) | 19,560,466 | |||||
XDAP | - | - | ||||||
XDJL | - | - | ||||||
XDOC | - | - | ||||||
XTAP | - | - | ||||||
XTJL | - | - | ||||||
XTOC | - | - | ||||||
XBAP | (758,004 | ) | 758,004 | |||||
XBJL | - | - | ||||||
XBOC | - | - | ||||||
QTAP | (2,084,328 | ) | 2,084,328 | |||||
QTJL | - | - | ||||||
QTOC | - | - | ||||||
TBJL | (32,130 | ) | 32,130 | |||||
TFJL | 7,910 | (7,910 | ) | |||||
BALT | (195,315 | ) | 195,315 | |||||
XDSQ | (1,120,688 | ) | 1,120,688 | |||||
XDQQ | (1,416,662 | ) | 1,416,662 | |||||
Distributions to Shareholders:
Distributions to shareholders are recorded on the ex-dividend date. The Funds intend to pay out dividends from their net investment income, if any, annually. Distributions of net realized capital gains, if any, will be declared and paid at least annually by the Funds. The Funds may periodically make reclassifications among certain of its capital accounts as a result of the recognition and characterization of certain income and capital gain distributions determined annually in accordance with federal tax regulations which may differ from U.S. GAAP. Distributions that exceed earnings and profits for tax purposes are reported as return of capital.
Investment Transactions and Investment Income:
Investment transactions are recorded on the trade date. The Trust determines the gain or loss realized from investment transactions on the basis of identified cost. Dividend income, if any, is recognized on the ex-dividend date. Interest income, including accretion of discounts and amortization of premiums is recognized on an accrual basis using the effective yield method.
3. | INVESTMENT ADVISOR AND OTHER AFFILIATES |
Innovator Capital Management, LLC (the “Adviser”) acts as investment adviser to the Funds pursuant to an investment advisory agreement between the Trust and the Adviser with respect to the Funds (“Advisory Agreement”) and, pursuant to the Advisory Agreement, is responsible for the day-to-day management of the Funds.
Pursuant to the Advisory Agreement, IJAN, IAPR, IJUL, and IOCT each pay monthly the Adviser a unitary fee calculated daily based on the average daily net assets of the Fund at the annual rate of 0.85%, EJAN, EAPR, EJUL and EOCT each pay monthly the Adviser a unitary fee calculated daily based on the average daily net assets of the Fund at the annual rate of 0.89%, BALT pays monthly the Adviser a unitary fee calculated daily based on the average daily net assets of the Fund at the annual rate of 0.69%. All other Innovator ETFs included in this report each, respectively, pay monthly the Adviser a unitary fee calculated daily based on the average daily net assets of each Fund at the annual rate of 0.79%. During the term of the Advisory Agreement, the Adviser pays all expenses of the Funds, including the cost of transfer agency, custody, fund administration, legal, audit, and other services and license fees, except for the fees paid under the Advisory Agreement, interest, taxes, brokerage commissions and other expenses connected with the execution of portfolio transactions, distribution and service fees payable pursuant to a Rule 12b-1 plan, if any, and extraordinary expenses.
Milliman Financial Risk Management LLC (the “Sub-Adviser”) acts as sub-adviser to the Funds pursuant to a sub-advisory agreement between the Adviser and the Sub-Adviser with respect to the Funds (“Sub-Advisory Agreement”) and, pursuant to the Sub-Advisory Agreement, is responsible for execution of the Sub-Adviser’s strategy for each of the Funds. The Sub-Adviser is responsible for the day-to-day management of the Funds’ portfolios. Pursuant to the Sub-Advisory Agreement between the Adviser and the Sub-Adviser, the Adviser pays the Sub-Adviser a fee, based on the Funds’ average daily net assets, for the services and facilities it provides payable on a monthly basis.
Certain trustees and officers of the Trust are affiliated with the Adviser. Trustee compensation is paid for by the Adviser.
4. | INVESTMENT TRANSACTIONS |
For the period ended April 30, 2022, there were no purchases or proceeds from long-term sales of investment securities.
For the period ended April 30, 2022, in-kind transactions associated with creations and redemptions were as follows:
In-Kind | In-Kind | |||||||
Creations | Redemptions | |||||||
IJAN | $ | - | $ | 56,174,015 | ||||
IAPR | - | 1,125,265 | ||||||
IJUL | 1,323,390 | 3,246,112 | ||||||
IOCT | 2,082,772 | 1,357,672 | ||||||
EJAN | - | 7,978,244 | ||||||
EAPR | 647,457 | 8,161,515 | ||||||
EJUL | - | 2,096,421 | ||||||
EOCT | 1,411,808 | - | ||||||
NJAN | - | 90,168,792 | ||||||
NAPR | - | 39,089,915 | ||||||
NJUL | 1,450,883 | 5,623,169 | ||||||
NOCT | 3,451,744 | 9,926,391 | ||||||
KJAN | - | 87,759,068 | ||||||
KAPR | 1,525,064 | 8,916,829 | ||||||
KJUL | 2,147,817 | 10,377,355 | ||||||
KOCT | 784,020 | - | ||||||
DSJA | - | 9,050,533 | ||||||
DSOC | - | 837,541 | ||||||
TSJA | - | 66,570,832 | ||||||
TSOC | - | 860,605 | ||||||
DBJA | - | 16,990,846 | ||||||
DBOC | - | - | ||||||
XDJA | - | - | ||||||
XDAP | - | 7,690,993 | ||||||
XDJL | - | - | ||||||
XDOC | - | - | ||||||
XTJA | - | 1,371,917 | ||||||
XTAP | - | 42,117,058 | ||||||
XTJL | - | - | ||||||
XTOC | 988,350 | - | ||||||
XBJA | - | 3,568,476 | ||||||
XBAP | 1,066,040 | 34,030,185 | ||||||
XBJL | - | - | ||||||
XBOC | - | - | ||||||
QTJA | - | 643,416 | ||||||
QTAP | 1,533,880 | 11,380,320 | ||||||
QTJL | 1,084,787 | - | ||||||
QTOC | 1,106,702 | - | ||||||
TBJL | - | 642,139 | ||||||
TFJL | - | 6,649,093 | ||||||
BALT | 7,727,258 | 44,139,752 | ||||||
XDSQ | - | 15,893,232 | ||||||
XDQQ | - | 20,783,193 | ||||||
5. | CREATION AND REDEMPTION TRANSACTIONS |
There were an unlimited number of shares of beneficial interest (without par value) authorized by the Trust. Individual shares of the Funds may only be purchased and sold at market prices on the Exchange through a broker-dealer. Such transactions may be subject to customary commission rates imposed by the broker-dealer, and market prices for the Funds’ shares may be at, above or below its NAV depending on the premium or discount at which the Funds’ shares trade.
The Funds issue and redeem shares on a continuous basis at NAV only in blocks of shares called “Creation Units.” Creation Units are issued and redeemed principally for cash. Once created, shares generally trade in the secondary market at market prices that change throughout the day in amounts less than a Creation Unit. Except when aggregated in Creation Units, shares are not redeemable securities of the Funds. Shares of the Funds may only be purchased or redeemed by certain financial institutions (“Authorized Participants”). An Authorized Participant is either (i) a broker-dealer or other participant in the clearing process through the Continuous Net Settlement System of the National Securities Clearing Corporation or (ii) a DTC participant and, in each case, must have executed a Participant Agreement with the Distributor. A transaction fee is applicable to each transaction regardless of the number of units purchased or sold in the transaction. Each Fund, subject to approval by the Board of Trustees, may adjust transaction fees from time to time based upon actual experience. Additional charges received by the Funds, if any, are disclosed as Transaction Fees on the Statements of Changes in Net Assets. Most retail investors do not qualify as Authorized Participants nor have the resources to buy and sell whole Creation Units. Therefore, they are unable to purchase or redeem the shares directly from the Funds. Rather, most retail investors may purchase shares in the secondary market with the assistance of a broker and are subject to customary brokerage commissions or fees.
6. | FEDERAL INCOME TAX INFORMATION |
At October 31, 2021, the cost of investments including options written and net unrealized appreciation/(depreciation) for federal income tax purposes were as follows:
Cost of Portfolio | Gross Unrealized Appreciation | Gross Unrealized Depreciation | Net Unrealized Appreciation/ (Depreciation) | |||||||||||||
IJAN | $ | 54,031,192 | $ | 7,779,078 | $ | (4,306,505 | ) | $ | 3,472,573 | |||||||
IAPR | 19,392,610 | 1,356,391 | (687,824 | ) | 668,567 | |||||||||||
IJUL | 55,271,680 | 1,699,356 | (790,409 | ) | 908,947 | |||||||||||
IOCT | 9,360,958 | 436,709 | (267,664 | ) | 169,045 | |||||||||||
EJAN | 106,539,080 | 7,438,630 | (7,557,987 | ) | (119,357 | ) | ||||||||||
EAPR | 34,340,234 | 1,250,045 | (1,534,300 | ) | (284,255 | ) | ||||||||||
EJUL | 42,222,970 | 1,704,955 | (2,660,246 | ) | (955,291 | ) | ||||||||||
EOCT | 5,014,302 | 124,021 | (89,000 | ) | 35,021 | |||||||||||
NJAN | 77,090,227 | 23,055,283 | (12,788,300 | ) | 10,266,983 | |||||||||||
NAPR | 38,301,323 | 8,868,747 | (5,888,562 | ) | 2,980,185 | |||||||||||
NJUL | 54,192,407 | 5,214,966 | (3,383,765 | ) | 1,831,201 | |||||||||||
NOCT | 75,924,663 | 6,925,197 | (4,874,213 | ) | 2,050,984 | |||||||||||
KJAN | 73,723,445 | 18,545,356 | (7,252,018 | ) | 11,293,338 | |||||||||||
KAPR | 81,756,710 | 6,808,419 | (3,634,496 | ) | 3,173,923 | |||||||||||
KJUL | 73,150,435 | 2,410,817 | (1,430,618 | ) | 980,199 | |||||||||||
KOCT | 35,724,959 | 2,345,997 | (1,420,039 | ) | 925,958 | |||||||||||
DJSA | 5,957,063 | 1,683,129 | (939,223 | ) | 743,906 | |||||||||||
DSOC | 8,557,949 | 992,660 | (567,207 | ) | 425,453 | |||||||||||
TSJA | 39,996,351 | 11,717,427 | (7,577,899 | ) | 4,139,528 | |||||||||||
TSOC | 16,043,727 | 2,113,687 | (1,444,085 | ) | 669,602 | |||||||||||
DBJA | 12,367,765 | 4,424,863 | (3,440,923 | ) | 983,940 | |||||||||||
DBOC | 21,005,346 | 2,854,362 | (2,282,820 | ) | 571,542 | |||||||||||
XDAP | 7,101,577 | 1,581,876 | (874,504 | ) | 707,372 | |||||||||||
XDJL | 3,212,822 | 365,118 | (172,343 | ) | 192,775 | |||||||||||
XDOC | 1,812,710 | 183,655 | (99,386 | ) | 84,269 | |||||||||||
XTAP | 7,935,340 | 1,887,571 | (1,360,747 | ) | 526,824 | |||||||||||
XTJL | 9,107,390 | 1,138,402 | (752,130 | ) | 386,272 | |||||||||||
XTOC | 2,423,906 | 179,723 | (122,181 | ) | 57,542 | |||||||||||
XBAP | 19,021,486 | 4,472,090 | (3,841,703 | ) | 630,387 | |||||||||||
XBJL | 10,296,568 | 1,207,965 | (900,789 | ) | 307,176 | |||||||||||
XBOC | 4,248,508 | 415,373 | (327,451 | ) | 87,922 | |||||||||||
QTAP | 19,107,430 | 2,805,860 | (3,447,861 | ) | (642,001 | ) | ||||||||||
QTJL | 7,821,738 | 1,071,941 | (638,895 | ) | 433,046 | |||||||||||
QTOC | 2,452,197 | 392,922 | (273,531 | ) | 119,391 | |||||||||||
TBJL | 4,902,353 | 45,936 | (53,368 | ) | (7,432 | ) | ||||||||||
TFJL | 9,353,886 | 254,022 | (111,668 | ) | 142,354 | |||||||||||
BALT | 28,912,799 | 1,737,121 | (1,589,525 | ) | 147,596 | |||||||||||
XDSQ | 12,860,087 | 1,475,708 | (905,882 | ) | 569,826 | |||||||||||
XDQQ | 14,884,034 | 1,865,864 | (1,054,901 | ) | 810,963 | |||||||||||
At October 31, 2021, the components of distributable earnings/(accumulated deficit) on a tax basis were as follows:
Accumulated Capital and Other Losses | Undistributed | Undistributed Net Ordinary Income | Unrealized Appreciation / (Depreciation) on Investments | Total Distributable Earnings /(Accumulated Deficit) | ||||||||||||||||
IJAN | $ | - | $ | - | $ | - | $ | 3,472,573 | $ | 3,472,573 | ||||||||||
IAPR | (251,751 | ) | - | - | 668,567 | 416,816 | ||||||||||||||
IJUL | (163,223 | ) | - | - | 908,947 | 745,724 | ||||||||||||||
IOCT | (4,901 | ) | - | - | 169,045 | 164,144 | ||||||||||||||
EJAN | (792,659 | ) | - | - | (119,357 | ) | (912,016 | ) | ||||||||||||
EAPR | (437,211 | ) | - | - | (284,255 | ) | (721,466 | ) | ||||||||||||
EJUL | (2,017,813 | ) | - | - | (955,291 | ) | (2,973,104 | ) | ||||||||||||
EOCT | (2,576 | ) | - | - | 35,021 | 32,445 | ||||||||||||||
NJAN | - | - | - | 10,266,983 | 10,266,983 | |||||||||||||||
NAPR | (238,069 | ) | - | - | 2,980,185 | 2,742,116 | ||||||||||||||
NJUL | - | - | - | 1,831,201 | 1,831,201 | |||||||||||||||
NOCT | - | - | - | 2,050,984 | 2,050,984 | |||||||||||||||
KJAN | - | - | - | 11,293,338 | 11,293,338 | |||||||||||||||
KAPR | (135,054 | ) | - | - | 3,173,923 | 3,038,869 | ||||||||||||||
KJUL | - | - | - | 980,199 | 980,199 | |||||||||||||||
KOCT | - | - | - | 925,958 | 925,958 | |||||||||||||||
DSJA | (31,076 | ) | - | - | 743,906 | 712,830 | ||||||||||||||
DSOC | (5,595,392 | ) | - | - | 425,453 | (5,169,939 | ) | |||||||||||||
TSJA | (205,245 | ) | - | - | 4,139,528 | 3,934,283 | ||||||||||||||
TSOC | (8,127,919 | ) | - | - | 669,602 | (7,458,317 | ) | |||||||||||||
DBJA | (267,707 | ) | - | - | 983,940 | 716,233 | ||||||||||||||
DBOC | (14,819,066 | ) | - | - | 571,542 | (14,247,524 | ) | |||||||||||||
XDAP | (32,349 | ) | - | - | 707,372 | 675,023 | ||||||||||||||
XDJL | (8,145 | ) | - | - | 192,775 | 184,630 | ||||||||||||||
XDOC | (1,098 | ) | - | - | 84,269 | 83,171 | ||||||||||||||
XTAP | (25,914 | ) | - | - | 526,824 | 500,910 | ||||||||||||||
XTJL | (18,095 | ) | - | - | 386,272 | 368,177 | ||||||||||||||
XTOC | (793 | ) | - | - | 57,542 | 56,749 | ||||||||||||||
XBAP | (89,083 | ) | - | - | 630,387 | 541,304 | ||||||||||||||
XBJL | (25,133 | ) | - | - | 307,176 | 282,043 | ||||||||||||||
XBOC | (1,939 | ) | - | - | 87,922 | 85,983 | ||||||||||||||
QTAP | (84,706 | ) | - | - | (642,001 | ) | (726,707 | ) | ||||||||||||
QTJL | (15,166 | ) | - | - | 433,046 | 417,880 | ||||||||||||||
QTOC | (1,155 | ) | - | - | 119,391 | 118,236 | ||||||||||||||
TBJL | (276,567 | ) | - | - | (7,432 | ) | (283,999 | ) | ||||||||||||
TFJL | (1,068,357 | ) | - | - | 142,354 | (926,003 | ) | |||||||||||||
BALT | (223,088 | ) | - | �� | - | 147,596 | (75,492 | ) | ||||||||||||
XDSQ | (626,194 | ) | - | - | 569,826 | (56,368 | ) | |||||||||||||
XDQQ | (309,135 | ) | - | - | 810,963 | 501,828 | ||||||||||||||
Certain qualified late year ordinary losses incurred after December 31, and within the current taxable year, are deemed to arise on the first business day of the next taxable year. At October 31, 2021, the Funds deferred the following qualified late year ordinary losses:
Late Year Ordinary Losses | ||||
IJAN | $ | - | ||
IAPR | 107,854 | |||
IJUL | 163,223 | |||
IOCT | 4,901 | |||
EJAN | 792,659 | |||
EAPR | 135,817 | |||
EJUL | 197,448 | |||
EOCT | 2,576 | |||
NJAN | - | |||
NAPR | 238,069 | |||
NJUL | - | |||
NOCT | - | |||
KJAN | - | |||
KAPR | 135,054 | |||
KJUL | - | |||
KOCT | - | |||
DSJA | 31,076 | |||
DSOC | 126,840 | |||
TSJA | 205,245 | |||
TSOC | 134,734 | |||
DBJA | 85,113 | |||
DBOC | 246,244 | |||
XDAP | 32,349 | |||
XDJL | 8,145 | |||
XDOC | 1,098 | |||
XTAP | 25,914 | |||
XTJL | 18,095 | |||
XTOC | 793 | |||
XBAP | 89,083 | |||
XBJL | 25,133 | |||
XBOC | 1,939 | |||
QTAP | 84,706 | |||
QTJL | 15,166 | |||
QTOC | 1,155 | |||
TBJL | 23,607 | |||
TFJL | 90,592 | |||
BALT | 24,714 | |||
XDSQ | 49,539 | |||
XDQQ | 57,511 | |||
At October 31, 2021, for federal income tax purposes, the Funds has capital loss carryforwards available to offset future capital gains for an unlimited period as indicated below:
Indefinite Short-Term | Indefinite Long-Term | |||||||
IJAN | $ | - | $ | - | ||||
IAPR | 143,897 | - | ||||||
IJUL | - | - | ||||||
IOCT | - | - | ||||||
EJAN | - | - | ||||||
EAPR | 301,394 | - | ||||||
EJUL | 742,828 | 1,077,537 | ||||||
EOCT | - | - | ||||||
NJAN | - | - | ||||||
NAPR | - | - | ||||||
NJUL | - | - | ||||||
NOCT | - | - | ||||||
KJAN | - | - | ||||||
KAPR | - | - | ||||||
KJUL | - | - | ||||||
KOCT | - | - | ||||||
DSJA | - | - | ||||||
DSOC | 5,468,552 | - | ||||||
TSJA | - | - | ||||||
TSOC | 7,993,185 | - | ||||||
DBJA | 182,594 | - | ||||||
DBOC | 14,572,822 | - | ||||||
XDAP | - | - | ||||||
XDJL | - | - | ||||||
XDOC | - | - | ||||||
XTAP | - | - | ||||||
XTJL | - | - | ||||||
XTOC | - | - | ||||||
XBAP | - | - | ||||||
XBJL | - | - | ||||||
XBOC | - | - | ||||||
QTAP | - | - | ||||||
QTJL | - | - | ||||||
QTOC | - | - | ||||||
TBJL | 252,960 | - | ||||||
TFJL | 977,765 | - | ||||||
BALT | 198,374 | - | ||||||
XDSQ | 576,655 | - | ||||||
XDQQ | 251,624 | - | ||||||
To the extent that these loss carryforwards are utilized, capital gains so offset will not be distributed to shareholders. During the current tax year ended October 31, 2021, EJAN, IJAN, and KJAN utilized $407,883, $546,112, and $874,164 of capital loss carryforwards available, respectively. EJUL, IJUL, and KOCT utilized $1,393,162, $2,954,982, and $255,985 of capital loss carryforwards, available, respectively during the current tax year ended October 31, 2021.
The tax character of the distributions paid by the Funds during the fiscal period ended October 31, 2020 were as follows:
Distributions paid from: | ||||||||||||
Net Ordinary Income | Net Long-Term Capital Gains | Total Distributions Paid | ||||||||||
IJAN | $ | - | $ | - | $ | - | ||||||
IJUL | 424,324 | 232,892 | 657,216 | |||||||||
EJAN | - | - | - | |||||||||
EJUL | 174,583 | 127,619 | 302,202 | |||||||||
NJAN | - | - | - | |||||||||
NAPR | - | - | - | |||||||||
NJUL | - | - | - | |||||||||
NOCT | 217,656 | 93,861 | 311,517 | |||||||||
KJAN | - | - | - | |||||||||
KAPR | - | - | - | |||||||||
KJUL | - | - | - | |||||||||
KOCT | 163,716 | 77,172 | 240,888 | |||||||||
TFJL | - | - | - | |||||||||
TBJL | - | - | - | |||||||||
DSOC | - | - | - | |||||||||
TSOC | - | - | - | |||||||||
DBOC | - | - | - | |||||||||
The Funds did not pay any distributions during the fiscal year or period ended October 31, 2021.
7. | NEW ACCOUNTING PRONOUNCEMENTS |
In August 2021, FASB issued Accounting Standards Update 2021-06, which includes updates to Financial Services— Investment Companies (Topic 946): Amendments to SEC Paragraphs Pursuant to SEC Final Rule Releases No. 33-10786, Amendments to Financial Disclosures about Acquired and Disposed Businesses (“ASU 2021-06”). Among other revisions, the ASU 2021-06 added to the Accounting Standard Codification the text of SEC Regulation S-X Rule 6-11, Financial Statements of Funds Acquired or to Be Acquired, which governs the financial reporting for fund acquisitions by investment companies and business development companies. The amendments are effective as of the beginning of the registrant’s fiscal year beginning after December 31, 2020 (the “mandatory compliance date”). Acquisitions and dispositions that are probable or consummated after the mandatory compliance date must be evaluated for significance using the final amendments. Management has evaluated ASU 2021-06 and has adopted the relevant provisions of the disclosure framework.
8. | COVID-19 |
The recent global outbreak of COVID-19 has disrupted economic markets and the prolonged economic impact is uncertain. The operational and financial performance of the issuers of securities in which the Funds invest depend on future developments, including the duration and spread of the outbreak, and such uncertainty may in turn impact the value of the Funds’ investments.
9. | SUBSEQUENT EVENT |
Management has evaluated the impact of all subsequent events of the Funds through the date of the financial statements were issued, and has determined that there were no subsequent events requiring recognition or disclosure in the financial statements.
INNOVATOR ETFs TRUST
Trustees and Officers (Unaudited)
Name, Address and Year of Birth | Position with the Trust | Length of Time Served* | Principal Occupation(s) During Past 5 Years | Number of Portfolios in Fund Complex(a) Overseen by Trustee or Officer | Other Directorships Held by Trustee or Officer in the Past Five Years |
Independent Trustees | |||||
Mark Berg 109 N. Hale Street, Wheaton, IL 60187 Year of Birth: 1971 | Trustee | Since 2017 | Founding Principal (2001-present), Chief Executive Officer (2019-present), President (2001-2019), Timothy Financial Counsel, Inc. | 87 | Tortazo, LLC (2018-present) |
Joe Stowell 109 N. Hale Street, Wheaton, IL 60187 Year of Birth: 1968 | Trustee | Since 2017 | Chief Operating Officer, Woodmen Valley Chapel (2015-present). | 87 | Board of Advisors, Westmont College |
Brian J. Wildman 109 N. Hale Street, Wheaton, IL 60187 Year of Birth: 1963 | Trustee | Since 2017 | President, Timothy Financial Counsel, Inc. (2019-present); Executive Vice President, Consumer Banking (2016-2019), Chief Risk Officer (2013-2016), MB Financial Bank. | 87 | Missionary Furlough Homes, Inc. (since 2008); MB Financial Bank (2003-2019). |
INNOVATOR ETFs TRUST
Trustees and Officers (Unaudited) (Continued)
Interested Trustee & Officer | |||||
H. Bruce Bond (b) 109 N. Hale Street, Wheaton, IL 60187 Year of Birth: 1963 | Interested Trustee, President and Principal Executive Officer | Since 2017 | Chief Executive Officer, Innovator Capital Management, LLC (2017-present). | 87 | None |
Officers | |||||
John W. Southard 109 N. Hale Street, Wheaton, IL 60187 Year of Birth: 1969 | Vice President, Treasurer and Principal Financial Accounting Officer | Since 2017 | Chief Investment Officer, Innovator Capital Management, LLC (2017-present); Director and Co-Founder, T2 Capital Management, LLC (2010-present). | 87 | Independent Trustee, ETF Managers Group, LLC (2012-2018) |
Kevin Gustafson 109 N. Hale Street Wheaton, IL 60187 Year of Birth: 1965 | Chief Compliance Officer and Anti-Money Laundering Officer | Since 2020 | Chief Compliance Officer, Innovator Capital Management LLC (2019 - present); General Counsel, Innovator Capital Management LLC (2019 - present); Chief Compliance Officer, General Counsel and Chief Risk Officer, Americas, Eastspring Investments, Inc. (2012 - 2019). | 87 | None |
* | The Funds’ Trustees serve for an indefinite term until their resignation, death or removal. The Funds’ officers are elected annually by the Board and serve at the Board’s pleasure. |
(a) | The Fund Complex includes the Funds, each series of Innovator ETFs Trust. |
(b) | H. Bruce Bond is deemed to be an interested person of the Trust (as defined in the 1940 Act) because of his affiliation with the Adviser. |
The Statement of Additional Information includes additional information about the Trustees and is available upon request, without charge, by calling 1-877-386-3890.
INNOVATOR ETFs TRUST
Board Considerations Regarding Approval of Investment Management Agreement (Unaudited)
BOARD CONSIDERATIONS REGARDING APPROVAL OF INVESTMENT MANAGEMENT AGREEMENT AND INVESTMENT SUB-ADVISORY AGREEMENT FOR THE FOLLOWING INNOVATOR FUNDS:
Innovator U.S. Equity Accelerated ETF – January
Innovator U.S. Equity Accelerated Plus ETF – January
Innovator U.S. Equity Accelerated 9 Buffer ETF – January
At a quarterly Board meeting held on December 16, 2020, the Trust’s Board considered approval of the Advisory Agreement with Innovator Capital Management, LLC (the “Adviser”), on behalf of the Innovator U.S. Equity Accelerated ETF - January, Innovator U.S. Equity Accelerated Plus ETF – January, and Innovator U.S. Equity Accelerated 9 Buffer ETF – January (the “Funds”), and the Sub-Advisory Agreement among the Trust, on behalf of the Funds, the Adviser and Milliman Financial Risk Management LLC (“Milliman” or the “Sub- Adviser”), for an initial two-year term. The Board determined that the agreements were in the best interests of the Funds in light of the extent and quality of the services expected to be provided and such other matters as the Board considered to be relevant in the exercise of its reasonable business judgment.
To reach this determination, the Board considered its duties under the Investment Company Act of 1940, as amended (the “1940 Act”), as well as under the general principles of state law in reviewing and approving advisory contracts; the requirements of the 1940 Act in such matters; the fiduciary duty of investment advisers with respect to advisory agreements and compensation; the standards used by courts in determining whether investment company boards have fulfilled their duties; and the factors to be considered by the Board in voting on such agreements. To assist the Board in its evaluation of the agreements, the Independent Trustees received a separate report from each of the Adviser and the Sub-Adviser in advance of the Meeting responding to a request for information provided on behalf of the Independent Trustees that, among other things, outlined the services to be provided by the Adviser and the Sub-Adviser to the Funds (including the relevant personnel responsible for these services and their experience); the proposed unitary fee rate payable by each Fund as compared to fees charged to peer groups of the Funds and as compared to fees charged to other clients of the Adviser and the Sub-Adviser, including other ETFs managed by the Adviser and the Sub- Adviser; the estimated expenses of the Funds as compared to expense ratios of the funds in the respective Fund’s peer group; the nature of the expenses to be incurred in providing services to the Funds and the potential for economies of scale, if any; financial data on the Adviser and the Sub- Adviser; any fall-out benefits accruing to the Adviser or the Sub-Adviser; and information on the Adviser’s and the Sub-Adviser’s compliance programs. The Independent Trustees also met separately with their Independent Counsel to discuss the information provided by the Adviser and the Sub-Adviser. The Board applied its business judgment to determine whether the arrangements between the Trust and the Adviser and among the Trust, the Adviser and the Sub-Adviser are reasonable business arrangements from each Fund’s perspective as well as from the perspective of each Fund’s shareholders.
INNOVATOR ETFs TRUST
Board Considerations Regarding Approval of Investment Management Agreement (Unaudited) (Continued)
In evaluating whether to approve the agreements, the Board applied its business judgment and considered the nature, extent and quality of the services to be provided by the Adviser and Milliman pursuant to the agreements. With respect to the investment management agreement, the Board considered that the Adviser will be responsible for the overall management and administration of the Funds and reviewed all of the services to be provided by the Adviser to the Funds, including oversight of Milliman, as well as the background and experience of the persons responsible for such services. The Board noted that the Adviser will oversee Milliman’s day-to-day management of each of the Fund’s investments, including portfolio risk monitoring and performance review. In reviewing the services to be provided, the Board noted the compliance program that had been developed by the Adviser included an adequate program for monitoring the Adviser’s, Milliman’s and each Fund’s compliance with the 1940 Act, as well as each Fund’s compliance with its investment objective and policies. With respect to the sub-advisory agreement, the Board reviewed the materials provided by Milliman and noted the background and experience of Milliman’s portfolio management team and Milliman’s investment style. In light of the information presented and the considerations made, the Board concluded that the nature, extent and quality of the services to be provided to the Funds by the Adviser and Milliman under the agreements were expected to be satisfactory.
Since the Funds had yet to commence investment operations, the Board could not consider the historical investment performance of the Funds.
The Board considered the proposed unitary fee rate payable by each Fund under the investment management agreement for the services to be provided. The Board noted that, under the unitary fee arrangement, each Fund would pay the Adviser a unitary fee equal to an annual rate of 0.79% of its average daily net assets. The Board considered that, from the unitary fee for each of the Funds, the Adviser would pay Milliman an annual sub-advisory fee equal to 0.12% on each Fund’s assets under management.
The Board noted that the Adviser would be responsible for the Funds’ expenses, including the cost of transfer agency, custody, fund administration, legal, audit and other services and license fees (if any), but excluding the fee payment under the investment management agreement, interest, taxes, brokerage commissions and other expenses connected with the execution of portfolio transactions, and extraordinary expenses. The Board received and reviewed information for the Funds showing the advisory fee rates and expense ratios of the funds comprising of each Fund’s peer group, as well as advisory fee rates charged by the Adviser and Milliman to other funds (including ETFs) and non-fund clients, as applicable. In light of the information considered and the nature, extent and quality of the services expected to be provided to the Funds under the agreements, the Board determined that the proposed unitary fee for each of the Funds, including the fee rate to be paid by the Adviser to Milliman from the unitary fee, was fair.
INNOVATOR ETFs TRUST
Board Considerations Regarding Approval of Investment Management Agreement (Unaudited) (Continued)
The Board noted that the proposed unitary fee for each of the Funds were structured to pass the benefits of any economies of scale on to shareholders as the respective Fund’s assets grow. The Board noted that any reduction in fixed costs associated with the management of the respective Fund would benefit the Adviser and Milliman, but that the unitary fee structure provides a level of certainty in expenses for each of the Funds. The Board noted that the Adviser is continuing to invest in personnel and infrastructure for the Innovator fund complex.
Because the Funds have not yet commenced operations and the actual asset base of the Funds have not yet been determined, the Board noted that there was no historical profitability information with respect to the Funds to be reviewed. The Board noted that it would review profitability information in connection with subsequent renewals of the agreements.
The Board considered potential “fall-out” or ancillary benefits anticipated to be received by the Adviser and Milliman. The Board concluded that the character and amount of potential fall-out benefits to the Adviser and Milliman were consistent with the types of benefits generally derived by investment managers and sub-advisers to funds.
Based on all of the information considered and the conclusions reached, the Board, including the Independent Trustees, unanimously determined that the terms of the agreements are fair and that the approval of the agreements is in the best interests of the Funds. No single factor was determinative in the Board’s analysis.
INNOVATOR ETFs TRUST
Board Considerations Regarding Approval of Investment Management Agreement (Unaudited) (Continued)
BOARD CONSIDERATIONS REGARDING APPROVAL OF INVESTMENT MANAGEMENT AGREEMENT AND INVESTMENT SUB-ADVISORY AGREEMENT FOR THE FOLLOWING INNOVATOR FUNDS:
Innovator Growth Accelerated Plus ETF - January
At a quarterly Board meeting held on March 18, 2021, the Trust’s Board considered approval of the Advisory Agreement with Innovator Capital Management, LLC (the “Adviser”), on behalf of the Innovator Growth Accelerated Plus ETF - January (the “Fund”), and the Sub-Advisory Agreement among the Trust, on behalf of the Fund, the Adviser and Milliman Financial Risk Management LLC (“Milliman” or the “Sub-Adviser”), for an initial two-year term. The Board determined that the agreements were in the best interests of the Fund in light of the extent and quality of the services expected to be provided and such other matters as the Board considered to be relevant in the exercise of its reasonable business judgment.
To reach this determination, the Board considered its duties under the Investment Company Act of 1940, as amended (the “1940 Act”), as well as under the general principles of state law in reviewing and approving advisory contracts; the requirements of the 1940 Act in such matters; the fiduciary duty of investment advisers with respect to advisory agreements and compensation; the standards used by courts in determining whether investment company boards have fulfilled their duties; and the factors to be considered by the Board in voting on such agreements. To assist the Board in its evaluation of the agreements, the Independent Trustees received a separate report from each of the Adviser and the Sub-Adviser in advance of the Meeting responding to a request for information provided on behalf of the Independent Trustees that, among other things, outlined the services to be provided by the Adviser and the Sub-Adviser to the Fund (including the relevant personnel responsible for these services and their experience); the proposed unitary fee rate payable by the Fund as compared to fees charged to peer groups of the Fund and as compared to fees charged to other clients of the Adviser and the Sub-Adviser, including other ETFs managed by the Adviser and the Sub- Adviser; the estimated expenses of the Fund as compared to expense ratios of the funds in the respective Fund’s peer group; the nature of the expenses to be incurred in providing services to the Fund and the potential for economies of scale, if any; financial data on the Adviser and the Sub- Adviser; any fall-out benefits accruing to the Adviser or the Sub-Adviser; and information on the Adviser’s and the Sub-Adviser’s compliance programs. The Independent Trustees also met separately with their Independent Counsel to discuss the information provided by the Adviser and the Sub-Adviser. The Board applied its business judgment to determine whether the arrangements between the Trust and the Adviser and among the Trust, the Adviser and the Sub-Adviser are reasonable business arrangements from the Fund’s perspective as well as from the perspective of the Fund’s shareholders.
INNOVATOR ETFs TRUST
Board Considerations Regarding Approval of Investment Management Agreement (Unaudited) (Continued)
In evaluating whether to approve the agreements, the Board applied its business judgment and considered the nature, extent and quality of the services to be provided by the Adviser and Milliman pursuant to the agreements. With respect to the investment management agreement, the Board considered that the Adviser will be responsible for the overall management and administration of the Fund and reviewed all of the services to be provided by the Adviser to the Fund, including oversight of Milliman, as well as the background and experience of the persons responsible for such services. The Board noted that the Adviser will oversee Milliman’s day-to-day management of the Fund’s investments, including portfolio risk monitoring and performance review. In reviewing the services to be provided, the Board noted the compliance program that had been developed by the Adviser included an adequate program for monitoring the Adviser’s, Milliman’s and the Fund’s compliance with the 1940 Act, as well as the Fund’s compliance with its investment objective and policies. With respect to the sub-advisory agreement, the Board reviewed the materials provided by Milliman and noted the background and experience of Milliman’s portfolio management team and Milliman’s investment style. In light of the information presented and the considerations made, the Board concluded that the nature, extent and quality of the services to be provided to the Fund by the Adviser and Milliman under the agreements were expected to be satisfactory.
Since the Fund had yet to commence investment operations, the Board could not consider the historical investment performance of the Fund.
The Board considered the proposed unitary fee rate payable by the Fund under the investment management agreement for the services to be provided. The Board noted that, under the unitary fee arrangement, the Fund would pay the Adviser a unitary fee equal to an annual rate of 0.79% of its average daily net assets. The Board considered that, from the unitary fee for the Fund, the Adviser would pay Milliman an annual sub-advisory fee equal to 0.12% on the Fund’s assets under management.
The Board noted that the Adviser would be responsible for the Fund’s expenses, including the cost of transfer agency, custody, fund administration, legal, audit and other services and license fees (if any), but excluding the fee payment under the investment management agreement, interest, taxes, brokerage commissions and other expenses connected with the execution of portfolio transactions, and extraordinary expenses. The Board received and reviewed information for the Fund showing the advisory fee rates and expense ratios of the funds comprising of the Fund’s peer group, as well as advisory fee rates charged by the Adviser and Milliman to other funds (including ETFs) and non-fund clients, as applicable.
INNOVATOR ETFs TRUST
Board Considerations Regarding Approval of Investment Management Agreement (Unaudited) (Continued)
In light of the information considered and the nature, extent and quality of the services expected to be provided to the Fund under the agreements, the Board determined that the proposed unitary fee for the Fund, including the fee rate to be paid by the Adviser to Milliman from the unitary fee, was fair.
The Board noted that the proposed unitary fee for the Fund was structured to pass the benefits of any economies of scale on to shareholders as the Fund’s assets grow. The Board noted that any reduction in fixed costs associated with the management of the Fund would benefit the Adviser and Milliman, but that the unitary fee structure provides a level of certainty in expenses for the Fund. The Board noted that the Adviser is continuing to invest in personnel and infrastructure for the Innovator fund complex.
Because the Fund has not yet commenced operations and the actual asset base of the Fund has not yet been determined, the Board noted that there was no historical profitability information with respect to the Fund to be reviewed. The Board noted that it would review profitability information in connection with subsequent renewals of the agreements.
The Board considered potential “fall-out” or ancillary benefits anticipated to be received by the Adviser and Milliman. The Board concluded that the character and amount of potential fall-out benefits to the Adviser and Milliman were consistent with the types of benefits generally derived by investment managers and sub-advisers to funds.
Based on all of the information considered and the conclusions reached, the Board, including the Independent Trustees, unanimously determined that the terms of the agreements are fair and that the approval of the agreements is in the best interests of the Fund. No single factor was determinative in the Board’s analysis.
INNOVATOR ETFs TRUST
Additional Information (Unaudited)
1. | INFORMATION ABOUT PROSPECTUS |
This report has been prepared for shareholders and may be distributed to others only if preceded or accompanied by a current prospectus. Investors should consider the investment objective and policies, risk considerations, charges and ongoing expenses of an investment carefully before investing. The prospectus contains this and other information relevant to an investment in the respective Fund. Please read the Prospectus carefully before investing. A copy of the Prospectus may be obtained without charge by writing to the Trust’s Distributor, or by calling toll free at 1-800-208-5212 or visiting www.innovatoretfs.com.
2. | PROXY VOTING POLICIES AND PROCEDURES |
The Trust’s Proxy Voting Policies and Procedures are available without charge, upon request, by calling 1-877-386-3890 and on the SEC’s website at www.sec.gov. Information relating to how each Fund voted proxies relating to portfolio securities held during each year ended June 30 is also available on the SEC’S website at www.sec.gov.
3. | INFORMATION ABOUT PORTFOLIO SECURITIES |
Each Funds’ complete schedule of portfolio holdings for the first and third quarters is filed with the SEC on Form N-Q or Part F of Form N-PORT (beginning with filings after March 31, 2020). The Trust’s Form N-Q or Part F of Form N-PORT is available without charge, upon request, by calling 1-877-386-3890, or on the SEC’s website at www.sec.gov. The Trust’s Form N-Q or Part F of Form N-PORT may be reviewed and copied at the SEC’s Public Reference Room in Washington, DC. Information on the operation of the Public Reference Room may be obtained by calling 1-800-SEC-0330.
4. | HOUSEHOLD DELIVERY OF SHAREHOLDER DOCUMENTS |
In order to reduce expenses, the Trust delivers one copy of an annual/semi-annual report, prospectus and/or proxy statement on behalf of two or more shareholders at a shared address (householding). If you do not wish to participate in householding, please indicate this preference on your new account application (if you are opening a new account) or call 1-877-FUND890 (877-386-3890) to change the status of your existing account. You may change your status at any time.
5. | ELECTRONIC DELIVERY OF SHAREHOLDER DOCUMENTS |
You may choose to receive a Fund’s prospectus and annual and semi-annual reports electronically. To sign up for electronic delivery, visit www.icsdelivery.com and select the first letter of your brokerage firm’s name. Then, select your brokerage institution from the list that follows, fill out the appropriate information and provide an e-mail address where you would like your information sent. If your brokerage firm is not listed, electronic delivery may not be available. Please contact your brokerage firm or financial adviser.
INNOVATOR ETFs TRUST
Additional Information (Unaudited) (Continued)
6. | TAX NOTICE |
For the fiscal year ended October 31, 2021, certain dividends paid by the Funds may be subject to a maximum tax rate of 23.8%, as provided for by the Jobs and Growth Tax Relief Reconciliation Act of 2003.
For the taxable year ended October 31, 2021, the percentage of ordinary income dividends paid by the Funds that qualify for the dividends received deduction available to corporations was 0.00%.
For the taxable year ended October 31, 2021, the percentage of ordinary income distributions that were designated as short-term capital gain distributions under Internal Revenue Section 871(k)2(c) was 0.00%.
INVESTMENT ADVISOR
Innovator Capital Management, LLC
109 North Hale Street
Wheaton, IL 60187
INVESTMENT SUB-ADVISOR
Milliman Financial Risk Management LLC
71 S. Wacker Drive, 31st Floor
Chicago, IL 60606
ADMINISTRATOR, FUND ACCOUNTANT & TRANSFER AGENT
U.S. Bancorp Fund Services, LLC
615 East Michigan Street
Milwaukee, WI 53202
DISTRIBUTOR
Foreside Fund Services, LLC
Three Canal Plaza
Portland, ME 04101
CUSTODIAN
U.S. Bank, N.A.
1555 North RiverCenter Drive, Suite 302
Milwaukee, WI 53212
LEGAL COUNSEL
Chapman and Cutler LLP
320 South Canal Street, 27th Floor
Chicago, IL 60606
INDEPENDENT REGISTERED PUBLIC ACCOUNTING FIRM
Cohen & Company, Ltd.
1350 Euclid Ave., Suite 800
Cleveland, OH 44115
TABLE OF CONTENTS
Letter to Shareholders | 3 |
Fund Performance | 8 |
Expense Example | 24 |
Schedules of Investments | 26 |
Statements of Assets and Liabilities | 48 |
Statements of Operations | 51 |
Statements of Changes in Net Assets | 54 |
Financial Highlights | 60 |
Notes to Financial Statements | 66 |
Trustees and Officers | 84 |
Board Considerations Regarding Approval of Investment Management Agreement | 86 |
Additional Information | 92 |
INNOVATOR ETFs TRUST
Letter to Shareholders (Unaudited)
Dear Valued Shareholders,
Thank you for your interest in Innovator ETFs.
During the six months ended April 30, 2022, the different methodologies of the Innovator IBD 50 (FFTY) and IBD Breakout Opportunity (BOUT) ETFs resulted in meaningfully different results, despite both falling into the mid-cap growth category. As with most of the equity market, mid cap stocks were down during the period and FFTY and BOUT were no exception. FFTY’s overweight to technology and underweight of energy were drivers of its underperformance of the Morningstar US Mid Cap Broad Growth Index. Meanwhile, BOUT benefited from its overweight to the energy and materials sectors, helping it to outperform the Index.
The Innovator Loup Frontier Tech ETF (LOUP) remained consistent in its effort to invest in companies that influence the future of technology. After many months of increases, the prices of technology stocks began to come under pressure as interest rates began to rise at the end of 2021. During the period from October 31, 2021 through April 30, 2022, the yield on the 10-year Treasury bond nearly doubled, climbing from 1.56% to 2.94%1 and putting upward pressure on the financing costs of characteristically debt-reliant technology companies. The frontier of new technology inherently involves uncertainty and volatility, but it’s also often the place where the most innovative opportunities are uncovered.
The Innovator S&P Investment Grade Preferred ETF (EPRF) remains the only preferred ETF designed to hold solely investment grade preferred stock. Its monthly distribution, qualified dividend income (QDI2) profile, weighting methodology, and pursuit of exclusively investment-grade exposure all help to distinguish it from other income-focused ETFs. During the six months ended April 30, 2022, as rising interest rates put downward pressure on the prices of preferred stock, EPRF continued to make monthly distributions, notching its 69th consecutive monthly dividend in April 2022.
The Innovator Laddered Allocation Buffer ETF (BUFB) and Laddered Allocation Power Buffer ETF (BUFF) are part of Innovator’s suite of Managed Outcome ETFs™. They are designed to offer a tax-efficient3, laddered approach to owning the market with buffers and market upside, to a cap. Each fund holds a laddered portfolio of Buffer ETFs™ such that every calendar month, one Buffer ETF is concluding its one-year outcome period and resetting into another one-year outcome period. This process allows investors to participate in a diverse set of buffered outcomes, smoothing out their overall investment experience.
INNOVATOR ETFs TRUST
Letter to Shareholders (Unaudited) (Continued)
The Innovator Buffer Step-Up Strategy ETF and Power Buffer Step-Up Strategy ETF are also part of Innovator’s suite of Managed Outcome ETFs. These managed buffer ETFs provide investors an alternative to managing and evaluating a series of buffer ETFs on their own. As single-ticker strategies, these ETFs are opportunistic, seeking to provide the upside of the SPDR S&P 500 ETF Trust (SPY) while mitigating downside losses with built-in buffers, through the active use of FLEX Options. These funds launched on March 8, 2022 and we are excited to be able to provide investors additional ways to access the features and benefits of defined outcome investing.

Bruce Bond
Chief Executive Officer
The views in this report were those of the Fund’s CEO as of April 30, 2022 and may not reflect his views on the date that this report is first published or anytime thereafter. These views are intended to assist shareholders in understanding their investments and do not constitute investment advice.
INNOVATOR ETFs TRUST
Letter to Shareholders (Unaudited) (Continued)
Investing involves risks. Principal loss is possible.
1. Source: Bloomberg LP, from 10/31/21 to 4/30/22
2. QDI, or qualified dividend income, is taxed at the same rate as are capital gains, while ordinary dividend income is taxed at standard federal income tax rates.
3. ETFs use creation units, which allow for the purchase and sale of assets in the fund collectively. Consequently, ETFs usually generate fewer capital gain distributions overall, which can make them somewhat more tax-efficient than mutual funds.
EPRF Risks
The fund invests in preferred securities which may be subject to many of the risks associated with debt securities, including interest rate risk. The fund invests in equity securities which may be subject to volatile price fluctuations. Because the fund is non-diversified and can invest a greater portion of its assets in securities of individual issuers than a diversified fund, changes in the market value of a single investment could cause greater fluctuations in share price.
BOUT and FFTY Risks
There is no guarantee the funds' strategies will be successful. Additionally, the Funds may invest in securities that have additional risks. Foreign companies can be more volatile, less liquid, and subject to the risk of currency fluctuations. This risk is greater for emerging markets. Small- and mid-cap companies can have limited liquidity and greater volatility than large-cap companies.
LOUP Risks
The value of stocks of information technology companies are particularly vulnerable to rapid changes in technology product cycles, rapid product obsolescence, government regulation, and are subject intense competition. The prices of information technology companies and companies that rely heavily on technology, especially those of smaller, less-seasoned companies, tend to be more volatile and less liquid than the overall market. Information technology companies are heavily dependent on patent and intellectual property rights, the loss or impairment of which may adversely affect profitability.
BUFB and BUFF Risks
The funds may have characteristics unlike many other traditional investment products and may not be suitable for all investors. For more information regarding whether an investment in the Fund is right for you, please see “Investor Suitability” in the prospectus.
INNOVATOR ETFs TRUST
Letter to Shareholders (Unaudited) (Continued)
The Laddered Allocation Buffer ETF™ (BUFB), in accordance with the MerQube US Large Cap Equity Buffer Laddered Index, will be continuously invested in a laddered portfolio of the twelve Underlying ETFs.
The Laddered Allocation Power Buffer ETF™ (BUFF), in accordance with the Refinitiv Laddered Power Buffer Strategy Index, will be continuously invested in a laddered portfolio of the twelve Underlying ETFs.
There is no guarantee that the defined outcome strategy of an Underlying ETF in any given Outcome Period will be achieved.
The funds only seek to provide their investment objective, which is not guaranteed, over the course of an entire outcome period. Investors who purchase shares after or sell shares before the end of an outcome period will experience very different outcomes than the funds seek to provide.
The Funds have characteristics unlike many other traditional investment products and may not be suitable for all investors. For more information regarding whether an investment in the Fund is right for you, please see Investor Suitability" in the prospectus.
The Funds are designed to provide point-to-point exposure to the price return of a reference asset via a basket of Flex Options. As a result, the ETFs are not expected to move directly in line with the reference asset during the interim period. Additionally, FLEX Options may be less liquid than standard options. In a less liquid market for the FLEX Options, the Fund may have difficulty closing out certain FLEX Options positions at desired times and prices.
Fund shareholders are subject to an upside return cap (Cap) that represents the maximum percentage return an investor can achieve from an investment in the funds' for the Outcome Period, before fees and expenses. If the Outcome Period has begun and the Fund has increased in value to a level near to the Cap, an investor purchasing at that price has little or no ability to achieve gains but remains vulnerable to downside risks. Additionally, the Cap may rise or fall from one Outcome Period to the next. The Cap, and the Fund's position relative to it, should be considered before investing in the Fund. The Funds' website, www.innovatoretfs.com, provides important Fund information as well information relating to the potential outcomes of an investment in a Fund on a daily basis.
INNOVATOR ETFs TRUST
Letter to Shareholders (Unaudited) (Continued)
Buffer ETFs: The Funds only seek to provide shareholders that hold shares for the entire Outcome Period with their respective buffer level against reference asset losses during the Outcome Period. You will bear all reference asset losses exceeding the buffer. Depending upon market conditions at the time of purchase, a shareholder that purchases shares after the Outcome Period has begun may also lose their entire investment. For instance, if the Outcome Period has begun and the Fund has decreased in value beyond the pre-determined buffer, an investor purchasing shares at that price may not benefit from the buffer. Similarly, if the Outcome Period has begun and the Fund has increased in value, an investor purchasing shares at that price may not benefit from the buffer until the Fund's value has decreased to its value at the commencement of the Outcome Period.
This material must be preceded by or accompanied with a prospectus. The Funds' investment objectives, risks, charges and expenses should be considered carefully before investing. The prospectus contains this and other important information, and it may be obtained at innovatoretfs.com. Read it carefully before investing.
Innovator ETFs are distributed by Foreside Fund Services, LLC.
INNOVATOR IBD® 50 ETF
Fund Performance
April 30, 2022 (Unaudited)
The following chart compares the value of a hypothetical $10,000 investment in the Innovator IBD® 50 ETF from its inception (April 8, 2015) to April 30, 2022 as compared with the S&P 500® Index.
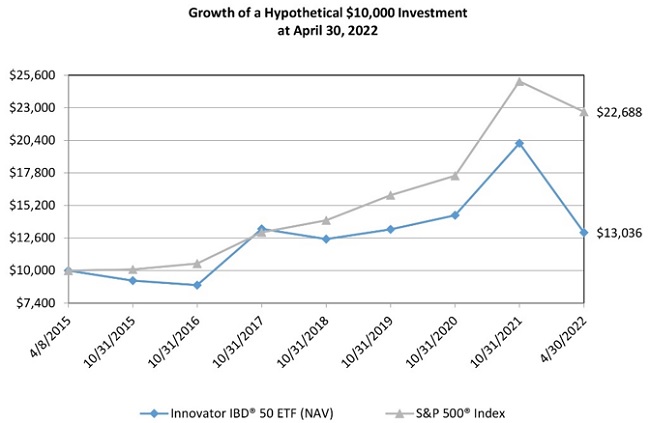
Average Annual Total Returns As of April 30, 2022 | |||||||||||||||||
1 Year | 3 Years | 5 Years | Since Inception (a) | ||||||||||||||
Innovator IBD® 50 ETF | |||||||||||||||||
NAV Return | -30.20 | % | -2.03 | % | 4.37 | % | 3.83 | % | |||||||||
Market Return | -30.24 | % | -2.04 | % | 4.33 | % | 3.82 | % | |||||||||
S&P 500® Index | 0.21 | % | 13.85 | % | 13.66 | % | 12.30 | % | |||||||||
IBD® 50 Index (b) | -29.68 | % | -1.41 | % | N/A | -0.52 | % | (c) | |||||||||
(a) | Inception date is April 8, 2015. |
(b) | The Fund began tracking the IBD® 50 Index on November 20, 2017. |
(c) | Since Inception return is from the date the Fund began tracking the IBD® 50 Index, November 20, 2017. |
Performance data quoted represents past performance and does not guarantee future results. The investment return and principal value of an investment will fluctuate so that an investor’s shares, when redeemed, may be worth more or less than their original cost. Current performance of the Fund may be lower or higher than the performance quoted. As of the latest prospectus, the gross and net expense ratios of the Fund were 0.93% and 0.80%, respectively. For the most recent performance, please visit the Fund’s website at innovatoretfs.com.
Fund Performance
April 30, 2022 (Unaudited) (Continued)
The line graph and performance table do not reflect the deduction of taxes that a shareholder may pay on fund distributions or the redemption of Fund shares. Total return calculations reflect the effect of the Advisor’s expense limitation agreement for the Fund. Returns shown for the Fund, S&P 500® Index and IBD® 50 Index include the reinvestment of all dividends, if any.
The S&P 500® Index is an unmanaged, capitalization–weighted index generally representative of the U.S. market for large capitalization stocks.
The IBD® 50 Index is a weekly, rule–based, computer–generated stock index compiled and published by Investor’s Business Daily® that seeks to identify the current top 50 growth stocks.
The Fund’s portfolio holdings may differ significantly from the securities held in the relevant index and, unlike an exchange–traded fund, the performance of an unmanaged index does not reflect deductions for transaction costs, taxes, management fees or other expenses.
You cannot invest directly in an index.
Premium/Discount Information:
Information regarding the differences between the price of the Fund’s shares on the secondary market and the Fund’s net asset value is available at Innovatoretfs.com/FFTY.
INNOVATOR IBD® BREAKOUT OPPORTUNITIES ETF
Fund Performance
April 30, 2022 (Unaudited)
The following chart compares the value of a hypothetical $10,000 investment in the Innovator IBD® Breakout Opportunities ETF from its inception (September 12, 2018) to April 30, 2022 as compared with the S&P 500® Index and IBD® Breakout Stocks Index.
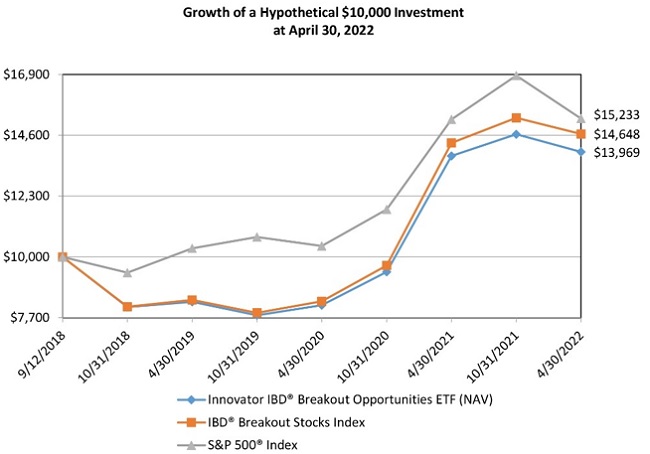
Average Annual Total Returns As of April 30, 2022 | ||||||||||||
1 Year | 3 Years | Since Inception (a) | ||||||||||
Innovator IBD® Breakout Opportunities ETF | ||||||||||||
NAV Return | 1.11 | % | 18.92 | % | 9.65 | % | ||||||
Market Return | 1.05 | % | 18.98 | % | 9.63 | % | ||||||
S&P 500® Index | 0.21 | % | 13.85 | % | 12.29 | % | ||||||
IBD® Breakout Stocks Index | 2.36 | % | 20.50 | % | 11.09 | % | ||||||
(a) | Inception date is September 12, 2018. |
Performance data quoted represents past performance and does not guarantee future results. The investment return and principal value of an investment will fluctuate so that an investor’s shares, when redeemed, may be worth more or less than their original cost. Current performance of the Fund may be lower or higher than the performance quoted. As of the latest prospectus, the net expense ratio of the Fund was 0.80%. For the most recent performance, please visit the Fund’s website at innovatoretfs.com.
INNOVATOR IBD® BREAKOUT OPPORTUNITIES ETF
Fund Performance
April 30, 2022 (Unaudited) (Continued)
The line graph and performance table do not reflect the deduction of taxes that a shareholder may pay on fund distributions or the redemption of Fund shares. Returns shown for the Fund, S&P 500® Index and IBD® Breakout Stocks Index include the reinvestment of all dividends, if any.
The S&P 500® Index is an unmanaged, capitalization–weighted index generally representative of the U.S. market for large capitalization stocks.
The IBD® Breakout Stocks Index is a rule–based index compiled and published by Investor’s Business Daily® that seeks to provide opportunistic investment exposure to those stocks with the potential to “break out” or experience a period of sustained price growth beyond the stock’s recent “resistance level,” with consideration for various market conditions.
The Fund’s portfolio holdings may differ significantly from the securities held in the relevant index and, unlike an exchange–traded fund, the performance of an unmanaged index does not reflect deductions for transaction costs, taxes, management fees or other expenses.
You cannot invest directly in an index.
Premium/Discount Information:
Information regarding the differences between the price of the Fund’s shares on the secondary market and the Fund’s net asset value is available at Innovatoretfs.com/BOUT.
INNOVATOR LOUP FRONTIER TECH ETF
Fund Performance
April 30, 2022 (Unaudited)
The following chart compares the value of a hypothetical $10,000 investment in the Innovator Loup Frontier Tech ETF from its inception (July 24, 2018) to April 30, 2022 as compared with the Dow Jones Global Index and Loup Frontier Tech Index.

Average Annual Total Returns As of April 30, 2022 | ||||||||||||
1 Year | 3 Years | Since Inception (a) | ||||||||||
Innovator Loup Frontier Tech ETF | ||||||||||||
NAV Return | -30.02 | % | 13.48 | % | 11.37 | % | ||||||
Market Return | -30.50 | % | 13.39 | % | 11.21 | % | ||||||
Dow Jones Global Index | -6.14 | % | 9.28 | % | 7.98 | % | ||||||
Loup Frontier Tech Index | -29.63 | % | 14.34 | % | 12.07 | % | ||||||
(a) | Inception date is July 24, 2018. |
Performance data quoted represents past performance and does not guarantee future results. The investment return and principal value of an investment will fluctuate so that an investor’s shares, when redeemed, may be worth more or less than their original cost. Current performance of the Fund may be lower or higher than the performance quoted. As of the latest prospectus, the net expense ratio of the Fund was 0.70%. For the most recent performance, please visit the Fund’s website at innovatoretfs.com.
Fund Performance
April 30, 2022 (Unaudited) (Continued)
The line graph and performance table do not reflect the deduction of taxes that a shareholder may pay on fund distributions or the redemption of Fund shares. Returns shown for the Fund, Dow Jones Global Index and Loup Frontier Tech Index include the reinvestment of all dividends, if any.
The Dow Jones Global Index is an unmanaged, capitalization–weighted index generally representative of the global market.
The Loup Frontier Tech Index is a rules–based stock index that seeks to identify and track those companies identified as being on the frontier of the development of new technologies that have the potential to have an outsized influence on the future.
The Fund’s portfolio holdings may differ significantly from the securities held in the relevant index and, unlike an exchange–traded fund, the performance of an unmanaged index does not reflect deductions for transaction costs, taxes, management fees or other expenses.
You cannot invest directly in an index.
Premium/Discount Information:
Information regarding the differences between the price of the Fund’s shares on the secondary market and the Fund’s net asset value is available at Innovatoretfs.com/LOUP.
INNOVATOR S&P INVESTMENT GRADE PREFERRED ETF
Fund Performance
April 30, 2022 (Unaudited)
The following chart compares the value of a hypothetical $10,000 investment in the Innovator S&P Investment Grade Preferred ETF from its inception (May 23, 2016) to April 30, 2022 as compared with the S&P U.S. High Quality Preferred Stock Index and the S&P U.S. Preferred Stock Index.
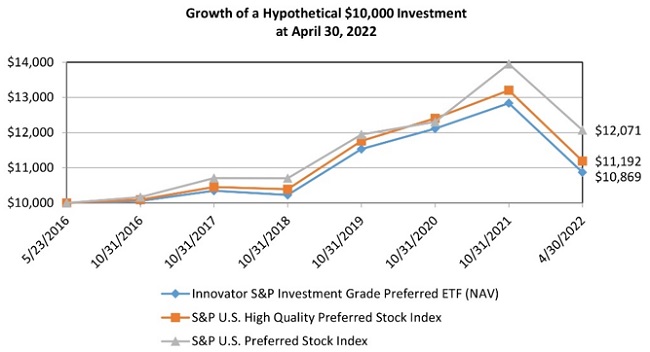
Average Annual Total Returns As of April 30, 2022 | ||||||||||||||||
1 Year | 3 Years | 5 Years | Since Inception (a) | |||||||||||||
Innovator S&P Investment Grade Preferred ETF | ||||||||||||||||
NAV Return | -13.20 | % | 0.03 | % | 1.50 | % | 1.41 | % | ||||||||
Market Return | -13.45 | % | -0.04 | % | 1.38 | % | 1.31 | % | ||||||||
S&P U.S. High Quality Preferred Stock Index | -12.90 | % | 0.40 | % | 1.95 | % | 1.91 | % | ||||||||
S&P U.S. Preferred Stock Index | -9.75 | % | 2.36 | % | 2.80 | % | 3.22 | % | ||||||||
(a) | Inception date is May 23, 2016. |
Performance data quoted represents past performance and does not guarantee future results. The investment return and principal value of an investment will fluctuate so that an investor’s shares, when redeemed, may be worth more or less than their original cost. Current performance of the Fund may be lower or higher than the performance quoted. As of the latest prospectus, the net expense ratio of the Fund was 0.47%. For the most recent performance, please visit the Fund’s website at innovatoretfs.com.
INNOVATOR S&P INVESTMENT GRADE PREFERRED ETF
Fund Performance
April 30, 2022 (Unaudited) (Continued)
The line graph and performance table do not reflect the deduction of taxes that a shareholder may pay on fund distributions or the redemption of Fund shares. Returns shown for the Fund, S&P U.S. High Quality Preferred Stock Index and S&P U.S. Preferred Stock Index include the reinvestment of all dividends, if any.
The S&P U.S. High Quality Preferred Stock Index is designed to provide exposure to U.S. - listed preferred stocks that meet a minimum size, liquidity, type of issuance, and quality criteria.
The S&P U.S. Preferred Stock Index generally represents the U.S. preferred stock market.
The Fund’s portfolio holdings may differ significantly from the securities held in the relevant index and, unlike an exchange-traded fund, the performance of an unmanaged index does not reflect deductions for transaction costs, taxes, management fees or other expenses.
You cannot invest directly in an index.
Premium/Discount Information:
Information regarding the differences between the price of the Fund’s shares on the secondary market and the Fund’s net asset value is available at innovatoretfs.com/EPRF.
INNOVATOR LADDERED ALLOCATION POWER BUFFER ETF
Fund Performance
April 30, 2022 (Unaudited)
The following chart compares the value of a hypothetical $10,000 investment in the Innovator Laddered Allocation Power Buffer ETF from its inception (October 19, 2016) to April 30, 2022 as compared with the S&P 500® Index.
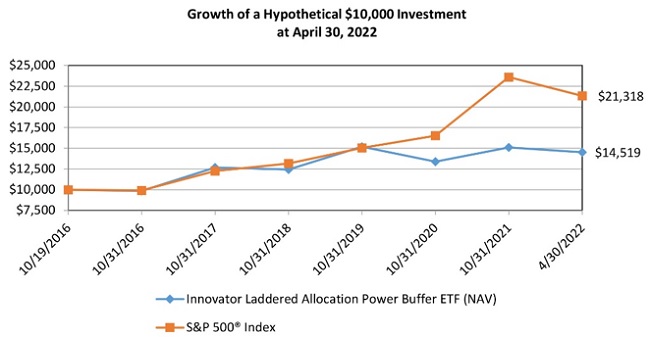
Average Annual Total Returns As of April 30, 2022 | |||||||||||||||||
1 Year | 3 Years | 5 Years | Since Inception (a) | ||||||||||||||
Innovator Laddered Allocation Power Buffer ETF | |||||||||||||||||
NAV Return | -0.70 | % | 1.07 | % | 4.12 | % | 6.98 | % | |||||||||
Market Return | -0.73 | % | 1.15 | % | 4.15 | % | 7.01 | % | |||||||||
S&P 500® Index | 0.21 | % | 13.85 | % | 13.66 | % | 14.67 | % | |||||||||
Refinitiv Laddered Power Buffer Strategy Index (b) | -0.58 | % | N/A | N/A | 4.80 | % | (c) | ||||||||||
(a) | Inception date is October 19, 2016. |
(b) | The Fund began tracking the Refinitiv Laddered Power Buffer Strategy Index on August 11, 2020. |
(c) | Since Inception return is cumulative and from the date the Fund began tracking the Refinitiv Laddered Power Buffer Strategy Index, August 11, 2020. |
Performance data quoted represents past performance and does not guarantee future results. The investment return and principal value of an investment will fluctuate so that an investor’s shares, when redeemed, may be worth more or less than their original cost. Current performance of the Fund may be lower or higher than the performance quoted. As of the latest prospectus, the gross and net expense ratios of the Fund were 0.99% and 0.89%, respectively. This expense ratio includes acquired fund fees and expenses of 0.79%. For the most recent performance, please visit the Fund’s website at innovatoretfs.com.
INNOVATOR LADDERED ALLOCATION POWER BUFFER ETF
Fund Performance
April 30, 2022 (Unaudited) (Continued)
The line graph and performance table do not reflect the deduction of taxes that a shareholder may pay on fund distributions or the redemption of Fund shares. Returns shown for the Fund, Refinitiv Laddered Power Buffer Strategy Index and S&P 500® Index include the reinvestment of all dividends, if any.
The Refinitiv Laddered Power Buffer Strategy Index is equally weighted in the shares of the twelve Innovator U.S. Equity Power Buffer ETFs which each respectively seek to provide a defined outcome based upon the performance of the S&P 500® Index - Price Return over the course of an approximately one-year time period that begins on the first trading day of the month indicated in the respective ETF's name. Each Innovator U.S. Equity Power Buffer ETF seeks to provide an upside return that is capped for an applicable outcome period and a measure of downside protection from losses for such outcome period. The Index seeks to provide "laddered" investing in the twelve Innovator U.S. Equity Power Buffer ETFs. Laddered investing refers to investments in several similar securities that have different reset dates, with the goal of mitigating timing risks associated with investing in a single investment.
The S&P 500® Index is an unmanaged, capitalization-weighted index generally representative of the U.S. market for large capitalization stocks.
The Fund’s portfolio holdings may differ significantly from the securities held in the relevant index and, unlike an exchange-traded fund, the performance of an unmanaged index does not reflect deductions for transaction costs, taxes, management fees or other expenses.
You cannot invest directly in an index.
Premium/Discount Information:
Information regarding the differences between the price of the Fund’s shares on the secondary market and the Fund’s net asset value is available at innovatoretfs.com/BUFF.
INNOVATOR LADDERED ALLOCATION BUFFER ETF
Fund Performance
April 30, 2022 (Unaudited)
The following chart compares the value of a hypothetical $10,000 investment in the Innovator Laddered Allocation Buffer ETF from its inception (February 8, 2022) to April 30, 2022 as compared with the S&P 500® Index.
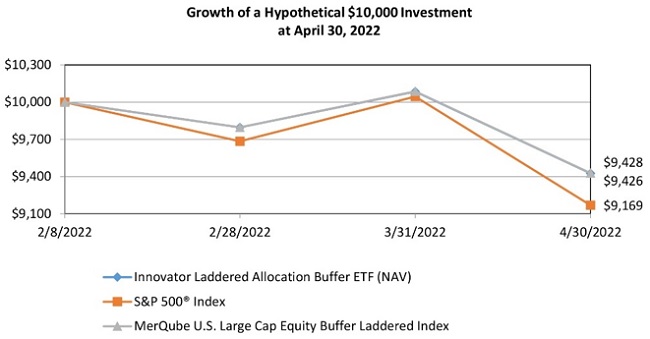
Total Returns As of April 30, 2022 | ||||
Since Inception (a) | ||||
Innovator Laddered Allocation Buffer ETF | ||||
NAV Return | -5.74 | % | ||
Market Return | -5.54 | % | ||
S&P 500® Index | -8.31 | % | ||
MerQube U.S. Large Cap Equity Buffer Laddered Index | -5.72 | % | ||
(a) | Inception date is February 8, 2022. |
Performance data quoted represents past performance and does not guarantee future results. The investment return and principal value of an investment will fluctuate so that an investor’s shares, when redeemed, may be worth more or less than their original cost. Current performance of the Fund may be lower or higher than the performance quoted. As of the latest prospectus, the gross and net expense ratios of the Fund were 0.99% and 0.89%, respectively. This expense ratio includes acquired fund fees and expenses of 0.79%. For the most recent performance, please visit the Fund’s website at innovatoretfs.com.
INNOVATOR LADDERED ALLOCATION BUFFER ETF
Fund Performance
April 30, 2022 (Unaudited) (Continued)
The line graph and performance table do not reflect the deduction of taxes that a shareholder may pay on fund distributions or the redemption of Fund shares. Returns shown for the Fund, MerQube U.S. Large Cap Equity Buffer Laddered Index and S&P 500® Index include the reinvestment of all dividends, if any.
The MerQube U.S. Large Cap Equity Buffer Laddered Index is equally weighted in the shares of the twelve Innovator U.S. Equity Buffer ETFs which each respectively seek to provide a defined outcome based upon the performance of the S&P 500® Index - Price Return over the course of an approximately one-year time period that begins on the first trading day of the month indicated in the respective ETF's name. Each Innovator U.S. Equity Buffer ETF seeks to provide an upside return that is capped for an applicable outcome period and a measure of downside protection from losses for such outcome period. The Index seeks to provide "laddered" investing in the twelve Innovator U.S. Equity Buffer ETFs. Laddered investing refers to investments in several similar securities that have different reset dates, with the goal of mitigating timing risks associated with investing in a single investment.
The S&P 500® Index is an unmanaged, capitalization-weighted index generally representative of the U.S. market for large capitalization stocks.
The Fund’s portfolio holdings may differ significantly from the securities held in the relevant index and, unlike an exchange-traded fund, the performance of an unmanaged index does not reflect deductions for transaction costs, taxes, management fees or other expenses.
You cannot invest directly in an index.
Premium/Discount Information:
Information regarding the differences between the price of the Fund’s shares on the secondary market and the Fund’s net asset value is available at innovatoretfs.com/BUFB.
INNOVATOR BUFFER STEP-UP STRATEGY ETF
Fund Performance | |
April 30, 2022 (Unaudited) | |
The following chart compares the value of a hypothetical $10,000 investment in the Innovator Buffer Step-Up Strategy ETF from its inception (March 7, 2022) to April 30, 2022 as compared with the S&P 500® Index - Price Return and Total Return. |
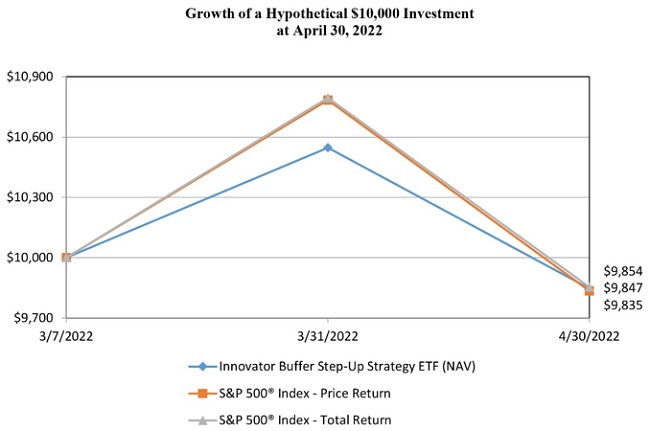
Total Returns as of April 30, 2022 | ||||
Since Inception (a) | ||||
Innovator Buffer Step-Up Strategy ETF | ||||
NAV Return | -1.53 | % | ||
Market Return | -1.68 | % | ||
S&P 500® Index - Price Return | -1.65 | % | ||
S&P 500® Index - Total Return | -1.46 | % | ||
(a) Inception date is March 7, 2022. |
Performance data quoted represents past performance and does not guarantee future results. The investment return and principal value of an investment will fluctuate so that an investor’s shares, when redeemed, may be worth more or less than their original cost. Current performance of the Fund may be lower or higher than the performance quoted. As of the latest prospectus, the net expense ratio of the Fund was 0.89%. For the most recent performance, please visit the Fund’s website at innovatoretfs.com. |
INNOVATOR BUFFER STEP-UP STRATEGY ETF
Fund Performance | ||
April 30, 2022 (Unaudited) (Continued) | ||
The line graph and performance table does not reflect the deduction of taxes that a shareholder may pay on fund distributions or the redemption of Fund shares. Returns shown for the Fund and S&P 500® Index - Total Return include the reinvestment of all dividends, if any. Returns shown for the S&P 500® Index - Price Return do not include the reinvestment of dividends, if any. |
The S&P 500® Index is an unmanaged, capitalization-weighted index generally representative of the U.S. market for large capitalization stocks. |
The Fund’s portfolio holdings may differ significantly from the securities held in the relevant index and, unlike an exchange-traded fund, the performance of an unmanaged index does not reflect deductions for transaction costs, taxes, management fees or other expenses. |
You cannot invest directly in an index. |
Premium/Discount Information: |
Information regarding the differences between the price of the Fund’s shares on the secondary market and the Fund’s net asset value is available at Innovatoretfs.com/BSTP. |
INNOVATOR POWER BUFFER STEP-UP STRATEGY ETF
Fund Performance | |
April 30, 2022 (Unaudited) | |
The following chart compares the value of a hypothetical $10,000 investment in the Innovator Power Buffer Step-Up Strategy ETF from its inception (March 7, 2022) to April 30, 2022 as compared with the S&P 500® Index - Price Return and Total Return. |
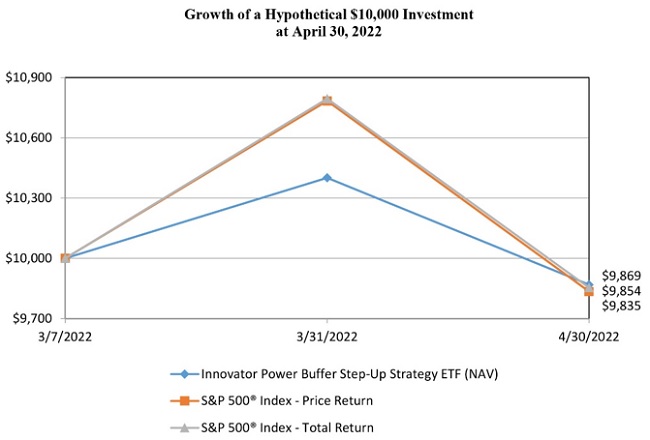
Total Returns as of April 30, 2022 | ||||
Since Inception (a) | ||||
Innovator Power Buffer Step-Up Strategy ETF | ||||
NAV Return | -1.31 | % | ||
Market Return | -1.46 | % | ||
S&P 500® Index - Price Return | -1.65 | % | ||
S&P 500® Index - Total Return | -1.46 | % | ||
(a) Inception date is March 7, 2022. |
Performance data quoted represents past performance and does not guarantee future results. The investment return and principal value of an investment will fluctuate so that an investor’s shares, when redeemed, may be worth more or less than their original cost. Current performance of the Fund may be lower or higher than the performance quoted. As of the latest prospectus, the net expense ratio of the Fund was 0.89%. For the most recent performance, please visit the Fund’s website at innovatoretfs.com. |
INNOVATOR POWER BUFFER STEP-UP STRATEGY ETF
Fund Performance | ||
April 30, 2022 (Unaudited) (Continued) | ||
The line graph and performance table does not reflect the deduction of taxes that a shareholder may pay on fund distributions or the redemption of Fund shares. Returns shown for the Fund and S&P 500® Index - Total Return include the reinvestment of all dividends, if any. Returns shown for the S&P 500® Index - Price Return do not include the reinvestment of dividends, if any. |
The S&P 500® Index is an unmanaged, capitalization-weighted index generally representative of the U.S. market for large capitalization stocks. |
The Fund’s portfolio holdings may differ significantly from the securities held in the relevant index and, unlike an exchange-traded fund, the performance of an unmanaged index does not reflect deductions for transaction costs, taxes, management fees or other expenses. |
You cannot invest directly in an index. |
Premium/Discount Information: |
Information regarding the differences between the price of the Fund’s shares on the secondary market and the Fund’s net asset value is available at Innovatoretfs.com/PSTP. |
INNOVATOR ETFs TRUST
Expense Example
For the Period Ended April 30, 2022 (Unaudited)
As a shareholder of the Funds, you incur two types of costs: (1) ongoing costs, including management fees, and other Fund expenses; and (2) transaction costs, including brokerage commissions on the purchase and sale of Fund shares. This Example is intended to help you understand your ongoing costs (in dollars) of investing in the Funds and to compare these costs with the ongoing costs of investing in other funds.
The Example is based on an investment of $1,000 invested at the beginning of the period and held for the entire respective period to April 30, 2022 for each Fund.
Actual Expenses
The first line under each Fund in the following table provides information about actual account values and actual expenses. You may use the information in this line, together with the amount you invested, to estimate the expenses you paid over the period. Simply divide your account value by $1,000 (for example, an $8,600 account value divided by $1,000 equals 8.6), then multiply the result by the number in the applicable line under the heading titled “Expenses Paid During the Period” to estimate the expenses you paid on your account during the period.
Hypothetical Example for Comparison Purposes
The second line under each Fund in the following table provides information about hypothetical account values and hypothetical expenses based on the Funds’ actual expense ratios and an assumed rate of return of 5% per year before expenses, which are not the Funds’ actual returns. The hypothetical account values and expenses may not be used to estimate the actual ending account balance or expenses you paid for the period. You may use this information to compare the ongoing costs of investing in the Funds with other funds. To do so, compare this 5% hypothetical example with the 5% hypothetical examples that appear in the shareholder reports of other funds.
Please note that the expenses shown in the table are meant to highlight your ongoing costs only and do not reflect any transactional costs, such as brokerage commissions on the purchase and sale of Fund shares. Therefore, the second line under the Fund in the table is useful in comparing the ongoing Fund costs only and will not help you determine the relative total costs of owning different funds. In addition, if these transactional costs were included, your costs could have been higher.
INNOVATOR ETFs TRUST
Expense Example
For the Period Ended April 30, 2022 (Unaudited) (Continued)
Expenses Paid | Annualized Expense | ||||||||||||||||
Beginning Account | Ending Account | During the | Ratio for the | ||||||||||||||
Value | Value | Period | Period | ||||||||||||||
Innovator IBD 50® ETF (NAV) | 0.80 | % | |||||||||||||||
Actual | $ | 1,000.00 | $ | 646.30 | $ | 3.27 | (a) | ||||||||||
Hypothetical | 1,000.00 | 1,020.83 | 4.01 | (a) | |||||||||||||
Innovator IBD® Breakout Opportunities ETF (NAV) | 0.80 | % | |||||||||||||||
Actual | 1,000.00 | 954.20 | 3.88 | (a) | |||||||||||||
Hypothetical | 1,000.00 | 1,020.83 | 4.01 | (a) | |||||||||||||
Innovator Loup Frontier Tech ETF (NAV) | 0.70 | % | |||||||||||||||
Actual | 1,000.00 | 669.50 | 2.90 | (a) | |||||||||||||
Hypothetical | 1,000.00 | 1,021.32 | 3.51 | (a) | |||||||||||||
Innovator S&P Investment Grade Preferred ETF (NAV) | 0.47 | % | |||||||||||||||
Actual | 1,000.00 | 846.70 | 2.15 | (a) | |||||||||||||
Hypothetical | 1,000.00 | 1,022.46 | 2.36 | (a) | |||||||||||||
Innovator Laddered Allocation Power Buffer ETF (NAV) | 0.10 | % | |||||||||||||||
Actual | 1,000.00 | 961.00 | 0.49 | (a) | |||||||||||||
Hypothetical | 1,000.00 | 1,024.30 | 0.50 | (a) | |||||||||||||
Innovator Laddered Allocation Buffer ETF (NAV) | 0.10 | % | |||||||||||||||
Actual | 1,000.00 | 942.60 | 0.30 | (b) | |||||||||||||
Hypothetical | 1,000.00 | 1,024.30 | 0.50 | (d) | |||||||||||||
Innovator Buffer Step-Up Strategy ETF (NAV) | 0.89 | % | |||||||||||||||
Actual | 1,000.00 | 984.70 | 1.31 | (c) | |||||||||||||
Hypothetical | 1,000.00 | 1,020.38 | 4.46 | (d) | |||||||||||||
Innovator Power Buffer Step-Up Strategy ETF (NAV) | 0.89 | % | |||||||||||||||
Actual | 1,000.00 | 986.90 | 1.31 | (c) | |||||||||||||
Hypothetical | 1,000.00 | 1,020.38 | 4.46 | (d) | |||||||||||||
(a) | Expenses are equal to the Fund’s annualized expense ratio, multiplied by the average account value over the period, multiplied by 181/365 (to reflect the six month period). |
(b) | Expenses are equal to the Fund’s annualized expense ratio, multiplied by the average account value over the period, multiplied by 81/365 (to reflect the period since the Fund’s inception). |
(c) | Expenses are equal to the Fund’s annualized expense ratio, multiplied by the average account value over the period, multiplied by 54/365 (to reflect the period since the Fund’s inception). |
(d) | For comparative purposes only as the Fund was not in operation for the full six month period. |
Schedule of Investments
April 30, 2022 (Unaudited)
Shares | Value | |||||||
COMMON STOCKS - 93.26% | ||||||||
Agriculture - 5.81% | ||||||||
Andersons, Inc. | 85,986 | $ | 4,319,077 | |||||
Bunge Ltd. | 37,687 | 4,263,153 | ||||||
8,582,230 | ||||||||
Biotechnology - 9.59% | ||||||||
Exelixis, Inc. (a) | 198,376 | 4,431,720 | ||||||
Regeneron Pharmaceuticals, Inc. (a) | 6,656 | 4,387,036 | ||||||
Vertex Pharmaceuticals, Inc. (a) | 19,571 | 5,347,189 | ||||||
14,165,945 | ||||||||
Chemicals - 6.03% | ||||||||
Dow, Inc. | 44,313 | 2,946,815 | ||||||
FMC Corp. | 33,856 | 4,487,274 | ||||||
Westlake Corp. | 11,644 | 1,473,548 | ||||||
8,907,637 | ||||||||
Coal - 0.49% | ||||||||
Arch Resources, Inc. | 4,367 | 726,582 | ||||||
Computers - 3.00% | ||||||||
Qualys, Inc. (a) | 32,481 | 4,426,511 | ||||||
Diversified Financial Services - 4.10% | ||||||||
International Money Express, Inc. (a) | 230,147 | 4,573,021 | ||||||
LPL Financial Holdings, Inc. | 7,854 | 1,475,531 | ||||||
6,048,552 | ||||||||
Electric - 0.97% | ||||||||
OGE Energy Corp. | 36,899 | 1,427,253 | ||||||
Electronics - 0.50% | ||||||||
Hubbell, Inc. | 3,806 | 743,540 | ||||||
Food - 3.06% | ||||||||
Simply Good Foods Co. (a) | 108,396 | 4,514,693 | ||||||
Gas - 1.01% | ||||||||
National Fuel Gas Co. | 21,252 | 1,490,403 | ||||||
Healthcare - Services - 1.00% | ||||||||
UnitedHealth Group, Inc. | 2,909 | 1,479,372 | ||||||
Schedule of Investments
April 30, 2022 (Unaudited) (Continued)
Shares | Value | |||||||
Insurance - 1.97% | ||||||||
Kinsale Capital Group, Inc. (b) | 13,114 | 2,907,243 | ||||||
Internet - 1.44% | ||||||||
Perion Network Ltd. (a) | 66,038 | 1,392,081 | ||||||
Zendesk, Inc. (a) | 6,071 | 740,905 | ||||||
2,132,986 | ||||||||
Iron & Steel - 13.90% | ||||||||
Cleveland-Cliffs, Inc. (a)(b) | 190,616 | 4,858,802 | ||||||
Nucor Corp. | 32,898 | 5,091,952 | ||||||
Reliance Steel & Aluminum Co. | 27,640 | 5,479,630 | ||||||
Steel Dynamics, Inc. | 59,356 | 5,089,777 | ||||||
20,520,161 | ||||||||
Lodging - 0.50% | ||||||||
Marriott International, Inc. - Class A (a) | 4,147 | 736,175 | ||||||
Metal Fabricate & Hardware - 0.51% | ||||||||
Ryerson Holding Corp. | 20,299 | 747,206 | ||||||
Miscellaneous Manufacturing - 2.62% | ||||||||
Carlisle Cos., Inc. | 12,238 | 3,174,048 | ||||||
LSB Industries, Inc. (a) | 32,730 | 700,749 | ||||||
3,874,797 | ||||||||
Oil & Gas - 6.70% | ||||||||
Cenovus Energy, Inc. | 246,877 | 4,562,287 | ||||||
Comstock Resources, Inc. (a) | 313,391 | 5,337,049 | ||||||
9,899,336 | ||||||||
Packaging & Containers - 2.10% | ||||||||
Graphic Packaging Holding Co. | 142,258 | 3,101,224 | ||||||
Pharmaceuticals - 9.49% | ||||||||
Amphastar Pharmaceuticals, Inc. (a)(b) | 145,090 | 5,146,342 | ||||||
AstraZeneca PLC - ADR | 11,288 | 749,523 | ||||||
Cigna Corp. | 11,919 | 2,941,371 | ||||||
McKesson Corp. | 9,403 | 2,911,263 | ||||||
Novo Nordisk AS - ADR | 6,698 | 763,572 | ||||||
Pacira BioSciences, Inc. (a)(b) | 20,084 | 1,497,664 | ||||||
14,009,735 | ||||||||
Schedule of Investments
April 30, 2022 (Unaudited) (Continued)
Shares | Value | |||||||
Pipelines - 6.47% | ||||||||
New Fortress Energy, Inc. (b) | 130,893 | 5,076,031 | ||||||
Williams Cos., Inc. | 130,632 | 4,479,371 | ||||||
9,555,402 | ||||||||
Retail - 7.18% | ||||||||
BJ's Wholesale Club Holdings, Inc. (a) | 44,537 | 2,865,956 | ||||||
Murphy USA, Inc. | 22,223 | 5,191,293 | ||||||
O'Reilly Automotive, Inc. (a) | 4,190 | 2,541,445 | ||||||
10,598,694 | ||||||||
Semiconductors - 0.95% | ||||||||
Silicon Motion Technology Corp. - ADR | 18,509 | 1,405,388 | ||||||
Transportation - 3.87% | ||||||||
Eagle Bulk Shipping, Inc. | 11,706 | 728,581 | ||||||
FLEX LNG Ltd. | 177,305 | 4,982,271 | ||||||
5,710,852 | ||||||||
TOTAL COMMON STOCKS (Cost $138,154,738) | 137,711,917 | |||||||
REAL ESTATE INVESTMENT TRUSTS - 6.28% | ||||||||
Storage - 3.83% | ||||||||
Extra Space Storage, Inc. | 7,326 | 1,391,940 | ||||||
Life Storage, Inc. | 21,449 | 2,841,778 | ||||||
Public Storage | 3,819 | 1,418,758 | ||||||
5,652,476 | ||||||||
Warehouse/Industrial - 2.45% | ||||||||
Rexford Industrial Realty, Inc. | 37,170 | 2,900,747 | ||||||
Terreno Realty Corp. | 9,840 | 715,860 | ||||||
3,616,607 | ||||||||
TOTAL REAL ESTATE INVESTMENT TRUSTS (Cost $9,562,653) | 9,269,083 | |||||||
INVESTMENTS PURCHASED WITH PROCEEDS FROM SECURITIES LENDING - 31.82% | Units | |||||||
Mount Vernon Liquid Assets Portfolio, LLC, 0.45% (c) | 46,996,751 | 46,996,751 | ||||||
TOTAL INVESTMENTS PURCHASED WITH PROCEEDS FROM SECURITIES LENDING (Cost $46,996,751) | 46,996,751 | |||||||
Schedule of Investments
April 30, 2022 (Unaudited) (Continued)
SHORT TERM INVESTMENTS - 0.74% | ||||||||
Money Market Deposit Account - 0.74% | Principal Amount | Value | ||||||
U.S. Bank Money Market Deposit Account, 0.130% (d) | $ | 1,098,688 | 1,098,688 | |||||
TOTAL SHORT TERM INVESTMENTS (Cost $1,098,688) | 1,098,688 | |||||||
Total Investments (Cost $195,812,830) - 132.10% | 195,076,439 | |||||||
Liabilities in Excess of Other Assets - (32.10)% | (47,402,986 | ) | ||||||
TOTAL NET ASSETS - 100.00% | $ | 147,673,453 | ||||||
Asset Type | % of Net Assets | |||
Common Stocks | 93.26 | % | ||
Real Estate Investment Trusts | 6.28 | |||
Investments Purchased with Proceeds From Securities Lending | 31.82 | |||
Short Term Investments | 0.74 | |||
Total Investments | 132.10 | |||
Liabilities in Excess of Other Assets | (32.10 | ) | ||
Net Assets | 100.00 | % | ||
Percentages are stated as a percent of net assets.
ADR - American Depositary Receipt
(a) | Non-income producing security. |
(b) | All or a portion of this security is on loan as of April 30, 2022. The total value of securities on loan is $17,140,654, or 11.61% of net assets. See Note 6. |
(c) | Represents annualized seven-day yield as of the end of the reporting period. |
(d) | The U.S. Bank Money Market Deposit Account (the “MMDA”) is a short-term investment vehicle in which the Fund holds cash balances. The MMDA will bear interest at a variable rate that is determined based on conditions and may change daily and by any amount. The rate shown is as of April 30, 2022. |
INNOVATOR IBD® BREAKOUT OPPORTUNITIES ETF
Schedule of Investments
April 30, 2022 (Unaudited)
Shares | Value | |||||||
COMMON STOCKS - 74.68% | ||||||||
Biotechnology - 6.05% | ||||||||
Exelixis, Inc. (a) | 25,560 | $ | 571,010 | |||||
Regeneron Pharmaceuticals, Inc. (a)(b) | 480 | 316,373 | ||||||
Vertex Pharmaceuticals, Inc. (a)(b) | 610 | 166,664 | ||||||
1,054,047 | ||||||||
Chemicals - 7.55% | ||||||||
Chemours Co. | 16,990 | 561,859 | ||||||
Mosaic Co. (b) | 1,230 | 76,777 | ||||||
Olin Corp. | 10,450 | 599,830 | ||||||
Sociedad Quimica y Minera de Chile SA - ADR | 1,050 | 77,490 | ||||||
1,315,956 | ||||||||
Commercial Services - 6.77% | ||||||||
Cintas Corp. | 800 | 317,808 | ||||||
Resources Connection, Inc. | 9,350 | 160,727 | ||||||
Service Corp. International | 8,320 | 545,875 | ||||||
TriNet Group, Inc. (a) | 1,750 | 155,225 | ||||||
1,179,635 | ||||||||
Diversified Financial Services - 0.47% | ||||||||
International Money Express, Inc. (a) | 4,150 | 82,461 | ||||||
Food - 8.18% | ||||||||
Ingles Markets, Inc. - Class A | 850 | 79,152 | ||||||
Kroger Co. (b) | 5,740 | 309,730 | ||||||
Sysco Corp. | 5,530 | 472,705 | ||||||
Tyson Foods, Inc. - Class A | 6,050 | 563,618 | ||||||
1,425,205 | ||||||||
Healthcare - Products - 2.94% | ||||||||
Edwards Lifesciences Corp. (a) | 4,840 | 511,975 | ||||||
Healthcare - Services - 1.89% | ||||||||
Humana, Inc. | 740 | 328,974 | ||||||
Insurance - 3.63% | ||||||||
Arch Capital Group Ltd. (a) | 10,400 | 474,968 | ||||||
Jackson Financial, Inc. - Class A | 3,700 | 156,547 | ||||||
631,515 | ||||||||
Machinery - Diversified - 3.12% | ||||||||
AGCO Corp. | 4,260 | 542,724 | ||||||
Schedule of Investments
April 30, 2022 (Unaudited) (Continued)
Shares | Value | |||||||
Media - 0.90% | ||||||||
World Wrestling Entertainment, Inc. - Class A (b) | 2,680 | 156,485 | ||||||
Mining - 0.44% | ||||||||
Franco-Nevada Corp. | 510 | 77,092 | ||||||
Oil & Gas - 10.19% | ||||||||
APA Corp. | 14,070 | 575,885 | ||||||
Ecopetrol SA - ADR (b) | 4,830 | 78,391 | ||||||
EQT Corp. (b) | 2,050 | 81,488 | ||||||
Occidental Petroleum Corp. | 5,780 | 318,420 | ||||||
Ovintiv, Inc. | 3,250 | 166,367 | ||||||
PDC Energy, Inc. (b) | 7,950 | 554,433 | ||||||
| 1,774,984 | ||||||||
Packaging & Containers - 0.93% | ||||||||
Packaging Corp. of America | 1,010 | 162,782 | ||||||
Pharmaceuticals - 11.25% | ||||||||
Alkermes PLC (a)(b) | 11,610 | 334,948 | ||||||
AmerisourceBergen Corp. (b) | 3,100 | 468,999 | ||||||
Bristol-Myers Squibb Co. (b) | 2,170 | 163,336 | ||||||
Cigna Corp. | 1,930 | 476,285 | ||||||
Merck & Co., Inc. (b) | 5,820 | 516,176 | ||||||
| 1,959,744 | ||||||||
Pipelines - 0.46% | ||||||||
Williams Cos., Inc. (b) | 2,330 | 79,896 | ||||||
Retail - 5.34% | ||||||||
Costco Wholesale Corp. | 570 | 303,080 | ||||||
Genuine Parts Co. | 2,450 | 318,623 | ||||||
Target Corp. | 1,350 | 308,677 | ||||||
| 930,380 | ||||||||
Semiconductors - 0.92% | ||||||||
Silicon Motion Technology Corp. - ADR | 2,120 | 160,972 | ||||||
Transportation - 0.44% | ||||||||
Genco Shipping & Trading Ltd. | 3,470 | 76,444 | ||||||
Schedule of Investments
April 30, 2022 (Unaudited) (Continued)
Shares | Value | |||||||
Water - 3.21% | ||||||||
Aris Water Solution, Inc. - Class A | 32,990 | 558,851 | ||||||
TOTAL COMMON STOCKS (Cost $12,915,244) | 13,010,122 | |||||||
MASTER LIMITED PARTNERSHIPS - 2.67% | ||||||||
Pipelines - 2.67% | ||||||||
Magellan Midstream Partners L.P. | 9,600 | 465,120 | ||||||
TOTAL MASTER LIMITED PARTNERSHIPS (Cost $472,656) | 465,120 | |||||||
REAL ESTATE INVESTMENT TRUSTS - 22.38% | ||||||||
Apartments - 5.23% | ||||||||
American Homes 4 Rent - Class A | 11,560 | 457,892 | ||||||
Invitation Homes, Inc. (b) | 11,400 | 453,948 | ||||||
| 911,840 | ||||||||
Diversified - 2.69% | ||||||||
Crown Castle International Corp. | 2,530 | 468,581 | ||||||
Manufactured Homes - 4.91% | ||||||||
Equity LifeStyle Properties, Inc. | 7,080 | 547,142 | ||||||
Sun Communities, Inc. | 1,760 | 309,003 | ||||||
| 856,145 | ||||||||
Single Tenant - 1.76% | ||||||||
National Retail Properties, Inc. | 7,000 | 306,880 | ||||||
Storage - 6.50% | ||||||||
CubeSmart | 9,300 | 441,843 | ||||||
Extra Space Storage, Inc. | 390 | 74,100 | ||||||
Iron Mountain, Inc. (b) | 8,660 | 465,302 | ||||||
Life Storage, Inc. | 1,140 | 151,039 | ||||||
| 1,132,284 | ||||||||
Warehouse/Industrial - 1.29% | ||||||||
EastGroup Properties, Inc. (b) | 780 | 146,250 | ||||||
Rexford Industrial Realty, Inc. | 1,010 | 78,820 | ||||||
| 225,070 | ||||||||
TOTAL REAL ESTATE INVESTMENT TRUSTS (Cost $4,102,777) | 3,900,800 | |||||||
Schedule of Investments
April 30, 2022 (Unaudited) (Continued)
INVESTMENTS PURCHASED WITH PROCEEDS FROM SECURITIES LENDING - 20.37% | Units | Value | ||||||
Mount Vernon Liquid Assets Portfolio, LLC, 0.45% (c) | 3,548,495 | 3,548,495 | ||||||
TOTAL INVESTMENTS PURCHASED WITH PROCEEDS FROM SECURITIES LENDING (Cost $3,548,495) | 3,548,495 | |||||||
SHORT TERM INVESTMENTS - 0.21% | ||||||||
Money Market Deposit Account - 0.21% | Principal Amount | |||||||
U.S. Bank Money Market Deposit Account, 0.130% (d) | $ | 36,275 | 36,275 | |||||
TOTAL SHORT TERM INVESTMENTS (Cost $36,275) | 36,275 | |||||||
Total Investments (Cost $21,075,447) - 120.31% | 20,960,812 | |||||||
Liabilities in Excess of Other Assets - (20.31)% | (3,538,804 | ) | ||||||
TOTAL NET ASSETS - 100.00% | $ | 17,422,008 | ||||||
Asset Type | % of Net Assets | |||
Common Stocks | 74.68 | % | ||
Master Limited Partnerships | 2.67 | |||
Real Estate Investment Trusts | 22.38 | |||
Investments Purchased with Proceeds From Securities Lending | 20.37 | |||
Short Term Investments | 0.21 | |||
Total Investments | 120.31 | |||
Liabilities in Excess of Other Assets | (20.31 | ) | ||
Net Assets | 100.00 | % | ||
Percentages are stated as a percent of net assets.
ADR American Depositary Receipt
(a) | Non-income producing security. |
(b) | All or a portion of this security is on loan as of April 30, 2022. The total value of securities on loan is $3,366,900, or 19.33% of net assets. See Note 6. |
(c) | Represents annualized seven-day yield as of the end of the reporting period. |
(d) | The U.S. Bank Money Market Deposit Account (the “MMDA”) is a short-term investment vehicle in which the Fund holds cash balances. The MMDA will bear interest at a variable rate that is determined based on conditions and may change daily and by any amount. The rate shown is as of April 30, 2022. |
Schedule of Investments
April 30, 2022 (Unaudited)
Shares | Value | |||||||
COMMON STOCKS - 99.83% | ||||||||
Aerospace & Defense - 5.84% | ||||||||
AeroVironment, Inc. (a)(b) | 16,629 | $ | 1,335,641 | |||||
Northrop Grumman Corp. | 3,697 | 1,624,462 | ||||||
2,960,103 | ||||||||
Auto Parts & Equipment - 3.33% | ||||||||
Magna International, Inc. | 27,979 | 1,686,294 | ||||||
Banks - 3.08% | ||||||||
Signature Bank | 6,433 | 1,558,394 | ||||||
Commercial Services - 10.32% | ||||||||
Affirm Holdings, Inc. (a)(b) | 76,029 | 2,182,032 | ||||||
Block, Inc. (a)(b) | 13,912 | 1,384,800 | ||||||
GXO Logistics, Inc. (a) | 27,993 | 1,656,906 | ||||||
5,223,738 | ||||||||
Diversified Financial Services - 7.89% | ||||||||
Coinbase Global, Inc. - Class A (a)(b) | 10,651 | 1,200,474 | ||||||
Galaxy Digital Holdings Ltd. (a) | 121,215 | 1,325,708 | ||||||
Nasdaq, Inc. | 9,346 | 1,470,780 | ||||||
3,996,962 | ||||||||
Electrical Components & Equipment - 3.27% | ||||||||
Novanta, Inc. (a) | 12,865 | 1,655,726 | ||||||
Electronics - 6.31% | ||||||||
II-VI, Inc. (a)(b) | 26,285 | 1,608,905 | ||||||
Trimble, Inc. (a) | 23,773 | 1,585,659 | ||||||
3,194,564 | ||||||||
Internet - 7.31% | ||||||||
Overstock.com, Inc. (a)(b) | 42,381 | 1,422,306 | ||||||
Snap, Inc. - Class A (a)(b) | 80,100 | 2,279,646 | ||||||
3,701,952 | ||||||||
Miscellaneous Manufacturing - 4.95% | ||||||||
Axon Enterprise, Inc. (a) | 22,353 | 2,508,007 | ||||||
Schedule of Investments
April 30, 2022 (Unaudited) (Continued)
Shares | Value | |||||||
Semiconductors - 35.75% | ||||||||
Advanced Micro Devices, Inc. (a) | 28,289 | 2,419,275 | ||||||
Ambarella, Inc. (a) | 18,903 | 1,551,558 | ||||||
ams-OSRAM AG (a) | 133,519 | 1,666,328 | ||||||
Applied Materials, Inc. | 14,290 | 1,576,901 | ||||||
ASML Holding NV | 2,769 | 1,600,798 | ||||||
Micron Technology, Inc. | 23,763 | 1,620,399 | ||||||
Samsung Electronics Co. Ltd. | 31,079 | 1,667,774 | ||||||
SK Hynix, Inc. | 18,813 | 1,685,082 | ||||||
Skyworks Solutions, Inc. | 23,366 | 2,647,368 | ||||||
Teradyne, Inc. | 15,776 | 1,663,737 | ||||||
18,099,220 | ||||||||
Software - 8.86% | ||||||||
Pegasystems, Inc. | 23,235 | 1,779,569 | ||||||
Take-Two Interactive Software, Inc. (a)(b) | 12,131 | 1,449,776 | ||||||
Unity Software, Inc. (a)(b) | 18,903 | 1,255,348 | ||||||
4,484,693 | ||||||||
Toys/Games/Hobbies - 2.92% | ||||||||
Nintendo Co. Ltd. | 3,200 | 1,477,265 | ||||||
TOTAL COMMON STOCKS (Cost $64,183,546) | 50,546,918 | |||||||
INVESTMENTS PURCHASED WITH PROCEEDS FROM SECURITIES LENDING - 27.28% | Units | |||||||
Mount Vernon Liquid Assets Portfolio, LLC, 0.45% (c) | 13,811,175 | 13,811,175 | ||||||
TOTAL INVESTMENTS PURCHASED WITH PROCEEDS FROM SECURITIES LENDING (Cost $13,811,175) | 13,811,175 | |||||||
SHORT TERM INVESTMENTS - 0.11% | ||||||||
Money Market Deposit Account - 0.11% | Principal Amount | Value | ||||||
U.S. Bank Money Market Deposit Account, 0.130% (d) | $ | 56,545 | 56,545 | |||||
TOTAL SHORT TERM INVESTMENTS (Cost $56,545) | 56,545 | |||||||
Total Investments (Cost $78,051,266) - 127.22% | 64,414,638 | |||||||
Liabilities in Excess of Other Assets - (27.22)% | (13,783,589 | ) | ||||||
TOTAL NET ASSETS - 100.00% | $ | 50,631,049 | ||||||
Schedule of Investments
April 30, 2022 (Unaudited) (Continued)
Country | % of Net Assets | |||
Austria | 3.29 | % | ||
Canada | 3.33 | |||
Japan | 2.92 | |||
Netherlands | 3.16 | |||
South Korea | 6.62 | |||
United States | 80.51 | |||
Total Country | 99.83 | |||
Investments Purchased with Proceeds From Securities Lending | 27.28 | |||
Short Term Investments | 0.11 | |||
Total Investments | 127.22 | |||
Liabilities in Excess of Other Assets | (27.22 | ) | ||
Net Assets | 100.00 | % | ||
Percentages are stated as a percent of net assets.
(a) | Non-income producing security. |
(b) | All or a portion of this security is on loan as of April 30, 2022. The total value of securities on loan is $13,043,384, or 25.76% of net assets. See Note 6. |
(c) | Represents annualized seven-day yield as of the end of the reporting period. |
(d) | The U.S. Bank Money Market Deposit Account (the “MMDA”) is a short-term investment vehicle in which the Fund holds cash balances. The MMDA will bear interest at a variable rate that is determined based on conditions and may change daily and by any amount. The rate shown is as of April 30, 2022. |
Schedule of Investments
April 30, 2022 (Unaudited)
Shares | Value | |||||||
PREFERRED STOCKS - 99.70% (a) | ||||||||
Banks - 41.17% | ||||||||
Bank of America Corp., Series 02, 3.000% to 05/31/2022 then 3-Month Libor + 0.650% (b) | 32,074 | $ | 615,179 | |||||
Bank of America Corp., Series 5, 4.000% to 05/21/2022 then 3-Month Libor + 0.500% (b) | 28,724 | 602,342 | ||||||
Bank of America Corp., Series E, 4.000% to 05/16/2022 then 3-Month Libor + 0.350% (b) | 27,882 | 605,876 | ||||||
Bank of America Corp., Series GG, 6.000% | 24,025 | 601,106 | ||||||
Bank of America Corp., Series HH, 5.875% | 24,386 | 596,969 | ||||||
Bank of America Corp., Series KK, 5.375% | 24,769 | 556,807 | ||||||
Bank of America Corp., Series LL, 5.000% | 25,719 | 543,700 | ||||||
Bank of America Corp., Series NN, 4.375% | 28,829 | 529,877 | ||||||
Bank of America Corp., Series PP, 4.125% | 29,308 | 525,492 | ||||||
Bank of America Corp., Series QQ, 4.250% | 28,949 | 516,161 | ||||||
Bank of Hawaii Corp., Series A, 4.375% | 271,914 | 5,405,650 | ||||||
Cullen/Frost Bankers, Inc., Series B, 4.450% | 283,385 | 5,681,869 | ||||||
First Citizens BancShares, Inc./NC, Series A, 5.375% | 244,421 | 5,734,117 | ||||||
First Republic Bank/CA, Series J, 4.700% | 55,764 | 1,076,245 | ||||||
First Republic Bank/CA, Series K, 4.125% | 60,227 | 1,058,790 | ||||||
First Republic Bank/CA, Series L, 4.250% | 59,996 | 1,071,529 | ||||||
First Republic Bank/CA, Series M, 4.000% | 62,007 | 1,085,122 | ||||||
First Republic Bank/CA, Series N, 4.500% | 56,446 | 1,060,620 | ||||||
JPMorgan Chase & Co., Series DD, 5.750% | 40,565 | 995,871 | ||||||
JPMorgan Chase & Co., Series EE, 6.000% (b) | 39,688 | 994,184 | ||||||
JPMorgan Chase & Co., Series GG, 4.750% | 45,071 | 913,139 | ||||||
JPMorgan Chase & Co., Series JJ, 4.550% | 47,408 | 900,278 | ||||||
JPMorgan Chase & Co., Series LL, 4.625% | 46,973 | 910,337 | ||||||
JPMorgan Chase & Co., Series MM, 4.200% (b) | 49,237 | 891,682 | ||||||
Northern Trust Corp., Series E, 4.700% | 253,091 | 5,745,166 | ||||||
State Street Corp., Series D, 5.900% to 03/15/2024 then 3-Month Libor + 3.108% | 120,734 | 3,042,497 | ||||||
State Street Corp., Series G, 5.350% to 03/15/2026 then 3-Month Libor + 3.709% (b) | 117,197 | 2,989,696 | ||||||
The PNC Financial Services Group, Inc., Series P, 6.125% to 05/01/2022 then 3-Month Libor + 4.067% | 244,438 | 6,137,838 | ||||||
Schedule of Investments
April 30, 2022 (Unaudited) (Continued)
Shares | Value | |||||||
Truist Financial Corp., Series O, 5.250% (b) | 123,673 | 2,850,663 | ||||||
Truist Financial Corp., Series R, 4.750% | 136,160 | 2,765,410 | ||||||
US Bancorp., Series B, 3.500% to 07/15/2022 then 3-Month Libor + 0.600% (b) | 76,773 | 1,577,685 | ||||||
US Bancorp., Series K, 5.500% (b) | 60,172 | 1,452,552 | ||||||
US Bancorp., Series L, 3.750% | 78,887 | 1,345,812 | ||||||
US Bancorp., Series M, 4.000% (b) | 75,653 | 1,342,841 | ||||||
62,723,102 | ||||||||
Capital Markets - 7.51% | ||||||||
KKR & Co., Inc., Series C, 6.000%, 09/15/2023 (b) | 82,625 | 5,416,895 | ||||||
Oaktree Capital Group LLC, Series A, 6.625% | 119,939 | 3,066,840 | ||||||
Oaktree Capital Group LLC, Series B, 6.550% | 118,611 | 2,959,344 | ||||||
11,443,079 | ||||||||
Diversified Financial Services - 5.16% | ||||||||
Apollo Asset Management, Inc., Series A, 6.375% | 41,077 | 1,021,585 | ||||||
Apollo Asset Management, Inc., Series B, 6.375% | 40,515 | 1,032,322 | ||||||
The Charles Schwab Corp., Series D, 5.950% | 122,213 | 3,082,212 | ||||||
The Charles Schwab Corp., Series J, 4.450% | 135,565 | 2,730,279 | ||||||
7,866,398 | ||||||||
Electric - 7.79% | ||||||||
Alabama Power Co. Series A, 5.000% | 244,999 | 6,173,975 | ||||||
Brookfield Renewable Partners LP, Series 17, 5.250% | 273,032 | 5,695,447 | ||||||
11,869,422 | ||||||||
Insurance - 23.49% | ||||||||
Arch Capital Group Ltd., Series F, 5.450% | 128,277 | 2,905,474 | ||||||
Arch Capital Group Ltd., Series G, 4.550% | 147,136 | 2,838,253 | ||||||
Athene Holding Ltd., Series A, 6.350% to 06/30/2029 then 3-Month USD Libor + 4.253% | 39,150 | 996,368 | ||||||
Athene Holding Ltd., Series B, 5.625% | 42,202 | 960,096 | ||||||
Athene Holding Ltd., Series C, 6.375% to 09/30/2025 then Five-Year Treasury Constant Maturity + 5.970% (b) | 39,018 | 1,029,295 | ||||||
Athene Holding Ltd., Series D, 4.875% | 47,870 | 954,528 | ||||||
Axis Capital Holdings Ltd., Series E, 5.500% | 250,036 | 5,588,305 | ||||||
MetLife, Inc., Series A, 4.000% to 06/15/2022 then 3-Month Libor + 1.000% | 87,994 | 2,043,221 | ||||||
Schedule of Investments
April 30, 2022 (Unaudited) (Continued)
Shares | Value | |||||||
MetLife, Inc., Series E, 5.625% | 80,583 | 2,050,837 | ||||||
MetLife, Inc., Series F, 4.750% | 87,099 | 1,962,340 | ||||||
RenaissanceRe Holdings Ltd., Series F, 5.750% | 122,357 | 2,943,909 | ||||||
RenaissanceRe Holdings Ltd., Series G, 4.200% | 147,348 | 2,767,196 | ||||||
The Allstate Corp., 5.100% to 01/15/2023 then 3-Month Libor + 3.165%, 01/15/2053 | 81,538 | 2,054,758 | ||||||
The Allstate Corp., Series H. 5.100% | 83,613 | 1,867,078 | ||||||
The Allstate Corp., Series I, 4.750% | 84,161 | 1,827,135 | ||||||
The Hartford Financial Services Group, Inc., Series G, 6.000% | 115,953 | 3,000,864 | ||||||
35,789,657 | ||||||||
Real Estate Investment Trusts - 11.01% | ||||||||
Kimco Realty Corp., Series L, 5.125% (b) | 123,821 | 3,041,044 | ||||||
Kimco Realty Corp., Series M, 5.250% | 124,566 | 3,019,480 | ||||||
PS Business Parks, Inc., Series X, 5.250% | 81,767 | 1,612,445 | ||||||
PS Business Parks, Inc., Series Y, 5.200% | 82,648 | 1,637,257 | ||||||
PS Business Parks, Inc., Series Z, 4.875% | 87,619 | 1,612,190 | ||||||
Public Storage, Series F, 5.150% | 20,547 | 508,538 | ||||||
Public Storage, Series G, 5.050% | 20,562 | 495,339 | ||||||
Public Storage, Series H, 5.600% | 19,776 | 502,706 | ||||||
Public Storage, Series I, 4.875% | 21,131 | 491,507 | ||||||
Public Storage, Series J, 4.700% | 22,215 | 497,838 | ||||||
Public Storage, Series L, 4.625% | 22,064 | 487,614 | ||||||
Public Storage, Series M, 4.125% | 23,981 | 474,824 | ||||||
Public Storage, Series N, 3.875% (b) | 25,692 | 478,385 | ||||||
Public Storage, Series O, 3.900% | 25,955 | 478,091 | ||||||
Public Storage, Series P, 4.000% | 25,119 | 475,000 | ||||||
Public Storage, Series Q, 3.950% | 25,566 | 481,919 | ||||||
Public Storage, Series R, 4.000% | 25,196 | 475,701 | ||||||
16,769,878 | ||||||||
Savings & Loans - 3.57% | ||||||||
Washington Federal, Inc., Series A, 4.875% | 284,165 | 5,441,759 | ||||||
TOTAL PREFERRED STOCKS (Cost $179,627,625) | 151,903,295 | |||||||
Schedule of Investments
April 30, 2022 (Unaudited) (Continued)
INVESTMENTS PURCHASED WITH PROCEEDS FROM SECURITIES LENDING - 3.96% | Units | Value | ||||||
Mount Vernon Liquid Assets Portfolio, LLC, 0.45% (c) | 6,033,675 | 6,033,675 | ||||||
TOTAL INVESTMENTS PURCHASED WITH PROCEEDS FROM SECURITIES LENDING (Cost $6,033,675) | 6,033,675 | |||||||
SHORT TERM INVESTMENTS - 0.53% | ||||||||
Money Market Deposit Account - 0.53% | Principal Amount | |||||||
U.S. Bank Money Market Deposit Account, 0.130% (d) | $ | 809,734 | 809,734 | |||||
TOTAL SHORT TERM INVESTMENTS (Cost $809,734) | 809,734 | |||||||
Total Investments (Cost $186,471,034) - 104.19% | 158,746,704 | |||||||
Liabilities in Excess of Other Assets - (4.19)% | (6,388,865 | ) | ||||||
TOTAL NET ASSETS - 100.00% | $ | 152,357,839 | ||||||
Asset Type | % of Net Assets | |||
Preferred Stocks | 99.70 | % | ||
Investments Purchased with Proceeds From Securities Lending | 3.96 | |||
Short Term Investments | 0.53 | |||
Total Investments | 104.19 | |||
Liabilities in Excess of Other Assets | (4.19 | ) | ||
Net Assets | 100.00 | % | ||
Percentages are stated as a percent of net assets. |
USD - United States Dollar |
Libor - London Interbank Offered Rate |
(a) | Securities with no stated maturity date are perpetual in nature. |
(b) | All or a portion of this security is on loan as of April 30, 2022. The total value of securities on loan is $5,816,728, or 3.82% of net assets. See Note 6. |
(c) | Represents annualized seven-day yield as of the end of the reporting period. |
(d) | The U.S. Bank Money Market Deposit Account (the “MMDA”) is a short-term investment vehicle in which the Fund holds cash balances. The MMDA will bear interest at a variable rate that is determined based on conditions and may change daily and by any amount. The rate shown is as of April 30, 2022. |
INNOVATOR LADDERED ALLOCATION POWER BUFFER ETF
Schedule of Investments
April 30, 2022 (Unaudited)
Shares | Value | |||||||
AFFILIATED EXCHANGE TRADED FUNDS - 99.84% (a) | ||||||||
Innovator U.S. Equity Power Buffer ETF - January | 275,221 | $ | 8,529,099 | |||||
Innovator U.S. Equity Power Buffer ETF - February | 304,301 | 8,520,428 | ||||||
Innovator U.S. Equity Power Buffer ETF - March | 276,775 | 8,527,438 | ||||||
Innovator U.S. Equity Power Buffer ETF - April | 301,903 | 8,504,607 | ||||||
Innovator U.S. Equity Power Buffer ETF - May (b) | 293,263 | 8,428,379 | ||||||
Innovator U.S. Equity Power Buffer ETF - June | 276,353 | 8,548,427 | ||||||
Innovator U.S. Equity Power Buffer ETF - July (b) | 290,461 | 8,554,076 | ||||||
Innovator U.S. Equity Power Buffer ETF - August | 295,984 | 8,571,697 | ||||||
Innovator U.S. Equity Power Buffer ETF - September (b) | 298,024 | 8,550,309 | ||||||
Innovator U.S. Equity Power Buffer ETF - October (b) | 295,021 | 8,546,788 | ||||||
Innovator U.S. Equity Power Buffer ETF - November | 293,348 | 8,539,302 | ||||||
Innovator U.S. Equity Power Buffer ETF - December (b) | 287,307 | 8,522,905 | ||||||
TOTAL AFFILIATED EXCHANGE TRADED FUNDS (Cost $102,902,237) | 102,343,455 | |||||||
INVESTMENTS PURCHASED WITH PROCEEDS FROM SECURITIES LENDING - 0.70% | Units | |||||||
Mount Vernon Liquid Assets Portfolio, LLC, 0.45% (c) | 720,700 | 720,700 | ||||||
TOTAL INVESTMENTS PURCHASED WITH PROCEEDS FROM SECURITIES LENDING (Cost $720,700) | 720,700 | |||||||
SHORT TERM INVESTMENTS - 0.17% | ||||||||
Money Market Deposit Account - 0.17% | Principal Amount | |||||||
U.S. Bank Money Market Deposit Account, 0.130% (d) | $ | 170,177 | 170,177 | |||||
TOTAL SHORT TERM INVESTMENTS (Cost $170,177) | 170,177 | |||||||
Total Investments (Cost $103,793,114) - 100.71% | 103,234,332 | |||||||
Liabilities in Excess of Other Assets - (0.71)% | (725,600 | ) | ||||||
TOTAL NET ASSETS - 100.00% | $ | 102,508,732 | ||||||
INNOVATOR LADDERED ALLOCATION POWER BUFFER ETF
Schedule of Investments
April 30, 2022 (Unaudited) (Continued)
Asset Type | % of Net Assets | |||
Affiliated Exchange Traded Funds | 99.84 | % | ||
Investments Purchased with Proceeds From Securities Lending | 0.70 | |||
Short Term Investments | 0.17 | |||
Total Investments | 100.71 | |||
Liabilities in Excess of Other Assets | (0.71 | ) | ||
Net Assets | 100.00 | % | ||
Percentages are stated as a percent of net assets. | ||||
(a) | Non-income producing security. |
(b) | All or a portion of this security is on loan as of April 30, 2022. The total value of securities on loan is $689,434, or 0.67% of net assets. See Note 6. |
(c) | Represents annualized seven-day yield as of the end of the reporting period. |
(d) | The U.S. Bank Money Market Deposit Account (the “MMDA”) is a short-term investment vehicle in which the Fund holds cash balances. The MMDA will bear interest at a variable rate that is determined based on conditions and may change daily and by any amount. The rate shown is as of April 30, 2022. |
INNOVATOR LADDERED ALLOCATION BUFFER ETF
Schedule of Investments
April 30, 2022 (Unaudited)
Shares | Value | |||||||
AFFILIATED EXCHANGE TRADED FUNDS - 99.94% (a) | ||||||||
Innovator U.S. Equity Buffer ETF - January | 27,436 | $ | 928,042 | |||||
Innovator U.S. Equity Buffer ETF - February | 30,628 | 926,613 | ||||||
Innovator U.S. Equity Buffer ETF - March | 28,329 | 928,058 | ||||||
Innovator U.S. Equity Buffer ETF - April | 29,279 | 928,437 | ||||||
Innovator U.S. Equity Buffer ETF - May | 30,571 | 923,244 | ||||||
Innovator U.S. Equity Buffer ETF - June | 28,899 | 927,658 | ||||||
Innovator U.S. Equity Buffer ETF - July | 30,058 | 930,295 | ||||||
Innovator U.S. Equity Buffer ETF - August | 30,343 | 929,406 | ||||||
Innovator U.S. Equity Buffer ETF - September | 30,457 | 931,070 | ||||||
Innovator U.S. Equity Buffer ETF - October | 29,070 | 927,784 | ||||||
Innovator U.S. Equity Buffer ETF - November | 30,894 | 929,270 | ||||||
Innovator U.S. Equity Buffer ETF - December | 29,013 | 927,256 | ||||||
TOTAL AFFILIATED EXCHANGE TRADED FUNDS (Cost $11,740,515) | 11,137,133 | |||||||
SHORT TERM INVESTMENTS - 0.07% | ||||||||
Money Market Deposit Account - 0.07% | Principal Amount | |||||||
U.S. Bank Money Market Deposit Account, 0.130% (b) | $ | 8,098 | 8,098 | |||||
TOTAL SHORT TERM INVESTMENTS (Cost $8,098) | 8,098 | |||||||
Total Investments (Cost $11,748,613) - 100.01% | 11,145,231 | |||||||
Liabilities in Excess of Other Assets - (0.01)% | (762 | ) | ||||||
TOTAL NET ASSETS - 100.00% | $ | 11,144,469 | ||||||
Asset Type | % of Net Assets | |||
Affiliated Exchange Traded Funds | 99.94 | % | ||
Short Term Investments | 0.07 | |||
Total Investments | 100.01 | |||
Liabilities in Excess of Other Assets | (0.01 | ) | ||
Net Assets | 100.00 | % | ||
Percentages are stated as a percent of net assets. |
(a) | Non-income producing security. |
(b) | The U.S. Bank Money Market Deposit Account (the “MMDA”) is a short-term investment vehicle in which the Fund holds cash balances. The MMDA will bear interest at a variable rate that is determined based on conditions and may change daily and by any amount. The rate shown is as of April 30, 2022. |
INNOVATOR BUFFER STEP-UP STRATEGY ETF
Schedule of Investments |
April 30, 2022 (Unaudited) |
Contracts | Notional Amount | Value | ||||||||||
PURCHASED OPTIONS - 107.07% (a)(b) | ||||||||||||
CALL OPTIONS - 98.08% | ||||||||||||
SPY SPDR S&P 500® Trust ETF, Expires 4/28/2023, Strike Price $4.14 | 260 | $ | 10,712,000 | $ | 10,454,600 | |||||||
10,454,600 | ||||||||||||
PUT OPTIONS - 8.99% | ||||||||||||
SPY SPDR S&P 500® Trust ETF, Expires 4/28/2023, Strike Price $412.02 | 260 | 10,712,000 | 958,360 | |||||||||
958,360 | ||||||||||||
TOTAL PURCHASED OPTIONS (Cost $11,414,025) | 11,412,960 | |||||||||||
SHORT TERM INVESTMENTS - 0.87% | Principal Amount | |||||||||||
Money Market Deposit Account- 0.87% | ||||||||||||
U.S. Bank Money Market Deposit Account, 0.130% (c) | $ | 92,555 | 92,555 | |||||||||
TOTAL SHORT TERM INVESTMENTS (Cost $92,555) | 92,555 | |||||||||||
Total Investments (Cost $11,506,580) - 107.94% | 11,505,515 | |||||||||||
Liabilities in Excess of Other Assets - (7.94)% | (846,676 | ) | ||||||||||
TOTAL NET ASSETS - 100.00% | $ | 10,658,839 | ||||||||||
Asset Type | % of Net Assets | |||
Purchased Options | 107.07 | % | ||
Short Term Investments | 0.87 | |||
Total Investments | 107.94 | |||
Liabilities in Excess of Other Assets | (7.94 | ) | ||
Net Assets | 100.00 | % | ||
Percentages are stated as a percent of net assets. |
(a) | Exchange-Traded. |
(b) | Purchased option contracts are held in connection with corresponding option contracts written short. |
(c) | The U.S. Bank Money Market Deposit Account (the “MMDA”) is a short-term investment vehicle in which the Fund holds cash balances. The MMDA will bear interest at a variable rate that is determined based on conditions and may change daily and by any amount. The rate shown is as of April 30, 2022. |
INNOVATOR BUFFER STEP-UP STRATEGY ETF
Schedule of Options Written (a) | |||
April 30, 2022 (Unaudited) |
Description | Expiration | Strike Price | Contracts | Notional Amount | Value | |||||||||||||||
Call Options | ||||||||||||||||||||
SPY SPDR S&P 500® Trust ETF | 4/28/2023 | $ | 494.40 | 260 | $ | (10,712,000 | ) | $ | (169,520 | ) | ||||||||||
(169,520 | ) | |||||||||||||||||||
Put Options | ||||||||||||||||||||
SPY SPDR S&P 500® Trust ETF | 4/28/2023 | 374.93 | 260 | (10,712,000 | ) | (639,340 | ) | |||||||||||||
(639,340 | ) | |||||||||||||||||||
Total Options Written (Premiums Received $807,790) | $ | (808,860 | ) | |||||||||||||||||
(a) Exchange-Traded. | ||||||||||||||||||||
INNOVATOR POWER BUFFER STEP-UP STRATEGY ETF
Schedule of Investments | ||||
April 30, 2022 (Unaudited) |
Contracts | Notional Amount | Value | ||||||||||
PURCHASED OPTIONS - 106.66% (a)(b) | ||||||||||||
CALL OPTIONS - 97.61% | ||||||||||||
SPY SPDR S&P 500® Trust ETF, Expires 4/28/2023, Strike Price $4.10 | 246 | $ | 10,135,200 | $ | 9,888,954 | |||||||
9,888,954 | ||||||||||||
PUT OPTIONS - 9.05% | ||||||||||||
SPY SPDR S&P 500® Trust ETF, Expires 4/28/2023, Strike Price $411.99 | 246 | 10,135,200 | 916,842 | |||||||||
916,842 | ||||||||||||
TOTAL PURCHASED OPTIONS (Cost $10,806,804) | 10,805,796 | |||||||||||
SHORT TERM INVESTMENTS - 0.34% | Principal Amount | |||||||||||
Money Market Deposit Account- 0.34% | ||||||||||||
U.S. Bank Money Market Deposit Account, 0.130% (c) | $ | 34,005 | 34,005 | |||||||||
TOTAL SHORT TERM INVESTMENTS (Cost $34,005) | 34,005 | |||||||||||
Total Investments (Cost $10,840,809) - 107.00% | 10,839,801 | |||||||||||
Liabilities in Excess of Other Assets - (7.00)% | (708,967 | ) | ||||||||||
TOTAL NET ASSETS - 100.00% | $ | 10,130,834 | ||||||||||
Asset Type | % of Net Assets | |||
Purchased Options | 106.66 | % | ||
Short Term Investments | 0.34 | |||
Total Investments | 107.00 | |||
Liabilities in Excess of Other Assets | (7.00 | ) | ||
Net Assets | 100.00 | % | ||
Percentages are stated as a percent of net assets. |
(a) | Exchange-Traded. |
(b) | Purchased option contracts are held in connection with corresponding option contracts written short. |
(c) | The U.S. Bank Money Market Deposit Account (the “MMDA”) is a short-term investment vehicle in which the Fund holds cash balances. The MMDA will bear interest at a variable rate that is determined based on conditions and may change daily and by any amount. The rate shown is as of April 30, 2022. |
INNOVATOR POWER BUFFER STEP-UP STRATEGY ETF
Schedule of Options Written (a) | |||
April 30, 2022 (Unaudited) |
Description | Expiration | Strike Price | Contracts | Notional Amount | Value | |||||||||||||||
Call Options | ||||||||||||||||||||
SPY SPDR S&P 500® Trust ETF | 4/28/2023 | $ | 471.49 | 246 | $ | (10,135,200 | ) | $ | (322,014 | ) | ||||||||||
(322,014 | ) | |||||||||||||||||||
Put Options | ||||||||||||||||||||
SPY SPDR S&P 500® Trust ETF | 4/28/2023 | 350.19 | 246 | (10,135,200 | ) | (449,442 | ) | |||||||||||||
(449,442 | ) | |||||||||||||||||||
Total Options Written (Premiums Received $770,444) | $ | (771,456 | ) | |||||||||||||||||
(a) Exchange-Traded. | ||||||||||||||||||||
Statements of Assets and Liabilities
April 30, 2022 (Unaudited)
Innovator IBD® 50 ETF | Innovator IBD® Breakout Opportunities ETF | Innovator Loup Frontier Tech ETF | |||||||||||
Assets: | |||||||||||||
Investments, at value (a)(b) | $ | 195,076,439 | $ | 20,960,812 | $ | 64,414,638 | |||||||
Dividends and interest receivable | 13,861 | 20,642 | 66,247 | ||||||||||
Receivable for investments sold | 89,098,809 | - | - | ||||||||||
Securities lending income receivable | 10,359 | 484 | 1,436 | ||||||||||
Prepaid expenses | 99 | - | - | ||||||||||
Total Assets | 284,199,567 | 20,981,938 | 64,482,321 | ||||||||||
Liabilities: | |||||||||||||
Payable for fund shares redeemed | 1,671,135 | - | - | ||||||||||
Payable for collateral upon return of securities loaned | 46,996,751 | 3,548,495 | 13,811,175 | ||||||||||
Payable to Adviser | 64,282 | 11,400 | 32,587 | ||||||||||
Payable for investments purchased | 87,623,976 | - | - | ||||||||||
Payable to Trustees | 4,588 | - | - | ||||||||||
Payable to Custodian | 4,002 | - | - | ||||||||||
Accrued expenses and other liabilities | 161,380 | 35 | 7,510 | ||||||||||
Total Liabilities | 136,526,114 | 3,559,930 | 13,851,272 | ||||||||||
Net Assets | $ | 147,673,453 | $ | 17,422,008 | $ | 50,631,049 | |||||||
Net Assets Consist of: | |||||||||||||
Capital stock | $ | 420,939,103 | $ | 25,679,467 | $ | 80,456,827 | |||||||
Total distributable earnings/(accumulateddeficit) | (273,265,650 | ) | (8,257,459 | ) | (29,825,778 | ) | |||||||
Net Assets | $ | 147,673,453 | $ | 17,422,008 | $ | 50,631,049 | |||||||
Net Asset Value: | |||||||||||||
Net assets | $ | 147,673,453 | $ | 17,422,008 | $ | 50,631,049 | |||||||
Shares of beneficial interest outstanding (unlimited shares without par authorized) | 4,550,000 | 500,000 | 1,350,001 | ||||||||||
Net asset value price per share | $ | 32.46 | $ | 34.84 | $ | 37.50 | |||||||
(a) | Cost of investments | $ | 195,812,830 | $ | 21,075,447 | $ | 78,051,266 | ||||||
(b) | Including securities on loan at a value of | 17,140,654 | 3,366,900 | 13,043,384 | |||||||||
Statements of Assets and Liabilities
April 30, 2022 (Unaudited) (Continued)
Innovator S&P Investment Grade Preferred ETF | Innovator Laddered Allocation Power Buffer ETF | Innovator Laddered Allocation Buffer ETF | |||||||||||||
Assets: | |||||||||||||||
Investments, at value (a) | $ | 158,746,704 | (b) | $ | 890,877 | $ | 8,098 | ||||||||
Investments in affiliates, at value (c) | - | 102,343,455 | (b) | 11,137,133 | |||||||||||
Dividends and interest receivable | 416,937 | 10 | - | ||||||||||||
Receivable for investments sold | 5,012,405 | - | - | ||||||||||||
Securities lending income receivable | 7,198 | 3,338 | - | ||||||||||||
Total Assets | 164,183,244 | 103,237,680 | 11,145,231 | ||||||||||||
Liabilities: | |||||||||||||||
Payable for fund shares redeemed | 5,025,570 | - | - | ||||||||||||
Payable to Adviser | 64,160 | 8,248 | 762 | ||||||||||||
Distribution payable | 702,000 | - | - | ||||||||||||
Payable for collateral upon return of securities loaned | 6,033,675 | 720,700 | - | ||||||||||||
Total Liabilities | 11,825,405 | 728,948 | 762 | ||||||||||||
Net Assets | $ | 152,357,839 | $ | 102,508,732 | $ | 11,144,469 | |||||||||
Net Assets Consist of: | |||||||||||||||
Capital stock | $ | 189,142,972 | $ | 141,281,804 | $ | 11,750,120 | |||||||||
Total distributable earnings/(accumulated deficit) | (36,785,133 | ) | (38,773,072 | ) | (605,651 | ) | |||||||||
Net Assets | $ | 152,357,839 | $ | 102,508,732 | $ | 11,144,469 | |||||||||
Net Asset Value: | |||||||||||||||
Net assets | $ | 152,357,839 | $ | 102,508,732 | $ | 11,144,469 | |||||||||
Shares of beneficial interest outstanding (unlimited shares without parauthorized) | 7,600,000 | 3,000,000 | 475,000 | ||||||||||||
Net asset value price per share | $ | 20.05 | $ | 34.17 | $ | 23.46 | |||||||||
(a) | Cost of investments | $ | 186,471,034 | $ | 890,877 | $ | 8,098 | ||||||||
(b) | Including securities on loan at a value of | 5,816,728 | 689,434 | - | |||||||||||
(c) | Cost of investments in affiliates | - | 102,902,237 | 11,740,515 | |||||||||||
Statements of Assets and Liabilities
April 30, 2022 (Unaudited) (Continued)
Innovator Buffer Step-Up Strategy ETF | Innovator Power Buffer Step-Up Strategy ETF | |||||||
Assets: | ||||||||
Investments, at value (a) | $ | 11,505,515 | $ | 10,839,801 | ||||
Interest receivable | 5 | 3 | ||||||
Receivable for investments sold | 12,363,228 | 9,585,462 | ||||||
Receivable for fund shares sold | - | 1,900,035 | ||||||
ETF variable fee receivable | - | 950 | ||||||
Total Assets | 23,868,748 | 22,326,251 | ||||||
Liabilities: | ||||||||
Payable to Adviser | 5,612 | 5,521 | ||||||
Payable for investments purchased | 12,395,437 | 11,418,440 | ||||||
Options written, at value (b) | 808,860 | 771,456 | ||||||
Total Liabilities | 13,209,909 | 12,195,417 | ||||||
Net Assets | $ | 10,658,839 | $ | 10,130,834 | ||||
Net Assets Consist of: | ||||||||
Capital stock | $ | 10,865,165 | $ | 10,274,865 | ||||
Total distributable earnings/(accumulated deficit) | (206,326 | ) | (144,031 | ) | ||||
Net Assets | $ | 10,658,839 | $ | 10,130,834 | ||||
Net Asset Value: | ||||||||
Net assets | $ | 10,658,839 | $ | 10,130,834 | ||||
Shares of beneficial interest outstanding (unlimted shares without par value authorized) | 425,000 | 400,000 | ||||||
Net asset value price per share | $ | 25.08 | $ | 25.33 | ||||
(a) Cost of investments | $ | 11,506,580 | $ | 10,840,809 | ||||
(b) Premiums received | 807,790 | 770,444 | ||||||
Statements of Operations
For the Period Ended April 30, 2022 (Unaudited)
Innovator IBD® 50 ETF | Innovator IBD® Breakout Opportunities ETF | Innovator Loup Frontier Tech ETF | ||||||||||
Investment Income: | ||||||||||||
Dividends | $ | 2,123,615 | $ | 99,570 | $ | 176,674 | ||||||
Less: Foreign witholding taxes and issuance fees | (343,530 | ) | (987 | ) | (21,039 | ) | ||||||
Interest | 65 | 10 | 71 | |||||||||
Securities lending income, net | 297,609 | 1,928 | 6,642 | |||||||||
Total Investment Income | 2,077,759 | 100,521 | 162,348 | |||||||||
Expenses: | ||||||||||||
Investment advisory fee | 732,949 | 67,687 | 238,063 | |||||||||
Professional fees | 26,420 | - | - | |||||||||
Administration fees | 36,363 | - | - | |||||||||
Fund accounting fees | 813 | - | - | |||||||||
Trustees fees and expenses | 7,608 | - | - | |||||||||
Printing and mailing expenses | 14,293 | - | - | |||||||||
Custody fees | 8,471 | - | - | |||||||||
Insurance expense | 1,810 | - | - | |||||||||
Registration fees | 552 | - | - | |||||||||
Other expenses | 183,483 | - | - | |||||||||
Total Expenses Before Expense Limitation | 1,012,762 | 67,687 | 238,063 | |||||||||
Net advisory recoupment/(waivers)(see Note 3) | (175,106 | ) | - | - | ||||||||
Net Expenses | 837,656 | 67,687 | 238,063 | |||||||||
Net Investment Income/(Loss) | 1,240,103 | 32,834 | (75,715 | ) | ||||||||
Realized & Unrealized Gain/(Loss): | ||||||||||||
Net realized gain/(loss) on: | ||||||||||||
Investments and foreign currency transactions | (65,780,223 | ) | (1,969,927 | ) | (9,368,073 | ) | ||||||
Redemptions sold in-kind on investments | 7,975,531 | 1,597,390 | 3,000,469 | |||||||||
Net change in unrealized appreciation/(depreciation) on: | ||||||||||||
Investments and translation of foreign currency | (33,596,923 | ) | (709,002 | ) | (19,178,974 | ) | ||||||
Net Realized and Unrealized Gain/(Loss) | (91,401,615 | ) | (1,081,539 | ) | (25,546,578 | ) | ||||||
Net Increase/(Decrease) in Net Assets Resulting From Operations | $ | (90,161,512 | ) | $ | (1,048,705 | ) | $ | (25,622,293 | ) | |||
Statements of Operations
For the Period Ended April 30, 2022 (Unaudited) (Continued)
Innovator S&P Investment Grade Preferred ETF | Innovator Laddered Allocation Power Buffer ETF | Innovator Laddered Allocation Buffer ETF | ||||||||||
Investment Income: | ||||||||||||
Dividends | $ | 4,823,380 | $ | - | $ | - | ||||||
Interest | 80 | 15 | 1 | |||||||||
Securities lending income, net | 86,314 | 25,665 | - | |||||||||
Total Investment Income | 4,909,774 | 25,680 | 1 | |||||||||
Expenses: | ||||||||||||
Investment advisory fee | 461,387 | 84,789 | 2,324 | |||||||||
Total Expenses Before Expense Limitation | 461,387 | 84,789 | 2,324 | |||||||||
Net advisory recoupment/(waivers)(see Note 3) | - | (20,851 | ) | (1,162 | ) | |||||||
Net Expenses | 461,387 | 63,938 | 1,162 | |||||||||
Net Investment Income/(Loss) | 4,448,387 | (38,258 | ) | (1,161 | ) | |||||||
Realized & Unrealized Gain/(Loss): | ||||||||||||
Net realized gain/(loss) on: | ||||||||||||
Investments | (3,750,667 | ) | - | - | ||||||||
Redemptions sold in-kind on investments | (1,242,796 | ) | - | - | ||||||||
Redemptions sold in-kind on affiliates | - | 505,266 | - | |||||||||
Investments in affiliates | - | (3,866 | ) | (1,108 | ) | |||||||
Net change in unrealized appreciation/(depreciation) on: | ||||||||||||
Investments | (30,781,638 | ) | - | - | ||||||||
Investments in affiliates | - | (4,483,763 | ) | (603,382 | ) | |||||||
Net Realized and Unrealized Gain/(Loss) | (35,775,101 | ) | (3,982,363 | ) | (604,490 | ) | ||||||
Net Increase/(Decrease) in Net Assets Resulting From Operations | $ | (31,326,714 | ) | $ | (4,020,621 | ) | $ | (605,651 | ) | |||
Statements of Operations
For the Period Ended April 30, 2022 (Unaudited) (Continued)
Innovator Buffer Step-Up Strategy ETF | (a) | Innovator Power Buffer Step-Up Strategy ETF | |||||||
Investment Income: | |||||||||
Interest | $ | 6 | $ | 4 | |||||
Total Investment Income | 6 | 4 | |||||||
Expenses: | |||||||||
Investment advisory fee | $ | 7,432 | 7,339 | ||||||
Total Expenses | 7,432 | 7,339 | |||||||
Net Investment Income/(Loss) | (7,426 | ) | (7,335 | ) | |||||
Realized & Unrealized Gain/(Loss): | |||||||||
Net realized gain/(loss) on: | |||||||||
Investments | (365,713 | ) | (357,943 | ) | |||||
Redemptions sold in-kind on investments | 226,630 | 217,583 | |||||||
Redemptions sold in-kind on options written | 58,587 | 105,652 | |||||||
Options written | (116,269 | ) | (99,968 | ) | |||||
Net change in unrealized appreciation/(depreciation) on: | |||||||||
Investments | (1,065 | ) | (1,008 | ) | |||||
Options written | (1,070 | ) | (1,012 | ) | |||||
Net Realized and Unrealized Gain/(Loss) on Investments and Options Written | (198,900 | ) | (136,696 | ) | |||||
Net Increase/(Decrease) in Net Assets Resulting From Operations | $ | (206,326 | ) | $ | (144,031 | ) | |||
(a) Since Commencement of Operations on March 7, 2022. | |||||||||
Statements of Changes in Net Assets
Innovator IBD® 50 ETF | ||||||||
Period Ended | Year Ended | |||||||
April 30, 2022 | October 31, 2021 | |||||||
(Unaudited) | ||||||||
Operations: | ||||||||
Net investment income/(loss) | $ | 1,240,103 | $ | 516,414 | ||||
Net realized gain/(loss) | (57,804,692 | ) | 47,870,932 | |||||
Net change in unrealized appreciation/(depreciation) | (33,596,923 | ) | 21,260,902 | |||||
Net Increase/(Decrease) in Net Assets Resulting from Operations | (90,161,512 | ) | 69,648,248 | |||||
Distributions to Shareholders: | ||||||||
Net distributions to shareholders | (520,522 | ) | - | |||||
Capital Share Transactions: | ||||||||
Proceeds from shares sold | 29,823,025 | 327,062,865 | ||||||
Cost of shares redeemed | (65,832,345 | ) | (303,970,475 | ) | ||||
Transaction fees (see Note 5) | - | 30 | ||||||
Net Increase/(Decrease) in Net Assets from Capital Share Transactions | (36,009,320 | ) | 23,092,420 | |||||
Total Increase/(Decrease) in Net Assets | $ | (126,691,354 | ) | $ | 92,740,668 | |||
Net Assets: | ||||||||
Beginning of period | $ | 274,364,807 | $ | 181,624,139 | ||||
End of period | $ | 147,673,453 | $ | 274,364,807 | ||||
Change in Shares Outstanding: | ||||||||
Shares sold | 600,000 | 7,100,000 | ||||||
Shares redeemed | (1,500,000 | ) | (6,700,000 | ) | ||||
Net Increase/(Decrease) | (900,000 | ) | 400,000 | |||||
Innovator IBD® Breakout Opportunities ETF | Innovator Loup Frontier Tech ETF | ||||||||||||||
Period Ended | Year Ended | Period Ended | Year Ended | ||||||||||||
April 30, 2022 | October 31, 2021 | April 30, 2022 | October 31, 2021 | ||||||||||||
(Unaudited) | (Unaudited) | ||||||||||||||
$ | 32,834 | $ | (10,940 | ) | $ | (75,715 | ) | $ | (198,576 | ) | |||||
(372,537 | ) | 1,869,422 | (6,367,604 | ) | 8,185,639 | ||||||||||
(709,002 | ) | 777,977 | (19,178,974 | ) | 2,224,157 | ||||||||||
(1,048,705 | ) | 2,636,459 | (25,622,293 | ) | 10,211,220 | ||||||||||
- | - | - | - | ||||||||||||
24,594,235 | 75,836,535 | 8,466,170 | 107,818,940 | ||||||||||||
(20,730,590 | ) | (69,749,030 | ) | (10,641,485 | ) | (56,415,275 | ) | ||||||||
- | - | 579 | 7,950 | ||||||||||||
3,863,645 | 6,087,505 | (2,174,736 | ) | 51,411,615 | |||||||||||
$ | 2,814,940 | $ | 8,723,964 | $ | (27,797,029 | ) | $ | 61,622,835 | |||||||
$ | 14,607,068 | $ | 5,883,104 | $ | 78,428,078 | $ | 16,805,243 | ||||||||
$ | 17,422,008 | $ | 14,607,068 | $ | 50,631,049 | $ | 78,428,078 | ||||||||
650,000 | 2,200,000 | 150,000 | 2,000,000 | ||||||||||||
(550,000 | ) | (2,050,000 | ) | (200,000 | ) | (1,050,000 | ) | ||||||||
100,000 | 150,000 | (50,000 | ) | 950,000 | |||||||||||
Statements of Changes in Net Assets
Innovator S&P Investment Grade Preferred ETF | ||||||||
Period Ended | Year Ended | |||||||
April 30, 2022 | October 31, 2021 | |||||||
(Unaudited) | ||||||||
Operations: | ||||||||
Net investment income/(loss) | $ | 4,448,387 | $ | 9,317,728 | ||||
Net realized gain/(loss) | (4,993,463 | ) | (1,078,724 | ) | ||||
Net change in unrealized appreciation/(depreciation) | (30,781,638 | ) | 2,353,258 | |||||
Net Increase/(Decrease) in Net Assets Resulting from Operations | (31,326,714 | ) | 10,592,262 | |||||
Distributions to Shareholders: | ||||||||
Distributions to shareholders | (4,289,318 | ) | (9,442,181 | ) | ||||
Distributions from return of capital | - | (570,855 | ) | |||||
Net distributions to shareholders | (4,289,318 | ) | (10,013,036 | ) | ||||
Capital Share Transactions: | ||||||||
Proceeds from shares sold | 1,214,505 | 111,812,865 | ||||||
Cost of shares redeemed | (36,034,330 | ) | (16,913,660 | ) | ||||
Net Increase/(Decrease) in Net Assets from Capital Share Transactions | (34,819,825 | ) | 94,899,205 | |||||
Total Increase/(Decrease) in Net Assets | $ | (70,435,857 | ) | $ | 95,478,431 | |||
Net Assets: | ||||||||
Beginning of period | $ | 222,793,696 | $ | 127,315,265 | ||||
End of period | $ | 152,357,839 | $ | 222,793,696 | ||||
Change in Shares Outstanding: | ||||||||
Shares sold | 50,000 | 4,600,000 | ||||||
Shares redeemed | (1,650,000 | ) | (700,000 | ) | ||||
Net Increase/(Decrease) | (1,600,000 | ) | 3,900,000 | |||||
(a) Since Commencement of Operations on February 8, 2022.
Innovator Laddered Allocation Power Buffer ETF | Innovator Laddered Allocation Buffer ETF | |||||||||||
Period Ended | Year Ended | Period Ended | ||||||||||
April 30, 2022 | October 31, 2021 | April 30, 2022 | ||||||||||
(Unaudited) | (Unaudited) | (a) | ||||||||||
$ | (38,258 | ) | $ | (73,125 | ) | $ | (1,161 | ) | ||||
501,400 | 1,314,917 | (1,108 | ) | |||||||||
| (4,483,763 | ) | 4,326,731 | (603,382 | ) | |||||||
| (4,020,621 | ) | 5,568,523 | (605,651 | ) | |||||||
- | - | - | ||||||||||
- | - | - | ||||||||||
- | - | - | ||||||||||
42,534,720 | 62,212,670 | 11,750,120 | ||||||||||
(5,342,801 | ) | (26,781,995 | ) | - | ||||||||
| 37,191,919 | 35,430,675 | 11,750,120 | |||||||||
$ | 33,171,298 | $ | 40,999,198 | $ | 11,144,469 | |||||||
$ | 69,337,434 | $ | 28,338,236 | $ | - | |||||||
$ | 102,508,732 | $ | 69,337,434 | $ | 11,144,469 | |||||||
1,200,000 | 1,850,000 | 475,000 | ||||||||||
(150,000 | ) | (800,000 | ) | - | ||||||||
1,050,000 | 1,050,000 | 475,000 | ||||||||||
Statements of Changes in Net Assets
|
Operations: |
Net investment income/(loss) |
Net realized gain/(loss) |
Net change in unrealized appreciation/(depreciation) |
Net Increase/(Decrease) in Net Assets Resulting from Operations |
Capital Share Transactions: |
Proceeds from shares sold |
Cost of shares redeemed |
Transaction fees (see Note 5) |
Net Increase/(Decrease) in Net Assets from Capital Share Transactions |
Total Increase/(Decrease) in Net Assets |
Net Assets: |
Beginning of period |
End of period |
Change in Shares Outstanding: |
Shares sold |
Shares redeemed |
Net Increase/(Decrease) |
(a) Since Commencement of Operations on March 7, 2022. |
Innovator Buffer Step-Up Strategy ETF | Innovator Power Buffer Step-Up Strategy ETF | |||||||||
Period Ended | Period Ended | |||||||||
April 30, 2022 | (a) | April 30, 2022 | (a) | |||||||
(Unaudited) | (Unaudited) | |||||||||
$ | (7,426 | ) | $ | (7,335 | ) | |||||
(196,765 | ) | (134,676 | ) | |||||||
(2,135 | ) | (2,020 | ) | |||||||
(206,326 | ) | (144,031 | ) | |||||||
20,593,085 | 19,389,245 | |||||||||
(9,732,825 | ) | (9,119,610 | ) | |||||||
4,905 | 5,230 | |||||||||
10,865,165 | 10,274,865 | |||||||||
$ | 10,658,839 | $ | 10,130,834 | |||||||
$ | - | $ | - | |||||||
$ | 10,658,839 | $ | 10,130,834 | |||||||
800,000 | 750,000 | |||||||||
(375,000 | ) | (350,000 | ) | |||||||
425,000 | 400,000 | |||||||||
Financial Highlights |
| Per Share Operating Performance (For a share outstanding throughout | ||||||||||||||||||||||
Investment Operations: | Capital Share Transactions: | |||||||||||||||||||||
Net Asset Value, Beginning of Period | Net investment income/(loss) (i) | Net realized and unrealized gain/(loss) | Total From Investment Operations | Transaction fees (see Note 5) | ||||||||||||||||||
Innovator IBD® 50 ETF | ||||||||||||||||||||||
For the period ended 4/30/2022 | $ | 50.34 | 0.24 | (18.02 | ) | (17.78 | ) | - | ||||||||||||||
For the year ended 10/31/2021 | $ | 35.97 | 0.10 | 14.27 | 14.37 | - | (f) | |||||||||||||||
For the year ended 10/31/2020 | $ | 33.17 | 0.04 | 2.76 | 2.80 | - | ||||||||||||||||
For the year ended 10/31/2019 | $ | 31.24 | (0.07 | ) | 2.00 | 1.93 | - | (f) | ||||||||||||||
For the year ended 10/31/2018 | $ | 33.34 | (0.12 | ) | (1.92 | ) | (2.04 | ) | - | (f) | ||||||||||||
For the period ended 10/31/2017 (e) | $ | 23.95 | 0.03 | 9.36 | 9.39 | - | ||||||||||||||||
For the year ended 11/30/2016 | $ | 23.54 | (0.06 | ) | 0.47 | 0.41 | - | |||||||||||||||
Innovator IBD® Breakout Opportunities ETF | ||||||||||||||||||||||
For the period ended 4/30/2022 | $ | 36.52 | 0.07 | (1.75 | ) | (1.68 | ) | - | ||||||||||||||
For the year ended 10/31/2021 | $ | 23.53 | (0.02 | ) | 13.01 | 12.99 | - | |||||||||||||||
For the year ended 10/31/2020 | $ | 19.44 | (0.03 | ) | 4.12 | 4.09 | - | |||||||||||||||
For the year ended 10/31/2019 | $ | 20.26 | - | (f) | (0.78 | ) | (0.78 | ) | - | (f) | ||||||||||||
For the period 9/12/2018 (d) - 10/31/2018 | $ | 25.00 | (0.01 | ) | (4.73 | ) | (4.74 | ) | - | |||||||||||||
Innovator Loup Frontier Tech ETF | ||||||||||||||||||||||
For the period ended 4/30/2022 | $ | 56.02 | (0.05 | ) | (18.47 | ) | (18.52 | ) | - | (f) | ||||||||||||
For the year ended 10/31/2021 | $ | 37.34 | (0.14 | ) | 18.81 | 18.67 | 0.01 | |||||||||||||||
For the year ended 10/31/2020 | $ | 23.70 | (0.09 | ) | 13.73 | 13.64 | - | (f) | ||||||||||||||
For the year ended 10/31/2019 | $ | 22.77 | (0.02 | ) | 0.95 | 0.93 | - | |||||||||||||||
For the period 7/24/2018 (d) - 10/31/2018 | $ | 25.00 | (0.01 | ) | (2.22 | ) | (2.23 | ) | - | (f) | ||||||||||||
(a) | Annualized for periods less than one year. |
(b) | Not annualized for periods less than one year. |
(c) | Does not include the impact of the expenses of the underlying funds in which the Fund invests. |
(d) | Commencement of operations. |
(e) | The period ended October 31, 2017 consists of eleven months due to the Fund's fiscal year end change. |
(f) | Amount represents less than $0.01 per share. |
(g) | Excludes in-kind transactions associated with creations and redemptions of the Funds. |
(h) | Recognition of net investment income by the Funds are affected by the timing of the declaration of dividends by the underlying investment companies in which the Funds invest. This ratio does not include net investment income of the underlying investment companies in which the Funds invest. |
(i) | Net investment income/(loss) per share has been calculated based on average shares outstanding during the period. |
| each period) | Ratios/Supplemental Data: | ||||||||||||||||||||||||||||||||
Distributions Paid to Shareholders: | Ratio to Average Net Assets of: (a) | ||||||||||||||||||||||||||||||||
Paid from net investment income | Change in Net Asset Value for the Period | Net Asset Value, End of Period | Total return (b) | Net assets, end of period (000) | Expenses, before waivers/ | Expenses, net of waivers/ | Net investment income/(loss) (h) | Portfolio turnover rate (b)(g) | |||||||||||||||||||||||||
| (0.10 | ) | (17.88 | ) | $ | 32.46 | (35.37 | )% | $ | 147,673 | 0.97 | % | 0.80 | % | 1.18 | % | 929 | % | ||||||||||||||||
| - | 14.37 | $ | 50.34 | 39.95 | % | $ | 274,365 | 0.93 | % | 0.80 | % | 0.22 | % | 1,133 | % | ||||||||||||||||||
| - | 2.80 | $ | 35.97 | 8.42 | % | $ | 181,624 | 0.90 | % | 0.80 | % | 0.12 | % | 974 | % | ||||||||||||||||||
| - | 1.93 | $ | 33.17 | 6.20 | % | $ | 326,748 | 0.78 | % | 0.80 | % | (0.21 | )% | 786 | % | ||||||||||||||||||
| (0.06 | ) | (2.10 | ) | $ | 31.24 | (6.15 | )% | $ | 440,451 | 0.84 | % | 0.80 | % | (0.43 | )% | 719 | % | ||||||||||||||||
| - | 9.39 | $ | 33.34 | 39.17 | % | $ | 181,710 | 1.03 | % | 0.80 | % | (0.24 | )% | 501 | % | ||||||||||||||||||
| - | 0.41 | $ | 23.95 | 1.78 | % | $ | 35,931 | 1.13 | % | 0.80 | % | (0.14 | )% | 1,041 | % | ||||||||||||||||||
| - | (1.68 | ) | $ | 34.84 | (4.58 | )% | $ | 17,422 | 0.80 | % | 0.80 | % | 0.39 | % | 784 | % | |||||||||||||||||
| - | 12.99 | $ | 36.52 | 55.18 | % | $ | 14,607 | 0.80 | % | 0.80 | % | (0.07 | )% | 1,846 | % | ||||||||||||||||||
| - | 4.09 | $ | 23.53 | 21.04 | % | $ | 5,883 | 0.80 | % | 0.80 | % | (0.12 | )% | 1,637 | % | ||||||||||||||||||
| (0.04 | ) | (0.82 | ) | $ | 19.44 | (3.84 | )% | $ | 7,777 | 0.80 | % | 0.80 | % | 0.02 | % | 1,777 | % | ||||||||||||||||
| - | (4.74 | ) | $ | 20.26 | (18.95 | )% | $ | 8,105 | 0.80 | % | 0.80 | % | (0.38 | )% | 289 | % | |||||||||||||||||
| - | (18.52 | ) | $ | 37.50 | (33.05 | )% | $ | 50,631 | 0.70 | % | 0.70 | % | (0.22 | )% | 69 | % | |||||||||||||||||
| - | 18.68 | $ | 56.02 | 50.01 | % | $ | 78,428 | 0.70 | % | 0.70 | % | (0.27 | )% | 134 | % | ||||||||||||||||||
| - | 13.64 | $ | 37.34 | 57.59 | % | $ | 16,805 | 0.70 | % | 0.70 | % | (0.32 | )% | 97 | % | ||||||||||||||||||
| - | 0.93 | $ | 23.70 | 4.07 | % | $ | 10,664 | 0.70 | % | 0.70 | % | (0.07 | )% | 107 | % | ||||||||||||||||||
| - | (2.23 | ) | $ | 22.77 | (8.92 | )% | $ | 12,524 | 0.70 | % | 0.70 | % | (0.23 | )% | 53 | % | |||||||||||||||||
Financial Highlights |
| Per Share Operating Performance (For a share | ||||||||||||||||||||||
Investment Operations: | Capital Share Transactions: | |||||||||||||||||||||
Net Asset Value, Beginning of Period | Net investment income/ | Net realized and unrealized gain/(loss) | Total From Investment Operations | Transaction fees (see | ||||||||||||||||||
Innovator S&P Investment Grade Preferred ETF | ||||||||||||||||||||||
For the period ended 4/30/2022 | $ | 24.22 | 0.51 | (4.18 | ) | (3.67 | ) | - | ||||||||||||||
For the year ended 10/31/2021 | $ | 24.02 | 1.14 | 0.27 | (i) | 1.41 | - | |||||||||||||||
For the year ended 10/31/2020 | $ | 24.11 | 1.23 | (0.07 | ) | 1.16 | - | (k) | ||||||||||||||
For the period 4/1/2019 (h) - 10/31/2019 | $ | 23.18 | 0.67 | 0.93 | 1.60 | - | ||||||||||||||||
For the year ended 3/31/2019 | $ | 23.38 | 1.18 | (0.18 | ) | 1.00 | - | |||||||||||||||
For the year ended 3/31/2018 | $ | 24.06 | 1.29 | (0.57 | ) | 0.72 | - | |||||||||||||||
For the period 5/23/2016 (f) - 3/31/2017 | $ | 25.07 | 1.21 | (1.17 | ) | 0.04 | - | |||||||||||||||
Innovator Laddered Power Buffer ETF | ||||||||||||||||||||||
For the period ended 4/30/2022 | $ | 35.56 | (0.02 | ) | (1.37 | ) | (1.39 | ) | - | |||||||||||||
For the year ended 10/31/2021 | $ | 31.49 | (0.05 | ) | 4.12 | 4.07 | - | |||||||||||||||
For the year ended 10/31/2020 | $ | 36.66 | 0.81 | (5.26 | ) | (4.45 | ) | - | ||||||||||||||
For the period 10/1/2019 (d) - 10/31/2019 | $ | 36.81 | 0.02 | (0.17 | ) | (0.15 | ) | - | ||||||||||||||
For the year ended 9/30/2019 | $ | 31.55 | 0.66 | 5.29 | 5.95 | - | ||||||||||||||||
For the year ended 9/30/2018 | $ | 31.23 | 0.47 | 0.32 | (i) | 0.79 | - | |||||||||||||||
For the period 10/19/2016 (f) - 9/30/2017 | $ | 25.36 | 0.47 | 5.82 | 6.29 | - | ||||||||||||||||
Innovator Laddered Buffer ETF | ||||||||||||||||||||||
For the period 2/8/2022 (f) - 4/30/2022 | $ | 24.89 | (0.01 | ) | (1.42 | ) | (1.43 | ) | - | |||||||||||||
(a) | Annualized for periods less than one year. |
(b) | Not annualized for periods less than one year. |
(c) | Net investment income/(loss) per share has been calculated based on average shares outstanding during the period. |
(d) | The period ended October 31, 2019 consists of one month due to the Fund's fiscal year end change. |
(e) | Excludes in-kind transactions associated with creations and redemptions of the Funds. |
(f) | Commencement of operations. |
(g) | The ratio of net expenses to average net assets includes tax expense of 0.01%. |
(h) | The period ended October 31, 2019 consists of seven months due to the Fund's fiscal year end change. |
(i) | Net realized and unrealized gain/(loss) per share includes balancing amounts necessary to reconcile the change in net asset value per share for the period, and may not reconcile with the aggregate gain/(loss) in the Statement of Operations due to: transactions for the period. |
(j) | The ratio of net expenses to average net assets includes interest expense fees of 0.03%. |
(k) | Amount represents less than $0.01 per share. |
(l) | Does not include the impact of the expenses of the underlying funds in which the Funds invest. |
(m) | Recognition of net investment income by the Funds are affected by the timing of the declaration of dividends by the underlying investment companies in which the Funds invest. This ratio does not include net investment income of the underlying investment companies in which the Funds invest. |
| outstanding throughout each period) | Ratios/Supplemental Data: | ||||||||||||||||||||||||||||||||||||||||
Distributions Paid to Shareholders: | Ratio to Average Net Assets of: (a) |
| |||||||||||||||||||||||||||||||||||||||
Paid from net investment income | Paid from return of capital | Total Distributions Paid | Change in Net Asset Value for the Period | Net Asset Value, End of Period | Total return (b) | Net assets, end of period (000) | Expenses, before waivers/ | Expenses, net of waivers/ | Net investment income/(loss) (m) | Portfolio turnover rate (b)(e) | |||||||||||||||||||||||||||||||
|
| ||||||||||||||||||||||||||||||||||||||||
(0.50 | ) | - | (0.50 | ) | (4.17 | ) | $ | 20.05 | (15.33 | )% | $ | 152,358 | 0.47 | % | 0.47 | % | 4.53 % | 21 % | |||||||||||||||||||||||
(1.14 | ) | (0.07 | ) | (1.21 | ) | 0.20 | $ | 24.22 | 5.97 | % | $ | 222,794 | 0.47 | % | 0.47 | % | 4.70 % | 68 % | |||||||||||||||||||||||
(1.25 | ) | - | (1.25 | ) | (0.09 | ) | $ | 24.02 | 5.04 | % | $ | 127,315 | 0.47 | % | 0.47 | % | 5.15 % | 58 % | |||||||||||||||||||||||
| (0.67 | ) | - | (0.67 | ) | 0.93 | $ | 24.11 | 6.93 | % | $ | 19,288 | 0.47 | % | 0.47 | % | 4.75 % | 34 % | |||||||||||||||||||||||
(1.20 | ) | - | (1.20 | ) | (0.20 | ) | $ | 23.18 | 4.54 | % | $ | 13,911 | 0.47 | % | 0.47 | % | 5.12 % | 58 % | |||||||||||||||||||||||
(1.36 | ) | (0.04 | ) | (1.40 | ) | (0.68 | ) | $ | 23.38 | 2.98 | % | $ | 19,870 | 0.47 | % | 0.47 | % | 5.39 % | 67 % | ||||||||||||||||||||||
(1.05 | ) | - | (1.05 | ) | (1.01 | ) | $ | 24.06 | 0.18 | % | $ | 12,030 | 0.48 | % | (g) | 0.48 | % | (g) | 5.86 % | 171 % | |||||||||||||||||||||
| |||||||||||||||||||||||||||||||||||||||||
| |||||||||||||||||||||||||||||||||||||||||
- | - | - | (1.39 | ) | $ | 34.17 | -3.90 | % | $ | 102,509 | 0.20 | % | 0.15 | % | (0.09)% | 1 % | |||||||||||||||||||||||||
- | - | - | 4.07 | $ | 35.56 | 12.93 | % | $ | 69,337 | 0.20 | % | 0.20 | % | (0.14)% | 1 % | ||||||||||||||||||||||||||
(0.72 | ) | - | (0.72 | ) | (5.17 | ) | $ | 31.49 | (11.93 | )% | $ | 28,338 | 0.47 | % | 0.47 | % | 2.47 % | 750 % | |||||||||||||||||||||||
| - | - | - | (0.15 | ) | $ | 36.66 | (0.42 | )% | $ | 137,463 | 0.49 | % | 0.49 | % | 0.63 % | 0 % | ||||||||||||||||||||||||
(0.69 | ) | - | (0.69 | ) | 5.26 | $ | 36.81 | 19.11 | % | $ | 136,195 | 0.49 | % | 0.49 | % | 2.00 % | 44 % | ||||||||||||||||||||||||
(0.47 | ) | - | (0.47 | ) | 0.32 | $ | 31.55 | 2.55 | % | $ | 162,484 | 0.52 | % | (j) | 0.52 | % | (j) | 1.47 % | 667 % | ||||||||||||||||||||||
| (0.42 | ) | - | (0.42 | ) | 5.87 | $ | 31.23 | 24.88 | % | $ | 134,301 | 0.49 | % | 0.49 | % | 1.66 % | 179 % | |||||||||||||||||||||||
| |||||||||||||||||||||||||||||||||||||||||
| |||||||||||||||||||||||||||||||||||||||||
- | - | - | (1.43 | ) | $ | 23.46 | (5.74 | )% | $ | 11,144 | 0.20 | % | 0.10 | % | (0.10)% | 1 % | |||||||||||||||||||||||||
Financial Highlights
Per Share Operating Performance (For a share outstanding throughout each period) |
Investment Operations: | Capital Share Transactions: | |||||||||||||||||||
Net Asset Value, Beginning of Period | Net investment income/(loss) (c) | Net realized and unrealized gain/(loss) | Total From Investment Operations | Transaction fees (see Note 5) | ||||||||||||||||
Innovator Buffer Step-Up Strategy ETF | ||||||||||||||||||||
For the period 3/7/2022(d) - 4/30/2022 | $ | 25.48 | (0.03 | ) | (0.39 | ) | (0.42 | ) | 0.02 | |||||||||||
Innovator Power Buffer Step-Up Strategy ETF | ||||||||||||||||||||
For the period 3/7/2022(d) - 4/30/2022 | $ | 25.67 | (0.03 | ) | (0.33 | ) | (0.36 | ) | 0.02 | |||||||||||
(a) Annualized for periods less than one year. |
(b) Not annualized for periods less than one year. |
(c) Net investment income/(loss) per share has been calculated based on average shares outstanding during the period. |
(d) Commencement of operations. |
| Ratios/Supplemental Data: | |||||||||||||||||||||||||
Ratio to Average Net Assets of: (a) | |||||||||||||||||||||||||
Change in Net Asset Value for the Period | Net Asset Value, End of Period | Total return (b) | Net assets, end of period (000) | Expenses | Net investment income/(loss) | Portfolio turnover rate (b) | |||||||||||||||||||
| (0.40 | ) | $ | 25.08 | (1.53 | )% | $ | 10,659 | 0.89 | % | (0.89 | )% | 0 | % | ||||||||||||
| (0.34 | ) | $ | 25.33 | (1.31 | )% | $ | 10,131 | 0.89 | % | (0.89 | )% | 0 | % | ||||||||||||
Notes to Financial Statements (Unaudited)
1. | ORGANIZATION |
Innovator ETFs Trust (the “Trust”) was organized under Delaware law as a Delaware statutory trust on October 17, 2007, and is registered with the Securities and Exchange Commission (“SEC”) under the Investment Company Act of 1940, as amended (the “1940 Act”) as an open–end management investment company. Effective February 9, 2022, BUFF’s name was changed from Innovator Laddered Fund of U.S. Equity Power Buffer ETFs to Innovator Laddered Allocation Power Buffer ETF. The Trust currently consists of multiple operational series, of which eight are covered in this report, collectively the (“Funds”):
Name | Ticker | Commencement of Operations | Tracking Index (a) | |||
Innovator IBD® 50 ETF | FFTY | April 8, 2015 | IBD® 50 Index | |||
Innovator IBD® Breakout Opportunities ETF | BOUT | September 12, 2018 | IBD® Breakout Stocks Index | |||
Innovator Loup Frontier Tech ETF | LOUP | July 24, 2018 | Loup Frontier Tech Index | |||
Innovator S&P Investment Grade Preferred ETF | EPRF | May 23, 2016 | S&P U.S. High Quality Preferred Stock Index | |||
Innovator Laddered Allocation Power Buffer ETF (b) | BUFF | October 19, 2016 | Refinitiv Laddered Power Buffer Strategy Index | |||
Innovator Laddered Allocation Buffer ETF (c) | BUFB | February 8, 2022 | MerQube U.S. Large Cap Equity Buffer Laddered Index | |||
Innovator Buffer Step-Up Strategy ETF | BSTP | March 7, 2022 | SPDR S&P 500® ETF Trust | |||
Innovator Power Buffer Step-Up Strategy ETF | PSTP | March 7, 2022 | SPDR S&P 500® ETF Trust |
(a) Each Fund individually seeks to track their respective index, before fees and expenses. |
(b) BUFF seeks to achieve its investment objective by investing primarily in other Innovator ETFs (Affiliated Fund of Fund structure) that themselves seek investment results corresponding to their own respective underlying indexes. In addition to its own fees and expenses, BUFF will pay indirectly a proportional share of the fees and expenses of the underlying Innovator ETFs in which it invests, including advisory and administration fees (Acquired Fund Fees and Expenses). Prior to August 11, 2020, BUFF sought investment results that generally corresponded, before fees and expenses, to the Lunt Capital U.S. Large Cap Equity Rotation Index. |
(c) BUFB seeks to achieve its investment objective by investing primarily in other Innovator ETFs (Affiliated Fund of Fund structure) that themselves seek investment results corresponding to their own respective underlying indexes. In addition to its own fees and expenses, BUFB will pay indirectly a proportional share of the fees and expenses of the underlying Innovator ETFs in which it invests, including advisory and administration fees (Acquired Fund Fees and Expenses). |
The operational series of the Trust covered outside of this report consist of:
Name | Ticker | Commencement of Operations | Tracking Fund | |||
Innovator U.S. Equity Buffer ETF – January | BJAN | December 31, 2018 | SPDR S&P 500® ETF Trust | |||
Innovator U.S. Equity Buffer ETF – February | BFEB | January 31, 2020 | SPDR S&P 500® ETF Trust | |||
Innovator U.S. Equity Buffer ETF – March | BMAR | February 28, 2020 | SPDR S&P 500® ETF Trust | |||
Innovator U.S. Equity Buffer ETF – April | BAPR | March 29, 2019 | SPDR S&P 500® ETF Trust | |||
Innovator U.S. Equity Buffer ETF – May | BMAY | April 30, 2020 | SPDR S&P 500® ETF Trust | |||
Innovator U.S. Equity Buffer ETF – June | BJUN | May 31, 2019 | SPDR S&P 500® ETF Trust | |||
Innovator U.S. Equity Buffer ETF – July | BJUL | August 28, 2018 | SPDR S&P 500® ETF Trust | |||
Innovator U.S. Equity Buffer ETF – August | BAUG | July 31, 2019 | SPDR S&P 500® ETF Trust | |||
Innovator U.S. Equity Buffer ETF – September | BSEP | August 30, 2019 | SPDR S&P 500® ETF Trust | |||
Innovator U.S. Equity Buffer ETF – October | BOCT | September 28, 2018 | SPDR S&P 500® ETF Trust | |||
Innovator U.S. Equity Buffer ETF – November | BNOV | October 31, 2019 | SPDR S&P 500® ETF Trust | |||
Innovator U.S. Equity Buffer ETF – December | BDEC | November 29, 2019 | SPDR S&P 500® ETF Trust | |||
Innovator U.S. Equity Power Buffer ETF – January | PJAN | December 31, 2018 | SPDR S&P 500® ETF Trust | |||
Innovator U.S. Equity Power Buffer ETF – February | PFEB | January 31, 2020 | SPDR S&P 500® ETF Trust | |||
Innovator U.S. Equity Power Buffer ETF – March | PMAR | February 28, 2020 | SPDR S&P 500® ETF Trust | |||
Innovator U.S. Equity Power Buffer ETF – April | PAPR | March 29, 2019 | SPDR S&P 500® ETF Trust | |||
Innovator U.S. Equity Power Buffer ETF – May | PMAY | April 30, 2020 | SPDR S&P 500® ETF Trust | |||
Innovator U.S. Equity Power Buffer ETF – June | PJUN | May 31, 2019 | SPDR S&P 500® ETF Trust | |||
Innovator U.S. Equity Power Buffer ETF – July | PJUL | August 7, 2018 | SPDR S&P 500® ETF Trust | |||
Innovator U.S. Equity Power Buffer ETF – August | PAUG | July 31, 2019 | SPDR S&P 500® ETF Trust | |||
Innovator U.S. Equity Power Buffer ETF – September | PSEP | August 30, 2019 | SPDR S&P 500® ETF Trust | |||
Innovator U.S. Equity Power Buffer ETF – October | POCT | September 28, 2018 | SPDR S&P 500® ETF Trust | |||
Innovator U.S. Equity Power Buffer ETF – November | PNOV | October 31, 2019 | SPDR S&P 500® ETF Trust | |||
Innovator U.S. Equity Power Buffer ETF – December | PDEC | November 29, 2019 | SPDR S&P 500® ETF Trust | |||
Innovator U.S. Equity Ultra Buffer ETF – January | UJAN | December 31, 2018 | SPDR S&P 500® ETF Trust | |||
Innovator U.S. Equity Ultra Buffer ETF – February | UFEB | January 31, 2020 | SPDR S&P 500® ETF Trust | |||
Innovator U.S. Equity Ultra Buffer ETF – March | UMAR | February 28, 2020 | SPDR S&P 500® ETF Trust | |||
Innovator U.S. Equity Ultra Buffer ETF – April | UAPR | March 29, 2019 | SPDR S&P 500® ETF Trust | |||
Innovator U.S. Equity Ultra Buffer ETF – May | UMAY | April 30, 2020 | SPDR S&P 500® ETF Trust |
Name | Ticker | Commencement of Operations | Tracking Fund | |||
Innovator U.S. Equity Ultra Buffer ETF – June | UJUN | May 31, 2019 | SPDR S&P 500® ETF Trust | |||
Innovator U.S. Equity Ultra Buffer ETF – July | UJUL | August 7, 2018 | SPDR S&P 500® ETF Trust | |||
Innovator U.S. Equity Ultra Buffer ETF – August | UAUG | July 31, 2019 | SPDR S&P 500® ETF Trust | |||
Innovator U.S. Equity Ultra Buffer ETF – September | USEP | August 30, 2019 | SPDR S&P 500® ETF Trust | |||
Innovator U.S. Equity Ultra Buffer ETF – October | UOCT | September 28, 2018 | SPDR S&P 500® ETF Trust | |||
Innovator U.S. Equity Ultra Buffer ETF – November | UNOV | October 31, 2019 | SPDR S&P 500® ETF Trust | |||
Innovator U.S. Equity Ultra Buffer ETF – December | UDEC | November 29, 2019 | SPDR S&P 500® ETF Trust | |||
Innovator International Developed Power Buffer ETF - January | IJAN | December 31, 2019 | iShares MSCI EAFE ETF | |||
Innovator International Developed Power Buffer ETF - April | IAPR | March 31, 2021 | iShares MSCI EAFE ETF | |||
Innovator International Developed Power Buffer ETF - July | IJUL | June 28, 2019 | iShares MSCI EAFE ETF | |||
Innovator International Developed Power Buffer ETF - October | IOCT | September 30, 2021 | iShares MSCI EAFE ETF | |||
Innovator Emerging Markets Power Buffer ETF - January | EJAN | December 31, 2019 | iShares MSCI Emerging Markets ETF | |||
Innovator Emerging Markets Power Buffer ETF - April | EAPR | March 31, 2021 | iShares MSCI Emerging Markets ETF | |||
Innovator Emerging Markets Power Buffer ETF - July | EJUL | June 28, 2019 | iShares MSCI Emerging Markets ETF | |||
Innovator Emerging Markets Power Buffer ETF - October | EOCT | September 30, 2021 | iShares MSCI Emerging Markets ETF | |||
Innovator Growth-100 Power Buffer ETF - January | NJAN | December 31, 2019 | Invesco QQQ Trust | |||
Innovator Growth-100 Power Buffer ETF - April | NAPR | March 31, 2020 | Invesco QQQ Trust | |||
Innovator Growth-100 Power Buffer ETF - July | NJUL | June 30, 2020 | Invesco QQQ Trust | |||
Innovator Growth-100 Power Buffer ETF - October | NOCT | September 30, 2019 | Invesco QQQ Trust | |||
Innovator U.S. Small Cap Power Buffer ETF - January | KJAN | December 31, 2019 | iShares Russell 2000 ETF | |||
Innovator U.S. Small Cap Power Buffer ETF - April | KAPR | March 31, 2020 | iShares Russell 2000 ETF | |||
Innovator U.S. Small Cap Power Buffer ETF - July | KJUL | June 30, 2020 | iShares Russell 2000 ETF | |||
Innovator U.S. Small Cap Power Buffer ETF - October | KOCT | September 30, 2019 | iShares Russell 2000 ETF | |||
Innovator Double Stacker ETF - January | DSJA | December 31, 2020 | SPDR S&P 500® ETF Trust and Invesco QQQ Trust | |||
Innovator Double Stacker ETF - October | DSOC | September 30, 2020 | SPDR S&P 500® ETF Trust and Invesco QQQ Trust | |||
Innovator Triple Stacker ETF - January | TSJA | December 31, 2020 | SPDR S&P 500® ETF Trust, Invesco QQQ Trust and iShares Russell 2000 ETF | |||
Innovator Triple Stacker ETF - October | TSOC | September 30, 2020 | SPDR S&P 500® ETF Trust, Invesco QQQ Trust and iShares Russell 2000 ETF | |||
Innovator Double Stacker 9 Buffer ETF - January | DBJA | December 31, 2020 | SPDR S&P 500® ETF Trust and Invesco QQQ Trust | |||
Innovator Double Stacker 9 Buffer ETF - October | DBOC | September 30, 2020 | SPDR S&P 500® ETF Trust and Invesco QQQ Trust | |||
Innovator U.S. Equity Accelerated ETF - January | XDJA | December 31, 2021 | SPDR S&P 500® ETF Trust | |||
Innovator U.S. Equity Accelerated ETF - April | XDAP | March 31, 2021 | SPDR S&P 500® ETF Trust | |||
Innovator U.S. Equity Accelerated ETF - July | XDJL | June 30, 2021 | SPDR S&P 500® ETF Trust | |||
Innovator U.S. Equity Accelerated ETF - October | XDOC | September 30, 2021 | SPDR S&P 500® ETF Trust | |||
Innovator U.S. Equity Accelerated Plus ETF - January | XTJA | December 31, 2021 | SPDR S&P 500® ETF Trust | |||
Innovator U.S. Equity Accelerated Plus ETF - April | XTAP | March 31, 2021 | SPDR S&P 500® ETF Trust | |||
Innovator U.S. Equity Accelerated Plus ETF - July | XTJL | June 30, 2021 | SPDR S&P 500® ETF Trust | |||
Innovator U.S. Equity Accelerated Plus ETF - October | XTOC | September 30, 2021 | SPDR S&P 500® ETF Trust | |||
Innovator U.S. Equity Accelerated 9 Buffer ETF - January | XBJA | December 31, 2021 | SPDR S&P 500® ETF Trust | |||
Innovator U.S. Equity Accelerated 9 Buffer ETF - April | XBAP | March 31, 2021 | SPDR S&P 500® ETF Trust | |||
Innovator U.S. Equity Accelerated 9 Buffer ETF - July | XBJL | June 30, 2021 | SPDR S&P 500® ETF Trust | |||
Innovator U.S. Equity Accelerated 9 Buffer ETF - October | XBOC | September 30, 2021 | SPDR S&P 500® ETF Trust | |||
Innovator Growth Accelerated Plus ETF - January | QTJA | December 31, 2021 | Invesco QQQ Trust | |||
Innovator Growth Accelerated Plus ETF - April | QTAP | March 31, 2021 | Invesco QQQ Trust | |||
Innovator Growth Accelerated Plus ETF - July | QTJL | June 30, 2021 | Invesco QQQ Trust | |||
Innovator Growth Accelerated Plus ETF - October | QTOC | September 30, 2021 | Invesco QQQ Trust | |||
Innovator 20+ Year Treasury Bond 9 Buffer ETF - July | TBJL | August 17, 2020 | iShares 20+ Year Treasury Bond ETF | |||
Innovator 20+ Year Treasury Bond 5 Floor ETF - Quarterly | TFJL | August 17, 2020 | iShares 20+ Year Treasury Bond ETF | |||
Innovator Defined Wealth Shield ETF | BALT | June 30, 2021 | SPDR S&P 500® ETF Trust | |||
Innovator U.S. Equity Accelerated ETF - Quarterly | XDSQ | March 31, 2021 | SPDR S&P 500® ETF Trust | |||
Innovator Growth Accelerated ETF - Quarterly | XDQQ | March 31, 2021 | Invesco QQQ Trust |
The Funds are exchange traded funds that offer one class of shares, do not charge a sales load, do not have a redemption fee and currently do not charge a 12b–1 fee to their shareholders. FFTY, BOUT, LOUP, BSTP and PSTP list and principally trade their shares on NYSE Arca, Inc. (“NYSE”), EPRF, BUFF and BUFB list and principally trade their shares on Cboe BZX Exchange, Inc. (“Cboe BZX”).
BSTP and PSTP employ a “step-up strategy” in which the sub-adviser will seek to opportunistically manage the respective Fund’s investment exposure by periodically terminating its FLEX Options investments earlier than its one-year expiration date and immediately reset the respective Fund’s options portfolio for a new one-year period. The “step-up strategy” seeks to help a Fund’s shareholder offset the timing risks inherent in owning an options package for one year. BSTP and PSTP do not pursue a “defined outcome strategy” or seek to achieve the full one-year investment outcomes of the options portfolio held. Unlike other Innovator ETFs that utilize a defined outcome investment strategy, they do not seek to provide shareholders with a set buffer percentage and maximum upside potential over any specified time period.
The Funds are investment companies and accordingly follow the investment company accounting and reporting guidance of the Financial Accounting Standards Board (“FASB”) Accounting Standards Codification (“ASC”) Topic 946 “Financial Services — Investment Companies”.
2. | SIGNIFICANT ACCOUNTING POLICIES |
The following is a summary of significant accounting policies consistently followed by the Trust in the preparation of its financial statements. These policies are in conformity with accounting principles generally accepted in the United States of America (“U.S. GAAP”).
Valuation:
The net asset values (“NAV”) of the Funds are determined as of the close of regular trading on the NYSE (normally 4:00 p.m. ET). If the NYSE closes early on a valuation day, the Funds shall determine NAV as of that time.
Portfolio securities generally shall be valued utilizing prices provided by independent pricing services. The Trust’s Pricing Committee (“Pricing Committee”) is responsible for establishing valuation of portfolio securities and other instruments held by the Funds in accordance with the Trust’s valuation procedures.
Common stocks, preferred stocks, exchange traded funds and other equity securities listed on any national or foreign exchange (excluding the NASDAQ National Market (“NASDAQ”) and the London Stock Exchange Alternative Investment Market (“AIM”)) are generally valued at the last sale price on the exchange on which they are principally traded or, for NASDAQ and AIM securities, the official closing price. Securities traded on more than one securities exchange are valued at the last sale price or official closing price, as applicable, at the close of the exchange representing the principal market for such securities. Securities traded in the over–the–counter market are valued at the mean of the bid and the asked price, if available, and otherwise at their closing bid price. Redeemable securities issued by open–end investment companies shall be valued at the investment company’s applicable net asset value, with the exception of exchange–traded open–end investment companies which are priced as equity securities. Units of Mount Vernon Liquid Assets Portfolio, LLC are not traded on an exchange and are valued at the investment company’s net asset value per share as provided by the underlying fund’s administrator. Fixed income securities, swaps, currency–, credit– and commodity–linked notes, and other similar instruments will be valued using a pricing service. Fixed income securities having a remaining maturity of 60 days or less when purchased will be valued at cost adjusted for amortization of premiums and accretion of discounts, provided the Pricing Committee has determined that the use of amortized cost is an appropriate reflection of fair value given market and issuer specific conditions existing at the time of the determination. Deposit accounts are valued at acquisition cost. Foreign securities and other assets denominated in foreign currencies are translated into U.S. dollars at the exchange rate of such currencies against the U.S. dollar as provided by the pricing service. All assets denominated in foreign currencies will be converted into U.S. dollars at the exchange rates in effect at the time of valuation. Restricted securities (with the exception of Rule 144A Securities for which market quotations are available) will normally be valued at fair value as determined by the Pricing Committee.
Exchange-traded option contracts (other than FLEX Option contracts) will be valued at the closing price in the market where such contracts are principally traded. If no closing price is available, they will be fair valued at the mean of their most recent bid and asked price, if available, and otherwise at their closing bid price. OTC options are fair valued at the mean of the most recent bid and asked price, if available, and otherwise at their closing bid price. FLEX Options will be valued at a model-based price provided by the exchange on which the option is traded at the official close of that exchange’s trading date. If the exchange on which the option is traded is unable to provide a model price, FLEX Options prices will be provided by backup provider Super Derivatives. Otherwise, the value of a FLEX Option will be determined by the Pricing Committee in accordance with the Trust’s valuation procedures.
If no quotation can be obtained from a pricing service, then the Pricing Committee will then attempt to obtain one or more broker quotes for the security. If no quotation is available from either a pricing service or one or more brokers or if the Pricing Committee has reason to question the reliability or accuracy of a quotation supplied or the use of amortized cost, the value of any portfolio security held by the Funds for which reliable market quotations are not readily available will be determined by the Pricing Committee in a manner that most appropriately reflects fair market value of the security on the valuation date. The use of a fair valuation method may be appropriate if, for example: (i) market quotations do not accurately reflect fair value of an investment; (ii) an investment’s value has been materially affected by events occurring after the close of the exchange or market on which the investment is principally traded (for example, a foreign exchange or market); (iii) a trading halt closes an exchange or market early; or (iv) other events result in an exchange or market delaying its normal close.
Fair Valuation Measurement:
FASB established a framework for measuring fair value in accordance with U.S. GAAP. Under ASC, Fair Value Measurement (“ASC 820”), various inputs are used in determining the value of the Funds’ investments. The inputs or methodology used for valuing securities are not necessarily an indication of the risk associated with investing in those securities. The three Levels of inputs of the fair value hierarchy are defined as follows:
• | Level 1 – | Unadjusted quoted prices in active markets for identical assets or liabilities that the Funds have the ability to access. | |
• | Level 2 – | Observable inputs other than quoted prices included in level 1 that are observable for the asset or liability, either directly or indirectly. These inputs may include quoted prices for the identical instrument on an inactive market, prices for similar instruments, interest rates, prepayment speeds, credit risk, yield curves, default rates and similar data. | |
• | Level 3 – | Unobservable inputs for the asset or liability, to the extent relevant observable inputs are not available, representing the Funds’ own assumptions about the assumptions a market participant would use in valuing the asset or liability, and would be based on the best information available. |
The availability of observable inputs can vary from security to security and is affected by a wide variety of factors, including, for example, the type of security, whether the security is new and not yet established in the marketplace, the liquidity of markets, and other characteristics particular to the security. To the extent that valuation is based on models or inputs that are less observable or unobservable in the market, the determination of fair value requires more judgement. Accordingly, the degree of judgement exercised in determining fair value is greatest for instruments categorized in Level 3.
The inputs used to measure fair value may fall into different levels of the fair value hierarchy. In such cases, for disclosure purposes, the level in the fair value hierarchy within which the fair value measurement falls in its entirety, is determined based on the lowest level input that is significant to the fair value measurement in its entirety.
The following table summarizes valuation of the Funds’ investments under the fair value hierarchy as of April 30, 2022:
FFTY | ||||||||||||||||
Level 1 | Level 2 | Level 3 | Total | |||||||||||||
Assets | ||||||||||||||||
Common Stocks | $ | 137,711,917 | $ | - | $ | - | $ | 137,711,917 | ||||||||
Real Estate Investment Trusts | 9,269,083 | - | - | 9,269,083 | ||||||||||||
Investments Purchased with Proceeds From Securities Lending | - | 46,996,751 | - | 46,996,751 | ||||||||||||
Short Term Investments | 1,098,688 | - | - | 1,098,688 | ||||||||||||
Total Assets | $ | 148,079,688 | $ | 46,996,751 | $ | - | $ | 195,076,439 | ||||||||
BOUT | ||||||||||||||||
Level 1 | Level 2 | Level 3 | Total | |||||||||||||
Assets | ||||||||||||||||
Common Stocks | $ | 13,010,122 | $ | - | $ | - | $ | 13,010,122 | ||||||||
Master Limited Partnerships | 465,120 | - | - | 465,120 | ||||||||||||
Real Estate Investment Trusts | 3,900,800 | - | - | 3,900,800 | ||||||||||||
Investments Purchased with Proceeds From Securities Lending | - | 3,548,495 | - | 3,548,495 | ||||||||||||
Short Term Investments | 36,275 | - | - | 36,275 | ||||||||||||
Total Assets | $ | 17,412,317 | $ | 3,548,495 | $ | - | $ | 20,960,812 | ||||||||
LOUP | ||||||||||||||||
Level 1 | Level 2 | Level 3 | Total | |||||||||||||
Assets | ||||||||||||||||
Common Stocks | $ | 50,546,918 | $ | - | $ | - | $ | 50,546,918 | ||||||||
Investments Purchased with Proceeds From Securities Lending | - | 13,811,175 | - | 13,811,175 | ||||||||||||
Short Term Investments | 56,545 | - | - | 56,545 | ||||||||||||
Total Assets | $ | 50,603,463 | $ | 13,811,175 | $ | - | $ | 64,414,638 | ||||||||
EPRF | ||||||||||||||||
Level 1 | Level 2 | Level 3 | Total | |||||||||||||
Assets | ||||||||||||||||
Preferred Stocks | $ | 151,903,295 | $ | - | $ | - | $ | 151,903,295 | ||||||||
Investments Purchased with Proceeds From Securities Lending | - | 6,033,675 | - | 6,033,675 | ||||||||||||
Short Term Investments | 809,734 | - | - | 809,734 | ||||||||||||
Total Assets | $ | 152,713,029 | $ | 6,033,675 | $ | - | $ | 158,746,704 | ||||||||
BUFF | ||||||||||||||||
Level 1 | Level 2 | Level 3 | Total | |||||||||||||
Assets | ||||||||||||||||
Affiliated Exchange Traded Funds | $ | 102,343,455 | $ | - | $ | - | $ | 102,343,455 | ||||||||
Investments Purchased with Proceeds From Securities Lending | - | 720,700 | - | 720,700 | ||||||||||||
Short Term Investments | 170,177 | - | - | 170,177 | ||||||||||||
Total Assets | $ | 102,513,632 | $ | 720,700 | $ | - | $ | 103,234,332 | ||||||||
BUFB | ||||||||||||||||
Level 1 | Level 2 | Level 3 | Total | |||||||||||||
Assets | ||||||||||||||||
Affiliated Exchange Traded Funds | $ | 11,137,133 | $ | - | $ | - | $ | 11,137,133 | ||||||||
Short Term Investments | 8,098 | - | - | 8,098 | ||||||||||||
Total Assets | $ | 11,145,231 | $ | - | $ | - | $ | 11,145,231 | ||||||||
BSTP | ||||||||||||||||
Level 1 | Level 2 | Level 3 | Total | |||||||||||||
Assets | ||||||||||||||||
Purchased Options | $ | - | $ | 11,412,960 | $ | - | $ | 11,412,960 | ||||||||
Short Term Investments | 92,555 | - | - | 92,555 | ||||||||||||
Total Assets | $ | 92,555 | $ | 11,412,960 | $ | - | $ | 11,505,515 | ||||||||
Liabilities | ||||||||||||||||
Options Written | $ | - | $ | 808,860 | $ | - | $ | 808,860 | ||||||||
Total Liabilities | $ | - | $ | 808,860 | $ | - | $ | 808,860 | ||||||||
PSTP | ||||||||||||||||
Level 1 | Level 2 | Level 3 | Total | |||||||||||||
Assets | ||||||||||||||||
Purchased Options | $ | - | $ | 10,805,796 | $ | - | $ | 10,805,796 | ||||||||
Short Term Investments | 34,005 | - | - | 34,005 | ||||||||||||
Total Assets | $ | 34,005 | $ | 10,805,796 | $ | - | $ | 10,839,801 | ||||||||
Liabilities | ||||||||||||||||
Options Written | $ | - | $ | 771,456 | $ | - | $ | 771,456 | ||||||||
Total Liabilities | $ | - | $ | 771,456 | $ | - | $ | 771,456 | ||||||||
See the Schedules of Investments for the investments detailed by industry classification.
There were no Level 3 investments for the Funds during the period ended April 30, 2022.
Option Contracts:
In general, an option contract is an agreement between a buyer and seller that gives the purchaser of the option the right to buy or sell a particular asset at a specified future date at an agreed upon price (commonly known as the “strike price”).
BSTP and PSTP invest primarily in FLEX Option contracts. FLEX Options are customized option contracts that trade on an exchange but provide investors with the ability to customize key contract terms like strike price, style and expiration date while achieving price discovery in competitive, transparent auctions markets and avoiding the counterparty exposure of over-the-counter options positions. Like traditional exchange-traded options, FLEX Options are guaranteed for settlement by the OCC, a market clearinghouse that guarantees performance by counterparties to certain derivatives contracts. The FLEX Options in which the Funds will invest are all European style options (options that are exercisable only on the expiration date). The FLEX Options are listed on the Chicago Board Options Exchange.
BSTP and PSTP will purchase and sell call and put FLEX Options. In general, put options give the holder (i.e., the buyer) the right to sell an asset (or deliver the cash value of the index, in case of an index put option) and the seller (i.e., the writer) of the put has the obligation to buy the asset (or receive cash value of the index, in case of an index put option) at a certain defined price. Call options give the holder (i.e., the buyer) the right to buy an asset (or receive cash value of the index, in case of an index call option) and the seller (i.e., the writer) the obligation to sell the asset (or deliver cash value of the index, in case of an index call option) at a certain defined price.
When BSTP and PSTP purchase an option, an amount equal to the premium paid by the Funds are recorded as an investment and is subsequently adjusted to the current value of the option purchased. If an option expires on the stipulated expiration date or if the Funds enter into a closing sale transaction, a gain or loss is realized. If a call option is exercised, the cost of the security acquired is increased by the premium paid for the call. If a put option is exercised, a gain or loss is realized from the sale of the underlying security, and the proceeds from such sale are decreased by the premium originally paid. Purchased options are non-income producing securities.
When BSTP and PSTP write an option, an amount equal to the premium received by the Funds are recorded as a liability and is subsequently adjusted to the current value of the option written. Premiums received from writing options that expire unexercised are treated by the Funds on the expiration date as realized gain from written options. The difference between the premium and the amount paid on effecting a closing purchase transaction, including brokerage commissions, is also treated as a realized gain, or if the premium is less than the amount paid for the closing purchase transaction, as a realized loss. If a call option is exercised, the premium is added to the proceeds from the sale of the underlying security in determining whether the Funds have realized a gain or loss. If a put option is exercised, the premium reduces the cost basis of the securities purchased by the Funds. BSTP and PSTP, as writers of an option, bear the market risk of an unfavorable change in the price of the security underlying the written option.
All of the FLEX Option contracts held by BSTP and PSTP are fully funded and cash settled, therefore balance sheet offsetting under ASC 210 does not apply.
BSTP and PSTP bear the risk that the OCC will be unable or unwilling to perform its obligations under the FLEX Options contracts. In the unlikely event that the OCC becomes insolvent or is otherwise unable to meet its settlement obligations, the Funds could suffer significant losses. Additionally, FLEX Options may be less liquid than certain other securities such as standardized options. In less liquid market for the FLEX Options, the Funds may have difficulty closing out certain FLEX Options positions at desired times and prices. The Funds may experience substantial downside from specific FLEX Option positions and certain FLEX Option positions may expire worthless. The value of the underlying FLEX Options will be affected by, among others, changes in the value of the exchange, changes in interest rates, changes in the actual and implied volatility of the Index and the remaining time to until the FLEX Options expire. The value of the FLEX Options does not increase or decrease at the same rate as the level of the Index (although they generally move in the same direction). However, as a FLEX Option approaches its expiration date, its value typically increasingly moves with the value of the Index.
The value of derivative instruments on the Statements of Assets and Liabilities for BSTP and PSTP as of April 30, 2022 are as follows:
Equity Risk - Call and Put Options not Accounted for as Hedging Instruments | ||||||||
Asset Derivatives | Liability Derivatives | |||||||
Investments, at value | Options written, at value | |||||||
BSTP | $ | 11,412,960 | $ | 808,860 | ||||
PSTP | 10,805,796 | 771,456 | ||||||
The effect of derivative instruments on the Statements of Operations for the period ended April 30, 2022:
Equity Risk - Call and Put Options not Accounted for as Hedging Instruments | ||||||||||||||||
Amount of Realized Gain/(Loss) on Derivatives Recognized in Income | ||||||||||||||||
Investments | Investments in-kind | Options written | Options written in-kind | |||||||||||||
BSTP | $ | (365,713 | ) | $ | 226,630 | $ | (116,269 | ) | $ | 58,587 | ||||||
PSTP | (357,943 | ) | 217,583 | (99,968 | ) | 105,652 | ||||||||||
Equity Risk - Call and Put Options not Accounted for as Hedging Instruments | ||||||||
Change in Unrealized Appreciation/(Depreciation) on Derivatives Recognized in Income | ||||||||
Investments | Options written | |||||||
BSTP | $ | (1,065 | ) | $ | (1,070 | ) | ||
PSTP | (1,008 | ) | (1,012 | ) | ||||
The average volume of derivative activity during the period ended April 30, 2022, is as follows:
Purchased Options | Options Written | |||||||
Average Monthly Market Value | Average Monthly Market Value | |||||||
BSTP | $ | 7,809,372 | $ | (537,970 | ) | |||
PSTP | 8,198,847 | (563,276 | ) | |||||
Use of Estimates:
In preparing financial statements in conformity with U.S. GAAP, management is required to make estimates and assumptions that affect the reported amounts of assets and liabilities and disclosure of contingent assets and liabilities as of the date of the financial statements and the reported amounts of increases and decreases in net assets from operations during the reporting period. Actual results could differ from these estimates.
Guarantees and Indemnifications:
In the normal course of business, the Trust may enter into a contract with service providers that contain general indemnification clauses. The Trust’s maximum exposure under these arrangements is unknown as this would involve future claims against the Trust that have not yet occurred. Based on experience, the Trust expects the risk of loss to be remote.
Tax Information:
The Funds are treated as separate entities for federal income tax purposes. The Funds intend to qualify as regulated investment companies (“RICs”) under Subchapter M of the Internal Revenue Code of 1986, as amended (the “Internal Revenue Code”). To qualify and remain eligible for the special tax treatment accorded to RICs, the Funds must meet certain annual income and quarterly asset diversification requirements and must distribute annually at least 90% of the sum of (i) its investment company taxable income (which includes dividends, interest and net short–term capital gains) and (ii) certain net tax–exempt income, if any. If so qualified, the Funds will not be subject to federal income tax to the extent the Funds distribute substantially all of their net investment income and capital gains to shareholders.
Management evaluates the Funds’ tax positions to determine if the tax positions taken meet the minimum recognition threshold in connection with accounting for uncertainties in income tax positions taken or expected to be taken for the purposes of measuring and recognizing tax liabilities in the financial statements. Tax benefits associated with an uncertain tax position can be recognized only when the position is “more likely than not” to be sustained assuming examination by taxing authorities. Interest and penalties related to income taxes would be recorded as tax expense in the Statements of Operations. During the period ended April 30, 2022, the Funds did not incur any interest or penalties. The Funds’ federal income tax returns are subject to examination by the Internal Revenue Service (IRS) for a period of three fiscal years after they are filed. State and local tax returns may be subject to examination for an additional fiscal year depending on the jurisdiction. As of April 30, 2022, the Funds did not have a liability for any unrecognized tax benefits. As of April 30, 2022, the Funds have no examinations in progress and management is not aware of any tax positions for which it is reasonably possible that the amounts of unrecognized tax benefits will significantly change in the next twelve months. The Funds are subject to examination by U.S. Federal tax authorities for all tax years since 2017, as applicable.
U.S. GAAP requires that certain components of net assets be reclassified between distributable earnings/(accumulated deficit) and additional paid–in capital.
These reclassifications have no effect on net assets or net asset value per share. For the year ended October 31, 2021, the Funds made the following permanent book–to–tax reclassifications primarily related to net operating loss forfeiture and redemptions in kind:
Distributable Earnings/ | ||||||||
(Accumulated Deficit) | Paid-In Capital | |||||||
FFTY | $ | (61,378,388 | ) | $ | 61,378,388 | |||
BOUT | (6,138,225 | ) | 6,138,225 | |||||
LOUP | (15,371,429 | ) | 15,371,429 | |||||
EPRF | (1,097,399 | ) | 1,097,399 | |||||
BUFF | (1,284,288 | ) | 1,284,288 | |||||
Distributions to Shareholders:
Distributions to shareholders are recorded on the ex–dividend date. FFTY, BOUT, LOUP, BUFF, BUFB, BSTP and PSTP intend to pay out dividends from their net investment income, if any, annually. EPRF intends to pay out dividends from its net investment income, if any, monthly. Distributions of net realized capital gains, if any, will be declared and paid at least annually by the Funds. The Funds may periodically make reclassifications among certain of its capital accounts as a result of the recognition and characterization of certain income and capital gain distributions determined annually in accordance with federal tax regulations which may differ from U.S. GAAP. Distributions that exceed earnings and profits for tax purposes are reported as a return of capital.
Investment Transactions and Investment Income:
Investment transactions are recorded on the trade date. The Trust determines the gain or loss realized from investment transactions on the basis of identified cost. Dividend income, if any, is recognized on the ex–dividend date or, in the case of foreign securities, as soon as the Funds are informed of the ex–dividend dates. Interest income, including accretion of discounts and amortization of premiums is recognized on an accrual basis using the effective yield method.
Distributions received from investments in master limited partnerships (“MLPs”), closed–end funds, real estate investment trusts (“REITs”) and royalty trusts are comprised of ordinary income, capital gains and return of capital. For financial statement purposes, estimates are used to characterize these distributions received as return of capital, capital gains or ordinary income. Such estimates are based on historical information available from each MLP, closed–end fund, REIT or royalty trust and other industry sources. These estimates may subsequently be revised and reflected on the Form 1099 received by shareholders based on information received for the security after its tax reporting periods are concluded, as the actual character of these distributions is not known until after the fiscal year end. The distributions received from MLPs, REITs, closed–end funds, and royalty trust securities that have been classified as income and capital gains are included in dividend income and net realized gain/(loss) on investments, respectively, on the Statements of Operations. The distributions received that are classified as return of capital reduce the cost of investments on the Statements of Assets and Liabilities.
Purchases and sales of investments and dividend and interest income are translated into U.S. dollars using the spot market rates of exchange prevailing on the respective dates of such translations. The gain or loss resulting from changes in foreign exchange rates is included with net realized and unrealized gain or loss from investments, as appropriate. Foreign securities and currency transactions may involve certain considerations and risks not typically associated with those of domestic origin. Foreign securities are recorded in the financial statements after translation to U.S. dollars based on the applicable exchange rate at the end of the period. The Funds report certain foreign currency–related transactions as components of realized gains or losses for financial reporting purposes, whereas such components are treated as ordinary income for federal income tax purposes.
3. | INVESTMENT ADVISOR AND OTHER AFFILIATES |
Innovator Capital Management, LLC (the “Adviser”) acts as investment adviser to the Funds pursuant to investment advisory agreements between the Trust and the Adviser with respect to the Funds (“Advisory Agreements”) and, pursuant to the Advisory Agreements, is responsible for the day–to–day management of the Funds.
Pursuant to an investment advisory agreement between the Trust and the Adviser with respect to FFTY, FFTY pays monthly the Adviser a management fee calculated daily based on the average daily net assets of the Fund.
Pursuant to an investment advisory agreement between the Trust and the Adviser with respect to the Funds, excluding FFTY, each respective Fund pays monthly the Adviser a unitary fee calculated daily based on the average daily net assets of the Fund. During the term of the Advisory Agreement, the Adviser pays all expenses of the respective Funds, including the cost of transfer agency, custody, fund administration, legal, audit, and other services and license fees, except for the fees paid under the Advisory Agreement, interest, taxes, brokerage commissions and other expenses connected with the execution of portfolio transactions, distribution and service fees payable pursuant to a Rule 12b–1 plan, if any, and extraordinary expenses.
Penserra Capital Management LLC (“Penserra”) and Milliman Financial Risk Management LLC (“Milliman”)(collectively the “Sub–Advisers”) act as sub–adviser to the Funds pursuant to sub–advisory agreements between the Adviser and respective Sub–Adviser with respect to the Funds (“Sub–Advisory Agreements”) and, pursuant to the Sub–Advisory Agreements, are responsible for execution of the Sub– Adviser’s strategy for each of the Funds. The Sub–Advisers are responsible for the day–to–day management of the Fund’s portfolios. Pursuant to the Sub–Advisory Agreements between the Adviser and the respective Sub–Adviser, the Adviser pays the Sub– Advisers a fee, based on the Funds’ average daily net assets, for the services and facilities they provide payable on a monthly basis.
Management/ Fee Rate | Sub-Adviser | |||||||
FFTY | 0.70 | % | Penserra | |||||
BOUT | 0.80 | % | Penserra | |||||
LOUP | 0.70 | % | Penserra | |||||
EPRF | 0.47 | % | Penserra | |||||
BUFF | 0.20 | % | Penserra | |||||
BUFB | 0.20 | % | Penserra | |||||
BSTP | 0.89 | % | Milliman | |||||
PSTP | 0.89 | % | Milliman | |||||
Certain trustees and officers of the Trust are affiliated with the Adviser. Excluding FFTY, Trustee compensation is paid for by the Adviser.
Pursuant to the Advisory Agreement between the Trust and the Adviser with respect to BUFF and BUFB, the Adviser has agreed to waive unitary fees of 0.10% of average daily net assets of the respective Fund until June 30, 2024. The waiver may be terminated by action of the Trust’s board at any time upon 60 days written notice by the Trust, on behalf of the Funds, or by the adviser on or after June 30, 2024. The Adviser is not entitled to recoup any of the fees that it waived.
The Trust entered into an Expense Limitation Agreement on behalf of FFTY with the Adviser. Under the terms of the Expense Limitation Agreement with FFTY, the Adviser contractually agreed to waive their advisory fees and/or assume as their own expense, certain expenses otherwise payable by the Fund to the extent necessary to ensure that total annual fund operating expenses (excluding any Rule 12b–1 fees, taxes, interest, brokerage fees, acquired fund fees and expenses, expenses incurred in connection with any merger, reorganization or proxy solicitation, litigation, and other extraordinary expenses) do not exceed 0.80% of average daily net assets of FFTY until August 31, 2022. Pursuant to the terms of the Expense Limitation Agreement, Innovator is entitled to recoup any fees that it waived and/or Fund expenses that it paid for a period of three years following such fee waivers and/or expense payments. The Fund may only make such repayment to the Adviser if, after the recoupment payment has been taken into account, it does not cause the Fund’s expense ratio to exceed either the expense cap in place at the time the expenses were waived or the Fund’s current expense cap. For the period ended April 30, 2022, the Adviser waived $175,106 of their advisory fees for FFTY without recouping any of their previously waived fees. The table below indicates the amount of fees that the Adviser may recoup:
Recovery Expiring in*: | ||||||||||||||||||||
FYE 10/31/2022 | FYE 10/31/2023 | FYE 10/31/2024 | FYE 10/31/2025 | Total | ||||||||||||||||
FFTY | $ | 5,288 | $ | 268,534 | $ | 309,101 | $ | 175,106 | $ | 758,029 | ||||||||||
* Recoupment expires on a rolling monthly basis three years following the respective fee waivers. |
4. | INVESTMENT TRANSACTIONS |
For the period ended April 30, 2022, the cost of purchases and proceeds from sales of investment securities, other than in–kind purchases and sales and short–term investments were as follows:
Purchases | Sales | |||||||||||||||
U.S. Governement | Other | U.S. Governement | Other | |||||||||||||
FFTY | $ | - | $ | 1,974,682,426 | $ | - | $ | 1,953,831,777 | ||||||||
BOUT | - | 130,344,244 | - | 130,265,479 | ||||||||||||
LOUP | - | 52,003,494 | - | 46,882,859 | ||||||||||||
EPRF | - | 40,743,594 | - | 40,328,021 | ||||||||||||
BUFF | - | 469,030 | - | 467,494 | ||||||||||||
BUFB | - | 56,827 | - | 55,822 | ||||||||||||
BSTP | - | - | - | - | ||||||||||||
PSTP | - | - | - | - | ||||||||||||
For the period ended April 30, 2022, in–kind transactions associated with creations and redemptions were as follows:
In-Kind | In-Kind | |||||||
Creations | Redemptions | |||||||
FFTY | $ | 7,304,179 | $ | 64,183,571 | ||||
BOUT | 24,489,222 | 20,592,493 | ||||||
LOUP | 2,853,891 | 10,324,899 | ||||||
EPRF | 1,210,493 | 35,846,304 | ||||||
BUFF | 42,460,055 | 5,333,751 | ||||||
BUFB | 11,740,617 | - | ||||||
BSTP | - | 1,151,598 | ||||||
PSTP | - | 1,060,691 | ||||||
Net capital gains or losses resulting from in–kind redemptions are excluded for the Funds’ taxable gains and are not distributed to shareholders.
5. CREATION AND REDEMPTION TRANSACTIONS
There were an unlimited number of shares of beneficial interest (without par value) authorized by the Trust. Individual shares of the Funds may only be purchased and sold at market prices on the Exchange through a broker–dealer. Such transactions may be subject to customary commission rates imposed by the broker–dealer, and market prices for the Funds’ shares may be at, above or below its NAV depending on the premium or discount at which the Funds’ shares trade.
The Funds issue and redeem shares on a continuous basis at NAV only in blocks of shares, called “Creation Units.” Creation Units are issued and redeemed for cash or in–kind for securities included in a specified universe. Once created, shares generally trade in the secondary market at market prices that change throughout the day in amounts less than a Creation Unit. Except when aggregated in Creation Units, shares are not redeemable securities of the Funds. Shares of the Funds may only be purchased or redeemed by certain financial institutions (“Authorized Participants”). An Authorized Participant is either (i) a broker–dealer or other participant in the clearing process through the Continuous Net Settlement System of the National Securities Clearing Corporation or (ii) a DTC participant and, in each case, must have executed a Participant Agreement with the Distributor. A transaction fee is applicable to each transaction regardless of the number of units purchased or sold in the transaction. Each Fund, subject to approval by the Board of Trustees, may adjust transaction fees from time to time based upon actual experience. Additional charges received by the Funds, if any, are disclosed as Transaction Fees on the Statements of Changes in Net Assets. Most retail investors do not qualify as Authorized Participants nor have the resources to buy and sell whole Creation Units. Therefore, they are unable to purchase or redeem the shares directly from the Funds. Rather, most retail investors may purchase shares in the secondary market with the assistance of a broker and are subject to customary brokerage commissions or fees.
6. | SECURITIES LENDING |
The Funds, excluding BSTP and PSTP, may lend up to 331/3% of the value of the securities in their respective portfolios to brokers, dealers and financial institutions (but not individuals) under terms of participation in a securities lending program administered by the securities lending agent. The Trust has entered into a Securities Lending Agreement (“SLA”) with U.S. Bank, N.A., the Funds’ custodian (the “Agent”). Under the terms of the SLA, the Funds may lend securities to certain broker–dealers and banks in exchange for collateral in the amount of at least 102% of the value of U.S. securities loaned or at least 105% of the value of non–U.S. securities loaned, marked to market daily. The collateral can be received in the form of cash collateral and/or non–cash collateral. Non–cash collateral can include U.S. Government Securities and letters of credit. The cash collateral is invested in the Mount Vernon Liquid Assets Portfolio, LLC (“Mount Vernon”), as noted in the Funds’ Schedules of Investments. Mount Vernon seeks to maximize current income to the extent consistent with the preservation of capital and liquidity; and to maintain a stable NAV of $1.00. Mount Vernon has an overnight and continuous maturity. The market value of the loaned securities is determined daily at the close of business of the Funds and any additional required collateral is delivered to the Funds on the next business day. The Funds continue to benefit from interest or dividends on the securities loaned and may also earn a return from the collateral. The Funds pay various fees in connection with the investment of cash collateral. The Funds pay the Agent fees based on the investment income received from securities lending activities. Although risk is mitigated by the collateral, the Funds could experience a delay in recovering their securities and possible loss of income or value if the borrower fails to return them. In the event of a borrower’s material default, the Agent shall take all actions the Agent deems appropriate to liquidate the collateral, purchase replacement securities at the Agents’ expense, or pay the Funds an amount equal to the market value of the loaned securities, subject to certain limitations.
As of April 30, 2022, the values of the securities on loan, cash collateral received, and fees and interest were as follows:
Value of Securities on Loan | Cash Collateral Received | Fees and Interest Earned | ||||||||||
FFTY | $ | 17,140,654 | $ | 46,996,751 | $ | 297,609 | ||||||
BOUT | 3,366,900 | 3,548,495 | 1,928 | |||||||||
LOUP | 13,043,384 | 13,811,175 | 6,642 | |||||||||
EPRF | 5,816,728 | 6,033,675 | 86,314 | |||||||||
BUFF | 689,434 | 720,700 | 25,665 | |||||||||
BUFB | - | - | - | |||||||||
Due to the absence of a master netting agreement related to the applicable Funds’ participation in securities lending, no additional offsetting disclosures have been made on behalf of the Funds for the total borrowings listed above.
7. | FEDERAL INCOME TAX INFORMATION |
At October 31, 2021, the cost of investments and net unrealized appreciation/
(depreciation) for federal income tax purposes were as follows:
FFTY | BOUT | LOUP | EPRF | BUFF | ||||||||||||||||
Cost of Portfolio | $ | 335,895,027 | $ | 16,204,422 | $ | 87,014,726 | $ | 244,271,479 | $ | 70,070,014 | ||||||||||
Gross Unrealized Appreciation | $ | 33,979,477 | $ | 718,328 | $ | 10,852,209 | $ | 5,103,264 | $ | 3,925,230 | ||||||||||
Gross Unrealized Depreciation | (9,499,114 | ) | (245,029 | ) | (6,040,222 | ) | (2,379,308 | ) | (899 | ) | ||||||||||
Net Unrealized Appreciation/(Depreciation) | $ | 24,480,363 | $ | 473,299 | $ | 4,811,987 | $ | 2,723,956 | $ | 3,924,331 | ||||||||||
The differences between book basis and tax basis cost on investments and net unrealized appreciation/(depreciation) are primarily attributable to wash sale loss deferrals.
As of October 31, 2021, the components of distributable earnings/(accumulated deficit) on a tax basis were as follows:
FFTY | BOUT | LOUP | EPRF | BUFF | ||||||||||||||||
Accumulated Capital and Other Losses | $ | (207,584,501 | ) | $ | (7,682,053 | ) | $ | (9,015,472 | ) | $ | (3,111,057 | ) | $ | (38,676,782 | ) | |||||
Distributions Payable | - | - | - | (782,000 | ) | - | ||||||||||||||
Undistributed Net Ordinary Income | 520,522 | - | - | - | - | |||||||||||||||
Unrealized Appreciation/(Depreciation) on Investments | 24,480,363 | 473,299 | 4,811,987 | 2,723,956 | 3,924,331 | |||||||||||||||
Total Distributable Earnings/(Accumulated Deficit) | $ | (182,583,616 | ) | $ | (7,208,754 | ) | $ | (4,203,485 | ) | $ | (1,169,101 | ) | $ | (34,752,451 | ) | |||||
Certain qualified late year ordinary losses incurred after December 31, and within the current taxable year, are deemed to arise on the first business day of the next taxable year.
At October 31, 2021, the Funds deferred the following qualified late year ordinary losses:
FFTY | BOUT | LOUP | EPRF | BUFF | ||||||||||||||||
Late Year Ordinary Losses | $ | - | $ | 4,526 | $ | 264,618 | $ | - | $ | 84,133 | ||||||||||
At October 31, 2021, for federal income tax purposes, the Funds had capital loss carryforwards available to offset future capital gains for an unlimited period as indicated below:
FFTY | BOUT | LOUP | EPRF | BUFF | ||||||||||||||||
Indefinite Short-Term | $ | 207,559,705 | $ | 7,677,524 | $ | 8,706,732 | $ | 2,947,089 | $ | 38,592,649 | ||||||||||
Indefinite Long-Term | - | - | 43,658 | 163,968 | - | |||||||||||||||
To the extent that these loss carryforwards are utilized, capital gains so offset will not be distributed to shareholders. During the current tax year ended October 31, 2021, BUFF utilized $31,705 of capital loss carryforwards available.
The tax character of the distributions paid by the Funds during the fiscal years ended October 31, 2021 and October 31, 2020 were as follows:
EPRF | BUFF | |||||||||||||||
2021 | 2020 | 2021 | 2020 | |||||||||||||
Distributions paid from: | ||||||||||||||||
Net Ordinary Income | $ | 9,442,181 | $ | 2,310,148 | $ | - | $ | 2,311,942 | ||||||||
Net Long-Term Capital Gains | - | - | - | - | ||||||||||||
Return of Capital | 570,855 | - | - | - | ||||||||||||
Total Distributions Paid | $ | 10,013,036 | $ | 2,310,148 | $ | - | $ | 2,311,942 | ||||||||
FFTY, BOUT, and LOUP did not pay any distributions during the fiscal years ended October 31, 2021 and October 31, 2020.
8. TRANSACTIONS WITH AFFILITATES
BUFF and BUFB had the following transactions during the year ended October 31, 2021 with affiliated companies:
BUFF | Period Ended April 30, 2022 | |||||||||||||||||||||||||||||||
Security Name | Value as of November 1, 2021 | Purchases | Sales | Value as of April 30, 2022 | Share Balance | Dividend Income | Net Realized Gain (Loss) on Sale of Shares | Net Change in Unrealized Appreciation (Depreciation) | ||||||||||||||||||||||||
Innovator U.S. Equity Power Buffer ETF – January | $ | 5,754,186 | $ | 3,727,865 | $ | 436,639 | $ | 8,529,099 | 275,221 | $ | - | $ | 39,200 | $ | (555,513 | ) | ||||||||||||||||
Innovator U.S. Equity Power Buffer ETF – February | 5,744,153 | 3,541,193 | 466,572 | 8,520,428 | 304,301 | - | 54,504 | $ | (352,850 | ) | ||||||||||||||||||||||
Innovator U.S. Equity Power Buffer ETF – March | 5,769,279 | 3,568,830 | 657,341 | 8,527,438 | 276,775 | - | 49,222 | $ | (202,552 | ) | ||||||||||||||||||||||
Innovator U.S. Equity Power Buffer ETF – April | 5,757,521 | 3,549,522 | 520,144 | 8,504,607 | 301,903 | - | 34,635 | $ | (316,927 | ) | ||||||||||||||||||||||
Innovator U.S. Equity Power Buffer ETF – May | 5,777,812 | 3,549,094 | 465,028 | 8,428,379 | 293,263 | - | 36,655 | $ | (470,154 | ) | ||||||||||||||||||||||
Innovator U.S. Equity Power Buffer ETF – June | 5,771,325 | 3,548,156 | 515,271 | 8,548,427 | 276,353 | - | 34,669 | $ | (290,452 | ) | ||||||||||||||||||||||
Innovator U.S. Equity Power Buffer ETF – July | 5,783,854 | 3,547,215 | 488,721 | 8,554,076 | 290,461 | - | 34,139 | $ | (322,411 | ) | ||||||||||||||||||||||
Innovator U.S. Equity Power Buffer ETF – August | 5,786,925 | 3,546,971 | 462,382 | 8,571,697 | 295,984 | - | 37,585 | $ | (337,402 | ) | ||||||||||||||||||||||
Innovator U.S. Equity Power Buffer ETF – September | 5,780,273 | 3,574,976 | 444,587 | 8,550,309 | 298,024 | - | 44,694 | $ | (405,047 | ) | ||||||||||||||||||||||
Innovator U.S. Equity Power Buffer ETF – October | 5,785,351 | 3,540,773 | 458,878 | 8,546,788 | 295,021 | - | 46,563 | $ | (367,021 | ) | ||||||||||||||||||||||
Innovator U.S. Equity Power Buffer ETF – November | 5,745,976 | 3,632,856 | 441,271 | 8,539,302 | 293,348 | - | 43,842 | $ | (442,101 | ) | ||||||||||||||||||||||
Innovator U.S. Equity Power Buffer ETF – December | 5,741,324 | 3,601,635 | 444,413 | 8,522,905 | 287,307 | - | 45,692 | $ | (421,333 | ) | ||||||||||||||||||||||
BUFB | Period Ended April 30, 2022 | |||||||||||||||||||||||||||||||
Security Name | Value as of November 1, 2021 | Purchases | Sales | Value as of April 30, 2022 | Share Balance | Dividend Income | Net Realized Gain (Loss) on Sale of Shares | Net Change in Unrealized Appreciation (Depreciation) | ||||||||||||||||||||||||
Innovator U.S. Equity Buffer ETF – January | $ | - | $ | 978,986 | $ | - | $ | 928,042 | 27,436 | $ | - | $ | - | $ | (50,944 | ) | ||||||||||||||||
Innovator U.S. Equity Buffer ETF – February | - | 988,911 | 10,074 | 926,613 | 30,628 | - | (211 | ) | $ | (52,013 | ) | |||||||||||||||||||||
Innovator U.S. Equity Buffer ETF – March | - | 995,995 | 17,656 | 928,058 | 28,329 | - | (334 | ) | $ | (49,947 | ) | |||||||||||||||||||||
Innovator U.S. Equity Buffer ETF – April | - | 990,951 | 19,078 | 928,437 | 29,279 | - | (399 | ) | $ | (43,037 | ) | |||||||||||||||||||||
Innovator U.S. Equity Buffer ETF – May | - | 984,649 | - | 923,244 | 30,571 | - | - | $ | (61,405 | ) | ||||||||||||||||||||||
Innovator U.S. Equity Buffer ETF – June | - | 981,952 | 4,581 | 927,658 | 28,899 | - | (81 | ) | $ | (49,632 | ) | |||||||||||||||||||||
Innovator U.S. Equity Buffer ETF – July | - | 980,871 | 3,422 | 930,295 | 30,058 | - | (65 | ) | $ | (47,089 | ) | |||||||||||||||||||||
Innovator U.S. Equity Buffer ETF – August | - | 978,951 | - | 929,406 | 30,343 | - | - | $ | (49,545 | ) | ||||||||||||||||||||||
Innovator U.S. Equity Buffer ETF – September | - | 979,473 | - | 931,070 | 30,457 | - | - | $ | (48,403 | ) | ||||||||||||||||||||||
Innovator U.S. Equity Buffer ETF – October | - | 978,219 | 1,012 | 927,784 | 29,070 | - | (18 | ) | $ | (49,405 | ) | |||||||||||||||||||||
Innovator U.S. Equity Buffer ETF – November | - | 978,343 | - | 929,270 | 30,894 | - | - | $ | (49,073 | ) | ||||||||||||||||||||||
Innovator U.S. Equity Buffer ETF – December | - | 980,145 | - | 927,256 | 29,013 | - | - | $ | (52,889 | ) | ||||||||||||||||||||||
9. | NEW ACCOUNTING PRONOUNCEMENTS |
In August 2021, FASB issued Accounting Standards Update 2021-06, which includes updates to Financial Services— Investment Companies (Topic 946): Amendments to SEC Paragraphs Pursuant to SEC Final Rule Releases No. 33-10786, Amendments to Financial Disclosures about Acquired and Disposed Businesses (“ASU 2021-06”). Among other revisions, the ASU 2021-06 added to the Accounting Standard Codification the text of SEC Regulation S-X Rule 6-11, Financial Statements of Funds Acquired or to Be Acquired, which governs the financial reporting for fund acquisitions by investment companies and business development companies. The amendments are effective as of the beginning of the registrant’s fiscal year beginning after December 31, 2020 (the “mandatory compliance date”). Acquisitions and dispositions that are probable or consummated after the mandatory compliance date must be evaluated for significance using the final amendments. Management has evaluated ASU 2021-06 and has adopted the relevant provisions of the disclosure framework.
10. | COVID-19 |
The recent global outbreak of COVID-19 has disrupted economic markets and the prolonged economic impact is uncertain. The operational and financial performance of the issuers of securities in which the Funds invest depend on future developments, including the duration and spread of the outbreak, and such uncertainty may in turn impact the value of the Funds’ investments.
11. | SUBSEQUENT EVENT |
Management has evaluated the impact of all subsequent events of the Funds through the date of the financial statements were issued, and has determined that there were no subsequent events requiring recognition or disclosure in the financial statements.
INNOVATOR ETFs TRUST
Trustees and Officers (Unaudited)
Name, Address and Year of Birth | Position with the Trust | Length of Time Served* | Principal Occupation(s) During Past 5 Years | Number of Portfolios in Fund Complex(a) Overseen by Trustee or Officer | Other Directorships Held by Trustee or Officer in the Past Five Years |
Independent Trustees | |||||
Mark Berg 109 N. Hale Street Wheaton, IL 60187 Year of Birth: 1971 | Trustee | Since 2017 | Founding Principal (2001-present), Chief Executive Officer (2019-present), President (2001-2019), Timothy Financial Counsel, Inc. | 87 | Tortazo, LLC (2018-present) |
Joe Stowell 109 N. Hale Street Wheaton, IL 60187 Year of Birth: 1968 | Trustee | Since 2017 | Chief Operating Officer, Woodmen Valley Chapel (2015–present). | 87 | Board of Advisors, Westmont College |
Brian J. Wildman 109 N. Hale Street Wheaton, IL 60187 Year of Birth: 1963 | Trustee | Since 2017 | President, Timothy Financial Counsel, Inc. (2019–present); Executive Vice President, Consumer Banking (2016–2019), Chief Risk Officer (2013–2016), MB Financial Bank. | 87 | Missionary Furlough Homes, Inc. (since 2008); MB Financial Bank (2003– 2019). |
INNOVATOR ETFs TRUST
Trustees and Officers (Unaudited) (Continued)
Interested Trustee & Officer | |||||
H. Bruce Bond (b) 109 N. Hale Street Wheaton, IL 60187 Year of Birth: 1963 | Interested Trustee, President and Principal Executive Officer | Since 2017 | Chief Executive Officer, Innovator Capital Management, LLC (2017–present). | 87 | None |
Officers | |||||
John W. Southard 109 N. Hale Street Wheaton, IL 60187 Year of Birth: 1969 | Vice President, Treasurer and Principal Financial Accounting Officer | Since 2017 | Chief Investment Officer, Innovator Capital Management, LLC (2017–present); Director and Co–Founder, T2 Capital Management, LLC (2010–present). | 87 | Independent Trustee, ETF Managers Group, LLC (2012–2018) |
Kevin Gustafson 109 N. Hale Street Wheaton, IL 60187 Year of Birth: 1965 | Chief Compliance Officer and Anti–Money Laundering Officer | Since 2020 | Chief Compliance Officer, Innovator Capital Management LLC (2019 - present); General Counsel, Innovator Capital Management LLC (2019 - present); Chief Compliance Officer, General Counsel and Chief Risk Officer, Americas, Eastspring Investments, Inc. (2012 - 2019). | 87 | None |
* | The Funds’ Trustees serve for an indefinite term until their resignation, death or removal. The Funds’ officers are elected annually by the Board and serve at the Board’s pleasure. |
(a) | The Fund Complex includes the Funds, each series of Innovator ETFs Trust. |
(b) | H. Bruce Bond is deemed to be an interested person of the Trust (as defined in the 1940 Act) because of his affiliation with the Adviser. |
The Statement of Additional Information includes additional information about the Trustees and is available upon request, without charge, by calling 1–877–386–3890.
INNOVATOR ETFs TRUST
Board Considerations Regarding Approval of Investment Management Agreement (Unaudited)
BOARD CONSIDERATIONS REGARDING APPROVAL OF INVESTMENT MANAGEMENT AGREEMENT AND INVESTMENT SUB-ADVISORY AGREEMENT FOR THE FOLLOWING INNOVATOR FUNDS:
Innovator Laddered Allocation Buffer ETF
At a quarterly Board meeting held on December 15, 2021, the Trust’s Board considered approval of the Advisory Agreement with Innovator Capital Management, LLC (the “Adviser”), on behalf of the Innovator Laddered Allocation Buffer ETF (the “Fund”), and the Sub-Advisory Agreement among the Trust, on behalf of the Fund, the Adviser and Penserra Capital Management LLC (“Penserra” or the “Sub-Adviser”), for an initial two-year term. The Board determined that the agreements were in the best interests of the Fund in light of the extent and quality of the services expected to be provided and such other matters as the Board considered to be relevant in the exercise of its reasonable business judgment.
To reach this determination, the Board considered its duties under the Investment Company Act of 1940, as amended (the “1940 Act”), as well as under the general principles of state law in reviewing and approving advisory contracts; the requirements of the 1940 Act in such matters; the fiduciary duty of investment advisers with respect to advisory agreements and compensation; the standards used by courts in determining whether investment company boards have fulfilled their duties; and the factors to be considered by the Board in voting on such agreements. To assist the Board in its evaluation of the agreements, the Independent Trustees received a separate report from each of the Adviser and the Sub-Adviser in advance of the Meeting responding to a request for information provided on behalf of the Independent Trustees that, among other things, outlined the services to be provided by the Adviser and the Sub-Adviser to the Fund (including the relevant personnel responsible for these services and their experience); the proposed unitary fee rate payable by the Fund as compared to fees charged to peer groups of the Fund and as compared to fees charged to other clients of the Adviser and the Sub-Adviser, including other ETFs managed by the Adviser and the Sub- Adviser; the estimated expenses of the Fund as compared to expense ratios of the funds in the respective Fund’s peer group; the nature of the expenses to be incurred in providing services to the Fund and the potential for economies of scale, if any; financial data on the Adviser and the Sub- Adviser; any fall-out benefits accruing to the Adviser or the Sub-Adviser; and information on the Adviser’s and the Sub-Adviser’s compliance programs. The Independent Trustees also met separately with their Independent Counsel to discuss the information provided by the Adviser and the Sub-Adviser. The Board applied its business judgment to determine whether the arrangements between the Trust and the Adviser and among the Trust, the Adviser and the Sub-Adviser are reasonable business arrangements from the Fund’s perspective as well as from the perspective of the Fund’s shareholders.
In evaluating whether to approve the agreements, the Board applied its business judgment and considered the nature, extent and quality of the services to be provided by the Adviser and Penserra pursuant to the agreements. With respect to the investment management agreement, the Board considered that the Adviser will be responsible for the overall management and administration of the Fund and reviewed all of the services to be provided by the Adviser to the Fund, including oversight of Penserra, as well as the background and experience of the persons responsible for such services. The Board noted that the Adviser will oversee Penserra’s day-to-day management of the Fund’s investments, including portfolio risk monitoring and performance review. In reviewing the services to be provided, the Board noted the compliance program that had been developed by the Adviser included an adequate program for monitoring the Adviser’s, Penserra’s and the Fund’s compliance with the 1940 Act, as well as the Fund’s compliance with its investment objective and policies. With respect to the sub-advisory agreement, the Board reviewed the materials provided by Penserra and noted the background and experience of Penserra’s portfolio management team and Penserra’s investment style. In light of the information presented and the considerations made, the Board concluded that the nature, extent and quality of the services to be provided to the Fund by the Adviser and Penserra under the agreements were expected to be satisfactory.
Since the Fund had yet to commence investment operations, the Board could not consider the historical investment performance of the Fund.
The Board considered the proposed unitary fee rate payable by the Fund under the investment management agreement for the services to be provided. The Board noted that, under the unitary fee arrangement, the Fund would pay the Adviser a unitary fee equal to an annual rate of 0.20% of its average daily net assets. The Board considered that, from the unitary fee for the Fund, the Adviser agreed to waive unitary fees of 0.10% of average daily net assets of the Fund until June 30, 2024.
The Board noted that the Adviser would be responsible for the Fund’s expenses, including the cost of transfer agency, custody, fund administration, legal, audit and other services and license fees (if any), but excluding the fee payment under the investment management agreement, interest, taxes, brokerage commissions and other expenses connected with the execution of portfolio transactions, and extraordinary expenses. The Board received and reviewed information for the Fund showing the advisory fee rates and expense ratios of the funds comprising of the Fund’s peer group, as well as advisory fee rates charged by the Adviser and Penserra to other funds (including ETFs) and non-fund clients, as applicable.
In light of the information considered and the nature, extent and quality of the services expected to be provided to the Fund under the agreements, the Board determined that the proposed unitary fee for the Fund, including the fee rate to be paid by the Adviser to Penserra from the unitary fee, was fair.
The Board noted that the proposed unitary fee for the Fund was structured to pass the benefits of any economies of scale on to shareholders as the Fund’s assets grow. The Board noted that any reduction in fixed costs associated with the management of the Fund would benefit the Adviser and Penserra, but that the unitary fee structure provides a level of certainty in expenses for the Fund. The Board noted that the Adviser is continuing to invest in personnel and infrastructure for the Innovator fund complex.
Because the Fund has not yet commenced operations and the actual asset base of the Fund has not yet been determined, the Board noted that there was no historical profitability information with respect to the Fund to be reviewed. The Board noted that it would review profitability information in connection with subsequent renewals of the agreements.
The Board considered potential “fall-out” or ancillary benefits anticipated to be received by the Adviser and Penserra. The Board concluded that the character and amount of potential fall-out benefits to the Adviser and Penserra were consistent with the types of benefits generally derived by investment managers and sub-advisers to funds.
Based on all of the information considered and the conclusions reached, the Board, including the Independent Trustees, unanimously determined that the terms of the agreements are fair and that the approval of the agreements is in the best interests of the Fund. No single factor was determinative in the Board’s analysis.
BOARD CONSIDERATIONS REGARDING APPROVAL OF INVESTMENT MANAGEMENT AGREEMENT AND INVESTMENT SUB-ADVISORY AGREEMENT FOR THE FOLLOWING INNOVATOR FUNDS:
Innovator Step-Up U.S. Equity Buffer ETF
Innovator Step-Up U.S. Equity Power Buffer ETF
At a quarterly Board meeting held on December 15, 2021, the Trust’s Board considered approval of the Advisory Agreement with Innovator Capital Management, LLC (the “Adviser”), on behalf of the Innovator Step-Up U.S. Equity Buffer ETF, and Innovator Step-Up U.S. Equity Power Buffer ETF (the “Funds”), and the Sub-Advisory Agreement among the Trust, on behalf of the Funds, the Adviser and Milliman Financial Risk Management LLC (“Milliman” or the “Sub- Adviser”), for an initial two-year term. The Board determined that the agreements were in the best interests of the Funds in light of the extent and quality of the services expected to be provided and such other matters as the Board considered to be relevant in the exercise of its reasonable business judgment.
To reach this determination, the Board considered its duties under the Investment Company Act of 1940, as amended (the “1940 Act”), as well as under the general principles of state law in reviewing and approving advisory contracts; the requirements of the 1940 Act in such matters; the fiduciary duty of investment advisers with respect to advisory agreements and compensation; the standards used by courts in determining whether investment company boards have fulfilled their duties; and the factors to be considered by the Board in voting on such agreements. To assist the Board in its evaluation of the agreements, the Independent Trustees received a separate report from each of the Adviser and the Sub-Adviser in advance of the Meeting responding to a request for information provided on behalf of the Independent Trustees that, among other things, outlined the services to be provided by the Adviser and the Sub-Adviser to the Funds (including the relevant personnel responsible for these services and their experience); the proposed unitary fee rate payable by each Fund as compared to fees charged to peer groups of the Funds and as compared to fees charged to other clients of the Adviser and the Sub-Adviser, including other ETFs managed by the Adviser and the Sub- Adviser; the estimated expenses of the Funds as compared to expense ratios of the funds in the respective Fund’s peer group; the nature of the expenses to be incurred in providing services to the Funds and the potential for economies of scale, if any; financial data on the Adviser and the Sub- Adviser; any fall-out benefits accruing to the Adviser or the Sub-Adviser; and information on the Adviser’s and the Sub-Adviser’s compliance programs. The Independent Trustees also met separately with their Independent Counsel to discuss the information provided by the Adviser and the Sub-Adviser. The Board applied its business judgment to determine whether the arrangements between the Trust and the Adviser and among the Trust, the Adviser and the Sub-Adviser are reasonable business arrangements from each Fund’s perspective as well as from the perspective of each Fund’s shareholders.
In evaluating whether to approve the agreements, the Board applied its business judgment and considered the nature, extent and quality of the services to be provided by the Adviser and Milliman pursuant to the agreements. With respect to the investment management agreement, the Board considered that the Adviser will be responsible for the overall management and administration of the Funds and reviewed all of the services to be provided by the Adviser to the Funds, including oversight of Milliman, as well as the background and experience of the persons responsible for such services. The Board noted that the Adviser will oversee Milliman’s day-to-day management of each of the Fund’s investments, including portfolio risk monitoring and performance review. In reviewing the services to be provided, the Board noted the compliance program that had been developed by the Adviser included an adequate program for monitoring the Adviser’s, Milliman’s and each Fund’s compliance with the 1940 Act, as well as each Fund’s compliance with its investment objective and policies. With respect to the sub-advisory agreement, the Board reviewed the materials provided by Milliman and noted the background and experience of Milliman’s portfolio management team and Milliman’s investment style. In light of the information presented and the considerations made, the Board concluded that the nature, extent and quality of the services to be provided to the Funds by the Adviser and Milliman under the agreements were expected to be satisfactory.
Since the Funds had yet to commence investment operations, the Board could not consider the historical investment performance of the Funds.
The Board considered the proposed unitary fee rate payable by each Fund under the investment management agreement for the services to be provided. The Board noted that, under the unitary fee arrangement, each Fund would pay the Adviser a unitary fee equal to an annual rate of 0.79% of its average daily net assets. The Board considered that, from the unitary fee for each of the Funds, the Adviser would pay Milliman an annual sub-advisory fee equal to 0.12% on each Fund’s assets under management.
The Board noted that the Adviser would be responsible for the Funds’ expenses, including the cost of transfer agency, custody, fund administration, legal, audit and other services and license fees (if any), but excluding the fee payment under the investment management agreement, interest, taxes, brokerage commissions and other expenses connected with the execution of portfolio transactions, and extraordinary expenses. The Board received and reviewed information for the Funds showing the advisory fee rates and expense ratios of the funds comprising of each Fund’s peer group, as well as advisory fee rates charged by the Adviser and Milliman to other funds (including ETFs) and non-fund clients, as applicable. In light of the information considered and the nature, extent and quality of the services expected to be provided to the Funds under the agreements, the Board determined that the proposed unitary fee for each of the Funds, including the fee rate to be paid by the Adviser to Milliman from the unitary fee, was fair.
The Board noted that the proposed unitary fee for each of the Funds were structured to pass the benefits of any economies of scale on to shareholders as the respective Fund’s assets grow. The Board noted that any reduction in fixed costs associated with the management of the respective Fund would benefit the Adviser and Milliman, but that the unitary fee structure provides a level of certainty in expenses for each of the Funds. The Board noted that the Adviser is continuing to invest in personnel and infrastructure for the Innovator fund complex.
Because the Funds have not yet commenced operations and the actual asset base of the Funds have not yet been determined, the Board noted that there was no historical profitability information with respect to the Funds to be reviewed. The Board noted that it would review profitability information in connection with subsequent renewals of the agreements.
The Board considered potential “fall-out” or ancillary benefits anticipated to be received by the Adviser and Milliman. The Board concluded that the character and amount of potential fall-out benefits to the Adviser and Milliman were consistent with the types of benefits generally derived by investment managers and sub-advisers to funds.
Based on all of the information considered and the conclusions reached, the Board, including the Independent Trustees, unanimously determined that the terms of the agreements are fair and that the approval of the agreements is in the best interests of the Funds. No single factor was determinative in the Board’s analysis.
INNOVATOR ETFs TRUST
Additional Information (Unaudited)
1. | INFORMATION ABOUT PROSPECTUS |
This report has been prepared for shareholders and may be distributed to others only if preceded or accompanied by a current prospectus. Investors should consider the investment objective and policies, risk considerations, charges and ongoing expenses of an investment carefully before investing. The prospectus contains this and other information relevant to an investment in the respective Fund. Please read the Prospectus carefully before investing. A copy of the Prospectus may be obtained without charge by writing to the Trust’s Distributor, or by calling toll free at 1–800–208–5212 or visiting www.innovatoretfs.com.
2. | PROXY VOTING POLICIES AND PROCEDURES |
The Trust’s Proxy Voting Policies and Procedures are available without charge, upon request, by calling 1–877–386–3890 and on the SEC’s website at www.sec.gov. Information relating to how each Fund voted proxies relating to portfolio securities held during each year ended June 30 is also available on the SEC’S website at www.sec.gov.
3. | INFORMATION ABOUT PORTFOLIO SECURITIES |
Each Funds’ complete schedule of portfolio holdings for the first and third quarters is filed with the SEC on Form N–Q or Part F of Form N–PORT (beginning with filings after March 31, 2020). The Trust’s Form N–Q or Part F of Form
N–PORT is available without charge, upon request, by calling 1–877–386–3890, or on the SEC’s website at www.sec.gov. The Trust’s Form N–Q or Part F of Form N–PORT may be reviewed and copied at the SEC’s Public Reference Room in Washington, DC. Information on the operation of the Public Reference Room may be obtained by calling 1–800–SEC–0330.
4. | HOUSEHOLD DELIVERY OF SHAREHOLDER DOCUMENTS |
In order to reduce expenses, the Trust delivers one copy of an annual/semi–annual report, prospectus and/or proxy statement on behalf of two or more shareholders at a shared address (householding). If you do not wish to participate in householding, please indicate this preference on your new account application (if you are opening a new account) or call 1–877–FUND890 (877–386–3890) to change the status of your existing account. You may change your status at any time.
INNOVATOR ETFs TRUST
Additional Information (Unaudited) (Continued)
5. ELECTRONIC DELIVERY OF SHAREHOLDER DOCUMENTS
You may choose to receive a Fund’s prospectus and annual and semi–annual reports electronically. To sign up for electronic delivery, visit www.icsdelivery.com and select the first letter of your brokerage firm’s name. Then, select your brokerage institution from the list that follows, fill out the appropriate information and provide an e–mail address where you would like your information sent. If your brokerage firm is not listed, electronic delivery may not be available. Please contact your brokerage firm or financial adviser.
6. TAX NOTICE
For the fiscal year ended October 31, 2021, certain dividends paid by the Funds may be subject to a maximum tax rate of 23.8%, as provided for the Jobs and Growth Tax Relief Reconciliation Act of 2003.
The following table lists the percentages of dividend income distributed for the year ended October 31, 2021, that were designated as qualified dividend income under the Jobs and Growth Tax Relief Reconciliation Act of 2003 and qualify for the corporate dividends received deduction, respectively:
% of Dividend Income Distributed | ||||||||
Fund | Qualified Dividend Income | Corporate Dividends Received Deduction | ||||||
FFTY | 0.00 | % | 0.00 | % | ||||
BOUT | 0.00 | 0.00 | ||||||
LOUP | 0.00 | 0.00 | ||||||
EPRF | 71.98 | 66.25 | ||||||
BUFF | 0.00 | 0.00 | ||||||
For the taxable year ended October 31, 2021, the Funds didn’t pay any ordinary income distributions that were designated as short–term capital gain distributions under Internal Revenue Section 871(k)2(c).
INVESTMENT ADVISOR
Innovator Capital Management, LLC
109 North Hale Street
Wheaton, IL 60187
INVESTMENT SUB–ADVISOR
Penserra Capital Management LLC
140 Broadway, 26th Floor
New York, NY 10005
ADMINISTRATOR, FUND ACCOUNTANT & TRANSFER AGENT
U.S. Bancorp Fund Services, LLC
615 East Michigan Street
Milwaukee, WI 53202
DISTRIBUTOR
Foreside Fund Services, LLC
Three Canal Plaza
Portland, ME 04101
CUSTODIAN
U.S. Bank, N.A.
1555 North RiverCenter Drive, Suite 302
Milwaukee, WI 53212
LEGAL COUNSEL
Chapman and Cutler LLP
320 South Canal Street, 27th Floor
Chicago, IL 60606
INDEPENDENT REGISTERED PUBLIC ACCOUNTING FIRM
Cohen & Company, Ltd.
1350 Euclid Ave., Suite 800
Cleveland, OH 44115

TABLE OF CONTENTS
| Letter to Shareholders | 3 |
| Fund Performance | 6 |
| Expense Example | 78 |
| Schedules of Investments and Options Written | 81 |
| Statements of Assets and Liabilities | 153 |
| Statements of Operations | 162 |
| Statements of Changes in Net Assets | 171 |
| Financial Highlights | 180 |
| Notes to Financial Statements | 189 |
| Trustees and Officers | 219 |
| Additional Information | 221 |
Letter to Shareholders (Unaudited)
Dear Valued Shareholders,
Thank you for your interest in Innovator ETFs.
The six-month period ended April 30, 2022 was marked by a number of confounding challenges. Just when much of the world was beginning to move beyond many of the constraints imposed from the Covid pandemic, a war broke out in Europe and inflation climbed to its highest level in 40 years. Central banks began to tighten monetary policy even as disruptions to global supply chains persisted.
In recent years, prior to the 2022 bond market selloff, historically-low bond yields meant that one of the few remaining portfolio benefits from a bond allocation was as a diversifier against a downturn in stocks. In 2022, however, we believe the traditional bond allocation that investors have relied on for decades has not lived up to the task. In the face of these economic challenges, not only did the stock market fall 10%, but the bond market also suffered a 9.5% loss, its worst six-month return since March 1980.1
At Innovator, we have been focused for several years on the challenges posed by bonds and the potential solution that Defined Outcome ETFs™ can provide - and the industry has been listening. During the six months ended April 30, 2022, Defined Outcome ETFs™ saw $3.3 billion in net flows, representing industry growth of 38%. Not surprisingly, ETFs with 15% and 30% buffers garnered the lion’s share of flows as investors sought out higher levels of risk management.
Among the 148 ETFs receiving Morningstar’s “Defined Outcome ETF” designation, Innovator remains the leader with a total of 79 ETFs and more than $6.2 billion in assets.
During this period, Innovator rounded out its industry-first suite of US Equity Accelerated ETFs®, which seek to offer 2x or 3x the upside of the SPDR S&P 500 ETF (SPY) to a cap, with 1-to-1 exposure on the downside over the outcome period.
I’m also pleased to be able to report that Innovator’s Buffer ETFs™ have performed as they were designed to, mitigating equity market drawdown and volatility during this period. On average, our 36 US Equity Buffer ETFs™ exhibited just 43% participation in the downside of the SPY and only 48% of its volatility.
Letter to Shareholders (Unaudited) (Continued)
Amidst these challenging market conditions, Innovator remains committed to providing products that enable investors to redefine the risk and reward of their market exposures. We intend to continue striving to earn your trust and look forward to working together to bring meaningful solutions to the ever-changing investment landscape.
On behalf of the team at Innovator, thank you for your confidence in us and in the products we offer. May the Lord grant all of us wisdom and peace in the months ahead.
Bruce Bond
Chief Executive Officer
The views in this report were those of the Fund’s CEO as of April 30, 2022 and may not reflect his views on the date that this report is first published or anytime thereafter. These views are intended to assist shareholders in understanding their investments and do not constitute investment advice.
1. | Source: Bloomberg LP. Stock and bond market measured by the S&P 500 Index and Bloomberg US Aggregate Bond Index, respectively. |
Letter to Shareholders (Unaudited) (Continued)
The funds only seek to provide their investment objective, which is not guaranteed, over the course of an entire outcome period. Investors who purchase shares after or sell shares before the end of an outcome period will experience very different outcomes than the funds seek to provide.
The Funds have characteristics unlike many other traditional investment products and may not be suitable for all investors. For more information regarding whether an investment in the Fund is right for you, please see Investor Suitability" in the prospectus.
The Funds are designed to provide point-to-point exposure to the price return of a reference asset via a basket of Flex Options. As a result, the ETFs are not expected to move directly in line with the reference asset during the interim period. Additionally, FLEX Options may be less liquid than standard options. In a less liquid market for the FLEX Options, the Fund may have difficulty closing out certain FLEX Options positions at desired times and prices.
Fund shareholders are subject to an upside return cap (Cap) that represents the maximum percentage return an investor can achieve from an investment in the funds' for the Outcome Period, before fees and expenses. If the Outcome Period has begun and the Fund has increased in value to a level near to the Cap, an investor purchasing at that price has little or no ability to achieve gains but remains vulnerable to downside risks. Additionally, the Cap may rise or fall from one Outcome Period to the next. The Cap, and the Fund's position relative to it, should be considered before investing in the Fund. The Funds' website, www.innovatoretfs.com, provides important Fund information as well information relating to the potential outcomes of an investment in a Fund on a daily basis.
Buffer ETFs: The Funds only seek to provide shareholders that hold shares for the entire Outcome Period with their respective buffer level against reference asset losses during the Outcome Period. You will bear all reference asset losses exceeding the buffer. Depending upon market conditions at the time of purchase, a shareholder that purchases shares after the Outcome Period has begun may also lose their entire investment. For instance, if the Outcome Period has begun and the Fund has decreased in value beyond the pre-determined buffer, an investor purchasing shares at that price may not benefit from the buffer. Similarly, if the Outcome Period has begun and the Fund has increased in value, an investor purchasing shares at that price may not benefit from the buffer until the Fund's value has decreased to its value at the commencement of the Outcome Period.
Letter to Shareholders (Unaudited) (Continued)
Accelerated ETFs: If the Outcome Period has begun and the Fund has experienced an accelerated return, an investor purchasing Shares at that price may be subject to losses that exceed any losses of the Underlying ETF for the remainder of the Outcome Period and may have diminished or no ability to experience further accelerated return, therefore exposing the investor to greater downside risks.
This material must be preceded by or accompanied with a prospectus. The Funds' investment objectives, risks, charges and expenses should be considered carefully before investing. The prospectus contains this and other important information, and it may be obtained at innovatoretfs.com. Read it carefully before investing.
Innovator ETFs are distributed by Foreside Fund Services, LLC.
INNOVATOR U.S. EQUITY BUFFER ETF – JANUARY
Fund Performance
April 30, 2022 (Unaudited)
The following chart compares the value of a hypothetical $10,000 investment in the Innovator U.S. Equity Buffer ETF - January from its inception (December 31, 2018) to April 30, 2022 as compared with the S&P 500® Index – Price Return and Total Return.
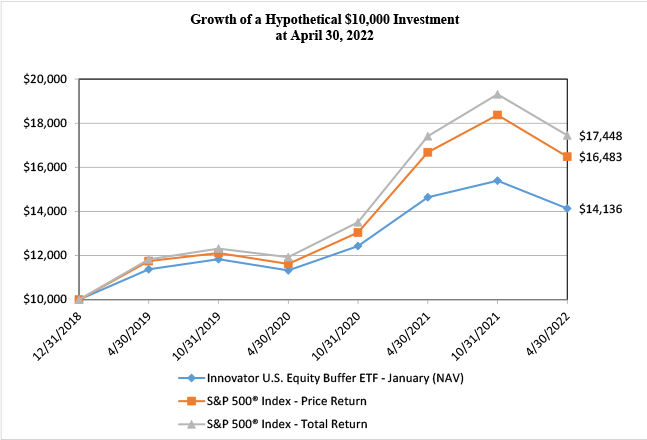
Average Annual Total Returns as of April 30, 2022 | ||||||||||||
One Year | Three Years | Since Inception (a) | ||||||||||
Innovator U.S. Equity Buffer ETF - January | ||||||||||||
NAV Return | -3.46 | % | 7.52 | % | 10.96 | % | ||||||
Market Return | -3.24 | % | 7.45 | % | 10.93 | % | ||||||
S&P 500® Index - Price Return | -1.18 | % | 11.94 | % | 16.20 | % | ||||||
S&P 500® Index - Total Return | 0.21 | % | 13.85 | % | 18.20 | % | ||||||
(a) | Inception date is December 31, 2018. |
Performance data quoted represents past performance and does not guarantee future results. The investment return and principal value of an investment will fluctuate so that an investor’s shares, when redeemed, may be worth more or less than their original cost. Current performance of the Fund may be lower or higher than the performance quoted. As of the latest prospectus, the net expense ratio of the Fund was 0.79%. For the most recent performance, please visit the Fund’s website at innovatoretfs.com.
INNOVATOR U.S. EQUITY BUFFER ETF – JANUARY
Fund Performance
April 30, 2022 (Unaudited) (Continued)
The line graph and performance table do not reflect the deduction of taxes that a shareholder may pay on fund distributions or the redemption of Fund shares. Returns shown for the Fund and S&P 500® Index – Total Return include the reinvestment of all dividends, if any. Returns shown for the S&P 500® Index – Price Return do not include the reinvestment of dividends, if any.
The S&P 500® Index is an unmanaged, capitalization–weighted index generally representative of the U.S. market for large capitalization stocks.
The Fund’s portfolio holdings may differ significantly from the securities held in the relevant index and, unlike an exchange–traded fund, the performance of an unmanaged index does not reflect deductions for transaction costs, taxes, management fees or other expenses.
You cannot invest directly in an index.
Premium/Discount Information:
Information regarding the differences between the price of the Fund’s shares on the secondary market and the Fund’s net asset value is available at Innovatoretfs.com/BJAN.
INNOVATOR U.S. EQUITY BUFFER ETF – FEBRUARY
Fund Performance
April 30, 2022 (Unaudited)
The following chart compares the value of a hypothetical $10,000 investment in the Innovator U.S. Equity Buffer ETF – February from its inception (January 31, 2020) to April 30, 2022 as compared with the S&P 500® Index - Price Return and Total Return.
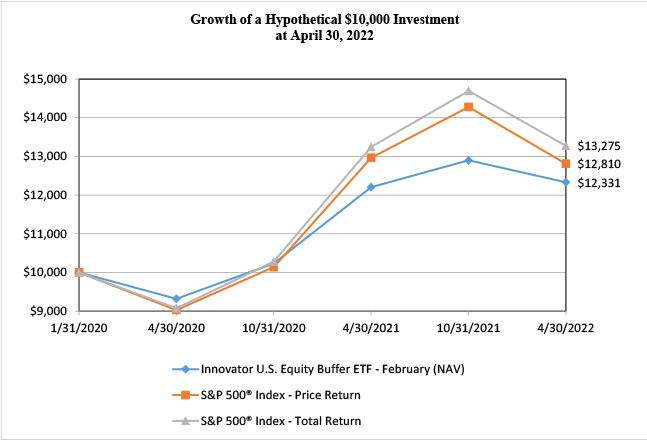
Average Annual Total Returns as of April 30, 2022 | ||||||||
One Year | Since Inception (a) | |||||||
Innovator U.S. Equity Buffer ETF - February | ||||||||
NAV Return | 1.01 | % | 9.77 | % | ||||
Market Return | 1.28 | % | 9.80 | % | ||||
S&P 500® Index - Price Return | -1.18 | % | 11.65 | % | ||||
S&P 500® Index - Total Return | 0.21 | % | 13.44 | % | ||||
(a) | Inception date is January 31, 2020. |
Performance data quoted represents past performance and does not guarantee future results. The investment return and principal value of an investment will fluctuate so that an investor’s shares, when redeemed, may be worth more or less than their original cost. Current performance of the Fund may be lower or higher than the performance quoted. As of the latest prospectus, the net expense ratio of the Fund was 0.79%. For the most recent performance, please visit the Fund’s website at innovatoretfs.com.
INNOVATOR U.S. EQUITY BUFFER ETF – FEBRUARY
Fund Performance
April 30, 2022 (Unaudited) (Continued)
The line graph and performance table do not reflect the deduction of taxes that a shareholder may pay on fund distributions or the redemption of Fund shares. Returns shown for the Fund and S&P 500® Index - Total Return include the reinvestment of all dividends, if any. Returns shown for the S&P 500® Index - Price Return do not include the reinvestment of dividends, if any.
The S&P 500® Index is an unmanaged, capitalization-weighted index generally representative of the U.S. market for large capitalization stocks.
The Fund’s portfolio holdings may differ significantly from the securities held in the relevant index and, unlike an exchange-traded fund, the performance of an unmanaged index does not reflect deductions for transaction costs, taxes, management fees or other expenses.
You cannot invest directly in an index.
Premium/Discount Information:
Information regarding the differences between the price of the Fund’s shares on the secondary market and the Fund’s net asset value is available at Innovatoretfs.com/BFEB.
INNOVATOR U.S. EQUITY BUFFER ETF – MARCH
Fund Performance
April 30, 2022 (Unaudited)
The following chart compares the value of a hypothetical $10,000 investment in the Innovator U.S. Equity Buffer ETF – March from its inception (February 28, 2020) to April 30, 2022 as compared with the S&P 500® Index - Price Return and Total Return.
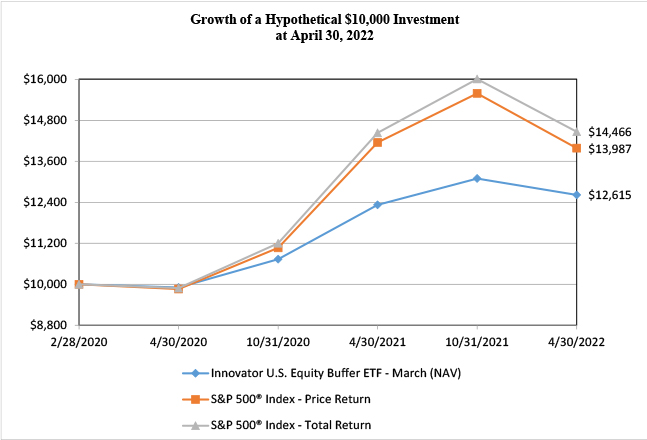
Average Annual Total Returns as of April 30, 2022 | ||||||||
One Year | Since Inception (a) | |||||||
Innovator U.S. Equity Buffer ETF - March | ||||||||
NAV Return | 2.35 | % | 11.30 | % | ||||
Market Return | 2.20 | % | 11.22 | % | ||||
S&P 500® Index - Price Return | -1.18 | % | 16.72 | % | ||||
S&P 500® Index - Total Return | 0.21 | % | 18.55 | % | ||||
(a) | Inception date is February 28, 2020. |
Performance data quoted represents past performance and does not guarantee future results. The investment return and principal value of an investment will fluctuate so that an investor’s shares, when redeemed, may be worth more or less than their original cost. Current performance of the Fund may be lower or higher than the performance quoted. As of the latest prospectus, the net expense ratio of the Fund was 0.79%. For the most recent performance, please visit the Fund’s website at innovatoretfs.com.
INNOVATOR U.S. EQUITY BUFFER ETF – MARCH
Fund Performance
April 30, 2022 (Unaudited) (Continued)
The line graph and performance table do not reflect the deduction of taxes that a shareholder may pay on fund distributions or the redemption of Fund shares. Returns shown for the Fund and S&P 500® Index - Total Return include the reinvestment of all dividends, if any. Returns shown for the S&P 500® Index - Price Return do not include the reinvestment of dividends, if any.
The S&P 500® Index is an unmanaged, capitalization-weighted index generally representative of the U.S. market for large capitalization stocks.
The Fund’s portfolio holdings may differ significantly from the securities held in the relevant index and, unlike an exchange-traded fund, the performance of an unmanaged index does not reflect deductions for transaction costs, taxes, management fees or other expenses.
You cannot invest directly in an index.
Premium/Discount Information:
Information regarding the differences between the price of the Fund’s shares on the secondary market and the Fund’s net asset value is available at Innovatoretfs.com/BMAR.
INNOVATOR U.S. EQUITY BUFFER ETF – APRIL
Fund Performance
April 30, 2022 (Unaudited)
The following chart compares the value of a hypothetical $10,000 investment in the Innovator U.S. Equity Buffer ETF – April from its inception (March 29, 2019) to April 30, 2022 as compared with the S&P 500® Index – Price Return and Total Return.
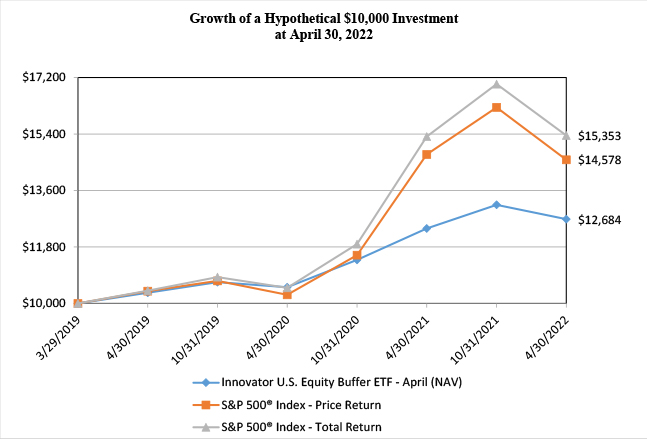
Average Annual Total Returns as of April 30, 2022 | ||||||||||||
One Year | Three Years | Since Inception (a) | ||||||||||
Innovator U.S. Equity Buffer ETF - April | ||||||||||||
NAV Return | 2.37 | % | 7.05 | % | 8.00 | % | ||||||
Market Return | 2.40 | % | 7.06 | % | 8.07 | % | ||||||
S&P 500® Index - Price Return | -1.18 | % | 11.94 | % | 12.98 | % | ||||||
S&P 500® Index - Total Return | 0.21 | % | 13.85 | % | 14.90 | % | ||||||
(a) | Inception date is March 29, 2019. |
Performance data quoted represents past performance and does not guarantee future results. The investment return and principal value of an investment will fluctuate so that an investor’s shares, when redeemed, may be worth more or less than their original cost. Current performance of the Fund may be lower or higher than the performance quoted. As of the latest prospectus, the net expense ratio of the Fund was 0.79%. For the most recent performance, please visit the Fund’s website at innovatoretfs.com.
INNOVATOR U.S. EQUITY BUFFER ETF – APRIL
Fund Performance
April 30, 2022 (Unaudited) (Continued)
The line graph and performance table do not reflect the deduction of taxes that a shareholder may pay on fund distributions or the redemption of Fund shares. Returns shown for the Fund and S&P 500® Index – Total Return include the reinvestment of all dividends, if any. Returns shown for the S&P 500® Index – Price Return do not include the reinvestment of dividends, if any.
The S&P 500® Index is an unmanaged, capitalization–weighted index generally representative of the U.S. market for large capitalization stocks.
The Fund’s portfolio holdings may differ significantly from the securities held in the relevant index and, unlike an exchange–traded fund, the performance of an unmanaged index does not reflect deductions for transaction costs, taxes, management fees or other expenses.
You cannot invest directly in an index.
Premium/Discount Information:
Information regarding the differences between the price of the Fund’s shares on the secondary market and the Fund’s net asset value is available at Innovatoretfs.com/BAPR.
INNOVATOR U.S. EQUITY BUFFER ETF – MAY
Fund Performance
April 30, 2022 (Unaudited)
The following chart compares the value of a hypothetical $10,000 investment in the Innovator U.S. Equity Buffer ETF – May from its inception (April 30, 2020) to April 30, 2022 as compared with the S&P 500® Index - Price Return and Total Return.

Average Annual Total Returns as of April 30, 2022 | ||||||||
One Year | Since Inception (a) | |||||||
Innovator U.S. Equity Buffer ETF - May | ||||||||
NAV Return | -0.84 | % | 8.46 | % | ||||
Market Return | -0.79 | % | 8.55 | % | ||||
S&P 500® Index - Price Return | -1.18 | % | 19.11 | % | ||||
S&P 500® Index - Total Return | 0.21 | % | 20.95 | % | ||||
(a) | Inception date is April 30, 2020. |
Performance data quoted represents past performance and does not guarantee future results. The investment return and principal value of an investment will fluctuate so that an investor’s shares, when redeemed, may be worth more or less than their original cost. Current performance of the Fund may be lower or higher than the performance quoted. As of the latest prospectus, the net expense ratio of the Fund was 0.79%. For the most recent performance, please visit the Fund’s website at innovatoretfs.com.
INNOVATOR U.S. EQUITY BUFFER ETF – MAY
Fund Performance
April 30, 2022 (Unaudited) (Continued)
The line graph and performance table do not reflect the deduction of taxes that a shareholder may pay on fund distributions or the redemption of Fund shares. Returns shown for the Fund and S&P 500® Index - Total Return include the reinvestment of all dividends, if any. Returns shown for the S&P 500® Index -Price Return do not include the reinvestment of dividends, if any.
The S&P 500® Index is an unmanaged, capitalization-weighted index generally representative of the U.S. market for large capitalization stocks.
The Fund’s portfolio holdings may differ significantly from the securities held in the relevant index and, unlike an exchange-traded fund, the performance of an unmanaged index does not reflect deductions for transaction costs, taxes, management fees or other expenses.
You cannot invest directly in an index.
Premium/Discount Information:
Information regarding the differences between the price of the Fund’s shares on the secondary market and the Fund’s net asset value is available at Innovatoretfs.com/BMAY.
INNOVATOR U.S. EQUITY BUFFER ETF – JUNE
Fund Performance
April 30, 2022 (Unaudited)
The following chart compares the value of a hypothetical $10,000 investment in the Innovator U.S. Equity Buffer ETF – June from its inception (May 31, 2019) to April 30, 2022 as compared with the S&P 500® Index – Price Return and Total Return.
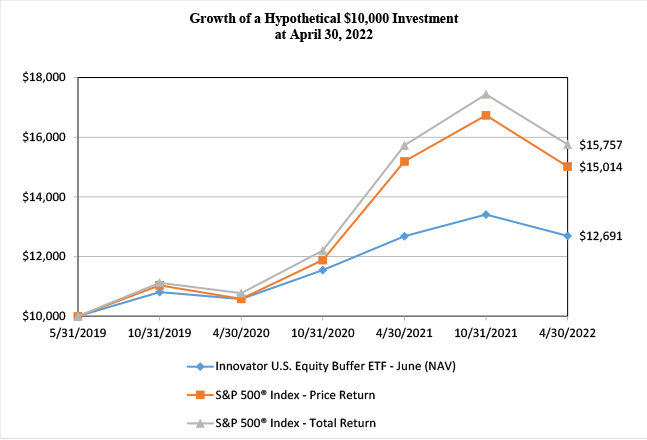
Average Annual Total Returns as of April 30, 2022 | ||||||||
One Year | Since Inception (a) | |||||||
Innovator U.S. Equity Buffer ETF - June | ||||||||
NAV Return | 0.06 | % | 8.51 | % | ||||
Market Return | 0.08 | % | 8.46 | % | ||||
S&P 500® Index - Price Return | -1.18 | % | 14.94 | % | ||||
S&P 500® Index - Total Return | 0.21 | % | 16.86 | % | ||||
(a) | Inception date is May 31, 2019. |
Performance data quoted represents past performance and does not guarantee future results. The investment return and principal value of an investment will fluctuate so that an investor’s shares, when redeemed, may be worth more or less than their original cost. Current performance of the Fund may be lower or higher than the performance quoted. As of the latest prospectus, the net expense ratio of the Fund was 0.79%. For the most recent performance, please visit the Fund’s website at innovatoretfs.com.
INNOVATOR U.S. EQUITY BUFFER ETF – JUNE
Fund Performance
April 30, 2022 (Unaudited) (Continued)
The line graph and performance table do not reflect the deduction of taxes that a shareholder may pay on fund distributions or the redemption of Fund shares. Returns shown for the Fund and S&P 500® Index – Total Return include the reinvestment of all dividends, if any. Returns shown for the S&P 500® Index – Price Return do not include the reinvestment of dividends, if any.
The S&P 500® Index is an unmanaged, capitalization–weighted index generally representative of the U.S. market for large capitalization stocks.
The Fund’s portfolio holdings may differ significantly from the securities held in the relevant index and, unlike an exchange–traded fund, the performance of an unmanaged index does not reflect deductions for transaction costs, taxes, management fees or other expenses.
You cannot invest directly in an index.
Premium/Discount Information:
Information regarding the differences between the price of the Fund’s shares on the secondary market and the Fund’s net asset value is available at Innovatoretfs.com/BJUN.
INNOVATOR U.S. EQUITY BUFFER ETF – JULY
Fund Performance
April 30, 2022 (Unaudited)
The following chart compares the value of a hypothetical $10,000 investment in the Innovator U.S. Equity Buffer ETF – July from its inception (August 28, 2018) to April 30, 2022 as compared with the S&P 500® Index – Price Return and Total Return.
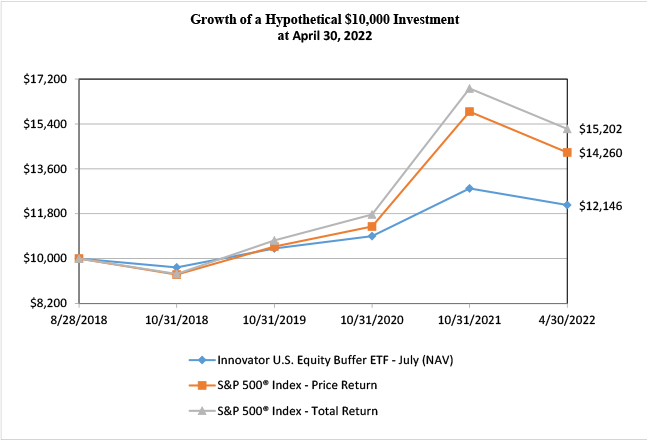
Average Annual Total Returns as of April 30, 2022 | ||||||||||||
One Year | Three Years | Since Inception (a) | ||||||||||
Innovator U.S. Equity Buffer ETF - July | ||||||||||||
NAV Return | -0.78 | % | 6.01 | % | 5.44 | % | ||||||
Market Return | -0.61 | % | 5.93 | % | 5.41 | % | ||||||
S&P 500® Index - Price Return | -1.18 | % | 11.94 | % | 10.15 | % | ||||||
S&P 500® Index - Total Return | 0.21 | % | 13.85 | % | 12.08 | % | ||||||
(a) | Inception date is August 28, 2018. |
Performance data quoted represents past performance and does not guarantee future results. The investment return and principal value of an investment will fluctuate so that an investor’s shares, when redeemed, may be worth more or less than their original cost. Current performance of the Fund may be lower or higher than the performance quoted. As of the latest prospectus, the net expense ratio of the Fund was 0.79%. For the most recent performance, please visit the Fund’s website at innovatoretfs.com
INNOVATOR U.S. EQUITY BUFFER ETF – JULY
Fund Performance
April 30, 2022 (Unaudited) (Continued)
The line graph and performance table do not reflect the deduction of taxes that a shareholder may pay on fund distributions or the redemption of Fund shares. Returns shown for the Fund and S&P 500® Index – Total Return include the reinvestment of all dividends, if any. Returns shown for the S&P 500® Index – Price Return do not include the reinvestment of dividends, if any.
The S&P 500® Index is an unmanaged, capitalization–weighted index generally representative of the U.S. market for large capitalization stocks.
The Fund’s portfolio holdings may differ significantly from the securities held in the relevant index and, unlike an exchange–traded fund, the performance of an unmanaged index does not reflect deductions for transaction costs, taxes, management fees or other expenses.
You cannot invest directly in an index.
Premium/Discount Information:
Information regarding the differences between the price of the Fund’s shares on the secondary market and the Fund’s net asset value is available at Innovatoretfs.com/BJUL.
INNOVATOR U.S. EQUITY BUFFER ETF – AUGUST
Fund Performance
April 30, 2022 (Unaudited)
The following chart compares the value of a hypothetical $10,000 investment in the Innovator U.S. Equity Buffer ETF – August from its inception (July 31, 2019) to April 30, 2022 as compared with the S&P 500® Index – Price Return and Total Return.
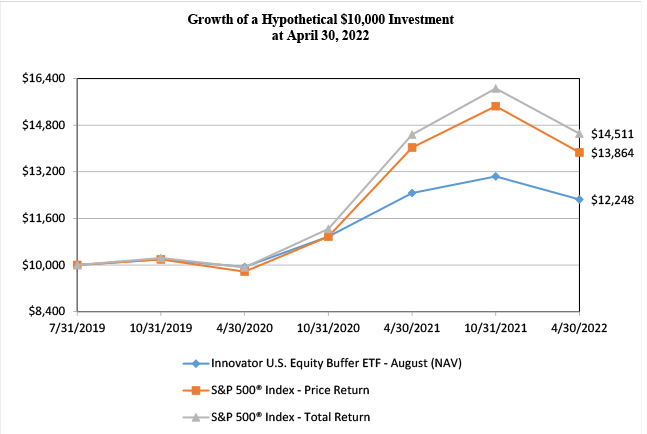
Average Annual Total Returns as of April 30, 2022 | ||||||||
One Year | Since Inception (a) | |||||||
Innovator U.S. Equity Buffer ETF - August | ||||||||
NAV Return | -1.79 | % | 7.65 | % | ||||
Market Return | -1.67 | % | 7.60 | % | ||||
S&P 500® Index - Price Return | -1.18 | % | 12.61 | % | ||||
S&P 500® Index - Total Return | 0.21 | % | 14.49 | % | ||||
(a) | Inception date is July 31, 2019. |
Performance data quoted represents past performance and does not guarantee future results. The investment return and principal value of an investment will fluctuate so that an investor’s shares, when redeemed, may be worth more or less than their original cost. Current performance of the Fund may be lower or higher than the performance quoted. As of the latest prospectus, the net expense ratio of the Fund was 0.79%. For the most recent performance, please visit the Fund’s website at innovatoretfs.com.
INNOVATOR U.S. EQUITY BUFFER ETF – AUGUST
Fund Performance
April 30, 2022 (Unaudited) (Continued)
The line graph and performance table do not reflect the deduction of taxes that a shareholder may pay on fund distributions or the redemption of Fund shares. Returns shown for the Fund and S&P 500® Index – Total Return include the reinvestment of all dividends, if any. Returns shown for the S&P 500® Index – Price Return do not include the reinvestment of dividends, if any.
The S&P 500® Index is an unmanaged, capitalization–weighted index generally representative of the U.S. market for large capitalization stocks.
The Fund’s portfolio holdings may differ significantly from the securities held in the relevant index and, unlike an exchange–traded fund, the performance of an unmanaged index does not reflect deductions for transaction costs, taxes, management fees or other expenses.
You cannot invest directly in an index.
Premium/Discount Information:
Information regarding the differences between the price of the Fund’s shares on the secondary market and the Fund’s net asset value is available at Innovatoretfs.com/BAUG.
INNOVATOR U.S. EQUITY BUFFER ETF – SEPTEMBER
Fund Performance
April 30, 2022 (Unaudited)
The following chart compares the value of a hypothetical $10,000 investment in the Innovator U.S. Equity Buffer ETF – September from its inception (August 30, 2019) to April 30, 2022 as compared with the S&P 500® Index – Price Return and Total Return.
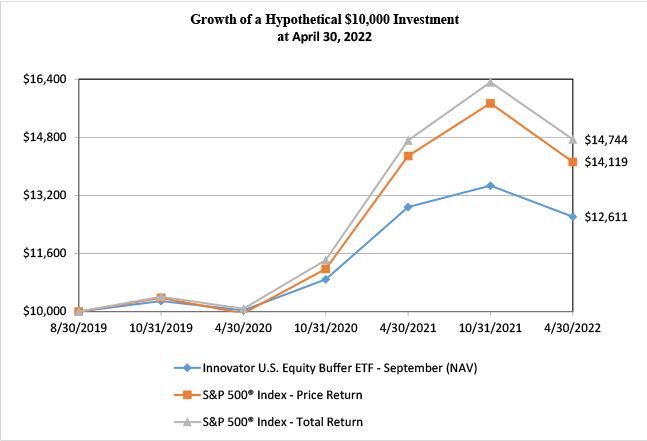
Average Annual Total Returns as of April 30, 2022 | ||||||||
One Year | Since Inception (a) | |||||||
Innovator U.S. Equity Buffer ETF - September | ||||||||
NAV Return | -2.08 | % | 9.08 | % | ||||
Market Return | -1.99 | % | 9.07 | % | ||||
S&P 500® Index - Price Return | -1.18 | % | 13.80 | % | ||||
S&P 500® Index - Total Return | 0.21 | % | 15.66 | % | ||||
(a) | Inception date is August 30, 2019. |
Performance data quoted represents past performance and does not guarantee future results. The investment return and principal value of an investment will fluctuate so that an investor’s shares, when redeemed, may be worth more or less than their original cost. Current performance of the Fund may be lower or higher than the performance quoted. As of the latest prospectus, the net expense ratio of the Fund was 0.79%. For the most recent performance, please visit the Fund’s website at innovatoretfs.com.
INNOVATOR U.S. EQUITY BUFFER ETF – SEPTEMBER
Fund Performance
April 30, 2022 (Unaudited) (Continued)
The line graph and performance table do not reflect the deduction of taxes that a shareholder may pay on fund distributions or the redemption of Fund shares. Returns shown for the Fund and S&P 500® Index – Total Return include the reinvestment of all dividends, if any. Returns shown for the S&P 500® Index – Price Return do not include the reinvestment of dividends, if any.
The S&P 500® Index is an unmanaged, capitalization–weighted index generally representative of the U.S. market for large capitalization stocks.
The Fund’s portfolio holdings may differ significantly from the securities held in the relevant index and, unlike an exchange–traded fund, the performance of an unmanaged index does not reflect deductions for transaction costs, taxes, management fees or other expenses.
You cannot invest directly in an index.
Premium/Discount Information:
Information regarding the differences between the price of the Fund’s shares on the secondary market and the Fund’s net asset value is available at Innovatoretfs.com/BSEP.
INNOVATOR U.S. EQUITY BUFFER ETF – OCTOBER
Fund Performance
April 30, 2022 (Unaudited)
The following chart compares the value of a hypothetical $10,000 investment in the Innovator U.S. Equity Buffer ETF – October from its inception (September 28, 2018) to April 30, 2022 as compared with the S&P 500® Index – Price Return and Total Return.
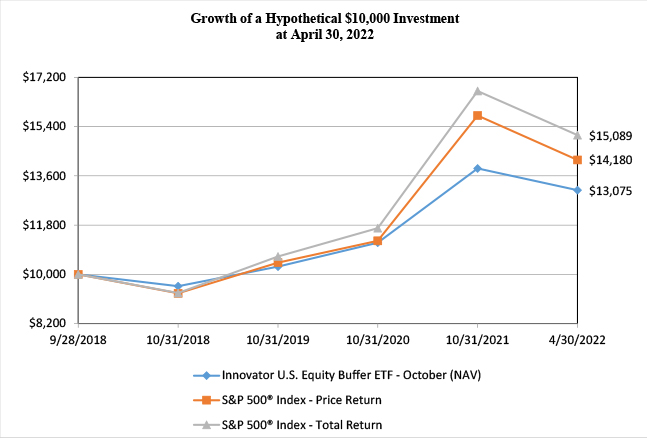
Average Annual Total Returns as of April 30, 2022 | ||||||||||||
One Year | Three Years | Since Inception (a) | ||||||||||
Innovator U.S. Equity Buffer ETF - October | ||||||||||||
NAV Return | 0.60 | % | 8.74 | % | 7.76 | % | ||||||
Market Return | 0.57 | % | 8.61 | % | 7.73 | % | ||||||
S&P 500® Index - Price Return | -1.18 | % | 11.94 | % | 10.23 | % | ||||||
S&P 500® Index - Total Return | 0.21 | % | 13.85 | % | 12.16 | % | ||||||
(a) | Inception date is September 28, 2018. |
Performance data quoted represents past performance and does not guarantee future results. The investment return and principal value of an investment will fluctuate so that an investor’s shares, when redeemed, may be worth more or less than their original cost. Current performance of the Fund may be lower or higher than the performance quoted. As of the latest prospectus, the net expense ratio of the Fund was 0.79%. For the most recent performance, please visit the Fund’s website at innovatoretfs.com.
INNOVATOR U.S. EQUITY BUFFER ETF – OCTOBER
Fund Performance
April 30, 2022 (Unaudited) (Continued)
The line graph and performance table do not reflect the deduction of taxes that a shareholder may pay on fund distributions or the redemption of Fund shares. Returns shown for the Fund and S&P 500® Index – Total Return include the reinvestment of all dividends, if any. Return shown for the S&P 500® Index – Price Return do not include the reinvestment of dividends, if any.
The S&P 500® Index is an unmanaged, capitalization–weighted index generally representative of the U.S. market for large capitalization stocks.
The Fund’s portfolio holdings may differ significantly from the securities held in the relevant index and, unlike an exchange–traded fund, the performance of an unmanaged index does not reflect deductions for transaction costs, taxes, management fees or other expenses.
You cannot invest directly in an index.
Premium/Discount Information:
Information regarding the differences between the price of the Fund’s shares on the secondary market and the Fund’s net asset value is available at Innovatoretfs.com/BOCT.
INNOVATOR U.S. EQUITY BUFFER ETF – NOVEMBER
Fund Performance
April 30, 2022 (Unaudited)
The following chart compares the value of a hypothetical $10,000 investment in the Innovator U.S. Equity Buffer ETF – November from its inception (October 31, 2019) to April 30, 2022 as compared with the S&P 500® Index - Price Return and Total Return.
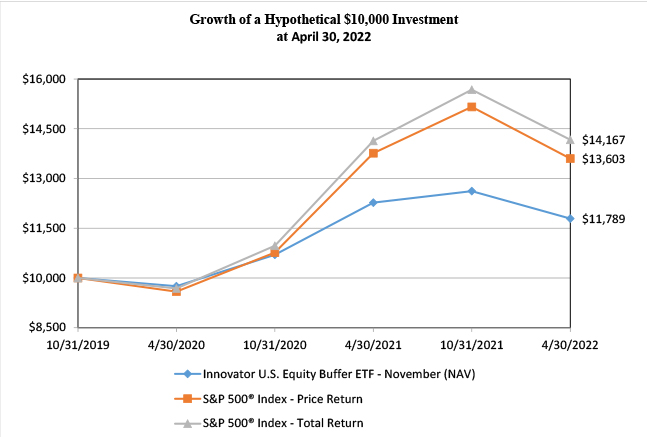
Average Annual Total Returns as of April 30, 2022 | ||||||||
One Year | Since Inception (a) | |||||||
Innovator U.S. Equity Buffer ETF - November | ||||||||
NAV Return | -3.92 | % | 6.81 | % | ||||
Market Return | -3.82 | % | 6.78 | % | ||||
S&P 500® Index - Price Return | -1.18 | % | 13.10 | % | ||||
S&P 500® Index - Total Return | 0.21 | % | 14.96 | % | ||||
(a) | Inception date is October 31, 2019. |
Performance data quoted represents past performance and does not guarantee future results. The investment return and principal value of an investment will fluctuate so that an investor’s shares, when redeemed, may be worth more or less than their original cost. Current performance of the Fund may be lower or higher than the performance quoted. As of the latest prospectus, the net expense ratio of the Fund was 0.79%. For the most recent performance, please visit the Fund’s website at innovatoretfs.com.
INNOVATOR U.S. EQUITY BUFFER ETF – NOVEMBER
Fund Performance
April 30, 2022 (Unaudited) (Continued)
The line graph and performance table do not reflect the deduction of taxes that a shareholder may pay on fund distributions or the redemption of Fund shares. Returns shown for the Fund and S&P 500® Index - Total Return include the reinvestment of all dividends, if any. Returns shown for the S&P 500® Index -Price Return do not include the reinvestment of dividends, if any.
The S&P 500® Index is an unmanaged, capitalization-weighted index generally representative of the U.S. market for large capitalization stocks.
The Fund’s portfolio holdings may differ significantly from the securities held in the relevant index and, unlike an exchange-traded fund, the performance of an unmanaged index does not reflect deductions for transaction costs, taxes, management fees or other expenses.
You cannot invest directly in an index.
Premium/Discount Information:
Information regarding the differences between the price of the Fund’s shares on the secondary market and the Fund’s net asset value is available at Innovatoretfs.com/BNOV.
INNOVATOR U.S. EQUITY BUFFER ETF – DECEMBER
Fund Performance
April 30, 2022 (Unaudited)
The following chart compares the value of a hypothetical $10,000 investment in the Innovator U.S. Equity Buffer ETF – December from its inception (November 29, 2019) to April 30, 2022 as compared with the S&P 500® Index - Price Return and Total Return.
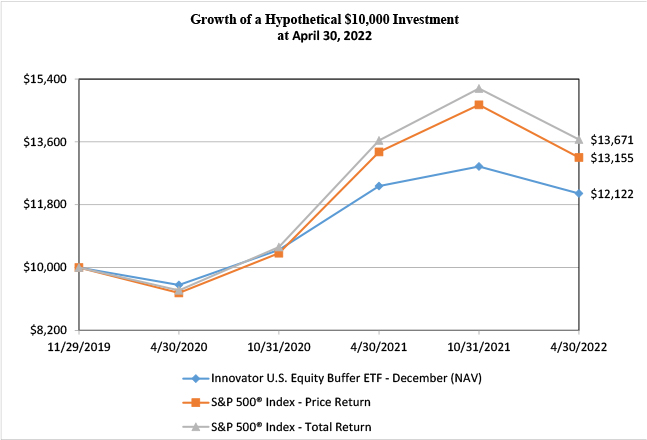
Average Annual Total Returns as of April 30, 2022 | ||||||||
One Year | Since Inception (a) | |||||||
Innovator U.S. Equity Buffer ETF - December | ||||||||
NAV Return | -1.70 | % | 8.28 | % | ||||
Market Return | -1.63 | % | 8.22 | % | ||||
S&P 500® Index - Price Return | -1.18 | % | 12.00 | % | ||||
S&P 500® Index - Total Return | 0.21 | % | 13.80 | % | ||||
(a) | Inception date is November 29, 2019. |
Performance data quoted represents past performance and does not guarantee future results. The investment return and principal value of an investment will fluctuate so that an investor’s shares, when redeemed, may be worth more or less than their original cost. Current performance of the Fund may be lower or higher than the performance quoted. As of the latest prospectus, the net expense ratio of the Fund was 0.79%. For the most recent performance, please visit the Fund’s website at innovatoretfs.com.
INNOVATOR U.S. EQUITY BUFFER ETF – DECEMBER
Fund Performance
April 30, 2022 (Unaudited) (Continued)
The line graph and performance table do not reflect the deduction of taxes that a shareholder may pay on fund distributions or the redemption of Fund shares. Returns shown for the Fund and S&P 500® Index - Total Return include the reinvestment of all dividends, if any. Returns shown for the S&P 500® Index -Price Return do not include the reinvestment of dividends, if any.
The S&P 500® Index is an unmanaged, capitalization-weighted index generally representative of the U.S. market for large capitalization stocks.
The Fund’s portfolio holdings may differ significantly from the securities held in the relevant index and, unlike an exchange-traded fund, the performance of an unmanaged index does not reflect deductions for transaction costs, taxes, management fees or other expenses.
You cannot invest directly in an index.
Premium/Discount Information:
Information regarding the differences between the price of the Fund’s shares on the secondary market and the Fund’s net asset value is available at Innovatoretfs.com/BDEC.
INNOVATOR U.S. EQUITY POWER BUFFER ETF – JANUARY
Fund Performance
April 30, 2022 (Unaudited)
The following chart compares the value of a hypothetical $10,000 investment in the Innovator U.S. Equity Power Buffer ETF – January from its inception (December 31, 2018) to April 30, 2022 as compared with the S&P 500® Index – Price Return and Total Return.
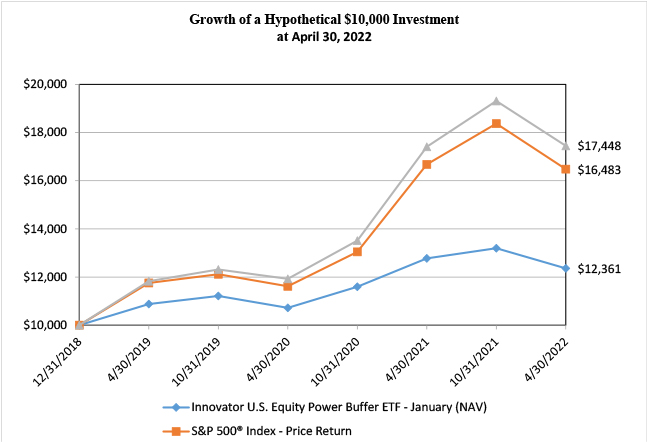
Average Annual Total Returns as of April 30, 2022 | ||||||||||||
One Year | Three Years | Since Inception (a) | ||||||||||
Innovator U.S. Equity Power Buffer ETF - January | ||||||||||||
NAV Return | -3.22 | % | 4.34 | % | 6.58 | % | ||||||
Market Return | -3.16 | % | 4.23 | % | 6.56 | % | ||||||
S&P 500® Index - Price Return | -1.18 | % | 11.94 | % | 16.20 | % | ||||||
S&P 500® Index - Total Return | 0.21 | % | 13.85 | % | 18.20 | % | ||||||
(a) | Inception date is December 31, 2018. |
Performance data quoted represents past performance and does not guarantee future results. The investment return and principal value of an investment will fluctuate so that an investor’s shares, when redeemed, may be worth more or less than their original cost. Current performance of the Fund may be lower or higher than the performance quoted. As of the latest prospectus, the net expense ratio of the Fund was 0.79%. For the most recent performance, please visit the Fund’s website at innovatoretfs.com.
INNOVATOR U.S. EQUITY POWER BUFFER ETF – JANUARY
Fund Performance
April 30, 2022 (Unaudited) (Continued)
The line graph and performance table do not reflect the deduction of taxes that a shareholder may pay on fund distributions or the redemption of Fund shares. Returns shown for the Fund and S&P 500® Index – Total Return include the reinvestment of all dividends, if any. Returns shown for the S&P 500® Index – Price Return do not include the reinvestment of dividends, if any.
The S&P 500® Index is an unmanaged, capitalization–weighted index generally representative of the U.S. market for large capitalization stocks.
The Fund’s portfolio holdings may differ significantly from the securities held in the relevant index and, unlike an exchange–traded fund, the performance of an unmanaged index does not reflect deductions for transaction costs, taxes, management fees or other expenses.
You cannot invest directly in an index.
Premium/Discount Information:
Information regarding the differences between the price of the Fund’s shares on the secondary market and the Fund’s net asset value is available at Innovatoretfs.com/PJAN.
INNOVATOR U.S. EQUITY POWER BUFFER ETF – FEBRUARY
Fund Performance
April 30, 2022 (Unaudited)
The following chart compares the value of a hypothetical $10,000 investment in the Innovator U.S. Equity Power Buffer ETF – February from its inception (January 31, 2020) to April 30, 2022 as compared with the S&P 500® Index - Price Return and Total Return.
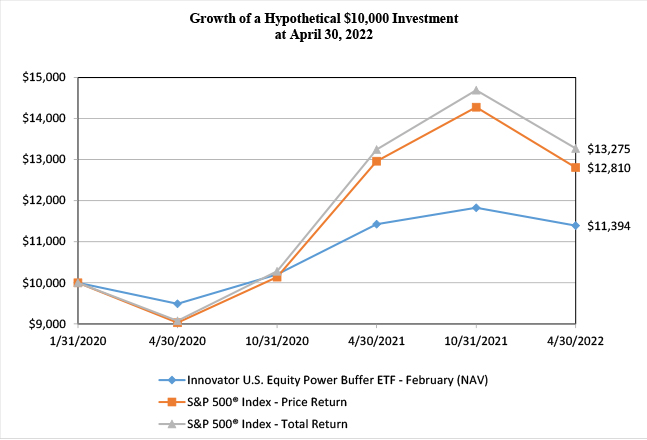
Average Annual Total Returns as of April 30, 2022 | ||||||||
One Year | Since Inception (a) | |||||||
Innovator U.S. Equity Power Buffer ETF - February | ||||||||
NAV Return | -0.30 | % | 5.98 | % | ||||
Market Return | -0.14 | % | 6.09 | % | ||||
S&P 500® Index - Price Return | -1.18 | % | 11.65 | % | ||||
S&P 500® Index - Total Return | 0.21 | % | 13.44 | % | ||||
(a) | Inception date is January 31, 2020. |
Performance data quoted represents past performance and does not guarantee future results. The investment return and principal value of an investment will fluctuate so that an investor’s shares, when redeemed, may be worth more or less than their original cost. Current performance of the Fund may be lower or higher than the performance quoted. As of the latest prospectus, the net expense ratio of the Fund was 0.79%. For the most recent performance, please visit the Fund’s website at innovatoretfs.com.
INNOVATOR U.S. EQUITY POWER BUFFER ETF – FEBRUARY
Fund Performance
April 30, 2022 (Unaudited) (Continued)
The line graph and performance table do not reflect the deduction of taxes that a shareholder may pay on fund distributions or the redemption of Fund shares. Returns shown for the Fund and S&P 500® Index - Total Return include the reinvestment of all dividends, if any. Returns shown for the S&P 500® Index -Price Return do not include the reinvestment of dividends, if any.
The S&P 500® Index is an unmanaged, capitalization-weighted index generally representative of the U.S. market for large capitalization stocks.
The Fund’s portfolio holdings may differ significantly from the securities held in the relevant index and, unlike an exchange-traded fund, the performance of an unmanaged index does not reflect deductions for transaction costs, taxes, management fees or other expenses.
You cannot invest directly in an index.
Premium/Discount Information:
Information regarding the differences between the price of the Fund’s shares on the secondary market and the Fund’s net asset value is available at Innovatoretfs.com/PFEB.
INNOVATOR U.S. EQUITY POWER BUFFER ETF – MARCH
Fund Performance
April 30, 2022 (Unaudited)
The following chart compares the value of a hypothetical $10,000 investment in the Innovator U.S. Equity Power Buffer ETF – March from its inception (February 28, 2020) to April 30, 2022 as compared with the S&P 500® Index - Price Return and Total Return.
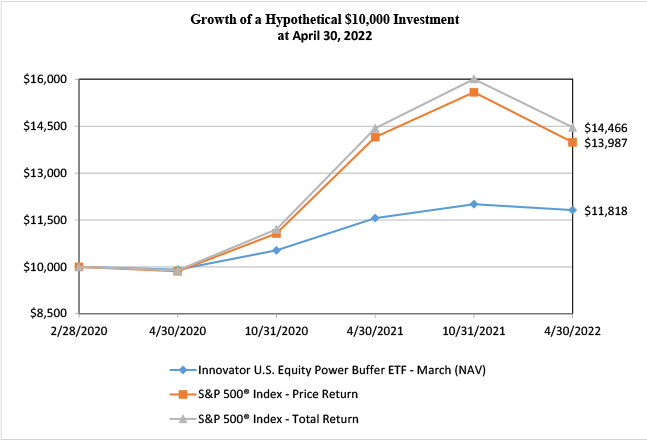
Average Annual Total Returns as of April 30, 2022 | ||||||||
One Year | Since Inception (a) | |||||||
Innovator U.S. Equity Power Buffer ETF - March | ||||||||
NAV Return | 2.25 | % | 8.00 | % | ||||
Market Return | 2.24 | % | 8.12 | % | ||||
S&P 500® Index - Price Return | -1.18 | % | 16.72 | % | ||||
S&P 500® Index - Total Return | 0.21 | % | 18.55 | % | ||||
(a) | Inception date is February 28, 2020. |
Performance data quoted represents past performance and does not guarantee future results. The investment return and principal value of an investment will fluctuate so that an investor’s shares, when redeemed, may be worth more or less than their original cost. Current performance of the Fund may be lower or higher than the performance quoted. As of the latest prospectus, the net expense ratio of the Fund was 0.79%. For the most recent performance, please visit the Fund’s website at innovatoretfs.com.
INNOVATOR U.S. EQUITY POWER BUFFER ETF – MARCH
Fund Performance
April 30, 2022 (Unaudited) (Continued)
The line graph and performance table do not reflect the deduction of taxes that a shareholder may pay on fund distributions or the redemption of Fund shares. Returns shown for the Fund and S&P 500® Index - Total Return include the reinvestment of all dividends, if any. Returns shown for the S&P 500® Index -Price Return do not include the reinvestment of dividends, if any.
The S&P 500® Index is an unmanaged, capitalization-weighted index generally representative of the U.S. market for large capitalization stocks.
The Fund’s portfolio holdings may differ significantly from the securities held in the relevant index and, unlike an exchange-traded fund, the performance of an unmanaged index does not reflect deductions for transaction costs, taxes, management fees or other expenses.
You cannot invest directly in an index.
Premium/Discount Information:
Information regarding the differences between the price of the Fund’s shares on the secondary market and the Fund’s net asset value is available at Innovatoretfs.com/PMAR.
INNOVATOR U.S. EQUITY POWER BUFFER ETF – APRIL
Fund Performance
April 30, 2022 (Unaudited)
The following chart compares the value of a hypothetical $10,000 investment in the Innovator U.S. Equity Power Buffer ETF – April from its inception (March 29, 2019) to April 30, 2022 as compared with the S&P 500® Index – Price Return and Total Return.
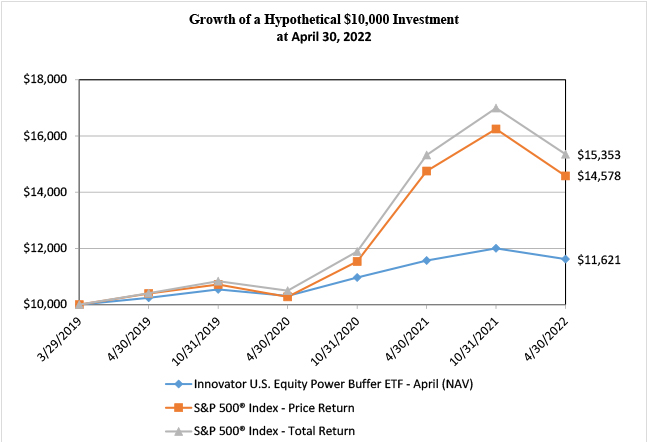
Average Annual Total Returns as of April 30, 2022 | ||||||||||||
One Year | Three Years | Since Inception (a) | ||||||||||
Innovator U.S. Equity Power Buffer ETF - April | ||||||||||||
NAV Return | 0.47 | % | 4.30 | % | 4.99 | % | ||||||
Market Return | 0.43 | % | 4.35 | % | 5.05 | % | ||||||
S&P 500® Index - Price Return | -1.18 | % | 11.94 | % | 12.98 | % | ||||||
S&P 500® Index - Total Return | 0.21 | % | 13.85 | % | 14.90 | % | ||||||
(a) | Inception date is March 29, 2019. |
Performance data quoted represents past performance and does not guarantee future results. The investment return and principal value of an investment will fluctuate so that an investor’s shares, when redeemed, may be worth more or less than their original cost. Current performance of the Fund may be lower or higher than the performance quoted. As of the latest prospectus, the net expense ratio of the Fund was 0.79%. For the most recent performance, please visit the Fund’s website at innovatoretfs.com.
INNOVATOR U.S. EQUITY POWER BUFFER ETF – APRIL
Fund Performance
April 30, 2022 (Unaudited) (Continued)
The line graph and performance table do not reflect the deduction of taxes that a shareholder may pay on fund distributions or the redemption of Fund shares. Returns shown for the Fund and S&P 500® Index – Total Return include the reinvestment of all dividends, if any. Returns shown for the S&P 500® Index – Price Return do not include the reinvestment of dividends, if any.
The S&P 500® Index is an unmanaged, capitalization–weighted index generally representative of the U.S. market for large capitalization stocks.
The Fund’s portfolio holdings may differ significantly from the securities held in the relevant index and, unlike an exchange–traded fund, the performance of an unmanaged index does not reflect deductions for transaction costs, taxes, management fees or other expenses.
You cannot invest directly in an index.
Premium/Discount Information:
Information regarding the differences between the price of the Fund’s shares on the secondary market and the Fund’s net asset value is available at Innovatoretfs.com/PAPR.
INNOVATOR U.S. EQUITY POWER BUFFER ETF – MAY
Fund Performance
April 30, 2022 (Unaudited)
The following chart compares the value of a hypothetical $10,000 investment in the Innovator U.S. Equity Power Buffer ETF – May from its inception (April 30, 2020) to April 30, 2022 as compared with the S&P 500® Index - Price Return and Total Return.
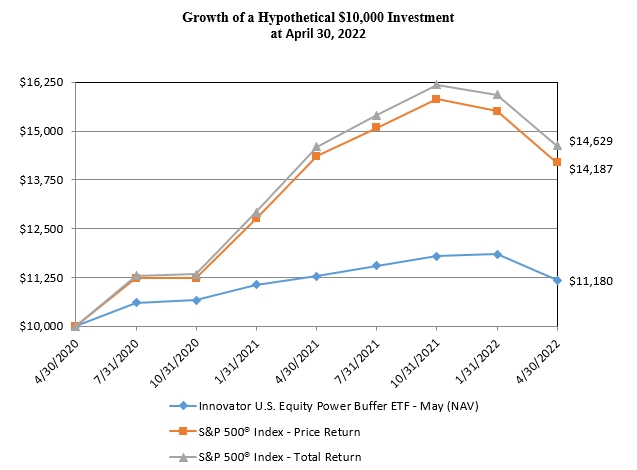
Average Annual Total Returns as of April 30, 2022 | ||||||||
One Year | Since Inception (a) | |||||||
Innovator U.S. Equity Power Buffer ETF - May | ||||||||
NAV Return | -0.83 | % | 5.74 | % | ||||
Market Return | -0.69 | % | 5.89 | % | ||||
S&P 500® Index - Price Return | -1.18 | % | 19.11 | % | ||||
S&P 500® Index - Total Return | 0.21 | % | 20.95 | % | ||||
(a) | Inception date is April 30, 2020. |
Performance data quoted represents past performance and does not guarantee future results. The investment return and principal value of an investment will fluctuate so that an investor’s shares, when redeemed, may be worth more or less than their original cost. Current performance of the Fund may be lower or higher than the performance quoted. As of the latest prospectus, the net expense ratio of the Fund was 0.79%. For the most recent performance, please visit the Fund’s website at innovatoretfs.com.
INNOVATOR U.S. EQUITY POWER BUFFER ETF – MAY
Fund Performance
April 30, 2022 (Unaudited) (Continued)
The line graph and performance table do not reflect the deduction of taxes that a shareholder may pay on fund distributions or the redemption of Fund shares. Returns shown for the Fund and S&P 500® Index - Total Return include the reinvestment of all dividends, if any. Returns shown for the S&P 500® Index -Price Return do not include the reinvestment of dividends, if any.
The S&P 500® Index is an unmanaged, capitalization-weighted index generally representative of the U.S. market for large capitalization stocks.
The Fund’s portfolio holdings may differ significantly from the securities held in the relevant index and, unlike an exchange-traded fund, the performance of an unmanaged index does not reflect deductions for transaction costs, taxes, management fees or other expenses.
You cannot invest directly in an index.
Premium/Discount Information:
Information regarding the differences between the price of the Fund’s shares on the secondary market and the Fund’s net asset value is available at Innovatoretfs.com/PMAY.
INNOVATOR U.S. EQUITY POWER BUFFER ETF – JUNE
Fund Performance
April 30, 2022 (Unaudited)
The following chart compares the value of a hypothetical $10,000 investment in the Innovator U.S. Equity Power Buffer ETF – June from its inception (May 31, 2019) to April 30, 2022 as compared with the S&P 500® Index – Price Return and Total Return.
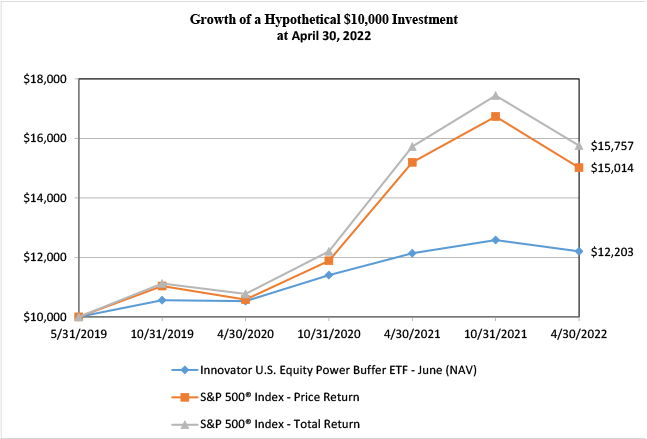
Average Annual Total Returns as of April 30, 2022 | ||||||||
One Year | Since Inception (a) | |||||||
Innovator U.S. Equity Power Buffer ETF - June | ||||||||
NAV Return | 0.54 | % | 7.06 | % | ||||
Market Return | 0.81 | % | 7.09 | % | ||||
S&P 500® Index - Price Return | -1.18 | % | 14.94 | % | ||||
S&P 500® Index - Total Return | 0.21 | % | 16.86 | % | ||||
(a) | Inception date is May 31, 2019. |
Performance data quoted represents past performance and does not guarantee future results. The investment return and principal value of an investment will fluctuate so that an investor’s shares, when redeemed, may be worth more or less than their original cost. Current performance of the Fund may be lower or higher than the performance quoted. As of the latest prospectus, the net expense ratio of the Fund was 0.79%. For the most recent performance, please visit the Fund’s website at innovatoretfs.com.
INNOVATOR U.S. EQUITY POWER BUFFER ETF – JUNE
Fund Performance
April 30, 2022 (Unaudited) (Continued)
The line graph and performance table do not reflect the deduction of taxes that a shareholder may pay on fund distributions or the redemption of Fund shares. Returns shown for the Fund and S&P 500® Index – Total Return include the reinvestment of all dividends, if any. Returns shown for the S&P 500® Index – Price Return do not include the reinvestment of dividends, if any.
The S&P 500® Index is an unmanaged, capitalization–weighted index generally representative of the U.S. market for large capitalization stocks.
The Fund’s portfolio holdings may differ significantly from the securities held in the relevant index and, unlike an exchange–traded fund, the performance of an unmanaged index does not reflect deductions for transaction costs, taxes, management fees or other expenses.
You cannot invest directly in an index.
Premium/Discount Information:
Information regarding the differences between the price of the Fund’s shares on the secondary market and the Fund’s net asset value is available at Innovatoretfs.com/PJUN.
INNOVATOR U.S. EQUITY POWER BUFFER ETF – JULY
Fund Performance
April 30, 2022 (Unaudited)
The following chart compares the value of a hypothetical $10,000 investment in the Innovator U.S. Equity Power Buffer ETF – July from its inception (August 7, 2018) to April 30, 2022 as compared with the S&P 500® Index – Price Return and Total Return.
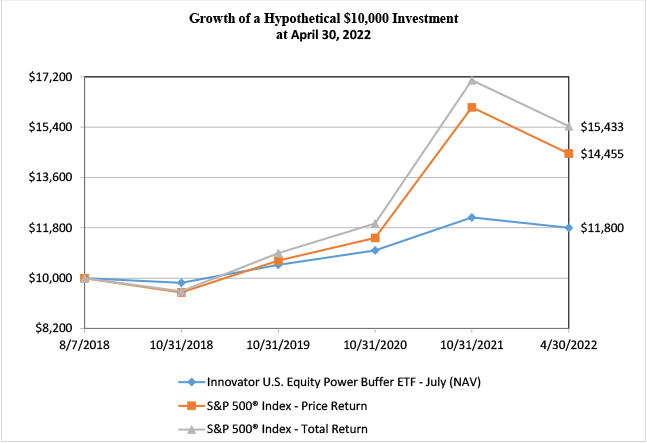
Average Annual Total Returns as of April 30, 2022 | ||||||||||||
One Year | Three Years | Since Inception (a) | ||||||||||
Innovator U.S. Equity Power Buffer ETF - July | ||||||||||||
NAV Return | -0.26 | % | 4.63 | % | 4.54 | % | ||||||
Market Return | -0.07 | % | 4.62 | % | 4.53 | % | ||||||
S&P 500® Index - Price Return | -1.18 | % | 11.94 | % | 10.39 | % | ||||||
S&P 500® Index - Total Return | 0.21 | % | 13.85 | % | 12.34 | % | ||||||
(a) | Inception date is August 7, 2018. |
Performance data quoted represents past performance and does not guarantee future results. The investment return and principal value of an investment will fluctuate so that an investor’s shares, when redeemed, may be worth more or less than their original cost. Current performance of the Fund may be lower or higher than the performance quoted. As of the latest prospectus, the net expense ratio of the Fund was 0.79%. For the most recent performance, please visit the Fund’s website at innovatoretfs.com.
INNOVATOR U.S. EQUITY POWER BUFFER ETF – JULY
Fund Performance
April 30, 2022 (Unaudited) (Continued)
The line graph and performance table do not reflect the deduction of taxes that a shareholder may pay on fund distributions or the redemption of Fund shares. Returns shown for the Fund and S&P 500® Index – Total Return include the reinvestment of all dividends, if any. Returns shown for the S&P 500® Index – Price Return do not include the reinvestment of dividends, if any.
The S&P 500® Index is an unmanaged, capitalization–weighted index generally representative of the U.S. market for large capitalization stocks.
The Fund’s portfolio holdings may differ significantly from the securities held in the relevant index and, unlike an exchange–traded fund, the performance of an unmanaged index does not reflect deductions for transaction costs, taxes, management fees or other expenses.
You cannot invest directly in an index.
Premium/Discount Information:
Information regarding the differences between the price of the Fund’s shares on the secondary market and the Fund’s net asset value is available at Innovatoretfs.com/PJUL.
INNOVATOR U.S. EQUITY POWER BUFFER ETF – AUGUST
Fund Performance
April 30, 2022 (Unaudited)
The following chart compares the value of a hypothetical $10,000 investment in the Innovator U.S. Equity Power Buffer ETF – August from its inception (July 31, 2019) to April 30, 2022 as compared with the S&P 500® Index – Price Return and Total Return.
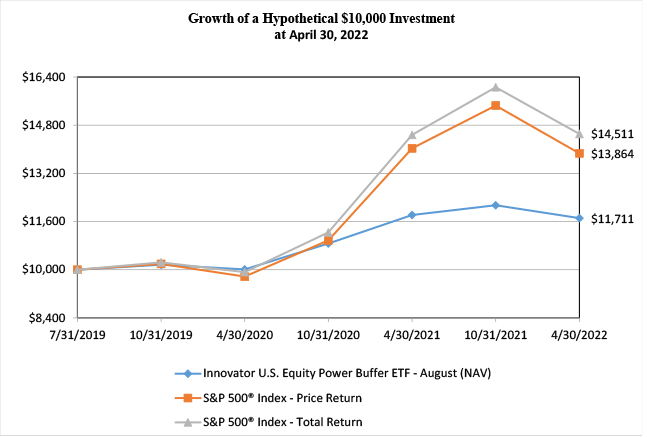
Average Annual Total Returns as of April 30, 2022 | ||||||||
One Year | Since Inception (a) | |||||||
Innovator U.S. Equity Power Buffer ETF - August | ||||||||
NAV Return | -0.91 | % | 5.91 | % | ||||
Market Return | -0.67 | % | 5.94 | % | ||||
S&P 500® Index - Price Return | -1.18 | % | 12.61 | % | ||||
S&P 500® Index - Total Return | 0.21 | % | 14.49 | % | ||||
(a) | Inception date is July 31, 2019. |
Performance data quoted represents past performance and does not guarantee future results. The investment return and principal value of an investment will fluctuate so that an investor’s shares, when redeemed, may be worth more or less than their original cost. Current performance of the Fund may be lower or higher than the performance quoted. As of the latest prospectus, the net expense ratio of the Fund was 0.79%. For the most recent performance, please visit the Fund’s website at innovatoretfs.com.
INNOVATOR U.S. EQUITY POWER BUFFER ETF – AUGUST
Fund Performance
April 30, 2022 (Unaudited) (Continued)
The line graph and performance table do not reflect the deduction of taxes that a shareholder may pay on fund distributions or the redemption of Fund shares. Returns shown for the Fund and S&P 500® Index – Total Return include the reinvestment of all dividends, if any. Returns shown for the S&P 500® Index – Price Return do not include the reinvestment of dividends, if any.
The S&P 500® Index is an unmanaged, capitalization–weighted index generally representative of the U.S. market for large capitalization stocks.
The Fund’s portfolio holdings may differ significantly from the securities held in the relevant index and, unlike an exchange–traded fund, the performance of an unmanaged index does not reflect deductions for transaction costs, taxes, management fees or other expenses.
You cannot invest directly in an index.
Premium/Discount Information:
Information regarding the differences between the price of the Fund’s shares on the secondary market and the Fund’s net asset value is available at Innovatoretfs.com/PAUG.
INNOVATOR U.S. EQUITY POWER BUFFER ETF – SEPTEMBER
Fund Performance
April 30, 2022 (Unaudited)
The following chart compares the value of a hypothetical $10,000 investment in the Innovator U.S. Equity Power Buffer ETF – September from its inception (August 30, 2019) to April 30, 2022 as compared with the S&P 500® Index – Price Return and Total Return.
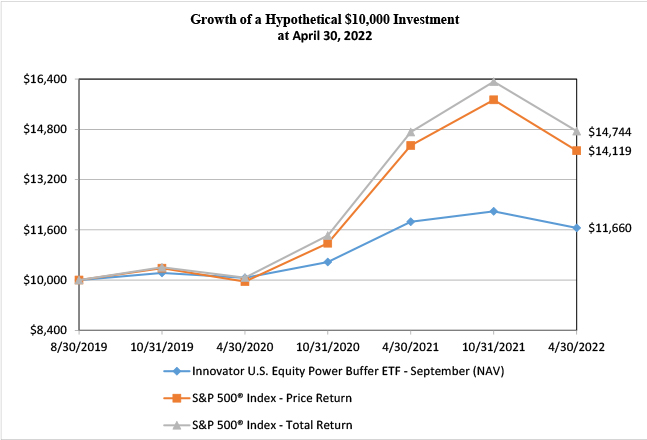
Average Annual Total Returns as of April 30, 2022 | ||||||||
One Year | Since Inception (a) | |||||||
Innovator U.S. Equity Power Buffer ETF - September | ||||||||
NAV Return | -1.67 | % | 5.92 | % | ||||
Market Return | -1.53 | % | 5.95 | % | ||||
S&P 500® Index - Price Return | -1.18 | % | 13.80 | % | ||||
S&P 500® Index - Total Return | 0.21 | % | 15.66 | % | ||||
(a) | Inception date is August 30, 2019. |
Performance data quoted represents past performance and does not guarantee future results. The investment return and principal value of an investment will fluctuate so that an investor’s shares, when redeemed, may be worth more or less than their original cost. Current performance of the Fund may be lower or higher than the performance quoted. As of the latest prospectus, the net expense ratio of the Fund was 0.79%. For the most recent performance, please visit the Fund’s website at innovatoretfs.com.
INNOVATOR U.S. EQUITY POWER BUFFER ETF – SEPTEMBER
Fund Performance
April 30, 2022 (Unaudited) (Continued)
The line graph and performance table do not reflect the deduction of taxes that a shareholder may pay on fund distributions or the redemption of Fund shares. Returns shown for the Fund and S&P 500® Index – Total Return include the reinvestment of all dividends, if any. Returns shown for the S&P 500® Index – Price Return do not include the reinvestment of dividends, if any.
The S&P 500® Index is an unmanaged, capitalization–weighted index generally representative of the U.S. market for large capitalization stocks.
The Fund’s portfolio holdings may differ significantly from the securities held in the relevant index and, unlike an exchange–traded fund, the performance of an unmanaged index does not reflect deductions for transaction costs, taxes, management fees or other expenses.
You cannot invest directly in an index.
Premium/Discount Information:
Information regarding the differences between the price of the Fund’s shares on the secondary market and the Fund’s net asset value is available at Innovatoretfs.com/PSEP.
INNOVATOR U.S. EQUITY POWER BUFFER ETF – OCTOBER
Fund Performance
April 30, 2022 (Unaudited)
The following chart compares the value of a hypothetical $10,000 investment in the Innovator U.S. Equity Power Buffer ETF – October from its inception (September 28, 2018) to April 30, 2022 as compared with the S&P 500® Index – Price Return and Total Return.
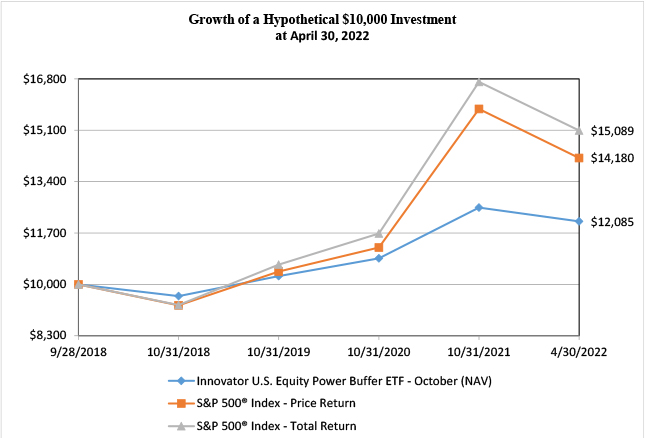
Average Annual Total Returns as of April 30, 2022 | ||||||||||||
One Year | Three Years | Since Inception (a) | ||||||||||
Innovator U.S. Equity Power Buffer ETF - October | ||||||||||||
NAV Return | 0.36 | % | 5.88 | % | 5.42 | % | ||||||
Market Return | 0.70 | % | 5.81 | % | 5.45 | % | ||||||
S&P 500® Index - Price Return | -1.18 | % | 11.94 | % | 10.23 | % | ||||||
S&P 500® Index - Total Return | 0.21 | % | 13.85 | % | 12.16 | % | ||||||
(a) | Inception date is September 28, 2018. |
Performance data quoted represents past performance and does not guarantee future results. The investment return and principal value of an investment will fluctuate so that an investor’s shares, when redeemed, may be worth more or less than their original cost. Current performance of the Fund may be lower or higher than the performance quoted. As of the latest prospectus, the net expense ratio of the Fund was 0.79%. For the most recent performance, please visit the Fund’s website at innovatoretfs.com.
INNOVATOR U.S. EQUITY POWER BUFFER ETF – OCTOBER
Fund Performance
April 30, 2022 (Unaudited) (Continued)
The line graph and performance table do not reflect the deduction of taxes that a shareholder may pay on fund distributions or the redemption of Fund shares. Returns shown for the Fund and S&P 500® Index – Total Return include the reinvestment of all dividends, if any. Returns shown for the S&P 500® Index – Price Return do not include the reinvestment of dividends, if any.
The S&P 500® Index is an unmanaged, capitalization–weighted index generally representative of the U.S. market for large capitalization stocks.
The Fund’s portfolio holdings may differ significantly from the securities held in the relevant index and, unlike an exchange–traded fund, the performance of an unmanaged index does not reflect deductions for transaction costs, taxes, management fees or other expenses.
You cannot invest directly in an index.
Premium/Discount Information:
Information regarding the differences between the price of the Fund’s shares on the secondary market and the Fund’s net asset value is available at Innovatoretfs.com/POCT.
INNOVATOR U.S. EQUITY POWER BUFFER ETF – NOVEMBER
Fund Performance
April 30, 2022 (Unaudited)
The following chart compares the value of a hypothetical $10,000 investment in the Innovator U.S. Equity Power Buffer ETF – November from its inception (October 31, 2019) to April 30, 2022 as compared with the S&P 500® Index - Price Return and Total Return.
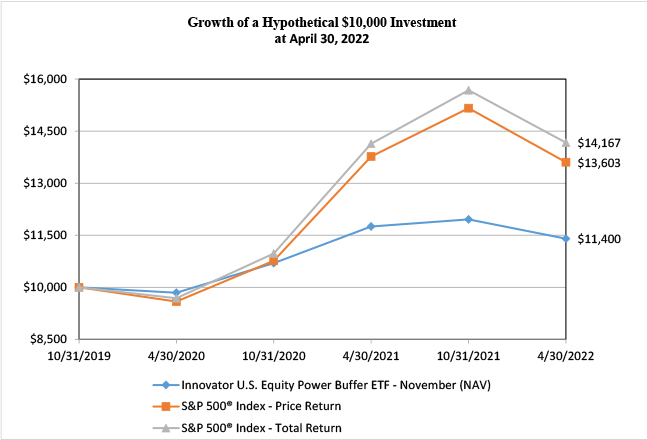
Average Annual Total Returns as of April 30, 2022 | ||||||||
One Year | Since Inception (a) | |||||||
Innovator U.S. Equity Power Buffer ETF - November | ||||||||
NAV Return | -3.00 | % | 5.38 | % | ||||
Market Return | -3.06 | % | 5.39 | % | ||||
S&P 500® Index - Price Return | -1.18 | % | 13.10 | % | ||||
S&P 500® Index - Total Return | 0.21 | % | 14.96 | % | ||||
(a) | Inception date is October 31, 2019. |
Performance data quoted represents past performance and does not guarantee future results. The investment return and principal value of an investment will fluctuate so that an investor’s shares, when redeemed, may be worth more or less than their original cost. Current performance of the Fund may be lower or higher than the performance quoted. As of the latest prospectus, the net expense ratio of the Fund was 0.79%. For the most recent performance, please visit the Fund’s website at innovatoretfs.com.
INNOVATOR U.S. EQUITY POWER BUFFER ETF – NOVEMBER
Fund Performance
April 30, 2022 (Unaudited) (Continued)
The line graph and performance table do not reflect the deduction of taxes that a shareholder may pay on fund distributions or the redemption of Fund shares. Returns shown for the Fund and S&P 500® Index - Total Return include the reinvestment of all dividends, if any. Returns shown for the S&P 500® Index -Price Return do not include the reinvestment of dividends, if any.
The S&P 500® Index is an unmanaged, capitalization-weighted index generally representative of the U.S. market for large capitalization stocks.
The Fund’s portfolio holdings may differ significantly from the securities held in the relevant index and, unlike an exchange-traded fund, the performance of an unmanaged index does not reflect deductions for transaction costs, taxes, management fees or other expenses.
You cannot invest directly in an index.
Premium/Discount Information:
Information regarding the differences between the price of the Fund’s shares on the secondary market and the Fund’s net asset value is available at Innovatoretfs.com/PNOV.
INNOVATOR U.S. EQUITY POWER BUFFER ETF – DECEMBER
Fund Performance
April 30, 2022 (Unaudited)
The following chart compares the value of a hypothetical $10,000 investment in the Innovator U.S. Equity Power Buffer ETF – December from its inception (November 29, 2019) to April 30, 2022 as compared with the S&P 500® Index - Price Return and Total Return.
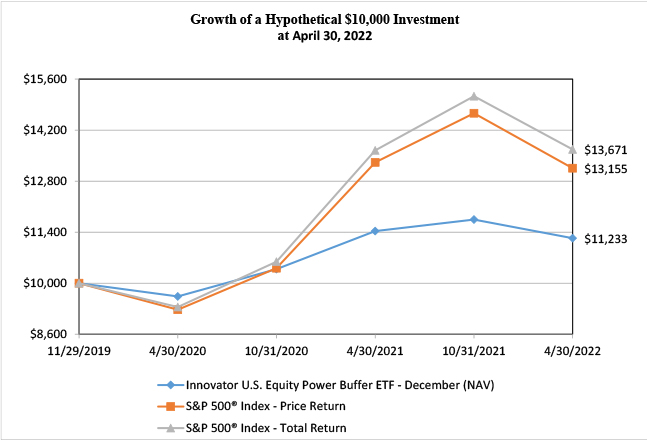
Average Annual Total Returns as of April 30, 2022 | ||||||||
One Year | Since Inception (a) | |||||||
Innovator U.S. Equity Power Buffer ETF - December | ||||||||
NAV Return | -1.73 | % | 4.92 | % | ||||
Market Return | -1.77 | % | 4.94 | % | ||||
S&P 500® Index - Price Return | -1.18 | % | 12.00 | % | ||||
S&P 500® Index - Total Return | 0.21 | % | 13.80 | % | ||||
(a) | Inception date is November 29, 2019. |
Performance data quoted represents past performance and does not guarantee future results. The investment return and principal value of an investment will fluctuate so that an investor’s shares, when redeemed, may be worth more or less than their original cost. Current performance of the Fund may be lower or higher than the performance quoted. As of the latest prospectus, the net expense ratio of the Fund was 0.79%. For the most recent performance, please visit the Fund’s website at innovatoretfs.com.
INNOVATOR U.S. EQUITY POWER BUFFER ETF – DECEMBER
Fund Performance
April 30, 2022 (Unaudited) (Continued)
The line graph and performance table do not reflect the deduction of taxes that a shareholder may pay on fund distributions or the redemption of Fund shares. Returns shown for the Fund and S&P 500® Index - Total Return include the reinvestment of all dividends, if any. Returns shown for the S&P 500® Index -Price Return do not include the reinvestment of dividends, if any.
The S&P 500® Index is an unmanaged, capitalization-weighted index generally representative of the U.S. market for large capitalization stocks.
The Fund’s portfolio holdings may differ significantly from the securities held in the relevant index and, unlike an exchange-traded fund, the performance of an unmanaged index does not reflect deductions for transaction costs, taxes, management fees or other expenses.
You cannot invest directly in an index.
Premium/Discount Information:
Information regarding the differences between the price of the Fund’s shares on the secondary market and the Fund’s net asset value is available at Innovatoretfs.com/PDEC.
INNOVATOR U.S. EQUITY ULTRA BUFFER ETF – JANUARY
Fund Performance
April 30, 2022 (Unaudited)
The following chart compares the value of a hypothetical $10,000 investment in the Innovator U.S. Equity Ultra Buffer ETF – January from its inception (December 31, 2018) to April 30, 2022 as compared with the S&P 500® Index – Price Return and Total Return.
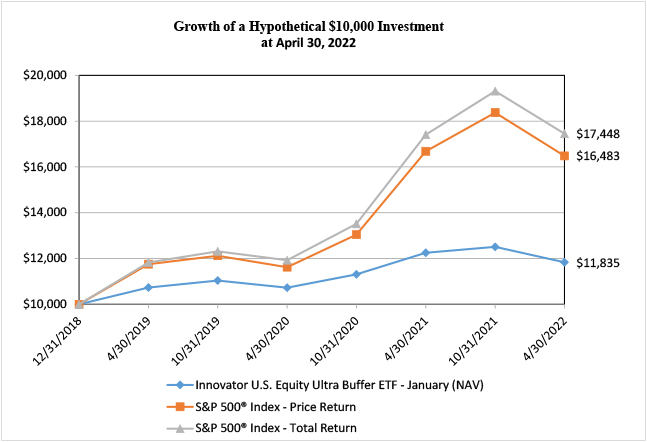
Average Annual Total Returns as of April 30, 2022 | ||||||||||||
One Year | Three Years | Since Inception (a) | ||||||||||
Innovator U.S. Equity Ultra Buffer ETF - January | ||||||||||||
NAV Return | -3.37 | % | 3.31 | % | 5.19 | % | ||||||
Market Return | -3.21 | % | 3.31 | % | 5.26 | % | ||||||
S&P 500® Index - Price Return | -1.18 | % | 11.94 | % | 16.20 | % | ||||||
S&P 500® Index - Total Return | 0.21 | % | 13.85 | % | 18.20 | % | ||||||
(a) | Inception date is December 31, 2018. |
Performance data quoted represents past performance and does not guarantee future results. The investment return and principal value of an investment will fluctuate so that an investor’s shares, when redeemed, may be worth more or less than their original cost. Current performance of the Fund may be lower or higher than the performance quoted. As of the latest prospectus, the net expense ratio of the Fund was 0.79%. For the most recent performance, please visit the Fund’s website at innovatoretfs.com.
INNOVATOR U.S. EQUITY ULTRA BUFFER ETF – JANUARY
Fund Performance
April 30, 2022 (Unaudited) (Continued)
The line graph and performance table do not reflect the deduction of taxes that a shareholder may pay on fund distributions or the redemption of Fund shares. Returns shown for the Fund and S&P 500® Index – Total Return include the reinvestment of all dividends, if any. Returns shown for the S&P 500® Index – Price Return do not include the reinvestment of dividends, if any.
The S&P 500® Index is an unmanaged, capitalization–weighted index generally representative of the U.S. market for large capitalization stocks.
The Fund’s portfolio holdings may differ significantly from the securities held in the relevant index and, unlike an exchange–traded fund, the performance of an unmanaged index does not reflect deductions for transaction costs, taxes, management fees or other expenses.
You cannot invest directly in an index.
Premium/Discount Information:
Information regarding the differences between the price of the Fund’s shares on the secondary market and the Fund’s net asset value is available at Innovatoretfs.com/UJAN.
INNOVATOR U.S. EQUITY ULTRA BUFFER ETF – FEBRUARY
Fund Performance
April 30, 2022 (Unaudited)
The following chart compares the value of a hypothetical $10,000 investment in the Innovator U.S. Equity Ultra Buffer ETF – February from its inception (January 31, 2020) to April 30, 2022 as compared with the S&P 500® Index - Price Return and Total Return.
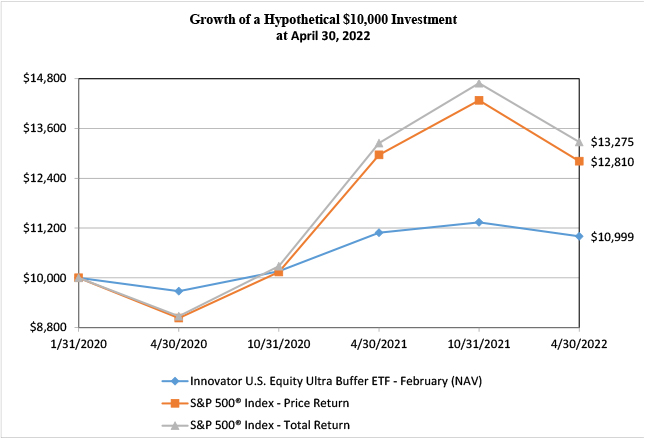
Average Annual Total Returns as of April 30, 2022 | ||||||||
One Year | Since Inception (a) | |||||||
Innovator U.S. Equity Ultra Buffer ETF - February | ||||||||
NAV Return | -0.81 | % | 4.33 | % | ||||
Market Return | -0.59 | % | 4.36 | % | ||||
S&P 500® Index - Price Return | -1.18 | % | 11.65 | % | ||||
S&P 500® Index - Total Return | 0.21 | % | 13.44 | % | ||||
(a) | Inception date is January 31, 2020. |
Performance data quoted represents past performance and does not guarantee future results. The investment return and principal value of an investment will fluctuate so that an investor’s shares, when redeemed, may be worth more or less than their original cost. Current performance of the Fund may be lower or higher than the performance quoted. As of the latest prospectus, the net expense ratio of the Fund was 0.79%. For the most recent performance, please visit the Fund’s website at innovatoretfs.com.
INNOVATOR U.S. EQUITY ULTRA BUFFER ETF – FEBRUARY
Fund Performance
April 30, 2022 (Unaudited) (Continued)
The line graph and performance table do not reflect the deduction of taxes that a shareholder may pay on fund distributions or the redemption of Fund shares. Returns shown for the Fund and S&P 500® Index - Total Return include the reinvestment of all dividends, if any. Returns shown for the S&P 500® Index -Price Return do not include the reinvestment of dividends, if any.
The S&P 500® Index is an unmanaged, capitalization-weighted index generally representative of the U.S. market for large capitalization stocks.
The Fund’s portfolio holdings may differ significantly from the securities held in the relevant index and, unlike an exchange-traded fund, the performance of an unmanaged index does not reflect deductions for transaction costs, taxes, management fees or other expenses.
You cannot invest directly in an index.
Premium/Discount Information:
Information regarding the differences between the price of the Fund’s shares on the secondary market and the Fund’s net asset value is available at Innovatoretfs.com/UFEB.
INNOVATOR U.S. EQUITY ULTRA BUFFER ETF – MARCH
Fund Performance
April 30, 2022 (Unaudited)
The following chart compares the value of a hypothetical $10,000 investment in the Innovator U.S. Equity Ultra Buffer ETF – March from its inception (February 28, 2020) to April 30, 2022 as compared with the S&P 500® Index - Price Return and Total Return.
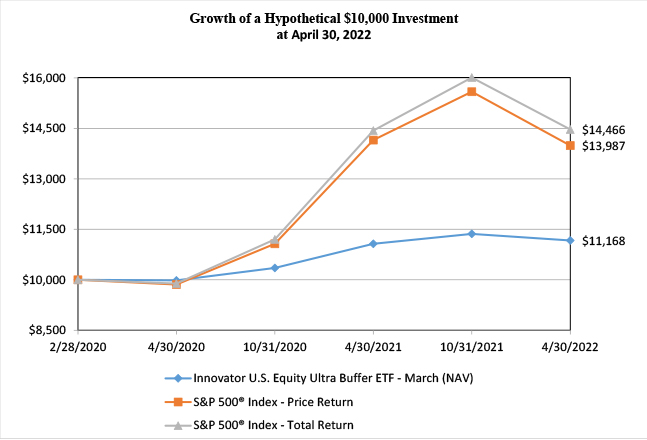
Average Annual Total Returns as of April 30, 2022 | ||||||||
One Year | Since Inception (a) | |||||||
Innovator U.S. Equity Ultra Buffer ETF - March | ||||||||
NAV Return | 0.90 | % | 5.22 | % | ||||
Market Return | 1.05 | % | 5.37 | % | ||||
S&P 500® Index - Price Return | -1.18 | % | 16.72 | % | ||||
S&P 500® Index - Total Return | 0.21 | % | 18.55 | % | ||||
(a) | Inception date is February 28, 2020. |
Performance data quoted represents past performance and does not guarantee future results. The investment return and principal value of an investment will fluctuate so that an investor’s shares, when redeemed, may be worth more or less than their original cost. Current performance of the Fund may be lower or higher than the performance quoted. As of the latest prospectus, the net expense ratio of the Fund was 0.79%. For the most recent performance, please visit the Fund’s website at innovatoretfs.com.
INNOVATOR U.S. EQUITY ULTRA BUFFER ETF – MARCH
Fund Performance
April 30, 2022 (Unaudited) (Continued)
The line graph and performance table do not reflect the deduction of taxes that a shareholder may pay on fund distributions or the redemption of Fund shares. Returns shown for the Fund and S&P 500® Index - Total Return include the reinvestment of all dividends, if any. Returns shown for the S&P 500® Index -Price Return do not include the reinvestment of dividends, if any.
The S&P 500® Index is an unmanaged, capitalization-weighted index generally representative of the U.S. market for large capitalization stocks.
The Fund’s portfolio holdings may differ significantly from the securities held in the relevant index and, unlike an exchange-traded fund, the performance of an unmanaged index does not reflect deductions for transaction costs, taxes, management fees or other expenses.
You cannot invest directly in an index.
Premium/Discount Information:
Information regarding the differences between the price of the Fund’s shares on the secondary market and the Fund’s net asset value is available at Innovatoretfs.com/UMAR.
INNOVATOR U.S. EQUITY ULTRA BUFFER ETF – APRIL
Fund Performance
April 30, 2022 (Unaudited)
The following chart compares the value of a hypothetical $10,000 investment in the Innovator U.S. Equity Ultra Buffer ETF – April from its inception (March 29, 2019) to April 30, 2022 as compared with the S&P 500® Index – Price Return and Total Return.
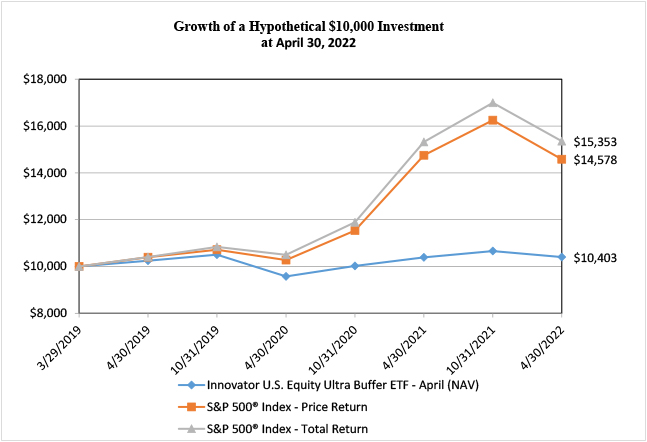
Average Annual Total Returns as of April 30, 2022 | ||||||||||||
One Year | Three Years | Since Inception (a) | ||||||||||
Innovator U.S. Equity Ultra Buffer ETF - April | ||||||||||||
NAV Return | 0.13 | % | 0.51 | % | 1.29 | % | ||||||
Market Return | 0.08 | % | 0.63 | % | 1.36 | % | ||||||
S&P 500® Index - Price Return | -1.18 | % | 11.94 | % | 12.98 | % | ||||||
S&P 500® Index - Total Return | 0.21 | % | 13.85 | % | 14.90 | % | ||||||
(a) | Inception date is March 29, 2019. |
Performance data quoted represents past performance and does not guarantee future results. The investment return and principal value of an investment will fluctuate so that an investor’s shares, when redeemed, may be worth more or less than their original cost. Current performance of the Fund may be lower or higher than the performance quoted. As of the latest prospectus, the net expense ratio of the Fund was 0.79%. For the most recent performance, please visit the Fund’s website at innovatoretfs.com.
INNOVATOR U.S. EQUITY ULTRA BUFFER ETF – APRIL
Fund Performance
April 30, 2022 (Unaudited) (Continued)
The line graph and performance table do not reflect the deduction of taxes that a shareholder may pay on fund distributions or the redemption of Fund shares. Returns shown for the Fund and S&P 500® Index – Total Return include the reinvestment of all dividends, if any. Returns shown for the S&P 500® Index – Price Return do not include the reinvestment of dividends, if any.
The S&P 500® Index is an unmanaged, capitalization–weighted index generally representative of the U.S. market for large capitalization stocks.
The Fund’s portfolio holdings may differ significantly from the securities held in the relevant index and, unlike an exchange–traded fund, the performance of an unmanaged index does not reflect deductions for transaction costs, taxes, management fees or other expenses.
You cannot invest directly in an index.
Premium/Discount Information:
Information regarding the differences between the price of the Fund’s shares on the secondary market and the Fund’s net asset value is available at Innovatoretfs.com/UAPR.
INNOVATOR U.S. EQUITY ULTRA BUFFER ETF – MAY
Fund Performance
April 30, 2022 (Unaudited)
The following chart compares the value of a hypothetical $10,000 investment in the Innovator U.S. Equity Ultra Buffer ETF – May from its inception (April 30, 2020) to April 30, 2022 as compared with the S&P 500® Index - Price Return and Total Return.
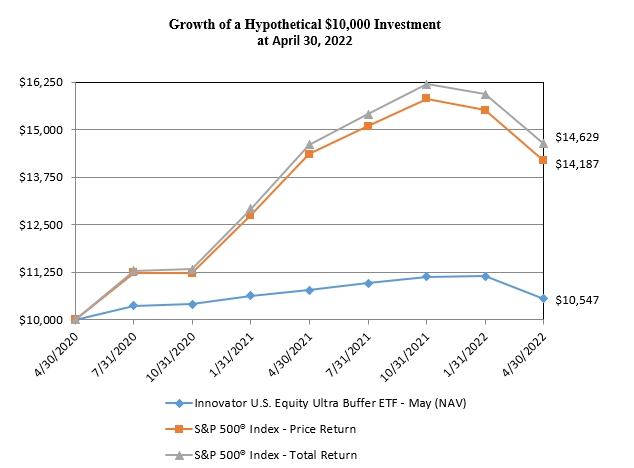
Average Annual Total Returns as of April 30, 2022 | ||||||||
One Year | Since Inception (a) | |||||||
Innovator U.S. Equity Ultra Buffer ETF - May | ||||||||
NAV Return | -2.09 | % | 2.70 | % | ||||
Market Return | -2.01 | % | 2.75 | % | ||||
S&P 500® Index - Price Return | -1.18 | % | 19.11 | % | ||||
S&P 500® Index - Total Return | 0.21 | % | 20.95 | % | ||||
(a) | Inception date is April 30, 2020. |
Performance data quoted represents past performance and does not guarantee future results. The investment return and principal value of an investment will fluctuate so that an investor’s shares, when redeemed, may be worth more or less than their original cost. Current performance of the Fund may be lower or higher than the performance quoted. As of the latest prospectus, the net expense ratio of the Fund was 0.79%. For the most recent performance, please visit the Fund’s website at innovatoretfs.com.
INNOVATOR U.S. EQUITY ULTRA BUFFER ETF – MAY
Fund Performance
April 30, 2022 (Unaudited) (Continued)
The line graph and performance table do not reflect the deduction of taxes that a shareholder may pay on fund distributions or the redemption of Fund shares. Returns shown for the Fund and S&P 500® Index - Total Return include the reinvestment of all dividends, if any. Returns shown for the S&P 500® Index -Price Return do not include the reinvestment of dividends, if any.
The S&P 500® Index is an unmanaged, capitalization-weighted index generally representative of the U.S. market for large capitalization stocks.
The Fund’s portfolio holdings may differ significantly from the securities held in the relevant index and, unlike an exchange-traded fund, the performance of an unmanaged index does not reflect deductions for transaction costs, taxes, management fees or other expenses.
You cannot invest directly in an index.
Premium/Discount Information:
Information regarding the differences between the price of the Fund’s shares on the secondary market and the Fund’s net asset value is available at Innovatoretfs.com/UMAY.
INNOVATOR U.S. EQUITY ULTRA BUFFER ETF – JUNE
Fund Performance
April 30, 2022 (Unaudited)
The following chart compares the value of a hypothetical $10,000 investment in the Innovator U.S. Equity Ultra Buffer ETF – June from its inception (May 31, 2019) to April 30, 2022 as compared with the S&P 500® Index – Price Return and Total Return.
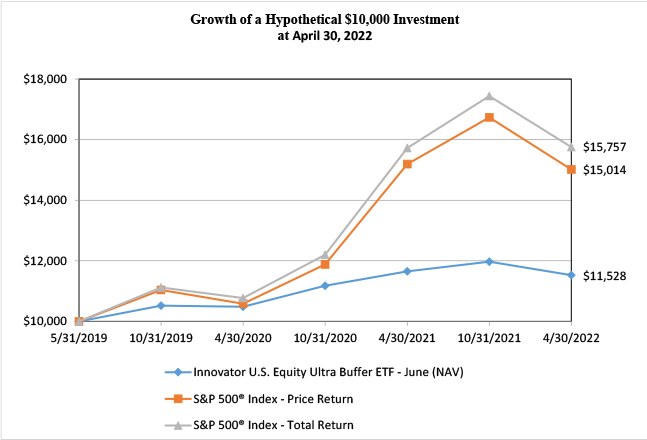
Average Annual Total Returns as of April 30, 2022 | ||||||||
One Year | Since Inception (a) | |||||||
Innovator U.S. Equity Ultra Buffer ETF - June | ||||||||
NAV Return | -1.05 | % | 4.99 | % | ||||
Market Return | -0.91 | % | 5.02 | % | ||||
S&P 500® Index - Price Return | -1.18 | % | 14.94 | % | ||||
S&P 500® Index - Total Return | 0.21 | % | 16.86 | % | ||||
(a) | Inception date is May 31, 2019. |
Performance data quoted represents past performance and does not guarantee future results. The investment return and principal value of an investment will fluctuate so that an investor’s shares, when redeemed, may be worth more or less than their original cost. Current performance of the Fund may be lower or higher than the performance quoted. As of the latest prospectus, the net expense ratio of the Fund was 0.79%. For the most recent performance, please visit the Fund’s website at innovatoretfs.com.
INNOVATOR U.S. EQUITY ULTRA BUFFER ETF – JUNE
Fund Performance
April 30, 2022 (Unaudited) (Continued)
The line graph and performance table do not reflect the deduction of taxes that a shareholder may pay on fund distributions or the redemption of Fund shares. Returns shown for the Fund and S&P 500® Index – Total Return include the reinvestment of all dividends, if any. Returns shown for the S&P 500® Index – Price Return do not include the reinvestment of dividends, if any.
The S&P 500® Index is an unmanaged, capitalization–weighted index generally representative of the U.S. market for large capitalization stocks.
The Fund’s portfolio holdings may differ significantly from the securities held in the relevant index and, unlike an exchange–traded fund, the performance of an unmanaged index does not reflect deductions for transaction costs, taxes, management fees or other expenses.
You cannot invest directly in an index.
Premium/Discount Information:
Information regarding the differences between the price of the Fund’s shares on the secondary market and the Fund’s net asset value is available at Innovatoretfs.com/UJUN.
INNOVATOR U.S. EQUITY ULTRA BUFFER ETF – JULY
Fund Performance
April 30, 2022 (Unaudited)
The following chart compares the value of a hypothetical $10,000 investment in the Innovator U.S. Equity Ultra Buffer ETF – July from its inception (August 7, 2018) to April 30, 2022 as compared with the S&P 500® Index – Price Return and Total Return.
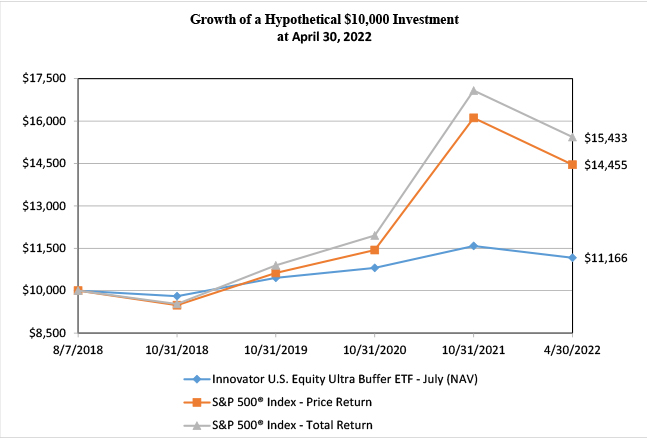
Average Annual Total Returns as of April 30, 2022 | ||||||||||||
One Year | Three Years | Since Inception (a) | ||||||||||
Innovator U.S. Equity Ultra Buffer ETF - July | ||||||||||||
NAV Return | -1.81 | % | 2.84 | % | 3.00 | % | ||||||
Market Return | -1.51 | % | 2.86 | % | 3.03 | % | ||||||
S&P 500® Index - Price Return | -1.18 | % | 11.94 | % | 10.39 | % | ||||||
S&P 500® Index - Total Return | 0.21 | % | 13.85 | % | 12.34 | % | ||||||
(a) | Inception date is August 7, 2018. |
Performance data quoted represents past performance and does not guarantee future results. The investment return and principal value of an investment will fluctuate so that an investor’s shares, when redeemed, may be worth more or less than their original cost. Current performance of the Fund may be lower or higher than the performance quoted. As of the latest prospectus, the net expense ratio of the Fund was 0.79%. For the most recent performance, please visit the Fund’s website at innovatoretfs.com.
INNOVATOR U.S. EQUITY ULTRA BUFFER ETF – JULY
Fund Performance
April 30, 2022 (Unaudited) (Continued)
The line graph and performance table do not reflect the deduction of taxes that a shareholder may pay on fund distributions or the redemption of Fund shares. Returns shown for the Fund and S&P 500® Index – Total Return include the reinvestment of all dividends, if any. Returns shown for the S&P 500® Index – Price Return do not include the reinvestment of dividends, if any.
The S&P 500® Index is an unmanaged, capitalization–weighted index generally representative of the U.S. market for large capitalization stocks.
The Fund’s portfolio holdings may differ significantly from the securities held in the relevant index and, unlike an exchange–traded fund, the performance of an unmanaged index does not reflect deductions for transaction costs, taxes, management fees or other expenses.
You cannot invest directly in an index.
Premium/Discount Information:
Information regarding the differences between the price of the Fund’s shares on the secondary market and the Fund’s net asset value is available at Innovatoretfs.com/UJUL.
INNOVATOR U.S. EQUITY ULTRA BUFFER ETF – AUGUST
Fund Performance
April 30, 2022 (Unaudited)
The following chart compares the value of a hypothetical $10,000 investment in the Innovator U.S. Equity Ultra Buffer ETF – August from its inception (July 31, 2019) to April 30, 2022 as compared with the S&P 500® Index – Price Return and Total Return.
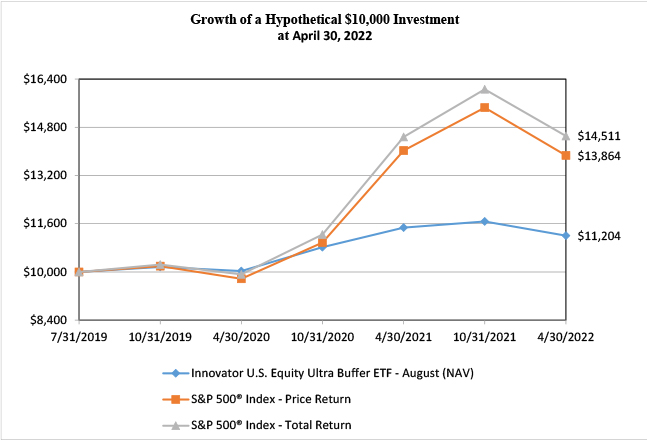
Average Annual Total Returns as of April 30, 2022 | ||||||||
One Year | Since Inception (a) | |||||||
Innovator U.S. Equity Ultra Buffer ETF - August | ||||||||
NAV Return | -2.30 | % | 4.22 | % | ||||
Market Return | -1.99 | % | 4.26 | % | ||||
S&P 500® Index - Price Return | -1.18 | % | 12.61 | % | ||||
S&P 500® Index - Total Return | 0.21 | % | 14.49 | % | ||||
(a) | Inception date is July 31, 2019. |
Performance data quoted represents past performance and does not guarantee future results. The investment return and principal value of an investment will fluctuate so that an investor’s shares, when redeemed, may be worth more or less than their original cost. Current performance of the Fund may be lower or higher than the performance quoted. As of the latest prospectus, the net expense ratio of the Fund was 0.79%. For the most recent performance, please visit the Fund’s website at innovatoretfs.com.
INNOVATOR U.S. EQUITY ULTRA BUFFER ETF – AUGUST
Fund Performance
April 30, 2022 (Unaudited) (Continued)
The line graph and performance table do not reflect the deduction of taxes that a shareholder may pay on fund distributions or the redemption of Fund shares. Returns shown for the Fund and S&P 500® Index – Total Return include the reinvestment of all dividends, if any. Returns shown for the S&P 500® Index – Price Return do not include the reinvestment of dividends, if any.
The S&P 500® Index is an unmanaged, capitalization–weighted index generally representative of the U.S. market for large capitalization stocks.
The Fund’s portfolio holdings may differ significantly from the securities held in the relevant index and, unlike an exchange–traded fund, the performance of an unmanaged index does not reflect deductions for transaction costs, taxes, management fees or other expenses.
You cannot invest directly in an index.
Premium/Discount Information:
Information regarding the differences between the price of the Fund’s shares on the secondary market and the Fund’s net asset value is available at Innovatoretfs.com/UAUG.
INNOVATOR U.S. EQUITY ULTRA BUFFER ETF – SEPTEMBER
Fund Performance
April 30, 2022 (Unaudited)
The following chart compares the value of a hypothetical $10,000 investment in the Innovator U.S. Equity Ultra Buffer ETF – September from its inception (August 30, 2019) to April 30, 2022 as compared with the S&P 500® Index – Price Return and Total Return.
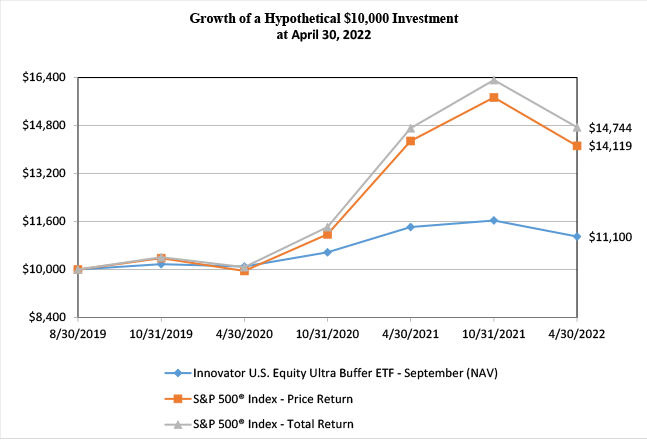
Average Annual Total Returns as of April 30, 2022 | ||||||||
One Year | Since Inception (a) | |||||||
Innovator U.S. Equity Ultra Buffer ETF - September | ||||||||
NAV Return | -2.74 | % | 3.99 | % | ||||
Market Return | -2.62 | % | 4.03 | % | ||||
S&P 500® Index - Price Return | -1.18 | % | 13.80 | % | ||||
S&P 500® Index - Total Return | 0.21 | % | 15.66 | % | ||||
(a) | Inception date is August 30, 2019. |
Performance data quoted represents past performance and does not guarantee future results. The investment return and principal value of an investment will fluctuate so that an investor’s shares, when redeemed, may be worth more or less than their original cost. Current performance of the Fund may be lower or higher than the performance quoted. As of the latest prospectus, the net expense ratio of the Fund was 0.79%. For the most recent performance, please visit the Fund’s website at innovatoretfs.com.
INNOVATOR U.S. EQUITY ULTRA BUFFER ETF – SEPTEMBER
Fund Performance
April 30, 2022 (Unaudited) (Continued)
The line graph and performance table do not reflect the deduction of taxes that a shareholder may pay on fund distributions or the redemption of Fund shares. Returns shown for the Fund and S&P 500® Index – Total Return include the reinvestment of all dividends, if any. Returns shown for the S&P 500® Index – Price Return do not include the reinvestment of dividends, if any.
The S&P 500® Index is an unmanaged, capitalization–weighted index generally representative of the U.S. market for large capitalization stocks.
The Fund’s portfolio holdings may differ significantly from the securities held in the relevant index and, unlike an exchange–traded fund, the performance of an unmanaged index does not reflect deductions for transaction costs, taxes, management fees or other expenses.
You cannot invest directly in an index.
Premium/Discount Information:
Information regarding the differences between the price of the Fund’s shares on the secondary market and the Fund’s net asset value is available at Innovatoretfs.com/USEP.
INNOVATOR U.S. EQUITY ULTRA BUFFER ETF – OCTOBER
Fund Performance
April 30, 2022 (Unaudited)
The following chart compares the value of a hypothetical $10,000 investment in the Innovator U.S. Equity Ultra Buffer ETF – October from its inception (September 28, 2018) to April 30, 2022 as compared with the S&P 500® Index – Price Return and Total Return.
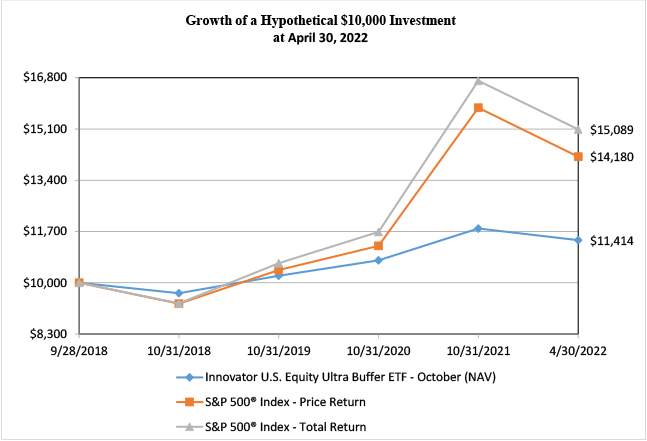
Average Annual Total Returns as of April 30, 2022 | ||||||||||||
One Year | Three Years | Since Inception (a) | ||||||||||
Innovator U.S. Equity Ultra Buffer ETF - October | ||||||||||||
NAV Return | -0.80 | % | 4.03 | % | 3.76 | % | ||||||
Market Return | -0.29 | % | 4.10 | % | 3.83 | % | ||||||
S&P 500® Index - Price Return | -1.18 | % | 11.94 | % | 10.23 | % | ||||||
S&P 500® Index - Total Return | 0.21 | % | 13.85 | % | 12.16 | % | ||||||
(a) | Inception date is September 28, 2018. |
Performance data quoted represents past performance and does not guarantee future results. The investment return and principal value of an investment will fluctuate so that an investor’s shares, when redeemed, may be worth more or less than their original cost. Current performance of the Fund may be lower or higher than the performance quoted. As of the latest prospectus, the net expense ratio of the Fund was 0.79%. For the most recent performance, please visit the Fund’s website at innovatoretfs.com.
INNOVATOR U.S. EQUITY ULTRA BUFFER ETF – OCTOBER
Fund Performance
April 30, 2022 (Unaudited) (Continued)
The line graph and performance table do not reflect the deduction of taxes that a shareholder may pay on fund distributions or the redemption of Fund shares. Returns shown for the Fund and S&P 500® Index – Total Return include the reinvestment of all dividends, if any. Returns shown for the S&P 500® Index – Price Return do not include the reinvestment of dividends, if any.
The S&P 500® Index is an unmanaged, capitalization–weighted index generally representative of the U.S. market for large capitalization stocks.
The Fund’s portfolio holdings may differ significantly from the securities held in the relevant index and, unlike an exchange–traded fund, the performance of an unmanaged index does not reflect deductions for transaction costs, taxes, management fees or other expenses.
You cannot invest directly in an index.
Premium/Discount Information:
Information regarding the differences between the price of the Fund’s shares on the secondary market and the Fund’s net asset value is available at Innovatoretfs.com/UOCT.
INNOVATOR U.S. EQUITY ULTRA BUFFER ETF – NOVEMBER
Fund Performance
April 30, 2022 (Unaudited)
The following chart compares the value of a hypothetical $10,000 investment in the Innovator U.S. Equity Ultra Buffer ETF – November from its inception (October 31, 2019) to April 30, 2022 as compared with the S&P 500® Index - Price Return and Total Return.
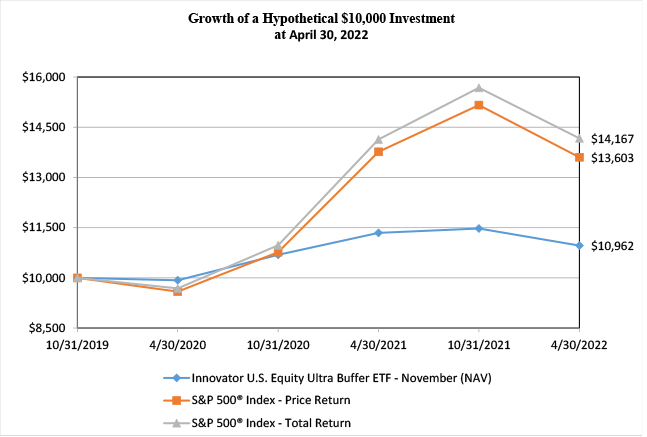
Average Annual Total Returns as of April 30, 2022 | ||||||||
One Year | Since Inception (a) | |||||||
Innovator U.S. Equity Ultra Buffer ETF - November | ||||||||
NAV Return | -3.37 | % | 3.75 | % | ||||
Market Return | -2.92 | % | 3.82 | % | ||||
S&P 500® Index - Price Return | -1.18 | % | 13.10 | % | ||||
S&P 500® Index - Total Return | 0.21 | % | 14.96 | % | ||||
(a) | Inception date is October 31, 2019. |
Performance data quoted represents past performance and does not guarantee future results. The investment return and principal value of an investment will fluctuate so that an investor’s shares, when redeemed, may be worth more or less than their original cost. Current performance of the Fund may be lower or higher than the performance quoted. As of the latest prospectus, the net expense ratio of the Fund was 0.79%. For the most recent performance, please visit the Fund’s website at innovatoretfs.com.
INNOVATOR U.S. EQUITY ULTRA BUFFER ETF – NOVEMBER
Fund Performance
April 30, 2022 (Unaudited) (Continued)
The line graph and performance table do not reflect the deduction of taxes that a shareholder may pay on fund distributions or the redemption of Fund shares. Returns shown for the Fund and S&P 500® Index - Total Return include the reinvestment of all dividends, if any. Returns shown for the S&P 500® Index - Price Return do not include the reinvestment of dividends, if any.
The S&P 500® Index is an unmanaged, capitalization-weighted index generally representative of the U.S. market for large capitalization stocks.
The Fund’s portfolio holdings may differ significantly from the securities held in the relevant index and, unlike an exchange-traded fund, the performance of an unmanaged index does not reflect deductions for transaction costs, taxes, management fees or other expenses.
You cannot invest directly in an index.
Premium/Discount Information:
Information regarding the differences between the price of the Fund’s shares on the secondary market and the Fund’s net asset value is available at Innovatoretfs.com/UNOV.
INNOVATOR U.S. EQUITY ULTRA BUFFER ETF – DECEMBER
Fund Performance
April 30, 2022 (Unaudited)
The following chart compares the value of a hypothetical $10,000 investment in the Innovator U.S. Equity Ultra Buffer ETF – December from its inception (November 29, 2019) to April 30, 2022 as compared with the S&P 500® Index - Price Return and Total Return.
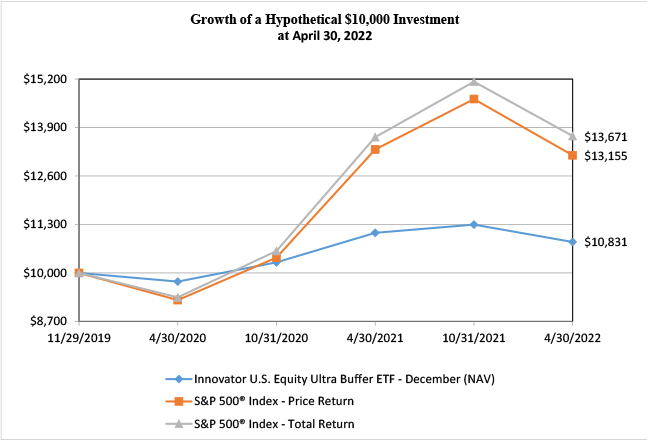
Average Annual Total Returns as of April 30, 2022 | ||||||||
One Year | Since Inception (a) | |||||||
Innovator U.S. Equity Ultra Buffer ETF - December | ||||||||
NAV Return | -2.21 | % | 3.36 | % | ||||
Market Return | -1.90 | % | 3.46 | % | ||||
S&P 500® Index - Price Return | -1.18 | % | 12.00 | % | ||||
S&P 500® Index - Total Return | 0.21 | % | 13.80 | % | ||||
(a) | Inception date is November 29, 2019. |
Performance data quoted represents past performance and does not guarantee future results. The investment return and principal value of an investment will fluctuate so that an investor’s shares, when redeemed, may be worth more or less than their original cost. Current performance of the Fund may be lower or higher than the performance quoted. As of the latest prospectus, the net expense ratio of the Fund was 0.79%. For the most recent performance, please visit the Fund’s website at innovatoretfs.com.
INNOVATOR U.S. EQUITY ULTRA BUFFER ETF – DECEMBER
Fund Performance
April 30, 2022 (Unaudited) (Continued)
The line graph and performance table do not reflect the deduction of taxes that a shareholder may pay on fund distributions or the redemption of Fund shares. Returns shown for the Fund and S&P 500® Index - Total Return include the reinvestment of all dividends, if any. Returns shown for the S&P 500® Index -Price Return do not include the reinvestment of dividends, if any.
The S&P 500® Index is an unmanaged, capitalization-weighted index generally representative of the U.S. market for large capitalization stocks.
The Fund’s portfolio holdings may differ significantly from the securities held in the relevant index and, unlike an exchange-traded fund, the performance of an unmanaged index does not reflect deductions for transaction costs, taxes, management fees or other expenses.
You cannot invest directly in an index.
Premium/Discount Information:
Information regarding the differences between the price of the Fund’s shares on the secondary market and the Fund’s net asset value is available at Innovatoretfs.com/UDEC.
INNOVATOR ETFs TRUST
Expense Example
For the Period Ended April 30, 2022 (Unaudited)
As a shareholder of the Funds, you incur two types of costs: (1) ongoing costs, including management fees, and other Fund expenses; and (2) transaction costs, including brokerage commissions on the purchase and sale of Fund shares. This Example is intended to help you understand your ongoing costs (in dollars) of investing in the Funds and to compare these costs with the ongoing costs of investing in other funds.
The Example is based on an investment of $1,000 invested at the beginning of the period and held for the entire period from November 1, 2021 to April 30, 2022 for each Fund.
Actual Expenses
The following table provides information about actual account values and actual expenses. You may use the information in this table, together with the amount you invested, to estimate the expenses you paid over the period. Simply divide your account value by $1,000 (for example, an $8,600 account value divided by $1,000 equals 8.6), then multiply the result by the number in the applicable line under the heading titled “Expenses Paid During the Period” to estimate the expenses you paid on your account during the period.
Beginning Account Value | Ending Account Value | Expenses Paid During the Period (a) | ||||||||||
Innovator U.S. Equity Buffer ETF - January (NAV) | $ | 1,000.00 | $ | 918.30 | $ | 3.76 | ||||||
Innovator U.S. Equity Buffer ETF - February (NAV) | 1,000.00 | 955.80 | 3.83 | |||||||||
Innovator U.S. Equity Buffer ETF - March (NAV) | 1,000.00 | 963.30 | 3.85 | |||||||||
Innovator U.S. Equity Buffer ETF - April (NAV) | 1,000.00 | 965.20 | 3.85 | |||||||||
Innovator U.S. Equity Buffer ETF - May (NAV) | 1,000.00 | 926.20 | 3.77 | |||||||||
Innovator U.S. Equity Buffer ETF - June (NAV) | 1,000.00 | 946.50 | 3.81 | |||||||||
Innovator U.S. Equity Buffer ETF - July (NAV) | 1,000.00 | 947.90 | 3.82 | |||||||||
Innovator U.S. Equity Buffer ETF - August (NAV) | 1,000.00 | 939.20 | 3.80 | |||||||||
Innovator U.S. Equity Buffer ETF - September (NAV) | 1,000.00 | 936.30 | 3.79 | |||||||||
Innovator U.S. Equity Buffer ETF - October (NAV) | 1,000.00 | 942.60 | 3.81 | |||||||||
Innovator U.S. Equity Buffer ETF - November (NAV) | 1,000.00 | 934.20 | 3.79 | |||||||||
Innovator U.S. Equity Buffer ETF - December (NAV) | 1,000.00 | 940.00 | 3.80 | |||||||||
Innovator U.S. Equity Power Buffer ETF - January (NAV) | 1,000.00 | 936.70 | 3.79 | |||||||||
Innovator U.S. Equity Power Buffer ETF - February (NAV) | 1,000.00 | 963.20 | 3.85 | |||||||||
Innovator U.S. Equity Power Buffer ETF - March (NAV) | 1,000.00 | 984.40 | 3.89 | |||||||||
Innovator U.S. Equity Power Buffer ETF - April (NAV) | 1,000.00 | 968.30 | 3.86 | |||||||||
Innovator U.S. Equity Power Buffer ETF - May (NAV) | 1,000.00 | 948.00 | 3.82 | |||||||||
Innovator U.S. Equity Power Buffer ETF - June (NAV) | 1,000.00 | 969.90 | 3.86 | |||||||||
Innovator U.S. Equity Power Buffer ETF - July (NAV) | 1,000.00 | 969.50 | 3.86 | |||||||||
Innovator U.S. Equity Power Buffer ETF - August (NAV) | 1,000.00 | 964.60 | 3.85 | |||||||||
Innovator U.S. Equity Power Buffer ETF - September (NAV) | 1,000.00 | 956.60 | 3.83 | |||||||||
Innovator U.S. Equity Power Buffer ETF - October (NAV) | 1,000.00 | 963.60 | 3.85 | |||||||||
Innovator U.S. Equity Power Buffer ETF - November (NAV) | 1,000.00 | 953.50 | 3.83 | |||||||||
INNOVATOR ETFs TRUST
Expense Example
For the Period Ended April 30, 2022 (Unaudited) (Continued)
Beginning Account Value | Ending Account Value | Expenses Paid During the Period (a) | ||||||||||
Innovator U.S. Equity Power Buffer ETF - December (NAV) | $ | 1,000.00 | $ | 956.40 | $ | 3.83 | ||||||
Innovator U.S. Equity Ultra Buffer ETF - January (NAV) | 1,000.00 | 946.10 | 3.81 | |||||||||
Innovator U.S. Equity Ultra Buffer ETF - February (NAV) | 1,000.00 | 970.20 | 3.86 | |||||||||
Innovator U.S. Equity Ultra Buffer ETF - March (NAV) | 1,000.00 | 982.70 | 3.88 | |||||||||
Innovator U.S. Equity Ultra Buffer ETF - April (NAV) | 1,000.00 | 976.10 | 3.87 | |||||||||
Innovator U.S. Equity Ultra Buffer ETF - May (NAV) | 1,000.00 | 948.00 | 3.82 | |||||||||
Innovator U.S. Equity Ultra Buffer ETF - June (NAV) | 1,000.00 | 962.90 | 3.84 | |||||||||
Innovator U.S. Equity Ultra Buffer ETF - July (NAV) | 1,000.00 | 964.20 | 3.85 | |||||||||
Innovator U.S. Equity Ultra Buffer ETF - August (NAV) | 1,000.00 | 959.70 | 3.84 | |||||||||
Innovator U.S. Equity Ultra Buffer ETF - September (NAV) | 1,000.00 | 954.20 | 3.83 | |||||||||
Innovator U.S. Equity Ultra Buffer ETF - October (NAV) | 1,000.00 | 967.40 | 3.85 | |||||||||
Innovator U.S. Equity Ultra Buffer ETF - November (NAV) | 1,000.00 | 955.40 | 3.83 | |||||||||
Innovator U.S. Equity Ultra Buffer ETF - December (NAV) | 1,000.00 | 958.80 | 3.84 | |||||||||
(a) | Expenses are equal to the Portfolio's annualized expense ratio (0.79%), multiplied by the average account value over the period, multiplied by 181/365 (to reflect the six month period). |
Hypothetical Example for Comparison Purposes
The following table provides information about hypothetical account values and hypothetical expenses based on the Funds’ actual expense ratios and an assumed rate of return of 5% per year before expenses, which are not the Funds’ actual returns. The hypothetical account values and expenses may not be used to estimate the actual ending account balance or expenses you paid for the period. You may use this information to compare the ongoing costs of investing in the Funds with other funds. To do so, compare this 5% hypothetical example with the 5% hypothetical examples that appear in the shareholder reports of other funds.
Please note that the expenses shown in the table are meant to highlight your ongoing costs only and do not reflect any transactional costs, such as brokerage commissions on the purchase and sale of Fund shares with respect to the Funds. Therefore, the table below is useful in comparing the ongoing costs only, and will not help you determine the relative total costs of owning different funds. In addition, if these transactional costs were included, your costs could have been higher.
Beginning Account Value | Ending Account Value | Expenses Paid During the Period (a) | ||||||||||
Innovator U.S. Equity Buffer ETF - January (NAV) | $ | 1,000.00 | $ | 1,020.88 | $ | 3.96 | ||||||
Innovator U.S. Equity Buffer ETF - February (NAV) | 1,000.00 | 1,020.88 | 3.96 | |||||||||
Innovator U.S. Equity Buffer ETF - March (NAV) | 1,000.00 | 1,020.88 | 3.96 | |||||||||
Innovator U.S. Equity Buffer ETF - April (NAV) | 1,000.00 | 1,020.88 | 3.96 | |||||||||
INNOVATOR ETFs TRUST
Expense Example
For the Period Ended April 30, 2022 (Unaudited) (Continued)
Beginning Account Value | Ending Account Value | Expenses Paid During the Period (a) | ||||||||||
Innovator U.S. Equity Buffer ETF - May (NAV) | $ | 1,000.00 | $ | 1,020.88 | $ | 3.96 | ||||||
Innovator U.S. Equity Buffer ETF - June (NAV) | 1,000.00 | 1,020.88 | 3.96 | |||||||||
Innovator U.S. Equity Buffer ETF - July (NAV) | 1,000.00 | 1,020.88 | 3.96 | |||||||||
Innovator U.S. Equity Buffer ETF - August (NAV) | 1,000.00 | 1,020.88 | 3.96 | |||||||||
Innovator U.S. Equity Buffer ETF - September (NAV) | 1,000.00 | 1,020.88 | 3.96 | |||||||||
Innovator U.S. Equity Buffer ETF - October (NAV) | 1,000.00 | 1,020.88 | 3.96 | |||||||||
Innovator U.S. Equity Buffer ETF - November (NAV) | 1,000.00 | 1,020.88 | 3.96 | |||||||||
Innovator U.S. Equity Buffer ETF - December (NAV) | 1,000.00 | 1,020.88 | 3.96 | |||||||||
Innovator U.S. Equity Power Buffer ETF - January (NAV) | 1,000.00 | 1,020.88 | 3.96 | |||||||||
Innovator U.S. Equity Power Buffer ETF - February (NAV) | 1,000.00 | 1,020.88 | 3.96 | |||||||||
Innovator U.S. Equity Power Buffer ETF - March (NAV) | 1,000.00 | 1,020.88 | 3.96 | |||||||||
Innovator U.S. Equity Power Buffer ETF - April (NAV) | 1,000.00 | 1,020.88 | 3.96 | |||||||||
Innovator U.S. Equity Power Buffer ETF - May (NAV) | 1,000.00 | 1,020.88 | 3.96 | |||||||||
Innovator U.S. Equity Power Buffer ETF - June (NAV) | 1,000.00 | 1,020.88 | 3.96 | |||||||||
Innovator U.S. Equity Power Buffer ETF - July (NAV) | 1,000.00 | 1,020.88 | 3.96 | |||||||||
Innovator U.S. Equity Power Buffer ETF - August (NAV) | 1,000.00 | 1,020.88 | 3.96 | |||||||||
Innovator U.S. Equity Power Buffer ETF - September (NAV) | 1,000.00 | 1,020.88 | 3.96 | |||||||||
Innovator U.S. Equity Power Buffer ETF - October (NAV) | 1,000.00 | 1,020.88 | 3.96 | |||||||||
Innovator U.S. Equity Power Buffer ETF - November (NAV) | 1,000.00 | 1,020.88 | 3.96 | |||||||||
Innovator U.S. Equity Power Buffer ETF - December (NAV) | 1,000.00 | 1,020.88 | 3.96 | |||||||||
Innovator U.S. Equity Ultra Buffer ETF - January (NAV) | 1,000.00 | 1,020.88 | 3.96 | |||||||||
Innovator U.S. Equity Ultra Buffer ETF - February (NAV) | 1,000.00 | 1,020.88 | 3.96 | |||||||||
Innovator U.S. Equity Ultra Buffer ETF - March (NAV) | 1,000.00 | 1,020.88 | 3.96 | |||||||||
Innovator U.S. Equity Ultra Buffer ETF - April (NAV) | 1,000.00 | 1,020.88 | 3.96 | |||||||||
Innovator U.S. Equity Ultra Buffer ETF - May (NAV) | 1,000.00 | 1,020.88 | 3.96 | |||||||||
Innovator U.S. Equity Ultra Buffer ETF - June (NAV) | 1,000.00 | 1,020.88 | 3.96 | |||||||||
Innovator U.S. Equity Ultra Buffer ETF - July (NAV) | 1,000.00 | 1,020.88 | 3.96 | |||||||||
Innovator U.S. Equity Ultra Buffer ETF - August (NAV) | 1,000.00 | 1,020.88 | 3.96 | |||||||||
Innovator U.S. Equity Ultra Buffer ETF - September (NAV) | 1,000.00 | 1,020.88 | 3.96 | |||||||||
Innovator U.S. Equity Ultra Buffer ETF - October (NAV) | 1,000.00 | 1,020.88 | 3.96 | |||||||||
Innovator U.S. Equity Ultra Buffer ETF - November (NAV) | 1,000.00 | 1,020.88 | 3.96 | |||||||||
Innovator U.S. Equity Ultra Buffer ETF - December (NAV) | 1,000.00 | 1,020.88 | 3.96 | |||||||||
(a) | Expenses are equal to the Portfolio's annualized expense ratio (0.79%), multiplied by the average account value over the period, multiplied by 181/365 (to reflect the six month period). |
INNOVATOR U.S. EQUITY BUFFER ETF – JANUARY
Schedule of Investments
April 30, 2022 (Unaudited)
Contracts | Notional Amount | Value | ||||||||||
PURCHASED OPTIONS - 109.06% (a)(b) | ||||||||||||
CALL OPTIONS - 93.55% | ||||||||||||
SPY SPDR S&P 500® Trust ETF, Expires 12/30/2022, Strike Price $3.81 | 4,536 | $ | 186,883,200 | $ | 182,919,238 | |||||||
| 182,919,238 | ||||||||||||
PUT OPTIONS - 15.51% | ||||||||||||
SPY SPDR S&P 500® Trust ETF, Expires 12/30/2022, Strike Price $474.97 | 4,536 | 186,883,200 | 30,335,585 | |||||||||
| 30,335,585 | ||||||||||||
TOTAL PURCHASED OPTIONS (Cost $225,077,115) | 213,254,823 | |||||||||||
Principal Amount | ||||||||||||
SHORT TERM INVESTMENTS - 0.62% | ||||||||||||
Money Market Deposit Account - 0.62% | ||||||||||||
U.S. Bank Money Market Deposit Account, 0.130% (c) | $ | 1,204,344 | 1,204,344 | |||||||||
TOTAL SHORT TERM INVESTMENTS (Cost $1,204,344) | 1,204,344 | |||||||||||
Total Investments (Cost $226,281,459) - 109.68% | 214,459,167 | |||||||||||
Liabilities in Excess of Other Assets - (9.68)% | (18,930,523 | ) | ||||||||||
TOTAL NET ASSETS - 100.00% | $ | 195,528,644 | ||||||||||
Asset Type | % of Net Assets | |||
Purchased Options | 109.06 | % | ||
Short Term Investments | 0.62 | |||
Total Investments | 109.68 | |||
Liabilities in Excess of Other Assets | (9.68 | ) | ||
Net Assets | 100.00 | % | ||
Percentages are stated as a percent of net assets. | ||||
(a) | Exchange-Traded. |
(b) | Purchased option contracts are held in connection with corresponding option contracts written short. |
(c) | The U.S. Bank Money Market Deposit Account (the “MMDA”) is a short-term investment vehicle in which the Fund holds cash balances. The MMDA will bear interest at a variable rate that is determined based on conditions and may change daily and by any amount. The rate shown is as of April 30, 2022. |
INNOVATOR U.S. EQUITY BUFFER ETF – JANUARY
Schedule of Options Written (a)
April 30, 2022 (Unaudited)
| Description (a) | Expiration | Strike Price | Contracts | Notional Amount | Value | |||||||||||||
Call Options | ||||||||||||||||||
SPY SPDR S&P 500® Trust ETF | 12/30/2022 | $ | 539.27 | 4,536 | $ | (186,883,200 | ) | $ | (281,055 | ) | ||||||||
| (281,055 | ) | |||||||||||||||||
Put Options | ||||||||||||||||||
SPY SPDR S&P 500® Trust ETF | 12/30/2022 | 432.21 | 4,536 | (186,883,200 | ) | (18,512,055 | ) | |||||||||||
| (18,512,055 | ) | |||||||||||||||||
Total Options Written (Premiums Received $14,911,180) | $ | (18,793,110 | ) | |||||||||||||||
(a) | Exchange-Traded. |
INNOVATOR U.S. EQUITY BUFFER ETF – FEBRUARY
Schedule of Investments
April 30, 2022 (Unaudited)
Contracts | Notional Amount | Value | ||||||||||
PURCHASED OPTIONS - 107.52% (a)(b) | ||||||||||||
CALL OPTIONS - 95.49% | ||||||||||||
SPY SPDR S&P 500® Trust ETF, Expires 1/31/2023, Strike Price $3.61 | 2,755 | $ | 113,506,000 | $ | 111,152,876 | |||||||
| 111,152,876 | ||||||||||||
PUT OPTIONS - 12.03% | ||||||||||||
SPY SPDR S&P 500® Trust ETF, Expires 1/31/2023, Strike Price $449.92 | 2,755 | 113,506,000 | 14,000,572 | |||||||||
| 14,000,572 | ||||||||||||
TOTAL PURCHASED OPTIONS (Cost $131,030,084) | 125,153,448 | |||||||||||
Principal Amount | ||||||||||||
SHORT TERM INVESTMENTS - 0.68% | ||||||||||||
Money Market Deposit Account - 0.68% | ||||||||||||
U.S. Bank Money Market Deposit Account, 0.130% (c) | $ | 787,729 | 787,729 | |||||||||
TOTAL SHORT TERM INVESTMENTS (Cost $787,729) | 787,729 | |||||||||||
Total Investments (Cost $131,817,813) - 108.20% | 125,941,177 | |||||||||||
Liabilities in Excess of Other Assets - (8.20)% | (9,536,164 | ) | ||||||||||
TOTAL NET ASSETS - 100.00% | $ | 116,405,013 | ||||||||||
Asset Type | % of Net Assets | |||
Purchased Options | 107.52 | % | ||
Short Term Investments | 0.68 | |||
Total Investments | 108.20 | |||
Liabilities in Excess of Other Assets | (8.20 | ) | ||
Net Assets | 100.00 | % | ||
Percentages are stated as a percent of net assets. | ||||
(a) | Exchange-Traded. |
(b) | Purchased option contracts are held in connection with corresponding option contracts written short. |
(c) | The U.S. Bank Money Market Deposit Account (the “MMDA”) is a short-term investment vehicle in which the Fund holds cash balances. The MMDA will bear interest at a variable rate that is determined based on conditions and may change daily and by any amount. The rate shown is as of April 30, 2022. |
INNOVATOR U.S. EQUITY BUFFER ETF – FEBRUARY
Schedule of Options Written (a)
April 30, 2022 (Unaudited)
| Description (a) | Expiration | Strike Price | Contracts | Notional Amount | Value | |||||||||||||
Call Options | ||||||||||||||||||
SPY SPDR S&P 500® Trust ETF | 1/31/2023 | $ | 516.59 | 2,755 | $ | (113,506,000 | ) | $ | (540,583 | ) | ||||||||
| (540,583 | ) | |||||||||||||||||
Put Options | ||||||||||||||||||
SPY SPDR S&P 500® Trust ETF | 1/31/2023 | 409.42 | 2,755 | (113,506,000 | ) | (8,918,440 | ) | |||||||||||
| (8,918,440 | ) | |||||||||||||||||
Total Options Written (Premiums Received $8,842,515) | $ | (9,459,023 | ) | |||||||||||||||
(a) | Exchange-Traded. |
INNOVATOR U.S. EQUITY BUFFER ETF – MARCH
Schedule of Investments
April 30, 2022 (Unaudited)
Contracts | Notional Amount | Value | ||||||||||
PURCHASED OPTIONS - 106.95% (a)(b) | ||||||||||||
CALL OPTIONS - 96.22% | ||||||||||||
SPY SPDR S&P 500® Trust ETF, Expires 2/28/2023, Strike Price $3.51 | 2,073 | $ | 85,407,600 | $ | 83,659,315 | |||||||
| 83,659,315 | ||||||||||||
PUT OPTIONS - 10.73% | ||||||||||||
SPY SPDR S&P 500® Trust ETF, Expires 2/28/2023, Strike Price $436.64 | 2,073 | 85,407,600 | 9,331,262 | |||||||||
| 9,331,262 | ||||||||||||
TOTAL PURCHASED OPTIONS (Cost $96,552,375) | 92,990,577 | |||||||||||
Principal Amount | ||||||||||||
SHORT TERM INVESTMENTS - 0.75% | ||||||||||||
Money Market Deposit Account - 0.75% | ||||||||||||
U.S. Bank Money Market Deposit Account, 0.130% (c) | $ | 654,905 | 654,905 | |||||||||
TOTAL SHORT TERM INVESTMENTS (Cost $654,905) | 654,905 | |||||||||||
Total Investments (Cost $97,207,280) - 107.70% | 93,645,482 | |||||||||||
Liabilities in Excess of Other Assets - (7.70)% | (6,696,136 | ) | ||||||||||
TOTAL NET ASSETS - 100.00% | $ | 86,949,346 | ||||||||||
Asset Type | % of Net Assets | |||
Purchased Options | 106.95 | % | ||
Short Term Investments | 0.75 | |||
Total Investments | 107.70 | |||
Liabilities in Excess of Other Assets | (7.70 | ) | ||
Net Assets | 100.00 | % | ||
Percentages are stated as a percent of net assets. | ||||
(a) | Exchange-Traded. |
(b) | Purchased option contracts are held in connection with corresponding option contracts written short. |
(c) | The U.S. Bank Money Market Deposit Account (the “MMDA”) is a short-term investment vehicle in which the Fund holds cash balances. The MMDA will bear interest at a variable rate that is determined based on conditions and may change daily and by any amount. The rate shown is as of April 30, 2022. |
INNOVATOR U.S. EQUITY BUFFER ETF – MARCH
Schedule of Options Written (a)
April 30, 2022 (Unaudited)
| Description (a) | Expiration | Strike Price | Contracts | Notional Amount | Value | |||||||||||||
Call Options | ||||||||||||||||||
SPY SPDR S&P 500® Trust ETF | 2/28/2023 | $ | 509.24 | 2,073 | $ | (85,407,600 | ) | $ | (643,630 | ) | ||||||||
| (643,630 | ) | |||||||||||||||||
Put Options | ||||||||||||||||||
SPY SPDR S&P 500® Trust ETF | 2/28/2023 | 397.33 | 2,073 | (85,407,600 | ) | (5,994,511 | ) | |||||||||||
| (5,994,511 | ) | |||||||||||||||||
Total Options Written (Premiums Received $6,722,043) | $ | (6,638,141 | ) | |||||||||||||||
(a) | Exchange-Traded. |
INNOVATOR U.S. EQUITY BUFFER ETF – APRIL
Schedule of Investments
April 30, 2022 (Unaudited)
Contracts | Notional Amount | Value | ||||||||||
PURCHASED OPTIONS - 108.34% (a)(b) | ||||||||||||
CALL OPTIONS - 95.41% | ||||||||||||
SPY SPDR S&P 500® Trust ETF, Expires 3/31/2023, Strike Price $3.63 | 2,967 | $ | 122,240,400 | $ | 119,260,359 | |||||||
| 119,260,359 | ||||||||||||
PUT OPTIONS - 12.93% | ||||||||||||
SPY SPDR S&P 500® Trust ETF, Expires 3/31/2023, Strike Price $451.65 | 2,967 | 122,240,400 | 16,163,029 | |||||||||
| 16,163,029 | ||||||||||||
TOTAL PURCHASED OPTIONS (Cost $141,361,927) | �� | 135,423,388 | ||||||||||
Principal Amount | ||||||||||||
SHORT TERM INVESTMENTS - 0.82% | ||||||||||||
Money Market Deposit Account - 0.82% | ||||||||||||
U.S. Bank Money Market Deposit Account, 0.130% (c) | $ | 1,021,480 | 1,021,480 | |||||||||
TOTAL SHORT TERM INVESTMENTS (Cost $1,021,480) | 1,021,480 | |||||||||||
Total Investments (Cost $142,383,407) - 109.16% | 136,444,868 | |||||||||||
Liabilities in Excess of Other Assets - (9.16)% | (11,442,368 | ) | ||||||||||
TOTAL NET ASSETS - 100.00% | $ | 125,002,500 | ||||||||||
Asset Type | % of Net Assets | |||
Purchased Options | 108.34 | % | ||
Short Term Investments | 0.82 | |||
Total Investments | 109.16 | |||
Liabilities in Excess of Other Assets | (9.16 | ) | ||
Net Assets | 100.00 | % | ||
Percentages are stated as a percent of net assets. | ||||
(a) | Exchange-Traded. |
(b) | Purchased option contracts are held in connection with corresponding option contracts written short. |
(c) | The U.S. Bank Money Market Deposit Account (the “MMDA”) is a short-term investment vehicle in which the Fund holds cash balances. The MMDA will bear interest at a variable rate that is determined based on conditions and may change daily and by any amount. The rate shown is as of April 30, 2022. |
INNOVATOR U.S. EQUITY BUFFER ETF – APRIL
Schedule of Options Written (a)
April 30, 2022 (Unaudited)
| Description (a) | Expiration | Strike Price | Contracts | Notional Amount | Value | |||||||||||||
Call Options | ||||||||||||||||||
SPY SPDR S&P 500® Trust ETF | 3/31/2023 | $ | 525.26 | 2,967 | $ | (122,240,400 | ) | $ | (748,888 | ) | ||||||||
| (748,888 | ) | |||||||||||||||||
Put Options | ||||||||||||||||||
SPY SPDR S&P 500® Trust ETF | 3/31/2023 | 410.99 | 2,967 | (122,240,400 | ) | (10,611,042 | ) | |||||||||||
| (10,611,042 | ) | |||||||||||||||||
Total Options Written (Premiums Received $8,802,768) | $ | (11,359,930 | ) | |||||||||||||||
(a) | Exchange-Traded. |
INNOVATOR U.S. EQUITY BUFFER ETF – MAY
Schedule of Investments
April 30, 2022 (Unaudited)
Contracts | Notional Amount | Value | ||||||||||
PURCHASED OPTIONS - 106.91% (a)(b) | ||||||||||||
CALL OPTIONS - 98.18% | ||||||||||||
SPY SPDR S&P 500® Trust ETF, Expires 4/28/2023, Strike Price $4.13 | 1,491 | $ | 61,429,200 | $ | 59,923,290 | |||||||
| 59,923,290 | ||||||||||||
PUT OPTIONS - 8.73% | ||||||||||||
SPY SPDR S&P 500® Trust ETF, Expires 4/28/2023, Strike Price $412.01 | 1,491 | 61,429,200 | 5,325,852 | |||||||||
| 5,325,852 | ||||||||||||
TOTAL PURCHASED OPTIONS (Cost $65,255,253) | 65,249,142 | |||||||||||
Principal Amount | ||||||||||||
SHORT TERM INVESTMENTS - 0.07% | ||||||||||||
Money Market Deposit Account - 0.07% | ||||||||||||
U.S. Bank Money Market Deposit Account, 0.130% (c) | $ | 40,661 | 40,661 | |||||||||
TOTAL SHORT TERM INVESTMENTS (Cost $40,661) | 40,661 | |||||||||||
Total Investments (Cost $65,295,914) - 106.98% | 65,289,803 | |||||||||||
Liabilities in Excess of Other Assets - (6.98)% | (4,257,030 | ) | ||||||||||
TOTAL NET ASSETS - 100.00% | $ | 61,032,773 | ||||||||||
Asset Type | % of Net Assets | |||
Purchased Options | 106.91 | % | ||
Short Term Investments | 0.07 | |||
Total Investments | 106.98 | |||
Liabilities in Excess of Other Assets | (6.98 | ) | ||
Net Assets | 100.00 | % | ||
Percentages are stated as a percent of net assets. | ||||
(a) | Exchange-Traded. |
(b) | Purchased option contracts are held in connection with corresponding option contracts written short. |
(c) | The U.S. Bank Money Market Deposit Account (the “MMDA”) is a short-term investment vehicle in which the Fund holds cash balances. The MMDA will bear interest at a variable rate that is determined based on conditions and may change daily and by any amount. The rate shown is as of April 30, 2022. |
INNOVATOR U.S. EQUITY BUFFER ETF – MAY
Schedule of Options Written (a)
April 30, 2022 (Unaudited)
| Description (a) | Expiration | Strike Price | Contracts | Notional Amount | Value | |||||||||||||
Call Options | ||||||||||||||||||
SPY SPDR S&P 500® Trust ETF | 4/28/2023 | $ | 496.67 | 1,491 | $ | (61,429,200 | ) | $ | (912,492 | ) | ||||||||
| (912,492 | ) | |||||||||||||||||
Put Options | ||||||||||||||||||
SPY SPDR S&P 500® Trust ETF | 4/28/2023 | 374.92 | 1,491 | (61,429,200 | ) | (3,521,742 | ) | |||||||||||
| (3,521,742 | ) | |||||||||||||||||
Total Options Written (Premiums Received $4,428,101) | $ | (4,434,234 | ) | |||||||||||||||
(a) | Exchange-Traded. |
INNOVATOR U.S. EQUITY BUFFER ETF – JUNE
Schedule of Investments
April 30, 2022 (Unaudited)
Contracts | Notional Amount | Value | ||||||||||
PURCHASED OPTIONS - 101.08% (a)(b) | ||||||||||||
CALL OPTIONS - 97.25% | ||||||||||||
SPY SPDR S&P 500® Trust ETF, Expires 5/31/2022, Strike Price $3.37 | 1,377 | $ | 56,732,400 | $ | 56,268,609 | |||||||
| 56,268,609 | ||||||||||||
PUT OPTIONS - 3.83% | ||||||||||||
SPY SPDR S&P 500® Trust ETF, Expires 5/31/2022, Strike Price $420.05 | 1,377 | 56,732,400 | 2,215,340 | |||||||||
| 2,215,340 | ||||||||||||
TOTAL PURCHASED OPTIONS (Cost $60,938,694) | 58,483,949 | |||||||||||
Principal Amount | ||||||||||||
SHORT TERM INVESTMENTS - 0.15% | ||||||||||||
Money Market Deposit Account - 0.15% | ||||||||||||
U.S. Bank Money Market Deposit Account, 0.130% (c) | $ | 88,563 | 88,563 | |||||||||
TOTAL SHORT TERM INVESTMENTS (Cost $88,563) | 88,563 | |||||||||||
Total Investments (Cost $61,027,257) - 101.23% | 58,572,512 | |||||||||||
Liabilities in Excess of Other Assets - (1.23)% | (709,830 | ) | ||||||||||
TOTAL NET ASSETS - 100.00% | $ | 57,862,682 | ||||||||||
Asset Type | % of Net Assets | |||
Purchased Options | 101.08 | % | ||
Short Term Investments | 0.15 | |||
Total Investments | 101.23 | |||
Liabilities in Excess of Other Assets | (1.23 | ) | ||
Net Assets | 100.00 | % | ||
Percentages are stated as a percent of net assets. | ||||
(a) | Exchange-Traded. |
(b) | Purchased option contracts are held in connection with corresponding option contracts written short. |
(c) | The U.S. Bank Money Market Deposit Account (the “MMDA”) is a short-term investment vehicle in which the Fund holds cash balances. The MMDA will bear interest at a variable rate that is determined based on conditions and may change daily and by any amount. The rate shown is as of April 30, 2022. |
INNOVATOR U.S. EQUITY BUFFER ETF – JUNE
Schedule of Options Written (a)
April 30, 2022 (Unaudited)
| Description (a) | Expiration | Strike Price | Contracts | Notional Amount | Value | |||||||||||||
Call Options | ||||||||||||||||||
SPY SPDR S&P 500® Trust ETF | 5/31/2022 | $ | 470.82 | 1,377 | $ | (56,732,400 | ) | $ | (12,620 | ) | ||||||||
| (12,620 | ) | |||||||||||||||||
Put Options | ||||||||||||||||||
SPY SPDR S&P 500® Trust ETF | 5/31/2022 | 382.24 | 1,377 | (56,732,400 | ) | (657,704 | ) | |||||||||||
| (657,704 | ) | |||||||||||||||||
Total Options Written (Premiums Received $3,553,510) | $ | (670,324 | ) | |||||||||||||||
(a) | Exchange-Traded. |
INNOVATOR U.S. EQUITY BUFFER ETF – JULY
Schedule of Investments
April 30, 2022 (Unaudited)
Contracts | Notional Amount | Value | ||||||||||
PURCHASED OPTIONS - 102.45% (a)(b) | ||||||||||||
CALL OPTIONS - 96.24% | ||||||||||||
SPY SPDR S&P 500® Trust ETF, Expires 6/30/2022, Strike Price $3.44 | 2,235 | $ | 92,082,000 | $ | 90,951,090 | |||||||
| 90,951,090 | ||||||||||||
PUT OPTIONS - 6.21% | ||||||||||||
SPY SPDR S&P 500® Trust ETF, Expires 6/30/2022, Strike Price $428.07 | 2,235 | 92,082,000 | 5,869,110 | |||||||||
| 5,869,110 | ||||||||||||
TOTAL PURCHASED OPTIONS (Cost $99,775,682) | 96,820,200 | |||||||||||
Principal Amount | ||||||||||||
SHORT TERM INVESTMENTS - 0.17% | ||||||||||||
Money Market Deposit Account - 0.17% | ||||||||||||
U.S. Bank Money Market Deposit Account, 0.130% (c) | $ | 158,817 | 158,817 | |||||||||
TOTAL SHORT TERM INVESTMENTS (Cost $158,817) | 158,817 | |||||||||||
Total Investments (Cost $99,934,499) - 102.62% | 96,979,017 | |||||||||||
Liabilities in Excess of Other Assets - (2.62)% | (2,472,054 | ) | ||||||||||
TOTAL NET ASSETS - 100.00% | $ | 94,506,963 | ||||||||||
Asset Type | % of Net Assets | |||
Purchased Options | 102.45 | % | ||
Short Term Investments | 0.17 | |||
Total Investments | 102.62 | |||
Liabilities in Excess of Other Assets | (2.62 | ) | ||
Net Assets | 100.00 | % | ||
Percentages are stated as a percent of net assets. | ||||
(a) | Exchange-Traded. |
(b) | Purchased option contracts are held in connection with corresponding option contracts written short. |
(c) | The U.S. Bank Money Market Deposit Account (the “MMDA”) is a short-term investment vehicle in which the Fund holds cash balances. The MMDA will bear interest at a variable rate that is determined based on conditions and may change daily and by any amount. The rate shown is as of April 30, 2022. |
INNOVATOR U.S. EQUITY BUFFER ETF – JULY
Schedule of Options Written (a)
April 30, 2022 (Unaudited)
| Description (a) | Expiration | Strike Price | Contracts | Notional Amount | Value | |||||||||||||
Call Options | ||||||||||||||||||
SPY SPDR S&P 500® Trust ETF | 6/30/2022 | $ | 479.43 | 2,235 | $ | (92,082,000 | ) | $ | (40,230 | ) | ||||||||
| (40,230 | ) | |||||||||||||||||
Put Options | ||||||||||||||||||
SPY SPDR S&P 500® Trust ETF | 6/30/2022 | 389.53 | 2,235 | (92,082,000 | ) | (2,393,685 | ) | |||||||||||
| (2,393,685 | ) | |||||||||||||||||
Total Options Written (Premiums Received $5,530,057) | $ | (2,433,915 | ) | |||||||||||||||
(a) | Exchange-Traded. |
INNOVATOR U.S. EQUITY BUFFER ETF – AUGUST
Schedule of Investments
April 30, 2022 (Unaudited)
Contracts | Notional Amount | Value | ||||||||||
PURCHASED OPTIONS - 103.70% (a)(b) | ||||||||||||
CALL OPTIONS - 95.67% | ||||||||||||
SPY SPDR S&P 500® Trust ETF, Expires 7/29/2022, Strike Price $3.52 | 2,650 | $ | 109,180,000 | $ | 107,829,301 | |||||||
| 107,829,301 | ||||||||||||
PUT OPTIONS - 8.03% | ||||||||||||
SPY SPDR S&P 500® Trust ETF, Expires 7/29/2022, Strike Price $438.52 | 2,650 | 109,180,000 | 9,051,114 | |||||||||
| 9,051,114 | ||||||||||||
TOTAL PURCHASED OPTIONS (Cost $121,862,843) | 116,880,415 | |||||||||||
Principal Amount | ||||||||||||
SHORT TERM INVESTMENTS - 0.27% | ||||||||||||
Money Market Deposit Account - 0.27% | ||||||||||||
U.S. Bank Money Market Deposit Account, 0.130% (c) | $ | 303,086 | 303,086 | |||||||||
TOTAL SHORT TERM INVESTMENTS (Cost $303,086) | 303,086 | |||||||||||
Total Investments (Cost $122,165,929) - 103.97% | 117,183,501 | |||||||||||
Liabilities in Excess of Other Assets - (3.97)% | (4,473,823 | ) | ||||||||||
TOTAL NET ASSETS - 100.00% | $ | 112,709,678 | ||||||||||
Asset Type | % of Net Assets | |||
Purchased Options | 103.70 | % | ||
Short Term Investments | 0.27 | |||
Total Investments | 103.97 | |||
Liabilities in Excess of Other Assets | (3.97 | ) | ||
Net Assets | 100.00 | % | ||
Percentages are stated as a percent of net assets. | ||||
(a) | Exchange-Traded. |
(b) | Purchased option contracts are held in connection with corresponding option contracts written short. |
(c) | The U.S. Bank Money Market Deposit Account (the “MMDA”) is a short-term investment vehicle in which the Fund holds cash balances. The MMDA will bear interest at a variable rate that is determined based on conditions and may change daily and by any amount. The rate shown is as of April 30, 2022. |
INNOVATOR U.S. EQUITY BUFFER ETF – AUGUST
Schedule of Options Written (a)
April 30, 2022 (Unaudited)
| Description (a) | Expiration | Strike Price | Contracts | Notional Amount | Value | |||||||||||||
Call Options | ||||||||||||||||||
SPY SPDR S&P 500® Trust ETF | 7/29/2022 | $ | 495.52 | 2,650 | $ | (109,180,000 | ) | $ | (66,511 | ) | ||||||||
| (66,511 | ) | |||||||||||||||||
Put Options | ||||||||||||||||||
SPY SPDR S&P 500® Trust ETF | 7/29/2022 | 399.04 | 2,650 | (109,180,000 | ) | (4,331,093 | ) | |||||||||||
| (4,331,093 | ) | |||||||||||||||||
Total Options Written (Premiums Received $6,179,294) | $ | (4,397,604 | ) | |||||||||||||||
(a) | Exchange-Traded. |
INNOVATOR U.S. EQUITY BUFFER ETF – SEPTEMBER
Schedule of Investments
April 30, 2022 (Unaudited)
Contracts | Notional Amount | Value | ||||||||||
PURCHASED OPTIONS - 105.23% (a)(b) | ||||||||||||
CALL OPTIONS - 94.87% | ||||||||||||
SPY SPDR S&P 500® Trust ETF, Expires 8/31/2022, Strike Price $3.63 | 3,298 | $ | 135,877,600 | $ | 134,161,698 | |||||||
| 134,161,698 | ||||||||||||
PUT OPTIONS - 10.36% | ||||||||||||
SPY SPDR S&P 500® Trust ETF, Expires 8/31/2022, Strike Price $451.57 | 3,298 | 135,877,600 | 14,651,702 | |||||||||
| 14,651,702 | ||||||||||||
TOTAL PURCHASED OPTIONS (Cost $155,543,876) | 148,813,400 | |||||||||||
Principal Amount | ||||||||||||
SHORT TERM INVESTMENTS - 0.34% | ||||||||||||
Money Market Deposit Account - 0.34% | ||||||||||||
U.S. Bank Money Market Deposit Account, 0.130% (c) | $ | 486,924 | 486,924 | |||||||||
TOTAL SHORT TERM INVESTMENTS (Cost $486,924) | 486,924 | |||||||||||
Total Investments (Cost $156,030,800) - 105.57% | 149,300,324 | |||||||||||
Liabilities in Excess of Other Assets - (5.57)% | (7,884,092 | ) | ||||||||||
TOTAL NET ASSETS - 100.00% | $ | 141,416,232 | ||||||||||
Asset Type | % of Net Assets | |||
Purchased Options | 105.23 | % | ||
Short Term Investments | 0.34 | |||
Total Investments | 105.57 | |||
Liabilities in Excess of Other Assets | (5.57 | ) | ||
Net Assets | 100.00 | % | ||
Percentages are stated as a percent of net assets. | ||||
(a) | Exchange-Traded. |
(b) | Purchased option contracts are held in connection with corresponding option contracts written short. |
(c) | The U.S. Bank Money Market Deposit Account (the “MMDA”) is a short-term investment vehicle in which the Fund holds cash balances. The MMDA will bear interest at a variable rate that is determined based on conditions and may change daily and by any amount. The rate shown is as of April 30, 2022. |
INNOVATOR U.S. EQUITY BUFFER ETF – SEPTEMBER
Schedule of Options Written (a)
April 30, 2022 (Unaudited)
| Description (a) | Expiration | Strike Price | Contracts | Notional Amount | Value | |||||||||||||
Call Options | ||||||||||||||||||
SPY SPDR S&P 500® Trust ETF | 8/31/2022 | $ | 509.81 | 3,298 | $ | (135,877,600 | ) | $ | (93,606 | ) | ||||||||
| (93,606 | ) | |||||||||||||||||
Put Options | ||||||||||||||||||
SPY SPDR S&P 500® Trust ETF | 8/31/2022 | 410.92 | 3,298 | (135,877,600 | ) | (7,693,270 | ) | |||||||||||
| (7,693,270 | ) | |||||||||||||||||
Total Options Written (Premiums Received $9,690,365) | $ | (7,786,876 | ) | |||||||||||||||
(a) | Exchange-Traded. |
INNOVATOR U.S. EQUITY BUFFER ETF – OCTOBER
Schedule of Investments
April 30, 2022 (Unaudited)
Contracts | Notional Amount | Value | ||||||||||
PURCHASED OPTIONS - 104.59% (a)(b) | ||||||||||||
CALL OPTIONS - 96.45% | ||||||||||||
SPY SPDR S&P 500® Trust ETF, Expires 9/30/2022, Strike Price $3.45 | 2,167 | $ | 89,280,400 | $ | 87,845,974 | |||||||
| 87,845,974 | ||||||||||||
PUT OPTIONS - 8.14% | ||||||||||||
SPY SPDR S&P 500® Trust ETF, Expires 9/30/2022, Strike Price $429.15 | 2,167 | 89,280,400 | 7,409,666 | |||||||||
| 7,409,666 | ||||||||||||
TOTAL PURCHASED OPTIONS (Cost $99,202,035) | 95,255,640 | |||||||||||
Principal Amount | ||||||||||||
SHORT TERM INVESTMENTS - 0.44% | ||||||||||||
Money Market Deposit Account - 0.44% | ||||||||||||
U.S. Bank Money Market Deposit Account, 0.130% (c) | $ | 399,164 | 399,164 | |||||||||
TOTAL SHORT TERM INVESTMENTS (Cost $399,164) | 399,164 | |||||||||||
Total Investments (Cost $99,601,199) - 105.03% | 95,654,804 | |||||||||||
Liabilities in Excess of Other Assets - (5.03)% | (4,580,781 | ) | ||||||||||
TOTAL NET ASSETS - 100.00% | $ | 91,074,023 | ||||||||||
Asset Type | % of Net Assets | |||
Purchased Options | 104.59 | % | ||
Short Term Investments | 0.44 | |||
Total Investments | 105.03 | |||
Liabilities in Excess of Other Assets | (5.03 | ) | ||
Net Assets | 100.00 | % | ||
Percentages are stated as a percent of net assets. | ||||
(a) | Exchange-Traded. |
(b) | Purchased option contracts are held in connection with corresponding option contracts written short. |
(c) | The U.S. Bank Money Market Deposit Account (the “MMDA”) is a short-term investment vehicle in which the Fund holds cash balances. The MMDA will bear interest at a variable rate that is determined based on conditions and may change daily and by any amount. The rate shown is as of April 30, 2022. |
INNOVATOR U.S. EQUITY BUFFER ETF – OCTOBER
Schedule of Options Written (a)
April 30, 2022 (Unaudited)
| Description (a) | Expiration | Strike Price | Contracts | Notional Amount | Value | |||||||||||||
Call Options | ||||||||||||||||||
SPY SPDR S&P 500® Trust ETF | 9/30/2022 | $ | 487.93 | 2,167 | $ | (89,280,400 | ) | $ | (347,470 | ) | ||||||||
| (347,470 | ) | |||||||||||||||||
Put Options | ||||||||||||||||||
SPY SPDR S&P 500® Trust ETF | 9/30/2022 | 390.52 | 2,167 | (89,280,400 | ) | (4,171,402 | ) | |||||||||||
| (4,171,402 | ) | |||||||||||||||||
Total Options Written (Premiums Received $6,669,153) | $ | (4,518,872 | ) | |||||||||||||||
(a) | Exchange-Traded. |
INNOVATOR U.S. EQUITY BUFFER ETF – NOVEMBER
Schedule of Investments
April 30, 2022 (Unaudited)
Contracts | Notional Amount | Value | ||||||||||
PURCHASED OPTIONS - 106.97% (a)(b) | ||||||||||||
CALL OPTIONS - 94.48% | ||||||||||||
SPY SPDR S&P 500® Trust ETF, Expires 10/31/2022, Strike Price $3.69 | 1,737 | $ | 71,564,400 | $ | 70,374,575 | |||||||
| 70,374,575 | ||||||||||||
PUT OPTIONS - 12.49% | ||||||||||||
SPY SPDR S&P 500® Trust ETF, Expires 10/31/2022, Strike Price $459.26 | 1,737 | 71,564,400 | 9,300,040 | |||||||||
| 9,300,040 | ||||||||||||
TOTAL PURCHASED OPTIONS (Cost $84,305,859) | 79,674,615 | |||||||||||
Principal Amount | ||||||||||||
SHORT TERM INVESTMENTS - 0.48% | ||||||||||||
Money Market Deposit Account - 0.48% | ||||||||||||
U.S. Bank Money Market Deposit Account, 0.130% (c) | $ | 360,758 | 360,758 | |||||||||
TOTAL SHORT TERM INVESTMENTS (Cost $360,758) | 360,758 | |||||||||||
Total Investments (Cost $84,666,617) - 107.45% | 80,035,373 | |||||||||||
Liabilities in Excess of Other Assets - (7.45)% | (5,545,925 | ) | ||||||||||
TOTAL NET ASSETS - 100.00% | $ | 74,489,448 | ||||||||||
Asset Type | % of Net Assets | |||
Purchased Options | 106.97 | % | ||
Short Term Investments | 0.48 | |||
Total Investments | 107.45 | |||
Liabilities in Excess of Other Assets | (7.45 | ) | ||
Net Assets | 100.00 | % | ||
Percentages are stated as a percent of net assets. | ||||
(a) | Exchange-Traded. |
(b) | Purchased option contracts are held in connection with corresponding option contracts written short. |
(c) | The U.S. Bank Money Market Deposit Account (the “MMDA”) is a short-term investment vehicle in which the Fund holds cash balances. The MMDA will bear interest at a variable rate that is determined based on conditions and may change daily and by any amount. The rate shown is as of April 30, 2022. |
INNOVATOR U.S. EQUITY BUFFER ETF – NOVEMBER
Schedule of Options Written (a)
April 30, 2022 (Unaudited)
| Description (a) | Expiration | Strike Price | Contracts | Notional Amount | Value | |||||||||||||
Call Options | ||||||||||||||||||
SPY SPDR S&P 500® Trust ETF | 10/31/2022 | $ | 517.35 | 1,737 | $ | (71,564,400 | ) | $ | (106,531 | ) | ||||||||
| (106,531 | ) | |||||||||||||||||
Put Options | ||||||||||||||||||
SPY SPDR S&P 500® Trust ETF | 10/31/2022 | 417.92 | 1,737 | (71,564,400 | ) | (5,389,313 | ) | |||||||||||
| (5,389,313 | ) | |||||||||||||||||
Total Options Written (Premiums Received $5,391,273) | $ | (5,495,844 | ) | |||||||||||||||
(a) | Exchange-Traded. |
INNOVATOR U.S. EQUITY BUFFER ETF – DECEMBER
Schedule of Investments
April 30, 2022 (Unaudited)
Contracts | Notional Amount | Value | ||||||||||
PURCHASED OPTIONS - 106.97% (a)(b) | ||||||||||||
CALL OPTIONS - 94.88% | ||||||||||||
SPY SPDR S&P 500® Trust ETF, Expires 11/30/2022, Strike Price $3.66 | 2,117 | $ | 87,220,400 | $ | 85,778,712 | |||||||
| 85,778,712 | ||||||||||||
PUT OPTIONS - 12.09% | ||||||||||||
SPY SPDR S&P 500® Trust ETF, Expires 11/30/2022, Strike Price $455.57 | 2,117 | 87,220,400 | 10,931,521 | |||||||||
| 10,931,521 | ||||||||||||
TOTAL PURCHASED OPTIONS (Cost $102,138,902) | 96,710,233 | |||||||||||
Principal Amount | ||||||||||||
SHORT TERM INVESTMENTS - 0.55% | ||||||||||||
Money Market Deposit Account - 0.55% | ||||||||||||
U.S. Bank Money Market Deposit Account, 0.130% (c) | $ | 496,254 | 496,254 | |||||||||
TOTAL SHORT TERM INVESTMENTS (Cost $496,254) | 496,254 | |||||||||||
Total Investments (Cost $102,635,156) - 107.52% | 97,206,487 | |||||||||||
Liabilities in Excess of Other Assets - (7.52)% | (6,801,613 | ) | ||||||||||
TOTAL NET ASSETS - 100.00% | $ | 90,404,874 | ||||||||||
Asset Type | % of Net Assets | |||
Purchased Options | 106.97 | % | ||
Short Term Investments | 0.55 | |||
Total Investments | 107.52 | |||
Liabilities in Excess of Other Assets | (7.52 | ) | ||
Net Assets | 100.00 | % | ||
Percentages are stated as a percent of net assets. | ||||
(a) | Exchange-Traded. |
(b) | Purchased option contracts are held in connection with corresponding option contracts written short. |
(c) | The U.S. Bank Money Market Deposit Account (the “MMDA”) is a short-term investment vehicle in which the Fund holds cash balances. The MMDA will bear interest at a variable rate that is determined based on conditions and may change daily and by any amount. The rate shown is as of April 30, 2022. |
INNOVATOR U.S. EQUITY BUFFER ETF – DECEMBER
Schedule of Options Written (a)
April 30, 2022 (Unaudited)
| Description (a) | Expiration | Strike Price | Contracts | Notional Amount | Value | |||||||||||||
Call Options | ||||||||||||||||||
SPY SPDR S&P 500® Trust ETF | 11/30/2022 | $ | 523.76 | 2,117 | $ | (87,220,400 | ) | $ | (183,934 | ) | ||||||||
| (183,934 | ) | |||||||||||||||||
Put Options | ||||||||||||||||||
SPY SPDR S&P 500® Trust ETF | 11/30/2022 | 414.56 | 2,117 | (87,220,400 | ) | (6,556,561 | ) | |||||||||||
| (6,556,561 | ) | |||||||||||||||||
Total Options Written (Premiums Received $7,017,602) | $ | (6,740,495 | ) | |||||||||||||||
(a) | Exchange-Traded. |
INNOVATOR U.S. EQUITY POWER BUFFER ETF – JANUARY
Schedule of Investments
April 30, 2022 (Unaudited)
Contracts | Notional Amount | Value | ||||||||||
PURCHASED OPTIONS - 106.38% (a)(b) | ||||||||||||
CALL OPTIONS - 91.19% | ||||||||||||
SPY SPDR S&P 500® Trust ETF, Expires 12/30/2022, Strike Price $3.80 | 12,399 | $ | 510,838,800 | $ | 500,374,044 | |||||||
| 500,374,044 | ||||||||||||
PUT OPTIONS - 15.19% | ||||||||||||
SPY SPDR S&P 500® Trust ETF, Expires 12/30/2022, Strike Price $474.96 | 12,399 | 510,838,800 | 83,333,679 | |||||||||
| 83,333,679 | ||||||||||||
TOTAL PURCHASED OPTIONS (Cost $613,712,887) | 583,707,723 | |||||||||||
Principal Amount | ||||||||||||
SHORT TERM INVESTMENTS - 0.61% | ||||||||||||
Money Market Deposit Account - 0.61% | ||||||||||||
U.S. Bank Money Market Deposit Account, 0.130% (c) | $ | 3,334,148 | 3,334,148 | |||||||||
TOTAL SHORT TERM INVESTMENTS (Cost $3,334,148) | 3,334,148 | |||||||||||
Total Investments (Cost $617,047,035) - 106.99% | 587,041,871 | |||||||||||
Liabilities in Excess of Other Assets - (6.99)% | (38,294,049 | ) | ||||||||||
TOTAL NET ASSETS - 100.00% | $ | 548,747,822 | ||||||||||
Asset Type | % of Net Assets | |||
Purchased Options | 106.38 | % | ||
Short Term Investments | 0.61 | |||
Total Investments | 106.99 | |||
Liabilities in Excess of Other Assets | (6.99 | ) | ||
Net Assets | 100.00 | % | ||
Percentages are stated as a percent of net assets. | ||||
(a) | Exchange-Traded. |
(b) | Purchased option contracts are held in connection with corresponding option contracts written short. |
(c) | The U.S. Bank Money Market Deposit Account (the “MMDA”) is a short-term investment vehicle in which the Fund holds cash balances. The MMDA will bear interest at a variable rate that is determined based on conditions and may change daily and by any amount. The rate shown is as of April 30, 2022. |
INNOVATOR U.S. EQUITY POWER BUFFER ETF – JANUARY
Schedule of Options Written (a)
April 30, 2022 (Unaudited)
| Description (a) | Expiration | Strike Price | Contracts | Notional Amount | Value | |||||||||||||
Call Options | ||||||||||||||||||
SPY SPDR S&P 500® Trust ETF | 12/30/2022 | $ | 517.66 | 12,399 | $ | (510,838,800 | ) | $ | (1,401,087 | ) | ||||||||
| (1,401,087 | ) | |||||||||||||||||
Put Options | ||||||||||||||||||
SPY SPDR S&P 500® Trust ETF | 12/30/2022 | 403.72 | 12,399 | (510,838,800 | ) | (36,527,454 | ) | |||||||||||
| (36,527,454 | ) | |||||||||||||||||
Total Options Written (Premiums Received $39,270,958) | $ | (37,928,541 | ) | |||||||||||||||
(a) | Exchange-Traded. |
INNOVATOR U.S. EQUITY POWER BUFFER ETF – FEBRUARY
Schedule of Investments
April 30, 2022 (Unaudited)
Contracts | Notional Amount | Value | ||||||||||
PURCHASED OPTIONS - 105.78% (a)(b) | ||||||||||||
CALL OPTIONS - 93.95% | ||||||||||||
SPY SPDR S&P 500® Trust ETF, Expires 1/31/2023, Strike Price $3.60 | 7,107 | $ | 292,808,400 | $ | 286,745,093 | |||||||
| 286,745,093 | ||||||||||||
PUT OPTIONS - 11.83% | ||||||||||||
SPY SPDR S&P 500® Trust ETF, Expires 1/31/2023, Strike Price $449.91 | 7,107 | 292,808,400 | 36,112,851 | |||||||||
| 36,112,851 | ||||||||||||
TOTAL PURCHASED OPTIONS (Cost $337,935,117) | 322,857,944 | |||||||||||
Principal Amount | ||||||||||||
SHORT TERM INVESTMENTS - 0.68% | ||||||||||||
Money Market Deposit Account - 0.68% | ||||||||||||
U.S. Bank Money Market Deposit Account, 0.130% (c) | $ | 2,078,194 | 2,078,194 | |||||||||
TOTAL SHORT TERM INVESTMENTS (Cost $2,078,194) | 2,078,194 | |||||||||||
Total Investments (Cost $340,013,311) - 106.46% | 324,936,138 | |||||||||||
Liabilities in Excess of Other Assets - (6.46)% | (19,707,229 | ) | ||||||||||
TOTAL NET ASSETS - 100.00% | $ | 305,228,909 | ||||||||||
Asset Type | % of Net Assets | |||
Purchased Options | 105.78 | % | ||
Short Term Investments | 0.68 | |||
Total Investments | 106.46 | |||
Liabilities in Excess of Other Assets | (6.46 | ) | ||
Net Assets | 100.00 | % | ||
Percentages are stated as a percent of net assets. | ||||
(a) | Exchange-Traded. |
(b) | Purchased option contracts are held in connection with corresponding option contracts written short. |
(c) | The U.S. Bank Money Market Deposit Account (the “MMDA”) is a short-term investment vehicle in which the Fund holds cash balances. The MMDA will bear interest at a variable rate that is determined based on conditions and may change daily and by any amount. The rate shown is as of April 30, 2022. |
INNOVATOR U.S. EQUITY POWER BUFFER ETF – FEBRUARY
Schedule of Options Written (a)
April 30, 2022 (Unaudited)
| Description (a) | Expiration | Strike Price | Contracts | Notional Amount | Value | |||||||||||||
Call Options | ||||||||||||||||||
SPY SPDR S&P 500® Trust ETF | 1/31/2023 | $ | 495.80 | 7,107 | $ | (292,808,400 | ) | $ | (2,936,710 | ) | ||||||||
| (2,936,710 | ) | |||||||||||||||||
Put Options | ||||||||||||||||||
SPY SPDR S&P 500® Trust ETF | 1/31/2023 | 382.42 | 7,107 | (292,808,400 | ) | (16,566,186 | ) | |||||||||||
| (16,566,186 | ) | |||||||||||||||||
Total Options Written (Premiums Received $22,114,076) | $ | (19,502,896 | ) | |||||||||||||||
(a) | Exchange-Traded. |
INNOVATOR U.S. EQUITY POWER BUFFER ETF – MARCH
Schedule of Investments
April 30, 2022 (Unaudited)
Contracts | Notional Amount | Value | ||||||||||
PURCHASED OPTIONS - 105.91% (a)(b) | ||||||||||||
CALL OPTIONS - 95.28% | ||||||||||||
SPY SPDR S&P 500® Trust ETF, Expires 2/28/2023, Strike Price $3.49 | 5,624 | $ | 231,708,800 | $ | 226,976,768 | |||||||
| 226,976,768 | ||||||||||||
PUT OPTIONS - 10.63% | ||||||||||||
SPY SPDR S&P 500® Trust ETF, Expires 2/28/2023, Strike Price $436.63 | 5,624 | 231,708,800 | 25,312,810 | |||||||||
| 25,312,810 | ||||||||||||
TOTAL PURCHASED OPTIONS (Cost $261,724,706) | 252,289,578 | |||||||||||
Principal Amount | ||||||||||||
SHORT TERM INVESTMENTS - 0.74% | ||||||||||||
Money Market Deposit Account - 0.74% | ||||||||||||
U.S. Bank Money Market Deposit Account, 0.130% (c) | $ | 1,757,355 | 1,757,355 | |||||||||
TOTAL SHORT TERM INVESTMENTS (Cost $1,757,355) | 1,757,355 | |||||||||||
Total Investments (Cost $263,482,061) - 106.65% | 254,046,933 | |||||||||||
Liabilities in Excess of Other Assets - (6.65)% | (15,821,726 | ) | ||||||||||
TOTAL NET ASSETS - 100.00% | $ | 238,225,207 | ||||||||||
Asset Type | % of Net Assets | |||
Purchased Options | 105.91 | % | ||
Short Term Investments | 0.74 | |||
Total Investments | 106.65 | |||
Liabilities in Excess of Other Assets | (6.65 | ) | ||
Net Assets | 100.00 | % | ||
Percentages are stated as a percent of net assets. | ||||
(a) | Exchange-Traded. |
(b) | Purchased option contracts are held in connection with corresponding option contracts written short. |
(c) | The U.S. Bank Money Market Deposit Account (the “MMDA”) is a short-term investment vehicle in which the Fund holds cash balances. The MMDA will bear interest at a variable rate that is determined based on conditions and may change daily and by any amount. The rate shown is as of April 30, 2022. |
INNOVATOR U.S. EQUITY POWER BUFFER ETF – MARCH
Schedule of Options Written (a)
April 30, 2022 (Unaudited)
| Description (a) | Expiration | Strike Price | Contracts | Notional Amount | Value | |||||||||||||
Call Options | ||||||||||||||||||
SPY SPDR S&P 500® Trust ETF | 2/28/2023 | $ | 487.76 | 5,624 | $ | (231,708,800 | ) | $ | (3,783,210 | ) | ||||||||
| (3,783,210 | ) | |||||||||||||||||
Put Options | ||||||||||||||||||
SPY SPDR S&P 500® Trust ETF | 2/28/2023 | 371.14 | 5,624 | (231,708,800 | ) | (11,881,411 | ) | |||||||||||
| (11,881,411 | ) | |||||||||||||||||
Total Options Written (Premiums Received $18,291,598) | $ | (15,664,621 | ) | |||||||||||||||
(a) | Exchange-Traded. |
INNOVATOR U.S. EQUITY POWER BUFFER ETF – APRIL
Schedule of Investments
April 30, 2022 (Unaudited)
Contracts | Notional Amount | Value | ||||||||||
PURCHASED OPTIONS - 106.50% (a)(b) | ||||||||||||
CALL OPTIONS - 93.79% | ||||||||||||
SPY SPDR S&P 500® Trust ETF, Expires 3/31/2023, Strike Price $3.61 | 7,234 | $ | 298,040,800 | $ | 290,789,122 | |||||||
| 290,789,122 | ||||||||||||
PUT OPTIONS - 12.71% | ||||||||||||
SPY SPDR S&P 500® Trust ETF, Expires 3/31/2023, Strike Price $451.64 | 7,234 | 298,040,800 | 39,404,201 | |||||||||
| 39,404,201 | ||||||||||||
TOTAL PURCHASED OPTIONS (Cost $344,313,127) | 330,193,323 | |||||||||||
Principal Amount | ||||||||||||
SHORT TERM INVESTMENTS - 0.81% | ||||||||||||
Money Market Deposit Account - 0.81% | ||||||||||||
U.S. Bank Money Market Deposit Account, 0.130% (c) | $ | 2,520,214 | 2,520,214 | |||||||||
TOTAL SHORT TERM INVESTMENTS (Cost $2,520,214) | 2,520,214 | |||||||||||
Total Investments (Cost $346,833,341) - 107.31% | 332,713,537 | |||||||||||
Liabilities in Excess of Other Assets - (7.31)% | (22,673,676 | ) | ||||||||||
TOTAL NET ASSETS - 100.00% | $ | 310,039,861 | ||||||||||
Asset Type | % of Net Assets | |||
Purchased Options | 106.50 | % | ||
Short Term Investments | 0.81 | |||
Total Investments | 107.31 | |||
Liabilities in Excess of Other Assets | (7.31 | ) | ||
Net Assets | 100.00 | % | ||
Percentages are stated as a percent of net assets. | ||||
(a) | Exchange-Traded. |
(b) | Purchased option contracts are held in connection with corresponding option contracts written short. |
(c) | The U.S. Bank Money Market Deposit Account (the “MMDA”) is a short-term investment vehicle in which the Fund holds cash balances. The MMDA will bear interest at a variable rate that is determined based on conditions and may change daily and by any amount. The rate shown is as of April 30, 2022. |
INNOVATOR U.S. EQUITY POWER BUFFER ETF – APRIL
Schedule of Options Written (a)
April 30, 2022 (Unaudited)
| Description (a) | Expiration | Strike Price | Contracts | Notional Amount | Value | |||||||||||||
Call Options | ||||||||||||||||||
SPY SPDR S&P 500® Trust ETF | 3/31/2023 | $ | 503.99 | 7,234 | $ | (298,040,800 | ) | $ | (3,441,284 | ) | ||||||||
| (3,441,284 | ) | |||||||||||||||||
Put Options | ||||||||||||||||||
SPY SPDR S&P 500® Trust ETF | 3/31/2023 | 383.89 | 7,234 | (298,040,800 | ) | (19,053,968 | ) | |||||||||||
| (19,053,968 | ) | |||||||||||||||||
Total Options Written (Premiums Received $21,258,554) | $ | (22,495,252 | ) | |||||||||||||||
(a) | Exchange-Traded. |
INNOVATOR U.S. EQUITY POWER BUFFER ETF – MAY
Schedule of Investments
April 30, 2022 (Unaudited)
Contracts | Notional Amount | Value | ||||||||||
PURCHASED OPTIONS - 106.96% (a)(b) | ||||||||||||
CALL OPTIONS - 98.21% | ||||||||||||
SPY SPDR S&P 500® Trust ETF, Expires 4/28/2023, Strike Price $4.12 | 4,918 | $ | 202,621,600 | $ | 197,654,420 | |||||||
| 197,654,420 | ||||||||||||
PUT OPTIONS - 8.75% | ||||||||||||
SPY SPDR S&P 500® Trust ETF, Expires 4/28/2023, Strike Price $412.00 | 4,918 | 202,621,600 | 17,611,358 | |||||||||
| 17,611,358 | ||||||||||||
TOTAL PURCHASED OPTIONS (Cost $215,285,846) | 215,265,778 | |||||||||||
Principal Amount | ||||||||||||
SHORT TERM INVESTMENTS - 0.06% | ||||||||||||
Money Market Deposit Account - 0.06% | ||||||||||||
U.S. Bank Money Market Deposit Account, 0.130% (c) | $ | 124,268 | 124,268 | |||||||||
TOTAL SHORT TERM INVESTMENTS (Cost $124,268) | 124,268 | |||||||||||
Total Investments (Cost $215,410,114) - 107.02% | 215,390,046 | |||||||||||
Liabilities in Excess of Other Assets - (7.02)% | (14,132,883 | ) | ||||||||||
TOTAL NET ASSETS - 100.00% | $ | 201,257,163 | ||||||||||
Asset Type | % of Net Assets | |||
Purchased Options | 106.96 | % | ||
Short Term Investments | 0.06 | |||
Total Investments | 107.02 | |||
Liabilities in Excess of Other Assets | (7.02 | ) | ||
Net Assets | 100.00 | % | ||
Percentages are stated as a percent of net assets. | ||||
(a) | Exchange-Traded. |
(b) | Purchased option contracts are held in connection with corresponding option contracts written short. |
(c) | The U.S. Bank Money Market Deposit Account (the “MMDA”) is a short-term investment vehicle in which the Fund holds cash balances. The MMDA will bear interest at a variable rate that is determined based on conditions and may change daily and by any amount. The rate shown is as of April 30, 2022. |
INNOVATOR U.S. EQUITY POWER BUFFER ETF – MAY
Schedule of Options Written (a)
April 30, 2022 (Unaudited)
| Description (a) | Expiration | Strike Price | Contracts | Notional Amount | Value | |||||||||||||
Call Options | ||||||||||||||||||
SPY SPDR S&P 500® Trust ETF | 4/28/2023 | $ | 471.78 | 4,918 | $ | (202,621,600 | ) | $ | (5,936,026 | ) | ||||||||
| (5,936,026 | ) | |||||||||||||||||
Put Options | ||||||||||||||||||
SPY SPDR S&P 500® Trust ETF | 4/28/2023 | 350.20 | 4,918 | (202,621,600 | ) | (8,719,614 | ) | |||||||||||
| (8,719,614 | ) | |||||||||||||||||
Total Options Written (Premiums Received $14,635,497) | $ | (14,655,640 | ) | |||||||||||||||
(a) | Exchange-Traded. |
INNOVATOR U.S. EQUITY POWER BUFFER ETF – JUNE
Schedule of Investments
April 30, 2022 (Unaudited)
Contracts | Notional Amount | Value | ||||||||||
PURCHASED OPTIONS - 100.60% (a)(b) | ||||||||||||
CALL OPTIONS - 96.79% | ||||||||||||
SPY SPDR S&P 500® Trust ETF, Expires 5/31/2022, Strike Price $3.36 | 3,258 | $ | 134,229,600 | $ | 133,135,520 | |||||||
| 133,135,520 | ||||||||||||
PUT OPTIONS - 3.81% | ||||||||||||
SPY SPDR S&P 500® Trust ETF, Expires 5/31/2022, Strike Price $420.04 | 3,258 | 134,229,600 | 5,239,966 | |||||||||
| 5,239,966 | ||||||||||||
TOTAL PURCHASED OPTIONS (Cost $143,245,949) | 138,375,486 | |||||||||||
Principal Amount | ||||||||||||
SHORT TERM INVESTMENTS - 0.14% | ||||||||||||
Money Market Deposit Account - 0.14% | ||||||||||||
U.S. Bank Money Market Deposit Account, 0.130% (c) | $ | 190,783 | 190,783 | |||||||||
TOTAL SHORT TERM INVESTMENTS (Cost $190,783) | 190,783 | |||||||||||
Total Investments (Cost $143,436,732) - 100.74% | 138,566,269 | |||||||||||
Liabilities in Excess of Other Assets - (0.74)% | (1,016,601 | ) | ||||||||||
TOTAL NET ASSETS - 100.00% | $ | 137,549,668 | ||||||||||
Asset Type | % of Net Assets | |||
Purchased Options | 100.60 | % | ||
Short Term Investments | 0.14 | |||
Total Investments | 100.74 | |||
Liabilities in Excess of Other Assets | (0.74 | ) | ||
Net Assets | 100.00 | % | ||
Percentages are stated as a percent of net assets. | ||||
(a) | Exchange-Traded. |
(b) | Purchased option contracts are held in connection with corresponding option contracts written short. |
(c) | The U.S. Bank Money Market Deposit Account (the “MMDA”) is a short-term investment vehicle in which the Fund holds cash balances. The MMDA will bear interest at a variable rate that is determined based on conditions and may change daily and by any amount. The rate shown is as of April 30, 2022. |
INNOVATOR U.S. EQUITY POWER BUFFER ETF – JUNE
Schedule of Options Written (a)
April 30, 2022 (Unaudited)
| Description (a) | Expiration | Strike Price | Contracts | Notional Amount | Value | |||||||||||||
Call Options | ||||||||||||||||||
SPY SPDR S&P 500® Trust ETF | 5/31/2022 | $ | 452.68 | 3,258 | $ | (134,229,600 | ) | $ | (194,699 | ) | ||||||||
| (194,699 | ) | |||||||||||||||||
Put Options | ||||||||||||||||||
SPY SPDR S&P 500® Trust ETF | 5/31/2022 | 357.03 | 3,258 | (134,229,600 | ) | (729,522 | ) | |||||||||||
| (729,522 | ) | |||||||||||||||||
Total Options Written (Premiums Received $8,656,983) | $ | (924,221 | ) | |||||||||||||||
(a) | Exchange-Traded. |
INNOVATOR U.S. EQUITY POWER BUFFER ETF – JULY
Schedule of Investments
April 30, 2022 (Unaudited)
Contracts | Notional Amount | Value | ||||||||||
PURCHASED OPTIONS - 101.42% (a)(b) | ||||||||||||
CALL OPTIONS - 95.49% | ||||||||||||
SPY SPDR S&P 500® Trust ETF, Expires 6/30/2022, Strike Price $3.42 | 3,974 | $ | 163,728,800 | $ | 161,741,707 | |||||||
| 161,741,707 | ||||||||||||
PUT OPTIONS - 5.93% | ||||||||||||
SPY SPDR S&P 500® Trust ETF, Expires 6/30/2022, Strike Price $428.06 | 3,974 | 163,728,800 | 10,042,315 | |||||||||
| 10,042,315 | ||||||||||||
TOTAL PURCHASED OPTIONS (Cost $177,916,518) | 171,784,022 | |||||||||||
Principal Amount | ||||||||||||
SHORT TERM INVESTMENTS - 0.21% | ||||||||||||
Money Market Deposit Account - 0.21% | ||||||||||||
U.S. Bank Money Market Deposit Account, 0.130% (c) | $ | 356,707 | 356,707 | |||||||||
TOTAL SHORT TERM INVESTMENTS (Cost $356,707) | 356,707 | |||||||||||
Total Investments (Cost $178,273,225) - 101.63% | 172,140,729 | |||||||||||
Liabilities in Excess of Other Assets - (1.63)% | (2,767,356 | ) | ||||||||||
TOTAL NET ASSETS - 100.00% | $ | 169,373,373 | ||||||||||
Asset Type | % of Net Assets | |||
Purchased Options | 101.42 | % | ||
Short Term Investments | 0.21 | |||
Total Investments | 101.63 | |||
Liabilities in Excess of Other Assets | (1.63 | ) | ||
Net Assets | 100.00 | % | ||
Percentages are stated as a percent of net assets. | ||||
(a) | Exchange-Traded. |
(b) | Purchased option contracts are held in connection with corresponding option contracts written short. |
(c) | The U.S. Bank Money Market Deposit Account (the “MMDA”) is a short-term investment vehicle in which the Fund holds cash balances. The MMDA will bear interest at a variable rate that is determined based on conditions and may change daily and by any amount. The rate shown is as of April 30, 2022. |
INNOVATOR U.S. EQUITY POWER BUFFER ETF – JULY
Schedule of Options Written (a)
April 30, 2022 (Unaudited)
| Description (a) | Expiration | Strike Price | Contracts | Notional Amount | Value | |||||||||||||
Call Options | ||||||||||||||||||
SPY SPDR S&P 500® Trust ETF | 6/30/2022 | $ | 461.45 | 3,974 | $ | (163,728,800 | ) | $ | (430,681 | ) | ||||||||
| (430,681 | ) | |||||||||||||||||
Put Options | ||||||||||||||||||
SPY SPDR S&P 500® Trust ETF | 6/30/2022 | 363.85 | 3,974 | (163,728,800 | ) | (2,229,791 | ) | |||||||||||
| (2,229,791 | ) | |||||||||||||||||
Total Options Written (Premiums Received $10,505,170) | $ | (2,660,472 | ) | |||||||||||||||
(a) | Exchange-Traded. |
INNOVATOR U.S. EQUITY POWER BUFFER ETF – AUGUST
Schedule of Investments
April 30, 2022 (Unaudited)
Contracts | Notional Amount | Value | ||||||||||
PURCHASED OPTIONS - 102.34% (a)(b) | ||||||||||||
CALL OPTIONS - 94.24% | ||||||||||||
SPY SPDR S&P 500® Trust ETF, Expires 7/29/2022, Strike Price $3.51 | 4,089 | $ | 168,466,800 | $ | 166,356,876 | |||||||
| 166,356,876 | ||||||||||||
PUT OPTIONS - 8.10% | ||||||||||||
SPY SPDR S&P 500® Trust ETF, Expires 7/29/2022, Strike Price $438.51 | 4,089 | 168,466,800 | 14,299,233 | |||||||||
| 14,299,233 | ||||||||||||
TOTAL PURCHASED OPTIONS (Cost $188,430,750) | 180,656,109 | |||||||||||
Principal Amount | ||||||||||||
SHORT TERM INVESTMENTS - 0.26% | ||||||||||||
Money Market Deposit Account - 0.26% | ||||||||||||
U.S. Bank Money Market Deposit Account, 0.130% (c) | $ | 450,927 | 450,927 | |||||||||
TOTAL SHORT TERM INVESTMENTS (Cost $450,927) | 450,927 | |||||||||||
Total Investments (Cost $188,881,677) - 102.60% | 181,107,036 | |||||||||||
Liabilities in Excess of Other Assets - (2.60)% | (4,592,283 | ) | ||||||||||
TOTAL NET ASSETS - 100.00% | $ | 176,514,753 | ||||||||||
Asset Type | % of Net Assets | |||
Purchased Options | 102.34 | % | ||
Short Term Investments | 0.26 | |||
Total Investments | 102.60 | |||
Liabilities in Excess of Other Assets | (2.60 | ) | ||
Net Assets | 100.00 | % | ||
Percentages are stated as a percent of net assets. | ||||
(a) | Exchange-Traded. |
(b) | Purchased option contracts are held in connection with corresponding option contracts written short. |
(c) | The U.S. Bank Money Market Deposit Account (the “MMDA”) is a short-term investment vehicle in which the Fund holds cash balances. The MMDA will bear interest at a variable rate that is determined based on conditions and may change daily and by any amount. The rate shown is as of April 30, 2022. |
INNOVATOR U.S. EQUITY POWER BUFFER ETF – AUGUST
Schedule of Options Written (a)
April 30, 2022 (Unaudited)
| Description (a) | Expiration | Strike Price | Contracts | Notional Amount | Value | |||||||||||||
Call Options | ||||||||||||||||||
SPY SPDR S&P 500® Trust ETF | 7/29/2022 | $ | 473.68 | 4,089 | $ | (168,466,800 | ) | $ | (388,455 | ) | ||||||||
| (388,455 | ) | |||||||||||||||||
Put Options | ||||||||||||||||||
SPY SPDR S&P 500® Trust ETF | 7/29/2022 | 372.73 | 4,089 | (168,466,800 | ) | (4,109,445 | ) | |||||||||||
| (4,109,445 | ) | |||||||||||||||||
Total Options Written (Premiums Received $11,019,198) | $ | (4,497,900 | ) | |||||||||||||||
(a) | Exchange-Traded. |
INNOVATOR U.S. EQUITY POWER BUFFER ETF – SEPTEMBER
Schedule of Investments
April 30, 2022 (Unaudited)
Contracts | Notional Amount | Value | ||||||||||
PURCHASED OPTIONS - 103.32% (a)(b) | ||||||||||||
CALL OPTIONS - 93.15% | ||||||||||||
SPY SPDR S&P 500® Trust ETF, Expires 8/31/2022, Strike Price $3.61 | 6,220 | $ | 256,264,000 | $ | 253,040,205 | |||||||
| 253,040,205 | ||||||||||||
PUT OPTIONS - 10.17% | ||||||||||||
SPY SPDR S&P 500® Trust ETF, Expires 8/31/2022, Strike Price $451.56 | 6,220 | 256,264,000 | 27,628,691 | |||||||||
| 27,628,691 | ||||||||||||
TOTAL PURCHASED OPTIONS (Cost $294,552,300) | 280,668,896 | |||||||||||
Principal Amount | ||||||||||||
SHORT TERM INVESTMENTS - 0.34% | ||||||||||||
Money Market Deposit Account - 0.34% | ||||||||||||
U.S. Bank Money Market Deposit Account, 0.130% (c) | $ | 925,244 | 925,244 | |||||||||
TOTAL SHORT TERM INVESTMENTS (Cost $925,244) | 925,244 | |||||||||||
Total Investments (Cost $295,477,544) - 103.66% | 281,594,140 | |||||||||||
Liabilities in Excess of Other Assets - (3.66)% | (9,931,160 | ) | ||||||||||
TOTAL NET ASSETS - 100.00% | $ | 271,662,980 | ||||||||||
Asset Type | % of Net Assets | |||
Purchased Options | 103.32 | % | ||
Short Term Investments | 0.34 | |||
Total Investments | 103.66 | |||
Liabilities in Excess of Other Assets | (3.66 | ) | ||
Net Assets | 100.00 | % | ||
Percentages are stated as a percent of net assets. | ||||
(a) | Exchange-Traded. |
(b) | Purchased option contracts are held in connection with corresponding option contracts written short. |
(c) | The U.S. Bank Money Market Deposit Account (the “MMDA”) is a short-term investment vehicle in which the Fund holds cash balances. The MMDA will bear interest at a variable rate that is determined based on conditions and may change daily and by any amount. The rate shown is as of April 30, 2022. |
INNOVATOR U.S. EQUITY POWER BUFFER ETF – SEPTEMBER
Schedule of Options Written (a)
April 30, 2022 (Unaudited)
| Description (a) | Expiration | Strike Price | Contracts | Notional Amount | Value | |||||||||||||
Call Options | ||||||||||||||||||
SPY SPDR S&P 500® Trust ETF | 8/31/2022 | $ | 489.94 | 6,220 | $ | (256,264,000 | ) | $ | (562,084 | ) | ||||||||
| (562,084 | ) | |||||||||||||||||
Put Options | ||||||||||||||||||
SPY SPDR S&P 500® Trust ETF | 8/31/2022 | 383.83 | 6,220 | (256,264,000 | ) | (9,187,987 | ) | |||||||||||
| (9,187,987 | ) | |||||||||||||||||
Total Options Written (Premiums Received $17,389,911) | $ | (9,750,071 | ) | |||||||||||||||
(a) | Exchange-Traded. |
INNOVATOR U.S. EQUITY POWER BUFFER ETF – OCTOBER
Schedule of Investments
April 30, 2022 (Unaudited)
Contracts | Notional Amount | Value | ||||||||||
PURCHASED OPTIONS - 103.69% (a)(b) | ||||||||||||
CALL OPTIONS - 95.63% | ||||||||||||
SPY SPDR S&P 500® Trust ETF, Expires 9/30/2022, Strike Price $3.43 | 4,387 | $ | 180,744,400 | $ | 177,849,179 | |||||||
| 177,849,179 | ||||||||||||
PUT OPTIONS - 8.06% | ||||||||||||
SPY SPDR S&P 500® Trust ETF, Expires 9/30/2022, Strike Price $429.14 | 4,387 | 180,744,400 | 14,998,405 | |||||||||
| 14,998,405 | ||||||||||||
TOTAL PURCHASED OPTIONS (Cost $199,718,254) | 192,847,584 | |||||||||||
Principal Amount | ||||||||||||
SHORT TERM INVESTMENTS - 0.41% | ||||||||||||
Money Market Deposit Account - 0.41% | ||||||||||||
U.S. Bank Money Market Deposit Account, 0.130% (c) | $ | 755,993 | 755,993 | |||||||||
TOTAL SHORT TERM INVESTMENTS (Cost $755,993) | 755,993 | |||||||||||
Total Investments (Cost $200,474,247) - 104.10% | 193,603,577 | |||||||||||
Liabilities in Excess of Other Assets - (4.10)% | (7,617,048 | ) | ||||||||||
TOTAL NET ASSETS - 100.00% | $ | 185,986,529 | ||||||||||
Asset Type | % of Net Assets | |||
Purchased Options | 103.69 | % | ||
Short Term Investments | 0.41 | |||
Total Investments | 104.10 | |||
Liabilities in Excess of Other Assets | (4.10 | ) | ||
Net Assets | 100.00 | % | ||
Percentages are stated as a percent of net assets. | ||||
(a) | Exchange-Traded. |
(b) | Purchased option contracts are held in connection with corresponding option contracts written short. |
(c) | The U.S. Bank Money Market Deposit Account (the “MMDA”) is a short-term investment vehicle in which the Fund holds cash balances. The MMDA will bear interest at a variable rate that is determined based on conditions and may change daily and by any amount. The rate shown is as of April 30, 2022. |
INNOVATOR U.S. EQUITY POWER BUFFER ETF – OCTOBER
Schedule of Options Written (a)
April 30, 2022 (Unaudited)
| Description (a) | Expiration | Strike Price | Contracts | Notional Amount | Value | |||||||||||||
Call Options | ||||||||||||||||||
SPY SPDR S&P 500® Trust ETF | 9/30/2022 | $ | 468.49 | 4,387 | $ | (180,744,400 | ) | $ | (1,855,366 | ) | ||||||||
| (1,855,366 | ) | |||||||||||||||||
Put Options | ||||||||||||||||||
SPY SPDR S&P 500® Trust ETF | 9/30/2022 | 364.77 | 4,387 | (180,744,400 | ) | (5,638,111 | ) | |||||||||||
| (5,638,111 | ) | |||||||||||||||||
Total Options Written (Premiums Received $14,094,657) | $ | (7,493,477 | ) | |||||||||||||||
(a) | Exchange-Traded. |
INNOVATOR U.S. EQUITY POWER BUFFER ETF – NOVEMBER
Schedule of Investments
April 30, 2022 (Unaudited)
Contracts | Notional Amount | Value | ||||||||||
PURCHASED OPTIONS - 104.80% (a)(b) | ||||||||||||
CALL OPTIONS - 92.57% | ||||||||||||
SPY SPDR S&P 500® Trust ETF, Expires 10/31/2022, Strike Price $3.67 | 4,638 | $ | 191,085,600 | $ | 187,917,817 | |||||||
| 187,917,817 | ||||||||||||
PUT OPTIONS - 12.23% | ||||||||||||
SPY SPDR S&P 500® Trust ETF, Expires 10/31/2022, Strike Price $459.25 | 4,638 | 191,085,600 | 24,828,980 | |||||||||
| 24,828,980 | ||||||||||||
TOTAL PURCHASED OPTIONS (Cost $225,597,087) | 212,746,797 | |||||||||||
Principal Amount | ||||||||||||
SHORT TERM INVESTMENTS - 0.47% | ||||||||||||
Money Market Deposit Account - 0.47% | ||||||||||||
U.S. Bank Money Market Deposit Account, 0.130% (c) | $ | 947,942 | 947,942 | |||||||||
TOTAL SHORT TERM INVESTMENTS (Cost $947,942) | 947,942 | |||||||||||
Total Investments (Cost $226,545,029) - 105.27% | 213,694,739 | |||||||||||
Liabilities in Excess of Other Assets - (5.27)% | (10,695,326 | ) | ||||||||||
TOTAL NET ASSETS - 100.00% | $ | 202,999,413 | ||||||||||
Asset Type | % of Net Assets | |||
Purchased Options | 104.80 | % | ||
Short Term Investments | 0.47 | |||
Total Investments | 105.27 | |||
Liabilities in Excess of Other Assets | (5.27 | ) | ||
Net Assets | 100.00 | % | ||
Percentages are stated as a percent of net assets. | ||||
(a) | Exchange-Traded. |
(b) | Purchased option contracts are held in connection with corresponding option contracts written short. |
(c) | The U.S. Bank Money Market Deposit Account (the “MMDA”) is a short-term investment vehicle in which the Fund holds cash balances. The MMDA will bear interest at a variable rate that is determined based on conditions and may change daily and by any amount. The rate shown is as of April 30, 2022. |
INNOVATOR U.S. EQUITY POWER BUFFER ETF – NOVEMBER
Schedule of Options Written (a)
April 30, 2022 (Unaudited)
| Description (a) | Expiration | Strike Price | Contracts | Notional Amount | Value | |||||||||||||
Call Options | ||||||||||||||||||
SPY SPDR S&P 500® Trust ETF | 10/31/2022 | $ | 497.55 | 4,638 | $ | (191,085,600 | ) | $ | (756,878 | ) | ||||||||
| (756,878 | ) | |||||||||||||||||
Put Options | ||||||||||||||||||
SPY SPDR S&P 500® Trust ETF | 10/31/2022 | 390.36 | 4,638 | (191,085,600 | ) | (9,804,580 | ) | |||||||||||
| (9,804,580 | ) | |||||||||||||||||
Total Options Written (Premiums Received $13,586,063) | $ | (10,561,458 | ) | |||||||||||||||
(a) | Exchange-Traded. |
INNOVATOR U.S. EQUITY POWER BUFFER ETF – DECEMBER
Schedule of Investments
April 30, 2022 (Unaudited)
Contracts | Notional Amount | Value | ||||||||||
PURCHASED OPTIONS - 104.94% (a)(b) | ||||||||||||
CALL OPTIONS - 93.08% | ||||||||||||
SPY SPDR S&P 500® Trust ETF, Expires 11/30/2022, Strike Price $3.64 | 5,194 | $ | 213,992,800 | $ | 210,465,922 | |||||||
| 210,465,922 | ||||||||||||
PUT OPTIONS - 11.86% | ||||||||||||
SPY SPDR S&P 500® Trust ETF, Expires 11/30/2022, Strike Price $455.56 | 5,194 | 213,992,800 | 26,816,788 | |||||||||
| 26,816,788 | ||||||||||||
TOTAL PURCHASED OPTIONS (Cost $251,410,253) | 237,282,710 | |||||||||||
Principal Amount | ||||||||||||
SHORT TERM INVESTMENTS - 0.54% | ||||||||||||
Money Market Deposit Account - 0.54% | ||||||||||||
U.S. Bank Money Market Deposit Account, 0.130% (c) | $ | 1,225,882 | 1,225,882 | |||||||||
TOTAL SHORT TERM INVESTMENTS (Cost $1,225,882) | 1,225,882 | |||||||||||
Total Investments (Cost $252,636,135) - 105.48% | 238,508,592 | |||||||||||
Liabilities in Excess of Other Assets - (5.48)% | (12,393,472 | ) | ||||||||||
TOTAL NET ASSETS - 100.00% | $ | 226,115,120 | ||||||||||
Asset Type | % of Net Assets | |||
Purchased Options | 104.94 | % | ||
Short Term Investments | 0.54 | |||
Total Investments | 105.48 | |||
Liabilities in Excess of Other Assets | (5.48 | ) | ||
Net Assets | 100.00 | % | ||
Percentages are stated as a percent of net assets. | ||||
(a) | Exchange-Traded. |
(b) | Purchased option contracts are held in connection with corresponding option contracts written short. |
(c) | The U.S. Bank Money Market Deposit Account (the “MMDA”) is a short-term investment vehicle in which the Fund holds cash balances. The MMDA will bear interest at a variable rate that is determined based on conditions and may change daily and by any amount. The rate shown is as of April 30, 2022. |
INNOVATOR U.S. EQUITY POWER BUFFER ETF – DECEMBER
Schedule of Options Written (a)
April 30, 2022 (Unaudited)
| Description (a) | Expiration | Strike Price | Contracts | Notional Amount | Value | |||||||||||||
Call Options | ||||||||||||||||||
SPY SPDR S&P 500® Trust ETF | 11/30/2022 | $ | 502.30 | 5,194 | $ | (213,992,800 | ) | $ | (1,042,776 | ) | ||||||||
| (1,042,776 | ) | |||||||||||||||||
Put Options | ||||||||||||||||||
SPY SPDR S&P 500® Trust ETF | 11/30/2022 | 387.23 | 5,194 | (213,992,800 | ) | (11,198,749 | ) | |||||||||||
| (11,198,749 | ) | |||||||||||||||||
Total Options Written (Premiums Received $17,467,076) | $ | (12,241,525 | ) | |||||||||||||||
(a) | Exchange-Traded. |
INNOVATOR U.S. EQUITY ULTRA BUFFER ETF – JANUARY
Schedule of Investments
April 30, 2022 (Unaudited)
Contracts | Notional Amount | Value | ||||||||||
PURCHASED OPTIONS - 101.75% (a)(b) | ||||||||||||
CALL OPTIONS - 90.34% | ||||||||||||
SPY SPDR S&P 500® Trust ETF, Expires 12/30/2022, Strike Price $3.79 | 6,150 | $ | 253,380,000 | $ | 248,017,700 | |||||||
| 248,017,700 | ||||||||||||
PUT OPTIONS - 11.41% | ||||||||||||
SPY SPDR S&P 500® Trust ETF, Expires 12/30/2022, Strike Price $451.21 | 6,150 | 253,380,000 | 31,316,067 | |||||||||
| 31,316,067 | ||||||||||||
TOTAL PURCHASED OPTIONS (Cost $292,981,494) | 279,333,767 | |||||||||||
Principal Amount | ||||||||||||
SHORT TERM INVESTMENTS - 0.60% | ||||||||||||
Money Market Deposit Account - 0.60% | ||||||||||||
U.S. Bank Money Market Deposit Account, 0.130% (c) | $ | 1,658,264 | 1,658,264 | |||||||||
TOTAL SHORT TERM INVESTMENTS (Cost $1,658,264) | 1,658,264 | |||||||||||
Total Investments (Cost $294,639,758) - 102.35% | 280,992,031 | |||||||||||
Liabilities in Excess of Other Assets - (2.35)% | (6,437,002 | ) | ||||||||||
TOTAL NET ASSETS - 100.00% | $ | 274,555,029 | ||||||||||
Asset Type | % of Net Assets | |||
Purchased Options | 101.75 | % | ||
Short Term Investments | 0.60 | |||
Total Investments | 102.35 | |||
Liabilities in Excess of Other Assets | (2.35 | ) | ||
Net Assets | 100.00 | % | ||
Percentages are stated as a percent of net assets. | ||||
(a) | Exchange-Traded. |
(b) | Purchased option contracts are held in connection with corresponding option contracts written short. |
(c) | The U.S. Bank Money Market Deposit Account (the “MMDA”) is a short-term investment vehicle in which the Fund holds cash balances. The MMDA will bear interest at a variable rate that is determined based on conditions and may change daily and by any amount. The rate shown is as of April 30, 2022. |
INNOVATOR U.S. EQUITY ULTRA BUFFER ETF – JANUARY
Schedule of Options Written (a)
April 30, 2022 (Unaudited)
| Description (a) | Expiration | Strike Price | Contracts | Notional Amount | Value | |||||||||||||
Call Options | ||||||||||||||||||
SPY SPDR S&P 500® Trust ETF | 12/30/2022 | $ | 507.73 | 6,150 | $ | (253,380,000 | ) | $ | (1,197,847 | ) | ||||||||
| (1,197,847 | ) | |||||||||||||||||
Put Options | ||||||||||||||||||
SPY SPDR S&P 500® Trust ETF | 12/30/2022 | 308.72 | 6,150 | (253,380,000 | ) | (5,070,112 | ) | |||||||||||
| (5,070,112 | ) | |||||||||||||||||
Total Options Written (Premiums Received $10,284,900) | $ | (6,267,959 | ) | |||||||||||||||
(a) | Exchange-Traded. |
INNOVATOR U.S. EQUITY ULTRA BUFFER ETF – FEBRUARY
Schedule of Investments
April 30, 2022 (Unaudited)
Contracts | Notional Amount | Value | ||||||||||
PURCHASED OPTIONS - 102.44% (a)(b) | ||||||||||||
CALL OPTIONS - 93.14% | ||||||||||||
SPY SPDR S&P 500® Trust ETF, Expires 1/31/2023, Strike Price $3.59 | 965 | $ | 39,758,000 | $ | 38,935,662 | |||||||
| 38,935,662 | ||||||||||||
PUT OPTIONS - 9.30% | ||||||||||||
SPY SPDR S&P 500® Trust ETF, Expires 1/31/2023, Strike Price $427.41 | 965 | 39,758,000 | 3,887,266 | |||||||||
| 3,887,266 | ||||||||||||
TOTAL PURCHASED OPTIONS (Cost $45,085,811) | 42,822,928 | |||||||||||
Principal Amount | ||||||||||||
SHORT TERM INVESTMENTS - 0.66% | ||||||||||||
Money Market Deposit Account - 0.66% | ||||||||||||
U.S. Bank Money Market Deposit Account, 0.130% (c) | $ | 275,961 | 275,961 | |||||||||
TOTAL SHORT TERM INVESTMENTS (Cost $275,961) | 275,961 | |||||||||||
Total Investments (Cost $45,361,772) - 103.10% | 43,098,889 | |||||||||||
Liabilities in Excess of Other Assets - (3.10)% | (1,295,327 | ) | ||||||||||
TOTAL NET ASSETS - 100.00% | $ | 41,803,562 | ||||||||||
Asset Type | % of Net Assets | |||
Purchased Options | 102.44 | % | ||
Short Term Investments | 0.66 | |||
Total Investments | 103.10 | |||
Liabilities in Excess of Other Assets | (3.10 | ) | ||
Net Assets | 100.00 | % | ||
Percentages are stated as a percent of net assets. | ||||
(a) | Exchange-Traded. |
(b) | Purchased option contracts are held in connection with corresponding option contracts written short. |
(c) | The U.S. Bank Money Market Deposit Account (the “MMDA”) is a short-term investment vehicle in which the Fund holds cash balances. The MMDA will bear interest at a variable rate that is determined based on conditions and may change daily and by any amount. The rate shown is as of April 30, 2022. |
INNOVATOR U.S. EQUITY ULTRA BUFFER ETF – FEBRUARY
Schedule of Options Written (a)
April 30, 2022 (Unaudited)
| Description (a) | Expiration | Strike Price | Contracts | Notional Amount | Value | |||||||||||||
Call Options | ||||||||||||||||||
SPY SPDR S&P 500® Trust ETF | 1/31/2023 | $ | 485.54 | 965 | $ | (39,758,000 | ) | $ | (561,635 | ) | ||||||||
| (561,635 | ) | |||||||||||||||||
Put Options | ||||||||||||||||||
SPY SPDR S&P 500® Trust ETF | 1/31/2023 | 292.44 | 965 | (39,758,000 | ) | (706,865 | ) | |||||||||||
| (706,865 | ) | |||||||||||||||||
Total Options Written (Premiums Received $2,205,255) | $ | (1,268,500 | ) | |||||||||||||||
(a) | Exchange-Traded. |
INNOVATOR U.S. EQUITY ULTRA BUFFER ETF – MARCH
Schedule of Investments
April 30, 2022 (Unaudited)
Contracts | Notional Amount | Value | ||||||||||
PURCHASED OPTIONS - 103.41% (a)(b) | ||||||||||||
CALL OPTIONS - 95.09% | ||||||||||||
SPY SPDR S&P 500® Trust ETF, Expires 2/28/2023, Strike Price $3.48 | 941 | $ | 38,769,200 | $ | 37,978,365 | |||||||
| 37,978,365 | ||||||||||||
PUT OPTIONS - 8.32% | ||||||||||||
SPY SPDR S&P 500® Trust ETF, Expires 2/28/2023, Strike Price $414.80 | 941 | 38,769,200 | 3,321,327 | |||||||||
| 3,321,327 | ||||||||||||
TOTAL PURCHASED OPTIONS (Cost $43,085,528) | 41,299,692 | |||||||||||
Principal Amount | ||||||||||||
SHORT TERM INVESTMENTS - 0.70% | ||||||||||||
Money Market Deposit Account - 0.70% | ||||||||||||
U.S. Bank Money Market Deposit Account, 0.130% (c) | $ | 279,614 | 279,614 | |||||||||
TOTAL SHORT TERM INVESTMENTS (Cost $279,614) | 279,614 | |||||||||||
Total Investments (Cost $43,365,142) - 104.11% | 41,579,306 | |||||||||||
Liabilities in Excess of Other Assets - (4.11)% | (1,640,108 | ) | ||||||||||
TOTAL NET ASSETS - 100.00% | $ | 39,939,198 | ||||||||||
Asset Type | % of Net Assets | |||
Purchased Options | 103.41 | % | ||
Short Term Investments | 0.70 | |||
Total Investments | 104.11 | |||
Liabilities in Excess of Other Assets | (4.11 | ) | ||
Net Assets | 100.00 | % | ||
Percentages are stated as a percent of net assets. | ||||
(a) | Exchange-Traded. |
(b) | Purchased option contracts are held in connection with corresponding option contracts written short. |
(c) | The U.S. Bank Money Market Deposit Account (the “MMDA”) is a short-term investment vehicle in which the Fund holds cash balances. The MMDA will bear interest at a variable rate that is determined based on conditions and may change daily and by any amount. The rate shown is as of April 30, 2022. |
INNOVATOR U.S. EQUITY ULTRA BUFFER ETF – MARCH
Schedule of Options Written (a)
April 30, 2022 (Unaudited)
| Description (a) | Expiration | Strike Price | Contracts | Notional Amount | Value | |||||||||||||
Call Options | ||||||||||||||||||
SPY SPDR S&P 500® Trust ETF | 2/28/2023 | $ | 475.32 | 941 | $ | (38,769,200 | ) | $ | (939,975 | ) | ||||||||
| (939,975 | ) | |||||||||||||||||
Put Options | ||||||||||||||||||
SPY SPDR S&P 500® Trust ETF | 2/28/2023 | 283.81 | 941 | (38,769,200 | ) | (674,043 | ) | |||||||||||
| (674,043 | ) | |||||||||||||||||
Total Options Written (Premiums Received $2,402,508) | $ | (1,614,018 | ) | |||||||||||||||
(a) | Exchange-Traded. |
INNOVATOR U.S. EQUITY ULTRA BUFFER ETF – APRIL
Schedule of Investments
April 30, 2022 (Unaudited)
Contracts | Notional Amount | Value | ||||||||||
PURCHASED OPTIONS - 102.74% (a)(b) | ||||||||||||
CALL OPTIONS - 92.75% | ||||||||||||
SPY SPDR S&P 500® Trust ETF, Expires 3/31/2023, Strike Price $3.60 | 1,216 | $ | 50,099,200 | $ | 48,881,415 | |||||||
| 48,881,415 | ||||||||||||
PUT OPTIONS - 9.99% | ||||||||||||
SPY SPDR S&P 500® Trust ETF, Expires 3/31/2023, Strike Price $429.06 | 1,216 | 50,099,200 | 5,264,992 | |||||||||
| 5,264,992 | ||||||||||||
TOTAL PURCHASED OPTIONS (Cost $56,866,535) | 54,146,407 | |||||||||||
Principal Amount | ||||||||||||
SHORT TERM INVESTMENTS - 0.80% | ||||||||||||
Money Market Deposit Account - 0.80% | ||||||||||||
U.S. Bank Money Market Deposit Account, 0.130% (c) | $ | 419,228 | 419,228 | |||||||||
TOTAL SHORT TERM INVESTMENTS (Cost $419,228) | 419,228 | |||||||||||
Total Investments (Cost $57,285,763) - 103.54% | 54,565,635 | |||||||||||
Liabilities in Excess of Other Assets - (3.54)% | (1,865,398 | ) | ||||||||||
TOTAL NET ASSETS - 100.00% | $ | 52,700,237 | ||||||||||
Asset Type | % of Net Assets | |||
Purchased Options | 102.74 | % | ||
Short Term Investments | 0.80 | |||
Total Investments | 103.54 | |||
Liabilities in Excess of Other Assets | (3.54 | ) | ||
Net Assets | 100.00 | % | ||
Percentages are stated as a percent of net assets. | ||||
(a) | Exchange-Traded. |
(b) | Purchased option contracts are held in connection with corresponding option contracts written short. |
(c) | The U.S. Bank Money Market Deposit Account (the “MMDA”) is a short-term investment vehicle in which the Fund holds cash balances. The MMDA will bear interest at a variable rate that is determined based on conditions and may change daily and by any amount. The rate shown is as of April 30, 2022. |
INNOVATOR U.S. EQUITY ULTRA BUFFER ETF – APRIL
Schedule of Options Written (a)
April 30, 2022 (Unaudited)
| Description (a) | Expiration | Strike Price | Contracts | Notional Amount | Value | |||||||||||||
Call Options | ||||||||||||||||||
SPY SPDR S&P 500® Trust ETF | 3/31/2023 | $ | 494.14 | 1,216 | $ | (50,099,200 | ) | $ | (781,611 | ) | ||||||||
| (781,611 | ) | |||||||||||||||||
Put Options | ||||||||||||||||||
SPY SPDR S&P 500® Trust ETF | 3/31/2023 | 293.57 | 1,216 | (50,099,200 | ) | (1,054,016 | ) | |||||||||||
| (1,054,016 | ) | |||||||||||||||||
Total Options Written (Premiums Received $2,582,804) | $ | (1,835,627 | ) | |||||||||||||||
(a) | Exchange-Traded. |
INNOVATOR U.S. EQUITY ULTRA BUFFER ETF – MAY
Schedule of Investments
April 30, 2022 (Unaudited)
Contracts | Notional Amount | Value | ||||||||||
PURCHASED OPTIONS - 105.58% (a)(b) | ||||||||||||
CALL OPTIONS - 98.35% | ||||||||||||
SPY SPDR S&P 500® Trust ETF, Expires 4/28/2023, Strike Price $4.11 | 727 | $ | 29,952,400 | $ | 29,235,578 | |||||||
| 29,235,578 | ||||||||||||
PUT OPTIONS - 7.23% | ||||||||||||
SPY SPDR S&P 500® Trust ETF, Expires 4/28/2023, Strike Price $391.40 | 727 | 29,952,400 | 2,149,739 | |||||||||
| 2,149,739 | ||||||||||||
TOTAL PURCHASED OPTIONS (Cost $31,388,297) | 31,385,317 | |||||||||||
Principal Amount | ||||||||||||
SHORT TERM INVESTMENTS - 0.02% | ||||||||||||
Money Market Deposit Account - 0.02% | ||||||||||||
U.S. Bank Money Market Deposit Account, 0.130% (c) | $ | 5,949 | 5,949 | |||||||||
TOTAL SHORT TERM INVESTMENTS (Cost $5,949) | 5,949 | |||||||||||
Total Investments (Cost $31,394,246) - 105.60% | 31,391,266 | |||||||||||
Liabilities in Excess of Other Assets - (5.60)% | (1,666,267 | ) | ||||||||||
TOTAL NET ASSETS - 100.00% | $ | 29,724,999 | ||||||||||
Asset Type | % of Net Assets | |||
Purchased Options | 105.58 | % | ||
Short Term Investments | 0.02 | |||
Total Investments | 105.60 | |||
Liabilities in Excess of Other Assets | (5.60 | ) | ||
Net Assets | 100.00 | % | ||
Percentages are stated as a percent of net assets. | ||||
(a) | Exchange-Traded. |
(b) | Purchased option contracts are held in connection with corresponding option contracts written short. |
(c) | The U.S. Bank Money Market Deposit Account (the “MMDA”) is a short-term investment vehicle in which the Fund holds cash balances. The MMDA will bear interest at a variable rate that is determined based on conditions and may change daily and by any amount. The rate shown is as of April 30, 2022. |
INNOVATOR U.S. EQUITY ULTRA BUFFER ETF – MAY
Schedule of Options Written (a)
April 30, 2022 (Unaudited)
| Description (a) | Expiration | Strike Price | Contracts | Notional Amount | Value | |||||||||||||
Call Options | ||||||||||||||||||
SPY SPDR S&P 500® Trust ETF | 4/28/2023 | $ | 459.79 | 727 | $ | (29,952,400 | ) | $ | (1,237,354 | ) | ||||||||
| (1,237,354 | ) | |||||||||||||||||
Put Options | ||||||||||||||||||
SPY SPDR S&P 500® Trust ETF | 4/28/2023 | 267.80 | 727 | (29,952,400 | ) | (494,360 | ) | |||||||||||
| (494,360 | ) | |||||||||||||||||
Total Options Written (Premiums Received $1,728,726) | $ | (1,731,714 | ) | |||||||||||||||
(a) | Exchange-Traded. |
INNOVATOR U.S. EQUITY ULTRA BUFFER ETF – JUNE
Schedule of Investments
April 30, 2022 (Unaudited)
Contracts | Notional Amount | Value | ||||||||||
PURCHASED OPTIONS - 100.18% (a)(b) | ||||||||||||
CALL OPTIONS - 98.18% | ||||||||||||
SPY SPDR S&P 500® Trust ETF, Expires 5/31/2022, Strike Price $3.35 | 405 | $ | 16,686,000 | $ | 16,550,401 | |||||||
| 16,550,401 | ||||||||||||
PUT OPTIONS - 2.00% | ||||||||||||
SPY SPDR S&P 500® Trust ETF, Expires 5/31/2022, Strike Price $399.04 | 405 | 16,686,000 | 337,723 | |||||||||
| 337,723 | ||||||||||||
TOTAL PURCHASED OPTIONS (Cost $17,540,833) | 16,888,124 | |||||||||||
Principal Amount | ||||||||||||
SHORT TERM INVESTMENTS - 0.26% | ||||||||||||
Money Market Deposit Account - 0.26% | ||||||||||||
U.S. Bank Money Market Deposit Account, 0.130% (c) | $ | 44,287 | 44,287 | |||||||||
TOTAL SHORT TERM INVESTMENTS (Cost $44,287) | 44,287 | |||||||||||
Total Investments (Cost $17,585,120) - 100.44% | 16,932,411 | |||||||||||
Liabilities in Excess of Other Assets - (0.44)% | (74,597 | ) | ||||||||||
TOTAL NET ASSETS - 100.00% | $ | 16,857,814 | ||||||||||
Asset Type | % of Net Assets | |||
Purchased Options | 100.18 | % | ||
Short Term Investments | 0.26 | |||
Total Investments | 100.44 | |||
Liabilities in Excess of Other Assets | (0.44 | ) | ||
Net Assets | 100.00 | % | ||
Percentages are stated as a percent of net assets. | ||||
(a) | Exchange-Traded. |
(b) | Purchased option contracts are held in connection with corresponding option contracts written short. |
(c) | The U.S. Bank Money Market Deposit Account (the “MMDA”) is a short-term investment vehicle in which the Fund holds cash balances. The MMDA will bear interest at a variable rate that is determined based on conditions and may change daily and by any amount. The rate shown is as of April 30, 2022. |
INNOVATOR U.S. EQUITY ULTRA BUFFER ETF – JUNE
Schedule of Options Written (a)
April 30, 2022 (Unaudited)
| Description (a) | Expiration | Strike Price | Contracts | Notional Amount | Value | |||||||||||||
Call Options | ||||||||||||||||||
SPY SPDR S&P 500® Trust ETF | 5/31/2022 | $ | 446.67 | 405 | $ | (16,686,000 | ) | $ | (46,489 | ) | ||||||||
| (46,489 | ) | |||||||||||||||||
Put Options | ||||||||||||||||||
SPY SPDR S&P 500® Trust ETF | 5/31/2022 | 273.03 | 405 | (16,686,000 | ) | (16,416 | ) | |||||||||||
| (16,416 | ) | |||||||||||||||||
Total Options Written (Premiums Received $800,909) | $ | (62,905 | ) | |||||||||||||||
(a) | Exchange-Traded. |
INNOVATOR U.S. EQUITY ULTRA BUFFER ETF – JULY
Schedule of Investments
April 30, 2022 (Unaudited)
Contracts | Notional Amount | Value | ||||||||||
PURCHASED OPTIONS - 100.64% (a)(b) | ||||||||||||
CALL OPTIONS - 96.91% | ||||||||||||
SPY SPDR S&P 500® Trust ETF, Expires 6/30/2022, Strike Price $3.41 | 864 | $ | 35,596,800 | $ | 35,165,642 | |||||||
| 35,165,642 | ||||||||||||
PUT OPTIONS - 3.73% | ||||||||||||
SPY SPDR S&P 500® Trust ETF, Expires 6/30/2022, Strike Price $406.66 | 864 | 35,596,800 | 1,352,604 | |||||||||
| 1,352,604 | ||||||||||||
TOTAL PURCHASED OPTIONS (Cost $38,084,174) | 36,518,246 | |||||||||||
Principal Amount | ||||||||||||
SHORT TERM INVESTMENTS - 0.18% | ||||||||||||
Money Market Deposit Account - 0.18% | ||||||||||||
U.S. Bank Money Market Deposit Account, 0.130% (c) | $ | 64,465 | 64,465 | |||||||||
TOTAL SHORT TERM INVESTMENTS (Cost $64,465) | 64,465 | |||||||||||
Total Investments (Cost $38,148,639) - 100.82% | 36,582,711 | |||||||||||
Liabilities in Excess of Other Assets - (0.82)% | (294,818 | ) | ||||||||||
TOTAL NET ASSETS - 100.00% | $ | 36,287,893 | ||||||||||
Asset Type | % of Net Assets | |||
Purchased Options | 100.64 | % | ||
Short Term Investments | 0.18 | |||
Total Investments | 100.82 | |||
Liabilities in Excess of Other Assets | (0.82 | ) | ||
Net Assets | 100.00 | % | ||
Percentages are stated as a percent of net assets. | ||||
(a) | Exchange-Traded. |
(b) | Purchased option contracts are held in connection with corresponding option contracts written short. |
(c) | The U.S. Bank Money Market Deposit Account (the “MMDA”) is a short-term investment vehicle in which the Fund holds cash balances. The MMDA will bear interest at a variable rate that is determined based on conditions and may change daily and by any amount. The rate shown is as of April 30, 2022. |
INNOVATOR U.S. EQUITY ULTRA BUFFER ETF – JULY
Schedule of Options Written (a)
April 30, 2022 (Unaudited)
| Description (a) | Expiration | Strike Price | Contracts | Notional Amount | Value | |||||||||||||
Call Options | ||||||||||||||||||
SPY SPDR S&P 500® Trust ETF | 6/30/2022 | $ | 453.74 | 864 | $ | (35,596,800 | ) | $ | (173,198 | ) | ||||||||
| (173,198 | ) | |||||||||||||||||
Put Options | ||||||||||||||||||
SPY SPDR S&P 500® Trust ETF | 6/30/2022 | 278.24 | 864 | (35,596,800 | ) | (99,057 | ) | |||||||||||
| (99,057 | ) | |||||||||||||||||
Total Options Written (Premiums Received $1,770,796) | $ | (272,255 | ) | |||||||||||||||
(a) | Exchange-Traded. |
INNOVATOR U.S. EQUITY ULTRA BUFFER ETF – AUGUST
Schedule of Investments
April 30, 2022 (Unaudited)
Contracts | Notional Amount | Value | ||||||||||
PURCHASED OPTIONS - 100.71% (a)(b) | ||||||||||||
CALL OPTIONS - 95.35% | ||||||||||||
SPY SPDR S&P 500® Trust ETF, Expires 7/29/2022, Strike Price $3.49 | 603 | $ | 24,843,600 | $ | 24,538,056 | |||||||
| 24,538,056 | ||||||||||||
PUT OPTIONS - 5.36% | ||||||||||||
SPY SPDR S&P 500® Trust ETF, Expires 7/29/2022, Strike Price $416.58 | 603 | 24,843,600 | 1,380,119 | |||||||||
| 1,380,119 | ||||||||||||
TOTAL PURCHASED OPTIONS (Cost $27,344,233) | 25,918,175 | |||||||||||
Principal Amount | ||||||||||||
SHORT TERM INVESTMENTS - 0.33% | ||||||||||||
Money Market Deposit Account - 0.33% | ||||||||||||
U.S. Bank Money Market Deposit Account, 0.130% (c) | $ | 84,799 | 84,799 | |||||||||
TOTAL SHORT TERM INVESTMENTS (Cost $84,799) | 84,799 | |||||||||||
Total Investments (Cost $27,429,032) - 101.04% | 26,002,974 | |||||||||||
Liabilities in Excess of Other Assets - (1.04)% | (267,537 | ) | ||||||||||
TOTAL NET ASSETS - 100.00% | $ | 25,735,437 | ||||||||||
Asset Type | % of Net Assets | |||
Purchased Options | 100.71 | % | ||
Short Term Investments | 0.33 | |||
Total Investments | 101.04 | |||
Liabilities in Excess of Other Assets | (1.04 | ) | ||
Net Assets | 100.00 | % | ||
Percentages are stated as a percent of net assets. | ||||
(a) | Exchange-Traded. |
(b) | Purchased option contracts are held in connection with corresponding option contracts written short. |
(c) | The U.S. Bank Money Market Deposit Account (the “MMDA”) is a short-term investment vehicle in which the Fund holds cash balances. The MMDA will bear interest at a variable rate that is determined based on conditions and may change daily and by any amount. The rate shown is as of April 30, 2022. |
INNOVATOR U.S. EQUITY ULTRA BUFFER ETF – AUGUST
Schedule of Options Written (a)
April 30, 2022 (Unaudited)
| Description (a) | Expiration | Strike Price | Contracts | Notional Amount | Value | |||||||||||||
Call Options | ||||||||||||||||||
SPY SPDR S&P 500® Trust ETF | 7/29/2022 | $ | 465.26 | 603 | $ | (24,843,600 | ) | $ | (117,405 | ) | ||||||||
| (117,405 | ) | |||||||||||||||||
Put Options | ||||||||||||||||||
SPY SPDR S&P 500® Trust ETF | 7/29/2022 | 285.03 | 603 | (24,843,600 | ) | (132,669 | ) | |||||||||||
| (132,669 | ) | |||||||||||||||||
Total Options Written (Premiums Received $1,321,797) | $ | (250,074 | ) | |||||||||||||||
(a) | Exchange-Traded. |
INNOVATOR U.S. EQUITY ULTRA BUFFER ETF – SEPTEMBER
Schedule of Investments
April 30, 2022 (Unaudited)
Contracts | Notional Amount | Value | ||||||||||
PURCHASED OPTIONS - 100.90% (a)(b) | ||||||||||||
CALL OPTIONS - 93.72% | ||||||||||||
SPY SPDR S&P 500® Trust ETF, Expires 8/31/2022, Strike Price $3.60 | 1,390 | $ | 57,268,000 | $ | 56,548,954 | |||||||
| 56,548,954 | ||||||||||||
PUT OPTIONS - 7.18% | ||||||||||||
SPY SPDR S&P 500® Trust ETF, Expires 8/31/2022, Strike Price $428.98 | 1,390 | 57,268,000 | 4,334,983 | |||||||||
| 4,334,983 | ||||||||||||
TOTAL PURCHASED OPTIONS (Cost $64,752,524) | 60,883,937 | |||||||||||
Principal Amount | ||||||||||||
SHORT TERM INVESTMENTS - 0.32% | ||||||||||||
Money Market Deposit Account - 0.32% | ||||||||||||
U.S. Bank Money Market Deposit Account, 0.130% (c) | $ | 192,867 | 192,867 | |||||||||
TOTAL SHORT TERM INVESTMENTS (Cost $192,867) | 192,867 | |||||||||||
Total Investments (Cost $64,945,391) - 101.22% | 61,076,804 | |||||||||||
Liabilities in Excess of Other Assets - (1.22)% | (735,747 | ) | ||||||||||
TOTAL NET ASSETS - 100.00% | $ | 60,341,057 | ||||||||||
Asset Type | % of Net Assets | |||
Purchased Options | 100.90 | % | ||
Short Term Investments | 0.32 | |||
Total Investments | 101.22 | |||
Liabilities in Excess of Other Assets | (1.22 | ) | ||
Net Assets | 100.00 | % | ||
Percentages are stated as a percent of net assets. | ||||
(a) | Exchange-Traded. |
(b) | Purchased option contracts are held in connection with corresponding option contracts written short. |
(c) | The U.S. Bank Money Market Deposit Account (the “MMDA”) is a short-term investment vehicle in which the Fund holds cash balances. The MMDA will bear interest at a variable rate that is determined based on conditions and may change daily and by any amount. The rate shown is as of April 30, 2022. |
INNOVATOR U.S. EQUITY ULTRA BUFFER ETF – SEPTEMBER
Schedule of Options Written (a)
April 30, 2022 (Unaudited)
| Description (a) | Expiration | Strike Price | Contracts | Notional Amount | Value | |||||||||||||
Call Options | ||||||||||||||||||
SPY SPDR S&P 500® Trust ETF | 8/31/2022 | $ | 480.82 | 1,390 | $ | (57,268,000 | ) | $ | (213,958 | ) | ||||||||
| (213,958 | ) | |||||||||||||||||
Put Options | ||||||||||||||||||
SPY SPDR S&P 500® Trust ETF | 8/31/2022 | 293.51 | 1,390 | (57,268,000 | ) | (481,219 | ) | |||||||||||
| (481,219 | ) | |||||||||||||||||
Total Options Written (Premiums Received $2,791,843) | $ | (695,177 | ) | |||||||||||||||
(a) | Exchange-Traded. |
INNOVATOR U.S. EQUITY ULTRA BUFFER ETF – OCTOBER
Schedule of Investments
April 30, 2022 (Unaudited)
Contracts | Notional Amount | Value | ||||||||||
PURCHASED OPTIONS - 102.19% (a)(b) | ||||||||||||
CALL OPTIONS - 96.26% | ||||||||||||
SPY SPDR S&P 500® Trust ETF, Expires 9/30/2022, Strike Price $3.42 | 1,459 | $ | 60,110,800 | $ | 59,149,375 | |||||||
| 59,149,375 | ||||||||||||
PUT OPTIONS - 5.93% | ||||||||||||
SPY SPDR S&P 500® Trust ETF, Expires 9/30/2022, Strike Price $407.68 | 1,459 | 60,110,800 | 3,646,681 | |||||||||
| 3,646,681 | ||||||||||||
TOTAL PURCHASED OPTIONS (Cost $65,438,426) | 62,796,056 | |||||||||||
Principal Amount | ||||||||||||
SHORT TERM INVESTMENTS - 0.42% | ||||||||||||
Money Market Deposit Account - 0.42% | ||||||||||||
U.S. Bank Money Market Deposit Account, 0.130% (c) | $ | 260,537 | 260,537 | |||||||||
TOTAL SHORT TERM INVESTMENTS (Cost $260,537) | 260,537 | |||||||||||
Total Investments (Cost $65,698,963) - 102.61% | 63,056,593 | |||||||||||
Liabilities in Excess of Other Assets - (2.61)% | (1,606,168 | ) | ||||||||||
TOTAL NET ASSETS - 100.00% | $ | 61,450,425 | ||||||||||
Asset Type | % of Net Assets | |||
Purchased Options | 102.19 | % | ||
Short Term Investments | 0.42 | |||
Total Investments | 102.61 | |||
Liabilities in Excess of Other Assets | (2.61 | ) | ||
Net Assets | 100.00 | % | ||
Percentages are stated as a percent of net assets. | ||||
(a) | Exchange-Traded. |
(b) | Purchased option contracts are held in connection with corresponding option contracts written short. |
(c) | The U.S. Bank Money Market Deposit Account (the “MMDA”) is a short-term investment vehicle in which the Fund holds cash balances. The MMDA will bear interest at a variable rate that is determined based on conditions and may change daily and by any amount. The rate shown is as of April 30, 2022. |
INNOVATOR U.S. EQUITY ULTRA BUFFER ETF – OCTOBER
Schedule of Options Written (a)
April 30, 2022 (Unaudited)
| Description (a) | Expiration | Strike Price | Contracts | Notional Amount | Value | |||||||||||||
Call Options | ||||||||||||||||||
SPY SPDR S&P 500® Trust ETF | 9/30/2022 | $ | 457.03 | 1,459 | $ | (60,110,800 | ) | $ | (1,035,667 | ) | ||||||||
| (1,035,667 | ) | |||||||||||||||||
Put Options | ||||||||||||||||||
SPY SPDR S&P 500® Trust ETF | 9/30/2022 | 278.94 | 1,459 | (60,110,800 | ) | (529,439 | ) | |||||||||||
| (529,439 | ) | |||||||||||||||||
Total Options Written (Premiums Received $3,858,972) | $ | (1,565,106 | ) | |||||||||||||||
(a) | Exchange-Traded. |
INNOVATOR U.S. EQUITY ULTRA BUFFER ETF – NOVEMBER
Schedule of Investments
April 30, 2022 (Unaudited)
Contracts | Notional Amount | Value | ||||||||||
PURCHASED OPTIONS - 101.42% (a)(b) | ||||||||||||
CALL OPTIONS - 92.37% | ||||||||||||
SPY SPDR S&P 500® Trust ETF, Expires 10/31/2022, Strike Price $3.66 | 989 | $ | 40,746,800 | $ | 40,072,287 | |||||||
| 40,072,287 | ||||||||||||
PUT OPTIONS - 9.05% | ||||||||||||
SPY SPDR S&P 500® Trust ETF, Expires 10/31/2022, Strike Price $436.29 | 989 | 40,746,800 | 3,925,412 | |||||||||
| 3,925,412 | ||||||||||||
TOTAL PURCHASED OPTIONS (Cost $47,031,741) | 43,997,699 | |||||||||||
Principal Amount | ||||||||||||
SHORT TERM INVESTMENTS - 0.47% | ||||||||||||
Money Market Deposit Account - 0.47% | ||||||||||||
U.S. Bank Money Market Deposit Account, 0.130% (c) | $ | 205,100 | 205,100 | |||||||||
TOTAL SHORT TERM INVESTMENTS (Cost $205,100) | 205,100 | |||||||||||
Total Investments (Cost $47,236,841) - 101.89% | 44,202,799 | |||||||||||
Liabilities in Excess of Other Assets - (1.89)% | (822,936 | ) | ||||||||||
TOTAL NET ASSETS - 100.00% | $ | 43,379,863 | ||||||||||
Asset Type | % of Net Assets | |||
Purchased Options | 101.42 | % | ||
Short Term Investments | 0.47 | |||
Total Investments | 101.89 | |||
Liabilities in Excess of Other Assets | (1.89 | ) | ||
Net Assets | 100.00 | % | ||
Percentages are stated as a percent of net assets. | ||||
(a) | Exchange-Traded. |
(b) | Purchased option contracts are held in connection with corresponding option contracts written short. |
(c) | The U.S. Bank Money Market Deposit Account (the “MMDA”) is a short-term investment vehicle in which the Fund holds cash balances. The MMDA will bear interest at a variable rate that is determined based on conditions and may change daily and by any amount. The rate shown is as of April 30, 2022. |
INNOVATOR U.S. EQUITY ULTRA BUFFER ETF – NOVEMBER
Schedule of Options Written (a)
April 30, 2022 (Unaudited)
| Description (a) | Expiration | Strike Price | Contracts | Notional Amount | Value | |||||||||||||
Call Options | ||||||||||||||||||
SPY SPDR S&P 500® Trust ETF | 10/31/2022 | $ | 488.18 | 989 | $ | (40,746,800 | ) | $ | (243,990 | ) | ||||||||
| (243,990 | ) | |||||||||||||||||
Put Options | ||||||||||||||||||
SPY SPDR S&P 500® Trust ETF | 10/31/2022 | 298.51 | 989 | (40,746,800 | ) | (550,769 | ) | |||||||||||
| (550,769 | ) | |||||||||||||||||
Total Options Written (Premiums Received $2,214,835) | $ | (794,759 | ) | |||||||||||||||
(a) | Exchange-Traded. |
INNOVATOR U.S. EQUITY ULTRA BUFFER ETF – DECEMBER
Schedule of Investments
April 30, 2022 (Unaudited)
Contracts | Notional Amount | Value | ||||||||||
PURCHASED OPTIONS - 101.70% (a)(b) | ||||||||||||
CALL OPTIONS - 92.79% | ||||||||||||
SPY SPDR S&P 500® Trust ETF, Expires 11/30/2022, Strike Price $3.63 | 1,064 | $ | 43,836,800 | $ | 43,115,364 | |||||||
| 43,115,364 | ||||||||||||
PUT OPTIONS - 8.91% | ||||||||||||
SPY SPDR S&P 500® Trust ETF, Expires 11/30/2022, Strike Price $432.78 | 1,064 | 43,836,800 | 4,141,757 | |||||||||
| 4,141,757 | ||||||||||||
TOTAL PURCHASED OPTIONS (Cost $50,533,717) | 47,257,121 | |||||||||||
Principal Amount | ||||||||||||
SHORT TERM INVESTMENTS - 0.56% | ||||||||||||
Money Market Deposit Account - 0.56% | ||||||||||||
U.S. Bank Money Market Deposit Account, 0.130% (c) | $ | 259,350 | 259,350 | |||||||||
TOTAL SHORT TERM INVESTMENTS (Cost $259,350) | 259,350 | |||||||||||
Total Investments (Cost $50,793,067) - 102.26% | 47,516,471 | |||||||||||
Liabilities in Excess of Other Assets - (2.26)% | (1,050,318 | ) | ||||||||||
TOTAL NET ASSETS - 100.00% | $ | 46,466,153 | ||||||||||
Asset Type | % of Net Assets | |||
Purchased Options | 101.70 | % | ||
Short Term Investments | 0.56 | |||
Total Investments | 102.26 | |||
Liabilities in Excess of Other Assets | (2.26 | ) | ||
Net Assets | 100.00 | % | ||
Percentages are stated as a percent of net assets. | ||||
(a) | Exchange-Traded. |
(b) | Purchased option contracts are held in connection with corresponding option contracts written short. |
(c) | The U.S. Bank Money Market Deposit Account (the “MMDA”) is a short-term investment vehicle in which the Fund holds cash balances. The MMDA will bear interest at a variable rate that is determined based on conditions and may change daily and by any amount. The rate shown is as of April 30, 2022. |
INNOVATOR U.S. EQUITY ULTRA BUFFER ETF – DECEMBER
Schedule of Options Written (a)
April 30, 2022 (Unaudited)
| Description (a) | Expiration | Strike Price | Contracts | Notional Amount | Value | |||||||||||||
Call Options | ||||||||||||||||||
SPY SPDR S&P 500® Trust ETF | 11/30/2022 | $ | 489.18 | 1,064 | $ | (43,836,800 | ) | $ | (366,428 | ) | ||||||||
| (366,428 | ) | |||||||||||||||||
Put Options | ||||||||||||||||||
SPY SPDR S&P 500® Trust ETF | 11/30/2022 | 296.11 | 1,064 | (43,836,800 | ) | (653,068 | ) | |||||||||||
| (653,068 | ) | |||||||||||||||||
Total Options Written (Premiums Received $2,703,192) | $ | (1,019,496 | ) | |||||||||||||||
(a) | Exchange-Traded. |
INNOVATOR ETFs TRUST
Statements of Assets and Liabilities
April 30, 2022 (Unaudited)
Innovator U.S. Equity Buffer ETF - January | Innovator U.S. Equity Buffer ETF - February | Innovator U.S. Equity Buffer ETF - March | Innovator U.S. Equity Buffer ETF - April | |||||||||||||
Assets: | �� | |||||||||||||||
Investments, at value (a) | $ | 214,459,167 | $ | 125,941,177 | $ | 93,645,482 | $ | 136,444,868 | ||||||||
Interest receivable | 82 | 50 | 42 | 63 | ||||||||||||
Deposit at broker for options | 150 | 201 | 199 | 200 | ||||||||||||
Total Assets | 214,459,399 | 125,941,428 | 93,645,723 | 136,445,131 | ||||||||||||
Liabilities: | ||||||||||||||||
Options written, at value (b) | 18,793,110 | 9,459,023 | 6,638,141 | 11,359,930 | ||||||||||||
Payable to Adviser | 137,645 | 77,392 | 58,236 | 82,701 | ||||||||||||
Total Liabilities | 18,930,755 | 9,536,415 | 6,696,377 | 11,442,631 | ||||||||||||
Net Assets | $ | 195,528,644 | $ | 116,405,013 | $ | 86,949,346 | $ | 125,002,500 | ||||||||
Net Assets Consist of: | ||||||||||||||||
Capital stock | $ | 192,949,570 | $ | 110,805,226 | $ | 81,581,218 | $ | 117,729,571 | ||||||||
Total distributable earnings/(accumulated deficit) | 2,579,074 | 5,599,787 | 5,368,128 | 7,272,929 | ||||||||||||
Net Assets | $ | 195,528,644 | $ | 116,405,013 | $ | 86,949,346 | $ | 125,002,500 | ||||||||
Net Asset Value: | ||||||||||||||||
Net assets | $ | 195,528,644 | $ | 116,405,013 | $ | 86,949,346 | $ | 125,002,500 | ||||||||
Shares of beneficial interest outstanding (unlimited shares without par value authorized) | 5,775,000 | 3,850,000 | 2,650,000 | 3,950,000 | ||||||||||||
Net asset value price per share | $ | 33.86 | $ | 30.24 | $ | 32.81 | $ | 31.65 | ||||||||
(a) Cost of investments | $ | 226,281,459 | $ | 131,817,813 | $ | 97,207,280 | $ | 142,383,407 | ||||||||
(b) Premiums received | 14,911,180 | 8,842,515 | 6,722,043 | 8,802,768 | ||||||||||||
INNOVATOR ETFs TRUST
Statements of Assets and Liabilities
April 30, 2022 (Unaudited)
Innovator U.S. Equity Buffer ETF - May | Innovator U.S. Equity Buffer ETF - June | Innovator U.S. Equity Buffer ETF - July | Innovator U.S. Equity Buffer ETF - August | |||||||||||||
Assets: | ||||||||||||||||
Investments, at value (a) | $ | 65,289,803 | $ | 58,572,512 | $ | 96,979,017 | $ | 117,183,501 | ||||||||
Interest receivable | 4 | 6 | 12 | 20 | ||||||||||||
ETF variable fee receivable | – | – | 1,549 | – | ||||||||||||
Receivable for investments sold | 65,480,845 | – | 121,194 | – | ||||||||||||
Receivable for fund shares sold | – | – | 3,892,470 | – | ||||||||||||
Deposit at broker for options | – | 108 | 202 | 100 | ||||||||||||
Total Assets | 130,770,652 | 58,572,626 | 100,994,444 | 117,183,621 | ||||||||||||
Liabilities: | ||||||||||||||||
Options written, at value (b) | 4,434,234 | 670,324 | 2,433,915 | 4,397,604 | ||||||||||||
Payable to Adviser | 45,393 | 39,620 | 55,000 | 76,339 | ||||||||||||
Payable for investments purchased | 65,255,253 | – | 3,998,566 | – | ||||||||||||
Due to broker for options | 2,999 | – | – | – | ||||||||||||
Total Liabilities | 69,737,879 | 709,944 | 6,487,481 | 4,473,943 | ||||||||||||
Net Assets | $ | 61,032,773 | $ | 57,862,682 | $ | 94,506,963 | $ | 112,709,678 | ||||||||
Net Assets Consist of: | ||||||||||||||||
Capital stock | $ | 58,764,815 | $ | 56,394,464 | $ | 90,745,034 | $ | 116,148,426 | ||||||||
Total distributable earnings/(accumulated deficit) | 2,267,958 | 1,468,218 | 3,761,929 | (3,438,748 | ) | |||||||||||
Net Assets | $ | 61,032,773 | $ | 57,862,682 | $ | 94,506,963 | $ | 112,709,678 | ||||||||
Net Asset Value: | ||||||||||||||||
Net assets | $ | 61,032,773 | $ | 57,862,682 | $ | 94,506,963 | $ | 112,709,678 | ||||||||
Shares of beneficial interest outstanding (unlimited shares without par value authorized) | 2,025,000 | 1,800,000 | 3,050,000 | 3,675,000 | ||||||||||||
Net asset value price per share | $ | 30.14 | $ | 32.15 | $ | 30.99 | $ | 30.67 | ||||||||
(a) Cost of investments | $ | 65,295,914 | $ | 61,027,257 | $ | 99,934,499 | $ | 122,165,929 | ||||||||
(b) Premiums received | 4,428,101 | 3,553,510 | 5,530,057 | 6,179,294 | ||||||||||||
INNOVATOR ETFs TRUST
Statements of Assets and Liabilities
April 30, 2022 (Unaudited)
Innovator U.S. Equity Buffer ETF - September | Innovator U.S. Equity Buffer ETF - October | Innovator U.S. Equity Buffer ETF - November | Innovator U.S. Equity Buffer ETF - December | |||||||||||||
Assets: | ||||||||||||||||
Investments, at value (a) | $ | 149,300,324 | $ | 95,654,804 | $ | 80,035,373 | $ | 97,206,487 | ||||||||
Interest receivable | 33 | 26 | 23 | 32 | ||||||||||||
Deposit at broker for options | 111 | 99 | 78 | 199 | ||||||||||||
Total Assets | 149,300,468 | 95,654,929 | 80,035,474 | 97,206,718 | ||||||||||||
Liabilities: | ||||||||||||||||
Options written, at value (b) | 7,786,876 | 4,518,872 | 5,495,844 | 6,740,495 | ||||||||||||
Payable to Adviser | 97,360 | 62,034 | 50,182 | 61,349 | ||||||||||||
Total Liabilities | 7,884,236 | 4,580,906 | 5,546,026 | 6,801,844 | ||||||||||||
Net Assets | $ | 141,416,232 | $ | 91,074,023 | $ | 74,489,448 | $ | 90,404,874 | ||||||||
Net Assets Consist of: | ||||||||||||||||
Capital stock | $ | 148,022,743 | $ | 92,704,035 | $ | 80,067,330 | $ | 95,999,950 | ||||||||
Total distributable earnings/(accumulated deficit) | (6,606,511 | ) | (1,630,012 | ) | (5,577,882 | ) | (5,595,076 | ) | ||||||||
Net Assets | $ | 141,416,232 | $ | 91,074,023 | $ | 74,489,448 | $ | 90,404,874 | ||||||||
Net Asset Value: | ||||||||||||||||
Net assets | $ | 141,416,232 | $ | 91,074,023 | $ | 74,489,448 | $ | 90,404,874 | ||||||||
Shares of beneficial interest outstanding (unlimited shares without par value authorized) | 4,625,000 | 2,850,000 | 2,475,000 | 2,825,000 | ||||||||||||
Net asset value price per share | $ | 30.58 | $ | 31.96 | $ | 30.10 | $ | 32.00 | ||||||||
(a) Cost of investments | $ | 156,030,800 | $ | 99,601,199 | $ | 84,666,617 | $ | 102,635,156 | ||||||||
(b) Premiums received | 9,690,365 | 6,669,153 | 5,391,273 | 7,017,602 | ||||||||||||
INNOVATOR ETFs TRUST
Statements of Assets and Liabilities
April 30, 2022 (Unaudited)
Innovator U.S. Equity Power Buffer ETF - January | Innovator U.S. Equity Power Buffer ETF - February | Innovator U.S. Equity Power Buffer ETF - March | Innovator U.S. Equity Power Buffer ETF - April | |||||||||||||
Assets: | ||||||||||||||||
Investments, at value (a) | $ | 587,041,871 | $ | 324,936,138 | $ | 254,046,933 | $ | 332,713,537 | ||||||||
Cash | 2,372 | – | – | – | ||||||||||||
Interest receivable | 216 | 134 | 112 | 148 | ||||||||||||
ETF variable fee receivable | 3,100 | – | – | – | ||||||||||||
Receivable for investments sold | 430,739 | – | – | – | ||||||||||||
Receivable for fund shares sold | 6,200,520 | – | – | – | ||||||||||||
Deposit at broker for options | 133 | 180 | 232 | 200 | ||||||||||||
Total Assets | 593,678,951 | 324,936,452 | 254,047,277 | 332,713,885 | ||||||||||||
Liabilities: | ||||||||||||||||
Options written, at value (b) | 37,928,541 | 19,502,896 | 15,664,621 | 22,495,252 | ||||||||||||
Payable to Adviser | 364,153 | 204,647 | 157,449 | 178,772 | ||||||||||||
Payable for investments purchased | 6,638,435 | – | – | – | ||||||||||||
Total Liabilities | 44,931,129 | 19,707,543 | 15,822,070 | 22,674,024 | ||||||||||||
Net Assets | $ | 548,747,822 | $ | 305,228,909 | $ | 238,225,207 | $ | 310,039,861 | ||||||||
Net Assets Consist of: | ||||||||||||||||
Capital stock | $ | 553,761,107 | $ | 299,484,067 | $ | 232,214,662 | $ | 303,694,530 | ||||||||
Total distributable earnings/(accumulated deficit) | (5,013,285 | ) | 5,744,842 | 6,010,545 | 6,345,331 | |||||||||||
Net Assets | $ | 548,747,822 | $ | 305,228,909 | $ | 238,225,207 | $ | 310,039,861 | ||||||||
Net Asset Value: | ||||||||||||||||
Net assets | $ | 548,747,822 | $ | 305,228,909 | $ | 238,225,207 | $ | 310,039,861 | ||||||||
Shares of beneficial interest outstanding (unlimited shares without par value authorized) | 17,700,000 | 10,925,000 | 7,750,000 | 11,025,000 | ||||||||||||
Net asset value price per share | $ | 31.00 | $ | 27.94 | $ | 30.74 | $ | 28.12 | ||||||||
(a) Cost of investments | $ | 617,047,035 | $ | 340,013,311 | $ | 263,482,061 | $ | 346,833,341 | ||||||||
(b) Premiums received | 39,270,958 | 22,114,076 | 18,291,598 | 21,258,554 | ||||||||||||
INNOVATOR ETFs TRUST
Statements of Assets and Liabilities
April 30, 2022 (Unaudited)
Innovator U.S. Equity Power Buffer ETF - May | Innovator U.S. Equity Power Buffer ETF - June | Innovator U.S. Equity Power Buffer ETF - July | Innovator U.S. Equity Power Buffer ETF - August | |||||||||||||
Assets: | ||||||||||||||||
Investments, at value (a) | $ | 215,390,046 | $ | 138,566,269 | $ | 172,140,729 | $ | 181,107,036 | ||||||||
Cash | 1,103 | – | 375 | – | ||||||||||||
Interest receivable | 11 | 14 | 22 | 31 | ||||||||||||
ETF variable fee receivable | 13,969 | – | – | 723 | ||||||||||||
Receivable for investments sold | 366,503,418 | – | – | 1,502,007 | ||||||||||||
Receivable for fund shares sold | 27,938,625 | – | – | – | ||||||||||||
Deposit at broker for options | 91 | 101 | 195 | 102 | ||||||||||||
Total Assets | 609,847,263 | 138,566,384 | 172,141,321 | 182,609,899 | ||||||||||||
Liabilities: | ||||||||||||||||
Options written, at value (b) | 14,655,640 | 924,221 | 2,660,472 | 4,497,900 | ||||||||||||
Payable for fund shares redeemed | 178,485,816 | – | – | 1,446,840 | ||||||||||||
Payable to Adviser | 129,149 | 92,495 | 107,476 | 112,867 | ||||||||||||
Payable for investments purchased | 215,319,495 | – | – | 37,539 | ||||||||||||
Total Liabilities | 408,590,100 | 1,016,716 | 2,767,948 | 6,095,146 | ||||||||||||
Net Assets | $ | 201,257,163 | $ | 137,549,668 | $ | 169,373,373 | $ | 176,514,753 | ||||||||
Net Assets Consist of: | ||||||||||||||||
Capital stock | $ | 195,310,251 | $ | 134,913,189 | $ | 167,319,121 | $ | 178,453,533 | ||||||||
Total distributable earnings/(accumulated deficit) | 5,946,912 | 2,636,479 | 2,054,252 | (1,938,780 | ) | |||||||||||
Net Assets | $ | 201,257,163 | $ | 137,549,668 | $ | 169,373,373 | $ | 176,514,753 | ||||||||
Net Asset Value: | ||||||||||||||||
Net assets | $ | 201,257,163 | $ | 137,549,668 | $ | 169,373,373 | $ | 176,514,753 | ||||||||
Shares of beneficial interest outstanding (unlimited shares without par value authorized) | 7,025,000 | 4,450,000 | 5,750,000 | 6,100,000 | ||||||||||||
Net asset value price per share | $ | 28.65 | $ | 30.91 | $ | 29.46 | $ | 28.94 | ||||||||
(a) Cost of investments | $ | 215,410,114 | $ | 143,436,732 | $ | 178,273,225 | $ | 188,881,677 | ||||||||
(b) Premiums received | 14,635,497 | 8,656,983 | 10,505,170 | 11,019,198 | ||||||||||||
INNOVATOR ETFs TRUST
Statements of Assets and Liabilities
April 30, 2022 (Unaudited)
Innovator U.S. Equity Power Buffer ETF - September | Innovator U.S. Equity Power Buffer ETF - October | Innovator U.S. Equity Power Buffer ETF - November | Innovator U.S. Equity Power Buffer ETF - December | |||||||||||||
Assets: | ||||||||||||||||
Investments, at value (a) | $ | 281,594,140 | $ | 193,603,577 | $ | 213,694,739 | $ | 238,508,592 | ||||||||
Interest receivable | 62 | 51 | 62 | 80 | ||||||||||||
Receivable for investments sold | – | – | 846,863 | – | ||||||||||||
Deposit at broker for options | 6 | 97 | 766,521 | 200 | ||||||||||||
Total Assets | 281,594,208 | 193,603,725 | 215,308,185 | 238,508,872 | ||||||||||||
Liabilities: | ||||||||||||||||
Options written, at value (b) | 9,750,071 | 7,493,477 | 10,561,458 | 12,241,525 | ||||||||||||
Payable to Adviser | 181,157 | 123,719 | 134,026 | 152,227 | ||||||||||||
Payable for investments purchased | – | – | 1,613,288 | – | ||||||||||||
Total Liabilities | 9,931,228 | 7,617,196 | 12,308,772 | 12,393,752 | ||||||||||||
Net Assets | $ | 271,662,980 | $ | 185,986,529 | $ | 202,999,413 | $ | 226,115,120 | ||||||||
Net Assets Consist of: | ||||||||||||||||
Capital stock | $ | 279,791,339 | $ | 187,702,244 | $ | 212,838,858 | $ | 236,582,092 | ||||||||
Total distributable earnings/(accumulated deficit) | (8,128,359 | ) | (1,715,715 | ) | (9,839,445 | ) | (10,466,972 | ) | ||||||||
Net Assets | $ | 271,662,980 | $ | 185,986,529 | $ | 202,999,413 | $ | 226,115,120 | ||||||||
Net Asset Value: | ||||||||||||||||
Net assets | $ | 271,662,980 | $ | 185,986,529 | $ | 202,999,413 | $ | 226,115,120 | ||||||||
Shares of beneficial interest outstanding (unlimited shares without par value authorized) | 9,475,000 | 6,425,000 | 6,975,000 | 7,625,000 | ||||||||||||
Net asset value price per share | $ | 28.67 | $ | 28.95 | $ | 29.10 | $ | 29.65 | ||||||||
(a) Cost of investments | $ | 295,477,544 | $ | 200,474,247 | $ | 226,545,029 | $ | 252,636,135 | ||||||||
(b) Premiums received | 17,389,911 | 14,094,657 | 13,586,063 | 17,467,076 | ||||||||||||
INNOVATOR ETFs TRUST
Statements of Assets and Liabilities
April 30, 2022 (Unaudited)
Innovator U.S. Equity Ultra Buffer ETF - January | Innovator U.S. Equity Ultra Buffer ETF - February | Innovator U.S. Equity Ultra Buffer ETF - March | Innovator U.S. Equity Ultra Buffer ETF - April | |||||||||||||
Assets: | ||||||||||||||||
Investments, at value (a) | $ | 280,992,031 | $ | 43,098,889 | $ | 41,579,306 | $ | 54,565,635 | ||||||||
Interest receivable | 101 | 18 | 19 | 24 | ||||||||||||
Deposit at broker for options | 195 | 200 | 199 | 200 | ||||||||||||
Total Assets | 280,992,327 | 43,099,107 | 41,579,524 | 54,565,859 | ||||||||||||
Liabilities: | ||||||||||||||||
Options written, at value (b) | 6,267,959 | 1,268,500 | 1,614,018 | 1,835,627 | ||||||||||||
Payable to Adviser | 169,339 | 27,045 | 26,308 | 29,995 | ||||||||||||
Total Liabilities | 6,437,298 | 1,295,545 | 1,640,326 | 1,865,622 | ||||||||||||
Net Assets | $ | 274,555,029 | $ | 41,803,562 | $ | 39,939,198 | $ | 52,700,237 | ||||||||
Net Assets Consist of: | ||||||||||||||||
Capital stock | $ | 276,992,133 | $ | 41,026,288 | $ | 38,406,726 | $ | 50,748,613 | ||||||||
Total distributable earnings/(accumulated deficit) | (2,437,104 | ) | 777,274 | 1,532,472 | 1,951,624 | |||||||||||
Net Assets | $ | 274,555,029 | $ | 41,803,562 | $ | 39,939,198 | $ | 52,700,237 | ||||||||
Net Asset Value: | ||||||||||||||||
Net assets | $ | 274,555,029 | $ | 41,803,562 | $ | 39,939,198 | $ | 52,700,237 | ||||||||
Shares of beneficial interest outstanding (unlimited shares without par value authorized) | 9,250,000 | 1,550,000 | 1,375,000 | 2,075,000 | ||||||||||||
Net asset value price per share | $ | 29.68 | $ | 26.97 | $ | 29.05 | $ | 25.40 | ||||||||
(a) Cost of investments | $ | 294,639,758 | $ | 45,361,772 | $ | 43,365,142 | $ | 57,285,763 | ||||||||
(b) Premiums received | 10,284,900 | 2,205,255 | 2,402,508 | 2,582,804 | ||||||||||||
INNOVATOR ETFs TRUST
Statements of Assets and Liabilities
April 30, 2022 (Unaudited)
Innovator U.S. Equity Ultra Buffer ETF - May | Innovator U.S. Equity Ultra Buffer ETF - June | Innovator U.S. Equity Ultra Buffer ETF - July | Innovator U.S. Equity Ultra Buffer ETF - August | |||||||||||||
Assets: | ||||||||||||||||
Investments, at value (a) | $ | 31,391,266 | $ | 16,932,411 | $ | 36,582,711 | $ | 26,002,974 | ||||||||
Interest receivable | 1 | 3 | 5 | 4 | ||||||||||||
Receivable for investments sold | 31,476,767 | – | – | – | ||||||||||||
Deposit at broker for options | – | 100 | 195 | 89 | ||||||||||||
Total Assets | 62,868,034 | 16,932,514 | 36,582,911 | 26,003,067 | ||||||||||||
Liabilities: | ||||||||||||||||
Options written, at value (b) | 1,731,714 | 62,905 | 272,255 | 250,074 | ||||||||||||
Payable to Adviser | 21,681 | 11,795 | 22,763 | 17,556 | ||||||||||||
Payable for investments purchased | 31,388,297 | – | – | – | ||||||||||||
Due to broker for options | 1,343 | – | – | – | ||||||||||||
Total Liabilities | 33,143,035 | 74,700 | 295,018 | 267,630 | ||||||||||||
Net Assets | $ | 29,724,999 | $ | 16,857,814 | $ | 36,287,893 | $ | 25,735,437 | ||||||||
Net Assets Consist of: | ||||||||||||||||
Capital stock | $ | 29,005,247 | $ | 16,770,951 | $ | 36,455,547 | $ | 26,195,642 | ||||||||
Total distributable earnings/(accumulated deficit) | 719,752 | 86,863 | (167,654 | ) | (460,205 | ) | ||||||||||
Net Assets | $ | 29,724,999 | $ | 16,857,814 | $ | 36,287,893 | $ | 25,735,437 | ||||||||
Net Asset Value: | ||||||||||||||||
Net assets | $ | 29,724,999 | $ | 16,857,814 | $ | 36,287,893 | $ | 25,735,437 | ||||||||
Shares of beneficial interest outstanding (unlimited shares without par value authorized) | 1,100,000 | 600,000 | 1,375,000 | 925,000 | ||||||||||||
Net asset value price per share | $ | 27.02 | $ | 28.10 | $ | 26.39 | $ | 27.82 | ||||||||
(a) Cost of investments | $ | 31,394,246 | $ | 17,585,120 | $ | 38,148,639 | $ | 27,429,032 | ||||||||
(b) Premiums received | 1,728,726 | 800,909 | 1,770,796 | 1,321,797 | ||||||||||||
INNOVATOR ETFs TRUST
Statements of Assets and Liabilities
April 30, 2022 (Unaudited)
Innovator U.S. Equity Ultra Buffer ETF - September | Innovator U.S. Equity Ultra Buffer ETF - October | Innovator U.S. Equity Ultra Buffer ETF - November | Innovator U.S. Equity Ultra Buffer ETF - December | |||||||||||||
Assets: | ||||||||||||||||
Investments, at value (a) | $ | 61,076,804 | $ | 63,056,593 | $ | 44,202,799 | $ | 47,516,471 | ||||||||
Interest receivable | 13 | 17 | 13 | 16 | ||||||||||||
Deposit at broker for options | 105 | 100 | 99 | 199 | ||||||||||||
Total Assets | 61,076,922 | 63,056,710 | 44,202,911 | 47,516,686 | ||||||||||||
Liabilities: | ||||||||||||||||
Options written, at value (b) | 695,177 | 1,565,106 | 794,759 | 1,019,496 | ||||||||||||
Payable to Adviser | 40,688 | 41,179 | 28,289 | 31,037 | ||||||||||||
Total Liabilities | 735,865 | 1,606,285 | 823,048 | 1,050,533 | ||||||||||||
Net Assets | $ | 60,341,057 | $ | 61,450,425 | $ | 43,379,863 | $ | 46,466,153 | ||||||||
Net Assets Consist of: | ||||||||||||||||
Capital stock | $ | 62,678,339 | $ | 62,716,187 | $ | 45,362,661 | $ | 48,478,973 | ||||||||
Total distributable earnings/(accumulated deficit) | (2,337,282 | ) | (1,265,762 | ) | (1,982,798 | ) | (2,012,820 | ) | ||||||||
Net Assets | $ | 60,341,057 | $ | 61,450,425 | $ | 43,379,863 | $ | 46,466,153 | ||||||||
Net Asset Value: | ||||||||||||||||
Net assets | $ | 60,341,057 | $ | 61,450,425 | $ | 43,379,863 | $ | 46,466,153 | ||||||||
Shares of beneficial interest outstanding (unlimited shares without par value authorized) | 2,225,000 | 2,250,000 | 1,550,000 | 1,625,000 | ||||||||||||
Net asset value price per share | $ | 27.12 | $ | 27.31 | $ | 27.99 | $ | 28.59 | ||||||||
(a) Cost of investments | $ | 64,945,391 | $ | 65,698,963 | $ | 47,236,841 | $ | 50,793,067 | ||||||||
(b) Premiums received | 2,791,843 | 3,858,972 | 2,214,835 | 2,703,192 | ||||||||||||
INNOVATOR ETFs TRUST
Statements of Operations
For the Period Ended April 30, 2022 (Unaudited)
Innovator U.S. Equity Buffer ETF - January | Innovator U.S. Equity Buffer ETF - February | Innovator U.S. Equity Buffer ETF - March | Innovator U.S. Equity Buffer ETF - April | |||||||||||||
Investment Income: | ||||||||||||||||
Interest | $ | 120 | $ | 69 | $ | 55 | $ | 221 | ||||||||
Total Investment Income | 120 | 69 | 55 | 221 | ||||||||||||
Expenses: | ||||||||||||||||
Investment advisory fee | 725,122 | 342,790 | 266,424 | 468,303 | ||||||||||||
Total Expenses | 725,122 | 342,790 | 266,424 | 468,303 | ||||||||||||
Net Investment Income/(Loss) | (725,002 | ) | (342,721 | ) | (266,369 | ) | (468,082 | ) | ||||||||
Realized & Unrealized Gain/(Loss): | ||||||||||||||||
Net realized gain/(loss) on: | ||||||||||||||||
Investments | (7,876,357 | ) | 526,724 | (1,557,053 | ) | 2,041,263 | ||||||||||
Redemptions sold in-kind on investments | 33,024,293 | 9,098,357 | 6,719,712 | 7,581,912 | ||||||||||||
Redemptions sold in-kind on options written | 6,841,451 | 4,429,411 | 4,046,196 | 6,598,362 | ||||||||||||
Options written | (11,951,723 | ) | (1,618,838 | ) | (96,462 | ) | 15,173 | |||||||||
Net change in unrealized appreciation/(depreciation) on: | ||||||||||||||||
Investments | (35,049,373 | ) | (17,384,435 | ) | (11,182,548 | ) | (16,911,061 | ) | ||||||||
Options written | (1,548,769 | ) | (621,439 | ) | (274,442 | ) | (1,854,280 | ) | ||||||||
Net Realized and Unrealized Gain/(Loss) on Investments and Options Written | (16,560,478 | ) | (5,570,220 | ) | (2,344,597 | ) | (2,528,631 | ) | ||||||||
Net Increase/(Decrease) in Net Assets Resulting From Operations | $ | (17,285,480 | ) | $ | (5,912,941 | ) | $ | (2,610,966 | ) | $ | (2,996,713 | ) | ||||
INNOVATOR ETFs TRUST
Statements of Operations
For the Period Ended April 30, 2022 (Unaudited)
Innovator U.S. Equity Buffer ETF - May | Innovator U.S. Equity Buffer ETF - June | Innovator U.S. Equity Buffer ETF - July | Innovator U.S. Equity Buffer ETF - August | |||||||||||||
Investment Income: | ||||||||||||||||
Interest | $ | 8 | $ | 12 | $ | 23 | $ | 33 | ||||||||
Total Investment Income | 8 | 12 | 23 | 33 | ||||||||||||
Expenses: | ||||||||||||||||
Investment advisory fee | 279,395 | 256,489 | 385,183 | 354,823 | ||||||||||||
Total Expenses | 279,395 | 256,489 | 385,183 | 354,823 | ||||||||||||
Net Investment Income/(Loss) | (279,387 | ) | (256,477 | ) | (385,160 | ) | (354,790 | ) | ||||||||
Realized & Unrealized Gain/(Loss): | ||||||||||||||||
Net realized gain/(loss) on: | ||||||||||||||||
Investments | (4,570,152 | ) | 272,932 | 3,662,140 | (102,160 | ) | ||||||||||
Redemptions sold in-kind on investments | 2,878,118 | 1,000,943 | 577,855 | 47,222 | ||||||||||||
Redemptions sold in-kind on options written | 4,013,700 | (61,348 | ) | 48,797 | 8,178 | |||||||||||
Options written | 237,924 | 83,727 | (282,362 | ) | 163,541 | |||||||||||
Net change in unrealized appreciation/(depreciation) on: | ||||||||||||||||
Investments | (4,826,104 | ) | (7,100,987 | ) | (9,903,835 | ) | (7,699,904 | ) | ||||||||
Options written | (1,269,028 | ) | 2,738,682 | 2,658,964 | 1,781,690 | |||||||||||
Net Realized and Unrealized Gain/(Loss) on Investments and Options Written | (3,535,542 | ) | (3,066,051 | ) | (3,238,441 | ) | (5,801,433 | ) | ||||||||
Net Increase/(Decrease) in Net Assets Resulting From Operations | $ | (3,814,929 | ) | $ | (3,322,528 | ) | $ | (3,623,601 | ) | $ | (6,156,223 | ) | ||||
INNOVATOR ETFs TRUST
Statements of Operations
For the Period Ended April 30, 2022 (Unaudited)
Innovator U.S. Equity Buffer ETF - September | Innovator U.S. Equity Buffer ETF - October | Innovator U.S. Equity Buffer ETF - November | Innovator U.S. Equity Buffer ETF - December | |||||||||||||
Investment Income: | ||||||||||||||||
Interest | $ | 54 | $ | 42 | $ | 38 | $ | 47 | ||||||||
Total Investment Income | 54 | 42 | 38 | 47 | ||||||||||||
Expenses: | ||||||||||||||||
Investment advisory fee | 588,876 | 411,955 | 315,080 | 317,030 | ||||||||||||
Total Expenses | 588,876 | 411,955 | 315,080 | 317,030 | ||||||||||||
Net Investment Income/(Loss) | (588,822 | ) | (411,913 | ) | (315,042 | ) | (316,983 | ) | ||||||||
Realized & Unrealized Gain/(Loss): | ||||||||||||||||
Net realized gain/(loss) on: | ||||||||||||||||
Investments | (1,068,018 | ) | (522,392 | ) | (448,378 | ) | (13,531,318 | ) | ||||||||
Redemptions sold in-kind on investments | – | 845,536 | – | – | ||||||||||||
Redemptions sold in-kind on options written | – | 434,628 | – | – | ||||||||||||
Options written | (122,685 | ) | (179,758 | ) | (78,646 | ) | (7,032,562 | ) | ||||||||
Net change in unrealized appreciation/(depreciation) on: | ||||||||||||||||
Investments | (8,446,469 | ) | (7,894,338 | ) | (4,627,525 | ) | 6,459,120 | |||||||||
Options written | 686,740 | 2,153,791 | (100,841 | ) | 8,826,667 | |||||||||||
Net Realized and Unrealized Gain/(Loss) on Investments and Options Written | (8,950,432 | ) | (5,162,533 | ) | (5,255,390 | ) | (5,278,093 | ) | ||||||||
Net Increase/(Decrease) in Net Assets Resulting From Operations | $ | (9,539,254 | ) | $ | (5,574,446 | ) | $ | (5,570,432 | ) | $ | (5,595,076 | ) | ||||
INNOVATOR ETFs TRUST
Statements of Operations
For the Period Ended April 30, 2022 (Unaudited)
Innovator U.S. Equity Power Buffer ETF - January | Innovator U.S. Equity Power Buffer ETF - February | Innovator U.S. Equity Power Buffer ETF - March | Innovator U.S. Equity Power Buffer ETF - April | |||||||||||||
Investment Income: | ||||||||||||||||
Interest | $ | 310 | $ | 186 | $ | 148 | $ | 157 | ||||||||
Total Investment Income | 310 | 186 | 148 | 157 | ||||||||||||
Expenses: | ||||||||||||||||
Investment advisory fee | 1,724,529 | 845,356 | 578,652 | 861,519 | ||||||||||||
Total Expenses | 1,724,529 | 845,356 | 578,652 | 861,519 | ||||||||||||
Net Investment Income/(Loss) | (1,724,219 | ) | (845,170 | ) | (578,504 | ) | (861,362 | ) | ||||||||
Realized & Unrealized Gain/(Loss): | ||||||||||||||||
Net realized gain/(loss) on: | ||||||||||||||||
Investments | (11,094,300 | ) | 992,795 | (3,450,983 | ) | 6,557,106 | ||||||||||
Redemptions sold in-kind on investments | 68,363,246 | 21,110,778 | 13,816,877 | 16,138,720 | ||||||||||||
Redemptions sold in-kind on options written | 10,886,368 | 5,856,708 | 4,574,382 | 10,306,320 | ||||||||||||
Options written | (42,781,632 | ) | (8,498,652 | ) | (1,543,075 | ) | (9,979,888 | ) | ||||||||
Net change in unrealized appreciation/(depreciation) on: | ||||||||||||||||
Investments | (74,119,154 | ) | (40,692,045 | ) | (24,544,190 | ) | (38,669,914 | ) | ||||||||
Options written | 17,648,136 | 9,914,448 | 7,035,655 | 7,249,810 | ||||||||||||
Net Realized and Unrealized Gain/(Loss) on Investments and Options Written | (31,097,336 | ) | (11,315,968 | ) | (4,111,334 | ) | (8,397,846 | ) | ||||||||
Net Increase/(Decrease) in Net Assets Resulting From Operations | $ | (32,821,555 | ) | $ | (12,161,138 | ) | $ | (4,689,838 | ) | $ | (9,259,208 | ) | ||||
INNOVATOR ETFs TRUST
Statements of Operations
For the Period Ended April 30, 2022 (Unaudited)
Innovator U.S. Equity Power Buffer ETF - May | Innovator U.S. Equity Power Buffer ETF - June | Innovator U.S. Equity Power Buffer ETF - July | Innovator U.S. Equity Power Buffer ETF - August | |||||||||||||
Investment Income: | ||||||||||||||||
Interest | $ | 23 | $ | 25 | $ | 41 | $ | 52 | ||||||||
Total Investment Income | 23 | 25 | 41 | 52 | ||||||||||||
Expenses: | ||||||||||||||||
Investment advisory fee | 832,608 | 572,933 | 738,412 | 695,460 | ||||||||||||
Total Expenses | 832,608 | 572,933 | 738,412 | 695,460 | ||||||||||||
Net Investment Income/(Loss) | (832,585 | ) | (572,908 | ) | (738,371 | ) | (695,408 | ) | ||||||||
Realized & Unrealized Gain/(Loss): | ||||||||||||||||
Net realized gain/(loss) on: | ||||||||||||||||
Investments | (13,710,551 | ) | 357,739 | 1,326,969 | (175,510 | ) | ||||||||||
Redemptions sold in-kind on investments | 8,463,751 | 104,959 | 35,321 | 115,553 | ||||||||||||
Redemptions sold in-kind on options written | 11,866,774 | 85,282 | 41,724 | 6,935 | ||||||||||||
Options written | 199,735 | (200,894 | ) | (323,592 | ) | 62,992 | ||||||||||
Net change in unrealized appreciation/(depreciation) on: | ||||||||||||||||
Investments | (14,438,526 | ) | (14,355,777 | ) | (15,624,106 | ) | (12,316,351 | ) | ||||||||
Options written | 1,644,083 | 10,413,893 | 10,390,546 | 6,978,283 | ||||||||||||
Net Realized and Unrealized Gain/(Loss) on Investments and Options Written | (5,974,734 | ) | (3,594,798 | ) | (4,153,138 | ) | (5,328,098 | ) | ||||||||
Net Increase/(Decrease) in Net Assets Resulting From Operations | $ | (6,807,319 | ) | $ | (4,167,706 | ) | $ | (4,891,509 | ) | $ | (6,023,506 | ) | ||||
INNOVATOR ETFs TRUST
Statements of Operations
For the Period Ended April 30, 2022 (Unaudited)
Innovator U.S. Equity Power Buffer ETF - September | Innovator U.S. Equity Power Buffer ETF - October | Innovator U.S. Equity Power Buffer ETF - November | Innovator U.S. Equity Power Buffer ETF - December | |||||||||||||
Investment Income: | ||||||||||||||||
Interest | $ | 99 | $ | 81 | $ | 96 | $ | 120 | ||||||||
Total Investment Income | 99 | 81 | 96 | 120 | ||||||||||||
Expenses: | ||||||||||||||||
Investment advisory fee | 1,077,115 | 766,932 | 779,136 | 790,825 | ||||||||||||
Total Expenses | 1,077,115 | 766,932 | 779,136 | 790,825 | ||||||||||||
Net Investment Income/(Loss) | (1,077,016 | ) | (766,851 | ) | (779,040 | ) | (790,705 | ) | ||||||||
Realized & Unrealized Gain/(Loss): | ||||||||||||||||
Net realized gain/(loss) on: | ||||||||||||||||
Investments | (574,230 | ) | 174,511 | (527,138 | ) | (27,103,403 | ) | |||||||||
Redemptions sold in-kind on investments | – | – | 902,972 | – | ||||||||||||
Redemptions sold in-kind on options written | – | – | 462,227 | – | ||||||||||||
Options written | (233,549 | ) | (853,884 | ) | (72,780 | ) | (18,488,553 | ) | ||||||||
Net change in unrealized appreciation/(depreciation) on: | ||||||||||||||||
Investments | (16,747,904 | ) | (14,525,849 | ) | (12,840,640 | ) | 9,828,493 | |||||||||
Options written | 6,466,172 | 9,211,348 | 3,034,282 | 26,087,193 | ||||||||||||
Net Realized and Unrealized Gain/(Loss) on Investments and Options Written | (11,089,511 | ) | (5,993,874 | ) | (9,041,077 | ) | (9,676,270 | ) | ||||||||
Net Increase/(Decrease) in Net Assets Resulting From Operations | $ | (12,166,527 | ) | $ | (6,760,725 | ) | $ | (9,820,117 | ) | $ | (10,466,975 | ) | ||||
INNOVATOR ETFs TRUST
Statements of Operations
For the Period Ended April 30, 2022 (Unaudited)
Innovator U.S. Equity Ultra Buffer ETF - January | Innovator U.S. Equity Ultra Buffer ETF - February | Innovator U.S. Equity Ultra Buffer ETF - March | Innovator U.S. Equity Ultra Buffer ETF - April | |||||||||||||
Investment Income: | ||||||||||||||||
Interest | $ | 139 | $ | 24 | $ | 25 | $ | 26 | ||||||||
Total Investment Income | 139 | 24 | 25 | 26 | ||||||||||||
Expenses: | ||||||||||||||||
Investment advisory fee | 590,517 | 122,488 | 126,933 | 179,185 | ||||||||||||
Total Expenses | 590,517 | 122,488 | 126,933 | 179,185 | ||||||||||||
Net Investment Income/(Loss) | (590,378 | ) | (122,464 | ) | (126,908 | ) | (179,159 | ) | ||||||||
Realized & Unrealized Gain/(Loss): | ||||||||||||||||
Net realized gain/(loss) on: | ||||||||||||||||
Investments | (3,044,483 | ) | (352,440 | ) | (202,411 | ) | 2,984,156 | |||||||||
Redemptions sold in-kind on investments | 21,421,180 | 4,050,167 | 3,976,863 | 3,399,487 | ||||||||||||
Redemptions sold in-kind on options written | 1,073,436 | 424,879 | 364,074 | 1,550,285 | ||||||||||||
Options written | (11,666,073 | ) | (1,896,741 | ) | (1,363,927 | ) | (3,491,033 | ) | ||||||||
Net change in unrealized appreciation/(depreciation) on: | ||||||||||||||||
Investments | (29,568,903 | ) | (6,768,626 | ) | (6,773,027 | ) | (9,254,453 | ) | ||||||||
Options written | 12,495,157 | 3,368,498 | 3,313,601 | 4,124,011 | ||||||||||||
Net Realized and Unrealized Gain/(Loss) on Investments and Options Written | (9,289,686 | ) | (1,174,263 | ) | (684,827 | ) | (687,547 | ) | ||||||||
Net Increase/(Decrease) in Net Assets Resulting From Operations | $ | (9,880,064 | ) | $ | (1,296,727 | ) | $ | (811,735 | ) | $ | (866,706 | ) | ||||
INNOVATOR ETFs TRUST
Statements of Operations
For the Period Ended April 30, 2022 (Unaudited)
Innovator U.S. Equity Ultra Buffer ETF - May | Innovator U.S. Equity Ultra Buffer ETF - June | Innovator U.S. Equity Ultra Buffer ETF - July | Innovator U.S. Equity Ultra Buffer ETF - August | |||||||||||||
Investment Income: | ||||||||||||||||
Interest | $ | 4 | $ | 4 | $ | 9 | $ | 8 | ||||||||
Total Investment Income | 4 | 4 | 9 | 8 | ||||||||||||
Expenses: | ||||||||||||||||
Investment advisory fee | 156,130 | 74,787 | 177,697 | 123,354 | ||||||||||||
Total Expenses | 156,130 | 74,787 | 177,697 | 123,354 | ||||||||||||
Net Investment Income/(Loss) | (156,126 | ) | (74,783 | ) | (177,688 | ) | (123,346 | ) | ||||||||
Realized & Unrealized Gain/(Loss): | ||||||||||||||||
Net realized gain/(loss) on: | ||||||||||||||||
Investments | (1,947,436 | ) | 133,476 | 406,036 | 337,481 | |||||||||||
Redemptions sold in-kind on investments | 1,303,213 | – | – | – | ||||||||||||
Redemptions sold in-kind on options written | 1,686,831 | – | – | – | ||||||||||||
Options written | (39,713 | ) | (57,125 | ) | (328,616 | ) | (320,003 | ) | ||||||||
Net change in unrealized appreciation/(depreciation) on: | ||||||||||||||||
Investments | (2,856,160 | ) | (2,139,774 | ) | (4,002,424 | ) | (2,675,914 | ) | ||||||||
Options written | 1,169,161 | 1,448,916 | 2,890,747 | 1,688,425 | ||||||||||||
Net Realized and Unrealized Gain/(Loss) on Investments and Options Written | (684,104 | ) | (614,507 | ) | (1,034,257 | ) | (970,011 | ) | ||||||||
Net Increase/(Decrease) in Net Assets Resulting From Operations | $ | (840,230 | ) | $ | (689,290 | ) | $ | (1,211,945 | ) | $ | (1,093,357 | ) | ||||
INNOVATOR ETFs TRUST
Statements of Operations
For the Period Ended April 30, 2022 (Unaudited)
Innovator U.S. Equity Ultra Buffer ETF - September | Innovator U.S. Equity Ultra Buffer ETF - October | Innovator U.S. Equity Ultra Buffer ETF - November | Innovator U.S. Equity Ultra Buffer ETF - December | |||||||||||||
Investment Income: | ||||||||||||||||
Interest | $ | 22 | $ | 28 | $ | 20 | $ | 24 | ||||||||
Total Investment Income | 22 | 28 | 20 | 24 | ||||||||||||
Expenses: | ||||||||||||||||
Investment advisory fee | 241,451 | 265,280 | 149,741 | 165,685 | ||||||||||||
Total Expenses | 241,451 | 265,280 | 149,741 | 165,685 | ||||||||||||
Net Investment Income/(Loss) | (241,429 | ) | (265,252 | ) | (149,721 | ) | (165,661 | ) | ||||||||
Realized & Unrealized Gain/(Loss): | ||||||||||||||||
Net realized gain/(loss) on: | ||||||||||||||||
Investments | (204,791 | ) | (600,132 | ) | (195,672 | ) | 3,345,993 | |||||||||
Options written | (119,141 | ) | (51,874 | ) | (23,440 | ) | (5,427,229 | ) | ||||||||
Net change in unrealized appreciation/(depreciation) on: | ||||||||||||||||
Investments | (4,664,663 | ) | (5,291,279 | ) | (3,032,708 | ) | (7,654,781 | ) | ||||||||
Options written | 2,283,662 | 4,063,975 | 1,421,414 | 7,888,857 | ||||||||||||
Net Realized and Unrealized Gain/(Loss) on Investments and Options Written | (2,704,933 | ) | (1,879,310 | ) | (1,830,406 | ) | (1,847,160 | ) | ||||||||
Net Increase/(Decrease) in Net Assets Resulting From Operations | $ | (2,946,362 | ) | $ | (2,144,562 | ) | $ | (1,980,127 | ) | $ | (2,012,821 | ) | ||||
INNOVATOR ETFs TRUST
Statements of Changes in Net Assets
Innovator U.S. Equity Buffer ETF - January | Innovator U.S. Equity Buffer ETF - February | Innovator U.S. Equity Buffer ETF - March | Innovator U.S. Equity Buffer ETF - April | |||||||||||||||||||||||||||||
Period Ended April 30, 2022 | Year Ended October 31, 2021 | Period Ended April 30, 2022 | Year Ended October 31, 2021 | Period Ended April 30, 2022 | Year Ended October 31, 2021 | Period Ended April 30, 2022 | Year Ended October 31, 2021 | |||||||||||||||||||||||||
Operations: | ||||||||||||||||||||||||||||||||
Net Investment income/(loss) | $ | (725,002 | ) | $ | (1,185,596 | ) | $ | (342,721 | ) | $ | (561,816 | ) | $ | (266,369 | ) | $ | (402,184 | ) | $ | (468,082 | ) | $ | (761,390 | ) | ||||||||
Net realized gain/(loss) | 20,037,664 | 3,578,517 | 12,435,654 | (2,653,750 | ) | 9,112,393 | (5,818,816 | ) | 16,236,710 | (30,367,943 | ) | |||||||||||||||||||||
Net change in unrealized appreciation/(depreciation) | (36,598,142 | ) | 28,868,519 | (18,005,874 | ) | 17,371,227 | (11,456,990 | ) | 15,766,764 | (18,765,341 | ) | 44,492,247 | ||||||||||||||||||||
Net Increase/(Decrease) in Net Assets Resulting from Operations | (17,285,480 | ) | 31,261,440 | (5,912,941 | ) | 14,155,661 | (2,610,966 | ) | 9,545,764 | (2,996,713 | ) | 13,362,914 | ||||||||||||||||||||
Capital Share Transactions: | ||||||||||||||||||||||||||||||||
Proceeds from shares sold | 247,099,190 | 184,391,120 | 129,142,289 | 88,951,570 | 91,934,637 | 72,173,690 | 153,722,802 | 77,380,390 | ||||||||||||||||||||||||
Cost of shares redeemed | (184,603,875 | ) | (191,274,643 | ) | (93,078,725 | ) | (53,948,647 | ) | (64,560,229 | ) | (43,325,395 | ) | (148,741,958 | ) | (37,447,975 | ) | ||||||||||||||||
Transaction fees (see Note 5) | 79,174 | 94,546 | 51,851 | 36,390 | 21,777 | 34,858 | 62,677 | 51,547 | ||||||||||||||||||||||||
Net Increase/(Decrease) in Net Assets from Capital Share Transactions | 62,574,489 | (6,788,977 | ) | 36,115,415 | 35,039,313 | 27,396,185 | 28,883,153 | 5,043,521 | 39,983,962 | |||||||||||||||||||||||
Total Increase/(Decrease) in Net Assets | $ | 45,289,009 | $ | 24,472,463 | $ | 30,202,474 | $ | 49,194,974 | $ | 24,785,219 | $ | 38,428,917 | $ | 2,046,808 | $ | 53,346,876 | ||||||||||||||||
Net Assets: | ||||||||||||||||||||||||||||||||
Beginning of the period | $ | 150,239,635 | $ | 125,767,172 | $ | 86,202,539 | $ | 37,007,565 | $ | 62,164,127 | $ | 23,735,210 | $ | 122,955,692 | $ | 69,608,816 | ||||||||||||||||
End of the period | $ | 195,528,644 | $ | 150,239,635 | $ | 116,405,013 | $ | 86,202,539 | $ | 86,949,346 | $ | 62,164,127 | $ | 125,002,500 | $ | 122,955,692 | ||||||||||||||||
Change in Shares Outstanding: | ||||||||||||||||||||||||||||||||
Shares sold | 6,700,000 | 5,650,000 | 4,075,000 | 3,175,000 | 2,750,000 | 2,375,000 | 4,800,000 | 2,525,000 | ||||||||||||||||||||||||
Shares redeemed | (5,000,000 | ) | (5,800,000 | ) | (2,950,000 | ) | (1,925,000 | ) | (1,925,000 | ) | (1,400,000 | ) | (4,600,000 | ) | (1,225,000 | ) | ||||||||||||||||
Net Increase/(Decrease) | 1,700,000 | (150,000 | ) | 1,125,000 | 1,250,000 | 825,000 | 975,000 | 200,000 | 1,300,000 | |||||||||||||||||||||||
INNOVATOR ETFs TRUST
Statements of Changes in Net Assets
Innovator U.S. Equity Buffer ETF - May | Innovator U.S. Equity Buffer ETF - June | Innovator U.S. Equity Buffer ETF - July | Innovator U.S. Equity Buffer ETF - August | |||||||||||||||||||||||||||||
Period Ended April 30, 2022 | Year Ended October 31, 2021 | Period Ended April 30, 2022 | Year Ended October 31, 2021 | Period Ended April 30, 2022 | Year Ended October 31, 2021 | Period Ended April 30, 2022 | Year Ended October 31, 2021 | |||||||||||||||||||||||||
Operations: | ||||||||||||||||||||||||||||||||
Net Investment income/(loss) | $ | (279,387 | ) | $ | (386,125 | ) | $ | (256,477 | ) | $ | (425,960 | ) | $ | (385,160 | ) | $ | (773,597 | ) | $ | (354,790 | ) | $ | (394,447 | ) | ||||||||
Net realized gain/(loss) | 2,559,590 | (4,594,201 | ) | 1,296,254 | (4,635,923 | ) | 4,006,430 | 9,975,739 | 116,781 | 1,922,924 | ||||||||||||||||||||||
Net change in unrealized appreciation/(depreciation) | (6,095,132 | ) | 12,281,286 | (4,362,305 | ) | 12,698,416 | (7,244,871 | ) | 5,702,775 | (5,918,214 | ) | 7,414,735 | ||||||||||||||||||||
Net Increase/(Decrease) in Net Assets Resulting from Operations | (3,814,929 | ) | 7,300,960 | (3,322,528 | ) | 7,636,533 | (3,623,601 | ) | 14,904,917 | (6,156,223 | ) | 8,943,212 | ||||||||||||||||||||
Capital Share Transactions: | ||||||||||||||||||||||||||||||||
Proceeds from shares sold | 65,734,660 | 88,101,790 | 1,687,982 | 92,524,980 | 22,909,778 | 200,680,682 | 50,076,202 | 88,707,932 | ||||||||||||||||||||||||
Cost of shares redeemed | (83,088,308 | ) | (29,299,918 | ) | (22,016,240 | ) | (50,852,033 | ) | (107,906,875 | ) | (100,360,368 | ) | (17,779,253 | ) | (59,252,027 | ) | ||||||||||||||||
Transaction fees (see Note 5) | 10,989 | 32,898 | 4,674 | 27,423 | 62,062 | 85,318 | 33,516 | 37,169 | ||||||||||||||||||||||||
Net Increase/(Decrease) in Net Assets from Capital Share Transactions | (17,342,659 | ) | 58,834,770 | (20,323,584 | ) | 41,700,370 | (84,935,035 | ) | 100,405,632 | 32,330,465 | 29,493,074 | |||||||||||||||||||||
Total Increase/(Decrease) in Net Assets | $ | (21,157,588 | ) | $ | 66,135,730 | $ | (23,646,112 | ) | $ | 49,336,903 | $ | (88,558,636 | ) | $ | 115,310,549 | $ | 26,174,242 | $ | 38,436,286 | |||||||||||||
Net Assets: | ||||||||||||||||||||||||||||||||
Beginning of the period | $ | 82,190,361 | $ | 16,054,631 | $ | 81,508,794 | $ | 32,171,891 | $ | 183,065,599 | $ | 67,755,050 | $ | 86,535,436 | $ | 48,099,150 | ||||||||||||||||
End of the period | $ | 61,032,773 | $ | 82,190,361 | $ | 57,862,682 | $ | 81,508,794 | $ | 94,506,963 | $ | 183,065,599 | $ | 112,709,678 | $ | 86,535,436 | ||||||||||||||||
Change in Shares Outstanding: | ||||||||||||||||||||||||||||||||
Shares sold | 2,150,000 | 2,900,000 | 50,000 | 2,875,000 | 725,000 | 6,375,000 | 1,575,000 | 2,800,000 | ||||||||||||||||||||||||
Shares redeemed | (2,650,000 | ) | (950,000 | ) | (650,000 | ) | (1,575,000 | ) | (3,275,000 | ) | (3,200,000 | ) | (550,000 | ) | (1,900,000 | ) | ||||||||||||||||
Net Increase/(Decrease) | (500,000 | ) | 1,950,000 | (600,000 | ) | 1,300,000 | (2,550,000 | ) | 3,175,000 | 1,025,000 | 900,000 | |||||||||||||||||||||
INNOVATOR ETFs TRUST
Statements of Changes in Net Assets
Innovator U.S. Equity Buffer ETF - September | Innovator U.S. Equity Buffer ETF - October | Innovator U.S. Equity Buffer ETF - November | Innovator U.S. Equity Buffer ETF - December | |||||||||||||||||||||||||||||
Period Ended April 30, 2022 | Year Ended October 31, 2021 | Period Ended April 30, 2022 | Year Ended October 31, 2021 | Period Ended April 30, 2022 | Year Ended October 31, 2021 | Period Ended April 30, 2022 | Year Ended October 31, 2021 | |||||||||||||||||||||||||
Operations: | ||||||||||||||||||||||||||||||||
Net Investment income/(loss) | $ | (588,822 | ) | $ | (718,733 | ) | $ | (411,913 | ) | $ | (657,252 | ) | $ | (315,042 | ) | $ | (173,282 | ) | $ | (316,983 | ) | $ | (603,516 | ) | ||||||||
Net realized gain/(loss) | (1,190,703 | ) | 10,780,549 | 578,014 | 11,163,815 | (527,024 | ) | 3,634,536 | (20,563,880 | ) | 28,529,207 | |||||||||||||||||||||
Net change in unrealized appreciation/(depreciation) | (7,759,729 | ) | 9,685,559 | (5,740,547 | ) | 7,718,734 | (4,728,366 | ) | (5,539 | ) | 15,285,787 | (14,999,717 | ) | |||||||||||||||||||
Net Increase/(Decrease) in Net Assets Resulting from Operations | (9,539,254 | ) | 19,747,375 | (5,574,446 | ) | 18,225,297 | (5,570,432 | ) | 3,455,715 | (5,595,076 | ) | 12,925,974 | ||||||||||||||||||||
Capital Share Transactions: | ||||||||||||||||||||||||||||||||
Proceeds from shares sold | 27,421,287 | 195,271,855 | 11,835,540 | 111,675,225 | 70,361,822 | 43,864,835 | 43,103,512 | 176,963,223 | ||||||||||||||||||||||||
Cost of shares redeemed | (33,245,410 | ) | (136,244,920 | ) | (27,072,688 | ) | (91,657,535 | ) | (20,938,573 | ) | (31,758,055 | ) | (5,004,620 | ) | (157,048,647 | ) | ||||||||||||||||
Transaction fees (see Note 5) | 30,333 | 83,130 | 10,916 | 18,784 | 37,946 | 13,267 | 27,033 | 75,094 | ||||||||||||||||||||||||
Net Increase/(Decrease) in Net Assets from Capital Share Transactions | (5,793,790 | ) | 59,110,065 | (15,226,232 | ) | 20,036,474 | 49,461,195 | 12,120,047 | 38,125,925 | 19,989,670 | ||||||||||||||||||||||
Total Increase/(Decrease) in Net Assets | $ | (15,333,044 | ) | $ | 78,857,440 | $ | (20,800,678 | ) | $ | 38,261,771 | $ | 43,890,763 | $ | 15,575,762 | $ | 32,530,849 | $ | 32,915,644 | ||||||||||||||
Net Assets: | ||||||||||||||||||||||||||||||||
Beginning of the period | $ | 156,749,276 | $ | 77,891,836 | $ | 111,874,701 | $ | 73,612,930 | $ | 30,598,685 | $ | 15,022,923 | $ | 57,874,025 | $ | 24,958,381 | ||||||||||||||||
End of the period | $ | 141,416,232 | $ | 156,749,276 | $ | 91,074,023 | $ | 111,874,701 | $ | 74,489,448 | $ | 30,598,685 | $ | 90,404,874 | $ | 57,874,025 | ||||||||||||||||
Change in Shares Outstanding: | ||||||||||||||||||||||||||||||||
Shares sold | 850,000 | 6,225,000 | 350,000 | 3,425,000 | 2,175,000 | 1,400,000 | 1,275,000 | 5,625,000 | ||||||||||||||||||||||||
Shares redeemed | (1,025,000 | ) | (4,375,000 | ) | (800,000 | ) | (2,825,000 | ) | (650,000 | ) | (1,000,000 | ) | (150,000 | ) | (4,825,000 | ) | ||||||||||||||||
Net Increase/(Decrease) | (175,000 | ) | 1,850,000 | (450,000 | ) | 600,000 | 1,525,000 | 400,000 | 1,125,000 | 800,000 | ||||||||||||||||||||||
INNOVATOR ETFs TRUST
Statements of Changes in Net Assets
Innovator U.S. Equity Power Buffer ETF - January | Innovator U.S. Equity Power Buffer ETF - February | Innovator U.S. Equity Power Buffer ETF - March | Innovator U.S. Equity Power Buffer ETF - April | |||||||||||||||||||||||||||||
Period Ended April 30, 2022 | Year Ended October 31, 2021 | Period Ended April 30, 2022 | Year Ended October 31, 2021 | Period Ended April 30, 2022 | Year Ended October 31, 2021 | Period Ended April 30, 2022 | Year Ended October 31, 2021 | |||||||||||||||||||||||||
Operations: | ||||||||||||||||||||||||||||||||
Net Investment income/(loss) | $ | (1,724,219 | ) | $ | (2,676,286 | ) | $ | (845,170 | ) | $ | (1,314,741 | ) | $ | (578,504 | ) | $ | (800,814 | ) | $ | (861,362 | ) | $ | (1,692,975 | ) | ||||||||
Net realized gain/(loss) | 25,373,682 | (16,726,748 | ) | 19,461,629 | (24,473,389 | ) | 13,397,201 | (23,155,114 | ) | 23,022,258 | (99,453,461 | ) | ||||||||||||||||||||
Net change in unrealized appreciation/(depreciation) | (56,471,018 | ) | 63,542,764 | (30,777,597 | ) | 48,615,397 | (17,508,535 | ) | 37,044,072 | (31,420,104 | ) | 120,950,615 | ||||||||||||||||||||
Net Increase/(Decrease) in Net Assets Resulting from Operations | (32,821,555 | ) | 44,139,730 | (12,161,138 | ) | 22,827,267 | (4,689,838 | ) | 13,088,144 | (9,259,208 | ) | 19,804,179 | ||||||||||||||||||||
Capital Share Transactions: | ||||||||||||||||||||||||||||||||
Proceeds from shares sold | 661,371,905 | 313,352,247 | 324,038,385 | 220,910,615 | 250,805,569 | 86,166,745 | 334,325,320 | 193,061,285 | ||||||||||||||||||||||||
Cost of shares redeemed | (374,607,190 | ) | (351,745,125 | ) | (177,179,802 | ) | (188,560,837 | ) | (125,842,190 | ) | (53,344,082 | ) | (257,635,305 | ) | (157,605,677 | ) | ||||||||||||||||
Transaction fees (see Note 5) | 243,934 | 217,229 | 124,720 | 108,516 | 77,023 | 68,994 | 105,809 | 165,496 | ||||||||||||||||||||||||
Net Increase/(Decrease) in Net Assets from Capital Share Transactions | 287,008,649 | (38,175,649 | ) | 146,983,303 | 32,458,294 | 125,040,402 | 32,891,657 | 76,795,824 | 35,621,104 | |||||||||||||||||||||||
Total Increase/(Decrease) in Net Assets | $ | 254,187,094 | $ | 5,964,081 | $ | 134,822,165 | $ | 55,285,561 | $ | 120,350,564 | $ | 45,979,801 | $ | 67,536,616 | $ | 55,425,283 | ||||||||||||||||
Net Assets: | ||||||||||||||||||||||||||||||||
Beginning of the period | $ | 294,560,728 | $ | 288,596,647 | $ | 170,406,744 | $ | 115,121,183 | $ | 117,874,643 | $ | 71,894,842 | $ | 242,503,245 | $ | 187,077,962 | ||||||||||||||||
End of the period | $ | 548,747,822 | $ | 294,560,728 | $ | 305,228,909 | $ | 170,406,744 | $ | 238,225,207 | $ | 117,874,643 | $ | 310,039,861 | $ | 242,503,245 | ||||||||||||||||
Change in Shares Outstanding: | ||||||||||||||||||||||||||||||||
Shares sold | 20,175,000 | 10,250,000 | 11,125,000 | 8,275,000 | 7,975,000 | 2,975,000 | 11,550,000 | 6,950,000 | ||||||||||||||||||||||||
Shares redeemed | (11,375,000 | ) | (11,275,000 | ) | (6,075,000 | ) | (7,000,000 | ) | (4,000,000 | ) | (1,825,000 | ) | (8,875,000 | ) | (5,650,000 | ) | ||||||||||||||||
Net Increase/(Decrease) | 8,800,000 | (1,025,000 | ) | 5,050,000 | 1,275,000 | 3,975,000 | 1,150,000 | 2,675,000 | 1,300,000 | |||||||||||||||||||||||
INNOVATOR ETFs TRUST
Statements of Changes in Net Assets
Innovator U.S. Equity Power Buffer ETF - May | Innovator U.S. Equity Power Buffer ETF - June | Innovator U.S. Equity Power Buffer ETF - July | Innovator U.S. Equity Power Buffer ETF - August | |||||||||||||||||||||||||||||
Period Ended April 30, 2022 | Year Ended October 31, 2021 | Period Ended April 30, 2022 | Year Ended October 31, 2021 | Period Ended April 30, 2022 | Year Ended October 31, 2021 | Period Ended April 30, 2022 | Year Ended October 31, 2021 | |||||||||||||||||||||||||
Operations: | ||||||||||||||||||||||||||||||||
Net Investment income/(loss) | $ | (832,585 | ) | $ | (1,237,109 | ) | $ | (572,908 | ) | $ | (894,828 | ) | $ | (738,371 | ) | $ | (1,079,931 | ) | $ | (695,408 | ) | $ | (937,008 | ) | ||||||||
Net realized gain/(loss) | 6,819,709 | (23,700,562 | ) | 347,086 | (22,617,650 | ) | 1,080,422 | 8,829,473 | 9,970 | (18,700 | ) | |||||||||||||||||||||
Net change in unrealized appreciation/(depreciation) | (12,794,443 | ) | 40,806,512 | (3,941,884 | ) | 35,205,333 | (5,233,560 | ) | 5,743,600 | (5,338,068 | ) | 14,335,167 | ||||||||||||||||||||
Net Increase/(Decrease) in Net Assets Resulting from Operations | (6,807,319 | ) | 15,868,841 | (4,167,706 | ) | 11,692,855 | (4,891,509 | ) | 13,493,142 | (6,023,506 | ) | 13,379,459 | ||||||||||||||||||||
Capital Share Transactions: | ||||||||||||||||||||||||||||||||
Proceeds from shares sold | 215,165,877 | 226,991,957 | 7,899,271 | 153,923,730 | 24,703,125 | 263,914,680 | 23,493,360 | 191,780,793 | ||||||||||||||||||||||||
Cost of shares redeemed | (245,931,240 | ) | (69,826,345 | ) | (19,160,360 | ) | (107,358,325 | ) | (69,240,278 | ) | (170,525,447 | ) | (26,970,615 | ) | (128,696,635 | ) | ||||||||||||||||
Transaction fees (see Note 5) | 50,197 | 118,881 | 12,726 | 119,083 | 46,597 | 114,217 | 24,099 | 69,818 | ||||||||||||||||||||||||
Net Increase/(Decrease) in Net Assets from Capital Share Transactions | (30,715,166 | ) | 157,284,493 | (11,248,363 | ) | 46,684,488 | (44,490,556 | ) | 93,503,450 | (3,453,156 | ) | 63,153,976 | ||||||||||||||||||||
Total Increase/(Decrease) in Net Assets | $ | (37,522,485 | ) | $ | 173,153,334 | $ | (15,416,069 | ) | $ | 58,377,343 | $ | (49,382,065 | ) | $ | 106,996,592 | $ | (9,476,662 | ) | $ | 76,533,435 | ||||||||||||
Net Assets: | ||||||||||||||||||||||||||||||||
Beginning of the period | $ | 238,779,648 | $ | 65,626,314 | $ | 152,965,737 | $ | 94,588,394 | $ | 218,755,438 | $ | 111,758,846 | $ | 185,991,415 | $ | 109,457,980 | ||||||||||||||||
End of the period | $ | 201,257,163 | $ | 238,779,648 | $ | 137,549,668 | $ | 152,965,737 | $ | 169,373,373 | $ | 218,755,438 | $ | 176,514,753 | $ | 185,991,415 | ||||||||||||||||
Change in Shares Outstanding: | ||||||||||||||||||||||||||||||||
Shares sold | 7,425,000 | 7,875,000 | 250,000 | 5,000,000 | 825,000 | 8,900,000 | 800,000 | 6,525,000 | ||||||||||||||||||||||||
Shares redeemed | (8,300,000 | ) | (2,375,000 | ) | (600,000 | ) | (3,475,000 | ) | (2,275,000 | ) | (5,775,000 | ) | (900,000 | ) | (4,400,000 | ) | ||||||||||||||||
Net Increase/(Decrease) | (875,000 | ) | 5,500,000 | (350,000 | ) | 1,525,000 | (1,450,000 | ) | 3,125,000 | (100,000 | ) | 2,125,000 | ||||||||||||||||||||
INNOVATOR ETFs TRUST
Statements of Changes in Net Assets
Innovator U.S. Equity Power Buffer ETF - September | Innovator U.S. Equity Power Buffer ETF - October | Innovator U.S. Equity Power Buffer ETF - November | Innovator U.S. Equity Power Buffer ETF - December | |||||||||||||||||||||||||||||
Period Ended April 30, 2022 | Year Ended October 31, 2021 | Period Ended April 30, 2022 | Year Ended October 31, 2021 | Period Ended April 30, 2022 | Year Ended October 31, 2021 | Period Ended April 30, 2022 | Year Ended October 31, 2021 | |||||||||||||||||||||||||
Operations: | ||||||||||||||||||||||||||||||||
Net Investment income/(loss) | $ | (1,077,016 | ) | $ | (2,075,118 | ) | $ | (766,851 | ) | $ | (1,260,844 | ) | $ | (779,040 | ) | $ | (487,244 | ) | $ | (790,705 | ) | $ | (1,205,400 | ) | ||||||||
Net realized gain/(loss) | (807,779 | ) | 32,783,140 | (679,373 | ) | 19,677,482 | 765,281 | 7,219,597 | (45,591,956 | ) | 47,736,905 | |||||||||||||||||||||
Net change in unrealized appreciation/(depreciation) | (10,281,732 | ) | 10,523,646 | (5,314,501 | ) | 7,595,535 | (9,806,358 | ) | (14,825 | ) | 35,915,686 | (29,573,550 | ) | |||||||||||||||||||
Net Increase/(Decrease) in Net Assets Resulting from Operations | (12,166,527 | ) | 41,231,668 | (6,760,725 | ) | 26,012,173 | (9,820,117 | ) | 6,717,528 | (10,466,975 | ) | 16,957,955 | ||||||||||||||||||||
Capital Share Transactions: | ||||||||||||||||||||||||||||||||
Proceeds from shares sold | 51,833,470 | 365,752,667 | 16,381,097 | 220,029,025 | 179,957,007 | 108,673,042 | 142,577,615 | 352,113,070 | ||||||||||||||||||||||||
Cost of shares redeemed | (71,538,200 | ) | (391,085,960 | ) | (33,190,897 | ) | (226,560,945 | ) | (46,567,680 | ) | (74,295,220 | ) | (14,594,592 | ) | (325,826,193 | ) | ||||||||||||||||
Transaction fees (see Note 5) | 61,309 | 186,618 | 24,030 | 86,230 | 87,563 | 30,075 | 78,587 | 164,217 | ||||||||||||||||||||||||
Net Increase/(Decrease) in Net Assets from Capital Share Transactions | (19,643,421 | ) | (25,146,675 | ) | (16,785,770 | ) | (6,445,690 | ) | 133,476,890 | 34,407,897 | 128,061,610 | 26,451,094 | ||||||||||||||||||||
Total Increase/(Decrease) in Net Assets | $ | (31,809,948 | ) | $ | 16,084,993 | $ | (23,546,495 | ) | $ | 19,566,483 | $ | 123,656,773 | $ | 41,125,425 | $ | 117,594,635 | $ | 43,409,049 | ||||||||||||||
Net Assets: | ||||||||||||||||||||||||||||||||
Beginning of the period | $ | 303,472,928 | $ | 287,387,935 | $ | 209,533,024 | $ | 189,966,541 | $ | 79,342,640 | $ | 38,217,215 | $ | 108,520,485 | $ | 65,111,436 | ||||||||||||||||
End of the period | $ | 271,662,980 | $ | 303,472,928 | $ | 185,986,529 | $ | 209,533,024 | $ | 202,999,413 | $ | 79,342,640 | $ | 226,115,120 | $ | 108,520,485 | ||||||||||||||||
Change in Shares Outstanding: | ||||||||||||||||||||||||||||||||
Shares sold | 1,750,000 | 12,525,000 | 550,000 | 7,525,000 | 5,900,000 | 3,650,000 | 4,600,000 | 12,000,000 | ||||||||||||||||||||||||
Shares redeemed | (2,400,000 | ) | (13,450,000 | ) | (1,100,000 | ) | (7,850,000 | ) | (1,525,000 | ) | (2,450,000 | ) | (475,000 | ) | (10,875,000 | ) | ||||||||||||||||
Net Increase/(Decrease) | (650,000 | ) | (925,000 | ) | (550,000 | ) | (325,000 | ) | 4,375,000 | 1,200,000 | 4,125,000 | 1,125,000 | ||||||||||||||||||||
INNOVATOR ETFs TRUST
Statements of Changes in Net Assets
Innovator U.S. Equity Ultra Buffer ETF - January | Innovator U.S. Equity Ultra Buffer ETF - February | Innovator U.S. Equity Ultra Buffer ETF - March | Innovator U.S. Equity Ultra Buffer ETF - April | |||||||||||||||||||||||||||||
Period Ended April 30, 2022 | Year Ended October 31, 2021 | Period Ended April 30, 2022 | Year Ended October 31, 2021 | Period Ended April 30, 2022 | Year Ended October 31, 2021 | Period Ended April 30, 2022 | Year Ended October 31, 2021 | |||||||||||||||||||||||||
Operations: | ||||||||||||||||||||||||||||||||
Net Investment income/(loss) | $ | (590,378 | ) | $ | (819,851 | ) | $ | (122,464 | ) | $ | (242,936 | ) | $ | (126,908 | ) | $ | (261,730 | ) | $ | (179,159 | ) | $ | (365,577 | ) | ||||||||
Net realized gain/(loss) | 7,784,060 | (31,184,196 | ) | 2,225,865 | (11,951,173 | ) | 2,774,599 | (16,471,145 | ) | 4,442,895 | (9,760,218 | ) | ||||||||||||||||||||
Net change in unrealized appreciation/(depreciation) | (17,073,746 | ) | 43,010,224 | (3,400,128 | ) | 15,595,512 | (3,459,426 | ) | 19,672,888 | (5,130,442 | ) | 12,961,820 | ||||||||||||||||||||
Net Increase/(Decrease) in Net Assets Resulting from Operations | (9,880,064 | ) | 11,006,177 | (1,296,727 | ) | 3,401,403 | (811,735 | ) | 2,940,013 | (866,706 | ) | 2,836,025 | ||||||||||||||||||||
Capital Share Transactions: | ||||||||||||||||||||||||||||||||
Proceeds from shares sold | 296,601,145 | 45,707,263 | 44,648,288 | 17,846,370 | 42,465,330 | 21,852,792 | 56,885,412 | 65,050,742 | ||||||||||||||||||||||||
Cost of shares redeemed | (98,553,805 | ) | (82,526,250 | ) | (27,968,332 | ) | (26,618,438 | ) | (34,975,983 | ) | (19,837,095 | ) | (60,580,368 | ) | (41,288,300 | ) | ||||||||||||||||
Transaction fees (see Note 5) | 113,566 | 63,731 | 11,822 | 22,233 | 10,449 | 20,845 | 19,594 | 50,300 | ||||||||||||||||||||||||
Net Increase/(Decrease) in Net Assets from Capital Share Transactions | 198,160,906 | (36,755,256 | ) | 16,691,778 | (8,749,835 | ) | 7,499,796 | 2,036,542 | (3,675,362 | ) | 23,812,742 | |||||||||||||||||||||
Total Increase/(Decrease) in Net Assets | $ | 188,280,842 | $ | (25,749,079 | ) | $ | 15,395,051 | $ | (5,348,432 | ) | $ | 6,688,061 | $ | 4,976,555 | $ | (4,542,068 | ) | $ | 26,648,767 | |||||||||||||
Net Assets: | ||||||||||||||||||||||||||||||||
Beginning of the period | $ | 86,274,187 | $ | 112,023,266 | $ | 26,408,511 | $ | 31,756,943 | $ | 33,251,137 | $ | 28,274,582 | $ | 57,242,305 | $ | 30,593,538 | ||||||||||||||||
End of the period | $ | 274,555,029 | $ | 86,274,187 | $ | 41,803,562 | $ | 26,408,511 | $ | 39,939,198 | $ | 33,251,137 | $ | 52,700,237 | $ | 57,242,305 | ||||||||||||||||
Change in Shares Outstanding: | ||||||||||||||||||||||||||||||||
Shares sold | 9,625,000 | 1,525,000 | 1,600,000 | 675,000 | 1,425,000 | 775,000 | 2,200,000 | 2,575,000 | ||||||||||||||||||||||||
Shares redeemed | (3,125,000 | ) | (2,725,000 | ) | (1,000,000 | ) | (1,000,000 | ) | (1,175,000 | ) | (700,000 | ) | (2,325,000 | ) | (1,625,000 | ) | ||||||||||||||||
Net Increase/(Decrease) | 6,500,000 | (1,200,000 | ) | 600,000 | (325,000 | ) | 250,000 | 75,000 | (125,000 | ) | 950,000 | |||||||||||||||||||||
INNOVATOR ETFs TRUST
Statements of Changes in Net Assets
Innovator U.S. Equity Ultra Buffer ETF - May | Innovator U.S. Equity Ultra Buffer ETF - June | Innovator U.S. Equity Ultra Buffer ETF - July | Innovator U.S. Equity Ultra Buffer ETF - August | |||||||||||||||||||||||||||||
Period Ended April 30, 2022 | Year Ended October 31, 2021 | Period Ended April 30, 2022 | Year Ended October 31, 2021 | Period Ended April 30, 2022 | Year Ended October 31, 2021 | Period Ended April 30, 2022 | Year Ended October 31, 2021 | |||||||||||||||||||||||||
Operations: | ||||||||||||||||||||||||||||||||
Net Investment income/(loss) | $ | (156,126 | ) | $ | (209,424 | ) | $ | (74,783 | ) | $ | (157,929 | ) | $ | (177,688 | ) | $ | (299,631 | ) | $ | (123,346 | ) | $ | (250,772 | ) | ||||||||
Net realized gain/(loss) | 1,002,895 | (3,930,524 | ) | 76,351 | 862,371 | 77,420 | 2,105,744 | 17,478 | 1,419,071 | |||||||||||||||||||||||
Net change in unrealized appreciation/(depreciation) | (1,686,999 | ) | 5,947,782 | (690,858 | ) | 664,338 | (1,111,677 | ) | 871,090 | (987,489 | ) | 1,656,959 | ||||||||||||||||||||
Net Increase/(Decrease) in Net Assets Resulting from Operations | (840,230 | ) | 1,807,834 | (689,290 | ) | 1,368,780 | (1,211,945 | ) | 2,677,203 | (1,093,357 | ) | 2,825,258 | ||||||||||||||||||||
Capital Share Transactions: | ||||||||||||||||||||||||||||||||
Proceeds from shares sold | 38,667,234 | 46,252,428 | – | 39,052,202 | 5,385,570 | 60,542,613 | 723,767 | 47,249,040 | ||||||||||||||||||||||||
Cost of shares redeemed | (48,749,930 | ) | (18,111,840 | ) | (3,609,232 | ) | (34,268,610 | ) | (20,587,580 | ) | (50,137,815 | ) | (20,288,278 | ) | (49,394,117 | ) | ||||||||||||||||
Transaction fees (see Note 5) | 13,882 | 16,999 | 1,805 | 18,176 | 12,987 | 23,382 | 10,506 | 24,001 | ||||||||||||||||||||||||
Net Increase/(Decrease) in Net Assets from Capital Share Transactions | (10,068,814 | ) | 28,157,587 | (3,607,427 | ) | 4,801,768 | (15,189,023 | ) | 10,428,180 | (19,554,005 | ) | (2,121,076 | ) | |||||||||||||||||||
Total Increase/(Decrease) in Net Assets | $ | (10,909,044 | ) | $ | 29,965,421 | $ | (4,296,717 | ) | $ | 6,170,548 | $ | (16,400,968 | ) | $ | 13,105,383 | $ | (20,647,362 | ) | $ | 704,182 | ||||||||||||
Net Assets: | ||||||||||||||||||||||||||||||||
Beginning of the period | $ | 40,634,043 | $ | 10,668,622 | $ | 21,154,531 | $ | 14,983,983 | $ | 52,688,861 | $ | 39,583,478 | $ | 46,382,799 | $ | 45,678,617 | ||||||||||||||||
End of the period | $ | 29,724,999 | $ | 40,634,043 | $ | 16,857,814 | $ | 21,154,531 | $ | 36,287,893 | $ | 52,688,861 | $ | 25,735,437 | $ | 46,382,799 | ||||||||||||||||
Change in Shares Outstanding: | ||||||||||||||||||||||||||||||||
Shares sold | 1,400,000 | 1,675,000 | – | 1,375,000 | 200,000 | 2,250,000 | 25,000 | 1,650,000 | ||||||||||||||||||||||||
Shares redeemed | (1,725,000 | ) | (650,000 | ) | (125,000 | ) | (1,200,000 | ) | (750,000 | ) | (1,875,000 | ) | (700,000 | ) | (1,750,000 | ) | ||||||||||||||||
Net Increase/(Decrease) | (325,000 | ) | 1,025,000 | (125,000 | ) | 175,000 | (550,000 | ) | 375,000 | (675,000 | ) | (100,000 | ) | |||||||||||||||||||
INNOVATOR ETFs TRUST
Statements of Changes in Net Assets
Innovator U.S. Equity Ultra Buffer ETF - September | Innovator U.S. Equity Ultra Buffer ETF - October | Innovator U.S. Equity Ultra Buffer ETF - November | Innovator U.S. Equity Ultra Buffer ETF - December | |||||||||||||||||||||||||||||
Period Ended April 30, 2022 | Year Ended October 31, 2021 | Period Ended April 30, 2022 | Year Ended October 31, 2021 | Period Ended April 30, 2022 | Year Ended October 31, 2021 | Period Ended April 30, 2022 | Year Ended October 31, 2021 | |||||||||||||||||||||||||
Operations: | ||||||||||||||||||||||||||||||||
Net Investment income/(loss) | $ | (241,429 | ) | $ | (425,362 | ) | $ | (265,252 | ) | $ | (569,928 | ) | $ | (149,721 | ) | $ | (105,883 | ) | $ | (165,661 | ) | $ | (326,715 | ) | ||||||||
Net realized gain/(loss) | (323,932 | ) | 4,899,842 | (652,006 | ) | 6,545,657 | (219,112 | ) | 1,040,225 | (2,081,236 | ) | (5,389,132 | ) | |||||||||||||||||||
Net change in unrealized appreciation/(depreciation) | (2,381,001 | ) | 1,339,852 | (1,227,304 | ) | 1,856,858 | (1,611,294 | ) | (1,547 | ) | 234,076 | 9,205,471 | ||||||||||||||||||||
Net Increase/(Decrease) in Net Assets Resulting from Operations | (2,946,362 | ) | 5,814,332 | (2,144,562 | ) | 7,832,587 | (1,980,127 | ) | 932,795 | (2,012,821 | ) | 3,489,624 | ||||||||||||||||||||
Capital Share Transactions: | ||||||||||||||||||||||||||||||||
Proceeds from shares sold | 12,078,153 | 87,776,507 | 9,214,235 | 65,441,403 | 37,985,333 | 20,065,740 | 22,344,440 | 67,298,308 | ||||||||||||||||||||||||
Cost of shares redeemed | (16,307,047 | ) | (91,360,843 | ) | (8,445,848 | ) | (115,868,045 | ) | (3,625,825 | ) | (18,890,845 | ) | (5,938,650 | ) | (62,526,630 | ) | ||||||||||||||||
Transaction fees (see Note 5) | 13,836 | 51,506 | 8,121 | 36,725 | 18,232 | 7,761 | 14,142 | 42,052 | ||||||||||||||||||||||||
Net Increase/(Decrease) in Net Assets from Capital Share Transactions | (4,215,058 | ) | (3,532,830 | ) | 776,508 | (50,389,917 | ) | 34,377,740 | 1,182,656 | 16,419,932 | 4,813,730 | |||||||||||||||||||||
Total Increase/(Decrease) in Net Assets | $ | (7,161,420 | ) | $ | 2,281,502 | $ | (1,368,054 | ) | $ | (42,557,330 | ) | $ | 32,397,613 | $ | 2,115,451 | $ | 14,407,111 | $ | 8,303,354 | |||||||||||||
Net Assets: | ||||||||||||||||||||||||||||||||
Beginning of the period | $ | 67,502,477 | $ | 65,220,975 | $ | 62,818,479 | $ | 105,375,809 | $ | 10,982,250 | $ | 8,866,799 | $ | 32,059,042 | $ | 23,755,688 | ||||||||||||||||
End of the period | $ | 60,341,057 | $ | 67,502,477 | $ | 61,450,425 | $ | 62,818,479 | $ | 43,379,863 | $ | 10,982,250 | $ | 46,466,153 | $ | 32,059,042 | ||||||||||||||||
Change in Shares Outstanding: | ||||||||||||||||||||||||||||||||
Shares sold | 425,000 | 3,150,000 | 325,000 | 2,350,000 | 1,300,000 | 700,000 | 750,000 | 2,375,000 | ||||||||||||||||||||||||
Shares redeemed | (575,000 | ) | (3,300,000 | ) | (300,000 | ) | (4,225,000 | ) | (125,000 | ) | (650,000 | ) | (200,000 | ) | (2,175,000 | ) | ||||||||||||||||
Net Increase/(Decrease) | (150,000 | ) | (150,000 | ) | 25,000 | (1,875,000 | ) | 1,175,000 | 50,000 | 550,000 | 200,000 | |||||||||||||||||||||
INNOVATOR ETFs TRUST
Financial Highlights
Per Share Operating Performance (For a share outstanding throughout each period) | Ratios/Supplemental Data: | |||||||||||||||||||||||||||||||||||||||||||||||||||
Investment Operations: | Capital Share Transactions: | Ratio to Average Net Assets of: (a) | ||||||||||||||||||||||||||||||||||||||||||||||||||
Net Asset Value, Beginning of Period | Net investment income/(loss) (b) | Net realized and unrealized gain/(loss) | Total From Investment Operations | Transaction fees (see Note 5) | Distributions Paid to Shareholders: | Change in Net Asset Value for the Period | Net Asset Value, End of Period | Total return (c) | Net assets, end of period (000) | Expenses | Net investment income/(loss) | Portfolio turnover rate (c) | ||||||||||||||||||||||||||||||||||||||||
| Innovator U.S. Equity Buffer ETF - January | ||||||||||||||||||||||||||||||||||||||||||||||||||||
For the period 11/1/2021 (d) - 4/30/2022 | $ | 36.87 | (0.14 | ) | (2.89 | ) | (3.03 | ) | 0.02 | – | (3.01 | ) | $ | 33.86 | (8.17 | )% | $ | 195,529 | 0.79 | % | (0.79 | )% | 0 | % | ||||||||||||||||||||||||||||
For the year ended 10/31/2021 | $ | 29.77 | (0.27 | ) | 7.35 | 7.08 | 0.02 | – | 7.10 | $ | 36.87 | 23.85 | % | $ | 150,240 | 0.79 | % | (0.79 | )% | 0 | % | |||||||||||||||||||||||||||||||
For the year ended 10/31/2020 | $ | 29.69 | (0.23 | ) | 1.63 | (e) | 1.40 | 0.04 | (1.36 | ) | 0.08 | $ | 29.77 | 4.99 | % | $ | 125,767 | 0.79 | % | (0.79 | )% | 0 | % | |||||||||||||||||||||||||||||
For the period 12/31/2018 (d) - 10/31/2019 | $ | 25.08 | (0.19 | ) | 4.75 | 4.56 | 0.05 | – | 4.61 | $ | 29.69 | 18.38 | % | $ | 22,267 | 0.80 | %(f) | (0.80 | )% | 0 | % | |||||||||||||||||||||||||||||||
| Innovator U.S. Equity Buffer ETF - February | ||||||||||||||||||||||||||||||||||||||||||||||||||||
For the period 11/1/2021 (d) - 4/30/2022 | $ | 31.63 | (0.12 | ) | (1.29 | ) | (1.41 | ) | 0.02 | – | (1.39 | ) | $ | 30.24 | (4.42 | )% | $ | 116,405 | 0.79 | % | (0.79 | )% | 0 | % | ||||||||||||||||||||||||||||
For the year ended 10/31/2021 | $ | 25.09 | (0.23 | ) | 6.75 | 6.52 | 0.02 | – | 6.54 | $ | 31.63 | 26.08 | % | $ | 86,203 | 0.79 | % | (0.79 | )% | 0 | % | |||||||||||||||||||||||||||||||
For the period 1/31/2020 (d) - 10/31/2020 | $ | 24.52 | (0.14 | ) | 0.69 | 0.55 | 0.02 | – | 0.57 | $ | 25.09 | 2.32 | % | $ | 37,008 | 0.79 | % | (0.79 | )% | 0 | % | |||||||||||||||||||||||||||||||
| Innovator U.S. Equity Buffer ETF - March | ||||||||||||||||||||||||||||||||||||||||||||||||||||
For the period 11/1/2021 (d) - 4/30/2022 | $ | 34.06 | (0.13 | ) | (1.13 | ) | (1.26 | ) | 0.01 | – | (1.25 | ) | $ | 32.81 | (3.67 | )% | $ | 86,949 | 0.79 | % | (0.79 | )% | 0 | % | ||||||||||||||||||||||||||||
For the year ended 10/31/2021 | $ | 27.92 | (0.25 | ) | 6.37 | 6.12 | 0.02 | – | 6.14 | $ | 34.06 | 21.98 | % | $ | 62,164 | 0.79 | % | (0.79 | )% | 0 | % | |||||||||||||||||||||||||||||||
For the period 2/28/2020 (d) - 10/31/2020 | $ | 26.01 | (0.14 | ) | 2.03 | 1.89 | 0.02 | – | 1.91 | $ | 27.92 | 7.36 | % | $ | 23,735 | 0.79 | % | (0.79 | )% | 0 | % | |||||||||||||||||||||||||||||||
| Innovator U.S. Equity Buffer ETF - April | ||||||||||||||||||||||||||||||||||||||||||||||||||||
For the period 11/1/2021 (d) - 4/30/2022 | $ | 32.79 | (0.13 | ) | (1.03 | ) | (1.16 | ) | 0.02 | – | (1.14 | ) | $ | 31.65 | (3.48 | )% | $ | 125,003 | 0.79 | % | (0.79 | )% | 0 | % | ||||||||||||||||||||||||||||
For the year ended 10/31/2021 | $ | 28.41 | (0.25 | ) | 4.61 | 4.36 | 0.02 | – | 4.38 | $ | 32.79 | 15.40 | % | $ | 122,956 | 0.79 | % | (0.79 | )% | 0 | % | |||||||||||||||||||||||||||||||
For the year ended 10/31/2020 | $ | 26.64 | (0.22 | ) | 1.95 | 1.73 | 0.04 | – | 1.77 | $ | 28.41 | 6.65 | % | $ | 69,609 | 0.79 | % | (0.79 | )% | 0 | % | |||||||||||||||||||||||||||||||
For the period 3/29/2019 (d) - 10/31/2019 | $ | 24.95 | (0.12 | ) | 1.79 | 1.67 | 0.02 | – | 1.69 | $ | 26.64 | 6.78 | % | $ | 41,295 | 0.79 | % | (0.79 | )% | 121 | % | |||||||||||||||||||||||||||||||
(a) | Annualized for periods less than one year. |
(b) | Net investment income/(loss) per share has been calculated based on average shares outstanding during the period. |
(c) | Not annualized for periods less than one year. |
(d) | Net realized and unrealized gain/(loss) per share includes balancing amounts necessary to reconcile the change in net asset value per share for the period, and may not reconcile with the aggregate gain/(loss) in the Statement of Operations due to share transactions for the period. |
(e) | Commencement of operations. |
(f) | Includes broker interest expense of 0.01%. |
INNOVATOR ETFs TRUST
Financial Highlights
Per Share Operating Performance (For a share outstanding throughout each period) | Ratios/Supplemental Data: | |||||||||||||||||||||||||||||||||||||||||||||||
Investment Operations: | Capital Share Transactions: | Ratio to Average Net Assets of: (a) | ||||||||||||||||||||||||||||||||||||||||||||||
Net Asset Value, Beginning of Period | Net investment income/(loss) (b) | Net realized and unrealized gain/(loss) | Total From Investment Operations | Transaction fees (see Note 5) | Change in Net Asset Value for the Period | Net Asset Value, End of Period | Total return (c) | Net assets, end of period (000) | Expenses | Net investment income/(loss) | Portfolio turnover rate (c) | |||||||||||||||||||||||||||||||||||||
| Innovator U.S. Equity Buffer ETF - May | ||||||||||||||||||||||||||||||||||||||||||||||||
For the period 11/1/2021 (d) - 4/30/2022 | $ | 32.55 | (0.13 | ) | (2.28 | ) | (2.41 | ) | 0.00 | (e) | (2.41 | ) | $ | 30.14 | (7.38 | )% | $ | 61,033 | 0.79 | % | (0.79 | )% | 0 | % | ||||||||||||||||||||||||
For the year ended 10/31/2021 | $ | 27.92 | (0.25 | ) | 4.86 | 4.61 | 0.02 | 4.63 | $ | 32.55 | 16.58 | % | $ | 82,190 | 0.79 | % | (0.79 | )% | 0 | % | ||||||||||||||||||||||||||||
For the period 4/30/2020 (d) - 10/31/2020 | $ | 25.63 | (0.11 | ) | 2.39 | 2.28 | 0.01 | 2.29 | $ | 27.92 | 8.94 | % | $ | 16,055 | 0.79 | % | (0.79 | )% | 0 | % | ||||||||||||||||||||||||||||
| Innovator U.S. Equity Buffer ETF - June | ||||||||||||||||||||||||||||||||||||||||||||||||
For the period 11/1/2021 (d) - 4/30/2022 | $ | 33.96 | (0.13 | ) | (1.68 | ) | (1.81 | ) | 0.00 | (e) | (1.81 | ) | $ | 32.15 | (5.35 | )% | $ | 57,863 | 0.79 | % | (0.79 | )% | 0 | % | ||||||||||||||||||||||||
For the year ended 10/31/2021 | $ | 29.25 | (0.26 | ) | 4.95 | 4.69 | 0.02 | 4.71 | $ | 33.96 | 16.12 | % | $ | 81,509 | 0.79 | % | (0.79 | )% | 0 | % | ||||||||||||||||||||||||||||
For the year ended 10/31/2020 | $ | 27.38 | (0.22 | ) | 2.03 | 1.81 | 0.06 | 1.87 | $ | 29.25 | 6.81 | % | $ | 32,172 | 0.79 | % | (0.79 | )% | 0 | % | ||||||||||||||||||||||||||||
For the period 5/31/2019 (d) - 10/31/2019 | $ | 25.33 | (0.09 | ) | 2.11 | 2.02 | 0.03 | 2.05 | $ | 27.38 | 8.10 | % | $ | 4,792 | 0.80 | %(f) | (0.80 | )% | 0 | % | ||||||||||||||||||||||||||||
| Innovator U.S. Equity Buffer ETF - July | ||||||||||||||||||||||||||||||||||||||||||||||||
For the period 11/1/2021 (d) - 4/30/2022 | $ | 32.69 | (0.13 | ) | (1.59 | ) | (1.72 | ) | 0.02 | (1.70 | ) | $ | 30.99 | (5.21 | )% | $ | 94,507 | 0.79 | % | (0.79 | )% | 0 | % | |||||||||||||||||||||||||
For the year ended 10/31/2021 | $ | 27.94 | (0.25 | ) | 4.97 | 4.72 | 0.03 | 4.75 | $ | 32.69 | 17.53 | % | $ | 183,066 | 0.79 | % | (0.79 | )% | 0 | % | ||||||||||||||||||||||||||||
For the year ended 10/31/2020 | $ | 26.55 | (0.21 | ) | 1.56 | 1.35 | 0.04 | 1.39 | $ | 27.94 | 5.24 | %(g) | $ | 67,755 | 0.79 | % | (0.79 | )% | 4 | % | ||||||||||||||||||||||||||||
For the year ended 10/31/2019 | $ | 24.61 | (0.21 | ) | 2.09 | 1.88 | 0.06 | 1.94 | $ | 26.55 | 7.89 | % | $ | 83,639 | 0.81 | %(f)(h) | (0.80 | )% | 106 | % | ||||||||||||||||||||||||||||
For the period 8/28/2018 (d) - 10/31/2018 | $ | 25.51 | (0.03 | ) | (0.90 | ) | (0.93 | ) | 0.03 | (0.90 | ) | $ | 24.61 | 3.53 | % | $ | 3,691 | 0.79 | % | (0.78 | )% | 0 | % | |||||||||||||||||||||||||
| Innovator U.S. Equity Buffer ETF - August | ||||||||||||||||||||||||||||||||||||||||||||||||
For the period 11/1/2021 (d) - 4/30/2022 | $ | 32.65 | (0.13 | ) | (1.86 | ) | (1.99 | ) | 0.01 | (1.98 | ) | $ | 30.67 | (6.08 | )% | $ | 112,710 | 0.79 | % | (0.79 | )% | 0 | % | |||||||||||||||||||||||||
For the year ended 10/31/2021 | $ | 27.49 | (0.24 | ) | 5.38 | 5.14 | 0.02 | 5.16 | $ | 32.65 | 18.81 | % | $ | 86,535 | 0.79 | % | (0.79 | )% | 0 | % | ||||||||||||||||||||||||||||
For the year ended 10/31/2020 | $ | 25.53 | (0.21 | ) | 2.15 | 1.94 | 0.02 | 1.96 | $ | 27.49 | 7.68 | % | $ | 48,099 | 0.79 | % | (0.79 | )% | 0 | % | ||||||||||||||||||||||||||||
For the period 7/31/2019 (d) - 10/31/2019 | $ | 25.04 | (0.05 | ) | 0.52 | 0.47 | 0.02 | 0.49 | $ | 25.53 | 1.94 | % | $ | 47,221 | 0.79 | % | (0.79 | )% | 0 | % | ||||||||||||||||||||||||||||
(a) | Annualized for periods less than one year. |
(b) | Net investment income/(loss) per share has been calculated based on average shares outstanding during the period. |
(c) | Not annualized for periods less than one year. |
(d) | Amount represents less than $0.01 per share. |
(e) | Commencement of operations. |
(f) | Includes broker interest expense of 0.01%. |
(g) | The total return for the period includes the impact of financial statement adjustments. This return differs from the actual performance a shareholder experienced over the period. |
(h) | Includes extraordinary expense of 0.01%. |
INNOVATOR ETFs TRUST
Financial Highlights
Per Share Operating Performance (For a share outstanding throughout each period) | Ratios/Supplemental Data: | |||||||||||||||||||||||||||||||||||||||||||||||||||
Investment Operations: | Capital Share Transactions: | Ratio to Average Net Assets of: (a) | ||||||||||||||||||||||||||||||||||||||||||||||||||
Net Asset Value, Beginning of Period | Net investment income/(loss) (b) | Net realized and unrealized gain/(loss) | Total From Investment Operations | Transaction fees (see Note 5) | Distributions Paid to Shareholders: | Change in Net Asset Value for the Period | Net Asset Value, End of Period | Total return (c) | Net assets, end of period (000) | Expenses | Net investment income/(loss) | Portfolio turnover rate (c) | ||||||||||||||||||||||||||||||||||||||||
| Innovator U.S. Equity Buffer ETF - September | ||||||||||||||||||||||||||||||||||||||||||||||||||||
For the period 11/1/2021 (d) - 4/30/2022 | $ | 32.66 | (0.13 | ) | (1.96 | ) | (2.09 | ) | 0.01 | – | (2.08 | ) | $ | 30.58 | (6.37 | )% | $ | 141,416 | 0.79 | % | (0.79 | )% | 0 | % | ||||||||||||||||||||||||||||
For the year ended 10/31/2021 | $ | 26.40 | (0.24 | ) | 6.47 | 6.23 | 0.03 | – | 6.26 | $ | 32.66 | 23.68 | % | $ | 156,749 | 0.79 | % | (0.79 | )% | 0 | % | |||||||||||||||||||||||||||||||
For the year ended 10/31/2020 | $ | 25.31 | (0.21 | ) | 1.59 | (e) | 1.38 | 0.07 | (0.36 | ) | 1.09 | $ | 26.40 | 5.81 | % | $ | 77,892 | 0.79 | % | (0.79 | )% | 0 | % | |||||||||||||||||||||||||||||
For the period 8/30/2019 (d) - 10/31/2019 | $ | 24.59 | (0.03 | ) | 0.73 | 0.70 | 0.02 | – | 0.72 | $ | 25.31 | 2.91 | % | $ | 4,429 | 0.79 | % | (0.79 | )% | 186 | % | |||||||||||||||||||||||||||||||
| Innovator U.S. Equity Buffer ETF - October | ||||||||||||||||||||||||||||||||||||||||||||||||||||
For the period 11/1/2021 (d) - 4/30/2022 | $ | 33.90 | (0.13 | ) | (1.81 | ) | (1.94 | ) | 0.00 | (f) | – | (1.94 | ) | $ | 31.96 | (5.74 | )% | $ | 91,074 | 0.79 | % | (0.79 | )% | 0 | % | |||||||||||||||||||||||||||
For the year ended 10/31/2021 | $ | 27.26 | (0.25 | ) | 6.88 | 6.63 | 0.01 | – | 6.64 | $ | 33.90 | 24.34 | % | $ | 111,875 | 0.79 | % | (0.79 | )% | 0 | % | |||||||||||||||||||||||||||||||
For the year ended 10/31/2020 | $ | 25.18 | (0.20 | ) | 2.31 | 2.11 | 0.02 | (0.05 | ) | 2.08 | $ | 27.26 | 8.51 | % | $ | 73,613 | 0.79 | % | (0.79 | )% | 0 | % | ||||||||||||||||||||||||||||||
For the year ended 10/31/2019 | $ | 23.42 | (0.20 | ) | 1.92 | 1.72 | 0.04 | – | 1.76 | $ | 25.18 | 7.48 | % | $ | 173,098 | 0.80 | %(g) | (0.80 | )% | 25 | % | |||||||||||||||||||||||||||||||
For the period 9/28/2018 (d) - 10/31/2018 | $ | 24.49 | (0.01 | ) | (1.07 | ) | (1.08 | ) | 0.01 | – | (1.07 | ) | $ | 23.42 | (4.35 | )% | $ | 21,082 | 0.79 | % | (0.79 | )% | 4 | % | ||||||||||||||||||||||||||||
| Innovator U.S. Equity Buffer ETF - November | ||||||||||||||||||||||||||||||||||||||||||||||||||||
For the period 11/1/2021 (d) - 4/30/2022 | $ | 32.21 | (0.12 | ) | (2.01 | ) | (2.13 | ) | 0.02 | – | (2.11 | ) | $ | 30.10 | (6.58 | )% | $ | 74,489 | 0.79 | % | (0.79 | )% | 0 | % | ||||||||||||||||||||||||||||
For the year ended 10/31/2021 | $ | 27.31 | (0.24 | ) | 5.12 | 4.88 | 0.02 | – | 4.90 | $ | 32.21 | 17.93 | % | $ | 30,599 | 0.79 | % | (0.79 | )% | 0 | % | |||||||||||||||||||||||||||||||
For the year ended 10/31/2020 | $ | 25.53 | (0.20 | ) | 1.92 | 1.72 | 0.06 | – | 1.78 | $ | 27.31 | 7.00 | % | $ | 15,023 | 0.79 | % | (0.79 | )% | 0 | % | |||||||||||||||||||||||||||||||
For the period 10/31/2019 (d) - 10/31/2019 | $ | 25.53 | – | – | – | – | – | – | $ | 25.53 | – | $ | 2,553 | – | – | – | % | |||||||||||||||||||||||||||||||||||
| Innovator U.S. Equity Buffer ETF - December | ||||||||||||||||||||||||||||||||||||||||||||||||||||
For the period 11/1/2021 (d) - 4/30/2022 | $ | 34.04 | (0.13 | ) | (1.92 | ) | (2.05 | ) | 0.01 | – | (2.04 | ) | $ | 32.00 | (6.00 | )% | $ | 90,405 | 0.79 | % | (0.79 | )% | 0 | % | ||||||||||||||||||||||||||||
For the year ended 10/31/2021 | $ | 27.73 | (0.25 | ) | 6.53 | 6.28 | 0.03 | – | 6.31 | $ | 34.04 | 22.76 | % | $ | 57,874 | 0.79 | % | (0.79 | )% | 0 | % | |||||||||||||||||||||||||||||||
For the period 11/29/2019 (d) - 10/31/2020 | $ | 26.40 | (0.19 | ) | 1.47 | 1.28 | 0.05 | – | 1.33 | $ | 27.73 | 5.04 | % | $ | 24,958 | 0.79 | % | (0.79 | )% | 146 | % | |||||||||||||||||||||||||||||||
(a) | Annualized for periods less than one year. |
(b) | Net investment income/(loss) per share has been calculated based on average shares outstanding during the period. |
(c) | Not annualized for periods less than one year. |
(d) | Net realized and unrealized gain/(loss) per share includes balancing amounts necessary to reconcile the change in net asset value per share for the period, and may not reconcile with the aggregate gain/(loss) in the Statement of Operations due to share transactions for the period. |
(e) | Commencement of operations. |
(f) | Amount represents less than $0.01 per share. |
(g) | Includes broker interest expense of 0.01%. |
INNOVATOR ETFs TRUST
Financial Highlights
Per Share Operating Performance (For a share outstanding throughout each period) | Ratios/Supplemental Data: | |||||||||||||||||||||||||||||||||||||||||||||||||||
Investment Operations: | Capital Share Transactions: | Ratio to Average Net Assets of: (a) | ||||||||||||||||||||||||||||||||||||||||||||||||||
Net Asset Value, Beginning of Period | Net investment income/(loss) (b) | Net realized and unrealized gain/(loss) | Total From Investment Operations | Transaction fees (see Note 5) | Distributions Paid to Shareholders: | Change in Net Asset Value for the Period | Net Asset Value, End of Period | Total return (c) | Net assets, end of period (000) | Expenses | Net investment income/(loss) | Portfolio turnover rate (c) | ||||||||||||||||||||||||||||||||||||||||
| Innovator U.S. Equity Power Buffer ETF - January | ||||||||||||||||||||||||||||||||||||||||||||||||||||
For the period 11/1/2021 (d) - 4/30/2022 | $ | 33.10 | (0.13 | ) | (1.99 | ) | (2.12 | ) | 0.02 | – | (2.10 | ) | $ | 31.00 | (6.33 | )% | $ | 548,748 | 0.79 | % | (0.79 | )% | 0 | % | ||||||||||||||||||||||||||||
For the year ended 10/31/2021 | $ | 29.08 | (0.25 | ) | 4.25 | 4.00 | 0.02 | – | 4.02 | $ | 33.10 | 13.82 | % | $ | 294,561 | 0.79 | % | (0.79 | )% | 0 | % | |||||||||||||||||||||||||||||||
For the year ended 10/31/2020 | $ | 28.13 | (0.22 | ) | 1.14 | 0.92 | 0.03 | – | 0.95 | $ | 29.08 | 3.38 | % | $ | 288,597 | 0.79 | % | (0.79 | )% | 0 | % | |||||||||||||||||||||||||||||||
For the period 12/31/2018 (d) - 10/31/2019 | $ | 25.08 | (0.18 | ) | 3.20 | 3.02 | 0.03 | – | 3.05 | $ | 28.13 | 12.15 | % | $ | 67,507 | 0.79 | % | (0.79 | )% | 0 | % | |||||||||||||||||||||||||||||||
| Innovator U.S. Equity Power Buffer ETF - February | ||||||||||||||||||||||||||||||||||||||||||||||||||||
For the period 11/1/2021 (d) - 4/30/2022 | $ | 29.01 | (0.11 | ) | (0.98 | ) | (1.09 | ) | 0.02 | – | (1.07 | ) | $ | 27.94 | (3.68 | )% | $ | 305,229 | 0.79 | % | (0.79 | )% | 0 | % | ||||||||||||||||||||||||||||
For the year ended 10/31/2021 | $ | 25.03 | (0.22 | ) | 4.18 | 3.96 | 0.02 | – | 3.98 | $ | 29.01 | 15.90 | % | $ | 170,407 | 0.79 | % | (0.79 | )% | 0 | % | |||||||||||||||||||||||||||||||
For the period 1/31/2020 (d) - 10/31/2020 | $ | 24.52 | (0.14 | ) | 0.63 | 0.49 | 0.02 | – | 0.51 | $ | 25.03 | 2.06 | % | $ | 115,121 | 0.79 | % | (0.79 | )% | 0 | % | |||||||||||||||||||||||||||||||
| Innovator U.S. Equity Power Buffer ETF - March | ||||||||||||||||||||||||||||||||||||||||||||||||||||
For the period 11/1/2021 (d) - 4/30/2022 | $ | 31.23 | (0.12 | ) | (0.39 | ) | (0.51 | ) | 0.02 | – | (0.49 | ) | $ | 30.74 | (1.56 | )% | $ | 238,225 | 0.79 | % | (0.79 | )% | 0 | % | ||||||||||||||||||||||||||||
For the year ended 10/31/2021 | $ | 27.39 | (0.24 | ) | 4.06 | 3.82 | 0.02 | – | 3.84 | $ | 31.23 | 14.01 | % | $ | 117,875 | 0.79 | % | (0.79 | )% | 0 | % | |||||||||||||||||||||||||||||||
For the period 2/28/2020 (d) - 10/31/2020 | $ | 26.01 | (0.14 | ) | 1.50 | 1.36 | 0.02 | – | 1.38 | $ | 27.39 | 5.30 | % | $ | 71,895 | 0.79 | % | (0.79 | )% | 0 | % | |||||||||||||||||||||||||||||||
| Innovator U.S. Equity Power Buffer ETF - April | ||||||||||||||||||||||||||||||||||||||||||||||||||||
For the period 11/1/2021 (d) - 4/30/2022 | $ | 29.04 | (0.11 | ) | (0.82 | ) | (0.93 | ) | 0.01 | – | (0.92 | ) | $ | 28.12 | (3.17 | )% | $ | 310,040 | 0.79 | % | (0.79 | )% | 0 | % | ||||||||||||||||||||||||||||
For the year ended 10/31/2021 | $ | 26.54 | (0.22 | ) | 2.70 | 2.48 | 0.02 | – | 2.50 | $ | 29.04 | 9.45 | % | $ | 242,503 | 0.79 | % | (0.79 | )% | 0 | % | |||||||||||||||||||||||||||||||
For the year ended 10/31/2020 | $ | 26.31 | (0.20 | ) | 1.20 | 1.00 | 0.03 | (0.80 | ) | 0.23 | $ | 26.54 | 4.00 | % | $ | 187,078 | 0.79 | % | (0.79 | )% | 0 | % | ||||||||||||||||||||||||||||||
For the period 3/29/2019 (d) - 10/31/2019 | $ | 24.95 | (0.12 | ) | 1.46 | 1.34 | 0.02 | – | 1.36 | $ | 26.31 | 5.44 | % | $ | 129,561 | 0.79 | % | (0.79 | )% | 126 | % | |||||||||||||||||||||||||||||||
(a) | Annualized for periods less than one year. |
(b) | Net investment income/(loss) per share has been calculated based on average shares outstanding during the period. |
(c) | Not annualized for periods less than one year. |
(d) | Commencement of operations. |
INNOVATOR ETFs TRUST
Financial Highlights
Per Share Operating Performance (For a share outstanding throughout each period) | Ratios/Supplemental Data: | |||||||||||||||||||||||||||||||||||||||||||||||||||
Investment Operations: | Capital Share Transactions: | Ratio to Average Net Assets of: (a) | ||||||||||||||||||||||||||||||||||||||||||||||||||
Net Asset Value, Beginning of Period | Net investment income/(loss) (b) | Net realized and unrealized gain/(loss) | Total From Investment Operations | Transaction fees (see Note 5) | Distributions Paid to Shareholders: | Change in Net Asset Value for the Period | Net Asset Value, End of Period | Total return (c) | Net assets, end of period (000) | Expenses | Net investment income/(loss) | Portfolio turnover rate (c) | ||||||||||||||||||||||||||||||||||||||||
| Innovator U.S. Equity Power Buffer ETF - May | ||||||||||||||||||||||||||||||||||||||||||||||||||||
For the period 11/1/2021 (d) - 4/30/2022 | $ | 30.23 | (0.12 | ) | (1.47 | ) | (1.59 | ) | 0.01 | – | (1.58 | ) | $ | 28.65 | (5.20 | )% | $ | 201,257 | 0.79 | % | (0.79 | )% | 0 | % | ||||||||||||||||||||||||||||
For the year ended 10/31/2021 | $ | 27.34 | (0.23 | ) | 3.10 | 2.87 | 0.02 | – | 2.89 | $ | 30.23 | 10.54 | % | $ | 238,780 | 0.79 | % | (0.79 | )% | 0 | % | |||||||||||||||||||||||||||||||
For the period 4/30/2020 (d) - 10/31/2020 | $ | 25.63 | (0.11 | ) | 1.80 | 1.69 | 0.02 | – | 1.71 | $ | 27.34 | 6.69 | % | $ | 65,626 | 0.79 | % | (0.79 | )% | 0 | % | |||||||||||||||||||||||||||||||
| Innovator U.S. Equity Power Buffer ETF - June | ||||||||||||||||||||||||||||||||||||||||||||||||||||
For the period 11/1/2021 (d) - 4/30/2022 | $ | 31.87 | (0.12 | ) | (0.84 | ) | (0.96 | ) | 0.00 | (e) | – | (0.96 | ) | $ | 30.91 | (3.01 | )% | $ | 137,550 | 0.79 | % | (0.79 | )% | 0 | % | |||||||||||||||||||||||||||
For the year ended 10/31/2021 | $ | 28.88 | (0.24 | ) | 3.20 | 2.96 | 0.03 | – | 2.99 | $ | 31.87 | 10.34 | % | $ | 152,966 | 0.79 | % | (0.79 | )% | 0 | % | |||||||||||||||||||||||||||||||
For the year ended 10/31/2020 | $ | 26.74 | (0.22 | ) | 2.30 | 2.08 | 0.06 | – | 2.14 | $ | 28.88 | 8.00 | % | $ | 94,588 | 0.79 | % | (0.79 | )% | 0 | % | |||||||||||||||||||||||||||||||
For the period 5/31/2019 (d) - 10/31/2019 | $ | 25.33 | (0.09 | ) | 1.48 | 1.39 | 0.02 | – | 1.41 | $ | 26.74 | 5.58 | % | $ | 20,057 | 0.79 | % | (0.79 | )% | 0 | % | |||||||||||||||||||||||||||||||
| Innovator U.S. Equity Power Buffer ETF - July | ||||||||||||||||||||||||||||||||||||||||||||||||||||
For the period 11/1/2021 (d) - 4/30/2022 | $ | 30.38 | (0.12 | ) | (0.81 | ) | (0.93 | ) | 0.01 | – | (0.92 | ) | $ | 29.46 | (3.05 | )% | $ | 169,373 | 0.79 | % | (0.79 | )% | 0 | % | ||||||||||||||||||||||||||||
For the year ended 10/31/2021 | $ | 27.43 | (0.23 | ) | 3.16 | 2.93 | 0.02 | – | 2.95 | $ | 30.38 | 10.78 | % | $ | 218,755 | 0.79 | % | (0.79 | )% | 0 | % | |||||||||||||||||||||||||||||||
For the year ended 10/31/2020 | $ | 26.36 | (0.21 | ) | 1.46 | 1.25 | 0.04 | (0.22 | ) | 1.07 | $ | 27.43 | 4.89 | % | $ | 111,759 | 0.79 | % | (0.79 | )% | 15 | % | ||||||||||||||||||||||||||||||
For the year ended 10/31/2019 | $ | 24.75 | (0.20 | ) | 1.77 | 1.57 | 0.04 | – | 1.61 | $ | 26.36 | 6.53 | % | $ | 92,273 | 0.79 | % | (0.79 | )% | 137 | % | |||||||||||||||||||||||||||||||
For the period 8/7/2018 (d) - 10/31/2018 | $ | 25.17 | (0.04 | ) | (0.39 | ) | (0.43 | ) | 0.01 | – | (0.42 | ) | $ | 24.75 | (1.68 | )% | $ | 3,712 | 0.79 | % | (0.79 | )% | 0 | % | ||||||||||||||||||||||||||||
| Innovator U.S. Equity Power Buffer ETF - August | ||||||||||||||||||||||||||||||||||||||||||||||||||||
For the period 11/1/2021 (d) - 4/30/2022 | $ | 30.00 | (0.12 | ) | (0.94 | ) | (1.06 | ) | 0.00 | (e) | – | (1.06 | ) | $ | 28.94 | (3.54 | )% | $ | 176,515 | 0.79 | % | (0.79 | )% | 0 | % | |||||||||||||||||||||||||||
For the year ended 10/31/2021 | $ | 26.86 | (0.23 | ) | 3.35 | 3.12 | 0.02 | �� | – | 3.14 | $ | 30.00 | 11.68 | % | $ | 185,991 | 0.79 | % | (0.79 | )% | 0 | % | ||||||||||||||||||||||||||||||
For the year ended 10/31/2020 | $ | 25.45 | (0.21 | ) | 1.93 | 1.72 | 0.03 | (0.34 | ) | 1.41 | $ | 26.86 | 6.95 | % | $ | 109,458 | 0.79 | % | (0.79 | )% | 0 | % | ||||||||||||||||||||||||||||||
For the period 7/31/2019 (d) - 10/31/2019 | $ | 25.04 | (0.05 | ) | 0.44 | 0.39 | 0.02 | – | 0.41 | $ | 25.45 | 1.65 | % | $ | 116,446 | 0.79 | % | (0.79 | )% | 0 | % | |||||||||||||||||||||||||||||||
(a) | Annualized for periods less than one year. |
(b) | Net investment income/(loss) per share has been calculated based on average shares outstanding during the period. |
(c) | Not annualized for periods less than one year. |
(d) | Commencement of operations. |
(e) | Amount represents less than $0.01 per share. |
INNOVATOR ETFs TRUST
Financial Highlights
Per Share Operating Performance (For a share outstanding throughout each period) | Ratios/Supplemental Data: | |||||||||||||||||||||||||||||||||||||||||||||||||||
Investment Operations: | Capital Share Transactions: | Ratio to Average Net Assets of: (a) | ||||||||||||||||||||||||||||||||||||||||||||||||||
Net Asset Value, Beginning of Period | Net investment income/(loss) (b) | Net realized and unrealized gain/(loss) | Total From Investment Operations | Transaction fees (see Note 5) | Distributions Paid to Shareholders: | Change in Net Asset Value for the Period | Net Asset Value, End of Period | Total return (c) | Net assets, end of period (000) | Expenses | Net investment income/(loss) | Portfolio turnover rate (c) | ||||||||||||||||||||||||||||||||||||||||
| Innovator U.S. Equity Power Buffer ETF - September | ||||||||||||||||||||||||||||||||||||||||||||||||||||
For the period 11/1/2021 (d) - 4/30/2022 | $ | 29.97 | (0.12 | ) | (1.19 | ) | (1.31 | ) | 0.01 | – | (1.30 | ) | $ | 28.67 | (4.34 | )% | $ | 271,663 | 0.79 | % | (0.79 | )% | 0 | % | ||||||||||||||||||||||||||||
For the year ended 10/31/2021 | $ | 26.01 | (0.23 | ) | 4.17 | 3.94 | 0.02 | – | 3.96 | $ | 29.97 | 15.24 | % | $ | 303,473 | 0.79 | % | (0.79 | )% | 0 | % | |||||||||||||||||||||||||||||||
For the year ended 10/31/2020 | $ | 25.15 | (0.21 | ) | 1.01 | (e) | 0.80 | 0.06 | – | 0.86 | $ | 26.01 | 3.40 | % | $ | 287,388 | 0.79 | % | (0.79 | )% | 3 | % | ||||||||||||||||||||||||||||||
For the period 8/30/2019 (d) - 10/31/2019 | $ | 24.59 | (0.03 | ) | 0.58 | 0.55 | 0.01 | – | 0.56 | $ | 25.15 | 2.29 | % | $ | 20,122 | 0.79 | % | (0.79 | )% | 127 | % | |||||||||||||||||||||||||||||||
| Innovator U.S. Equity Power Buffer ETF - October | ||||||||||||||||||||||||||||||||||||||||||||||||||||
For the period 11/1/2021 (d) - 4/30/2022 | $ | 30.04 | (0.12 | ) | (0.97 | ) | (1.09 | ) | 0.00 | (f) | – | (1.09 | ) | $ | 28.95 | (3.64 | )% | $ | 185,987 | 0.79 | % | (0.79 | )% | 0 | % | |||||||||||||||||||||||||||
For the year ended 10/31/2021 | $ | 26.02 | (0.23 | ) | 4.23 | 4.00 | 0.02 | – | 4.02 | $ | 30.04 | 15.44 | % | $ | 209,533 | 0.79 | % | (0.79 | )% | 0 | % | |||||||||||||||||||||||||||||||
For the year ended 10/31/2020 | $ | 25.16 | (0.20 | ) | 1.60 | 1.40 | 0.02 | (0.56 | ) | 0.86 | $ | 26.02 | 5.74 | % | $ | 189,967 | 0.79 | % | (0.79 | )% | 0 | % | ||||||||||||||||||||||||||||||
For the year ended 10/31/2019 | $ | 23.54 | (0.20 | ) | 1.79 | 1.59 | 0.03 | – | 1.62 | $ | 25.16 | 6.90 | % | $ | 311,363 | 0.80 | %(g) | (0.79 | )% | 3 | % | |||||||||||||||||||||||||||||||
For the period 9/28/2018 (d) - 10/31/2018 | $ | 24.49 | (0.01 | ) | (0.95 | ) | (0.96 | ) | 0.01 | – | (0.95 | ) | $ | 23.54 | (3.89 | )% | $ | 11,180 | 0.79 | % | (0.79 | )% | 4 | % | ||||||||||||||||||||||||||||
| Innovator U.S. Equity Power Buffer ETF - November | ||||||||||||||||||||||||||||||||||||||||||||||||||||
For the period 11/1/2021 (d) - 4/30/2022 | $ | 30.52 | �� | (0.12 | ) | (1.31 | ) | (1.43 | ) | 0.01 | – | (1.42 | ) | $ | 29.10 | (4.65 | )% | $ | 202,999 | 0.79 | % | (0.79 | )% | 0 | % | |||||||||||||||||||||||||||
For the year ended 10/31/2021 | $ | 27.30 | (0.23 | ) | 3.44 | 3.21 | 0.01 | – | 3.22 | $ | 30.52 | 11.80 | % | $ | 79,343 | 0.79 | % | (0.79 | )% | 0 | % | |||||||||||||||||||||||||||||||
For the year ended 10/31/2020 | $ | 25.53 | (0.21 | ) | 1.94 | 1.73 | 0.04 | – | 1.77 | $ | 27.30 | 6.94 | % | $ | 38,217 | 0.79 | % | (0.79 | )% | 0 | % | |||||||||||||||||||||||||||||||
For the period 10/31/2019 (d) - 10/31/2019 | $ | 25.53 | – | – | – | – | – | – | $ | 25.53 | – | $ | 2,553 | – | – | – | % | |||||||||||||||||||||||||||||||||||
| Innovator U.S. Equity Power Buffer ETF - December | ||||||||||||||||||||||||||||||||||||||||||||||||||||
For the period 11/1/2021 (d) - 4/30/2022 | $ | 31.01 | (0.12 | ) | (1.25 | ) | (1.37 | ) | 0.01 | – | (1.36 | ) | $ | 29.65 | (4.36 | )% | $ | 226,115 | 0.79 | % | (0.79 | )% | 0 | % | ||||||||||||||||||||||||||||
For the year ended 10/31/2021 | $ | 27.42 | (0.24 | ) | 3.80 | 3.56 | 0.03 | – | 3.59 | $ | 31.01 | 13.10 | % | $ | 108,520 | 0.79 | % | (0.79 | )% | 0 | % | |||||||||||||||||||||||||||||||
For the period 11/29/2019 (d) - 10/31/2020 | $ | 26.40 | (0.19 | ) | 1.17 | 0.98 | 0.04 | – | 1.02 | $ | 27.42 | 3.85 | % | $ | 65,111 | 0.79 | % | (0.79 | )% | 141 | % | |||||||||||||||||||||||||||||||
(a) | Annualized for periods less than one year. |
(b) | Net investment income/(loss) per share has been calculated based on average shares outstanding during the period. |
(c) | Not annualized for periods less than one year. |
(d) | Net realized and unrealized gain/(loss) per share includes balancing amounts necessary to reconcile the change in net asset value per share for the period, and may not reconcile with the aggregate gain/(loss) in the Statement of Operations due to share transactions for the period. |
(e) | Commencement of operations. |
(f) | Amount represents less than $0.01 per share. |
(g) | Includes broker interest expense of 0.01%. |
INNOVATOR ETFs TRUST
Financial Highlights
Per Share Operating Performance (For a share outstanding throughout each period) | Ratios/Supplemental Data: | |||||||||||||||||||||||||||||||||||||||||||||||||||
Investment Operations: | Capital Share Transactions: | Ratio to Average Net Assets of: (a) | ||||||||||||||||||||||||||||||||||||||||||||||||||
Net Asset Value, Beginning of Period | Net investment income/(loss) (b) | Net realized and unrealized gain/(loss) | Total From Investment Operations | Transaction fees (see Note 5) | Distributions Paid to Shareholders: | Change in Net Asset Value for the Period | Net Asset Value, End of Period | Total return (c) | Net assets, end of period (000) | Expenses | Net investment income/(loss) | Portfolio turnover rate (c) | ||||||||||||||||||||||||||||||||||||||||
| Innovator U.S. Equity Ultra Buffer ETF - January | ||||||||||||||||||||||||||||||||||||||||||||||||||||
For the period 11/1/2021 (d) - 4/30/2022 | $ | 31.37 | (0.12 | ) | (1.59 | ) | (1.71 | ) | 0.02 | – | (1.69 | ) | $ | 29.68 | (5.39 | )% | $ | 274,555 | 0.79 | % | (0.79 | )% | 0 | % | ||||||||||||||||||||||||||||
For the year ended 10/31/2021 | $ | 28.36 | (0.24 | ) | 3.23 | 2.99 | 0.02 | – | 3.01 | $ | 31.37 | 10.62 | % | $ | 86,274 | 0.79 | % | (0.79 | )% | 0 | % | |||||||||||||||||||||||||||||||
For the year ended 10/31/2020 | $ | 27.69 | (0.22 | ) | 0.86 | 0.64 | 0.03 | – | 0.67 | $ | 28.36 | 2.44 | % | $ | 112,023 | 0.79 | % | (0.79 | )% | 0 | % | |||||||||||||||||||||||||||||||
For the period 12/31/2018 (d) - 10/31/2019 | $ | 25.08 | (0.18 | ) | 2.77 | 2.59 | 0.02 | – | 2.61 | $ | 27.69 | 10.39 | % | $ | 30,455 | 0.79 | % | (0.79 | )% | 0 | % | |||||||||||||||||||||||||||||||
| Innovator U.S. Equity Ultra Buffer ETF - February | ||||||||||||||||||||||||||||||||||||||||||||||||||||
For the period 11/1/2021 (d) - 4/30/2022 | $ | 27.80 | (0.11 | ) | (0.73 | ) | (0.84 | ) | 0.01 | – | (0.83 | ) | $ | 26.97 | (2.98 | )% | $ | 41,804 | 0.79 | % | (0.79 | )% | 0 | % | ||||||||||||||||||||||||||||
For the year ended 10/31/2021 | $ | 24.91 | (0.21 | ) | 3.08 | 2.87 | 0.02 | – | 2.89 | $ | 27.80 | 11.61 | % | $ | 26,409 | 0.79 | % | (0.79 | )% | 0 | % | |||||||||||||||||||||||||||||||
For the period 1/31/2020 (d) - 10/31/2020 | $ | 24.52 | (0.14 | ) | 0.50 | 0.36 | 0.03 | – | 0.39 | $ | 24.91 | 1.58 | % | $ | 31,757 | 0.79 | % | (0.79 | )% | 0 | % | |||||||||||||||||||||||||||||||
| Innovator U.S. Equity Ultra Buffer ETF - March | ||||||||||||||||||||||||||||||||||||||||||||||||||||
For the period 11/1/2021 (d) - 4/30/2022 | $ | 29.56 | (0.12 | ) | (0.40 | ) | (0.52 | ) | 0.01 | – | (0.51 | ) | $ | 29.05 | (1.73 | )% | $ | 39,939 | 0.79 | % | (0.79 | )% | 0 | % | ||||||||||||||||||||||||||||
For the year ended 10/31/2021 | $ | 26.93 | (0.23 | ) | 2.84 | 2.61 | 0.02 | – | 2.63 | $ | 29.56 | 9.76 | % | $ | 33,251 | 0.79 | % | (0.79 | )% | 0 | % | |||||||||||||||||||||||||||||||
For the period 2/28/2020 (d) - 10/31/2020 | $ | 26.01 | (0.14 | ) | 1.03 | 0.89 | 0.03 | – | 0.92 | $ | 26.93 | 3.53 | % | $ | 28,275 | 0.79 | % | (0.79 | )% | 0 | % | |||||||||||||||||||||||||||||||
| Innovator U.S. Equity Ultra Buffer ETF - April | ||||||||||||||||||||||||||||||||||||||||||||||||||||
For the period 11/1/2021 (d) - 4/30/2022 | $ | 26.02 | (0.10 | ) | (0.53 | ) | (0.63 | ) | 0.01 | – | (0.62 | ) | $ | 25.40 | (2.39 | )% | $ | 52,700 | 0.79 | % | (0.79 | )% | 0 | % | ||||||||||||||||||||||||||||
For the year ended 10/31/2021 | $ | 24.47 | (0.20 | ) | 1.72 | 1.52 | 0.03 | – | 1.55 | $ | 26.02 | 6.31 | % | $ | 57,242 | 0.79 | % | (0.79 | )% | 0 | % | |||||||||||||||||||||||||||||||
For the year ended 10/31/2020 | $ | 26.22 | (0.19 | ) | (1.01 | )(e) | (1.20 | ) | 0.02 | (0.57 | ) | (1.75 | ) | $ | 24.47 | (4.59 | )% | $ | 30,594 | 0.79 | % | (0.79 | )% | 0 | % | |||||||||||||||||||||||||||
For the period 3/29/2019 (d) - 10/31/2019 | $ | 24.95 | (0.12 | ) | 1.37 | 1.25 | 0.02 | – | 1.27 | $ | 26.22 | 5.07 | % | $ | 19,006 | 0.79 | % | (0.79 | )% | 106 | % | |||||||||||||||||||||||||||||||
(a) | Annualized for periods less than one year. |
(b) | Net investment income/(loss) per share has been calculated based on average shares outstanding during the period. |
(c) | Not annualized for periods less than one year. |
(d) | Commencement of operations. |
(e) | Net realized and unrealized gain/(loss) per share includes balancing amounts necessary to reconcile the change in net asset value per share for the period, and may not reconcile with the aggregate gain/(loss) in the Statement of Operations due to share transactions for the period. |
INNOVATOR ETFs TRUST
Financial Highlights
Per Share Operating Performance (For a share outstanding throughout each period) | Ratios/Supplemental Data: | |||||||||||||||||||||||||||||||||||||||||||||||||||
Investment Operations: | Capital Share Transactions: | Ratio to Average Net Assets of: (a) | ||||||||||||||||||||||||||||||||||||||||||||||||||
Net Asset Value, Beginning of Period | Net investment income/(loss) (b) | Net realized and unrealized gain/(loss) | Total From Investment Operations | Transaction fees (see Note 5) | Distributions Paid to Shareholders: | Change in Net Asset Value for the Period | Net Asset Value, End of Period | Total return (c) | Net assets, end of period (000) | Expenses | Net investment income/(loss) | Portfolio turnover rate (c) | ||||||||||||||||||||||||||||||||||||||||
| Innovator U.S. Equity Ultra Buffer ETF - May | ||||||||||||||||||||||||||||||||||||||||||||||||||||
For the period 11/1/2021 (d) - 4/30/2022 | $ | 28.52 | (0.11 | ) | (1.40 | ) | (1.51 | ) | 0.01 | – | (1.50 | ) | $ | 27.02 | (5.20 | )% | $ | 29,725 | 0.79 | % | (0.79 | )% | 0 | % | ||||||||||||||||||||||||||||
For the year ended 10/31/2021 | $ | 26.67 | (0.22 | ) | 2.05 | 1.83 | 0.02 | – | 1.85 | $ | 28.52 | 6.91 | % | $ | 40,634 | 0.79 | % | (0.79 | )% | 0 | % | |||||||||||||||||||||||||||||||
For the period 4/30/2020 (d) - 10/31/2020 | $ | 25.63 | (0.11 | ) | 1.14 | 1.03 | 0.01 | – | 1.04 | $ | 26.67 | 4.06 | % | $ | 10,669 | 0.79 | % | (0.79 | )% | 0 | % | |||||||||||||||||||||||||||||||
| Innovator U.S. Equity Ultra Buffer ETF - June | ||||||||||||||||||||||||||||||||||||||||||||||||||||
For the period 11/1/2021 (d) - 4/30/2022 | $ | 29.18 | (0.11 | ) | (0.97 | ) | (1.08 | ) | 0.00 | (e) | – | (1.08 | ) | $ | 28.10 | (3.71 | )% | $ | 16,858 | 0.79 | % | (0.79 | )% | 0 | % | |||||||||||||||||||||||||||
For the year ended 10/31/2021 | $ | 27.24 | (0.23 | ) | 2.14 | 1.91 | 0.03 | – | 1.94 | $ | 29.18 | 7.10 | % | $ | 21,155 | 0.79 | % | (0.79 | )% | 0 | % | |||||||||||||||||||||||||||||||
For the year ended 10/31/2020 | $ | 26.65 | (0.21 | ) | 1.74 | 1.53 | 0.08 | (1.02 | ) | 0.59 | $ | 27.24 | 6.26 | % | $ | 14,984 | 0.79 | % | (0.79 | )% | 0 | % | ||||||||||||||||||||||||||||||
For the period 5/31/2019 (d) - 10/31/2019 | $ | 25.33 | (0.09 | ) | 1.37 | 1.28 | 0.04 | – | 1.32 | $ | 26.65 | 5.19 | % | $ | 2,665 | 0.80 | %(f) | (0.80 | )% | 0 | % | |||||||||||||||||||||||||||||||
| Innovator U.S. Equity Ultra Buffer ETF - July | ||||||||||||||||||||||||||||||||||||||||||||||||||||
For the period 11/1/2021 (d) - 4/30/2022 | $ | 27.37 | (0.11 | ) | (0.88 | ) | (0.99 | ) | 0.01 | – | (0.98 | ) | $ | 26.39 | (3.58 | )% | $ | 36,288 | 0.79 | % | (0.79 | )% | 0 | % | ||||||||||||||||||||||||||||
For the year ended 10/31/2021 | $ | 25.54 | (0.21 | ) | 2.02 | 1.81 | 0.02 | – | 1.83 | $ | 27.37 | 7.18 | % | $ | 52,689 | 0.79 | % | (0.79 | )% | 0 | % | |||||||||||||||||||||||||||||||
For the year ended 10/31/2020 | $ | 26.31 | (0.20 | ) | 1.01 | 0.81 | 0.04 | (1.62 | ) | (0.77 | ) | $ | 25.54 | 3.37 | % | $ | 39,583 | 0.79 | % | (0.79 | )% | 1 | % | |||||||||||||||||||||||||||||
For the year ended 10/31/2019 | $ | 24.68 | (0.20 | ) | 1.78 | 1.58 | 0.05 | – | 1.63 | $ | 26.31 | 6.62 | % | $ | 38,809 | 0.79 | % | (0.79 | )% | 27 | % | |||||||||||||||||||||||||||||||
For the period 8/7/2018 (d) - 10/31/2018 | $ | 25.17 | (0.04 | ) | (0.46 | ) | (0.50 | ) | 0.01 | – | (0.49 | ) | $ | 24.68 | (1.95 | )% | $ | 3,702 | 0.79 | % | (0.79 | )% | 0 | % | ||||||||||||||||||||||||||||
| Innovator U.S. Equity Ultra Buffer ETF - August | ||||||||||||||||||||||||||||||||||||||||||||||||||||
For the period 11/1/2021 (d) - 4/30/2022 | $ | 28.99 | (0.11 | ) | (1.07 | ) | (1.18 | ) | 0.01 | – | (1.17 | ) | $ | 27.82 | (4.03 | )% | $ | 25,735 | 0.79 | % | (0.79 | )% | 0 | % | ||||||||||||||||||||||||||||
For the year ended 10/31/2021 | $ | 26.87 | (0.22 | ) | 2.32 | 2.10 | 0.02 | – | 2.12 | $ | 28.99 | 7.89 | % | $ | 46,383 | 0.79 | % | (0.79 | )% | 0 | % | |||||||||||||||||||||||||||||||
For the year ended 10/31/2020 | $ | 25.45 | (0.21 | ) | 1.81 | 1.60 | 0.03 | (0.21 | ) | 1.42 | $ | 26.87 | 6.46 | % | $ | 45,679 | 0.79 | % | (0.79 | )% | 0 | % | ||||||||||||||||||||||||||||||
For the period 7/31/2019 (d) - 10/31/2019 | $ | 25.04 | (0.05 | ) | 0.44 | 0.39 | 0.02 | – | 0.41 | $ | 25.45 | 1.64 | % | $ | 18,452 | 0.79 | % | (0.79 | )% | 0 | % | |||||||||||||||||||||||||||||||
(a) | Annualized for periods less than one year. |
(b) | Net investment income/(loss) per share has been calculated based on average shares outstanding during the period. |
(c) | Not annualized for periods less than one year. |
(d) | Commencement of operations. |
(e) | Amount represents less than $0.01 per share. |
(f) | Includes broker interest expense of 0.01%. |
INNOVATOR ETFs TRUST
Financial Highlights
Per Share Operating Performance (For a share outstanding throughout each period) | Ratios/Supplemental Data: | |||||||||||||||||||||||||||||||||||||||||||||||||||
Investment Operations: | Capital Share Transactions: | Ratio to Average Net Assets of: (a) | ||||||||||||||||||||||||||||||||||||||||||||||||||
Net Asset Value, Beginning of Period | Net investment income/(loss) (b) | Net realized and unrealized gain/(loss) | Total From Investment Operations | Transaction fees (see Note 5) | Distributions Paid to Shareholders: | Change in Net Asset Value for the Period | Net Asset Value, End of Period | Total return (c) | Net assets, end of period (000) | Expenses | Net investment income/(loss) | Portfolio turnover rate (c) | ||||||||||||||||||||||||||||||||||||||||
| Innovator U.S. Equity Ultra Buffer ETF - September | ||||||||||||||||||||||||||||||||||||||||||||||||||||
For the period 11/1/2021 (d) - 4/30/2022 | $ | 28.42 | (0.11 | ) | (1.20 | ) | (1.31 | ) | 0.01 | – | (1.30 | ) | $ | 27.12 | (4.58 | )% | $ | 60,341 | 0.79 | % | (0.79 | )% | 0 | % | ||||||||||||||||||||||||||||
For the year ended 10/31/2021 | $ | 25.83 | (0.22 | ) | 2.78 | 2.56 | 0.03 | – | 2.59 | $ | 28.42 | 10.03 | % | $ | 67,502 | 0.79 | % | (0.79 | )% | 0 | % | |||||||||||||||||||||||||||||||
For the year ended 10/31/2020 | $ | 25.02 | (0.20 | ) | 1.09 | 0.89 | 0.08 | (0.16 | ) | 0.81 | $ | 25.83 | 3.90 | % | $ | 65,221 | 0.79 | % | (0.79 | )% | 35 | % | ||||||||||||||||||||||||||||||
For the period 8/30/2019 (d) - 10/31/2019 | $ | 24.59 | (0.03 | ) | 0.43 | 0.40 | 0.03 | – | 0.43 | $ | 25.02 | 1.76 | % | $ | 5,005 | 0.79 | % | (0.79 | )% | 152 | % | |||||||||||||||||||||||||||||||
| Innovator U.S. Equity Ultra Buffer ETF - October | ||||||||||||||||||||||||||||||||||||||||||||||||||||
For the period 11/1/2021 (d) - 4/30/2022 | $ | 28.23 | (0.11 | ) | (0.81 | ) | (0.92 | ) | 0.00 | (e) | – | (0.92 | ) | $ | 27.31 | (3.26 | )% | $ | 61,450 | 0.79 | % | (0.79 | )% | 0 | % | |||||||||||||||||||||||||||
For the year ended 10/31/2021 | $ | 25.70 | (0.22 | ) | 2.74 | 2.52 | 0.01 | – | 2.53 | $ | 28.23 | 9.85 | % | $ | 62,818 | 0.79 | % | (0.79 | )% | 0 | % | |||||||||||||||||||||||||||||||
For the year ended 10/31/2020 | $ | 25.05 | (0.20 | ) | 1.41 | 1.21 | 0.02 | (0.58 | ) | 0.65 | $ | 25.70 | 5.00 | % | $ | 105,376 | 0.79 | % | (0.79 | )% | 0 | % | ||||||||||||||||||||||||||||||
For the year ended 10/31/2019 | $ | 23.64 | (0.19 | ) | 1.58 | 1.39 | 0.02 | – | 1.41 | $ | 25.05 | 5.98 | % | $ | 135,912 | 0.80 | %(f) | (0.79 | )% | 4 | % | |||||||||||||||||||||||||||||||
For the period 9/28/2018 (d) - 10/31/2018 | $ | 24.49 | (0.01 | ) | (0.85 | ) | (0.86 | ) | 0.01 | – | (0.85 | ) | $ | 23.64 | (3.47 | )% | $ | 13,593 | 0.79 | % | (0.79 | )% | 3 | % | ||||||||||||||||||||||||||||
| Innovator U.S. Equity Ultra Buffer ETF - November | ||||||||||||||||||||||||||||||||||||||||||||||||||||
For the period 11/1/2021 (d) - 4/30/2022 | $ | 29.29 | (0.11 | ) | (1.20 | ) | (1.31 | ) | 0.01 | – | (1.30 | ) | $ | 27.99 | (4.46 | )% | $ | 43,380 | 0.79 | % | (0.79 | )% | 0 | % | ||||||||||||||||||||||||||||
For the year ended 10/31/2021 | $ | 27.28 | (0.23 | ) | 2.22 | 1.99 | 0.02 | – | 2.01 | $ | 29.29 | 7.36 | % | $ | 10,982 | 0.79 | % | (0.79 | )% | 0 | % | |||||||||||||||||||||||||||||||
For the year ended 10/31/2020 | $ | 25.53 | (0.21 | ) | 1.94 | 1.73 | 0.02 | – | 1.75 | $ | 27.28 | 6.88 | % | $ | 8,867 | 0.79 | % | (0.79 | )% | 0 | % | |||||||||||||||||||||||||||||||
For the period 10/31/2019 (d) - 10/31/2019 | $ | 25.53 | – | – | – | – | – | – | $ | 25.53 | – | $ | 2,553 | – | – | – | % | |||||||||||||||||||||||||||||||||||
| Innovator U.S. Equity Ultra Buffer ETF - December | ||||||||||||||||||||||||||||||||||||||||||||||||||||
For the period 11/1/2021 (d) - 4/30/2022 | $ | 29.82 | (0.12 | ) | (1.12 | ) | (1.24 | ) | 0.01 | – | (1.23 | ) | $ | 28.59 | (4.12 | )% | $ | 46,466 | 0.79 | % | (0.79 | )% | 0 | % | ||||||||||||||||||||||||||||
For the year ended 10/31/2021 | $ | 27.15 | 0.23 | 2.87 | 2.64 | 0.03 | – | 2.67 | $ | 29.82 | 9.85 | % | $ | 32,059 | 0.79 | % | (0.79 | )% | 0 | % | ||||||||||||||||||||||||||||||||
For the period 11/29/2019 (d) - 10/31/2020 | $ | 26.40 | (0.19 | ) | 0.91 | 0.72 | 0.03 | – | 0.75 | $ | 27.15 | 2.84 | % | $ | 23,756 | 0.79 | % | (0.79 | )% | 160 | % | |||||||||||||||||||||||||||||||
(a) | Annualized for periods less than one year. |
(b) | Net investment income/(loss) per share has been calculated based on average shares outstanding during the period. |
(c) | Not annualized for periods less than one year. |
(d) | Commencement of operations. |
(e) | Amount represents less than $0.01 per share. |
(f) | Includes broker interest expense of 0.01%. |
INNOVATOR ETFs TRUST
Notes to Financial Statements (Unaudited)
1. | ORGANIZATION |
Innovator ETFs Trust (the “Trust”) was organized under Delaware law as a Delaware statutory trust on October 17, 2007, and is registered with the Securities and Exchange Commission (“SEC”) under the Investment Company Act of 1940, as amended (the “1940 Act”) as an open–end management investment company. The Trust currently consists of multiple operational series, of which thirty–six are covered in this report, collectively the (“Funds”):
Name |
| Ticker |
| Commencement of Operations |
| Tracking Fund |
Innovator U.S. Equity Buffer ETF - January |
| BJAN |
| December 31, 2018 |
| SPDR S&P 500® ETF Trust |
Innovator U.S. Equity Buffer ETF - February |
| BFEB |
| January 31, 2020 |
| SPDR S&P 500® ETF Trust |
Innovator U.S. Equity Buffer ETF - March |
| BMAR |
| February 28, 2020 |
| SPDR S&P 500® ETF Trust |
Innovator U.S. Equity Buffer ETF - April |
| BAPR |
| March 29, 2019 |
| SPDR S&P 500® ETF Trust |
Innovator U.S. Equity Buffer ETF - May |
| BMAY |
| April 30, 2020 |
| SPDR S&P 500® ETF Trust |
Innovator U.S. Equity Buffer ETF - June |
| BJUN |
| May 31, 2019 |
| SPDR S&P 500® ETF Trust |
Innovator U.S. Equity Buffer ETF - July |
| BJUL |
| August 28, 2018 |
| SPDR S&P 500® ETF Trust |
Innovator U.S. Equity Buffer ETF - August |
| BAUG |
| July 31, 2019 |
| SPDR S&P 500® ETF Trust |
Innovator U.S. Equity Buffer ETF - September |
| BSEP |
| August 30, 2019 |
| SPDR S&P 500® ETF Trust |
Innovator U.S. Equity Buffer ETF - October |
| BOCT |
| September 28, 2018 |
| SPDR S&P 500® ETF Trust |
Innovator U.S. Equity Buffer ETF - November |
| BNOV |
| October 31, 2019 |
| SPDR S&P 500® ETF Trust |
Innovator U.S. Equity Buffer ETF - December |
| BDEC |
| November 29, 2019 |
| SPDR S&P 500® ETF Trust |
Innovator U.S. Equity Power Buffer ETF - January |
| PJAN |
| December 31, 2018 |
| SPDR S&P 500® ETF Trust |
Innovator U.S. Equity Power Buffer ETF - February |
| PFEB |
| January 31, 2020 |
| SPDR S&P 500® ETF Trust |
Innovator U.S. Equity Power Buffer ETF - March |
| PMAR |
| February 28, 2020 |
| SPDR S&P 500® ETF Trust |
Innovator U.S. Equity Power Buffer ETF - April |
| PAPR |
| March 29, 2019 |
| SPDR S&P 500® ETF Trust |
Innovator U.S. Equity Power Buffer ETF - May |
| PMAY |
| April 30, 2020 |
| SPDR S&P 500® ETF Trust |
Innovator U.S. Equity Power Buffer ETF - June |
| PJUN |
| May 31, 2019 |
| SPDR S&P 500® ETF Trust |
Innovator U.S. Equity Power Buffer ETF - July |
| PJUL |
| August 7, 2018 |
| SPDR S&P 500® ETF Trust |
Innovator U.S. Equity Power Buffer ETF - August |
| PAUG |
| July 31, 2019 |
| SPDR S&P 500® ETF Trust |
Innovator U.S. Equity Power Buffer ETF - September |
| PSEP |
| August 30, 2019 |
| SPDR S&P 500® ETF Trust |
Innovator U.S. Equity Power Buffer ETF - October |
| POCT |
| September 28, 2018 |
| SPDR S&P 500® ETF Trust |
Innovator U.S. Equity Power Buffer ETF - November |
| PNOV |
| October 31, 2019 |
| SPDR S&P 500® ETF Trust |
Innovator U.S. Equity Power Buffer ETF - December |
| PDEC |
| November 29, 2019 |
| SPDR S&P 500® ETF Trust |
Innovator U.S. Equity Ultra Buffer ETF - January |
| UJAN |
| December 31, 2018 |
| SPDR S&P 500® ETF Trust |
Innovator U.S. Equity Ultra Buffer ETF - February |
| UFEB |
| January 31, 2020 |
| SPDR S&P 500® ETF Trust |
Innovator U.S. Equity Ultra Buffer ETF - March |
| UMAR |
| February 28, 2020 |
| SPDR S&P 500® ETF Trust |
Innovator U.S. Equity Ultra Buffer ETF - April |
| UAPR |
| March 29, 2019 |
| SPDR S&P 500® ETF Trust |
Innovator U.S. Equity Ultra Buffer ETF - May |
| UMAY |
| April 30, 2020 |
| SPDR S&P 500® ETF Trust |
Innovator U.S. Equity Ultra Buffer ETF - June |
| UJUN |
| May 31, 2019 |
| SPDR S&P 500® ETF Trust |
Innovator U.S. Equity Ultra Buffer ETF - July |
| UJUL |
| August 7, 2018 |
| SPDR S&P 500® ETF Trust |
Innovator U.S. Equity Ultra Buffer ETF - August |
| UAUG |
| July 31, 2019 |
| SPDR S&P 500® ETF Trust |
Innovator U.S. Equity Ultra Buffer ETF - September |
| USEP |
| August 30, 2019 |
| SPDR S&P 500® ETF Trust |
Innovator U.S. Equity Ultra Buffer ETF - October |
| UOCT |
| September 28, 2018 |
| SPDR S&P 500® ETF Trust |
Innovator U.S. Equity Ultra Buffer ETF - November |
| UNOV |
| October 31, 2019 |
| SPDR S&P 500® ETF Trust |
Innovator U.S. Equity Ultra Buffer ETF - December |
| UDEC |
| November 29, 2019 |
| SPDR S&P 500® ETF Trust |
INNOVATOR ETFs TRUST
Notes to Financial Statements (Unaudited) (Continued)
The operational series of the Trust covered outside of this report consist of:
Name |
| Ticker |
| Commencement of Operations |
| Tracking Fund/Index |
Innovator IBD 50 ETF |
| FFTY |
| April 8, 2015 |
| IBD® 50 Index |
Innovator IBD Breakout Opportunities ETF |
| BOUT |
| September 12, 2018 |
| iShares 20+ Year Treasury Bond ETF |
Innovator Loup Frontier Tech ETF |
| LOUP |
| July 24, 2018 |
| iShares 20+ Year Treasury Bond ETF |
Innovator S&P Investment Grade Preferred ETF |
| EPRF |
| May 23, 2016 |
| iShares 20+ Year Treasury Bond ETF |
Innovator Laddered Allocation Buffer ETF |
| BUFF |
| October 19, 2016 |
| iShares 20+ Year Treasury Bond ETF |
Innovator MSCI EAFE Power Buffer ETF - January |
| IJAN |
| December 31, 2019 |
| iShares MSCI EAFE ETF |
Innovator MSCI EAFE Power Buffer ETF - April |
| IAPR |
| March 31, 2021 |
| iShares MSCI EAFE ETF |
Innovator MSCI EAFE Power Buffer ETF - July |
| IJUL |
| June 28, 2019 |
| iShares MSCI EAFE ETF |
Innovator International Developed Power Buffer ETF - October |
| IOCT |
| September 30, 2021 |
| iShares MSCI EAFE ETF |
Innovator MSCI EM Power Buffer ETF - January |
| EJAN |
| December 31, 2019 |
| iShares MSCI Emerging Markets ETF |
Innovator MSCI Emerging Markets Power Buffer ETF - April |
| EAPR |
| March 31, 2021 |
| iShares MSCI Emerging Markets ETF |
Innovator MSCI Emerging Markets Power Buffer ETF - July |
| EJUL |
| June 28, 2019 |
| iShares MSCI Emerging Markets ETF |
Innovator Emerging Markets Power Buffer ETF - October |
| EOCT |
| September 30, 2021 |
| iShares MSCI Emerging Markets ETF |
Innovator Nasdaq 100 Power Buffer ETF - January |
| NJAN |
| December 31, 2019 |
| Invesco QQQ Trust |
Innovator Nasdaq 100 Power Buffer ETF - April |
| NAPR |
| March 31, 2020 |
| Invesco QQQ Trust |
Innovator Nasdaq-100 Power Buffer ETF - July |
| NJUL |
| June 30, 2020 |
| Invesco QQQ Trust |
Innovator Nasdaq 100 Power Buffer ETF - October |
| NOCT |
| September 30, 2019 |
| Invesco QQQ Trust |
Innovator Russell 2000 Power Buffer ETF - January |
| KJAN |
| December 31, 2019 |
| iShares 20+ Year Treasury Bond ETF |
Innovator Russell 2000 Power Buffer ETF - April |
| KAPR |
| March 31, 2020 |
| iShares 20+ Year Treasury Bond ETF |
Innovator Russell 2000 Power Buffer ETF - July |
| KJUL |
| June 30, 2020 |
| iShares 20+ Year Treasury Bond ETF |
Innovator Russell 2000 Power Buffer ETF - October |
| KOCT |
| September 30, 2019 |
| iShares 20+ Year Treasury Bond ETF |
Innovator Double Stacker ETF - January |
| DSJA |
| December 31, 2020 |
| SPDR S&P 500® ETF Trust and Invesco QQQ Trust |
Innovator Double Stacker ETF - October |
| DSOC |
| September 30, 2020 |
| SPDR S&P 500® ETF Trust and Invesco QQQ Trust |
Innovator Triple Stacker ETF - January |
| TSJA |
| December 31, 2020 |
| SPDR S&P 500® ETF Trust, Invesco QQQ Trust and iShares Russell 2000 ETF |
Innovator Triple Stacker ETF - October |
| TSOC |
| September 30, 2020 |
| SPDR S&P 500® ETF Trust, Invesco QQQ Trust and iShares Russell 2000 ETF |
Innovator Double Stacker 9 Buffer ETF - January |
| DBJA |
| December 31, 2020 |
| SPDR S&P 500® ETF Trust and Invesco QQQ Trust |
Innovator Double Stacker 9 Buffer ETF - October |
| DBOC |
| September 30, 2020 |
| SPDR S&P 500® ETF Trust and Invesco QQQ Trust |
Innovator U.S. Equity Accelerated ETF - April |
| XDAP |
| March 31, 2021 |
| SPDR S&P 500® ETF Trust |
Innovator U.S. Equity Accelerated ETF - July |
| XDJL |
| June 30, 2021 |
| SPDR S&P 500® ETF Trust |
Innovator U.S. Equity Accelerated ETF - October |
| XDOC |
| September 30, 2021 |
| SPDR S&P 500® ETF Trust |
Innovator U.S. Equity Accelerated Plus ETF - April |
| XTAP |
| March 31, 2021 |
| SPDR S&P 500® ETF Trust |
Innovator U.S. Equity Accelerated Plus ETF - July |
| XTJL |
| June 30, 2021 |
| SPDR S&P 500® ETF Trust |
Innovator U.S. Equity Accelerated Plus ETF - October |
| XTOC |
| September 30, 2021 |
| SPDR S&P 500® ETF Trust |
Innovator U.S. Equity Accelerated 9 Buffer ETF - April |
| XBAP |
| March 31, 2021 |
| SPDR S&P 500® ETF Trust |
Innovator U.S. Equity Accelerated 9 Buffer ETF - July |
| XBJL |
| June 30, 2021 |
| SPDR S&P 500® ETF Trust |
Innovator U.S. Equity Accelerated 9 Buffer ETF - October |
| XBOC |
| September 30, 2021 |
| SPDR S&P 500® ETF Trust |
Innovator Growth Accelerated Plus ETF - April |
| QTAP |
| March 31, 2021 |
| Invesco QQQ Trust |
Innovator Growth Accelerated Plus ETF - July |
| QTJL |
| June 30, 2021 |
| Invesco QQQ Trust |
Innovator Growth Accelerated Plus ETF - October |
| QTOC |
| September 30, 2021 |
| Invesco QQQ Trust |
Innovator 20+ Year Treasury Bond 9 Buffer ETF - July |
| TBJL |
| August 17, 2020 |
| iShares 20+ Year Treasury Bond ETF |
Innovator 20+ Year Treasury Bond 5 Floor ETF - July |
| TFJL |
| August 17, 2020 |
| iShares 20+ Year Treasury Bond ETF |
Innovator Defined Wealth Shield ETF |
| BALT |
| June 30, 2021 |
| SPDR S&P 500® ETF Trust |
Innovator U.S. Equity Accelerated ETF - Quarterly |
| XDSQ |
| March 31, 2021 |
| SPDR S&P 500® ETF Trust |
Innovator Growth Accelerated ETF - Quarterly |
| XDQQ |
| March 31, 2021 |
| Invesco QQQ Trust |
Innovator Growth Accelerated Plus ETF - January |
| QTJA |
| December 31, 2021 |
| SPDR S&P 500® ETF Trust |
Innovator Buffer Step-Up Strategy ETF |
| BSTP |
| March 7, 2022 |
| SPDR S&P 500® ETF Trust |
Innovator Power Buffer Step-Up Strategy ETF |
| PSTP |
| March 7, 2022 |
| SPDR S&P 500® ETF Trust |
The Funds are exchange traded funds that offer one class of shares, do not charge a sales load, do not have a redemption fee and currently do not charge a 12b–1 fee to their shareholders. The Funds list and principally trade their shares on Cboe BZX Exchange, Inc. (“Cboe BZX” or the “Exchange”).
INNOVATOR ETFs TRUST
Notes to Financial Statements (Unaudited) (Continued)
Each Fund employs a specific “defined outcome strategy.” Defined outcome strategies generally seek to produce pre-determined investment outcomes based upon the performance of an index or one or more underlying securities. The Funds’ pre-determined outcomes (“Outcomes”) are based upon the price performance of a benchmark index or one or more underlying exchange-traded fund (the “Benchmark”) over a period of approximately one year or another predetermined period (“Outcome Period”). The Funds’ investment strategy provides shareholders with participation in any gains experienced by the applicable Benchmark over the course of the Outcome Period, subject to a cap on upside returns (a “Cap”), and, if applicable, a predetermined buffer (a “Buffer”) against Benchmark losses for the Outcome Period. These defined outcomes are managed by purchasing and selling call and put FLexible EXchange Options (“FLEX Options”) to create layers within a Fund’s portfolio. Each Fund’s FLEX Option has the same reference asset and expiration date, with uniquely selected strike prices for the Fund’s Outcome Period. Due to the customizable nature of FLEX Options that allows for specific strike prices to be selected for the same reference asset and expiration date, when each of the FLEX Options expire on the last day of the Outcome Period, the Funds are expected to achieve a Benchmark investment return with the applicable Buffer and Cap investment parameters.
The Funds are investment companies and accordingly follow the investment company accounting and reporting guidance of the Financial Accounting Standards Board (“FASB”) Accounting Standards Codification (“ASC”) Topic 946 “Financial Services — Investment Companies”.
2. | SIGNIFICANT ACCOUNTING POLICIES |
The following is a summary of significant accounting policies consistently followed by the Trust in the preparation of its financial statements. These policies are in conformity with accounting principles generally accepted in the United States of America (“U.S. GAAP”).
Valuation:
The net asset values (“NAV”) of the Funds are determined as of the close of regular trading on the NYSE (normally 4:00 p.m. ET). If the NYSE closes early on a valuation day, the Funds shall determine NAV as of that time.
Portfolio securities generally shall be valued utilizing prices provided by independent pricing services. The Trust’s Pricing Committee (“Pricing Committee”) is responsible for establishing valuation of portfolio securities and other instruments held by the Funds in accordance with the Trust’s valuation procedures.
Common stocks, preferred stocks and other equity securities listed on any national or foreign exchange (excluding the NASDAQ National Market (“NASDAQ”) and the London Stock Exchange Alternative Investment Market (“AIM”)) are generally valued at the last sale price on the exchange on which they are principally traded or, for NASDAQ and AIM securities, the official closing price. Securities traded on more than one securities exchange are valued at the last sale price or official closing price, as applicable, at the close of the exchange representing the principal market for such securities. Securities traded in the over–the–counter market are valued at the mean of the bid and the asked price, if available, and otherwise at their closing bid price. Redeemable securities issued by open–end investment companies shall be valued at the investment company’s applicable net asset value, with the exception of exchange–traded open–end investment companies which are priced as equity securities. Fixed income securities, swaps, currency–, credit– and commodity–linked notes, and other similar instruments will be valued using a pricing service. Fixed income securities having a remaining maturity of 60 days or less when purchased will be valued at cost adjusted for amortization of premiums and accretion of discounts, provided the Pricing Committee has determined that the use of amortized cost is an appropriate reflection of fair value given market and issuer specific conditions existing at the time of the determination. Deposit accounts are valued at acquisition cost. Foreign securities and other assets denominated in foreign currencies are translated into U.S. dollars at the exchange rate of such currencies against the U.S. dollar as provided by the pricing service. All assets denominated in foreign currencies will be converted into U.S. dollars at the exchange rates in effect at the time of valuation. Restricted securities (with the exception of Rule 144A Securities for which market quotations are available) will normally be valued at fair value as determined by the Pricing Committee.
INNOVATOR ETFs TRUST
Notes to Financial Statements (Unaudited) (Continued)
Exchange–traded option contracts (other than FLexible EXchange Option or “FLEX Option” contracts) will be valued at the closing price in the market where such contracts are principally traded. If no closing price is available, they will be fair valued at the mean of their most recent bid and asked price, if available, and otherwise at their closing bid price. OTC options are fair valued at the mean of the most recent bid and asked price, if available, and otherwise at their closing bid price. FLEX Options will be valued at a model–based price provided by the exchange on which the option is traded at the official close of that exchange’s trading date. If the exchange on which the option is traded is unable to provide a model price, FLEX Options prices will be provided by backup provider Super Derivatives. Otherwise, the value of a FLEX Option will be determined by the Pricing Committee in accordance with the Trust’s valuation procedures.
If no quotation can be obtained from a pricing service, then the Pricing Committee will then attempt to obtain one or more broker quotes for the security. If no quotation is available from either a pricing service or one or more brokers or if the Pricing Committee has reason to question the reliability or accuracy of a quotation supplied or the use of amortized cost, the value of any portfolio security held by the Funds for which reliable market quotations are not readily available will be determined by the Pricing Committee in a manner that most appropriately reflects fair market value of the security on the valuation date. The use of a fair valuation method may be appropriate if, for example: (i) market quotations do not accurately reflect fair value of an investment; (ii) an investment’s value has been materially affected by events occurring after the close of the exchange or market on which the investment is principally traded (for example, a foreign exchange or market); (iii) a trading halt closes an exchange or market early; or (iv) other events result in an exchange or market delaying its normal close.
INNOVATOR ETFs TRUST
Notes to Financial Statements (Unaudited) (Continued)
Fair Valuation Measurement:
FASB established a framework for measuring fair value in accordance with U.S. GAAP. Under ASC Topic, Fair Value Measurement (“ASC 820”), various inputs are used in determining the value of the Funds’ investments. The inputs or methodology used for valuing securities are not necessarily an indication of the risk associated with investing in those securities. The three Levels of inputs of the fair value hierarchy are defined as follows:
● Level 1 – | Unadjusted quoted prices in active markets for identical assets or liabilities that the Funds have the ability to access. |
● Level 2 – | Observable inputs other than quoted prices included in level 1 that are observable for the asset or liability, either directly or indirectly. These inputs may include quoted prices for the identical instrument on an inactive market, prices for similar instruments, interest rates, prepayment speeds, credit risk, yield curves, default rates and similar data. |
● Level 3 – | Unobservable inputs for the asset or liability, to the extent relevant observable inputs are not available, representing the Funds’ own assumptions about the assumptions a market participant would use in valuing the asset or liability, and would be based on the best information available. |
The availability of observable inputs can vary from security to security and is affected by a wide variety of factors, including, for example, the type of security, whether the security is new and not yet established in the marketplace, the liquidity of markets, and other characteristics particular to the security. To the extent that valuation is based on models or inputs that are less observable or unobservable in the market, the determination of fair value requires more judgement. Accordingly, the degree of judgement exercised in determining fair value is greatest for instruments categorized in Level 3.
The inputs used to measure fair value may fall into different levels of the fair value hierarchy. In such cases, for disclosure purposes, the level in the fair value hierarchy within which the fair value measurement falls in its entirety, is determined based on the lowest level input that is significant to the fair value measurement in its entirety.
INNOVATOR ETFs TRUST
Notes to Financial Statements (Unaudited) (Continued)
The following table summarizes valuation of the Funds’ investments under the fair value hierarchy levels as of April 30, 2022:
BJAN | ||||||||||||||||
Level 1 | Level 2 | Level 3 | Total | |||||||||||||
Assets | ||||||||||||||||
Purchased Options | $ | – | $ | 213,254,823 | $ | – | $ | 213,254,823 | ||||||||
Short Term Investments | 1,204,344 | – | – | 1,204,344 | ||||||||||||
Total Assets | $ | 1,204,344 | $ | 213,254,823 | $ | – | $ | 214,459,167 | ||||||||
Liabilities | ||||||||||||||||
Options Written | $ | – | $ | 18,793,110 | $ | – | $ | 18,793,110 | ||||||||
Total Liabilities | $ | – | $ | 18,793,110 | $ | – | $ | 18,793,110 | ||||||||
BFEB | ||||||||||||||||
Level 1 | Level 2 | Level 3 | Total | |||||||||||||
Assets | ||||||||||||||||
Purchased Options | $ | – | $ | 125,153,448 | $ | – | $ | 125,153,448 | ||||||||
Short Term Investments | 787,729 | – | – | 787,729 | ||||||||||||
Total Assets | $ | 787,729 | $ | 125,153,448 | $ | – | $ | 125,941,177 | ||||||||
Liabilities | ||||||||||||||||
Options Written | $ | – | $ | 9,459,023 | $ | – | $ | 9,459,023 | ||||||||
Total Liabilities | $ | – | $ | 9,459,023 | $ | – | $ | 9,459,023 | ||||||||
BMAR | ||||||||||||||||
Level 1 | Level 2 | Level 3 | Total | |||||||||||||
Assets | ||||||||||||||||
Purchased Options | $ | – | $ | 92,990,577 | $ | – | $ | 92,990,577 | ||||||||
Short Term Investments | 654,905 | – | – | 654,905 | ||||||||||||
Total Assets | $ | 654,905 | $ | 92,990,577 | $ | – | $ | 93,645,482 | ||||||||
Liabilities | ||||||||||||||||
Options Written | $ | – | $ | 6,638,141 | $ | – | $ | 6,638,141 | ||||||||
Total Liabilities | $ | – | $ | 6,638,141 | $ | – | $ | 6,638,141 | ||||||||
BAPR | ||||||||||||||||
Level 1 | Level 2 | Level 3 | Total | |||||||||||||
Assets | ||||||||||||||||
Purchased Options | $ | – | $ | 135,423,388 | $ | – | $ | 135,423,388 | ||||||||
Short Term Investments | 1,021,480 | – | – | 1,021,480 | ||||||||||||
Total Assets | $ | 1,021,480 | $ | 135,423,388 | $ | – | $ | 136,444,868 | ||||||||
Liabilities | ||||||||||||||||
Options Written | $ | – | $ | 11,359,930 | $ | – | $ | 11,359,930 | ||||||||
Total Liabilities | $ | – | $ | 11,359,930 | $ | – | $ | 11,359,930 | ||||||||
INNOVATOR ETFs TRUST
Notes to Financial Statements (Unaudited) (Continued)
BMAY | ||||||||||||||||
Level 1 | Level 2 | Level 3 | Total | |||||||||||||
Assets | ||||||||||||||||
Purchased Options | $ | – | $ | 65,249,142 | $ | – | $ | 65,249,142 | ||||||||
Short Term Investments | 40,661 | – | – | 40,661 | ||||||||||||
Total Assets | $ | 40,661 | $ | 65,249,142 | $ | – | $ | 65,289,803 | ||||||||
Liabilities | ||||||||||||||||
Options Written | $ | – | $ | 4,434,234 | $ | – | $ | 4,434,234 | ||||||||
Total Liabilities | $ | – | $ | 4,434,234 | $ | – | $ | 4,434,234 | ||||||||
BJUN | ||||||||||||||||
Level 1 | Level 2 | Level 3 | Total | |||||||||||||
Assets | ||||||||||||||||
Purchased Options | $ | – | $ | 58,483,949 | $ | – | $ | 58,483,949 | ||||||||
Short Term Investments | 88,563 | – | – | 88,563 | ||||||||||||
Total Assets | $ | 88,563 | $ | 58,483,949 | $ | – | $ | 58,572,512 | ||||||||
Liabilities | ||||||||||||||||
Options Written | $ | – | $ | 670,324 | $ | – | $ | 670,324 | ||||||||
Total Liabilities | $ | – | $ | 670,324 | $ | – | $ | 670,324 | ||||||||
BJUL | ||||||||||||||||
Level 1 | Level 2 | Level 3 | Total | |||||||||||||
Assets | ||||||||||||||||
Purchased Options | $ | – | $ | 96,820,200 | $ | – | $ | 96,820,200 | ||||||||
Short Term Investments | 158,817 | – | – | 158,817 | ||||||||||||
Total Assets | $ | 158,817 | $ | 96,820,200 | $ | – | $ | 96,979,017 | ||||||||
Liabilities | ||||||||||||||||
Options Written | $ | – | $ | 2,433,915 | $ | – | $ | 2,433,915 | ||||||||
Total Liabilities | $ | – | $ | 2,433,915 | $ | – | $ | 2,433,915 | ||||||||
BAUG | ||||||||||||||||
Level 1 | Level 2 | Level 3 | Total | |||||||||||||
Assets | ||||||||||||||||
Purchased Options | $ | – | $ | 116,880,415 | $ | – | $ | 116,880,415 | ||||||||
Short Term Investments | 303,086 | – | – | 303,086 | ||||||||||||
Total Assets | $ | 303,086 | $ | 116,880,415 | $ | – | $ | 117,183,501 | ||||||||
Liabilities | ||||||||||||||||
Options Written | $ | – | $ | 4,397,604 | $ | – | $ | 4,397,604 | ||||||||
Total Liabilities | $ | – | $ | 4,397,604 | $ | – | $ | 4,397,604 | ||||||||
INNOVATOR ETFs TRUST
Notes to Financial Statements (Unaudited) (Continued)
BSEP | ||||||||||||||||
Level 1 | Level 2 | Level 3 | Total | |||||||||||||
Assets | ||||||||||||||||
Purchased Options | $ | – | $ | 148,813,400 | $ | – | $ | 148,813,400 | ||||||||
Short Term Investments | 486,924 | – | – | 486,924 | ||||||||||||
Total Assets | $ | 486,924 | $ | 148,813,400 | $ | – | $ | 149,300,324 | ||||||||
Liabilities | ||||||||||||||||
Options Written | $ | – | $ | 7,786,876 | $ | – | $ | 7,786,876 | ||||||||
Total Liabilities | $ | – | $ | 7,786,876 | $ | – | $ | 7,786,876 | ||||||||
BOCT | ||||||||||||||||
Level 1 | Level 2 | Level 3 | Total | |||||||||||||
Assets | ||||||||||||||||
Purchased Options | $ | – | $ | 95,255,640 | $ | – | $ | 95,255,640 | ||||||||
Short Term Investments | 399,164 | – | – | 399,164 | ||||||||||||
Total Assets | $ | 399,164 | $ | 95,255,640 | $ | – | $ | 95,654,804 | ||||||||
Liabilities | ||||||||||||||||
Options Written | $ | – | $ | 4,518,872 | $ | – | $ | 4,518,872 | ||||||||
Total Liabilities | $ | – | $ | 4,518,872 | $ | – | $ | 4,518,872 | ||||||||
BNOV | ||||||||||||||||
Level 1 | Level 2 | Level 3 | Total | |||||||||||||
Assets | ||||||||||||||||
Purchased Options | $ | – | $ | 79,674,615 | $ | – | $ | 79,674,615 | ||||||||
Short Term Investments | 360,758 | – | – | 360,758 | ||||||||||||
Total Assets | $ | 360,758 | $ | 79,674,615 | $ | – | $ | 80,035,373 | ||||||||
Liabilities | ||||||||||||||||
Options Written | $ | – | $ | 5,495,844 | $ | – | $ | 5,495,844 | ||||||||
Total Liabilities | $ | – | $ | 5,495,844 | $ | – | $ | 5,495,844 | ||||||||
BDEC | ||||||||||||||||
Level 1 | Level 2 | Level 3 | Total | |||||||||||||
Assets | ||||||||||||||||
Purchased Options | $ | – | $ | 96,710,233 | $ | – | $ | 96,710,233 | ||||||||
Short Term Investments | 496,254 | – | – | 496,254 | ||||||||||||
Total Assets | $ | 496,254 | $ | 96,710,233 | $ | – | $ | 97,206,487 | ||||||||
Liabilities | ||||||||||||||||
Options Written | $ | – | $ | 6,740,495 | $ | – | $ | 6,740,495 | ||||||||
Total Liabilities | $ | – | $ | 6,740,495 | $ | – | $ | 6,740,495 | ||||||||
INNOVATOR ETFs TRUST
Notes to Financial Statements (Unaudited) (Continued)
PJAN | ||||||||||||||||
Level 1 | Level 2 | Level 3 | Total | |||||||||||||
Assets | ||||||||||||||||
Purchased Options | $ | – | $ | 583,707,723 | $ | – | $ | 583,707,723 | ||||||||
Short Term Investments | 3,334,148 | – | – | 3,334,148 | ||||||||||||
Total Assets | $ | 3,334,148 | $ | 583,707,723 | $ | – | $ | 587,041,871 | ||||||||
Liabilities | ||||||||||||||||
Options Written | $ | – | $ | 37,928,541 | $ | – | $ | 37,928,541 | ||||||||
Total Liabilities | $ | – | $ | 37,928,541 | $ | – | $ | 37,928,541 | ||||||||
PFEB | ||||||||||||||||
Level 1 | Level 2 | Level 3 | Total | |||||||||||||
Assets | ||||||||||||||||
Purchased Options | $ | – | $ | 322,857,944 | $ | – | $ | 322,857,944 | ||||||||
Short Term Investments | 2,078,194 | – | – | 2,078,194 | ||||||||||||
Total Assets | $ | 2,078,194 | $ | 322,857,944 | $ | – | $ | 324,936,138 | ||||||||
Liabilities | ||||||||||||||||
Options Written | $ | – | $ | 19,502,896 | $ | – | $ | 19,502,896 | ||||||||
Total Liabilities | $ | – | $ | 19,502,896 | $ | – | $ | 19,502,896 | ||||||||
PMAR | ||||||||||||||||
Level 1 | Level 2 | Level 3 | Total | |||||||||||||
Assets | ||||||||||||||||
Purchased Options | $ | ��� | $ | 252,289,578 | $ | – | $ | 252,289,578 | ||||||||
Short Term Investments | 1,757,355 | – | – | 1,757,355 | ||||||||||||
Total Assets | $ | 1,757,355 | $ | 252,289,578 | $ | – | $ | 254,046,933 | ||||||||
Liabilities | ||||||||||||||||
Options Written | $ | – | $ | 15,664,621 | $ | – | $ | 15,664,621 | ||||||||
Total Liabilities | $ | – | $ | 15,664,621 | $ | – | $ | 15,664,621 | ||||||||
PAPR | ||||||||||||||||
Level 1 | Level 2 | Level 3 | Total | |||||||||||||
Assets | ||||||||||||||||
Purchased Options | $ | – | $ | 330,193,323 | $ | – | $ | 330,193,323 | ||||||||
Short Term Investments | 2,520,214 | – | – | 2,520,214 | ||||||||||||
Total Assets | $ | 2,520,214 | $ | 330,193,323 | $ | – | $ | 332,713,537 | ||||||||
Liabilities | ||||||||||||||||
Options Written | $ | – | $ | 22,495,252 | $ | – | $ | 22,495,252 | ||||||||
Total Liabilities | $ | – | $ | 22,495,252 | $ | – | $ | 22,495,252 | ||||||||
INNOVATOR ETFs TRUST
Notes to Financial Statements (Unaudited) (Continued)
PMAY | ||||||||||||||||
Level 1 | Level 2 | Level 3 | Total | |||||||||||||
Assets | ||||||||||||||||
Purchased Options | $ | – | $ | 215,265,778 | $ | – | $ | 215,265,778 | ||||||||
Short Term Investments | 124,268 | – | – | 124,268 | ||||||||||||
Total Assets | $ | 124,268 | $ | 215,265,778 | $ | – | $ | 215,390,046 | ||||||||
Liabilities | ||||||||||||||||
Options Written | $ | – | $ | 14,655,640 | $ | – | $ | 14,655,640 | ||||||||
Total Liabilities | $ | – | $ | 14,655,640 | $ | – | $ | 14,655,640 | ||||||||
PJUN | ||||||||||||||||
Level 1 | Level 2 | Level 3 | Total | |||||||||||||
Assets | ||||||||||||||||
Purchased Options | $ | – | $ | 138,375,486 | $ | – | $ | 138,375,486 | ||||||||
Short Term Investments | 190,783 | – | – | 190,783 | ||||||||||||
Total Assets | $ | 190,783 | $ | 138,375,486 | $ | – | $ | 138,566,269 | ||||||||
Liabilities | ||||||||||||||||
Options Written | $ | – | $ | 924,221 | $ | – | $ | 924,221 | ||||||||
Total Liabilities | $ | – | $ | 924,221 | $ | – | $ | 924,221 | ||||||||
PJUL | ||||||||||||||||
Level 1 | Level 2 | Level 3 | Total | |||||||||||||
Assets | ||||||||||||||||
Purchased Options | $ | – | $ | 171,784,022 | $ | – | $ | 171,784,022 | ||||||||
Short Term Investments | 356,707 | – | – | 356,707 | ||||||||||||
Total Assets | $ | 356,707 | $ | 171,784,022 | $ | – | $ | 172,140,729 | ||||||||
Liabilities | ||||||||||||||||
Options Written | $ | – | $ | 2,660,472 | $ | – | $ | 2,660,472 | ||||||||
Total Liabilities | $ | – | $ | 2,660,472 | $ | – | $ | 2,660,472 | ||||||||
PAUG | ||||||||||||||||
Level 1 | Level 2 | Level 3 | Total | |||||||||||||
Assets | ||||||||||||||||
Purchased Options | $ | – | $ | 180,656,109 | $ | – | $ | 180,656,109 | ||||||||
Short Term Investments | 450,927 | – | – | 450,927 | ||||||||||||
Total Assets | $ | 450,927 | $ | 180,656,109 | $ | – | $ | 181,107,036 | ||||||||
Liabilities | ||||||||||||||||
Options Written | $ | – | $ | 4,497,900 | $ | – | $ | 4,497,900 | ||||||||
Total Liabilities | $ | – | $ | 4,497,900 | $ | – | $ | 4,497,900 | ||||||||
INNOVATOR ETFs TRUST
Notes to Financial Statements (Unaudited) (Continued)
PSEP | ||||||||||||||||
Level 1 | Level 2 | Level 3 | Total | |||||||||||||
Assets | ||||||||||||||||
Purchased Options | $ | – | $ | 280,668,896 | $ | – | $ | 280,668,896 | ||||||||
Short Term Investments | 925,244 | – | – | 925,244 | ||||||||||||
Total Assets | $ | 925,244 | $ | 280,668,896 | $ | – | $ | 281,594,140 | ||||||||
Liabilities | ||||||||||||||||
Options Written | $ | – | $ | 9,750,071 | $ | – | $ | 9,750,071 | ||||||||
Total Liabilities | $ | – | $ | 9,750,071 | $ | – | $ | 9,750,071 | ||||||||
POCT | ||||||||||||||||
Level 1 | Level 2 | Level 3 | Total | |||||||||||||
Assets | ||||||||||||||||
Purchased Options | $ | – | $ | 192,847,584 | $ | – | $ | 192,847,584 | ||||||||
Short Term Investments | 755,993 | – | – | 755,993 | ||||||||||||
Total Assets | $ | 755,993 | $ | 192,847,584 | $ | – | $ | 193,603,577 | ||||||||
Liabilities | ||||||||||||||||
Options Written | $ | – | $ | 7,493,477 | $ | – | $ | 7,493,477 | ||||||||
Total Liabilities | $ | – | $ | 7,493,477 | $ | – | $ | 7,493,477 | ||||||||
PNOV | ||||||||||||||||
Level 1 | Level 2 | Level 3 | Total | |||||||||||||
Assets | ||||||||||||||||
Purchased Options | $ | – | $ | 212,746,797 | $ | – | $ | 212,746,797 | ||||||||
Short Term Investments | 947,942 | – | – | 947,942 | ||||||||||||
Total Assets | $ | 947,942 | $ | 212,746,797 | $ | – | $ | 213,694,739 | ||||||||
Liabilities | ||||||||||||||||
Options Written | $ | – | $ | 10,561,458 | $ | – | $ | 10,561,458 | ||||||||
Total Liabilities | $ | – | $ | 10,561,458 | $ | – | $ | 10,561,458 | ||||||||
PDEC | ||||||||||||||||
Level 1 | Level 2 | Level 3 | Total | |||||||||||||
Assets | ||||||||||||||||
Purchased Options | $ | – | $ | 237,282,710 | $ | – | $ | 237,282,710 | ||||||||
Short Term Investments | 1,225,882 | – | – | 1,225,882 | ||||||||||||
Total Assets | $ | 1,225,882 | $ | 237,282,710 | $ | – | $ | 238,508,592 | ||||||||
Liabilities | ||||||||||||||||
Options Written | $ | – | $ | 12,241,525 | $ | – | $ | 12,241,525 | ||||||||
Total Liabilities | $ | – | $ | 12,241,525 | $ | – | $ | 12,241,525 | ||||||||
INNOVATOR ETFs TRUST
Notes to Financial Statements (Unaudited) (Continued)
UJAN | ||||||||||||||||
Level 1 | Level 2 | Level 3 | Total | |||||||||||||
Assets | ||||||||||||||||
Purchased Options | $ | – | $ | 279,333,767 | $ | – | $ | 279,333,767 | ||||||||
Short Term Investments | 1,658,264 | – | – | 1,658,264 | ||||||||||||
Total Assets | $ | 1,658,264 | $ | 279,333,767 | $ | – | $ | 280,992,031 | ||||||||
Liabilities | ||||||||||||||||
Options Written | $ | – | $ | 6,267,959 | $ | – | $ | 6,267,959 | ||||||||
Total Liabilities | $ | – | $ | 6,267,959 | $ | – | $ | 6,267,959 | ||||||||
UFEB | ||||||||||||||||
Level 1 | Level 2 | Level 3 | Total | |||||||||||||
Assets | ||||||||||||||||
Purchased Options | $ | – | $ | 42,822,928 | $ | – | $ | 42,822,928 | ||||||||
Short Term Investments | 275,961 | – | – | 275,961 | ||||||||||||
Total Assets | $ | 275,961 | $ | 42,822,928 | $ | – | $ | 43,098,889 | ||||||||
Liabilities | ||||||||||||||||
Options Written | $ | – | $ | 1,268,500 | $ | – | $ | 1,268,500 | ||||||||
Total Liabilities | $ | – | $ | 1,268,500 | $ | – | $ | 1,268,500 | ||||||||
UMAR | ||||||||||||||||
Level 1 | Level 2 | Level 3 | Total | |||||||||||||
Assets | ||||||||||||||||
Purchased Options | $ | – | $ | 41,299,692 | $ | – | $ | 41,299,692 | ||||||||
Short Term Investments | 279,614 | – | – | 279,614 | ||||||||||||
Total Assets | $ | 279,614 | $ | 41,299,692 | $ | – | $ | 41,579,306 | ||||||||
Liabilities | ||||||||||||||||
Options Written | $ | – | $ | 1,614,018 | $ | – | $ | 1,614,018 | ||||||||
Total Liabilities | $ | – | $ | 1,614,018 | $ | – | $ | 1,614,018 | ||||||||
UAPR | ||||||||||||||||
Level 1 | Level 2 | Level 3 | Total | |||||||||||||
Assets | ||||||||||||||||
Purchased Options | $ | – | $ | 54,146,407 | $ | – | $ | 54,146,407 | ||||||||
Short Term Investments | 419,228 | – | – | 419,228 | ||||||||||||
Total Assets | $ | 419,228 | $ | 54,146,407 | $ | – | $ | 54,565,635 | ||||||||
Liabilities | ||||||||||||||||
Options Written | $ | – | $ | 1,835,627 | $ | – | $ | 1,835,627 | ||||||||
Total Liabilities | $ | – | $ | 1,835,627 | $ | – | $ | 1,835,627 | ||||||||
INNOVATOR ETFs TRUST
Notes to Financial Statements (Unaudited) (Continued)
UMAY | ||||||||||||||||
Level 1 | Level 2 | Level 3 | Total | |||||||||||||
Assets | ||||||||||||||||
Purchased Options | $ | – | $ | 31,385,317 | $ | – | $ | 31,385,317 | ||||||||
Short Term Investments | 5,949 | – | – | 5,949 | ||||||||||||
Total Assets | $ | 5,949 | $ | 31,385,317 | $ | – | $ | 31,391,266 | ||||||||
Liabilities | ||||||||||||||||
Options Written | $ | – | $ | 1,731,714 | $ | – | $ | 1,731,714 | ||||||||
Total Liabilities | $ | – | $ | 1,731,714 | $ | – | $ | 1,731,714 | ||||||||
UJUN | ||||||||||||||||
Level 1 | Level 2 | Level 3 | Total | |||||||||||||
Assets | ||||||||||||||||
Purchased Options | $ | – | $ | 16,888,124 | $ | – | $ | 16,888,124 | ||||||||
Short Term Investments | 44,287 | – | – | 44,287 | ||||||||||||
Total Assets | $ | 44,287 | $ | 16,888,124 | $ | – | $ | 16,932,411 | ||||||||
Liabilities | ||||||||||||||||
Options Written | $ | – | $ | 62,905 | $ | – | $ | 62,905 | ||||||||
Total Liabilities | $ | – | $ | 62,905 | $ | – | $ | 62,905 | ||||||||
UJUL | ||||||||||||||||
Level 1 | Level 2 | Level 3 | Total | |||||||||||||
Assets | �� | |||||||||||||||
Purchased Options | $ | – | $ | 36,518,246 | $ | – | $ | 36,518,246 | ||||||||
Short Term Investments | 64,465 | – | – | 64,465 | ||||||||||||
Total Assets | $ | 64,465 | $ | 36,518,246 | $ | – | $ | 36,582,711 | ||||||||
Liabilities | ||||||||||||||||
Options Written | $ | – | $ | 272,255 | $ | – | $ | 272,255 | ||||||||
Total Liabilities | $ | – | $ | 272,255 | $ | – | $ | 272,255 | ||||||||
UAUG | ||||||||||||||||
Level 1 | Level 2 | Level 3 | Total | |||||||||||||
Assets | ||||||||||||||||
Purchased Options | $ | – | $ | 25,918,175 | $ | – | $ | 25,918,175 | ||||||||
Short Term Investments | 84,799 | – | – | 84,799 | ||||||||||||
Total Assets | $ | 84,799 | $ | 25,918,175 | $ | – | $ | 26,002,974 | ||||||||
Liabilities | ||||||||||||||||
Options Written | $ | – | $ | 250,074 | $ | – | $ | 250,074 | ||||||||
Total Liabilities | $ | – | $ | 250,074 | $ | – | $ | 250,074 | ||||||||
INNOVATOR ETFs TRUST
Notes to Financial Statements (Unaudited) (Continued)
USEP | ||||||||||||||||
Level 1 | Level 2 | Level 3 | Total | |||||||||||||
Assets | ||||||||||||||||
Purchased Options | $ | – | $ | 60,883,937 | $ | – | $ | 60,883,937 | ||||||||
Short Term Investments | 192,867 | – | – | 192,867 | ||||||||||||
Total Assets | $ | 192,867 | $ | 60,883,937 | $ | – | $ | 61,076,804 | ||||||||
Liabilities | ||||||||||||||||
Options Written | $ | – | $ | 695,177 | $ | – | $ | 695,177 | ||||||||
Total Liabilities | $ | – | $ | 695,177 | $ | – | $ | 695,177 | ||||||||
UOCT | ||||||||||||||||
Level 1 | Level 2 | Level 3 | Total | |||||||||||||
Assets | ||||||||||||||||
Purchased Options | $ | – | $ | 62,796,056 | $ | – | $ | 62,796,056 | ||||||||
Short Term Investments | 260,537 | – | – | 260,537 | ||||||||||||
Total Assets | $ | 260,537 | $ | 62,796,056 | $ | – | $ | 63,056,593 | ||||||||
Liabilities | ||||||||||||||||
Options Written | $ | – | $ | 1,565,106 | $ | – | $ | 1,565,106 | ||||||||
Total Liabilities | $ | – | $ | 1,565,106 | $ | – | $ | 1,565,106 | ||||||||
UNOV | ||||||||||||||||
Level 1 | Level 2 | Level 3 | Total | |||||||||||||
Assets | ||||||||||||||||
Purchased Options | $ | – | $ | 43,997,699 | $ | – | $ | 43,997,699 | ||||||||
Short Term Investments | 205,100 | – | – | 205,100 | ||||||||||||
Total Assets | $ | 205,100 | $ | 43,997,699 | $ | – | $ | 44,202,799 | ||||||||
Liabilities | ||||||||||||||||
Options Written | $ | – | $ | 794,759 | $ | – | $ | 794,759 | ||||||||
Total Liabilities | $ | – | $ | 794,759 | $ | – | $ | 794,759 | ||||||||
UDEC | ||||||||||||||||
Level 1 | Level 2 | Level 3 | Total | |||||||||||||
Assets | ||||||||||||||||
Purchased Options | $ | – | $ | 47,257,121 | $ | – | $ | 47,257,121 | ||||||||
Short Term Investments | 259,350 | – | – | 259,350 | ||||||||||||
Total Assets | $ | 259,350 | $ | 47,257,121 | $ | – | $ | 47,516,471 | ||||||||
Liabilities | ||||||||||||||||
Options Written | $ | – | $ | 1,019,496 | $ | – | $ | 1,019,496 | ||||||||
Total Liabilities | $ | – | $ | 1,019,496 | $ | – | $ | 1,019,496 | ||||||||
There were no Level 3 investments for the Funds during the period ended April 30, 2022.
INNOVATOR ETFs TRUST
Notes to Financial Statements (Unaudited) (Continued)
Option Contracts:
In general, an option contract is an agreement between a buyer and seller that gives the purchaser of the option the right to buy or sell a particular asset at a specified future date at an agreed upon price (commonly known as the “strike price”).
The Funds invest primarily in FLEX Option contracts. FLEX Options are customized option contracts that trade on an exchange but provide investors with the ability to customize key contract terms like strike price, style and expiration date while achieving price discovery in competitive, transparent auctions markets and avoiding the counterparty exposure of over–the–counter options positions. Like traditional exchange–traded options, FLEX Options are guaranteed for settlement by the OCC, a market clearinghouse that guarantees performance by counterparties to certain derivatives contracts. The FLEX Options in which the Funds will invest are all European style options (options that are exercisable only on the expiration date). The FLEX Options are listed on the Chicago Board Options Exchange.
The Funds will purchase and sell call and put FLEX Options. In general, put options give the holder (i.e., the buyer) the right to sell an asset (or deliver the cash value of the index, in case of an index put option) and the seller (i.e., the writer) of the put has the obligation to buy the asset (or receive cash value of the index, in case of an index put option) at a certain defined price. Call options give the holder (i.e., the buyer) the right to buy an asset (or receive cash value of the index, in case of an index call option) and the seller (i.e., the writer) the obligation to sell the asset (or deliver cash value of the index, in case of an index call option) at a certain defined price.
When the Funds purchase an option, an amount equal to the premium paid by the Funds are recorded as an investment and is subsequently adjusted to the current value of the option purchased. If an option expires on the stipulated expiration date or if the Funds enter into a closing sale transaction, a gain or loss is realized. If a call option is exercised, the cost of the security acquired is increased by the premium paid for the call. If a put option is exercised, a gain or loss is realized from the sale of the underlying security, and the proceeds from such sale are decreased by the premium originally paid. Purchased options are non-income producing securities.
When the Funds write an option, an amount equal to the premium received by the Funds are recorded as a liability and is subsequently adjusted to the current value of the option written. Premiums received from writing options that expire unexercised are treated by the Funds on the expiration date as realized gain from written options. The difference between the premium and the amount paid on effecting a closing purchase transaction, including brokerage commissions, is also treated as a realized gain, or if the premium is less than the amount paid for the closing purchase transaction, as a realized loss. If a call option is exercised, the premium is added to the proceeds from the sale of the underlying security in determining whether the Funds have realized a gain or loss. If a put option is exercised, the premium reduces the cost basis of the securities purchased by the Funds. The Funds, as writers of an option, bear the market risk of an unfavorable change in the price of the security underlying the written option.
INNOVATOR ETFs TRUST
Notes to Financial Statements (Unaudited) (Continued)
All of the FLEX Option contracts held by the Funds are fully funded and cash settled, therefore balance sheet offsetting under ASC 210 does not apply.
The Funds bear the risk that the OCC will be unable or unwilling to perform its obligations under the FLEX Options contracts. In the unlikely event that the OCC becomes insolvent or is otherwise unable to meet its settlement obligations, the Funds could suffer significant losses. Additionally, FLEX Options may be less liquid than certain other securities such as standardized options. In less liquid market for the FLEX Options, the Funds may have difficulty closing out certain FLEX Options positions at desired times and prices. The Funds may experience substantial downside from specific FLEX Option positions and certain FLEX Option positions may expire worthless. The value of the underlying FLEX Options will be affected by, among others, changes in the value of the exchange, changes in interest rates, changes in the actual and implied volatility of the Index and the remaining time to until the FLEX Options expire. The value of the FLEX Options does not increase or decrease at the same rate as the level of the Index (although they generally move in the same direction). However, as a FLEX Option approaches its expiration date, its value typically increasingly moves with the value of the Index.
INNOVATOR ETFs TRUST
Notes to Financial Statements (Unaudited) (Continued)
The value of derivative instruments on the Statements of Assets and Liabilities for the Funds as of April 30, 2022, is as follows:
Equity Risk - Call and Put Options not Accounted for as Hedging Instruments | ||||||||
Asset Derivatives | Liability Derivatives | |||||||
Investments, at value | Options written, at alue | |||||||
BJAN | $ | 213,254,823 | $ | 18,793,110 | ||||
BFEB | 125,153,448 | 9,459,023 | ||||||
BMAR | 92,990,577 | 6,638,141 | ||||||
BAPR | 135,423,388 | 11,359,930 | ||||||
BMAY | 65,249,142 | 4,434,234 | ||||||
BJUN | 58,483,949 | 670,324 | ||||||
BJUL | 96,820,200 | 2,433,915 | ||||||
BAUG | 116,880,415 | 4,397,604 | ||||||
BSEP | 148,813,400 | 7,786,876 | ||||||
BOCT | 95,255,640 | 4,518,872 | ||||||
BNOV | 79,674,615 | 5,495,844 | ||||||
BDEC | 96,710,233 | 6,740,495 | ||||||
PJAN | 583,707,723 | 37,928,541 | ||||||
PFEB | 322,857,944 | 19,502,896 | ||||||
PMAR | 252,289,578 | 15,664,621 | ||||||
PAPR | 330,193,323 | 22,495,252 | ||||||
PMAY | 215,265,778 | 14,655,640 | ||||||
PJUN | 138,375,486 | 924,221 | ||||||
PJUL | 171,784,022 | 2,660,472 | ||||||
PAUG | 180,656,109 | 4,497,900 | ||||||
PSEP | 280,668,896 | 9,750,071 | ||||||
POCT | 192,847,584 | 7,493,477 | ||||||
PNOV | 212,746,797 | 10,561,458 | ||||||
PDEC | 237,282,710 | 12,241,525 | ||||||
UJAN | 279,333,767 | 6,267,959 | ||||||
UFEB | 42,822,928 | 1,268,500 | ||||||
UMAR | 41,299,692 | 1,614,018 | ||||||
UAPR | 54,146,407 | 1,835,627 | ||||||
UMAY | 31,385,317 | 1,731,714 | ||||||
UJUN | 16,888,124 | 62,905 | ||||||
UJUL | 36,518,246 | 272,255 | ||||||
UAUG | 25,918,175 | 250,074 | ||||||
USEP | 60,883,937 | 695,177 | ||||||
UOCT | 62,796,056 | 1,565,106 | ||||||
UNOV | 43,997,699 | 794,759 | ||||||
UDEC | 47,257,121 | 1,019,496 | ||||||
INNOVATOR ETFs TRUST
Notes to Financial Statements (Unaudited) (Continued)
The effect of derivative instruments on the Statements of Operations for the period ended April 30, 2022:
Equity Risk - Call and Put Options not Accounted for as | ||||||||||||||||
Amount of Realized Gain/(Loss) on Derivatives | ||||||||||||||||
Investments | Investments in-kind | Options written | Options | |||||||||||||
BJAN | $ | (7,876,357 | ) | $ | 33,024,293 | $ | (11,951,723 | ) | $ | 6,841,451 | ||||||
BFEB | 526,724 | 9,098,357 | (1,618,838 | ) | 4,429,411 | |||||||||||
BMAR | (1,557,053 | ) | 6,719,712 | (96,462 | ) | 4,046,196 | ||||||||||
BAPR | 2,041,263 | 7,581,912 | 15,173 | 6,598,362 | ||||||||||||
BMAY | (4,570,152 | ) | 2,878,118 | 237,924 | 4,013,700 | |||||||||||
BJUN | 272,932 | 1,000,943 | 83,727 | (61,348 | ) | |||||||||||
BJUL | 3,662,140 | 577,855 | (282,362 | ) | 48,797 | |||||||||||
BAUG | (102,160 | ) | 47,222 | 163,541 | 8,178 | |||||||||||
BSEP | (1,068,018 | ) | – | (122,685 | ) | – | ||||||||||
BOCT | (522,392 | ) | 845,536 | (179,758 | ) | 434,628 | ||||||||||
BNOV | (448,378 | ) | – | (78,646 | ) | – | ||||||||||
BDEC | (13,531,318 | ) | – | (7,032,562 | ) | – | ||||||||||
PJAN | (11,094,300 | ) | 68,363,246 | (42,781,632 | ) | 10,886,368 | ||||||||||
PFEB | 992,795 | 21,110,778 | (8,498,652 | ) | 5,856,708 | |||||||||||
PMAR | (3,450,983 | ) | 13,816,877 | (1,543,075 | ) | 4,574,382 | ||||||||||
PAPR | 6,557,106 | 16,138,720 | (9,979,888 | ) | 10,306,320 | |||||||||||
PMAY | (13,710,551 | ) | 8,463,751 | 199,735 | 11,866,774 | |||||||||||
PJUN | 357,739 | 104,959 | (200,894 | ) | 85,282 | |||||||||||
PJUL | 1,326,969 | 35,321 | (323,592 | ) | 41,724 | |||||||||||
PAUG | (175,510 | ) | 115,553 | 62,992 | 6,935 | |||||||||||
PSEP | (574,230 | ) | – | (233,549 | ) | – | ||||||||||
POCT | 174,511 | – | (853,884 | ) | – | |||||||||||
PNOV | (527,138 | ) | 902,972 | (72,780 | ) | 462,227 | ||||||||||
PDEC | (27,103,403 | ) | – | (18,488,553 | ) | – | ||||||||||
UJAN | (3,044,483 | ) | 21,421,180 | (11,666,073 | ) | 1,073,436 | ||||||||||
UFEB | (352,440 | ) | 4,050,167 | (1,896,741 | ) | 424,879 | ||||||||||
UMAR | (202,411 | ) | 3,976,863 | (1,363,927 | ) | 364,074 | ||||||||||
UAPR | 2,984,156 | 3,399,487 | (3,491,033 | ) | 1,550,285 | |||||||||||
UMAY | (1,947,436 | ) | 1,303,213 | (39,713 | ) | 1,686,831 | ||||||||||
UJUN | 133,476 | – | (57,125 | ) | – | |||||||||||
UJUL | 406,036 | – | (328,616 | ) | – | |||||||||||
UAUG | 337,481 | – | (320,003 | ) | – | |||||||||||
USEP | (204,791 | ) | – | (119,141 | ) | – | ||||||||||
UOCT | (600,132 | ) | – | (51,874 | ) | – | ||||||||||
UNOV | (195,672 | ) | – | (23,440 | ) | – | ||||||||||
UDEC | 3,345,993 | – | (5,427,229 | ) | – | |||||||||||
INNOVATOR ETFs TRUST
Notes to Financial Statements (Unaudited) (Continued)
Equity Risk - Call and Put Options not Accounted for as Hedging Instruments | ||||||||
Change in Unrealized Appreciation/(Depreciation) on Derivatives Recognized in Income | ||||||||
Investments | Options | |||||||
BJAN | $ | (35,049,373 | ) | $ | (1,548,769 | ) | ||
BFEB | (17,384,435 | ) | (621,439 | ) | ||||
BMAR | (11,182,548 | ) | (274,442 | ) | ||||
BAPR | (16,911,061 | ) | (1,854,280 | ) | ||||
BMAY | (4,826,104 | ) | (1,269,028 | ) | ||||
BJUN | (7,100,987 | ) | 2,738,682 | |||||
BJUL | (9,903,835 | ) | 2,658,964 | |||||
BAUG | (7,699,904 | ) | 1,781,690 | |||||
BSEP | (8,446,469 | ) | 686,740 | |||||
BOCT | (7,894,338 | ) | 2,153,791 | |||||
BNOV | (4,627,525 | ) | (100,841 | ) | ||||
BDEC | 6,459,120 | 8,826,667 | ||||||
PJAN | (74,119,154 | ) | 17,648,136 | |||||
PFEB | (40,692,045 | ) | 9,914,448 | |||||
PMAR | (24,544,190 | ) | 7,035,655 | |||||
PAPR | (38,669,914 | ) | 7,249,810 | |||||
PMAY | (14,438,526 | ) | 1,644,083 | |||||
PJUN | (14,355,777 | ) | 10,413,893 | |||||
PJUL | (15,624,106 | ) | 10,390,546 | |||||
PAUG | (12,316,351 | ) | 6,978,283 | |||||
PSEP | (16,747,904 | ) | 6,466,172 | |||||
POCT | (14,525,849 | ) | 9,211,348 | |||||
PNOV | (12,840,640 | ) | 3,034,282 | |||||
PDEC | 9,828,493 | 26,087,193 | ||||||
UJAN | (29,568,903 | ) | 12,495,157 | |||||
UFEB | (6,768,626 | ) | 3,368,498 | |||||
UMAR | (6,773,027 | ) | 3,313,601 | |||||
UAPR | (9,254,453 | ) | 4,124,011 | |||||
UMAY | (2,856,160 | ) | 1,169,161 | |||||
UJUN | (2,139,774 | ) | 1,448,916 | |||||
UJUL | (4,002,424 | ) | 2,890,747 | |||||
UAUG | (2,675,914 | ) | 1,688,425 | |||||
USEP | (4,664,663 | ) | 2,283,662 | |||||
UOCT | (5,291,279 | ) | 4,063,975 | |||||
UNOV | (3,032,708 | ) | 1,421,414 | |||||
UDEC | (7,654,781 | ) | 7,888,857 | |||||
INNOVATOR ETFs TRUST
Notes to Financial Statements (Unaudited) (Continued)
The average volume of derivative activity during the period ended April 30, 2022, is as follows:
Purchased Options | Options Written | |||||||
Average Monthly | Average Monthly | |||||||
BJAN | $ | 199,056,005 | $ | (14,066,360 | ) | |||
BFEB | 93,938,206 | (6,565,616 | ) | |||||
BMAR | 73,079,440 | (4,496,186 | ) | |||||
BAPR | 124,943,767 | (6,902,058 | ) | |||||
BMAY | 71,256,788 | (2,412,847 | ) | |||||
BJUN | 64,565,515 | (2,328,692 | ) | |||||
BJUL | 98,870,365 | (3,986,477 | ) | |||||
BAUG | 93,966,273 | (3,660,923 | ) | |||||
BSEP | 157,789,671 | (7,462,749 | ) | |||||
BOCT | 110,330,418 | (6,314,501 | ) | |||||
BNOV | 88,272,505 | (5,330,048 | ) | |||||
BDEC | 88,612,275 | (5,338,636 | ) | |||||
PJAN | 504,848,411 | (31,929,620 | ) | |||||
PFEB | 239,841,215 | (17,942,142 | ) | |||||
PMAR | 164,274,977 | (12,833,311 | ) | |||||
PAPR | 245,209,632 | (17,854,573 | ) | |||||
PMAY | 217,204,687 | (10,847,545 | ) | |||||
PJUN | 152,448,453 | (7,528,601 | ) | |||||
PJUL | 191,808,084 | (9,544,853 | ) | |||||
PAUG | 185,267,051 | (8,522,364 | ) | |||||
PSEP | 287,218,725 | (12,876,056 | ) | |||||
POCT | 207,311,609 | (13,379,875 | ) | |||||
PNOV | 215,601,852 | (11,877,306 | ) | |||||
PDEC | 223,942,393 | (12,340,712 | ) | |||||
UJAN | 175,548,174 | (6,522,663 | ) | |||||
UFEB | 34,188,966 | (2,489,091 | ) | |||||
UMAR | 35,200,416 | (2,932,345 | ) | |||||
UAPR | 48,974,270 | (3,623,309 | ) | |||||
UMAY | 40,107,894 | (2,164,825 | ) | |||||
UJUN | 19,558,513 | (1,008,162 | ) | |||||
UJUL | 46,319,951 | (2,341,942 | ) | |||||
UAUG | 31,182,624 | (1,344,111 | ) | |||||
USEP | 63,355,496 | (2,153,593 | ) | |||||
UOCT | 71,054,847 | (4,424,087 | ) | |||||
UNOV | 41,741,471 | (1,532,475 | ) | |||||
UDEC | 45,169,054 | (1,797,720 | ) | |||||
INNOVATOR ETFs TRUST
Notes to Financial Statements (Unaudited) (Continued)
Use of Estimates:
In preparing financial statements in conformity with U.S. GAAP, management is required to make estimates and assumptions that affect the reported amounts of assets and liabilities and disclosure of contingent assets and liabilities as of the date of the financial statements and the reported amounts of increases and decreases in net assets from operations during the reporting period. Actual results could differ from these estimates.
Guarantees and Indemnifications:
In the normal course of business, the Trust may enter into a contract with service providers that contain general indemnification clauses. The Trust’s maximum exposure under these arrangements is unknown as this would involve future claims against the Trust that have not yet occurred. Based on experience, the Trust expects the risk of loss to be remote.
Tax Information:
The Funds are treated as separate entities for federal income tax purposes. The Funds intend to qualify as regulated investment companies (“RICs”) under Subchapter M of the Internal Revenue Code of 1986, as amended (the “Internal Revenue Code”). To qualify and remain eligible for the special tax treatment accorded to RICs, the Funds must meet certain annual income and quarterly asset diversification requirements and must distribute annually at least 90% of the sum of (i) its investment company taxable income (which includes dividends, interest and net short-term capital gains) and (ii) certain net tax-exempt income, if any. If so qualified, the Funds will not be subject to federal income tax to the extent the Funds distribute substantially all of their net investment income and capital gains to shareholders.
Management evaluates the Funds’ tax positions to determine if the tax positions taken meet the minimum recognition threshold in connection with accounting for uncertainties in income tax positions taken or expected to be taken for the purposes of measuring and recognizing tax liabilities in the financial statements. Tax benefits associated with an uncertain tax position can be recognized only when the position is “more likely than not” to be sustained assuming examination by taxing authorities. Interest and penalties related to income taxes would be recorded as tax expense in the Statements of Operations. During the period ended April 30, 2022, the Funds did not incur any interest or penalties. The Funds’ federal income tax returns are subject to examination by the Internal Revenue Service (IRS) for a period of three fiscal years after they are filed. State and local tax returns may be subject to examination for an additional fiscal year depending on the jurisdiction. As of April 30, 2022, the Funds did not have a liability for any unrecognized tax benefits. As of April 30, 2022, the Funds have no examinations in progress and management is not aware of any tax positions for which it is reasonably possible that the amounts of unrecognized tax benefits will significantly change in the next twelve months. The Funds are subject to examination by U.S. Federal tax authorities for all tax years since inception.
INNOVATOR ETFs TRUST
Notes to Financial Statements (Unaudited) (Continued)
U.S. GAAP requires that certain components of net assets be reclassified between distributable earnings/(accumulated deficit) and additional paid-in capital. These reclassifications have no effect on net assets or net asset value per share. For the year ended October 31, 2021, the Funds made the following permanent book-to-tax reclassifications due to deemed distributions and redemption in-kind transactions:
Distributable Earnings/ (Accumulated Deficit) | Paid-In | |||||||
BJAN | $ | (971,038 | ) | $ | 971,038 | |||
BFEB | (2,506,274 | ) | 2,506,274 | |||||
BMAR | (1,566,669 | ) | 1,566,669 | |||||
BAPR | (3,093,271 | ) | 3,093,271 | |||||
BMAY | (1,218,071 | ) | 1,218,071 | |||||
BJUN | (2,845,787 | ) | 2,845,787 | |||||
BJUL | (7,519,387 | ) | 7,519,387 | |||||
BAUG | (6,225,736 | ) | 6,225,736 | |||||
BSEP | (15,421,553 | ) | 15,421,553 | |||||
BOCT | (14,280,863 | ) | 14,280,863 | |||||
BNOV | (3,463,164 | ) | 3,463,164 | |||||
BDEC | (12,925,974 | ) | 12,925,974 | |||||
PJAN | (16,331,458 | ) | 16,331,458 | |||||
PFEB | (4,921,288 | ) | 4,921,288 | |||||
PMAR | (2,387,759 | ) | 2,387,759 | |||||
PAPR | (4,199,639 | ) | 4,199,639 | |||||
PMAY | (3,114,610 | ) | 3,114,610 | |||||
PJUN | (4,888,672 | ) | 4,888,672 | |||||
PJUL | (6,547,380 | ) | 6,547,380 | |||||
PAUG | (9,294,734 | ) | 9,294,734 | |||||
PSEP | (34,275,966 | ) | 34,275,966 | |||||
POCT | (20,967,163 | ) | 20,967,163 | |||||
PNOV | (6,736,855 | ) | 6,736,855 | |||||
PDEC | (16,957,954 | ) | 16,957,954 | |||||
UJAN | (3,563,217 | ) | 3,563,217 | |||||
UFEB | (1,327,403 | ) | 1,327,403 | |||||
UMAR | (595,805 | ) | 595,805 | |||||
UAPR | (17,694 | ) | 17,694 | |||||
UMAY | (247,850 | ) | 247,850 | |||||
UJUN | (592,628 | ) | 592,628 | |||||
UJUL | (1,632,913 | ) | 1,632,913 | |||||
UAUG | (2,192,105 | ) | 2,192,105 | |||||
USEP | (5,205,253 | ) | 5,205,253 | |||||
UOCT | (6,953,787 | ) | 6,953,787 | |||||
UNOV | (935,467 | ) | 935,467 | |||||
UDEC | (3,489,624 | ) | 3,489,624 | |||||
INNOVATOR ETFs TRUST
Notes to Financial Statements (Unaudited) (Continued)
Distributions to Shareholders:
Distributions to shareholders are recorded on the ex–dividend date. The Funds intend to pay out dividends from their net investment income, if any, annually. Distributions of net realized capital gains, if any, will be declared and paid at least annually by the Funds. The Funds may periodically make reclassifications among certain of its capital accounts as a result of the recognition and characterization of certain income and capital gain distributions determined annually in accordance with federal tax regulations which may differ from U.S. GAAP. Distributions that exceed earnings and profits for tax purposes are reported as a return of capital.
Investment Transactions and Investment Income:
Investment transactions are recorded on the trade date. The Trust determines the gain or loss realized from investment transactions on the basis of identified cost. Dividend income, if any, is recognized on the ex–dividend date. Interest income, including accretion of discounts and amortization of premiums is recognized on an accrual basis using the effective yield method.
3. | INVESTMENT ADVISOR AND OTHER AFFILIATES |
Innovator Capital Management, LLC (the “Adviser”) acts as investment adviser to the Funds pursuant to an investment advisory agreement between the Trust and the Adviser with respect to the Funds (“Advisory Agreement”) and, pursuant to the Advisory Agreement, is responsible for the day–to–day management of the Funds.
Pursuant to the Advisory Agreement, each respective Fund pays monthly the Adviser a unitary fee calculated daily based on the average daily net assets of the Fund at the annual rate of 0.79%. During the term of the Advisory Agreement, the Adviser pays all expenses of the Funds, including the cost of transfer agency, custody, fund administration, legal, audit, and other services and license fees, except for the fees paid under the Advisory Agreement, interest, taxes, brokerage commissions and other expenses connected with the execution of portfolio transactions, distribution and service fees payable pursuant to a Rule 12b–1 plan, if any, and extraordinary expenses.
Milliman Financial Risk Management LLC (the “Sub–Adviser”) acts as sub–adviser to the Funds pursuant to a sub–advisory agreement between the Adviser and the Sub–Adviser with respect to the Funds (“Sub–Advisory Agreement”) and, pursuant to the Sub–Advisory Agreement, is responsible for execution of the Sub–Adviser’s strategy for each of the Funds. The Sub–Adviser is responsible for the day–to–day management of the Funds’ portfolios. Pursuant to the Sub–Advisory Agreement between the Adviser and the Sub–Adviser, the Adviser pays the Sub–Adviser a fee, based on the Funds’ average daily net assets, for the services and facilities it provides payable on a monthly basis.
Certain trustees and officers of the Trust are affiliated with the Adviser. Trustee compensation is paid for by the Adviser.
INNOVATOR ETFs TRUST
Notes to Financial Statements (Unaudited) (Continued)
4. | INVESTMENT TRANSACTIONS |
For the period ended April 30, 2022, there were no purchases or proceeds from long-term sales of investment securities.
For the period ended April 30, 2022, in-kind transactions associated with creations and redemptions were as follows:
In-Kind | In-Kind | |||||||
BJAN | $ | – | $ | 151,738,818 | ||||
BFEB | – | 60,024,059 | ||||||
BMAR | – | 56,890,139 | ||||||
BAPR | – | 111,937,096 | ||||||
BMAY | – | 65,245,995 | ||||||
BJUN | – | 16,131,912 | ||||||
BJUL | – | 7,356,384 | ||||||
BAUG | – | 911,700 | ||||||
BSEP | – | – | ||||||
BOCT | 1,935,758 | 16,982,472 | ||||||
BNOV | 26,424,129 | – | ||||||
BDEC | – | – | ||||||
PJAN | – | 315,864,525 | ||||||
PFEB | – | 134,909,113 | ||||||
PMAR | – | 114,781,826 | ||||||
PAPR | – | 200,179,226 | ||||||
PMAY | – | 185,037,038 | ||||||
PJUN | – | 1,657,149 | ||||||
PJUL | – | 804,990 | ||||||
PAUG | – | 2,441,779 | ||||||
PSEP | 824,689 | – | ||||||
POCT | 1,769,564 | – | ||||||
PNOV | 43,055,424 | 40,784,880 | ||||||
PDEC | – | – | ||||||
UJAN | – | 98,577,745 | ||||||
UFEB | – | 26,511,157 | ||||||
UMAR | – | 30,711,375 | ||||||
UAPR | – | 41,738,562 | ||||||
UMAY | – | 30,181,937 | ||||||
UJUN | – | – | ||||||
UJUL | – | – | ||||||
UAUG | – | – | ||||||
USEP | 756,630 | – | ||||||
UOCT | 1,648,205 | – | ||||||
UNOV | 6,838,530 | – | ||||||
UDEC | – | – | ||||||
INNOVATOR ETFs TRUST
Notes to Financial Statements (Unaudited) (Continued)
5. | CREATION AND REDEMPTION TRANSACTIONS |
There were an unlimited number of shares of beneficial interest (without par value) authorized by the Trust. Individual shares of the Funds may only be purchased and sold at market prices on the Exchange through a broker-dealer. Such transactions may be subject to customary commission rates imposed by the broker-dealer, and market prices for the Funds’ shares may be at, above or below its NAV depending on the premium or discount at which the Funds’ shares trade.
The Funds issue and redeem shares on a continuous basis at NAV only in blocks of 25,000 shares, called “Creation Units.” Creation Units are issued and redeemed principally for cash. Once created, shares generally trade in the secondary market at market prices that change throughout the day in amounts less than a Creation Unit. Except when aggregated in Creation Units, shares are not redeemable securities of the Funds. Shares of the Funds may only be purchased or redeemed by certain financial institutions (“Authorized Participants”). An Authorized Participant is either (i) a broker–dealer or other participant in the clearing process through the Continuous Net Settlement System of the National Securities Clearing Corporation or (ii) a DTC participant and, in each case, must have executed a Participant Agreement with the Distributor. A transaction fee is applicable to each transaction regardless of the number of units purchased or sold in the transaction. Each Fund, subject to approval by the Board of Trustees, may adjust transaction fees from time to time based upon actual experience. Variable fees received by the Funds, if any, are disclosed on the Statements of Changes in Net Assets. Most retail investors do not qualify as Authorized Participants nor have the resources to buy and sell whole Creation Units. Therefore, they are unable to purchase or redeem the shares directly from the Funds. Rather, most retail investors may purchase shares in the secondary market with the assistance of a broker and are subject to customary brokerage commissions or fees.
INNOVATOR ETFs TRUST
Notes to Financial Statements (Unaudited) (Continued)
6. | FEDERAL INCOME TAX INFORMATION |
At October 31, 2021, the cost of investments including written options and net unrealized appreciation/(depreciation) for federal income tax purposes were as follows:
Cost of Portfolio | Gross Unrealized Appreciation | Gross Unrealized Depreciation | Net Unrealized Appreciation/ (Depreciation) | |||||||||||||
BJAN | $ | 129,445,611 | $ | 41,470,768 | $ | (20,576,847 | ) | $ | 20,893,921 | |||||||
BFEB | 74,746,063 | 21,820,066 | (10,307,336 | ) | 11,512,730 | |||||||||||
BMAR | 54,225,429 | 14,466,628 | (6,487,533 | ) | 7,979,095 | |||||||||||
BAPR | 112,770,004 | 20,769,724 | (10,500,081 | ) | 10,269,643 | |||||||||||
BMAY | 76,162,070 | 11,038,371 | (4,955,482 | ) | 6,082,889 | |||||||||||
BJUN | 76,773,133 | 9,571,635 | (4,780,889 | ) | 4,790,746 | |||||||||||
BJUL | 175,799,822 | 14,976,910 | (7,591,380 | ) | 7,385,530 | |||||||||||
BAUG | 83,873,425 | 5,189,992 | (2,472,516 | ) | 2,717,476 | |||||||||||
BSEP | 153,911,830 | 5,590,550 | (2,657,807 | ) | 2,932,743 | |||||||||||
BOCT | 107,998,619 | 9,016,357 | (5,071,923 | ) | 3,944,434 | |||||||||||
BNOV | 30,356,394 | – | (7,449 | ) | (7,449 | ) | ||||||||||
BDEC | 57,894,150 | – | – | – | ||||||||||||
PJAN | 266,951,586 | 77,623,705 | (49,815,433 | ) | 27,808,272 | |||||||||||
PFEB | 152,194,360 | 45,833,050 | (27,521,446 | ) | 18,311,604 | |||||||||||
PMAR | 107,252,838 | 27,829,697 | (17,129,312 | ) | 10,700,385 | |||||||||||
PAPR | 226,598,931 | 42,792,528 | (26,728,925 | ) | 16,063,603 | |||||||||||
PMAY | 226,185,041 | 31,479,631 | (18,725,400 | ) | 12,754,231 | |||||||||||
PJUN | 146,263,848 | 17,821,463 | (11,017,280 | ) | 6,804,183 | |||||||||||
PJUL | 211,960,754 | 18,694,530 | (11,748,768 | ) | 6,945,762 | |||||||||||
PAUG | 182,031,208 | 11,039,657 | (6,954,932 | ) | 4,084,725 | |||||||||||
PSEP | 299,629,328 | 9,303,100 | (5,264,932 | ) | 4,038,168 | |||||||||||
POCT | 204,615,308 | 16,358,450 | (11,313,440 | ) | 5,045,010 | |||||||||||
PNOV | 78,745,660 | – | (19,327 | ) | (19,327 | ) | ||||||||||
PDEC | 108,748,349 | – | – | – | ||||||||||||
UJAN | 78,891,265 | 22,130,349 | (14,687,389 | ) | 7,442,960 | |||||||||||
UFEB | 24,351,945 | 6,584,486 | (4,510,486 | ) | 2,074,000 | |||||||||||
UMAR | 30,810,998 | 7,322,117 | (4,860,038 | ) | 2,462,079 | |||||||||||
UAPR | 54,121,087 | 9,030,170 | (5,872,678 | ) | 3,157,492 | |||||||||||
UMAY | 38,979,884 | 4,634,277 | (2,953,245 | ) | 1,681,032 | |||||||||||
UJUN | 20,392,968 | 2,197,726 | (1,421,574 | ) | 776,152 | |||||||||||
UJUL | 51,679,828 | 3,831,232 | (2,786,942 | ) | 1,044,290 | |||||||||||
UAUG | 45,779,709 | 2,238,914 | (1,605,761 | ) | 633,153 | |||||||||||
USEP | 66,936,199 | 1,752,874 | (1,143,795 | ) | 609,079 | |||||||||||
UOCT | 61,979,251 | 4,426,096 | (3,547,296 | ) | 878,800 | |||||||||||
UNOV | 10,892,581 | – | (2,672 | ) | (2,672 | ) | ||||||||||
UDEC | 32,101,487 | – | – | – | ||||||||||||
The differences between book basis and tax basis cost on investments and net unrealized appreciation/(depreciation) are primarily attributable to the tax treatment of derivatives.
INNOVATOR ETFs TRUST
Notes to Financial Statements (Unaudited) (Continued)
As of October 31, 2021, the components of distributable earnings/(accumulated deficit) on a tax basis were as follows:
Accumulated Capital and Other Losses | Undistributed Net Ordinary Income | Undistributed Capital Gains | Unrealized Appreciation/ (Depreciation) on Investments | Total Distributable Earnings/ (Accumulated Deficit) | ||||||||||||||||
BJAN | $ | (1,029,367 | ) | $ | – | $ | – | $ | 20,893,921 | $ | 19,864,554 | |||||||||
BFEB | – | – | – | 11,512,730 | 11,512,730 | |||||||||||||||
BMAR | – | – | – | 7,979,095 | 7,979,095 | |||||||||||||||
BAPR | – | – | – | 10,269,643 | 10,269,643 | |||||||||||||||
BMAY | – | – | – | 6,082,889 | 6,082,889 | |||||||||||||||
BJUN | – | – | – | 4,790,746 | 4,790,746 | |||||||||||||||
BJUL | – | – | – | 7,385,530 | 7,385,530 | |||||||||||||||
BAUG | – | – | – | 2,717,476 | 2,717,476 | |||||||||||||||
BSEP | – | – | – | 2,932,743 | 2,932,743 | |||||||||||||||
BOCT | – | – | – | 3,944,434 | 3,944,434 | |||||||||||||||
BNOV | – | – | – | (7,449 | ) | (7,449 | ) | |||||||||||||
BDEC | – | – | – | – | – | |||||||||||||||
PJAN | – | – | – | 27,808,272 | 27,808,272 | |||||||||||||||
PFEB | (405,625 | ) | – | – | 18,311,604 | 17,905,979 | ||||||||||||||
PMAR | – | – | – | 10,700,385 | 10,700,385 | |||||||||||||||
PAPR | (459,063 | ) | – | – | 16,063,603 | 15,604,540 | ||||||||||||||
PMAY | – | – | – | 12,754,231 | 12,754,231 | |||||||||||||||
PJUN | – | – | – | 6,804,183 | 6,804,183 | |||||||||||||||
PJUL | – | – | – | 6,945,762 | 6,945,762 | |||||||||||||||
PAUG | – | – | – | 4,084,725 | 4,084,725 | |||||||||||||||
PSEP | – | – | – | 4,038,168 | 4,038,168 | |||||||||||||||
POCT | – | – | – | 5,045,010 | 5,045,010 | |||||||||||||||
PNOV | – | – | – | (19,327 | ) | (19,327 | ) | |||||||||||||
PDEC | 1 | – | – | – | 1 | |||||||||||||||
UJAN | – | – | – | 7,442,960 | 7,442,960 | |||||||||||||||
UFEB | – | – | – | 2,074,000 | 2,074,000 | |||||||||||||||
UMAR | (117,871 | ) | – | – | 2,462,079 | 2,344,208 | ||||||||||||||
UAPR | (339,161 | ) | – | – | 3,157,492 | 2,818,331 | ||||||||||||||
UMAY | (121,048 | ) | – | – | 1,681,032 | 1,559,984 | ||||||||||||||
UJUN | – | – | – | 776,152 | 776,152 | |||||||||||||||
UJUL | – | – | – | 1,044,290 | 1,044,290 | |||||||||||||||
UAUG | – | – | – | 633,153 | 633,153 | |||||||||||||||
USEP | – | – | – | 609,079 | 609,079 | |||||||||||||||
UOCT | – | – | – | 878,800 | 878,800 | |||||||||||||||
UNOV | – | – | – | (2,672 | ) | (2,672 | ) | |||||||||||||
UDEC | – | – | – | – | – | |||||||||||||||
INNOVATOR ETFs TRUST
Notes to Financial Statements (Unaudited) (Continued)
Certain qualified late year ordinary losses incurred after December 31, and within the current taxable year, are deemed to arise on the first business day of the next taxable year. At October 31, 2021, the Funds deferred the following qualified late year ordinary losses:
Late Year Ordinary Losses | ||||
BJAN | $ | 1,029,367 | ||
BFEB | – | |||
BMAR | – | |||
BAPR | – | |||
BMAY | – | |||
BJUN | – | |||
BJUL | – | |||
BAUG | – | |||
BSEP | – | |||
BOCT | – | |||
BNOV | – | |||
BDEC | – | |||
PJAN | – | |||
PFEB | 405,623 | |||
PMAR | – | |||
PAPR | 459,063 | |||
PMAY | – | |||
PJUN | – | |||
PJUL | – | |||
PAUG | – | |||
PSEP | – | |||
POCT | – | |||
PNOV | – | |||
PDEC | – | |||
UJAN | – | |||
UFEB | – | |||
UMAR | 117,871 | |||
UAPR | 327,066 | |||
UMAY | 121,048 | |||
UJUN | – | |||
UJUL | – | |||
UAUG | – | |||
USEP | – | |||
UOCT | – | |||
UNOV | – | |||
UDEC | – | |||
At October 31, 2021, for federal income tax purposes, UAPR had $12,096 of indefinite short-term capital loss carryforwards available to offset future capital gains for an unlimited period. All other Funds had no capital-loss carryforwards at October 31,2021.
INNOVATOR ETFs TRUST
Notes to Financial Statements (Unaudited) (Continued)
To the extent that these loss carryforwards are utilized, capital gains so offset will not be distributed to shareholders. During the current tax year ended October 31, 2021, BJAN, BSEP, and PSEP utilized $9,508,224, $1,270,511, and $2,459,844 of capital loss carryforwards available, respectively.
The tax character of the distributions paid by the Funds during the fiscal year or period ended October 31, 2020 were as follows:
Distributions paid from: | ||||||||||||
Net Ordinary | Net Long-Term | Total | ||||||||||
BJAN | $ | 1,017,030 | $ | – | $ | 1,017,030 | ||||||
BFEB | – | – | – | |||||||||
BMAR | – | – | – | |||||||||
BAPR | – | – | – | |||||||||
BMAY | – | – | – | |||||||||
BJUN | – | – | – | |||||||||
BJUL | – | – | – | |||||||||
BAUG | – | – | – | |||||||||
BSEP | 62,944 | – | 62,944 | |||||||||
BOCT | 364,251 | – | 364,251 | |||||||||
BNOV | – | – | – | |||||||||
BDEC | – | – | – | |||||||||
PJAN | – | – | – | |||||||||
PFEB | – | – | – | |||||||||
PMAR | – | – | – | |||||||||
PAPR | 1,697,336 | 1,088,189 | 2,785,525 | |||||||||
PMAY | – | – | – | |||||||||
PJUN | – | – | – | |||||||||
PJUL | 770,315 | – | 770,315 | |||||||||
PAUG | 1,011,480 | 526,980 | 1,538,460 | |||||||||
PSEP | – | – | – | |||||||||
POCT | 2,195,472 | 4,873,122 | 7,068,594 | |||||||||
PNOV | – | – | – | |||||||||
PDEC | – | – | – | |||||||||
UJAN | – | – | – | |||||||||
UFEB | – | – | – | |||||||||
UMAR | – | – | – | |||||||||
UAPR | 252,554 | 161,349 | 413,903 | |||||||||
UMAY | – | – | – | |||||||||
UJUN | 42,149 | 59,377 | 101,526 | |||||||||
UJUL | 1,438,744 | 953,057 | 2,391,801 | |||||||||
UAUG | 97,889 | 57,580 | 155,469 | |||||||||
USEP | 20,870 | 11,776 | 32,646 | |||||||||
UOCT | 2,185,521 | 968,412 | 3,153,933 | |||||||||
UNOV | – | – | – | |||||||||
UDEC | – | – | – | |||||||||
The Funds did not pay any distributions during the fiscal year ended October 31, 2021.
INNOVATOR ETFs TRUST
Notes to Financial Statements (Unaudited) (Continued)
7. | NEW ACCOUNTING PRONOUNCEMENTS |
In August 2021, FASB issued Accounting Standards Update 2021-06, which includes updates to Financial Services— Investment Companies (Topic 946): Amendments to SEC Paragraphs Pursuant to SEC Final Rule Releases No. 33-10786, Amendments to Financial Disclosures about Acquired and Disposed Businesses (“ASU 2021-06”). Among other revisions, the ASU 2021-06 added to the Accounting Standard Codification the text of SEC Regulation S-X Rule 6-11, Financial Statements of Funds Acquired or to Be Acquired, which governs the financial reporting for fund acquisitions by investment companies and business development companies. The amendments are effective as of the beginning of the registrant’s fiscal year beginning after December 31, 2020 (the “mandatory compliance date”). Acquisitions and dispositions that are probable or consummated after the mandatory compliance date must be evaluated for significance using the final amendments. Management has evaluated ASU 2021-06 and has adopted the relevant provisions of the disclosure framework.
8. | COVID-19 |
The recent global outbreak of COVID-19 has disrupted economic markets and the prolonged economic impact is uncertain. The operational and financial performance of the issuers of securities in which the Funds invest depend on future developments, including the duration and spread of the outbreak, and such uncertainty may in turn impact the value of the Funds’ investments.
9. | SUBSEQUENT EVENT |
Management has evaluated the impact of all subsequent events of the Funds through the date of the financial statements were issued, and has determined that there were no subsequent events requiring recognition or disclosure in the financial statements.
INNOVATOR ETFs TRUST
Trustees and Officers (Unaudited)
Name, Address and Year of Birth | Position with | Length of Time Served* | Principal Occupation(s) | Number of Portfolios in Fund Complex(a) Overseen by Trustee or Officer | Other Directorships Held by Trustee or Officer in the Past Five Years |
Independent Trustees | |||||
Mark Berg | Trustee | Since 2017 | Founding Principal (2001-present), Chief Executive Officer (2019-present), President (2001-2019), Timothy Financial Counsel, Inc. | 87 | Tortazo, LLC (2018-present) |
Joe Stowell | Trustee | Since 2017 | Chief Operating Officer, Woodmen Valley Chapel (2015–present). | 87 | Board of Advisors, Westmont College |
Brian J. Wildman | Trustee | Since 2017 | President, Timothy Financial Counsel, Inc. (2019–present); Executive Vice President, Consumer Banking (2016–2019), Chief Risk Officer (2013–2016), MB Financial Bank. | 87 | Missionary Furlough Homes, Inc. (since 2008); MB Financial Bank (2003–2019). |
INNOVATOR ETFs TRUST
Trustees and Officers (Unaudited) (Continued)
Interested Trustee & Officer | |||||
H. Bruce Bond (b) | Interested Trustee, President and Principal Executive Officer | Since 2017 | Chief Executive Officer, Innovator Capital Management, LLC (2017–present). | 87 | None |
Officers | |||||
John W. Southard | Vice President, Treasurer and Principal Financial Accounting Officer | Since 2017 | Chief Investment Officer, Innovator Capital Management, LLC (2017–present); Director and Co–Founder, T2 Capital Management, LLC (2010–present). | 87 | Independent Trustee, ETF Managers Group, LLC (2012–2018) |
Kevin Gustafson | Chief Compliance Officer and Anti–Money | Since 2020 | Chief Compliance Officer, Innovator Capital Management LLC (2019-present); General Counsel, Innovator Capital Management LLC (2019-present); Chief Compliance Officer, General Counsel and Chief Risk Officer, Americas, Eastspring Investments, Inc. (2012-2019) | 87 | None |
* | The Funds’ Trustees serve for an indefinite term until their resignation, death or removal. The Funds’ officers are elected annually by the Board and serve at the Board’s pleasure. | ||||
(a) | The Fund Complex includes the Funds, each series of Innovator ETFs Trust. | ||||
(b) | H. Bruce Bond is deemed to be an interested person of the Trust (as defined in the 1940 Act) because of his affiliation with the Adviser. | ||||
| |||||
The Statement of Additional Information includes additional information about the Trustees and is available upon request, without charge, by calling 1–877–386–3890. | |||||
INNOVATOR ETFs TRUST
Additional Information (Unaudited)
1. | INFORMATION ABOUT PROSPECTUS |
This report has been prepared for shareholders and may be distributed to others only if preceded or accompanied by a current prospectus. Investors should consider the investment objective and policies, risk considerations, charges and ongoing expenses of an investment carefully before investing. The prospectus contains this and other information relevant to an investment in the respective Fund. Please read the Prospectus carefully before investing. A copy of the Prospectus may be obtained without charge by writing to the Trust’s Distributor, or by calling toll free at 1–800–208–5212 or visiting www.innovatoretfs.com.
2. | PROXY VOTING POLICIES AND PROCEDURE |
The Trust’s Proxy Voting Policies and Procedures are available without charge, upon request, by calling 1–877–386–3890 and on the SEC’s website at www.sec.gov. Information relating to how each Fund voted proxies relating to portfolio securities held during each year ended June 30 is also available on the SEC’S website at www.sec.gov.
3. | INFORMATION ABOUT PORTFOLIO SECURITIES |
Each Funds’ complete schedule of portfolio holdings for the first and third quarters is filed with the SEC on Form N-Q or Part F of Form N-PORT (beginning with filings after March 31, 2020). The Trust’s Form N-Q or Part F of Form N-PORT is available without charge, upon request, by calling 1-877-386-3890, or on the SEC’s website at www.sec.gov. The Trust’s Form N-Q or Part F of Form N-PORT may be reviewed and copied at the SEC’s Public Reference Room in Washington, DC. Information on the operation of the Public Reference Room may be obtained by calling 1-800-SEC-0330.
4. | HOUSEHOLD DELIVERY OF SHAREHOLDER DOCUMENTS |
In order to reduce expenses, the Trust delivers one copy of an annual/semi–annual report, prospectus and/or proxy statement on behalf of two or more shareholders at a shared address (householding). If you do not wish to participate in householding, please indicate this preference on your new account application (if you are opening a new account) or call 1–877–FUND890 (877–386–3890) to change the status of your existing account. You may change your status at any time.
INNOVATOR ETFs TRUST
Additional Information (Unaudited) (Continued)
5. | ELECTRONIC DELIVERY OF SHAREHOLDER DOCUMENTS |
You may choose to receive a Fund’s prospectus and annual and semi–annual reports electronically. To sign up for electronic delivery, visit www.icsdelivery.com and select the first letter of your brokerage firm’s name. Then, select your brokerage institution from the list that follows, fill out the appropriate information and provide an e–mail address where you would like your information sent. If your brokerage firm is not listed, electronic delivery may not be available. Please contact your brokerage firm or financial adviser.
6. | TAX NOTICE |
For the fiscal year ended October 31, 2021, certain dividends paid by the Funds may be subject to a maximum tax rate of 23.8%, as provided for by the Jobs and Growth Tax Relief Reconciliation Act of 2003.
For the taxable year ended October 31, 2021, the percentage of ordinary income dividends paid by the Funds that qualify for the dividends received deduction available to corporations was 0.00%.
For the taxable year ended October 31, 2021, the percentage of ordinary income distributions that were designated as short-term capital gain distributions under Internal Revenue Section 871(k)2(c) was 0.00%.
INVESTMENT ADVISOR
Innovator Capital Management, LLC
109 North Hale Street,
Wheaton, IL 60187
INVESTMENT SUB–ADVISOR
Milliman Financial Risk Management LLC
71 S. Wacker Drive, 31st Floor
Chicago, IL 60606
ADMINISTRATOR, FUND ACCOUNTANT & TRANSFER AGENT
U.S. Bancorp Fund Services, LLC
615 East Michigan Street
Milwaukee, WI 53202
DISTRIBUTOR
Foreside Fund Services, LLC
Three Canal Plaza
Portland, ME 04101
CUSTODIAN
U.S. Bank, N.A.
1555 North RiverCenter Drive, Suite 302
Milwaukee, WI 53212
LEGAL COUNSEL
Chapman and Cutler LLP
320 South Canal Street, 27th Floor
Chicago, IL 60606
INDEPENDENT REGISTERED PUBLIC ACCOUNTING FIRM
Cohen & Company, Ltd.
1350 Euclid Ave., Suite 800
Cleveland, OH 44115
(b) | Not applicable |
Item 2. Code of Ethics.
Not applicable for semi-annual reports.
Item 3. Audit Committee Financial Expert.
Not applicable for semi-annual reports.
Item 4. Principal Accountant Fees and Services.
Not applicable for semi-annual reports.
Item 5. Audit Committee of Listed Registrants.
The registrant is an issuer as defined in Rule 10A-3 under the Securities Exchange Act of 1934, (the “Act”) and has a separately-designated standing audit committee established in accordance with Section 3(a)(58)(A) of the Act. The independent members of the committee [, consisting of the entire Board,] are as follows: Brian Wildman, Joe Stowell and Mark Berg.
Item 6. Investments.
(a) | Schedule of Investments is included as part of the report to shareholders filed under Item 1 of this Form. |
(b) | Not applicable |
Item 7. Disclosure of Proxy Voting Policies and Procedures for Closed-End Management Investment Companies.
Not applicable to open-end investment companies.
Item 8. Portfolio Managers of Closed-End Management Investment Companies.
Not applicable to open-end investment companies.
Item 9. Purchases of Equity Securities by Closed‑End Management Investment Company and Affiliated Purchasers.
Not applicable to open-end investment companies.
Item 10. Submission of Matters to a Vote of Security Holders.
There have been no material changes to the procedures by which shareholders may recommend nominees to the registrant’s board of trustees.
Item 11. Controls and Procedures.
(a) | The Registrant’s Principal Executive Officer and Principal Financial Officer have reviewed the Registrant's disclosure controls and procedures (as defined in Rule 30a-3(c) under the Investment Company Act of 1940 (the “Act”)) as of a date within 90 days of the filing of this report, as required by Rule 30a-3(b) under the Act and Rules 13a-15(b) or 15d‑15(b) under the Securities Exchange Act of 1934. Based on their review, such officers have concluded that the disclosure controls and procedures are effective in ensuring that information required to be disclosed in this report is appropriately recorded, processed, summarized and reported and made known to them by others within the Registrant and by the Registrant’s service provider. |
(b) | There were no changes in the Registrant's internal control over financial reporting (as defined in Rule 30a-3(d) under the Act) that occurred during the period covered by this report that have materially affected, or are reasonably likely to materially affect, the Registrant's internal control over financial reporting. |
Item 12. Disclosure of Securities Lending Activities for Closed-End Management Investment Companies
Not applicable to open-end investment companies.
Item 13. Exhibits.
(a) | (1) Any code of ethics or amendment thereto, that is the subject of the disclosure required by Item 2, to the extent that the registrant intends to satisfy Item 2 requirements through filing an exhibit. Not Applicable |
(3) Any written solicitation to purchase securities under Rule 23c‑1 under the Act sent or given during the period covered by the report by or on behalf of the registrant to 10 or more persons. Not applicable to open-end investment companies.
(4) Change in the registrant’s independent public accountant. There was no change in the registrant’s independent public accountant for the period covered by this report.
(b) | Certifications pursuant to Section 906 of the Sarbanes‑Oxley Act of 2002. Furnished herewith. |
SIGNATURES
Pursuant to the requirements of the Securities Exchange Act of 1934 and the Investment Company Act of 1940, the registrant has duly caused this report to be signed on its behalf by the undersigned, thereunto duly authorized.
| (Registrant) | Innovator ETFs Trust |
| By (Signature and Title)* | /s/ Bruce Bond |
| Bruce Bond, Principal Executive Officer |
| Date | 6/29/2022 |
Pursuant to the requirements of the Securities Exchange Act of 1934 and the Investment Company Act of 1940, this report has been signed below by the following persons on behalf of the registrant and in the capacities and on the dates indicated.
| By (Signature and Title)* | /s/ Bruce Bond |
| Bruce Bond, Principal Executive Officer |
| Date | 6/29/2022 |
| By (Signature and Title)* | /s/ John Southard |
| John Southard, Principal Financial Officer |
| Date | 6/29/2022 |
* Print the name and title of each signing officer under his or her signature.