UNITED STATES
SECURITIES AND EXCHANGE COMMISSION
Washington, D.C. 20549
FORM N-CSR
CERTIFIED SHAREHOLDER REPORT OF REGISTERED MANAGEMENT INVESTMENT COMPANIES
Investment Company Act file number 811-22135
Innovator ETFs Trust
(Exact name of registrant as specified in charter)
109 North Hale Street
Wheaton, IL 60187
(Address of principal executive offices) (Zip code)
Chapman and Cutler LLP
320 South Canal Street, 27th Floor
Chicago, IL 60606
(Name and address of agent for service)
800-208-5212
Registrant's telephone number, including area code
Date of fiscal year end: October 31, 2023
Date of reporting period: April 30, 2023
Item 1. Reports to Stockholders.
TABLE OF CONTENTS
Letter to Shareholders | 3 |
Fund Performance | 5 |
Expense Example | 85 |
Schedules of Investments and Options Written | 88 |
Statements of Assets and Liabilities | 168 |
Statements of Operations | 188 |
Statements of Changes in Net Assets | 208 |
Financial Highlights | 228 |
Notes to Financial Statements | 248 |
Trustees and Officers | 279 |
Board Considerations Regarding Approval of Investment Management Agreement | 281 |
Additional Information | 284 |
Letter to Shareholders (Unaudited)
Dear Valued Shareholders,
The 1-year period ended April 30, 2023 was noteworthy in many ways. During this 12-month stretch, investors witnessed a remarkable chain of events:
| | 1. | Accommodative covid-era monetary policy led to the highest inflation in 40 years |
| | 2. | High and rising inflation led to tighter monetary policy |
| | 3. | Tighter monetary policy led to large bank failures |
| | 4. | Bank failures led to heightened stock market volatility |
On top of all that, the Federal government reached its debt limit in early 2023 and Congress had still not resolved the matter as of April 30.
While many investors have dealt with the effects of high inflation, bank failures and government debt limits, few have experienced such swift and severe Fed policy tightening out of such an accommodative policy stance. If there’s anything to be learned from this period, it may be the simple reminder that the future remains unknown and the ability to have a better sense of your risk in the middle of the storm is invaluable.
We believe that the Fed is likely to hold interest rates higher for longer than the market has anticipated and that investors will need to learn to factor these higher rates into their thinking. In our estimation, this doesn’t translate to a full-blown “risk-off” sentiment; but to the extent that higher rates create greater market uncertainty, we continue to think investors will do well to be risk aware.
The heightened uncertainty during this period led a large swath of investors to look for ways to maintain market exposure with built-in risk management. Many investors looked to Innovator during this period and we were pleased to offer the industry’s largest and widest-ranging suite of Defined Outcome ETFs™, including the latest addition of our Premium Income Barrier ETFs™. Over this period, while the global equity market was up 2.6%, strong inflows resulted in our assets under management nearly doubling, rising by more than $6.5 billion over the 12-month period.
On behalf of the team at Innovator, thank you for the confidence and trust you’ve place in us and our products over the past year. We’ve worked to earn that trust and intend to work hard to keep it. We wish you the best in good health and prosperity in the coming year.

Bruce Bond,
CEO
Letter to Shareholders (Unaudited) (Continued)
The views in this report were those of the Fund’s CEO as of April 30, 2023 and may not reflect his views on the date that this report is first published or anytime thereafter. These views are intended to assist shareholders in understanding their investments and do not constitute investment advice.
The Funds have characteristics unlike many other traditional investment products and may not be suitable for all investors. For more information regarding whether an investment in the Fund is right for you, please see Investor Suitability" in the prospectus.
Investing involves risks. Loss of principal is possible.
This material must be preceded by or accompanied with a prospectus. The Funds' investment objectives, risks, charges and expenses should be considered carefully before investing. The prospectus contains this and other important information, and it may be obtained at innovatoretfs.com. Read it carefully before investing.
Innovator ETFs are distributed by Foreside Fund Services, LLC.
INNOVATOR U.S. EQUITY BUFFER ETF – JANUARY
Fund Performance |
April 30, 2023 (Unaudited) | | |
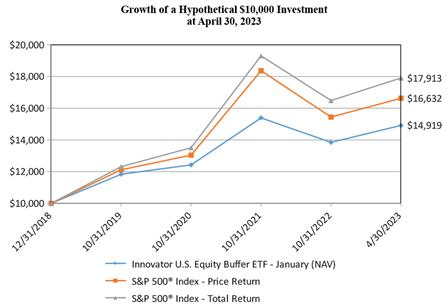
The following chart compares the value of a hypothetical $10,000 investment in the Innovator U.S. Equity Buffer ETF - January from its inception (December 31, 2018) to April 30, 2023 as compared with the S&P 500® Index – Price Return and Total Return.
| | | Average Annual Total Returns as of April 30, 2023 | |
| | | One Year | | | Three Years | | | Since Inception (a) | |
Innovator U.S. Equity Buffer ETF - January | | | | | | | | | | | | |
NAV Return | | | 5.53 | % | | | 9.62 | % | | | 9.68 | % |
Market Return | | | 5.44 | % | | | 9.61 | % | | | 9.64 | % |
S&P 500® Index - Price Return | | | 0.91 | % | | | 12.70 | % | | | 12.47 | % |
S&P 500® Index - Total Return | | | 2.66 | % | | | 14.52 | % | | | 14.42 | % |
(a) | Inception date is December 31, 2018. |
Performance data quoted represents past performance and does not guarantee future results. The investment return and principal value of an investment will fluctuate so that an investor’s shares, when redeemed, may be worth more or less than their original cost. Current performance of the Fund may be lower or higher than the performance quoted. As of the latest prospectus, the net expense ratio of the Fund was 0.79%. For the most recent performance, please visit the Fund’s website at innovatoretfs.com.
5
INNOVATOR U.S. EQUITY BUFFER ETF – JANUARY
Fund Performance |
April 30, 2023 (Unaudited) (Continued) |
The line graph and performance table do not reflect the deduction of taxes that a shareholder may pay on fund distributions or the redemption of Fund shares. Returns shown for the Fund and S&P 500® Index – Total Return include the reinvestment of all dividends, if any. Returns shown for the S&P 500® Index – Price Return do not include the reinvestment of dividends, if any.
The S&P 500® Index is an unmanaged, capitalization–weighted index generally representative of the U.S. market for large capitalization stocks.
The Fund’s portfolio holdings may differ significantly from the securities held in the relevant index and, unlike an exchange–traded fund, the performance of an unmanaged index does not reflect deductions for transaction costs, taxes, management fees or other expenses.
You cannot invest directly in an index.
Premium/Discount Information:
Information regarding the differences between the price of the Fund’s shares on the secondary market and the Fund’s net asset value is available at Innovatoretfs.com/BJAN.
INNOVATOR U.S. EQUITY BUFFER ETF – FEBRUARY
Fund Performance |
April 30, 2023 (Unaudited) |
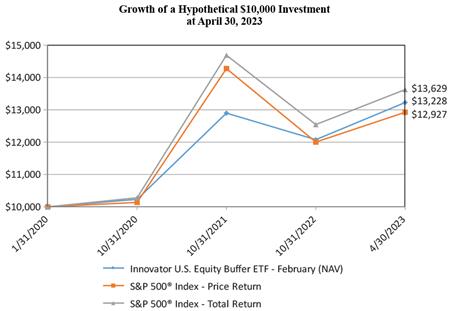
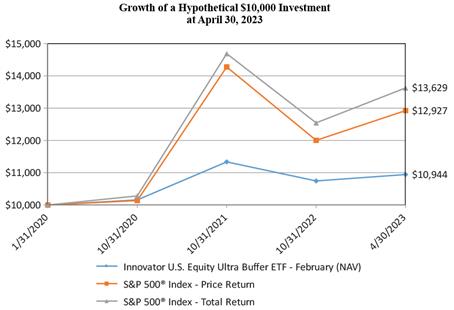
The following chart compares the value of a hypothetical $10,000 investment in the Innovator U.S. Equity Buffer ETF – February from its inception (January 31, 2020) to April 30, 2023 as compared with the S&P 500® Index - Price Return and Total Return.
| | | Average Annual Total Returns as of
April 30, 2023 | |
| | | One Year | | | Three Years | | | Since Inception (a) | |
Innovator U.S. Equity Buffer ETF - February | | | | | | | | | | | | |
NAV Return | | | 7.28 | % | | | 12.38 | % | | | 9.00 | % |
Market Return | | | 7.11 | % | | | 12.44 | % | | | 8.97 | % |
S&P 500® Index - Price Return | | | 0.91 | % | | | 12.70 | % | | | 8.23 | % |
S&P 500® Index - Total Return | | | 2.66 | % | | | 14.52 | % | | | 10.01 | % |
(a) | Inception date is January 31, 2020. |
Performance data quoted represents past performance and does not guarantee future results. The investment return and principal value of an investment will fluctuate so that an investor’s shares, when redeemed, may be worth more or less than their original cost. Current performance of the Fund may be lower or higher than the performance quoted. As of the latest prospectus, the net expense ratio of the Fund was 0.79%. For the most recent performance, please visit the Fund’s website at innovatoretfs.com.
INNOVATOR U.S. EQUITY BUFFER ETF – FEBRUARY
Fund Performance |
April 30, 2023 (Unaudited) (Continued) |
The line graph and performance table do not reflect the deduction of taxes that a shareholder may pay on fund distributions or the redemption of Fund shares. Returns shown for the Fund and S&P 500® Index - Total Return include the reinvestment of all dividends, if any. Returns shown for the S&P 500® Index – Price Return do not include the reinvestment of dividends, if any.
The S&P 500® Index is an unmanaged, capitalization-weighted index generally representative of the U.S. market for large capitalization stocks.
The Fund’s portfolio holdings may differ significantly from the securities held in the relevant index and, unlike an exchange-traded fund, the performance of an unmanaged index does not reflect deductions for transaction costs, taxes, management fees or other expenses.
You cannot invest directly in an index.
Premium/Discount Information:
Information regarding the differences between the price of the Fund’s shares on the secondary market and the Fund’s net asset value is available at Innovatoretfs.com/BFEB.
INNOVATOR U.S. EQUITY BUFFER ETF – MARCH
Fund Performance
April 30, 2023 (Unaudited)
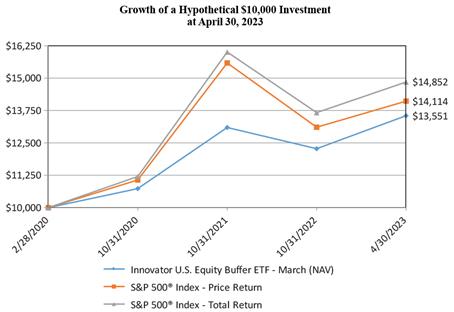
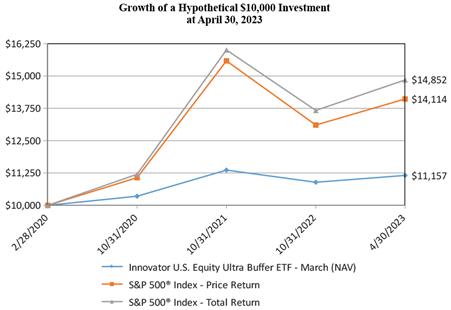
The following chart compares the value of a hypothetical $10,000 investment in the Innovator U.S. Equity Buffer ETF – March from its inception (February 28, 2020) to April 30, 2023 as compared with the S&P 500® Index - Price Return and Total Return.
| | | Average Annual Total Returns as of April 30, 2023 | |
| | | One Year | | | Three Years | | | Since Inception (a) | |
Innovator U.S. Equity Buffer ETF - March | | | | | | | | | | | | |
NAV Return | | | 7.42 | % | | | 11.01 | % | | | 10.06 | % |
Market Return | | | 7.45 | % | | | 10.93 | % | | | 10.02 | % |
S&P 500® Index - Price Return | | | 0.91 | % | | | 12.70 | % | | | 11.48 | % |
S&P 500® Index - Total Return | | | 2.66 | % | | | 14.52 | % | | | 13.29 | % |
(a) | Inception date is February 28, 2020. |
Performance data quoted represents past performance and does not guarantee future results. The investment return and principal value of an investment will fluctuate so that an investor’s shares, when redeemed, may be worth more or less than their original cost. Current performance of the Fund may be lower or higher than the performance quoted. As of the latest prospectus, the net expense ratio of the Fund was 0.79%. For the most recent performance, please visit the Fund’s website at innovatoretfs.com.
9
INNOVATOR U.S. EQUITY BUFFER ETF – MARCH
Fund Performance
April 30, 2023 (Unaudited) (Continued)
The line graph and performance table do not reflect the deduction of taxes that a shareholder may pay on fund distributions or the redemption of Fund shares. Returns shown for the Fund and S&P 500® Index - Total Return include the reinvestment of all dividends, if any. Returns shown for the S&P 500® Index – Price Return do not include the reinvestment of dividends, if any.
The S&P 500® Index is an unmanaged, capitalization-weighted index generally representative of the U.S. market for large capitalization stocks.
The Fund’s portfolio holdings may differ significantly from the securities held in the relevant index and, unlike an exchange-traded fund, the performance of an unmanaged index does not reflect deductions for transaction costs, taxes, management fees or other expenses.
You cannot invest directly in an index.
Premium/Discount Information:
Information regarding the differences between the price of the Fund’s shares on the secondary market and the Fund’s net asset value is available at Innovatoretfs.com/BMAR.
INNOVATOR U.S. EQUITY BUFFER ETF – APRIL
Fund Performance |
April 30, 2023 (Unaudited) | |
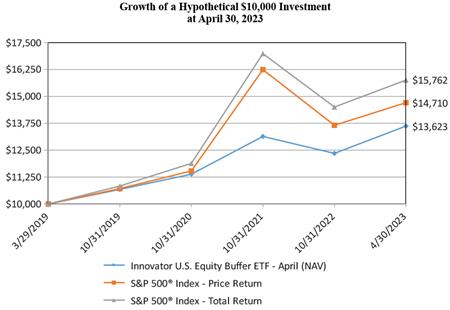
The following chart compares the value of a hypothetical $10,000 investment in the Innovator U.S. Equity Buffer ETF – April from its inception (March 29, 2019) to April 30, 2023 as compared with the S&P 500® Index – Price Return and Total Return.
| | | Average Annual Total Returns as of April 30, 2023 | |
| | | One Year | | | Three Years | | | Since Inception (a) | |
Innovator U.S. Equity Buffer ETF - April | | | | | | | | | | | | |
NAV Return | | | 7.40 | % | | | 9.00 | % | | | 7.86 | % |
Market Return | | | 6.97 | % | | | 8.42 | % | | | 7.80 | % |
S&P 500® Index - Price Return | | | 0.91 | % | | | 12.70 | % | | | 9.90 | % |
S&P 500® Index - Total Return | | | 2.66 | % | | | 14.52 | % | | | 11.77 | % |
(a) | Inception date is March 29, 2019. |
Performance data quoted represents past performance and does not guarantee future results. The investment return and principal value of an investment will fluctuate so that an investor’s shares, when redeemed, may be worth more or less than their original cost. Current performance of the Fund may be lower or higher than the performance quoted. As of the latest prospectus, the net expense ratio of the Fund was 0.79%. For the most recent performance, please visit the Fund’s website at innovatoretfs.com.
11
INNOVATOR U.S. EQUITY BUFFER ETF – APRIL
Fund Performance |
April 30, 2023 (Unaudited) (Continued) | |
The line graph and performance table do not reflect the deduction of taxes that a shareholder may pay on fund distributions or the redemption of Fund shares. Returns shown for the Fund and S&P 500® Index – Total Return include the reinvestment of all dividends, if any. Returns shown for the S&P 500® Index – Price Return do not include the reinvestment of dividends, if any.
The S&P 500® Index is an unmanaged, capitalization–weighted index generally representative of the U.S. market for large capitalization stocks.
The Fund’s portfolio holdings may differ significantly from the securities held in the relevant index and, unlike an exchange–traded fund, the performance of an unmanaged index does not reflect deductions for transaction costs, taxes, management fees or other expenses.
You cannot invest directly in an index.
Premium/Discount Information:
Information regarding the differences between the price of the Fund’s shares on the secondary market and the Fund’s net asset value is available at Innovatoretfs.com/BAPR.
INNOVATOR U.S. EQUITY BUFFER ETF – MAY
Fund Performance |
April 30, 2023 (Unaudited) | | |
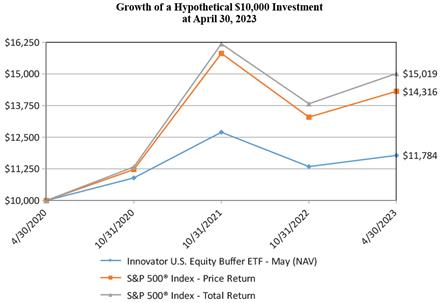
The following chart compares the value of a hypothetical $10,000 investment in the Innovator U.S. Equity Buffer ETF – May from its inception (April 30, 2020) to April 30, 2023 as compared with the S&P 500® Index - Price Return and Total Return.
| | | Average Annual Total Returns as of April 30, 2023 | |
| | | One Year | | | Three Years | | | Since Inception (a) | |
Innovator U.S. Equity Buffer ETF - May | | | | | | | | | | | | |
NAV Return | | | 0.18 | % | | | 5.62 | % | | | 5.62 | % |
Market Return | | | -0.08 | % | | | 5.59 | % | | | 5.59 | % |
S&P 500® Index - Price Return | | | 0.91 | % | | | 12.70 | % | | | 12.70 | % |
S&P 500® Index - Total Return | | | 2.66 | % | | | 14.52 | % | | | 14.52 | % |
(a) | Inception date is April 30, 2020. |
Performance data quoted represents past performance and does not guarantee future results. The investment return and principal value of an investment will fluctuate so that an investor’s shares, when redeemed, may be worth more or less than their original cost. Current performance of the Fund may be lower or higher than the performance quoted. As of the latest prospectus, the net expense ratio of the Fund was 0.79%. For the most recent performance, please visit the Fund’s website at innovatoretfs.com.
13
INNOVATOR U.S. EQUITY BUFFER ETF – MAY
Fund Performance |
April 30, 2023 (Unaudited) (Continued) | | |
The line graph and performance table do not reflect the deduction of taxes that a shareholder may pay on fund distributions or the redemption of Fund shares. Returns shown for the Fund and S&P 500® Index - Total Return include the reinvestment of all dividends, if any. Returns shown for the S&P 500® Index – Price Return do not include the reinvestment of dividends, if any.
The S&P 500® Index is an unmanaged, capitalization-weighted index generally representative of the U.S. market for large capitalization stocks.
The Fund’s portfolio holdings may differ significantly from the securities held in the relevant index and, unlike an exchange-traded fund, the performance of an unmanaged index does not reflect deductions for transaction costs, taxes, management fees or other expenses.
You cannot invest directly in an index.
Premium/Discount Information:
Information regarding the differences between the price of the Fund’s shares on the secondary market and the Fund’s net asset value is available at Innovatoretfs.com/BMAY.
INNOVATOR U.S. EQUITY BUFFER ETF – JUNE
Fund Performance |
April 30, 2023 (Unaudited) |
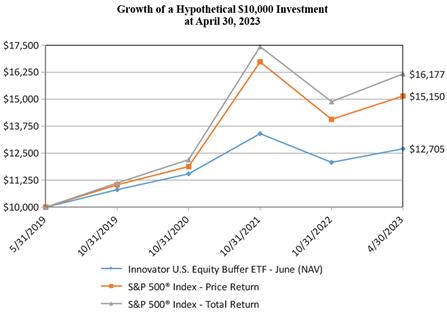
The following chart compares the value of a hypothetical $10,000 investment in the Innovator U.S. Equity Buffer ETF – June from its inception (May 31, 2019) to April 30, 2023 as compared with the S&P 500® Index – Price Return and Total Return.
| | | Average Annual Total Returns as of April 30, 2023 | |
| | | One Year | | | Three Years | | | Since Inception (a) | |
Innovator U.S. Equity Buffer ETF - June | | | | | | | | | | | | |
NAV Return | | | 0.11 | % | | | 6.31 | % | | | 6.30 | % |
Market Return | | | 0.25 | % | | | 6.23 | % | | | 6.30 | % |
S&P 500® Index - Price Return | | | 0.91 | % | | | 12.70 | % | | | 11.19 | % |
S&P 500® Index - Total Return | | | 2.66 | % | | | 14.52 | % | | | 13.06 | % |
(a) | Inception date is May 31, 2019. |
Performance data quoted represents past performance and does not guarantee future results. The investment return and principal value of an investment will fluctuate so that an investor’s shares, when redeemed, may be worth more or less than their original cost. Current performance of the Fund may be lower or higher than the performance quoted. As of the latest prospectus, the net expense ratio of the Fund was 0.79%. For the most recent performance, please visit the Fund’s website at innovatoretfs.com.
15
INNOVATOR U.S. EQUITY BUFFER ETF – JUNE
Fund Performance |
April 30, 2023 (Unaudited) (Continued) |
The line graph and performance table do not reflect the deduction of taxes that a shareholder may pay on fund distributions or the redemption of Fund shares. Returns shown for the Fund and S&P 500® Index – Total Return include the reinvestment of all dividends, if any. Returns shown for the S&P 500® Index – Price Return do not include the reinvestment of dividends, if any.
The S&P 500® Index is an unmanaged, capitalization–weighted index generally representative of the U.S. market for large capitalization stocks.
The Fund’s portfolio holdings may differ significantly from the securities held in the relevant index and, unlike an exchange–traded fund, the performance of an unmanaged index does not reflect deductions for transaction costs, taxes, management fees or other expenses.
You cannot invest directly in an index.
Premium/Discount Information:
Information regarding the differences between the price of the Fund’s shares on the secondary market and the Fund’s net asset value is available at Innovatoretfs.com/BJUN.
INNOVATOR U.S. EQUITY BUFFER ETF – JULY
Fund Performance
April 30, 2023 (Unaudited)
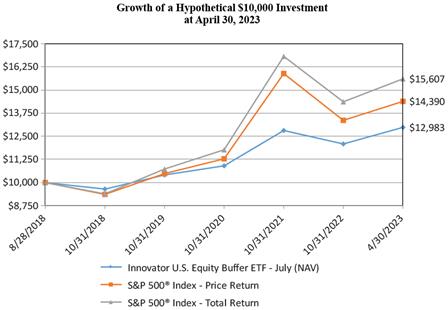
The following chart compares the value of a hypothetical $10,000 investment in the Innovator U.S. Equity Buffer ETF – July from its inception (August 28, 2018) to April 30, 2023 as compared with the S&P 500® Index – Price Return and Total Return.
| | | Average Annual Total Returns as of April 30, 2023 | |
| | | One Year | | | Three Years | | | Since Inception (a) | |
Innovator U.S. Equity Buffer ETF - July | | | | | | | | | | | | |
NAV Return | | | 6.89 | % | | | 8.53 | % | | | 5.75 | % |
Market Return | | | 6.84 | % | | | 8.35 | % | | | 5.71 | % |
S&P 500® Index - Price Return | | | 0.91 | % | | | 12.70 | % | | | 8.10 | % |
S&P 500® Index - Total Return | | | 2.66 | % | | | 14.52 | % | | | 10.00 | % |
(a) | Inception date is August 28, 2018. |
Performance data quoted represents past performance and does not guarantee future results. The investment return and principal value of an investment will fluctuate so that an investor’s shares, when redeemed, may be worth more or less than their original cost. Current performance of the Fund may be lower or higher than the performance quoted. As of the latest prospectus, the net expense ratio of the Fund was 0.79%. For the most recent performance, please visit the Fund’s website at innovatoretfs.com
17
INNOVATOR U.S. EQUITY BUFFER ETF – JULY
Fund Performance
April 30, 2023 (Unaudited) (Continued)
The line graph and performance table do not reflect the deduction of taxes that a shareholder may pay on fund distributions or the redemption of Fund shares. Returns shown for the Fund and S&P 500® Index – Total Return include the reinvestment of all dividends, if any. Returns shown for the S&P 500® Index – Price Return do not include the reinvestment of dividends, if any.
The S&P 500® Index is an unmanaged, capitalization–weighted index generally representative of the U.S. market for large capitalization stocks.
The Fund’s portfolio holdings may differ significantly from the securities held in the relevant index and, unlike an exchange–traded fund, the performance of an unmanaged index does not reflect deductions for transaction costs, taxes, management fees or other expenses.
You cannot invest directly in an index.
Premium/Discount Information:
Information regarding the differences between the price of the Fund’s shares on the secondary market and the Fund’s net asset value is available at Innovatoretfs.com/BJUL.
INNOVATOR U.S. EQUITY BUFFER ETF – AUGUST
Fund Performance |
April 30, 2023 (Unaudited) | | | |
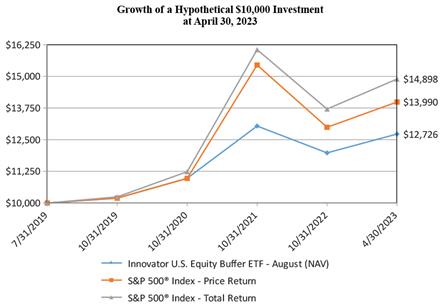
The following chart compares the value of a hypothetical $10,000 investment in the Innovator U.S. Equity Buffer ETF – August from its inception (July 31, 2019) to April 30, 2023 as compared with the S&P 500® Index – Price Return and Total Return.
| | | Average Annual Total Returns as of April 30, 2023 | |
| | | One Year | | | Three Years | | | Since Inception (a) | |
Innovator U.S. Equity Buffer ETF - August | | | | | | | | | | | | |
NAV Return | | | 3.90 | % | | | 8.61 | % | | | 6.64 | % |
Market Return | | | 3.88 | % | | | 8.43 | % | | | 6.60 | % |
S&P 500® Index - Price Return | | | 0.91 | % | | | 12.70 | % | | | 9.36 | % |
S&P 500® Index - Total Return | | | 2.66 | % | | | 14.52 | % | | | 11.21 | % |
(a) | Inception date is July 31, 2019. |
Performance data quoted represents past performance and does not guarantee future results. The investment return and principal value of an investment will fluctuate so that an investor’s shares, when redeemed, may be worth more or less than their original cost. Current performance of the Fund may be lower or higher than the performance quoted. As of the latest prospectus, the net expense ratio of the Fund was 0.79%. For the most recent performance, please visit the Fund’s website at innovatoretfs.com.
19
INNOVATOR U.S. EQUITY BUFFER ETF – AUGUST
Fund Performance |
April 30, 2023 (Unaudited) (Continued) | | |
The line graph and performance table do not reflect the deduction of taxes that a shareholder may pay on fund distributions or the redemption of Fund shares. Returns shown for the Fund and S&P 500® Index – Total Return include the reinvestment of all dividends, if any. Returns shown for the S&P 500® Index – Price Return do not include the reinvestment of dividends, if any.
The S&P 500® Index is an unmanaged, capitalization–weighted index generally representative of the U.S. market for large capitalization stocks.
The Fund’s portfolio holdings may differ significantly from the securities held in the relevant index and, unlike an exchange–traded fund, the performance of an unmanaged index does not reflect deductions for transaction costs, taxes, management fees or other expenses.
You cannot invest directly in an index.
Premium/Discount Information:
Information regarding the differences between the price of the Fund’s shares on the secondary market and the Fund’s net asset value is available at Innovatoretfs.com/BAUG.
INNOVATOR U.S. EQUITY BUFFER ETF – SEPTEMBER
Fund Performance |
April 30, 2023 (Unaudited) | | | |
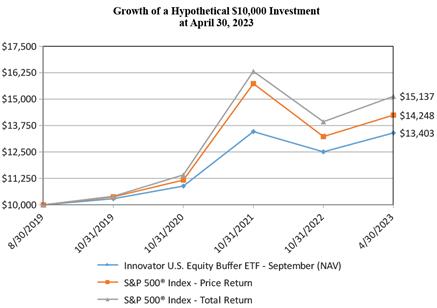
The following chart compares the value of a hypothetical $10,000 investment in the Innovator U.S. Equity Buffer ETF – September from its inception (August 30, 2019) to April 30, 2023 as compared with the S&P 500® Index – Price Return and Total Return.
| | | Average Annual Total Returns as of April 30, 2023 | |
| | | One Year | | | Three Years | | | Since Inception (a) | |
Innovator U.S. Equity Buffer ETF - September | | | | | | | | | | | | |
NAV Return | | | 6.28 | % | | | 10.12 | % | | | 8.31 | % |
Market Return | | | 6.20 | % | | | 9.98 | % | | | 8.28 | % |
S&P 500® Index - Price Return | | | 0.91 | % | | | 12.70 | % | | | 10.13 | % |
S&P 500® Index - Total Return | | | 2.66 | % | | | 14.52 | % | | | 11.96 | % |
(a) | Inception date is August 30, 2019. |
Performance data quoted represents past performance and does not guarantee future results. The investment return and principal value of an investment will fluctuate so that an investor’s shares, when redeemed, may be worth more or less than their original cost. Current performance of the Fund may be lower or higher than the performance quoted. As of the latest prospectus, the net expense ratio of the Fund was 0.79%. For the most recent performance, please visit the Fund’s website at innovatoretfs.com.
21
INNOVATOR U.S. EQUITY BUFFER ETF – SEPTEMBER
Fund Performance |
April 30, 2023 (Unaudited) (Continued) | |
The line graph and performance table do not reflect the deduction of taxes that a shareholder may pay on fund distributions or the redemption of Fund shares. Returns shown for the Fund and S&P 500® Index – Total Return include the reinvestment of all dividends, if any. Returns shown for the S&P 500® Index – Price Return do not include the reinvestment of dividends, if any.
The S&P 500® Index is an unmanaged, capitalization–weighted index generally representative of the U.S. market for large capitalization stocks.
The Fund’s portfolio holdings may differ significantly from the securities held in the relevant index and, unlike an exchange–traded fund, the performance of an unmanaged index does not reflect deductions for transaction costs, taxes, management fees or other expenses.
You cannot invest directly in an index.
Premium/Discount Information:
Information regarding the differences between the price of the Fund’s shares on the secondary market and the Fund’s net asset value is available at Innovatoretfs.com/BSEP.
INNOVATOR U.S. EQUITY BUFFER ETF – OCTOBER
Fund Performance |
April 30, 2023 (Unaudited) | | |
The following chart compares the value of a hypothetical $10,000 investment in the Innovator U.S. Equity Buffer ETF – October from its inception (September 28, 2018) to April 30, 2023 as compared with the S&P 500® Index – Price Return and Total Return.

| | | Average Annual Total Returns as of April 30, 2023 | |
| | | One Year | | | Three Years | | | Since Inception (a) | |
Innovator U.S. Equity Buffer ETF - October | | | | | | | | | | | | |
NAV Return | | | 7.47 | % | | | 11.83 | % | | | 7.70 | % |
Market Return | | | 7.39 | % | | | 11.81 | % | | | 7.65 | % |
S&P 500® Index - Price Return | | | 0.91 | % | | | 12.70 | % | | | 8.13 | % |
S&P 500® Index - Total Return | | | 2.66 | % | | | 14.52 | % | | | 10.01 | % |
(a) | Inception date is September 28, 2018. |
Performance data quoted represents past performance and does not guarantee future results. The investment return and principal value of an investment will fluctuate so that an investor’s shares, when redeemed, may be worth more or less than their original cost. Current performance of the Fund may be lower or higher than the performance quoted. As of the latest prospectus, the net expense ratio of the Fund was 0.79%. For the most recent performance, please visit the Fund’s website at innovatoretfs.com.
23
INNOVATOR U.S. EQUITY BUFFER ETF – OCTOBER
Fund Performance |
April 30, 2023 (Unaudited) (Continued) | | |
The line graph and performance table do not reflect the deduction of taxes that a shareholder may pay on fund distributions or the redemption of Fund shares. Returns shown for the Fund and S&P 500® Index – Total Return include the reinvestment of all dividends, if any. Return shown for the S&P 500® Index – Price Return do not include the reinvestment of dividends, if any.
The S&P 500® Index is an unmanaged, capitalization–weighted index generally representative of the U.S. market for large capitalization stocks.
The Fund’s portfolio holdings may differ significantly from the securities held in the relevant index and, unlike an exchange–traded fund, the performance of an unmanaged index does not reflect deductions for transaction costs, taxes, management fees or other expenses.
You cannot invest directly in an index.
Premium/Discount Information:
Information regarding the differences between the price of the Fund’s shares on the secondary market and the Fund’s net asset value is available at Innovatoretfs.com/BOCT.
INNOVATOR U.S. EQUITY BUFFER ETF – NOVEMBER
Fund Performance |
April 30, 2023 (Unaudited) |
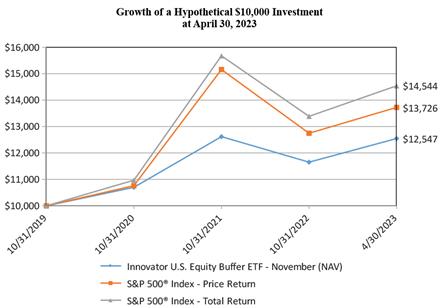
The following chart compares the value of a hypothetical $10,000 investment in the Innovator U.S. Equity Buffer ETF – November from its inception (October 31, 2019) to April 30, 2023 as compared with the S&P 500® Index - Price Return and Total Return.
| | | Average Annual Total Returns as of April 30, 2023 | |
| | | One Year | | | Three Years | | | Since Inception (a) | |
Innovator U.S. Equity Buffer ETF - November | | | | | | | | | | | | |
NAV Return | | | 6.43 | % | | | 8.76 | % | | | 6.70 | % |
Market Return | | | 6.29 | % | | | 8.59 | % | | | 6.64 | % |
S&P 500® Index - Price Return | | | 0.91 | % | | | 12.70 | % | | | 9.48 | % |
S&P 500® Index - Total Return | | | 2.66 | % | | | 14.52 | % | | | 11.30 | % |
(a) | Inception date is October 31, 2019. |
Performance data quoted represents past performance and does not guarantee future results. The investment return and principal value of an investment will fluctuate so that an investor’s shares, when redeemed, may be worth more or less than their original cost. Current performance of the Fund may be lower or higher than the performance quoted. As of the latest prospectus, the net expense ratio of the Fund was 0.79%. For the most recent performance, please visit the Fund’s website at innovatoretfs.com.
INNOVATOR U.S. EQUITY BUFFER ETF – NOVEMBER
Fund Performance |
April 30, 2023 (Unaudited) (Continued) |
The line graph and performance table do not reflect the deduction of taxes that a shareholder may pay on fund distributions or the redemption of Fund shares. Returns shown for the Fund and S&P 500® Index - Total Return include the reinvestment of all dividends, if any. Returns shown for the S&P 500® Index – Price Return do not include the reinvestment of dividends, if any.
The S&P 500® Index is an unmanaged, capitalization-weighted index generally representative of the U.S. market for large capitalization stocks.
The Fund’s portfolio holdings may differ significantly from the securities held in the relevant index and, unlike an exchange-traded fund, the performance of an unmanaged index does not reflect deductions for transaction costs, taxes, management fees or other expenses.
You cannot invest directly in an index.
Premium/Discount Information:
Information regarding the differences between the price of the Fund’s shares on the secondary market and the Fund’s net asset value is available at Innovatoretfs.com/BNOV.
INNOVATOR U.S. EQUITY BUFFER ETF – DECEMBER
Fund Performance |
April 30, 2023 (Unaudited) | | |
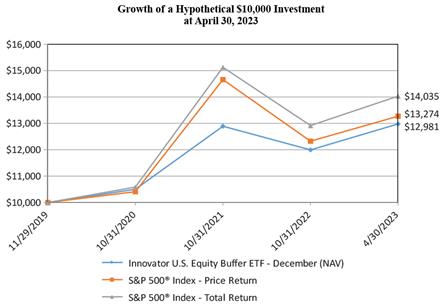
The following chart compares the value of a hypothetical $10,000 investment in the Innovator U.S. Equity Buffer ETF – December from its inception (November 29, 2019) to April 30, 2023 as compared with the S&P 500® Index - Price Return and Total Return.
| | | Average Annual Total Returns as of April 30, 2023 | |
| | | One Year | | | Three Years | | | Since Inception (a) | |
Innovator U.S. Equity Buffer ETF - December | | | | | | | | | | | | |
NAV Return | | | 7.09 | % | | | 10.97 | % | | | 7.93 | % |
Market Return | | | 7.09 | % | | | 10.74 | % | | | 7.89 | % |
S&P 500® Index - Price Return | | | 0.91 | % | | | 12.70 | % | | | 8.64 | % |
S&P 500® Index - Total Return | | | 2.66 | % | | | 14.52 | % | | | 10.42 | % |
(a) | Inception date is November 29, 2019. |
Performance data quoted represents past performance and does not guarantee future results. The investment return and principal value of an investment will fluctuate so that an investor’s shares, when redeemed, may be worth more or less than their original cost. Current performance of the Fund may be lower or higher than the performance quoted. As of the latest prospectus, the net expense ratio of the Fund was 0.79%. For the most recent performance, please visit the Fund’s website at innovatoretfs.com.
27
INNOVATOR U.S. EQUITY BUFFER ETF – DECEMBER
Fund Performance |
April 30, 2023 (Unaudited) (Continued) | | |
The line graph and performance table do not reflect the deduction of taxes that a shareholder may pay on fund distributions or the redemption of Fund shares. Returns shown for the Fund and S&P 500® Index - Total Return include the reinvestment of all dividends, if any. Returns shown for the S&P 500® Index – Price Return do not include the reinvestment of dividends, if any.
The S&P 500® Index is an unmanaged, capitalization-weighted index generally representative of the U.S. market for large capitalization stocks.
The Fund’s portfolio holdings may differ significantly from the securities held in the relevant index and, unlike an exchange-traded fund, the performance of an unmanaged index does not reflect deductions for transaction costs, taxes, management fees or other expenses.
You cannot invest directly in an index.
Premium/Discount Information:
Information regarding the differences between the price of the Fund’s shares on the secondary market and the Fund’s net asset value is available at Innovatoretfs.com/BDEC.
INNOVATOR U.S. EQUITY POWER BUFFER ETF – JANUARY
Fund Performance |
April 30, 2023 (Unaudited) | | |
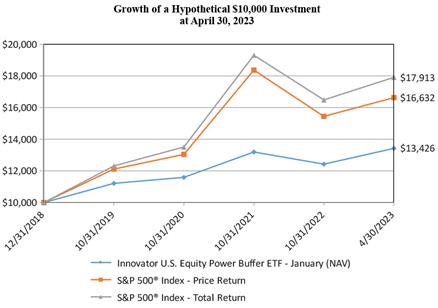
The following chart compares the value of a hypothetical $10,000 investment in the Innovator U.S. Equity Power Buffer ETF – January from its inception (December 31, 2018) to April 30, 2023 as compared with the S&P 500® Index – Price Return and Total Return.
| | | Average Annual Total Returns as of April 30, 2023 | |
| | | One Year | | | Three Years | | | Since Inception (a) | |
Innovator U.S. Equity Power Buffer ETF - January | | | | | | | | | | | | |
NAV Return | | | 8.61 | % | | | 7.79 | % | | | 7.04 | % |
Market Return | | | 8.52 | % | | | 7.74 | % | | | 7.01 | % |
S&P 500® Index - Price Return | | | 0.91 | % | | | 12.70 | % | | | 12.47 | % |
S&P 500® Index - Total Return | | | 2.66 | % | | | 14.52 | % | | | 14.42 | % |
(a) | Inception date is December 31, 2018. |
Performance data quoted represents past performance and does not guarantee future results. The investment return and principal value of an investment will fluctuate so that an investor’s shares, when redeemed, may be worth more or less than their original cost. Current performance of the Fund may be lower or higher than the performance quoted. As of the latest prospectus, the net expense ratio of the Fund was 0.79%. For the most recent performance, please visit the Fund’s website at innovatoretfs.com.
29
INNOVATOR U.S. EQUITY POWER BUFFER ETF – JANUARY
Fund Performance |
April 30, 2023 (Unaudited) (Continued) | | |
The line graph and performance table do not reflect the deduction of taxes that a shareholder may pay on fund distributions or the redemption of Fund shares. Returns shown for the Fund and S&P 500® Index – Total Return include the reinvestment of all dividends, if any. Returns shown for the S&P 500® Index – Price Return do not include the reinvestment of dividends, if any.
The S&P 500® Index is an unmanaged, capitalization–weighted index generally representative of the U.S. market for large capitalization stocks.
The Fund’s portfolio holdings may differ significantly from the securities held in the relevant index and, unlike an exchange–traded fund, the performance of an unmanaged index does not reflect deductions for transaction costs, taxes, management fees or other expenses.
You cannot invest directly in an index.
Premium/Discount Information:
Information regarding the differences between the price of the Fund’s shares on the secondary market and the Fund’s net asset value is available at Innovatoretfs.com/PJAN.
INNOVATOR U.S. EQUITY POWER BUFFER ETF – FEBRUARY
Fund Performance |
April 30, 2023 (Unaudited) | | |
The following chart compares the value of a hypothetical $10,000 investment in the Innovator U.S. Equity Power Buffer ETF – February from its inception (January 31, 2020) to April 30, 2023 as compared with the S&P 500® Index - Price Return and Total Return.
| | | Average Annual Total Returns as of April 30, 2023 | |
| | | One Year | | | Three Years | | | Since Inception (a) | |
Innovator U.S. Equity Power Buffer ETF - February | | | | | | | | | | | | |
NAV Return | | | 5.94 | % | | | 8.35 | % | | | 5.97 | % |
Market Return | | | 5.57 | % | | | 8.47 | % | | | 5.93 | % |
S&P 500® Index - Price Return | | | 0.91 | % | | | 12.70 | % | | | 8.23 | % |
S&P 500® Index - Total Return | | | 2.66 | % | | | 14.52 | % | | | 10.01 | % |
(a) | Inception date is January 31, 2020. |
Performance data quoted represents past performance and does not guarantee future results. The investment return and principal value of an investment will fluctuate so that an investor’s shares, when redeemed, may be worth more or less than their original cost. Current performance of the Fund may be lower or higher than the performance quoted. As of the latest prospectus, the net expense ratio of the Fund was 0.79%. For the most recent performance, please visit the Fund’s website at innovatoretfs.com.
31
INNOVATOR U.S. EQUITY POWER BUFFER ETF – FEBRUARY
Fund Performance |
April 30, 2023 (Unaudited) (Continued) | |
The line graph and performance table do not reflect the deduction of taxes that a shareholder may pay on fund distributions or the redemption of Fund shares. Returns shown for the Fund and S&P 500® Index - Total Return include the reinvestment of all dividends, if any. Returns shown for the S&P 500® Index – Price Return do not include the reinvestment of dividends, if any.
The S&P 500® Index is an unmanaged, capitalization-weighted index generally representative of the U.S. market for large capitalization stocks.
The Fund’s portfolio holdings may differ significantly from the securities held in the relevant index and, unlike an exchange-traded fund, the performance of an unmanaged index does not reflect deductions for transaction costs, taxes, management fees or other expenses.
You cannot invest directly in an index.
Premium/Discount Information:
Information regarding the differences between the price of the Fund’s shares on the secondary market and the Fund’s net asset value is available at Innovatoretfs.com/PFEB.
INNOVATOR U.S. EQUITY POWER BUFFER ETF – MARCH
Fund Performance |
April 30, 2023 (Unaudited) | |
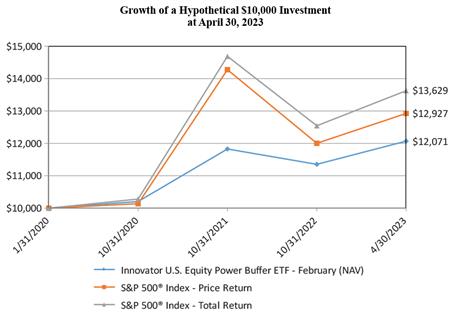
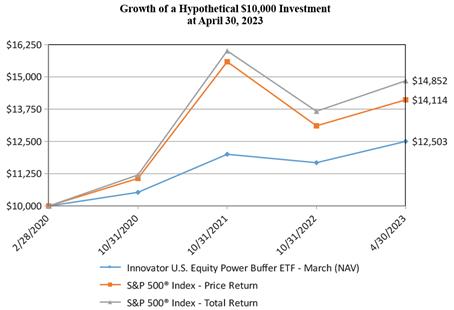
The following chart compares the value of a hypothetical $10,000 investment in the Innovator U.S. Equity Power Buffer ETF – March from its inception (February 28, 2020) to April 30, 2023 as compared with the S&P 500® Index - Price Return and Total Return.
| | | Average Annual Total Returns as of April 30, 2023 | |
| | | One Year | | | Three Years | | | Since Inception (a) | |
Innovator U.S. Equity Power Buffer ETF - March | | | | | | | | | | | | |
NAV Return | | | 5.80 | % | | | 8.04 | % | | | 7.30 | % |
Market Return | | | 5.36 | % | | | 7.88 | % | | | 7.24 | % |
S&P 500® Index - Price Return | | | 0.91 | % | | | 12.70 | % | | | 11.48 | % |
S&P 500® Index - Total Return | | | 2.66 | % | | | 14.52 | % | | | 13.29 | % |
(a) | Inception date is February 28, 2020. |
Performance data quoted represents past performance and does not guarantee future results. The investment return and principal value of an investment will fluctuate so that an investor’s shares, when redeemed, may be worth more or less than their original cost. Current performance of the Fund may be lower or higher than the performance quoted. As of the latest prospectus, the net expense ratio of the Fund was 0.79%. For the most recent performance, please visit the Fund’s website at innovatoretfs.com.
33
INNOVATOR U.S. EQUITY POWER BUFFER ETF – MARCH
Fund Performance |
April 30, 2023 (Unaudited) (Continued) | |
The line graph and performance table do not reflect the deduction of taxes that a shareholder may pay on fund distributions or the redemption of Fund shares. Returns shown for the Fund and S&P 500® Index - Total Return include the reinvestment of all dividends, if any. Returns shown for the S&P 500® Index – Price Return do not include the reinvestment of dividends, if any.
The S&P 500® Index is an unmanaged, capitalization-weighted index generally representative of the U.S. market for large capitalization stocks.
The Fund’s portfolio holdings may differ significantly from the securities held in the relevant index and, unlike an exchange-traded fund, the performance of an unmanaged index does not reflect deductions for transaction costs, taxes, management fees or other expenses.
You cannot invest directly in an index.
Premium/Discount Information:
Information regarding the differences between the price of the Fund’s shares on the secondary market and the Fund’s net asset value is available at Innovatoretfs.com/PMAR.
INNOVATOR U.S. EQUITY POWER BUFFER ETF – APRIL
Fund Performance |
April 30, 2023 (Unaudited) | | |
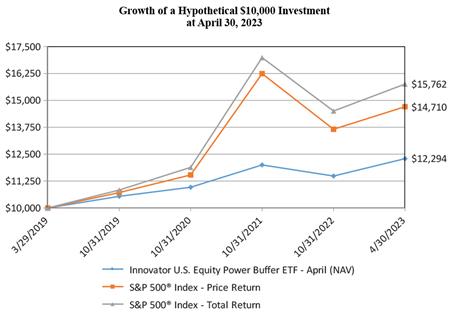
The following chart compares the value of a hypothetical $10,000 investment in the Innovator U.S. Equity Power Buffer ETF – April from its inception (March 29, 2019) to April 30, 2023 as compared with the S&P 500® Index – Price Return and Total Return.
| | | Average Annual Total Returns as of April 30, 2023 | |
| | | One Year | | | Three Years | | | Since Inception (a) | |
Innovator U.S. Equity Power Buffer ETF - April | | | | | | | | | | | | |
NAV Return | | | 5.79 | % | | | 6.05 | % | | | 5.18 | % |
Market Return | | | 5.54 | % | | | 5.71 | % | | | 5.17 | % |
S&P 500® Index - Price Return | | | 0.91 | % | | | 12.70 | % | | | 9.90 | % |
S&P 500® Index - Total Return | | | 2.66 | % | | | 14.52 | % | | | 11.77 | % |
(a) | Inception date is March 29, 2019. |
Performance data quoted represents past performance and does not guarantee future results. The investment return and principal value of an investment will fluctuate so that an investor’s shares, when redeemed, may be worth more or less than their original cost. Current performance of the Fund may be lower or higher than the performance quoted. As of the latest prospectus, the net expense ratio of the Fund was 0.79%. For the most recent performance, please visit the Fund’s website at innovatoretfs.com.
35
INNOVATOR U.S. EQUITY POWER BUFFER ETF – APRIL
Fund Performance |
April 30, 2023 (Unaudited) (Continued) | | |
The line graph and performance table do not reflect the deduction of taxes that a shareholder may pay on fund distributions or the redemption of Fund shares. Returns shown for the Fund and S&P 500® Index – Total Return include the reinvestment of all dividends, if any. Returns shown for the S&P 500® Index – Price Return do not include the reinvestment of dividends, if any.
The S&P 500® Index is an unmanaged, capitalization–weighted index generally representative of the U.S. market for large capitalization stocks.
The Fund’s portfolio holdings may differ significantly from the securities held in the relevant index and, unlike an exchange–traded fund, the performance of an unmanaged index does not reflect deductions for transaction costs, taxes, management fees or other expenses.
You cannot invest directly in an index.
Premium/Discount Information:
Information regarding the differences between the price of the Fund’s shares on the secondary market and the Fund’s net asset value is available at Innovatoretfs.com/PAPR.
INNOVATOR U.S. EQUITY POWER BUFFER ETF – MAY
Fund Performance |
April 30, 2023 (Unaudited) |
The following chart compares the value of a hypothetical $10,000 investment in the Innovator U.S. Equity Power Buffer ETF – May from its inception (April 30, 2020) to April 30, 2023 as compared with the S&P 500® Index - Price Return and Total Return.

| | | Average Annual Total Returns as of April 30, 2023 | |
| | | One Year | | | Three Years | | | Since Inception (a) | |
Innovator U.S. Equity Power Buffer ETF - May | | | | | | | | | | | | |
NAV Return | | | 0.19 | % | | | 3.85 | % | | | 3.85 | % |
Market Return | | | -0.14 | % | | | 3.84 | % | | | 3.84 | % |
S&P 500® Index - Price Return | | | 0.91 | % | | | 12.70 | % | | | 12.70 | % |
S&P 500® Index - Total Return | | | 2.66 | % | | | 14.52 | % | | | 14.52 | % |
(a) | Inception date is April 30, 2020. |
Performance data quoted represents past performance and does not guarantee future results. The investment return and principal value of an investment will fluctuate so that an investor’s shares, when redeemed, may be worth more or less than their original cost. Current performance of the Fund may be lower or higher than the performance quoted. As of the latest prospectus, the net expense ratio of the Fund was 0.79%. For the most recent performance, please visit the Fund’s website at innovatoretfs.com.
37
INNOVATOR U.S. EQUITY POWER BUFFER ETF – MAY
Fund Performance |
April 30, 2023 (Unaudited) (Continued) |
The line graph and performance table do not reflect the deduction of taxes that a shareholder may pay on fund distributions or the redemption of Fund shares. Returns shown for the Fund and S&P 500® Index - Total Return include the reinvestment of all dividends, if any. Returns shown for the S&P 500® Index – Price Return do not include the reinvestment of dividends, if any.
The S&P 500® Index is an unmanaged, capitalization-weighted index generally representative of the U.S. market for large capitalization stocks.
The Fund’s portfolio holdings may differ significantly from the securities held in the relevant index and, unlike an exchange-traded fund, the performance of an unmanaged index does not reflect deductions for transaction costs, taxes, management fees or other expenses.
You cannot invest directly in an index.
Premium/Discount Information:
Information regarding the differences between the price of the Fund’s shares on the secondary market and the Fund’s net asset value is available at Innovatoretfs.com/PMAY.
INNOVATOR U.S. EQUITY POWER BUFFER ETF – JUNE
Fund Performance |
April 30, 2023 (Unaudited) | |
The following chart compares the value of a hypothetical $10,000 investment in the Innovator U.S. Equity Power Buffer ETF – June from its inception (May 31, 2019) to April 30, 2023 as compared with the S&P 500® Index – Price Return and Total Return.

| | | Average Annual Total Returns as of April 30, 2023 | |
| | | One Year | | �� | Three Years | | | Since Inception (a) | |
Innovator U.S. Equity Power Buffer ETF - June | | | | | | | | | | | | |
NAV Return | | | -0.17 | % | | | 4.98 | % | | | 5.17 | % |
Market Return | | | -0.34 | % | | | 5.01 | % | | | 5.14 | % |
S&P 500® Index - Price Return | | | 0.91 | % | | | 12.70 | % | | | 11.19 | % |
S&P 500® Index - Total Return | | | 2.66 | % | | | 14.52 | % | | | 13.06 | % |
(a) | Inception date is May 31, 2019. |
Performance data quoted represents past performance and does not guarantee future results. The investment return and principal value of an investment will fluctuate so that an investor’s shares, when redeemed, may be worth more or less than their original cost. Current performance of the Fund may be lower or higher than the performance quoted. As of the latest prospectus, the net expense ratio of the Fund was 0.79%. For the most recent performance, please visit the Fund’s website at innovatoretfs.com.
39
INNOVATOR U.S. EQUITY POWER BUFFER ETF – JUNE
Fund Performance |
April 30, 2023 (Unaudited) (Continued) | |
The line graph and performance table do not reflect the deduction of taxes that a shareholder may pay on fund distributions or the redemption of Fund shares. Returns shown for the Fund and S&P 500® Index – Total Return include the reinvestment of all dividends, if any. Returns shown for the S&P 500® Index – Price Return do not include the reinvestment of dividends, if any.
The S&P 500® Index is an unmanaged, capitalization–weighted index generally representative of the U.S. market for large capitalization stocks.
The Fund’s portfolio holdings may differ significantly from the securities held in the relevant index and, unlike an exchange–traded fund, the performance of an unmanaged index does not reflect deductions for transaction costs, taxes, management fees or other expenses.
You cannot invest directly in an index.
Premium/Discount Information:
Information regarding the differences between the price of the Fund’s shares on the secondary market and the Fund’s net asset value is available at Innovatoretfs.com/PJUN.
INNOVATOR U.S. EQUITY POWER BUFFER ETF – JULY
Fund Performance |
April 30, 2023 (Unaudited) |
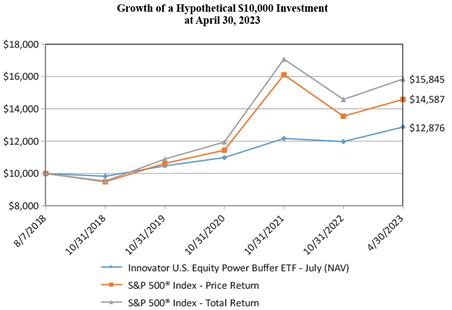
The following chart compares the value of a hypothetical $10,000 investment in the Innovator U.S. Equity Power Buffer ETF – July from its inception (August 7, 2018) to April 30, 2023 as compared with the S&P 500® Index – Price Return and Total Return.
| | | Average Annual Total Returns as of April 30, 2023 | |
| | | One Year | | | Three Years | | | Since Inception (a) | |
Innovator U.S. Equity Power Buffer ETF - July | | | | | | | | | | | | |
NAV Return | | | 9.11 | % | | | 7.53 | % | | | 5.49 | % |
Market Return | | | 9.07 | % | | | 7.41 | % | | | 5.48 | % |
S&P 500® Index - Price Return | | | 0.91 | % | | | 12.70 | % | | | 8.31 | % |
S&P 500® Index - Total Return | | | 2.66 | % | | | 14.52 | % | | | 10.22 | % |
(a) | Inception date is August 7, 2018. |
Performance data quoted represents past performance and does not guarantee future results. The investment return and principal value of an investment will fluctuate so that an investor’s shares, when redeemed, may be worth more or less than their original cost. Current performance of the Fund may be lower or higher than the performance quoted. As of the latest prospectus, the net expense ratio of the Fund was 0.79%. For the most recent performance, please visit the Fund’s website at innovatoretfs.com.
INNOVATOR U.S. EQUITY POWER BUFFER ETF – JULY
Fund Performance |
April 30, 2023 (Unaudited) (Continued) |
The line graph and performance table do not reflect the deduction of taxes that a shareholder may pay on fund distributions or the redemption of Fund shares. Returns shown for the Fund and S&P 500® Index – Total Return include the reinvestment of all dividends, if any. Returns shown for the S&P 500® Index – Price Return do not include the reinvestment of dividends, if any.
The S&P 500® Index is an unmanaged, capitalization–weighted index generally representative of the U.S. market for large capitalization stocks.
The Fund’s portfolio holdings may differ significantly from the securities held in the relevant index and, unlike an exchange–traded fund, the performance of an unmanaged index does not reflect deductions for transaction costs, taxes, management fees or other expenses.
You cannot invest directly in an index.
Premium/Discount Information:
Information regarding the differences between the price of the Fund’s shares on the secondary market and the Fund’s net asset value is available at Innovatoretfs.com/PJUL.
INNOVATOR U.S. EQUITY POWER BUFFER ETF – AUGUST
Fund Performance |
April 30, 2023 (Unaudited) |
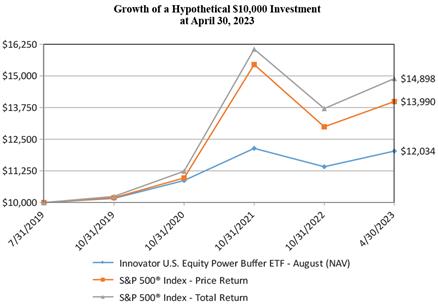
The following chart compares the value of a hypothetical $10,000 investment in the Innovator U.S. Equity Power Buffer ETF – August from its inception (July 31, 2019) to April 30, 2023 as compared with the S&P 500® Index – Price Return and Total Return.
| | | Average Annual Total Returns as of April 30, 2023 | |
| | | One Year | | | Three Years | | | Since Inception (a) | |
Innovator U.S. Equity Power Buffer ETF - August | | | | | | | | | | | | |
NAV Return | | | 2.75 | % | | | 6.32 | % | | | 5.06 | % |
Market Return | | | 2.73 | % | | | 6.26 | % | | | 5.08 | % |
S&P 500® Index - Price Return | | | 0.91 | % | | | 12.70 | % | | | 9.36 | % |
S&P 500® Index - Total Return | | | 2.66 | % | | | 14.52 | % | | | 11.21 | % |
(a) | Inception date is July 31, 2019. |
Performance data quoted represents past performance and does not guarantee future results. The investment return and principal value of an investment will fluctuate so that an investor’s shares, when redeemed, may be worth more or less than their original cost. Current performance of the Fund may be lower or higher than the performance quoted. As of the latest prospectus, the net expense ratio of the Fund was 0.79%. For the most recent performance, please visit the Fund’s website at innovatoretfs.com.
INNOVATOR U.S. EQUITY POWER BUFFER ETF – AUGUST
Fund Performance |
April 30, 2023 (Unaudited) (Continued) | |
The line graph and performance table do not reflect the deduction of taxes that a shareholder may pay on fund distributions or the redemption of Fund shares. Returns shown for the Fund and S&P 500® Index – Total Return include the reinvestment of all dividends, if any. Returns shown for the S&P 500® Index – Price Return do not include the reinvestment of dividends, if any.
The S&P 500® Index is an unmanaged, capitalization–weighted index generally representative of the U.S. market for large capitalization stocks.
The Fund’s portfolio holdings may differ significantly from the securities held in the relevant index and, unlike an exchange–traded fund, the performance of an unmanaged index does not reflect deductions for transaction costs, taxes, management fees or other expenses.
You cannot invest directly in an index.
Premium/Discount Information:
Information regarding the differences between the price of the Fund’s shares on the secondary market and the Fund’s net asset value is available at Innovatoretfs.com/PAUG.
INNOVATOR U.S. EQUITY POWER BUFFER ETF – SEPTEMBER
Fund Performance |
April 30, 2023 (Unaudited) |
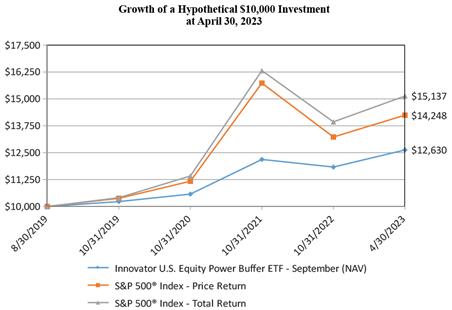
The following chart compares the value of a hypothetical $10,000 investment in the Innovator U.S. Equity Power Buffer ETF – September from its inception (August 30, 2019) to April 30, 2023 as compared with the S&P 500® Index – Price Return and Total Return.
| | | Average Annual Total Returns as of April 30, 2023 | |
| | | One Year | | | Three Years | | | Since Inception (a) | |
Innovator U.S. Equity Power Buffer ETF - September | | | | | | | | | | | | |
NAV Return | | | 8.32 | % | | | 7.84 | % | | | 6.57 | % |
Market Return | | | 8.09 | % | | | 7.65 | % | | | 6.53 | % |
S&P 500® Index - Price Return | | | 0.91 | % | | | 12.70 | % | | | 10.13 | % |
S&P 500® Index - Total Return | | | 2.66 | % | | | 14.52 | % | | | 11.96 | % |
(a) | Inception date is August 30, 2019. |
Performance data quoted represents past performance and does not guarantee future results. The investment return and principal value of an investment will fluctuate so that an investor’s shares, when redeemed, may be worth more or less than their original cost. Current performance of the Fund may be lower or higher than the performance quoted. As of the latest prospectus, the net expense ratio of the Fund was 0.79%. For the most recent performance, please visit the Fund’s website at innovatoretfs.com.
45
INNOVATOR U.S. EQUITY POWER BUFFER ETF – SEPTEMBER
Fund Performance |
April 30, 2023 (Unaudited) (Continued) |
The line graph and performance table do not reflect the deduction of taxes that a shareholder may pay on fund distributions or the redemption of Fund shares. Returns shown for the Fund and S&P 500® Index – Total Return include the reinvestment of all dividends, if any. Returns shown for the S&P 500® Index – Price Return do not include the reinvestment of dividends, if any.
The S&P 500® Index is an unmanaged, capitalization–weighted index generally representative of the U.S. market for large capitalization stocks.
The Fund’s portfolio holdings may differ significantly from the securities held in the relevant index and, unlike an exchange–traded fund, the performance of an unmanaged index does not reflect deductions for transaction costs, taxes, management fees or other expenses.
You cannot invest directly in an index.
Premium/Discount Information:
Information regarding the differences between the price of the Fund’s shares on the secondary market and the Fund’s net asset value is available at Innovatoretfs.com/PSEP.
INNOVATOR U.S. EQUITY POWER BUFFER ETF – OCTOBER
Fund Performance |
April 30, 2023 (Unaudited) |
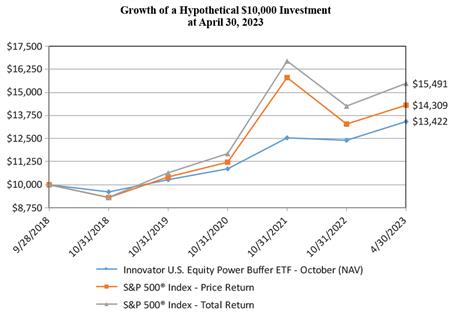
The following chart compares the value of a hypothetical $10,000 investment in the Innovator U.S. Equity Power Buffer ETF – October from its inception (September 28, 2018) to April 30, 2023 as compared with the S&P 500® Index – Price Return and Total Return.
| | | Average Annual Total Returns as of April 30, 2023 | |
| | | One Year | | | Three Years | | | Since Inception (a) | |
Innovator U.S. Equity Power Buffer ETF - October | | | | | | | | | | | | |
NAV Return | | | 11.07 | % | | | 9.95 | % | | | 6.63 | % |
Market Return | | | 10.73 | % | | | 9.84 | % | | | 6.58 | % |
S&P 500® Index - Price Return | | | 0.91 | % | | | 12.70 | % | | | 8.13 | % |
S&P 500® Index - Total Return | | | 2.66 | % | | | 14.52 | % | | | 10.01 | % |
(a) | Inception date is September 28, 2018. |
Performance data quoted represents past performance and does not guarantee future results. The investment return and principal value of an investment will fluctuate so that an investor’s shares, when redeemed, may be worth more or less than their original cost. Current performance of the Fund may be lower or higher than the performance quoted. As of the latest prospectus, the net expense ratio of the Fund was 0.79%. For the most recent performance, please visit the Fund’s website at innovatoretfs.com.
47
INNOVATOR U.S. EQUITY POWER BUFFER ETF – OCTOBER
Fund Performance |
April 30, 2023 (Unaudited) (Continued) |
The line graph and performance table do not reflect the deduction of taxes that a shareholder may pay on fund distributions or the redemption of Fund shares. Returns shown for the Fund and S&P 500® Index – Total Return include the reinvestment of all dividends, if any. Returns shown for the S&P 500® Index – Price Return do not include the reinvestment of dividends, if any.
The S&P 500® Index is an unmanaged, capitalization–weighted index generally representative of the U.S. market for large capitalization stocks.
The Fund’s portfolio holdings may differ significantly from the securities held in the relevant index and, unlike an exchange–traded fund, the performance of an unmanaged index does not reflect deductions for transaction costs, taxes, management fees or other expenses.
You cannot invest directly in an index.
Premium/Discount Information:
Information regarding the differences between the price of the Fund’s shares on the secondary market and the Fund’s net asset value is available at Innovatoretfs.com/POCT.
INNOVATOR U.S. EQUITY POWER BUFFER ETF – NOVEMBER
Fund Performance |
April 30, 2023 (Unaudited) | | |
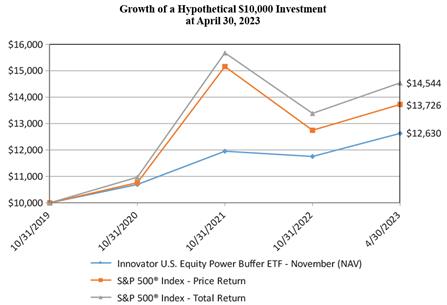
The following chart compares the value of a hypothetical $10,000 investment in the Innovator U.S. Equity Power Buffer ETF – November from its inception (October 31, 2019) to April 30, 2023 as compared with the S&P 500® Index - Price Return and Total Return.
| | | Average Annual Total Returns as of April 30, 2023 | |
| | | One Year | | | Three Years | | | Since Inception (a) | |
Innovator U.S. Equity Power Buffer ETF - November | | | | | | | | | | | | |
NAV Return | | | 10.79 | % | | | 8.67 | % | | | 6.90 | % |
Market Return | | | 10.68 | % | | | 8.57 | % | | | 6.88 | % |
S&P 500® Index - Price Return | | | 0.91 | % | | | 12.70 | % | | | 9.48 | % |
S&P 500® Index - Total Return | | | 2.66 | % | | | 14.52 | % | | | 11.30 | % |
(a) | Inception date is October 31, 2019. |
Performance data quoted represents past performance and does not guarantee future results. The investment return and principal value of an investment will fluctuate so that an investor’s shares, when redeemed, may be worth more or less than their original cost. Current performance of the Fund may be lower or higher than the performance quoted. As of the latest prospectus, the net expense ratio of the Fund was 0.79%. For the most recent performance, please visit the Fund’s website at innovatoretfs.com.
49
INNOVATOR U.S. EQUITY POWER BUFFER ETF – NOVEMBER
Fund Performance |
April 30, 2023 (Unaudited) (Continued) | |
The line graph and performance table do not reflect the deduction of taxes that a shareholder may pay on fund distributions or the redemption of Fund shares. Returns shown for the Fund and S&P 500® Index - Total Return include the reinvestment of all dividends, if any. Returns shown for the S&P 500® Index – Price Return do not include the reinvestment of dividends, if any.
The S&P 500® Index is an unmanaged, capitalization-weighted index generally representative of the U.S. market for large capitalization stocks.
The Fund’s portfolio holdings may differ significantly from the securities held in the relevant index and, unlike an exchange-traded fund, the performance of an unmanaged index does not reflect deductions for transaction costs, taxes, management fees or other expenses.
You cannot invest directly in an index.
Premium/Discount Information:
Information regarding the differences between the price of the Fund’s shares on the secondary market and the Fund’s net asset value is available at Innovatoretfs.com/PNOV.
INNOVATOR U.S. EQUITY POWER BUFFER ETF – DECEMBER
Fund Performance |
April 30, 2023 (Unaudited) | | |
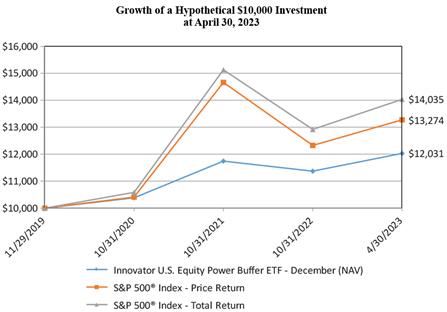
The following chart compares the value of a hypothetical $10,000 investment in the Innovator U.S. Equity Power Buffer ETF – December from its inception (November 29, 2019) to April 30, 2023 as compared with the S&P 500® Index - Price Return and Total Return.
| | | Average Annual Total Returns as of April 30, 2023 | |
| | | One Year | | | Three Years | | | Since Inception (a) | |
Innovator U.S. Equity Power Buffer ETF - December | | | | | | | | | | | | |
NAV Return | | | 7.11 | % | | | 7.68 | % | | | 5.56 | % |
Market Return | | | 6.83 | % | | | 7.48 | % | | | 5.49 | % |
S&P 500® Index - Price Return | | | 0.91 | % | | | 12.70 | % | | | 8.64 | % |
S&P 500® Index - Total Return | | | 2.66 | % | | | 14.52 | % | | | 10.42 | % |
(a) | Inception date is November 29, 2019. |
Performance data quoted represents past performance and does not guarantee future results. The investment return and principal value of an investment will fluctuate so that an investor’s shares, when redeemed, may be worth more or less than their original cost. Current performance of the Fund may be lower or higher than the performance quoted. As of the latest prospectus, the net expense ratio of the Fund was 0.79%. For the most recent performance, please visit the Fund’s website at innovatoretfs.com.
51
INNOVATOR U.S. EQUITY POWER BUFFER ETF – DECEMBER
Fund Performance |
April 30, 2023 (Unaudited) (Continued) | |
The line graph and performance table do not reflect the deduction of taxes that a shareholder may pay on fund distributions or the redemption of Fund shares. Returns shown for the Fund and S&P 500® Index - Total Return include the reinvestment of all dividends, if any. Returns shown for the S&P 500® Index – Price Return do not include the reinvestment of dividends, if any.
The S&P 500® Index is an unmanaged, capitalization-weighted index generally representative of the U.S. market for large capitalization stocks.
The Fund’s portfolio holdings may differ significantly from the securities held in the relevant index and, unlike an exchange-traded fund, the performance of an unmanaged index does not reflect deductions for transaction costs, taxes, management fees or other expenses.
You cannot invest directly in an index.
Premium/Discount Information:
Information regarding the differences between the price of the Fund’s shares on the secondary market and the Fund’s net asset value is available at Innovatoretfs.com/PDEC.
INNOVATOR U.S. EQUITY ULTRA BUFFER ETF - JANUARY
Fund Performance |
April 30, 2023 (Unaudited) | | |
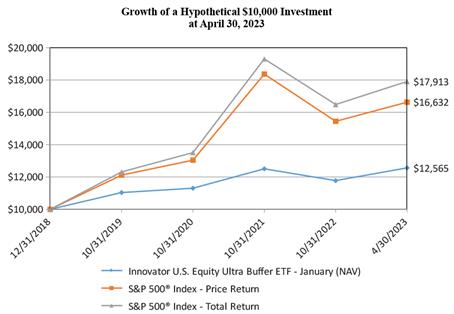
The following chart compares the value of a hypothetical $10,000 investment in the Innovator U.S. Equity Ultra Buffer ETF – January from its inception (December 31, 2018) to April 30, 2023 as compared with the S&P 500® Index – Price Return and Total Return.
| | | Average Annual Total Returns as of April 30, 2023 | |
| | | One Year | | | Three Years | | | Since Inception (a) | |
Innovator U.S. Equity Ultra Buffer ETF - January | | | | | | | | | | | | |
NAV Return | | | 6.17 | % | | | 5.43 | % | | | 5.42 | % |
Market Return | | | 5.68 | % | | | 5.34 | % | | | 5.36 | % |
S&P 500® Index - Price Return | | | 0.91 | % | | | 12.70 | % | | | 12.47 | % |
S&P 500® Index - Total Return | | | 2.66 | % | | | 14.52 | % | | | 14.42 | % |
(a) | Inception date is December 31, 2018. |
Performance data quoted represents past performance and does not guarantee future results. The investment return and principal value of an investment will fluctuate so that an investor’s shares, when redeemed, may be worth more or less than their original cost. Current performance of the Fund may be lower or higher than the performance quoted. As of the latest prospectus, the net expense ratio of the Fund was 0.79%. For the most recent performance, please visit the Fund’s website at innovatoretfs.com.
53
INNOVATOR U.S. EQUITY ULTRA BUFFER ETF - JANUARY
Fund Performance |
April 30, 2023 (Unaudited) (Continued) | |
The line graph and performance table do not reflect the deduction of taxes that a shareholder may pay on fund distributions or the redemption of Fund shares. Returns shown for the Fund and S&P 500® Index – Total Return include the reinvestment of all dividends, if any. Returns shown for the S&P 500® Index – Price Return do not include the reinvestment of dividends, if any.
The S&P 500® Index is an unmanaged, capitalization–weighted index generally representative of the U.S. market for large capitalization stocks.
The Fund’s portfolio holdings may differ significantly from the securities held in the relevant index and, unlike an exchange–traded fund, the performance of an unmanaged index does not reflect deductions for transaction costs, taxes, management fees or other expenses.
You cannot invest directly in an index.
Premium/Discount Information:
Information regarding the differences between the price of the Fund’s shares on the secondary market and the Fund’s net asset value is available at Innovatoretfs.com/UJAN.
INNOVATOR U.S. EQUITY ULTRA BUFFER ETF - FEBRUARY
Fund Performance |
April 30, 2023 (Unaudited) | |
The following chart compares the value of a hypothetical $10,000 investment in the Innovator U.S. Equity Ultra Buffer ETF – February from its inception (January 31, 2020) to April 30, 2023 as compared with the S&P 500® Index - Price Return and Total Return.
| | | Average Annual Total Returns as of April 30, 2023 | |
| | | One Year | | | Three Years | | | Since Inception (a) | |
Innovator U.S. Equity Ultra Buffer ETF - February | | | | | | | | | | | | |
NAV Return | | | -0.50 | % | | | 4.19 | % | | | 2.82 | % |
Market Return | | | -0.62 | % | | | 4.20 | % | | | 2.80 | % |
S&P 500® Index - Price Return | | | 0.91 | % | | | 12.70 | % | | | 8.23 | % |
S&P 500® Index - Total Return | | | 2.66 | % | | | 14.52 | % | | | 10.01 | % |
(a) | Inception date is January 31, 2020. |
Performance data quoted represents past performance and does not guarantee future results. The investment return and principal value of an investment will fluctuate so that an investor’s shares, when redeemed, may be worth more or less than their original cost. Current performance of the Fund may be lower or higher than the performance quoted. As of the latest prospectus, the net expense ratio of the Fund was 0.79%. For the most recent performance, please visit the Fund’s website at innovatoretfs.com.
INNOVATOR U.S. EQUITY ULTRA BUFFER ETF - FEBRUARY
Fund Performance |
April 30, 2023 (Unaudited) (Continued) | | |
The line graph and performance table do not reflect the deduction of taxes that a shareholder may pay on fund distributions or the redemption of Fund shares. Returns shown for the Fund and S&P 500® Index - Total Return include the reinvestment of all dividends, if any. Returns shown for the S&P 500® Index – Price Return do not include the reinvestment of dividends, if any.
The S&P 500® Index is an unmanaged, capitalization-weighted index generally representative of the U.S. market for large capitalization stocks.
The Fund’s portfolio holdings may differ significantly from the securities held in the relevant index and, unlike an exchange-traded fund, the performance of an unmanaged index does not reflect deductions for transaction costs, taxes, management fees or other expenses.
You cannot invest directly in an index.
Premium/Discount Information:
Information regarding the differences between the price of the Fund’s shares on the secondary market and the Fund’s net asset value is available at Innovatoretfs.com/UFEB.
INNOVATOR U.S. EQUITY ULTRA BUFFER ETF - MARCH
Fund Performance |
April 30, 2023 (Unaudited) | |
The following chart compares the value of a hypothetical $10,000 investment in the Innovator U.S. Equity Ultra Buffer ETF – March from its inception (February 28, 2020) to April 30, 2023 as compared with the S&P 500® Index - Price Return and Total Return.
| | | Average Annual Total Returns as of April 30, 2023 | |
| | | One Year | | | Three Years | | | Since Inception (a) | |
Innovator U.S. Equity Ultra Buffer ETF - March | | | | | | | | | | | | |
NAV Return | | | -0.09 | % | | | 3.78 | % | | | 3.52 | % |
Market Return | | | -0.55 | % | | | 3.70 | % | | | 3.46 | % |
S&P 500® Index - Price Return | | | 0.91 | % | | | 12.70 | % | | | 11.48 | % |
S&P 500® Index - Total Return | | | 2.66 | % | | | 14.52 | % | | | 13.29 | % |
(a) | Inception date is February 28, 2020. |
Performance data quoted represents past performance and does not guarantee future results. The investment return and principal value of an investment will fluctuate so that an investor’s shares, when redeemed, may be worth more or less than their original cost. Current performance of the Fund may be lower or higher than the performance quoted. As of the latest prospectus, the net expense ratio of the Fund was 0.79%. For the most recent performance, please visit the Fund’s website at innovatoretfs.com.
57
INNOVATOR U.S. EQUITY ULTRA BUFFER ETF - MARCH
Fund Performance |
April 30, 2023 (Unaudited) (Continued) | | |
The line graph and performance table do not reflect the deduction of taxes that a shareholder may pay on fund distributions or the redemption of Fund shares. Returns shown for the Fund and S&P 500® Index - Total Return include the reinvestment of all dividends, if any. Returns shown for the S&P 500® Index – Price Return do not include the reinvestment of dividends, if any.
The S&P 500® Index is an unmanaged, capitalization-weighted index generally representative of the U.S. market for large capitalization stocks.
The Fund’s portfolio holdings may differ significantly from the securities held in the relevant index and, unlike an exchange-traded fund, the performance of an unmanaged index does not reflect deductions for transaction costs, taxes, management fees or other expenses.
You cannot invest directly in an index.
Premium/Discount Information:
Information regarding the differences between the price of the Fund’s shares on the secondary market and the Fund’s net asset value is available at Innovatoretfs.com/UMAR.
INNOVATOR U.S. EQUITY ULTRA BUFFER ETF - APRIL
Fund Performance |
April 30, 2023 (Unaudited) | |
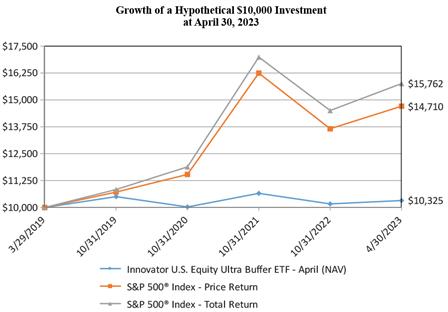
The following chart compares the value of a hypothetical $10,000 investment in the Innovator U.S. Equity Ultra Buffer ETF – April from its inception (March 29, 2019) to April 30, 2023 as compared with the S&P 500® Index – Price Return and Total Return.
| | | Average Annual Total Returns as of April 30, 2023 | |
| | | One Year | | | Three Years | | | Since Inception (a) | |
Innovator U.S. Equity Ultra Buffer ETF - April | | | | | | | | | | | | |
NAV Return | | | -0.75 | % | | | 2.55 | % | | | 0.79 | % |
Market Return | | | -1.16 | % | | | 1.92 | % | | | 0.74 | % |
S&P 500® Index - Price Return | | | 0.91 | % | | | 12.70 | % | | | 9.90 | % |
S&P 500® Index - Total Return | | | 2.66 | % | | | 14.52 | % | | | 11.77 | % |
(a) | Inception date is March 29, 2019. |
Performance data quoted represents past performance and does not guarantee future results. The investment return and principal value of an investment will fluctuate so that an investor’s shares, when redeemed, may be worth more or less than their original cost. Current performance of the Fund may be lower or higher than the performance quoted. As of the latest prospectus, the net expense ratio of the Fund was 0.79%. For the most recent performance, please visit the Fund’s website at innovatoretfs.com.
59
INNOVATOR U.S. EQUITY ULTRA BUFFER ETF - APRIL
Fund Performance |
April 30, 2023 (Unaudited) (Continued) | | |
The line graph and performance table do not reflect the deduction of taxes that a shareholder may pay on fund distributions or the redemption of Fund shares. Returns shown for the Fund and S&P 500® Index – Total Return include the reinvestment of all dividends, if any. Returns shown for the S&P 500® Index – Price Return do not include the reinvestment of dividends, if any.
The S&P 500® Index is an unmanaged, capitalization–weighted index generally representative of the U.S. market for large capitalization stocks.
The Fund’s portfolio holdings may differ significantly from the securities held in the relevant index and, unlike an exchange–traded fund, the performance of an unmanaged index does not reflect deductions for transaction costs, taxes, management fees or other expenses.
You cannot invest directly in an index.
Premium/Discount Information:
Information regarding the differences between the price of the Fund’s shares on the secondary market and the Fund’s net asset value is available at Innovatoretfs.com/UAPR.
INNOVATOR U.S. EQUITY ULTRA BUFFER ETF - MAY
Fund Performance |
April 30, 2023 (Unaudited) | |
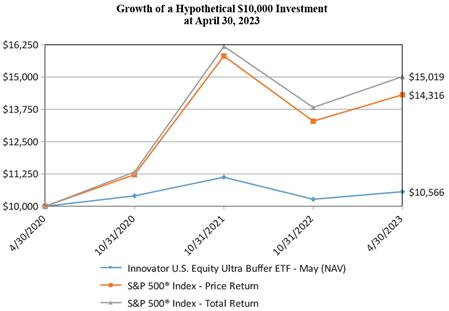
The following chart compares the value of a hypothetical $10,000 investment in the Innovator U.S. Equity Ultra Buffer ETF – May from its inception (April 30, 2020) to April 30, 2023 as compared with the S&P 500® Index - Price Return and Total Return.
| | | Average Annual Total Returns as of April 30, 2023 | |
| | | One Year | | | Three Years | | | Since Inception (a) | |
Innovator U.S. Equity Ultra Buffer ETF - May | | | | | | | | | | | | |
NAV Return | | | 0.19 | % | | | 1.85 | % | | | 1.85 | % |
Market Return | | | -0.03 | % | | | 1.81 | % | | | 1.81 | % |
S&P 500® Index - Price Return | | | 0.91 | % | | | 12.70 | % | | | 12.70 | % |
S&P 500® Index - Total Return | | | 2.66 | % | | | 14.52 | % | | | 14.52 | % |
(a) | Inception date is April 30, 2020. |
Performance data quoted represents past performance and does not guarantee future results. The investment return and principal value of an investment will fluctuate so that an investor’s shares, when redeemed, may be worth more or less than their original cost. Current performance of the Fund may be lower or higher than the performance quoted. As of the latest prospectus, the net expense ratio of the Fund was 0.79%. For the most recent performance, please visit the Fund’s website at innovatoretfs.com.
61
INNOVATOR U.S. EQUITY ULTRA BUFFER ETF - MAY
Fund Performance |
April 30, 2023 (Unaudited) (Continued) | | |
The line graph and performance table do not reflect the deduction of taxes that a shareholder may pay on fund distributions or the redemption of Fund shares. Returns shown for the Fund and S&P 500® Index - Total Return include the reinvestment of all dividends, if any. Returns shown for the S&P 500® Index – Price Return do not include the reinvestment of dividends, if any.
The S&P 500® Index is an unmanaged, capitalization-weighted index generally representative of the U.S. market for large capitalization stocks.
The Fund’s portfolio holdings may differ significantly from the securities held in the relevant index and, unlike an exchange-traded fund, the performance of an unmanaged index does not reflect deductions for transaction costs, taxes, management fees or other expenses.
You cannot invest directly in an index.
Premium/Discount Information:
Information regarding the differences between the price of the Fund’s shares on the secondary market and the Fund’s net asset value is available at Innovatoretfs.com/UMAY.
INNOVATOR U.S. EQUITY ULTRA BUFFER ETF - JUNE
Fund Performance |
April 30, 2023 (Unaudited) | | | |
The following chart compares the value of a hypothetical $10,000 investment in the Innovator U.S. Equity Ultra Buffer ETF – June from its inception (May 31, 2019) to April 30, 2023 as compared with the S&P 500® Index – Price Return and Total Return.
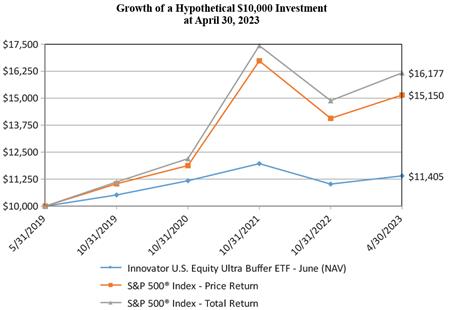
| | | Average Annual Total Returns as of April 30, 2023 | |
| | | One Year | | | Three Years | | | Since Inception (a) | |
Innovator U.S. Equity Ultra Buffer ETF - June | | | | | | | | | | | | |
NAV Return | | | -1.06 | % | | | 2.84 | % | | | 3.41 | % |
Market Return | | | -1.29 | % | | | 2.79 | % | | | 3.37 | % |
S&P 500® Index - Price Return | | | 0.91 | % | | | 12.70 | % | | | 11.19 | % |
S&P 500® Index - Total Return | | | 2.66 | % | | | 14.52 | % | | | 13.06 | % |
(a) | Inception date is May 31, 2019. |
Performance data quoted represents past performance and does not guarantee future results. The investment return and principal value of an investment will fluctuate so that an investor’s shares, when redeemed, may be worth more or less than their original cost. Current performance of the Fund may be lower or higher than the performance quoted. As of the latest prospectus, the net expense ratio of the Fund was 0.79%. For the most recent performance, please visit the Fund’s website at innovatoretfs.com.
INNOVATOR U.S. EQUITY ULTRA BUFFER ETF - JUNE
Fund Performance |
April 30, 2023 (Unaudited) (Continued) | | |
The line graph and performance table do not reflect the deduction of taxes that a shareholder may pay on fund distributions or the redemption of Fund shares. Returns shown for the Fund and S&P 500® Index – Total Return include the reinvestment of all dividends, if any. Returns shown for the S&P 500® Index – Price Return do not include the reinvestment of dividends, if any.
The S&P 500® Index is an unmanaged, capitalization–weighted index generally representative of the U.S. market for large capitalization stocks.
The Fund’s portfolio holdings may differ significantly from the securities held in the relevant index and, unlike an exchange–traded fund, the performance of an unmanaged index does not reflect deductions for transaction costs, taxes, management fees or other expenses.
You cannot invest directly in an index.
Premium/Discount Information:
Information regarding the differences between the price of the Fund’s shares on the secondary market and the Fund’s net asset value is available at Innovatoretfs.com/UJUN.
INNOVATOR U.S. EQUITY ULTRA BUFFER ETF - JULY
Fund Performance |
April 30, 2023 (Unaudited) | | | |
The following chart compares the value of a hypothetical $10,000 investment in the Innovator U.S. Equity Ultra Buffer ETF – July from its inception (August 7, 2018) to April 30, 2023 as compared with the S&P 500® Index – Price Return and Total Return.
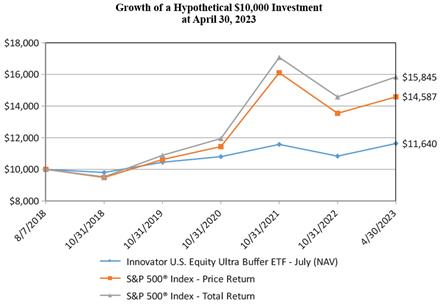
| | | Average Annual Total Returns as of April 30, 2023 | |
| | | One Year | | | Three Years | | | Since Inception (a) | |
Innovator U.S. Equity Ultra Buffer ETF - July | | | | | | | | | | | | |
NAV Return | | | 4.24 | % | | | 4.20 | % | | | 3.26 | % |
Market Return | | | 4.12 | % | | | 4.14 | % | | | 3.26 | % |
S&P 500® Index - Price Return | | | 0.91 | % | | | 12.70 | % | | | 8.31 | % |
S&P 500® Index - Total Return | | | 2.66 | % | | | 14.52 | % | | | 10.22 | % |
(a) | Inception date is August 7, 2018. |
Performance data quoted represents past performance and does not guarantee future results. The investment return and principal value of an investment will fluctuate so that an investor’s shares, when redeemed, may be worth more or less than their original cost. Current performance of the Fund may be lower or higher than the performance quoted. As of the latest prospectus, the net expense ratio of the Fund was 0.79%. For the most recent performance, please visit the Fund’s website at innovatoretfs.com.
65
INNOVATOR U.S. EQUITY ULTRA BUFFER ETF - JULY
Fund Performance |
April 30, 2023 (Unaudited) (Continued) | |
The line graph and performance table do not reflect the deduction of taxes that a shareholder may pay on fund distributions or the redemption of Fund shares. Returns shown for the Fund and S&P 500® Index – Total Return include the reinvestment of all dividends, if any. Returns shown for the S&P 500® Index – Price Return do not include the reinvestment of dividends, if any.
The S&P 500® Index is an unmanaged, capitalization–weighted index generally representative of the U.S. market for large capitalization stocks.
The Fund’s portfolio holdings may differ significantly from the securities held in the relevant index and, unlike an exchange–traded fund, the performance of an unmanaged index does not reflect deductions for transaction costs, taxes, management fees or other expenses.
You cannot invest directly in an index.
Premium/Discount Information:
Information regarding the differences between the price of the Fund’s shares on the secondary market and the Fund’s net asset value is available at Innovatoretfs.com/UJUL.
INNOVATOR U.S. EQUITY ULTRA BUFFER ETF - AUGUST
Fund Performance |
April 30, 2023 (Unaudited) | | | |
The following chart compares the value of a hypothetical $10,000 investment in the Innovator U.S. Equity Ultra Buffer ETF – August from its inception (July 31, 2019) to April 30, 2023 as compared with the S&P 500® Index – Price Return and Total Return.
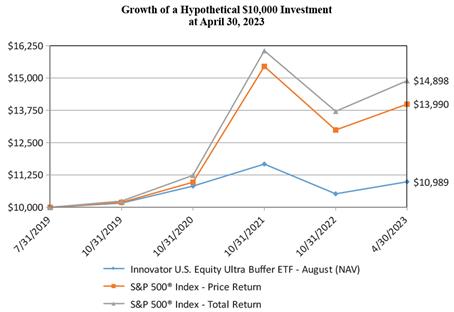
| | | Average Annual Total Returns as of April 30, 2023 | |
| | | One Year | | | Three Years | | | Since Inception (a) | |
Innovator U.S. Equity Ultra Buffer ETF - August | | | | | | | | | | | | |
NAV Return | | | -1.92 | % | | | 3.09 | % | | | 2.55 | % |
Market Return | | | -1.98 | % | | | 3.00 | % | | | 2.56 | % |
S&P 500® Index - Price Return | | | 0.91 | % | | | 12.70 | % | | | 9.36 | % |
S&P 500® Index - Total Return | | | 2.66 | % | | | 14.52 | % | | | 11.21 | % |
(a) | Inception date is July 31, 2019. |
Performance data quoted represents past performance and does not guarantee future results. The investment return and principal value of an investment will fluctuate so that an investor’s shares, when redeemed, may be worth more or less than their original cost. Current performance of the Fund may be lower or higher than the performance quoted. As of the latest prospectus, the net expense ratio of the Fund was 0.79%. For the most recent performance, please visit the Fund’s website at innovatoretfs.com.
INNOVATOR U.S. EQUITY ULTRA BUFFER ETF - AUGUST
Fund Performance |
April 30, 2023 (Unaudited) (Continued) | |
The line graph and performance table do not reflect the deduction of taxes that a shareholder may pay on fund distributions or the redemption of Fund shares. Returns shown for the Fund and S&P 500® Index – Total Return include the reinvestment of all dividends, if any. Returns shown for the S&P 500® Index – Price Return do not include the reinvestment of dividends, if any.
The S&P 500® Index is an unmanaged, capitalization–weighted index generally representative of the U.S. market for large capitalization stocks.
The Fund’s portfolio holdings may differ significantly from the securities held in the relevant index and, unlike an exchange–traded fund, the performance of an unmanaged index does not reflect deductions for transaction costs, taxes, management fees or other expenses.
You cannot invest directly in an index.
Premium/Discount Information:
Information regarding the differences between the price of the Fund’s shares on the secondary market and the Fund’s net asset value is available at Innovatoretfs.com/UAUG.
INNOVATOR U.S. EQUITY ULTRA BUFFER ETF - SEPTEMBER
Fund Performance |
April 30, 2023 (Unaudited) | | | |
The following chart compares the value of a hypothetical $10,000 investment in the Innovator U.S. Equity Ultra Buffer ETF – September from its inception (August 30, 2019) to April 30, 2023 as compared with the S&P 500® Index – Price Return and Total Return.
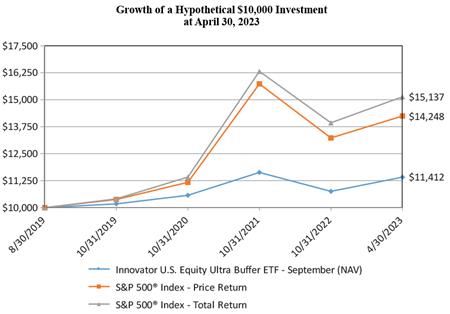
| | | Average Annual Total Returns as of April 30, 2023 | |
| | | One Year | | | Three Years | | | Since Inception (a) | |
Innovator U.S. Equity Ultra Buffer ETF - September | | | | | | | | | | | | |
NAV Return | | | 2.81 | % | | | 4.16 | % | | | 3.67 | % |
Market Return | | | 2.50 | % | | | 4.07 | % | | | 3.61 | % |
S&P 500® Index - Price Return | | | 0.91 | % | | | 12.70 | % | | | 10.13 | % |
S&P 500® Index - Total Return | | | 2.66 | % | | | 14.52 | % | | | 11.96 | % |
(a) | Inception date is August 30, 2019. |
Performance data quoted represents past performance and does not guarantee future results. The investment return and principal value of an investment will fluctuate so that an investor’s shares, when redeemed, may be worth more or less than their original cost. Current performance of the Fund may be lower or higher than the performance quoted. As of the latest prospectus, the net expense ratio of the Fund was 0.79%. For the most recent performance, please visit the Fund’s website at innovatoretfs.com.
INNOVATOR U.S. EQUITY ULTRA BUFFER ETF - SEPTEMBER
Fund Performance |
April 30, 2023 (Unaudited) (Continued) | | |
The line graph and performance table do not reflect the deduction of taxes that a shareholder may pay on fund distributions or the redemption of Fund shares. Returns shown for the Fund and S&P 500® Index – Total Return include the reinvestment of all dividends, if any. Returns shown for the S&P 500® Index – Price Return do not include the reinvestment of dividends, if any.
The S&P 500® Index is an unmanaged, capitalization–weighted index generally representative of the U.S. market for large capitalization stocks.
The Fund’s portfolio holdings may differ significantly from the securities held in the relevant index and, unlike an exchange–traded fund, the performance of an unmanaged index does not reflect deductions for transaction costs, taxes, management fees or other expenses.
You cannot invest directly in an index.
Premium/Discount Information:
Information regarding the differences between the price of the Fund’s shares on the secondary market and the Fund’s net asset value is available at Innovatoretfs.com/USEP.
INNOVATOR U.S. EQUITY ULTRA BUFFER ETF - OCTOBER
Fund Performance |
April 30, 2023 (Unaudited) | | |
The following chart compares the value of a hypothetical $10,000 investment in the Innovator U.S. Equity Ultra Buffer ETF – October from its inception (September 28, 2018) to April 30, 2023 as compared with the S&P 500® Index – Price Return and Total Return.

| | | Average Annual Total Returns as of April 30, 2023 | |
| | | One Year | | | Three Years | | | Since Inception (a) | |
Innovator U.S. Equity Ultra Buffer ETF - October | | | | | | | | | | | | |
NAV Return | | | 5.96 | % | | | 6.04 | % | | | 4.23 | % |
Market Return | | | 5.53 | % | | | 6.05 | % | | | 4.19 | % |
S&P 500® Index - Price Return | | | 0.91 | % | | | 12.70 | % | | | 8.13 | % |
S&P 500® Index - Total Return | | | 2.66 | % | | | 14.52 | % | | | 10.01 | % |
(a) | Inception date is September 28, 2018. |
Performance data quoted represents past performance and does not guarantee future results. The investment return and principal value of an investment will fluctuate so that an investor’s shares, when redeemed, may be worth more or less than their original cost. Current performance of the Fund may be lower or higher than the performance quoted. As of the latest prospectus, the net expense ratio of the Fund was 0.79%. For the most recent performance, please visit the Fund’s website at innovatoretfs.com.
71
INNOVATOR U.S. EQUITY ULTRA BUFFER ETF - OCTOBER
Fund Performance |
April 30, 2023 (Unaudited) (Continued) | | |
The line graph and performance table do not reflect the deduction of taxes that a shareholder may pay on fund distributions or the redemption of Fund shares. Returns shown for the Fund and S&P 500® Index – Total Return include the reinvestment of all dividends, if any. Returns shown for the S&P 500® Index – Price Return do not include the reinvestment of dividends, if any.
The S&P 500® Index is an unmanaged, capitalization–weighted index generally representative of the U.S. market for large capitalization stocks.
The Fund’s portfolio holdings may differ significantly from the securities held in the relevant index and, unlike an exchange–traded fund, the performance of an unmanaged index does not reflect deductions for transaction costs, taxes, management fees or other expenses.
You cannot invest directly in an index.
Premium/Discount Information:
Information regarding the differences between the price of the Fund’s shares on the secondary market and the Fund’s net asset value is available at Innovatoretfs.com/UOCT.
INNOVATOR U.S. EQUITY ULTRA BUFFER ETF - NOVEMBER
Fund Performance |
April 30, 2023 (Unaudited) | | | |
The following chart compares the value of a hypothetical $10,000 investment in the Innovator U.S. Equity Ultra Buffer ETF – November from its inception (October 31, 2019) to April 30, 2023 as compared with the S&P 500® Index - Price Return and Total Return.
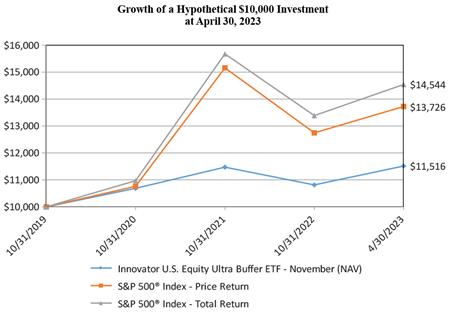
| | | Average Annual Total Returns as of April 30, 2023 | |
| | | One Year | | | Three Years | | | Since Inception (a) | |
Innovator U.S. Equity Ultra Buffer ETF - November | | | | | | | | | | | | |
NAV Return | | | 5.05 | % | | | 5.08 | % | | | 4.12 | % |
Market Return | | | 4.65 | % | | | 4.95 | % | | | 4.06 | % |
S&P 500® Index - Price Return | | | 0.91 | % | | | 12.70 | % | | | 9.48 | % |
S&P 500® Index - Total Return | | | 2.66 | % | | | 14.52 | % | | | 11.30 | % |
(a) | Inception date is October 31, 2019. |
Performance data quoted represents past performance and does not guarantee future results. The investment return and principal value of an investment will fluctuate so that an investor’s shares, when redeemed, may be worth more or less than their original cost. Current performance of the Fund may be lower or higher than the performance quoted. As of the latest prospectus, the net expense ratio of the Fund was 0.79%. For the most recent performance, please visit the Fund’s website at innovatoretfs.com.
INNOVATOR U.S. EQUITY ULTRA BUFFER ETF - NOVEMBER
Fund Performance |
April 30, 2023 (Unaudited) (Continued) | | |
The line graph and performance table do not reflect the deduction of taxes that a shareholder may pay on fund distributions or the redemption of Fund shares. Returns shown for the Fund and S&P 500® Index - Total Return include the reinvestment of all dividends, if any. Returns shown for the S&P 500® Index – Price Return do not include the reinvestment of dividends, if any.
The S&P 500® Index is an unmanaged, capitalization-weighted index generally representative of the U.S. market for large capitalization stocks.
The Fund’s portfolio holdings may differ significantly from the securities held in the relevant index and, unlike an exchange-traded fund, the performance of an unmanaged index does not reflect deductions for transaction costs, taxes, management fees or other expenses.
You cannot invest directly in an index.
Premium/Discount Information:
Information regarding the differences between the price of the Fund’s shares on the secondary market and the Fund’s net asset value is available at Innovatoretfs.com/UNOV.
INNOVATOR U.S. EQUITY ULTRA BUFFER ETF - DECEMBER
Fund Performance |
April 30, 2023 (Unaudited) | | | |
The following chart compares the value of a hypothetical $10,000 investment in the Innovator U.S. Equity Ultra Buffer ETF – December from its inception (November 29, 2019) to April 30, 2023 as compared with the S&P 500® Index - Price Return and Total Return.
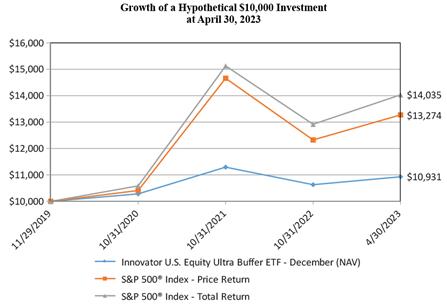
| | | Average Annual Total Returns as of April 30, 2023 | |
| | | One Year | | | Three Years | | | Since Inception (a) | |
Innovator U.S. Equity Ultra Buffer ETF - December | | | | | | | | | | | | |
NAV Return | | | 0.92 | % | | | 3.82 | % | | | 2.64 | % |
Market Return | | | 0.51 | % | | | 3.58 | % | | | 2.59 | % |
S&P 500® Index - Price Return | | | 0.91 | % | | | 12.70 | % | | | 8.64 | % |
S&P 500® Index - Total Return | | | 2.66 | % | | | 14.52 | % | | | 10.42 | % |
(a) | Inception date is November 29, 2019. |
Performance data quoted represents past performance and does not guarantee future results. The investment return and principal value of an investment will fluctuate so that an investor’s shares, when redeemed, may be worth more or less than their original cost. Current performance of the Fund may be lower or higher than the performance quoted. As of the latest prospectus, the net expense ratio of the Fund was 0.79%. For the most recent performance, please visit the Fund’s website at innovatoretfs.com.
75
INNOVATOR U.S. EQUITY ULTRA BUFFER ETF - DECEMBER
Fund Performance |
April 30, 2023 (Unaudited) (Continued) | | |
The line graph and performance table do not reflect the deduction of taxes that a shareholder may pay on fund distributions or the redemption of Fund shares. Returns shown for the Fund and S&P 500® Index - Total Return include the reinvestment of all dividends, if any. Returns shown for the S&P 500® Index – Price Return do not include the reinvestment of dividends, if any.
The S&P 500® Index is an unmanaged, capitalization-weighted index generally representative of the U.S. market for large capitalization stocks.
The Fund’s portfolio holdings may differ significantly from the securities held in the relevant index and, unlike an exchange-traded fund, the performance of an unmanaged index does not reflect deductions for transaction costs, taxes, management fees or other expenses.
You cannot invest directly in an index.
Premium/Discount Information:
Information regarding the differences between the price of the Fund’s shares on the secondary market and the Fund’s net asset value is available at Innovatoretfs.com/UDEC.
INNOVATOR PREMIUM INCOME 10 BARRIER ETF - APRIL
Fund Performance |
April 30, 2023 (Unaudited) | | |
| | | Total Returns As of April 30, 2023 | |
| | | Since Inception (a) | |
Innovator Premium Income 10 Barrier ETF - April | | | | |
NAV Return | | | 0.94 | % |
Market Return | | | 1.10 | % |
S&P 500® Index - Price Return | | | 1.46 | % |
S&P 500® Index - Total Return | | | 1.56 | % |
(a) Inception date is March 31, 2023. |
| |
Performance data quoted represents past performance and does not guarantee future results. The investment return and principal value of an investment will fluctuate so that an investor’s shares, when redeemed, may be worth more or less than their original cost. Current performance of the Fund may be lower or higher than the performance quoted. As of the latest prospectus, the net expense ratio of the Fund was 0.79%. For the most recent performance, please visit the Fund’s website at innovatoretfs.com. |
77
INNOVATOR PREMIUM INCOME 10 BARRIER ETF - APRIL
Fund Performance |
April 30, 2023 (Unaudited) (Continued) |
| |
The performance table does not reflect the deduction of taxes that a shareholder may pay on fund distributions or the redemption of Fund shares. Returns shown for the Fund and S&P 500® Index - Total Return include the reinvestment of all dividends, if any. Returns shown for the S&P 500® Index – Price Return do not include the reinvestment of dividends, if any. |
| |
The S&P 500® Index is an unmanaged, capitalization-weighted index generally representative of the U.S. market for large capitalization stocks. |
| |
The Fund’s portfolio holdings may differ significantly from the securities held in the relevant index and, unlike an exchange-traded fund, the performance of an unmanaged index does not reflect deductions for transaction costs, taxes, management fees or other expenses. |
| |
You cannot invest directly in an index. |
| |
Premium/Discount Information: |
| |
Information regarding the differences between the price of the Fund’s shares on the secondary market and the Fund’s net asset value is available at Innovatoretfs.com/APRD. |
INNOVATOR PREMIUM INCOME 20 BARRIER ETF - APRIL
Fund Performance |
April 30, 2023 (Unaudited) | | |
| | | Total Returns As of April 30, 2023 | |
| | | Since Inception (a) | |
Innovator Premium Income 20 Barrier ETF - April | | | | |
NAV Return | | | 0.69 | % |
Market Return | | | 0.90 | % |
S&P 500® Index - Price Return | | | 1.46 | % |
S&P 500® Index - Total Return | | | 1.56 | % |
(a) Inception date is March 31, 2023. |
| |
Performance data quoted represents past performance and does not guarantee future results. The investment return and principal value of an investment will fluctuate so that an investor’s shares, when redeemed, may be worth more or less than their original cost. Current performance of the Fund may be lower or higher than the performance quoted. As of the latest prospectus, the net expense ratio of the Fund was 0.79%. For the most recent performance, please visit the Fund’s website at innovatoretfs.com. |
79
INNOVATOR PREMIUM INCOME 20 BARRIER ETF - APRIL
Fund Performance |
April 30, 2023 (Unaudited) (Continued) |
| |
The performance table does not reflect the deduction of taxes that a shareholder may pay on fund distributions or the redemption of Fund shares. Returns shown for the Fund and S&P 500® Index - Total Return include the reinvestment of all dividends, if any. Returns shown for the S&P 500® Index – Price Return do not include the reinvestment of dividends, if any. |
| |
The S&P 500® Index is an unmanaged, capitalization-weighted index generally representative of the U.S. market for large capitalization stocks. |
| |
The Fund’s portfolio holdings may differ significantly from the securities held in the relevant index and, unlike an exchange-traded fund, the performance of an unmanaged index does not reflect deductions for transaction costs, taxes, management fees or other expenses. |
| |
You cannot invest directly in an index. |
| |
Premium/Discount Information: |
| |
Information regarding the differences between the price of the Fund’s shares on the secondary market and the Fund’s net asset value is available at Innovatoretfs.com/APRH. |
INNOVATOR PREMIUM INCOME 30 BARRIER ETF - APRIL
Fund Performance |
April 30, 2023 (Unaudited) |
| | | Total Returns As of April 30, 2023 | |
| | | Since Inception (a) | |
Innovator Premium Income 30 Barrier ETF - April | | | | |
NAV Return | | | 0.51 | % |
Market Return | | | 0.59 | % |
S&P 500® Index - Price Return | | | 1.46 | % |
S&P 500® Index - Total Return | | | 1.56 | % |
(a) Inception date is March 31, 2023. |
| | | | | | |
Performance data quoted represents past performance and does not guarantee future results. The investment return and principal value of an investment will fluctuate so that an investor’s shares, when redeemed, may be worth more or less than their original cost. Current performance of the Fund may be lower or higher than the performance quoted. As of the latest prospectus, the net expense ratio of the Fund was 0.79%. For the most recent performance, please visit the Fund’s website at innovatoretfs.com. |
81
INNOVATOR PREMIUM INCOME 30 BARRIER ETF - APRIL
Fund Performance |
April 30, 2023 (Unaudited) (Continued) |
The performance table does not reflect the deduction of taxes that a shareholder may pay on fund distributions or the redemption of Fund shares. Returns shown for the Fund and S&P 500® Index - Total Return include the reinvestment of all dividends, if any. Returns shown for the S&P 500® Index – Price Return do not include the reinvestment of dividends, if any. |
| |
The S&P 500® Index is an unmanaged, capitalization-weighted index generally representative of the U.S. market for large capitalization stocks. |
| |
The Fund’s portfolio holdings may differ significantly from the securities held in the relevant index and, unlike an exchange-traded fund, the performance of an unmanaged index does not reflect deductions for transaction costs, taxes, management fees or other expenses. |
| |
You cannot invest directly in an index. |
| |
Premium/Discount Information: |
| |
Information regarding the differences between the price of the Fund’s shares on the secondary market and the Fund’s net asset value is available at Innovatoretfs.com/APRJ. |
INNOVATOR PREMIUM INCOME 40 BARRIER ETF - APRIL
Fund Performance |
April 30, 2023 (Unaudited) |
| | | Total Returns As of April 30, 2023 | |
| | | Since Inception (a) | |
Innovator Premium Income 40 Barrier ETF - April | | | | |
NAV Return | | | 0.40 | % |
Market Return | | | 0.35 | % |
S&P 500® Index - Price Return | | | 1.46 | % |
S&P 500® Index - Total Return | | | 1.56 | % |
(a) Inception date is March 31, 2023. |
| |
Performance data quoted represents past performance and does not guarantee future results. The investment return and principal value of an investment will fluctuate so that an investor’s shares, when redeemed, may be worth more or less than their original cost. Current performance of the Fund may be lower or higher than the performance quoted. As of the latest prospectus, the net expense ratio of the Fund was 0.79%. For the most recent performance, please visit the Fund’s website at innovatoretfs.com. |
83
INNOVATOR PREMIUM INCOME 40 BARRIER ETF - APRIL
Fund Performance |
April 30, 2023 (Unaudited) (Continued) |
| |
The performance table does not reflect the deduction of taxes that a shareholder may pay on fund distributions or the redemption of Fund shares. Returns shown for the Fund and S&P 500® Index - Total Return include the reinvestment of all dividends, if any. Returns shown for the S&P 500® Index – Price Return do not include the reinvestment of dividends, if any. |
| |
The S&P 500® Index is an unmanaged, capitalization-weighted index generally representative of the U.S. market for large capitalization stocks. |
| |
The Fund’s portfolio holdings may differ significantly from the securities held in the relevant index and, unlike an exchange-traded fund, the performance of an unmanaged index does not reflect deductions for transaction costs, taxes, management fees or other expenses. |
| |
You cannot invest directly in an index. |
| |
Premium/Discount Information: |
| |
Information regarding the differences between the price of the Fund’s shares on the secondary market and the Fund’s net asset value is available at Innovatoretfs.com/APRQ. |
Expense Example
For the Period Ended April 30, 2023 (Unaudited)
As a shareholder of the Funds, you incur two types of costs: (1) ongoing costs, including management fees, and other Fund expenses; and (2) transaction costs, including brokerage commissions on the purchase and sale of Fund shares. This Example is intended to help you understand your ongoing costs (in dollars) of investing in the Funds and to compare these costs with the ongoing costs of investing in other funds.
The Example is based on an investment of $1,000 invested at the beginning of the respective period and held for the entire respective period to April 30, 2023 for each Fund.
Actual Expenses
The following table provides information about actual account values and actual expenses. You may use the information in this table, together with the amount you invested, to estimate the expenses you paid over the period. Simply divide your account value by $1,000 (for example, an $8,600 account value divided by $1,000 equals 8.6), then multiply the result by the number in the applicable line under the heading titled “Expenses Paid During the Period” to estimate the expenses you paid on your account during the period.
| | | | | | | | | | | Expenses Paid | | |
| | | Beginning | | | Ending | | | During the | | |
| | | Account Value | | | Account Value | | | Period | | |
Innovator U.S. Equity Buffer ETF - January (NAV) | | $ | 1,000.00 | | | $ | 1,077.20 | | | $ | 4.07 | | (a) |
Innovator U.S. Equity Buffer ETF - February (NAV) | | | 1,000.00 | | | | 1,095.20 | | | | 4.10 | | (a) |
Innovator U.S. Equity Buffer ETF - March (NAV) | | | 1,000.00 | | | | 1,103.80 | | | | 4.12 | | (a) |
Innovator U.S. Equity Buffer ETF - April (NAV) | | | 1,000.00 | | | | 1,102.60 | | | | 4.12 | | (a) |
Innovator U.S. Equity Buffer ETF - May (NAV) | | | 1,000.00 | | | | 1,039.00 | | | | 3.99 | | (a) |
Innovator U.S. Equity Buffer ETF - June (NAV) | | | 1,000.00 | | | | 1,052.10 | | | | 4.02 | | (a) |
Innovator U.S. Equity Buffer ETF - July (NAV) | | | 1,000.00 | | | | 1,074.20 | | | | 4.06 | | (a) |
Innovator U.S. Equity Buffer ETF - August (NAV) | | | 1,000.00 | | | | 1,062.20 | | | | 4.04 | | (a) |
Innovator U.S. Equity Buffer ETF - September (NAV) | | | 1,000.00 | | | | 1,071.50 | | | | 4.06 | | (a) |
Innovator U.S. Equity Buffer ETF - October (NAV) | | | 1,000.00 | | | | 1,092.70 | | | | 4.10 | | (a) |
Innovator U.S. Equity Buffer ETF - November (NAV) | | | 1,000.00 | | | | 1,076.70 | | | | 4.07 | | (a) |
Innovator U.S. Equity Buffer ETF - December (NAV) | | | 1,000.00 | | | | 1,082.00 | | | | 4.08 | | (a) |
Innovator U.S. Equity Power Buffer ETF - January (NAV) | | | 1,000.00 | | | | 1,080.40 | | | | 4.08 | | (a) |
Innovator U.S. Equity Power Buffer ETF - February (NAV) | | | 1,000.00 | | | | 1,063.20 | | | | 4.04 | | (a) |
Innovator U.S. Equity Power Buffer ETF - March (NAV) | | | 1,000.00 | | | | 1,070.60 | | | | 4.06 | | (a) |
Innovator U.S. Equity Power Buffer ETF - April (NAV) | | | 1,000.00 | | | | 1,070.30 | | | | 4.06 | | (a) |
Innovator U.S. Equity Power Buffer ETF - May (NAV) | | | 1,000.00 | | | | 1,024.60 | | | | 3.97 | | (a) |
Innovator U.S. Equity Power Buffer ETF - June (NAV) | | | 1,000.00 | | | | 1,039.40 | | | | 3.99 | | (a) |
Innovator U.S. Equity Power Buffer ETF - July (NAV) | | | 1,000.00 | | | | 1,074.90 | | | | 4.06 | | (a) |
Innovator U.S. Equity Power Buffer ETF - August (NAV) | | | 1,000.00 | | | | 1,054.20 | | | | 4.02 | | (a) |
Innovator U.S. Equity Power Buffer ETF - September (NAV) �� | | | 1,000.00 | | | | 1,067.20 | | | | 4.05 | | (a) |
Innovator U.S. Equity Power Buffer ETF - October (NAV) | | | 1,000.00 | | | | 1,081.60 | | | | 4.08 | | (a) |
Innovator U.S. Equity Power Buffer ETF - November (NAV) | | | 1,000.00 | | | | 1,074.30 | | | | 4.06 | | (a) |
Innovator U.S. Equity Power Buffer ETF - December (NAV) | | | 1,000.00 | | | | 1,057.80 | | | | 4.03 | | (a) |
Innovator U.S. Equity Ultra Buffer ETF - January (NAV) | | | 1,000.00 | | | | 1,066.60 | | | | 4.05 | | (a) |
Innovator U.S. Equity Ultra Buffer ETF - February (NAV) | | | 1,000.00 | | | | 1,018.40 | | | | 3.95 | | (a) |
Innovator U.S. Equity Ultra Buffer ETF - March (NAV) | | | 1,000.00 | | | | 1,024.40 | | | | 3.97 | | (a) |
Innovator U.S. Equity Ultra Buffer ETF - April (NAV) | | | 1,000.00 | | | | 1,015.40 | | | | 3.95 | | (a) |
Innovator U.S. Equity Ultra Buffer ETF - May (NAV) | | | 1,000.00 | | | | 1,028.50 | | | | 3.97 | | (a) |
Innovator U.S. Equity Ultra Buffer ETF - June (NAV) | | | 1,000.00 | | | | 1,034.60 | | | | 3.99 | | (a) |
Innovator U.S. Equity Ultra Buffer ETF - July (NAV) | | | 1,000.00 | | | | 1,073.90 | | | | 4.06 | | (a) |
Innovator U.S. Equity Ultra Buffer ETF - August (NAV) | | | 1,000.00 | | | | 1,044.30 | | | | 4.00 | | (a) |
Expense Example
For the Period Ended April 30, 2023 (Unaudited) (Continued)
| | | | | | | | | | | Expenses Paid | | |
| | | Beginning | | | Ending | | | During the | | |
| | | Account Value | | | Account Value | | | Period | | |
Innovator U.S. Equity Ultra Buffer ETF - September (NAV) | | | 1,000.00 | | | | 1,061.00 | | | | 4.04 | | (a) |
Innovator U.S. Equity Ultra Buffer ETF - October (NAV) | | | 1,000.00 | | | | 1,073.50 | | | | 4.06 | | (a) |
Innovator U.S. Equity Ultra Buffer ETF - November (NAV) | | | 1,000.00 | | | | 1,064.90 | | | | 4.04 | | (a) |
Innovator U.S. Equity Ultra Buffer ETF - December (NAV) | | | 1,000.00 | | | | 1,028.10 | | | | 3.97 | | (a) |
Innovator Premium Income 10 Barrier ETF - April (NAV) | | | 1,000.00 | | | | 1,009.40 | | | | 0.61 | | (b) |
Innovator Premium Income 20 Barrier ETF - April (NAV) | | | 1,000.00 | | | | 1,006.90 | | | | 0.61 | | (b) |
Innovator Premium Income 30 Barrier ETF - April (NAV) | | | 1,000.00 | | | | 1,005.10 | | | | 0.61 | | (b) |
Innovator Premium Income 40 Barrier ETF - April (NAV) | | | 1,000.00 | | | | 1,004.00 | | | | 0.61 | | (b) |
(a) | Expenses are equal to the Fund’s annualized expense ratio (0.79%), multiplied by the average account value over the period, multiplied by 181/365 (to reflect the six month period). |
(b) | Expenses are equal to the Fund’s annualized expense ratio (0.79%), multiplied by the average account value over the period, multiplied by 28/365 (to reflect the period since the Fund's inception). |
Hypothetical Example for Comparison Purposes
The following table provides information about hypothetical account values and hypothetical expenses based on the Funds’ actual expense ratios and an assumed rate of return of 5% per year before expenses, which are not the Funds’ actual returns. The hypothetical account values and expenses may not be used to estimate the actual ending account balance or expenses you paid for the period. You may use this information to compare the ongoing costs of investing in the Funds with other funds. To do so, compare this 5% hypothetical example with the 5% hypothetical examples that appear in the shareholder reports of other funds.
Please note that the expenses shown in the table are meant to highlight your ongoing costs only and do not reflect any transactional costs, such as brokerage commissions on the purchase and sale of Fund shares with respect to the Funds. Therefore, the table below is useful in comparing the ongoing costs only, and will not help you determine the relative total costs of owning different funds. In addition, if these transactional costs were included, your costs could have been higher.
Expense Example
For the Period Ended April 30, 2023 (Unaudited) (Continued)
| | | | | | | | | | | Expenses Paid | | |
| | | Beginning | | | Ending | | | During the | | |
| | | Account Value | | | Account Value | | | Period | | |
Innovator U.S. Equity Buffer ETF - January (NAV) | | $ | 1,000.00 | | | $ | 1,020.88 | | | $ | 3.96 | | (a) |
Innovator U.S. Equity Buffer ETF - February (NAV) | | | 1,000.00 | | | | 1,020.88 | | | | 3.96 | | (a) |
Innovator U.S. Equity Buffer ETF - March (NAV) | | | 1,000.00 | | | | 1,020.88 | | | | 3.96 | | (a) |
Innovator U.S. Equity Buffer ETF - April (NAV) | | | 1,000.00 | | | | 1,020.88 | | | | 3.96 | | (a) |
Innovator U.S. Equity Buffer ETF - May (NAV) | | | 1,000.00 | | | | 1,020.88 | | | | 3.96 | | (a) |
Innovator U.S. Equity Buffer ETF - June (NAV) | | | 1,000.00 | | | | 1,020.88 | | | | 3.96 | | (a) |
Innovator U.S. Equity Buffer ETF - July (NAV) | | | 1,000.00 | | | | 1,020.88 | | | | 3.96 | | (a) |
Innovator U.S. Equity Buffer ETF - August (NAV) | | | 1,000.00 | | | | 1,020.88 | | | | 3.96 | | (a) |
Innovator U.S. Equity Buffer ETF - September (NAV) | | | 1,000.00 | | | | 1,020.88 | | | | 3.96 | | (a) |
Innovator U.S. Equity Buffer ETF - October (NAV) | | | 1,000.00 | | | | 1,020.88 | | | | 3.96 | | (a) |
Innovator U.S. Equity Buffer ETF - November (NAV) | | | 1,000.00 | | | | 1,020.88 | | | | 3.96 | | (a) |
Innovator U.S. Equity Buffer ETF - December (NAV) | | | 1,000.00 | | | | 1,020.88 | | | | 3.96 | | (a) |
Innovator U.S. Equity Power Buffer ETF - January (NAV) | | | 1,000.00 | | | | 1,020.88 | | | | 3.96 | | (a) |
Innovator U.S. Equity Power Buffer ETF - February (NAV) | | | 1,000.00 | | | | 1,020.88 | | | | 3.96 | | (a) |
Innovator U.S. Equity Power Buffer ETF - March (NAV) | | | 1,000.00 | | | | 1,020.88 | | | | 3.96 | | (a) |
Innovator U.S. Equity Power Buffer ETF - April (NAV) | | | 1,000.00 | | | | 1,020.88 | | | | 3.96 | | (a) |
Innovator U.S. Equity Power Buffer ETF - May (NAV) | | | 1,000.00 | | | | 1,020.88 | | | | 3.96 | | (a) |
Innovator U.S. Equity Power Buffer ETF - June (NAV) | | | 1,000.00 | | | | 1,020.88 | | | | 3.96 | | (a) |
Innovator U.S. Equity Power Buffer ETF - July (NAV) | | | 1,000.00 | | | | 1,020.88 | | | | 3.96 | | (a) |
Innovator U.S. Equity Power Buffer ETF - August (NAV) | | | 1,000.00 | | | | 1,020.88 | | | | 3.96 | | (a) |
Innovator U.S. Equity Power Buffer ETF - September (NAV) | | | 1,000.00 | | | | 1,020.88 | | | | 3.96 | | (a) |
Innovator U.S. Equity Power Buffer ETF - October (NAV) | | | 1,000.00 | | | | 1,020.88 | | | | 3.96 | | (a) |
Innovator U.S. Equity Power Buffer ETF - November (NAV) | | | 1,000.00 | | | | 1,020.88 | | | | 3.96 | | (a) |
Innovator U.S. Equity Power Buffer ETF - December (NAV) | | | 1,000.00 | | | | 1,020.88 | | | | 3.96 | | (a) |
Innovator U.S. Equity Ultra Buffer ETF - January (NAV) | | | 1,000.00 | | | | 1,020.88 | | | | 3.96 | | (a) |
Innovator U.S. Equity Ultra Buffer ETF - February (NAV) | | | 1,000.00 | | | | 1,020.88 | | | | 3.96 | | (a) |
Innovator U.S. Equity Ultra Buffer ETF - March (NAV) | | | 1,000.00 | | | | 1,020.88 | | | | 3.96 | | (a) |
Innovator U.S. Equity Ultra Buffer ETF - April (NAV) | | | 1,000.00 | | | | 1,020.88 | | | | 3.96 | | (a) |
Innovator U.S. Equity Ultra Buffer ETF - May (NAV) | | | 1,000.00 | | | | 1,020.88 | | | | 3.96 | | (a) |
Innovator U.S. Equity Ultra Buffer ETF - June (NAV) | | | 1,000.00 | | | | 1,020.88 | | | | 3.96 | | (a) |
Innovator U.S. Equity Ultra Buffer ETF - July (NAV) | | | 1,000.00 | | | | 1,020.88 | | | | 3.96 | | (a) |
Innovator U.S. Equity Ultra Buffer ETF - August (NAV) | | | 1,000.00 | | | | 1,020.88 | | | | 3.96 | | (a) |
Innovator U.S. Equity Ultra Buffer ETF - September (NAV) | | | 1,000.00 | | | | 1,020.88 | | | | 3.96 | | (a) |
Innovator U.S. Equity Ultra Buffer ETF - October (NAV) | | | 1,000.00 | | | | 1,020.88 | | | | 3.96 | | (a) |
Innovator U.S. Equity Ultra Buffer ETF - November (NAV) | | | 1,000.00 | | | | 1,020.88 | | | | 3.96 | | (a) |
Innovator U.S. Equity Ultra Buffer ETF - December (NAV) | | | 1,000.00 | | | | 1,020.88 | | | | 3.96 | | (a) |
Innovator Premium Income 10 Barrier ETF - April (NAV) | | | 1,000.00 | | | | 1,020.88 | | | | 3.96 | | (b) |
Innovator Premium Income 20 Barrier ETF - April (NAV) | | | 1,000.00 | | | | 1,020.88 | | | | 3.96 | | (b) |
Innovator Premium Income 30 Barrier ETF - April (NAV) | | | 1,000.00 | | | | 1,020.88 | | | | 3.96 | | (b) |
Innovator Premium Income 40 Barrier ETF - April (NAV) | | | 1,000.00 | | | | 1,020.88 | | | | 3.96 | | (b) |
(a) | Expenses are equal to the Fund’s annualized expense ratio (0.79%), multiplied by the average account value over the period, multiplied by 181/365 (to reflect the six month period). |
(b) | For comparative purposes only as the Fund was not in operation for the full six month period. |
INNOVATOR U.S. EQUITY BUFFER ETF – JANUARY
Schedule of Investments
April 30, 2023 (Unaudited)
| | | Contracts | | | Notional Amount | | | Value | |
PURCHASED OPTIONS - 102.18% (a)(b) | | | | | | | | | | | | |
CALL OPTIONS - 99.27% | | | | | | | | | | | | |
SPY SPDR S&P 500® Trust ETF, Expires 12/29/2023, Strike Price $3.84 | | | 4,394 | | | $ | 182,759,642 | | | $ | 179,130,286 | |
| | | | | | | | | | | | 179,130,286 | |
PUT OPTIONS - 2.91% | | | | | | | | | | | | |
SPY SPDR S&P 500® Trust ETF, Expires 12/29/2023, Strike Price $382.44 | | | 4,394 | | | | 182,759,642 | | | | 5,252,939 | |
| | | | | | | | | | | | 5,252,939 | |
TOTAL PURCHASED OPTIONS (Cost $176,688,235) | | | | | | | | | | | 184,383,225 | |
| | | Principal Amount | | | | | | | | | |
SHORT TERM INVESTMENTS - 0.26% | | | | | | | | | | | | |
Money Market Deposit Account - 0.26% | | | | | | | | | | | | |
U.S. Bank Money Market Deposit Account, 4.650% (c) | | $ | 467,208 | | | | | | | | 467,208 | |
TOTAL SHORT TERM INVESTMENTS (Cost $467,208) | | | | | | | | | | | 467,208 | |
| | | | | | | | | | | | | |
Total Investments (Cost $177,155,443) - 102.44% | | | | | | | | | | | 184,850,433 | |
Liabilities in Excess of Other Assets - (2.44)% | | | | | | | | | | | (4,404,832 | ) |
TOTAL NET ASSETS - 100.00% | | | | | | | | | | $ | 180,445,601 | |
Asset Type | | % of Net Assets | |
Purchased Options | | | 102.18 | % |
Short Term Investments | | | 0.26 | |
Total Investments | | | 102.44 | |
Liabilities in Excess of Other Assets | | | (2.44 | ) |
Net Assets | | | 100.00 | % |
| | | | | |
Percentages are stated as a percent of net assets | | | | |
(a) | Exchange-Traded. |
(b) | Purchased option contracts are held in connection with corresponding option contracts written short. |
(c) | The U.S. Bank Money Market Deposit Account (the “MMDA”) is a short-term investment vehicle in which the Fund holds cash balances. The MMDA will bear interest at a variable rate that is determined based on conditions and may change daily and by any amount. The rate shown is as of April 30, 2023. |
The accompanying notes are an integral part of these financial statements.
INNOVATOR U.S. EQUITY BUFFER ETF – JANUARY
Schedule of Options Written (a) |
April 30, 2023 (Unaudited) (Continued) |
Description | | Expiration | | | Strike Price | | | Contracts | | | Notional Amount | | | Value | |
Call Options | | | | | | | | | | | | | | | | | | | | |
SPY SPDR S&P 500® Trust ETF | | 12/29/2023 | | | $ | 478.31 | | | | 4,394 | | | $ | (182,759,642 | ) | | $ | (1,283,883 | ) |
| | | | | | | | | | | | | | | | | | | | (1,283,883 | ) |
Put Options | | | | | | | | | | | | | | | | | | | | |
SPY SPDR S&P 500® Trust ETF | | 12/29/2023 | | | | 348.01 | | | | 4,394 | | | | (182,759,642 | ) | | | (3,007,605 | ) |
| | | | | | | | | | | | | | | | | | | | (3,007,605 | ) |
Total Options Written (Premiums Received $9,707,216) | | | | | | | | | | | | | | | $ | (4,291,488 | ) |
The accompanying notes are an integral part of these financial statements.
INNOVATOR U.S. EQUITY BUFFER ETF – FEBRUARY
Schedule of Investments | | | | |
April 30, 2023 (Unaudited) | | | | |
| | | Contracts | | | Notional Amount | | | Value | |
PURCHASED OPTIONS - 103.09% (a)(b) | | | | | | | | | | | | |
CALL OPTIONS - 98.63% | | | | | | | | | | | | |
SPY SPDR S&P 500® Trust ETF, Expires 1/31/2024, Strike Price $4.08 | | | 2,925 | | | $ | 121,659,525 | | | $ | 119,171,783 | |
| | | | | | | | | | | | 119,171,783 | |
PUT OPTIONS - 4.46% | | | | | | | | | | | | |
SPY SPDR S&P 500® Trust ETF, Expires 1/31/2024, Strike Price $406.49 | | | 2,925 | | | | 121,659,525 | | | | 5,391,243 | |
| | | | | | | | | | | | 5,391,243 | |
TOTAL PURCHASED OPTIONS (Cost $123,265,128) | | | | | | | | | | | 124,563,026 | |
| | | Principal Amount | | | | | | | | | |
SHORT TERM INVESTMENTS - 0.27% | | | | | | | | | | | | |
Money Market Deposit Account - 0.27% | | | | | | | | | | | | |
U.S. Bank Money Market Deposit Account, 4.650% (c) | | $ | 331,201 | | | | | | | | 331,201 | |
TOTAL SHORT TERM INVESTMENTS (Cost $331,201) | | | | | | | | | | | 331,201 | |
| | | | | | | | | | | | | |
Total Investments (Cost $123,596,329) - 103.36% | | | | | | | | | | | 124,894,227 | |
Liabilities in Excess of Other Assets - (3.36)% | | | | | | | | | | | (4,071,218 | ) |
TOTAL NET ASSETS - 100.00% | | | | | | | | | | $ | 120,823,009 | |
Asset Type | | % of Net Assets | |
Purchased Options | | | 103.09 | % |
Short Term Investments | | | 0.27 | |
Total Investments | | | 103.36 | |
Liabilities in Excess of Other Assets | | | (3.36 | ) |
Net Assets | | | 100.00 | % |
| | | | | |
Percentages are stated as a percent of net assets | | | | |
(a) | Exchange-Traded. |
(b) | Purchased option contracts are held in connection with corresponding option contracts written short. |
(c) | The U.S. Bank Money Market Deposit Account (the “MMDA”) is a short-term investment vehicle in which the Fund holds cash balances. The MMDA will bear interest at a variable rate that is determined based on conditions and may change daily and by any amount. The rate shown is as of April 30, 2023. |
The accompanying notes are an integral part of these financial statements.
INNOVATOR U.S. EQUITY BUFFER ETF – FEBRUARY
Schedule of Options Written (a) | | | |
April 30, 2023 (Unaudited) (Continued) | | | |
Description | | Expiration | | | Strike Price | | | Contracts | | | Notional Amount | | | Value | |
Call Options | | | | | | | | | | | | | | | | | | | | |
SPY SPDR S&P 500® Trust ETF | | 1/31/2024 | | | $ | 485.66 | | | | 2,925 | | | $ | (121,659,525 | ) | | $ | (859,131 | ) |
| | | | | | | | | | | | | | | | | | | | (859,131 | ) |
Put Options | | | | | | | | | | | | | | | | | | | | |
SPY SPDR S&P 500® Trust ETF | | 1/31/2024 | | | | 369.90 | | | | 2,925 | | | | (121,659,525 | ) | | | (3,134,957 | ) |
| | | | | | | | | | | | | | | | | | | | (3,134,957 | ) |
Total Options Written (Premiums Received $5,560,940) | | | | | | | | | | | | | | | $ | (3,994,088 | ) |
The accompanying notes are an integral part of these financial statements.
INNOVATOR U.S. EQUITY BUFFER ETF – MARCH
Schedule of Investments |
April 30, 2023 (Unaudited) |
| | | Contracts | | | Notional Amount | | | Value | |
PURCHASED OPTIONS - 103.47% (a)(b) | | | | | | | | | | | | |
CALL OPTIONS - 99.36% | | | | | | | | | | | | |
SPY SPDR S&P 500® Trust ETF, Expires 2/29/2024, Strike Price $3.97 | | | 2,469 | | | $ | 102,693,117 | | | $ | 100,687,598 | |
| | | | | | | | | | | | 100,687,598 | |
PUT OPTIONS - 4.11% | | | | | | | | | | | | |
SPY SPDR S&P 500® Trust ETF, Expires 2/29/2024, Strike Price $396.27 | | | 2,469 | | | | 102,693,117 | | | | 4,161,993 | |
| | | | | | | | | | | | 4,161,993 | |
TOTAL PURCHASED OPTIONS (Cost $101,655,828) | | | | | | | | | | | 104,849,591 | |
| | | Principal Amount | | | | | | | | | |
SHORT TERM INVESTMENTS - 0.27% | | | | | | | | | | | | |
Money Market Deposit Account - 0.27% | | | | | | | | | | | | |
U.S. Bank Money Market Deposit Account, 4.650% (c) | | $ | 268,747 | | | | | | | | 268,747 | |
TOTAL SHORT TERM INVESTMENTS (Cost $268,747) | | | | | | | | | | | 268,747 | |
| | | | | | | | | | | | | |
Total Investments (Cost $101,924,575) - 103.74% | | | | | | | | | | | 105,118,338 | |
Liabilities in Excess of Other Assets - (3.74)% | | | | | | | | | | | (3,788,433 | ) |
TOTAL NET ASSETS - 100.00% | | | | | | | | | | $ | 101,329,905 | |
Asset Type | | % of Net Assets | |
Purchased Options | | | 103.47 | % |
Short Term Investments�� | | | 0.27 | |
Total Investments | | | 103.74 | |
Liabilities in Excess of Other Assets | | | (3.74 | ) |
Net Assets | | | 100.00 | % |
| | | | | |
Percentages are stated as a percent of net assets. | | | | |
(a) | Exchange-Traded. |
(b) | Purchased option contracts are held in connection with corresponding option contracts written short. |
(c) | The U.S. Bank Money Market Deposit Account (the “MMDA”) is a short-term investment vehicle in which the Fund holds cash balances. The MMDA will bear interest at a variable rate that is determined based on conditions and may change daily and by any amount. The rate shown is as of April 30, 2023. |
The accompanying notes are an integral part of these financial statements.
INNOVATOR U.S. EQUITY BUFFER ETF – MARCH
Schedule of Options Written (a) | | | |
April 30, 2023 (Unaudited) (Continued) | | | |
Description | | Expiration | | | Strike Price | | | Contracts | | | Notional Amount | | | Value | |
Call Options | | | | | | | | | | | | | | | | | | | | |
SPY SPDR S&P 500® Trust ETF | | 2/29/2024 | | | $ | 480.47 | | | | 2,469 | | | $ | (102,693,117 | ) | | $ | (1,223,834 | ) |
| | | | | | | | | | | | | | | | | | | | (1,223,834 | ) |
Put Options | | | | | | | | | | | | | | | | | | | | |
SPY SPDR S&P 500® Trust ETF | | 2/29/2024 | | | | 360.60 | | | | 2,469 | | | | (102,693,117 | ) | | | (2,499,591 | ) |
| | | | | | | | | | | | | | | | | | | | (2,499,591 | ) |
Total Options Written (Premiums Received $4,507,041) | | | | | | | | | | | | | | | $ | (3,723,425 | ) |
The accompanying notes are an integral part of these financial statements.
INNOVATOR U.S. EQUITY BUFFER ETF – APRIL
Schedule of Investments | | | | | |
April 30, 2023 (Unaudited) | | | | | |
| | | Contracts | | | Notional Amount | | | Value | |
PURCHASED OPTIONS - 103.92% (a)(b) | | | | | | | | | | | | |
CALL OPTIONS - 98.65% | | | | | | | | | | | | |
SPY SPDR S&P 500® Trust ETF, Expires 3/28/2024, Strike Price $4.11 | | | 4,002 | | | $ | 166,455,186 | | | $ | 162,617,108 | |
| | | | | | | | | | | | 162,617,108 | |
PUT OPTIONS - 5.27% | | | | | | | | | | | | |
SPY SPDR S&P 500® Trust ETF, Expires 3/28/2024, Strike Price $409.40 | | | 4,002 | | | | 166,455,186 | | | | 8,684,980 | |
| | | | | | | | | | | | 8,684,980 | |
TOTAL PURCHASED OPTIONS (Cost $170,019,605) | | | | | | | | | | | 171,302,088 | |
| | | Principal Amount | | | | | | | | | |
SHORT TERM INVESTMENTS - 0.26% | | | | | | | | | | | | |
Money Market Deposit Account - 0.26% | | | | | | | | | | | | |
U.S. Bank Money Market Deposit Account, 4.650% (c) | | $ | 420,721 | | | | | | | | 420,721 | |
TOTAL SHORT TERM INVESTMENTS (Cost $420,721) | | | | | | | | | | | 420,721 | |
| | | | | | | | | | | | | |
Total Investments (Cost $170,440,326) - 104.18% | | | | | | | | | | | 171,722,809 | |
Liabilities in Excess of Other Assets - (4.18)% | | | | | | | | | | | (6,879,622 | ) |
TOTAL NET ASSETS - 100.00% | | | | | | | | | | $ | 164,843,187 | |
Asset Type | | % of Net Assets | |
Purchased Options | | | 103.92 | % |
Short Term Investments | | | 0.26 | |
Total Investments | | | 104.18 | |
Liabilities in Excess of Other Assets | | | (4.18 | ) |
Net Assets | | | 100.00 | % |
| | | | | |
Percentages are stated as a percent of net assets. | | | | |
(a) | Exchange-Traded. |
(b) | Purchased option contracts are held in connection with corresponding option contracts written short. |
(c) | The U.S. Bank Money Market Deposit Account (the “MMDA”) is a short-term investment vehicle in which the Fund holds cash balances. The MMDA will bear interest at a variable rate that is determined based on conditions and may change daily and by any amount. The rate shown is as of April 30, 2023. |
The accompanying notes are an integral part of these financial statements.
INNOVATOR U.S. EQUITY BUFFER ETF – APRIL
Schedule of Options Written (a) | | | |
April 30, 2023 (Unaudited) (Continued) | | | |
Description | | Expiration | | | Strike Price | | | Contracts | | | Notional Amount | | | Value | |
Call Options | | | | | | | | | | | | | | | | | | | | |
SPY SPDR S&P 500® Trust ETF | | 3/28/2024 | | | $ | 491.84 | | | | 4,002 | | | $ | (166,455,186 | ) | | $ | (1,496,548 | ) |
| | | | | | | | | | | | | | | | | | | | (1,496,548 | ) |
Put Options | | | | | | | | | | | | | | | | | | | | |
SPY SPDR S&P 500® Trust ETF | | 3/28/2024 | | | | 372.54 | | | | 4,002 | | | | (166,455,186 | ) | | | (5,288,603 | ) |
| | | | | | | | | | | | | | | | | | | | (5,288,603 | ) |
Total Options Written (Premiums Received $7,850,036) | | | | | | | | | | | | | | | $ | (6,785,151 | ) |
The accompanying notes are an integral part of these financial statements.
INNOVATOR U.S. EQUITY BUFFER ETF – MAY
Schedule of Investments |
April 30, 2023 (Unaudited) |
| | | Contracts | | | Notional Amount | | | Value | |
PURCHASED OPTIONS - 104.50% (a)(b) | | | | | | | | | | | | |
CALL OPTIONS - 98.48% | | | | | | | | | | | | |
SPY SPDR S&P 500® Trust ETF, Expires 4/30/2024, Strike Price $4.17 | | | 2,964 | | | $ | 123,281,652 | | | $ | 120,415,464 | |
| | | | | | | | | | | | 120,415,464 | |
PUT OPTIONS - 6.02% | | | | | | | | | | | | |
SPY SPDR S&P 500® Trust ETF, Expires 4/30/2024, Strike Price $415.94 | | | 2,964 | | | | 123,281,652 | | | | 7,365,540 | |
| | | | | | | | | | | | 7,365,540 | |
TOTAL PURCHASED OPTIONS (Cost $127,793,735) | | | | | | | | | | | 127,781,004 | |
| | | Principal Amount | | | | | | | | | |
SHORT TERM INVESTMENTS - 0.28% | | | | | | | | | | | | |
Money Market Deposit Account - 0.28% | | | | | | | | | | | | |
U.S. Bank Money Market Deposit Account, 4.650% (c) | | $ | 340,480 | | | | | | | | 340,480 | |
TOTAL SHORT TERM INVESTMENTS (Cost $340,480) | | | | | | | | | | | 340,480 | |
| | | | | | | | | | | | | |
Total Investments (Cost $128,134,215) - 104.78% | | | | | | | | | | | 128,121,484 | |
Liabilities in Excess of Other Assets - (4.78)% | | | | | | | | | | | (5,842,415 | ) |
TOTAL NET ASSETS - 100.00% | | | | | | | | | | $ | 122,279,069 | |
Asset Type | | % of Net Assets | |
Purchased Options | | | 104.50 | % |
Short Term Investments | | | 0.28 | |
Total Investments | | | 104.78 | |
Liabilities in Excess of Other Assets | | | (4.78 | ) |
Net Assets | | | 100.00 | % |
| | | | | |
Percentages are stated as a percent of net assets. | | | | |
(a) | Exchange-Traded. |
(b) | Purchased option contracts are held in connection with corresponding option contracts written short. |
(c) | The U.S. Bank Money Market Deposit Account (the “MMDA”) is a short-term investment vehicle in which the Fund holds cash balances. The MMDA will bear interest at a variable rate that is determined based on conditions and may change daily and by any amount. The rate shown is as of April 30, 2023. |
The accompanying notes are an integral part of these financial statements.
INNOVATOR U.S. EQUITY BUFFER ETF – MAY
Schedule of Options Written (a) | | | |
April 30, 2023 (Unaudited) (Continued) | | | |
Description | | Expiration | | | Strike Price | | | Contracts | | | Notional Amount | | | Value | |
Call Options | | | | | | | | | | | | | | | | | | | | |
SPY SPDR S&P 500® Trust ETF | | 4/30/2024 | | | $ | 496.87 | | | | 2,964 | | | $ | (123,281,652 | ) | | $ | (1,158,924 | ) |
| | | | | | | | | | | | | | | | | | | | (1,158,924 | ) |
Put Options | | | | | | | | | | | | | | | | | | | | |
SPY SPDR S&P 500® Trust ETF | | 4/30/2024 | | | | 378.50 | | | | 2,964 | | | | (123,281,652 | ) | | | (4,576,416 | ) |
| | | | | | | | | | | | | | | | | | | | (4,576,416 | ) |
Total Options Written (Premiums Received $5,722,563) | | | | | | | | | | | | | | | $ | (5,735,340 | ) |
The accompanying notes are an integral part of these financial statements.
INNOVATOR U.S. EQUITY BUFFER ETF – JUNE
Schedule of Investments | | | | |
April 30, 2023 (Unaudited) | | | | |
| | | Contracts | | | Notional Amount | | | Value | |
PURCHASED OPTIONS - 99.94% (a)(b) | | | | | | | | | | | | |
CALL OPTIONS - 98.80% | | | | | | | | | | | | |
SPY SPDR S&P 500® Trust ETF, Expires 5/31/2023, Strike Price $4.14 | | | 3,457 | | | $ | 143,787,001 | | | $ | 142,293,577 | |
| | | | | | | | | | | | 142,293,577 | |
PUT OPTIONS - 1.14% | | | | | | | | | | | | |
SPY SPDR S&P 500® Trust ETF, Expires 5/31/2023, Strike Price $412.94 | | | 3,457 | | | | 143,787,001 | | | | 1,645,532 | |
| | | | | | | | | | | | 1,645,532 | |
TOTAL PURCHASED OPTIONS (Cost $148,536,392) | | | | | | | | | | | 143,939,109 | |
| | | Principal Amount | | | | | | | | | |
SHORT TERM INVESTMENTS - 0.23% | | | | | | | | | | | | |
Money Market Deposit Account - 0.23% | | | | | | | | | | | | |
U.S. Bank Money Market Deposit Account, 4.650% (c) | | $ | 324,697 | | | | | | | | 324,697 | |
TOTAL SHORT TERM INVESTMENTS (Cost $324,697) | | | | | | | | | | | 324,697 | |
| | | | | | | | | | | | | |
Total Investments (Cost $148,861,089) - 100.17% | | | | | | | | | | | 144,263,806 | |
Liabilities in Excess of Other Assets - (0.17)% | | | | | | | | | | | (246,167 | ) |
TOTAL NET ASSETS - 100.00% | | | | | | | | | | $ | 144,017,639 | |
Asset Type | | % of Net Assets | |
Purchased Options | | | 99.94 | % |
Short Term Investments | | | 0.23 | |
Total Investments | | | 100.17 | |
Liabilities in Excess of Other Assets | | | (0.17 | ) |
Net Assets | | | 100.00 | % |
| | | | | |
Percentages are stated as a percent of net assets | | | | |
(a) | Exchange-Traded. |
(b) | Purchased option contracts are held in connection with corresponding option contracts written short. |
(c) | The U.S. Bank Money Market Deposit Account (the “MMDA”) is a short-term investment vehicle in which the Fund holds cash balances. The MMDA will bear interest at a variable rate that is determined based on conditions and may change daily and by any amount. The rate shown is as of April 30, 2023. |
The accompanying notes are an integral part of these financial statements.
INNOVATOR U.S. EQUITY BUFFER ETF – JUNE
Schedule of Options Written (a) | | | |
April 30, 2023 (Unaudited) (Continued) | | | |
Description | | Expiration | | | Strike Price | | | Contracts | | | Notional Amount | | | Value | |
Call Options | | $ | 4 | | | | | | | | | | | | | | | | | |
SPY SPDR S&P 500® Trust ETF | | 5/31/2023 | | | $ | 494.28 | | | | 3,457 | | | $ | (143,787,001 | ) | | $ | (17,285 | ) |
| | | | | | | | | | | | | | | | | | | | (17,285 | ) |
Put Options | | | | | | | | | | | | | | | | | | | | |
SPY SPDR S&P 500® Trust ETF | | 5/31/2023 | | | | 375.77 | | | | 3,457 | | | | (143,787,001 | ) | | | (221,248 | ) |
| | | | | | | | | | | | | | | | | | | | (221,248 | ) |
Total Options Written (Premiums Received $6,096,311) | | | | | | | | | | | | | | | $ | (238,533 | ) |
The accompanying notes are an integral part of these financial statements.
INNOVATOR U.S. EQUITY BUFFER ETF – JULY
Schedule of Investments |
April 30, 2023 (Unaudited) |
| | | Contracts | | | Notional Amount | | | Value | |
PURCHASED OPTIONS - 100.05% (a)(b) | | | | | | | | | | | | |
CALL OPTIONS - 99.49% | | | | | | | | | | | | |
SPY SPDR S&P 500® Trust ETF, Expires 6/30/2023, Strike Price $3.78 | | | 3,549 | | | $ | 147,613,557 | | | $ | 145,805,590 | |
| | | | | | | | | | | | 145,805,590 | |
PUT OPTIONS - 0.56% | | | | | | | | | | | | |
SPY SPDR S&P 500® Trust ETF, Expires 6/30/2023, Strike Price $377.26 | | | 3,549 | | | | 147,613,557 | | | | 819,109 | |
| | | | | | | | | | | | 819,109 | |
TOTAL PURCHASED OPTIONS (Cost $142,890,833) | | | | | | | | | | | 146,624,699 | |
| | | Principal Amount | | | | | | | | | |
SHORT TERM INVESTMENTS - 0.24% | | | | | | | | | | | | |
Money Market Deposit Account - 0.24% | | | | | | | | | | | | |
U.S. Bank Money Market Deposit Account, 4.650% (c) | | $ | 351,676 | | | | | | | | 351,676 | |
TOTAL SHORT TERM INVESTMENTS (Cost $351,676) | | | | | | | | | | | 351,676 | |
| | | | | | | | | | | | | |
Total Investments (Cost $143,242,509) - 100.29% | | | | | | | | | | | 146,976,375 | |
Liabilities in Excess of Other Assets - (0.29)% | | | | | | | | | | | (421,971 | ) |
TOTAL NET ASSETS - 100.00% | | | | | | | | | | $ | 146,554,404 | |
Asset Type | | % of Net Assets | |
Purchased Options | | | 100.05 | % |
Short Term Investments | | | 0.24 | |
Total Investments | | | 100.29 | |
Liabilities in Excess of Other Assets | | | (0.29 | ) |
Net Assets | | | 100.00 | % |
| | | | | |
Percentages are stated as a percent of net assets. | | | | |
(a) | Exchange-Traded. |
(b) | Purchased option contracts are held in connection with corresponding option contracts written short. |
(c) | The U.S. Bank Money Market Deposit Account (the “MMDA”) is a short-term investment vehicle in which the Fund holds cash balances. The MMDA will bear interest at a variable rate that is determined based on conditions and may change daily and by any amount. The rate shown is as of April 30, 2023. |
The accompanying notes are an integral part of these financial statements.
INNOVATOR U.S. EQUITY BUFFER ETF – JULY
Schedule of Options Written (a) | | | |
April 30, 2023 (Unaudited) (Continued) | | | |
Description | | Expiration | | | Strike Price | | | Contracts | | | Notional Amount | | | Value | |
Call Options | | | | | | | | | | | | | | | | | | | | |
SPY SPDR S&P 500® Trust ETF | | 6/30/2023 | | | $ | 466.66 | | | | 3,549 | | | $ | (147,613,557 | ) | | $ | (30,202 | ) |
| | | | | | | | | | | | | | | | | | | | (30,202 | ) |
Put Options | | | | | | | | | | | | | | | | | | | | |
SPY SPDR S&P 500® Trust ETF | | 6/30/2023 | | | | 343.30 | | | | 3,549 | | | | (147,613,557 | ) | | | (288,215 | ) |
| | | | | | | | | | | | | | | | | | | | (288,215 | ) |
Total Options Written (Premiums Received $8,026,768) | | | | | | | | | | | | | | | $ | (318,417 | ) |
The accompanying notes are an integral part of these financial statements.
INNOVATOR U.S. EQUITY BUFFER ETF – AUGUST
Schedule of Investments | | | | | |
April 30, 2023 (Unaudited) | | | | | |
| | | Contracts | | | Notional Amount | | | Value | |
PURCHASED OPTIONS - 100.71% (a)(b) | | | | | | | | | | | | |
CALL OPTIONS - 98.29% | | | | | | | | | | | | |
SPY SPDR S&P 500® Trust ETF, Expires 7/31/2023, Strike Price $4.13 | | | 2,976 | | | $ | 123,780,768 | | | $ | 122,155,098 | |
| | | | | | | | | | | | 122,155,098 | |
PUT OPTIONS - 2.42% | | | | | | | | | | | | |
SPY SPDR S&P 500® Trust ETF, Expires 7/31/2023, Strike Price $412.00 | | | 2,976 | | | | 123,780,768 | | | | 3,008,230 | |
| | | | | | | | | | | | 3,008,230 | |
TOTAL PURCHASED OPTIONS (Cost $128,442,463) | | | | | | | | | | | 125,163,328 | |
| | | Principal Amount | | | | | | | | | |
SHORT TERM INVESTMENTS - 0.25% | | | | | | | | | | | | |
Money Market Deposit Account - 0.25% | | | | | | | | | | | | |
U.S. Bank Money Market Deposit Account, 4.650% (c) | | $ | 316,283 | | | | | | | | 316,283 | |
TOTAL SHORT TERM INVESTMENTS (Cost $316,283) | | | | | | | | | | | 316,283 | |
| | | | | | | | | | | | | |
Total Investments (Cost $128,758,746) - 100.96% | | | | | | | | | | | 125,479,611 | |
Liabilities in Excess of Other Assets - (0.96)% | | | | | | | | | | | (1,200,062 | ) |
TOTAL NET ASSETS - 100.00% | | | | | | | | | | $ | 124,279,549 | |
Asset Type | | % of Net Assets | |
Purchased Options | | | 100.71 | % |
Short Term Investments | | | 0.25 | |
Total Investments | | | 100.96 | |
Liabilities in Excess of Other Assets | | | (0.96 | ) |
Net Assets | | | 100.00 | % |
| | | | | |
Percentages are stated as a percent of net assets. | | | | |
(a) | Exchange-Traded. |
(b) | Purchased option contracts are held in connection with corresponding option contracts written short. |
(c) | The U.S. Bank Money Market Deposit Account (the “MMDA”) is a short-term investment vehicle in which the Fund holds cash balances. The MMDA will bear interest at a variable rate that is determined based on conditions and may change daily and by any amount. The rate shown is as of April 30, 2023. |
The accompanying notes are an integral part of these financial statements.
INNOVATOR U.S. EQUITY BUFFER ETF – AUGUST
Schedule of Options Written (a) | | | |
April 30, 2023 (Unaudited) (Continued) | | | |
Description | | Expiration | | | Strike Price | | | Contracts | | | Notional Amount | | | Value | |
Call Options | | | | | | | | | | | | | | | | | | | | |
SPY SPDR S&P 500® Trust ETF | | 7/31/2023 | | | $ | 504.52 | | | | 2,976 | | | $ | (123,780,768 | ) | | $ | (10,207 | ) |
| | | | | | | | | | | | | | | | | | | | (10,207 | ) |
Put Options | | | | | | | | | | | | | | | | | | | | |
SPY SPDR S&P 500® Trust ETF | | 7/31/2023 | | | | 374.91 | | | | 2,976 | | | | (123,780,768 | ) | | | (1,114,156 | ) |
| | | | | | | | | | | | | | | | | | | | (1,114,156 | ) |
Total Options Written (Premiums Received $6,784,563) | | | | | | | | | | | | | | | $ | (1,124,363 | ) |
The accompanying notes are an integral part of these financial statements.
INNOVATOR U.S. EQUITY BUFFER ETF – SEPTEMBER
Schedule of Investments |
April 30, 2023 (Unaudited) |
| | | Contracts | | | Notional Amount | | | Value | |
PURCHASED OPTIONS - 100.74% (a)(b) | | | | | | | | | | | | |
CALL OPTIONS - 98.71% | | | | | | | | | | | | |
SPY SPDR S&P 500® Trust ETF, Expires 8/31/2023, Strike Price $3.96 | | | 4,105 | | | $ | 170,739,265 | | | $ | 168,415,834 | |
| | | | | | | | | | | | 168,415,834 | |
PUT OPTIONS - 2.03% | | | | | | | | | | | | |
SPY SPDR S&P 500® Trust ETF, Expires 8/31/2023, Strike Price $395.19 | | | 4,105 | | | | 170,739,265 | | | | 3,472,830 | |
| | | | | | | | | | | | 3,472,830 | |
TOTAL PURCHASED OPTIONS (Cost $171,501,741) | | | | | | | | | | | 171,888,664 | |
| | | Principal Amount | | | | | | | | | |
SHORT TERM INVESTMENTS - 0.22% | | | | | | | | | | | | |
Money Market Deposit Account - 0.22% | | | | | | | | | | | | |
U.S. Bank Money Market Deposit Account, 4.650% (c) | | $ | 381,861 | | | | | | | | 381,861 | |
TOTAL SHORT TERM INVESTMENTS (Cost $381,861) | | | | | | | | | | | 381,861 | |
| | | | | | | | | | | | | |
Total Investments (Cost $171,883,602) - 100.96% | | | | | | | | | | | 172,270,525 | |
Liabilities in Excess of Other Assets - (0.96)% | | | | | | | | | | | (1,658,905 | ) |
TOTAL NET ASSETS - 100.00% | | | | | | | | | | $ | 170,611,620 | |
Asset Type | | % of Net Assets | |
Purchased Options | | | 100.74 | % |
Short Term Investments | | | 0.22 | |
Total Investments | | | 100.96 | |
Liabilities in Excess of Other Assets | | | (0.96 | ) |
Net Assets | | | 100.00 | % |
| | | | | |
Percentages are stated as a percent of net assets. | | | | |
(a) | Exchange-Traded. |
(b) | Purchased option contracts are held in connection with corresponding option contracts written short. |
(c) | The U.S. Bank Money Market Deposit Account (the “MMDA”) is a short-term investment vehicle in which the Fund holds cash balances. The MMDA will bear interest at a variable rate that is determined based on conditions and may change daily and by any amount. The rate shown is as of April 30, 2023. |
The accompanying notes are an integral part of these financial statements.
INNOVATOR U.S. EQUITY BUFFER ETF – SEPTEMBER
Schedule of Options Written (a) | | | |
April 30, 2023 (Unaudited) (Continued) | | | |
Description | | Expiration | | | Strike Price | | | Contracts | | | Notional Amount | | | Value | |
Call Options | | | | | | | | | | | | | | | | | | | | |
SPY SPDR S&P 500® Trust ETF | | 8/31/2023 | | | $ | 490.38 | | | | 4,105 | | | $ | (170,739,265 | ) | | $ | (73,890 | ) |
| | | | | | | | | | | | | | | | | | | | (73,890 | ) |
Put Options | | | | | | | | | | | | | | | | | | | | |
SPY SPDR S&P 500® Trust ETF | | 8/31/2023 | | | | 359.61 | | | | 4,105 | | | | (170,739,265 | ) | | | (1,559,900 | ) |
| | | | | | | | | | | | | | | | | | | | (1,559,900 | ) |
Total Options Written (Premiums Received $10,639,704) | | | | | | | | | | | | | | | $ | (1,633,790 | ) |
The accompanying notes are an integral part of these financial statements.
INNOVATOR U.S. EQUITY BUFFER ETF – OCTOBER
Schedule of Investments |
April 30, 2023 (Unaudited) |
| | | Contracts | | | Notional Amount | | | Value | |
PURCHASED OPTIONS - 101.14% (a)(b) | | | | | | | | | | | | |
CALL OPTIONS - 99.96% | | | | | | | | | | | | |
SPY SPDR S&P 500® Trust ETF, Expires 9/29/2023, Strike Price $3.58 | | | 3,668 | | | $ | 152,563,124 | | | $ | 150,195,614 | |
| | | | | | | | | | | | 150,195,614 | |
PUT OPTIONS - 1.18% | | | | | | | | | | | | |
SPY SPDR S&P 500® Trust ETF, Expires 9/29/2023, Strike Price $357.19 | | | 3,668 | | | | 152,563,124 | | | | 1,764,161 | |
| | | | | | | | | | | | 1,764,161 | |
TOTAL PURCHASED OPTIONS (Cost $141,383,879) | | | | | | | | | | | 151,959,775 | |
| | | Principal Amount | | | | | | | | | |
SHORT TERM INVESTMENTS - 0.25% | | | | | | | | | | | | |
Money Market Deposit Account - 0.25% | | | | | | | | | | | | |
U.S. Bank Money Market Deposit Account, 4.650% (c) | | $ | 381,691 | | | | | | | | 381,691 | |
TOTAL SHORT TERM INVESTMENTS (Cost $381,691) | | | | | | | | | | | 381,691 | |
| | | | | | | | | | | | | |
Total Investments (Cost $141,765,570) - 101.39% | | | | | | | | | | | 152,341,466 | |
Liabilities in Excess of Other Assets - (1.39)% | | | | | | | | | | | (2,084,375 | ) |
TOTAL NET ASSETS - 100.00% | | | | | | | | | | $ | 150,257,091 | |
Asset Type | | % of Net Assets | |
Purchased Options | | | 101.14 | % |
Short Term Investments | | | 0.25 | |
Total Investments | | | 101.39 | |
Liabilities in Excess of Other Assets | | | (1.39 | ) |
Net Assets | | | 100.00 | % |
| | | | | |
Percentages are stated as a percent of net assets. | | | | |
(a) | Exchange-Traded. |
(b) | Purchased option contracts are held in connection with corresponding option contracts written short. |
(c) | The U.S. Bank Money Market Deposit Account (the “MMDA”) is a short-term investment vehicle in which the Fund holds cash balances. The MMDA will bear interest at a variable rate that is determined based on conditions and may change daily and by any amount. The rate shown is as of April 30, 2023. |
The accompanying notes are an integral part of these financial statements.
INNOVATOR U.S. EQUITY BUFFER ETF – OCTOBER
Schedule of Options Written (a) | | | |
April 30, 2023 (Unaudited) (Continued) | | | |
Description | | Expiration | | | Strike Price | | | Contracts | | | Notional Amount | | | Value | |
Call Options | | | | | | | | | | | | | | | | | | | | |
SPY SPDR S&P 500® Trust ETF | | 9/29/2023 | | | $ | 458.80 | | | | 3,668 | | | $ | (152,563,124 | ) | | $ | (1,017,284 | ) |
| | | | | | | | | | | | | | | | | | | | (1,017,284 | ) |
Put Options | | | | | | | | | | | | | | | | | | | | |
SPY SPDR S&P 500® Trust ETF | | 9/29/2023 | | | | 325.03 | | | | 3,668 | | | | (152,563,124 | ) | | | (965,234 | ) |
| | | | | | | | | | | | | | | | | | | | (965,234 | ) |
Total Options Written (Premiums Received $8,718,828) | | | | | | | | | | | | | | | $ | (1,982,518 | ) |
The accompanying notes are an integral part of these financial statements.
INNOVATOR U.S. EQUITY BUFFER ETF – NOVEMBER
Schedule of Investments |
April 30, 2023 (Unaudited) |
| | | Contracts | | | Notional Amount | | | Value | |
PURCHASED OPTIONS - 101.27% (a)(b) | | | | | | | | | | | | |
CALL OPTIONS - 98.85% | | | | | | | | | | | | |
SPY SPDR S&P 500® Trust ETF, Expires 10/31/2023, Strike Price $3.87 | | | 3,269 | | | $ | 135,967,517 | | | $ | 133,786,047 | |
| | | | | | | | | | | | 133,786,047 | |
PUT OPTIONS - 2.42% | | | | | | | | | | | | |
SPY SPDR S&P 500® Trust ETF, Expires 10/31/2023, Strike Price $386.22 | | | 3,269 | | | | 135,967,517 | | | | 3,274,002 | |
| | | | | | | | | | | | 3,274,002 | |
TOTAL PURCHASED OPTIONS (Cost $132,845,565) | | | | | | | | | | | 137,060,049 | |
| | | Principal Amount | | | | | | | | | |
SHORT TERM INVESTMENTS - 0.22% | | | | | | | | | | | | |
Money Market Deposit Account - 0.22% | | | | | | | | | | | | |
U.S. Bank Money Market Deposit Account, 4.650% (c) | | $ | 296,222 | | | | | | | | 296,222 | |
TOTAL SHORT TERM INVESTMENTS (Cost $296,222) | | | | | | | | | | | 296,222 | |
| | | | | | | | | | | | | |
Total Investments (Cost $133,141,787) - 101.49% | | | | | | | | | | | 137,356,271 | |
Liabilities in Excess of Other Assets - (1.49)% | | | | | | | | | | | (2,019,582 | ) |
TOTAL NET ASSETS - 100.00% | | | | | | | | | | $ | 135,336,689 | |
Asset Type | | % of Net Assets | |
Purchased Options | | | 101.27 | % |
Short Term Investments | | | 0.22 | |
Total Investments | | | 101.49 | |
Liabilities in Excess of Other Assets | | | (1.49 | ) |
Net Assets | | | 100.00 | % |
| | | | | |
Percentages are stated as a percent of net assets. | | | | |
(a) | Exchange-Traded. |
(b) | Purchased option contracts are held in connection with corresponding option contracts written short. |
(c) | The U.S. Bank Money Market Deposit Account (the “MMDA”) is a short-term investment vehicle in which the Fund holds cash balances. The MMDA will bear interest at a variable rate that is determined based on conditions and may change daily and by any amount. The rate shown is as of April 30, 2023. |
The accompanying notes are an integral part of these financial statements.
INNOVATOR U.S. EQUITY BUFFER ETF – NOVEMBER
Schedule of Options Written (a) | | | |
April 30, 2023 (Unaudited) (Continued) | | | |
Description | | Expiration | | | Strike Price | | | Contracts | | | Notional Amount | | | Value | |
Call Options | | | | | | | | | | | | | | | | | | | | |
SPY SPDR S&P 500® Trust ETF | | 10/31/2023 | | | $ | 497.01 | | | | 3,269 | | | $ | (135,967,517 | ) | | $ | (190,910 | ) |
| | | | | | | | | | | | | | | | | | | | (190,910 | ) |
Put Options | | | | | | | | | | | | | | | | | | | | |
SPY SPDR S&P 500® Trust ETF | | 10/31/2023 | | | | 351.45 | | | | 3,269 | | | | (135,967,517 | ) | | | (1,741,952 | ) |
| | | | | | | | | | | | | | | | | | | | (1,741,952 | ) |
Total Options Written (Premiums Received $8,004,641) | | | | | | | | | | | | | | | $ | (1,932,862 | ) |
The accompanying notes are an integral part of these financial statements.
INNOVATOR U.S. EQUITY BUFFER ETF – DECEMBER
Schedule of Investments |
April 30, 2023 (Unaudited) |
| | | Contracts | | | Notional Amount | | | Value | |
PURCHASED OPTIONS - 102.00% (a)(b) | | | | | | | | | | | | |
CALL OPTIONS - 98.16% | | | | | | | | | | | | |
SPY SPDR S&P 500® Trust ETF, Expires 11/30/2023, Strike Price $4.09 | | | 2,651 | | | $ | 110,263,043 | | | $ | 108,487,112 | |
| | | | | | | | | | | | 108,487,112 | |
PUT OPTIONS - 3.84% | | | | | | | | | | | | |
SPY SPDR S&P 500® Trust ETF, Expires 11/30/2023, Strike Price $407.69 | | | 2,651 | | | | 110,263,043 | | | | 4,240,911 | |
| | | | | | | | | | | | 4,240,911 | |
TOTAL PURCHASED OPTIONS (Cost $112,526,752) | | | | | | | | | | | 112,728,023 | |
| | | Principal Amount | | | | | | | | | |
SHORT TERM INVESTMENTS - 0.28% | | | | | | | | | | | | |
Money Market Deposit Account - 0.28% | | | | | | | | | | | | |
U.S. Bank Money Market Deposit Account, 4.650% (c) | | $ | 308,672 | | | | | | | | 308,672 | |
TOTAL SHORT TERM INVESTMENTS (Cost $308,672) | | | | | | | | | | | 308,672 | |
| | | | | | | | | | | | | |
Total Investments (Cost $112,835,424) - 102.28% | | | | | | | | | | | 113,036,695 | |
Liabilities in Excess of Other Assets - (2.28)% | | | | | | | | | | | (2,517,922 | ) |
TOTAL NET ASSETS - 100.00% | | | | | | | | | | $ | 110,518,773 | |
Asset Type | | % of Net Assets | |
Purchased Options | | | 102.00 | % |
Short Term Investments | | | 0.28 | |
Total Investments | | | 102.28 | |
Liabilities in Excess of Other Assets | | | (2.28 | ) |
Net Assets | | | 100.00 | % |
| | | | | |
Percentages are stated as a percent of net assets. | | | | |
(a) | Exchange-Traded. |
(b) | Purchased option contracts are held in connection with corresponding option contracts written short. |
(c) | The U.S. Bank Money Market Deposit Account (the “MMDA”) is a short-term investment vehicle in which the Fund holds cash balances. The MMDA will bear interest at a variable rate that is determined based on conditions and may change daily and by any amount. The rate shown is as of April 30, 2023. |
The accompanying notes are an integral part of these financial statements.
INNOVATOR U.S. EQUITY BUFFER ETF – DECEMBER
Schedule of Options Written (a) | | | |
April 30, 2023 (Unaudited) (Continued) | | | |
Description | | Expiration | | | Strike Price | | | Contracts | | | Notional Amount | | | Value | |
Call Options | | | | | | | | | | | | | | | | | | | | |
SPY SPDR S&P 500® Trust ETF | | 11/30/2023 | | | $ | 509.60 | | | | 2,651 | | | $ | (110,263,043 | ) | | $ | (152,724 | ) |
| | | | | | | | | | | | | | | | | | | | (152,724 | ) |
Put Options | | | | | | | | | | | | | | | | | | | | |
SPY SPDR S&P 500® Trust ETF | | 11/30/2023 | | | | 370.99 | | | | 2,651 | | | | (110,263,043 | ) | | | (2,293,486 | ) |
| | | | | | | | | | | | | | | | | | | | (2,293,486 | ) |
Total Options Written (Premiums Received $6,388,557) | | | | | | | | | | | | | | | $ | (2,446,210 | ) |
The accompanying notes are an integral part of these financial statements.
INNOVATOR U.S. EQUITY POWER BUFFER ETF – JANUARY
Schedule of Investments |
April 30, 2023 (Unaudited) |
| | | Contracts | | | Notional Amount | | | Value | |
PURCHASED OPTIONS - 103.19% (a)(b) | | | | | | | | | | | | |
CALL OPTIONS - 100.24% | | | | | | | | | | | | |
SPY SPDR S&P 500® Trust ETF, Expires 12/29/2023, Strike Price $3.82 | | | 16,672 | | | $ | 693,438,496 | | | $ | 679,267,296 | |
| | | | | | | | | | | | 679,267,296 | |
PUT OPTIONS - 2.95% | | | | | | | | | | | | |
SPY SPDR S&P 500® Trust ETF, Expires 12/29/2023, Strike Price $382.43 | | | 16,672 | | | | 693,438,496 | | | | 20,006,400 | |
| | | | | | | | | | | | 20,006,400 | |
TOTAL PURCHASED OPTIONS (Cost $669,563,437) | | | | | | | | | | | 699,273,696 | |
| | | Principal Amount | | | | | | | | | |
SHORT TERM INVESTMENTS - 0.26% | | | | | | | | | | | | |
Money Market Deposit Account - 0.26% | | | | | | | | | | | | |
U.S. Bank Money Market Deposit Account, 4.650% (c) | | $ | 1,754,483 | | | | | | | | 1,754,483 | |
TOTAL SHORT TERM INVESTMENTS (Cost $1,754,483) | | | | | | | | | | | 1,754,483 | |
| | | | | | | | | | | | | |
Total Investments (Cost $671,317,920) - 103.45% | | | | | | | | | | | 701,028,179 | |
Liabilities in Excess of Other Assets - (3.45)% | | | | | | | | | | | (23,372,919 | ) |
TOTAL NET ASSETS - 100.00% | | | | | | | | | | $ | 677,655,260 | |
Asset Type | | % of Net Assets | |
Purchased Options | | | 103.19 | % |
Short Term Investments | | | 0.26 | |
Total Investments | | | 103.45 | |
Liabilities in Excess of Other Assets | | | (3.45 | ) |
Net Assets | | | 100.00 | % |
| | | | | |
Percentages are stated as a percent of net assets. | | | | |
(a) | Exchange-Traded. |
(b) | Purchased option contracts are held in connection with corresponding option contracts written short. |
(c) | The U.S. Bank Money Market Deposit Account (the “MMDA”) is a short-term investment vehicle in which the Fund holds cash balances. The MMDA will bear interest at a variable rate that is determined based on conditions and may change daily and by any amount. The rate shown is as of April 30, 2023. |
The accompanying notes are an integral part of these financial statements.
INNOVATOR U.S. EQUITY POWER BUFFER ETF – JANUARY
Schedule of Options Written (a) | | | |
April 30, 2023 (Unaudited) (Continued) | | | |
Description | | Expiration | | | Strike Price | | | Contracts | | | Notional Amount | | | Value | |
Call Options | | | | | | | | | | | | | | | | | | | | |
SPY SPDR S&P 500® Trust ETF | | 12/29/2023 | | | $ | 454.48 | | | | 16,672 | | | $ | (693,438,496 | ) | | $ | (15,004,800 | ) |
| | | | | | | | | | | | | | | | | | | | (15,004,800 | ) |
Put Options | | | | | | | | | | | | | | | | | | | | |
SPY SPDR S&P 500® Trust ETF | | 12/29/2023 | | | | 325.07 | | | | 16,672 | | | | (693,438,496 | ) | | | (7,985,888 | ) |
| | | | | | | | | | | | | | | | | | | | (7,985,888 | ) |
Total Options Written (Premiums Received $36,874,015) | | | | | | | | | | | | | | | $ | (22,990,688 | ) |
The accompanying notes are an integral part of these financial statements.
INNOVATOR U.S. EQUITY POWER BUFFER ETF – FEBRUARY
Schedule of Investments |
April 30, 2023 (Unaudited) |
| | | Contracts | | | Notional Amount | | | Value | |
PURCHASED OPTIONS - 103.41% (a)(b) | | | | | | | | | | | | |
CALL OPTIONS - 98.89% | | | | | | | | | | | | |
SPY SPDR S&P 500® Trust ETF, Expires 1/31/2024, Strike Price $4.06 | | | 15,237 | | | $ | 633,752,541 | | | $ | 620,542,062 | |
| | | | | | | | | | | | 620,542,062 | |
PUT OPTIONS - 4.52% | | | | | | | | | | | | |
SPY SPDR S&P 500® Trust ETF, Expires 1/31/2024, Strike Price $406.48 | | | 15,237 | | | | 633,752,541 | | | | 28,371,294 | |
| | | | | | | | | | | | 28,371,294 | |
TOTAL PURCHASED OPTIONS (Cost $643,787,963) | | | | | | | | | | | 648,913,356 | |
| | | Principal Amount | | | | | | | | | |
SHORT TERM INVESTMENTS - 0.26% | | | | | | | | | | | | |
Money Market Deposit Account - 0.26% | | | | | | | | | | | | |
U.S. Bank Money Market Deposit Account, 4.650% (c) | | $ | 1,626,541 | | | | | | | | 1,626,541 | |
TOTAL SHORT TERM INVESTMENTS (Cost $1,626,541) | | | | | | | | | | | 1,626,541 | |
| | | | | | | | | | | | | |
Total Investments (Cost $645,414,504) - 103.67% | | | | | | | | | | | 650,539,897 | |
Liabilities in Excess of Other Assets - (3.67)% | | | | | | | | | | | (23,056,482 | ) |
TOTAL NET ASSETS - 100.00% | | | | | | | | | | $ | 627,483,415 | |
Asset Type | | % of Net Assets | |
Purchased Options | | | 103.41 | % |
Short Term Investments | | | 0.26 | |
Total Investments | | | 103.67 | |
Liabilities in Excess of Other Assets | | | (3.67 | ) |
Net Assets | | | 100.00 | % |
| | | | | |
Percentages are stated as a percent of net assets. | | | | |
(a) | Exchange-Traded. |
(b) | Purchased option contracts are held in connection with corresponding option contracts written short. |
(c) | The U.S. Bank Money Market Deposit Account (the “MMDA”) is a short-term investment vehicle in which the Fund holds cash balances. The MMDA will bear interest at a variable rate that is determined based on conditions and may change daily and by any amount. The rate shown is as of April 30, 2023. |
The accompanying notes are an integral part of these financial statements.
INNOVATOR U.S. EQUITY POWER BUFFER ETF – FEBRUARY
Schedule of Options Written (a) | | | |
April 30, 2023 (Unaudited) (Continued) | | | |
Description | | Expiration | | | Strike Price | | | Contracts | | | Notional Amount | | | Value | |
Call Options | | | | | | | | | | | | | | | | | | | | |
SPY SPDR S&P 500® Trust ETF | | 1/31/2024 | | | $ | 464.77 | | | | 15,237 | | | $ | (633,752,541 | ) | | $ | (11,382,039 | ) |
| | | | | | | | | | | | | | | | | | | | (11,382,039 | ) |
Put Options | | | | | | | | | | | | | | | | | | | | |
SPY SPDR S&P 500® Trust ETF | | 1/31/2024 | | | | 345.51 | | | | 15,237 | | | | (633,752,541 | ) | | | (11,366,802 | ) |
| | | | | | | | | | | | | | | | | | | | (11,366,802 | ) |
Total Options Written (Premiums Received $29,267,012) | | | | | | | | | | | | | | | $ | (22,748,841 | ) |
The accompanying notes are an integral part of these financial statements.
INNOVATOR U.S. EQUITY POWER BUFFER ETF – MARCH
Schedule of Investments |
April 30, 2023 (Unaudited) |
| | | Contracts | | | Notional Amount | | | Value | |
PURCHASED OPTIONS - 104.28% (a)(b) | | | | | | | | | | | | |
CALL OPTIONS - 100.14% | | | | | | | | | | | | |
SPY SPDR S&P 500® Trust ETF, Expires 2/29/2024, Strike Price $3.96 | | | 11,000 | | | $ | 457,523,000 | | | $ | 448,598,371 | |
| | | | | | | | | | | | 448,598,371 | |
PUT OPTIONS - 4.14% | | | | | | | | | | | | |
SPY SPDR S&P 500® Trust ETF, Expires 2/29/2024, Strike Price $396.26 | | | 11,000 | | | | 457,523,000 | | | | 18,540,170 | |
| | | | | | | | | | | | 18,540,170 | |
TOTAL PURCHASED OPTIONS (Cost $452,485,416) | | | | | | | | | | | 467,138,541 | |
| | | Principal Amount | | | | | | | | | |
SHORT TERM INVESTMENTS - 0.26% | | | | | | | | | | | | |
Money Market Deposit Account - 0.26% | | | | | | | | | | | | |
U.S. Bank Money Market Deposit Account, 4.650% (c) | | $ | 1,171,977 | | | | | | | | 1,171,977 | |
TOTAL SHORT TERM INVESTMENTS (Cost $1,171,977) | | | | | | | | | | | 1,171,977 | |
| | | | | | | | | | | | | |
Total Investments (Cost $453,657,393) - 104.54% | | | | | | | | | | | 468,310,518 | |
Liabilities in Excess of Other Assets - (4.54)% | | | | | | | | | | | (20,340,242 | ) |
TOTAL NET ASSETS - 100.00% | | | | | | | | | | $ | 447,970,276 | |
Asset Type | | % of Net Assets | |
Purchased Options | | | 104.28 | % |
Short Term Investments | | | 0.26 | |
Total Investments | | | 104.54 | |
Liabilities in Excess of Other Assets | | | (4.54 | ) |
Net Assets | | | 100.00 | % |
| | | | | |
Percentages are stated as a percent of net assets. | | | | |
(a) | Exchange-Traded. |
(b) | Purchased option contracts are held in connection with corresponding option contracts written short. |
(c) | The U.S. Bank Money Market Deposit Account (the “MMDA”) is a short-term investment vehicle in which the Fund holds cash balances. The MMDA will bear interest at a variable rate that is determined based on conditions and may change daily and by any amount. The rate shown is as of April 30, 2023. |
The accompanying notes are an integral part of these financial statements.
INNOVATOR U.S. EQUITY POWER BUFFER ETF – MARCH
Schedule of Options Written (a) | | | |
April 30, 2023 (Unaudited) (Continued) | | | |
Description | | Expiration | | | Strike Price | | | Contracts | | | Notional Amount | | | Value | |
Call Options | | | | | | | | | | | | | | | | | | | | |
SPY SPDR S&P 500® Trust ETF | | 2/29/2024 | | | $ | 459.54 | | | | 11,000 | | | $ | (457,523,000 | ) | | $ | (12,231,230 | ) |
| | | | | | | | | | | | | | | | | | | | (12,231,230 | ) |
Put Options | | | | | | | | | | | | | | | | | | | | |
SPY SPDR S&P 500® Trust ETF | | 2/29/2024 | | | | 336.82 | | | | 11,000 | | | | (457,523,000 | ) | | | (7,822,870 | ) |
| | | | | | | | | | | | | | | | | | | | (7,822,870 | ) |
Total Options Written (Premiums Received $20,226,798) | | | | | | | | | | | | | | | $ | (20,054,100 | ) |
The accompanying notes are an integral part of these financial statements.
INNOVATOR U.S. EQUITY POWER BUFFER ETF – APRIL
Schedule of Investments |
April 30, 2023 (Unaudited) |
| | | Contracts | | | Notional Amount | | | Value | |
PURCHASED OPTIONS - 104.10% (a)(b) | | | | | | | | | | | | |
CALL OPTIONS - 98.76% | | | | | | | | | | | | |
SPY SPDR S&P 500® Trust ETF, Expires 3/28/2024, Strike Price $4.09 | | | 16,043 | | | $ | 667,276,499 | | | $ | 651,506,230 | |
| | | | | | | | | | | | 651,506,230 | |
PUT OPTIONS - 5.34% | | | | | | | | | | | | |
SPY SPDR S&P 500® Trust ETF, Expires 3/28/2024, Strike Price $409.39 | | | 16,043 | | | | 667,276,499 | | | | 35,214,385 | |
| | | | | | | | | | | | 35,214,385 | |
TOTAL PURCHASED OPTIONS (Cost $681,732,060) | | | | | | | | | | | 686,720,615 | |
| | | Principal Amount | | | | | | | | | |
SHORT TERM INVESTMENTS - 0.26% | | | | | | | | | | | | |
Money Market Deposit Account - 0.26% | | | | | | | | | | | | |
U.S. Bank Money Market Deposit Account, 4.650% (c) | | $ | 1,729,876 | | | | | | | | 1,729,876 | |
TOTAL SHORT TERM INVESTMENTS (Cost $1,729,876) | | | | | | | | | | | 1,729,876 | |
| | | | | | | | | | | | | |
Total Investments (Cost $683,461,936) - 104.36% | | | | | | | | | | | 688,450,491 | |
Liabilities in Excess of Other Assets - (4.36)% | | | | | | | | | | | (28,767,974 | ) |
TOTAL NET ASSETS - 100.00% | | | | | | | | | | $ | 659,682,517 | |
Asset Type | | % of Net Assets | |
Purchased Options | | | 104.10 | % |
Short Term Investments | | | 0.26 | |
Total Investments | | | 104.36 | |
Liabilities in Excess of Other Assets | | | (4.36 | ) |
Net Assets | | | 100.00 | % |
| | | | | |
Percentages are stated as a percent of net assets. | | | | |
(a) | Exchange-Traded. |
(b) | Purchased option contracts are held in connection with corresponding option contracts written short. |
(c) | The U.S. Bank Money Market Deposit Account (the “MMDA”) is a short-term investment vehicle in which the Fund holds cash balances. The MMDA will bear interest at a variable rate that is determined based on conditions and may change daily and by any amount. The rate shown is as of April 30, 2023. |
The accompanying notes are an integral part of these financial statements.
INNOVATOR U.S. EQUITY POWER BUFFER ETF – APRIL
Schedule of Options Written (a) | | | |
April 30, 2023 (Unaudited) (Continued) | | | |
Description | | Expiration | | | Strike Price | | | Contracts | | | Notional Amount | | | Value | |
Call Options | | | | | | | | | | | | | | | | | | | | |
SPY SPDR S&P 500® Trust ETF | | 3/28/2024 | | | $ | 470.59 | | | | 16,043 | | | $ | (667,276,499 | ) | | $ | (13,620,507 | ) |
| | | | | | | | | | | | | | | | | | | | (13,620,507 | ) |
Put Options | | | | | | | | | | | | | | | | | | | | |
SPY SPDR S&P 500® Trust ETF | | 3/28/2024 | | | | 347.98 | | | | 16,043 | | | | (667,276,499 | ) | | | (14,839,775 | ) |
| | | | | | | | | | | | | | | | | | | | (14,839,775 | ) |
Total Options Written (Premiums Received $30,849,929) | | | | | | | | | | | | | | | $ | (28,460,282 | ) |
The accompanying notes are an integral part of these financial statements.
INNOVATOR U.S. EQUITY POWER BUFFER ETF – MAY
Schedule of Investments |
April 30, 2023 (Unaudited) |
| | | Contracts | | | Notional Amount | | | Value | |
PURCHASED OPTIONS - 104.50% (a)(b) | | | | | | | | | | | | |
CALL OPTIONS - 98.42% | | | | | | | | | | | | |
SPY SPDR S&P 500® Trust ETF, Expires 4/30/2024, Strike Price $4.16 | | | 12,035 | | | $ | 500,571,755 | | | $ | 488,681,175 | |
| | | | | | | | | | | | 488,681,175 | |
PUT OPTIONS - 6.08% | | | | | | | | | | | | |
SPY SPDR S&P 500® Trust ETF, Expires 4/30/2024, Strike Price $415.93 | | | 12,035 | | | | 500,571,755 | | | | 30,195,815 | |
| | | | | | | | | | | | 30,195,815 | |
TOTAL PURCHASED OPTIONS (Cost $518,928,346) | | | | | | | | | | | 518,876,990 | |
| | | Principal Amount | | | | | | | | | |
SHORT TERM INVESTMENTS - 0.25% | | | | | | | | | | | | |
Money Market Deposit Account - 0.25% | | | | | | | | | | | | |
U.S. Bank Money Market Deposit Account, 4.650% (c) | | $ | 1,232,036 | | | | | | | | 1,232,036 | |
TOTAL SHORT TERM INVESTMENTS (Cost $1,232,036) | | | | | | | | | | | 1,232,036 | |
| | | | | | | | | | | | | |
Total Investments (Cost $520,160,382) - 104.75% | | | | | | | | | | | 520,109,026 | |
Liabilities in Excess of Other Assets - (4.75)% | | | | | | | | | | | (23,576,517 | ) |
TOTAL NET ASSETS - 100.00% | | | | | | | | | | $ | 496,532,509 | |
Asset Type | | % of Net Assets | |
Purchased Options | | | 104.50 | % |
Short Term Investments | | | 0.25 | |
Total Investments | | | 104.75 | |
Liabilities in Excess of Other Assets | | | (4.75 | ) |
Net Assets | | | 100.00 | % |
| | | | | |
Percentages are stated as a percent of net assets. | | | | |
(a) | Exchange-Traded. |
(b) | Purchased option contracts are held in connection with corresponding option contracts written short. |
(c) | The U.S. Bank Money Market Deposit Account (the “MMDA”) is a short-term investment vehicle in which the Fund holds cash balances. The MMDA will bear interest at a variable rate that is determined based on conditions and may change daily and by any amount. The rate shown is as of April 30, 2023. |
The accompanying notes are an integral part of these financial statements.
INNOVATOR U.S. EQUITY POWER BUFFER ETF – MAY
Schedule of Options Written (a) | | | |
April 30, 2023 (Unaudited) (Continued) | | | |
Description | | Expiration | | | Strike Price | | | Contracts | | | Notional Amount | | | Value | |
Call Options | | | | | | | | | | | | | | | | | | | | |
SPY SPDR S&P 500® Trust ETF | | 4/30/2024 | | | $ | 476.32 | | | | 12,035 | | | $ | (500,571,755 | ) | | $ | (10,193,645 | ) |
| | | | | | | | | | | | | | | | | | | | (10,193,645 | ) |
Put Options | | | | | | | | | | | | | | | | | | | | |
SPY SPDR S&P 500® Trust ETF | | 4/30/2024 | | | | 353.54 | | | | 12,035 | | | | (500,571,755 | ) | | | (13,130,185 | ) |
| | | | | | | | | | | | | | | | | | | | (13,130,185 | ) |
Total Options Written (Premiums Received $23,272,287) | | | | | | | | | | | | | | | $ | (23,323,830 | ) |
The accompanying notes are an integral part of these financial statements.
INNOVATOR U.S. EQUITY POWER BUFFER ETF – JUNE
Schedule of Investments |
April 30, 2023 (Unaudited) |
| | | Contracts | | | Notional Amount | | | Value | |
PURCHASED OPTIONS - 99.87% (a)(b) | | | | | | | | | | | | |
CALL OPTIONS - 98.71% | | | | | | | | | | | | |
SPY SPDR S&P 500® Trust ETF, Expires 5/31/2023, Strike Price $4.13 | | | 8,705 | | | $ | 362,067,065 | | | $ | 358,657,142 | |
| | | | | | | | | | | | 358,657,142 | |
PUT OPTIONS - 1.16% | | | | | | | | | | | | |
SPY SPDR S&P 500® Trust ETF, Expires 5/31/2023, Strike Price $412.93 | | | 8,705 | | | | 362,067,065 | | | | 4,212,872 | |
| | | | | | | | | | | | 4,212,872 | |
TOTAL PURCHASED OPTIONS (Cost $379,755,987) | | | | | | | | | | | 362,870,014 | |
| | | Principal Amount | | | | | | | | | |
SHORT TERM INVESTMENTS - 0.27% | | | | | | | | | | | | |
Money Market Deposit Account - 0.27% | | | | | | | | | | | | |
U.S. Bank Money Market Deposit Account, 4.650% (c) | | $ | 963,230 | | | | | | | | 963,230 | |
TOTAL SHORT TERM INVESTMENTS (Cost $963,230) | | | | | | | | | | | 963,230 | |
| | | | | | | | | | | | | |
Total Investments (Cost $380,719,217) - 100.14% | | | | | | | | | | | 363,833,244 | |
Liabilities in Excess of Other Assets - (0.14)% | | | | | | | | | | | (487,443 | ) |
TOTAL NET ASSETS - 100.00% | | | | | | | | | | $ | 363,345,801 | |
Asset Type | | % of Net Assets | |
Purchased Options | | | 99.87 | % |
Short Term Investments | | | 0.27 | |
Total Investments | | | 100.14 | |
Liabilities in Excess of Other Assets | | | (0.14 | ) |
Net Assets | | | 100.00 | % |
| | | | | |
Percentages are stated as a percent of net assets. | | | | |
(a) | Exchange-Traded. |
(b) | Purchased option contracts are held in connection with corresponding option contracts written short. |
(c) | The U.S. Bank Money Market Deposit Account (the “MMDA”) is a short-term investment vehicle in which the Fund holds cash balances. The MMDA will bear interest at a variable rate that is determined based on conditions and may change daily and by any amount. The rate shown is as of April 30, 2023. |
The accompanying notes are an integral part of these financial statements.
INNOVATOR U.S. EQUITY POWER BUFFER ETF – JUNE
Schedule of Options Written (a) | | | |
April 30, 2023 (Unaudited) (Continued) | | | |
Description | | Expiration | | | Strike Price | | | Contracts | | | Notional Amount | | | Value | |
Call Options | | | | | | | | | | | | | | | | | | | | |
SPY SPDR S&P 500® Trust ETF | | 5/31/2023 | | | $ | 472.02 | | | | 8,705 | | | $ | (362,067,065 | ) | | $ | (12,796 | ) |
| | | | | | | | | | | | | | | | | | | | (12,796 | ) |
Put Options | | | | | | | | | | | | | | | | | | | | |
SPY SPDR S&P 500® Trust ETF | | 5/31/2023 | | | | 350.99 | | | | 8,705 | | | | (362,067,065 | ) | | | (246,613 | ) |
| | | | | | | | | | | | | | | | | | | | (246,613 | ) |
Total Options Written (Premiums Received $21,282,491) | | | | | | | | | | | | | | | $ | (259,409 | ) |
The accompanying notes are an integral part of these financial statements.
INNOVATOR U.S. EQUITY POWER BUFFER ETF – JULY
Schedule of Investments |
April 30, 2023 (Unaudited) |
| | | Contracts | | | Notional Amount | | | Value | |
PURCHASED OPTIONS - 100.15% (a)(b) | | | | | | | | | | | | |
CALL OPTIONS - 99.59% | | | | | | | | | | | | |
SPY SPDR S&P 500® Trust ETF, Expires 6/30/2023, Strike Price $3.77 | | | 10,089 | | | $ | 419,631,777 | | | $ | 414,502,126 | |
| | | | | | | | | | | | 414,502,126 | |
PUT OPTIONS - 0.56% | | | | | | | | | | | | |
SPY SPDR S&P 500® Trust ETF, Expires 6/30/2023, Strike Price $377.25 | | | 10,089 | | | | 419,631,777 | | | | 2,327,734 | |
| | | | | | | | | | | | 2,327,734 | |
TOTAL PURCHASED OPTIONS (Cost $407,925,674) | | | | | | | | | | | 416,829,860 | |
| | | Principal Amount | | | | | | | | | |
SHORT TERM INVESTMENTS - 0.26% | | | | | | | | | | | | |
Money Market Deposit Account - 0.26% | | | | | | | | | | | | |
U.S. Bank Money Market Deposit Account, 4.650% (c) | | $ | 1,072,570 | | | | | | | | 1,072,570 | |
TOTAL SHORT TERM INVESTMENTS (Cost $1,072,570) | | | | | | | | | | | 1,072,570 | |
| | | | | | | | | | | | | |
Total Investments (Cost $408,998,244) - 100.41% | | | | | | | | | | | 417,902,430 | |
Liabilities in Excess of Other Assets - (0.41)% | | | | | | | | | | | (1,684,410 | ) |
TOTAL NET ASSETS - 100.00% | | | | | | | | | | $ | 416,218,020 | |
Asset Type | | % of Net Assets | |
Purchased Options | | | 100.15 | % |
Short Term Investments | | | 0.26 | |
Total Investments | | | 100.41 | |
Liabilities in Excess of Other Assets | | | (0.41 | ) |
Net Assets | | | 100.00 | % |
| | | | | |
Percentages are stated as a percent of net assets. | | | | |
(a) | Exchange-Traded. |
(b) | Purchased option contracts are held in connection with corresponding option contracts written short. |
(c) | The U.S. Bank Money Market Deposit Account (the “MMDA”) is a short-term investment vehicle in which the Fund holds cash balances. The MMDA will bear interest at a variable rate that is determined based on conditions and may change daily and by any amount. The rate shown is as of April 30, 2023. |
The accompanying notes are an integral part of these financial statements.
INNOVATOR U.S. EQUITY POWER BUFFER ETF – JULY
Schedule of Options Written (a) | | | |
April 30, 2023 (Unaudited) (Continued) | | | |
Description | | Expiration | | | Strike Price | | | Contracts | | | Notional Amount | | | Value | |
Call Options | | $ | 4 | | | | | | | | | | | | | | | | | |
SPY SPDR S&P 500® Trust ETF | | 6/30/2023 | | | $ | 443.00 | | | | 10,089 | | | $ | (419,631,777 | ) | | $ | (923,043 | ) |
| | | | | | | | | | | | | | | | | | | | (923,043 | ) |
Put Options | | | | | | | | | | | | | | | | | | | | |
SPY SPDR S&P 500® Trust ETF | | 6/30/2023 | | | | 320.66 | | | | 10,089 | | | | (419,631,777 | ) | | | (479,530 | ) |
| | | | | | | | | | | | | | | | | | | | (479,530 | ) |
Total Options Written (Premiums Received $24,944,243) | | | | | | | | | | | | | | | $ | (1,402,573 | ) |
The accompanying notes are an integral part of these financial statements.
INNOVATOR U.S. EQUITY POWER BUFFER ETF – AUGUST
Schedule of Investments |
April 30, 2023 (Unaudited) |
| | | Contracts | | | Notional Amount | | | Value | |
PURCHASED OPTIONS - 100.32% (a)(b) | | | | | | | | | | | | |
CALL OPTIONS - 97.91% | | | | | | | | | | | | |
SPY SPDR S&P 500® Trust ETF, Expires 7/31/2023, Strike Price $4.12 | | | 12,518 | | | $ | 520,661,174 | | | $ | 513,835,359 | |
| | | | | | | | | | | | 513,835,359 | |
PUT OPTIONS - 2.41% | | | | | | | | | | | | |
SPY SPDR S&P 500® Trust ETF, Expires 7/31/2023, Strike Price $411.99 | | | 12,518 | | | | 520,661,174 | | | | 12,650,064 | |
| | | | | | | | | | | | 12,650,064 | |
TOTAL PURCHASED OPTIONS (Cost $538,832,260) | | | | | | | | | | | 526,485,423 | |
| | | Principal Amount | | | | | | | | | |
SHORT TERM INVESTMENTS - 0.26% | | | | | | | | | | | | |
Money Market Deposit Account - 0.26% | | | | | | | | | | | | |
U.S. Bank Money Market Deposit Account, 4.650% (c) | | $ | 1,354,432 | | | | | | | | 1,354,432 | |
TOTAL SHORT TERM INVESTMENTS (Cost $1,354,432) | | | | | | | | | | | 1,354,432 | |
| | | | | | | | | | | | | |
Total Investments (Cost $540,186,692) - 100.58% | | | | | | | | | | | 527,839,855 | |
Liabilities in Excess of Other Assets - (0.58)% | | | | | | | | | | | (3,036,579 | ) |
TOTAL NET ASSETS - 100.00% | | | | | | | | | | $ | 524,803,276 | |
Asset Type | | % of Net Assets | |
Purchased Options | | | 100.32 | % |
Short Term Investments | | | 0.26 | |
Total Investments | | | 100.58 | |
Liabilities in Excess of Other Assets | | | (0.58 | ) |
Net Assets | | | 100.00 | % |
| | | | | |
Percentages are stated as a percent of net assets. | | | | |
(a) | Exchange-Traded. |
(b) | Purchased option contracts are held in connection with corresponding option contracts written short. |
(c) | The U.S. Bank Money Market Deposit Account (the “MMDA”) is a short-term investment vehicle in which the Fund holds cash balances. The MMDA will bear interest at a variable rate that is determined based on conditions and may change daily and by any amount. The rate shown is as of April 30, 2023. |
The accompanying notes are an integral part of these financial statements.
INNOVATOR U.S. EQUITY POWER BUFFER ETF – AUGUST
Schedule of Options Written (a) | | | |
April 30, 2023 (Unaudited) (Continued) | | | |
Description | | Expiration | | | Strike Price | | | Contracts | | | Notional Amount | | | Value | |
Call Options | | | | | | | | | | | | | | | | | | | | |
SPY SPDR S&P 500® Trust ETF | | 7/31/2023 | | | $ | 476.22 | | | | 12,518 | | | $ | (520,661,174 | ) | | $ | (217,438 | ) |
| | | | | | | | | | | | | | | | | | | | (217,438 | ) |
Put Options | | | | | | | | | | | | | | | | | | | | |
SPY SPDR S&P 500® Trust ETF | | 7/31/2023 | | | | 350.19 | | | | 12,518 | | | | (520,661,174 | ) | | | (2,496,965 | ) |
| | | | | | | | | | | | | | | | | | | | (2,496,965 | ) |
Total Options Written (Premiums Received $28,790,438) | | | | | | | | | | | | | | | $ | (2,714,403 | ) |
The accompanying notes are an integral part of these financial statements.
INNOVATOR U.S. EQUITY POWER BUFFER ETF – SEPTEMBER
Schedule of Investments |
April 30, 2023 (Unaudited) |
| | | Contracts | | | Notional Amount | | | Value | |
PURCHASED OPTIONS - 100.66% (a)(b) | | | | | | | | | | | | |
CALL OPTIONS - 98.63% | | | | | | | | | | | | |
SPY SPDR S&P 500® Trust ETF, Expires 8/31/2023, Strike Price $3.95 | | | 15,580 | | | $ | 648,018,940 | | | $ | 639,465,519 | |
| | | | | | | | | | | | 639,465,519 | |
PUT OPTIONS - 2.03% | | | | | | | | | | | | |
SPY SPDR S&P 500® Trust ETF, Expires 8/31/2023, Strike Price $395.18 | | | 15,580 | | | | 648,018,940 | | | | 13,196,260 | |
| | | | | | | | | | | | 13,196,260 | |
TOTAL PURCHASED OPTIONS (Cost $649,842,441) | | | | | | | | | | | 652,661,779 | |
| | | Principal Amount | | | | | | | | | |
SHORT TERM INVESTMENTS - 0.26% | | | | | | | | | | | | |
Money Market Deposit Account - 0.26% | | | | | | | | | | | | |
U.S. Bank Money Market Deposit Account, 4.650% (c) | | $ | 1,665,153 | | | | | | | | 1,665,153 | |
TOTAL SHORT TERM INVESTMENTS (Cost $1,665,153) | | | | | | | | | | | 1,665,153 | |
| | | | | | | | | | | | | |
Total Investments (Cost $651,507,594) - 100.92% | | | | | | | | | | | 654,326,932 | |
Liabilities in Excess of Other Assets - (0.92)% | | | | | | | | | | | (5,993,743 | ) |
TOTAL NET ASSETS - 100.00% | | | | | | | | | | $ | 648,333,189 | |
Asset Type | | % of Net Assets | |
Purchased Options | | | 100.66 | % |
Short Term Investments | | | 0.26 | |
Total Investments | | | 100.92 | |
Liabilities in Excess of Other Assets | | | (0.92 | ) |
Net Assets | | | 100.00 | % |
| | | | | |
Percentages are stated as a percent of net assets. | | | | |
(a) | Exchange-Traded. |
(b) | Purchased option contracts are held in connection with corresponding option contracts written short. |
(c) | The U.S. Bank Money Market Deposit Account (the “MMDA”) is a short-term investment vehicle in which the Fund holds cash balances. The MMDA will bear interest at a variable rate that is determined based on conditions and may change daily and by any amount. The rate shown is as of April 30, 2023. |
The accompanying notes are an integral part of these financial statements.
INNOVATOR U.S. EQUITY POWER BUFFER ETF – SEPTEMBER
Schedule of Options Written (a) | | | |
April 30, 2023 (Unaudited) (Continued) | | | |
Description | | Expiration | | | Strike Price | | | Contracts | | | Notional Amount | | | Value | |
Call Options | | | | | | | | | | | | | | | | | | | | |
SPY SPDR S&P 500® Trust ETF | | 8/31/2023 | | | $ | 464.34 | | | | 15,580 | | | $ | (648,018,940 | ) | | $ | (1,916,340 | ) |
| | | | | | | | | | | | | | | | | | | | (1,916,340 | ) |
Put Options | | | | | | | | | | | | | | | | | | | | |
SPY SPDR S&P 500® Trust ETF | | 8/31/2023 | | | | 335.90 | | | | 15,580 | | | | (648,018,940 | ) | | | (3,723,620 | ) |
| | | | | | | | | | | | | | | | | | | | (3,723,620 | ) |
Total Options Written (Premiums Received $35,583,673) | | | | | | | | | | | | | | | $ | (5,639,960 | ) |
The accompanying notes are an integral part of these financial statements.
INNOVATOR U.S. EQUITY POWER BUFFER ETF – OCTOBER
Schedule of Investments |
April 30, 2023 (Unaudited) |
| | | Contracts | | | Notional Amount | | | Value | |
PURCHASED OPTIONS - 103.36% (a)(b) | | | | | | | | | | | | |
CALL OPTIONS - 102.16% | | | | | | | | | | | | |
SPY SPDR S&P 500® Trust ETF, Expires 9/29/2023, Strike Price $3.57 | | | 12,533 | | | $ | 521,285,069 | | | $ | 513,207,927 | |
| | | | | | | | | | | | 513,207,927 | |
PUT OPTIONS - 1.20% | | | | | | | | | | | | |
SPY SPDR S&P 500® Trust ETF, Expires 9/29/2023, Strike Price $357.18 | | | 12,533 | | | | 521,285,069 | | | | 6,026,744 | |
| | | | | | | | | | | | 6,026,744 | |
TOTAL PURCHASED OPTIONS (Cost $484,261,220) | | | | | | | | | | | 519,234,671 | |
| | | Principal Amount | | | | | | | | | |
SHORT TERM INVESTMENTS - 0.24% | | | | | | | | | | | | |
Money Market Deposit Account - 0.24% | | | | | | | | | | | | |
U.S. Bank Money Market Deposit Account, 4.650% (c) | | $ | 1,228,086 | | | | | | | | 1,228,086 | |
TOTAL SHORT TERM INVESTMENTS (Cost $1,228,086) | | | | | | | | | | | 1,228,086 | |
| | | | | | | | | | | | | |
Total Investments (Cost $485,489,306) - 103.60% | | | | | | | | | | | 520,462,757 | |
Liabilities in Excess of Other Assets - (3.60)% | | | | | | | | | | | (18,105,086 | ) |
TOTAL NET ASSETS - 100.00% | | | | | | | | | | $ | 502,357,671 | |
Asset Type | | % of Net Assets | |
Purchased Options | | | 103.36 | % |
Short Term Investments | | | 0.24 | |
Total Investments | | | 103.60 | |
Liabilities in Excess of Other Assets | | | (3.60 | ) |
Net Assets | | | 100.00 | % |
| | | | | |
Percentages are stated as a percent of net assets. | | | | |
(a) | Exchange-Traded. |
(b) | Purchased option contracts are held in connection with corresponding option contracts written short. |
(c) | The U.S. Bank Money Market Deposit Account (the “MMDA”) is a short-term investment vehicle in which the Fund holds cash balances. The MMDA will bear interest at a variable rate that is determined based on conditions and may change daily and by any amount. The rate shown is as of April 30, 2023. |
The accompanying notes are an integral part of these financial statements.
INNOVATOR U.S. EQUITY POWER BUFFER ETF – OCTOBER
Schedule of Options Written (a) | | | |
April 30, 2023 (Unaudited) (Continued) | | | |
Description | | Expiration | | | Strike Price | | | Contracts | | | Notional Amount | | | Value | |
Call Options | | | | | | | | | | | | | | | | | | | | |
SPY SPDR S&P 500® Trust ETF | | 9/29/2023 | | | $ | 431.22 | | | | 12,533 | | | $ | (521,285,069 | ) | | $ | (15,472,365 | ) |
| | | | | | | | | | | | | | | | | | | | (15,472,365 | ) |
Put Options | | | | | | | | | | | | | | | | | | | | |
SPY SPDR S&P 500® Trust ETF | | 9/29/2023 | | | | 303.60 | | | | 12,533 | | | | (521,285,069 | ) | | | (2,309,205 | ) |
| | | | | | | | | | | | | | | | | | | | (2,309,205 | ) |
Total Options Written (Premiums Received $31,160,110) | | | | | | | | | | | | | | | $ | (17,781,570 | ) |
The accompanying notes are an integral part of these financial statements.
INNOVATOR U.S. EQUITY POWER BUFFER ETF – NOVEMBER
Schedule of Investments | | | | |
April 30, 2023 (Unaudited) | | | | |
| | | Contracts | | | Notional Amount | | | Value | |
PURCHASED OPTIONS - 101.43% (a)(b) | | | | | | | | | | | | |
CALL OPTIONS - 98.99% | | | | | | | | | | | | |
SPY SPDR S&P 500® Trust ETF, Expires 10/31/2023, Strike Price $3.86 | | | 19,200 | | | $ | 798,585,600 | | | $ | 785,241,601 | |
| | | | | | | | | | | | 785,241,601 | |
PUT OPTIONS - 2.44% | | | | | | | | | | | | |
SPY SPDR S&P 500® Trust ETF, Expires 10/31/2023, Strike Price $386.21 | | | 19,200 | | | | 798,585,600 | | | | 19,334,400 | |
| | | | | | | | | | | | 19,334,400 | |
TOTAL PURCHASED OPTIONS (Cost $781,570,442) | | | | | | | | | | | 804,576,001 | |
| | | Principal Amount | | | | | | | | | |
SHORT TERM INVESTMENTS - 0.26% | | | | | | | | | | | | |
Money Market Deposit Account - 0.26% | | | | | | | | | | | | |
U.S. Bank Money Market Deposit Account, 4.650% (c) | | $ | 2,033,725 | | | | | | | | 2,033,725 | |
TOTAL SHORT TERM INVESTMENTS (Cost $2,033,725) | | | | | | | | | | | 2,033,725 | |
| | | | | | | | | | | | | |
Total Investments (Cost $783,604,167) - 101.69% | | | | | | | | | | | 806,609,726 | |
Liabilities in Excess of Other Assets - (1.69)% | | | | | | | | | | | (13,393,844 | ) |
TOTAL NET ASSETS - 100.00% | | | | | | | | | | $ | 793,215,882 | |
Asset Type | | % of Net Assets | |
Purchased Options | | | 101.43 | % |
Short Term Investments | | | 0.26 | |
Total Investments | | | 101.69 | |
Liabilities in Excess of Other Assets | | | (1.69 | ) |
Net Assets | | | 100.00 | % |
| | | | | |
Percentages are stated as a percent of net assets. | | | | |
(a) | Exchange-Traded. |
(b) | Purchased option contracts are held in connection with corresponding option contracts written short. |
(c) | The U.S. Bank Money Market Deposit Account (the “MMDA”) is a short-term investment vehicle in which the Fund holds cash balances. The MMDA will bear interest at a variable rate that is determined based on conditions and may change daily and by any amount. The rate shown is as of April 30, 2023. |
The accompanying notes are an integral part of these financial statements.
INNOVATOR U.S. EQUITY POWER BUFFER ETF – NOVEMBER
Schedule of Options Written (a) | | | |
April 30, 2023 (Unaudited) (Continued) | | | |
Description | | Expiration | | | Strike Price | | | Contracts | | | Notional Amount | | | Value | |
Call Options | | | | | | | | | | | | | | | | | | | | |
SPY SPDR S&P 500® Trust ETF | | 10/31/2023 | | | $ | 465.46 | | | | 19,200 | | | $ | (798,585,600 | ) | | $ | (6,028,800 | ) |
| | | | | | | | | | | | | | | | | | | | (6,028,800 | ) |
Put Options | | | | | | | | | | | | | | | | | | | | |
SPY SPDR S&P 500® Trust ETF | | 10/31/2023 | | | | 328.28 | | | | 19,200 | | | | (798,585,600 | ) | | | (6,892,800 | ) |
| | | | | | | | | | | | | | | | | | | | (6,892,800 | ) |
Total Options Written (Premiums Received $46,671,315) | | | | | | | | | | | | | | | $ | (12,921,600 | ) |
The accompanying notes are an integral part of these financial statements.
INNOVATOR U.S. EQUITY POWER BUFFER ETF – DECEMBER
Schedule of Investments | | | | | |
April 30, 2023 (Unaudited) | | | | | |
| | | Contracts | | | Notional Amount | | | Value | |
PURCHASED OPTIONS - 101.58% (a)(b) | | | | | | | | | | | | |
CALL OPTIONS - 97.70% | | | | | | | | | | | | |
SPY SPDR S&P 500® Trust ETF, Expires 11/30/2023, Strike Price $4.08 | | | 17,052 | | | $ | 709,243,836 | | | $ | 697,409,748 | |
| | | | | | | | | | | | 697,409,748 | |
PUT OPTIONS - 3.88% | | | | | | | | | | | | |
SPY SPDR S&P 500® Trust ETF, Expires 11/30/2023, Strike Price $407.68 | | | 17,052 | | | | 709,243,836 | | | | 27,726,552 | |
| | | | | | | | | | | | 27,726,552 | |
TOTAL PURCHASED OPTIONS (Cost $721,485,930) | | | | | | | | | | | 725,136,300 | |
| | | Principal Amount | | | | | | | | | |
SHORT TERM INVESTMENTS - 0.26% | | | | | | | | | | | | |
Money Market Deposit Account - 0.26% | | | | | | | | | | | | |
U.S. Bank Money Market Deposit Account, 4.650% (c) | | $ | 1,856,852 | | | | | | | | 1,856,852 | |
TOTAL SHORT TERM INVESTMENTS (Cost $1,856,852) | | | | | | | | | | | 1,856,852 | |
| | | | | | | | | | | | | |
Total Investments (Cost $723,342,782) - 101.84% | | | | | | | | | | | 726,993,152 | |
Liabilities in Excess of Other Assets - (1.84)% | | | | | | | | | | | (13,128,661 | ) |
TOTAL NET ASSETS - 100.00% | | | | | | | | | | $ | 713,864,491 | |
Asset Type | | % of Net Assets | |
Purchased Options | | | 101.58 | % |
Short Term Investments | | | 0.26 | |
Total Investments | | | 101.84 | |
Liabilities in Excess of Other Assets | | | (1.84 | ) |
Net Assets | | | 100.00 | % |
| | | | | |
Percentages are stated as a percent of net assets. | | | | |
(a) | Exchange-Traded. |
(b) | Purchased option contracts are held in connection with corresponding option contracts written short. |
(c) | The U.S. Bank Money Market Deposit Account (the “MMDA”) is a short-term investment vehicle in which the Fund holds cash balances. The MMDA will bear interest at a variable rate that is determined based on conditions and may change daily and by any amount. The rate shown is as of April 30, 2023. |
The accompanying notes are an integral part of these financial statements.
INNOVATOR U.S. EQUITY POWER BUFFER ETF – DECEMBER
Schedule of Options Written (a) | | | |
April 30, 2023 (Unaudited) (Continued) | | | |
Description | | Expiration | | | Strike Price | | | Contracts | | | Notional Amount | | | Value | |
Call Options | | | | | | | | | | | | | | | | | | | | |
SPY SPDR S&P 500® Trust ETF | | 11/30/2023 | | | $ | 482.61 | | | | 17,052 | | | $ | (709,243,836 | ) | | $ | (3,120,516 | ) |
| | | | | | | | | | | | | | | | | | | | (3,120,516 | ) |
Put Options | | | | | | | | | | | | | | | | | | | | |
SPY SPDR S&P 500® Trust ETF | | 11/30/2023 | | | | 346.53 | | | | 17,052 | | | | (709,243,836 | ) | | | (9,634,380 | ) |
| | | | | | | | | | | | | | | | | | | | (9,634,380 | ) |
Total Options Written (Premiums Received $38,000,996) | | | | | | | | | | | | | | | $ | (12,754,896 | ) |
The accompanying notes are an integral part of these financial statements.
INNOVATOR U.S. EQUITY ULTRA BUFFER ETF – JANUARY
Schedule of Investments | | | | | |
April 30, 2023 (Unaudited) | | | | | |
| | | Contracts | | | Notional Amount | | | Value | |
PURCHASED OPTIONS - 103.36% (a)(b) | | | | | | | | | | | | |
CALL OPTIONS - 101.18% | | | | | | | | | | | | |
SPY SPDR S&P 500® Trust ETF, Expires 12/29/2023, Strike Price $3.81 | | | 3,754 | | | $ | 156,140,122 | | | $ | 153,050,166 | |
| | | | | | | | | | | | 153,050,166 | |
PUT OPTIONS - 2.18% | | | | | | | | | | | | |
SPY SPDR S&P 500® Trust ETF, Expires 12/29/2023, Strike Price $363.31 | | | 3,754 | | | | 156,140,122 | | | | 3,297,739 | |
| | | | | | | | | | | | 3,297,739 | |
TOTAL PURCHASED OPTIONS (Cost $148,246,414) | | | | | | | | | | | 156,347,905 | |
| | | Principal Amount | | | | | | | | | |
SHORT TERM INVESTMENTS - 0.25% | | | | | | | | | | | | |
Money Market Deposit Account - 0.25% | | | | | | | | | | | | |
U.S. Bank Money Market Deposit Account, 4.650% (c) | | $ | 384,626 | | | | | | | | 384,626 | |
TOTAL SHORT TERM INVESTMENTS (Cost $384,626) | | | | | | | | | | | 384,626 | |
| | | | | | | | | | | | | |
Total Investments (Cost $148,631,040) - 103.61% | | | | | | | | | | | 156,732,531 | |
Liabilities in Excess of Other Assets - (3.61)% | | | | | | | | | | | (5,471,710 | ) |
TOTAL NET ASSETS - 100.00% | | | | | | | | | | $ | 151,260,821 | |
Asset Type | | % of Net Assets | |
Purchased Options | | | 103.36 | % |
Short Term Investments | | | 0.25 | |
Total Investments | | | 103.61 | |
Liabilities in Excess of Other Assets | | | (3.61 | ) |
Net Assets | | | 100.00 | % |
| | | | | |
Percentages are stated as a percent of net assets. | | | | |
(a) | Exchange-Traded. |
(b) | Purchased option contracts are held in connection with corresponding option contracts written short. |
(c) | The U.S. Bank Money Market Deposit Account (the “MMDA”) is a short-term investment vehicle in which the Fund holds cash balances. The MMDA will bear interest at a variable rate that is determined based on conditions and may change daily and by any amount. The rate shown is as of April 30, 2023. |
The accompanying notes are an integral part of these financial statements.
INNOVATOR U.S. EQUITY ULTRA BUFFER ETF – JANUARY
Schedule of Options Written (a) | | | |
April 30, 2023 (Unaudited) (Continued) | | | |
Description | | Expiration | | | Strike Price | | | Contracts | | | Notional Amount | | | Value | |
Call Options | | | | | | | | | | | | | | | | | | | | |
SPY SPDR S&P 500® Trust ETF | | 12/29/2023 | | | $ | 445.15 | | | | 3,754 | | | $ | (156,140,122 | ) | | $ | (4,777,003 | ) |
| | | | | | | | | | | | | | | | | | | | (4,777,003 | ) |
Put Options | | | | | | | | | | | | | | | | | | | | |
SPY SPDR S&P 500® Trust ETF | | 12/29/2023 | | | | 248.58 | | | | 3,754 | | | | (156,140,122 | ) | | | (598,162 | ) |
| | | | | | | | | | | | | | | | | | | | (598,162 | ) |
Total Options Written (Premiums Received $6,084,139) | | | | | | | | | | | | | | | $ | (5,375,165 | ) |
The accompanying notes are an integral part of these financial statements.
INNOVATOR U.S. EQUITY ULTRA BUFFER ETF – FEBRUARY
Schedule of Investments | | | | | |
April 30, 2023 (Unaudited) | | | | | |
| | | Contracts | | | Notional Amount | | | Value | |
PURCHASED OPTIONS - 102.51% (a)(b) | | | | | | | | | | | | |
CALL OPTIONS - 99.18% | | | | | | | | | | | | |
SPY SPDR S&P 500® Trust ETF, Expires 1/31/2024, Strike Price $4.05 | | | 2,221 | | | $ | 92,378,053 | | | $ | 90,495,445 | |
| | | | | | | | | | | | 90,495,445 | |
PUT OPTIONS - 3.33% | | | | | | | | | | | | |
SPY SPDR S&P 500® Trust ETF, Expires 1/31/2024, Strike Price $386.16 | | | 2,221 | | | | 92,378,053 | | | | 3,039,438 | |
| | | | | | | | | | | | 3,039,438 | |
TOTAL PURCHASED OPTIONS (Cost $92,300,483) | | | | | | | | | | | 93,534,883 | |
| | | Principal Amount | | | | | | | | | |
SHORT TERM INVESTMENTS - 0.25% | | | | | | | | | | | | |
Money Market Deposit Account - 0.25% | | | | | | | | | | | | |
U.S. Bank Money Market Deposit Account, 4.650% (c) | | $ | 225,448 | | | | | | | | 225,448 | |
TOTAL SHORT TERM INVESTMENTS (Cost $225,448) | | | | | | | | | | | 225,448 | |
| | | | | | | | | | | | | |
Total Investments (Cost $92,525,931) - 102.76% | | | | | | | | | | | 93,760,331 | |
Liabilities in Excess of Other Assets - (2.76)% | | | | | | | | | | | (2,523,228 | ) |
TOTAL NET ASSETS - 100.00% | | | | | | | | | | $ | 91,237,103 | |
Asset Type | | % of Net Assets | |
Purchased Options | | | 102.51 | % |
Short Term Investments | | | 0.25 | |
Total Investments | | | 102.76 | |
Liabilities in Excess of Other Assets | | | (2.76 | ) |
Net Assets | | | 100.00 | % |
| | | | | |
Percentages are stated as a percent of net assets. | | | | |
(a) | Exchange-Traded. |
(b) | Purchased option contracts are held in connection with corresponding option contracts written short. |
(c) | The U.S. Bank Money Market Deposit Account (the “MMDA”) is a short-term investment vehicle in which the Fund holds cash balances. The MMDA will bear interest at a variable rate that is determined based on conditions and may change daily and by any amount. The rate shown is as of April 30, 2023. |
The accompanying notes are an integral part of these financial statements.
INNOVATOR U.S. EQUITY ULTRA BUFFER ETF – FEBRUARY
Schedule of Options Written (a) | | | |
April 30, 2023 (Unaudited) (Continued) | | | |
Description | | Expiration | | | Strike Price | | | Contracts | | | Notional Amount | | | Value | |
Call Options | | | | | | | | | | | | | | | | | | | | |
SPY SPDR S&P 500® Trust ETF | | 1/31/2024 | | | $ | 460.54 | | | | 2,221 | | | $ | (92,378,053 | ) | | $ | (1,970,937 | ) |
| | | | | | | | | | | | | | | | | | | | (1,970,937 | ) |
Put Options | | | | | | | | | | | | | | | | | | | | |
SPY SPDR S&P 500® Trust ETF | | 1/31/2024 | | | | 264.21 | | | | 2,221 | | | | (92,378,053 | ) | | | (494,417 | ) |
| | | | | | | | | | | | | | | | | | | | (494,417 | ) |
Total Options Written (Premiums Received $2,938,517) | | | | | | | | | | | | | | | $ | (2,465,354 | ) |
The accompanying notes are an integral part of these financial statements.
INNOVATOR U.S. EQUITY ULTRA BUFFER ETF – MARCH
Schedule of Investments | | | | | |
April 30, 2023 (Unaudited) | | | | | |
| | | Contracts | | | Notional Amount | | | Value | |
PURCHASED OPTIONS - 103.59% (a)(b) | | | | | | | | | | | | |
CALL OPTIONS - 100.45% | | | | | | | | | | | | |
SPY SPDR S&P 500® Trust ETF, Expires 2/29/2024, Strike Price $3.95 | | | 1,787 | | | $ | 74,326,691 | | | $ | 72,878,560 | |
| | | | | | | | | | | | 72,878,560 | |
PUT OPTIONS - 3.14% | | | | | | | | | | | | |
SPY SPDR S&P 500® Trust ETF, Expires 2/29/2024, Strike Price $376.45 | | | 1,787 | | | | 74,326,691 | | | | 2,277,245 | |
| | | | | | | | | | | | 2,277,245 | |
TOTAL PURCHASED OPTIONS (Cost $72,405,242) | | | | | | | | | | | 75,155,805 | |
| | | Principal Amount | | | | | | | | | |
SHORT TERM INVESTMENTS - 0.29% | | | | | | | | | | | | |
Money Market Deposit Account - 0.29% | | | | | | | | | | | | |
U.S. Bank Money Market Deposit Account, 4.650% (c) | | $ | 210,012 | | | | | | | | 210,012 | |
TOTAL SHORT TERM INVESTMENTS (Cost $210,012) | | | | | | | | | | | 210,012 | |
| | | | | | | | | | | | | |
Total Investments (Cost $72,615,254) - 103.88% | | | | | | | | | | | 75,365,817 | |
Liabilities in Excess of Other Assets - (3.88)% | | | | | | | | | | | (2,815,275 | ) |
TOTAL NET ASSETS - 100.00% | | | | | | | | | | $ | 72,550,542 | |
Asset Type | | % of Net Assets | |
Purchased Options | | | 103.59 | % |
Short Term Investments | | | 0.29 | |
Total Investments | | | 103.88 | |
Liabilities in Excess of Other Assets | | | (3.88 | ) |
Net Assets | | | 100.00 | % |
| | | | | |
Percentages are stated as a percent of net assets. | | | | |
(a) | Exchange-Traded. |
(b) | Purchased option contracts are held in connection with corresponding option contracts written short. |
(c) | The U.S. Bank Money Market Deposit Account (the “MMDA”) is a short-term investment vehicle in which the Fund holds cash balances. The MMDA will bear interest at a variable rate that is determined based on conditions and may change daily and by any amount. The rate shown is as of April 30, 2023. |
The accompanying notes are an integral part of these financial statements.
INNOVATOR U.S. EQUITY ULTRA BUFFER ETF – MARCH
Schedule of Options Written (a) | | | |
April 30, 2023 (Unaudited) (Continued) | | | |
Description | | Expiration | | | Strike Price | | | Contracts | | | Notional Amount | | | Value | |
Call Options | | | | | | | | | | | | | | | | | | | | |
SPY SPDR S&P 500® Trust ETF | | 2/29/2024 | | | $ | 454.43 | | | | 1,787 | | | $ | (74,326,691 | ) | | $ | (2,357,500 | ) |
| | | | | | | | | | | | | | | | | | | | (2,357,500 | ) |
Put Options | | | | | | | | | | | | | | | | | | | | |
SPY SPDR S&P 500® Trust ETF | | 2/29/2024 | | | | 257.57 | | | | 1,787 | | | | (74,326,691 | ) | | | (405,970 | ) |
| | | | | | | | | | | | | | | | | | | | (405,970 | ) |
Total Options Written (Premiums Received $2,276,542) | | | | | | | | | | | | | | | $ | (2,763,470 | ) |
The accompanying notes are an integral part of these financial statements.
INNOVATOR U.S. EQUITY ULTRA BUFFER ETF – APRIL
Schedule of Investments | | | | | |
April 30, 2023 (Unaudited) | | | | | |
| | | Contracts | | | Notional Amount | | | Value | |
PURCHASED OPTIONS - 102.96% (a)(b) | | | | | | | | | | | | |
CALL OPTIONS - 98.93% | | | | | | | | | | | | |
SPY SPDR S&P 500® Trust ETF, Expires 3/28/2024, Strike Price $4.08 | | | 3,728 | | | $ | 155,058,704 | | | $ | 151,494,065 | |
| | | | | | | | | | | | 151,494,065 | |
PUT OPTIONS - 4.03% | | | | | | | | | | | | |
SPY SPDR S&P 500® Trust ETF, Expires 3/28/2024, Strike Price $388.92 | | | 3,728 | | | | 155,058,704 | | | | 6,165,963 | |
| | | | | | | | | | | | 6,165,963 | |
TOTAL PURCHASED OPTIONS (Cost $156,438,919) | | | | | | | | | | | 157,660,028 | |
| | | Principal Amount | | | | | | | | | |
SHORT TERM INVESTMENTS - 0.28% | | | | | | | | | | | | |
Money Market Deposit Account - 0.28% | | | | | | | | | | | | |
U.S. Bank Money Market Deposit Account, 4.650% (c) | | $ | 429,743 | | | | | | | | 429,743 | |
TOTAL SHORT TERM INVESTMENTS (Cost $429,743) | | | | | | | | | | | 429,743 | |
| | | | | | | | | | | | | |
Total Investments (Cost $156,868,662) - 103.24% | | | | | | | | | | | 158,089,771 | |
Liabilities in Excess of Other Assets - (3.24)% | | | | | | | | | | | (4,953,133 | ) |
TOTAL NET ASSETS - 100.00% | | | | | | | | | | $ | 153,136,638 | |
Asset Type | | % of Net Assets | |
Purchased Options | | | 102.96 | % |
Short Term Investments | | | 0.28 | |
Total Investments | | | 103.24 | |
Liabilities in Excess of Other Assets | | | (3.24 | ) |
Net Assets | | | 100.00 | % |
| | | | | |
Percentages are stated as a percent of net assets. | | | | |
(a) | Exchange-Traded. |
(b) | Purchased option contracts are held in connection with corresponding option contracts written short. |
(c) | The U.S. Bank Money Market Deposit Account (the “MMDA”) is a short-term investment vehicle in which the Fund holds cash balances. The MMDA will bear interest at a variable rate that is determined based on conditions and may change daily and by any amount. The rate shown is as of April 30, 2023. |
The accompanying notes are an integral part of these financial statements.
INNOVATOR U.S. EQUITY ULTRA BUFFER ETF – APRIL
Schedule of Options Written (a) | | | |
April 30, 2023 (Unaudited) (Continued) | | | |
Description | | Expiration | | | Strike Price | | | Contracts | | | Notional Amount | | | Value | |
Call Options | | | | | | | | | | | | | | | | | | | | |
SPY SPDR S&P 500® Trust ETF | | 3/28/2024 | | | $ | 465.15 | | | | 3,728 | | | $ | (155,058,704 | ) | | $ | (3,806,027 | ) |
| | | | | | | | | | | | | | | | | | | | (3,806,027 | ) |
Put Options | | | | | | | | | | | | | | | | | | | | |
SPY SPDR S&P 500® Trust ETF | | 3/28/2024 | | | | 266.10 | | | | 3,728 | | | | (155,058,704 | ) | | | (1,050,662 | ) |
| | | | | | | | | | | | | | | | | | | | (1,050,662 | ) |
Total Options Written (Premiums Received $5,127,670) | | | | | | | | | | | | | | | $ | (4,856,689 | ) |
The accompanying notes are an integral part of these financial statements.
INNOVATOR U.S. EQUITY ULTRA BUFFER ETF – MAY
Schedule of Investments | | | | | |
April 30, 2023 (Unaudited) | | | | | |
| | | Contracts | | | Notional Amount | | | Value | |
PURCHASED OPTIONS - 103.10% (a)(b) | | | | | | | | | | | | |
CALL OPTIONS - 98.46% | | | | | | | | | | | | |
SPY SPDR S&P 500® Trust ETF, Expires 4/30/2024, Strike Price $4.15 | | | 2,362 | | | $ | 98,242,666 | | | $ | 95,963,336 | |
| | | | | | | | | | | | 95,963,336 | |
PUT OPTIONS - 4.64% | | | | | | | | | | | | |
SPY SPDR S&P 500® Trust ETF, Expires 4/30/2024, Strike Price $395.13 | | | 2,362 | | | | 98,242,666 | | | | 4,527,954 | |
| | | | | | | | | | | | 4,527,954 | |
TOTAL PURCHASED OPTIONS (Cost $100,501,442) | | | | | | | | | | | 100,491,290 | |
| | | Principal Amount | | | | | | | | | |
SHORT TERM INVESTMENTS - 0.29% | | | | | | | | | | | | |
Money Market Deposit Account - 0.29% | | | | | | | | | | | | |
U.S. Bank Money Market Deposit Account, 4.650% (c) | | $ | 282,521 | | | | | | | | 282,521 | |
TOTAL SHORT TERM INVESTMENTS (Cost $282,521) | | | | | | | | | | | 282,521 | |
| | | | | | | | | | | | | |
Total Investments (Cost $100,783,963) - 103.39% | | | | | | | | | | | 100,773,811 | |
Liabilities in Excess of Other Assets - (3.39)% | | | | | | | | | | | (3,307,493 | ) |
TOTAL NET ASSETS - 100.00% | | | | | | | | | | $ | 97,466,318 | |
Asset Type | | % of Net Assets | |
Purchased Options | | | 103.10 | % |
Short Term Investments | | | 0.29 | |
Total Investments | | | 103.39 | |
Liabilities in Excess of Other Assets | | | (3.39 | ) |
Net Assets | | | 100.00 | % |
| | | | | |
Percentages are stated as a percent of net assets. | | | | |
(a) | Exchange-Traded. |
(b) | Purchased option contracts are held in connection with corresponding option contracts written short. |
(c) | The U.S. Bank Money Market Deposit Account (the “MMDA”) is a short-term investment vehicle in which the Fund holds cash balances. The MMDA will bear interest at a variable rate that is determined based on conditions and may change daily and by any amount. The rate shown is as of April 30, 2023. |
The accompanying notes are an integral part of these financial statements.
INNOVATOR U.S. EQUITY ULTRA BUFFER ETF – MAY
Schedule of Options Written (a) | | | |
April 30, 2023 (Unaudited) (Continued) | | | |
Description | | Expiration | | | Strike Price | | | Contracts | | | Notional Amount | | | Value | |
Call Options | | | | | | | | | | | | | | | | | | | | |
SPY SPDR S&P 500® Trust ETF | | 4/30/2024 | | | $ | 470.42 | | | | 2,362 | | | $ | (98,242,666 | ) | | $ | (2,423,412 | ) |
| | | | | | | | | | | | | | | | | | | | (2,423,412 | ) |
Put Options | | | | | | | | | | | | | | | | | | | | |
SPY SPDR S&P 500® Trust ETF | | 4/30/2024 | | | | 270.35 | | | | 2,362 | | | | (98,242,666 | ) | | | (803,080 | ) |
| | | | | | | | | | | | | | | | | | | | (803,080 | ) |
Total Options Written (Premiums Received $3,216,314) | | | | | | | | | | | | | | | $ | (3,226,492 | ) |
The accompanying notes are an integral part of these financial statements.
INNOVATOR U.S. EQUITY ULTRA BUFFER ETF – JUNE
Schedule of Investments | | | | | |
April 30, 2023 (Unaudited) | | | | | |
| | | Contracts | | | Notional Amount | | | Value | |
PURCHASED OPTIONS - 99.85% (a)(b) | | | | | | | | | | | | |
CALL OPTIONS - 99.47% | | | | | | | | | | | | |
SPY SPDR S&P 500® Trust ETF, Expires 5/31/2023, Strike Price $4.12 | | | 2,181 | | | $ | 90,714,333 | | | $ | 89,862,151 | |
| | | | | | | | | | | | 89,862,151 | |
PUT OPTIONS - 0.38% | | | | | | | | | | | | |
SPY SPDR S&P 500® Trust ETF, Expires 5/31/2023, Strike Price $392.28 | | | 2,181 | | | | 90,714,333 | | | | 342,003 | |
| | | | | | | | | | | | 342,003 | |
TOTAL PURCHASED OPTIONS (Cost $90,009,586) | | | | | | | | | | | 90,204,154 | |
| | | Principal Amount | | | | | | | | | |
SHORT TERM INVESTMENTS - 0.24% | | | | | | | | | | | | |
Money Market Deposit Account - 0.24% | | | | | | | | | | | | |
U.S. Bank Money Market Deposit Account, 4.650% (c) | | $ | 213,917 | | | | | | | | 213,917 | |
TOTAL SHORT TERM INVESTMENTS (Cost $213,917) | | | | | | | | | | | 213,917 | |
| | | | | | | | | | | | | |
Total Investments (Cost $90,223,503) - 100.09% | | | | | | | | | | | 90,418,071 | |
Liabilities in Excess of Other Assets - (0.09)% | | | | | | | | | | | (75,930 | ) |
TOTAL NET ASSETS - 100.00% | | | | | | | | | | $ | 90,342,141 | |
Asset Type | | % of Net Assets | |
Purchased Options | | | 99.85 | % |
Short Term Investments | | | 0.24 | |
Total Investments | | | 100.09 | |
Liabilities in Excess of Other Assets | | | (0.09 | ) |
Net Assets | | | 100.00 | % |
| | | | | |
Percentages are stated as a percent of net assets. | | | | |
(a) | Exchange-Traded. |
(b) | Purchased option contracts are held in connection with corresponding option contracts written short. |
(c) | The U.S. Bank Money Market Deposit Account (the “MMDA”) is a short-term investment vehicle in which the Fund holds cash balances. The MMDA will bear interest at a variable rate that is determined based on conditions and may change daily and by any amount. The rate shown is as of April 30, 2023. |
The accompanying notes are an integral part of these financial statements.
INNOVATOR U.S. EQUITY ULTRA BUFFER ETF – JUNE
Schedule of Options Written (a) | | | |
April 30, 2023 (Unaudited) (Continued) | | | |
Description | | Expiration | | | Strike Price | | | Contracts | | | Notional Amount | | | Value | |
Call Options | | | | | | | | | | | | | | | | | | | | |
SPY SPDR S&P 500® Trust ETF | | 5/31/2023 | | | $ | 462.07 | | | | 2,181 | | | $ | (90,714,333 | ) | | $ | (5,584 | ) |
| | | | | | | | | | | | | | | | | | | | (5,584 | ) |
Put Options | | | | | | | | | | | | | | | | | | | | |
SPY SPDR S&P 500® Trust ETF | | 5/31/2023 | | | | 268.40 | | | | 2,181 | | | | (90,714,333 | ) | | | (12,148 | ) |
| | | | | | | | | | | | | | | | | | | | (12,148 | ) |
Total Options Written (Premiums Received $2,598,568) | | | | | | | | | | | | | | | $ | (17,732 | ) |
The accompanying notes are an integral part of these financial statements.
INNOVATOR U.S. EQUITY ULTRA BUFFER ETF – JULY
Schedule of Investments | | | | |
April 30, 2023 (Unaudited) | | | | |
| | | Contracts | | | Notional Amount | | | Value | |
PURCHASED OPTIONS - 100.61% (a)(b) | | | | | | | | | | | | |
CALL OPTIONS - 100.30% | | | | | | | | | | | | |
SPY SPDR S&P 500® Trust ETF, Expires 6/30/2023, Strike Price $3.76 | | | 1,328 | | | $ | 55,235,504 | | | $ | 54,497,135 | |
| | | | | | | | | | | | 54,497,135 | |
PUT OPTIONS - 0.31% | | | | | | | | | | | | |
SPY SPDR S&P 500® Trust ETF, Expires 6/30/2023, Strike Price $358.39 | | | 1,328 | | | | 55,235,504 | | | | 167,328 | |
| | | | | | | | | | | | 167,328 | |
TOTAL PURCHASED OPTIONS (Cost $52,401,805) | | | | | | | | | | | 54,664,463 | |
| | | Principal Amount | | | | | | | | | |
SHORT TERM INVESTMENTS - 0.16% | | | | | | | | | | | | |
Money Market Deposit Account - 0.16% | | | | | | | | | | | | |
U.S. Bank Money Market Deposit Account, 4.650% (c) | | $ | 87,132 | | | | | | | | 87,132 | |
TOTAL SHORT TERM INVESTMENTS (Cost $87,132) | | | | | | | | | | | 87,132 | |
| | | | | | | | | | | | | |
Total Investments (Cost $52,488,937) - 100.77% | | | | | | | | | | | 54,751,595 | |
Liabilities in Excess of Other Assets - (0.77)% | | | | | | | | | | | (419,106 | ) |
TOTAL NET ASSETS - 100.00% | | | | | | | | | | $ | 54,332,489 | |
Asset Type | | % of Net Assets | |
Purchased Options | | | 100.61 | % |
Short Term Investments | | | 0.16 | |
Total Investments | | | 100.77 | |
Liabilities in Excess of Other Assets | | | (0.77 | ) |
Net Assets | | | 100.00 | % |
| | | | | |
Percentages are stated as a percent of net assets. | | | | |
(a) | Exchange-Traded. |
(b) | Purchased option contracts are held in connection with corresponding option contracts written short. |
(c) | The U.S. Bank Money Market Deposit Account (the “MMDA”) is a short-term investment vehicle in which the Fund holds cash balances. The MMDA will bear interest at a variable rate that is determined based on conditions and may change daily and by any amount. The rate shown is as of April 30, 2023. |
The accompanying notes are an integral part of these financial statements.
INNOVATOR U.S. EQUITY ULTRA BUFFER ETF – JULY
Schedule of Options Written (a) | | | |
April 30, 2023 (Unaudited) (Continued) | | | |
Description | | Expiration | | | Strike Price | | | Contracts | | | Notional Amount | | | Value | |
Call Options | | | | | | | | | | | | | | | | | | | | |
SPY SPDR S&P 500® Trust ETF | | 6/30/2023 | | | $ | 431.61 | | | | 1,328 | | | $ | (55,235,504 | ) | | $ | (424,960 | ) |
| | | | | | | | | | | | | | | | | | | | (424,960 | ) |
Put Options | | | | | | | | | | | | | | | | | | | | |
SPY SPDR S&P 500® Trust ETF | | 6/30/2023 | | | | 245.21 | | | | 1,328 | | | | (55,235,504 | ) | | | (6,640 | ) |
| | | | | | | | | | | | | | | | | | | | (6,640 | ) |
Total Options Written (Premiums Received $2,442,944) | | | | | | | | | | | | | | | $ | (431,600 | ) |
The accompanying notes are an integral part of these financial statements.
INNOVATOR U.S. EQUITY ULTRA BUFFER ETF – AUGUST
Schedule of Investments | | | | |
April 30, 2023 (Unaudited) | | | | |
| | | Contracts | | | Notional Amount | | | Value | |
PURCHASED OPTIONS - 99.98% (a)(b) | | | | | | | | | | | | |
CALL OPTIONS - 98.57% | | | | | | | | | | | | |
SPY SPDR S&P 500® Trust ETF, Expires 7/31/2023, Strike Price $4.11 | | | 3,097 | | | $ | 128,813,521 | | | $ | 127,091,589 | |
| | | | | | | | | | | | 127,091,589 | |
PUT OPTIONS - 1.41% | | | | | | | | | | | | |
SPY SPDR S&P 500® Trust ETF, Expires 7/31/2023, Strike Price $391.39 | | | 3,097 | | | | 128,813,521 | | | | 1,817,939 | |
| | | | | | | | | | | | 1,817,939 | |
TOTAL PURCHASED OPTIONS (Cost $129,625,428) | | | | | | | | | | | 128,909,528 | |
| | | Principal Amount | | | | | | | | | |
SHORT TERM INVESTMENTS - 0.22% | | | | | | | | | | | | |
Money Market Deposit Account - 0.22% | | | | | | | | | | | | |
U.S. Bank Money Market Deposit Account, 4.650% (c) | | $ | 281,268 | | | | | | | | 281,268 | |
TOTAL SHORT TERM INVESTMENTS (Cost $281,268) | | | | | | | | | | | 281,268 | |
| | | | | | | | | | | | | |
Total Investments (Cost $129,906,696) - 100.20% | | | | | | | | | | | 129,190,796 | |
Liabilities in Excess of Other Assets - (0.20)% | | | | | | | | | | | (258,244 | ) |
TOTAL NET ASSETS - 100.00% | | | | | | | | | | $ | 128,932,552 | |
Asset Type | | % of Net Assets | |
Purchased Options | | | 99.98 | % |
Short Term Investments | | | 0.22 | |
Total Investments | | | 100.20 | |
Liabilities in Excess of Other Assets | | | (0.20 | ) |
Net Assets | | | 100.00 | % |
| | | | | |
Percentages are stated as a percent of net assets. | | | | |
(a) | Exchange-Traded. |
(b) | Purchased option contracts are held in connection with corresponding option contracts written short. |
(c) | The U.S. Bank Money Market Deposit Account (the “MMDA”) is a short-term investment vehicle in which the Fund holds cash balances. The MMDA will bear interest at a variable rate that is determined based on conditions and may change daily and by any amount. The rate shown is as of April 30, 2023. |
The accompanying notes are an integral part of these financial statements.
INNOVATOR U.S. EQUITY ULTRA BUFFER ETF – AUGUST
Schedule of Options Written (a) | | | |
April 30, 2023 (Unaudited) (Continued) | | | |
Description | | Expiration | | | Strike Price | | | Contracts | | | Notional Amount | | | Value | |
Call Options | | | | | | | | | | | | | | | | | | | | |
SPY SPDR S&P 500® Trust ETF | | 7/31/2023 | | | $ | 466.17 | | | | 3,097 | | | $ | (128,813,521 | ) | | $ | (108,395 | ) |
| | | | | | | | | | | | | | | | | | | | (108,395 | ) |
Put Options | | | | | | | | | | | | | | | | | | | | |
SPY SPDR S&P 500® Trust ETF | | 7/31/2023 | | | | 267.79 | | | | 3,097 | | | | (128,813,521 | ) | | | (133,171 | ) |
| | | | | | | | | | | | | | | | | | | | (133,171 | ) |
Total Options Written (Premiums Received $3,484,307) | | | | | | | | | | | | | | | $ | (241,566 | ) |
The accompanying notes are an integral part of these financial statements.
INNOVATOR U.S. EQUITY ULTRA BUFFER ETF – SEPTEMBER
Schedule of Investments | | | | | |
April 30, 2023 (Unaudited) | | | | | |
| | | Contracts | | | Notional Amount | | | Value | |
PURCHASED OPTIONS - 100.63% (a)(b) | | | | | | | | | | | | |
CALL OPTIONS - 99.34% | | | | | | | | | | | | |
SPY SPDR S&P 500® Trust ETF, Expires 8/31/2023, Strike Price $3.94 | | | 2,630 | | | $ | 109,389,590 | | | $ | 108,029,512 | |
| | | | | | | | | | | | 108,029,512 | |
PUT OPTIONS - 1.29% | | | | | | | | | | | | |
SPY SPDR S&P 500® Trust ETF, Expires 8/31/2023, Strike Price $375.42 | | | 2,630 | | | | 109,389,590 | | | | 1,400,291 | |
| | | | | | | | | | | | 1,400,291 | |
TOTAL PURCHASED OPTIONS (Cost $108,014,550) | | | | | | | | | | | 109,429,803 | |
| | | Principal Amount | | | | | | | | | |
SHORT TERM INVESTMENTS - 0.26% | | | | | | | | | | | | |
Money Market Deposit Account - 0.26% | | | | | | | | | | | | |
U.S. Bank Money Market Deposit Account, 4.650% (c) | | $ | 280,442 | | | | | | | | 280,442 | |
TOTAL SHORT TERM INVESTMENTS (Cost $280,442) | | | | | | | | | | | 280,442 | |
| | | | | | | | | | | | | |
Total Investments (Cost $108,294,992) - 100.89% | | | | | | | | | | | 109,710,245 | |
Liabilities in Excess of Other Assets - (0.89)% | | | | | | | | | | | (971,355 | ) |
TOTAL NET ASSETS - 100.00% | | | | | | | | | | $ | 108,738,890 | |
Asset Type | | % of Net Assets | |
Purchased Options | | | 100.63 | % |
Short Term Investments | | | 0.26 | |
Total Investments | | | 100.89 | |
Liabilities in Excess of Other Assets | | | (0.89 | ) |
Net Assets | | | 100.00 | % |
| | | | | |
Percentages are stated as a percent of net assets. | | | | |
(a) | Exchange-Traded. |
(b) | Purchased option contracts are held in connection with corresponding option contracts written short. |
(c) | The U.S. Bank Money Market Deposit Account (the “MMDA”) is a short-term investment vehicle in which the Fund holds cash balances. The MMDA will bear interest at a variable rate that is determined based on conditions and may change daily and by any amount. The rate shown is as of April 30, 2023. |
The accompanying notes are an integral part of these financial statements.
INNOVATOR U.S. EQUITY ULTRA BUFFER ETF – SEPTEMBER
Schedule of Options Written (a) | | | |
April 30, 2023 (Unaudited) (Continued) | | | |
Description | | Expiration | | | Strike Price | | | Contracts | | | Notional Amount | | | Value | |
Call Options | | | | | | | | | | | | | | | | | | | | |
SPY SPDR S&P 500® Trust ETF | | 8/31/2023 | | | $ | 452.16 | | | | 2,630 | | | $ | (109,389,590 | ) | | $ | (726,853 | ) |
| | | | | | | | | | | | | | | | | | | | (726,853 | ) |
Put Options | | | | | | | | | | | | | | | | | | | | |
SPY SPDR S&P 500® Trust ETF | | 8/31/2023 | | | | 256.87 | | | | 2,630 | | | | (109,389,590 | ) | | | (174,422 | ) |
| | | | | | | | | | | | | | | | | | | | (174,422 | ) |
Total Options Written (Premiums Received $3,462,844) | | | | | | | | | | | | | | | $ | (901,275 | ) |
The accompanying notes are an integral part of these financial statements.
INNOVATOR U.S. EQUITY ULTRA BUFFER ETF – OCTOBER
Schedule of Investments | | | | | |
April 30, 2023 (Unaudited) | | | | | |
| | | Contracts | | | Notional Amount | | | Value | |
PURCHASED OPTIONS - 105.13% (a)(b) | | | | | | | | | | | | |
CALL OPTIONS - 104.26% | | | | | | | | | | | | |
SPY SPDR S&P 500® Trust ETF, Expires 9/29/2023, Strike Price $3.56 | | | 2,413 | | | $ | 100,363,909 | | | $ | 98,811,143 | |
| | | | | | | | | | | | 98,811,143 | |
PUT OPTIONS - 0.87% | | | | | | | | | | | | |
SPY SPDR S&P 500® Trust ETF, Expires 9/29/2023, Strike Price $339.32 | | | 2,413 | | | | 100,363,909 | | | | 821,554 | |
| | | | | | | | | | | | 821,554 | |
TOTAL PURCHASED OPTIONS (Cost $90,184,429) | | | | | | | | | | | 99,632,697 | |
| | | Principal Amount | | | | | | | | | |
SHORT TERM INVESTMENTS - 0.22% | | | | | | | | | | | | |
Money Market Deposit Account - 0.22% | | | | | | | | | | | | |
U.S. Bank Money Market Deposit Account, 4.650% (c) | | $ | 211,858 | | | | | | | | 211,858 | |
TOTAL SHORT TERM INVESTMENTS (Cost $211,858) | | | | | | | | | | | 211,858 | |
| | | | | | | | | | | | | |
Total Investments (Cost $90,396,287) - 105.35% | | | | | | | | | | | 99,844,555 | |
Liabilities in Excess of Other Assets - (5.35)% | | | | | | | | | | | (5,072,009 | ) |
TOTAL NET ASSETS - 100.00% | | | | | | | | | | $ | 94,772,546 | |
Asset Type | | % of Net Assets | |
Purchased Options | | | 105.13 | % |
Short Term Investments | | | 0.22 | |
Total Investments | | | 105.35 | |
Liabilities in Excess of Other Assets | | | (5.35 | ) |
Net Assets | | | 100.00 | % |
| | | | | |
Percentages are stated as a percent of net assets. | | | | |
(a) | Exchange-Traded. |
(b) | Purchased option contracts are held in connection with corresponding option contracts written short. |
(c) | The U.S. Bank Money Market Deposit Account (the “MMDA”) is a short-term investment vehicle in which the Fund holds cash balances. The MMDA will bear interest at a variable rate that is determined based on conditions and may change daily and by any amount. The rate shown is as of April 30, 2023. |
The accompanying notes are an integral part of these financial statements.
INNOVATOR U.S. EQUITY ULTRA BUFFER ETF – OCTOBER
Schedule of Options Written (a) | | | |
April 30, 2023 (Unaudited) (Continued) | | | |
Description | | Expiration | | | Strike Price | | | Contracts | | | Notional Amount | | | Value | |
Call Options | | | | | | | | | | | | | | | | | | | | |
SPY SPDR S&P 500® Trust ETF | | 9/29/2023 | | | $ | 418.22 | | | | 2,413 | | | $ | (100,363,909 | ) | | $ | (4,837,630 | ) |
| | | | | | | | | | | | | | | | | | | | (4,837,630 | ) |
Put Options | | | | | | | | | | | | | | | | | | | | |
SPY SPDR S&P 500® Trust ETF | | 9/29/2023 | | | | 232.17 | | | | 2,413 | | | | (100,363,909 | ) | | | (173,133 | ) |
| | | | | | | | | | | | | | | | | | | | (173,133 | ) |
Total Options Written (Premiums Received $4,647,191) | | | | | | | | | | | | | | | $ | (5,010,763 | ) |
The accompanying notes are an integral part of these financial statements.
INNOVATOR U.S. EQUITY ULTRA BUFFER ETF – NOVEMBER
Schedule of Investments | | | | |
April 30, 2023 (Unaudited) | | | | |
| | | Contracts | | | Notional Amount | | | Value | |
PURCHASED OPTIONS - 101.63% (a)(b) | | | | | | | | | | | | |
CALL OPTIONS - 99.91% | | | | | | | | | | | | |
SPY SPDR S&P 500® Trust ETF, Expires 10/31/2023, Strike Price $3.85 | | | 1,238 | | | $ | 51,492,134 | | | $ | 50,668,394 | |
| | | | | | | | | | | | 50,668,394 | |
PUT OPTIONS - 1.72% | | | | | | | | | | | | |
SPY SPDR S&P 500® Trust ETF, Expires 10/31/2023, Strike Price $366.90 | | | 1,238 | | | | 51,492,134 | | | | 872,790 | |
| | | | | | | | | | | | 872,790 | |
TOTAL PURCHASED OPTIONS (Cost $49,805,192) | | | | | | | | | | | 51,541,184 | |
| | | Principal Amount | | | | | | | | | |
SHORT TERM INVESTMENTS - 0.24% | | | | | | | | | | | | |
Money Market Deposit Account - 0.24% | | | | | | | | | | | | |
U.S. Bank Money Market Deposit Account, 4.650% (c) | | $ | 123,848 | | | | | | | | 123,848 | |
TOTAL SHORT TERM INVESTMENTS (Cost $123,848) | | | | | | | | | | | 123,848 | |
| | | | | | | | | | | | | |
Total Investments (Cost $49,929,040) - 101.87% | | | | | | | | | | | 51,665,032 | |
Liabilities in Excess of Other Assets - (1.87)% | | | | | | | | | | | (951,240 | ) |
TOTAL NET ASSETS - 100.00% | | | | | | | | | | $ | 50,713,792 | |
Asset Type | | % of Net Assets | |
Purchased Options | | | 101.63 | % |
Short Term Investments | | | 0.24 | |
Total Investments | | | 101.87 | |
Liabilities in Excess of Other Assets | | | (1.87 | ) |
Net Assets | | | 100.00 | % |
| | | | | |
Percentages are stated as a percent of net assets. | | | | |
(a) | Exchange-Traded. |
(b) | Purchased option contracts are held in connection with corresponding option contracts written short. |
(c) | The U.S. Bank Money Market Deposit Account (the “MMDA”) is a short-term investment vehicle in which the Fund holds cash balances. The MMDA will bear interest at a variable rate that is determined based on conditions and may change daily and by any amount. The rate shown is as of April 30, 2023. |
The accompanying notes are an integral part of these financial statements.
INNOVATOR U.S. EQUITY ULTRA BUFFER ETF – NOVEMBER
Schedule of Options Written (a) | | | |
April 30, 2023 (Unaudited) (Continued) | | | |
Description | | Expiration | | | Strike Price | | | Contracts | | | Notional Amount | | | Value | |
Call Options | | | | | | | | | | | | | | | | | | | | |
SPY SPDR S&P 500® Trust ETF | | 10/31/2023 | | | $ | 452.21 | | | | 1,238 | | | $ | (51,492,134 | ) | | $ | (776,176 | ) |
| | | | | | | | | | | | | | | | | | | | (776,176 | ) |
Put Options | | | | | | | | | | | | | | | | | | | | |
SPY SPDR S&P 500® Trust ETF | | 10/31/2023 | | | | 251.04 | | | | 1,238 | | | | (51,492,134 | ) | | | (142,531 | ) |
| | | | | | | | | | | | | | | | | | | | (142,531 | ) |
Total Options Written (Premiums Received $2,157,816) | | | | | | | | | | | | | | | $ | (918,707 | ) |
The accompanying notes are an integral part of these financial statements.
INNOVATOR U.S. EQUITY ULTRA BUFFER ETF – DECEMBER
Schedule of Investments | | | | |
April 30, 2023 (Unaudited) | | | | |
| | | Contracts | | | Notional Amount | | | Value | |
PURCHASED OPTIONS - 100.97% (a)(b) | | | | | | | | | | | | |
CALL OPTIONS - 98.24% | | | | | | | | | | | | |
SPY SPDR S&P 500® Trust ETF, Expires 11/30/2023, Strike Price $4.06 | | | 2,459 | | | $ | 102,277,187 | | | $ | 100,637,010 | |
| | | | | | | | | | | | 100,637,010 | |
PUT OPTIONS - 2.73% | | | | | | | | | | | | |
SPY SPDR S&P 500® Trust ETF, Expires 11/30/2023, Strike Price $387.30 | | | 2,459 | | | | 102,277,187 | | | | 2,800,334 | |
| | | | | | | | | | | | 2,800,334 | |
TOTAL PURCHASED OPTIONS (Cost $103,114,995) | | | | | | | | | | | 103,437,344 | |
| | | Principal Amount | | | | | | | | | |
SHORT TERM INVESTMENTS - 0.27% | | | | | | | | | | | | |
Money Market Deposit Account - 0.27% | | | | | | | | | | | | |
U.S. Bank Money Market Deposit Account, 4.650% (c) | | $ | 276,812 | | | | | | | | 276,812 | |
TOTAL SHORT TERM INVESTMENTS (Cost $276,812) | | | | | | | | | | | 276,812 | |
| | | | | | | | | | | | | |
Total Investments (Cost $103,391,807) - 101.24% | | | | | | | | | | | 103,714,156 | |
Liabilities in Excess of Other Assets - (1.24)% | | | | | | | | | | | (1,270,747 | ) |
TOTAL NET ASSETS - 100.00% | | | | | | | | | | $ | 102,443,409 | |
Asset Type | | % of Net Assets | |
Purchased Options | | | 100.97 | % |
Short Term Investments | | | 0.27 | |
Total Investments | | | 101.24 | |
Liabilities in Excess of Other Assets | | | (1.24 | ) |
Net Assets | | | 100.00 | % |
| | | | | |
Percentages are stated as a percent of net assets. | | | | |
(a) | Exchange-Traded. |
(b) | Purchased option contracts are held in connection with corresponding option contracts written short. |
(c) | The U.S. Bank Money Market Deposit Account (the “MMDA”) is a short-term investment vehicle in which the Fund holds cash balances. The MMDA will bear interest at a variable rate that is determined based on conditions and may change daily and by any amount. The rate shown is as of April 30, 2023. |
The accompanying notes are an integral part of these financial statements.
INNOVATOR U.S. EQUITY ULTRA BUFFER ETF – DECEMBER
Schedule of Options Written (a) | | | |
April 30, 2023 (Unaudited) (Continued) | | | |
Description | | Expiration | | | Strike Price | | | Contracts | | | Notional Amount | | | Value | |
Call Options | | | | | | | | | | | | | | | | | | | | |
SPY SPDR S&P 500® Trust ETF | | 11/30/2023 | | | $ | 471.69 | | | | 2,459 | | | $ | (102,277,187 | ) | | $ | (796,052 | ) |
| | | | | | | | | | | | | | | | | | | | (796,052 | ) |
Put Options | | | | | | | | | | | | | | | | | | | | |
SPY SPDR S&P 500® Trust ETF | | 11/30/2023 | | | | 264.99 | | | | 2,459 | | | | (102,277,187 | ) | | | (409,694 | ) |
| | | | | | | | | | | | | | | | | | | | (409,694 | ) |
Total Options Written (Premiums Received $2,810,012) | | | | | | | | | | | | | | | $ | (1,205,746 | ) |
The accompanying notes are an integral part of these financial statements.
INNOVATOR PREMIUM INCOME 10 BARRIER ETF – APRIL
Schedule of Investments | | | | |
April 30, 2023 (Unaudited) | | | | |
| | | Contracts | | | Notional Amount | | | Value | |
PURCHASED OPTIONS - 28.87% (a)(b) | | | | | | | | | | | | |
PUT OPTIONS - 28.87% | | | | | | | | | | | | |
SPX S&P 500® Index, Expires 3/28/2024, Strike Price $3,656.95 | | | 75 | | | | 31,271,100 | | | $ | 891,090 | |
TOTAL PURCHASED OPTIONS (Cost $982,091) | | | | | | | | | | | 891,090 | |
| | | | | | | | | | | | | |
SHORT TERM INVESTMENTS - 104.81% | | Principal Amount | | | | | | | | | |
U.S. Treasury Bill - 104.71% | | | | | | | | | | | | |
United States Treasury Bill, 2.657%, 6/29/2023 (c)(d) | | $ | 71,300 | | | | | | | | 70,726 | |
United States Treasury Bill, 3.228%, 9/28/2023 (c)(d) | | | 71,500 | | | | | | | | 70,080 | |
United States Treasury Bill, 3.031%, 12/28/2023 (c)(d) | | | 71,600 | | | | | | | | 69,514 | |
United States Treasury Bill, 3.271%, 3/21/2024 (c)(d) | | | 3,152,300 | | | | | | | | 3,021,249 | |
| | | | | | | | | | | | 3,231,569 | |
Money Market Deposit Account - 0.10% | | | | | | | | | | | | |
U.S. Bank Money Market Deposit Account, 4.800% (e) | | | 2,984 | | | | | | | | 2,984 | |
TOTAL SHORT TERM INVESTMENTS (Cost $3,238,562) | | | | | | | | | | | 3,234,553 | |
| | | | | | | | | | | | | |
Total Investments (Cost $4,220,653) - 133.68% | | | | | | | | | | | 4,125,643 | |
Liabilities in Excess of Other Assets - (33.68)% | | | | | | | | | | | (1,039,357 | ) |
TOTAL NET ASSETS - 100.00% | | | | | | | | | | $ | 3,086,286 | |
Asset Type | | % of Net Assets | |
Purchased Options | | | 28.87 | % |
Short Term Investments | | | 104.81 | |
Total Investments | | | 133.68 | |
Liabilities in Excess of Other Assets | | | (33.68 | ) |
Net Assets | | | 100.00 | % |
Percentages are stated as a percent of net assets.
(b) | Purchased option contracts are held in connection with corresponding option contracts written short. |
(c) | Rate disclosed is the effective yield as of April 30, 2023. |
(d) | All or a portion of the security can be pledged as collateral in connection with options written contracts. |
(e) | The U.S. Bank Money Market Deposit Account (the “MMDA”) is a short-term investment vehicle in which the Fund holds cash balances. The MMDA will bear interest at a variable rate that is determined based on conditions and may change daily and by any amount. The rate shown is as of April 30, 2023. |
The accompanying notes are an integral part of these financial statements.
INNOVATOR PREMIUM INCOME 10 BARRIER ETF – APRIL
Schedule of Options Written (a) | | |
April 30, 2023 (Unaudited) (Continued) | | |
Description | | Expiration | | | Strike Price | | | Contracts | | | Notional Amount | | | Value | |
Put Options | | | | | | | | | | | | | | | | | | | | |
SPX S&P 500® Index | | 3/28/2024 | | | $ | 3,698.04 | | | | 80 | | | $ | (33,355,840 | ) | | $ | (1,006,590 | ) |
XSP S&P 500® Mini Index | | 3/28/2024 | | | | 369.80 | | | | 25 | | | | (1,042,375 | ) | | | (31,462 | ) |
| | | | | | | | | | | | | | | | | | | | | |
Total Options Written (Premiums Received $1,141,770) | | | | | | | | | | | | | | | | | | $ | (1,038,052 | ) |
The accompanying notes are an integral part of these financial statements.
INNOVATOR PREMIUM INCOME 20 BARRIER ETF – APRIL
Schedule of Investments | |
April 30, 2023 (Unaudited) | |
| | |
| | | Contracts | | | Notional Amount | | | Value | |
PURCHASED OPTIONS - 32.00% (a)(b) | | | | | | | | | | | | |
PUT OPTIONS - 32.00% | | | | | | | | | | | | |
SPX S&P 500® Index, Expires 3/28/2024, Strike Price $3,246.05 | | | 690 | | | | 287,694,120 | | | $ | 4,531,741 | |
TOTAL PURCHASED OPTIONS (Cost $5,012,941) | | | | | | | | | | | 4,531,741 | |
| | | | | | | | | | | | | |
SHORT TERM INVESTMENTS - 103.72% | | Principal Amount | | | | | | | | | |
U.S. Treasury Bill - 103.61% | | | | | | | | | | | | |
United States Treasury Bill, 3.496%, 6/29/2023 (c)(d) | | $ | 279,800 | | | | | | | | 277,549 | |
United States Treasury Bill, 4.022%, 9/28/2023 (c)(d) | | | 280,400 | | | | | | | | 274,832 | |
United States Treasury Bill, 3.731%, 12/28/2023 (c)(d) | | | 280,900 | | | | | | | | 272,715 | |
United States Treasury Bill, 4.017%, 3/21/2024 (c)(d) | | | 14,448,600 | | | | | | | | 13,847,930 | |
| | | | | | | | | | | | 14,673,026 | |
Money Market Deposit Account - 0.11% | | | | | | | | | | | | |
U.S. Bank Money Market Deposit Account, 4.800% (e) | | | 15,105 | | | | | | | | 15,105 | |
TOTAL SHORT TERM INVESTMENTS (Cost $14,705,521) | | | | | | | | | | | 14,688,131 | |
| | | | | | | | | | | | | |
Total Investments (Cost $19,718,462) - 135.72% | | | | | | | | | | | 19,219,872 | |
Liabilities in Excess of Other Assets - (35.72)% | | | | | | | | | | | (5,058,743 | ) |
TOTAL NET ASSETS - 100.00% | | | | | | | | | | $ | 14,161,129 | |
Asset Type | | % of Net Assets | |
Purchased Options | | | 32.00 | % |
Short Term Investments | | | 103.72 | |
Total Investments | | | 135.72 | |
Liabilities in Excess of Other Assets | | | (35.72 | ) |
Net Assets | | | 100.00 | % |
Percentages are stated as a percent of net assets.
(b) | Purchased option contracts are held in connection with corresponding option contracts written short. |
(c) | Rate disclosed is the effective yield as of April 30, 2023. |
(d) | All or a portion of the security can be pledged as collateral in connection with options written contracts. |
(e) | The U.S. Bank Money Market Deposit Account (the “MMDA”) is a short-term investment vehicle in which the Fund holds cash balances. The MMDA will bear interest at a variable rate that is determined based on conditions and may change daily and by any amount. The rate shown is as of April 30, 2023. |
The accompanying notes are an integral part of these financial statements.
INNOVATOR PREMIUM INCOME 20 BARRIER ETF – APRIL
Schedule of Options Written (a) | | | |
April 30, 2023 (Unaudited) (Continued) | | | |
Description | | Expiration | | | Strike Price | | | Contracts | | | Notional Amount | | | Value | |
Put Options | | | | | | | | | | | | | | | | | | | | |
SPX S&P 500® Index | | 3/28/2024 | | | $ | 3,287.14 | | | | 713 | | | $ | (297,283,924 | ) | | $ | (4,974,693 | ) |
XSP S&P 500® Mini Index | | 3/28/2024 | | | | 328.71 | | | | 115 | | | | (4,794,925 | ) | | | (80,092 | ) |
| | | | | | | | | | | | | | | | | | | | | |
Total Options Written (Premiums Received $5,582,674) | | | | | | | | | | | | | | | | | | $ | (5,054,785 | ) |
| | | | | | | | | | | | | | | | | | | | | |
(a) Exchange-Traded. | | | | | | | | | | | | | | | | | | | | |
The accompanying notes are an integral part of these financial statements.
INNOVATOR PREMIUM INCOME 30 BARRIER ETF – APRIL
Schedule of Investments | | | | | |
April 30, 2023 (Unaudited) | | | | | |
| | | Contracts | | | Notional Amount | | | Value | |
PURCHASED OPTIONS - 26.39% (a)(b) | | | | | | | | | | | | |
PUT OPTIONS - 26.39% | | | | | | | | | | | | |
SPX S&P 500® Index, Expires 3/28/2024, Strike Price $2,835.16 | | | 1,935 | | | | 806,794,380 | | | $ | 6,975,114 | |
TOTAL PURCHASED OPTIONS (Cost $7,991,146) | | | | | | | | | | | 6,975,114 | |
| | | | | | | | | | | | | |
SHORT TERM INVESTMENTS - 102.57% | | Principal Amount | | | | | | | | | |
U.S. Treasury Bill - 102.43% | | | | | | | | | | | | |
United States Treasury Bill, 3.227%, 6/29/2023 (c)(d) | | $ | 430,500 | | | | | | | | 427,037 | |
United States Treasury Bill, 3.861%, 9/28/2023 (c)(d) | | | 431,300 | | | | | | | | 422,735 | |
United States Treasury Bill, 3.632%, 12/28/2023 (c)(d) | | | 432,200 | | | | | | | | 419,607 | |
United States Treasury Bill, 3.889%, 3/21/2024 (c)(d) | | | 26,921,200 | | | | | | | | 25,802,007 | |
| | | | | | | | | | | | 27,071,386 | |
Money Market Deposit Account - 0.14% | | | | | | | | | | | | |
U.S. Bank Money Market Deposit Account, 4.800% (e) | | | 35,541 | | | | | | | | 35,541 | |
TOTAL SHORT TERM INVESTMENTS (Cost $27,157,170) | | | | | | | | | | | 27,106,927 | |
| | | | | | | | | | | | | |
Total Investments (Cost $35,148,316) - 128.96% | | | | | | | | | | | 34,082,041 | |
Liabilities in Excess of Other Assets - (28.96)% | | | | | | | | | | | (7,652,782 | ) |
TOTAL NET ASSETS - 100.00% | | | | | | | | | | $ | 26,429,259 | |
Asset Type | | % of Net Assets | |
Purchased Options | | | 26.39 | % |
Short Term Investments | | | 102.57 | |
Total Investments | | | 128.96 | |
Liabilities in Excess of Other Assets | | | (28.96 | ) |
Net Assets | | | 100.00 | % |
Percentages are stated as a percent of net assets.
(b) | Purchased option contracts are held in connection with corresponding option contracts written short. |
(c) | Rate disclosed is the effective yield as of April 30, 2023. |
(d) | All or a portion of the security can be pledged as collateral in connection with options written contracts. |
(e) | The U.S. Bank Money Market Deposit Account (the “MMDA”) is a short-term investment vehicle in which the Fund holds cash balances. The MMDA will bear interest at a variable rate that is determined based on conditions and may change daily and by any amount. The rate shown is as of April 30, 2023. |
The accompanying notes are an integral part of these financial statements.
INNOVATOR PREMIUM INCOME 30 BARRIER ETF – APRIL
Schedule of Options Written (a) | | | |
April 30, 2023 (Unaudited) (Continued) | | | |
Description | | Expiration | | | Strike Price | | | Contracts | | | Notional Amount | | | Value | |
Put Options | | | | | | | | | | | | | | | | | | | | |
SPX S&P 500® Index | | 3/28/2024 | | | $ | 2,876.25 | | | | 1,978 | | | $ | (824,723,144 | ) | | $ | (7,561,755 | ) |
XSP S&P 500® Mini Index | | 3/28/2024 | | | | 287.63 | | | | 215 | | | | (8,964,425 | ) | | | (82,040 | ) |
| | | | | | | | | | | | | | | | | | | | | |
Total Options Written (Premiums Received $8,698,248) | | | | | | | | | | | | | | | | | | $ | (7,643,795 | ) |
| | | | | | | | | | | | | | | | | | | | | |
(a) Exchange-Traded. | | | | | | | | | | | | | | | | | | | | |
The accompanying notes are an integral part of these financial statements.
INNOVATOR PREMIUM INCOME 40 BARRIER ETF – APRIL
Schedule of Investments |
April 30, 2023 (Unaudited) |
| | | Contracts | | | Notional Amount | | | Value | |
PURCHASED OPTIONS - 20.08% (a)(b) | | | | | | | | | | | | |
PUT OPTIONS - 20.08% | | | | | | | | | | | | |
SPX S&P 500® Index, Expires 3/28/2024, Strike Price $2,424.27 | | | 2,400 | | | | 1,000,675,200 | | | $ | 4,932,456 | |
TOTAL PURCHASED OPTIONS (Cost $5,719,618) | | | | | | | | | | | 4,932,456 | |
| | | | | | | | | | | | | |
SHORT TERM INVESTMENTS - 101.69% | | Principal Amount | | | | | | | | | |
U.S. Treasury Bill - 101.53% | | | | | | | | | | | | |
United States Treasury Bill, 3.177%, 6/29/2023 (c)(d) | | $ | 337,400 | | | | | | | | 334,686 | |
United States Treasury Bill, 3.788%, 9/28/2023 (c)(d) | | | 338,100 | | | | | | | | 331,386 | |
United States Treasury Bill, 3.574%, 12/28/2023 (c)(d) | | | 338,800 | | | | | | | | 328,928 | |
United States Treasury Bill, 3.805%, 3/21/2024 (c)(d) | | | 24,978,500 | | | | | | | | 23,940,071 | |
| | | | | | | | | | | | 24,935,071 | |
Money Market Deposit Account - 0.16% | | | | | | | | | | | | |
U.S. Bank Money Market Deposit Account, 4.800% (e) | | | 37,953 | | | | | | | | 37,953 | |
TOTAL SHORT TERM INVESTMENTS (Cost $25,031,517) | | | | | | | | | | | 24,973,024 | |
| | | | | | | | | | | | | |
Total Investments (Cost $30,751,135) - 121.77% | | | | | | | | | | | 29,905,480 | |
Liabilities in Excess of Other Assets - (21.77)% | | | | | | | | | | | (5,346,524 | ) |
TOTAL NET ASSETS - 100.00% | | | | | | | | | | $ | 24,558,956 | |
Asset Type | | % of Net Assets | |
Purchased Options | | | 20.08 | % |
Short Term Investments | | | 101.69 | |
Total Investments | | | 121.77 | |
Liabilities in Excess of Other Assets | | | (21.77 | ) |
Net Assets | | | 100.00 | % |
Percentages are stated as a percent of net assets.
(b) | Purchased option contracts are held in connection with corresponding option contracts written short. |
(c) | Rate disclosed is the effective yield as of April 30, 2023. |
(d) | All or a portion of the security can be pledged as collateral in connection with options written contracts. |
(e) | The U.S. Bank Money Market Deposit Account (the “MMDA”) is a short-term investment vehicle in which the Fund holds cash balances. The MMDA will bear interest at a variable rate that is determined based on conditions and may change daily and by any amount. The rate shown is as of April 30, 2023. |
The accompanying notes are an integral part of these financial statements.
INNOVATOR PREMIUM INCOME 40 BARRIER ETF – APRIL
Schedule of Options Written (a) | | | |
April 30, 2023 (Unaudited) (Continued) | | | |
Description | | Expiration | | | Strike Price | | | Contracts | | | Notional Amount | | | Value | |
Put Options | | | | | | | | | | | | | | | | | | | | |
SPX S&P 500® Index | | 3/28/2024 | | | $ | 2,465.36 | | | | 2,440 | | | $ | (1,017,353,120 | ) | | $ | (5,294,874 | ) |
XSP S&P 500® Mini Index | | 3/28/2024 | | | | 246.54 | | | | 200 | | | | (8,339,000 | ) | | | (42,672 | ) |
| | | | | | | | | | | | | | | | | | | | | |
Total Options Written (Premiums Received $6,160,738) | | | | | | | | | | | | | | | | | | $ | (5,337,546 | ) |
| | | | | | | | | | | | | | | | | | | | | |
(a) Exchange-Traded. | | | | | | | | | | | | | | | | | | | | |
The accompanying notes are an integral part of these financial statements.
Statements of Assets and Liabilities
April 30, 2023 (Unaudited)
| |
Assets: | |
Investments, at value (a) | |
Interest receivable | |
Deposit at broker for options | |
Total Assets | |
| | |
Liabilities: | |
Options written, at value (b) | |
Payable to Adviser | |
Total Liabilities | |
Net Assets | |
| | |
Net Assets Consist of: | |
Capital stock | |
Total distributable earnings/(accumulated deficit) | |
Net Assets | |
| | |
Net Asset Value: | |
Net assets | |
Shares of beneficial interest outstanding (unlimited shares without par value authorized) | |
Net asset value price per share | |
| | |
(a) Cost of investments | |
(b) Premiums received | |
The accompanying notes are an integral part of these financial statements.
| | Innovator U.S. Equity Buffer ETF - January | | | Innovator U.S. Equity Buffer ETF - February | | | Innovator U.S. Equity Buffer ETF - March | | | Innovator U.S. Equity Buffer ETF - April | |
| | | | | | | | | | | | | | | | |
| | $ | 184,850,433 | | | $ | 124,894,227 | | | $ | 105,118,338 | | | $ | 171,722,809 | |
| | | 1,728 | | | | 1,197 | | | | 970 | | | | 1,484 | |
| | | 152 | | | | 206 | | | | 203 | | | | 203 | |
| | | 184,852,313 | | | | 124,895,630 | | | | 105,119,511 | | | | 171,724,496 | |
| | | | | | | | | | | | | | | | |
| | | | | | | | | | | | | | | | |
| | | 4,291,488 | | | | 3,994,088 | | | | 3,723,425 | | | | 6,785,151 | |
| | | 115,224 | | | | 78,533 | | | | 66,181 | | | | 96,158 | |
| | | 4,406,712 | | | | 4,072,621 | | | | 3,789,606 | | | | 6,881,309 | |
| | $ | 180,445,601 | | | $ | 120,823,009 | | | $ | 101,329,905 | | | $ | 164,843,187 | |
| | | | | | | �� | | | | | | | | | |
| | | | | | | | | | | | | | | | |
| | $ | 211,574,300 | | | $ | 122,651,323 | | | $ | 100,791,163 | | | $ | 163,325,126 | |
| | | (31,128,699 | ) | | | (1,828,314 | ) | | | 538,742 | | | | 1,518,061 | |
| | $ | 180,445,601 | | | $ | 120,823,009 | | | $ | 101,329,905 | | | $ | 164,843,187 | |
| | | | | | | | | | | | | | | | |
| | | | | | | | | | | | | | | | |
| | $ | 180,445,601 | | | $ | 120,823,009 | | | $ | 101,329,905 | | | $ | 164,843,187 | |
| | | 5,050,000 | | | | 3,725,000 | | | | 2,875,000 | | | | 4,850,000 | |
| | $ | 35.73 | | | $ | 32.44 | | | $ | 35.25 | | | $ | 33.99 | |
| | | | | | | | | | | | | | | | |
| | $ | 177,155,443 | | | $ | 123,596,329 | | | $ | 101,924,575 | | | $ | 170,440,326 | |
| | | 9,707,216 | | | | 5,560,940 | | | | 4,507,041 | | | | 7,850,036 | |
The accompanying notes are an integral part of these financial statements.
Statements of Assets and Liabilities
April 30, 2023 (Unaudited)
| |
Assets: | |
Investments, at value (a) | |
Interest receivable | |
Receivable for investments sold | |
Deposit at broker for options | |
Total Assets | |
| | |
Liabilities: | |
Options written, at value (b) | |
Payable for fund shares redeemed | |
Payable to Adviser | |
Payable for investments purchased | |
Total Liabilities | |
Net Assets | |
| | |
Net Assets Consist of: | |
Capital stock | |
Total distributable earnings/(accumulated deficit) | |
Net Assets | |
| | |
Net Asset Value: | |
Net assets | |
Shares of beneficial interest outstanding (unlimited shares without par value authorized) | |
Net asset value price per share | |
| | |
(a) Cost of investments | |
(b) Premiums received | |
The accompanying notes are an integral part of these financial statements.
| | Innovator U.S. Equity Buffer ETF - May | | | Innovator U.S. Equity Buffer ETF - June | | | Innovator U.S. Equity Buffer ETF - July | | | Innovator U.S. Equity Buffer ETF - August | |
| | | | | | | | | | | | | | | | |
| | $ | 128,121,484 | | | $ | 144,263,806 | | | $ | 146,976,375 | | | $ | 125,479,611 | |
| | | 1,254 | | | | 1,376 | | | | 1,399 | | | | 1,388 | |
| | | 127,766,376 | | | | 83,265 | | | | 1,652,575 | | | | – | |
| | | 102 | | | | 144 | | | | 206 | | | | 193 | |
| | | 255,889,216 | | | | 144,348,591 | | | | 148,630,555 | | | | 125,481,192 | |
| | | | | | | | | | | | | | | | |
| | | | | | | | | | | | | | | | |
| | | 5,735,340 | | | | 238,533 | | | | 318,417 | | | | 1,124,363 | |
| | | – | | | | – | | | | 1,655,980 | | | | – | |
| | | 81,072 | | | | 92,273 | | | | 98,166 | | | | 77,280 | |
| | | 127,793,735 | | | | 146 | | | | 3,588 | | | | – | |
| | | 133,610,147 | | | | 330,952 | | | | 2,076,151 | | | | 1,201,643 | |
| | $ | 122,279,069 | | | $ | 144,017,639 | | | $ | 146,554,404 | | | $ | 124,279,549 | |
| | | | | | | | | | | | | | | | |
| | | | | | | | | | | | | | | | |
| | $ | 126,707,267 | | | $ | 146,403,543 | | | $ | 135,619,566 | | | $ | 131,326,019 | |
| | | (4,428,198 | ) | | | (2,385,904 | ) | | | 10,934,838 | | | | (7,046,470 | ) |
| | $ | 122,279,069 | | | $ | 144,017,639 | | | $ | 146,554,404 | | | $ | 124,279,549 | |
| | | | | | | | | | | | | | | | |
| | | | | | | | | | | | | | | | |
| | $ | 122,279,069 | | | $ | 144,017,639 | | | $ | 146,554,404 | | | $ | 124,279,549 | |
| | | 4,050,000 | | | | 4,475,000 | | | | 4,425,000 | | | | 3,900,000 | |
| | $ | 30.19 | | | $ | 32.18 | | | $ | 33.12 | | | $ | 31.87 | |
| | | | | | | | | | | | | | | | |
| | $ | 128,134,215 | | | $ | 148,861,089 | | | $ | 143,242,509 | | | $ | 128,758,746 | |
| | | 5,722,563 | | | | 6,096,311 | | | | 8,026,768 | | | | 6,784,563 | |
The accompanying notes are an integral part of these financial statements.
Statements of Assets and Liabilities
April 30, 2023 (Unaudited)
| |
Assets: | |
Investments, at value (a) | |
Interest receivable | |
Receivable for investments sold | |
Deposit at broker for options | |
Total Assets | |
| | |
Liabilities: | |
Options written, at value (b) | |
Payable to Adviser | |
Payable for investments purchased | |
Total Liabilities | |
Net Assets | |
| | |
Net Assets Consist of: | |
Capital stock | |
Total distributable earnings/(accumulated deficit) | |
Net Assets | |
| | |
Net Asset Value: | |
Net assets | |
Shares of beneficial interest outstanding (unlimited shares without par value authorized) | |
Net asset value price per share | |
| | |
(a) Cost of investments | |
(b) Premiums received | |
The accompanying notes are an integral part of these financial statements.
| | Innovator U.S. Equity Buffer ETF - September | | | Innovator U.S. Equity Buffer ETF - October | | | Innovator U.S. Equity Buffer ETF - November | | | Innovator U.S. Equity Buffer ETF - December | |
| | | | | | | | | | | | | | | | |
| | $ | 172,270,525 | | | $ | 152,341,466 | | | $ | 137,356,271 | | | $ | 113,036,695 | |
| | | 1,598 | | | | 1,667 | | | | 1,323 | | | | 1,080 | |
| | | 83,737 | | | | – | | | | – | | | | – | |
| | | 113 | | | | 101 | | | | 79 | | | | 204 | |
| | | 172,355,973 | | | | 152,343,234 | | | | 137,357,673 | | | | 113,037,979 | |
| | | | | | | | | | | | | | | | |
| | | | | | | | | | | | | | | | |
| | | 1,633,790 | | | | 1,982,518 | | | | 1,932,862 | | | | 2,446,210 | |
| | | 109,758 | | | | 103,625 | | | | 88,122 | | | | 72,996 | |
| | | 805 | | | | – | | | | – | | | | – | |
| | | 1,744,353 | | | | 2,086,143 | | | | 2,020,984 | | | | 2,519,206 | |
| | $ | 170,611,620 | | | $ | 150,257,091 | | | $ | 135,336,689 | | | $ | 110,518,773 | |
| | | | | | | | | | | | | | | | |
| | | | | | | | | | | | | | | | |
| | $ | 172,245,212 | | | $ | 137,657,331 | | | $ | 135,760,473 | | | $ | 111,453,846 | |
| | | (1,633,592 | ) | | | 12,599,760 | | | | (423,784 | ) | | | (935,073 | ) |
| | $ | 170,611,620 | | | $ | 150,257,091 | | | $ | 135,336,689 | | | $ | 110,518,773 | |
| | | | | | | | | | | | | | | | |
| | | | | | | | | | | | | | | | |
| | $ | 170,611,620 | | | $ | 150,257,091 | | | $ | 135,336,689 | | | $ | 110,518,773 | |
| | | 5,250,000 | | | | 4,375,000 | | | | 4,225,000 | | | | 3,225,000 | |
| | $ | 32.50 | | | $ | 34.34 | | | $ | 32.03 | | | $ | 34.27 | |
| | | | | | | | | | | | | | | | |
| | $ | 171,883,602 | | | $ | 141,765,570 | | | $ | 133,141,787 | | | $ | 112,835,424 | |
| | | 10,639,704 | | | | 8,718,828 | | | | 8,004,641 | | | | 6,388,557 | |
The accompanying notes are an integral part of these financial statements.
Statements of Assets and Liabilities
April 30, 2023 (Unaudited)
| |
Assets: | |
Investments, at value (a) | |
Interest receivable | |
ETF variable fee receivable | |
Receivable for investments sold | |
Receivable for fund shares sold | |
Deposit at broker for options | |
Total Assets | |
| | |
Liabilities: | |
Options written, at value (b) | |
Payable for fund shares redeemed | |
Payable to Adviser | |
Payable for investments purchased | |
Total Liabilities | |
Net Assets | |
| | |
Net Assets Consist of: | |
Capital stock | |
Total distributable earnings/(accumulated deficit) | |
Net Assets | |
| | |
Net Asset Value: | |
Net assets | |
Shares of beneficial interest outstanding (unlimited shares without par value authorized) | |
Net asset value price per share | |
| | |
(a) Cost of investments | |
(b) Premiums received | |
The accompanying notes are an integral part of these financial statements.
| | Innovator U.S. Equity Power Buffer ETF - January | | | Innovator U.S. Equity Power Buffer ETF - February | | | Innovator U.S. Equity Power Buffer ETF - March | | | Innovator U.S. Equity Power Buffer ETF - April | |
| | | | | | | | | | | | | | | | |
| | $ | 701,028,179 | | | $ | 650,539,897 | | | $ | 468,310,518 | | | $ | 688,450,491 | |
| | | 6,791 | | | | 6,243 | | | | 4,434 | | | | 5,210 | |
| | | 421 | | | | – | | | | – | | | | 1,859 | |
| | | 922,644 | | | | 85,167 | | | | – | | | | 159,272 | |
| | | – | | | | – | | | | – | | | | 3,718,613 | |
| | | 134 | | | | 183 | | | | 236 | | | | 203 | |
| | | 701,958,169 | | | | 650,631,490 | | | | 468,315,188 | | | | 692,335,648 | |
| | | | | | | | | | | | | | | | |
| | | | | | | | | | | | | | | | |
| | | 22,990,688 | | | | 22,748,841 | | | | 20,054,100 | | | | 28,460,282 | |
| | | 841,808 | | | | – | | | | – | | | | – | |
| | | 439,981 | | | | 396,240 | | | | 290,812 | | | | 340,012 | |
| | | 30,432 | | | | 2,994 | | | | – | | | | 3,852,837 | |
| | | 24,302,909 | | | | 23,148,075 | | | | 20,344,912 | | | | 32,653,131 | |
| | $ | 677,655,260 | | | $ | 627,483,415 | | | $ | 447,970,276 | | | $ | 659,682,517 | |
| | | | | | | | | | | | | | | | |
| | | | | | | | | | | | | | | | |
| | $ | 722,926,559 | | | $ | 629,740,360 | | | $ | 442,308,555 | | | $ | 660,698,069 | |
| | | (45,271,299 | ) | | | (2,256,945 | ) | | | 5,661,721 | | | | (1,015,552 | ) |
| | $ | 677,655,260 | | | $ | 627,483,415 | | | $ | 447,970,276 | | | $ | 659,682,517 | |
| | | | | | | | | | | | | | | | |
| | | | | | | | | | | | | | | | |
| | $ | 677,655,260 | | | $ | 627,483,415 | | | $ | 447,970,276 | | | $ | 659,682,517 | |
| | | 20,125,000 | | | | 21,200,000 | | | | 13,775,000 | | | | 22,175,000 | |
| | $ | 33.67 | | | $ | 29.60 | | | $ | 32.52 | | | $ | 29.75 | |
| | | | | | | | | | | | | | | | |
| | $ | 671,317,920 | | | $ | 645,414,504 | | | $ | 453,657,393 | | | $ | 683,461,936 | |
| | | 36,874,015 | | | | 29,267,012 | | | | 20,226,798 | | | | 30,849,929 | |
The accompanying notes are an integral part of these financial statements.
Statements of Assets and Liabilities
April 30, 2023 (Unaudited)
| |
Assets: | |
Investments, at value (a) | |
Interest receivable | |
ETF variable fee receivable | |
Receivable for investments sold | |
Receivable for fund shares sold | |
Deposit at broker for options | |
Total Assets | |
| | |
Liabilities: | |
Options written, at value (b) | |
Payable to Adviser | |
Payable for investments purchased | |
Total Liabilities | |
Net Assets | |
| | |
Net Assets Consist of: | |
Capital stock | |
Total distributable earnings/(accumulated deficit) | |
Net Assets | |
| | |
Net Asset Value: | |
Net assets | |
Shares of beneficial interest outstanding (unlimited shares without par value authorized) | |
Net asset value price per share | |
| | |
(a) Cost of investments | |
(b) Premiums received | |
The accompanying notes are an integral part of these financial statements.
| | Innovator U.S.
Equity Power Buffer
ETF - May | | | Innovator U.S. Equity Power Buffer ETF - June | | | Innovator U.S. Equity Power Buffer ETF - July | | | Innovator U.S. Equity Power Buffer ETF - August | |
| | | | | | | | | | | | | | | | |
| | $ | 520,109,026 | | | $ | 363,833,244 | | | $ | 417,902,430 | | | $ | 527,839,855 | |
| | | 4,690 | | | | 3,668 | | | | 4,315 | | | | 5,105 | |
| | | 19,020 | | | | – | | | | – | | | | – | |
| | | 480,906,825 | | | | – | | | | – | | | | – | |
| | | 38,039,557 | | | | – | | | | – | | | | – | |
| | | 73 | | | | 225 | | | | 205 | | | | 175 | |
| | | 1,039,079,191 | | | | 363,837,137 | | | | 417,906,950 | | | | 527,845,135 | |
| | | | | | | | | | | | | | | | |
| | | | | | | | | | | | | | | | |
| | | 23,323,830 | | | | 259,409 | | | | 1,402,573 | | | | 2,714,403 | |
| | | 294,506 | | | | 231,927 | | | | 286,357 | | | | 327,456 | |
| | | 518,928,346 | | | | – | | | | – | | | | – | |
| | | 542,546,682 | | | | 491,336 | | | | 1,688,930 | | | | 3,041,859 | |
| | $ | 496,532,509 | | | $ | 363,345,801 | | | $ | 416,218,020 | | | $ | 524,803,276 | |
| | | | | | | | | | | | | | | | |
| | | | | | | | | | | | | | | | |
| | $ | 516,411,253 | | | $ | 363,828,941 | | | $ | 389,977,407 | | | $ | 524,992,959 | |
| | | (19,878,744 | ) | | | (483,140 | ) | | | 26,240,613 | | | | (189,683 | ) |
| | $ | 496,532,509 | | | $ | 363,345,801 | | | $ | 416,218,020 | | | $ | 524,803,276 | |
| | | | | | | | | | | | | | | | |
| | | | | | | | | | | | | | | | |
| | $ | 496,532,509 | | | $ | 363,345,801 | | | $ | 416,218,020 | | | $ | 524,803,276 | |
| | | 17,300,000 | | | | 11,775,000 | | | | 12,950,000 | | | | 17,650,000 | |
| | $ | 28.70 | | | $ | 30.86 | | | $ | 32.14 | | | $ | 29.73 | |
| | | | | | | | | | | | | | | | |
| | $ | 520,160,382 | | | $ | 380,719,217 | | | $ | 408,998,244 | | | $ | 540,186,692 | |
| | | 23,272,287 | | | | 21,282,491 | | | | 24,944,243 | | | | 28,790,438 | |
The accompanying notes are an integral part of these financial statements.
Statements of Assets and Liabilities
April 30, 2023 (Unaudited)
| |
Assets: | |
Investments, at value (a) | |
Interest receivable | |
ETF variable fee receivable | |
Receivable for investments sold | |
Receivable for fund shares sold | |
Deposit at broker for options | |
Total Assets | |
| | |
Liabilities: | |
Options written, at value (b) | |
Payable for fund shares redeemed | |
Payable to Adviser | |
Payable for investments purchased | |
Total Liabilities | |
Net Assets | |
| | |
Net Assets Consist of: | |
Capital stock | |
Total distributable earnings/(accumulated deficit) | |
Net Assets | |
| | |
Net Asset Value: | |
Net assets | |
Shares of beneficial interest outstanding (unlimited shares without par value authorized) | |
Net asset value price per share | |
| | |
(a) Cost of investments | |
(b) Premiums received | |
The accompanying notes are an integral part of these financial statements.
| | Innovator U.S. Equity Power Buffer ETF - September | | | Innovator U.S. Equity Power Buffer ETF - October | | | Innovator U.S. Equity Power Buffer ETF - November | | | Innovator U.S. Equity Power Buffer ETF - December | |
| | | | | | | | | | | | | | | | |
| | $ | 654,326,932 | | | $ | 520,462,757 | | | $ | 806,609,726 | | | $ | 726,993,152 | |
| | | 6,507 | | | | 4,907 | | | | 7,894 | | | | 7,320 | |
| | | – | | | | – | | | | – | | | | 794 | |
| | | 1,633,735 | | | | – | | | | 1,676,191 | | | | 26,773 | |
| | | – | | | | – | | | | – | | | | 1,588,130 | |
| | | 14 | | | | 106 | | | | 97 | | | | 203 | |
| | | 655,967,188 | | | | 520,467,770 | | | | 808,293,908 | | | | 728,616,372 | |
| | | | | | | | | | | | | | | | |
| | | | | | | | | | | | | | | | |
| | | 5,639,960 | | | | 17,781,570 | | | | 12,921,600 | | | | 12,754,896 | |
| | | 1,552,895 | | | | – | | | | 1,612,230 | | | | – | |
| | | 427,013 | | | | 328,529 | | | | 517,267 | | | | 465,930 | |
| | | 14,131 | | | | – | | | | 26,929 | | | | 1,531,055 | |
| | | 7,633,999 | | | | 18,110,099 | | | | 15,078,026 | | | | 14,751,881 | |
| | $ | 648,333,189 | | | $ | 502,357,671 | | | $ | 793,215,882 | | | $ | 713,864,491 | |
| | | | | | | | | | | | | | | | |
| | | | | | | | | | | | | | | | |
| | $ | 624,919,127 | | | $ | 464,933,575 | | | $ | 751,735,795 | | | $ | 690,414,862 | |
| | | 23,414,062 | | | | 37,424,096 | | | | 41,480,087 | | | | 23,449,629 | |
| | $ | 648,333,189 | | | $ | 502,357,671 | | | $ | 793,215,882 | | | $ | 713,864,491 | |
| | | | | | | | | | | | | | | | |
| | | | | | | | | | | | | | | | |
| | $ | 648,333,189 | | | $ | 502,357,671 | | | $ | 793,215,882 | | | $ | 713,864,491 | |
| | | 20,875,000 | | | | 15,625,000 | | | | 24,600,000 | | | | 22,475,000 | |
| | $ | 31.06 | | | $ | 32.15 | | | $ | 32.24 | | | $ | 31.76 | |
| | | | | | | | | | | | | | | | |
| | $ | 651,507,594 | | | $ | 485,489,306 | | | $ | 783,604,167 | | | $ | 723,342,782 | |
| | | 35,583,673 | | | | 31,160,110 | | | | 46,671,315 | | | | 38,000,996 | |
The accompanying notes are an integral part of these financial statements.
Statements of Assets and Liabilities
April 30, 2023 (Unaudited)
| |
Assets: | |
Investments, at value (a) | |
Interest receivable | |
Deposit at broker for options | |
Total Assets | |
| | |
Liabilities: | |
Options written, at value (b) | |
Payable to Adviser | |
Total Liabilities | |
Net Assets | |
| | |
Net Assets Consist of: | |
Capital stock | |
Total distributable earnings/(accumulated deficit) | |
Net Assets | |
| | |
Net Asset Value: | |
Net assets | |
Shares of beneficial interest outstanding (unlimited shares without par value authorized) | |
Net asset value price per share | |
| | |
(a) Cost of investments | |
(b) Premiums received | |
The accompanying notes are an integral part of these financial statements.
| | Innovator U.S.
Equity Ultra Buffer ETF - January | | | Innovator U.S. Equity Ultra Buffer ETF - February | | | Innovator U.S. Equity Ultra Buffer ETF - March | | | Innovator U.S.
Equity Ultra Buffer ETF - April | |
| | | | | | | | | | | | | | | | |
| | $ | 156,732,531 | | | $ | 93,760,331 | | | $ | 75,365,817 | | | $ | 158,089,771 | |
| | | 1,494 | | | | 863 | | | | 754 | | | | 2,711 | |
| | | 368 | | | | 203 | | | | 169 | | | | 203 | |
| | | 156,734,393 | | | | 93,761,397 | | | | 75,366,740 | | | | 158,092,685 | |
| | | | | | | | | | | | | | | | |
| | | | | | | | | | | | | | | | |
| | | 5,375,165 | | | | 2,465,354 | | | | 2,763,470 | | | | 4,856,689 | |
| | | 98,407 | | | | 58,940 | | | | 52,728 | | | | 99,358 | |
| | | 5,473,572 | | | | 2,524,294 | | | | 2,816,198 | | | | 4,956,047 | |
| | $ | 151,260,821 | | | $ | 91,237,103 | | | $ | 72,550,542 | | | $ | 153,136,638 | |
| | | | | | | | | | | | | | | | |
| | | | | | | | | | | | | | | | |
| | $ | 174,682,974 | | | $ | 95,055,548 | | | $ | 75,709,136 | | | $ | 155,082,734 | |
| | | (23,422,153 | ) | | | (3,818,445 | ) | | | (3,158,594 | ) | | | (1,946,096 | ) |
| | $ | 151,260,821 | | | $ | 91,237,103 | | | $ | 72,550,542 | | | $ | 153,136,638 | |
| | | | | | | | | | | | | | | | |
| | | | | | | | | | | | | | | | |
| | $ | 151,260,821 | | | $ | 91,237,103 | | | $ | 72,550,542 | | | $ | 153,136,638 | |
| | | 4,800,000 | | | | 3,400,000 | | | | 2,500,000 | | | | 6,075,000 | |
| | $ | 31.51 | | | $ | 26.83 | | | $ | 29.02 | | | $ | 25.21 | |
| | | | | | | | | | | | | | | | |
| | $ | 148,631,040 | | | $ | 92,525,931 | | | $ | 72,615,254 | | | $ | 156,868,662 | |
| | | 6,084,139 | | | | 2,938,517 | | | | 2,276,542 | | | | 5,127,670 | |
The accompanying notes are an integral part of these financial statements.
Statements of Assets and Liabilities
April 30, 2023 (Unaudited)
| |
Assets: | |
Investments, at value (a) | |
Interest receivable | |
ETF variable fee receivable | |
Receivable for investments sold | |
Receivable for fund shares sold | |
Deposit at broker for options | |
Total Assets | |
| | |
Liabilities: | |
Options written, at value (b) | |
Payable for fund shares redeemed | |
Payable to Adviser | |
Payable for investments purchased | |
Total Liabilities | |
Net Assets | |
| | |
Net Assets Consist of: | |
Capital stock | |
Total distributable earnings/(accumulated deficit) | |
Net Assets | |
| | |
Net Asset Value: | |
Net assets | |
Shares of beneficial interest outstanding (unlimited shares without par value authorized) | |
Net asset value price per share | |
| | |
(a) Cost of investments | |
(b) Premiums received | |
The accompanying notes are an integral part of these financial statements.
| | Innovator U.S.
Equity Ultra Buffer ETF - May | | | Innovator U.S. Equity Ultra Buffer ETF - June | | | Innovator U.S. Equity Ultra Buffer ETF - July | | | Innovator U.S.
Equity Ultra Buffer ETF - August | |
| | | | | | | | | | | | | | | | |
| | $ | 100,773,811 | | | $ | 90,418,071 | | | $ | 54,751,595 | | | $ | 129,190,796 | |
| | | 1,979 | | | | 834 | | | | 437 | | | | 1,142 | |
| | | – | | | | – | | | | – | | | | 341 | |
| | | 100,482,344 | | | | – | | | | 740,925 | | | | 1,105 | |
| | | – | | | | – | | | | – | | | | 682,182 | |
| | | 159 | | | | 101 | | | | 199 | | | | 197 | |
| | | 201,258,293 | | | | 90,419,006 | | | | 55,493,156 | | | | 129,875,763 | |
| | | | | | | | | | | | | | | | |
| | | | | | | | | | | | | | | | |
| | | 3,226,492 | | | | 17,732 | | | | 431,600 | | | | 241,566 | |
| | | – | | | | – | | | | 687,753 | | | | – | |
| | | 64,041 | | | | 59,133 | | | | 35,455 | | | | 77,220 | |
| | | 100,501,442 | | | | – | | | | 5,859 | | | | 624,425 | |
| | | 103,791,975 | | | | 76,865 | | | | 1,160,667 | | | | 943,211 | |
| | $ | 97,466,318 | | | $ | 90,342,141 | | | $ | 54,332,489 | | | $ | 128,932,552 | |
| | | | | | | | | | | | | | | | |
| | | | | | | | | | | | | | | | |
| | $ | 97,803,807 | | | $ | 87,733,414 | | | $ | 52,864,846 | | | $ | 128,102,761 | |
| | | (337,489 | ) | | | 2,608,727 | | | | 1,467,643 | | | | 829,791 | |
| | $ | 97,466,318 | | | $ | 90,342,141 | | | $ | 54,332,489 | | | $ | 128,932,552 | |
| | | | | | | | | | | | | | | | |
| | | | | | | | | | | | | | | | |
| | $ | 97,466,318 | | | $ | 90,342,141 | | | $ | 54,332,489 | | | $ | 128,932,552 | |
| | | 3,600,000 | | | | 3,250,000 | | | | 1,975,000 | | | | 4,725,000 | |
| | $ | 27.07 | | | $ | 27.80 | | | $ | 27.51 | | | $ | 27.29 | |
| | | | | | | | | | | | | | | | |
| | $ | 100,783,963 | | | $ | 90,223,503 | | | $ | 52,488,937 | | | $ | 129,906,696 | |
| | | 3,216,314 | | | | 2,598,568 | | | | 2,442,944 | | | | 3,484,307 | |
The accompanying notes are an integral part of these financial statements.
Statements of Assets and Liabilities
April 30, 2023 (Unaudited)
| |
Assets: | |
Investments, at value (a) | |
Interest receivable | |
Deposit at broker for options | |
Total Assets | |
| | |
Liabilities: | |
Options written, at value (b) | |
Payable to Adviser | |
Total Liabilities | |
Net Assets | |
| | |
Net Assets Consist of: | |
Capital stock | |
Total distributable earnings/(accumulated deficit) | |
Net Assets | |
| | |
Net Asset Value: | |
Net assets | |
Shares of beneficial interest outstanding (unlimited shares without par value authorized) | |
Net asset value price per share | |
| | |
(a) Cost of investments | |
(b) Premiums received | |
The accompanying notes are an integral part of these financial statements.
| | Innovator U.S.
Equity Ultra Buffer ETF - September | | | Innovator U.S. Equity Ultra Buffer ETF - October | | | Innovator U.S. E quity Ultra Buffer ETF - November | | | Innovator U.S.
Equity Ultra Buffer ETF - December | |
| | | | | | | | | | | | | | | | |
| | $ | 109,710,245 | | | $ | 99,844,555 | | | $ | 51,665,032 | | | $ | 103,714,156 | |
| | | 1,029 | | | | 867 | | | | 466 | | | | 1,001 | |
| | | 106 | | | | 102 | | | | 101 | | | | 202 | |
| | | 109,711,380 | | | | 99,845,524 | | | | 51,665,599 | | | | 103,715,359 | |
| | | | | | | | | | | | | | | | |
| | | | | | | | | | | | | | | | |
| | | 901,275 | | | | 5,010,763 | | | | 918,707 | | | | 1,205,746 | |
| | | 71,215 | | | | 62,215 | | | | 33,100 | | | | 66,204 | |
| | | 972,490 | | | | 5,072,978 | | | | 951,807 | | | | 1,271,950 | |
| | $ | 108,738,890 | | | $ | 94,772,546 | | | $ | 50,713,792 | | | $ | 102,443,409 | |
| | | | | | | | | | | | | | | | |
| | | | | | | | | | | | | | | | |
| | $ | 104,206,828 | | | $ | 95,496,483 | | | $ | 52,817,352 | | | $ | 101,689,804 | |
| | | 4,532,062 | | | | (723,937 | ) | | | (2,103,560 | ) | | | 753,605 | |
| | $ | 108,738,890 | | | $ | 94,772,546 | | | $ | 50,713,792 | | | $ | 102,443,409 | |
| | | | | | | | | | | | | | | | |
| | | | | | | | | | | | | | | | |
| | $ | 108,738,890 | | | $ | 94,772,546 | | | $ | 50,713,792 | | | $ | 102,443,409 | |
| | | 3,900,000 | | | | 3,275,000 | | | | 1,725,000 | | | | 3,550,000 | |
| | $ | 27.88 | | | $ | 28.94 | | | $ | 29.40 | | | $ | 28.86 | |
| | | | | | | | | | | | | | | | |
| | $ | 108,294,992 | | | $ | 90,396,287 | | | $ | 49,929,040 | | | $ | 103,391,807 | |
| | | 3,462,844 | | | | 4,647,191 | | | | 2,157,816 | | | | 2,810,012 | |
The accompanying notes are an integral part of these financial statements.
Statements of Assets and Liabilities
April 30, 2023 (Unaudited)
| | | | | |
| | Assets: | | | |
| | Investments, at value (a) | |
| | Interest receivable | |
| | Deposit at broker for options | |
| | Total Assets | |
| | | | | |
| | Liabilities: | | | |
| | Options written, at value (b) | |
| | Payable to Adviser | |
| | Due to broker for options | |
| | Total Liabilities | |
| | Net Assets | |
| | | | | |
| | Net Assets Consist of: | | | |
| | Capital stock | |
| | Total distributable earnings/(accumulated deficit) | |
| | Net Assets | |
| | | | | |
| | Net Asset Value: | | | |
| | Net assets | |
| | Shares of beneficial interest outstanding (unlimited shares without par value authorized) | |
| | Net asset value price per share | |
| | | | | |
(a) | Cost of investments | |
(b) | Premiums received | |
The accompanying notes are an integral part of these financial statements.
| | Innovator Premium Income 10 Barrier ETF - April | | | Innovator Premium Income 20 Barrier ETF -
April | | | Innovator Premium Income 30 Barrier ETF -
April | | | Innovator Premium Income 40 Barrier ETF -
April | |
| | | | | | | | | | | | | | | | |
| | $ | 4,125,643 | | | $ | 19,219,872 | | | $ | 34,082,041 | | | $ | 29,905,480 | |
| | | 6 | | | | 23 | | | | 350 | | | | 527 | |
| | | - | | | | - | | | | 286 | | | | - | |
| | | 4,125,649 | | | | 19,219,895 | | | | 34,082,677 | | | | 29,906,007 | |
| | | | | | | | | | | | | | | | |
| | | | | | | | | | | | | | | | |
| | | 1,038,052 | | | | 5,054,785 | | | | 7,643,795 | | | | 5,337,546 | |
| | | 1,262 | | | | 3,891 | | | | 9,623 | | | | 9,354 | |
| | | 49 | | | | 90 | | | | - | | | | 151 | |
| | | 1,039,363 | | | | 5,058,766 | | | | 7,653,418 | | | | 5,347,051 | |
| | $ | 3,086,286 | | | $ | 14,161,129 | | | $ | 26,429,259 | | | $ | 24,558,956 | |
| | | | | | | | | | | | | | | | |
| | | | | | | | | | | | | | | | |
| | $ | 3,069,571 | | | $ | 14,107,547 | | | $ | 26,383,888 | | | $ | 24,526,715 | |
| | | 16,715 | | | | 53,582 | | | | 45,371 | | | | 32,241 | |
| | $ | 3,086,286 | | | $ | 14,161,129 | | | $ | 26,429,259 | | | $ | 24,558,956 | |
| | | | | | | | | | | | | | | | |
| | | | | | | | | | | | | | | | |
| | $ | 3,086,286 | | | $ | 14,161,129 | | | $ | 26,429,259 | | | $ | 24,558,956 | |
| | | 125,000 | | | | 575,000 | | | | 1,075,000 | | | | 1,000,000 | |
| | $ | 24.69 | | | $ | 24.63 | | | $ | 24.59 | | | $ | 24.56 | |
| | | | | | | | | | | | | | | | |
| | $ | 4,220,653 | | | $ | 19,718,462 | | | $ | 35,148,316 | | | $ | 30,751,135 | |
| | | 1,141,770 | | | | 5,582,674 | | | | 8,698,248 | | | | 6,160,738 | |
The accompanying notes are an integral part of these financial statements.
Statements of Operations
For the Period Ended April 30, 2023 (Unaudited)
| |
Investment Income: | |
Interest | |
Total Investment Income | |
| | |
Expenses: | |
Investment advisory fee | |
Total Expenses | |
Net Investment Income/(Loss) | |
| | |
Realized & Unrealized Gain/(Loss): | |
Net realized gain/(loss) on: | |
Investments | |
Redemptions sold in-kind on investments | |
Redemptions sold in-kind on options written | |
Options written | |
Net change in unrealized appreciation/(depreciation) on: | |
Investments | |
Options written | |
Net Realized and Unrealized Gain/(Loss) on Investments and Options Written | |
Net Increase/(Decrease) in Net Assets Resulting From Operations | |
The accompanying notes are an integral part of these financial statements.
| | Innovator U.S. Equity Buffer ETF - January | | | Innovator U.S. Equity Buffer ETF - February | | | Innovator U.S. Equity Buffer ETF - March | | | Innovator U.S. Equity Buffer ETF - April | |
| | | | | | | | | | | | | | | | |
| | $ | 7,350 | | | $ | 4,213 | | | $ | 3,425 | | | $ | 5,413 | |
| | | 7,350 | | | | 4,213 | | | | 3,425 | | | | 5,413 | |
| | | | | | | | | | | | | | | | |
| | | | | | | | | | | | | | | | |
| | | 639,204 | | | | 351,170 | | | | 323,303 | | | | 488,705 | |
| | | 639,204 | | | | 351,170 | | | | 323,303 | | | | 488,705 | |
| | | (631,854 | ) | | | (346,957 | ) | | | (319,878 | ) | | | (483,292 | ) |
| | | | | | | | | | | | | | | | |
| | | | | | | | | | | | | | | | |
| | | | | | | | | | | | | | | | |
| | | (17,511,673 | ) | | | (5,898,515 | ) | | | (5,886,095 | ) | | | (13,825,537 | ) |
| | | 9,901,579 | | | | 407,783 | | | | 191,845 | | | | 6,350,693 | |
| | | 335,450 | | | | 2,170,546 | | | | 3,009,954 | | | | 3,452,908 | |
| | | (6,608,061 | ) | | | 2,554,773 | | | | 2,840,803 | | | | 4,462,436 | |
| | | | | | | | | | | | | | | | |
| | | 16,608,009 | | | | 7,308,488 | | | | 9,378,622 | | | | 10,077,633 | |
| | | 9,729,224 | | | | 1,410,793 | | | | (697,506 | ) | | | 2,344,822 | |
| | | 12,454,528 | | | | 7,953,868 | | | | 8,837,623 | | | | 12,862,955 | |
| | $ | 11,822,674 | | | $ | 7,606,911 | | | $ | 8,517,745 | | | $ | 12,379,663 | |
The accompanying notes are an integral part of these financial statements.
Statements of Operations
For the Period Ended April 30, 2023 (Unaudited)
| |
Investment Income: | |
Interest | |
Total Investment Income | |
| | |
Expenses: | |
Investment advisory fee | |
Total Expenses | |
Net Investment Income/(Loss) | |
| | |
Realized & Unrealized Gain/(Loss): | |
Net realized gain/(loss) on: | |
Investments | |
Redemptions sold in-kind on investments | |
Redemptions sold in-kind on options written | |
Options written | |
Net change in unrealized appreciation/(depreciation) on: | |
Investments | |
Options written | |
Net Realized and Unrealized Gain/(Loss) on Investments and Options Written | |
Net Increase/(Decrease) in Net Assets Resulting From Operations | |
The accompanying notes are an integral part of these financial statements.
| | Innovator U.S. Equity Buffer ETF - May | | | Innovator U.S. Equity Buffer ETF - June | | | Innovator U.S. Equity Buffer ETF - July | | | Innovator U.S. Equity Buffer ETF - August | |
| | | | | | | | | | | | | | | | |
| | $ | 8,063 | | | $ | 5,371 | | | $ | 8,013 | | | $ | 5,942 | |
| | | 8,063 | | | | 5,371 | | | | 8,013 | | | | 5,942 | |
| | | | | | | | | | | | | | | | |
| | | | | | | | | | | | | | | | |
| | | 590,518 | | | | 396,938 | | | | 623,617 | | | | 431,889 | |
| | | 590,518 | | | | 396,938 | | | | 623,617 | | | | 431,889 | |
| | | (582,455 | ) | | | (391,567 | ) | | | (615,604 | ) | | | (425,947 | ) |
| | | | | | | | | | | | | | | | |
| | | | | | | | | | | | | | | | |
| | | | | | | | | | | | | | | | |
| | | (10,475,878 | ) | | | (124,455 | ) | | | (246,566 | ) | | | (312,585 | ) |
| | | (63,807 | ) | | | (90,631 | ) | | | 3,753,759 | | | | (117,716 | ) |
| | | 8,189,399 | | | | 309,576 | | | | 3,111,125 | | | | 205,623 | |
| | | 4,142,809 | | | | (4,771 | ) | | | 156,204 | | | | 47,978 | |
| | | | | | | | | | | | | | | | |
| | | 8,898,579 | | | | (253,191 | ) | | | 2,038,113 | | | | 1,444,359 | |
| | | (4,412,084 | ) | | | 4,565,878 | | | | 4,207,682 | | | | 5,545,397 | |
| | | 6,279,018 | | | | 4,402,406 | | | | 13,020,317 | | | | 6,813,056 | |
| | $ | 5,696,563 | | | $ | 4,010,839 | | | $ | 12,404,713 | | | $ | 6,387,109 | |
The accompanying notes are an integral part of these financial statements.
Statements of Operations
For the Period Ended April 30, 2023 (Unaudited)
| |
Investment Income: | |
Interest | |
Total Investment Income | |
| | |
Expenses: | |
Investment advisory fee | |
Total Expenses | |
Net Investment Income/(Loss) | |
| | |
Realized & Unrealized Gain/(Loss): | |
Net realized gain/(loss) on: | |
Investments | |
Redemptions sold in-kind on investments | |
Redemptions sold in-kind on options written | |
Options written | |
Net change in unrealized appreciation/(depreciation) on: | |
Investments | |
Options written | |
Net Realized and Unrealized Gain/(Loss) on Investments and Options Written | |
Net Increase/(Decrease) in Net Assets Resulting From Operations | |
The accompanying notes are an integral part of these financial statements.
| | Innovator U.S. Equity Buffer ETF - September | | | Innovator U.S. Equity Buffer ETF -
October | | | Innovator U.S. Equity Buffer ETF -
November | | | Innovator U.S. Equity Buffer ETF - December | |
| | | | | | | | | | | | | | | | |
| | $ | 8,662 | | | $ | 10,911 | | | $ | 6,786 | | | $ | 5,000 | |
| | | 8,662 | | | | 10,911 | | | | 6,786 | | | | 5,000 | |
| | | | | | | | | | | | | | | | |
| | | | | | | | | | | | | | | | |
| | | 664,302 | | | | 844,387 | | | | 518,558 | | | | 394,414 | |
| | | 664,302 | | | | 844,387 | | | | 518,558 | | | | 394,414 | |
| | | (655,640 | ) | | | (833,476 | ) | | | (511,772 | ) | | | (389,414 | ) |
| | | | | | | | | | | | | | | | |
| | | | | | | | | | | | | | | | |
| | | | | | | | | | | | | | | | |
| | | (287,903 | ) | | | (630,501 | ) | | | (261,337 | ) | | | (6,799,239 | ) |
| | | 252,481 | | | | 6,845,041 | | | | 698,460 | | | | 2,858,339 | |
| | | 448,101 | | | | 4,876,439 | | | | 488,246 | | | | 3,205,219 | |
| | | 14,345 | | | | 60,762 | | | | (8,814 | ) | | | 911,776 | |
| | | | | | | | | | | | | | | | |
| | | 3,786,245 | | | | 1,410,488 | | | | 4,221,410 | | | | 3,948,985 | |
| | | 8,164,760 | | | | 5,837,771 | | | | 6,078,796 | | | | 3,514,189 | |
| | | 12,378,029 | | | | 18,400,000 | | | | 11,216,761 | | | | 7,639,269 | |
| | $ | 11,722,389 | | | $ | 17,566,524 | | | $ | 10,704,989 | | | $ | 7,249,855 | |
The accompanying notes are an integral part of these financial statements.
Statements of Operations
For the Period Ended April 30, 2023 (Unaudited)
| |
Investment Income: | |
Interest | |
Total Investment Income | |
| | |
Expenses: | |
Investment advisory fee | |
Total Expenses | |
Net Investment Income/(Loss) | |
| | |
Realized & Unrealized Gain/(Loss): | |
Net realized gain/(loss) on: | |
Investments | |
Redemptions sold in-kind on investments | |
Redemptions sold in-kind on options written | |
Options written | |
Net change in unrealized appreciation/(depreciation) on: | |
Investments | |
Options written | |
Net Realized and Unrealized Gain/(Loss) on Investments and Options Written | |
Net Increase/(Decrease) in Net Assets Resulting From Operations | |
The accompanying notes are an integral part of these financial statements.
| | Innovator U.S. Equity Power Buffer ETF - January | | | Innovator U.S. Equity Power Buffer ETF - February | | | Innovator U.S. Equity Power Buffer ETF - March | | | Innovator U.S. Equity Power Buffer ETF - April | |
| | | | | | | | | | | | | | | | |
| | $ | 28,022 | | | $ | 19,487 | | | $ | 13,569 | | | $ | 16,308 | |
| | | 28,022 | | | | 19,487 | | | | 13,569 | | | | 16,308 | |
| | | | | | | | | | | | | | | | |
| | | | | | | | | | | | | | | | |
| | | 2,249,822 | | | | 1,540,400 | | | | 1,155,425 | | | | 1,373,355 | |
| | | 2,249,822 | | | | 1,540,400 | | | | 1,155,425 | | | | 1,373,355 | |
| | | (2,221,800 | ) | | | (1,520,913 | ) | | | (1,141,856 | ) | | | (1,357,047 | ) |
| | | | | | | | | | | | | | | | |
| | | | | | | | | | | | | | | | |
| | | | | | | | | | | | | | | | |
| | | (45,845,422 | ) | | | (18,111,524 | ) | | | (17,330,706 | ) | | | (33,727,147 | ) |
| | | 24,281,556 | | | | 3,091,907 | | | | 2,144,994 | | | | 16,781,034 | |
| | | 9,870,710 | | | | 9,421,315 | | | | 16,891,096 | | | | 19,475,105 | |
| | | (1,844,114 | ) | | | 8,047,253 | | | | 145,447 | | | | 1,097,760 | |
| | | | | | | | | | | | | | | | |
| | | 54,427,898 | | | | 22,268,497 | | | | 31,332,155 | | | | 25,143,149 | |
| | | 6,179,568 | | | | (1,969,045 | ) | | | (8,871,379 | ) | | | (3,580,048 | ) |
| | | 47,070,196 | | | | 22,748,403 | | | | 24,311,607 | | | | 25,189,853 | |
| | $ | 44,848,396 | | | $ | 21,227,490 | | | $ | 23,169,751 | | | $ | 23,832,806 | |
The accompanying notes are an integral part of these financial statements.
Statements of Operations
For the Period Ended April 30, 2023 (Unaudited)
| |
Investment Income: | |
Interest | |
Total Investment Income | |
| | |
Expenses: | |
Investment advisory fee | |
Total Expenses | |
Net Investment Income/(Loss) | |
| | |
Realized & Unrealized Gain/(Loss): | |
Net realized gain/(loss) on: | |
Investments | |
Redemptions sold in-kind on investments | |
Redemptions sold in-kind on options written | |
Options written | |
Net change in unrealized appreciation/(depreciation) on: | |
Investments | |
Options written | |
Net Realized and Unrealized Gain/(Loss) on Investments and Options Written | |
Net Increase/(Decrease) in Net Assets Resulting From Operations | |
The accompanying notes are an integral part of these financial statements.
| | Innovator U.S. Equity Power Buffer ETF -
May | | | Innovator U.S. Equity Power Buffer ETF - June | | | Innovator U.S. Equity Power Buffer ETF -
July | | | Innovator U.S. Equity Power Buffer ETF - August | |
| | | | | | | | | | | | | | | | |
| | $ | 26,516 | | | $ | 19,509 | | | $ | 25,271 | | | $ | 25,359 | |
| | | 26,516 | | | | 19,509 | | | | 25,271 | | | | 25,359 | |
| | | | | | | | | | | | | | | | |
| | | | | | | | | | | | | | | | |
| | | 1,584,737 | | | | 1,409,757 | | | | 1,904,316 | | | | 1,844,462 | |
| | | 1,584,737 | | | | 1,409,757 | | | | 1,904,316 | | | | 1,844,462 | |
| | | (1,558,221 | ) | | | (1,390,248 | ) | | | (1,879,045 | ) | | | (1,819,103 | ) |
| | | | | | | | | | | | | | | | |
| | | | | | | | | | | | | | | | |
| | | | | | | | | | | | | | | | |
| | | (31,561,883 | ) | | | (1,090,233 | ) | | | (1,425,789 | ) | | | (2,812,346 | ) |
| | | 4,435,756 | | | | 2,345,281 | | | | 5,830,508 | | | | 2,241,942 | |
| | | 17,694,763 | | | | 2,860,837 | | | | 8,086,291 | | | | 1,953,794 | |
| | | 9,612,032 | | | | (23,984 | ) | | | 95,489 | | | | (18,893 | ) |
| | | | | | | | | | | | | | | | |
| | | 21,663,742 | | | | (1,375,330 | ) | | | 9,986,642 | | | | 5,307,445 | |
| | | (13,711,922 | ) | | | 12,117,455 | | | | 14,663,050 | | | | 19,969,753 | |
| | | 8,132,488 | | | | 14,834,026 | | | | 37,236,191 | | | | 26,641,695 | |
| | $ | 6,574,267 | | | $ | 13,443,778 | | | $ | 35,357,146 | | | $ | 24,822,592 | |
The accompanying notes are an integral part of these financial statements.
Statements of Operations
For the Period Ended April 30, 2023 (Unaudited)
| |
Investment Income: | |
Interest | |
Total Investment Income | |
| | |
Expenses: | |
Investment advisory fee | |
Total Expenses | |
Net Investment Income/(Loss) | |
| | |
Realized & Unrealized Gain/(Loss): | |
Net realized gain/(loss) on: | |
Investments | |
Redemptions sold in-kind on investments | |
Redemptions sold in-kind on options written | |
Options written | |
Net change in unrealized appreciation/(depreciation) on: | |
Investments | |
Options written | |
Net Realized and Unrealized Gain/(Loss) on Investments and Options Written | |
Net Increase/(Decrease) in Net Assets Resulting From Operations | |
The accompanying notes are an integral part of these financial statements.
| | Innovator U.S. Equity Power Buffer ETF - September | | | Innovator U.S. Equity Power Buffer ETF - October | | | Innovator U.S. Equity Power Buffer ETF - November | | | Innovator U.S. Equity Power Buffer ETF - December | |
| | | | | | | | | | | | | | | | |
| | $ | 32,705 | | | $ | 31,406 | | | $ | 41,521 | | | $ | 30,991 | |
| | | 32,705 | | | | 31,406 | | | | 41,521 | | | | 30,991 | |
| | | | | | | | | | | | | | | | |
| | | | | | | | | | | | | | | | |
| | | 2,390,969 | | | | 2,388,906 | | | | 3,074,642 | | | | 2,258,314 | |
| | | 2,390,969 | | | | 2,388,906 | | | | 3,074,642 | | | | 2,258,314 | |
| | | (2,358,264 | ) | | | (2,357,500 | ) | | | (3,033,121 | ) | | | (2,227,323 | ) |
| | | | | | | | | | | | | | | | |
| | | | | | | | | | | | | | | | |
| | | | | | | | | | | | | | | | |
| | | (959,406 | ) | | | (904,903 | ) | | | (457,554 | ) | | | (20,912,318 | ) |
| | | 3,931,573 | | | | 15,876,684 | | | | 3,487,442 | | | | 5,432,698 | |
| | | 3,159,345 | | | | 7,360,366 | | | | 2,578,915 | | | | 9,078,337 | |
| | | 5,380 | | | | (310,167 | ) | | | 81,641 | | | | 7,941,179 | |
| | | | | | | | | | | | | | | | |
| | | 11,994,938 | | | | 9,983,602 | | | | 23,040,940 | | | | 18,912,221 | |
| | | 25,948,835 | | | | 17,862,904 | | | | 33,785,571 | | | | 14,206,184 | |
| | | 44,080,665 | | | | 49,868,486 | | | | 62,516,955 | | | | 34,658,301 | |
| | $ | 41,722,401 | | | $ | 47,510,986 | | | $ | 59,483,834 | | | $ | 32,430,978 | |
The accompanying notes are an integral part of these financial statements.
Statements of Operations
For the Period Ended April 30, 2023 (Unaudited)
| |
Investment Income: | |
Interest | |
Total Investment Income | |
| | |
Expenses: | |
Investment advisory fee | |
Total Expenses | |
Net Investment Income/(Loss) | |
| | |
Realized & Unrealized Gain/(Loss): | |
Net realized gain/(loss) on: | |
Investments | |
Redemptions sold in-kind on investments | |
Redemptions sold in-kind on options written | |
Options written | |
Net change in unrealized appreciation/(depreciation) on: | |
Investments | |
Options written | |
Net Realized and Unrealized Gain/(Loss) on Investments and Options Written | |
Net Increase/(Decrease) in Net Assets Resulting From Operations | |
The accompanying notes are an integral part of these financial statements.
| | Innovator U.S. Equity Ultra Buffer ETF - January | | | Innovator U.S. Equity Ultra Buffer ETF - February | | | Innovator U.S. Equity Ultra Buffer ETF - March | | | Innovator U.S. Equity Ultra Buffer ETF -
April | |
| | | | | | | | | | | | | | | | |
| | $ | 7,913 | | | $ | 3,149 | | | $ | 4,322 | | | $ | 7,523 | |
| | | 7,913 | | | | 3,149 | | | | 4,322 | | | | 7,523 | |
| | | | | | | | | | | | | | | | |
| | | | | | | | | | | | | | | | |
| | | 789,329 | | | | 288,794 | | | | 322,064 | | | | 579,626 | |
| | | 789,329 | | | | 288,794 | | | | 322,064 | | | | 579,626 | |
| | | (781,416 | ) | | | (285,645 | ) | | | (317,742 | ) | | | (572,103 | ) |
| | | | | | | | | | | | | | | | |
| | | | | | | | | | | | | | | | |
| | | | | | | | | | | | | | | | |
| | | (23,323,106 | ) | | | (4,744,273 | ) | | | (6,109,840 | ) | | | (4,355,230 | ) |
| | | 11,933,880 | | | | (50,960 | ) | | | 458,724 | | | | 1,069,908 | |
| | | 6,159,374 | | | | 1,852,997 | | | | 2,482,364 | | | | 4,369,213 | |
| | | 1,925,304 | | | | 413,656 | | | | (55,547 | ) | | | 17,500 | |
| | | | | | | | | | | | | | | | |
| | | 22,799,276 | | | | 6,105,420 | | | | 7,737,870 | | | | 4,755,579 | |
| | | (6,733,863 | ) | | | (1,540,734 | ) | | | (2,598,769 | ) | | | (2,921,895 | ) |
| | | 12,760,865 | | | | 2,036,106 | | | | 1,914,802 | | | | 2,935,075 | |
| | $ | 11,979,449 | | | $ | 1,750,461 | | | $ | 1,597,060 | | | $ | 2,362,972 | |
The accompanying notes are an integral part of these financial statements.
Statements of Operations
For the Period Ended April 30, 2023 (Unaudited)
| |
Investment Income: | |
Interest | |
Total Investment Income | |
| | |
Expenses: | |
Investment advisory fee | |
Total Expenses | |
Net Investment Income/(Loss) | |
| | |
Realized & Unrealized Gain/(Loss): | |
Net realized gain/(loss) on: | |
Investments | |
Redemptions sold in-kind on investments | |
Redemptions sold in-kind on options written | |
Options written | |
Net change in unrealized appreciation/(depreciation) on: | |
Investments | |
Options written | |
Net Realized and Unrealized Gain/(Loss) on Investments and Options Written | |
Net Increase/(Decrease) in Net Assets Resulting From Operations | |
The accompanying notes are an integral part of these financial statements.
| | Innovator U.S. Equity Ultra Buffer ETF -
May | | | Innovator U.S. Equity Ultra Buffer ETF -
June | | | Innovator U.S. Equity Ultra Buffer ETF -
July | | | Innovator U.S. Equity Ultra Buffer ETF - August | |
| | | | | | | | | | | | | | | | |
| | $ | 5,897 | | | $ | 4,760 | | | $ | 3,200 | | | $ | 5,344 | |
| | | 5,897 | | | | 4,760 | | | | 3,200 | | | | 5,344 | |
| | | | | | | | | | | | | | | | |
| | | | | | | | | | | | | | | | |
| | | 366,091 | | | | 366,459 | | | | 252,255 | | | | 408,384 | |
| | | 366,091 | | | | 366,459 | | | | 252,255 | | | | 408,384 | |
| | | (360,194 | ) | | | (361,699 | ) | | | (249,055 | ) | | | (403,040 | ) |
| | | | | | | | | | | | | | | | |
| | | | | | | | | | | | | | | | |
| | | | | | | | | | | | | | | | |
| | | (4,812,414 | ) | | | (1,530,323 | ) | | | (90,507 | ) | | | (173,698 | ) |
| | | 4,349,259 | | | | 1,579,700 | | | | 998,982 | | | | 1,317,788 | |
| | | 3,233,229 | | | | 1,150,253 | | | | 780,387 | | | | 717,597 | |
| | | 966,040 | | | | 164,908 | | | | 16,956 | | | | (1,793 | ) |
| | | | | | | | | | | | | | | | |
| | | 2,326,420 | | | | 2,304,017 | | | | 1,732,375 | | | | 1,682,649 | |
| | | (2,903,700 | ) | | | 478,731 | | | | 1,420,063 | | | | 1,833,873 | |
| | | 3,158,834 | | | | 4,147,286 | | | | 4,858,256 | | | | 5,376,416 | |
| | $ | 2,798,640 | | | $ | 3,785,587 | | | $ | 4,609,201 | | | $ | 4,973,376 | |
The accompanying notes are an integral part of these financial statements.
Statements of Operations
For the Period Ended April 30, 2023 (Unaudited)
| |
Investment Income: | |
Interest | |
Total Investment Income | |
| | |
Expenses: | |
Investment advisory fee | |
Total Expenses | |
Net Investment Income/(Loss) | |
| | |
Realized & Unrealized Gain/(Loss): | |
Net realized gain/(loss) on: | |
Investments | |
Redemptions sold in-kind on investments | |
Redemptions sold in-kind on options written | |
Options written | |
Net change in unrealized appreciation/(depreciation) on: | |
Investments | |
Options written | |
Net Realized and Unrealized Gain/(Loss) on Investments and Options Written | |
Net Increase/(Decrease) in Net Assets Resulting From Operations | |
The accompanying notes are an integral part of these financial statements.
| | Innovator U.S. Equity Ultra Buffer ETF - September | | | Innovator U.S. Equity Ultra Buffer ETF - October | | | Innovator U.S. Equity Ultra Buffer ETF - November | | | Innovator U.S. Equity Ultra Buffer ETF - December | |
| | | | | | | | | | | | | | | | |
| | $ | 7,046 | | | $ | 5,165 | | | $ | 3,160 | | | $ | 4,507 | |
| | | 7,046 | | | | 5,165 | | | | 3,160 | | | | 4,507 | |
| | | | | | | | | | | | | | | | |
| | | | | | | | | | | | | | | | |
| | | 527,895 | | | | 411,558 | | | | 243,394 | | | | 346,979 | |
| | | 527,895 | | | | 411,558 | | | | 243,394 | | | | 346,979 | |
| | | (520,849 | ) | | | (406,393 | ) | | | (240,234 | ) | | | (342,472 | ) |
| | | | | | | | | | | | | | | | |
| | | | | | | | | | | | | | | | |
| | | | | | | | | | | | | | | | |
| | | (436,162 | ) | | | 470,905 | | | | (106,784 | ) | | | (4,716,976 | ) |
| | | 5,066,273 | | | | 1,014,708 | | | | 1,028,614 | | | | 1,350,873 | |
| | | 1,713,194 | | | | 279,863 | | | | 490,749 | | | | 2,432,269 | |
| | | (62,601 | ) | | | (318,903 | ) | | | (3,819 | ) | | | 831,952 | |
| | | | | | | | | | | | | | | | |
| | | 373,742 | | | | 4,043,042 | | | | 1,741,949 | | | | 4,954,246 | |
| | | 2,236,945 | | | | 2,387,309 | | | | 1,245,125 | | | | (693,842 | ) |
| | | 8,891,391 | | | | 7,876,924 | | | | 4,395,834 | | | | 4,158,522 | |
| | $ | 8,370,542 | | | $ | 7,470,531 | | | $ | 4,155,600 | | | $ | 3,816,050 | |
The accompanying notes are an integral part of these financial statements.
Statements of Operations
For the Period Ended April 30, 2023 (Unaudited)
| | |
Investment Income: | |
Interest | |
Total Investment Income | |
| | | |
Expenses: | |
Investment advisory fee | |
Total Expenses | |
Net Investment Income/(Loss) | |
| | | |
Unrealized Gain/(Loss): | |
Net change in unrealized appreciation/(depreciation) on: | |
| | Investments | |
| | Options written | |
Net Unrealized Gain/(Loss) on Investments and Options Written | |
Net Increase/(Decrease) in Net Assets Resulting From Operations | |
| | | |
| | | |
(a) Since Commencement of Operations on March 31, 2023. | |
The accompanying notes are an integral part of these financial statements.
| | Innovator Premium Income 10 Barrier ETF – April (a) | | | | Innovator
Premium Income 20 Barrier ETF – April (a) | | | | Innovator
Premium Income 30 Barrier ETF -
April (a) | | | | Innovator
Premium Income 40 Barrier ETF – April (a) | | |
| | | | | | | | | | | | | | | | | | | | |
| | $ | 9,269 | | | | $ | 28,174 | | | | $ | 66,731 | | | | $ | 64,039 | | |
| | | 9,269 | | | | | 28,174 | | | | | 66,731 | | | | | 64,039 | | |
| | | | | | | | | | | | | | | | | | | | |
| | | | | | | | | | | | | | | | | | | | |
| | | 1,262 | | | | | 3,891 | | | | | 9,538 | | | | | 9,335 | | |
| | | 1,262 | | | | | 3,891 | | | | | 9,538 | | | | | 9,335 | | |
| | | 8,007 | | | | | 24,283 | | | | | 57,193 | | | | | 54,704 | | |
| | | | | | | | | | | | | | | | | | | | |
| | | | | | | | | | | | | | | | | | | | |
| | | | | | | | | | | | | | | | | | | | |
| | | (95,010 | ) | | | | (498,590 | ) | | | | (1,066,275 | ) | | | | (845,655 | ) | |
| | | 103,718 | | | | | 527,889 | | | | | 1,054,453 | | | | | 823,192 | | |
| | | 8,708 | | | | | 29,299 | | | | | (11,822 | ) | | | | (22,463 | ) | |
| | $ | 16,715 | | | | $ | 53,582 | | | | $ | 45,371 | | | | $ | 32,241 | | |
The accompanying notes are an integral part of these financial statements.
Statements of Changes in Net Assets
| | | Innovator U.S. Equity Buffer
ETF - January | |
| | | Period Ended April 30, 2023 (Unaudited) | | | Year Ended October 31, 2022 | |
Operations: | | | | | | | | |
Net Investment income/(loss) | | $ | (631,854 | ) | | $ | (1,392,425 | ) |
Net realized gain/(loss) | | | (13,882,705 | ) | | | 13,056,738 | |
Net change in unrealized appreciation/(depreciation) | | | 26,337,233 | | | | (34,120,436 | ) |
Net Increase/(Decrease) in Net Assets Resulting from Operations | | | 11,822,674 | | | | (22,456,123 | ) |
| | | | | | | | | |
| | | | | | | | | |
Capital Share Transactions: | | | | | | | | |
Proceeds from shares sold | | | 116,354,915 | | | | 264,258,187 | |
Cost of shares redeemed | | | (90,395,577 | ) | | | (249,518,483 | ) |
Transaction fees (see Note 5) | | | 27,767 | | | | 112,606 | |
Net Increase/(Decrease) in Net Assets from Capital Share Transactions | | | 25,987,105 | | | | 14,852,310 | |
Total Increase/(Decrease) in Net Assets | | $ | 37,809,779 | | | $ | (7,603,813 | ) |
| | | | | | | | | |
Net Assets: | | | | | | | | |
Beginning of the period | | $ | 142,635,822 | | | $ | 150,239,635 | |
End of the period | | $ | 180,445,601 | | | $ | 142,635,822 | |
| | | | | | | | | |
Change in Shares Outstanding: | | | | | | | | |
Shares sold | | | 3,475,000 | | | | 7,225,000 | |
Shares redeemed | | | (2,725,000 | ) | | | (7,000,000 | ) |
Net Increase/(Decrease) | | | 750,000 | | | | 225,000 | |
The accompanying notes are an integral part of these financial statements.
| | Innovator U.S. Equity Buffer
ETF - February | | | Innovator U.S. Equity Buffer ETF - March | | | Innovator U.S. Equity Buffer
ETF - April | |
| | Period Ended April 30, 2023 (Unaudited) | | | Year Ended October 31, 2022 | | | Period Ended April 30, 2023 (Unaudited) | | | Year Ended October 31, 2022 | | | Period Ended April 30, 2023 (Unaudited) | | | Year Ended October 31, 2022 | |
| | | | | | | | | | | | | | | | | | | | | | | | |
| | $ | (346,957 | ) | | $ | (774,213 | ) | | $ | (319,878 | ) | | $ | (600,313 | ) | | $ | (483,292 | ) | | $ | (945,432 | ) |
| | | (765,413 | ) | | | 7,821,581 | | | | 156,507 | | | | 8,019,677 | | | | 440,500 | | | | 15,010,390 | |
| | | 8,719,281 | | | | (17,367,260 | ) | | | 8,681,116 | | | | (12,682,830 | ) | | | 12,422,455 | | | | (20,344,728 | ) |
| | | 7,606,911 | | | | (10,319,892 | ) | | | 8,517,745 | | | | (5,263,466 | ) | | | 12,379,663 | | | | (6,279,770 | ) |
| | | | | | | | | | | | | | | | | | | | | | | | |
| | | | | | | | | | | | | | | | | | | | | | | | |
| | | | | | | | | | | | | | | | | | | | | | | | |
| | | 88,230,097 | | | | 135,143,030 | | | | 74,164,290 | | | | 96,744,935 | | | | 159,444,370 | | | | 166,719,955 | |
| | | (43,903,853 | ) | | | (142,224,700 | ) | | | (58,009,443 | ) | | | (77,037,963 | ) | | | (122,598,025 | ) | | | (167,876,110 | ) |
| | | 29,618 | | | | 59,259 | | | | 22,309 | | | | 27,371 | | | | 22,002 | | | | 75,410 | |
| | | 44,355,862 | | | | (7,022,411 | ) | | | 16,177,156 | | | | 19,734,343 | | | | 36,868,347 | | | | (1,080,745 | ) |
| | $ | 51,962,773 | | | $ | (17,342,303 | ) | | $ | 24,694,901 | | | $ | 14,470,877 | | | $ | 49,248,010 | | | $ | (7,360,515 | ) |
| | | | | | | | | | | | | | | | | | | | | | | | |
| | | | | | | | | | | | | | | | | | | | | | | | |
| | $ | 68,860,236 | | | $ | 86,202,539 | | | $ | 76,635,004 | | | $ | 62,164,127 | | | $ | 115,595,177 | | | $ | 122,955,692 | |
| | $ | 120,823,009 | | | $ | 68,860,236 | | | $ | 101,329,905 | | | $ | 76,635,004 | | | $ | 164,843,187 | | | $ | 115,595,177 | |
| | | | | | | | | | | | | | | | | | | | | | | | |
| | | | | | | | | | | | | | | | | | | | | | | | |
| | | 2,800,000 | | | | 4,275,000 | | | | 2,200,000 | | | | 2,900,000 | | | | 4,900,000 | | | | 5,225,000 | |
| | | (1,400,000 | ) | | | (4,675,000 | ) | | | (1,725,000 | ) | | | (2,325,000 | ) | | | (3,800,000 | ) | | | (5,225,000 | ) |
| | | 1,400,000 | | | | (400,000 | ) | | | 475,000 | | | | 575,000 | | | | 1,100,000 | | | | – | |
The accompanying notes are an integral part of these financial statements.
Statements of Changes in Net Assets
| | | Innovator U.S. Equity Buffer ETF
- May | |
| | | Period Ended April 30, 2023 (Unaudited) | | | Year Ended October 31, 2022 | |
Operations: | | | | | | | | |
Net Investment income/(loss) | | $ | (582,455 | ) | | $ | (953,058 | ) |
Net realized gain/(loss) | | | 1,792,523 | | | | 3,194,777 | |
Net change in unrealized appreciation/(depreciation) | | | 4,486,495 | | | | (10,594,891 | ) |
Net Increase/(Decrease) in Net Assets Resulting from Operations | | | 5,696,563 | | | | (8,353,172 | ) |
| | | | | | | | | |
| | | | | | | | | |
Capital Share Transactions: | | | | | | | | |
Proceeds from shares sold | | | 77,972,147 | | | | 204,029,287 | |
Cost of shares redeemed | | | (137,268,840 | ) | | | (102,090,475 | ) |
Transaction fees (see Note 5) | | | 20,892 | | | | 82,306 | |
Net Increase/(Decrease) in Net Assets from Capital Share Transactions | | | (59,275,801 | ) | | | 102,021,118 | |
Total Increase/(Decrease) in Net Assets | | $ | (53,579,238 | ) | | $ | 93,667,946 | |
| | | | | | | | | |
Net Assets: | | | | | | | | |
Beginning of the period | | $ | 175,858,307 | | | $ | 82,190,361 | |
End of the period | | $ | 122,279,069 | | | $ | 175,858,307 | |
| | | | | | | | | |
Change in Shares Outstanding: | | | | | | | | |
Shares sold | | | 2,600,000 | | | | 6,850,000 | |
Shares redeemed | | | (4,600,000 | ) | | | (3,325,000 | ) |
Net Increase/(Decrease) | | | (2,000,000 | ) | | | 3,525,000 | |
The accompanying notes are an integral part of these financial statements.
Innovator U.S. Equity Buffer ETF - June | | | Innovator U.S. Equity Buffer ETF - July | | | Innovator U.S. Equity Buffer ETF - August | |
Period Ended April 30, 2023 (Unaudited) | | | Year Ended October 31, 2022 | | | Period Ended April 30, 2023 (Unaudited) | | | Year Ended October 31, 2022 | | | Period Ended April 30, 2023 (Unaudited) | | | Year Ended October 31, 2022 | |
| | | | | | | | | | | | | | | | | | | | | | | |
| $ | (391,567 | ) | | $ | (572,372 | ) | | $ | (615,604 | ) | | $ | (878,306 | ) | | $ | (425,947 | ) | | $ | (814,052 | ) |
| | 89,719 | | | | 1,223,060 | | | | 6,774,522 | | | | 2,774,257 | | | | (176,700 | ) | | | (4,127,848 | ) |
| | 4,312,687 | | | | (7,842,938 | ) | | | 6,245,795 | | | | (2,189,108 | ) | | | 6,989,756 | | | | (7,326,167 | ) |
| | 4,010,839 | | | | (7,192,250 | ) | | | 12,404,713 | �� | | | (293,157 | ) | | | 6,387,109 | | | | (12,268,067 | ) |
| | | | | | | | | | | | | | | | | | | | | | | |
| | | | | | | | | | | | | | | | | | | | | | | |
| | | | | | | | | | | | | | | | | | | | | | | |
| | 70,482,473 | | | | 110,271,314 | | | | 25,355,708 | | | | 230,534,290 | | | | 29,007,500 | | | | 202,934,790 | |
| | (6,985,522 | ) | | | (108,154,937 | ) | | | (61,564,135 | ) | | | (243,100,360 | ) | | | (13,886,000 | ) | | | (174,555,855 | ) |
| | 35,613 | | | | 41,315 | | | | 17,007 | | | | 134,739 | | | | 17,253 | | | | 107,383 | |
| | 63,532,564 | | | | 2,157,692 | | | | (36,191,420 | ) | | | (12,431,331 | ) | | | 15,138,753 | | | | 28,486,318 | |
| $ | 67,543,403 | | | $ | (5,034,558 | ) | | $ | (23,786,707 | ) | | $ | (12,724,488 | ) | | $ | 21,525,862 | | | $ | 16,218,251 | |
| | | | | | | | | | | | | | | | | | | | | | | |
| | | | | | | | | | | | | | | | | | | | | | | |
| $ | 76,474,236 | | | $ | 81,508,794 | | | $ | 170,341,111 | | | $ | 183,065,599 | | | $ | 102,753,687 | | | $ | 86,535,436 | |
| $ | 144,017,639 | | | $ | 76,474,236 | | | $ | 146,554,404 | | | $ | 170,341,111 | | | $ | 124,279,549 | | | $ | 102,753,687 | |
| | | | | | | | | | | | | | | | | | | | | | | |
| | | | | | | | | | | | | | | | | | | | | | | |
| | 2,200,000 | | | | 3,475,000 | | | | 800,000 | | | | 7,675,000 | | | | 925,000 | | | | 6,475,000 | |
| | (225,000 | ) | | | (3,375,000 | ) | | | (1,900,000 | ) | | | (7,750,000 | ) | | | (450,000 | ) | | | (5,700,000 | ) |
| | 1,975,000 | | | | 100,000 | | | | (1,100,000 | ) | | | (75,000 | ) | | | 475,000 | | | | 775,000 | |
The accompanying notes are an integral part of these financial statements.
Statements of Changes in Net Assets
| | | Innovator U.S. Equity Buffer
ETF - September | |
| | | Period Ended April 30, 2023 (Unaudited) | | | Year Ended October 31, 2022 | |
Operations: | | | | | | | | |
Net Investment income/(loss) | | $ | (655,640 | ) | | $ | (1,134,048 | ) |
Net realized gain/(loss) | | | 427,024 | | | | (4,631,759 | ) |
Net change in unrealized appreciation/(depreciation) | | | 11,951,005 | | | | (5,490,910 | ) |
Net Increase/(Decrease) in Net Assets Resulting from Operations | | | 11,722,389 | | | | (11,256,717 | ) |
| | | | | | | | | |
| | | | | | | | | |
Capital Share Transactions: | | | | | | | | |
Proceeds from shares sold | | | 8,428,514 | | | | 163,473,610 | |
Cost of shares redeemed | | | (15,594,348 | ) | | | (143,014,130 | ) |
Transaction fees (see Note 5) | | | 6,535 | | | | 96,491 | |
Net Increase/(Decrease) in Net Assets from Capital Share Transactions | | | (7,159,299 | ) | | | 20,555,971 | |
Total Increase/(Decrease) in Net Assets | | $ | 4,563,090 | | | $ | 9,299,254 | |
| | | | | | | | | |
Net Assets: | | | | | | | | |
Beginning of the period | | $ | 166,048,530 | | | $ | 156,749,276 | |
End of the period | | $ | 170,611,620 | | | $ | 166,048,530 | |
| | | | | | | | | |
Change in Shares Outstanding: | | | | | | | | |
Shares sold | | | 275,000 | | | | 5,325,000 | |
Shares redeemed | | | (500,000 | ) | | | (4,650,000 | ) |
Net Increase/(Decrease) | | | (225,000 | ) | | | 675,000 | |
The accompanying notes are an integral part of these financial statements.
Innovator U.S. Equity Buffer
ETF - October | | | Innovator U.S. Equity Buffer ETF - November | | | Innovator U.S. Equity Buffer
ETF - December | |
Period Ended April 30, 2023 (Unaudited) | | | Year Ended October 31, 2022 | | | Period Ended April 30, 2023 (Unaudited) | | | Year Ended October 31, 2022 | | | Period Ended April 30, 2023 (Unaudited) | | | Year Ended October 31, 2022 | |
| | | | | | | | | | | | | | | | | | | | | | | |
| $ | (833,476 | ) | | $ | (855,125 | ) | | $ | (511,772 | ) | | $ | (581,542 | ) | | $ | (389,414 | ) | | $ | (675,337 | ) |
| | 11,151,741 | | | | (7,332,877 | ) | | | 916,555 | | | | (5,982,250 | ) | | | 176,095 | | | | (23,982,674 | ) |
| | 7,248,259 | | | | 6,119,513 | | | | 10,300,206 | | | | (6,493 | ) | | | 7,463,174 | | | | 17,117,793 | |
| | 17,566,524 | | | | (2,068,489 | ) | | | 10,704,989 | | | | (6,570,285 | ) | | | 7,249,855 | | | | (7,540,218 | ) |
| | | | | | | | | | | | | | | | | | | | | | | |
| | | | | | | | | | | | | | | | | | | | | | | |
| | | | | | | | | | | | | | | | | | | | | | | |
| | 16,141,248 | | | | 235,324,437 | | | | 78,314,717 | | | | 106,444,640 | | | | 112,467,558 | | | | 97,437,537 | |
| | (109,763,495 | ) | | | (118,936,245 | ) | | | (15,434,880 | ) | | | (68,807,962 | ) | | | (112,967,005 | ) | | | (44,121,098 | ) |
| | 10,933 | | | | 107,477 | | | | 41,436 | | | | 45,349 | | | | 46,350 | | | | 71,769 | |
| | (93,611,314 | ) | | | 116,495,669 | | | | 62,921,273 | | | | 37,682,027 | | | | (453,097 | ) | | | 53,388,208 | |
| $ | (76,044,790 | ) | | $ | 114,427,180 | | | $ | 73,626,262 | | | $ | 31,111,742 | | | $ | 6,796,758 | | | $ | 45,847,990 | |
| | | | | | | | | | | | | | | | | | | | | | | |
| | | | | | | | | | | | | | | | | | | | | | | |
| $ | 226,301,881 | | | $ | 111,874,701 | | | $ | 61,710,427 | | | $ | 30,598,685 | | | $ | 103,722,015 | | | $ | 57,874,025 | |
| $ | 150,257,091 | | | $ | 226,301,881 | | | $ | 135,336,689 | | | $ | 61,710,427 | | | $ | 110,518,773 | | | $ | 103,722,015 | |
| | | | | | | | | | | | | | | | | | | | | | | |
| | | | | | | | | | | | | | | | | | | | | | | |
| | 500,000 | | | | 7,700,000 | | | | 2,650,000 | | | | 3,400,000 | | | | 3,450,000 | | | | 2,950,000 | |
| | (3,325,000 | ) | | | (3,800,000 | ) | | | (500,000 | ) | | | (2,275,000 | ) | | | (3,500,000 | ) | | | (1,375,000 | ) |
| | (2,825,000 | ) | | | 3,900,000 | | | | 2,150,000 | | | | 1,125,000 | | | | (50,000 | ) | | | 1,575,000 | |
The accompanying notes are an integral part of these financial statements.
Statements of Changes in Net Assets
| | | Innovator U.S. Equity Power Buffer ETF - January | |
| | | Period Ended April 30, 2023 (Unaudited) | | | Year Ended October 31, 2022 | |
Operations: | | | | | | | | |
Net Investment income/(loss) | | $ | (2,221,800 | ) | | $ | (3,796,381 | ) |
Net realized gain/(loss) | | | (13,537,270 | ) | | | 15,210,957 | |
Net change in unrealized appreciation/(depreciation) | | | 60,607,466 | | | | (44,822,152 | ) |
Net Increase/(Decrease) in Net Assets Resulting from Operations | | | 44,848,396 | | | | (33,407,576 | ) |
| | | | | | | | | |
| | | | | | | | | |
Capital Share Transactions: | | | | | | | | |
Proceeds from shares sold | | | 492,542,832 | | | | 712,865,811 | |
Cost of shares redeemed | | | (308,697,203 | ) | | | (525,540,307 | ) |
Transaction fees (see Note 5) | | | 166,726 | | | | 315,853 | |
Net Increase/(Decrease) in Net Assets from Capital Share Transactions | | | 184,012,355 | | | | 187,641,357 | |
Total Increase/(Decrease) in Net Assets | | $ | 228,860,751 | | | $ | 154,233,781 | |
| | | | | | | | | |
Net Assets: | | | | | | | | |
Beginning of the period | | $ | 448,794,509 | | | $ | 294,560,728 | |
End of the period | | $ | 677,655,260 | | | $ | 448,794,509 | |
| | | | | | | | | |
Change in Shares Outstanding: | | | | | | | | |
Shares sold | | | 15,400,000 | | | | 21,850,000 | |
Shares redeemed | | | (9,675,000 | ) | | | (16,350,000 | ) |
Net Increase/(Decrease) | | | 5,725,000 | | | | 5,500,000 | |
The accompanying notes are an integral part of these financial statements.
| | Innovator U.S. Equity Power Buffer ETF - February | | | Innovator U.S. Equity Power Buffer ETF - March | | | Innovator U.S. Equity Power Buffer ETF - April | |
| | Period Ended April 30, 2023 (Unaudited) | | | Year Ended October 31, 2022 | | | Period Ended April 30, 2023 (Unaudited) | | | Year Ended October 31, 2022 | | | Period Ended April 30, 2023 (Unaudited) | | | Year Ended October 31, 2022 | |
| | | | | | | | | | | | | | | | | | | | | | | | |
| | $ | (1,520,913 | ) | | $ | (1,885,754 | ) | | $ | (1,141,856 | ) | | $ | (1,510,280 | ) | | $ | (1,357,047 | ) | | $ | (2,101,003 | ) |
| | | 2,448,951 | | | | 14,300,856 | | | | 1,850,831 | | | | 12,019,910 | | | | 3,626,752 | | | | 19,162,390 | |
| | | 20,299,452 | | | | (26,967,492 | ) | | | 22,460,776 | | | | (18,335,339 | ) | | | 21,563,101 | | | | (30,248,501 | ) |
| | | 21,227,490 | | | | (14,552,390 | ) | | | 23,169,751 | | | | (7,825,709 | ) | | | 23,832,806 | | | | (13,187,114 | ) |
| | | | | | | | | | | | | | | | | | | | | | | | |
| | | | | | | | | | | | | | | | | | | | | | | | |
| | | | | | | | | | | | | | | | | | | | | | | | |
| | | 522,339,360 | | | | 346,725,900 | | | | 489,466,240 | | | | 287,366,113 | | | | 686,484,638 | | | | 388,545,420 | |
| | | (155,708,140 | ) | | | (263,323,423 | ) | | | (291,104,257 | ) | | | (171,226,173 | ) | | | (359,366,249 | ) | | | (309,481,353 | ) |
| | | 209,201 | | | | 158,673 | | | | 143,354 | | | | 106,314 | | | | 197,382 | | | | 153,742 | |
| | | 366,840,421 | | | | 83,561,150 | | | | 198,505,337 | | | | 116,246,254 | | | | 327,315,771 | | | | 79,217,809 | |
| | $ | 388,067,911 | | | $ | 69,008,760 | | | $ | 221,675,088 | | | $ | 108,420,545 | | | $ | 351,148,577 | | | $ | 66,030,695 | |
| | | | | | | | | | | | | | | | | | | | | | | | |
| | | | | | | | | | | | | | | | | | | | | | | | |
| | $ | 239,415,504 | | | $ | 170,406,744 | | | $ | 226,295,188 | | | $ | 117,874,643 | | | $ | 308,533,940 | | | $ | 242,503,245 | |
| | $ | 627,483,415 | | | $ | 239,415,504 | | | $ | 447,970,276 | | | $ | 226,295,188 | | | $ | 659,682,517 | | | $ | 308,533,940 | |
| | | | | | | | | | | | | | | | | | | | | | | | |
| | | | | | | | | | | | | | | | | | | | | | | | |
| | | 17,975,000 | | | | 11,950,000 | | | | 15,600,000 | | | | 9,175,000 | | | | 23,400,000 | | | | 13,500,000 | |
| | | (5,375,000 | ) | | | (9,225,000 | ) | | | (9,275,000 | ) | | | (5,500,000 | ) | | | (12,325,000 | ) | | | (10,750,000 | ) |
| | | 12,600,000 | | | | 2,725,000 | | | | 6,325,000 | | | | 3,675,000 | | | | 11,075,000 | | | | 2,750,000 | |
The accompanying notes are an integral part of these financial statements.
Statements of Changes in Net Assets
| | | Innovator U.S. Equity Power Buffer ETF - May | |
| | | Period Ended April 30, 2023 (Unaudited) | | | Year Ended October 31, 2022 | |
Operations: | | | | | | | | |
Net Investment income/(loss) | | $ | (1,558,221 | ) | | $ | (2,391,922 | ) |
Net realized gain/(loss) | | | 180,668 | | | | 6,944,927 | |
Net change in unrealized appreciation/(depreciation) | | | 7,951,820 | | | | (20,808,950 | ) |
Net Increase/(Decrease) in Net Assets Resulting from Operations | | | 6,574,267 | | | | (16,255,945 | ) |
| | | | | | | | | |
| | | | | | | | | |
Capital Share Transactions: | | | | | | | | |
Proceeds from shares sold | | | 469,552,208 | | | | 500,467,810 | |
Cost of shares redeemed | | | (372,750,395 | ) | | | (330,230,175 | ) |
Transaction fees (see Note 5) | | | 189,266 | | | | 205,825 | |
Net Increase/(Decrease) in Net Assets from Capital Share Transactions | | | 96,991,079 | | | | 170,443,460 | |
Total Increase/(Decrease) in Net Assets | | $ | 103,565,346 | | | $ | 154,187,515 | |
| | | | | | | | | |
Net Assets: | | | | | | | | |
Beginning of the period | | $ | 392,967,163 | | | $ | 238,779,648 | |
End of the period | | $ | 496,532,509 | | | $ | 392,967,163 | |
| | | | | | | | | |
Change in Shares Outstanding: | | | | | | | | |
Shares sold | | | 16,375,000 | | | | 17,475,000 | |
Shares redeemed | | | (13,100,000 | ) | | | (11,350,000 | ) |
Net Increase/(Decrease) | | | 3,275,000 | | | | 6,125,000 | |
The accompanying notes are an integral part of these financial statements.
| | Innovator U.S. Equity Power Buffer ETF - June | | | Innovator U.S. Equity Power Buffer ETF - July | | | Innovator U.S. Equity Power Buffer ETF - August | |
| | Period Ended April 30, 2023 (Unaudited) | | | Year Ended October 31, 2022 | | | Period Ended April 30, 2023 (Unaudited) | | | Year Ended October 31, 2022 | | | Period Ended April 30, 2023 (Unaudited) | | | Year Ended October 31, 2022 | |
| | | | | | | | | | | | | | | | | | | | | | | | |
| | $ | (1,390,248 | ) | | $ | (1,761,840 | ) | | $ | (1,879,045 | ) | | $ | (2,106,388 | ) | | $ | (1,819,103 | ) | | $ | (1,824,122 | ) |
| | | 4,091,901 | | | | 3,543,572 | | | | 12,586,499 | | | | 4,290,213 | | | | 1,364,497 | | | | (84,441 | ) |
| | | 10,742,125 | | | | (13,409,199 | ) | | | 24,649,692 | | | | 850,402 | | | | 25,277,198 | | | | (15,632,726 | ) |
| | | 13,443,778 | | | | (11,627,467 | ) | | | 35,357,146 | | | | 3,034,227 | | | | 24,822,592 | | | | (17,541,289 | ) |
| | | | | | | | | | | | | | | | | | | | | | | | |
| | | | | | | | | | | | | | | | | | | | | | | | |
| | | | | | | | | | | | | | | | | | | | | | | | |
| | | 50,492,018 | | | | 428,015,688 | | | | 45,831,027 | | | | 552,054,235 | | | | 120,712,688 | | | | 490,066,589 | |
| | | (44,984,695 | ) | | | (225,145,245 | ) | | | (168,830,145 | ) | | | (270,255,030 | ) | | | (56,578,418 | ) | | | (222,920,795 | ) |
| | | 29,414 | | | | 156,573 | | | | 31,818 | | | | 239,304 | | | | 74,620 | | | | 175,874 | |
| | | 5,536,737 | | | | 203,027,016 | | | | (122,967,300 | ) | | | 282,038,509 | | | | 64,208,890 | | | | 267,321,668 | |
| | $ | 18,980,515 | | | $ | 191,399,549 | | | $ | (87,610,154 | ) | | $ | 285,072,736 | | | $ | 89,031,482 | | | $ | 249,780,379 | |
| | | | | | | | | | | | | | | | | | | | | | | | |
| | | | | | | | | | | | | | | | | | | | | | | | |
| | $ | 344,365,286 | | | $ | 152,965,737 | | | $ | 503,828,174 | | | $ | 218,755,438 | | | $ | 435,771,794 | | | $ | 185,991,415 | |
| | $ | 363,345,801 | | | $ | 344,365,286 | | | $ | 416,218,020 | | | $ | 503,828,174 | | | $ | 524,803,276 | | | $ | 435,771,794 | |
| | | | | | | | | | | | | | | | | | | | | | | | |
| | | | | | | | | | | | | | | | | | | | | | | | |
| | | 1,650,000 | | | | 14,200,000 | | | | 1,525,000 | | | | 18,800,000 | | | | 4,125,000 | | | | 16,900,000 | |
| | | (1,475,000 | ) | | | (7,400,000 | ) | | | (5,425,000 | ) | | | (9,150,000 | ) | | | (1,925,000 | ) | | | (7,650,000 | ) |
| | | 175,000 | | | | 6,800,000 | | | | (3,900,000 | ) | | | 9,650,000 | | | | 2,200,000 | | | | 9,250,000 | |
The accompanying notes are an integral part of these financial statements.
Statements of Changes in Net Assets
| | | Innovator U.S. Equity Power Buffer ETF - September | |
| | | Period Ended April 30, 2023 (Unaudited) | | | Year Ended October 31, 2022 | |
Operations: | | | | | | | | |
Net Investment income/(loss) | | $ | (2,358,264 | ) | | $ | (2,337,158 | ) |
Net realized gain/(loss) | | | 6,136,892 | | | | 254,036 | |
Net change in unrealized appreciation/(depreciation) | | | 37,943,773 | | | | (9,218,889 | ) |
Net Increase/(Decrease) in Net Assets Resulting from Operations | | | 41,722,401 | | | | (11,302,011 | ) |
| | | | | | | | | |
| | | | | | | | | |
Capital Share Transactions: | | | | | | | | |
Proceeds from shares sold | | | 140,199,542 | | | | 502,832,858 | |
Cost of shares redeemed | | | (80,806,880 | ) | | | (248,135,755 | ) |
Transaction fees (see Note 5) | | | 74,997 | | | | 275,109 | |
Net Increase/(Decrease) in Net Assets from Capital Share Transactions | | | 59,467,659 | | | | 254,972,212 | |
Total Increase/(Decrease) in Net Assets | | $ | 101,190,060 | | | $ | 243,670,201 | |
| | | | | | | | | |
Net Assets: | | | | | | | | |
Beginning of the period | | $ | 547,143,129 | | | $ | 303,472,928 | |
End of the period | | $ | 648,333,189 | | | $ | 547,143,129 | |
| | | | | | | | | |
Change in Shares Outstanding: | | | | | | | | |
Shares sold | | | 4,750,000 | | | | 17,200,000 | |
Shares redeemed | | | (2,675,000 | ) | | | (8,525,000 | ) |
Net Increase/(Decrease) | | | 2,075,000 | | | | 8,675,000 | |
The accompanying notes are an integral part of these financial statements.
| | Innovator U.S. Equity Power Buffer ETF - October | | | Innovator U.S. Equity Power Buffer ETF - November | | | Innovator U.S. Equity Power B uffer ETF - December | |
| | Period Ended April 30, 2023 (Unaudited) | | | Year Ended October 31, 2022 | | | Period Ended April 30, 2023 (Unaudited) | | | Year Ended October 31, 2022 | | | Period Ended April 30, 2023 (Unaudited) | | | Year Ended October 31, 2022 | |
| | | | | | | | | | | | | | | | | | | | | | | | |
| | $ | (2,357,500 | ) | | $ | (1,880,912 | ) | | $ | (3,033,121 | ) | | $ | (1,529,342 | ) | | $ | (2,227,323 | ) | | $ | (1,646,227 | ) |
| | | 22,021,980 | | | | (3,616,433 | ) | | | 5,690,444 | | | | (3,521,983 | ) | | | 1,539,896 | | | | (46,947,377 | ) |
| | | 27,846,506 | | | | 15,460,475 | | | | 56,826,511 | | | | (51,911 | ) | | | 33,118,405 | | | | 40,595,743 | |
| | | 47,510,986 | | | | 9,963,130 | | | | 59,483,834 | | | | (5,103,236 | ) | | | 32,430,978 | | | | (7,997,861 | ) |
| | | | | | | | | | | | | | | | | | | | | | | | |
| | | | | | | | | | | | | | | | | | | | | | | | |
| | | | | | | | | | | | | | | | | | | | | | | | |
| | | 47,637,730 | | | | 678,118,137 | | | | 483,111,885 | | | | 417,456,003 | | | | 649,554,484 | | | | 150,588,793 | |
| | | (242,321,525 | ) | | | (248,418,882 | ) | | | (67,014,896 | ) | | | (174,482,237 | ) | | | (176,346,185 | ) | | | (43,274,947 | ) |
| | | 42,512 | | | | 292,559 | | | | 245,905 | | | | 175,984 | | | | 296,583 | | | | 92,161 | |
| | | (194,641,283 | ) | | | 429,991,814 | | | | 416,342,894 | | | | 243,149,750 | | | | 473,504,882 | | | | 107,406,007 | |
| | $ | (147,130,297 | ) | | $ | 439,954,944 | | | $ | 475,826,728 | | | $ | 238,046,514 | | | $ | 505,935,860 | | | $ | 99,408,146 | |
| | | | | | | | | | | | | | | | | | | | | | | | |
| | | | | | | | | | | | | | | | | | | | | | | | |
| | $ | 649,487,968 | | | $ | 209,533,024 | | | $ | 317,389,154 | | | $ | 79,342,640 | | | $ | 207,928,631 | | | $ | 108,520,485 | |
| | $ | 502,357,671 | | | $ | 649,487,968 | | | $ | 793,215,882 | | | $ | 317,389,154 | | | $ | 713,864,491 | | | $ | 207,928,631 | |
| | | | | | | | | | | | | | | | | | | | | | | | |
| | | | | | | | | | | | | | | | | | | | | | | | |
| | | 1,575,000 | | | | 23,450,000 | | | | 16,150,000 | | | | 13,850,000 | | | | 21,250,000 | | | | 4,875,000 | |
| | | (7,800,000 | ) | | | (8,575,000 | ) | | | (2,125,000 | ) | | | (5,875,000 | ) | | | (5,700,000 | ) | | | (1,450,000 | ) |
| | | (6,225,000 | ) | | | 14,875,000 | | | | 14,025,000 | | | | 7,975,000 | | | | 15,550,000 | | | | 3,425,000 | |
The accompanying notes are an integral part of these financial statements.
Statements of Changes in Net Assets
| | | Innovator U.S. Equity Ultra Buffer ETF - January | |
| | | Period Ended April 30, 2023 (Unaudited) | | | Year Ended October 31, 2022 | |
Operations: | | | | | | | | |
Net Investment income/(loss) | | $ | (781,416 | ) | | $ | (1,849,216 | ) |
Net realized gain/(loss) | | | (3,304,548 | ) | | | 4,720,887 | |
Net change in unrealized appreciation/(depreciation) | | | 16,065,413 | | | | (14,697,908 | ) |
Net Increase/(Decrease) in Net Assets Resulting from Operations | | | 11,979,449 | | | | (11,826,237 | ) |
| | | | | | | | | |
| | | | | | | | | |
Capital Share Transactions: | | | | | | | | |
Proceeds from shares sold | | | 151,614,791 | | | | 431,531,228 | |
Cost of shares redeemed | | | (296,015,387 | ) | | | (222,552,470 | ) |
Transaction fees (see Note 5) | | | 44,089 | | | | 211,171 | |
Net Increase/(Decrease) in Net Assets from Capital Share Transactions | | | (144,356,507 | ) | | | 209,189,929 | |
Total Increase/(Decrease) in Net Assets | | $ | (132,377,058 | ) | | $ | 197,363,692 | |
| | | | | | | | | |
Net Assets: | | | | | | | | |
Beginning of the period | | $ | 283,637,879 | | | $ | 86,274,187 | |
End of the period | | $ | 151,260,821 | | | $ | 283,637,879 | |
| | | | | | | | | |
Change in Shares Outstanding: | | | | | | | | |
Shares sold | | | 5,100,000 | | | | 14,200,000 | |
Shares redeemed | | | (9,900,000 | ) | | | (7,350,000 | ) |
Net Increase/(Decrease) | | | (4,800,000 | ) | | | 6,850,000 | |
The accompanying notes are an integral part of these financial statements.
| | Innovator U.S. Equity Ultra Buffer ETF - February | | | Innovator U.S. Equity Ultra Buffer ETF - March | | | Innovator U.S. Equity Ultra Buffer ETF - April | |
| | Period Ended April 30, 2023 (Unaudited) | | | Year Ended October 31, 2022 | | | Period Ended April 30, 2023 (Unaudited) | | | Year Ended October 31, 2022 | | | Period Ended April 30, 2023 (Unaudited) | | | Year Ended October 31, 2022 | |
| | | | | | | | | | | | | | | | | | | | | | | | |
| | $ | (285,645 | ) | | $ | (325,297 | ) | | $ | (317,742 | ) | | $ | (335,106 | ) | | $ | (572,103 | ) | | $ | (572,102 | ) |
| | | (2,528,580 | ) | | | 2,540,234 | | | | (3,224,299 | ) | | | 3,530,144 | | | | 1,101,391 | | | | 1,863,012 | |
| | | 4,564,686 | | | | (4,931,123 | ) | | | 5,139,101 | | | | (5,337,545 | ) | | | 1,833,684 | | | | (3,499,086 | ) |
| | | 1,750,461 | | | | (2,716,186 | ) | | | 1,597,060 | | | | (2,142,507 | ) | | | 2,362,972 | | | | (2,208,176 | ) |
| | | | | | | | | | | | | | | | | | | | | | | | |
| | | | | | | | | | | | | | | | | | | | | | | | |
| | | | | | | | | | | | | | | | | | | | | | | | |
| | | 80,362,582 | | | | 62,813,015 | | | | 165,081,055 | | | | 80,205,350 | | | | 274,681,545 | | | | 146,114,520 | |
| | | (44,260,173 | ) | | | (33,169,010 | ) | | | (163,572,920 | ) | | | (41,937,333 | ) | | | (246,861,930 | ) | | | (78,334,945 | ) |
| | | 26,671 | | | | 21,232 | | | | 39,381 | | | | 29,319 | | | | 68,491 | | | | 71,856 | |
| | | 36,129,080 | | | | 29,665,237 | | | | 1,547,516 | | | | 38,297,336 | | | | 27,888,106 | | | | 67,851,431 | |
| | $ | 37,879,541 | | | $ | 26,949,051 | | | $ | 3,144,576 | | | $ | 36,154,829 | | | $ | 30,251,078 | | | $ | 65,643,255 | |
| | | | | | | | | | | | | | | | | | | | | | | | |
| | | | | | | | | | | | | | | | | | | | | | | | |
| | $ | 53,357,562 | | | $ | 26,408,511 | | | $ | 69,405,966 | | | $ | 33,251,137 | | | $ | 122,885,560 | | | $ | 57,242,305 | |
| | $ | 91,237,103 | | | $ | 53,357,562 | | | $ | 72,550,542 | | | $ | 69,405,966 | | | $ | 153,136,638 | | | $ | 122,885,560 | |
| | | | | | | | | | | | | | | | | | | | | | | | |
| | | | | | | | | | | | | | | | | | | | | | | | |
| | | 3,050,000 | | | | 2,275,000 | | | | 5,850,000 | | | | 2,750,000 | | | | 11,025,000 | | | | 5,800,000 | |
| | | (1,675,000 | ) | | | (1,200,000 | ) | | | (5,800,000 | ) | | | (1,425,000 | ) | | | (9,900,000 | ) | | | (3,050,000 | ) |
| | | 1,375,000 | | | | 1,075,000 | | | | 50,000 | | | | 1,325,000 | | | | 1,125,000 | | | | 2,750,000 | |
The accompanying notes are an integral part of these financial statements.
Statements of Changes in Net Assets
| | | Innovator U.S. Equity Ultra Buffer ETF - May | |
| | | Period Ended April 30, 2023 (Unaudited) | | | Year Ended October 31, 2022 | |
Operations: | | | | | | | | |
Net Investment income/(loss) | | $ | (360,194 | ) | | $ | (493,234 | ) |
Net realized gain/(loss) | | | 3,736,114 | | | | (88,676 | ) |
Net change in unrealized appreciation/(depreciation) | | | (577,280 | ) | | | (1,124,082 | ) |
Net Increase/(Decrease) in Net Assets Resulting from Operations | | | 2,798,640 | | | | (1,705,992 | ) |
| | | | | | | | | |
| | | | | | | | | |
Capital Share Transactions: | | | | | | | | |
Proceeds from shares sold | | | 72,781,163 | | | | 121,467,737 | |
Cost of shares redeemed | | | (77,526,980 | ) | | | (61,062,960 | ) |
Transaction fees (see Note 5) | | | 19,911 | | | | 60,756 | |
Net Increase/(Decrease) in Net Assets from Capital Share Transactions | | | (4,725,906 | ) | | | 60,465,533 | |
Total Increase/(Decrease) in Net Assets | | $ | (1,927,266 | ) | | $ | 58,759,541 | |
| | | | | | | | | |
Net Assets: | | | | | | | | |
Beginning of the period | | $ | 99,393,584 | | | $ | 40,634,043 | |
End of the period | | $ | 97,466,318 | | | $ | 99,393,584 | |
| | | | | | | | | |
Change in Shares Outstanding: | | | | | | | | |
Shares sold | | | 2,750,000 | | | | 4,550,000 | |
Shares redeemed | | | (2,925,000 | ) | | | (2,200,000 | ) |
Net Increase/(Decrease) | | | (175,000 | ) | | | 2,350,000 | |
The accompanying notes are an integral part of these financial statements.
| | Innovator U.S. Equity Ultra Buffer ETF - June | | | Innovator U.S. Equity Ultra Buffer ETF - July | | | Innovator U.S. Equity Ultra Buffer ETF - August | |
| | Period Ended April 30, 2023 (Unaudited) | | | Year Ended October 31, 2022 | | | Period Ended April 30, 2023 (Unaudited) | | | Year Ended October 31, 2022 | | | Period Ended April 30, 2023 (Unaudited) | | | Year Ended October 31, 2022 | |
| | | | | | | | | | | | | | | | | | | | | | | | |
| | $ | (361,699 | ) | | $ | (425,885 | ) | | $ | (249,055 | ) | | $ | (395,628 | ) | | $ | (403,040 | ) | | $ | (327,182 | ) |
| | | 1,364,538 | | | | 498,253 | | | | 1,705,818 | | | | (1,277,626 | ) | | | 1,859,894 | | | | (1,402,620 | ) |
| | | 2,782,748 | | | | (783,495 | ) | | | 3,152,438 | | | | 77,274 | | | | 3,516,522 | | | | (1,622,835 | ) |
| | | 3,785,587 | | | | (711,127 | ) | | | 4,609,201 | | | | (1,595,980 | ) | | | 4,973,376 | | | | (3,352,637 | ) |
| | | | | | | | | | | | | | | | | | | | | | | | |
| | | | | | | | | | | | | | | | | | | | | | | | |
| | | | | | | | | | | | | | | | | | | | | | | | |
| | | 14,266,160 | | | | 119,789,758 | | | | 3,835,638 | | | | 89,725,618 | | | | 57,684,833 | | | | 111,274,400 | |
| | | (42,585,843 | ) | | | (25,425,937 | ) | | | (27,765,212 | ) | | | (67,210,810 | ) | | | (16,062,695 | ) | | | (72,056,085 | ) |
| | | 16,099 | | | | 52,913 | | | | 3,218 | | | | 41,955 | | | | 29,512 | | | | 59,049 | |
| | | (28,303,584 | ) | | | 94,416,734 | | | | (23,926,356 | ) | | | 22,556,763 | | | | 41,651,650 | | | | 39,277,364 | |
| | $ | (24,517,997 | ) | | $ | 93,705,607 | | | $ | (19,317,155 | ) | | $ | 20,960,783 | | | $ | 46,625,026 | | | $ | 35,924,727 | |
| | | | | | | | | | | | | | | | | | | | | | | | |
| | | | | | | | | | | | | | | | | | | | | | | | |
| | $ | 114,860,138 | | | $ | 21,154,531 | | | $ | 73,649,644 | | | $ | 52,688,861 | | | $ | 82,307,526 | | | $ | 46,382,799 | |
| | $ | 90,342,141 | | | $ | 114,860,138 | | | $ | 54,332,489 | | | $ | 73,649,644 | | | $ | 128,932,552 | | | $ | 82,307,526 | |
| | | | | | | | | | | | | | | | | | | | | | | | |
| | | | | | | | | | | | | | | | | | | | | | | | |
| | | 525,000 | | | | 4,475,000 | | | | 150,000 | | | | 3,525,000 | | | | 2,175,000 | | | | 4,175,000 | |
| | | (1,550,000 | ) | | | (925,000 | ) | | | (1,050,000 | ) | | | (2,575,000 | ) | | | (600,000 | ) | | | (2,625,000 | ) |
| | | (1,025,000 | ) | | | 3,550,000 | | | | (900,000 | ) | | | 950,000 | | | | 1,575,000 | | | | 1,550,000 | |
The accompanying notes are an integral part of these financial statements.
Statements of Changes in Net Assets
| | | Innovator U.S. Equity Ultra Buffer ETF - September | |
| | | Period Ended April 30, 2023 (Unaudited) | | | Year Ended October 31, 2022 | |
Operations: | | | | | | | | |
Net Investment income/(loss) | | $ | (520,849 | ) | | $ | (538,038 | ) |
Net realized gain/(loss) | | | 6,280,704 | | | | (2,897,791 | ) |
Net change in unrealized appreciation/(depreciation) | | | 2,610,687 | | | | 757,056 | |
Net Increase/(Decrease) in Net Assets Resulting from Operations | | | 8,370,542 | | | | (2,678,773 | ) |
| | | | | | | | | |
| | | | | | | | | |
Capital Share Transactions: | | | | | | | | |
Proceeds from shares sold | | | 10,698,435 | | | | 154,017,692 | |
Cost of shares redeemed | | | (69,325,893 | ) | | | (59,931,218 | ) |
Transaction fees (see Note 5) | | | 9,793 | | | | 75,835 | |
Net Increase/(Decrease) in Net Assets from Capital Share Transactions | | | (58,617,665 | ) | | | 94,162,309 | |
Total Increase/(Decrease) in Net Assets | | $ | (50,247,123 | ) | | $ | 91,483,536 | |
| | | | | | | | | |
Net Assets: | | | | | | | | |
Beginning of the period | | $ | 158,986,013 | | | $ | 67,502,477 | |
End of the period | | $ | 108,738,890 | | | $ | 158,986,013 | |
| | | | | | | | | |
Change in Shares Outstanding: | | | | | | | | |
Shares sold | | | 400,000 | | | | 5,900,000 | |
Shares redeemed | | | (2,550,000 | ) | | | (2,225,000 | ) |
Net Increase/(Decrease) | | | (2,150,000 | ) | | | 3,675,000 | |
The accompanying notes are an integral part of these financial statements.
| | Innovator U.S. Equity Ultra Buffer ETF - October | | | Innovator U.S. Equity Ultra Buffer ETF - November | | | Innovator U.S. Equity Ultra Buffer ETF - December | |
| | Period Ended April 30, 2023 (Unaudited) | | | Year Ended October 31, 2022 | | | Period Ended April 30, 2023 (Unaudited) | | | Year Ended October 31, 2022 | | | Period Ended April 30, 2023 (Unaudited) | | | Year Ended October 31, 2022 | |
| | | | | | | | | | | | | | | | | | | | | | | | |
| | $ | (406,393 | ) | | $ | (574,255 | ) | | $ | (240,234 | ) | | $ | (329,373 | ) | | $ | (342,472 | ) | | $ | (344,192 | ) |
| | | 1,446,573 | | | | (2,697,559 | ) | | | 1,408,760 | | | | (2,208,402 | ) | | | (101,882 | ) | | | (2,071,436 | ) |
| | | 6,430,351 | | | | 1,775,544 | | | | 2,987,074 | | | | (9,302 | ) | | | 4,260,404 | | | | (506,813 | ) |
| | | 7,470,531 | | | | (1,496,270 | ) | | | 4,155,600 | | | | (2,547,077 | ) | | | 3,816,050 | | | | (2,922,441 | ) |
| | | | | | | | | | | | | | | | | | | | | | | | |
| | | | | | | | | | | | | | | | | | | | | | | | |
| | | | | | | | | | | | | | | | | | | | | | | | |
| | | 6,122,340 | | | | 152,701,155 | | | | 23,303,373 | | | | 80,750,695 | | | | 116,732,152 | | | | 30,094,508 | |
| | | (32,054,468 | ) | | | (100,855,685 | ) | | | (29,883,465 | ) | | | (36,086,448 | ) | | | (64,462,918 | ) | | | (12,938,490 | ) |
| | | 13,134 | | | | 53,330 | | | | 12,362 | | | | 26,502 | | | | 46,783 | | | | 18,723 | |
| | | (25,918,994 | ) | | | 51,898,800 | | | | (6,567,730 | ) | | | 44,690,749 | | | | 52,316,017 | | | | 17,174,741 | |
| | $ | (18,448,463 | ) | | $ | 50,402,530 | | | $ | (2,412,130 | ) | | $ | 42,143,672 | | | $ | 56,132,067 | | | $ | 14,252,300 | |
| | | | | | | | | | | | | | | | | | | | | | | | |
| | | | | | | | | | | | | | | | | | | | | | | | |
| | $ | 113,221,009 | | | $ | 62,818,479 | | | $ | 53,125,922 | | | $ | 10,982,250 | | | $ | 46,311,342 | | | $ | 32,059,042 | |
| | $ | 94,772,546 | | | $ | 113,221,009 | | | $ | 50,713,792 | | | $ | 53,125,922 | | | $ | 102,443,409 | | | $ | 46,311,342 | |
| | | | | | | | | | | | | | | | | | | | | | | | |
| | | | | | | | | | | | | | | | | | | | | | | | |
| | | 225,000 | | | | 5,775,000 | | | | 850,000 | | | | 2,850,000 | | | | 4,200,000 | | | | 1,025,000 | |
| | | (1,150,000 | ) | | | (3,800,000 | ) | | | (1,050,000 | ) | | | (1,300,000 | ) | | | (2,300,000 | ) | | | (450,000 | ) |
| | | (925,000 | ) | | | 1,975,000 | | | | (200,000 | ) | | | 1,550,000 | | | | 1,900,000 | | | | 575,000 | |
The accompanying notes are an integral part of these financial statements.
Statements of Changes in Net Assets
| |
| | |
| | |
| | |
Operations: | |
Net investment income/(loss) | |
Net change in unrealized appreciation/(depreciation) | |
Net Increase/(Decrease) in Net Assets Resulting from Operations | |
| | |
Capital Share Transactions: | |
Proceeds from shares sold | |
Transaction fees (see Note 5) | |
Net Increase/(Decrease) in Net Assets from Capital Share Transactions | |
Total Increase/(Decrease) in Net Assets | |
| | |
Net Assets: | |
Beginning of period | |
End of period | |
| | |
Change in Shares Outstanding: | |
Shares sold | |
Shares redeemed | |
Net Increase/(Decrease) | |
(a) Since Commencement of Operations on March 31, 2023. | |
The accompanying notes are an integral part of these financial statements.
| | Innovator Premium Income 10 Barrier ETF - April | | | Innovator Premium Income 20 Barrier ETF -
April | | | Innovator
Premium Income
30 Barrier ETF -
April | | | Innovator
Premium Income
40 Barrier ETF -
April | |
| | Period Ended | | | Period Ended | | | Period Ended | | | Period Ended | |
| | April 30, 2023 | | | April 30, 2023 | | | April 30, 2023 | | | April 30, 2023 | |
| | (Unaudited) (a) | | | (Unaudited) (a) | | | (Unaudited) (a) | | | (Unaudited) (a) | |
| | | | | | | | | | | | | | | | |
| | $ | 8,007 | | | $ | 24,283 | | | $ | 57,193 | | | $ | 54,704 | |
| | | 8,708 | | | | 29,299 | | | | (11,822 | ) | | | (22,463 | ) |
| | | 16,715 | | | | 53,582 | | | | 45,371 | | | | 32,241 | |
| | | | | | | | | | | | | | | | |
| | | | | | | | | | | | | | | | |
| | | 3,068,648 | | | | 14,101,108 | | | | 26,366,288 | | | | 24,505,760 | |
| | | 923 | | | | 6,439 | | | | 17,600 | | | | 20,955 | |
| | | 3,069,571 | | | | 14,107,547 | | | | 26,383,888 | | | | 24,526,715 | |
| | $ | 3,086,286 | | | $ | 14,161,129 | | | $ | 26,429,259 | | | $ | 24,558,956 | |
| | | | | | | | | | | | | | | | |
| | | | | | | | | | | | | | | | |
| | $ | - | | | $ | - | | | $ | - | | | $ | - | |
| | $ | 3,086,286 | | | $ | 14,161,129 | | | $ | 26,429,259 | | | $ | 24,558,956 | |
| | | | | | | | | | | | | | | | |
| | | | | | | | | | | | | | | | |
| | | 125,000 | | | | 575,000 | | | | 1,075,000 | | | | 1,000,000 | |
| | | - | | | | - | | | | - | | | | - | |
| | | 125,000 | | | | 575,000 | | | | 1,075,000 | | | | 1,000,000 | |
The accompanying notes are an integral part of these financial statements.
Financial Highlights
| | | Per Share Operating Performance (For a share outstanding throughout each period) |
| | | | | | | Investment Operations: | | | Capital Share Transactions: | | | | | |
| | | Net Asset Value, Beginning of Period | | | Net investment income/(loss) (b) | | | Net realized and unrealized gain/(loss) | | | Total From Investment Operations | | | Transaction fees (see Note 5) | | | Distributions Paid to Shareholders: Paid from realized gains | |
Innovator U.S. Equity Buffer ETF - January | | | | | | | | | | | | | | | | | | | | | | | | |
For the period 11/1/2022 - 4/30/2023 | | $ | 33.17 | | | | (0.13 | ) | | | 2.68 | | | | 2.55 | | | | 0.01 | | | | – | |
For the year ended 10/31/2022 | | $ | 36.87 | | | | (0.27 | ) | | | (3.45 | ) | | | (3.72 | ) | | | 0.02 | | | | – | |
For the year ended 10/31/2021 | | $ | 29.77 | | | | (0.27 | ) | | | 7.35 | | | | 7.08 | | | | 0.02 | | | | – | |
For the year ended 10/31/2020 | | $ | 29.69 | | | | (0.23 | ) | | 1.63 | (d) | | | 1.40 | | | | 0.04 | | | | (1.36 | ) |
For the period 12/31/2018 (e) - 10/31/2019 | | $ | 25.08 | | | | (0.19 | ) | | | 4.75 | | | | 4.56 | | | | 0.05 | | | | – | |
Innovator U.S. Equity Buffer ETF - February | | | | | | | | | | | | | | | | | | | | | | | | |
For the period 11/1/2022 - 4/30/2023 | | $ | 29.62 | | | | (0.12 | ) | | | 2.93 | | | | 2.81 | | | | 0.01 | | | | – | |
For the year ended 10/31/2022 | | $ | 31.63 | | | | (0.24 | ) | | | (1.79 | ) | | | (2.03 | ) | | | 0.02 | | | | – | |
For the year ended 10/31/2021 | | $ | 25.09 | | | | (0.23 | ) | | | 6.75 | | | | 6.52 | | | | 0.02 | | | | – | |
For the period 1/31/2020 (e) - 10/31/2020 | | $ | 24.52 | | | | (0.14 | ) | | | 0.69 | | | | 0.55 | | | | 0.02 | | | | – | |
Innovator U.S. Equity Buffer ETF - March | | | | | | | | | | | | | | | | | | | | | | | | |
For the period 11/1/2022 - 4/30/2023 | | $ | 31.93 | | | | (0.13 | ) | | | 3.44 | | | | 3.31 | | | | 0.01 | | | | – | |
For the year ended 10/31/2022 | | $ | 34.06 | | | | (0.26 | ) | | | (1.88 | ) | | | (2.14 | ) | | | 0.01 | | | | – | |
For the year ended 10/31/2021 | | $ | 27.92 | | | | (0.25 | ) | | | 6.37 | | | | 6.12 | | | | 0.02 | | | | – | |
For the period 2/28/2020 (e) - 10/31/2020 | | $ | 26.01 | | | | (0.14 | ) | | | 2.03 | | | | 1.89 | | | | 0.02 | | | | – | |
Innovator U.S. Equity Buffer ETF - April | | | | | | | | | | | | | | | | | | | | | | | | |
For the period 11/1/2022 - 4/30/2023 | | $ | 30.83 | | | | (0.12 | ) | | | 3.27 | | | | 3.15 | | | | 0.01 | | | | – | |
For the year ended 10/31/2022 | | $ | 32.79 | | | | (0.25 | ) | | | (1.73 | ) | | | (1.98 | ) | | | 0.02 | | | | – | |
For the year ended 10/31/2021 | | $ | 28.41 | | | | (0.25 | ) | | | 4.61 | | | | 4.36 | | | | 0.02 | | | | – | |
For the year ended 10/31/2020 | | $ | 26.64 | | | | (0.22 | ) | | | 1.95 | | | | 1.73 | | | | 0.04 | | | | – | |
For the period 3/29/2019 (e) - 10/31/2019 | | $ | 24.95 | | | | (0.12 | ) | | | 1.79 | | | | 1.67 | | | | 0.02 | | | | – | |
(a) | Annualized for periods less than one year. |
(b) | Net investment income/(loss) per share has been calculated based on average shares outstanding during the period. |
(c) | Not annualized for periods less than one year. |
(d) | Net realized and unrealized gain/(loss) per share includes balancing amounts necessary to reconcile the change in net asset value per share for the period, and may not reconcile with the aggregate gain/(loss) in the Statement of Operations due to share transactions for the period. |
(e) | Commencement of operations. |
(f) | Includes broker interest expense of 0.01%. |
The accompanying notes are an integral part of these financial statements.
| | | | | | | | | | Ratios/Supplemental Data: |
| | | | | | | | | | | | | | | | | | Ratio to Average Net Assets of: (a) | | | | | |
| | Change in Net Asset Value for the Period | | | Net Asset Value, End of Period | | | Total
return (c) | | | Net assets, end of period (000) | | | Expenses | | | Net investment income/(loss) | | | Portfolio turnover
rate (c) | |
| | | | | | | | | | | | | | | | | | | | | | | | | | | | |
| | | 2.56 | | | $ | 35.73 | | | | 7.72 | % | | $ | 180,446 | | | | 0.79 | % | | | (0.78 | )% | | | 0 | % |
| | | (3.70 | ) | | $ | 33.17 | | | | (10.03 | )% | | $ | 142,636 | | | | 0.79 | % | | | (0.79 | )% | | | 0 | % |
| | | 7.10 | | | $ | 36.87 | | | | 23.85 | % | | $ | 150,240 | | | | 0.79 | % | | | (0.79 | )% | | | 0 | % |
| | | 0.08 | | | $ | 29.77 | | | | 4.99 | % | | $ | 125,767 | | | | 0.79 | % | | | (0.79 | )% | | | 0 | % |
| | | 4.61 | | | $ | 29.69 | | | | 18.38 | % | | $ | 22,267 | | | | 0.80 | %(f) | | | (0.80 | )% | | | 0 | % |
| | | | | | | | | | | | | | | | | | | | | | | | | | | | |
| | | 2.82 | | | $ | 32.44 | | | | 9.52 | % | | $ | 120,823 | | | | 0.79 | % | | | (0.78 | )% | | | 0 | % |
| | | (2.01 | ) | | $ | 29.62 | | | | (6.37 | )% | | $ | 68,860 | | | | 0.79 | % | | | (0.79 | )% | | | 0 | % |
| | | 6.54 | | | $ | 31.63 | | | | 26.08 | % | | $ | 86,203 | | | | 0.79 | % | | | (0.79 | )% | | | 0 | % |
| | | 0.57 | | | $ | 25.09 | | | | 2.32 | % | | $ | 37,008 | | | | 0.79 | % | | | (0.79 | )% | | | 0 | % |
| | | | | | | | | | | | | | | | | | | | | | | | | | | | |
| | | 3.32 | | | $ | 35.25 | | | | 10.38 | % | | $ | 101,330 | | | | 0.79 | % | | | (0.78 | )% | | | 0 | % |
| | | (2.13 | ) | | $ | 31.93 | | | | (6.26 | )% | | $ | 76,635 | | | | 0.79 | % | | | (0.79 | )% | | | 0 | % |
| | | 6.14 | | | $ | 34.06 | | | | 21.98 | % | | $ | 62,164 | | | | 0.79 | % | | | (0.79 | )% | | | 0 | % |
| | | 1.91 | | | $ | 27.92 | | | | 7.36 | % | | $ | 23,735 | | | | 0.79 | % | | | (0.79 | )% | | | 0 | % |
| | | | | | | | | | | | | | | | | | | | | | | | | | | | |
| | | 3.16 | | | $ | 33.99 | | | | 10.26 | % | | $ | 164,843 | | | | 0.79 | % | | | (0.78 | )% | | | 0 | % |
| | | (1.96 | ) | | $ | 30.83 | | | | (5.99 | )% | | $ | 115,595 | | | | 0.79 | % | | | (0.79 | )% | | | 0 | % |
| | | 4.38 | | | $ | 32.79 | | | | 15.40 | % | | $ | 122,956 | | | | 0.79 | % | | | (0.79 | )% | | | 0 | % |
| | | 1.77 | | | $ | 28.41 | | | | 6.65 | % | | $ | 69,609 | | | | 0.79 | % | | | (0.79 | )% | | | 0 | % |
| | | 1.69 | | | $ | 26.64 | | | | 6.78 | % | | $ | 41,295 | | | | 0.79 | % | | | (0.79 | )% | | | 121 | % |
The accompanying notes are an integral part of these financial statements.
Financial Highlights
| | | Per Share Operating Performance (For a share outstanding throughout each period) |
| | | | | | | Investment Operations: | | | Capital Share Transactions: | |
| | | Net Asset Value, Beginning of Period | | | Net investment income/(loss) (b) | | | Net realized and unrealized gain/(loss) | | | Total From Investment Operations | | | Transaction fees (see Note 5) | |
Innovator U.S. Equity Buffer ETF - May | | | | | | | | | | | | | | | | | | | | |
For the period 11/1/2022 - 4/30/2023 | | $ | 29.07 | | | | (0.11 | ) | | | 1.23 | | | | 1.12 | | | – | (d) |
For the year ended 10/31/2022 | | $ | 32.55 | | | | (0.24 | ) | | | (3.26 | ) | | | (3.50 | ) | | | 0.02 | |
For the year ended 10/31/2021 | | $ | 27.92 | | | | (0.25 | ) | | | 4.86 | | | | 4.61 | | | | 0.02 | |
For the period 4/30/2020 (e) - 10/31/2020 | | $ | 25.63 | | | | (0.11 | ) | | | 2.39 | | | | 2.28 | | | | 0.01 | |
Innovator U.S. Equity Buffer ETF - June | | | | | | | | | | | | | | | | | | | | |
For the period 11/1/2022 - 4/30/2023 | | $ | 30.59 | | | | (0.12 | ) | | | 1.70 | | | | 1.58 | | | | 0.01 | |
For the year ended 10/31/2022 | | $ | 33.96 | | | | (0.25 | ) | | | (3.14 | ) | | | (3.39 | ) | | | 0.02 | |
For the year ended 10/31/2021 | | $ | 29.25 | | | | (0.26 | ) | | | 4.95 | | | | 4.69 | | | | 0.02 | |
For the year ended 10/31/2020 | | $ | 27.38 | | | | (0.22 | ) | | | 2.03 | | | | 1.81 | | | | 0.06 | |
For the period 5/31/2019 (e) - 10/31/2019 | | $ | 25.33 | | | | (0.09 | ) | | | 2.11 | | | | 2.02 | | | | 0.03 | |
Innovator U.S. Equity Buffer ETF - July | | | | | | | | | | | | | | | | | | | | |
For the period 11/1/2022 - 4/30/2023 | | $ | 30.83 | | | | (0.12 | ) | | | 2.41 | | | | 2.29 | | | – | (d) |
For the year ended 10/31/2022 | | $ | 32.69 | | | | (0.25 | ) | | | (1.65 | ) | (i) | | (1.90 | ) | | | 0.04 | |
For the year ended 10/31/2021 | | $ | 27.94 | | | | (0.25 | ) | | | 4.97 | | | | 4.72 | | | | 0.03 | |
For the year ended 10/31/2020 | | $ | 26.55 | | | | (0.21 | ) | | | 1.56 | | | | 1.35 | | | | 0.04 | |
For the year ended 10/31/2019 | | $ | 24.61 | | | | (0.21 | ) | | | 2.09 | | | | 1.88 | | | | 0.06 | |
For the period 8/28/2018 (e) - 10/31/2018 | | $ | 25.51 | | | | (0.03 | ) | | | (0.90 | ) | | | (0.93 | ) | | | 0.03 | |
Innovator U.S. Equity Buffer ETF - August | | | | | | | | | | | | | | | | | | | | |
For the period 11/1/2022 - 4/30/2023 | | $ | 30.00 | | | | (0.12 | ) | | | 1.99 | | | | 1.87 | | | – | (d) |
For the year ended 10/31/2022 | | $ | 32.65 | | | | (0.25 | ) | | | (2.43 | ) | | | (2.68 | ) | | | 0.03 | |
For the year ended 10/31/2021 | | $ | 27.49 | | | | (0.24 | ) | | | 5.38 | | | | 5.14 | | | | 0.02 | |
For the year ended 10/31/2020 | | $ | 25.53 | | | | (0.21 | ) | | | 2.15 | | | | 1.94 | | | | 0.02 | |
For the period 7/31/2019 (e) - 10/31/2019 | | $ | 25.04 | | | | (0.05 | ) | | | 0.52 | | | | 0.47 | | | | 0.02 | |
(a) | Annualized for periods less than one year. |
(b) | Net investment income/(loss) per share has been calculated based on average shares outstanding during the period. |
(c) | Not annualized for periods less than one year. |
(d) | Amount represents less than $0.01 per share. |
(e) | Commencement of operations. |
(f) | Includes broker interest expense of 0.01%. |
(g) | The total return for the period includes the impact of financial statement adjustments. This return differs from the actual performance a shareholder experienced over the period. |
(h) | Includes extraordinary expense of 0.01%. |
(i) | Net realized and unrealized gain/(loss) per share includes balancing amounts necessary to reconcile the change in net asset value per share for the period, and may not reconcile with the aggregate gain/(loss) in the Statement of Operations due to share transactions for the period. |
The accompanying notes are an integral part of these financial statements.
| | | | | Ratios/Supplemental Data: | |
| | | | | | | | | | | | | | | | | | Ratio to Average Net Assets of: (a) | | | | | |
| | Change in Net Asset Value for the Period | | | Net Asset Value, End of Period | | | Total
return (c) | | | Net assets, end of period (000) | | | Expenses | | | Net investment income/(loss) | | | Portfolio turnover
rate (c) | |
| | | | | | | | | | | | | | | | | | | | | | | | | | | | |
| | | 1.12 | | | $ | 30.19 | | | | 3.90 | % | | $ | 122,279 | | | | 0.79 | % | | | (0.78 | )% | | | 0 | % |
| | | (3.48 | ) | | $ | 29.07 | | | | (10.70 | )% | | $ | 175,858 | | | | 0.79 | % | | | (0.79 | )% | | | 0 | % |
| | | 4.63 | | | $ | 32.55 | | | | 16.58 | % | | $ | 82,190 | | | | 0.79 | % | | | (0.79 | )% | | | 0 | % |
| | | 2.29 | | | $ | 27.92 | | | | 8.94 | % | | $ | 16,055 | | | | 0.79 | % | | | (0.79 | )% | | | 0 | % |
| | | | | | | | | | | | | | | | | | | | | | | | | | | | |
| | | 1.59 | | | $ | 32.18 | | | | 5.21 | % | | $ | 144,018 | | | | 0.79 | % | | | (0.78 | )% | | | 0 | % |
| | | (3.37 | ) | | $ | 30.59 | | | | (9.93 | )% | | $ | 76,474 | | | | 0.79 | % | | | (0.79 | )% | | | 0 | % |
| | | 4.71 | | | $ | 33.96 | | | | 16.12 | % | | $ | 81,509 | | | | 0.79 | % | | | (0.79 | )% | | | 0 | % |
| | | 1.87 | | | $ | 29.25 | | | | 6.81 | % | | $ | 32,172 | | | | 0.79 | % | | | (0.79 | )% | | | 0 | % |
| | | 2.05 | | | $ | 27.38 | | | | 8.10 | % | | $ | 4,792 | | | 0.80 | %(f) | | | (0.80 | )% | | | 0 | % |
| | | | | | | | | | | | | | | | | | | | | | | | | | | | |
| | | 2.29 | | | $ | 33.12 | | | | 7.42 | % | | $ | 146,554 | | | | 0.79 | % | | | (0.78 | )% | | | 0 | % |
| | | (1.86 | ) | | $ | 30.83 | | | | (5.69 | )% | | $ | 170,341 | | | | 0.79 | % | | | (0.79 | )% | | | 0 | % |
| | | 4.75 | | | $ | 32.69 | | | | 17.53 | % | | $ | 183,066 | | | | 0.79 | % | | | (0.79 | )% | | | 0 | % |
| | | 1.39 | | | $ | 27.94 | | | 5.24 | %(g) | | $ | 67,755 | | | | 0.79 | % | | | (0.79 | )% | | | 4 | % |
| | | 1.94 | | | $ | 26.55 | | | | 7.89 | % | | $ | 83,639 | | | 0.81 | %(f)(h) | | | (0.80 | )% | | | 106 | % |
| | | (0.90 | ) | | $ | 24.61 | | | | 3.53 | % | | $ | 3,691 | | | | 0.79 | % | | | (0.78 | )% | | | 0 | % |
| | | | | | | | | | | | | | | | | | | | | | | | | | | | |
| | | 1.87 | | | $ | 31.87 | | | | 6.22 | % | | $ | 124,280 | | | | 0.79 | % | | | (0.78 | )% | | | 0 | % |
| | | (2.65 | ) | | $ | 30.00 | | | | (8.13 | )% | | $ | 102,754 | | | | 0.79 | % | | | (0.79 | )% | | | 0 | % |
| | | 5.16 | | | $ | 32.65 | | | | 18.81 | % | | $ | 86,535 | | | | 0.79 | % | | | (0.79 | )% | | | 0 | % |
| | | 1.96 | | | $ | 27.49 | | | | 7.68 | % | | $ | 48,099 | | | | 0.79 | % | | | (0.79 | )% | | | 0 | % |
| | | 0.49 | | | $ | 25.53 | | | | 1.94 | % | | $ | 47,221 | | | | 0.79 | % | | | (0.79 | )% | | | 0 | % |
The accompanying notes are an integral part of these financial statements.
Financial Highlights
| | | Per Share Operating Performance (For a share outstanding throughout each period) |
| | | | | | | Investment Operations: | | | Capital Share Transactions: | | | | | |
| | | Net Asset Value, Beginning of Period | | | Net investment income/(loss) (b) | | | Net realized and unrealized gain/(loss) | | | Total From Investment Operations | | | Transaction fees (see Note 5) | | | Distributions Paid to Shareholders: Paid from realized gains | |
Innovator U.S. Equity Buffer ETF - September | | | | | | | | | | | | | | | | | | | | | | | | |
For the period 11/1/2022 - 4/30/2023 | | $ | 30.33 | | | | (0.12 | ) | | | 2.29 | | | | 2.17 | | | – | (d) | | | – | |
For the year ended 10/31/2022 | | $ | 32.66 | | | | (0.25 | ) | | | (2.10 | ) | | | (2.35 | ) | | | 0.02 | | | | – | |
For the year ended 10/31/2021 | | $ | 26.40 | | | | (0.24 | ) | | | 6.47 | | | | 6.23 | | | | 0.03 | | | | – | |
For the year ended 10/31/2020 | | $ | 25.31 | | | | (0.21 | ) | | 1.59 | (e) | | | 1.38 | | | | 0.07 | | | | (0.36 | ) |
For the period 8/30/2019 (f) - 10/31/2019 | | $ | 24.59 | | | | (0.03 | ) | | | 0.73 | | | | 0.70 | | | | 0.02 | | | | – | |
Innovator U.S. Equity Buffer ETF - October | | | | | | | | | | | | | | | | | | | | | | | | |
For the period 11/1/2022 - 4/30/2023 | | $ | 31.43 | | | | (0.13 | ) | | | 3.04 | | | | 2.91 | | | – | (d) | | | – | |
For the year ended 10/31/2022 | | $ | 33.90 | | | | (0.26 | ) | | | (2.24 | ) | | | (2.50 | ) | | | 0.03 | | | | – | |
For the year ended 10/31/2021 | | $ | 27.26 | | | | (0.25 | ) | | | 6.88 | | | | 6.63 | | | | 0.01 | | | | – | |
For the year ended 10/31/2020 | | $ | 25.18 | | | | (0.20 | ) | | | 2.31 | | | | 2.11 | | | | 0.02 | | | | (0.05 | ) |
For the year ended 10/31/2019 | | $ | 23.42 | | | | (0.20 | ) | | | 1.92 | | | | 1.72 | | | | 0.04 | | | | – | |
For the period 9/28/2018 (f) - 10/31/2018 | | $ | 24.49 | | | | (0.01 | ) | | | (1.07 | ) | | | (1.08 | ) | | | 0.01 | | | | – | |
Innovator U.S. Equity Buffer ETF - November | | | | | | | | | | | | | | | | | | | | | | | | |
For the period 11/1/2022 - 4/30/2023 | | $ | 29.74 | | | | (0.12 | ) | | | 2.40 | | | | 2.28 | | | | 0.01 | | | | – | |
For the year ended 10/31/2022 | | $ | 32.21 | | | | (0.24 | ) | | | (2.25 | ) | | | (2.49 | ) | | | 0.02 | | | | – | |
For the year ended 10/31/2021 | | $ | 27.31 | | | | (0.24 | ) | | | 5.12 | | | | 4.88 | | | | 0.02 | | | | – | |
For the year ended 10/31/2020 | | $ | 25.53 | | | | (0.20 | ) | | | 1.92 | | | | 1.72 | | | | 0.06 | | | | – | |
For the period 10/31/2019 (f) - 10/31/2019 | | $ | 25.53 | | | | – | | | | – | | | | – | | | | – | | | | – | |
Innovator U.S. Equity Buffer ETF - December | | | | | | | | | | | | | | | | | | | | | | | | |
For the period 11/1/2022 - 4/30/2023 | | $ | 31.67 | | | | (0.13 | ) | | | 2.71 | | | | 2.58 | | | | 0.02 | | | | – | |
For the year ended 10/31/2022 | | $ | 34.04 | | | | (0.26 | ) | | | (2.14 | ) | | | (2.40 | ) | | | 0.03 | | | | – | |
For the year ended 10/31/2021 | | $ | 27.73 | | | | (0.25 | ) | | | 6.53 | | | | 6.28 | | | | 0.03 | | | | – | |
For the period 11/29/2019 (f) - 10/31/2020 | | $ | 26.40 | | | | (0.19 | ) | | | 1.47 | | | | 1.28 | | | | 0.05 | | | | – | |
(a) | Annualized for periods less than one year. |
(b) | Net investment income/(loss) per share has been calculated based on average shares outstanding during the period. |
(c) | Not annualized for periods less than one year. |
(d) | Amount represents less than $0.01 per share. |
(e) | Net realized and unrealized gain/(loss) per share includes balancing amounts necessary to reconcile the change in net asset value per share for the period, and may not reconcile with the aggregate gain/(loss) in the Statement of Operations due to share transactions for the period. |
(f) | Commencement of operations. |
(g) | Includes broker interest expense of 0.01%. |
The accompanying notes are an integral part of these financial statements.
| | | | | | | | | | Ratios/Supplemental Data: | |
| | | | | | | | | | | | | | | | | | Ratio to Average Net Assets of: (a) | | | | | |
| | Change in Net Asset Value for the Period | | | Net Asset Value, End of Period | | | Total return (c) | | | Net assets, end of period (000) | | | Expenses | | | Net investment income/(loss) | | | Portfolio turnover rate (c) | |
| | | | | | | | | | | | | | | | | | | | | | | | | | | | |
| | | 2.17 | | | $ | 32.50 | | | | 7.15 | % | | $ | 170,612 | | | | 0.79 | % | | | (0.78 | )% | | | 0 | % |
| | | (2.33 | ) | | $ | 30.33 | | | | (7.13 | )% | | $ | 166,049 | | | | 0.79 | % | | | (0.79 | )% | | | 0 | % |
| | | 6.26 | | | $ | 32.66 | | | | 23.68 | % | | $ | 156,749 | | | | 0.79 | % | | | (0.79 | )% | | | 0 | % |
| | | 1.09 | | | $ | 26.40 | | | | 5.81 | % | | $ | 77,892 | | | | 0.79 | % | | | (0.79 | )% | | | 0 | % |
| | | 0.72 | | | $ | 25.31 | | | | 2.91 | % | | $ | 4,429 | | | | 0.79 | % | | | (0.79 | )% | | | 186 | % |
| | | | | | | | | | | | | | | | | | | | | | | | | | | | |
| | | 2.91 | | | $ | 34.34 | | | | 9.27 | % | | $ | 150,257 | | | | 0.79 | % | | | (0.78 | )% | | | 0 | % |
| | | (2.47 | ) | | $ | 31.43 | | | | (7.29 | )% | | $ | 226,302 | | | | 0.79 | % | | | (0.79 | )% | | | 0 | % |
| | | 6.64 | | | $ | 33.90 | | | | 24.34 | % | | $ | 111,875 | | | | 0.79 | % | | | (0.79 | )% | | | 0 | % |
| | | 2.08 | | | $ | 27.26 | | | | 8.51 | % | | $ | 73,613 | | | | 0.79 | % | | | (0.79 | )% | | | 0 | % |
| | | 1.76 | | | $ | 25.18 | | | | 7.48 | % | | $ | 173,098 | | | | 0.80 | %(g) | | | (0.80 | )% | | | 25 | % |
| | | (1.07 | ) | | $ | 23.42 | | | | (4.35 | )% | | $ | 21,082 | | | | 0.79 | % | | | (0.79 | )% | | | 4 | % |
| | | | | | | | | | | | | | | | | | | | | | | | | | | | |
| | | 2.29 | | | $ | 32.03 | | | | 7.67 | % | | $ | 135,337 | | | | 0.79 | % | | | (0.78 | )% | | | 0 | % |
| | | (2.47 | ) | | $ | 29.74 | | | | (7.65 | )% | | $ | 61,710 | | | | 0.79 | % | | | (0.79 | )% | | | 0 | % |
| | | 4.90 | | | $ | 32.21 | | | | 17.93 | % | | $ | 30,599 | | | | 0.79 | % | | | (0.79 | )% | | | 0 | % |
| | | 1.78 | | | $ | 27.31 | | | | 7.00 | % | | $ | 15,023 | | | | 0.79 | % | | | (0.79 | )% | | | 0 | % |
| | | – | | | $ | 25.53 | | | | – | | | $ | 2,553 | | | | – | | | | – | | | | – | % |
| | | | | | | | | | | | | | | | | | | | | | | | | | | | |
| | | 2.60 | | | $ | 34.27 | | | | 8.20 | % | | $ | 110,519 | | | | 0.79 | % | | | (0.78 | )% | | | 0 | % |
| | | (2.37 | ) | | $ | 31.67 | | | | (6.97 | )% | | $ | 103,722 | | | | 0.79 | % | | | (0.79 | )% | | | 0 | % |
| | | 6.31 | | | $ | 34.04 | | | | 22.76 | % | | $ | 57,874 | | | | 0.79 | % | | | (0.79 | )% | | | 0 | % |
| | | 1.33 | | | $ | 27.73 | | | | 5.04 | % | | $ | 24,958 | | | | 0.79 | % | | | (0.79 | )% | | | 146 | % |
The accompanying notes are an integral part of these financial statements.
Financial Highlights
| | | Per Share Operating Performance (For a share outstanding throughout each period) |
| | | | | | | Investment Operations: | | | Capital Share Transactions: | | | | | |
| | | Net Asset Value, Beginning of Period | | | Net investment income/(loss) (b) | | | Net realized and unrealized gain/(loss) | | | Total From Investment Operations | | | Transaction fees (see Note 5) | | | Distributions Paid to Shareholders: Paid from realized gains | |
Innovator U.S. Equity Power Buffer ETF - January | | | | | | | | | | | | | | | | | | | | | | | | |
For the period 11/1/2022 - 4/30/2023 | | $ | 31.17 | | | | (0.13 | ) | | | 2.62 | | | | 2.49 | | | | 0.01 | | | | – | |
For the year ended 10/31/2022 | | $ | 33.10 | | | | (0.25 | ) | | | (1.70 | ) | | | (1.95 | ) | | | 0.02 | | | | – | |
For the year ended 10/31/2021 | | $ | 29.08 | | | | (0.25 | ) | | | 4.25 | | | | 4.00 | | | | 0.02 | | | | – | |
For the year ended 10/31/2020 | | $ | 28.13 | | | | (0.22 | ) | | | 1.14 | | | | 0.92 | | | | 0.03 | | | | – | |
For the period 12/31/2018 (d) - 10/31/2019 | | $ | 25.08 | | | | (0.18 | ) | | | 3.20 | | | | 3.02 | | | | 0.03 | | | | – | |
Innovator U.S. Equity Power Buffer ETF - February | | | | | | | | | | | | | | | | | | | | | | | | |
For the period 11/1/2022 - 4/30/2023 | | $ | 27.84 | | | | (0.11 | ) | | | 1.85 | | | | 1.74 | | | | 0.02 | | | | – | |
For the year ended 10/31/2022 | | $ | 29.01 | | | | (0.22 | ) | | | (0.97 | ) | | | (1.19 | ) | | | 0.02 | | | | – | |
For the year ended 10/31/2021 | | $ | 25.03 | | | | (0.22 | ) | | | 4.18 | | | | 3.96 | | | | 0.02 | | | | – | |
For the period 1/31/2020 (d) - 10/31/2020 | | $ | 24.52 | | | | (0.14 | ) | | | 0.63 | | | | 0.49 | | | | 0.02 | | | | – | |
Innovator U.S. Equity Power Buffer ETF - March | | | | | | | | | | | | | | | | | | | | | | | | |
For the period 11/1/2022 - 4/30/2023 | | $ | 30.38 | | | | (0.12 | ) | | | 2.24 | | | | 2.12 | | | | 0.02 | | | | – | |
For the year ended 10/31/2022 | | $ | 31.23 | | | | (0.24 | ) | | | (0.63 | ) | | | (0.87 | ) | | | 0.02 | | | | – | |
For the year ended 10/31/2021 | | $ | 27.39 | | | | (0.24 | ) | | | 4.06 | | | | 3.82 | | | | 0.02 | | | | – | |
For the period 2/28/2020 (d) - 10/31/2020 | | $ | 26.01 | | | | (0.14 | ) | | | 1.50 | | | | 1.36 | | | | 0.02 | | | | – | |
Innovator U.S. Equity Power Buffer ETF - April | | | | | | | | | | | | | | | | | | | | | | | | |
For the period 11/1/2022 - 4/30/2023 | | $ | 27.80 | | | | (0.11 | ) | | | 2.04 | | | | 1.93 | | | | 0.02 | | | | – | |
For the year ended 10/31/2022 | | $ | 29.04 | | | | (0.22 | ) | | | (1.04 | ) | | | (1.26 | ) | | | 0.02 | | | | – | |
For the year ended 10/31/2021 | | $ | 26.54 | | | | (0.22 | ) | | | 2.70 | | | | 2.48 | | | | 0.02 | | | | – | |
For the year ended 10/31/2020 | | $ | 26.31 | | | | (0.20 | ) | | | 1.20 | | | | 1.00 | | | | 0.03 | | | | (0.80 | ) |
For the period 3/29/2019 (d) - 10/31/2019 | | $ | 24.95 | | | | (0.12 | ) | | | 1.46 | | | | 1.34 | | | | 0.02 | | | | – | |
(a) | Annualized for periods less than one year. |
(b) | Net investment income/(loss) per share has been calculated based on average shares outstanding during the period. |
(c) | Not annualized for periods less than one year. |
(d) | Commencement of operations. |
The accompanying notes are an integral part of these financial statements.
| | | | | | | | | | Ratios/Supplemental Data: | |
| | | | | | | | | | | | | | | | | | Ratio to Average Net Assets of: (a) | | | | | |
| | Change in Net Asset Value for the Period | | | Net Asset Value, End of Period | | | Total return (c) | | | Net assets, end of period (000) | | | Expenses | | | Net investment income/(loss) | | | Portfolio turnover rate (c) | |
| | | | | | | | | | | | | | | | | | | | | | | | | | | | |
| | | 2.50 | | | $ | 33.67 | | | | 8.04 | % | | $ | 677,655 | | | | 0.79 | % | | | (0.78 | )% | | | 0 | % |
| | | (1.93 | ) | | $ | 31.17 | | | | (5.83 | )% | | $ | 448,795 | | | | 0.79 | % | | | (0.79 | )% | | | 0 | % |
| | | 4.02 | | | $ | 33.10 | | | | 13.82 | % | | $ | 294,561 | | | | 0.79 | % | | | (0.79 | )% | | | 0 | % |
| | | 0.95 | | | $ | 29.08 | | | | 3.38 | % | | $ | 288,597 | | | | 0.79 | % | | | (0.79 | )% | | | 0 | % |
| | | 3.05 | | | $ | 28.13 | | | | 12.15 | % | | $ | 67,507 | | | | 0.79 | % | | | (0.79 | )% | | | 0 | % |
| | | | | | | | | | | | | | | | | | | | | | | | | | | | |
| | | 1.76 | | | $ | 29.60 | | | | 6.32 | % | | $ | 627,483 | | | | 0.79 | % | | | (0.78 | )% | | | 0 | % |
| | | (1.17 | ) | | $ | 27.84 | | | | (4.02 | )% | | $ | 239,416 | | | | 0.79 | % | | | (0.79 | )% | | | 0 | % |
| | | 3.98 | | | $ | 29.01 | | | | 15.90 | % | | $ | 170,407 | | | | 0.79 | % | | | (0.79 | )% | | | 0 | % |
| | | 0.51 | | | $ | 25.03 | | | | 2.06 | % | | $ | 115,121 | | | | 0.79 | % | | | (0.79 | )% | | | 0 | % |
| | | | | | | | | | | | | | | | | | | | | | | | | | | | |
| | | 2.14 | | | $ | 32.52 | | | | 7.06 | % | | $ | 447,970 | | | | 0.79 | % | | | (0.78 | )% | | | 0 | % |
| | | (0.85 | ) | | $ | 30.38 | | | | (2.72 | )% | | $ | 226,295 | | | | 0.79 | % | | | (0.79 | )% | | | 0 | % |
| | | 3.84 | | | $ | 31.23 | | | | 14.01 | % | | $ | 117,875 | | | | 0.79 | % | | | (0.79 | )% | | | 0 | % |
| | | 1.38 | | | $ | 27.39 | | | | 5.30 | % | | $ | 71,895 | | | | 0.79 | % | | | (0.79 | )% | | | 0 | % |
| | | | | | | | | | | | | | | | | | | | | | | | | | | | |
| | | 1.95 | | | $ | 29.75 | | | | 7.03 | % | | $ | 659,683 | | | | 0.79 | % | | | (0.78 | )% | | | 0 | % |
| | | (1.24 | ) | | $ | 27.80 | | | | (4.29 | )% | | $ | 308,534 | | | | 0.79 | % | | | (0.79 | )% | | | 0 | % |
| | | 2.50 | | | $ | 29.04 | | | | 9.45 | % | | $ | 242,503 | | | | 0.79 | % | | | (0.79 | )% | | | 0 | % |
| | | 0.23 | | | $ | 26.54 | | | | 4.00 | % | | $ | 187,078 | | | | 0.79 | % | | | (0.79 | )% | | | 0 | % |
| | | 1.36 | | | $ | 26.31 | | | | 5.44 | % | | $ | 129,561 | | | | 0.79 | % | | | (0.79 | )% | | | 126 | % |
The accompanying notes are an integral part of these financial statements.
Financial Highlights
| | | Per Share Operating Performance (For a share outstanding throughout each period) |
| | | | | | | Investment Operations: | | | Capital Share Transactions: | | | | | |
| | | Net Asset Value, Beginning of Period | | | Net investment income/(loss) (b) | | | Net realized and unrealized gain/(loss) | | | Total From Investment Operations | | | Transaction fees (see Note 5) | | | Distributions Paid to Shareholders: Paid from realized gains | |
Innovator U.S. Equity Power Buffer ETF - May | | | | | | | | | | | | | | | | | | | | | | | | |
For the period 11/1/2022 - 4/30/2023 | | $ | 28.02 | | | | (0.11 | ) | | | 0.78 | | | | 0.67 | | | | 0.01 | | | | – | |
For the year ended 10/31/2022 | | $ | 30.23 | | | | (0.23 | ) | | | (2.00 | ) | | | (2.23 | ) | | | 0.02 | | | | – | |
For the year ended 10/31/2021 | | $ | 27.34 | | | | (0.23 | ) | | | 3.10 | | | | 2.87 | | | | 0.02 | | | | – | |
For the period 4/30/2020 (d) - 10/31/2020 | | $ | 25.63 | | | | (0.11 | ) | | | 1.80 | | | | 1.69 | | | | 0.02 | | | | – | |
Innovator U.S. Equity Power Buffer ETF - June | | | | | | | | | | | | | | | | | | | | | | | | |
For the period 11/1/2022 - 4/30/2023 | | $ | 29.69 | | | | (0.12 | ) | | | 1.29 | | | | 1.17 | | | – | (e) | | | – | |
For the year ended 10/31/2022 | | $ | 31.87 | | | | (0.24 | ) | | | (1.96 | ) | | | (2.20 | ) | | | 0.02 | | | | – | |
For the year ended 10/31/2021 | | $ | 28.88 | | | | (0.24 | ) | | | 3.20 | | | | 2.96 | | | | 0.03 | | | | – | |
For the year ended 10/31/2020 | | $ | 26.74 | | | | (0.22 | ) | | | 2.30 | | | | 2.08 | | | | 0.06 | | | | – | |
For the period 5/31/2019 (d) - 10/31/2019 | | $ | 25.33 | | | | (0.09 | ) | | | 1.48 | | | | 1.39 | | | | 0.02 | | | | – | |
Innovator U.S. Equity Power Buffer ETF - July | | | | | | | | | | | | | | | | | | | | | | | | |
For the period 11/1/2022 - 4/30/2023 | | $ | 29.90 | | | | (0.12 | ) | | | 2.36 | | | | 2.24 | | | – | (e) | | | – | |
For the year ended 10/31/2022 | | $ | 30.38 | | | | (0.24 | ) | | | (0.27 | ) | (f) | | (0.51 | ) | | | 0.03 | | | | – | |
For the year ended 10/31/2021 | | $ | 27.43 | | | | (0.23 | ) | | | 3.16 | | | | 2.93 | | | | 0.02 | | | | – | |
For the year ended 10/31/2020 | | $ | 26.36 | | | | (0.21 | ) | | | 1.46 | | | | 1.25 | | | | 0.04 | | | | (0.22 | ) |
For the year ended 10/31/2019 | | $ | 24.75 | | | | (0.20 | ) | | | 1.77 | | | | 1.57 | | | | 0.04 | | | | – | |
For the period 8/7/2018 (d) - 10/31/2018 | | $ | 25.17 | | | | (0.04 | ) | | | (0.39 | ) | | | (0.43 | ) | | | 0.01 | | | | – | |
Innovator U.S. Equity Power Buffer ETF - August | | | | | | | | | | | | | | | | | | | | | | | | |
For the period 11/1/2022 - 4/30/2023 | | $ | 28.21 | | | | (0.11 | ) | | | 1.63 | | | | 1.52 | | | – | (e) | | | – | |
For the year ended 10/31/2022 | | $ | 30.00 | | | | (0.23 | ) | | | (1.58 | ) | | | (1.81 | ) | | | 0.02 | | | | – | |
For the year ended 10/31/2021 | | $ | 26.86 | | | | (0.23 | ) | | | 3.35 | | | | 3.12 | | | | 0.02 | | | | – | |
For the year ended 10/31/2020 | | $ | 25.45 | | | | (0.21 | ) | | | 1.93 | | | | 1.72 | | | | 0.03 | | | | (0.34 | ) |
For the period 7/31/2019 (d) - 10/31/2019 | | $ | 25.04 | | | | (0.05 | ) | | | 0.44 | | | | 0.39 | | | | 0.02 | | | | – | |
(a) | Annualized for periods less than one year. |
(b) | Net investment income/(loss) per share has been calculated based on average shares outstanding during the period. |
(c) | Not annualized for periods less than one year. |
(d) | Commencement of operations. |
(e) | Amount represents less than $0.01 per share. |
(f) | Net realized and unrealized gain/(loss) per share includes balancing amounts necessary to reconcile the change in net asset value per share for the period, and may not reconcile with the aggregate gain/(loss) in the Statement of Operations due to share transactions for the period. |
The accompanying notes are an integral part of these financial statements.
| | | | | | | | | | Ratios/Supplemental Data: | |
| | | | | | | | | | | | | | | | | | Ratio to Average Net Assets of: (a) | | | | | |
| | Change in Net Asset Value for the Period | | | Net Asset Value, End of Period | | | Total return (c) | | | Net assets, end of period (000) | | | Expenses | | | Net investment income/(loss) | | | Portfolio turnover rate (c) | |
| | | | | | | | | | | | | | | | | | | | | | | | | | | | |
| | | 0.68 | | | $ | 28.70 | | | | 2.46 | % | | $ | 496,533 | | | | 0.79 | % | | | (0.78 | )% | | | 0 | % |
| | | (2.21 | ) | | $ | 28.02 | | | | (7.30 | )% | | $ | 392,967 | | | | 0.79 | % | | | (0.79 | )% | | | 0 | % |
| | | 2.89 | | | $ | 30.23 | | | | 10.54 | % | | $ | 238,780 | | | | 0.79 | % | | | (0.79 | )% | | | 0 | % |
| | | 1.71 | | | $ | 27.34 | | | | 6.69 | % | | $ | 65,626 | | | | 0.79 | % | | | (0.79 | )% | | | 0 | % |
| | | | | | | | | | | | | | | | | | | | | | | | | | | | |
| | | 1.17 | | | $ | 30.86 | | | | 3.94 | % | | $ | 363,346 | | | | 0.79 | % | | | (0.78 | )% | | | 0 | % |
| | | (2.18 | ) | | $ | 29.69 | | | | (6.84 | )% | | $ | 344,365 | | | | 0.79 | % | | | (0.79 | )% | | | 0 | % |
| | | 2.99 | | | $ | 31.87 | | | | 10.34 | % | | $ | 152,966 | | | | 0.79 | % | | | (0.79 | )% | | | 0 | % |
| | | 2.14 | | | $ | 28.88 | | | | 8.00 | % | | $ | 94,588 | | | | 0.79 | % | | | (0.79 | )% | | | 0 | % |
| | | 1.41 | | | $ | 26.74 | | | | 5.58 | % | | $ | 20,057 | | | | 0.79 | % | | | (0.79 | )% | | | 0 | % |
| | | | | | | | | | | | | | | | | | | | | | | | | | | | |
| | | 2.24 | | | $ | 32.14 | | | | 7.49 | % | | $ | 416,218 | | | | 0.79 | % | | | (0.78 | )% | | | 0 | % |
| | | (0.48 | ) | | $ | 29.90 | | | | (1.59 | )% | | $ | 503,828 | | | | 0.79 | % | | | (0.79 | )% | | | 0 | % |
| | | 2.95 | | | $ | 30.38 | | | | 10.78 | % | | $ | 218,755 | | | | 0.79 | % | | | (0.79 | )% | | | 0 | % |
| | | 1.07 | | | $ | 27.43 | | | | 4.89 | % | | $ | 111,759 | | | | 0.79 | % | | | (0.79 | )% | | | 15 | % |
| | | 1.61 | | | $ | 26.36 | | | | 6.53 | % | | $ | 92,273 | | | | 0.79 | % | | | (0.79 | )% | | | 137 | % |
| | | (0.42 | ) | | $ | 24.75 | | | | (1.68 | )% | | $ | 3,712 | | | | 0.79 | % | | | (0.79 | )% | | | 0 | % |
| | | | | | | | | | | | | | | | | | | | | | | | | | | | |
| | | 1.52 | | | $ | 29.73 | | | | 5.42 | % | | $ | 524,803 | | | | 0.79 | % | | | (0.78 | )% | | | 0 | % |
| | | (1.79 | ) | | $ | 28.21 | | | | (5.98 | )% | | $ | 435,772 | | | | 0.79 | % | | | (0.79 | )% | | | 0 | % |
| | | 3.14 | | | $ | 30.00 | | | | 11.68 | % | | $ | 185,991 | | | | 0.79 | % | | | (0.79 | )% | | | 0 | % |
| | | 1.41 | | | $ | 26.86 | | | | 6.95 | % | | $ | 109,458 | | | | 0.79 | % | | | (0.79 | )% | | | 0 | % |
| | | 0.41 | | | $ | 25.45 | | | | 1.65 | % | | $ | 116,446 | | | | 0.79 | % | | | (0.79 | )% | | | 0 | % |
The accompanying notes are an integral part of these financial statements.
Financial Highlights
| | | Per Share Operating Performance (For a share outstanding throughout each period) |
| | | | | | | Investment Operations: | | | Capital Share Transactions: | | | | | |
| | | Net Asset Value, Beginning of Period | | | Net investment income/(loss) (b) | | | Net realized and unrealized gain/(loss) | | | Total From Investment Operations | | | Transaction fees (see Note 5) | | | Distributions Paid to Shareholders: Paid from realized gains | |
Innovator U.S. Equity Power Buffer ETF - September | | | | | | | | | | | | | | | | | | | | | | | | |
For the period 11/1/2022 - 4/30/2023 | | $ | 29.10 | | | | (0.12 | ) | | | 2.08 | | | | 1.96 | | | – | (d) | | | – | |
For the year ended 10/31/2022 | | $ | 29.97 | | | | (0.23 | ) | | | (0.67 | ) | | | (0.90 | ) | | | 0.03 | | | | – | |
For the year ended 10/31/2021 | | $ | 26.01 | | | | (0.23 | ) | | | 4.17 | | | | 3.94 | | | | 0.02 | | | | – | |
For the year ended 10/31/2020 | | $ | 25.15 | | | | (0.21 | ) | | 1.01 | (e) | | | 0.80 | | | | 0.06 | | | | – | |
For the period 8/30/2019 (f) - 10/31/2019 | | $ | 24.59 | | | | (0.03 | ) | | | 0.58 | | | | 0.55 | | | | 0.01 | | | | – | |
Innovator U.S. Equity Power Buffer ETF - October | | | | | | | | | | | | | | | | | | | | | | | | |
For the period 11/1/2022 - 4/30/2023 | | $ | 29.72 | | | | (0.12 | ) | | | 2.55 | | | | 2.43 | | | – | (d) | | | – | |
For the year ended 10/31/2022 | | $ | 30.04 | | | | (0.23 | ) | | | (0.13 | )(e) | | | (0.36 | ) | | | 0.04 | | | | – | |
For the year ended 10/31/2021 | | $ | 26.02 | | | | (0.23 | ) | | | 4.23 | | | | 4.00 | | | | 0.02 | | | | – | |
For the year ended 10/31/2020 | | $ | 25.16 | | | | (0.20 | ) | | | 1.60 | | | | 1.40 | | | | 0.02 | | | | (0.56 | ) |
For the year ended 10/31/2019 | | $ | 23.54 | | | | (0.20 | ) | | | 1.79 | | | | 1.59 | | | | 0.03 | | | | – | |
For the period 9/28/2018 (f) - 10/31/2018 | | $ | 24.49 | | | | (0.01 | ) | | | (0.95 | ) | | | (0.96 | ) | | | 0.01 | | | | – | |
Innovator U.S. Equity Power Buffer ETF - November | | | | | | | | | | | | | | | | | | | | | | | | |
For the period 11/1/2022 - 4/30/2023 | | $ | 30.01 | | | | (0.12 | ) | | | 2.34 | | | | 2.22 | | | | 0.01 | | | | – | |
For the year ended 10/31/2022 | | $ | 30.52 | | | | (0.23 | ) | | | (0.31 | ) | | | (0.54 | ) | | | 0.03 | | | | – | |
For the year ended 10/31/2021 | | $ | 27.30 | | | | (0.23 | ) | | | 3.44 | | | | 3.21 | | | | 0.01 | | | | – | |
For the year ended 10/31/2020 | | $ | 25.53 | | | | (0.21 | ) | | | 1.94 | | | | 1.73 | | | | 0.04 | | | | – | |
For the period 10/31/2019 (f) - 10/31/2019 | | $ | 25.53 | | | | – | | | | – | | | | – | | | | – | | | | – | |
Innovator U.S. Equity Power Buffer ETF - December | | | | | | | | | | | | | | | | | | | | | | | | |
For the period 11/1/2022 - 4/30/2023 | | $ | 30.03 | | | | (0.12 | ) | | | 1.83 | | | | 1.71 | | | | 0.02 | | | | – | |
For the year ended 10/31/2022 | | $ | 31.01 | | | | (0.24 | ) | | | (0.75 | ) | | | (0.99 | ) | | | 0.01 | | | | – | |
For the year ended 10/31/2021 | | $ | 27.42 | | | | (0.24 | ) | | | 3.80 | | | | 3.56 | | | | 0.03 | | | | – | |
For the period 11/29/2019 (f) - 10/31/2020 | | $ | 26.40 | | | | (0.19 | ) | | | 1.17 | | | | 0.98 | | | | 0.04 | | | | – | |
(a) | Annualized for periods less than one year. |
(b) | Net investment income/(loss) per share has been calculated based on average shares outstanding during the period. |
(c) | Not annualized for periods less than one year. |
(d) | Amount represents less than $0.01 per share. |
(e) | Net realized and unrealized gain/(loss) per share includes balancing amounts necessary to reconcile the change in net asset value per share for the period, and may not reconcile with the aggregate gain/(loss) in the Statement of Operations due to share transactions for the period. |
(f) | Commencement of operations. |
(g) | Includes broker interest expense of 0.01%. |
The accompanying notes are an integral part of these financial statements.
| | | | | | | | | | Ratios/Supplemental Data: | |
| | | | | | | | | | | | | | | | | | Ratio to Average Net Assets of: (a) | | | | | |
| | Change in Net Asset Value for the Period | | | Net Asset Value, End of Period | | | Total return (c) | | | Net assets, end of period (000) | | | Expenses | | | Net investment income/(loss) | | | Portfolio turnover rate (c) | |
| | | | | | | | | | | | | | | | | | | | | | | | | | | | |
| | | 1.96 | | | $ | 31.06 | | | | 6.72 | % | | $ | 648,333 | | | | 0.79 | % | | | (0.78 | )% | | | 0 | % |
| | | (0.87 | ) | | $ | 29.10 | | | | (2.90 | )% | | $ | 547,143 | | | | 0.79 | % | | | (0.79 | )% | | | 0 | % |
| | | 3.96 | | | $ | 29.97 | | | | 15.24 | % | | $ | 303,473 | | | | 0.79 | % | | | (0.79 | )% | | | 0 | % |
| | | 0.86 | | | $ | 26.01 | | | | 3.40 | % | | $ | 287,388 | | | | 0.79 | % | | | (0.79 | )% | | | 3 | % |
| | | 0.56 | | | $ | 25.15 | | | | 2.29 | % | | $ | 20,122 | | | | 0.79 | % | | | (0.79 | )% | | | 127 | % |
| | | | | | | | | | | | | | | | | | | | | | | | | | | | |
| | | 2.43 | | | $ | 32.15 | | | | 8.16 | % | | $ | 502,358 | | | | 0.79 | % | | | (0.78 | )% | | | 0 | % |
| | | (0.32 | ) | | $ | 29.72 | | | | (1.05 | )% | | $ | 649,488 | | | | 0.79 | % | | | (0.79 | )% | | | 0 | % |
| | | 4.02 | | | $ | 30.04 | | | | 15.44 | % | | $ | 209,533 | | | | 0.79 | % | | | (0.79 | )% | | | 0 | % |
| | | 0.86 | | | $ | 26.02 | | | | 5.74 | % | | $ | 189,967 | | | | 0.79 | % | | | (0.79 | )% | | | 0 | % |
| | | 1.62 | | | $ | 25.16 | | | | 6.90 | % | | $ | 311,363 | | | | 0.80 | %(g) | | | (0.79 | )% | | | 3 | % |
| | | (0.95 | ) | | $ | 23.54 | | | | (3.89 | )% | | $ | 11,180 | | | | 0.79 | % | | | (0.79 | )% | | | 4 | % |
| | | | | | | | | | | | | | | | | | | | | | | | | | | | |
| | | 2.23 | | | $ | 32.24 | | | | 7.43 | % | | $ | 793,216 | | | | 0.79 | % | | | (0.78 | )% | | | 0 | % |
| | | (0.51 | ) | | $ | 30.01 | | | | (1.67 | )% | | $ | 317,389 | | | | 0.79 | % | | | (0.79 | )% | | | 0 | % |
| | | 3.22 | | | $ | 30.52 | | | | 11.80 | % | | $ | 79,343 | | | | 0.79 | % | | | (0.79 | )% | | | 0 | % |
| | | 1.77 | | | $ | 27.30 | | | | 6.94 | % | | $ | 38,217 | | | | 0.79 | % | | | (0.79 | )% | | | 0 | % |
| | | – | | | $ | 25.53 | | | | – | | | $ | 2,553 | | | | – | | | | – | | | | – | % |
| | | | | | | | | | | | | | | | | | | | | | | | | | | | |
| | | 1.73 | | | $ | 31.76 | | | | 5.78 | % | | $ | 713,864 | | | | 0.79 | % | | | (0.78 | )% | | | 0 | % |
| | | (0.98 | ) | | $ | 30.03 | | | | (3.16 | )% | | $ | 207,929 | | | | 0.79 | % | | | (0.79 | )% | | | 0 | % |
| | | 3.59 | | | $ | 31.01 | | | | 13.10 | % | | $ | 108,520 | | | | 0.79 | % | | | (0.79 | )% | | | 0 | % |
| | | 1.02 | | | $ | 27.42 | | | | 3.85 | % | | $ | 65,111 | | | | 0.79 | % | | | (0.79 | )% | | | 141 | % |
The accompanying notes are an integral part of these financial statements.
Financial Highlights
| | | Per Share Operating Performance (For a share outstanding throughout each period) |
| | | | | | | Investment Operations: | | | Capital Share Transactions: | | | | | |
| | | Net Asset Value, Beginning of Period | | | Net investment income/(loss) (b) | | | Net realized and unrealized gain/(loss) | | | Total From Investment Operations | | | Transaction fees (see Note 5) | | | Distributions Paid to Shareholders: Paid from realized gains | |
Innovator U.S. Equity Ultra Buffer ETF - January | | | | | | | | | | | | | | | | | | | | | | | | |
For the period 11/1/2022 - 4/30/2023 | | $ | 29.55 | | | | (0.12 | ) | | | 2.07 | | | | 1.95 | | | | 0.01 | | | | – | |
For the year ended 10/31/2022 | | $ | 31.37 | | | | (0.23 | ) | | | (1.62 | ) | | | (1.85 | ) | | | 0.03 | | | | – | |
For the year ended 10/31/2021 | | $ | 28.36 | | | | (0.24 | ) | | | 3.23 | | | | 2.99 | | | | 0.02 | | | | – | |
For the year ended 10/31/2020 | | $ | 27.69 | | | | (0.22 | ) | | | 0.86 | | | | 0.64 | | | | 0.03 | | | | – | |
For the period 12/31/2018 (d) - 10/31/2019 | | $ | 25.08 | | | | (0.18 | ) | | | 2.77 | | | | 2.59 | | | | 0.02 | | | | – | |
Innovator U.S. Equity Ultra Buffer ETF - February | | | | | | | | | | | | | | | | | | | | | | | | |
For the period 11/1/2022 - 4/30/2023 | | $ | 26.35 | | | | (0.10 | ) | | | 0.57 | | | | 0.47 | | | | 0.01 | | | | – | |
For the year ended 10/31/2022 | | $ | 27.80 | | | | (0.21 | ) | | | (1.25 | ) | | | (1.46 | ) | | | 0.01 | | | | – | |
For the year ended 10/31/2021 | | $ | 24.91 | | | | (0.21 | ) | | | 3.08 | | | | 2.87 | | | | 0.02 | | | | – | |
For the period 1/31/2020 (d) - 10/31/2020 | | $ | 24.52 | | | | (0.14 | ) | | | 0.50 | | | | 0.36 | | | | 0.03 | | | | – | |
Innovator U.S. Equity Ultra Buffer ETF - March | | | | | | | | | | | | | | | | | | | | | | | | |
For the period 11/1/2022 - 4/30/2023 | | $ | 28.33 | | | | (0.11 | ) | | | 0.79 | | | | 0.68 | | | | 0.01 | | | | – | |
For the year ended 10/31/2022 | | $ | 29.56 | | | | (0.23 | ) | | | (1.02 | ) | | | (1.25 | ) | | | 0.02 | | | | – | |
For the year ended 10/31/2021 | | $ | 26.93 | | | | (0.23 | ) | | | 2.84 | | | | 2.61 | | | | 0.02 | | | | – | |
For the period 2/28/2020 (d) - 10/31/2020 | | $ | 26.01 | | | | (0.14 | ) | | | 1.03 | | | | 0.89 | | | | 0.03 | | | | – | |
Innovator U.S. Equity Ultra Buffer ETF - April | | | | | | | | | | | | | | | | | | | | | | | | |
For the period 11/1/2022 - 4/30/2023 | | $ | 24.83 | | | | (0.10 | ) | | | 0.47 | | | | 0.37 | | | | 0.01 | | | | – | |
For the year ended 10/31/2022 | | $ | 26.02 | | | | (0.20 | ) | | | (1.01 | ) | | | (1.21 | ) | | | 0.02 | | | | – | |
For the year ended 10/31/2021 | | $ | 24.47 | | | | (0.20 | ) | | | 1.72 | | | | 1.52 | | | | 0.03 | | | | – | |
For the year ended 10/31/2020 | | $ | 26.22 | | | | (0.19 | ) | | (1.01 | )(e) | | | (1.20 | ) | | | 0.02 | | | | (0.57 | ) |
For the period 3/29/2019 (d) - 10/31/2019 | | $ | 24.95 | | | | (0.12 | ) | | | 1.37 | | | | 1.25 | | | | 0.02 | | | | – | |
(a) | Annualized for periods less than one year. |
(b) | Net investment income/(loss) per share has been calculated based on average shares outstanding during the period. |
(c) | Not annualized for periods less than one year. |
(d) | Commencement of operations. |
(e) | Net realized and unrealized gain/(loss) per share includes balancing amounts necessary to reconcile the change in net asset value per share for the period, and may not reconcile with the aggregate gain/(loss) in the Statement of Operations due to share transactions for the period. |
The accompanying notes are an integral part of these financial statements.
| | | | | | | | | | Ratios/Supplemental Data: | |
| | | | | | | | | | | | | | | | | | Ratio to Average Net Assets of: (a) | | | | | |
| | Change in Net Asset Value for the Period | | | Net Asset Value, End of Period | | | Total return (c) | | | Net assets, end of period (000) | | | Expenses | | | Net investment income/(loss) | | | Portfolio turnover rate (c) | |
| | | | | | | | | | | | | | | | | | | | | | | | | | | | |
| | | 1.96 | | | $ | 31.51 | | | | 6.66 | % | | $ | 151,261 | | | | 0.79 | % | | | (0.78 | )% | | | 0 | % |
| | | (1.82 | ) | | $ | 29.55 | | | | (5.82 | )% | | $ | 283,638 | | | | 0.79 | % | | | (0.79 | )% | | | 0 | % |
| | | 3.01 | | | $ | 31.37 | | | | 10.62 | % | | $ | 86,274 | | | | 0.79 | % | | | (0.79 | )% | | | 0 | % |
| | | 0.67 | | | $ | 28.36 | | | | 2.44 | % | | $ | 112,023 | | | | 0.79 | % | | | (0.79 | )% | | | 0 | % |
| | | 2.61 | | | $ | 27.69 | | | | 10.39 | % | | $ | 30,455 | | | | 0.79 | % | | | (0.79 | )% | | | 0 | % |
| | | | | | | | | | | | | | | | | | | | | | | | | | | | |
| | | 0.48 | | | $ | 26.83 | | | | 1.84 | % | | $ | 91,237 | | | | 0.79 | % | | | (0.78 | )% | | | 0 | % |
| | | (1.45 | ) | | $ | 26.35 | | | | (5.21 | )% | | $ | 53,358 | | | | 0.79 | % | | | (0.79 | )% | | | 0 | % |
| | | 2.89 | | | $ | 27.80 | | | | 11.61 | % | | $ | 26,409 | | | | 0.79 | % | | | (0.79 | )% | | | 0 | % |
| | | 0.39 | | | $ | 24.91 | | | | 1.58 | % | | $ | 31,757 | | | | 0.79 | % | | | (0.79 | )% | | | 0 | % |
| | | | | | | | | | | | | | | | | | | | | | | | | | | | |
| | | 0.69 | | | $ | 29.02 | | | | 2.44 | % | | $ | 72,551 | | | | 0.79 | % | | | (0.78 | )% | | | 0 | % |
| | | (1.23 | ) | | $ | 28.33 | | | | (4.15 | )% | | $ | 69,406 | | | | 0.79 | % | | | (0.79 | )% | | | 0 | % |
| | | 2.63 | | | $ | 29.56 | | | | 9.76 | % | | $ | 33,251 | | | | 0.79 | % | | | (0.79 | )% | | | 0 | % |
| | | 0.92 | | | $ | 26.93 | | | | 3.53 | % | | $ | 28,275 | | | | 0.79 | % | | | (0.79 | )% | | | 0 | % |
| | | | | | | | | | | | | | | | | | | | | | | | | | | | |
| | | 0.38 | | | $ | 25.21 | | | | 1.54 | % | | $ | 153,137 | | | | 0.79 | % | | | (0.78 | )% | | | 0 | % |
| | | (1.19 | ) | | $ | 24.83 | | | | (4.59 | )% | | $ | 122,886 | | | | 0.79 | % | | | (0.78 | )% | | | 0 | % |
| | | 1.55 | | | $ | 26.02 | | | | 6.31 | % | | $ | 57,242 | | | | 0.79 | % | | | (0.79 | )% | | | 0 | % |
| | | (1.75 | ) | | $ | 24.47 | | | | (4.59 | )% | | $ | 30,594 | | | | 0.79 | % | | | (0.79 | )% | | | 0 | % |
| | | 1.27 | | | $ | 26.22 | | | | 5.07 | % | | $ | 19,006 | | | | 0.79 | % | | | (0.79 | )% | | | 106 | % |
The accompanying notes are an integral part of these financial statements.
Financial Highlights
| | | Per Share Operating Performance (For a share outstanding throughout each period) |
| | | | | | | Investment Operations: | | | Capital Share Transactions: | | | | | |
| | | Net Asset Value, Beginning of Period | | | Net investment income/(loss) (b) | | | Net realized and unrealized gain/(loss) | | | Total From Investment Operations | | | Transaction fees (see Note 5) | | | Distributions Paid to Shareholders: Paid from realized gains | |
Innovator U.S. Equity Ultra Buffer ETF - May | | | | | | | | | | | | | | | | | | | | | | | | |
For the period 11/1/2022 - 4/30/2023 | | $ | 26.33 | | | | (0.10 | ) | | | 0.83 | | | | 0.73 | | | | 0.01 | | | | – | |
For the year ended 10/31/2022 | | $ | 28.52 | | | | (0.21 | ) | | | (2.01 | ) | | | (2.22 | ) | | | 0.03 | | | | – | |
For the year ended 10/31/2021 | | $ | 26.67 | | | | (0.22 | ) | | | 2.05 | | | | 1.83 | | | | 0.02 | | | | – | |
For the period 4/30/2020 (d) - 10/31/2020 | | $ | 25.63 | | | | (0.11 | ) | | | 1.14 | | | | 1.03 | | | | 0.01 | | | | – | |
Innovator U.S. Equity Ultra Buffer ETF - June | | | | | | | | | | | | | | | | | | | | | | | | |
For the period 11/1/2022 - 4/30/2023 | | $ | 26.87 | | | | (0.11 | ) | | | 1.04 | | | | 0.93 | | | – | (e) | | | – | |
For the year ended 10/31/2022 | | $ | 29.18 | | | | (0.21 | ) | | | (2.13 | ) | (g) | | (2.34 | ) | | | 0.03 | | | | – | |
For the year ended 10/31/2021 | | $ | 27.24 | | | | (0.23 | ) | | | 2.14 | | | | 1.91 | | | | 0.03 | | | | – | |
For the year ended 10/31/2020 | | $ | 26.65 | | | | (0.21 | ) | | | 1.74 | | | | 1.53 | | | | 0.08 | | | | (1.02 | ) |
For the period 5/31/2019 (d) - 10/31/2019 | | $ | 25.33 | | | | (0.09 | ) | | | 1.37 | | | | 1.28 | | | | 0.04 | | | | – | |
Innovator U.S. Equity Ultra Buffer ETF - July | | | | | | | | | | | | | | | | | | | | | | | | |
For the period 11/1/2022 - 4/30/2023 | | $ | 25.62 | | | | (0.10 | ) | | | 1.99 | | | | 1.89 | | | – | (e) | | | – | |
For the year ended 10/31/2022 | | $ | 27.37 | | | | (0.21 | ) | | | (1.56 | ) | | | (1.77 | ) | | | 0.02 | | | | – | |
For the year ended 10/31/2021 | | $ | 25.54 | | | | (0.21 | ) | | | 2.02 | | | | 1.81 | | | | 0.02 | | | | – | |
For the year ended 10/31/2020 | | $ | 26.31 | | | | (0.20 | ) | | | 1.01 | | | | 0.81 | | | | 0.04 | | | | (1.62 | ) |
For the year ended 10/31/2019 | | $ | 24.68 | | | | (0.20 | ) | | | 1.78 | | | | 1.58 | | | | 0.05 | | | | – | |
For the period 8/7/2018 (d) - 10/31/2018 | | $ | 25.17 | | | | (0.04 | ) | | | (0.46 | ) | | | (0.50 | ) | | | 0.01 | | | | – | |
Innovator U.S. Equity Ultra Buffer ETF - August | | | | | | | | | | | | | | | | | | | | | | | | |
For the period 11/1/2022 - 4/30/2023 | | $ | 26.13 | | | | (0.10 | ) | | | 1.25 | | | | 1.15 | | | | 0.01 | | | | – | |
For the year ended 10/31/2022 | | $ | 28.99 | | | | (0.22 | ) | | | (2.68 | ) | | | (2.90 | ) | | | 0.04 | | | | – | |
For the year ended 10/31/2021 | | $ | 26.87 | | | | (0.22 | ) | | | 2.32 | | | | 2.10 | | | | 0.02 | | | | – | |
For the year ended 10/31/2020 | | $ | 25.45 | | | | (0.21 | ) | | | 1.81 | | | | 1.60 | | | | 0.03 | | | | (0.21 | ) |
For the period 7/31/2019 (d) - 10/31/2019 | | $ | 25.04 | | | | (0.05 | ) | | | 0.44 | | | | 0.39 | | | | 0.02 | | | | – | |
(a) | Annualized for periods less than one year. |
(b) | Net investment income/(loss) per share has been calculated based on average shares outstanding during the period. |
(c) | Not annualized for periods less than one year. |
(d) | Commencement of operations. |
(e) | Amount represents less than $0.01 per share. |
(f) | Includes broker interest expense of 0.01%. |
(g) | Net realized and unrealized gain/(loss) per share includes balancing amounts necessary to reconcile the change in net asset value per share for the period, and may not reconcile with the aggregate gain/(loss) in the Statement of operations due to share transactions for the period. |
The accompanying notes are an integral part of these financial statements.
| | | | | | | | | | Ratios/Supplemental Data: | |
| | | | | | | | | | | | | | | | | | Ratio to Average Net Assets of: (a) | | | | | |
| | Change in Net Asset Value for the Period | | | Net Asset Value, End of Period | | | Total return (c) | | | Net assets, end of period (000) | | | Expenses | | | Net investment income/(loss) | | | Portfolio turnover rate (c) | |
| | | | | | | | | | | | | | | | | | | | | | | | | | | | |
| | | 0.74 | | | $ | 27.07 | | | | 2.85 | % | | $ | 97,466 | | | | 0.79 | % | | | (0.78 | )% | | | 0 | % |
| | | (2.19 | ) | | $ | 26.33 | | | | (7.67 | )% | | $ | 99,394 | | | | 0.79 | % | | | (0.79 | )% | | | 0 | % |
| | | 1.85 | | | $ | 28.52 | | | | 6.91 | % | | $ | 40,634 | | | | 0.79 | % | | | (0.79 | )% | | | 0 | % |
| | | 1.04 | | | $ | 26.67 | | | | 4.06 | % | | $ | 10,669 | | | | 0.79 | % | | | (0.79 | )% | | | 0 | % |
| | | | | | | | | | | | | | | | | | | | | | | | | | | | |
| | | 0.93 | | | $ | 27.80 | | | | 3.46 | % | | $ | 90,342 | | | | 0.79 | % | | | (0.78 | )% | | | 0 | % |
| | | (2.31 | ) | | $ | 26.87 | | | | (7.92 | )% | | $ | 114,860 | | | | 0.79 | % | | | (0.79 | )% | | | 0 | % |
| | | 1.94 | | | $ | 29.18 | | | | 7.10 | % | | $ | 21,155 | | | | 0.79 | % | | | (0.79 | )% | | | 0 | % |
| | | 0.59 | | | $ | 27.24 | | | | 6.26 | % | | $ | 14,984 | | | | 0.79 | % | | | (0.79 | )% | | | 0 | % |
| | | 1.32 | | | $ | 26.65 | | | | 5.19 | % | | $ | 2,665 | | | | 0.80 | %(f) | | | (0.80 | )% | | | 0 | % |
| | | | | | | | | | | | | | | | | | | | | | | | | | | | |
| | | 1.89 | | | $ | 27.51 | | | | 7.39 | % | | $ | 54,332 | | | | 0.79 | % | | | (0.78 | )% | | | 0 | % |
| | | (1.75 | ) | | $ | 25.62 | | | | (6.41 | )% | | $ | 73,650 | | | | 0.79 | % | | | (0.79 | )% | | | 0 | % |
| | | 1.83 | | | $ | 27.37 | | | | 7.18 | % | | $ | 52,689 | | | | 0.79 | % | | | (0.79 | )% | | | 0 | % |
| | | (0.77 | ) | | $ | 25.54 | | | | 3.37 | % | | $ | 39,583 | | | | 0.79 | % | | | (0.79 | )% | | | 1 | % |
| | | 1.63 | | | $ | 26.31 | | | | 6.62 | % | | $ | 38,809 | | | | 0.79 | % | | | (0.79 | )% | | | 27 | % |
| | | (0.49 | ) | | $ | 24.68 | | | | (1.95 | )% | | $ | 3,702 | | | | 0.79 | % | | | (0.79 | )% | | | 0 | % |
| | | | | | | | | | | | | | | | | | | | | | | | | | | | |
| | | 1.16 | | | $ | 27.29 | | | | 4.43 | % | | $ | 128,933 | | | | 0.79 | % | | | (0.78 | )% | | | 0 | % |
| | | (2.86 | ) | | $ | 26.13 | | | | (9.87 | )% | | $ | 82,308 | | | | 0.79 | % | | | (0.79 | )% | | | 0 | % |
| | | 2.12 | | | $ | 28.99 | | | | 7.89 | % | | $ | 46,383 | | | | 0.79 | % | | | (0.79 | )% | | | 0 | % |
| | | 1.42 | | | $ | 26.87 | | | | 6.46 | % | | $ | 45,679 | | | | 0.79 | % | | | (0.79 | )% | | | 0 | % |
| | | 0.41 | | | $ | 25.45 | | | | 1.64 | % | | $ | 18,452 | | | | 0.79 | % | | | (0.79 | )% | | | 0 | % |
The accompanying notes are an integral part of these financial statements.
Financial Highlights
| | | Per Share Operating Performance (For a share outstanding throughout each period) |
| | | | | | | Investment Operations: | | | Capital Share Transactions: | | | | | |
| | | Net Asset Value, Beginning of Period | | | Net investment income/(loss) (b) | | | Net realized and unrealized gain/(loss) | | | Total From Investment Operations | | | Transaction fees (see Note 5) | | | Distributions Paid to Shareholders: Paid from realized gains | |
Innovator U.S. Equity Ultra Buffer ETF - September | | | | | | | | | | | | | | | | | | | | | | | | |
For the period 11/1/2022 - 4/30/2023 | | $ | 26.28 | | | | (0.10 | ) | | | 1.70 | | | | 1.60 | | | – | (d) | | | – | |
For the year ended 10/31/2022 | | $ | 28.42 | | | | (0.21 | ) | | | (1.96 | ) | | | (2.17 | ) | | | 0.03 | | | | – | |
For the year ended 10/31/2021 | | $ | 25.83 | | | | (0.22 | ) | | | 2.78 | | | | 2.56 | | | | 0.03 | | | | – | |
For the year ended 10/31/2020 | | $ | 25.02 | | | | (0.20 | ) | | | 1.09 | | | | 0.89 | | | | 0.08 | | | | (0.16 | ) |
For the period 8/30/2019 (e) - 10/31/2019 | | $ | 24.59 | | | | (0.03 | ) | | | 0.43 | | | | 0.40 | | | | 0.03 | | | | – | |
Innovator U.S. Equity Ultra Buffer ETF - October | | | | | | | | | | | | | | | | | | | | | | | | |
For the period 11/1/2022 - 4/30/2023 | | $ | 26.96 | | | | (0.11 | ) | | | 2.09 | | | | 1.98 | | | – | (d) | | | – | |
For the year ended 10/31/2022 | | $ | 28.23 | | | | (0.22 | ) | | | (1.07 | ) | | | (1.29 | ) | | | 0.02 | | | | – | |
For the year ended 10/31/2021 | | $ | 25.70 | | | | (0.22 | ) | | | 2.74 | | | | 2.52 | | | | 0.01 | | | | – | |
For the year ended 10/31/2020 | | $ | 25.05 | | | | (0.20 | ) | | | 1.41 | | | | 1.21 | | | | 0.02 | | | | (0.58 | ) |
For the year ended 10/31/2019 | | $ | 23.64 | | | | (0.19 | ) | | | 1.58 | | | | 1.39 | | | | 0.02 | | | | – | |
For the period 9/28/2018 (e) - 10/31/2018 | | $ | 24.49 | | | | (0.01 | ) | | | (0.85 | ) | | | (0.86 | ) | | | 0.01 | | | | – | |
Innovator U.S. Equity Ultra Buffer ETF - November | | | | | | | | | | | | | | | | | | | | | | | | |
For the period 11/1/2022 - 4/30/2023 | | $ | 27.60 | | | | (0.11 | ) | | | 1.90 | | | | 1.79 | | | | 0.01 | | | | – | |
For the year ended 10/31/2022 | | $ | 29.29 | | | | (0.22 | ) | | | (1.49 | ) | | | (1.71 | ) | | | 0.02 | | | | – | |
For the year ended 10/31/2021 | | $ | 27.28 | | | | (0.23 | ) | | | 2.22 | | | | 1.99 | | | | 0.02 | | | | – | |
For the year ended 10/31/2020 | | $ | 25.53 | | | | (0.21 | ) | | | 1.94 | | | | 1.73 | | | | 0.02 | | | | – | |
For the period 10/31/2019 (e) - 10/31/2019 | | $ | 25.53 | | | | – | | | | – | | | | – | | | | – | | | | – | |
Innovator U.S. Equity Ultra Buffer ETF - December | | | | | | | | | | | | | | | | | | | | | | | | |
For the period 11/1/2022 - 4/30/2023 | | $ | 28.07 | | | | (0.11 | ) | | | 0.89 | | | | 0.78 | | | | 0.01 | | | | – | |
For the year ended 10/31/2022 | | $ | 29.82 | | | | (0.23 | ) | | | (1.53 | ) | | | (1.76 | ) | | | 0.01 | | | | – | |
For the year ended 10/31/2021 | | $ | 27.15 | | | | 0.23 | | | | 2.87 | | | | 2.64 | | | | 0.03 | | | | – | |
For the period 11/29/2019 (e) - 10/31/2020 | | $ | 26.40 | | | | (0.19 | ) | | | 0.91 | | | | 0.72 | | | | 0.03 | | | | – | |
(a) | Annualized for periods less than one year. |
(b) | Net investment income/(loss) per share has been calculated based on average shares outstanding during the period. |
(c) | Not annualized for periods less than one year. |
(d) | Amount represents less than $0.01 per share. |
(e) | Commencement of operations. |
(f) | Includes broker interest expense of 0.01%. |
The accompanying notes are an integral part of these financial statements.
| | | | | | | | | | Ratios/Supplemental Data: | |
| | | | | | | | | | | | | | | | | | Ratio to Average Net Assets of: (a) | | | | | |
| | Change in Net Asset Value for the Period | | | Net Asset Value, End of Period | | | Total return (c) | | | Net assets, end of period (000) | | | Expenses | | | Net investment income/(loss) | | | Portfolio turnover rate (c) | |
| | | | | | | | | | | | | | | | | | | | | | | | | | | | |
| | | 1.60 | | | $ | 27.88 | | | | 6.10 | % | | $ | 108,739 | | | | 0.79 | % | | | (0.78 | )% | | | 0 | % |
| | | (2.14 | ) | | $ | 26.28 | | | | (7.54 | )% | | $ | 158,986 | | | | 0.79 | % | | | (0.79 | )% | | | 0 | % |
| | | 2.59 | | | $ | 28.42 | | | | 10.03 | % | | $ | 67,502 | | | | 0.79 | % | | | (0.79 | )% | | | 0 | % |
| | | 0.81 | | | $ | 25.83 | | | | 3.90 | % | | $ | 65,221 | | | | 0.79 | % | | | (0.79 | )% | | | 35 | % |
| | | 0.43 | | | $ | 25.02 | | | | 1.76 | % | | $ | 5,005 | | | | 0.79 | % | | | (0.79 | )% | | | 152 | % |
| | | | | | | | | | | | | | | | | | | | | | | | | | | | |
| | | 1.98 | | | $ | 28.94 | | | | 7.35 | % | | $ | 94,773 | | | | 0.79 | % | | | (0.78 | )% | | | 0 | % |
| | | (1.27 | ) | | $ | 26.96 | | | | (4.52 | )% | | $ | 113,221 | | | | 0.79 | % | | | (0.79 | )% | | | 0 | % |
| | | 2.53 | | | $ | 28.23 | | | | 9.85 | % | | $ | 62,818 | | | | 0.79 | % | | | (0.79 | )% | | | 0 | % |
| | | 0.65 | | | $ | 25.70 | | | | 5.00 | % | | $ | 105,376 | | | | 0.79 | % | | | (0.79 | )% | | | 0 | % |
| | | 1.41 | | | $ | 25.05 | | | | 5.98 | % | | $ | 135,912 | | | | 0.80 | %(f) | | | (0.79 | )% | | | 4 | % |
| | | (0.85 | ) | | $ | 23.64 | | | | (3.47 | )% | | $ | 13,593 | | | | 0.79 | % | | | (0.79 | )% | | | 3 | % |
| | | | | | | | | | | | | | | | | | | | | | | | | | | | |
| | | 1.80 | | | $ | 29.40 | | | | 6.49 | % | | $ | 50,714 | | | | 0.79 | % | | | (0.78 | )% | | | 0 | % |
| | | (1.69 | ) | | $ | 27.60 | | | | (5.76 | )% | | $ | 53,126 | | | | 0.79 | % | | | (0.79 | )% | | | 0 | % |
| | | 2.01 | | | $ | 29.29 | | | | 7.36 | % | | $ | 10,982 | | | | 0.79 | % | | | (0.79 | )% | | | 0 | % |
| | | 1.75 | | | $ | 27.28 | | | | 6.88 | % | | $ | 8,867 | | | | 0.79 | % | | | (0.79 | )% | | | 0 | % |
| | | – | | | $ | 25.53 | | | | – | | | $ | 2,553 | | | | – | | | | – | | | | – | % |
| | | | | | | | | | | | | | | | | | | | | | | | | | | | |
| | | 0.79 | | | $ | 28.86 | | | | 2.81 | % | | $ | 102,443 | | | | 0.79 | % | | | (0.78 | )% | | | 0 | % |
| | | (1.75 | ) | | $ | 28.07 | | | | (5.88 | )% | | $ | 46,311 | | | | 0.79 | % | | | (0.79 | )% | | | 0 | % |
| | | 2.67 | | | $ | 29.82 | | | | 9.85 | % | | $ | 32,059 | | | | 0.79 | % | | | (0.79 | )% | | | 0 | % |
| | | 0.75 | | | $ | 27.15 | | | | 2.84 | % | | $ | 23,756 | | | | 0.79 | % | | | (0.79 | )% | | | 160 | % |
The accompanying notes are an integral part of these financial statements.
Financial Highlights
| | | Per Share Operating Performance (For a share outstanding throughout each period) |
| | | | | | | Investment Operations: | | | Capital Share Transactions: | |
| | | Net Asset Value, Beginning of Period | | | Net investment income/(loss) (c) | | | Net realized and unrealized gain/(loss) | | | Total From Investment Operations | | | Transaction fees (see Note 5) | |
Innovator Premium Income 10 Barrier ETF - April | | | | | | | | | | | | | | | | | | | | |
For the period 3/31/2023(d) - 4/30/2023 | | $ | 24.46 | | | | 0.09 | | | | 0.13 | | | | 0.22 | | | | 0.01 | |
| | | | | | | | | | | | | | | | | | | | | |
Innovator Premium Income 20 Barrier ETF - April | | | | | | | | | | | | | | | | | | | | |
For the period 3/31/2023(d) - 4/30/2023 | | $ | 24.46 | | | | 0.09 | | | | 0.06 | | | | 0.15 | | | | 0.02 | |
| | | | | | | | | | | | | | | | | | | | | |
Innovator Premium Income 30 Barrier ETF - April | | | | | | | | | | | | | | | | | | | | |
For the period 3/31/2023(d) - 4/30/2023 | | $ | 24.46 | | | | 0.09 | | | | 0.01 | | | | 0.10 | | | | 0.03 | |
| | | | | | | | | | | | | | | | | | | | | |
Innovator Premium Income 40 Barrier ETF - April | | | | | | | | | | | | | | | | | | | | |
For the period 3/31/2023(d) - 4/30/2023 | | $ | 24.46 | | | | 0.09 | | | | (0.02 | ) | | | 0.07 | | | | 0.03 | |
| | | | | | | | | | | | | | | | | | | | | |
(a) Annualized for periods less than one year. |
(b) Not annualized for periods less than one year. |
(c) Net investment income/(loss) per share has been calculated based on average shares outstanding during the period. |
(d) Commencement of operations. |
The accompanying notes are an integral part of these financial statements.
| | | | | | | | | | Ratios/Supplemental Data: | |
| | | | | | | | | | | | | | | | | | Ratio to Average Net Assets of: (a) | | | | | |
| | Change in Net Asset Value for the Period | | | Net Asset Value, End of Period | | | Total return (b) | | | Net assets, end of period (000) | | | Expenses | | | Net investment income/(loss) | | | Portfolio turnover rate (b) | |
| | | | | | | | | | | | | | | | | | | | | | | | | | | | |
| | | 0.23 | | | $ | 24.69 | | | | 0.94 | % | | $ | 3,086 | | | | 0.79 | % | | | 5.01 | % | | | 0 | % |
| | | | | | | | | | | | | | | | | | | | | | | | | | | | |
| | | | | | | | | | | | | | | | | | | | | | | | | | | | |
| | | 0.17 | | | $ | 24.63 | | | | 0.69 | % | | $ | 14,161 | | | | 0.79 | % | | | 4.93 | % | | | 0 | % |
| | | | | | | | | | | | | | | | | | | | | | | | | | | | |
| | | | | | | | | | | | | | | | | | | | | | | | | | | | |
| | | 0.13 | | | $ | 24.59 | | | | 0.51 | % | | $ | 26,429 | | | | 0.79 | % | | | 4.70 | % | | | 0 | % |
| | | | | | | | | | | | | | | | | | | | | | | | | | | | |
| | | | | | | | | | | | | | | | | | | | | | | | | | | | |
| | | 0.10 | | | $ | 24.56 | | | | 0.40 | % | | $ | 24,559 | | | | 0.79 | % | | | 4.62 | % | | | 0 | % |
The accompanying notes are an integral part of these financial statements.
Notes to Financial Statements (Unaudited)
Innovator ETFs Trust (the “Trust”) was organized under Delaware law as a Delaware statutory trust on October 17, 2007, and is registered with the Securities and Exchange Commission (“SEC”) under the Investment Company Act of 1940, as amended (the “1940 Act”) as an open-end management investment company. The Trust currently consists of multiple operational series, of which forty are covered in this report, collectively the (“Funds”):
Name | | Ticker | | Commencement of Operations | | Tracking Fund (a) |
Innovator U.S. Equity Buffer ETF – January | | BJAN | | December 31, 2018 | | SPDR S&P 500® ETF Trust |
Innovator U.S. Equity Buffer ETF – February | | BFEB | | January 31, 2020 | | SPDR S&P 500® ETF Trust |
Innovator U.S. Equity Buffer ETF – March | | BMAR | | February 28, 2020 | | SPDR S&P 500® ETF Trust |
Innovator U.S. Equity Buffer ETF – April | | BAPR | | March 29, 2019 | | SPDR S&P 500® ETF Trust |
Innovator U.S. Equity Buffer ETF – May | | BMAY | | April 30, 2020 | | SPDR S&P 500® ETF Trust |
Innovator U.S. Equity Buffer ETF – June | | BJUN | | May 31, 2019 | | SPDR S&P 500® ETF Trust |
Innovator U.S. Equity Buffer ETF – July | | BJUL | | August 28, 2018 | | SPDR S&P 500® ETF Trust |
Innovator U.S. Equity Buffer ETF – August | | BAUG | | July 31, 2019 | | SPDR S&P 500® ETF Trust |
Innovator U.S. Equity Buffer ETF – September | | BSEP | | August 30, 2019 | | SPDR S&P 500® ETF Trust |
Innovator U.S. Equity Buffer ETF – October | | BOCT | | September 28, 2018 | | SPDR S&P 500® ETF Trust |
Innovator U.S. Equity Buffer ETF – November | | BNOV | | October 31, 2019 | | SPDR S&P 500® ETF Trust |
Innovator U.S. Equity Buffer ETF – December | | BDEC | | November 29, 2019 | | SPDR S&P 500® ETF Trust |
Innovator U.S. Equity Power Buffer ETF – January | | PJAN | | December 31, 2018 | | SPDR S&P 500® ETF Trust |
Innovator U.S. Equity Power Buffer ETF – February | | PFEB | | January 31, 2020 | | SPDR S&P 500® ETF Trust |
Innovator U.S. Equity Power Buffer ETF – March | | PMAR | | February 28, 2020 | | SPDR S&P 500® ETF Trust |
Innovator U.S. Equity Power Buffer ETF – April | | PAPR | | March 29, 2019 | | SPDR S&P 500® ETF Trust |
Innovator U.S. Equity Power Buffer ETF – May | | PMAY | | April 30, 2020 | | SPDR S&P 500® ETF Trust |
Innovator U.S. Equity Power Buffer ETF – June | | PJUN | | May 31, 2019 | | SPDR S&P 500® ETF Trust |
Innovator U.S. Equity Power Buffer ETF – July | | PJUL | | August 7, 2018 | | SPDR S&P 500® ETF Trust |
Innovator U.S. Equity Power Buffer ETF – August | | PAUG | | July 31, 2019 | | SPDR S&P 500® ETF Trust |
Innovator U.S. Equity Power Buffer ETF – September | | PSEP | | August 30, 2019 | | SPDR S&P 500® ETF Trust |
Innovator U.S. Equity Power Buffer ETF – October | | POCT | | September 28, 2018 | | SPDR S&P 500® ETF Trust |
Innovator U.S. Equity Power Buffer ETF – November | | PNOV | | October 31, 2019 | | SPDR S&P 500® ETF Trust |
Innovator U.S. Equity Power Buffer ETF – December | | PDEC | | November 29, 2019 | | SPDR S&P 500® ETF Trust |
Innovator U.S. Equity Ultra Buffer ETF – January | | UJAN | | December 31, 2018 | | SPDR S&P 500® ETF Trust |
Innovator U.S. Equity Ultra Buffer ETF – February | | UFEB | | January 31, 2020 | | SPDR S&P 500® ETF Trust |
Innovator U.S. Equity Ultra Buffer ETF – March | | UMAR | | February 28, 2020 | | SPDR S&P 500® ETF Trust |
Innovator U.S. Equity Ultra Buffer ETF – April | | UAPR | | March 29, 2019 | | SPDR S&P 500® ETF Trust |
Innovator U.S. Equity Ultra Buffer ETF – May | | UMAY | | April 30, 2020 | | SPDR S&P 500® ETF Trust |
Innovator U.S. Equity Ultra Buffer ETF – June | | UJUN | | May 31, 2019 | | SPDR S&P 500® ETF Trust |
Innovator U.S. Equity Ultra Buffer ETF – July | | UJUL | | August 7, 2018 | | SPDR S&P 500® ETF Trust |
Innovator U.S. Equity Ultra Buffer ETF – August | | UAUG | | July 31, 2019 | | SPDR S&P 500® ETF Trust |
Innovator U.S. Equity Ultra Buffer ETF – September | | USEP | | August 30, 2019 | | SPDR S&P 500® ETF Trust |
Innovator U.S. Equity Ultra Buffer ETF – October | | UOCT | | September 28, 2018 | | SPDR S&P 500® ETF Trust |
Innovator U.S. Equity Ultra Buffer ETF – November | | UNOV | | October 31, 2019 | | SPDR S&P 500® ETF Trust |
Innovator U.S. Equity Ultra Buffer ETF – December | | UDEC | | November 29, 2019 | | SPDR S&P 500® ETF Trust |
Innovator Premium Income 10 Barrier ETF - April | | APRD | | March 31, 2023 | | S&P 500® Index |
Innovator Premium Income 20 Barrier ETF - April | | APRH | | March 31, 2023 | | S&P 500® Index |
Innovator Premium Income 30 Barrier ETF - April | | APRJ | | March 31, 2023 | | S&P 500® Index |
Innovator Premium Income 40 Barrier ETF - April | | APRQ | | March 31, 2023 | | S&P 500® Index |
248
Notes to Financial Statements (Unaudited) (Continued)
The operational series of the Trust covered outside of this report consist of:
Name | | Ticker | | Commencement of Operations | | Tracking Index/Fund |
Innovator IBD® 50 ETF | | FFTY | | April 8, 2015 | | IBD® 50 Index |
Innovator IBD® Breakout Opportunities ETF | | BOUT | | September 12, 2018 | | IBD® Breakout Stocks Index |
Innovator Deepwater Frontier Tech ETF | | LOUP | | July 24, 2018 | | Loup Frontier Tech Index |
Innovator S&P Investment Grade Preferred ETF | | EPRF | | May 23, 2016 | | S&P U.S. High Quality Preferred Stock Index |
Innovator Laddered Allocation Buffer ETF | | BUFB | | February 8, 2022 | | MerQube U.S. Large Cap Equity Buffer Laddered Index |
Innovator Laddered Allocation Power Buffer ETF | | BUFF | | October 19, 2016 | | Refinitiv Laddered Power Buffer Strategy Index |
Innovator Buffer Step-Up Strategy ETF | | BSTP | | March 7, 2022 | | SPDR S&P 500® ETF Trust |
Innovator Power Buffer Step-Up Strategy ETF | | PSTP | | March 7, 2022 | | SPDR S&P 500® ETF Trust |
Innovator Hedged TSLA Strategy ETF | | TSLH | | July 25, 2022 | | Tesla, Inc. |
Innovator Uncapped Accelerated U.S. Equity ETF | | XUSP | | August 10, 2022 | | SPDR S&P 500® ETF Trust |
Innovator Equity Managed Floor ETF | | SFLR | | November 8, 2022 | | SPDR S&P 500® ETF Trust |
Innovator Gradient Tactical Rotation Strategy ETF | | IGTR | | November 16, 2022 | | S&P Global Broad Market Index |
Innovator International Developed Power Buffer ETF - January | | IJAN | | December 31, 2019 | | iShares MSCI EAFE ETF |
Innovator International Developed Power Buffer ETF - April | | IAPR | | March 31, 2021 | | iShares MSCI EAFE ETF |
Innovator International Developed Power Buffer ETF - July | | IJUL | | June 28, 2019 | | iShares MSCI EAFE ETF |
Innovator International Developed Power Buffer ETF - October | | IOCT | | September 30, 2021 | | iShares MSCI EAFE ETF |
Innovator Emerging Markets Power Buffer ETF - January | | EJAN | | December 31, 2019 | | iShares MSCI Emerging Markets ETF |
Innovator Emerging Markets Power Buffer ETF - April | | EAPR | | March 31, 2021 | | iShares MSCI Emerging Markets ETF |
Innovator Emerging Markets Power Buffer ETF - July | | EJUL | | June 28, 2019 | | iShares MSCI Emerging Markets ETF |
Innovator Emerging Markets Power Buffer ETF - October | | EOCT | | September 30, 2021 | | iShares MSCI Emerging Markets ETF |
Innovator Growth-100 Power Buffer ETF - January | | NJAN | | December 31, 2019 | | Invesco QQQ Trust |
Innovator Growth-100 Power Buffer ETF - April | | NAPR | | March 31, 2020 | | Invesco QQQ Trust |
Innovator Growth-100 Power Buffer ETF - July | | NJUL | | June 30, 2020 | | Invesco QQQ Trust |
Innovator Growth-100 Power Buffer ETF - October | | NOCT | | September 30, 2019 | | Invesco QQQ Trust |
Innovator U.S. Small Cap Power Buffer ETF - January | | KJAN | | December 31, 2019 | | iShares Russell 2000 ETF |
Innovator U.S. Small Cap Power Buffer ETF - April | | KAPR | | March 31, 2020 | | iShares Russell 2000 ETF |
Innovator U.S. Small Cap Power Buffer ETF - July | | KJUL | | June 30, 2020 | | iShares Russell 2000 ETF |
Innovator U.S. Small Cap Power Buffer ETF - October | | KOCT | | September 30, 2019 | | iShares Russell 2000 ETF |
Innovator Double Stacker ETF - January | | DSJA | | December 31, 2020 | | SPDR S&P 500® ETF Trust and Invesco QQQ Trust |
Innovator Double Stacker ETF - October | | DSOC | | September 30, 2020 | | SPDR S&P 500® ETF Trust and Invesco QQQ Trust |
Innovator Triple Stacker ETF - January | | TSJA | | December 31, 2020 | | SPDR S&P 500® ETF Trust, Invesco QQQ Trust and iShares Russell 2000 ETF |
Innovator Triple Stacker ETF - October | | TSOC | | September 30, 2020 | | SPDR S&P 500® ETF Trust, Invesco QQQ Trust and iShares Russell 2000 ETF |
Innovator Double Stacker 9 Buffer ETF - January | | DBJA | | December 31, 2020 | | SPDR S&P 500® ETF Trust and Invesco QQQ Trust |
Innovator Double Stacker 9 Buffer ETF - October | | DBOC | | September 30, 2020 | | SPDR S&P 500® ETF Trust and Invesco QQQ Trust |
Innovator U.S. Equity Accelerated ETF - January | | XDJA | | December 31, 2021 | | SPDR S&P 500® ETF Trust |
Innovator U.S. Equity Accelerated ETF - April | | XDAP | | March 31, 2021 | | SPDR S&P 500® ETF Trust |
Innovator U.S. Equity Accelerated ETF - July | | XDJL | | June 30, 2021 | | SPDR S&P 500® ETF Trust |
Innovator U.S. Equity Accelerated ETF - October | | XDOC | | September 30, 2021 | | SPDR S&P 500® ETF Trust |
Innovator U.S. Equity Accelerated Plus ETF - January | | XTJA | | December 31, 2021 | | SPDR S&P 500® ETF Trust |
Innovator U.S. Equity Accelerated Plus ETF - April | | XTAP | | March 31, 2021 | | SPDR S&P 500® ETF Trust |
Innovator U.S. Equity Accelerated Plus ETF - July | | XTJL | | June 30, 2021 | | SPDR S&P 500® ETF Trust |
Innovator U.S. Equity Accelerated Plus ETF - October | | XTOC | | September 30, 2021 | | SPDR S&P 500® ETF Trust |
Innovator U.S. Equity Accelerated 9 Buffer ETF - January | | XBJA | | December 31, 2021 | | SPDR S&P 500® ETF Trust |
Innovator U.S. Equity Accelerated 9 Buffer ETF - April | | XBAP | | March 31, 2021 | | SPDR S&P 500® ETF Trust |
Innovator U.S. Equity Accelerated 9 Buffer ETF - July | | XBJL | | June 30, 2021 | | SPDR S&P 500® ETF Trust |
Innovator U.S. Equity Accelerated 9 Buffer ETF - October | | XBOC | | September 30, 2021 | | SPDR S&P 500® ETF Trust |
Innovator Growth Accelerated Plus ETF - January | | QTJA | | December 31, 2021 | | Invesco QQQ Trust |
Innovator Growth Accelerated Plus ETF - April | | QTAP | | March 31, 2021 | | Invesco QQQ Trust |
Innovator Growth Accelerated Plus ETF - July | | QTJL | | June 30, 2021 | | Invesco QQQ Trust |
Innovator Growth Accelerated Plus ETF - October | | QTOC | | September 30, 2021 | | Invesco QQQ Trust |
Innovator 20+ Year Treasury Bond 9 Buffer ETF - July | | TBJL | | August 17, 2020 | | iShares 20+ Year Treasury Bond ETF |
Innovator 20+ Year Treasury Bond 5 Floor ETF - Quarterly | | TFJL | | August 17, 2020 | | iShares 20+ Year Treasury Bond ETF |
Innovator Defined Wealth Shield ETF | | BALT | | June 30, 2021 | | SPDR S&P 500® ETF Trust |
Innovator U.S. Equity Accelerated ETF - Quarterly | | XDSQ | | March 31, 2021 | | SPDR S&P 500® ETF Trust |
Innovator Growth Accelerated ETF - Quarterly | | XDQQ | | March 31, 2021 | | Invesco QQQ Trust |
249
Notes to Financial Statements (Unaudited) (Continued)
The Funds are exchange traded funds that offer one class of shares, do not charge a sales load, do not have a redemption fee and currently do not charge a 12b-1 fee to their shareholders. The Funds list and principally trade their shares on Cboe BZX Exchange, Inc. (“Cboe BZX” or the “Exchange”).
Each Fund employs a specific “defined outcome strategy.” Defined outcome strategies generally seek to produce pre-determined investment outcomes based upon the performance of an index or one or more underlying securities. The Funds’ pre-determined outcomes (“Outcomes”) are based upon the price performance of a benchmark index or one or more underlying exchange-traded fund (the “Benchmark”) over a period of approximately one year or another predetermined period (“Outcome Period”). The Funds’ investment strategy provides shareholders with participation in any gains experienced by the applicable Benchmark over the course of the Outcome Period, subject to a cap on upside returns (a “Cap”), and a predetermined buffer (a “Buffer”), each as applicable, against Benchmark losses for the Outcome Period. These defined outcomes are managed by purchasing and selling call and put FLexible EXchange Options (“FLEX Options”) to create layers within a Fund’s portfolio. Each Fund’s FLEX Option has the same reference asset and expiration date, with uniquely selected strike prices for the Fund’s Outcome Period. Due to the customizable nature of FLEX Options that allows for specific strike prices to be selected for the same reference asset and expiration date, when each of the FLEX Options expire on the last day of the Outcome Period, the Funds are expected to achieve a Benchmark investment return with the applicable Buffer and Cap investment parameters.
The Funds are investment companies and accordingly follow the investment company accounting and reporting guidance of the Financial Accounting Standards Board (“FASB”) Accounting Standards Codification (“ASC”) Topic 946 “Financial Services — Investment Companies”.
250
Notes to Financial Statements (Unaudited) (Continued)
2. | SIGNIFICANT ACCOUNTING POLICIES |
The following is a summary of significant accounting policies consistently followed by the Trust in the preparation of its financial statements. These policies are in conformity with accounting principles generally accepted in the United States of America (“U.S. GAAP”).
Valuation:
The net asset values (“NAV”) of the Funds are determined as of the close of regular trading on the NYSE (normally 4:00 p.m. ET). If the NYSE closes early on a valuation day, the Funds shall determine NAV as of that time.
Portfolio securities generally shall be valued utilizing prices provided by independent pricing services. The Adviser, as the Trust’s Valuation Designee (“Valuation Designee”) is responsible for establishing valuation of portfolio securities and other instruments held by the Funds in accordance with the Trust’s valuation procedures.
Common stocks, preferred stocks and other equity securities listed on any national or foreign exchange (excluding the NASDAQ National Market (“NASDAQ”) and the London Stock Exchange Alternative Investment Market (“AIM”)) are generally valued at the last sale price on the exchange on which they are principally traded or, for NASDAQ and AIM securities, the official closing price. Securities traded on more than one securities exchange are valued at the last sale price or official closing price, as applicable, at the close of the exchange representing the principal market for such securities. Securities traded in the over-the-counter market are valued at the mean of the bid and the asked price, if available, and otherwise at their closing bid price. Redeemable securities issued by open-end investment companies shall be valued at the investment company’s applicable net asset value, with the exception of exchange-traded open-end investment companies which are priced as equity securities. Fixed income securities, swaps, currency-, credit- and commodity-linked notes, and other similar instruments will be valued using a pricing service. Fixed income securities having a remaining maturity of 60 days or less when purchased will be valued at cost adjusted for amortization of premiums and accretion of discounts, provided the Valuation Designee has determined that the use of amortized cost is an appropriate reflection of fair value given market and issuer specific conditions existing at the time of the determination. Deposit accounts are valued at acquisition cost. Foreign securities and other assets denominated in foreign currencies are translated into U.S. dollars at the exchange rate of such currencies against the U.S. dollar as provided by the pricing service. All assets denominated in foreign currencies will be converted into U.S. dollars at the exchange rates in effect at the time of valuation. Restricted securities (with the exception of Rule 144A Securities for which market quotations are available) will normally be valued at fair value as determined by the Valuation Designee.
Exchange-traded option contracts (other than FLEX Option contracts) will be valued at the closing price in the market where such contracts are principally traded. If no closing price is available, they will be fair valued at the mean of their most recent bid and asked price, if available, and otherwise at their closing bid price. OTC options are fair valued at the mean of the most recent bid and asked price, if available, and otherwise at their closing bid price. FLEX Options will be valued at a model-based price provided by the exchange on which the option is traded at the official close of that exchange’s trading date. If the exchange on which the option is traded is unable to provide a model price, FLEX Options prices will be provided by backup provider Super Derivatives. Otherwise, the value of a FLEX Option will be determined by the Valuation Designee in accordance with the Trust’s valuation procedures.
If no quotation can be obtained from a pricing service, then the Valuation Designee will then attempt to obtain one or more broker quotes for the security. If no quotation is available from either a pricing service or one or more brokers or if the Valuation Designee has reason to question the reliability or accuracy of a quotation supplied or the use of amortized cost, the value of any portfolio security held by the Funds for which reliable market quotations are not readily available will be determined by the Valuation Designee in a manner that most appropriately reflects fair market value of the security on the valuation date. The use of a fair valuation method may be appropriate if, for example: (i) market quotations do not accurately reflect fair value of an investment; (ii) an investment’s value has been materially affected by events occurring after the close of the exchange or market on which the investment is principally traded (for example, a foreign exchange or market); (iii) a trading halt closes an exchange or market early; or (iv) other events result in an exchange or market delaying its normal close.
251
Notes to Financial Statements (Unaudited) (Continued)
Fair Valuation Measurement:
FASB established a framework for measuring fair value in accordance with U.S. GAAP. Under ASC Topic 820, “Fair Value Measurement” (“ASC 820”), various inputs are used in determining the value of the Funds’ investments. The inputs or methodology used for valuing securities are not necessarily an indication of the risk associated with investing in those securities. The three Levels of inputs of the fair value hierarchy are defined as follows:
| | • | Level 1 – | Unadjusted quoted prices in active markets for identical assets or liabilities that the Funds have the ability to access. |
| | • | Level 2 – | Observable inputs other than quoted prices included in level 1 that are observable for the asset or liability, either directly or indirectly. These inputs may include quoted prices for the identical instrument on an inactive market, prices for similar instruments, interest rates, prepayment speeds, credit risk, yield curves, default rates and similar data. |
| | • | Level 3 – | Unobservable inputs for the asset or liability, to the extent relevant observable inputs are not available, representing the Funds’ own assumptions about the assumptions a market participant would use in valuing the asset or liability, and would be based on the best information available. |
The availability of observable inputs can vary from security to security and is affected by a wide variety of factors, including, for example, the type of security, whether the security is new and not yet established in the marketplace, the liquidity of markets, and other characteristics particular to the security. To the extent that valuation is based on models or inputs that are less observable or unobservable in the market, the determination of fair value requires more judgement. Accordingly, the degree of judgement exercised in determining fair value is greatest for instruments categorized in Level 3.
The inputs used to measure fair value may fall into different levels of the fair value hierarchy. In such cases, for disclosure purposes, the level in the fair value hierarchy within which the fair value measurement falls in its entirety, is determined based on the lowest level input that is significant to the fair value measurement in its entirety.
252
Notes to Financial Statements (Unaudited) (Continued)
The following table summarizes valuation of the Funds’ investments under the fair value hierarchy levels as of April 30, 2023:
BJAN | | | | | | | | | | | | | | | | |
| | | Level 1 | | | Level 2 | | | Level 3 | | | Total | |
Assets | | | | | | | | | | | | | | | | |
Purchased Options | | $ | – | | | $ | 184,383,225 | | | $ | – | | | $ | 184,383,225 | |
Short Term Investments | | | 467,208 | | | | – | | | | – | | | | 467,208 | |
Total Assets | | $ | 467,208 | | | $ | 184,383,225 | | | $ | – | | | $ | 184,850,433 | |
| | | | | | | | | | | | | | | | | |
Liabilities | | | | | | | | | | | | | | | | |
Options Written | | $ | – | | | $ | 4,291,488 | | | $ | – | | | $ | 4,291,488 | |
Total Liabilities | | $ | – | | | $ | 4,291,488 | | | $ | – | | | $ | 4,291,488 | |
BFEB | | | | | | | | | | | | | | | | |
| | | Level 1 | | | Level 2 | | | Level 3 | | | Total | |
Assets | | | | | | | | | | | | | | | | |
Purchased Options | | $ | – | | | $ | 124,563,026 | | | $ | – | | | $ | 124,563,026 | |
Short Term Investments | | | 331,201 | | | | – | | | | – | | | | 331,201 | |
Total Assets | | $ | 331,201 | | | $ | 124,563,026 | | | $ | – | | | $ | 124,894,227 | |
| | | | | | | | | | | | | | | | | |
Liabilities | | | | | | | | | | | | | | | | |
Options Written | | $ | – | | | $ | 3,994,088 | | | $ | – | | | $ | 3,994,088 | |
Total Liabilities | | $ | – | | | $ | 3,994,088 | | | $ | – | | | $ | 3,994,088 | |
BMAR | | | | | | | | | | | | | | | | |
| | | Level 1 | | | Level 2 | | | Level 3 | | | Total | |
Assets | | | | | | | | | | | | | | | | |
Purchased Options | | $ | – | | | $ | 104,849,591 | | | $ | – | | | $ | 104,849,591 | |
Short Term Investments | | | 268,747 | | | | – | | | | – | | | | 268,747 | |
Total Assets | | $ | 268,747 | | | $ | 104,849,591 | | | $ | – | | | $ | 105,118,338 | |
| | | | | | | | | | | | | | | | | |
Liabilities | | | | | | | | | | | | | | | | |
Options Written | | $ | – | | | $ | 3,723,425 | | | $ | – | | | $ | 3,723,425 | |
Total Liabilities | | $ | – | | | $ | 3,723,425 | | | $ | – | | | $ | 3,723,425 | |
| | | | | | | | | | | | | | | | | |
BAPR | | | | | | | | | | | | | | | | |
| | | Level 1 | | | Level 2 | | | Level 3 | | | Total | |
Assets | | | | | | | | | | | | | | | | |
Purchased Options | | $ | – | | | $ | 171,302,088 | | | $ | – | | | $ | 171,302,088 | |
Short Term Investments | | | 420,721 | | | | – | | | | – | | | | 420,721 | |
Total Assets | | $ | 420,721 | | | $ | 171,302,088 | | | $ | – | | | $ | 171,722,809 | |
| | | | | | | | | | | | | | | | | |
Liabilities | | | | | | | | | | | | | | | | |
Options Written | | $ | – | | | $ | 6,785,151 | | | $ | – | | | $ | 6,785,151 | |
Total Liabilities | | $ | – | | | $ | 6,785,151 | | | $ | – | | | $ | 6,785,151 | |
| | | | | | | | | | | | | | | | | |
BMAY | | | | | | | | | | | | | | | | |
| | | Level 1 | | | Level 2 | | | Level 3 | | | Total | |
Assets | | | | | | | | | | | | | | | | |
Purchased Options | | $ | – | | | $ | 127,781,004 | | | $ | – | | | $ | 127,781,004 | |
Short Term Investments | | | 340,480 | | | | – | | | | – | | | | 340,480 | |
Total Assets | | $ | 340,480 | | | $ | 127,781,004 | | | $ | – | | | $ | 128,121,484 | |
| | | | | | | | | | | | | | | | | |
Liabilities | | | | | | | | | | | | | | | | |
Options Written | | $ | – | | | $ | 5,735,340 | | | $ | – | | | $ | 5,735,340 | |
Total Liabilities | | $ | – | | | $ | 5,735,340 | | | $ | – | | | $ | 5,735,340 | |
253
Notes to Financial Statements (Unaudited) (Continued)
BJUN | | | | | | | | | | | | | | | | |
| | | Level 1 | | | Level 2 | | | Level 3 | | | Total | |
Assets | | | | | | | | | | | | | | | | |
Purchased Options | | $ | – | | | $ | 143,939,109 | | | $ | – | | | $ | 143,939,109 | |
Short Term Investments | | | 324,697 | | | | – | | | | – | | | | 324,697 | |
Total Assets | | $ | 324,697 | | | $ | 143,939,109 | | | $ | – | | | $ | 144,263,806 | |
| | | | | | | | | | | | | | | | | |
Liabilities | | | | | | | | | | | | | | | | |
Options Written | | $ | – | | | $ | 238,533 | | | $ | – | | | $ | 238,533 | |
Total Liabilities | | $ | – | | | $ | 238,533 | | | $ | – | | | $ | 238,533 | |
| | | | | | | | | | | | | | | | | |
BJUL | | | | | | | | | | | | | | | | |
| | | Level 1 | | | Level 2 | | | Level 3 | | | Total | |
Assets | | | | | | | | | | | | | | | | |
Purchased Options | | $ | – | | | $ | 146,624,699 | | | $ | – | | | $ | 146,624,699 | |
Short Term Investments | | | 351,676 | | | | – | | | | – | | | | 351,676 | |
Total Assets | | $ | 351,676 | | | $ | 146,624,699 | | | $ | – | | | $ | 146,976,375 | |
| | | | | | | | | | | | | | | | | |
Liabilities | | | | | | | | | | | | | | | | |
Options Written | | $ | – | | | $ | 318,417 | | | $ | – | | | $ | 318,417 | |
Total Liabilities | | $ | – | | | $ | 318,417 | | | $ | – | | | $ | 318,417 | |
| | | | | | | | | | | | | | | | | |
BAUG | | | | | | | | | | | | | | | | |
| | | Level 1 | | | Level 2 | | | Level 3 | | | Total | |
Assets | | | | | | | | | | | | | | | | |
Purchased Options | | $ | – | | | $ | 125,163,328 | | | $ | – | | | $ | 125,163,328 | |
Short Term Investments | | | 316,283 | | | | – | | | | – | | | | 316,283 | |
Total Assets | | $ | 316,283 | | | $ | 125,163,328 | | | $ | – | | | $ | 125,479,611 | |
| | | | | | | | | | | | | | | | | |
Liabilities | | | | | | | | | | | | | | | | |
Options Written | | $ | – | | | $ | 1,124,363 | | | $ | – | | | $ | 1,124,363 | |
Total Liabilities | | $ | – | | | $ | 1,124,363 | | | $ | – | | | $ | 1,124,363 | |
| | | | | | | | | | | | | | | | | |
BSEP | | | | | | | | | | | | | | | | |
| | | Level 1 | | | Level 2 | | | Level 3 | | | Total | |
Assets | | | | | | | | | | | | | | | | |
Purchased Options | | $ | – | | | $ | 171,888,664 | | | $ | – | | | $ | 171,888,664 | |
Short Term Investments | | | 381,861 | | | | – | | | | – | | | | 381,861 | |
Total Assets | | $ | 381,861 | | | $ | 171,888,664 | | | $ | – | | | $ | 172,270,525 | |
| | | | | | | | | | | | | | | | | |
Liabilities | | | | | | | | | | | | | | | | |
Options Written | | $ | – | | | $ | 1,633,790 | | | $ | – | | | $ | 1,633,790 | |
Total Liabilities | | $ | – | | | $ | 1,633,790 | | | $ | – | | | $ | 1,633,790 | |
| | | | | | | | | | | | | | | | | |
BOCT | | | | | | | | | | | | | | | | |
| | | Level 1 | | | Level 2 | | | Level 3 | | | Total | |
Assets | | | | | | | | | | | | | | | | |
Purchased Options | | $ | – | | | $ | 151,959,775 | | | $ | – | | | $ | 151,959,775 | |
Short Term Investments | | | 381,691 | | | | – | | | | – | | | | 381,691 | |
Total Assets | | $ | 381,691 | | | $ | 151,959,775 | | | $ | – | | | $ | 152,341,466 | |
| | | | | | | | | | | | | | | | | |
Liabilities | | | | | | | | | | | | | | | | |
Options Written | | $ | – | | | $ | 1,982,518 | | | $ | – | | | $ | 1,982,518 | |
Total Liabilities | | $ | – | | | $ | 1,982,518 | | | $ | – | | | $ | 1,982,518 | |
254
Notes to Financial Statements (Unaudited) (Continued)
BNOV | | | | | | | | | | | | | | | | |
| | | Level 1 | | | Level 2 | | | Level 3 | | | Total | |
Assets | | | | | | | | | | | | | | | | |
Purchased Options | | $ | – | | | $ | 137,060,049 | | | $ | – | | | $ | 137,060,049 | |
Short Term Investments | | | 296,222 | | | | – | | | | – | | | | 296,222 | |
Total Assets | | $ | 296,222 | | | $ | 137,060,049 | | | $ | – | | | $ | 137,356,271 | |
| | | | | | | | | | | | | | | | | |
Liabilities | | | | | | | | | | | | | | | | |
Options Written | | $ | – | | | $ | 1,932,862 | | | $ | – | | | $ | 1,932,862 | |
Total Liabilities | | $ | – | | | $ | 1,932,862 | | | $ | – | | | $ | 1,932,862 | |
| | | | | | | | | | | | | | | | | |
BDEC | | | | | | | | | | | | | | | | |
| | | Level 1 | | | Level 2 | | | Level 3 | | | Total | |
Assets | | | | | | | | | | | | | | | | |
Purchased Options | | $ | – | | | $ | 112,728,023 | | | $ | – | | | $ | 112,728,023 | |
Short Term Investments | | | 308,672 | | | | – | | | | – | | | | 308,672 | |
Total Assets | | $ | 308,672 | | | $ | 112,728,023 | | | $ | – | | | $ | 113,036,695 | |
| | | | | | | | | | | | | | | | | |
Liabilities | | | | | | | | | | | | | | | | |
Options Written | | $ | – | | | $ | 2,446,210 | | | $ | – | | | $ | 2,446,210 | |
Total Liabilities | | $ | – | | | $ | 2,446,210 | | | $ | – | | | $ | 2,446,210 | |
| | | | | | | | | | | | | | | | | |
PJAN | | | | | | | | | | | | | | | | |
| | | Level 1 | | | Level 2 | | | Level 3 | | | Total | |
Assets | | | | | | | | | | | | | | | | |
Purchased Options | | $ | – | | | $ | 699,273,696 | | | $ | – | | | $ | 699,273,696 | |
Short Term Investments | | | 1,754,483 | | | | – | | | | – | | | | 1,754,483 | |
Total Assets | | $ | 1,754,483 | | | $ | 699,273,696 | | | $ | – | | | $ | 701,028,179 | |
| | | | | | | | | | | | | | | | | |
Liabilities | | | | | | | | | | | | | | | | |
Options Written | | $ | – | | | $ | 22,990,688 | | | $ | – | | | $ | 22,990,688 | |
Total Liabilities | | $ | – | | | $ | 22,990,688 | | | $ | – | | | $ | 22,990,688 | |
| | | | | | | | | | | | | | | | | |
PFEB | | | | | | | | | | | | | | | | |
| | | Level 1 | | | Level 2 | | | Level 3 | | | Total | |
Assets | | | | | | | | | | | | | | | | |
Purchased Options | | $ | – | | | $ | 648,913,356 | | | $ | – | | | $ | 648,913,356 | |
Short Term Investments | | | 1,626,541 | | | | – | | | | – | | | | 1,626,541 | |
Total Assets | | $ | 1,626,541 | | | $ | 648,913,356 | | | $ | – | | | $ | 650,539,897 | |
| | | | | | | | | | | | | | | | | |
Liabilities | | | | | | | | | | | | | | | | |
Options Written | | $ | – | | | $ | 22,748,841 | | | $ | – | | | $ | 22,748,841 | |
Total Liabilities | | $ | – | | | $ | 22,748,841 | | | $ | – | | | $ | 22,748,841 | |
| | | | | | | | | | | | | | | | | |
PMAR | | | | | | | | | | | | | | | | |
| | | Level 1 | | | Level 2 | | | Level 3 | | | Total | |
Assets | | | | | | | | | | | | | | | | |
Purchased Options | | $ | – | | | $ | 467,138,541 | | | $ | – | | | $ | 467,138,541 | |
Short Term Investments | | | 1,171,977 | | | | – | | | | – | | | | 1,171,977 | |
Total Assets | | $ | 1,171,977 | | | $ | 467,138,541 | | | $ | – | | | $ | 468,310,518 | |
| | | | | | | | | | | | | | | | | |
Liabilities | | | | | | | | | | | | | | | | |
Options Written | | $ | – | | | $ | 20,054,100 | | | $ | – | | | $ | 20,054,100 | |
Total Liabilities | | $ | – | | | $ | 20,054,100 | | | $ | – | | | $ | 20,054,100 | |
255
Notes to Financial Statements (Unaudited) (Continued)
PAPR | | | | | | | | | | | | | | | | |
| | | Level 1 | | | Level 2 | | | Level 3 | | | Total | |
Assets | | | | | | | | | | | | | | | | |
Purchased Options | | $ | – | | | $ | 686,720,615 | | | $ | – | | | $ | 686,720,615 | |
Short Term Investments | | | 1,729,876 | | | | – | | | | – | | | | 1,729,876 | |
Total Assets | | $ | 1,729,876 | | | $ | 686,720,615 | | | $ | – | | | $ | 688,450,491 | |
| | | | | | | | | | | | | | | | | |
Liabilities | | | | | | | | | | | | | | | | |
Options Written | | $ | – | | | $ | 28,460,282 | | | $ | – | | | $ | 28,460,282 | |
Total Liabilities | | $ | – | | | $ | 28,460,282 | | | $ | – | | | $ | 28,460,282 | |
| | | | | | | | | | | | | | | | | |
PMAY | | | | | | | | | | | | | | | | |
| | | Level 1 | | | Level 2 | | | Level 3 | | | Total | |
Assets | | | | | | | | | | | | | | | | |
Purchased Options | | $ | – | | | $ | 518,876,990 | | | $ | – | | | $ | 518,876,990 | |
Short Term Investments | | | 1,232,036 | | | | – | | | | – | | | | 1,232,036 | |
Total Assets | | $ | 1,232,036 | | | $ | 518,876,990 | | | $ | – | | | $ | 520,109,026 | |
| | | | | | | | | | | | | | | | | |
Liabilities | | | | | | | | | | | | | | | | |
Options Written | | $ | – | | | $ | 23,323,830 | | | $ | – | | | $ | 23,323,830 | |
Total Liabilities | | $ | – | | | $ | 23,323,830 | | | $ | – | | | $ | 23,323,830 | |
| | | | | | | | | | | | | | | | | |
PJUN | | | | | | | | | | | | | | | | |
| | | Level 1 | | | Level 2 | | | Level 3 | | | Total | |
Assets | | | | | | | | | | | | | | | | |
Purchased Options | | $ | – | | | $ | 362,870,014 | | | $ | – | | | $ | 362,870,014 | |
Short Term Investments | | | 963,230 | | | | – | | | | – | | | | 963,230 | |
Total Assets | | $ | 963,230 | | | $ | 362,870,014 | | | $ | – | | | $ | 363,833,244 | |
| | | | | | | | | | | | | | | | | |
Liabilities | | | | | | | | | | | | | | | | |
Options Written | | $ | – | | | $ | 259,409 | | | $ | – | | | $ | 259,409 | |
Total Liabilities | | $ | – | | | $ | 259,409 | | | $ | – | | | $ | 259,409 | |
| | | | | | | | | | | | | | | | | |
PJUL | | | | | | | | | | | | | | | | |
| | | Level 1 | | | Level 2 | | | Level 3 | | | Total | |
Assets | | | | | | | | | | | | | | | | |
Purchased Options | | $ | – | | | $ | 416,829,860 | | | $ | – | | | $ | 416,829,860 | |
Short Term Investments | | | 1,072,570 | | | | – | | | | – | | | | 1,072,570 | |
Total Assets | | $ | 1,072,570 | | | $ | 416,829,860 | | | $ | – | | | $ | 417,902,430 | |
| | | | | | | | | | | | | | | | | |
Liabilities | | | | | | | | | | | | | | | | |
Options Written | | $ | – | | | $ | 1,402,573 | | | $ | – | | | $ | 1,402,573 | |
Total Liabilities | | $ | – | | | $ | 1,402,573 | | | $ | – | | | $ | 1,402,573 | |
256
Notes to Financial Statements (Unaudited) (Continued)
PAUG | | | | | | | | | | | | | | | | |
| | | Level 1 | | | Level 2 | | | Level 3 | | | Total | |
Assets | | | | | | | | | | | | | | | | |
Purchased Options | | $ | – | | | $ | 526,485,423 | | | $ | – | | | $ | 526,485,423 | |
Short Term Investments | | | 1,354,432 | | | | – | | | | – | | | | 1,354,432 | |
Total Assets | | $ | 1,354,432 | | | $ | 526,485,423 | | | $ | – | | | $ | 527,839,855 | |
| | | | | | | | | | | | | | | | | |
Liabilities | | | | | | | | | | | | | | | | |
Options Written | | $ | – | | | $ | 2,714,403 | | | $ | – | | | $ | 2,714,403 | |
Total Liabilities | | $ | – | | | $ | 2,714,403 | | | $ | – | | | $ | 2,714,403 | |
| | | | | | | | | | | | | | | | | |
PSEP | | | | | | | | | | | | | | | | |
| | | Level 1 | | | Level 2 | | | Level 3 | | | Total | |
Assets | | | | | | | | | | | | | | | | |
Purchased Options | | $ | – | | | $ | 652,661,779 | | | $ | – | | | $ | 652,661,779 | |
Short Term Investments | | | 1,665,153 | | | | – | | | | – | | | | 1,665,153 | |
Total Assets | | $ | 1,665,153 | | | $ | 652,661,779 | | | $ | – | | | $ | 654,326,932 | |
| | | | | | | | | | | | | | | | | |
Liabilities | | | | | | | | | | | | | | | | |
Options Written | | $ | – | | | $ | 5,639,960 | | | $ | – | | | $ | 5,639,960 | |
Total Liabilities | | $ | – | | | $ | 5,639,960 | | | $ | – | | | $ | 5,639,960 | |
| | | | | | | | | | | | | | | | | |
POCT | | | | | | | | | | | | | | | | |
| | | Level 1 | | | Level 2 | | | Level 3 | | | Total | |
Assets | | | | | | | | | | | | | | | | |
Purchased Options | | $ | – | | | $ | 519,234,671 | | | $ | – | | | $ | 519,234,671 | |
Short Term Investments | | | 1,228,086 | | | | – | | | | – | | | | 1,228,086 | |
Total Assets | | $ | 1,228,086 | | | $ | 519,234,671 | | | $ | – | | | $ | 520,462,757 | |
| | | | | | | | | | | | | | | | | |
Liabilities | | | | | | | | | | | | | | | | |
Options Written | | $ | – | | | $ | 17,781,570 | | | $ | – | | | $ | 17,781,570 | |
Total Liabilities | | $ | – | | | $ | 17,781,570 | | | $ | – | | | $ | 17,781,570 | |
| | | | | | | | | | | | | | | | | |
PNOV | | | | | | | | | | | | | | | | |
| | | Level 1 | | | Level 2 | | | Level 3 | | | Total | |
Assets | | | | | | | | | | | | | | | | |
Purchased Options | | $ | – | | | $ | 804,576,001 | | | $ | – | | | $ | 804,576,001 | |
Short Term Investments | | | 2,033,725 | | | | – | | | | – | | | | 2,033,725 | |
Total Assets | | $ | 2,033,725 | | | $ | 804,576,001 | | | $ | – | | | $ | 806,609,726 | |
| | | | | | | | | | | | | | | | | |
Liabilities | | | | | | | | | | | | | | | | |
Options Written | | $ | – | | | $ | 12,921,600 | | | $ | – | | | $ | 12,921,600 | |
Total Liabilities | | $ | – | | | $ | 12,921,600 | | | $ | – | | | $ | 12,921,600 | |
257
Notes to Financial Statements (Unaudited) (Continued)
PDEC | | | | | | | | | | | | | | | | |
| | | Level 1 | | | Level 2 | | | Level 3 | | | Total | |
Assets | | | | | | | | | | | | | | | | |
Purchased Options | | $ | – | | | $ | 725,136,300 | | | $ | – | | | $ | 725,136,300 | |
Short Term Investments | | | 1,856,852 | | | | – | | | | – | | | | 1,856,852 | |
Total Assets | | $ | 1,856,852 | | | $ | 725,136,300 | | | $ | – | | | $ | 726,993,152 | |
| | | | | | | | | | | | | | | | | |
Liabilities | | | | | | | | | | | | | | | | |
Options Written | | $ | – | | | $ | 12,754,896 | | | $ | – | | | $ | 12,754,896 | |
Total Liabilities | | $ | – | | | $ | 12,754,896 | | | $ | – | | | $ | 12,754,896 | |
| | | | | | | | | | | | | | | | | |
UJAN | | | | | | | | | | | | | | | | |
| | | Level 1 | | | Level 2 | | | Level 3 | | | Total | |
Assets | | | | | | | | | | | | | | | | |
Purchased Options | | $ | – | | | $ | 156,347,905 | | | $ | – | | | $ | 156,347,905 | |
Short Term Investments | | | 384,626 | | | | – | | | | – | | | | 384,626 | |
Total Assets | | $ | 384,626 | | | $ | 156,347,905 | | | $ | – | | | $ | 156,732,531 | |
| | | | | | | | | | | | | | | | | |
Liabilities | | | | | | | | | | | | | | | | |
Options Written | | $ | – | | | $ | 5,375,165 | | | $ | – | | | $ | 5,375,165 | |
Total Liabilities | | $ | – | | | $ | 5,375,165 | | | $ | – | | | $ | 5,375,165 | |
| | | | | | | | | | | | | | | | | |
UFEB | | | | | | | | | | | | | | | | |
| | | Level 1 | | | Level 2 | | | Level 3 | | | Total | |
Assets | | | | | | | | | | | | | | | | |
Purchased Options | | $ | – | | | $ | 93,534,883 | | | $ | – | | | $ | 93,534,883 | |
Short Term Investments | | | 225,448 | | | | – | | | | – | | | | 225,448 | |
Total Assets | | $ | 225,448 | | | $ | 93,534,883 | | | $ | – | | | $ | 93,760,331 | |
| | | | | | | | | | | | | | | | | |
Liabilities | | | | | | | | | | | | | | | | |
Options Written | | $ | – | | | $ | 2,465,354 | | | $ | – | | | $ | 2,465,354 | |
Total Liabilities | | $ | – | | | $ | 2,465,354 | | | $ | – | | | $ | 2,465,354 | |
| | | | | | | | | | | | | | | | | |
UMAR | | | | | | | | | | | | | | | | |
| | | Level 1 | | | Level 2 | | | Level 3 | | | Total | |
Assets | | | | | | | | | | | | | | | | |
Purchased Options | | $ | – | | | $ | 75,155,805 | | | $ | – | | | $ | 75,155,805 | |
Short Term Investments | | | 210,012 | | | | – | | | | – | | | | 210,012 | |
Total Assets | | $ | 210,012 | | | $ | 75,155,805 | | | $ | – | | | $ | 75,365,817 | |
| | | | | | | | | | | | | | | | | |
Liabilities | | | | | | | | | | | | | | | | |
Options Written | | $ | – | | | $ | 2,763,470 | | | $ | – | | | $ | 2,763,470 | |
Total Liabilities | | $ | – | | | $ | 2,763,470 | | | $ | – | | | $ | 2,763,470 | |
258
Notes to Financial Statements (Unaudited) (Continued)
UAPR | | | | | | | | | | | | | | | | |
| | | Level 1 | | | Level 2 | | | Level 3 | | | Total | |
Assets | | | | | | | | | | | | | | | | |
Purchased Options | | $ | – | | | $ | 157,660,028 | | | $ | – | | | $ | 157,660,028 | |
Short Term Investments | | | 429,743 | | | | – | | | | – | | | | 429,743 | |
Total Assets | | $ | 429,743 | | | $ | 157,660,028 | | | $ | – | | | $ | 158,089,771 | |
| | | | | | | | | | | | | | | | | |
Liabilities | | | | | | | | | | | | | | | | |
Options Written | | $ | – | | | $ | 4,856,689 | | | $ | – | | | $ | 4,856,689 | |
Total Liabilities | | $ | – | | | $ | 4,856,689 | | | $ | – | | | $ | 4,856,689 | |
| | | | | | | | | | | | | | | | | |
UMAY | | | | | | | | | | | | | | | | |
| | | Level 1 | | | Level 2 | | | Level 3 | | | Total | |
Assets | | | | | | | | | | | | | | | | |
Purchased Options | | $ | – | | | $ | 100,491,290 | | | $ | – | | | $ | 100,491,290 | |
Short Term Investments | | | 282,521 | | | | – | | | | – | | | | 282,521 | |
Total Assets | | $ | 282,521 | | | $ | 100,491,290 | | | $ | – | | | $ | 100,773,811 | |
| | | | | | | | | | | | | | | | | |
Liabilities | | | | | | | | | | | | | | | | |
Options Written | | $ | – | | | $ | 3,226,492 | | | $ | – | | | $ | 3,226,492 | |
Total Liabilities | | $ | – | | | $ | 3,226,492 | | | $ | – | | | $ | 3,226,492 | |
| | | | | | | | | | | | | | | | | |
UJUN | | | | | | | | | | | | | | | | |
| | | Level 1 | | | Level 2 | | | Level 3 | | | Total | |
Assets | | | | | | | | | | | | | | | | |
Purchased Options | | $ | – | | | $ | 90,204,154 | | | $ | – | | | $ | 90,204,154 | |
Short Term Investments | | | 213,917 | | | | – | | | | – | | | | 213,917 | |
Total Assets | | $ | 213,917 | | | $ | 90,204,154 | | | $ | – | | | $ | 90,418,071 | |
| | | | | | | | | | | | | | | | | |
Liabilities | | | | | | | | | | | | | | | | |
Options Written | | $ | – | | | $ | 17,732 | | | $ | – | | | $ | 17,732 | |
Total Liabilities | | $ | – | | | $ | 17,732 | | | $ | – | | | $ | 17,732 | |
| | | | | | | | | | | | | | | | | |
UJUL | | | | | | | | | | | | | | | | |
| | | Level 1 | | | Level 2 | | | Level 3 | | | Total | |
Assets | | | | | | | | | | | | | | | | |
Purchased Options | | $ | – | | | $ | 54,664,463 | | | $ | – | | | $ | 54,664,463 | |
Short Term Investments | | | 87,132 | | | | – | | | | – | | | | 87,132 | |
Total Assets | | $ | 87,132 | | | $ | 54,664,463 | | | $ | – | | | $ | 54,751,595 | |
| | | | | | | | | | | | | | | | | |
Liabilities | | | | | | | | | | | | | | | | |
Options Written | | $ | – | | | $ | 431,600 | | | $ | – | | | $ | 431,600 | |
Total Liabilities | | $ | – | | | $ | 431,600 | | | $ | – | | | $ | 431,600 | |
259
Notes to Financial Statements (Unaudited) (Continued)
UAUG | | | | | | | | | | | | | | | | |
| | | Level 1 | | | Level 2 | | | Level 3 | | | Total | |
Assets | | | | | | | | | | | | | | | | |
Purchased Options | | $ | – | | | $ | 128,909,528 | | | $ | – | | | $ | 128,909,528 | |
Short Term Investments | | | 281,268 | | | | – | | | | – | | | | 281,268 | |
Total Assets | | $ | 281,268 | | | $ | 128,909,528 | | | $ | – | | | $ | 129,190,796 | |
| | | | | | | | | | | | | | | | | |
Liabilities | | | | | | | | | | | | | | | | |
Options Written | | $ | – | | | $ | 241,566 | | | $ | – | | | $ | 241,566 | |
Total Liabilities | | $ | – | | | $ | 241,566 | | | $ | – | | | $ | 241,566 | |
| | | | | | | | | | | | | | | | | |
USEP | | | | | | | | | | | | | | | | |
| | | Level 1 | | | Level 2 | | | Level 3 | | | Total | |
Assets | | | | | | | | | | | | | | | | |
Purchased Options | | $ | – | | | $ | 109,429,803 | | | $ | – | | | $ | 109,429,803 | |
Short Term Investments | | | 280,442 | | | | – | | | | – | | | | 280,442 | |
Total Assets | | $ | 280,442 | | | $ | 109,429,803 | | | $ | – | | | $ | 109,710,245 | |
| | | | | | | | | | | | | | | | | |
Liabilities | | | | | | | | | | | | | | | | |
Options Written | | $ | – | | | $ | 901,275 | | | $ | – | | | $ | 901,275 | |
Total Liabilities | | $ | – | | | $ | 901,275 | | | $ | – | | | $ | 901,275 | |
| | | | | | | | | | | | | | | | | |
UOCT | | | | | | | | | | | | | | | | |
| | | Level 1 | | | Level 2 | | | Level 3 | | | Total | |
Assets | | | | | | | | | | | | | | | | |
Purchased Options | | $ | – | | | $ | 99,632,697 | | | $ | – | | | $ | 99,632,697 | |
Short Term Investments | | | 211,858 | | | | – | | | | – | | | | 211,858 | |
Total Assets | | $ | 211,858 | | | $ | 99,632,697 | | | $ | – | | | $ | 99,844,555 | |
| | | | | | | | | | | | | | | | | |
Liabilities | | | | | | | | | | | | | | | | |
Options Written | | $ | – | | | $ | 5,010,763 | | | $ | – | | | $ | 5,010,763 | |
Total Liabilities | | $ | – | | | $ | 5,010,763 | | | $ | – | | | $ | 5,010,763 | |
UNOV | | | | | | | | | | | | | | | | |
| | | Level 1 | | | Level 2 | | | Level 3 | | | Total | |
Assets | | | | | | | | | | | | | | | | |
Purchased Options | | $ | – | | | $ | 51,541,184 | | | $ | – | | | $ | 51,541,184 | |
Short Term Investments | | | 123,848 | | | | – | | | | – | | | | 123,848 | |
Total Assets | | $ | 123,848 | | | $ | 51,541,184 | | | $ | – | | | $ | 51,665,032 | |
| | | | | | | | | | | | | | | | | |
Liabilities | | | | | | | | | | | | | | | | |
Options Written | | $ | – | | | $ | 918,707 | | | $ | – | | | $ | 918,707 | |
Total Liabilities | | $ | – | | | $ | 918,707 | | | $ | – | | | $ | 918,707 | |
| | | | | | | | | | | | | | | | | |
UDEC | | | | | | | | | | | | | | | | |
| | | Level 1 | | | Level 2 | | | Level 3 | | | Total | |
Assets | | | | | | | | | | | | | | | | |
Purchased Options | | $ | – | | | $ | 103,437,344 | | | $ | – | | | $ | 103,437,344 | |
Short Term Investments | | | 276,812 | | | | – | | | | – | | | | 276,812 | |
Total Assets | | $ | 276,812 | | | $ | 103,437,344 | | | $ | – | | | $ | 103,714,156 | |
| | | | | | | | | | | | | | | | | |
Liabilities | | | | | | | | | | | | | | | | |
Options Written | | $ | – | | | $ | 1,205,746 | | | $ | – | | | $ | 1,205,746 | |
Total Liabilities | | $ | – | | | $ | 1,205,746 | | | $ | – | | | $ | 1,205,746 | |
260
Notes to Financial Statements (Unaudited) (Continued)
APRD | | | | | | | | | | | | | | | | |
| | | Level 1 | | | Level 2 | | | Level 3 | | | Total | |
Assets | | | | | | | | | | | | | | | | |
Purchased Options | | $ | - | | | $ | 891,090 | | | $ | - | | | $ | 891,090 | |
Short Term Investments | | | 2,984 | | | | 3,231,569 | | | | - | | | | 3,234,553 | |
Total Assets | | $ | 2,984 | | | $ | 4,122,659 | | | $ | - | | | $ | 4,125,643 | |
| | | | | | | | | | | | | | | | | |
Liabilities | | | | | | | | | | | | | | | | |
Options Written | | $ | - | | | $ | 1,038,052 | | | $ | - | | | $ | 1,038,052 | |
Total Liabilities | | $ | - | | | $ | 1,038,052 | | | $ | - | | | $ | 1,038,052 | |
| | | | | | | | | | | | | | | | | |
APRH | | | | | | | | | | | | | | | | |
| | | Level 1 | | | Level 2 | | | Level 3 | | | Total | |
Assets | | | | | | | | | | | | | | | | |
Purchased Options | | $ | - | | | $ | 4,531,741 | | | $ | - | | | $ | 4,531,741 | |
Short Term Investments | | | 15,105 | | | | 14,673,026 | | | | - | | | | 14,688,131 | |
Total Assets | | $ | 15,105 | | | $ | 19,204,767 | | | $ | - | | | $ | 19,219,872 | |
| | | | | | | | | | | | | | | | | |
Liabilities | | | | | | | | | | | | | | | | |
Options Written | | $ | - | | | $ | 5,054,785 | | | $ | - | | | $ | 5,054,785 | |
Total Liabilities �� | | $ | - | | | $ | 5,054,785 | | | $ | - | | | $ | 5,054,785 | |
| | | | | | | | | | | | | | | | | |
APRJ | | | | | | | | | | | | | | | | |
| | | Level 1 | | | Level 2 | | | Level 3 | | | Total | |
Assets | | | | | | | | | | | | | | | | |
Purchased Options | | $ | - | | | $ | 6,975,114 | | | $ | - | | | $ | 6,975,114 | |
Short Term Investments | | | 35,541 | | | | 27,071,386 | | | | - | | | | 27,106,927 | |
Total Assets | | $ | 35,541 | | | $ | 34,046,500 | | | $ | - | | | $ | 34,082,041 | |
| | | | | | | | | | | | | | | | | |
Liabilities | | | | | | | | | | | | | | | | |
Options Written | | $ | - | | | $ | 7,643,795 | | | $ | - | | | $ | 7,643,795 | |
Total Liabilities | | $ | - | | | $ | 7,643,795 | | | $ | - | | | $ | 7,643,795 | |
| | | | | | | | | | | | | | | | | |
APRQ | | | | | | | | | | | | | | | | |
| | | Level 1 | | | Level 2 | | | Level 3 | | | Total | |
Assets | | | | | | | | | | | | | | | | |
Purchased Options | | $ | - | | | $ | 4,932,456 | | | $ | - | | | $ | 4,932,456 | |
Short Term Investments | | | 37,953 | | | | 24,935,071 | | | | - | | | | 24,973,024 | |
Total Assets | | $ | 37,953 | | | $ | 29,867,527 | | | $ | - | | | $ | 29,905,480 | |
| | | | | | | | | | | | | | | | | |
Liabilities | | | | | | | | | | | | | | | | |
Options Written | | $ | - | | | $ | 5,337,546 | | | $ | - | | | $ | 5,337,546 | |
Total Liabilities | | $ | - | | | $ | 5,337,546 | | | $ | - | | | $ | 5,337,546 | |
261
Notes to Financial Statements (Unaudited) (Continued)
There were no Level 3 investments for the Funds during the period ended April 30, 2023.
Option Contracts:
In general, an option contract is an agreement between a buyer and seller that gives the purchaser of the option the right to buy or sell a particular asset at a specified future date at an agreed upon price (commonly known as the “strike price”).
The Funds invest primarily in FLEX Option contracts. FLEX Options are customized option contracts that trade on an exchange but provide investors with the ability to customize key contract terms like strike price, style and expiration date while achieving price discovery in competitive, transparent auctions markets and avoiding the counterparty exposure of over-the-counter options positions. Like traditional exchange-traded options, FLEX Options are guaranteed for settlement by the OCC, a market clearinghouse that guarantees performance by counterparties to certain derivatives contracts. The FLEX Options in which the Funds will invest are all European style options (options that are exercisable only on the expiration date). The FLEX Options are listed on the Chicago Board Options Exchange.
The Funds will purchase and sell call and put FLEX Options. In general, put options give the holder (i.e., the buyer) the right to sell an asset (or deliver the cash value of the index, in case of an index put option) and the seller (i.e., the writer) of the put has the obligation to buy the asset (or receive cash value of the index, in case of an index put option) at a certain defined price. Call options give the holder (i.e., the buyer) the right to buy an asset (or receive cash value of the index, in case of an index call option) and the seller (i.e., the writer) the obligation to sell the asset (or deliver cash value of the index, in case of an index call option) at a certain defined price.
262
Notes to Financial Statements (Unaudited) (Continued)
When the Funds purchase an option, an amount equal to the premium paid by the Funds are recorded as an investment and is subsequently adjusted to the current value of the option purchased. If an option expires on the stipulated expiration date or if the Funds enter into a closing sale transaction, a gain or loss is realized. If a call option is exercised, the cost of the security acquired is increased by the premium paid for the call. If a put option is exercised, a gain or loss is realized from the sale of the underlying security, and the proceeds from such sale are decreased by the premium originally paid. Purchased options are non-income producing securities.
When the Funds write an option, an amount equal to the premium received by the Funds are recorded as a liability and is subsequently adjusted to the current value of the option written. Premiums received from writing options that expire unexercised are treated by the Funds on the expiration date as realized gain from written options. The difference between the premium and the amount paid on effecting a closing purchase transaction, including brokerage commissions, is also treated as a realized gain, or if the premium is less than the amount paid for the closing purchase transaction, as a realized loss. If a call option is exercised, the premium is added to the proceeds from the sale of the underlying security in determining whether the Funds have realized a gain or loss. If a put option is exercised, the premium reduces the cost basis of the securities purchased by the Funds. The Funds, as writers of an option, bear the market risk of an unfavorable change in the price of the security underlying the written option.
All of the FLEX Option contracts held by the Funds are fully funded and cash settled, therefore balance sheet offsetting under U.S. GAAP does not apply.
The Funds bear the risk that the OCC will be unable or unwilling to perform its obligations under the FLEX Options contracts. In the unlikely event that the OCC becomes insolvent or is otherwise unable to meet its settlement obligations, the Funds could suffer significant losses. Additionally, FLEX Options may be less liquid than certain other securities such as standardized options. In less liquid market for the FLEX Options, the Funds may have difficulty closing out certain FLEX Options positions at desired times and prices. The Funds may experience substantial downside from specific FLEX Option positions and certain FLEX Option positions may expire worthless. The value of the underlying FLEX Options will be affected by, among others, changes in the value of the exchange, changes in interest rates, changes in the actual and implied volatility of the Index and the remaining time to until the FLEX Options expire. The value of the FLEX Options does not increase or decrease at the same rate as the level of the Index (although they generally move in the same direction). However, as a FLEX Option approaches its expiration date, its value typically increasingly moves with the value of the Index.
263
Notes to Financial Statements (Unaudited) (Continued)
The value of derivative instruments on the Statements of Assets and Liabilities for the Funds as of April 30, 2023 are as follows:
| | | Equity Risk - Call and Put Options not Accounted for as Hedging Instruments | |
| | | Asset Derivatives | | | Liability Derivatives | |
| | | Investments, at value | | | Options written, at value | |
BJA | | $ | 184,383,225 | | | $ | 4,291,488 | |
BFEB | | | 124,563,026 | | | | 3,994,088 | |
BMAR | | | 104,849,591 | | | | 3,723,425 | |
BAPR | | | 171,302,088 | | | | 6,785,151 | |
BMAY | | | 127,781,004 | | | | 5,735,340 | |
BJUN | | | 143,939,109 | | | | 238,533 | |
BJUL | | | 146,624,699 | | | | 318,417 | |
BAUG | | | 125,163,328 | | | | 1,124,363 | |
BSEP | | | 171,888,664 | | | | 1,633,790 | |
BOCT | | | 151,959,775 | | | | 1,982,518 | |
BNOV | | | 137,060,049 | | | | 1,932,862 | |
BDEC | | | 112,728,023 | | | | 2,446,210 | |
PJAN | | | 699,273,696 | | | | 22,990,688 | |
PFEB | | | 648,913,356 | | | | 22,748,841 | |
PMAR | | | 467,138,541 | | | | 20,054,100 | |
PAPR | | | 686,720,615 | | | | 28,460,282 | |
PMAY | | | 518,876,990 | | | | 23,323,830 | |
PJUN | | | 362,870,014 | | | | 259,409 | |
PJUL | | | 416,829,860 | | | | 1,402,573 | |
PAUG | | | 526,485,423 | | | | 2,714,403 | |
PSEP | | | 652,661,779 | | | | 5,639,960 | |
POCT | | | 519,234,671 | | | | 17,781,570 | |
PNOV | | | 804,576,001 | | | | 12,921,600 | |
PDEC | | | 725,136,300 | | | | 12,754,896 | |
UJAN | | | 156,347,905 | | | | 5,375,165 | |
UFEB | | | 93,534,883 | | | | 2,465,354 | |
UMAR | | | 75,155,805 | | | | 2,763,470 | |
UAPR | | | 157,660,028 | | | | 4,856,689 | |
UMAY | | | 100,491,290 | | | | 3,226,492 | |
UJUN | | | 90,204,154 | | | | 17,732 | |
UJUL | | | 54,664,463 | | | | 431,600 | |
UAUG | | | 128,909,528 | | | | 241,566 | |
USEP | | | 109,429,803 | | | | 901,275 | |
UOCT | | | 99,632,697 | | | | 5,010,763 | |
UNOV | | | 51,541,184 | | | | 918,707 | |
UDEC | | | 103,437,344 | | | | 1,205,746 | |
APRD | | | 891,090 | | | | 1,038,052 | |
APRH | | | 4,531,741 | | | | 5,054,785 | |
APRJ | | | 6,975,114 | | | | 7,643,795 | |
APRQ �� | | | 4,932,456 | | | | 5,337,546 | |
264
Notes to Financial Statements (Unaudited) (Continued)
The effect of derivative instruments on the Statements of Operations for the period ended April 30, 2023:
| | | Equity Risk - Call and Put Options not Accounted for as Hedging Instruments | |
| | | Amount of Realized Gain/(Loss) on Derivatives Recognized in Income | |
| | | Investments | | | Investments in-kind | | | Options written | | | Options written in-kind | |
BJAN | | $ | (17,511,673 | ) | | $ | 9,901,579 | | | $ | (6,608,061 | ) | | $ | 335,450 | |
BFEB | | | (5,898,515 | ) | | | 407,783 | | | | 2,554,773 | | | | 2,170,546 | |
BMAR | | | (5,886,095 | ) | | | 191,845 | | | | 2,840,803 | | | | 3,009,954 | |
BAPR | | | (13,825,537 | ) | | | 6,350,693 | | | | 4,462,436 | | | | 3,452,908 | |
BMAY | | | (10,475,878 | ) | | | (63,807 | ) | | | 4,142,809 | | | | 8,189,399 | |
BJUN | | | (124,455 | ) | | | (90,631 | ) | | | (4,771 | ) | | | 309,576 | |
BJUL | | | (246,566 | ) | | | 3,753,759 | | | | 156,204 | | | | 3,111,125 | |
BAUG | | | (312,585 | ) | | | (117,716 | ) | | | 47,978 | | | | 205,623 | |
BSEP | | | (287,903 | ) | | | 252,481 | | | | 14,345 | | | | 448,101 | |
BOCT | | | (630,501 | ) | | | 6,845,041 | | | | 60,762 | | | | 4,876,439 | |
BNOV | | | (261,337 | ) | | | 698,460 | | | | (8,814 | ) | | | 488,246 | |
BDEC | | | (6,799,239 | ) | | | 2,858,339 | | | | 911,776 | | | | 3,205,219 | |
PJAN | | | (45,845,422 | ) | | | 24,281,556 | | | | (1,844,114 | ) | | | 9,870,710 | |
PFEB | | | (18,111,524 | ) | | | 3,091,907 | | | | 8,047,253 | | | | 9,421,315 | |
PMAR | | | (17,330,706 | ) | | | 2,144,994 | | | | 145,447 | | | | 16,891,096 | |
PAPR | | | (33,727,147 | ) | | | 16,781,034 | | | | 1,097,760 | | | | 19,475,105 | |
PMAY | | | (31,561,883 | ) | | | 4,435,756 | | | | 9,612,032 | | | | 17,694,763 | |
PJUN | | | (1,090,233 | ) | | | 2,345,281 | | | | (23,984 | ) | | | 2,860,837 | |
PJUL | | | (1,425,789 | ) | | | 5,830,508 | | | | 95,489 | | | | 8,086,291 | |
PAUG | | | (2,812,346 | ) | | | 2,241,942 | | | | (18,893 | ) | | | 1,953,794 | |
PSEP | | | (959,406 | ) | | | 3,931,573 | | | | 5,380 | | | | 3,159,345 | |
POCT | | | (904,903 | ) | | | 15,876,684 | | | | (310,167 | ) | | | 7,360,366 | |
PNOV | | | (457,554 | ) | | | 3,487,442 | | | | 81,641 | | | | 2,578,915 | |
PDEC | | | (20,912,318 | ) | | | 5,432,698 | | | | 7,941,179 | | | | 9,078,337 | |
UJAN | | | (23,323,106 | ) | | | 11,933,880 | | | | 1,925,304 | | | | 6,159,374 | |
UFEB | | | (4,744,273 | ) | | | (50,960 | ) | | | 413,656 | | | | 1,852,997 | |
UMAR | | | (6,109,840 | ) | | | 458,724 | | | | (55,547 | ) | | | 2,482,364 | |
UAPR | | | (4,355,230 | ) | | | 1,069,908 | | | | 17,500 | | | | 4,369,213 | |
UMAY | | | (4,812,414 | ) | | | 4,349,259 | | | | 966,040 | | | | 3,233,229 | |
UJUN | | | (1,530,323 | ) | | | 1,579,700 | | | | 164,908 | | | | 1,150,253 | |
UJUL | | | (90,507 | ) | | | 998,982 | | | | 16,956 | | | | 780,387 | |
UAUG | | | (173,698 | ) | | | 1,317,788 | | | | (1,793 | ) | | | 717,597 | |
USEP | | | (436,162 | ) | | | 5,066,273 | | | | (62,601 | ) | | | 1,713,194 | |
UOCT | | | 470,905 | | | | 1,014,708 | | | | (318,903 | ) | | | 279,863 | |
UNOV | | | (106,784 | ) | | | 1,028,614 | | | | (3,819 | ) | | | 490,749 | |
UDEC | | | (4,716,976 | ) | | | 1,350,873 | | | | 831,952 | | | | 2,432,269 | |
APRD | | | - | | | | - | | | | - | | | | - | |
APRH | | | - | | | | - | | | | - | | | | - | |
APRJ | | | - | | | | - | | | | - | | | | - | |
APRQ | | | - | | | | - | | | | - | | | | - | |
265
Notes to Financial Statements (Unaudited) (Continued)
| | | Equity Risk - Call and Put Options not Accounted for as Hedging Instruments | |
| | | Change in Unrealized Appreciation/(Depreciation) on Derivatives Recognized in Income | |
| | | Investments | | | Options written | |
BJAN | | $ | 16,608,009 | | | $ | 9,729,224 | |
BFEB | | | 7,308,488 | | | | 1,410,793 | |
BMAR | | | 9,378,622 | | | | (697,506 | ) |
BAPR | | | 10,077,633 | | | | 2,344,822 | |
BMAY | | | 8,898,579 | | | | (4,412,084 | ) |
BJUN | | | (253,191 | ) | | | 4,565,878 | |
BJUL | | | 2,038,113 | | | | 4,207,682 | |
BAUG | | | 1,444,359 | | | | 5,545,397 | |
BSEP | | | 3,786,245 | | | | 8,164,760 | |
BOCT | | | 1,410,488 | | | | 5,837,771 | |
BNOV | | | 4,221,410 | | | | 6,078,796 | |
BDEC | | | 3,948,985 | | | | 3,514,189 | |
PJAN | | | 54,427,898 | | | | 6,179,568 | |
PFEB | | | 22,268,497 | | | | (1,969,045 | ) |
PMAR | | | 31,332,155 | | | | (8,871,379 | ) |
PAPR | | | 25,143,149 | | | | (3,580,048 | ) |
PMAY | | | 21,663,742 | | | | (13,711,922 | ) |
PJUN | | | (1,375,330 | ) | | | 12,117,455 | |
PJUL | | | 9,986,642 | | | | 14,663,050 | |
PAUG | | | 5,307,445 | | | | 19,969,753 | |
PSEP | | | 11,994,938 | | | | 25,948,835 | |
POCT | | | 9,983,602 | | | | 17,862,904 | |
PNOV | | | 23,040,940 | | | | 33,785,571 | |
PDEC | | | 18,912,221 | | | | 14,206,184 | |
UJAN | | | 22,799,276 | | | | (6,733,863 | ) |
UFEB | | | 6,105,420 | | | | (1,540,734 | ) |
UMAR | | | 7,737,870 | | | | (2,598,769 | ) |
UAPR | | | 4,755,579 | | | | (2,921,895 | ) |
UMAY | | | 2,326,420 | | | | (2,903,700 | ) |
UJUN | | | 2,304,017 | | | | 478,731 | |
UJUL | | | 1,732,375 | | | | 1,420,063 | |
UAUG | | | 1,682,649 | | | | 1,833,873 | |
USEP | | | 373,742 | | | | 2,236,945 | |
UOCT | | | 4,043,042 | | | | 2,387,309 | |
UNOV | | | 1,741,949 | | | | 1,245,125 | |
UDEC | | | 4,954,246 | | | | (693,842 | ) |
APRD (a) | | | (91,001 | ) | | | 103,718 | |
APRH (a) | | | (481,200 | ) | | | 527,889 | |
APRJ (a) | | | (1,016,032 | ) | | | 1,054,453 | |
APRQ (a) | | | (787,162 | ) | | | 823,192 | |
| | (a) | Amount is included in the change in unrealized appreciation/(depreciation) on investments on the statement of operations. |
266
Notes to Financial Statements (Unaudited) (Continued)
The average volume of derivative activity during the period ended April 30, 2023, is as follows:
| | | Purchased Options | | | Options Written | |
| | | Average Monthly Market Value | | | Average Monthly Market Value | |
BJAN | | $ | 171,634,954 | | | $ | (6,535,488 | ) |
BFEB | | | 95,549,155 | | | | (3,929,103 | ) |
BMAR | | | 86,265,343 | | | | (2,992,718 | ) |
BAPR | | | 132,496,680 | | | | (5,888,930 | ) |
BMAY | | | 144,237,189 | | | | (3,369,149 | ) |
BJUN | | | 110,210,607 | | | | (1,822,560 | ) |
BJUL | | | 161,567,137 | | | | (2,674,657 | ) |
BAUG | | | 115,959,426 | | | | (3,071,187 | ) |
BSEP | | | 174,719,695 | | | | (4,530,848 | ) |
BOCT | | | 211,722,459 | | | | (6,337,842 | ) |
BNOV | | | 139,784,811 | | | | (4,170,053 | ) |
BDEC | | | 105,920,573 | | | | (4,063,744 | ) |
PJAN | | | 617,359,522 | | | | (22,905,822 | ) |
PFEB | | | 441,275,389 | | | | (15,508,352 | ) |
PMAR | | | 329,226,117 | | | | (10,789,579 | ) |
PAPR | | | 393,765,419 | | | | (12,222,965 | ) |
PMAY | | | 428,044,475 | | | | (7,219,358 | ) |
PJUN | | | 367,879,184 | | | | (4,571,861 | ) |
PJUL | | | 488,103,203 | | | | (9,495,163 | ) |
PAUG | | | 493,037,408 | | | | (9,365,448 | ) |
PSEP | | | 632,979,969 | | | | (14,760,912 | ) |
POCT | | | 632,463,087 | | | | (29,796,440 | ) |
PNOV | | | 830,475,714 | | | | (25,771,439 | ) |
PDEC | | | 626,330,658 | | | | (19,275,489 | ) |
UJAN | | | 193,292,531 | | | | (5,508,224 | ) |
UFEB | | | 77,313,885 | | | | (1,548,920 | ) |
UMAR | | | 82,733,359 | | | | (1,668,158 | ) |
UAPR | | | 148,703,650 | | | | (1,795,447 | ) |
UMAY | | | 93,304,747 | | | | (831,549 | ) |
UJUN | | | 93,551,342 | | | | (526,216 | ) |
UJUL | | | 64,042,160 | | | | (1,399,086 | ) |
UAUG | | | 109,035,656 | | | | (965,315 | ) |
USEP | | | 134,151,586 | | | | (2,637,615 | ) |
UOCT | | | 108,688,461 | | | | (6,140,772 | ) |
UNOV | | | 62,876,122 | | | | (1,777,252 | ) |
UDEC | | | 93,634,792 | | | | (1,751,702 | ) |
APRD | | | 654,480 | | | | (761,975 | ) |
APRH | | | 2,496,750 | | | | (2,784,051 | ) |
APRJ | | | 3,677,727 | | | | (4,029,426 | ) |
APRQ | | | 2,607,228 | | | | (2,820,983 | ) |
267
Notes to Financial Statements (Unaudited) (Continued)
Use of Estimates:
In preparing financial statements in conformity with U.S. GAAP, management is required to make estimates and assumptions that affect the reported amounts of assets and liabilities and disclosure of contingent assets and liabilities as of the date of the financial statements and the reported amounts of increases and decreases in net assets from operations during the reporting period. Actual results could differ from these estimates.
Guarantees and Indemnifications:
In the normal course of business, the Trust may enter into a contract with service providers that contain general indemnification clauses. The Trust’s maximum exposure under these arrangements is unknown as this would involve future claims against the Trust that have not yet occurred. Based on experience, the Trust expects the risk of loss to be remote.
Tax Information:
The Funds are treated as separate entities for federal income tax purposes. The Funds intend to qualify as regulated investment companies (“RICs”) under Subchapter M of the Internal Revenue Code of 1986, as amended (the “Internal Revenue Code”). To qualify and remain eligible for the special tax treatment accorded to RICs, the Funds must meet certain annual income and quarterly asset diversification requirements and must distribute annually at least 90% of the sum of (i) its investment company taxable income (which includes dividends, interest and net short-term capital gains) and (ii) certain net tax-exempt income, if any. If so qualified, the Funds will not be subject to federal income tax to the extent the Funds distribute substantially all of their net investment income and capital gains to shareholders.
Management evaluates the Funds’ tax positions to determine if the tax positions taken meet the minimum recognition threshold in connection with accounting for uncertainties in income tax positions taken or expected to be taken for the purposes of measuring and recognizing tax liabilities in the financial statements. Tax benefits associated with an uncertain tax position can be recognized only when the position is “more likely than not” to be sustained assuming examination by taxing authorities. Interest and penalties related to income taxes would be recorded as tax expense in the Statements of Operations. During the period ended April 30, 2023, the Funds did not incur any interest or penalties. The Funds’ federal income tax returns are subject to examination by the Internal Revenue Service (IRS) for a period of three fiscal years after they are filed. State and local tax returns may be subject to examination for an additional fiscal year depending on the jurisdiction. As of April 30, 2023, the Funds did not have a liability for any unrecognized tax benefits. As of April 30, 2023, the Funds have no examinations in progress and management is not aware of any tax positions for which it is reasonably possible that the amounts of unrecognized tax benefits will significantly change in the next twelve months. The Funds are subject to examination by U.S. Federal tax authorities for all tax years since inception.
Notes to Financial Statements (Unaudited) (Continued)
U.S. GAAP requires that certain components of net assets be reclassified between distributable earnings/(accumulated deficit) and additional paid-in capital. These reclassifications have no effect on net assets or net asset value per share. For the year ended October 31, 2022, the Funds made the following permanent book-to-tax reclassifications due to deemed distributions, net operating losses, and redemption in-kind transactions:
| | | Distributable Earnings/ (Accumulated Deficit) | | | Paid-In Capital | |
BJAN | | $ | (40,359,803 | ) | | $ | 40,359,803 | |
BFEB | | | (10,628,062 | ) | | | 10,628,062 | |
BMAR | | | (10,694,631 | ) | | | 10,694,631 | |
BAPR | | | (14,851,474 | ) | | | 14,851,474 | |
BMAY | | | (7,854,475 | ) | | | 7,854,475 | |
BJUN | | | (3,995,240 | ) | | | 3,995,240 | |
BJUL | | | (8,562,248 | ) | | | 8,562,248 | |
BAUG | | | (3,882,987 | ) | | | 3,882,987 | |
BSEP | | | (5,032,006 | ) | | | 5,032,006 | |
BOCT | | | (6,842,709 | ) | | | 6,842,709 | |
BNOV | | | (4,551,039 | ) | | | 4,551,039 | |
BDEC | | | (644,711 | ) | | | 644,711 | |
PJAN | | | (84,520,389 | ) | | | 84,520,389 | |
PFEB | | | (26,838,024 | ) | | | 26,838,024 | |
PMAR | | | (20,382,706 | ) | | | 20,382,706 | |
PAPR | | | (27,265,785 | ) | | | 27,265,785 | |
PMAY | | | (22,951,297 | ) | | | 22,951,297 | |
PJUN | | | (9,103,635 | ) | | | 9,103,635 | |
PJUL | | | (19,096,521 | ) | | | 19,096,521 | |
PAUG | | | (11,555,712 | ) | | | 11,555,712 | |
PSEP | | | (11,044,495 | ) | | | 11,044,495 | |
POCT | | | (25,095,030 | ) | | | 25,095,030 | |
PNOV | | | (12,881,183 | ) | | | 12,881,183 | |
PDEC | | | (983,489 | ) | | | 983,489 | |
UJAN | | | (31,018,328 | ) | | | 31,018,328 | |
UFEB | | | (4,926,720 | ) | | | 4,926,720 | |
UMAR | | | (4,957,353 | ) | | | 4,957,353 | |
UAPR | | | (4,919,223 | ) | | | 4,919,223 | |
UMAY | | | (2,990,120 | ) | | | 2,990,120 | |
UJUN | | | (1,241,885 | ) | | | 1,241,885 | |
UJUL | | | (2,589,870 | ) | | | 2,589,870 | |
UAUG | | | (1,424,101 | ) | | | 1,424,101 | |
USEP | | | (1,768,784 | ) | | | 1,768,784 | |
UOCT | | | (7,576,998 | ) | | | 7,576,998 | |
UNOV | | | (3,709,410 | ) | | | 3,709,410 | |
UDEC | | | (140,004 | ) | | | 140,004 | |
269
Notes to Financial Statements (Unaudited) (Continued)
Distributions to Shareholders:
Distributions to shareholders are recorded on the ex-dividend date. The Funds intend to pay out dividends from their net investment income, if any, annually. Distributions of net realized capital gains, if any, will be declared and paid at least annually by the Funds. The Funds may periodically make reclassifications among certain of its capital accounts as a result of the recognition and characterization of certain income and capital gain distributions determined annually in accordance with federal tax regulations which may differ from U.S. GAAP. Distributions that exceed earnings and profits for tax purposes are reported as return of capital.
Investment Transactions and Investment Income:
Investment transactions are recorded on the trade date. The Trust determines the gain or loss realized from investment transactions on the basis of identified cost. Dividend income, if any, is recognized on the ex-dividend date. Interest income, including accretion of discounts and amortization of premiums is recognized on an accrual basis using the effective yield method.
3. | INVESTMENT ADVISOR AND OTHER AFFILIATES |
Innovator Capital Management, LLC (the “Adviser”) acts as investment adviser to the Funds pursuant to an investment advisory agreement between the Trust and the Adviser with respect to the Funds (“Advisory Agreement”) and, pursuant to the Advisory Agreement, is responsible for the day-to-day management of the Funds.
Pursuant to the Advisory Agreement, each respective Fund pays monthly the Adviser a unitary fee calculated daily based on the average daily net assets of the Fund at the annual rate of 0.79%. During the term of the Advisory Agreement, the Adviser pays all expenses of the Funds, including the cost of transfer agency, custody, fund administration, legal, audit, and other services and license fees, except for the fees paid under the Advisory Agreement, interest, taxes, brokerage commissions and other expenses connected with the execution of portfolio transactions, distribution and service fees payable pursuant to a Rule 12b-1 plan, if any, and extraordinary expenses.
270
Notes to Financial Statements (Unaudited) (Continued)
Milliman Financial Risk Management LLC (the “Sub-Adviser”) acts as sub-adviser to the Funds pursuant to a sub-advisory agreement between the Adviser and the Sub-Adviser with respect to the Funds (“Sub-Advisory Agreement”) and, pursuant to the Sub-Advisory Agreement, is responsible for execution of the Sub-Adviser’s strategy for each of the Funds. The Sub-Adviser is responsible for the day-to-day management of the Funds’ portfolios. Pursuant to the Sub-Advisory Agreement between the Adviser and the Sub-Adviser, the Adviser pays the Sub-Adviser a fee, based on the Funds’ average daily net assets, for the services and facilities it provides payable on a monthly basis.
Certain trustees and officers of the Trust are affiliated with the Adviser. Trustee compensation is paid for by the Adviser.
271
Notes to Financial Statements (Unaudited) (Continued)
4. | INVESTMENT TRANSACTIONS |
For the period ended April 30, 2023, there were no purchases or proceeds from long-term sales of investment securities.
For the period ended April 30, 2023, in-kind transactions associated with creations and redemptions were as follows:
| | | In-Kind | | | In-Kind | |
| | | Creations | | | Redemptions | |
BJAN | | $ | - | | | $ | 36,915,367 | |
BFEB | | | - | | | | 9,565,287 | |
BMAR | | | - | | | | 16,136,981 | |
BAPR | | | - | | | | 21,897,580 | |
BMAY | | | - | | | | 112,944,598 | |
BJUN | | | - | | | | 6,428,938 | |
BJUL | | | - | | | | 53,856,936 | |
BAUG | | | - | | | | 8,183,784 | |
BSEP | | | - | | | | 11,220,244 | |
BOCT | | | - | | | | 103,424,177 | |
BNOV | | | - | | | | 11,198,848 | |
BDEC | | | - | | | | 11,476,706 | |
PJAN | | | - | | | | 114,648,652 | |
PFEB | | | - | | | | 39,902,596 | |
PMAR | | | - | | | | 60,074,569 | |
PAPR | | | - | | | | 58,038,610 | |
PMAY | | | - | | | | 237,349,398 | |
PJUN | | | - | | | | 36,259,599 | |
PJUL | | | - | | | | 151,912,828 | |
PAUG | | | - | | | | 27,637,155 | |
PSEP | | | - | | | | 71,931,622 | |
POCT | | | - | | | | 210,516,295 | |
PNOV | | | - | | | | 59,501,355 | |
PDEC | | | - | | | | 34,002,789 | |
UJAN | | | - | | | | 128,500,444 | |
UFEB | | | - | | | | 9,903,256 | |
UMAR | | | - | | | | 35,185,288 | |
UAPR | | | - | | | | 27,170,962 | |
UMAY | | | - | | | | 62,347,826 | |
UJUN | | | - | | | | 23,948,189 | |
UJUL | | | - | | | | 24,923,025 | |
UAUG | | | - | | | | 14,512,188 | |
USEP | | | - | | | | 59,905,787 | |
UOCT | | | - | | | | 12,777,392 | |
UNOV | | | - | | | | 28,530,029 | |
UDEC | | | - | | | | 42,423,373 | |
APRD | | | - | | | | - | |
APRH | | | - | | | | - | |
APRJ | | | - | | | | - | |
APRQ | | | - | | | | - | |
272
Notes to Financial Statements (Unaudited) (Continued)
5. CREATION AND REDEMPTION TRANSACTIONS
There were an unlimited number of shares of beneficial interest (without par value) authorized by the Trust. Individual shares of the Funds may only be purchased and sold at market prices on the Exchange through a broker-dealer. Such transactions may be subject to customary commission rates imposed by the broker-dealer, and market prices for the Funds’ shares may be at, above or below its NAV depending on the premium or discount at which the Funds’ shares trade.
The Funds issue and redeem shares on a continuous basis at NAV only in blocks of 25,000 shares, called “Creation Units.” Creation Units are issued and redeemed principally for cash. Once created, shares generally trade in the secondary market at market prices that change throughout the day in amounts less than a Creation Unit. Except when aggregated in Creation Units, shares are not redeemable securities of the Funds. Shares of the Funds may only be purchased or redeemed by certain financial institutions (“Authorized Participants”). An Authorized Participant is either (i) a broker-dealer or other participant in the clearing process through the Continuous Net Settlement System of the National Securities Clearing Corporation or (ii) a DTC participant and, in each case, must have executed a Participant Agreement with the Distributor. A transaction fee is applicable to each transaction regardless of the number of units purchased or sold in the transaction. Each Fund, subject to approval by the Board of Trustees, may adjust transaction fees from time to time based upon actual experience. Additional charges received by the Funds, if any, are disclosed as Transaction Fees on the Statements of Changes in Net Assets. Most retail investors do not qualify as Authorized Participants nor have the resources to buy and sell whole Creation Units. Therefore, they are unable to purchase or redeem the shares directly from the Funds. Rather, most retail investors may purchase shares in the secondary market with the assistance of a broker and are subject to customary brokerage commissions or fees.
273
Notes to Financial Statements (Unaudited) (Continued)
6. | FEDERAL INCOME TAX INFORMATION |
At October 31, 2022, the cost of investments including options written and net unrealized appreciation/(depreciation) for federal income tax purposes were as follows:
| | | Cost of Portfolio | | | Gross Unrealized Appreciation | | | Gross Unrealized Depreciation | | | Net Unrealized Appreciation / (Depreciation) | |
BJAN | | $ | 155,956,541 | | | $ | 18,541,277 | | | $ | (31,767,792 | ) | | $ | (13,226,515 | ) |
BFEB | | | 74,769,357 | | | | 4,910,943 | | | | (10,765,474 | ) | | | (5,854,531 | ) |
BMAR | | | 81,389,323 | | | | 3,785,872 | | | | (8,489,608 | ) | | | (4,703,736 | ) |
BAPR | | | 125,744,211 | | | | 9,526,575 | | | | (19,601,661 | ) | | | (10,075,086 | ) |
BMAY | | | 180,485,326 | | | | 4,399,307 | | | | (8,911,310 | ) | | | (4,512,003 | ) |
BJUN | | | 79,577,181 | | | | 1,486,513 | | | | (4,538,705 | ) | | | (3,052,192 | ) |
BJUL | | | 165,243,678 | | | | 9,328,015 | | | | (4,131,591 | ) | | | 5,196,424 | |
BAUG | | | 107,433,952 | | | | 2,448,332 | | | | (7,057,023 | ) | | | (4,608,691 | ) |
BSEP | | | 168,722,257 | | | | 841,155 | | | | (3,399,321 | ) | | | (2,558,166 | ) |
BOCT | | | 216,363,013 | | | | 19,003,350 | | | | (8,939,404 | ) | | | 10,063,946 | |
BNOV | | | 61,629,655 | | | | - | | | | (13,941 | ) | | | (13,941 | ) |
BDEC | | | 107,108,220 | | | | 8,299,575 | | | | (11,619,130 | ) | | | (3,319,555 | ) |
PJAN | | | 466,110,887 | | | | 60,542,393 | | | | (77,556,273 | ) | | | (17,013,880 | ) |
PFEB | | | 248,228,431 | | | | 21,833,683 | | | | (30,489,571 | ) | | | (8,655,888 | ) |
PMAR | | | 234,077,488 | | | | 15,245,854 | | | | (22,880,808 | ) | | | (7,634,954 | ) |
PAPR | | | 322,958,721 | | | | 27,956,494 | | | | (42,141,393 | ) | | | (14,184,899 | ) |
PMAY | | | 401,237,554 | | | | 13,660,379 | | | | (21,715,099 | ) | | | (8,054,720 | ) |
PJUN | | | 351,163,190 | | | | 8,905,627 | | | | (15,510,644 | ) | | | (6,605,017 | ) |
PJUL | | | 496,342,283 | | | | 19,062,749 | | | | (11,266,585 | ) | | | 7,796,164 | |
PAUG | | | 447,598,538 | | | | 13,131,870 | | | | (24,679,871 | ) | | | (11,548,001 | ) |
PSEP | | | 552,645,138 | | | | 3,994,878 | | | | (9,175,599 | ) | | | (5,180,721 | ) |
POCT | | | 629,320,477 | | | | 47,579,909 | | | | (27,074,424 | ) | | | 20,505,485 | |
PNOV | | | 316,903,443 | | | | - | | | | (71,237 | ) | | | (71,237 | ) |
PDEC | | | 212,286,520 | | | | 24,687,748 | | | | (28,909,683 | ) | | | (4,221,935 | ) |
UJAN | | | 291,111,147 | | | | 21,043,957 | | | | (28,298,905 | ) | | | (7,254,948 | ) |
UFEB | | | 56,250,066 | | | | 3,455,930 | | | | (6,313,053 | ) | | | (2,857,123 | ) |
UMAR | | | 72,314,629 | | | | 2,111,841 | | | | (4,987,307 | ) | | | (2,875,466 | ) |
UAPR | | | 123,308,884 | | | | 4,621,086 | | | | (4,962,679 | ) | | | (341,593 | ) |
UMAY | | | 98,880,205 | | | | 2,893,522 | | | | (2,336,573 | ) | | | 556,949 | |
UJUN | | | 114,942,284 | | | | 2,338,070 | | | | (2,345,413 | ) | | | (7,343 | ) |
UJUL | | | 72,574,181 | | | | 2,698,838 | | | | (1,577,274 | ) | | | 1,121,564 | |
UAUG | | | 83,349,222 | | | | 1,542,348 | | | | (2,532,029 | ) | | | (989,681 | ) |
USEP | | | 157,702,963 | | | | 4,396,817 | | | | (3,030,681 | ) | | | 1,366,136 | |
UOCT | | | 110,637,138 | | | | 8,656,408 | | | | (6,002,065 | ) | | | 2,654,343 | |
UNOV | | | 53,016,765 | | | | - | | | | (11,975 | ) | | | (11,975 | ) |
UDEC | | | 48,675,386 | | | | 3,555,647 | | | | (5,889,436 | ) | | | (2,333,789 | ) |
274
Notes to Financial Statements (Unaudited) (Continued)
At October 31, 2022, the components of distributable earnings/(accumulated deficit) on a tax basis were as follows:
| | | Accumulated Capital and Other Losses | | | Undistributed Net Ordinary Income | | | Undistributed Capital Gains | | | Unrealized Appreciation / (Depreciation) on Investments | | | Total Distributable Earnings /(Accumulated Deficit) | |
BJAN | | $ | (29,724,859 | ) | | $ | - | | | $ | - | | | $ | (13,226,515 | ) | | $ | (42,951,374 | ) |
BFEB | | | (3,580,693 | ) | | | - | | | | - | | | | (5,854,531 | ) | | | (9,435,224 | ) |
BMAR | | | (3,275,266 | ) | | | - | | | | - | | | | (4,703,736 | ) | | | (7,979,002 | ) |
BAPR | | | (786,516 | ) | | | - | | | | - | | | | (10,075,086 | ) | | | (10,861,602 | ) |
BMAY | | | (5,612,758 | ) | | | - | | | | - | | | | (4,512,003 | ) | | | (10,124,761 | ) |
BJUN | | | (3,344,552 | ) | | | - | | | | - | | | | (3,052,192 | ) | | | (6,396,744 | ) |
BJUL | | | (6,666,300 | ) | | | - | | | | - | | | | 5,196,424 | | | | (1,469,876 | ) |
BAUG | | | (8,824,887 | ) | | | - | | | | - | | | | (4,608,691 | ) | | | (13,433,578 | ) |
BSEP | | | (10,797,814 | ) | | | - | | | | - | | | | (2,558,166 | ) | | | (13,355,980 | ) |
BOCT | | | (15,030,711 | ) | | | - | | | | - | | | | 10,063,946 | | | | (4,966,765 | ) |
BNOV | | | (11,114,831 | ) | | | - | | | | - | | | | (13,941 | ) | | | (11,128,772 | ) |
BDEC | | | (4,865,374 | ) | | | - | | | | - | | | | (3,319,555 | ) | | | (8,184,929 | ) |
PJAN | | | (73,105,815 | ) | | | - | | | | - | | | | (17,013,880 | ) | | | (90,119,695 | ) |
PFEB | | | (14,828,547 | ) | | | - | | | | - | | | | (8,655,888 | ) | | | (23,484,435 | ) |
PMAR | | | (9,873,077 | ) | | | - | | | | - | | | | (7,634,954 | ) | | | (17,508,031 | ) |
PAPR | | | (10,663,460 | ) | | | - | | | | - | | | | (14,184,899 | ) | | | (24,848,359 | ) |
PMAY | | | (18,398,291 | ) | | | - | | | | - | | | | (8,054,720 | ) | | | (26,453,011 | ) |
PJUN | | | (7,321,902 | ) | | | - | | | | - | | | | (6,605,017 | ) | | | (13,926,919 | ) |
PJUL | | | (16,912,696 | ) | | | - | | | | - | | | | 7,796,164 | | | | (9,116,532 | ) |
PAUG | | | (13,464,275 | ) | | | - | | | | - | | | | (11,548,001 | ) | | | (25,012,276 | ) |
PSEP | | | (13,127,617 | ) | | | - | | | | - | | | | (5,180,721 | ) | | | (18,308,338 | ) |
POCT | | | (30,592,375 | ) | | | - | | | | - | | | | 20,505,485 | | | | (10,086,890 | ) |
PNOV | | | (17,932,509 | ) | | | - | | | | - | | | | (71,237 | ) | | | (18,003,746 | ) |
PDEC | | | (4,759,413 | ) | | | - | | | | - | | | | (4,221,935 | ) | | | (8,981,348 | ) |
UJAN | | | (28,146,655 | ) | | | - | | | | - | | | | (7,254,948 | ) | | | (35,401,603 | ) |
UFEB | | | (2,711,782 | ) | | | - | | | | - | | | | (2,857,123 | ) | | | (5,568,905 | ) |
UMAR | | | (1,880,187 | ) | | | - | | | | - | | | | (2,875,466 | ) | | | (4,755,653 | ) |
UAPR | | | (3,967,474 | ) | | | - | | | | - | | | | (341,593 | ) | | | (4,309,068 | ) |
UMAY | | | (3,693,077 | ) | | | - | | | | - | | | | 556,949 | | | | (3,136,128 | ) |
UJUN | | | (1,169,517 | ) | | | - | | | | - | | | | (7,343 | ) | | | (1,176,860 | ) |
UJUL | | | (4,263,123 | ) | | | - | | | | - | | | | 1,121,564 | | | | (3,141,559 | ) |
UAUG | | | (3,153,904 | ) | | | - | | | | - | | | | (989,681 | ) | | | (4,143,585 | ) |
USEP | | | (5,204,616 | ) | | | - | | | | - | | | | 1,366,136 | | | | (3,838,480 | ) |
UOCT | | | (10,848,811 | ) | | | - | | | | - | | | | 2,654,343 | | | | (8,194,468 | ) |
UNOV | | | (6,247,184 | ) | | | - | | | | - | | | | (11,975 | ) | | | (6,259,159 | ) |
UDEC | | | (728,655 | ) | | | - | | | | - | | | | (2,333,789 | ) | | | (3,062,444 | ) |
275
Notes to Financial Statements (Unaudited) (Continued)
Certain qualified late year ordinary losses incurred after December 31, and within the current taxable year, are deemed to arise on the first business day of the next taxable year. At October 31, 2022, the Funds deferred the following qualified late year ordinary losses:
| | | Late Year Ordinary Losses | |
BJAN | | $ | 1,199,475 | |
BFEB | | | 680,142 | |
BMAR | | | 521,285 | |
BAPR | | | 786,516 | |
BMAY | | | 850,246 | |
BJUN | | | 476,415 | |
BJUL | | | 719,872 | |
BAUG | | | 704,776 | |
BSEP | | | 933,826 | |
BOCT | | | 704,699 | |
BNOV | | | 474,585 | |
BDEC | | | 586,925 | |
PJAN | | | 3,424,465 | |
PFEB | | | 1,676,791 | |
PMAR | | | 1,363,787 | |
PAPR | | | 1,803,172 | |
PMAY | | | 2,084,701 | |
PJUN | | | 1,564,364 | |
PJUL | | | 1,820,037 | |
PAUG | | | 1,584,478 | |
PSEP | | | 1,970,366 | |
POCT | | | 1,605,914 | |
PNOV | | | 1,279,448 | |
PDEC | | | 1,448,055 | |
UJAN | | | 1,736,708 | |
UFEB | | | 290,725 | |
UMAR | | | 293,938 | |
UAPR | | | 503,744 | |
UMAY | | | 438,513 | |
UJUN | | | 399,287 | |
UJUL | | | 326,643 | |
UAUG | | | 278,960 | |
USEP | | | 453,463 | |
UOCT | | | 483,258 | |
UNOV | | | 286,412 | |
UDEC | | | 297,690 | |
276
Notes to Financial Statements (Unaudited) (Continued)
At October 31, 2022, for federal income tax purposes, the Funds had capital loss carryforwards available to offset future capital gains for an unlimited period as indicated below:
| | | Indefinite Short-Term | |
BJAN | | $ | 28,525,382 | |
BFEB | | | 2,900,552 | |
BMAR | | | 2,753,982 | |
BAPR | | | - | |
BMAY | | | 4,762,510 | |
BJUN | | | 2,868,137 | |
BJUL | | | 5,946,425 | |
BAUG | | | 8,120,111 | |
BSEP | | | 9,863,987 | |
BOCT | | | 14,326,012 | |
BNOV | | | 10,640,246 | |
BDEC | | | 4,278,448 | |
PJAN | | | 69,681,348 | |
PFEB | | | 13,151,754 | |
PMAR | | | 8,509,289 | |
PAPR | | | 8,860,289 | |
PMAY | | | 16,313,591 | |
PJUN | | | 5,757,539 | |
PJUL | | | 15,092,659 | |
PAUG | | | 11,879,797 | |
PSEP | | | 11,157,251 | |
POCT | | | 28,986,461 | |
PNOV | | | 16,653,060 | |
PDEC | | | 3,311,359 | |
UJAN | | | 26,409,949 | |
UFEB | | | 2,421,058 | |
UMAR | | | 1,586,248 | |
UAPR | | | 3,463,730 | |
UMAY | | | 3,254,565 | |
UJUN | | | 770,230 | |
UJUL | | | 3,936,481 | |
UAUG | | | 2,874,943 | |
USEP | | | 4,751,150 | |
UOCT | | | 10,365,554 | |
UNOV | | | 5,960,773 | |
UDEC | | | 430,966 | |
To the extent that these loss carryforwards are utilized, capital gains so offset will not be distributed to shareholders. During the current tax year ended October 31, 2022, no capital loss carryforwards available were utilized.
The Funds did not pay any distributions during the fiscal years ended October 31, 2022 and October 31, 2021, respectively.
277
Notes to Financial Statements (Unaudited) (Continued)
7. SUBSEQUENT EVENT
Management has evaluated the impact of all subsequent events of the Funds through the date of the financial statements were issued, and has determined that there were no subsequent events requiring recognition or disclosure in the financial statements.
Trustees and Officers (Unaudited)
Name, Address and Year of Birth | Position with the Trust | Length of Time Served* | Principal Occupation(s) During Past 5 Years | Number of Portfolios in Fund Complex(a) Overseen by Trustee or Officer | Other Directorships Held by Trustee or Officer in the Past Five Years |
Independent Trustees |
Mark Berg 109 N. Hale Street, Wheaton, IL 60187 Year of Birth: 1971 | Trustee | Since 2017 | Founding Principal (2001-present), Chief Executive Officer (2019-present), President (2001-2019), Timothy Financial Counsel, Inc. | 95 | Tortazo, LLC (2018-present) |
Joe Stowell 109 N. Hale Street, Wheaton, IL 60187 Year of Birth: 1968 | Trustee | Since 2017 | Chief Operating Officer, Woodmen Valley Chapel (2015-present). | 95 | Board of Advisors, Westmont College (2016-2021). |
Brian J. Wildman 109 N. Hale Street, Wheaton, IL 60187 Year of Birth: 1963 | Trustee | Since 2017 | President, Timothy Financial Counsel, Inc. (2019-present); Executive Vice President, Consumer Banking (2016-2019), Chief Risk Officer (2013-2016), MB Financial Bank. | 95 | Missionary Furlough Homes, Inc. (since 2008); MB Financial Bank (2003-2019). |
Trustees and Officers (Unaudited) (Continued)
Interested Trustee & Officer |
H. Bruce Bond (b) 109 N. Hale Street, Wheaton, IL 60187 Year of Birth: 1963 | Interested Trustee, President and Principal Executive Officer | Since 2017 | Chief Executive Officer, Innovator Capital Management, LLC (2017-present). | 95 | None |
Officers |
John W. Southard, Jr. 109 N. Hale Street, Wheaton, IL 60187 Year of Birth: 1969 | Vice President, Secretary and Assistant Treasurer | Since 2017 | Chief Investment Officer, Innovator Capital Management, LLC (2017-present); Director and Co-Founder, T2 Capital Management, LLC (2010-present). | 95 | Independent Trustee, ETF Managers Group, LLC (2012-2018) |
Kathleen Meyer 109 N. Hale Street Wheaton, IL 60187 Year of Birth: 1964 | Vice President, Treasurer and Principal Financial Accounting Officer | Since 2022 | Chief Financial Officer, Innovator Capital Management, LLC (2018-present) | 95 | None |
Kevin P. Hourihan 3 Canal Plaza 3rd Floor Portland, ME 04101 Year of Birth: 1978 | Chief Compliance Officer and Anti-Money Laundering Officer | Since 2023 | Senior Principal Consultant, Fund Chief Compliance Officer, ACA Global, LLC (since 2022); Chief Compliance Officer, Ashmore Funds (2017-2022); Chief Compliance Officer, Ashmore Investment Management (US) Corp (2014-2022); Chief Compliance Officer, Ashmore Equities Investment Management (2015-2019). | 95 | None |
* | The Funds’ Trustees serve for an indefinite term until their resignation, death or removal. The Funds’ officers are elected annually by the Board and serve at the Board’s pleasure. |
(a) | The Fund Complex includes the Funds, each series of Innovator ETFs Trust. |
(b) | H. Bruce Bond is deemed to be an interested person of the Trust (as defined in the 1940 Act) because of his affiliation with the Adviser. |
The Statement of Additional Information includes additional information about the Trustees and is available upon request, without charge, by calling 1-877-386-3890.
Board Considerations Regarding Approval of Investment Management Agreement (Unaudited)
BOARD CONSIDERATIONS REGARDING APPROVAL OF INVESTMENT MANAGEMENT AGREEMENT AND INVESTMENT SUB-ADVISORY AGREEMENT FOR THE FOLLOWING INNOVATOR FUNDS:
Innovator Premium Income 10 Barrier ETF – April
Innovator Premium Income 20 Barrier ETF – April
Innovator Premium Income 30 Barrier ETF – April
Innovator Premium Income 40 Barrier ETF – April
At a quarterly Board meeting held on June 16, 2022, the Trust’s Board considered approval of the Advisory Agreement with Innovator Capital Management, LLC (the “Adviser”), on behalf of the Innovator Premium Income 10 Barrier ETF - April, Innovator Premium Income 20 Barrier ETF - April, Innovator Premium Income 30 Barrier ETF - April and Innovator Premium Income 40 Barrier ETF - April (the “Funds”), and the Sub-Advisory Agreement among the Trust, on behalf of the Funds, the Adviser and Milliman Financial Risk Management LLC (“Milliman” or the “Sub- Adviser”), for an initial two-year term. The Board determined that the agreements were in the best interests of the Funds in light of the extent and quality of the services expected to be provided and such other matters as the Board considered to be relevant in the exercise of its reasonable business judgment.
To reach this determination, the Board considered its duties under the Investment Company Act of 1940, as amended (the “1940 Act”), as well as under the general principles of state law in reviewing and approving advisory contracts; the requirements of the 1940 Act in such matters; the fiduciary duty of investment advisers with respect to advisory agreements and compensation; the standards used by courts in determining whether investment company boards have fulfilled their duties; and the factors to be considered by the Board in voting on such agreements. To assist the Board in its evaluation of the agreements, the Independent Trustees received a separate report from each of the Adviser and the Sub-Adviser in advance of the Meeting responding to a request for information provided on behalf of the Independent Trustees that, among other things, outlined the services to be provided by the Adviser and the Sub-Adviser to the Funds (including the relevant personnel responsible for these services and their experience); the proposed unitary fee rate payable by each Fund as compared to fees charged to peer groups of the Funds and as compared to fees charged to other clients of the Adviser and the Sub-Adviser, including other ETFs managed by the Adviser and the Sub- Adviser; the estimated expenses of the Funds as compared to expense ratios of the funds in the respective Fund’s peer group; the nature of the expenses to be incurred in providing services to the Funds and the potential for economies of scale, if any; financial data on the Adviser and the Sub- Adviser; any fall-out benefits accruing to the Adviser or the Sub-Adviser; and information on the Adviser’s and the Sub-Adviser’s compliance programs. The Independent Trustees also met separately with their Independent Counsel to discuss the information provided by the Adviser and the Sub-Adviser. The Board applied its business judgment to determine whether the arrangements between the Trust and the Adviser and among the Trust, the Adviser and the Sub-Adviser are reasonable business arrangements from each Fund’s perspective as well as from the perspective of each Fund’s shareholders.
Board Considerations Regarding Approval of Investment Management Agreement (Unaudited) (Continued)
In evaluating whether to approve the agreements, the Board applied its business judgment and considered the nature, extent and quality of the services to be provided by the Adviser and Milliman pursuant to the agreements. With respect to the investment management agreement, the Board considered that the Adviser will be responsible for the overall management and administration of the Funds and reviewed all of the services to be provided by the Adviser to the Funds, including oversight of Milliman, as well as the background and experience of the persons responsible for such services. The Board noted that the Adviser will oversee Milliman’s day-to-day management of each of the Fund’s investments, including portfolio risk monitoring and performance review. In reviewing the services to be provided, the Board noted the compliance program that had been developed by the Adviser included an adequate program for monitoring the Adviser’s, Milliman’s and each Fund’s compliance with the 1940 Act, as well as each Fund’s compliance with its investment objective and policies. With respect to the sub-advisory agreement, the Board reviewed the materials provided by Milliman and noted the background and experience of Milliman’s portfolio management team and Milliman’s investment style. In light of the information presented and the considerations made, the Board concluded that the nature, extent and quality of the services to be provided to the Funds by the Adviser and Milliman under the agreements were expected to be satisfactory.
Since the Funds had yet to commence investment operations, the Board could not consider the historical investment performance of the Funds.
The Board considered the proposed unitary fee rate payable by each Fund under the investment management agreement for the services to be provided. The Board noted that, under the unitary fee arrangement, each Fund would pay the Adviser a unitary fee equal to an annual rate of 0.79% of its average daily net assets. The Board considered that, from the unitary fee for each of the Funds, the Adviser would pay Milliman an annual sub-advisory fee equal to 0.12% on the Fund’s assets under management.
Board Considerations Regarding Approval of Investment Management Agreement (Unaudited) (Continued)
The Board noted that the Adviser would be responsible for the Funds’ expenses, including the cost of transfer agency, custody, fund administration, legal, audit and other services and license fees (if any), but excluding the fee payment under the investment management agreement, interest, taxes, brokerage commissions and other expenses connected with the execution of portfolio transactions, and extraordinary expenses. The Board received and reviewed information for the Funds showing the advisory fee rates and expense ratios of the funds comprising of each Fund’s peer group, as well as advisory fee rates charged by the Adviser and Milliman to other funds (including ETFs) and non-fund clients, as applicable. In light of the information considered and the nature, extent and quality of the services expected to be provided to the Funds under the agreements, the Board determined that the proposed unitary fee for each of the Funds, including the fee rate to be paid by the Adviser to Milliman from the unitary fee, was fair.
The Board noted that the proposed unitary fee for each of the Funds were structured to pass the benefits of any economies of scale on to shareholders as the respective Fund’s assets grow. The Board noted that any reduction in fixed costs associated with the management of the respective Fund would benefit the Adviser and Milliman, but that the unitary fee structure provides a level of certainty in expenses for each of the Funds. The Board noted that the Adviser is continuing to invest in personnel and infrastructure for the Innovator fund complex.
Because the Funds have not yet commenced operations and the actual asset base of the Funds have not yet been determined, the Board noted that there was no historical profitability information with respect to the Funds to be reviewed. The Board noted that it would review profitability information in connection with subsequent renewals of the agreements.
The Board considered potential “fall-out” or ancillary benefits anticipated to be received by the Adviser and Milliman. The Board concluded that the character and amount of potential fall-out benefits to the Adviser and Milliman were consistent with the types of benefits generally derived by investment managers and sub-advisers to funds.
Based on all of the information considered and the conclusions reached, the Board, including the Independent Trustees, unanimously determined that the terms of the agreements are fair and that the approval of the agreements is in the best interests of the Funds. No single factor was determinative in the Board’s analysis.
INNOVATOR ETFs TRUST
Additional Information (Unaudited)
1. | INFORMATION ABOUT PROSPECTUS |
This report has been prepared for shareholders and may be distributed to others only if preceded or accompanied by a current prospectus. Investors should consider the investment objective and policies, risk considerations, charges and ongoing expenses of an investment carefully before investing. The prospectus contains this and other information relevant to an investment in the respective Fund. Please read the Prospectus carefully before investing. A copy of the Prospectus may be obtained without charge by writing to the Trust’s Distributor, or by calling toll free at 1-800-208-5212 or visiting www.innovatoretfs.com.
2. | PROXY VOTING POLICIES AND PROCEDURES |
The Trust’s Proxy Voting Policies and Procedures are available without charge, upon request, by calling 1-877-386-3890 and on the SEC’s website at www.sec.gov. Information relating to how each Fund voted proxies relating to portfolio securities held during each year ended June 30 is also available on the SEC’S website at www.sec.gov.
3. | INFORMATION ABOUT PORTFOLIO SECURITIES |
Each Funds’ complete schedule of portfolio holdings for the first and third quarters is filed with the SEC on Form N-Q or Part F of Form N-PORT (beginning with filings after March 31, 2020). The Trust’s Form N-Q or Part F of Form N-PORT is available without charge, upon request, by calling 1-877-386-3890, or on the SEC’s website at www.sec.gov. The Trust’s Form N-Q or Part F of Form N-PORT may be reviewed and copied at the SEC’s Public Reference Room in Washington, DC. Information on the operation of the Public Reference Room may be obtained by calling 1-800-SEC-0330.
4. | HOUSEHOLD DELIVERY OF SHAREHOLDER DOCUMENTS |
In order to reduce expenses, the Trust delivers one copy of an annual/semi-annual report, prospectus and/or proxy statement on behalf of two or more shareholders at a shared address (householding). If you do not wish to participate in householding, please indicate this preference on your new account application (if you are opening a new account) or call 1-877-FUND890 (877-386-3890) to change the status of your existing account. You may change your status at any time.
5. | ELECTRONIC DELIVERY OF SHAREHOLDER DOCUMENTS |
You may choose to receive a Fund’s prospectus and annual and semi-annual reports electronically. To sign up for electronic delivery, visit www.icsdelivery.com and select the first letter of your brokerage firm’s name. Then, select your brokerage institution from the list that follows, fill out the appropriate information and provide an e-mail address where you would like your information sent. If your brokerage firm is not listed, electronic delivery may not be available. Please contact your brokerage firm or financial adviser.
Additional Information (Unaudited) (Continued)
For the fiscal year ended October 31, 2022, certain dividends paid by the Funds may be subject to a maximum tax rate of 23.8%, as provided for by the Jobs and Growth Tax Relief Reconciliation Act of 2003.
For the taxable year ended October 31, 2022, the percentage of ordinary income dividends paid by the Funds that qualify for the dividends received deduction available to corporations was 0.00%.
For the taxable year ended October 31, 2022, the percentage of ordinary income distributions that were designated as short-term capital gain distributions under Internal Revenue Section 871(k)2(c) was 0.00%.
7. LIQUIDITY RISK MANAGEMENT PROGRAM
Consistent with Rule 22e-4 under the Investment Company Act of 1940, as amended, Innovator ETFs Trust (“Trust”), on behalf of each of its series (each a “Fund” and, collectively, the “Funds”), has established a liquidity risk management program to govern the Funds’ approach to managing liquidity risk (the “Program”). The Program is overseen by the Trust’s Valuation Committee as the Program Administrator, a committee comprised of representatives of the Trust’s investment adviser, Innovator Capital Management LLC and representatives of Milliman Financial Risk Management LLC, the sub-adviser for certain of the Funds (the “Committee”). The Trust’s Board of Trustees (the “Board”) has approved the designation of the Committee to administer the Program.
The Program’s principal objectives include supporting the Funds’ compliance with limits on investments in illiquid assets and mitigating the risk that a Fund will be unable to meet its redemption obligations in a timely manner. The Program also includes a number of elements that support the management and assessment of liquidity risk, including an annual assessment of factors that influence each Fund’s liquidity and the periodic classification and re-classification of certain Funds’ investments into groupings that reflect the Committee’s assessment of their relative liquidity under current market conditions.
At a meeting of the Board held on September 13, 2022, the Trustees received a written report from the Committee regarding the design and operational effectiveness of the Program which has been in operation since September 2019. The Committee determined, and reported to the Board, that the Program is reasonably designed to assess and manage the Funds’ liquidity risk and has operated adequately and effectively to manage the Funds’ liquidity risk since implementation. The Committee reported that during the period covered by the report, there were no liquidity events that impacted the Funds or their ability to timely meet redemptions without dilution to existing shareholders. The Committee also noted no Fund has filed a Form N-LIQUID with the SEC.
INVESTMENT ADVISOR
Innovator Capital Management, LLC
109 North Hale Street
Wheaton, IL 60187
INVESTMENT SUB-ADVISOR
Milliman Financial Risk Management, LLC
71 South Wacker Drive, 31st Floor
Chicago, IL 60606
ADMINISTRATOR, FUND ACCOUNTANT & TRANSFER AGENT
U.S. Bancorp Fund Services, LLC
615 East Michigan Street
Milwaukee, WI 53202
DISTRIBUTOR
Foreside Fund Services, LLC
Three Canal Plaza, Suite 100
Portland, ME 04101
CUSTODIAN
U.S. Bank, N.A.
1555 North RiverCenter Drive, Suite 302
Milwaukee, WI 53212
LEGAL COUNSEL
Chapman and Cutler LLP
320 South Canal Street, 27th Floor
Chicago, IL 60606
INDEPENDENT REGISTERED PUBLIC ACCOUNTING FIRM
Cohen & Company, Ltd.
342 North Water Street, Suite 830
Milwaukee, WI 53202
TABLE OF CONTENTS
Letter to Shareholders | 3 |
Fund Performance | 5 |
Expense Example | 29 |
Schedules of Investments | 31 |
Statements of Assets and Liabilities | 78 |
Statements of Operations | 83 |
Statements of Changes in Net Assets | 88 |
Financial Highlights | 98 |
Notes to Financial Statements | 108 |
Trustees and Officers | 130 |
Board Considerations Regarding Approval of Investment Management Agreement | 132 |
Additional Information | 138 |
INNOVATOR ETFs TRUST
Letter to Shareholders (Unaudited)
Dear Valued Shareholders,
The 1-year period ended April 30, 2023 was noteworthy in many ways. During this 12-month stretch, investors witnessed a remarkable chain of events:
| | 1. | Accommodative covid-era monetary policy led to the highest inflation in 40 years |
| | 2. | High and rising inflation led to tighter monetary policy |
| | 3. | Tighter monetary policy led to large bank failures |
| | 4. | Bank failures led to heightened stock market volatility |
On top of all that, the Federal government reached its debt limit in early 2023 and Congress had still not resolved the matter as of April 30.
While many investors have dealt with the effects of high inflation, bank failures and government debt limits, few have experienced such swift and severe Fed policy tightening out of such an accommodative policy stance. If there’s anything to be learned from this period, it may be the simple reminder that the future remains unknown and the ability to have a better sense of your risk in the middle of the storm is invaluable.
We believe that the Fed is likely to hold interest rates higher for longer than the market has anticipated and that investors will need to learn to factor these higher rates into their thinking. In our estimation, this doesn’t translate to a full-blown “risk-off” sentiment; but to the extent that higher rates create greater market uncertainty, we continue to think investors will do well to be risk aware.
The heightened uncertainty during this period led a large swath of investors to look for ways to maintain market exposure with built-in risk management. Many investors looked to Innovator during this period and we were pleased to offer the industry’s largest and widest-ranging suite of Defined Outcome ETFs™, including the latest addition of our Premium Income Barrier ETFs™. Over this period, while the global equity market was up 2.6%, strong inflows resulted in our assets under management nearly doubling, rising by more than $6.5 billion over the 12-month period.
On behalf of the team at Innovator, thank you for the confidence and trust you’ve place in us and our products over the past year. We’ve worked to earn that trust and intend to work hard to keep it. We wish you the best in good health and prosperity in the coming year.

Bruce Bond,
CEO
INNOVATOR ETFs TRUST
Letter to Shareholders (Unaudited) (Continued)
The views in this report were those of the Fund’s CEO as of April 30, 2023 and may not reflect his views on the date that this report is first published or anytime thereafter. These views are intended to assist shareholders in understanding their investments and do not constitute investment advice.
The Funds have characteristics unlike many other traditional investment products and may not be suitable for all investors. For more information regarding whether an investment in the Fund is right for you, please see Investor Suitability" in the prospectus.
Investing involves risks. Loss of principal is possible.
This material must be preceded by or accompanied with a prospectus. The Funds' investment objectives, risks, charges and expenses should be considered carefully before investing. The prospectus contains this and other important information, and it may be obtained at innovatoretfs.com. Read it carefully before investing.
Innovator ETFs are distributed by Foreside Fund Services, LLC.
Fund Performance
April 30, 2023 (Unaudited)
The following chart compares the value of a hypothetical $10,000 investment in the Innovator IBD® 50 ETF from its inception (April 8, 2015) to April 30, 2023 as compared with the S&P 500® Index.
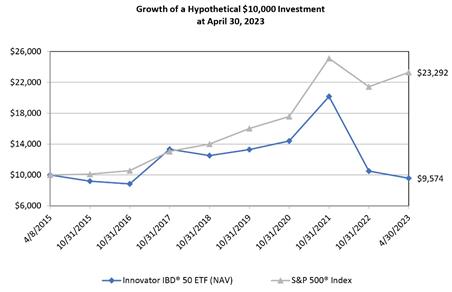
| | | Average Annual Total Returns As of April 30, 2023 |
| | | 1 Year | | | 3 Years | | | 5 Years | | | Since
Inception (a) |
Innovator IBD® 50 ETF | | | | | | | | | | | | | | | | | |
NAV Return | | | -26.55 | % | | | -7.34 | % | | | -6.30 | % | | | -0.54 | % | |
Market Return | | | -26.56 | % | | | -7.40 | % | | | -6.33 | % | | | -0.55 | % | |
S&P 500® Index | | | 2.66 | % | | | 14.52 | % | | | 11.45 | % | | | 11.06 | % | |
IBD® 50 Index (b) | | | -26.52 | % | | | -6.82 | % | | | -5.75 | % | | | -5.91 | % | (c) |
(a) | Inception date is April 8, 2015. |
(b) | The Fund began tracking the IBD® 50 Index on November 20, 2017. |
(c) | Since Inception return is from the date the Fund began tracking the IBD® 50 Index, November 20, 2017. |
Performance data quoted represents past performance and does not guarantee future results. The investment return and principal value of an investment will fluctuate so that an investor’s shares, when redeemed, may be worth more or less than their original cost. Current performance of the Fund may be lower or higher than the performance quoted. As of the latest prospectus, the gross and net expense ratios of the Fund were 0.97% and 0.80%, respectively. For the most recent performance, please visit the Fund’s website at innovatoretfs.com.
Fund Performance
April 30, 2023 (Unaudited) (Continued)
The line graph and performance table do not reflect the deduction of taxes that a shareholder may pay on fund distributions or the redemption of Fund shares. Total return calculations reflect the effect of the Advisor’s expense limitation agreement for the Fund. Returns shown for the Fund, S&P 500® Index and IBD® 50 Index include the reinvestment of all dividends, if any.
The S&P 500® Index is an unmanaged, capitalization–weighted index generally representative of the U.S. market for large capitalization stocks.
The IBD® 50 Index is a weekly, rule–based, computer–generated stock index compiled and published by Investor’s Business Daily® that seeks to identify the current top 50 growth stocks.
The Fund’s portfolio holdings may differ significantly from the securities held in the relevant index and, unlike an exchange–traded fund, the performance of an unmanaged index does not reflect deductions for transaction costs, taxes, management fees or other expenses.
You cannot invest directly in an index.
Premium/Discount Information:
Information regarding the differences between the price of the Fund’s shares on the secondary market and the Fund’s net asset value is available at Innovatoretfs.com/FFTY.
INNOVATOR IBD® BREAKOUT OPPORTUNITIES ETF
Fund Performance
April 30, 2023 (Unaudited)
The following chart compares the value of a hypothetical $10,000 investment in the Innovator IBD® Breakout Opportunities ETF from its inception (September 12, 2018) to April 30, 2023 as compared with the S&P 500® Index and IBD® Breakout Stocks Index.
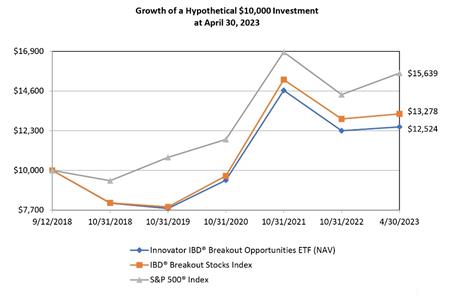
| | | Average Annual Total Returns As of April 30, 2023 | |
| | | 1 Year | | | 3 Years | | | Since Inception (a) | |
Innovator IBD® Breakout Opportunities ETF | | | | | | | | | | | | |
NAV Return | | | -10.34 | % | | | 15.28 | % | | | 4.98 | % |
Market Return | | | -10.34 | % | | | 15.02 | % | | | 4.97 | % |
S&P 500® Index | | | 2.66 | % | | | 14.52 | % | | | 10.14 | % |
IBD® Breakout Stocks Index | | | -9.35 | % | | | 16.85 | % | | | 6.31 | % |
(a) | Inception date is September 12, 2018. |
Performance data quoted represents past performance and does not guarantee future results. The investment return and principal value of an investment will fluctuate so that an investor’s shares, when redeemed, may be worth more or less than their original cost. Current performance of the Fund may be lower or higher than the performance quoted. As of the latest prospectus, the net expense ratio of the Fund was 0.81%. For the most recent performance, please visit the Fund’s website at innovatoretfs.com.
7
INNOVATOR IBD® BREAKOUT OPPORTUNITIES ETF
Fund Performance
April 30, 2023 (Unaudited) (Continued)
The line graph and performance table do not reflect the deduction of taxes that a shareholder may pay on fund distributions or the redemption of Fund shares. Returns shown for the Fund, S&P 500® Index and IBD® Breakout Stocks Index include the reinvestment of all dividends, if any.
The S&P 500® Index is an unmanaged, capitalization–weighted index generally representative of the U.S. market for large capitalization stocks.
The IBD® Breakout Stocks Index is a rule–based index compiled and published by Investor’s Business Daily® that seeks to provide opportunistic investment exposure to those stocks with the potential to “break out” or experience a period of sustained price growth beyond the stock’s recent “resistance level,” with consideration for various market conditions.
The Fund’s portfolio holdings may differ significantly from the securities held in the relevant index and, unlike an exchange–traded fund, the performance of an unmanaged index does not reflect deductions for transaction costs, taxes, management fees or other expenses.
You cannot invest directly in an index.
Premium/Discount Information:
Information regarding the differences between the price of the Fund’s shares on the secondary market and the Fund’s net asset value is available at Innovatoretfs.com/BOUT.
INNOVATOR DEEPWATER FRONTIER TECH ETF
Fund Performance
April 30, 2023 (Unaudited)
The following chart compares the value of a hypothetical $10,000 investment in the Innovator Deepwater Frontier Tech ETF from its inception (July 24, 2018) to April 30, 2023 as compared with the Dow Jones Global Index and Loup Frontier Tech Index.
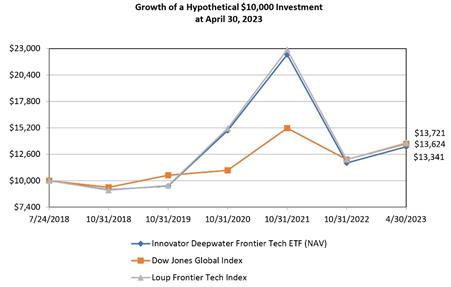
| | | Average Annual Total Returns As of April 30, 2023 | |
| | | 1 Year | | | 3 Years | | | Since Inception (a) | |
Innovator Deepwater Frontier Tech ETF | | | | | | | | | | | | |
NAV Return | | | -11.07 | % | | | 8.27 | % | | | 6.23 | % |
Market Return | | | -10.94 | % | | | 8.12 | % | | | 6.15 | % |
Dow Jones Global Index | | | 2.02 | % | | | 12.14 | % | | | 6.70 | % |
Loup Frontier Tech Index | | | -10.67 | % | | | 8.94 | % | | | 6.86 | % |
(a) | Inception date is July 24, 2018. |
Performance data quoted represents past performance and does not guarantee future results. The investment return and principal value of an investment will fluctuate so that an investor’s shares, when redeemed, may be worth more or less than their original cost. Current performance of the Fund may be lower or higher than the performance quoted. As of the latest prospectus, the net expense ratio of the Fund was 0.70%. For the most recent performance, please visit the Fund’s website at innovatoretfs.com.
9
INNOVATOR DEEPWATER FRONTIER TECH ETF
Fund Performance
April 30, 2023 (Unaudited) (Continued)
The line graph and performance table do not reflect the deduction of taxes that a shareholder may pay on fund distributions or the redemption of Fund shares. Returns shown for the Fund, Dow Jones Global Index and Loup Frontier Tech Index include the reinvestment of all dividends, if any.
The Dow Jones Global Index is an unmanaged, capitalization–weighted index generally representative of the global market.
The Loup Frontier Tech Index is a rules–based stock index that seeks to identify and track those companies identified as being on the frontier of the development of new technologies that have the potential to have an outsized influence on the future.
The Fund’s portfolio holdings may differ significantly from the securities held in the relevant index and, unlike an exchange–traded fund, the performance of an unmanaged index does not reflect deductions for transaction costs, taxes, management fees or other expenses.
You cannot invest directly in an index.
Premium/Discount Information:
Information regarding the differences between the price of the Fund’s shares on the secondary market and the Fund’s net asset value is available at Innovatoretfs.com/LOUP.
INNOVATOR S&P INVESTMENT GRADE PREFERRED ETF
Fund Performance
April 30, 2023 (Unaudited)
The following chart compares the value of a hypothetical $10,000 investment in the Innovator S&P Investment Grade Preferred ETF from its inception (May 23, 2016) to April 30, 2023 as compared with the S&P U.S. High Quality Preferred Stock Index and the S&P U.S. Preferred Stock Index.
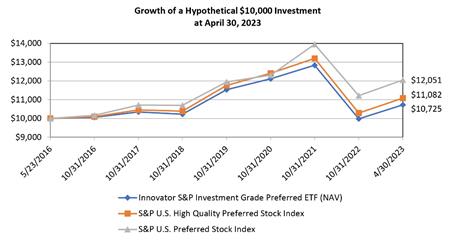
| | | Average Annual Total Returns As of April 30, 2023 | |
| | | 1 Year | | | 3 Years | | | 5 Years | | | Since Inception (a) | |
Innovator S&P Investment Grade Preferred ETF | | | | | | | | | | | | | | | | |
NAV Return | | | -1.32 | % | | | -2.08 | % | | | 1.03 | % | | | 1.01 | % |
Market Return | | | -1.11 | % | | | -2.59 | % | | | 1.08 | % | | | 0.96 | % |
S&P U.S. High Quality Preferred Stock Index | | | -0.99 | % | | | -1.73 | % | | | 1.43 | % | | | 1.49 | % |
S&P U.S. Preferred Stock Index | | | -0.17 | % | | | 1.82 | % | | | 2.50 | % | | | 2.73 | % |
(a) | Inception date is May 23, 2016. |
Performance data quoted represents past performance and does not guarantee future results. The investment return and principal value of an investment will fluctuate so that an investor’s shares, when redeemed, may be worth more or less than their original cost. Current performance of the Fund may be lower or higher than the performance quoted. As of the latest prospectus, the net expense ratio of the Fund was 0.47%. For the most recent performance, please visit the Fund’s website at innovatoretfs.com.
11
INNOVATOR S&P INVESTMENT GRADE PREFERRED ETF
Fund Performance
April 30, 2023 (Unaudited) (Continued)
The line graph and performance table do not reflect the deduction of taxes that a shareholder may pay on fund distributions or the redemption of Fund shares. Returns shown for the Fund, S&P U.S. High Quality Preferred Stock Index and S&P U.S. Preferred Stock Index include the reinvestment of all dividends, if any.
The S&P U.S. High Quality Preferred Stock Index is designed to provide exposure to U.S. - listed preferred stocks that meet a minimum size, liquidity, type of issuance, and quality criteria.
The S&P U.S. Preferred Stock Index generally represents the U.S. preferred stock market.
The Fund’s portfolio holdings may differ significantly from the securities held in the relevant index and, unlike an exchange-traded fund, the performance of an unmanaged index does not reflect deductions for transaction costs, taxes, management fees or other expenses.
You cannot invest directly in an index.
Premium/Discount Information:
Information regarding the differences between the price of the Fund’s shares on the secondary market and the Fund’s net asset value is available at innovatoretfs.com/EPRF.
INNOVATOR LADDERED ALLOCATION POWER BUFFER ETF
Fund Performance
April 30, 2023 (Unaudited)
The following chart compares the value of a hypothetical $10,000 investment in the Innovator Laddered Allocation Power Buffer ETF from its inception (October 19, 2016) to April 30, 2023 as compared with the S&P 500® Index.
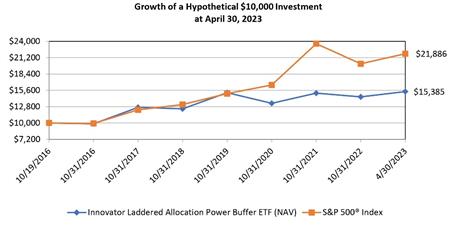
| | | Average Annual Total Returns As of April 30, 2023 | | |
| | | 1 Year | | | 3 Years | | | 5 Years | | | Since Inception (a) | | |
Innovator Laddered Allocation Power Buffer ETF | | | | | | | | | | | | | | | | | |
NAV Return | | | 5.97 | % | | | 11.87 | % | | | 4.22 | % | | | 6.82 | % | |
Market Return | | | 6.00 | % | | | 11.89 | % | | | 4.26 | % | | | 6.85 | % | |
S&P 500® Index | | | 2.66 | % | | | 14.52 | % | | | 11.45 | % | | | 12.75 | % | |
Refinitiv Laddered Power Buffer Strategy Index (b) | | | 6.02 | % | | | N/A | | | | N/A | | | | 5.25 | % | (c) |
(a) | Inception date is October 19, 2016. |
(b) | The Fund began tracking the Refinitiv Laddered Power Buffer Strategy Index on August 11, 2020. |
(c) | Since Inception return is cumulative and from the date the Fund began tracking the Refinitiv Laddered Power Buffer Strategy Index, August 11, 2020. |
Performance data quoted represents past performance and does not guarantee future results. The investment return and principal value of an investment will fluctuate so that an investor’s shares, when redeemed, may be worth more or less than their original cost. Current performance of the Fund may be lower or higher than the performance quoted. As of the latest prospectus, the gross and net expense ratios of the Fund were 0.99% and 0.89%, respectively. This expense ratio includes acquired fund fees and expenses of 0.79%. For the most recent performance, please visit the Fund’s website at innovatoretfs.com.
13
INNOVATOR LADDERED ALLOCATION POWER BUFFER ETF
Fund Performance
April 30, 2023 (Unaudited) (Continued)
The line graph and performance table do not reflect the deduction of taxes that a shareholder may pay on fund distributions or the redemption of Fund shares. Returns shown for the Fund, Refinitiv Laddered Power Buffer Strategy Index and S&P 500® Index include the reinvestment of all dividends, if any.
The Refinitiv Laddered Power Buffer Strategy Index is equally weighted in the shares of the twelve Innovator U.S. Equity Power Buffer ETFs which each respectively seek to provide a defined outcome based upon the performance of the S&P 500® Index - Price Return over the course of an approximately one-year time period that begins on the first trading day of the month indicated in the respective ETF's name. Each Innovator U.S. Equity Power Buffer ETF seeks to provide an upside return that is capped for an applicable outcome period and a measure of downside protection from losses for such outcome period. The Index seeks to provide "laddered" investing in the twelve Innovator U.S. Equity Power Buffer ETFs. Laddered investing refers to investments in several similar securities that have different reset dates, with the goal of mitigating timing risks associated with investing in a single investment.
The S&P 500® Index is an unmanaged, capitalization-weighted index generally representative of the U.S. market for large capitalization stocks.
The Fund’s portfolio holdings may differ significantly from the securities held in the relevant index and, unlike an exchange-traded fund, the performance of an unmanaged index does not reflect deductions for transaction costs, taxes, management fees or other expenses.
You cannot invest directly in an index.
Premium/Discount Information:
Information regarding the differences between the price of the Fund’s shares on the secondary market and the Fund’s net asset value is available at innovatoretfs.com/BUFF.
INNOVATOR LADDERED ALLOCATION BUFFER ETF
Fund Performance
April 30, 2023 (Unaudited)
The following chart compares the value of a hypothetical $10,000 investment in the Innovator Laddered Allocation Buffer ETF from its inception (February 8, 2022) to April 30, 2023 as compared with the S&P 500® Index.
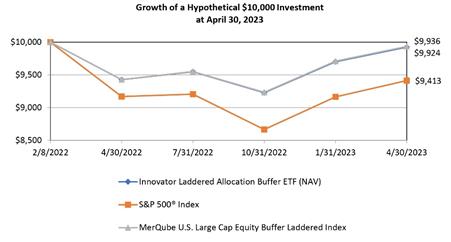
| | | Average Annual Total Returns As of April 30, 2023 | |
| | | 1 Year | | | Since
Inception (a) | |
Innovator Laddered Allocation Buffer ETF | | | | | | | | |
NAV Return | | | 5.28 | % | | | -0.62 | % |
Market Return | | | 5.04 | % | | | -0.64 | % |
S&P 500® Index | | | 2.66 | % | | | -4.83 | % |
MerQube U.S. Large Cap Equity Buffer Laddered Index | | | 5.39 | % | | | -0.52 | % |
(a) | Inception date is February 8, 2022. |
Performance data quoted represents past performance and does not guarantee future results. The investment return and principal value of an investment will fluctuate so that an investor’s shares, when redeemed, may be worth more or less than their original cost. Current performance of the Fund may be lower or higher than the performance quoted. As of the latest prospectus, the gross and net expense ratios of the Fund were 0.99% and 0.89%, respectively. This expense ratio includes acquired fund fees and expenses of 0.79%. For the most recent performance, please visit the Fund’s website at innovatoretfs.com.
15
INNOVATOR LADDERED ALLOCATION BUFFER ETF
Fund Performance
April 30, 2023 (Unaudited) (Continued)
The line graph and performance table do not reflect the deduction of taxes that a shareholder may pay on fund distributions or the redemption of Fund shares. Returns shown for the Fund, MerQube U.S. Large Cap Equity Buffer Laddered Index and S&P 500® Index include the reinvestment of all dividends, if any.
The MerQube U.S. Large Cap Equity Buffer Laddered Index is equally weighted in the shares of the twelve Innovator U.S. Equity Buffer ETFs which each respectively seek to provide a defined outcome based upon the performance of the S&P 500® Index - Price Return over the course of an approximately one-year time period that begins on the first trading day of the month indicated in the respective ETF's name. Each Innovator U.S. Equity Buffer ETF seeks to provide an upside return that is capped for an applicable outcome period and a measure of downside protection from losses for such outcome period. The Index seeks to provide "laddered" investing in the twelve Innovator U.S. Equity Buffer ETFs. Laddered investing refers to investments in several similar securities that have different reset dates, with the goal of mitigating timing risks associated with investing in a single investment.
The S&P 500® Index is an unmanaged, capitalization-weighted index generally representative of the U.S. market for large capitalization stocks.
The Fund’s portfolio holdings may differ significantly from the securities held in the relevant index and, unlike an exchange-traded fund, the performance of an unmanaged index does not reflect deductions for transaction costs, taxes, management fees or other expenses.
You cannot invest directly in an index.
Premium/Discount Information:
Information regarding the differences between the price of the Fund’s shares on the secondary market and the Fund’s net asset value is available at innovatoretfs.com/BUFB.
INNOVATOR BUFFER STEP-UP STRATEGY ETF
Fund Performance |
April 30, 2023 (Unaudited) | |
The following chart compares the value of a hypothetical $10,000 investment in the Innovator Buffer Step-Up Strategy ETF from its inception (March 7, 2022) to April 30, 2023 as compared with the S&P 500® Index - Price Return and Total Return. |
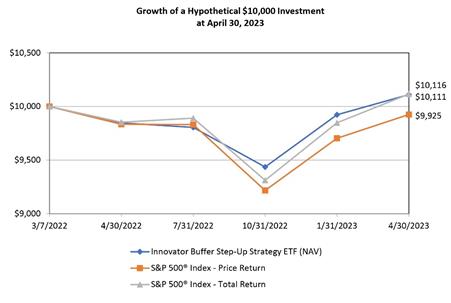
| | | Average Annual Total Returns As of April 30, 2023 | |
| | | 1 Year | | | Since Inception (a) | |
Innovator Buffer Step-Up Strategy ETF | | | | | | | | |
NAV Return | | | 2.68 | % | | | 0.97 | % |
Market Return | | | 2.73 | % | | | 0.88 | % |
S&P 500® Index - Price Return | | | 0.91 | % | | | -0.66 | % |
S&P 500® Index - Total Return | | | 2.66 | % | | | 1.01 | % |
(a) Inception date is March 7, 2022. |
| |
Performance data quoted represents past performance and does not guarantee future results. The investment return and principal value of an investment will fluctuate so that an investor’s shares, when redeemed, may be worth more or less than their original cost. Current performance of the Fund may be lower or higher than the performance quoted. As of the latest prospectus, the net expense ratio of the Fund was 0.89%. For the most recent performance, please visit the Fund’s website at innovatoretfs.com. |
17
INNOVATOR BUFFER STEP-UP STRATEGY ETF
Fund Performance |
April 30, 2023 (Unaudited) (Continued) | | |
The line graph and performance table does not reflect the deduction of taxes that a shareholder may pay on fund distributions or the redemption of Fund shares. Returns shown for the Fund and S&P 500® Index - Total Return include the reinvestment of all dividends, if any. Returns shown for the S&P 500® Index - Price Return do not include the reinvestment of dividends, if any. |
| |
The S&P 500® Index is an unmanaged, capitalization-weighted index generally representative of the U.S. market for large capitalization stocks. |
| |
The Fund’s portfolio holdings may differ significantly from the securities held in the relevant index and, unlike an exchange-traded fund, the performance of an unmanaged index does not reflect deductions for transaction costs, taxes, management fees or other expenses. |
| |
You cannot invest directly in an index. |
| |
Premium/Discount Information: |
| |
Information regarding the differences between the price of the Fund’s shares on the secondary market and the Fund’s net asset value is available at Innovatoretfs.com/BSTP. |
INNOVATOR POWER BUFFER STEP-UP STRATEGY ETF
Fund Performance |
April 30, 2023 (Unaudited) | |
The following chart compares the value of a hypothetical $10,000 investment in the Innovator Power Buffer Step-Up Strategy ETF from its inception (March 7, 2022) to April 30, 2023 as compared with the S&P 500® Index - Price Return and Total Return. |
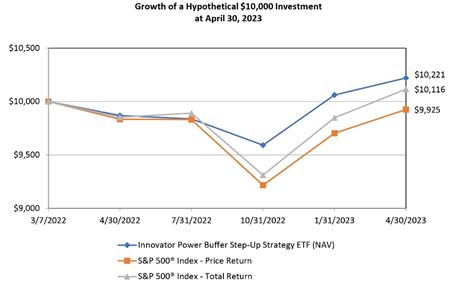
| | | Average Annual Total Returns As of April 30, 2023 | |
| | | 1 Year | | | Since Inception (a) | |
Innovator Power Buffer Step-Up Strategy ETF | | | | | | | | |
NAV Return | | | 3.57 | % | | | 1.93 | % |
Market Return | | | 3.64 | % | | | 1.85 | % |
S&P 500® Index - Price Return | | | 0.91 | % | | | -0.66 | % |
S&P 500® Index - Total Return | | | 2.66 | % | | | 1.01 | % |
(a) Inception date is March 7, 2022. |
| |
Performance data quoted represents past performance and does not guarantee future results. The investment return and principal value of an investment will fluctuate so that an investor’s shares, when redeemed, may be worth more or less than their original cost. Current performance of the Fund may be lower or higher than the performance quoted. As of the latest prospectus, the net expense ratio of the Fund was 0.89%. For the most recent performance, please visit the Fund’s website at innovatoretfs.com. |
19
INNOVATOR POWER BUFFER STEP-UP STRATEGY ETF
Fund Performance |
April 30, 2023 (Unaudited) (Continued) | | |
The line graph and performance table does not reflect the deduction of taxes that a shareholder may pay on fund distributions or the redemption of Fund shares. Returns shown for the Fund and S&P 500® Index - Total Return include the reinvestment of all dividends, if any. Returns shown for the S&P 500® Index - Price Return do not include the reinvestment of dividends, if any. |
| |
The S&P 500® Index is an unmanaged, capitalization-weighted index generally representative of the U.S. market for large capitalization stocks. |
| |
The Fund’s portfolio holdings may differ significantly from the securities held in the relevant index and, unlike an exchange-traded fund, the performance of an unmanaged index does not reflect deductions for transaction costs, taxes, management fees or other expenses. |
| |
You cannot invest directly in an index. |
| |
Premium/Discount Information: |
| |
Information regarding the differences between the price of the Fund’s shares on the secondary market and the Fund’s net asset value is available at Innovatoretfs.com/PSTP. |
INNOVATOR HEDGED TSLA STRATEGY ETF
Fund Performance |
April 30, 2023 (Unaudited) | |
The following chart compares the value of a hypothetical $10,000 investment in the Innovator Hedged TSLA Strategy ETF from its inception (July 25, 2022) to April 30, 2023 as compared with Tesla, Inc. and the NASDAQ-100 Index - Price Return and Total Return.
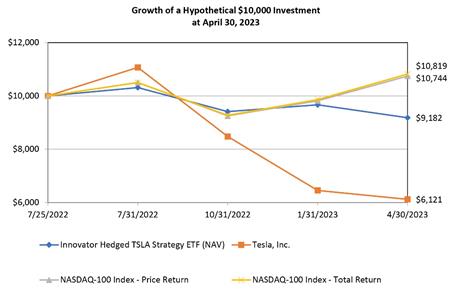
| | | Total Returns As of April 30, 2023 | |
| | | Since Inception (a) | |
Innovator Hedged TSLA Strategy ETF | | | | |
NAV Return | | | -8.18 | % |
Market Return | | | -8.31 | % |
Tesla, Inc. | | | -38.79 | % |
NASDAQ-100 Index - Price Return | | | 7.44 | % |
NASDAQ-100 Index - Total Return | | | 8.19 | % |
(a) Inception date is July 25, 2022.
Performance data quoted represents past performance and does not guarantee future results. The investment return and principal value of an investment will fluctuate so that an investor’s shares, when redeemed, may be worth more or less than their original cost. Current performance of the Fund may be lower or higher than the performance quoted. As of the latest prospectus, the net expense ratio of the Fund was 0.79%. For the most recent performance, please visit the Fund’s website at innovatoretfs.com.
21
INNOVATOR HEDGED TSLA STRATEGY ETF
Fund Performance |
April 30, 2023 (Unaudited) (Continued) | | |
The line graph and performance table does not reflect the deduction of taxes that a shareholder may pay on fund distributions or the redemption of Fund shares. Returns shown for the Fund, Tesla Inc. and NASDAQ-100 Index - Total Return include the reinvestment of all dividends, if any. Returns shown for the NASDAQ-100 Index - Price Return do not include the reinvestment of dividends, if any.
The NASDAQ-100 Index includes 100 of the largest domestic and international non-financial companies listed on the Nasdaq Stock Market based on market capitalization. The NASDAQ-100 Price Index reflects companies across major industry groups including computer hardware and software, telecommunications, retail/wholesale trade and biotechnologies. It does not contain securities of financial companies including investment companies.
The Fund’s portfolio holdings may differ significantly from the securities held in the relevant index and, unlike an exchange-traded fund, the performance of an unmanaged index does not reflect deductions for transaction costs, taxes, management fees or other expenses.
You cannot invest directly in an index.
Premium/Discount Information:
Information regarding the differences between the price of the Fund’s shares on the secondary market and the Fund’s net asset value is available at Innovatoretfs.com/TSLH.
INNOVATOR UNCAPPED ACCELERATED U.S. EQUITY ETF
Fund Performance |
April 30, 2023 (Unaudited) | |
The following chart compares the value of a hypothetical $10,000 investment in the Innovator Uncapped Accelerated U.S. Equity ETF from its inception (August 10, 2022) to April 30, 2023 as compared with the S&P 500® Index - Price Return and Total Return.

| | | Total Returns As of April 30, 2023 | |
| | | Since Inception (a) | |
Innovator Uncapped Accelerated U.S. Equity ETF | | | | |
NAV Return | | | -1.55 | % |
Market Return | | | -1.69 | % |
S&P 500® Index - Price Return | | | -0.97 | % |
S&P 500® Index - Total Return | | | 0.29 | % |
(a) Inception date is August 10, 2022.
Performance data quoted represents past performance and does not guarantee future results. The investment return and principal value of an investment will fluctuate so that an investor’s shares, when redeemed, may be worth more or less than their original cost. Current performance of the Fund may be lower or higher than the performance quoted. As of the latest prospectus, the net expense ratio of the Fund was 0.79%. For the most recent performance, please visit the Fund’s website at innovatoretfs.com.
23
INNOVATOR UNCAPPED ACCELERATED U.S. EQUITY ETF
Fund Performance |
April 30, 2023 (Unaudited) (Continued) | | |
The line graph and performance table does not reflect the deduction of taxes that a shareholder may pay on fund distributions or the redemption of Fund shares. Returns shown for the Fund and S&P 500® Index - Total Return include the reinvestment of all dividends, if any. Returns shown for the S&P 500® Index - Price Return do not include the reinvestment of dividends, if any.
The S&P 500® Index is an unmanaged, capitalization-weighted index generally representative of the U.S. market for large capitalization stocks.
The Fund’s portfolio holdings may differ significantly from the securities held in the relevant index and, unlike an exchange-traded fund, the performance of an unmanaged index does not reflect deductions for transaction costs, taxes, management fees or other expenses.
You cannot invest directly in an index.
Premium/Discount Information:
Information regarding the differences between the price of the Fund’s shares on the secondary market and the Fund’s net asset value is available at Innovatoretfs.com/XUSP.
INNOVATOR EQUITY MANAGED FLOOR ETF
Fund Performance |
April 30, 2023 (Unaudited) | |
The following chart compares the value of a hypothetical $10,000 investment in the Innovator Equity Managed Floor ETF from its inception (November 8, 2022) to April 30, 2023 as compared with the S&P 500® Index - Price Return and Total Return.
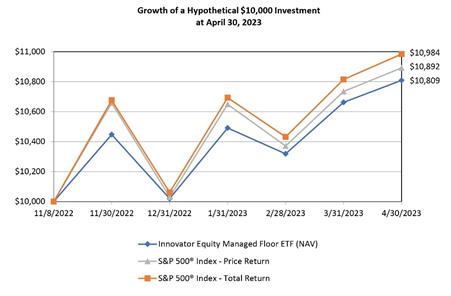
| | | Total Returns As of April 30, 2023 | |
| | | Since Inception (a) | |
Innovator Equity Managed Floor ETF | | | | |
NAV Return | | | 8.09 | % |
Market Return | | | 8.04 | % |
S&P 500® Index - Price Return | | | 8.92 | % |
S&P 500® Index - Total Return | | | 9.84 | % |
(a) Inception date is November 8, 2022.
Performance data quoted represents past performance and does not guarantee future results. The investment return and principal value of an investment will fluctuate so that an investor’s shares, when redeemed, may be worth more or less than their original cost. Current performance of the Fund may be lower or higher than the performance quoted. As of the latest prospectus, the net expense ratio of the Fund was 0.89%. For the most recent performance, please visit the Fund’s website at innovatoretfs.com.
25
INNOVATOR EQUITY MANAGED FLOOR ETF
Fund Performance |
April 30, 2023 (Unaudited) (Continued) | | |
The line graph and performance table does not reflect the deduction of taxes that a shareholder may pay on fund distributions or the redemption of Fund shares. Returns shown for the Fund and S&P 500® Index - Total Return include the reinvestment of all dividends, if any. Returns shown for the S&P 500® Index - Price Return do not include the reinvestment of dividends, if any.
The S&P 500® Index is an unmanaged, capitalization-weighted index generally representative of the U.S. market for large capitalization stocks.
The Fund’s portfolio holdings may differ significantly from the securities held in the relevant index and, unlike an exchange-traded fund, the performance of an unmanaged index does not reflect deductions for transaction costs, taxes, management fees or other expenses.
You cannot invest directly in an index.
Premium/Discount Information:
Information regarding the differences between the price of the Fund’s shares on the secondary market and the Fund’s net asset value is available at
Innovatoretfs.com/SFLR.
INNOVATOR GRADIENT TACTICAL ROTATION STRATEGY ETF
Fund Performance |
April 30, 2023 (Unaudited) | |
The following chart compares the value of a hypothetical $10,000 investment in the Innovator Gradient Tactical Rotation Strategy ETF from its inception (November 16, 2022) to April 30, 2023 as compared with the S&P Global Broad Market Index - Total Return and S&P 500® Index - Total Return.
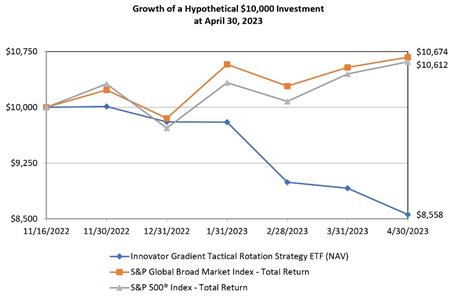
| | | Total Returns As of April 30, 2023 | |
| | | Since Inception (a) | |
Innovator Gradient Tactical Rotation Strategy ETF | | | | |
NAV Return | | | -14.42 | % |
Market Return | | | -14.66 | % |
S&P Global Broad Market Index - Total Return | | | 6.74 | % |
S&P 500® Index - Total Return | | | 6.12 | % |
(a) Inception date is November 16, 2022.
Performance data quoted represents past performance and does not guarantee future results. The investment return and principal value of an investment will fluctuate so that an investor’s shares, when redeemed, may be worth more or less than their original cost. Current performance of the Fund may be lower or higher than the performance quoted. As of the latest prospectus, the net expense ratio of the Fund was 0.80%. For the most recent performance, please visit the Fund’s website at innovatoretfs.com.
27
INNOVATOR GRADIENT TACTICAL ROTATION STRATEGY ETF
Fund Performance |
April 30, 2023 (Unaudited) (Continued) | | |
The line graph and performance table do not reflect the deduction of taxes that a shareholder may pay on fund distributions or the redemption of Fund shares. Returns shown for the Fund, S&P 500® Index Total Return and S&P Global BMI Total Return Index include the reinvestment of all dividends, if any.
The S&P Global Broad Market Index is a market capitalization-weighted index providing a broad measure of global equities markets.
The S&P 500® Index is an unmanaged, capitalization-weighted index generally representative of the U.S. market for large capitalization stocks.
The Fund’s portfolio holdings may differ significantly from the securities held in the relevant index and, unlike an exchange-traded fund, the performance of an unmanaged index does not reflect deductions for transaction costs, taxes, management fees or other expenses.
You cannot invest directly in an index.
Premium/Discount Information:
Information regarding the differences between the price of the Fund’s shares on the secondary market and the Fund’s net asset value is available at Innovatoretfs.com/IGTR.
Expense Example
For the Period Ended April 30, 2023 (Unaudited)
As a shareholder of the Funds, you incur two types of costs: (1) ongoing costs, including management fees, and other Fund expenses; and (2) transaction costs, including brokerage commissions on the purchase and sale of Fund shares. This Example is intended to help you understand your ongoing costs (in dollars) of investing in the Funds and to compare these costs with the ongoing costs of investing in other funds.
The Example is based on an investment of $1,000 invested at the beginning of the period and held for the entire respective period to April 30, 2023 for each Fund.
Actual Expenses
The first line under each Fund in the following table provides information about actual account values and actual expenses. You may use the information in this line, together with the amount you invested, to estimate the expenses you paid over the period. Simply divide your account value by $1,000 (for example, an $8,600 account value divided by $1,000 equals 8.6), then multiply the result by the number in the applicable line under the heading titled “Expenses Paid During the Period” to estimate the expenses you paid on your account during the period.
Hypothetical Example for Comparison Purposes
The second line under each Fund in the following table provides information about hypothetical account values and hypothetical expenses based on the Funds’ actual expense ratios and an assumed rate of return of 5% per year before expenses, which are not the Funds’ actual returns. The hypothetical account values and expenses may not be used to estimate the actual ending account balance or expenses you paid for the period. You may use this information to compare the ongoing costs of investing in the Funds with other funds. To do so, compare this 5% hypothetical example with the 5% hypothetical examples that appear in the shareholder reports of other funds.
Please note that the expenses shown in the table are meant to highlight your ongoing costs only and do not reflect any transactional costs, such as brokerage commissions on the purchase and sale of Fund shares. Therefore, the second line under the Fund in the table is useful in comparing the ongoing Fund costs only and will not help you determine the relative total costs of owning different funds. In addition, if these transactional costs were included, your costs could have been higher.
Expense Example
For the Period Ended April 30, 2023 (Unaudited) (Continued)
| | | | | | | | | | | Expenses Paid | | | | Annualized Expense | |
| | | Beginning | | | Ending | | | During | | | | Ratio for | |
| | | Account Value | | | Account Value | | | the Period | | | | the Period | |
Innovator IBD 50® ETF (NAV) | | | | | | | | | | | | | | | | 0.80 | % |
Actual | | $ | 1,000.00 | | | $ | 911.20 | | | $ | 3.79 | | (a) | | | | |
Hypothetical | | | 1,000.00 | | | | 1,020.83 | | | | 4.01 | | (a) | | | | |
Innovator IBD® Breakout Opportunities ETF (NAV) | | | | | | | | | | | | | | | | 0.80 | % |
Actual | | | 1,000.00 | | | | 1,018.20 | | | | 4.00 | | (a) | | | | |
Hypothetical | | | 1,000.00 | | | | 1,020.83 | | | | 4.01 | | (a) | | | | |
Innovator Deepwater Frontier Tech ETF (NAV) | | | | | | | | | | | | | | | | 0.70 | % |
Actual | | | 1,000.00 | | | | 1,136.30 | | | | 3.71 | | (a) | | | | |
Hypothetical | | | 1,000.00 | | | | 1,021.32 | | | | 3.51 | | (a) | | | | |
Innovator S&P Investment Grade Preferred ETF (NAV) | | | | | | | | | | | | | | | | 0.47 | % |
Actual | | | 1,000.00 | | | | 1,074.90 | | | | 2.42 | | (a) | | | | |
Hypothetical | | | 1,000.00 | | | | 1,022.46 | | | | 2.36 | | (a) | | | | |
Innovator Laddered Allocation Power Buffer ETF (NAV) | | | | | | | | | | | | | | | | 0.10 | % |
Actual | | | 1,000.00 | | | | 1,062.00 | | | | 0.51 | | (a) | | | | |
Hypothetical | | | 1,000.00 | | | | 1,024.30 | | | | 0.50 | | (a) | | | | |
Innovator Laddered Allocation Buffer ETF (NAV) | | | | | | | | | | | | | | | | 0.10 | % |
Actual | | | 1,000.00 | | | | 1,075.50 | | | | 0.51 | | (a) | | | | |
Hypothetical | | | 1,000.00 | | | | 1,024.30 | | | | 0.50 | | (a) | | | | |
Innovator Buffer Step-Up Strategy ETF (NAV) | | | | | | | | | | | | | | | | 0.89 | % |
Actual | | | 1,000.00 | | | | 1,071.50 | | | | 4.57 | | (a) | | | | |
Hypothetical | | | 1,000.00 | | | | 1,020.38 | | | | 4.46 | | (a) | | | | |
Innovator Power Buffer Step-Up Strategy ETF (NAV) | | | | | | | | | | | | | | | | 0.89 | % |
Actual | | | 1,000.00 | | | | 1,065.60 | | | | 4.56 | | (a) | | | | |
Hypothetical | | | 1,000.00 | | | | 1,020.38 | | | | 4.46 | | (a) | | | | |
Innovator Hedged TSLA Strategy ETF (NAV) | | | | | | | | | | | | | | | | 0.79 | % |
Actual | | | 1,000.00 | | | | 975.50 | | | | 3.87 | | (a) | | | | |
Hypothetical | | | 1,000.00 | | | | 1,020.88 | | | | 3.96 | | (a) | | | | |
Innovator Uncapped Accelerated U.S. Equity ETF (NAV) | | | | | | | | | | | | | | | | 0.79 | % |
Actual | | | 1,000.00 | | | | 1,079.40 | | | | 4.07 | | (a) | | | | |
Hypothetical | | | 1,000.00 | | | | 1,020.88 | | | | 3.96 | | (a) | | | | |
Innovator Equity Managed Floor ETF (NAV) | | | | | | | | | | | | | | | | 0.89 | % |
Actual | | | 1,000.00 | | | | 1,080.90 | | | | 4.39 | | (b) | | | | |
Hypothetical | | | 1,000.00 | | | | 1,020.38 | | | | 4.46 | | (d) | | | | |
Innovator Gradient Tactical Rotation Strategy ETF (NAV) | | | | | | | | | | | | | | | | 0.80 | % |
Actual | | | 1,000.00 | | | | 855.80 | | | | 3.36 | | (c) | | | | |
Hypothetical | | | 1,000.00 | | | | 1,020.83 | | | | 4.01 | | (d) | | | | |
(a) | Expenses are equal to the Fund’s annualized expense ratio, multiplied by the average account value over the period, multiplied by 181/365 (to reflect the six month period). |
(b) | Expenses are equal to the Fund’s annualized expense ratio, multiplied by the average account value over the period, multiplied by 173/365 (to reflect the period since the Fund’s inception). |
(c) | Expenses are equal to the Fund’s annualized expense ratio, multiplied by the average account value over the period, multiplied by 165/365 (to reflect the period since the Fund’s inception). |
(d) | For comparative purposes only as the Fund was not in operation for the full six month period. |
Schedule of Investments |
April 30, 2023 (Unaudited) |
| | | Shares | | | Value | |
COMMON STOCKS - 99.70% | | | | | | | | |
Advertising - 1.06% | | | | | | | | |
The Trade Desk, Inc. - Class A (a) | | | 12,798 | | | $ | 823,423 | |
| | | | | | | | | |
Apparel - 6.31% | | | | | | | | |
Crocs, Inc. (a) | | | 18,187 | | | | 2,249,186 | |
On Holding AG - Class A (a) | | | 81,740 | | | | 2,652,463 | |
| | | | | | | | 4,901,649 | |
Auto Manufacturers - 0.50% | | | | | | | | |
PACCAR, Inc. | | | 5,252 | | | | 392,272 | |
| | | | | | | | | |
Auto Parts & Equipment - 2.59% | | | | | | | | |
Mobileye Global, Inc. - Class A (a)(b) | | | 53,462 | | | | 2,012,310 | |
| | | | | | | | | |
Biotechnology - 6.61% | | | | | | | | |
BeiGene Ltd. - ADR (a)(b) | | | 9,363 | | | | 2,387,190 | |
Intra-Cellular Therapies, Inc. (a) | | | 37,740 | | | | 2,345,541 | |
Vertex Pharmaceuticals, Inc. (a) | | | 1,187 | | | | 404,447 | |
| | | | | | | | 5,137,178 | |
Building Materials - 6.71% | | | | | | | | |
AAON, Inc. (b) | | | 24,528 | | | | 2,403,744 | |
Tecnoglass, Inc. (b) | | | 64,053 | | | | 2,808,724 | |
| | | | | | | | 5,212,468 | |
Commercial Services - 2.04% | | | | | | | | |
Flywire Corp. (a)(b) | | | 27,161 | | | | 792,286 | |
Quanta Services, Inc. | | | 4,681 | | | | 794,085 | |
| | | | | | | | 1,586,371 | |
Distribution & Wholesale - 1.53% | | | | | | | | |
Copart, Inc. (a) | | | 4,979 | | | | 393,590 | |
Core & Main, Inc. - Class A (a) | | | 30,410 | | | | 792,485 | |
| | | | | | | | 1,186,075 | |
Electronics - 1.02% | | | | | | | | |
Hubbell, Inc. | | | 2,953 | | | | 795,302 | |
| | | | | | | | | |
Energy-Alternate Sources - 1.99% | | | | | | | | |
Array Technologies, Inc. (a) | | | 75,654 | | | | 1,547,124 | |
The accompanying notes are an integral part of these financial statements.
Schedule of Investments |
April 30, 2023 (Unaudited) (Continued) |
| | | Shares | | | Value | |
Entertainment - 3.71% | | | | | | | | |
DraftKings, Inc. - Class A (a) | | | 131,683 | | | | 2,885,174 | |
| | | | | | | | | |
Environmental Control - 3.02% | | | | | | | | |
Clean Harbors, Inc. (a) | | | 16,190 | | | | 2,350,140 | |
| | | | | | | | | |
Food - 0.51% | | | | | | | | |
The Hershey Co. | | | 1,466 | | | | 400,306 | |
| | | | | | | | | |
Healthcare - Products - 10.46% | | | | | | | | |
Inmode Ltd. (a) | | | 41,938 | | | | 1,562,610 | |
Inspire Medical Systems, Inc. (a)(b) | | | 8,543 | | | | 2,286,363 | |
Lantheus Holdings, Inc. (a) | | | 18,091 | | | | 1,545,876 | |
Shockwave Medical, Inc. (a)(b) | | | 9,420 | | | | 2,733,307 | |
| | | | | | | | 8,128,156 | |
Healthcare - Services - 1.94% | | | | | | | | |
Medpace Holdings, Inc. (a) | | | 7,531 | | | | 1,507,254 | |
| | | | | | | | | |
Home Builders - 10.49% | | | | | | | | |
Meritage Homes Corp. (b) | | | 22,058 | | | | 2,824,527 | |
PulteGroup, Inc. (b) | | | 41,585 | | | | 2,792,433 | |
Tri Pointe Homes, Inc. (a) | | | 88,399 | | | | 2,535,283 | |
| | | | | | | | 8,152,243 | |
Internet - 3.07% | | | | | | | | |
MercadoLibre, Inc. (a) | | | 1,865 | | | | 2,382,519 | |
| | | | | | | | | |
Leisure Time - 0.50% | | | | | | | | |
Brunswick Corp./DE | | | 4,622 | | | | 391,899 | |
| | | | | | | | | |
Mining - 0.50% | | | | | | | | |
Agnico Eagle Mines Ltd. | | | 6,869 | | | | 389,678 | |
| | | | | | | | | |
Miscellaneous Manufacturing - 2.89% | | | | | | | | |
Axon Enterprise, Inc. (a) | | | 10,659 | | | | 2,245,958 | |
| | | | | | | | | |
Oil & Gas - 1.51% | | | | | | | | |
BP PLC - ADR | | | 19,479 | | | | 784,614 | |
TotalEnergies SE - ADR | | | 6,057 | | | | 387,224 | |
| | | | | | | | 1,171,838 | |
The accompanying notes are an integral part of these financial statements.
Schedule of Investments |
April 30, 2023 (Unaudited) (Continued) |
| | | Shares | | | Value | |
Pharmaceuticals – 1.42% | | | | | | | | |
Amphastar Pharmaceuticals, Inc. (a) | | | 20,123 | | | | 719,800 | |
Novo Nordisk AS – ADR | | | 2,327 | | | | 388,819 | |
| | | | | | | | 1,108,619 | |
Retail – 12.00% | | | | | | | | |
BJ’s Wholesale Club Holdings, Inc. (a) | | | 5,046 | | | | 385,363 | |
Floor & Decor Holdings, Inc. – Class A (a) | | | 16,365 | | | | 1,625,699 | |
Lululemon Athletica, Inc. (a) | | | 4,118 | | | | 1,564,552 | |
Tractor Supply Co. | | | 6,316 | | | | 1,505,734 | |
Ulta Beauty, Inc. (a) | | | 2,805 | | | | 1,546,761 | |
Wingstop, Inc. (b) | | | 13,479 | | | | 2,697,283 | |
| | | | | | | | 9,325,392 | |
Software – 13.77% | | | | | | | | |
DoubleVerify Holdings, Inc. (a) | | | 12,961 | | | | 381,313 | |
Duolingo, Inc. (a) | | | 19,675 | | | | 2,678,948 | |
Dynatrace, Inc. (a) | | | 36,741 | | | | 1,553,410 | |
Fiserv, Inc. (a) | | | 6,487 | | | | 792,192 | |
HubSpot, Inc. (a)(b) | | | 1,848 | | | | 777,916 | |
Salesforce, Inc. (a) | | | 8,020 | | | | 1,590,927 | |
Samsara, Inc. – Class A (a)(b) | | | 120,360 | | | | 2,172,498 | |
Sciplay Corp. – Class A (a) | | | 44,463 | | | | 759,428 | |
| | | | | | | | 10,706,632 | |
Telecommunication – 3.55% | | | | | | | | |
Arista Networks, Inc. (a) | | | 17,234 | | | | 2,760,198 | |
TOTAL COMMON STOCKS (Cost $74,828,358) | | | | | | | 77,500,178 | |
| | | | | | | | | |
INVESTMENTS PURCHASED WITH PROCEEDS FROM SECURITIES LENDING – 29.44% | | Units | | | | | |
Mount Vernon Liquid Assets Portfolio, LLC, 5.03% (c) | | | 22,880,354 | | | | 22,880,354 | |
TOTAL INVESTMENTS PURCHASED WITH PROCEEDS FROM SECURITIES LENDING (Cost $22,880,354) | | | | | | | 22,880,354 | |
The accompanying notes are an integral part of these financial statements.
Schedule of Investments |
April 30, 2023 (Unaudited) (Continued) |
SHORT TERM INVESTMENTS - 0.23% | | | | | | | | |
Money Market Deposit Account - 0.23% | | Principal Amount | | | Value | |
U.S. Bank Money Market Deposit Account, 4.800% (d) | | $ | 179,182 | | | | 179,182 | |
TOTAL SHORT TERM INVESTMENTS (Cost $179,182) | | | | | | | 179,182 | |
| | | | | | | | | |
Total Investments (Cost $97,887,894) - 129.37% | | | | | | | 100,559,714 | |
Liabilities in Excess of Other Assets - (29.37)% | | | | | | | (22,829,677 | ) |
TOTAL NET ASSETS - 100.00% | | | | | | $ | 77,730,037 | |
| | | | | | | | | |
Asset Type | | % of Net Assets | | | | | |
Common Stocks | | | 99.70 | % | | | | |
Investments Purchased with Proceeds From Securities Lending | | | 29.44 | | | | | |
Short Term Investments | | | 0.23 | | | | | |
Total Investments | | | 129.37 | | | | | |
Liabilities in Excess of Other Assets | | | (29.37 | ) | | | | |
Net Assets | | | 100.00 | % | | | | |
Percentages are stated as a percent of net assets.
ADR - American Depositary Receipt
(a) | Non-income producing security. |
(b) | All or a portion of this security is on loan as of April 30, 2023. The total value of securities on loan is $12,127,505, or 15.60% of net assets. See Note 6. |
(c) | Represents annualized seven-day yield as of the end of the reporting period. |
(d) | The U.S. Bank Money Market Deposit Account (the “MMDA”) is a short-term investment vehicle in which the Fund holds cash balances. The MMDA will bear interest at a variable rate that is determined based on conditions and may change daily and by any amount. The rate shown is as of April 30, 2023. |
The accompanying notes are an integral part of these financial statements.
INNOVATOR IBD® BREAKOUT OPPORTUNITIES ETF
Schedule of Investments |
April 30, 2023 (Unaudited) |
| | | Shares | | | Value | |
COMMON STOCKS - 98.09% | | | | | | | | |
Advertising - 2.58% | | | | | | | | |
Omnicom Group, Inc. (a) | | | 3,951 | | | $ | 357,842 | |
| | | | | | | | | |
Apparel - 1.90% | | | | | | | | |
On Holding AG - Class A (b) | | | 1,215 | | | | 39,427 | |
Skechers USA, Inc. - Class A (b) | | | 4,212 | | | | 224,036 | |
| | | | | | | | 263,463 | |
Banks - 5.69% | | | | | | | | |
HDFC Bank Ltd. - ADR | | | 5,229 | | | | 364,984 | |
ICICI Bank Ltd. - ADR | | | 16,875 | | | | 383,907 | |
JPMorgan Chase & Co. | | | 288 | | | | 39,813 | |
| | | | | | | | 788,704 | |
Beverages - 5.05% | | | | | | | | |
PepsiCo, Inc. (a) | | | 1,998 | | | | 381,398 | |
The Coca-Cola Co. | | | 4,968 | | | | 318,697 | |
| | | | | | | | 700,095 | |
Biotechnology - 1.83% | | | | | | | | |
Intra-Cellular Therapies, Inc. (b) | | | 3,393 | | | | 210,875 | |
Vertex Pharmaceuticals, Inc. (b) | | | 126 | | | | 42,932 | |
| | | | | | | | 253,807 | |
Building Materials - 3.01% | | | | | | | | |
PGT Innovations, Inc. (b) | | | 1,548 | | | | 39,722 | |
The AZEK Co., Inc. (b) | | | 13,896 | | | | 377,138 | |
| | | | | | | | 416,860 | |
Commercial Services - 4.23% | | | | | | | | |
Cintas Corp. | | | 234 | | | | 106,650 | |
FTI Consulting, Inc. (b) | | | 1,080 | | | | 194,940 | |
Insperity, Inc. (a) | | | 1,638 | | | | 200,590 | |
Quanta Services, Inc. (a) | | | 243 | | | | 41,223 | |
Rollins, Inc. �� | | | 1,026 | | | | 43,348 | |
| | | | | | | | 586,751 | |
Computers - 1.61% | | | | | | | | |
ExlService Holdings, Inc. (b) | | | 1,251 | | | | 223,153 | |
| | | | | | | | | |
Diversified Financial Services - 1.05% | | | | | | | | |
Mastercard, Inc. - Class A | | | 279 | | | | 106,028 | |
Visa, Inc. - Class A (a) | | | 171 | | | | 39,797 | |
| | | | | | | | 145,825 | |
The accompanying notes are an integral part of these financial statements.
INNOVATOR IBD® BREAKOUT OPPORTUNITIES ETF
Schedule of Investments |
April 30, 2023 (Unaudited) (Continued) |
| | | Shares | | | Value | |
Environmental Control - 5.65% | | | | | | | | |
Energy Recovery, Inc. (b) | | | 1,791 | | | | 40,351 | |
Republic Services, Inc. | | | 1,530 | | | | 221,269 | |
Waste Connections, Inc. | | | 1,458 | | | | 202,881 | |
Waste Management, Inc. | | | 1,926 | | | | 319,812 | |
| | | | | | | | 784,313 | |
Food - 2.71% | | | | | | | | |
General Mills, Inc. | | | 4,239 | | | | 375,703 | |
| | | | | | | | | |
Food Service - 2.32% | | | | | | | | |
Sovos Brands, Inc. (b) | | | 18,792 | | | | 322,283 | |
| | | | | | | | | |
Healthcare - Products - 6.01% | | | | | | | | |
Hologic, Inc. (b) | | | 3,780 | | | | 325,118 | |
Insulet Corp. (a)(b) | | | 126 | | | | 40,073 | |
Intuitive Surgical, Inc. (b) | | | 1,062 | | | | 319,896 | |
ResMed, Inc. | | | 180 | | | | 43,373 | |
Stryker Corp. | | | 351 | | | | 105,177 | |
| | | | | | | | 833,637 | |
Healthcare - Services - 0.28% | | | | | | | | |
The Ensign Group, Inc. | | | 405 | | | | 39,321 | |
| | | | | | | | | |
Home Builders - 0.31% | | | | | | | | |
PulteGroup, Inc. (a) | | | 648 | | | | 43,513 | |
| | | | | | | | | |
Insurance - 3.80% | | | | | | | | |
Aon PLC - Class A (a) | | | 954 | | | | 310,222 | |
Arch Capital Group Ltd. (b) | | | 1,476 | | | | 110,803 | |
Kinsale Capital Group, Inc. (a) | | | 324 | | | | 105,854 | |
| | | | | | | | 526,879 | |
Internet - 1.44% | | | | | | | | |
Palo Alto Networks, Inc. (a)(b) | | | 1,098 | | | | 200,341 | |
| | | | | | | | | |
Leisure Time - 2.65% | | | | | | | | |
Life Time Group Holdings, Inc. (a)(b) | | | 17,703 | | | | 368,045 | |
| | | | | | | | | |
Media - 0.75% | | | | | | | | |
World Wrestling Entertainment, Inc. - Class A (a) | | | 972 | | | | 104,169 | |
The accompanying notes are an integral part of these financial statements.
INNOVATOR IBD® BREAKOUT OPPORTUNITIES ETF
Schedule of Investments |
April 30, 2023 (Unaudited) (Continued) |
| | | Shares | | | Value | |
Mining - 1.53% | | | | | | | | |
Franco-Nevada Corp. (a) | | | 1,395 | | | | 211,733 | |
| | | | | | | | | |
Oil & Gas - 13.82% | | | | | | | | |
BP PLC - ADR | | | 8,019 | | | | 323,006 | |
Civitas Resources, Inc. (a) | | | 3,042 | | | | 210,050 | |
Denbury, Inc. (b) | | | 2,295 | | | | 214,307 | |
Exxon Mobil Corp. | | | 2,745 | | | | 324,843 | |
Hess Corp. | | | 2,214 | | | | 321,163 | |
Shell PLC - ADR | | | 6,039 | | | | 374,297 | |
TotalEnergies SE - ADR | | | 1,674 | | | | 107,019 | |
Weatherford International PLC (b) | | | 648 | | | | 41,880 | |
| | | | | | | | 1,916,565 | |
Oil & Gas Services - 0.29% | | | | | | | | |
Atlas Energy Solutions, Inc. - Class A (b) | | | 2,232 | | | | 40,265 | |
| | | | | | | | | |
Pharmaceuticals - 6.11% | | | | | | | | |
AbbVie, Inc. | | | 1,305 | | | | 197,212 | |
Protagonist Therapeutics, Inc. (b) | | | 13,239 | | | | 299,201 | |
Sanofi - ADR | | | 6,543 | | | | 351,032 | |
| | | | | | | | 847,445 | |
Pipelines - 2.67% | | | | | | | | |
Targa Resources Corp. (a) | | | 4,905 | | | | 370,475 | |
| | | | | | | | | |
Retail - 9.47% | | | | | | | | |
Academy Sports & Outdoors, Inc. (a) | | | 5,562 | | | | 353,298 | |
Dick's Sporting Goods, Inc. (a) | | | 711 | | | | 103,102 | |
Lululemon Athletica, Inc. (b) | | | 108 | | | | 41,033 | |
O'Reilly Automotive, Inc. (b) | | | 117 | | | | 107,325 | |
Restaurant Brands International, Inc. (a) | | | 5,337 | | | | 374,284 | |
Wingstop, Inc. | | | 1,674 | | | | 334,984 | |
| | | | | | | | 1,314,026 | |
Software - 5.34% | | | | | | | | |
Adobe, Inc. (b) | | | 279 | | | | 105,339 | |
Cadence Design Systems, Inc. (b) | | | 495 | | | | 103,678 | |
Fiserv, Inc. (b) | | | 909 | | | | 111,007 | |
Intuit, Inc. | | | 90 | | | | 39,956 | |
Roper Technologies, Inc. | | | 837 | | | | 380,651 | |
| | | | | | | | 740,631 | |
The accompanying notes are an integral part of these financial statements.
INNOVATOR IBD® BREAKOUT OPPORTUNITIES ETF
Schedule of Investments |
April 30, 2023 (Unaudited) (Continued) |
| | | Shares | | | Value | |
Telecommunications - 0.79% | | | | | | | | |
Arista Networks, Inc. (a)(b) | | | 684 | | | | 109,549 | |
| | | | | | | | | |
Transportation - 5.20% | | | | | | | | |
Old Dominion Freight Line, Inc. | | | 117 | | | | 37,486 | |
XPO, Inc. (b) | | | 7,227 | | | | 319,289 | |
ZTO Express Cayman, Inc. - ADR | | | 13,158 | | | | 364,213 | |
| | | | | | | | 720,988 | |
TOTAL COMMON STOCKS (Cost $13,196,855) | | | | | | | 13,606,381 | |
| | | | | | | | | |
MASTER LIMITED PARTNERSHIPS - 1.50% | | | | | | | | |
Pipelines - 1.50% | | | | | | | | |
Enterprise Products Partners LP | | | 7,911 | | | | 208,138 | |
TOTAL MASTER LIMITED PARTNERSHIPS (Cost $207,172) | | | | | | | 208,138 | |
| | | | | | | | | |
INVESTMENTS PURCHASED WITH PROCEEDS FROM SECURITIES LENDING - 20.48% | | Units | | | | | |
Mount Vernon Liquid Assets Portfolio, LLC, 5.03% (c) | | | 2,841,107 | | | | 2,841,107 | |
TOTAL INVESTMENTS PURCHASED WITH PROCEEDS FROM SECURITIES LENDING (Cost $2,841,107) | | | | | | | 2,841,107 | |
| | | | | | | | | |
SHORT TERM INVESTMENTS - 0.40% | | | | | | | | |
Money Market Deposit Account - 0.40% | | Principal Amount | | | Value | |
U.S. Bank Money Market Deposit Account, 4.800% (d) | | $ | 55,992 | | | | 55,992 | |
TOTAL SHORT TERM INVESTMENTS (Cost $55,992) | | | | | | | 55,992 | |
| | | | | | | | | |
Total Investments (Cost $16,301,126) - 120.47% | | | | | | | 16,711,618 | |
Liabilities in Excess of Other Assets - (20.47)% | | | | | | | (2,839,207 | ) |
TOTAL NET ASSETS - 100.00% | | | | | | $ | 13,872,411 | |
The accompanying notes are an integral part of these financial statements.
INNOVATOR IBD® BREAKOUT OPPORTUNITIES ETF
Schedule of Investments |
April 30, 2023 (Unaudited) (Continued) |
Asset Type | | % of Net Assets | |
Common Stocks | | | 98.09 | % |
Master Limited Partnerships | | | 1.50 | |
Investments Purchased with Proceeds From Securities Lending | | | 20.48 | |
Short Term Investments | | | 0.40 | |
Total Investments | | | 120.47 | |
Liabilities in Excess of Other Assets | | | (20.47 | ) |
Net Assets | | | 100.00 | % |
Percentages are stated as a percent of net assets.
ADR American Depositary Receipt
(a) | All or a portion of this security is on loan as of April 30, 2023. The total value of securities on loan is $2,784,482, or 20.07% of net assets. See Note 6. |
(b) | Non-income producing security. |
(c) | Represents annualized seven-day yield as of the end of the reporting period. |
(d) | The U.S. Bank Money Market Deposit Account (the “MMDA”) is a short-term investment vehicle in which the Fund holds cash balances. The MMDA will bear interest at a variable rate that is determined based on conditions and may change daily and by any amount. The rate shown is as of April 30, 2023. |
The accompanying notes are an integral part of these financial statements.
INNOVATOR DEEPWATER FRONTIER TECH ETF
Schedule of Investments |
April 30, 2023 (Unaudited) |
| | | Shares | | | Value | |
COMMON STOCKS - 96.93% | | | | | | | | |
Aerospace & Defense - 5.87% | | | | | | | | |
AeroVironment, Inc. (a)(b) | | | 10,223 | | | $ | 1,029,354 | |
Lockheed Martin Corp. | | | 2,207 | | | | 1,025,041 | |
| | | | | | | | 2,054,395 | |
Auto Parts & Equipment - 7.86% | | | | | | | | |
LG Energy Solution Ltd. (a) | | | 4,052 | | | | 1,758,975 | |
Mobileye Global, Inc. - Class A (a)(b) | | | 26,434 | | | | 994,976 | |
| | | | | | | | 2,753,951 | |
Banks - 5.95% | | | | | | | | |
NU Holdings Ltd./Cayman Islands - Class A (a) | | | 404,038 | | | | 2,084,836 | |
| | | | | | | | | |
Commercial Services - 9.45% | | | | | | | | |
Adyen NV (a) | | | 712 | | | | 1,139,175 | |
Block, Inc. (a)(b) | | | 16,508 | | | | 1,003,521 | |
GXO Logistics, Inc. (a)(b) | | | 21,976 | | | | 1,167,585 | |
| | | | | | | | 3,310,281 | |
Computers - 7.83% | | | | | | | | |
AutoStore Holdings Ltd. (a) | | | 482,143 | | | | 1,032,868 | |
Crowdstrike Holdings, Inc. - Class A (a)(b) | | | 14,251 | | | | 1,710,832 | |
| | | | | | | | 2,743,700 | |
Electrical Components & Equipment - 3.09% | | | | | | | | |
Novanta, Inc. (a) | | | 7,081 | | | | 1,082,260 | |
| | | | | | | | | |
Electronics - 2.96% | | | | | | | | |
Trimble, Inc. (a) | | | 22,038 | | | | 1,037,990 | |
| | | | | | | | | |
Internet - 3.06% | | | | | | | | |
Uber Technologies, Inc. (a) | | | 34,497 | | | | 1,071,132 | |
| | | | | | | | | |
Miscellaneous Manufacturing - 2.97% | | | | | | | | |
Axon Enterprise, Inc. (a)(b) | | | 4,926 | | | | 1,037,957 | |
| | | | | | | | | |
Semiconductors - 23.99% | | | | | | | | |
Advanced Micro Devices, Inc. (a) | | | 11,467 | | | | 1,024,806 | |
ams-OSRAM AG (a) | | | 159,257 | | | | 1,093,962 | |
Applied Materials, Inc. (b) | | | 9,394 | | | | 1,061,804 | |
ASML Holding NV | | | 1,663 | | | | 1,050,919 | |
The accompanying notes are an integral part of these financial statements.
INNOVATOR DEEPWATER FRONTIER TECH ETF
Schedule of Investments |
April 30, 2023 (Unaudited) (Continued) |
| | | Shares | | | Value | |
Micron Technology, Inc. | | | 17,315 | | | | 1,114,393 | |
Skyworks Solutions, Inc. (b) | | | 9,791 | | | | 1,036,867 | |
Taiwan Semiconductor Manufacturing Co. Ltd. | | | 64,000 | | | | 1,045,068 | |
Teradyne, Inc. (b) | | | 10,656 | | | | 973,745 | |
| | | | | | | | 8,401,564 | |
Software - 20.82% | | | | | | | | |
Adobe, Inc. (a) | | | 2,914 | | | | 1,100,210 | |
Alteryx, Inc. - Class A (a)(b) | | | 33,820 | | | | 1,391,017 | |
Palantir Technologies, Inc. - Class A (a) | | | 130,603 | | | | 1,012,173 | |
Pegasystems, Inc. (b) | | | 23,217 | | | | 1,059,160 | |
Take-Two Interactive Software, Inc. (a)(b) | | | 9,041 | | | | 1,123,706 | |
Unity Software, Inc. (a)(b) | | | 59,549 | | | | 1,606,036 | |
| | | | | | | | 7,292,302 | |
Telecommunications - 3.08% | | | | | | | | |
Arista Networks, Inc. (a) | | | 6,724 | | | | 1,076,916 | |
TOTAL COMMON STOCKS (Cost $35,796,707) | | | | | | | 33,947,284 | |
| | | | | | | | | |
PREFERRED STOCKS - 3.06% | | | | | | | | |
Auto Manufacturers - 3.06% | | | | | | | | |
Dr Ing hc F Porsche AG (a) | | | 8,567 | | | | 1,070,498 | |
TOTAL PREFERRED STOCKS (Cost $761,334) | | | | | | | 1,070,498 | |
| | | | | | | | | |
INVESTMENTS PURCHASED WITH PROCEEDS FROM SECURITIES LENDING - 32.46% | | Units | | | | | |
Mount Vernon Liquid Assets Portfolio, LLC, 5.03% (c) | | | 11,367,570 | | | | 11,367,570 | |
TOTAL INVESTMENTS PURCHASED WITH PROCEEDS FROM SECURITIES LENDING (Cost $11,367,570) | | | | | | | 11,367,570 | |
The accompanying notes are an integral part of these financial statements.
INNOVATOR DEEPWATER FRONTIER TECH ETF
Schedule of Investments |
April 30, 2023 (Unaudited) (Continued) |
SHORT TERM INVESTMENTS - 0.04% | | | | | | | | |
Money Market Deposit Account - 0.04% | | Principal Amount | | | Value | |
U.S. Bank Money Market Deposit Account, 4.800% (d) | | $ | 13,673 | | | | 13,673 | |
TOTAL SHORT TERM INVESTMENTS (Cost $13,673) | | | | | | | 13,673 | |
| | | | | | | | | |
Total Investments (Cost $47,939,284) - 132.49% | | | | | | | 46,399,025 | |
Liabilities in Excess of Other Assets - (32.49)% | | | | | | | (11,378,018 | ) |
TOTAL NET ASSETS - 100.00% | | | | | | $ | 35,021,007 | |
| | | | | | | | | |
Country | | % of Net Assets | | | | | |
Austria | | | 3.12 | % | | | | |
Brazil | | | 5.95 | | | | | |
Germany | | | 3.06 | | | | | |
Israel | | | 2.84 | | | | | |
Netherlands | | | 6.25 | | | | | |
Norway | | | 2.95 | | | | | |
South Korea | | | 5.02 | | | | | |
Taiwan | | | 2.99 | | | | | |
United States | | | 67.81 | | | | | |
Total Country | | | 99.99 | | | | | |
Investments Purchased with Proceeds From Securities Lending | | | 32.46 | | | | | |
Short Term Investments | | | 0.04 | | | | | |
Total Investments | | | 132.49 | | | | | |
Liabilities in Excess of Other Assets | | | (32.49 | ) | | | | |
Net Assets | | | 100.00 | % | | | | |
Percentages are stated as a percent of net assets.
(a) | Non-income producing security. |
(b) | All or a portion of this security is on loan as of April 30, 2023. The total value of securities on loan is $10,960,217, or 31.30% of net assets. See Note 6. |
(c) | Represents annualized seven-day yield as of the end of the reporting period. |
(d) | The U.S. Bank Money Market Deposit Account (the “MMDA”) is a short-term investment vehicle in which the Fund holds cash balances. The MMDA will bear interest at a variable rate that is determined based on conditions and may change daily and by any amount. The rate shown is as of April 30, 2023. |
The accompanying notes are an integral part of these financial statements.
INNOVATOR S&P INVESTMENT GRADE PREFERRED ETF
Schedule of Investments |
April 30, 2023 (Unaudited) |
| | | Shares | | | Value | |
PREFERRED STOCKS - 99.31% (a) | | | | | | | | |
Banks - 36.66% (c) | | | | | | | | |
Bank of America Corp., Series 02, 5.603% to 05/30/2023 then 3-Month USD Libor + 0.650% | | | 19,172 | | | $ | 401,845 | |
Bank of America Corp., Series 4, 5.703% to 05/30/2023 then 3-Month USD Libor + 0.750% | | | 18,632 | | | | 400,774 | |
Bank of America Corp., Series 5, 5.415% to 05/21/2023 then 3-Month USD Libor + 0.500% | | | 19,330 | | | | 396,265 | |
Bank of America Corp., Series E, 5.214% to 05/15/2023 then 3-Month USD Libor + 0.350% | | | 19,144 | | | | 388,623 | |
Bank of America Corp., Series GG, 6.000% | | | 15,813 | | | | 393,744 | |
Bank of America Corp., Series HH, 5.875% | | | 16,197 | | | | 402,981 | |
Bank of America Corp., Series KK, 5.375% | | | 16,846 | | | | 398,913 | |
Bank of America Corp., Series LL, 5.000% (b) | | | 18,007 | | | | 401,016 | |
Bank of America Corp., Series NN, 4.375% | | | 20,476 | | | | 398,258 | |
Bank of America Corp., Series PP, 4.125% | | | 21,826 | | | | 400,071 | |
Bank of America Corp., Series QQ, 4.250% | | | 20,995 | | | | 396,596 | |
Bank of America Corp., Series SS, 4.750% | | | 18,800 | | | | 392,920 | |
Bank of Hawaii Corp., Series A, 4.375% | | | 288,901 | | | | 4,524,190 | |
Cullen/Frost Bankers, Inc., Series B, 4.450% | | | 253,554 | | | | 4,941,767 | |
JPMorgan Chase & Co., Series DD, 5.750% | | | 31,589 | | | | 796,359 | |
JPMorgan Chase & Co., Series EE, 6.000% | | | 31,082 | | | | 795,078 | |
JPMorgan Chase & Co., Series GG, 4.750% | | | 35,787 | | | | 802,345 | |
JPMorgan Chase & Co., Series JJ, 4.550% (b) | | | 37,229 | | | | 792,978 | |
JPMorgan Chase & Co., Series LL, 4.625% | | | 36,696 | | | | 787,496 | |
JPMorgan Chase & Co., Series MM, 4.200% (b) | | | 39,311 | | | | 793,689 | |
Morgan Stanley, Series A, 5.960% to 07/17/2023 then 3-Month USD Libor + 0.700% | | | 29,137 | | | | 599,639 | |
Morgan Stanley, Series E, 7.125% to 10/15/2023 then 3-Month USD Libor + 4.320% | | | 23,468 | | | | 597,965 | |
The accompanying notes are an integral part of these financial statements.
INNOVATOR S&P INVESTMENT GRADE PREFERRED ETF
Schedule of Investments |
April 30, 2023 (Unaudited) (Continued) |
| | | Shares | | | Value | |
Morgan Stanley, Series F, 6.875% to 01/15/2024 then 3-Month USD Libor + 3.940% | | | 23,930 | | | | 607,343 | |
Morgan Stanley, Series I, 6.375% to 10/15/2024 then 3-Month USD Libor + 3.708% | | | 24,007 | | | | 603,296 | |
Morgan Stanley, Series K, 5.850% to 04/15/2027 then 3-Month USD Libor + 3.491% (b) | | | 23,882 | | | | 597,289 | |
Morgan Stanley, Series L, 4.875% (b) | | | 26,582 | | | | 612,715 | |
Morgan Stanley, Series O, 4.250% | | | 31,131 | | | | 607,366 | |
Morgan Stanley, Series P, 6.500% | | | 23,203 | | | | 606,526 | |
Northern Trust Corp., Series E, 4.700% | | | 208,339 | | | | 4,687,628 | |
State Street Corp., Series D, 5.900% to 03/15/2024 then 3-Month USD Libor + 3.108% (b) | | | 98,488 | | | | 2,393,258 | |
State Street Corp., Series G, 5.350% to 03/15/2026 then 3-Month USD Libor + 3.709% (b) | | | 93,577 | | | | 2,378,727 | |
Truist Financial Corp., Series O, 5.250% (b) | | | 102,248 | | | | 2,406,918 | |
Truist Financial Corp., Series R, 4.750% (b) | | | 112,744 | | | | 2,422,869 | |
US Bancorp., Series B, 5.860% to 07/17/2023 then 3-Month USD Libor + 0.600% | | | 49,092 | | | | 915,075 | |
US Bancorp., Series K, 5.500% | | | 38,566 | | | | 919,028 | |
US Bancorp., Series L, 3.750% | | | 52,803 | | | | 901,347 | |
US Bancorp., Series M, 4.000% | | | 50,389 | | | | 911,537 | |
US Bancorp., Series O, 4.500% | | | 44,654 | | | | 914,514 | |
| | | | | | | | 42,688,948 | |
Capital Markets - 4.36% | | | | | | | | |
KKR & Co., Inc., Series C, 6.000%, 09/15/2023 | | | 79,487 | | | | 5,076,835 | |
| | | | | | | | | |
Close-End Funds - 4.17% | | | | | | | | |
The Gabelli Dividend & Income Trust, Series K, 4.250% | | | 240,080 | | | | 4,859,147 | |
The accompanying notes are an integral part of these financial statements.
INNOVATOR S&P INVESTMENT GRADE PREFERRED ETF
Schedule of Investments |
April 30, 2023 (Unaudited) (Continued) |
| | | Shares | | | Value | |
Diversified Financial Services - 5.72% | | | | | | | | |
Apollo Asset Management, Inc., Series A, 6.375% | | | 30,239 | | | | 747,206 | |
Apollo Asset Management, Inc., Series B, 6.375% | | | 29,378 | | | | 743,851 | |
The Charles Schwab Corp., Series D, 5.950% | | | 100,566 | | | | 2,531,246 | |
The Charles Schwab Corp., Series J, 4.450% (b) | | | 127,455 | | | | 2,640,868 | |
| | | | | | | | 6,663,171 | |
Insurance - 36.25% (c) | | | | | | | | |
Arch Capital Group Ltd., Series F, 5.450% | | | 103,762 | | | | 2,408,316 | |
Arch Capital Group Ltd., Series G, 4.550% | | | 123,942 | | | | 2,377,207 | |
Athene Holding Ltd., Series A, 6.350% to 06/30/2029 then 3-Month USD Libor + 4.253% | | | 31,058 | | | | 673,648 | |
Athene Holding Ltd., Series B, 5.625% (b) | | | 33,545 | | | | 673,248 | |
Athene Holding Ltd., Series C, 6.375% to 09/30/2025 then Five-Year Treasury Constant Maturity + 5.970% | | | 28,794 | | | | 649,305 | |
Athene Holding Ltd., Series D, 4.875% | | | 40,486 | | | | 676,521 | |
Athene Holding Ltd., Series E, 7.750% to 12/30/2027 then Five-Year Treasury Constant Maturity + 3.962% | | | 27,920 | | | | 690,182 | |
Axis Capital Holdings Ltd., Series E, 5.500% | | | 222,956 | | | | 5,063,331 | |
Equitable Holdings, Inc., Series A, 5.250% | | | 109,784 | | | | 2,357,062 | |
Equitable Holdings, Inc., Series C, 4.300% | | | 133,449 | | | | 2,354,040 | |
Lincoln National Corp., Series D, 9.000% (b) | | | 188,263 | | | | 4,964,495 | |
MetLife, Inc., Series A, 5.866% to 06/15/2023 then 3-Month USD Libor + 1.000% | | | 67,932 | | | | 1,600,478 | |
MetLife, Inc., Series E, 5.625% | | | 63,456 | | | | 1,586,400 | |
MetLife, Inc., Series F, 4.750% | | | 71,285 | | | | 1,556,152 | |
RenaissanceRe Holdings Ltd., Series F, 5.750% | | | 100,821 | | | | 2,435,835 | |
RenaissanceRe Holdings Ltd., Series G, 4.200% | | | 137,769 | | | | 2,525,306 | |
The Allstate Corp., 8.438% to 07/15/2023 then 3-Month USD Libor + 3.165%, 01/15/2053 | | | 62,311 | | | | 1,585,815 | |
The Allstate Corp., Series H, 5.100% | | | 70,808 | | | | 1,688,771 | |
The Allstate Corp., Series I, 4.750% | | | 71,381 | | | | 1,708,147 | |
The Hartford Financial Services Group, Inc., Series G, 6.000% | | | 186,934 | | | | 4,628,486 | |
| | | | | | | | 42,202,745 | |
The accompanying notes are an integral part of these financial statements.
INNOVATOR S&P INVESTMENT GRADE PREFERRED ETF
Schedule of Investments |
April 30, 2023 (Unaudited) (Continued) |
| | | Shares | | | Value | |
Real Estate Investment Trusts - 8.30% | | | | | | | | |
Kimco Realty Corp., Series L, 5.125% | | | 106,640 | | | | 2,418,595 | |
Kimco Realty Corp., Series M, 5.250% | | | 105,135 | | | | 2,405,489 | |
Public Storage, Series F, 5.150% | | | 14,152 | | | | 348,564 | |
Public Storage, Series G, 5.050% | | | 14,140 | | | | 345,723 | |
Public Storage, Series H, 5.600% | | | 13,285 | | | | 340,362 | |
Public Storage, Series I, 4.875% | | | 15,295 | | | | 351,479 | |
Public Storage, Series J, 4.700% | | | 15,741 | | | | 343,469 | |
Public Storage, Series K, 4.750% | | | 15,633 | | | | 343,613 | |
Public Storage, Series L, 4.625% | | | 16,046 | | | | 349,321 | |
Public Storage, Series M, 4.125% | | | 17,939 | | | | 347,120 | |
Public Storage, Series N, 3.875% | | | 18,535 | | | | 346,234 | |
Public Storage, Series O, 3.900% | | | 18,465 | | | | 345,480 | |
Public Storage, Series P, 4.000% | | | 18,015 | | | | 347,870 | |
Public Storage, Series Q, 3.950% | | | 18,555 | | | | 341,412 | |
Public Storage, Series R, 4.000% | | | 18,203 | | | | 340,396 | |
Public Storage, Series S, 4.100% | | | 18,092 | | | | 347,547 | |
| | | | | | | | 9,662,674 | |
Savings & Loans - 3.85% | | | | | | | | |
Washington Federal, Inc., Series A, 4.875% | | | 285,438 | | | | 4,481,377 | |
TOTAL PREFERRED STOCKS (Cost $134,729,452) | | | | | | | 115,634,897 | |
| | | | | | | | | |
INVESTMENTS PURCHASED WITH PROCEEDS FROM SECURITIES LENDING - 8.84% | | Units | | | | | |
TOTAL INVESTMENTS PURCHASED WITH PROCEEDS FROM SECURITIES LENDING (Cost $10,291,453) | | | | | | | 10,291,453 | |
The accompanying notes are an integral part of these financial statements.
INNOVATOR S&P INVESTMENT GRADE PREFERRED ETF
Schedule of Investments |
April 30, 2023 (Unaudited) (Continued) |
SHORT TERM INVESTMENTS - 1.00% | | | | | | | | |
Money Market Deposit Account - 1.00% | | Principal Amount | | | Value | |
U.S. Bank Money Market Deposit Account, 4.800% (e) | | $ | 1,164,794 | | | | 1,164,794 | |
TOTAL SHORT TERM INVESTMENTS (Cost $1,164,794) | | | | | | | 1,164,794 | |
| | | | | | | | | |
Total Investments (Cost $146,185,699) - 109.15% | | | | | | | 127,091,144 | |
Liabilities in Excess of Other Assets - (9.15)% | | | | | | | (10,658,788 | ) |
TOTAL NET ASSETS - 100.00% | | | | | | $ | 116,432,356 | |
| | | | | | | | | |
Asset Type | | % of Net Assets | | | | | |
Preferred Stocks | | | 99.31 | % | | | | |
Investments Purchased with Proceeds From Securities Lending | | | 8.84 | | | | | |
Short Term Investments | | | 1.00 | | | | | |
Total Investments | | | 109.15 | | | | | |
Liabilities in Excess of Other Assets | | | (9.15 | ) | | | | |
Net Assets | | | 100.00 | % | | | | |
Percentages are stated as a percent of net assets.
USD - United States Dollar
Libor - London Interbank Offered Rate
(a) | Securities with no stated maturity date are perpetual in nature. |
(b) | All or a portion of this security is on loan as of April 30, 2023. The total value of securities on loan is $10,053,416, or 8.63% of net assets. See Note 6. |
(c) | To the extent that the Index concentrates in the securities of issuers in a particular industry or sector, the Fund will also concentrate its investments to approximately the same extent. |
(d) | Represents annualized seven-day yield as of the end of the reporting period. |
(e) | The U.S. Bank Money Market Deposit Account (the “MMDA”) is a short-term investment vehicle in which the Fund holds cash balances. The MMDA will bear interest at a variable rate that is determined based on conditions and may change daily and by any amount. The rate shown is as of April 30, 2023. |
The accompanying notes are an integral part of these financial statements.
INNOVATOR LADDERED ALLOCATION POWER BUFFER ETF
Schedule of Investments |
April 30, 2023 (Unaudited) |
| | | Shares | | | Value | |
AFFILIATED EXCHANGE TRADED FUNDS - 99.89% (a) | | | | | | | | |
Innovator U.S. Equity Power Buffer ETF - January | | | 551,908 | | | $ | 18,560,666 | |
Innovator U.S. Equity Power Buffer ETF - February | | | 627,832 | | | | 18,558,714 | |
Innovator U.S. Equity Power Buffer ETF - March (b) | | | 571,532 | | | | 18,551,929 | |
Innovator U.S. Equity Power Buffer ETF - April (b) | | | 624,080 | | | | 18,553,898 | |
Innovator U.S. Equity Power Buffer ETF - May (b) | | | 642,006 | | | | 18,425,572 | |
Innovator U.S. Equity Power Buffer ETF - June | | | 598,747 | | | | 18,458,711 | |
Innovator U.S. Equity Power Buffer ETF - July (b) | | | 578,689 | | | | 18,587,492 | |
Innovator U.S. Equity Power Buffer ETF - August (b) | | | 622,335 | | | | 18,514,466 | |
Innovator U.S. Equity Power Buffer ETF - September (b) | | | 597,876 | | | | 18,540,135 | |
Innovator U.S. Equity Power Buffer ETF - October | | | 578,689 | | | | 18,564,343 | |
Innovator U.S. Equity Power Buffer ETF - November | | | 576,525 | | | | 18,575,636 | |
Innovator U.S. Equity Power Buffer ETF - December | | | 585,100 | | | | 18,541,819 | |
TOTAL AFFILIATED EXCHANGE TRADED FUNDS (Cost $211,767,919) | | | | | | | 222,433,381 | |
| | | | | | | | | |
INVESTMENTS PURCHASED WITH PROCEEDS FROM SECURITIES LENDING - 1.58% | | Units | | | | | |
Mount Vernon Liquid Assets Portfolio, LLC, 5.03% (c) | | | 3,518,125 | | | | 3,518,125 | |
TOTAL INVESTMENTS PURCHASED WITH PROCEEDS FROM SECURITIES LENDING (Cost $3,518,125) | | | | | | | 3,518,125 | |
The accompanying notes are an integral part of these financial statements.
INNOVATOR LADDERED ALLOCATION POWER BUFFER ETF
Schedule of Investments |
April 30, 2023 (Unaudited) (Continued) |
SHORT TERM INVESTMENTS - 0.11% | | | | | | | | |
Money Market Deposit Account - 0.11% | | Principal Amount | | | Value | |
U.S. Bank Money Market Deposit Account, 4.800% (d) | | $ | 248,607 | | | | 248,607 | |
TOTAL SHORT TERM INVESTMENTS (Cost $248,607) | | | | | | | 248,607 | |
| | | | | | | | | |
Total Investments (Cost $215,534,651) - 101.58% | | | | | | | 226,200,113 | |
Liabilities in Excess of Other Assets - (1.58)% | | | | | | | (3,518,846 | ) |
TOTAL NET ASSETS - 100.00% | | | | | | $ | 222,681,267 | |
| | | | | | | | | |
Asset Type | | % of Net Assets | | | | | |
Affiliated Exchange Traded Funds | | | 99.89 | % | | | | |
Investments Purchased with Proceeds From Securities Lending | | | 1.58 | | | | | |
Short Term Investments | | | 0.11 | | | | | |
Total Investments | | | 101.58 | | | | | |
Liabilities in Excess of Other Assets | | | (1.58 | ) | | | | |
Net Assets | | | 100.00 | % | | | | |
Percentages are stated as a percent of net assets.
(a) | Non-income producing security. |
(b) | All or a portion of this security is on loan as of April 30, 2023. The total value of securities on loan is $3,451,289, or 1.55% of net assets. See Note 6. |
(c) | Represents annualized seven-day yield as of the end of the reporting period. |
(d) | The U.S. Bank Money Market Deposit Account (the “MMDA”) is a short-term investment vehicle in which the Fund holds cash balances. The MMDA will bear interest at a variable rate that is determined based on conditions and may change daily and by any amount. The rate shown is as of April 30, 2023. |
The accompanying notes are an integral part of these financial statements.
INNOVATOR LADDERED ALLOCATION BUFFER ETF
Schedule of Investments |
April 30, 2023 (Unaudited) |
| | | Shares | | | Value | |
AFFILIATED EXCHANGE TRADED FUNDS - 99.96% (a) | | | | | | | | |
Innovator U.S. Equity Buffer ETF - January | | | 83,777 | | | $ | 2,987,990 | |
Innovator U.S. Equity Buffer ETF - February | | | 92,209 | | | | 2,987,987 | |
Innovator U.S. Equity Buffer ETF - March | | | 84,996 | | | | 2,991,859 | |
Innovator U.S. Equity Buffer ETF - April | | | 88,057 | | | | 2,986,902 | |
Innovator U.S. Equity Buffer ETF - May | | | 98,254 | | | | 2,964,883 | |
Innovator U.S. Equity Buffer ETF - June | | | 92,360 | | | | 2,972,200 | |
Innovator U.S. Equity Buffer ETF - July | | | 90,289 | | | | 2,985,677 | |
Innovator U.S. Equity Buffer ETF - August | | | 93,631 | | | | 2,979,338 | |
Innovator U.S. Equity Buffer ETF - September | | | 91,871 | | | | 2,982,739 | |
Innovator U.S. Equity Buffer ETF - October | | | 87,247 | | | | 2,990,243 | |
Innovator U.S. Equity Buffer ETF - November | | | 93,483 | | | | 2,988,652 | |
Innovator U.S. Equity Buffer ETF - December | | | 87,245 | | | | 2,986,004 | |
TOTAL AFFILIATED EXCHANGE TRADED FUNDS (Cost $34,267,393) | | | | | | | 35,804,474 | |
| | | | | | | | | |
SHORT TERM INVESTMENTS - 0.05% | | | | | | | | |
Money Market Deposit Account - 0.05% | | Principal Amount | | | | | |
U.S. Bank Money Market Deposit Account, 4.800% (b) | | $ | 16,019 | | | | 16,019 | |
TOTAL SHORT TERM INVESTMENTS (Cost $16,019) | | | | | | | 16,019 | |
| | | | | | | | | |
Total Investments (Cost $34,283,412) - 100.01% | | | | | | | 35,820,493 | |
Liabilities in Excess of Other Assets - (0.01)% | | | | | | | (2,877 | ) |
TOTAL NET ASSETS - 100.00% | | | | | | $ | 35,817,616 | |
| | | | | | | | | |
Asset Type | | % of Net Assets | | | | | |
Affiliated Exchange Traded Funds | | | 99.96 | % | | | | |
Short Term Investments | | | 0.05 | | | | | |
Total Investments | | | 100.01 | | | | | |
Liabilities in Excess of Other Assets | | | (0.01 | ) | | | | |
Net Assets | | | 100.00 | % | | | | |
Percentages are stated as a percent of net assets.
(a) | Non-income producing security. |
(b) | The U.S. Bank Money Market Deposit Account (the “MMDA”) is a short-term investment vehicle in which the Fund holds cash balances. The MMDA will bear interest at a variable rate that is determined based on conditions and may change daily and by any amount. The rate shown is as of April 30, 2023. |
The accompanying notes are an integral part of these financial statements.
INNOVATOR BUFFER STEP-UP STRATEGY ETF
Schedule of Investments | | | | | |
April 30, 2023 (Unaudited) | | | | | |
| | | Contracts | | | Notional Amount | | | Value | |
PURCHASED OPTIONS - 103.74% (a)(b) | | | | | | | | | | | | |
CALL OPTIONS - 99.62% | | | | | | | | | | | | |
SPY SPDR S&P 500® Trust ETF, Expires 2/29/2024, Strike Price $3.99 | | | 771 | | | $ | 32,068,203 | | | $ | 31,440,463 | |
| | | | | | | | | | | | 31,440,463 | |
PUT OPTIONS - 4.12% | | | | | | | | | | | | |
SPY SPDR S&P 500® Trust ETF, Expires 2/29/2024, Strike Price $396.25 | | | 771 | | | | 32,068,203 | | | | 1,299,312 | |
| | | | | | | | | | | | 1,299,312 | |
TOTAL PURCHASED OPTIONS (Cost $31,672,340) | | | | | | | | | | | 32,739,775 | |
| | | | | | | | | | | | | |
SHORT TERM INVESTMENTS - 0.07% | | Principal Amount | | | | | | | | | |
Money Market Deposit Account- 0.07% | | | | | | | | | | | | |
U.S. Bank Money Market Deposit Account, 4.800% (c) | | $ | 21,288 | | | | | | | | 21,288 | |
TOTAL SHORT TERM INVESTMENTS (Cost $21,288) | | | | | | | | | | | 21,288 | |
| | | | | | | | | | | | | |
Total Investments (Cost $31,693,628) - 103.81% | | | | | | | | | | | 32,761,063 | |
Liabilities in Excess of Other Assets - (3.81)% | | | | | | | | | | | (1,201,790 | ) |
TOTAL NET ASSETS - 100.00% | | | | | | | | | | $ | 31,559,273 | |
The accompanying notes are an integral part of these financial statements.
INNOVATOR BUFFER STEP-UP STRATEGY ETF
Schedule of Investments | | | | | |
April 30, 2023 (Unaudited) (Continued) | | | | | |
Asset Type | | % of Net Assets | |
Purchased Options | | | 103.74 | % |
Short Term Investments | | | 0.07 | |
Total Investments | | | 103.81 | |
Liabilities in Excess of Other Assets | | | (3.81 | ) |
Net Assets | | | 100.00 | % |
Percentages are stated as a percent of net assets.
(b) | Purchased option contracts are held in connection with corresponding option contracts written short. |
(c) | The U.S. Bank Money Market Deposit Account (the “MMDA”) is a short-term investment vehicle in which the Fund holds cash balances. The MMDA will bear interest at a variable rate that is determined based on conditions and may change daily and by any amount. The rate shown is as of April 30, 2023. |
Schedule of Options Written (a) | | | | | |
April 30, 2023 (Unaudited) (Continued) | | | | | |
| | | | | | | | | | | | | | | | | | | | | |
Description | | Expiration | | | Strike Price | | | Contracts | | | Notional Amount | | | Value | |
Call Options | | | | | | | | | | | | | | | | | | | | |
SPY SPDR S&P 500® Trust ETF | | 2/29/2024 | | | $ | 479.47 | | | | 771 | | | $ | (32,068,203 | ) | | $ | (398,445 | ) |
| | | | | | | | | | | | | | | | | | | | (398,445 | ) |
Put Options | | | | | | | | | | | | | | | | | | | | |
SPY SPDR S&P 500® Trust ETF | | 2/29/2024 | | | | 360.61 | | | | 771 | | | | (32,068,203 | ) | | | (780,661 | ) |
| | | | | | | | | | | | | | | | | | | | (780,661 | ) |
Total Options Written (Premiums Received $1,410,369) | | | | | | | | | | | | | | | $ | (1,179,106 | ) |
| | | | | | | | | | | | | | | | | | | | | |
(a) Exchange-Traded. | | | | | | | | | | | | | |
The accompanying notes are an integral part of these financial statements.
INNOVATOR POWER BUFFER STEP-UP STRATEGY ETF
Schedule of Investments | | | | | |
April 30, 2023 (Unaudited) | | | | | |
| | | Contracts | | | Notional Amount | | | Value | |
PURCHASED OPTIONS - 104.46% (a)(b) | | | | | | | | | | | | |
CALL OPTIONS - 100.32% | | | | | | | | | | | | |
SPY SPDR S&P 500® Trust ETF, Expires 2/29/2024, Strike Price $3.94 | | | 1,678 | | | $ | 69,793,054 | | | $ | 68,434,864 | |
| | | | | | | | | | | | 68,434,864 | |
PUT OPTIONS - 4.14% | | | | | | | | | | | | |
SPY SPDR S&P 500® Trust ETF, Expires 2/29/2024, Strike Price $396.24 | | | 1,678 | | | | 69,793,054 | | | | 2,827,430 | |
| | | | | | | | | | | | 2,827,430 | |
TOTAL PURCHASED OPTIONS (Cost $69,125,562) | | | | | | | | | | | 71,262,294 | |
| | | | | | | | | | | | | |
SHORT TERM INVESTMENTS - 0.18% | | Principal Amount | | | | | | | | | |
Money Market Deposit Account- 0.18% | | | | | | | | | | | | |
U.S. Bank Money Market Deposit Account, 4.800% (c) | | $ | 124,963 | | | | | | | | 124,963 | |
TOTAL SHORT TERM INVESTMENTS (Cost $124,963) | | | | | | | | | | | 124,963 | |
| | | | | | | | | | | | | |
Total Investments (Cost $69,250,525) - 104.64% | | | | | | | | | | | 71,387,257 | |
Liabilities in Excess of Other Assets - (4.64)% | | | | | | | | | | | (3,167,848 | ) |
TOTAL NET ASSETS - 100.00% | | | | | | | | | | $ | 68,219,409 | |
| | | | | | | | | | | | | |
The accompanying notes are an integral part of these financial statements.
INNOVATOR POWER BUFFER STEP-UP STRATEGY ETF
Schedule of Investments | | | | | |
April 30, 2023 (Unaudited) (Continued) | | | | | |
Asset Type | | % of Net Assets | |
Purchased Options | | | 104.46 | % |
Short Term Investments | | | 0.18 | |
Total Investments | | | 104.64 | |
Liabilities in Excess of Other Assets | | | (4.64 | ) |
Net Assets | | | 100.00 | % |
Percentages are stated as a percent of net assets.
(b) | Purchased option contracts are held in connection with corresponding option contracts written short. |
(c) | The U.S. Bank Money Market Deposit Account (the “MMDA”) is a short-term investment vehicle in which the Fund holds cash balances. The MMDA will bear interest at a variable rate that is determined based on conditions and may change daily and by any amount. The rate shown is as of April 30, 2023. |
Schedule of Options Written (a) | | | | | |
April 30, 2023 (Unaudited) (Continued) | | | | | |
| | | | | | | | | | | | | | | | | | | | | |
Description | | Expiration | | | Strike Price | | | Contracts | | | Notional Amount | | | Value | |
Call Options | | | | | | | | | | | | | | | | | | | | |
SPY SPDR S&P 500® Trust ETF | | 2/29/2024 | | | $ | 458.59 | | | | 1,678 | | | $ | (69,793,054 | ) | | $ | (1,927,669 | ) |
| | | | | | | | | | | | | | | | | | | | (1,927,669 | ) |
Put Options | | | | | | | | | | | | | | | | | | | | |
SPY SPDR S&P 500® Trust ETF | | 2/29/2024 | | | | 336.81 | | | | 1,678 | | | | (69,793,054 | ) | | | (1,193,159 | ) |
| | | | | | | | | | | | | | | | | | | | (1,193,159 | ) |
Total Options Written (Premiums Received $3,135,096) | | | | | | | | | | | | | | | | | | $ | (3,120,828 | ) |
| | | | | | | | | | | | | | | | | | | | | |
(a) Exchange-Traded. | | | | | | | | | | | | | | | | | | | | |
The accompanying notes are an integral part of these financial statements.
INNOVATOR HEDGED TSLA STRATEGY ETF
Schedule of Investments | | | | | |
April 30, 2023 (Unaudited) | | | | | |
| | | Contracts | | | Notional Amount | | | Value | |
PURCHASED OPTIONS - 2.92% (a)(b) | | | | | | | | | | | | |
CALL OPTIONS - 2.92% | | | | | | | | | | | | |
Tesla, Inc., Expires 6/30/2023, Strike Price $186.24 | | | 95 | | | $ | 1,560,945 | | | $ | 52,990 | |
TOTAL PURCHASED OPTIONS (Cost $344,878) | | | | | | | | | | | 52,990 | |
| | | | | | | | | | | | | |
SHORT TERM INVESTMENTS - 97.61% | | Principal Amount | | | | | | | | | |
U.S. Treasury Bill - 97.47% | | | | | | | | | | | | |
United States Treasury Bill, 3.128%, 6/29/2023 (c)(d) | | $ | 1,783,000 | | | | | | | | 1,768,656 | |
| | | | | | | | | | | | 1,768,656 | |
Money Market Deposit Account - 0.14% | | | | | | | | | | | | |
U.S. Bank Money Market Deposit Account, 4.800% (e) | | | 2,514 | | | | | | | | 2,514 | |
| | | | | | | | | | | | 2,514 | |
TOTAL SHORT TERM INVESTMENTS (Cost $1,772,024) | | | | | | | | | | | 1,771,170 | |
| | | | | | | | | | | | | |
Total Investments (Cost $2,116,902) - 100.53% | | | | | | | | | | | 1,824,160 | |
Liabilities in Excess of Other Assets - (0.53)% | | | | | | | | | | | (9,551 | ) |
TOTAL NET ASSETS - 100.00% | | | | | | | | | | $ | 1,814,609 | |
| | | | | | | | | | | | | |
Asset Type | | % of Net Assets | | | | | | | | | |
Purchased Options | | | 2.92 | % | | | | | | | | |
Short Term Investments | | | 97.61 | | | | | | | | | |
Total Investments | | | 100.53 | | | | | | | | | |
Liabilities in Excess of Other Assets | | | (0.53 | ) | | | | | | | | |
Net Assets | | | 100.00 | % | | | | | | | | |
The accompanying notes are an integral part of these financial statements.
INNOVATOR HEDGED TSLA STRATEGY ETF
Schedule of Investments | | | | | |
April 30, 2023 (Unaudited) (Continued) | | | | | |
Asset Type | | % of Net Assets | |
Purchased Options | | | 2.92 | % |
Short Term Investments | | | 97.61 | |
Total Investments | | | 100.53 | |
Liabilities in Excess of Other Assets | | | (0.53 | ) |
Net Assets | | | 100.00 | % |
Percentages are stated as a percent of net assets.
(b) | Purchased option contracts are held in connection with corresponding option contracts written short. |
(c) | Rate disclosed is the effective yield as of April 30, 2023. |
(d) | All or a portion of the security can be pledged as collateral in connection with options written contracts. |
(e) | The U.S. Bank Money Market Deposit Account (the “MMDA”) is a short-term investment vehicle in which the Fund holds cash balances. The MMDA will bear interest at a variable rate that is determined based on conditions and may change daily and by any amount. The rate shown is as of April 30, 2023. |
The accompanying notes are an integral part of these financial statements.
INNOVATOR UNCAPPED ACCELERATED U.S. EQUITY ETF
Schedule of Options Written (a) | | | | | |
April 30, 2023 (Unaudited) (Continued) | | | | | |
| | | | | | | | | | | | | | | | | | | | | |
Description | | Expiration | | | Strike Price | | | Contracts | | | Notional Amount | | | Value | |
Call Options | | | | | | | | | | | | | | | | | | | | |
Tesla, Inc. | | 6/30/2023 | | | $ | 227.93 | | | | 95 | | | $ | (1,560,945 | ) | | $ | (8,688 | ) |
Total Options Written (Premiums Received $147,790) | | | | | | | | | | | | | | | | | | $ | (8,688 | ) |
| | | | | | | | | | | | | | | | | | | | | |
(a) Exchange-Traded. | | | | | | | | | | | | | | | | | | | | |
Schedule of Investments | | | | | |
April 30, 2023 (Unaudited) | | | | | |
| | | Contracts | | | Notional Amount | | | Value | |
PURCHASED OPTIONS - 109.92% (a)(b) | | | | | | | | | | | | |
CALL OPTIONS - 109.92% | | | | | | | | | | | | |
SPY SPDR S&P 500® Trust ETF, Expires 6/30/2023, Strike Price $440.99 | | | 117 | | | $ | 4,866,381 | | | $ | 13,482 | |
SPY SPDR S&P 500® Trust ETF, Expires 6/30/2023, Strike Price $4.20 | | | 72 | | | | 2,994,696 | | | | 2,955,022 | |
SPY SPDR S&P 500® Trust ETF, Expires 9/29/2023, Strike Price $375.04 | | | 106 | | | | 4,408,858 | | | | 560,125 | |
SPY SPDR S&P 500® Trust ETF, Expires 9/29/2023, Strike Price $3.63 | | | 72 | | | | 2,994,696 | | | | 2,947,873 | |
SPY SPDR S&P 500® Trust ETF, Expires 12/29/2023, Strike Price $401.55 | | | 108 | | | | 4,492,044 | | | | 424,717 | |
SPY SPDR S&P 500® Trust ETF, Expires 12/29/2023, Strike Price $3.86 | | | 72 | | | | 2,994,696 | | | | 2,935,087 | |
SPY SPDR S&P 500® Trust ETF, Expires 3/28/2024, Strike Price $429.86 | | | 119 | | | | 4,949,567 | | | | 327,682 | |
SPY SPDR S&P 500® Trust ETF, Expires 3/28/2024, Strike Price $4.13 | | | 72 | | | | 2,994,696 | | | | 2,925,508 | |
TOTAL PURCHASED OPTIONS (Cost $12,539,606) | | | | | | | | | | | 13,089,496 | |
| | | | | | | | | | | | | |
SHORT TERM INVESTMENTS - 0.48% | | Principal Amount | | | | | | | | | |
Money Market Deposit Account- 0.48% | | | | | | | | | | | | |
U.S. Bank Money Market Deposit Account, 4.800% (c) | | $ | 56,635 | | | | | | | | 56,635 | |
TOTAL SHORT TERM INVESTMENTS (Cost $56,635) | | | | | | | | | | | 56,635 | |
| | | | | | | | | | | | | |
Total Investments (Cost $12,596,241) - 110.40% | | | | | | | | | | | 13,146,131 | |
Liabilities in Excess of Other Assets - (10.40)% | | | | | | | | | | | (1,238,065 | ) |
TOTAL NET ASSETS - 100.00% | | | | | | | | | | $ | 11,908,066 | |
The accompanying notes are an integral part of these financial statements.
INNOVATOR UNCAPPED ACCELERATED U.S. EQUITY ETF
Schedule of Investments | | | | | |
April 30, 2023 (Unaudited) (Continued) | | | | | |
Asset Type | | % of Net Assets | |
Purchased Options | | | 109.92 | % |
Short Term Investments | | | 0.48 | |
Total Investments | | | 110.40 | |
Liabilities in Excess of Other Assets | | | (10.40 | ) |
Net Assets | | | 100.00 | % |
Percentages are stated as a percent of net assets.
(b) | Purchased option contracts are held in connection with corresponding option contracts written short. |
(c) | The U.S. Bank Money Market Deposit Account (the “MMDA”) is a short-term investment vehicle in which the Fund holds cash balances. The MMDA will bear interest at a variable rate that is determined based on conditions and may change daily and by any amount. The rate shown is as of April 30, 2023. |
Schedule of Options Written (a) | | | | | |
April 30, 2023 (Unaudited) (Continued) | | | | | |
| | | | | | | | | | | | | | | | | | | | | |
Description | | Expiration | | | Strike Price | | | Contracts | | | Notional Amount | | | Value | |
Call Options | | | | | | | | | | | | | | | | | | | | |
SPY SPDR S&P 500® Trust ETF | | 6/30/2023 | | | $ | 419.99 | | | | 72 | | | $ | (2,994,696 | ) | | $ | (62,112 | ) |
SPY SPDR S&P 500® Trust ETF | | 9/29/2023 | | | | 357.20 | | | | 72 | | | | (2,994,696 | ) | | | (491,216 | ) |
SPY SPDR S&P 500® Trust ETF | | 12/29/2023 | | | | 382.45 | | | | 72 | | | | (2,994,696 | ) | | | (386,013 | ) |
SPY SPDR S&P 500® Trust ETF | | 3/28/2024 | | | | 409.41 | | | | 72 | | | | (2,994,696 | ) | | | (292,083 | ) |
Total Options Written (Premiums Received $1,126,278) | | | | | | | | | | | | | | | | | | $ | (1,231,424 | ) |
| | | | | | | | | | | | | | | | | | | | | |
(a) Exchange-Traded. | | | | | | | | | | | | | | | | | | | | |
The accompanying notes are an integral part of these financial statements.
INNOVATOR GRADIENT TACTICAL ROTATION STRATEGY ETF
Schedule of Investments | | | | | |
April 30, 2023 (Unaudited) | | | | | |
| | | Shares | | | Value | |
COMMON STOCKS - 99.67% | | | | | | | | |
Airlines - 2.67% | | | | | | | | |
American Airlines Group, Inc. (a) | | | 178,482 | | | $ | 2,434,494 | |
Delta Air Lines, Inc. (a) | | | 63,921 | | | | 2,193,130 | |
United Airlines Holdings, Inc. (a) | | | 55,084 | | | | 2,412,679 | |
| | | | | | | | 7,040,303 | |
Apparel - 2.94% | | | | | | | | |
NIKE, Inc. - Class B | | | 21,395 | | | | 2,711,174 | |
Ralph Lauren Corp. | | | 22,026 | | | | 2,528,365 | |
Tapestry, Inc. | | | 61,635 | | | | 2,515,324 | |
| | | | | | | | 7,754,863 | |
Auto Manufacturers - 2.79% | | | | | | | | |
Ford Motor Co. | | | 205,881 | | | | 2,445,866 | |
General Motors Co. | | | 63,923 | | | | 2,112,016 | |
Tesla, Inc. (a) | | | 16,930 | | | | 2,781,769 | |
| | | | | | | | 7,339,651 | |
Auto Parts & Equipment - 1.09% | | | | | | | | |
Aptiv PLC (a) | | | 27,834 | | | | 2,863,005 | |
| | | | | | | | | |
Banks - 0.74% | | | | | | | | |
First Republic Bank/CA (b) | | | 17,857 | | | | 62,678 | |
State Street Corp. | | | 26,257 | | | | 1,897,331 | |
| | | | | | | | 1,960,009 | |
Biotechnology - 1.95% | | | | | | | | |
Illumina, Inc. (a) | | | 13,845 | | | | 2,845,978 | |
Moderna, Inc. (a) | | | 17,299 | | | | 2,298,864 | |
| | | | | | | | 5,144,842 | |
Building Materials - 0.80% | | | | | | | | |
Mohawk Industries, Inc. (a) | | | 19,820 | | | | 2,098,938 | |
| | | | | | | | | |
Chemicals - 0.71% | | | | | | | | |
Albemarle Corp. | | | 10,069 | | | | 1,867,397 | |
| | | | | | | | | |
Commercial Services - 1.90% | | | | | | | | |
PayPal Holdings, Inc. (a) | | | 38,705 | | | | 2,941,580 | |
United Rentals, Inc. | | | 5,686 | | | | 2,053,271 | |
| | | | | | | | 4,994,851 | |
The accompanying notes are an integral part of these financial statements.
INNOVATOR GRADIENT TACTICAL ROTATION STRATEGY ETF
Schedule of Investments | | | | | |
April 30, 2023 (Unaudited) (Continued) | | | | | |
| | | Shares | | | Value | |
Computers - 5.71% | | | | | | | | |
Apple, Inc. | | | 16,505 | | | | 2,800,568 | |
EPAM Systems, Inc. (a) | | | 8,531 | | | | 2,409,496 | |
Fortinet, Inc. (a) | | | 50,399 | | | | 3,177,657 | |
HP, Inc. | | | 81,737 | | | | 2,428,406 | |
Seagate Technology Holdings PLC | | | 34,156 | | | | 2,007,348 | |
Western Digital Corp. (a) | | | 64,506 | | | | 2,221,587 | |
| | | | | | | | 15,045,062 | |
Cosmetics & Personal Care - 0.91% | | | | | | | | |
The Estee Lauder Cos., Inc. - Class A | | | 9,719 | | | | 2,397,872 | |
| | | | | | | | | |
Distribution & Wholesale - 0.83% | | | | | | | | |
Pool Corp. | | | 6,238 | | | | 2,191,534 | |
| | | | | | | | | |
Diversified Financial Services - 6.91% | | | | | | | | |
Ameriprise Financial, Inc. | | | 6,950 | | | | 2,120,584 | |
BlackRock, Inc. | | | 3,459 | | | | 2,321,681 | |
Capital One Financial Corp. | | | 22,362 | | | | 2,175,823 | |
Discover Financial Services | | | 20,816 | | | | 2,153,832 | |
Franklin Resources, Inc. (b) | | | 77,862 | | | | 2,092,931 | |
Invesco Ltd. | | | 147,717 | | | | 2,530,392 | |
Synchrony Financial | | | 72,622 | | | | 2,143,075 | |
T Rowe Price Group, Inc. | | | 23,806 | | | | 2,674,127 | |
| | | | | | | | 18,212,445 | |
Electrical Components & Equipment - 1.23% | | | | | | | | |
Generac Holdings, Inc. (a) | | | 31,624 | | | | 3,232,605 | |
| | | | | | | | | |
Electronics - 0.90% | | | | | | | | |
Trimble, Inc. (a) | | | 50,182 | | | | 2,363,572 | |
| | | | | | | | | |
Energy-Alternate Sources - 1.83% | | | | | | | | |
Enphase Energy, Inc. (a) | | | 13,749 | | | | 2,257,586 | |
SolarEdge Technologies, Inc. (a) | | | 8,943 | | | | 2,554,389 | |
| | | | | | | | 4,811,975 | |
Entertainment - 1.35% | | | | | | | | |
Caesars Entertainment, Inc. (a) | | | 78,350 | | | | 3,548,472 | |
The accompanying notes are an integral part of these financial statements.
INNOVATOR GRADIENT TACTICAL ROTATION STRATEGY ETF
Schedule of Investments | | | | | |
April 30, 2023 (Unaudited) (Continued) | | | | | |
| | | Shares | | | Value | |
Healthcare - Products - 3.26% | | | | | | | | |
Align Technology, Inc. (a) | | | 9,349 | | | | 3,041,230 | |
IDEXX Laboratories, Inc. (a) | | | 4,859 | | | | 2,391,405 | |
Intuitive Surgical, Inc. (a) | | | 10,451 | | | | 3,148,050 | |
| | | | | | | | 8,580,685 | |
Healthcare - Services - 0.64% | | | | | | | | |
Catalent, Inc. (a) | | | 33,847 | | | | 1,696,412 | |
| | | | | | | | | |
Home Builders - 3.25% | | | | | | | | |
DR Horton, Inc. (b) | | | 24,748 | | | | 2,717,825 | |
Lennar Corp. - Class A | | | 24,355 | | | | 2,747,488 | |
PulteGroup, Inc. (b) | | | 45,982 | | | | 3,087,691 | |
| | | | | | | | 8,553,004 | |
Insurance - 0.67% | | | | | | | | |
Lincoln National Corp. | | | 80,709 | | | | 1,753,807 | |
| | | | | | | | | |
Internet - 7.93% | | | | | | | | |
Alphabet, Inc. - Class C (a) | | | 25,957 | | | | 2,809,067 | |
Amazon.com, Inc. (a) | | | 31,786 | | | | 3,351,834 | |
Etsy, Inc. (a)(b) | | | 27,508 | | | | 2,779,133 | |
Expedia Group, Inc. (a) | | | 22,875 | | | | 2,149,335 | |
Match Group, Inc. (a) | | | 71,119 | | | | 2,624,291 | |
Meta Platforms, Inc. - Class A (a) | | | 18,316 | | | | 4,401,700 | |
Netflix, Inc. (a) | | | 8,446 | | | | 2,786,589 | |
| | | | | | | | 20,901,949 | |
Leisure Time - 3.47% | | | | | | | | |
Carnival Corp. (a)(b) | | | 334,624 | | | | 3,081,887 | |
Norwegian Cruise Line Holdings Ltd. (a)(b) | | �� | 226,470 | | | | 3,023,375 | |
Royal Caribbean Cruises Ltd. (a)(b) | | | 46,254 | | | | 3,026,399 | |
| | | | | | | | 9,131,661 | |
Lodging - 2.32% | | | | | | | | |
MGM Resorts International | | | 70,235 | | | | 3,154,956 | |
Wynn Resorts Ltd. (a) | | | 25,965 | | | | 2,967,280 | |
| | | | | | | | 6,122,236 | |
Media - 1.57% | | | | | | | | |
DISH Network Corp. - Class A (a)(b) | | | 226,829 | | | | 1,703,486 | |
Warner Bros Discovery, Inc. (a)(b) | | | 178,441 | | | | 2,428,582 | |
| | | | | | | | 4,132,068 | |
The accompanying notes are an integral part of these financial statements.
INNOVATOR GRADIENT TACTICAL ROTATION STRATEGY ETF
Schedule of Investments | | | | | |
April 30, 2023 (Unaudited) (Continued) | | | | | |
| | | Shares | | | Value | |
Mining - 0.90% | | | | | | | | |
Freeport-McMoRan, Inc. | | | 62,692 | | | | 2,376,654 | |
| | | | | | | | | |
Office & Business Equipment - 0.98% | | | | | | | | |
Zebra Technologies Corp. - Class A (a) | | | 8,995 | | | | 2,590,830 | |
| | | | | | | | | |
Pharmaceuticals - 1.16% | | | | | | | | |
Dexcom, Inc. (a) | | | 25,204 | | | | 3,058,253 | |
| | | | | | | | | |
Retail - 1.79% | | | | | | | | |
Bath & Body Works, Inc. | | | 62,981 | | | | 2,210,633 | |
CarMax, Inc. (a)(b) | | | 35,955 | | | | 2,517,929 | |
| | | | | | | | 4,728,562 | |
Semiconductors - 20.05% | | | | | | | | |
Advanced Micro Devices, Inc. (a) | | | 46,607 | | | | 4,165,269 | |
Analog Devices, Inc. | | | 14,018 | | | | 2,521,558 | |
Applied Materials, Inc. | | | 28,558 | | | | 3,227,911 | |
Broadcom, Inc. | | | 4,104 | | | | 2,571,156 | |
Intel Corp. | | | 84,541 | | | | 2,625,843 | |
KLA Corp. | | | 7,711 | | | | 2,980,610 | |
Lam Research Corp. | | | 6,697 | | | | 3,509,764 | |
Microchip Technology, Inc. | | | 36,467 | | | | 2,661,726 | |
Micron Technology, Inc. | | | 47,501 | | | | 3,057,164 | |
Monolithic Power Systems, Inc. | | | 8,462 | | | | 3,909,191 | |
NVIDIA Corp. | | | 19,272 | | | | 5,347,788 | |
NXP Semiconductors NV | | | 15,558 | | | | 2,547,467 | |
ON Semiconductor Corp. (a)(b) | | | 45,699 | | | | 3,288,500 | |
Qorvo, Inc. (a) | | | 27,956 | | | | 2,574,188 | |
QUALCOMM, Inc. | | | 22,343 | | | | 2,609,662 | |
Skyworks Solutions, Inc. | | | 24,047 | | | | 2,546,577 | |
Teradyne, Inc. (b) | | | 29,209 | | | | 2,669,118 | |
| | | | | | | | 52,813,492 | |
Software - 14.43% | | | | | | | | |
Adobe, Inc. (a) | | | 7,274 | | | | 2,746,371 | |
ANSYS, Inc. (a) | | | 10,352 | | | | 3,249,700 | |
Autodesk, Inc. (a) | | | 14,012 | | | | 2,729,397 | |
Cadence Design Systems, Inc. (a) | | | 13,548 | | | | 2,837,629 | |
Ceridian HCM Holding, Inc. (a) | | | 46,398 | | | | 2,945,345 | |
The accompanying notes are an integral part of these financial statements.
INNOVATOR GRADIENT TACTICAL ROTATION STRATEGY ETF
Schedule of Investments | | | | | |
April 30, 2023 (Unaudited) (Continued) | | | | | |
| | | Shares | | | Value | |
Intuit, Inc. | | | 7,699 | | | | 3,417,972 | |
Microsoft Corp. | | | 9,394 | | | | 2,886,400 | |
MSCI, Inc. | | | 4,731 | | | | 2,282,471 | |
Paycom Software, Inc. (a) | | | 9,766 | | | | 2,835,753 | |
Salesforce, Inc. (a) | | | 16,856 | | | | 3,343,725 | |
ServiceNow, Inc. (a) | | | 6,917 | | | | 3,177,808 | |
Synopsys, Inc. (a) | | | 7,159 | | | | 2,658,280 | |
Tyler Technologies, Inc. (a) | | | 7,664 | | | | 2,904,886 | |
| | | | | | | | 38,015,737 | |
Telecommunications - 1.17% | | | | | | | | |
Arista Networks, Inc. (a) | | | 19,276 | | | | 3,087,244 | |
| | | | | | | | | |
Transportation - 0.82% | | | | | | | | |
Old Dominion Freight Line, Inc. | | | 6,755 | | | | 2,164,234 | |
TOTAL COMMON STOCKS (Cost $292,519,818) | | | | | | | 262,574,224 | |
| | | | | | | | | |
INVESTMENTS PURCHASED WITH PROCEEDS FROM SECURITIES LENDING - 8.85% | | Units | | | | | |
Mount Vernon Liquid Assets Portfolio, LLC, 5.03% (c) | | | 23,312,054 | | | | 23,312,054 | |
TOTAL INVESTMENTS PURCHASED WITH PROCEEDS FROM SECURITIES LENDING (Cost $23,312,054) | | | | | | | 23,312,054 | |
The accompanying notes are an integral part of these financial statements.
INNOVATOR GRADIENT TACTICAL ROTATION STRATEGY ETF
Schedule of Investments | | | | | |
April 30, 2023 (Unaudited) (Continued) | | | | | |
SHORT TERM INVESTMENTS - 0.37% | | Principal Amount | | | Value | |
U.S. Treasury Bill - 0.36% | | | | | | | | |
United States Treasury Bill, 0.225%, 5/4/2023 (d) | | $ | 911,000 | | | | 910,688.00 | |
United States Treasury Bill, 0.581%, 5/9/2023 (d) | | | 32,000 | | | | 31,971.00 | |
| | | | | | | | 942,659.00 | |
Money Market Deposit Account - 0.01% | | | | | | | | |
U.S. Bank Money Market Deposit Account, 4.800% (e) | | | 18,086 | | | | 18,086 | |
TOTAL SHORT TERM INVESTMENTS (Cost $960,735) | | | | | | | 960,745 | |
| | | | | | | | | |
Total Investments (Cost $316,792,607) - 108.89% | | | | | | | 286,847,023 | |
Assets in Excess of Liabilities - (8.89)% | | | | | | | (23,418,531 | ) |
TOTAL NET ASSETS - 100.00% | | | | | | $ | 263,428,492 | |
| | | | | | | | | |
Asset Type | | % of Net Assets | | | | | |
Common Stocks | | | 99.67 | % | | | | |
Investments Purchased with Proceeds From Securities Lending | | | 8.85 | | | | | |
Short Term Investments | | | 0.37 | | | | | |
Total Investments | | | 108.89 | | | | | |
Liabilities in Excess of Other Assets | | | (8.89 | ) | | | | |
Net Assets | | | 100.00 | % | | | | |
Percentages are stated as a percent of net assets.
(a) | Non-income producing security. |
(b) | All or a portion of this security is on loan as of April 30, 2023. The total value of securities on loan is $23,067,634, or 8.76% of net assets. See Note 6. |
(c) | Represents annualized seven-day yield as of the end of the reporting period. |
(d) | Rate disclosed is the effective yield as of April 30,2023. |
(e) | The U.S. Bank Money Market Deposit Account (the “MMDA”) is a short-term investment vehicle in which the Fund holds cash balances. The MMDA will bear interest at a variable rate that is determined based on conditions and may change daily and by any amount. The rate shown is as of April 30, 2023. |
The accompanying notes are an integral part of these financial statements.
INNOVATOR EQUITY MANAGED FLOOR ETF
Schedule of Investments | | | | | |
April 30, 2023 (Unaudited) | | | | | |
| | | Shares | | | Value | |
COMMON STOCKS - 96.13% | | | | | | | | |
Advertising - 0.10% | | | | | | | | |
The Trade Desk, Inc. - Class A (a)(b) | | | 342 | | | $ | 22,004 | |
| | | | | | | | | |
Aerospace & Defense - 1.60% | | | | | | | | |
HEICO Corp. | | | 236 | | | | 39,799 | |
HEICO Corp. - Class A | | | 180 | | | | 24,161 | |
Lockheed Martin Corp. | | | 252 | | | | 117,042 | |
The Boeing Co. (a) | | | 432 | | | | 89,329 | |
TransDigm Group, Inc. | | | 109 | | | | 83,385 | |
| | | | | | | | 353,716 | |
Agriculture - 0.49% | | | | | | | | |
Philip Morris International, Inc. | | | 1,080 | | | | 107,968 | |
| | | | | | | | | |
Airlines - 0.23% | | | | | | | | |
Delta Air Lines, Inc. (a) | | | 1,458 | | | | 50,024 | |
| | | | | | | | | |
Apparel - 0.51% | | | | | | | | |
NIKE, Inc. - Class B | | | 900 | | | | 114,048 | |
| | | | | | | | | |
Auto Manufacturers - 1.64% | | | | | | | | |
Ford Motor Co. | | | 2,916 | | | | 34,642 | |
General Motors Co. | | | 1,224 | | | | 40,441 | |
Lucid Group, Inc. (a)(b) | | | 504 | | | | 4,002 | |
Rivian Automotive, Inc. - Class A (a)(b) | | | 414 | | | | 5,308 | |
Tesla, Inc. (a) | | | 1,696 | | | | 278,670 | |
| | | | | | | | 363,063 | |
Banks - 3.84% | | | | | | | | |
Bank of America Corp. | | | 5,404 | | | | 158,229 | |
Citizens Financial Group, Inc. (b) | | | 882 | | | | 27,289 | |
Huntington Bancshares, Inc. | | | 2,610 | | | | 29,232 | |
JPMorgan Chase & Co. | | | 1,985 | | | | 274,407 | |
KeyCorp | | | 2,340 | | | | 26,348 | |
Morgan Stanley (b) | | | 760 | | | | 68,378 | |
Regions Financial Corp. | | | 2,124 | | | | 38,784 | |
The Goldman Sachs Group, Inc. | | | 342 | | | | 117,457 | |
Wells Fargo & Co. | | | 2,754 | | | | 109,472 | |
| | | | | | | | 849,596 | |
The accompanying notes are an integral part of these financial statements.
INNOVATOR EQUITY MANAGED FLOOR ETF
Schedule of Investments | | | | | |
April 30, 2023 (Unaudited) (Continued) | | | | | |
| | | Shares | | | | Value | |
Beverages - 2.17% | | | | | | | | | |
Brown-Forman Corp. - Class A | | | 252 | | | | | 16,602 | |
Brown-Forman Corp. - Class B | | | 558 | | | | | 36,320 | |
PepsiCo, Inc. | | | 1,147 | | | | | 218,951 | |
The Coca-Cola Co. | | | 3,250 | | | | | 208,488 | |
| | | | | | | | | 480,361 | |
Biotechnology - 2.01% | | | | | | | | | |
Alnylam Pharmaceuticals, Inc. (a) | | | 90 | | | | | 17,928 | |
Amgen, Inc. | | | 414 | | | | | 99,253 | |
BioMarin Pharmaceutical, Inc. (a) | | | 234 | | | | | 22,473 | |
Gilead Sciences, Inc. | | | 954 | | | | | 78,428 | |
Horizon Therapeutics PLC (a) | | | 198 | | | | | 22,010 | |
Moderna, Inc. (a) | | | 233 | | | | | 30,963 | |
Regeneron Pharmaceuticals, Inc. (a) | | | 77 | | | | | 61,738 | |
Royalty Pharma PLC - Class A | | | 576 | | | | | 20,246 | |
Seagen, Inc. (a) | | | 126 | | | | | 25,200 | |
Vertex Pharmaceuticals, Inc. (a) | | | 198 | | | | | 67,465 | |
| | | | | | | | | 445,704 | |
Building Materials - 0.32% | | | | | | | | | |
Trane Technologies PLC (b) | | | 379 | | | | | 70,422 | |
| | | | | | | | | | |
Chemicals - 1.64% | | | | | | | | | |
Albemarle Corp. | | | 90 | | | | | 16,691 | |
Celanese Corp. | | | 288 | | | | | 30,597 | |
Dow, Inc. (b) | | | 1,134 | | | | | 61,690 | |
Linde PLC | | | 417 | | | | | 154,060 | |
LyondellBasell Industries NV - Class A (b) | | | 414 | | | | | 39,169 | |
PPG Industries, Inc. | | | 432 | | | | | 60,592 | |
| | | | | | | | | 362,799 | |
Commercial Services - 1.04% | | | | | | | | | |
Block, Inc. (a) | | | 360 | | | | | 21,884 | |
Cintas Corp. | | | 162 | | | | | 73,835 | |
PayPal Holdings, Inc. (a) | | | 828 | | | | | 62,928 | |
TransUnion | | | 378 | | | | | 26,010 | |
United Rentals, Inc. | | | 126 | | | | | 45,500 | |
| | | | | | | | | 230,157 | |
The accompanying notes are an integral part of these financial statements.
INNOVATOR EQUITY MANAGED FLOOR ETF
Schedule of Investments | | | | | |
April 30, 2023 (Unaudited) (Continued) | | | | | |
| | | Shares | | | | Value | |
Computers - 8.93% | | | | | | | | | |
Accenture PLC - Class A | | | 540 | | | | | 151,357 | |
Apple, Inc. | | | 9,958 | | | | | 1,689,674 | |
Crowdstrike Holdings, Inc. - Class A (a) | | | 185 | | | | | 22,209 | |
Dell Technologies, Inc. - Class C | | | 306 | | | | | 13,308 | |
International Business Machines Corp. | | | 719 | | | | | 90,889 | |
Zscaler, Inc. (a) | | | 106 | | | | | 9,551 | |
| | | | | | | | | 1,976,988 | |
Cosmetics & Personal Care - 1.30% | | | | | | | | | |
The Procter & Gamble Co. | | | 1,834 | | | | | 286,800 | |
| | | | | | | | | | |
Diversified Financial Services - 3.85% | | | | | | | | | |
American Express Co. | | | 468 | | | | | 75,507 | |
Apollo Global Management, Inc. | | | 450 | | | | | 28,526 | |
Blue Owl Capital, Inc. | | | 954 | | | | | 10,742 | |
Coinbase Global, Inc. - Class A (a)(b) | | | 108 | | | | | 5,809 | |
Franklin Resources, Inc. (b) | | | 666 | | | | | 17,902 | |
Interactive Brokers Group, Inc. - Class A | | | 288 | | | | | 22,421 | |
LPL Financial Holdings, Inc. | | | 108 | | | | | 22,555 | |
Mastercard, Inc. - Class A | | | 596 | | | | | 226,498 | |
Nasdaq, Inc. | | | 993 | | | | | 54,982 | |
Rocket Cos., Inc. - Class A (a)(b) | | | 684 | | | | | 6,094 | |
T Rowe Price Group, Inc. | | | 378 | | | | | 42,461 | |
The Charles Schwab Corp. | | | 1,066 | | | | | 55,688 | |
Tradeweb Markets, Inc. - Class A | | | 252 | | | | | 17,743 | |
Visa, Inc. - Class A (b) | | | 1,139 | | | | | 265,078 | |
| | | | | | | | | 852,006 | |
Electric - 2.79% | | | | | | | | | |
Alliant Energy Corp. | | | 1,160 | | | | | 63,962 | |
Ameren Corp. | | | 781 | | | | | 69,485 | |
Avangrid, Inc. (b) | | | 720 | | | | | 28,987 | |
CenterPoint Energy, Inc. | | | 2,233 | | | | | 68,040 | |
CMS Energy Corp. | | | 1,045 | | | | | 65,062 | |
Consolidated Edison, Inc. | | | 782 | | | | | 77,003 | |
DTE Energy Co. | | | 541 | | | | | 60,814 | |
Entergy Corp. | | | 594 | | | | | 63,903 | |
Evergy, Inc. | | | 938 | | | | | 58,259 | |
PPL Corp. | | | 2,178 | | | | | 62,552 | |
| | | | | | | | | 618,067 | |
The accompanying notes are an integral part of these financial statements.
INNOVATOR EQUITY MANAGED FLOOR ETF
Schedule of Investments | | | | | |
April 30, 2023 (Unaudited) (Continued) | | | | | |
| | | Shares | | Value | |
Electrical Components & Equipment - 0.25% | | | | | | | |
AMETEK, Inc. | | | 396 | | | 54,620 | |
| | | | | | | | |
Electronics - 0.46% | | | | | | | |
TE Connectivity Ltd. | | | 594 | | | 72,688 | |
Trimble, Inc. (a) | | | 612 | | | 28,825 | |
| | | | | | | 101,513 | |
Energy-Alternate Sources - 0.15% | | | | | | | |
Enphase Energy, Inc. (a) | | | 121 | | | 19,868 | |
First Solar, Inc. (a)(b) | | | 77 | | | 14,059 | |
| | | | | | | 33,927 | |
Engineering & Construction - 0.16% | | | | | | | |
Jacobs Solutions, Inc. | | | 306 | | | 35,331 | |
| | | | | | | | |
Entertainment - 0.03% | | | | | | | |
Warner Music Group Corp. - Class A | | | 216 | | | 6,582 | |
| | | | | | | | |
Environmental Control - 0.72% | | | | | | | |
Republic Services, Inc. | | | 486 | | | 70,285 | |
Waste Management, Inc. | | | 540 | | | 89,667 | |
| | | | | | | 159,952 | |
Food - 1.01% | | | | | | | |
Albertsons Cos., Inc. - Class A | | | 479 | | | 10,011 | |
Campbell Soup Co. | | | 1,044 | | | 56,689 | |
Conagra Brands, Inc. | | | 1,278 | | | 48,513 | |
Kellogg Co. | | | 906 | | | 63,212 | |
The J M Smucker Co. (b) | | | 288 | | | 44,470 | |
| | | | | | | 222,895 | |
Forest Products & Paper - 0.15% | | | | | | | |
International Paper Co. | | | 972 | | | 32,183 | |
The accompanying notes are an integral part of these financial statements.
INNOVATOR EQUITY MANAGED FLOOR ETF
Schedule of Investments | | | | | |
April 30, 2023 (Unaudited) (Continued) | | | | | |
| | | Shares | | | | Value | |
Healthcare - Products - 3.74% | | | | | | | | | |
Abbott Laboratories | | | 1,279 | | | | | 141,291 | |
Avantor, Inc. (a)(b) | | | 684 | | | | | 13,324 | |
Danaher Corp. | | | 505 | | | | | 119,640 | |
GE HealthCare Technologies, Inc. (a) | | | 458 | | | | | 37,254 | |
Insulet Corp. (a)(b) | | | 72 | | | | | 22,899 | |
Intuitive Surgical, Inc. (a) | | | 288 | | | | | 86,751 | |
Medtronic PLC (b) | | | 1,188 | | | | | 108,049 | |
Teleflex, Inc. | | | 126 | | | | | 34,338 | |
The Cooper Cos., Inc. | | | 162 | | | | | 61,795 | |
Thermo Fisher Scientific, Inc. | | | 270 | | | | | 149,823 | |
Zimmer Biomet Holdings, Inc. | | | 378 | | | | | 52,330 | |
| | | | | | | | | 827,494 | |
Healthcare - Services - 2.17% | | | | | | | | | |
HCA Healthcare, Inc. | | | 198 | | | | | 56,891 | |
Humana, Inc. | | | 162 | | | | | 85,939 | |
UnitedHealth Group, Inc. | | | 684 | | | | | 336,589 | |
| | | | | | | | | 479,419 | |
Home Builders - 0.27% | | | | | | | | | |
Lennar Corp. - Class B | | | 612 | | | | | 59,866 | |
| | | | | | | | | | |
Household Products & Wares - 0.28% | | | | | | | | | |
Church & Dwight Co., Inc. | | | 630 | | | | | 61,186 | |
| | | | | | | | | | |
Insurance - 3.56% | | | | | | | | | |
Arch Capital Group Ltd. (a) | | | 702 | | | | | 52,699 | |
Arthur J Gallagher & Co. | | | 381 | | | | | 79,271 | |
Berkshire Hathaway, Inc. - Class B (a) | | | 936 | | | | | 307,523 | |
Brown & Brown, Inc. | | | 774 | | | | | 49,838 | |
Loews Corp. | | | 972 | | | | | 55,958 | |
Markel Corp. (a)(b) | | | 36 | | | | | 49,267 | |
Principal Financial Group, Inc. | | | 540 | | | | | 40,333 | |
Prudential Financial, Inc. (b) | | | 720 | | | | | 62,640 | |
The Hartford Financial Services Group, Inc. | | | 666 | | | | | 47,279 | |
W R Berkley Corp. | | | 738 | | | | | 43,483 | |
| | | | | | | | | 788,291 | |
The accompanying notes are an integral part of these financial statements.
INNOVATOR EQUITY MANAGED FLOOR ETF
Schedule of Investments | | | | | |
April 30, 2023 (Unaudited) (Continued) | | | | | |
| | | Shares | | | Value | |
Internet - 9.90% | | | | | | | | |
Airbnb, Inc. - Class A (a) | | | 288 | | | | 34,465 | |
Alphabet, Inc. - Class A (a) | | | 3,816 | | | | 409,609 | |
Alphabet, Inc. - Class C (a) | | | 3,402 | | | | 368,164 | |
Amazon.com, Inc. (a)(b) | | | 5,544 | | | | 584,616 | |
Booking Holdings, Inc. (a) | | | 36 | | | | 96,707 | |
CDW Corp. | | | 288 | | | | 48,842 | |
Chewy, Inc. - Class A (a)(b) | | | 126 | | | | 3,907 | |
Coupang, Inc. (a) | | | 648 | | | | 10,860 | |
DoorDash, Inc. - Class A (a) | | | 156 | | | | 9,546 | |
Expedia Group, Inc. (a) | | | 148 | | | | 13,906 | |
MercadoLibre, Inc. (a)(b) | | | 36 | | | | 45,990 | |
Meta Platforms, Inc. - Class A (a) | | | 1,401 | | | | 336,688 | |
Netflix, Inc. (a) | | | 281 | | | | 92,710 | |
Okta, Inc. (a) | | | 144 | | | | 9,868 | |
Palo Alto Networks, Inc. (a)(b) | | | 234 | | | | 42,696 | |
Pinterest, Inc. - Class A (a) | | | 612 | | | | 14,076 | |
Snap, Inc. - Class A (a)(b) | | | 828 | | | | 7,212 | |
Spotify Technology SA (a)(b) | | | 144 | | | | 19,238 | |
Uber Technologies, Inc. (a) | | | 1,296 | | | | 40,241 | |
| | | | | | | | 2,189,341 | |
Iron & Steel - 0.17% | | | | | | | | |
Nucor Corp. (b) | | | 252 | | | | 37,341 | |
| | | | | | | | | |
Lodging - 0.21% | | | | | | | | |
MGM Resorts International (b) | | | 1,026 | | | | 46,088 | |
| | | | | | | | | |
Machinery - Construction & Mining - 0.39% | | | | | | | | |
Caterpillar, Inc. | | | 396 | | | | 86,645 | |
| | | | | | | | | |
Machinery - Diversified - 1.04% | | | | | | | | |
Deere & Co. | | | 216 | | | | 81,652 | |
Dover Corp. | | | 450 | | | | 65,772 | |
IDEX Corp. | | | 252 | | | | 51,993 | |
Westinghouse Air Brake Technologies Corp. | | | 306 | | | | 29,887 | |
| | | | | | | | 229,304 | |
The accompanying notes are an integral part of these financial statements.
INNOVATOR EQUITY MANAGED FLOOR ETF
Schedule of Investments | | | | | |
April 30, 2023 (Unaudited) (Continued) | | | | | |
| | | Shares | | | Value | |
Media - 1.50% | | | | | | | | |
Comcast Corp. - Class A | | | 3,078 | | | | 127,336 | |
FactSet Research Systems, Inc. | | | 90 | | | | 37,052 | |
Liberty Broadband Corp. - Class A (a) | | | 90 | | | | 7,608 | |
Liberty Broadband Corp. - Class C (a) | | | 198 | | | | 16,786 | |
Paramount Global - Class A (b) | | | 216 | | | | 5,715 | |
Sirius XM Holdings, Inc. (b) | | | 2,646 | | | | 10,055 | |
The Walt Disney Co. (a) | | | 1,242 | | | | 127,305 | |
| | | | | | | | 331,857 | |
Mining - 0.30% | | | | | | | | |
Freeport-McMoRan, Inc. | | | 1,314 | | | | 49,814 | |
Southern Copper Corp. | | | 217 | | | | 16,672 | |
| | | | | | | | 66,486 | |
Miscellaneous Manufacturing - 0.93% | | | | | | | | |
3M Co. | | | 702 | | | | 74,566 | |
Carlisle Cos., Inc. | | | 162 | | | | 34,968 | |
General Electric Co. | | | 972 | | | | 96,199 | |
| | | | | | | | 205,733 | |
Oil & Gas - 3.93% | | | | | | | | |
Chevron Corp. | | | 1,332 | | | | 224,549 | |
ConocoPhillips | | | 1,154 | | | | 118,735 | |
Devon Energy Corp. | | | 810 | | | | 43,278 | |
Exxon Mobil Corp. | | | 2,976 | | | | 352,180 | |
Marathon Oil Corp. | | | 1,350 | | | | 32,616 | |
Occidental Petroleum Corp. | | | 720 | | | | 44,302 | |
Texas Pacific Land Corp. | | | 8 | | | | 11,821 | |
Valero Energy Corp. | | | 376 | | | | 43,116 | |
| | | | | | | | 870,597 | |
Oil & Gas Services - 0.38% | | | | | | | | |
Baker Hughes Co. | | | 990 | | | | 28,948 | |
Schlumberger NV | | | 1,134 | | | | 55,963 | |
| | | | | | | | 84,911 | |
The accompanying notes are an integral part of these financial statements.
INNOVATOR EQUITY MANAGED FLOOR ETF
Schedule of Investments | | | | | |
April 30, 2023 (Unaudited) (Continued) | | | | | |
| | | Shares | | | Value | |
Pharmaceuticals - 6.27% | | | | | | | | |
AbbVie, Inc. | | | 1,217 | | | | 183,913 | |
AmerisourceBergen Corp. | | | 252 | | | | 42,046 | |
Bristol-Myers Squibb Co. | | | 1,548 | | | | 103,360 | |
CVS Health Corp. | | | 954 | | | | 69,938 | |
Dexcom, Inc. (a) | | | 298 | | | | 36,159 | |
Eli Lilly & Co. | | | 564 | | | | 223,265 | |
Johnson & Johnson | | | 1,877 | | | | 307,264 | |
Merck & Co., Inc. | | | 1,802 | | | | 208,077 | |
Pfizer, Inc. | | | 3,619 | | | | 140,743 | |
The Cigna Group | | | 288 | | | | 72,948 | |
| | | | | | | | 1,387,713 | |
Pipelines - 0.40% | | | | | | | | |
Cheniere Energy, Inc. | | | 234 | | | | 35,802 | |
Kinder Morgan, Inc. (b) | | | 3,132 | | | | 53,714 | |
| | | | | | | | 89,516 | |
Private Equity - 0.51% | | | | | | | | |
Ares Management Corp. - Class A | | | 288 | | | | 25,226 | |
Blackstone, Inc. | | | 540 | | | | 48,238 | |
KKR & Co., Inc. | | | 756 | | | | 40,121 | |
| | | | | | | | 113,585 | |
Retail - 5.60% | | | | | | | | |
Costco Wholesale Corp. | | | 352 | | | | 177,133 | |
Genuine Parts Co. (b) | | | 264 | | | | 44,434 | |
Lowe's Cos., Inc. | | | 558 | | | | 115,969 | |
Lululemon Athletica, Inc. (a) | | | 108 | | | | 41,032 | |
McDonald's Corp. | | | 617 | | | | 182,478 | |
Ross Stores, Inc. | | | 540 | | | | 57,634 | |
Starbucks Corp. | | | 918 | | | | 104,918 | |
Target Corp. | | | 378 | | | | 59,630 | |
The Home Depot, Inc. (b) | | | 756 | | | | 227,209 | |
Ulta Beauty, Inc. (a)(b) | | | 72 | | | | 39,703 | |
Walmart, Inc. | | | 1,098 | | | | 165,765 | |
Yum China Holdings, Inc. | | | 372 | | | | 22,759 | |
| | | | | | | | 1,238,664 | |
The accompanying notes are an integral part of these financial statements.
INNOVATOR EQUITY MANAGED FLOOR ETF
Schedule of Investments | | | | | |
April 30, 2023 (Unaudited) (Continued) | | | | | |
| | | Shares | | | Value | |
Semiconductors - 5.77% | | | | | | | | |
Advanced Micro Devices, Inc. (a) | | | 1,243 | | | | 111,087 | |
Broadcom, Inc. (b) | | | 306 | | | | 191,709 | |
GLOBALFOUNDRIES, Inc. (a)(b) | | | 143 | | | | 8,408 | |
Intel Corp. | | | 2,934 | | | | 91,130 | |
Lam Research Corp. | | | 188 | | | | 98,527 | |
Marvell Technology, Inc. | | | 864 | | | | 34,111 | |
Micron Technology, Inc. | | | 864 | | | | 55,607 | |
NVIDIA Corp. | | | 1,535 | | | | 425,947 | |
QUALCOMM, Inc. | | | 756 | | | | 88,301 | |
Teradyne, Inc. | | | 418 | | | | 38,197 | |
Texas Instruments, Inc. | | | 794 | | | | 132,756 | |
| | | | | | | | 1,275,780 | |
Software - 10.67% | | | | | | | | |
Adobe, Inc. (a) | | | 324 | | | | 122,329 | |
Aspen Technology, Inc. (a) | | | 53 | | | | 9,381 | |
Atlassian Corp. - Class A (a)(b) | | | 131 | | | | 19,343 | |
Bentley Systems, Inc. - Class B | | | 342 | | | | 14,556 | |
BILL Holdings, Inc. (a) | | | 95 | | | | 7,297 | |
Broadridge Financial Solutions, Inc. | | | 342 | | | | 49,730 | |
Cloudflare, Inc. - Class A (a) | | | 198 | | | | 9,316 | |
Datadog, Inc. - Class A (a) | | | 234 | | | | 15,767 | |
DocuSign, Inc. (a) | | | 288 | | | | 14,239 | |
HubSpot, Inc. (a) | | | 36 | | | | 15,154 | |
Intuit, Inc. | | | 236 | | | | 104,772 | |
Microsoft Corp. | | | 4,617 | | | | 1,418,620 | |
MongoDB, Inc. (a)(b) | | | 54 | | | | 12,958 | |
Oracle Corp. | | | 1,164 | | | | 110,254 | |
Palantir Technologies, Inc. - Class A (a) | | | 1,494 | | | | 11,579 | |
ROBLOX Corp. - Class A (a) | | | 252 | | | | 8,971 | |
Salesforce, Inc. (a)(b) | | | 666 | | | | 132,115 | |
ServiceNow, Inc. (a)(b) | | | 164 | | | | 75,345 | |
Snowflake, Inc. - Class A (a) | | | 198 | | | | 29,320 | |
Splunk, Inc. (a)(b) | | | 162 | | | | 13,971 | |
SS&C Technologies Holdings, Inc. | | | 558 | | | | 32,665 | |
Twilio, Inc. - Class A (a) | | | 216 | | | | 11,364 | |
Unity Software, Inc. (a)(b) | | | 302 | | | | 8,145 | |
The accompanying notes are an integral part of these financial statements.
INNOVATOR EQUITY MANAGED FLOOR ETF
Schedule of Investments | | | | | |
April 30, 2023 (Unaudited) (Continued) | | | | | |
| | | Shares | | | Value | |
Veeva Systems, Inc. Class A (a) | | | 126 | | | | 22,564 | |
VMware, Inc. - Class A (a) | | | 272 | | | | 34,008 | |
Workday, Inc. - Class A (a)(b) | | | 204 | | | | 37,973 | |
Zoom Video Communications, Inc. - Class A (a) | | | 198 | | | | 12,163 | |
ZoomInfo Technologies, Inc. (a) | | | 288 | | | | 6,310 | |
| | | | | | | | 2,360,209 | |
Telecommunications - 1.62% | | | | | | | | |
AT&T, Inc. | | | 6,015 | | | | 106,285 | |
Cisco Systems, Inc. | | | 3,357 | | | | 158,618 | |
T-Mobile US, Inc. (a) | | | 617 | | | | 88,786 | |
Ubiquiti, Inc. (b) | | | 18 | | | | 4,186 | |
| | | | | | | | 357,875 | |
Transportation - 1.13% | | | | | | | | |
Expeditors International of Washington, Inc. (b) | | | 396 | | | | 45,081 | |
FedEx Corp. | | | 252 | | | | 57,401 | |
JB Hunt Transport Services, Inc. | | | 180 | | | | 31,552 | |
Union Pacific Corp. | | | 594 | | | | 116,245 | |
| | | | | | | | 250,279 | |
TOTAL COMMON STOCKS (Cost $20,049,929) | | | | | | | 21,268,906 | |
| | | | | | | | | |
REAL ESTATE INVESTMENT TRUSTS - 2.22% | | | | | | | | |
Apartments - 1.16% | | | | | | | | |
Camden Property Trust | | | 486 | | | | 53,484 | |
Essex Property Trust, Inc. | | | 216 | | | | 47,462 | |
Invitation Homes, Inc. (b) | | | 1,494 | | | | 49,855 | |
Mid-America Apartment Communities, Inc. | | | 378 | | | | 58,136 | |
UDR, Inc. (b) | | | 1,134 | | | | 46,868 | |
| | | | | | | | 255,805 | |
Diversified - 0.53% | | | | | | | | |
American Tower Corp. | | | 360 | | | | 73,581 | |
WP Carey, Inc. (b) | | | 576 | | | | 42,739 | |
| | | | | | | | 116,320 | |
The accompanying notes are an integral part of these financial statements.
INNOVATOR EQUITY MANAGED FLOOR ETF
Schedule of Investments | | | | | |
April 30, 2023 (Unaudited) (Continued) | | | | | |
| | | Shares | | | | | | | Value | |
Health Care - 0.23% | | | | | | | | | | | | |
Healthpeak Properties, Inc. | | | 2,305 | | | | | | | | 50,641 | |
| | | | | | | | | | | | | |
Manufactured Homes - 0.21% | | | | | | | | | | | | |
Sun Communities, Inc. | | | 342 | | | | | | | | 47,514 | |
| | | | | | | | | | | | | |
Office Property - 0.09% | | | | | | | | | | | | |
Boston Properties, Inc. | | | 378 | | | | | | | | 20,170 | |
TOTAL REAL ESTATE INVESTMENT TRUSTS (Cost $510,314) | | | | | | | | | | | 490,450 | |
| | | | | | | | | | | | | |
PURCHASED OPTIONS - 1.42% (c)(d) | | Contracts | | | Notional Amount | | | | |
PUT OPTIONS - 1.42% | | | | | | | | | | | | |
SPY SPDR S&P 500® Trust ETF, Expires 6/30/2023, Strike Price $344.00 | | | 133 | | | $ | 5,531,869 | | | | 11,571 | |
SPY SPDR S&P 500® Trust ETF, Expires 9/29/2023, Strike Price $345.00 | | | 133 | | | | 5,531,869 | | | | 52,402 | |
SPY SPDR S&P 500® Trust ETF, Expires 12/29/2023, Strike Price $345.00 | | | 132 | | | | 5,490,276 | | | | 86,922 | |
SPY SPDR S&P 500® Trust ETF, Expires 3/28/2024, Strike Price $364.00 | | | 136 | | | | 5,656,648 | | | | 163,880 | |
TOTAL PURCHASED OPTIONS (Cost $635,953) | | | | | | | | | | | 314,775 | |
| | | | | | | | | | | | | |
INVESTMENTS PURCHASED WITH PROCEEDS FROM SECURITIES LENDING - 10.14% | | Units | | | | | | | | | |
Mount Vernon Liquid Assets Portfolio, LLC, 5.03% (e) | | | 2,244,485 | | | | | | | | 2,244,485 | |
TOTAL INVESTMENTS PURCHASED WITH PROCEEDS FROM SECURITIES LENDING (Cost $2,244,485) | | | | | | | | | | | 2,244,485 | |
The accompanying notes are an integral part of these financial statements.
INNOVATOR EQUITY MANAGED FLOOR ETF
Schedule of Investments | | | | | |
April 30, 2023 (Unaudited) (Continued) | | | | | |
SHORT TERM INVESTMENTS - 0.64% | | | | | | | | |
Money Market Deposit Account - 0.64% | | Principal Amount | | | Value | |
U.S. Bank Money Market Deposit Account, 4.800% (f) | | $ | 141,209 | | | | 141,209 | |
TOTAL SHORT TERM INVESTMENTS (Cost $141,209) | | | | | | | 141,209 | |
| | | | | | | | | |
Total Investments (Cost $23,581,890) - 110.55% | | | | | | | 24,459,825 | |
Liabilities in Excess of Other Assets - (10.55)% | | | | | | | (2,333,588 | ) |
TOTAL NET ASSETS - 100.00% | | | | | | $ | 22,126,237 | |
| | | | | | | | | |
Asset Type | | % of Net Assets | | | | | |
Common Stocks | | | 96.13 | % | | | | |
Real Estate Investment Trusts | | | 2.22 | | | | | |
Purchased Options | | | 1.42 | | | | | |
Investments Purchased with Proceeds From Securities Lending | | | 10.14 | | | | | |
Short Term Investments | | | 0.64 | | | | | |
Total Investments | | | 110.55 | | | | | |
Liabilities in Excess of Other Assets | | | (10.55 | ) | | | | |
Net Assets | | | 100.00 | % | | | | |
Percentages are stated as a percent of net assets.
(a) | Non-income producing security. |
(b) | All or a portion of this security is on loan as of April 30, 2023. The total value of securities on loan is $2,208,450, or 9.98% of net assets. See Note 6. |
(d) | All or a portion of the security can be pledged as collateral in connection with options written contracts. |
(e) | Represents annualized seven-day yield as of the end of the reporting period. |
(f) | The U.S. Bank Money Market Deposit Account (the “MMDA”) is a short-term investment vehicle in which the Fund holds cash balances. The MMDA will bear interest at a variable rate that is determined based on conditions and may change daily and by any amount. The rate shown is as of April 30, 2023. |
The accompanying notes are an integral part of these financial statements.
INNOVATOR EQUITY MANAGED FLOOR ETF
Schedule of Options Written (a) | | | | | |
April 30, 2023 (Unaudited) (Continued) | | | | | |
| | | | | | | | | | | | | | | | | | | | | |
Description | | Expiration | | | Strike Price | | | Contracts | | | Notional Amount | | | Value | |
Call Options | | | | | | | | | | | | | | | | | | | | |
SPXW S&P® 500 Index | | 5/1/2023 | | | $ | 4,230.00 | | | | 17 | | | $ | (7,088,116 | ) | | $ | (425 | ) |
SPXW S&P® 500 Index | | 5/5/2023 | | | | 4,225.00 | | | | 18 | | | | (7,505,064 | ) | | | (22,248 | ) |
SPXW S&P® 500 Index | | 5/10/2023 | | | | 4,160.00 | | | | 17 | | | | (7,088,116 | ) | | | (75,514 | ) |
Total Options Written (Premiums Received $65,220) | | | | | | | | | | | | | | | | | | $ | (98,187 | ) |
| | | | | | | | | | | | | | | | | | | | | |
(a) Exchange-Traded. | | | | | | | | | | | | | | | | | | | | |
The accompanying notes are an integral part of these financial statements.
Statements of Assets and Liabilities
April 30, 2023 (Unaudited)
| | | | Innovator IBD® 50 ETF | | | Innovator IBD® Breakout Opportunities ETF | | | Innovator Deepwater Frontier Tech ETF | |
| | Assets: | | | | | | | | | | | | |
| | Investments, at value (a)(b) | | $ | 100,559,714 | | | $ | 16,711,618 | | | $ | 46,399,025 | |
| | Dividends and interest receivable | | | 11,928 | | | | 10,748 | | | | 3,667 | |
| | Receivable for investments sold | | | 27,662,277 | | | | - | | | | - | |
| | Securities lending income receivable | | | 7,467 | | | | 233 | | | | 7,230 | |
| | Prepaid expenses | | | 1,559 | | | | - | | | | - | |
| | Total Assets | | | 128,242,945 | | | | 16,722,599 | | | | 46,409,922 | |
| | | | | | | | | | | | | | |
| | Liabilities: | | | | | | | | | | | | |
| | Payable for collateral upon return of securities loaned | | | 22,880,354 | | | | 2,841,107 | | | | 11,367,570 | |
| | Payable to Adviser | | | 30,276 | | | | 9,081 | | | | 20,880 | |
| | Payable for investments purchased | | | 27,481,376 | | | | - | | | | - | |
| | Payable to Trustees | | | 2,003 | | | | - | | | | - | |
| | Payable to Custodian | | | 4,875 | | | | - | | | | - | |
| | Accrued expenses and other liabilities | | | 114,024 | | | | - | | | | 465 | |
| | Total Liabilities | | | 50,512,908 | | | | 2,850,188 | | | | 11,388,915 | |
| | Net Assets | | $ | 77,730,037 | | | $ | 13,872,411 | | | $ | 35,021,007 | |
| | | | | | | | | | | | | | |
| | Net Assets Consist of: | | | | | | | | | | | | |
| | Capital stock | | $ | 395,358,013 | | | $ | 25,885,895 | | | $ | 72,424,139 | |
| | Total distributable earnings/(accumulated deficit) | | | (317,627,976 | ) | | | (12,013,484 | ) | | | (37,403,132 | ) |
| | Net Assets | | $ | 77,730,037 | | | $ | 13,872,411 | | | $ | 35,021,007 | |
| | | | | | | | | | | | | | |
| | Net Asset Value: | | | | | | | | | | | | |
| | Net assets | | $ | 77,730,037 | | | $ | 13,872,411 | | | $ | 35,021,007 | |
| | Shares of beneficial interest outstanding (unlimited shares without par authorized) | | | 3,350,000 | | | | 450,000 | | | | 1,050,001 | |
| | Net asset value price per share | | $ | 23.20 | | | $ | 30.83 | | | $ | 33.35 | |
| | | | | | | | | | | | | | |
(a) | Cost of investments | | $ | 97,887,894 | | | $ | 16,301,126 | | | $ | 47,939,284 | |
(b) | Including securities on loan at a value of | | | 12,127,505 | | | | 2,784,482 | | | | 10,960,217 | |
The accompanying notes are an integral part of these financial statements.
Statements of Assets and Liabilities
April 30, 2023 (Unaudited) (Continued)
| | | | Innovator S&P Investment Grade Preferred ETF | | | | Innovator Laddered Allocation Power Buffer ETF | | | | Innovator Laddered Allocation Buffer ETF | |
| | Assets: | | | | | | | | | | | | | | |
| | Investments, at value (a) | | $ | 127,091,144 | | (b) | | $ | 3,766,732 | | | | $ | 16,019 | |
| | Investments in affiliates, at value (c) | | | - | | | | | 222,433,381 | | (b) | | | 35,804,474 | |
| | Dividends and interest receivable | | | 185,424 | | | | | 915 | | | | | 42 | |
| | Securities lending income receivable | | | 19,033 | | | | | 15,944 | | | | | - | |
| | Total Assets | | | 127,295,601 | | | | | 226,216,972 | | | | | 35,820,535 | |
| | | | | | | | | | | | | | | | |
| | Liabilities: | | | | | | | | | | | | | | |
| | Payable to Adviser | | | 44,792 | | | | | 17,580 | | | | | 2,919 | |
| | Distribution payable | | | 527,000 | | | | | - | | | | | - | |
| | Payable for collateral upon return of securities loaned | | | 10,291,453 | | | | | 3,518,125 | | | | | - | |
| | Total Liabilities | | | 10,863,245 | | | | | 3,535,705 | | | | | 2,919 | |
| | Net Assets | | $ | 116,432,356 | | | | $ | 222,681,267 | | | | $ | 35,817,616 | |
| | | | | | | | | | | | | | | | |
| | Net Assets Consist of: | | | | | | | | | | | | | | |
| | Capital stock | | $ | 157,669,002 | | | | $ | 250,513,522 | | | | $ | 34,098,693 | |
| | Total distributable earnings/(accumulated deficit) | | | (41,236,646 | ) | | | | (27,832,255 | ) | | | | 1,718,923 | |
| | Net Assets | | $ | 116,432,356 | | | | $ | 222,681,267 | | | | $ | 35,817,616 | |
| | | | | | | | | | | | | | | | |
| | Net Asset Value: | | | | | | | | | | | | | | |
| | Net assets | | $ | 116,432,356 | | | | $ | 222,681,267 | | | | $ | 35,817,616 | |
| | Shares of beneficial interest outstanding (unlimited shares without par authorized) | | | 6,200,000 | | | | | 6,150,000 | | | | | 1,450,000 | |
| | Net asset value price per share | | $ | 18.78 | | | | $ | 36.21 | | | | $ | 24.70 | |
| | | | | | | | | | | | | | | | |
(a) | Cost of investments | | $ | 146,185,699 | | | | $ | 3,766,732 | | | | $ | 16,019 | |
(b) | Including securities on loan at a value of | | | 10,053,416 | | | | | 3,451,289 | | | | | - | |
(c) | Cost of investments in affiliates | | | - | | | | | 211,767,919 | | | | | 34,267,393 | |
The accompanying notes are an integral part of these financial statements.
Statements of Assets and Liabilities
April 30, 2023 (Unaudited) (Continued)
| | | | Innovator Buffer Step-Up Strategy ETF | | | Innovator Power Buffer Step-Up Strategy ETF | |
| | Assets: | | | | | | | | |
| | Investments, at value (a) | | $ | 32,761,063 | | | $ | 71,387,257 | |
| | Interest receivable | | | 123 | | | | 461 | |
| | Total Assets | | | 32,761,186 | | | | 71,387,718 | |
| | | | | | | | | | |
| | Liabilities: | | | | | | | | |
| | Payable to Adviser | | | 22,807 | | | | 47,481 | |
| | Options written, at value (b) | | | 1,179,106 | | | | 3,120,828 | |
| | Total Liabilities | | | 1,201,913 | | | | 3,168,309 | |
| | Net Assets | | $ | 31,559,273 | | | $ | 68,219,409 | |
| | | | | | | | | | |
| | Net Assets Consist of: | | | | | | | | |
| | Capital stock | | $ | 32,479,803 | | | $ | 67,294,038 | |
| | Total distributable earnings/(accumulated deficit) | | | (920,530 | ) | | | 925,371 | |
| | Net Assets | | $ | 31,559,273 | | | $ | 68,219,409 | |
| | | | | | | | | | |
| | Net Asset Value: | | | | | | | | |
| | Net assets | | $ | 31,559,273 | | | $ | 68,219,409 | |
| | Shares of beneficial interest outstanding (unlimited shares without par value authorized) | | | 1,225,000 | | | | 2,600,000 | |
| | Net asset value price per share | | $ | 25.76 | | | $ | 26.24 | |
| | | | | | | | | | |
(a) | Cost of investments | | $ | 31,693,628 | | | $ | 69,250,525 | |
(b) | Premiums received | | | 1,410,369 | | | | 3,135,096 | |
The accompanying notes are an integral part of these financial statements.
Statements of Assets and Liabilities
April 30, 2023 (Unaudited) (Continued)
| | | | Innovator Hedged TSLA Strategy ETF | | | Innovator Uncapped Accelerated U.S. Equity ETF | |
| | Assets: | | | | | | | | |
| | Investments, at value (a) | | $ | 1,824,160 | | | $ | 13,146,131 | |
| | Interest receivable | | | 286 | | | | 215 | |
| | Deposit at broker for options | | | 70 | | | | 39 | |
| | Total Assets | | | 1,824,516 | | | | 13,146,385 | |
| | | | | | | | | | |
| | Liabilities: | | | | | | | | |
| | Payable to Adviser | | | 1,219 | | | | 6,895 | |
| | Options written, at value (b) | | | 8,688 | | | | 1,231,424 | |
| | Total Liabilities | | | 9,907 | | | | 1,238,319 | |
| | Net Assets | | $ | 1,814,609 | | | $ | 11,908,066 | |
| | | | | | | | | | |
| | Net Assets Consist of: | | | | | | | | |
| | Capital stock | | $ | 2,078,386 | | | $ | 11,842,016 | |
| | Total distributable earnings/(accumulated deficit) | | | (263,777 | ) | | | 66,050 | |
| | Net Assets | | $ | 1,814,609 | | | $ | 11,908,066 | |
| | | | | | | | | | |
| | Net Asset Value: | | | | | | | | |
| | Net assets | | $ | 1,814,609 | | | $ | 11,908,066 | |
| | Shares of beneficial interest outstanding (unlimited shares without par value authorized) | | | 80,000 | | | | 450,000 | |
| | Net asset value price per share | | $ | 22.68 | | | $ | 26.46 | |
| | | | | | | | | | |
(a) | Cost of investments | | $ | 2,116,902 | | | $ | 12,596,241 | |
(b) | Premiums received | | | 147,790 | | | | 1,126,278 | |
The accompanying notes are an integral part of these financial statements.
Statements of Assets and Liabilities
April 30, 2023 (Unaudited) (Continued)
| | | | Innovator Equity Managed Floor ETF | | | Innovator Gradient Tactical Rotation Strategy ETF | |
| | Assets: | | | | | | | | |
| | Investments, at value (a)(b) | | $ | 24,459,825 | | | $ | 286,847,023 | |
| | Cash | | | 7,258 | | | | - | |
| | Dividends and interest receivable | | | 18,249 | | | | 87,199 | |
| | Receivable for investments sold | | | - | | | | 2,077,841 | |
| | Securities lending income receivable | | | 374 | | | | 5,534 | |
| | Deposit at broker for options | | | 189 | | | | - | |
| | Total Assets | | | 24,485,895 | | | | 289,017,597 | |
| | | | | | | | | | |
| | Liabilities: | | | | | | | | |
| | Payable for fund shares redeemed | | | - | | | | 2,098,880 | |
| | Payable for collateral upon return of securities loaned | | | 2,244,485 | | | | 23,312,054 | |
| | Payable to Adviser | | | 16,986 | | | | 178,171 | |
| | Options written, at value (c) | | | 98,187 | | | | - | |
| | Total Liabilities | | | 2,359,658 | | | | 25,589,105 | |
| | Net Assets | | $ | 22,126,237 | | | $ | 263,428,492 | |
| | | | | | | | | | |
| | Net Assets Consist of: | | | | | | | | |
| | Capital stock | | $ | 20,648,885 | | | $ | 312,268,635 | |
| | Total distributable earnings/(accumulated deficit) | | | 1,477,352 | | | | (48,840,143 | ) |
| | Net Assets | | $ | 22,126,237 | | | $ | 263,428,492 | |
| | | | | | | | | | |
| | Net Asset Value: | | | | | | | | |
| | Net assets | | $ | 22,126,237 | | | $ | 263,428,492 | |
| | Shares of beneficial interest outstanding (unlimited shares without par authorized) | | | 900,000 | | | | 12,350,000 | |
| | Net asset value price per share | | $ | 24.58 | | | $ | 21.33 | |
| | | | | | | | | | |
(a) | Cost of investments | | $ | 23,581,890 | | | $ | 316,792,607 | |
(b) | Including securities on loan at a value of | | | 2,208,450 | | | | 23,067,634 | |
(c) | Premiums received | | | 65,220 | | | | - | |
The accompanying notes are an integral part of these financial statements.
Statements of Operations
For the Period Ended April 30, 2023 (Unaudited)
| | | | Innovator IBD® 50 ETF | | | Innovator IBD® Breakout Opportunities ETF | | | Innovator Deepwater Frontier Tech ETF | |
Investment Income: | | | | | | | | | | | | |
Dividends | | $ | 440,652 | | | $ | 122,867 | | | $ | 64,002 | |
| | Less: Foreign witholding taxes and issuance fees | | | (10,314 | ) | | | (1,409 | ) | | | (3,548 | ) |
Interest | | | 8,462 | | | | 1,741 | | | | 3,304 | |
Securities lending income, net | | | 31,203 | | | | 6,482 | | | | 21,417 | |
Total Investment Income | | | 470,003 | | | | 129,681 | | | | 85,175 | |
| | | | | | | | | | | | | | |
Expenses: | | | | | | | | | | | | | |
Investment advisory fee | | | 291,338 | | | | 55,688 | | | | 122,052 | |
Professional fees | | | 23,487 | | | | - | | | | - | |
Administration fees | | | 33,940 | | | | - | | | | - | |
Fund accounting fees | | | 812 | | | | - | | | | - | |
Trustees fees and expenses | | | 2,750 | | | | - | | | | - | |
Printing and mailing expenses | | | 17,459 | | | | - | | | | - | |
Custody fees | | | 9,839 | | | | - | | | | - | |
Insurance expense | | | 1,003 | | | | - | | | | - | |
Other expenses | | | 93,075 | | | | - | | | | - | |
Total Expenses Before Expense Limitation | | | 473,703 | | | | 55,688 | | | | 122,052 | |
Net advisory recoupment/(waivers)(see Note 3) | | | (140,745 | ) | | | - | | | | - | |
Net Expenses | | | 332,958 | | | | 55,688 | | | | 122,052 | |
Net Investment Income/(Loss) | | | 137,045 | | | | 73,993 | | | | (36,877 | ) |
| | | | | | | | | | | | | | |
Realized & Unrealized Gain/(Loss): | | | | | | | | | | | | |
Net realized gain/(loss) on: | | | | | | | | | | | | |
| | Investments and foreign currency transactions | | | (9,089,878 | ) | | | 402,770 | | | | (2,808,126 | ) |
| | Redemptions sold in-kind on investments | | | 2,185,410 | | | | 116,145 | | | | 424,229 | |
Net change in unrealized appreciation/(depreciation) on: | | | | | | | | | | | | |
| | Investments and translation of foreign currency | | | (2,807,079 | ) | | | (318,244 | ) | | | 6,731,435 | |
Net Realized and Unrealized Gain/(Loss) | | | (9,711,547 | ) | | | 200,671 | | | | 4,347,538 | |
Net Increase/(Decrease) in Net Assets Resulting From Operations | | $ | (9,574,502 | ) | | $ | 274,664 | | | $ | 4,310,661 | |
The accompanying notes are an integral part of these financial statements.
Statements of Operations
For the Period Ended April 30, 2023 (Unaudited) (Continued)
| | | | Innovator S&P Investment Grade Preferred ETF | | | Innovator Laddered Allocation Power Buffer ETF | | | Innovator Laddered Allocation Buffer ETF | |
Investment Income: | | | | | | | | | | | | |
Dividends | | $ | 3,139,874 | | | $ | - | | | $ | - | |
Interest | | | 16,301 | | | | 4,452 | | | | 277 | |
Securities lending income, net | | | 78,817 | | | | 47,653 | | | | - | |
Total Investment Income | | | 3,234,992 | | | | 52,105 | | | | 277 | |
| | | | | | | | | | | | | | |
Expenses: | | | | | | | | | | | | | |
Investment advisory fee | | | 281,190 | | | | 177,365 | | | | 33,106 | |
Total Expenses Before Expense Limitation | | | 281,190 | | | | 177,365 | | | | 33,106 | |
Net advisory recoupment/(waivers)(see Note 3) | | | - | | | | (88,683 | ) | | | (16,553 | ) |
Net Expenses | | | 281,190 | | | | 88,682 | | | | 16,553 | |
Net Investment Income/(Loss) | | | 2,953,802 | | | | (36,577 | ) | | | (16,276 | ) |
| | | | | | | | | | | | | | |
Realized & Unrealized Gain/(Loss): | | | | | | | | | | | | |
Net realized gain/(loss) on: | | | | | | | | | | | | |
| | Investments | | | (5,867,051 | ) | | | - | | | | - | |
| | Redemptions sold in-kind on investments | | | 299,714 | | | | - | | | | - | |
| | Redemptions sold in-kind on affiliates | | | - | | | | 267,686 | | | | 228,916 | |
| | Investments in affiliates | | | - | | | | 3,654 | | | | (2,965 | ) |
Net change in unrealized appreciation/(depreciation) on: | | | | | | | | | | | | |
| | Investments | | | 11,191,780 | | | | - | | | | - | |
| | Investments in affiliates | | | - | | | | 11,009,755 | | | | 2,238,801 | |
Net Realized and Unrealized Gain/(Loss) | | | 5,624,443 | | | | 11,281,095 | | | | 2,464,752 | |
Net Increase/(Decrease) in Net Assets Resulting From Operations | | $ | 8,578,245 | | | $ | 11,244,518 | | | $ | 2,448,476 | |
The accompanying notes are an integral part of these financial statements.
Statements of Operations
For the Period Ended April 30, 2023 (Unaudited) (Continued)
| | | | Innovator Buffer Step-Up Strategy ETF | | | Innovator Power Buffer Step-Up Strategy ETF | |
Investment Income: | | | | | | | | |
Interest | | $ | 803 | | | $ | 1,638 | |
Total Investment Income | | | 803 | | | | 1,638 | |
| | | | | | | | | | |
Expenses: | | | | | | | | | |
Investment advisory fee | | | 132,363 | | | | 210,207 | |
Total Expenses | | | 132,363 | | | | 210,207 | |
Net Investment Income/(Loss) | | | (131,560 | ) | | | (208,569 | ) |
| | | | | | | | | | |
Realized & Unrealized Gain/(Loss): | | | | | | | | |
Net realized gain/(loss) on: | | | | | | | | |
| | Investments | | | (1,317,360 | ) | | | (1,485,562 | ) |
| | Redemptions sold in-kind on investments | | | 66,474 | | | | 306,407 | |
| | Redemptions sold in-kind on options written | | | 501,444 | | | | 931,647 | |
| | Options written | | | 930,345 | | | | 1,162,328 | |
Net change in unrealized appreciation/(depreciation) on: | | | | | | | | |
| | Investments | | | 2,246,015 | | | | 3,102,481 | |
| | Options written | | | (167,658 | ) | | | (611,742 | ) |
Net Realized and Unrealized Gain/(Loss) on Investments and Options Written | | | 2,259,260 | | | | 3,405,559 | |
Net Increase/(Decrease) in Net Assets Resulting From Operations | | $ | 2,127,700 | | | $ | 3,196,990 | |
The accompanying notes are an integral part of these financial statements.
Statements of Operations
For the Period Ended April 30, 2023 (Unaudited) (Continued)
| | | | Innovator Hedged TSLA Strategy ETF | | | Innovator Uncapped Accelerated U.S. Equity ETF | |
Investment Income: | | | | | | | | |
Interest | | $ | 39,452 | | | $ | 945 | |
Total Investment Income | | | 39,452 | | | | 945 | |
| | | | | | | | | | |
Expenses: | | | | | | | | | |
Investment advisory fee | | | 8,914 | | | | 31,323 | |
Total Expenses | | | 8,914 | | | | 31,323 | |
Net Investment Income/(Loss) | | | 30,538 | | | | (30,378 | ) |
| | | | | | | | | | |
Realized & Unrealized Gain/(Loss): | | | | | | | | |
Net realized gain/(loss) on: | | | | | | | | |
| | Investments | | | 45,055 | | | | (438,385 | ) |
| | Redemptions sold in-kind on investments | | | 719,078 | | | | 76,747 | |
| | Redemptions sold in-kind on options written | | | 758 | | | | 167,188 | |
| | Options written | | | (799,332 | ) | | | 77,837 | |
Net change in unrealized appreciation/(depreciation) on: | | | | | | | | |
| | Investments | | | 36,210 | | | | 977,752 | |
| | Options written | | | (38,711 | ) | | | (248,960 | ) |
Net Realized and Unrealized Gain/(Loss) on Investments and Options Written | | | (36,942 | ) | | | 612,179 | |
Net Increase/(Decrease) in Net Assets Resulting From Operations | | $ | (6,404 | ) | | $ | 581,801 | |
The accompanying notes are an integral part of these financial statements.
Statements of Operations
For the Period Ended April 30, 2023 (Unaudited) (Continued)
| | | | Innovator Equity Managed Floor ETF (a) | | | Innovator Gradient Tactical Rotation Strategy ETF (b) | |
Investment Income: | | | | | | | | |
Dividends | | $ | 126,712 | | | $ | 1,956,058 | |
| | Less: Foreign witholding taxes and issuance fees | | | - | | | | (2,480 | ) |
Interest | | | 6,078 | | | | 494,443 | |
Securities lending income, net | | | 1,106 | | | | 11,737 | |
Total Investment Income | | | 133,896 | | | | 2,459,758 | |
| | | | | | | | | | |
Expenses: | | | | | | | | | |
Investment advisory fee | | | 75,233 | | | | 1,071,431 | |
Total Expenses | | | 75,233 | | | | 1,071,431 | |
Net Investment Income/(Loss) | | | 58,663 | | | | 1,388,327 | |
| | | | | | | | | | |
Realized & Unrealized Gain/(Loss): | | | | | | | | |
Net realized gain/(loss) on: | | | | | | | | |
| | Investments and foreign currency transactions | | | (261,652 | ) | | | (17,549,374 | ) |
| | Redemptions sold in-kind on investments | | | 484,216 | | | | (1,738,217 | ) |
| | Options written | | | 402,799 | | | | - | |
Net change in unrealized appreciation/(depreciation) on: | | | | | | | | |
| | Investments and translation of foreign currency | | | 878,817 | | | | (29,945,584 | ) |
| | Options written | | | (32,967 | ) | | | - | |
Net Realized and Unrealized Gain/(Loss) | | | 1,471,213 | | | | (49,233,175 | ) |
Net Increase/(Decrease) in Net Assets Resulting From Operations | | $ | 1,529,876 | | | $ | (47,844,848 | ) |
| | | | | | | | | | |
(a) Since Commencement of Operations on November 8, 2022. | | | | | | | | |
(b) Since Commencement of Operations on November 16, 2022. | | | | | | | | |
The accompanying notes are an integral part of these financial statements.
Statements of Changes in Net Assets
| | | Innovator IBD® 50 ETF | |
| | | Period Ended | | | Year Ended | |
| | | April 30, 2023 | | | October 31, 2022 | |
| | | (Unaudited) | | | | | |
Operations: | | | | | | | | |
Net investment income/(loss) | | $ | 137,045 | | | $ | 2,130,836 | |
Net realized gain/(loss) | | | (6,904,468 | ) | | | (92,292,451 | ) |
Net change in unrealized appreciation/(depreciation) | | | (2,807,079 | ) | | | (27,381,789 | ) |
Net Increase/(Decrease) in Net Assets Resulting from Operations | | | (9,574,502 | ) | | | (117,543,404 | ) |
| | | | | | | | | |
Distributions to Shareholders: | | | | | | | | |
Net distributions to shareholders | | | (2,131,160 | ) | | | (520,522 | ) |
| | | | | | | | | |
Capital Share Transactions: | | | | | | | | |
Proceeds from shares sold | | | 20,544,060 | | | | 32,771,310 | |
Cost of shares redeemed | | | (33,151,480 | ) | | | (87,029,075 | ) |
Transaction fees (see Note 5) | | | 3 | | | | - | |
Net Increase/(Decrease) in Net Assets from Capital Share Transactions | | | (12,607,417 | ) | | | (54,257,765 | ) |
Total Increase/(Decrease) in Net Assets | | $ | (24,313,079 | ) | | $ | (172,321,691 | ) |
| | | | | | | | | |
Net Assets: | | | | | | | | |
Beginning of period | | $ | 102,043,116 | | | $ | 274,364,807 | |
End of period | | $ | 77,730,037 | | | $ | 102,043,116 | |
| | | | | | | | | |
Change in Shares Outstanding: | | | | | | | | |
Shares sold | | | 850,000 | | | | 700,000 | |
Shares redeemed | | | (1,400,000 | ) | | | (2,250,000 | ) |
Net Increase/(Decrease) | | | (550,000 | ) | | | (1,550,000 | ) |
The accompanying notes are an integral part of these financial statements.
| | Innovator IBD® Breakout Opportunities ETF | | | Innovator Deepwater Frontier Tech ETF | |
| | Period Ended | | | Year Ended | | | Period Ended | | | Year Ended | |
| | April 30, 2023 | | | October 31, 2022 | | | April 30, 2023 | | | October 31, 2022 | |
| | (Unaudited) | | | | | | | (Unaudited) | | | | | |
| | | | | | | | | | | | | | | | |
| | $ | 73,993 | | | $ | 149,261 | | | $ | (36,877 | ) | | $ | (53,054 | ) |
| | | 518,915 | | | | (3,368,320 | ) | | | (2,383,897 | ) | | | (22,879,627 | ) |
| | | (318,244 | ) | | | 134,380 | | | | 6,731,435 | | | | (13,811,288 | ) |
| | | 274,664 | | | | (3,084,679 | ) | | | 4,310,661 | | | | (36,743,969 | ) |
| | | | | | | | | | | | | | | | |
| | | | | | | | | | | | | | | | |
| | | (179,202 | ) | | | - | | | | - | | | | - | |
| | | | | | | | | | | | | | | | |
| | | | | | | | | | | | | | | | |
| | | 3,041,730 | | | | 27,819,425 | | | | 1,723,420 | | | | 10,044,230 | |
| | | (3,071,100 | ) | | | (25,535,495 | ) | | | (3,302,770 | ) | | | (19,449,030 | ) |
| | | - | | | | - | | | | 1,413 | | | | 8,974 | |
| | | (29,370 | ) | | | 2,283,930 | | | | (1,577,937 | ) | | | (9,395,826 | ) |
| | $ | 66,092 | | | $ | (800,749 | ) | | $ | 2,732,724 | | | $ | (46,139,795 | ) |
| | | | | | | | | | | | | | | | |
| | | | | | | | | | | | | | | | |
| | $ | 13,806,319 | | | $ | 14,607,068 | | | $ | 32,288,283 | | | $ | 78,428,078 | |
| | $ | 13,872,411 | | | $ | 13,806,319 | | | $ | 35,021,007 | | | $ | 32,288,283 | |
| | | | | | | | | | | | | | | | |
| | | | | | | | | | | | | | | | |
| | | 100,000 | | | | 750,000 | | | | 50,000 | | | | 200,000 | |
| | | (100,000 | ) | | | (700,000 | ) | | | (100,000 | ) | | | (500,000 | ) |
| | | - | | | | 50,000 | | | | (50,000 | ) | | | (300,000 | ) |
The accompanying notes are an integral part of these financial statements.
Statements of Changes in Net Assets
| | | Innovator S&P Investment Grade Preferred ETF | |
| | | Period Ended | | | Year Ended | |
| | | April 30, 2023 | | | October 31, 2022 | |
| | | (Unaudited) | | | | | |
Operations: | | | | | | | | |
Net investment income/(loss) | | $ | 2,953,802 | | | $ | 7,806,854 | |
Net realized gain/(loss) | | | (5,567,337 | ) | | | (17,216,205 | ) |
Net change in unrealized appreciation/(depreciation) | | | 11,191,780 | | | | (33,343,643 | ) |
Net Increase/(Decrease) in Net Assets Resulting from Operations | | | 8,578,245 | | | | (42,752,994 | ) |
| | | | | | | | | |
Distributions to Shareholders: | | | | | | | | |
Distributions to shareholders | | | (2,917,673 | ) | | | (7,781,626 | ) |
Distributions from return of capital | | | - | | | | (179,692 | ) |
Net distributions to shareholders | | | (2,917,673 | ) | | | (7,961,318 | ) |
| | | | | | | | | |
Capital Share Transactions: | | | | | | | | |
Proceeds from shares sold | | | 930,500 | | | | 9,342,305 | |
Cost of shares redeemed | | | (9,215,260 | ) | | | (62,365,145 | ) |
Net Increase/(Decrease) in Net Assets from Capital Share Transactions | | | (8,284,760 | ) | | | (53,022,840 | ) |
Total Increase/(Decrease) in Net Assets | | $ | (2,624,188 | ) | | $ | (103,737,152 | ) |
| | | | | | | | | |
Net Assets: | | | | | | | | |
Beginning of period | | $ | 119,056,544 | | | $ | 222,793,696 | |
End of period | | $ | 116,432,356 | | | $ | 119,056,544 | |
| | | | | | | | | |
Change in Shares Outstanding: | | | | | | | | |
Shares sold | | | 50,000 | | | | 450,000 | |
Shares redeemed | | | (500,000 | ) | | | (3,000,000 | ) |
Net Increase/(Decrease) | | | (450,000 | ) | | | (2,550,000 | ) |
(a) Since Commencement of Operations on February 8, 2022.
The accompanying notes are an integral part of these financial statements.
| | Innovator Laddered Allocation Power Buffer ETF | | | Innovator Laddered Allocation Buffer ETF | | |
| | Period Ended | | | Year Ended | | | Period Ended | | | Period Ended | | |
| | April 30, 2023 | | | October 31, 2022 | | | April 30, 2023 | | | October 31, 2022 (a) | | |
| | (Unaudited) | | | | | | | (Unaudited) | | | | | | |
| | | | | | | | | | | | | | | | | |
| | $ | (36,577 | ) | | $ | (69,920 | ) | | $ | (16,276 | ) | | $ | (10,075 | ) | |
| | | 271,340 | | | | 832,964 | | | | 225,951 | | | | (22,302 | ) | |
| | | 11,009,755 | | | | (4,269,274 | ) | | | 2,238,801 | | | | (701,720 | ) | |
| | | 11,244,518 | | | | (3,506,230 | ) | | | 2,448,476 | | | | (734,097 | ) | |
| | | | | | | | | | | | | | | | | |
| | | | | | | | | | | | | | | | | |
| | | - | | | | - | | | | - | | | | - | | |
| | | - | | | | - | | | | - | | | | - | | |
| | | - | | | | - | | | | - | | | | - | | |
| | | | | | | | | | | | | | | | | |
| | | | | | | | | | | | | | | | | |
| | | 64,911,230 | | | | 98,082,895 | | | | 11,640,028 | | | | 27,694,797 | | |
| | | (3,489,690 | ) | | | (13,898,890 | ) | | | (4,684,393 | ) | | | (547,195 | ) | |
| | | 61,421,540 | | | | 84,184,005 | | | | 6,955,635 | | | | 27,147,602 | | |
| | $ | 72,666,058 | | | $ | 80,677,775 | | | $ | 9,404,111 | | | $ | 26,413,505 | | |
| | | | | | | | | | | | | | | | | |
| | | | | | | | | | | | | | | | | |
| | $ | 150,015,209 | | | $ | 69,337,434 | | | $ | 26,413,505 | | | $ | - | | |
| | $ | 222,681,267 | | | $ | 150,015,209 | | | $ | 35,817,616 | | | $ | 26,413,505 | | |
| | | | | | | | | | | | | | | | | |
| | | | | | | | | | | | | | | | | |
| | | 1,850,000 | | | | 2,850,000 | | | | 500,000 | | | | 1,175,000 | | |
| | | (100,000 | ) | | | (400,000 | ) | | | (200,000 | ) | | | (25,000 | ) | |
| | | 1,750,000 | | | | 2,450,000 | | | | 300,000 | | | | 1,150,000 | | |
The accompanying notes are an integral part of these financial statements.
Statements of Changes in Net Assets
| | |
| | |
| | |
| | |
Operations: | |
Net investment income/(loss) | |
Net realized gain/(loss) | |
Net change in unrealized appreciation/(depreciation) | |
Net Increase/(Decrease) in Net Assets Resulting from Operations | |
| | |
Capital Share Transactions: | |
Proceeds from shares sold | |
Cost of shares redeemed | |
Transaction fees (see Note 5) | |
Net Increase/(Decrease) in Net Assets from Capital Share Transactions | |
Total Increase/(Decrease) in Net Assets | |
| | |
Net Assets: | |
Beginning of period | |
End of period | |
| | |
Change in Shares Outstanding: | |
Shares sold | |
Shares redeemed | |
Net Increase/(Decrease) | |
(a) Since Commencement of Operations on March 7, 2022. | | | | | | | |
The accompanying notes are an integral part of these financial statements.
| | Innovator Buffer Step-Up Strategy ETF | | | | Innovator Power Buffer Step-Up Strategy ETF | |
| | Period Ended | | | Period Ended | | | | Period Ended | | | Period Ended | |
| | April 30, 2023 | | | October 31, 2022 (a) | | | | April 30, 2023 | | | October 31, 2022 (a) | |
| | (Unaudited) | | | | | | | | (Unaudited) | | | | | |
| | | | | | | | | | | | | | | | | |
| | $ | (131,560 | ) | | $ | (107,871 | ) | | | $ | (208,569 | ) | | $ | (106,149 | ) |
| | | 180,903 | | | | (343,914 | ) | | | | 914,820 | | | | (118,629 | ) |
| | | 2,078,357 | | | | (779,659 | ) | | | | 2,490,739 | | | | (339,739 | ) |
| | | 2,127,700 | | | | (1,231,444 | ) | | | | 3,196,990 | | | | (564,517 | ) |
| | | | | | | | | | | | | | | | | |
| | | | | | | | | | | | | | | | | |
| | | 16,213,796 | | | | 68,555,817 | | | | | 51,575,480 | | | | 69,013,632 | |
| | | (15,635,952 | ) | | | (38,486,250 | ) | | | | (20,426,050 | ) | | | (34,610,805 | ) |
| | | 1,219 | | | | 14,387 | | | | | 16,844 | | | | 17,835 | |
| | | 579,063 | | | | 30,083,954 | | | | | 31,166,274 | | | | 34,420,662 | |
| | $ | 2,706,763 | | | $ | 28,852,510 | | | | $ | 34,363,264 | | | $ | 33,856,145 | |
| | | | | | | | | | | | | | | | | |
| | | | | | | | | | | | | | | | | |
| | $ | 28,852,510 | | | $ | - | | | | $ | 33,856,145 | | | $ | - | |
| | $ | 31,559,273 | | | | 28,852,510 | | | | $ | 68,219,409 | | | | 33,856,145 | |
| | | | | | | | | | | | | | | | | |
| | | | | | | | | | | | | | | | | |
| | | 675,000 | | | | 2,750,000 | | | | | 2,050,000 | | | | 2,750,000 | |
| | | (650,000 | ) | | | (1,550,000 | ) | | | | (825,000 | ) | | | (1,375,000 | ) |
| | | 25,000 | | | | 1,200,000 | | | | | 1,225,000 | | | | 1,375,000 | |
The accompanying notes are an integral part of these financial statements.
Statements of Changes in Net Assets
| |
| | |
| | |
| | |
Operations: | |
Net investment income/(loss) | |
Net realized gain/(loss) | |
Net change in unrealized appreciation/(depreciation) | |
Net Increase/(Decrease) in Net Assets Resulting from Operations | |
| | |
Distributions to Shareholders: | |
Net distributions to shareholders | |
Total Distributions to Shareholders | |
| | |
Capital Share Transactions: | |
Proceeds from shares sold | |
Cost of shares redeemed | |
Transaction fees (see Note 5) | |
Net Increase/(Decrease) in Net Assets from Capital Share Transactions | |
Total Increase/(Decrease) in Net Assets | |
| | |
Net Assets: | |
Beginning of period | |
End of period | |
| | |
Change in Shares Outstanding: | |
Shares sold | |
Shares redeemed | |
Net Increase/(Decrease) | |
(a) Since Commencement of Operations on July 25, 2022.
(b) Since Commencement of Operations on August 10, 2022.
The accompanying notes are an integral part of these financial statements.
| | Innovator Hedged TSLA Strategy ETF | | | | Innovator Uncapped Accelerated U.S. Equity ETF | |
| | Period Ended | | | Period Ended | | | | Period Ended | | | Period Ended | |
| | April 30, 2023 | | | October 31, 2022 (a) | | | | April 30, 2023 | | | October 31, 2022 (b) | |
| | (Unaudited) | | | | | | | | (Unaudited) | | | | | |
| | | | | | | | | | | | | | | | | |
| | $ | 30,538 | | | $ | 9,846 | | | | $ | (30,378 | ) | | $ | (9,338 | ) |
| | | (34,441 | ) | | | 30,766 | | | | | (116,613 | ) | | | (222,365 | ) |
| | | (2,501 | ) | | | (151,139 | ) | | | | 728,792 | | | | (284,048 | ) |
| | | (6,404 | ) | | | (110,527 | ) | | | | 581,801 | | | | (515,751 | ) |
| | | | | | | | | | | | | | | | | |
| | | | | | | | | | | | | | | | | |
| | | (18,587 | ) | | | - | | | | | - | | | | - | |
| | | (18,587 | ) | | | - | | | | | - | | | | - | |
| | | | | | | | | | | | | | | | | |
| | | | | | | | | | | | | | | | | |
| | | 1,226,145 | | | | 5,105,365 | | | | | 11,940,710 | | | | 6,031,590 | |
| | | (1,731,182 | ) | | | (2,650,830 | ) | | | | (6,136,025 | ) | | | - | |
| | | - | | | | 629 | | | | | 5,413 | | | | 328 | |
| | | (505,037 | ) | | | 2,455,164 | | | | | 5,810,098 | | | | 6,031,918 | |
| | $ | (530,028 | ) | | $ | 2,344,637 | | | | $ | 6,391,899 | | | $ | 5,516,167 | |
| | | | | | | | | | | | | | | | | |
| | | | | | | | | | | | | | | | | |
| | $ | 2,344,637 | | | $ | - | | | | $ | 5,516,167 | | | $ | - | |
| | $ | 1,814,609 | | | | 2,344,637 | | | | $ | 11,908,066 | | | | 5,516,167 | |
| | | | | | | | | | | | | | | | | |
| | | | | | | | | | | | | | | | | |
| | | 50,000 | | | | 200,000 | | | | | 475,000 | | | | 225,000 | |
| | | (70,000 | ) | | | (100,000 | ) | | | | (250,000 | ) | | | - | |
| | | (20,000 | ) | | | 100,000 | | | | | 225,000 | | | | 225,000 | |
The accompanying notes are an integral part of these financial statements.
Statements of Changes in Net Assets
| |
| | |
| | |
| | |
Operations: | |
Net investment income/(loss) | |
Net realized gain/(loss) | |
Net change in unrealized appreciation/(depreciation) | |
Net Increase/(Decrease) in Net Assets Resulting from Operations | |
| | |
Distributions to Shareholders: | |
Net distributions to shareholders | |
| | |
Capital Share Transactions: | |
Proceeds from shares sold | |
Cost of shares redeemed | |
Net Increase/(Decrease) in Net Assets from Capital Share Transactions | |
Total Increase/(Decrease) in Net Assets | |
| | |
Net Assets: | |
Beginning of period | |
End of period | |
| | |
Change in Shares Outstanding: | |
Shares sold | |
Shares redeemed | |
Net Increase/(Decrease) | |
(a) Since Commencement of Operations on November 8, 2022. |
(b) Since Commencement of Operations on November 16, 2022. |
The accompanying notes are an integral part of these financial statements.
| | | Innovator Equity Managed Floor ETF | | | Innovator Gradient Tactical Rotation Strategy ETF | |
| | | Period Ended | | | Period Ended | |
| | | April 30, 2023 (a) | | | April 30, 2023 (b) | |
| | | (Unaudited) | | | (Unaudited) | |
| | | | | | | | | |
| | | $ | 58,663 | | | $ | 1,388,327 | |
| | | | 625,363 | | | | (19,287,591 | ) |
| | | | 845,850 | | | | (29,945,584 | ) |
| | | | 1,529,876 | | | | (47,844,848 | ) |
| | | | | | | | | |
| | | | | | | | | |
| | | | (52,524 | ) | | | (995,295 | ) |
| | | | | | | | | |
| | | | | | | | | |
| | | | 25,482,205 | | | | 339,859,310 | |
| | | | (4,833,320 | ) | | | (27,590,675 | ) |
| | | | 20,648,885 | | | | 312,268,635 | |
| | | $ | 22,126,237 | | | $ | 263,428,492 | |
| | | | | | | | | |
| | | | | | | | | |
| | | $ | - | | | $ | - | |
| | | $ | 22,126,237 | | | $ | 263,428,492 | |
| | | | | | | | | |
| | | | | | | | | |
| | | | 1,100,000 | | | | 13,600,000 | |
| | | | (200,000 | ) | | | (1,250,000 | ) |
| | | | 900,000 | | | | 12,350,000 | |
The accompanying notes are an integral part of these financial statements.
| | | Per Share Operating Performance (For a share outstanding throughout |
| | | | | | | Investment Operations: | | | Capital Share Transactions: | | | |
| | | Net Asset Value, Beginning of Period | | | Net investment income/(loss) (e) | | | | Net realized and unrealized gain/(loss) | | | Total From Investment Operations | | | Transaction fees (see Note 5) | | | |
Innovator IBD® 50 ETF | | | | | | | | | | | | | | | | | | | | | | | |
For the period ended 4/30/2023 | | $ | 26.16 | | | | 0.04 | | | | | (2.40 | ) | | | (2.36 | ) | | | - | | (f) | |
For the year ended 10/31/2022 | | $ | 50.34 | | | | 0.46 | | | | | (24.54 | ) | | | (24.08 | ) | | | - | | | |
For the year ended 10/31/2021 | | $ | 35.97 | | | | 0.10 | | | | | 14.27 | | | | 14.37 | | | | - | | (f) | |
For the year ended 10/31/2020 | | $ | 33.17 | | | | 0.04 | | | | | 2.76 | | | | 2.80 | | | | - | | | |
For the year ended 10/31/2019 | | $ | 31.24 | | | | (0.07 | ) | | | | 2.00 | | | | 1.93 | | | | - | | (f) | |
For the year ended 10/31/2018 | | $ | 33.34 | | | | (0.12 | ) | | | | (1.92 | ) | | | (2.04 | ) | | | - | | (f) | |
| | | | | | | | | | | | | | | | | | | | | | | | |
Innovator IBD® Breakout Opportunities ETF | | | | | | | | | | | | | | | | | | | | | | | |
For the period ended 4/30/2023 | | $ | 30.68 | | | | 0.16 | | | | | 0.39 | | | | 0.55 | | | | - | | | |
For the year ended 10/31/2022 | | $ | 36.52 | | | | 0.32 | | | | | (6.16 | ) | | | (5.84 | ) | | | - | | | |
For the year ended 10/31/2021 | | $ | 23.53 | | | | (0.02 | ) | | | | 13.01 | | | | 12.99 | | | | - | | | |
For the year ended 10/31/2020 | | $ | 19.44 | | | | (0.03 | ) | | | | 4.12 | | | | 4.09 | | | | - | | | |
For the year ended 10/31/2019 | | $ | 20.26 | | | | - | | (f) | | | (0.78 | ) | | | (0.78 | ) | | | - | | (f) | |
For the period 9/12/2018 (d) - 10/31/2018 | | $ | 25.00 | | | | (0.01 | ) | | | | (4.73 | ) | | | (4.74 | ) | | | - | | | |
| | | | | | | | | | | | | | | | | | | | | | | | |
Innovator Deepwater Frontier Tech ETF | | | | | | | | | | | | | | | | | | | | | | | |
For the period ended 4/30/2023 | | $ | 29.35 | | | | (0.03 | ) | | | | 4.03 | | | | 4.00 | | | | - | | (f) | |
For the year ended 10/31/2022 | | $ | 56.02 | | | | (0.04 | ) | | | | (26.64 | ) | | | (26.68 | ) | | | 0.01 | | | |
For the year ended 10/31/2021 | | $ | 37.34 | | | | (0.14 | ) | | | | 18.81 | | | | 18.67 | | | | 0.01 | | | |
For the year ended 10/31/2020 | | $ | 23.70 | | | | (0.09 | ) | | | | 13.73 | | | | 13.64 | | | | - | | (f) | |
For the year ended 10/31/2019 | | $ | 22.77 | | | | (0.02 | ) | | | | 0.95 | | | | 0.93 | | | | - | | | |
For the period 7/24/2018 (d) - 10/31/2018 | | $ | 25.00 | | | | (0.01 | ) | | | | (2.22 | ) | | | (2.23 | ) | | | - | | (f) | |
(a) | Annualized for periods less than one year. |
(b) | Not annualized for periods less than one year. |
(c) | Does not include the impact of the expenses of the underlying funds in which the Fund invests. |
(d) | Commencement of operations. |
(e) | Net investment income/(loss) per share has been calculated based on average shares outstanding during the period. |
(f) | Amount represents less than $0.01 per share. |
(g) | Excludes in-kind transactions associated with creations and redemptions of the Funds. |
(h) | Recognition of net investment income by the Funds are affected by the timing of the declaration of dividends by the underlying investment companies in which the Funds invest. This ratio does not include net investment income of the underlying investment companies in which the Funds invest. |
The accompanying notes are an integral part of these financial statements.
| | each period) | | | Ratios/Supplemental Data: | |
| | | | | | | | | | | | | | | | | | | | | | | | | | |
| | Distributions Paid to Shareholders: | | | | | | | | | | | | | | | | | | | Ratio to Average Net Assets of: (a) | | | | | |
| | Paid from net investment income | | | Change in Net Asset Value for the Period | | | Net Asset Value, End of Period | | | Total return (b) | | | Net assets, end of period (000) | | | Expenses, before waivers/recoupment (c) | | | Expenses, net of waivers/recoupment (c) | | | Net investment income/(loss) (h) | | | Portfolio turnover rate (b)(g) | |
| | | | | | | | | | | | | | | | | | | | | | | | | | | | | | | | | | | | |
| | | (0.60 | ) | | | (2.96 | ) | | $ | 23.20 | | | | (8.88 | )% | | $ | 77,730 | | | | 1.14 | % | | | 0.80 | % | | | 0.33 | % | | | 706 | % |
| | | (0.10 | ) | | | (24.18 | ) | | $ | 26.16 | | | | (47.90 | )% | | $ | 102,043 | | | | 0.97 | % | | | 0.80 | % | | | 1.29 | % | | | 1,961 | % |
| | | - | | | | 14.37 | | | $ | 50.34 | | | | 39.95 | % | | $ | 274,365 | | | | 0.93 | % | | | 0.80 | % | | | 0.22 | % | | | 1,133 | % |
| | | - | | | | 2.80 | | | $ | 35.97 | | | | 8.42 | % | | $ | 181,624 | | | | 0.90 | % | | | 0.80 | % | | | 0.12 | % | | | 974 | % |
| | | - | | | | 1.93 | | | $ | 33.17 | | | | 6.20 | % | | $ | 326,748 | | | | 0.78 | % | | | 0.80 | % | | | (0.21 | )% | | | 786 | % |
| | | (0.06 | ) | | | (2.10 | ) | | $ | 31.24 | | | | (6.15 | )% | | $ | 440,451 | | | | 0.84 | % | | | 0.80 | % | | | (0.43 | )% | | | 719 | % |
| | | | | | | | | | | | | | | | | | | | | | | | | | | | | | | | | | | | |
| | | | | | | | | | | | | | | | | | | | | | | | | | | | | | | | | | | | |
| | | (0.40 | ) | | | 0.15 | | | $ | 30.83 | | | | 1.82 | % | | $ | 13,872 | | | | 0.80 | % | | | 0.80 | % | | | 1.06 | % | | | 887 | % |
| | | - | | | | (5.84 | ) | | $ | 30.68 | | | | (15.98 | )% | | $ | 13,806 | | | | 0.80 | % | | | 0.80 | % | | | 0.92 | % | | | 1,980 | % |
| | | - | | | | 12.99 | | | $ | 36.52 | | | | 55.18 | % | | $ | 14,607 | | | | 0.80 | % | | | 0.80 | % | | | (0.07 | )% | | | 1,846 | % |
| | | - | | | | 4.09 | | | $ | 23.53 | | | | 21.04 | % | | $ | 5,883 | | | | 0.80 | % | | | 0.80 | % | | | (0.12 | )% | | | 1,637 | % |
| | | (0.04 | ) | | | (0.82 | ) | | $ | 19.44 | | | | (3.84 | )% | | $ | 7,777 | | | | 0.80 | % | | | 0.80 | % | | | 0.02 | % | | | 1,777 | % |
| | | - | | | | (4.74 | ) | | $ | 20.26 | | | | (18.95 | )% | | $ | 8,105 | | | | 0.80 | % | | | 0.80 | % | | | (0.38 | )% | | | 289 | % |
| | | | | | | | | | | | | | | | | | | | | | | | | | | | | | | | | | | | |
| | | | | | | | | | | | | | | | | | | | | | | | | | | | | | | | | | | | |
| | | - | | | | 4.00 | | | $ | 33.35 | | | | 13.63 | % | | $ | 35,021 | | | | 0.70 | % | | | 0.70 | % | | | (0.21 | )% | | | 84 | % |
| | | - | | | | (26.67 | ) | | $ | 29.35 | | | | (47.60 | )% | | $ | 32,288 | | | | 0.70 | % | | | 0.70 | % | | | (0.10 | )% | | | 138 | % |
| | | - | | | | 18.68 | | | $ | 56.02 | | | | 50.01 | % | | $ | 78,428 | | | | 0.70 | % | | | 0.70 | % | | | (0.27 | )% | | | 134 | % |
| | | - | | | | 13.64 | | | $ | 37.34 | | | | 57.59 | % | | $ | 16,805 | | | | 0.70 | % | | | 0.70 | % | | | (0.32 | )% | | | 97 | % |
| | | - | | | | 0.93 | | | $ | 23.70 | | | | 4.07 | % | | $ | 10,664 | | | | 0.70 | % | | | 0.70 | % | | | (0.07 | )% | | | 107 | % |
| | | - | | | | (2.23 | ) | | $ | 22.77 | | | | (8.92 | )% | | $ | 12,524 | | | | 0.70 | % | | | 0.70 | % | | | (0.23 | )% | | | 53 | % |
The accompanying notes are an integral part of these financial statements.
| | | Per Share Operating Performance (For a share |
| | | | | | | Investment Operations: | | | Capital Share Transactions: | | |
| | | Net Asset Value, Beginning of Period | | | Net investment income/(loss) (c) | | | Net realized and unrealized gain/(loss) | | | | Total From Investment Operations | | | Transaction fees (see
Note 5) | | |
Innovator S&P Investment Grade Preferred ETF | | | | | | | | | | | | | | | | | | | | | | |
For the period ended 4/30/2023 | | $ | 17.90 | | | | 0.46 | | | | 0.88 | | | | | 1.34 | | | | - | | |
For the year ended 10/31/2022 | | $ | 24.22 | | | | 1.00 | | | | (6.28 | ) | | | | (5.28 | ) | | | - | | |
For the year ended 10/31/2021 | | $ | 24.02 | | | | 1.14 | | | | 0.27 | | (h) | | | 1.41 | | | | - | | |
For the year ended 10/31/2020 | | $ | 24.11 | | | | 1.23 | | | | (0.07 | ) | | | | 1.16 | | | | - | | (j) |
For the period 4/1/2019 (g) - 10/31/2019 | | $ | 23.18 | | | | 0.67 | | | | 0.93 | | | | | 1.60 | | | | - | | |
For the year ended 3/31/2019 | | $ | 23.38 | | | | 1.18 | | | | (0.18 | ) | | | | 1.00 | | | | - | | |
For the year ended 3/31/2018 | | $ | 24.06 | | | | 1.29 | | | | (0.57 | ) | | | | 0.72 | | | | - | | |
| | | | | | | | | | | | | | | | | | | | | | | |
Innovator Laddered Allocation Power Buffer ETF | | | | | | | | | | | | | | | | | | | | | | |
For the period ended 4/30/2023 | | $ | 34.09 | | | | (0.01 | ) | | | 2.13 | | | | | 2.12 | | | | - | | |
For the year ended 10/31/2022 | | $ | 35.56 | | | | (0.02 | ) | | | (1.45 | ) | | | | (1.47 | ) | | | - | | |
For the year ended 10/31/2021 | | $ | 31.49 | | | | (0.05 | ) | | | 4.12 | | | | | 4.07 | | | | - | | |
For the year ended 10/31/2020 | | $ | 36.66 | | | | 0.81 | | | | (5.26 | ) | | | | (4.45 | ) | | | - | | |
For the period 10/1/2019 (d) - 10/31/2019 | | $ | 36.81 | | | | 0.02 | | | | (0.17 | ) | | | | (0.15 | ) | | | - | | |
For the year ended 9/30/2019 | | $ | 31.55 | | | | 0.66 | | | | 5.29 | | | | | 5.95 | | | | - | | |
For the year ended 9/30/2018 | | $ | 31.23 | | | | 0.47 | | | | 0.32 | | (h) | | | 0.79 | | | | - | | |
| | | | | | | | | | | | | | | | | | | | | | | |
Innovator Laddered Allocation Buffer ETF | | | | | | | | | | | | | | | | | | | | | | |
For the period ended 4/30/2023 | | $ | 22.97 | | | | (0.01 | ) | | | 1.74 | | | | | 1.73 | | | | - | | |
For the period 2/8/2022 (f) - 10/31/2022 | | $ | 24.89 | | | | (0.02 | ) | | | (1.90 | ) | | | | (1.92 | ) | | | - | | |
(a) | Annualized for periods less than one year. |
(b) | Not annualized for periods less than one year. |
(c) | Net investment income/(loss) per share has been calculated based on average shares outstanding during the period. |
(d) | The period ended October 31, 2019 consists of one month due to the Fund's fiscal year end change. |
(e) | Excludes in-kind transactions associated with creations and redemptions of the Funds. |
(f) | Commencement of operations. |
(g) | The period ended October 31, 2019 consists of seven months due to the Fund's fiscal year end change. |
(h) | Net realized and unrealized gain/(loss) per share includes balancing amounts necessary to reconcile the change in net asset value per share for the period, and may not reconcile with the aggregate gain/(loss) in the Statement of Operations due to share transactions for the period. |
(j) | The ratio of net expenses to average net assets includes interest expense fees of 0.03%. |
(j) | Amount represents less than $0.01 per share. |
(k) | Does not include the impact of the expenses of the underlying funds in which the Funds invest. |
(l) | Recognition of net investment income by the Funds are affected by the timing of the declaration of dividends by the underlying investment companies in which the Funds invest. This ratio does not include net investment income of the underlying investment companies in which the Funds invest. |
The accompanying notes are an integral part of these financial statements.
outstanding throughout each period) | | | Ratios/Supplemental Data: |
| | Distributions Paid to Shareholders: | | | | | | | | | | | | | | | | | | | Ratio to Average Net Assets of: (a) | | | |
| | Paid from net investment income | | | Paid from return of capital | | | Total Distributions Paid | | | Change in Net Asset Value for the Period | | | Net Asset Value, End of Period | | | Total return (b) | | | Net assets, end of period (000) | | | Expenses, before waivers/
recoupment (k) | | | | Expenses, net of waivers/
recoupment (k) | | | | Net investment income/
(loss) (l) | | Portfolio turnover rate (b)(e) |
| | | | | | | | | | | | | | | | | | | | | | | | | | | | | | | | | | | | | | | | | | |
| | | (0.46 | ) | | | - | | | | (0.46 | ) | | | 0.88 | | | $ | 18.78 | | | | 7.49 | % | | $ | 116,432 | | | | 0.47 | % | | | | 0.47 | % | | | 4.94 % | | 8 % |
| | | (1.02 | ) | | | (0.02 | ) | | | (1.04 | ) | | | (6.32 | ) | | $ | 17.90 | | | | (22.27 | )% | | $ | 119,057 | | | | 0.47 | % | | | | 0.47 | % | | | 4.70 % | | 46 % |
| | | (1.14 | ) | | | (0.07 | ) | | | (1.21 | ) | | | 0.20 | | | $ | 24.22 | | | | 5.97 | % | | $ | 222,794 | | | | 0.47 | % | | | | 0.47 | % | | | 4.70 % | | 68 % |
| | | (1.25 | ) | | | - | | | | (1.25 | ) | | | (0.09 | ) | | $ | 24.02 | | | | 5.04 | % | | $ | 127,315 | | | | 0.47 | % | | | | 0.47 | % | | | 5.15 % | | 58 % |
| | | (0.67 | ) | | | - | | | | (0.67 | ) | | | 0.93 | | | $ | 24.11 | | | | 6.93 | % | | $ | 19,288 | | | | 0.47 | % | | | | 0.47 | % | | | 4.75 % | | 34 % |
| | | (1.20 | ) | | | - | | | | (1.20 | ) | | | (0.20 | ) | | $ | 23.18 | | | | 4.54 | % | | $ | 13,911 | | | | 0.47 | % | | | | 0.47 | % | | | 5.12 % | | 58 % |
| | | (1.36 | ) | | | (0.04 | ) | | | (1.40 | ) | | | (0.68 | ) | | $ | 23.38 | | | | 2.98 | % | | $ | 19,870 | | | | 0.47 | % | | | | 0.47 | % | | | 5.39 % | | 67 % |
| | | | | | | | | | | | | | | | | | | | | | | | | | | | | | | | | | | | | | | | | | |
| | | | | | | | | | | | | | | | | | | | | | | | | | | | | | | | | | | | | | | | | | |
| | | - | | | | - | | | | - | | | | 2.12 | | | $ | 36.21 | | | | 6.20 | % | | $ | 222,681 | | | | 0.20 | % | | | | 0.10 | % | | | (0.04)% | | 1 % |
| | | - | | | | - | | | | - | | | | (1.47 | ) | | $ | 34.09 | | | | (4.11 | )% | | $ | 150,015 | | | | 0.20 | % | | | | 0.12 | % | | | (0.07)% | | 2 % |
| | | - | | | | - | | | | - | | | | 4.07 | | | $ | 35.56 | | | | 12.93 | % | | $ | 69,337 | | | | 0.20 | % | | | | 0.20 | % | | | (0.14)% | | 1 % |
| | | (0.72 | ) | | | - | | | | (0.72 | ) | | | (5.17 | ) | | $ | 31.49 | | | | (11.93 | )% | | $ | 28,338 | | | | 0.47 | % | | | | 0.47 | % | | | 2.47 % | | 750 % |
| | | - | | | | - | | | | - | | | | (0.15 | ) | | $ | 36.66 | | | | (0.42 | )% | | $ | 137,463 | | | | 0.49 | % | | | | 0.49 | % | | | 0.63 % | | 0 % |
| | | (0.69 | ) | | | - | | | | (0.69 | ) | | | 5.26 | | | $ | 36.81 | | | | 19.11 | % | | $ | 136,195 | | | | 0.49 | % | | | | 0.49 | % | | | 2.00 % | | 44 % |
| | | (0.47 | ) | | | - | | | | (0.47 | ) | | | 0.32 | | | $ | 31.55 | | | | 2.55 | % | | $ | 162,484 | | | | 0.52 | % | (i) | | | 0.52 | % | (i) | | 1.47 % | | 667 % |
| | | | | | | | | | | | | | | | | | | | | | | | | | | | | | | | | | | | | | | | | | |
| | | | | | | | | | | | | | | | | | | | | | | | | | | | | | | | | | | | | | | | | | |
| | | - | | | | - | | | | - | | | | 1.73 | | | $ | 24.70 | | | | 7.55 | % | | $ | 35,818 | | | | 0.20 | % | | | | 0.10 | % | | | (0.10)% | | 1 % |
| | | - | | | | - | | | | - | | | | (1.92 | ) | | $ | 22.97 | | | | (7.72 | )% | | $ | 26,414 | | | | 0.20 | % | | | | 0.10 | % | | | (0.10)% | | 179 % |
The accompanying notes are an integral part of these financial statements.
Financial Highlights
| | | Per Share Operating Performance (For a share outstanding throughout each period) |
| | | | | | | Investment Operations: | | | Capital Share Transactions: | | |
| | | Net Asset Value, Beginning of Period | | | Net investment income/(loss) (c) | | | Net realized and unrealized gain/(loss) | | | Total From Investment Operations | | | Transaction fees (see Note 5) | | |
Innovator Buffer Step-Up Strategy ETF | | | | | | | | | | | | | | | | | | | | | |
For the period ended 4/30/2023 | | $ | 24.04 | | | | (0.11 | ) | | | 1.83 | | | | 1.72 | | | | - | | (e) |
For the period 3/7/2022(d) - 10/31/2022 | | $ | 25.48 | | | | (0.14 | ) | | | (1.32 | ) | | | (1.46 | ) | | | 0.02 | | |
| | | | | | | | | | | | | | | | | | | | | | |
Innovator Power Buffer Step-Up Strategy ETF | | | | | | | | | | | | | | | | | | | | | |
For the period ended 4/30/2023 | | $ | 24.62 | | | | (0.11 | ) | | | 1.72 | | | | 1.61 | | | | 0.01 | | |
For the period 3/7/2022(d) - 10/31/2022 | | $ | 25.67 | | | | (0.14 | ) | | | (0.93 | ) | | | (1.07 | ) | | | 0.02 | | |
(a) | Annualized for periods less than one year. |
(b) | Not annualized for periods less than one year. |
(c) | Net investment income/(loss) per share has been calculated based on average shares outstanding during the period. |
(d) | Commencement of operations. |
(e) | Amount represents less than $0.01 per share. |
The accompanying notes are an integral part of these financial statements.
| | | | | | | | | | Ratios/Supplemental Data: | |
| | | | | | | | | | | | | | | | | | | | | | |
| | | | | | | | | | | | | | | | | | Ratio to Average Net Assets of: (a) | | | | | |
| | Change in Net Asset Value for the Period | | | Net Asset Value, End of Period | | | Total return (b) | | | Net assets, end of period (000) | | | Expenses | | | Net investment income/(loss) | | | Portfolio turnover rate (b) | |
| | | | | | | | | | | | | | | | | | | | | | | | | | | | |
| | | 1.72 | | | $ | 25.76 | | | | 7.15 | % | | $ | 31,559 | | | | 0.89 | % | | | (0.88 | )% | | | 0 | % |
| | | (1.44 | ) | | $ | 24.04 | | | | (5.64 | )% | | $ | 28,853 | | | | 0.89 | % | | | (0.89 | )% | | | 0 | % |
| | | | | | | | | | | | | | | | | | | | | | | | | | | | |
| | | | | | | | | | | | | | | | | | | | | | | | | | | | |
| | | 1.62 | | | $ | 26.24 | | | | 6.56 | % | | $ | 68,219 | | | | 0.89 | % | | | (0.88 | )% | | | 0 | % |
| | | (1.05 | ) | | $ | 24.62 | | | | (4.08 | )% | | $ | 33,856 | | | | 0.89 | % | | | (0.89 | )% | | | 0 | % |
The accompanying notes are an integral part of these financial statements.
Financial Highlights
| | | Per Share Operating Performance (For a share outstanding throughout |
| | | | | | | Investment Operations: | | | Capital Share Transactions: | | |
| | | Net Asset Value, Beginning of Period | | | Net investment income/(loss) (c) | | | Net realized and unrealized gain/(loss) | | | Total From Investment Operations | | | Transaction fees (see Note 5) | | |
Innovator Hedged TSLA Strategy ETF | | | | | | | | | | | | | | | | | | | | | |
For the period ended 4/30/2023 | | $ | 23.45 | | | | 0.31 | | | | (0.89 | ) | | | (0.58 | ) | | | - | | |
For the period 7/25/2022(d) - 10/31/2022 | | $ | 24.91 | | | | 0.10 | | | | (1.57 | ) | | | (1.47 | ) | | | 0.01 | | |
| | | | | | | | | | | | | | | | | | | | | | |
Innovator Uncapped Accelerated U.S. Equity ETF | | | | | | | | | | | | | | | | | | | | | |
For the period ended 4/30/2023 | | $ | 24.52 | | | | (0.10 | ) | | | 2.02 | | | | 1.92 | | | | 0.02 | | |
For the period 8/10/2022(d) - 10/31/2022 | | $ | 26.88 | | | | (0.04 | ) | | | (2.32 | ) | | | (2.36 | ) | | | - | | (e) |
(a) | Annualized for periods less than one year. |
(b) | Not annualized for periods less than one year. |
(c) | Net investment income/(loss) per share has been calculated based on average shares outstanding during the period. |
(d) | Commencement of operations. |
(e) | Amount represents less than $0.01 per share. |
The accompanying notes are an integral part of these financial statements.
| | each period) | | | Ratios/Supplemental Data: | |
| | | | | | | | | | | | | | | | | | | | | | | | | | | |
| | | | | | | | | | | | | | | | | | | | | | Ratio to Average Net Assets of: (a) | | | | | |
| | Distributions Paid to Shareholders:
Paid from net investment income | | | Change in Net Asset Value for the Period | | | Net Asset Value, End of Period | | | Total return (b) | | | Net assets, end of period (000) | | | Expenses | | | Net investment income/(loss) | | | Portfolio turnover rate (b) | |
| | | | | | | | | | | | | | | | | | | | | | | | | | | | | | | | |
| | | (0.19 | ) | | | (0.77 | ) | | $ | 22.68 | | | | (2.45 | )% | | $ | 1,815 | | | | 0.79 | % | | | 2.71 | % | | | 0 | % |
| | | - | | | | (1.46 | ) | | $ | 23.45 | | | | (5.88 | )% | | $ | 2,345 | | | | 0.79 | % | | | 1.47 | % | | | 0 | % |
| | | | | | | | | | | | | | | | | | | | | | | | | | | | | | | | |
| | | | | | | | | | | | | | | | | | | | | | | | | | | | | | | | |
| | | - | | | | 1.94 | | | $ | 26.46 | | | | 7.94 | % | | $ | 11,908 | | | | 0.79 | % | | | (0.77 | )% | | | 0 | % |
| | | - | | | | (2.36 | ) | | $ | 24.52 | | | | (8.79 | )% | | $ | 5,516 | | | | 0.79 | % | | | (0.78 | )% | | | 0 | % |
The accompanying notes are an integral part of these financial statements.
Financial Highlights
| | | Per Share Operating Performance (For a share outstanding throughout |
| | | | | | | Investment Operations: | | | Capital Share Transactions: | |
| | | Net Asset Value, Beginning of Period | | | Net investment income/(loss) (c) | | | Net realized and unrealized gain/(loss) | | | Total From Investment Operations | | | Transaction fees (see Note 5) | |
Innovator Equity Managed Floor ETF | | | | | | | | | | | | | | | | | | | | |
For the period 11/8/2022 (d) - 4/30/2023 | | $ | 22.80 | | | | 0.08 | | | | 1.76 | | | | 1.84 | | | | - | |
| | | | | | | | | | | | | | | | | | | | | |
Innovator Gradient Tactical Rotation Strategy ETF | | | | | | | | | | | | | | | | | | | | |
For the period 11/16/2022 (d) - 4/30/2023 | | $ | 25.00 | | | | 0.11 | | | | (3.71 | ) | | | (3.60 | ) | | | - | |
(a) | Annualized for periods less than one year. |
(b) | Not annualized for periods less than one year. |
(c) | Net investment income/(loss) per share has been calculated based on average shares outstanding during the period. |
(d) | Commencement of operations. |
(e) | Recognition of net investment income by the Funds are affected by the timing of the declaration of dividends by the underlying investment companies in which the Funds invest. This ratio does not include net investment income of the underlying investment companies in which the Funds invest. |
(f) | Excludes in-kind transactions associated with creations and redemptions of the Funds. |
The accompanying notes are an integral part of these financial statements.
| | each period) | | | Ratios/Supplemental Data: | |
| | | | | | | | | | | | | | | | | | | | | | | | | | |
| | Distributions Paid to Shareholders: | | | | | | | | | | | | | | | | | | | Ratio to Average Net Assets of: (a) | | | | | |
| | Paid from net investment income | | | Change in Net Asset Value for the Period | | | Net Asset Value, End of Period | | | Total return (b) | | | Net assets, end of period (000) | | | Expenses | | | Net investment income/(loss) (e) | | | Portfolio turnover rate (b)(f) | |
| | | | | | | | | | | | | | | | | | | | | | | | | | | | | | | | |
| | | (0.06 | ) | | | 1.78 | | | $ | 24.58 | | | | 8.09 | % | | $ | 22,126 | | | | 0.89 | % | | | 0.69 | % | | | 0 | % |
| | | | | | | | | | | | | | | | | | | | | | | | | | | | | | | | |
| | | | | | | | | | | | | | | | | | | | | | | | | | | | | | | | |
| | | (0.07 | ) | | | (3.67 | ) | | $ | 21.33 | | | | (14.42 | )% | | $ | 263,428 | | | | 0.80 | % | | | 1.04 | % | | | 152 | % |
The accompanying notes are an integral part of these financial statements.
Notes to Financial Statements (Unaudited)
Innovator ETFs Trust (the “Trust”) was organized under Delaware law as a Delaware statutory trust on October 17, 2007, and is registered with the Securities and Exchange Commission (“SEC”) under the Investment Company Act of 1940, as amended (the “1940 Act”) as an open–end management investment company. Effective April 1, 2023, LOUP’s name was changed from Innovator Loup Frontier Tech ETF to Innovator Deepwater Frontier Tech ETF. The Trust currently consists of multiple operational series, of which twelve are covered in this report, collectively the (“Funds”):
Name | | Ticker | | Commencement of Operations | | Tracking Index/Fund (a) |
Innovator IBD® 50 ETF | | FFTY | | April 8, 2015 | | IBD® 50 Index |
Innovator IBD® Breakout Opportunities ETF | | BOUT | | September 12, 2018 | | IBD® Breakout Stocks Index |
Innovator Deepwater Frontier Tech ETF | | LOUP | | July 24, 2018 | | Loup Frontier Tech Index |
Innovator S&P Investment Grade Preferred ETF | | EPRF | | May 23, 2016 | | S&P U.S. High Quality Preferred Stock Index |
Innovator Laddered Allocation Power Buffer ETF (b) | | BUFF | | October 19, 2016 | | Refinitiv Laddered Power Buffer Strategy Index |
Innovator Laddered Allocation Buffer ETF (c) | | BUFB | | February 8, 2022 | | MerQube U.S. Large Cap Equity Buffer Laddered Index |
Innovator Buffer Step-Up Strategy ETF | | BSTP | | March 7, 2022 | | SPDR S&P 500® ETF Trust |
Innovator Power Buffer Step-Up Strategy ETF | | PSTP | | March 7, 2022 | | SPDR S&P 500® ETF Trust |
Innovator Hedged TSLA Strategy ETF (d) | | TSLH | | July 25, 2022 | | Tesla, Inc. |
Innovator Uncapped Accelerated U.S. Equity ETF | | XUSP | | August 10, 2022 | | SPDR S&P 500® ETF Trust |
Innovator Equity Managed Floor ETF | | SFLR | | November 8, 2022 | | SPDR S&P 500® ETF Trust |
Innovator Gradient Tactical Rotation Strategy ETF | | IGTR | | November 16, 2022 | | S&P Global Broad Market Index |
(a) | Each Fund individually seeks to track their respective index or Fund, before fees and expenses. |
(b) | BUFF seeks to achieve its investment objective by investing primarily in other Innovator ETFs (Affiliated Fund of Fund structure) that themselves seek investment results corresponding to their own respective underlying indexes. In addition to its own fees and expenses, BUFF will pay indirectly a proportional share of the fees and expenses of the underlying Innovator ETFs in which it invests, including advisory and administration fees (Acquired Fund Fees and Expenses). Prior to August 11, 2020, BUFF sought investment results that generally corresponded, before fees and expenses, to the Lunt Capital U.S. Large Cap Equity Rotation Index. |
(c) | BUFB seeks to achieve its investment objective by investing primarily in other Innovator ETFs (Affiliated Fund of Fund structure) that themselves seek investment results corresponding to their own respective underlying indexes. In addition to its own fees and expenses, BUFB will pay indirectly a proportional share of the fees and expenses of the underlying Innovator ETFs in which it invests, including advisory and administration fees (Acquired Fund Fees and Expenses). |
(d) | TSLH seeks to participate in the price return of the common stock of Tesla, Inc., subject to a limit on investment gains and seeks to provide a level of protection against significant declines in the price return of the common stock of Tesla, Inc. |
The operational series of the Trust covered outside of this report consist of:
Name | | Ticker | | Commencement of Operations | | Tracking Fund |
Innovator U.S. Equity Buffer ETF – January | | BJAN | | December 31, 2018 | | SPDR S&P 500® ETF Trust |
Innovator U.S. Equity Buffer ETF – February | | BFEB | | January 31, 2020 | | SPDR S&P 500® ETF Trust |
Innovator U.S. Equity Buffer ETF – March | | BMAR | | February 28, 2020 | | SPDR S&P 500® ETF Trust |
Innovator U.S. Equity Buffer ETF – April | | BAPR | | March 29, 2019 | | SPDR S&P 500® ETF Trust |
Innovator U.S. Equity Buffer ETF – May | | BMAY | | April 30, 2020 | | SPDR S&P 500® ETF Trust |
Innovator U.S. Equity Buffer ETF – June | | BJUN | | May 31, 2019 | | SPDR S&P 500® ETF Trust |
Innovator U.S. Equity Buffer ETF – July | | BJUL | | August 28, 2018 | | SPDR S&P 500® ETF Trust |
Innovator U.S. Equity Buffer ETF – August | | BAUG | | July 31, 2019 | | SPDR S&P 500® ETF Trust |
Innovator U.S. Equity Buffer ETF – September | | BSEP | | August 30, 2019 | | SPDR S&P 500® ETF Trust |
Innovator U.S. Equity Buffer ETF – October | | BOCT | | September 28, 2018 | | SPDR S&P 500® ETF Trust |
Innovator U.S. Equity Buffer ETF – November | | BNOV | | October 31, 2019 | | SPDR S&P 500® ETF Trust |
Innovator U.S. Equity Buffer ETF – December | | BDEC | | November 29, 2019 | | SPDR S&P 500® ETF Trust |
Innovator U.S. Equity Power Buffer ETF – January | | PJAN | | December 31, 2018 | | SPDR S&P 500® ETF Trust |
Innovator U.S. Equity Power Buffer ETF – February | | PFEB | | January 31, 2020 | | SPDR S&P 500® ETF Trust |
Innovator U.S. Equity Power Buffer ETF – March | | PMAR | | February 28, 2020 | | SPDR S&P 500® ETF Trust |
Innovator U.S. Equity Power Buffer ETF – April | | PAPR | | March 29, 2019 | | SPDR S&P 500® ETF Trust |
Innovator U.S. Equity Power Buffer ETF – May | | PMAY | | April 30, 2020 | | SPDR S&P 500® ETF Trust |
Innovator U.S. Equity Power Buffer ETF – June | | PJUN | | May 31, 2019 | | SPDR S&P 500® ETF Trust |
Innovator U.S. Equity Power Buffer ETF – July | | PJUL | | August 7, 2018 | | SPDR S&P 500® ETF Trust |
Innovator U.S. Equity Power Buffer ETF – August | | PAUG | | July 31, 2019 | | SPDR S&P 500® ETF Trust |
Innovator U.S. Equity Power Buffer ETF – September | | PSEP | | August 30, 2019 | | SPDR S&P 500® ETF Trust |
Innovator U.S. Equity Power Buffer ETF – October | | POCT | | September 28, 2018 | | SPDR S&P 500® ETF Trust |
Innovator U.S. Equity Power Buffer ETF – November | | PNOV | | October 31, 2019 | | SPDR S&P 500® ETF Trust |
Innovator U.S. Equity Power Buffer ETF – December | | PDEC | | November 29, 2019 | | SPDR S&P 500® ETF Trust |
Innovator U.S. Equity Ultra Buffer ETF – January | | UJAN | | December 31, 2018 | | SPDR S&P 500® ETF Trust |
Innovator U.S. Equity Ultra Buffer ETF – February | | UFEB | | January 31, 2020 | | SPDR S&P 500® ETF Trust |
Innovator U.S. Equity Ultra Buffer ETF – March | | UMAR | | February 28, 2020 | | SPDR S&P 500® ETF Trust |
Innovator U.S. Equity Ultra Buffer ETF – April | | UAPR | | March 29, 2019 | | SPDR S&P 500® ETF Trust |
Innovator U.S. Equity Ultra Buffer ETF – May | | UMAY | | April 30, 2020 | | SPDR S&P 500® ETF Trust |
Innovator U.S. Equity Ultra Buffer ETF – June | | UJUN | | May 31, 2019 | | SPDR S&P 500® ETF Trust |
Innovator U.S. Equity Ultra Buffer ETF – July | | UJUL | | August 7, 2018 | | SPDR S&P 500® ETF Trust |
Innovator U.S. Equity Ultra Buffer ETF – August | | UAUG | | July 31, 2019 | | SPDR S&P 500® ETF Trust |
Innovator U.S. Equity Ultra Buffer ETF – September | | USEP | | August 30, 2019 | | SPDR S&P 500® ETF Trust |
Name | | Ticker | | Commencement of Operations | | Tracking Fund |
Innovator U.S. Equity Ultra Buffer ETF – October | | UOCT | | September 28, 2018 | | SPDR S&P 500® ETF Trust |
Innovator U.S. Equity Ultra Buffer ETF – November | | UNOV | | October 31, 2019 | | SPDR S&P 500® ETF Trust |
Innovator U.S. Equity Ultra Buffer ETF – December | | UDEC | | November 29, 2019 | | SPDR S&P 500® ETF Trust |
Innovator Premium Income 10 Barrier ETF - April | | APRD | | March 31, 2023 | | S&P 500® Index |
Innovator Premium Income 20 Barrier ETF - April | | APRH | | March 31, 2023 | | S&P 500® Index |
Innovator Premium Income 30 Barrier ETF - April | | APRJ | | March 31, 2023 | | S&P 500® Index |
Innovator Premium Income 40 Barrier ETF - April | | APRQ | | March 31, 2023 | | S&P 500® Index |
Innovator International Developed Power Buffer ETF - January | | IJAN | | December 31, 2019 | | iShares MSCI EAFE ETF |
Innovator International Developed Power Buffer ETF - April | | IAPR | | March 31, 2021 | | iShares MSCI EAFE ETF |
Innovator International Developed Power Buffer ETF - July | | IJUL | | June 28, 2019 | | iShares MSCI EAFE ETF |
Innovator International Developed Power Buffer ETF - October | | IOCT | | September 30, 2021 | | iShares MSCI EAFE ETF |
Innovator Emerging Markets Power Buffer ETF - January | | EJAN | | December 31, 2019 | | iShares MSCI Emerging Markets ETF |
Innovator Emerging Markets Power Buffer ETF - April | | EAPR | | March 31, 2021 | | iShares MSCI Emerging Markets ETF |
Innovator Emerging Markets Power Buffer ETF - July | | EJUL | | June 28, 2019 | | iShares MSCI Emerging Markets ETF |
Innovator Emerging Markets Power Buffer ETF - October | | EOCT | | September 30, 2021 | | iShares MSCI Emerging Markets ETF |
Innovator Growth-100 Power Buffer ETF - January | | NJAN | | December 31, 2019 | | Invesco QQQ Trust |
Innovator Growth-100 Power Buffer ETF - April | | NAPR | | March 31, 2020 | | Invesco QQQ Trust |
Innovator Growth-100 Power Buffer ETF - July | | NJUL | | June 30, 2020 | | Invesco QQQ Trust |
Innovator Growth-100 Power Buffer ETF - October | | NOCT | | September 30, 2019 | | Invesco QQQ Trust |
Innovator U.S. Small Cap Power Buffer ETF - January | | KJAN | | December 31, 2019 | | iShares Russell 2000 ETF |
Innovator U.S. Small Cap Power Buffer ETF - April | | KAPR | | March 31, 2020 | | iShares Russell 2000 ETF |
Innovator U.S. Small Cap Power Buffer ETF - July | | KJUL | | June 30, 2020 | | iShares Russell 2000 ETF |
Innovator U.S. Small Cap Power Buffer ETF - October | | KOCT | | September 30, 2019 | | iShares Russell 2000 ETF |
Innovator Double Stacker ETF - January | | DSJA | | December 31, 2020 | | SPDR S&P 500® ETF Trust and Invesco QQQ Trust |
Innovator Double Stacker ETF - October | | DSOC | | September 30, 2020 | | SPDR S&P 500® ETF Trust and Invesco QQQ Trust |
Innovator Triple Stacker ETF - January | | TSJA | | December 31, 2020 | | SPDR S&P 500® ETF Trust, Invesco QQQ Trust and iShares Russell 2000 ETF |
Innovator Triple Stacker ETF - October | | TSOC | | September 30, 2020 | | SPDR S&P 500® ETF Trust, Invesco QQQ Trust and iShares Russell 2000 ETF |
Innovator Double Stacker 9 Buffer ETF - January | | DBJA | | December 31, 2020 | | SPDR S&P 500® ETF Trust and Invesco QQQ Trust |
Innovator Double Stacker 9 Buffer ETF - October | | DBOC | | September 30, 2020 | | SPDR S&P 500® ETF Trust and Invesco QQQ Trust |
Innovator U.S. Equity Accelerated ETF - January | | XDJA | | December 31, 2021 | | SPDR S&P 500® ETF Trust |
Innovator U.S. Equity Accelerated ETF - April | | XDAP | | March 31, 2021 | | SPDR S&P 500® ETF Trust |
Innovator U.S. Equity Accelerated ETF - July | | XDJL | | June 30, 2021 | | SPDR S&P 500® ETF Trust |
Innovator U.S. Equity Accelerated ETF - October | | XDOC | | September 30, 2021 | | SPDR S&P 500® ETF Trust |
Innovator U.S. Equity Accelerated Plus ETF - January | | XTJA | | December 31, 2021 | | SPDR S&P 500® ETF Trust |
Innovator U.S. Equity Accelerated Plus ETF - April | | XTAP | | March 31, 2021 | | SPDR S&P 500® ETF Trust |
Innovator U.S. Equity Accelerated Plus ETF - July | | XTJL | | June 30, 2021 | | SPDR S&P 500® ETF Trust |
Innovator U.S. Equity Accelerated Plus ETF - October | | XTOC | | September 30, 2021 | | SPDR S&P 500® ETF Trust |
Innovator U.S. Equity Accelerated 9 Buffer ETF - January | | XBJA | | December 31, 2021 | | SPDR S&P 500® ETF Trust |
Innovator U.S. Equity Accelerated 9 Buffer ETF - April | | XBAP | | March 31, 2021 | | SPDR S&P 500® ETF Trust |
Innovator U.S. Equity Accelerated 9 Buffer ETF - July | | XBJL | | June 30, 2021 | | SPDR S&P 500® ETF Trust |
Innovator U.S. Equity Accelerated 9 Buffer ETF - October | | XBOC | | September 30, 2021 | | SPDR S&P 500® ETF Trust |
Innovator Growth Accelerated Plus ETF - January | | QTJA | | December 31, 2021 | | Invesco QQQ Trust |
Innovator Growth Accelerated Plus ETF - April | | QTAP | | March 31, 2021 | | Invesco QQQ Trust |
Innovator Growth Accelerated Plus ETF - July | | QTJL | | June 30, 2021 | | Invesco QQQ Trust |
Innovator Growth Accelerated Plus ETF - October | | QTOC | | September 30, 2021 | | Invesco QQQ Trust |
Innovator 20+ Year Treasury Bond 9 Buffer ETF - July | | TBJL | | August 17, 2020 | | iShares 20+ Year Treasury Bond ETF |
Innovator 20+ Year Treasury Bond 5 Floor ETF - Quarterly | | TFJL | | August 17, 2020 | | iShares 20+ Year Treasury Bond ETF |
Innovator Defined Wealth Shield ETF | | BALT | | June 30, 2021 | | SPDR S&P 500® ETF Trust |
Innovator U.S. Equity Accelerated ETF - Quarterly | | XDSQ | | March 31, 2021 | | SPDR S&P 500® ETF Trust |
Innovator Growth Accelerated ETF - Quarterly | | XDQQ | | March 31, 2021 | | Invesco QQQ Trust |
The Funds are exchange traded funds that offer one class of shares, do not charge a sales load, do not have a redemption fee and currently do not charge a 12b–1 fee to their shareholders. FFTY, BOUT, LOUP, BSTP, PSTP, SFLR and IGTR list and principally trade their shares on NYSE Arca, Inc. (“NYSE”), EPRF, BUFF, BUFB, TSLH and XUSP list and principally trade their shares on Cboe BZX Exchange, Inc. (“Cboe BZX”).
BSTP and PSTP employ a “step-up strategy” in which the sub-adviser will seek to opportunistically manage the respective Fund’s investment exposure by periodically terminating its FLEX Options investments earlier than its one-year expiration date and immediately reset the respective Fund’s options portfolio for a new one-year period. The “step-up strategy” seeks to help a Fund’s shareholder offset the timing risks inherent in owning an options package for one year. BSTP, PSTP, TSLH and XUSP do not pursue a “defined outcome strategy” or seek to achieve the full one-year investment outcomes of the options portfolio held. Unlike other Innovator ETFs that utilize a defined outcome investment strategy, they do not seek to provide shareholders with a set buffer percentage and maximum upside potential over any specified time period.
Notes to Financial Statements (Unaudited) (Continued)
The Funds are investment companies and accordingly follow the investment company accounting and reporting guidance of the Financial Accounting Standards Board (“FASB”) Accounting Standards Codification (“ASC”) Topic 946 “Financial Services — Investment Companies”.
2. | SIGNIFICANT ACCOUNTING POLICIES |
The following is a summary of significant accounting policies consistently followed by the Trust in the preparation of its financial statements. These policies are in conformity with accounting principles generally accepted in the United States of America (“U.S. GAAP”).
Valuation:
The net asset values (“NAV”) of the Funds are determined as of the close of regular trading on the NYSE (normally 4:00 p.m. ET). If the NYSE closes early on a valuation day, the Funds shall determine NAV as of that time.
Portfolio securities generally shall be valued utilizing prices provided by independent pricing services. The Adviser, as the Trust’s Valuation Designee (“Valuation Designee”) is responsible for establishing valuation of portfolio securities and other instruments held by the Funds in accordance with the Trust’s valuation procedures.
Common stocks, preferred stocks, exchange traded funds and other equity securities listed on any national or foreign exchange (excluding the NASDAQ National Market (“NASDAQ”) and the London Stock Exchange Alternative Investment Market (“AIM”)) are generally valued at the last sale price on the exchange on which they are principally traded or, for NASDAQ and AIM securities, the official closing price. Securities traded on more than one securities exchange are valued at the last sale price or official closing price, as applicable, at the close of the exchange representing the principal market for such securities. Securities traded in the over–the–counter market are valued at the mean of the bid and the asked price, if available, and otherwise at their closing bid price. Redeemable securities issued by open–end investment companies shall be valued at the investment company’s applicable net asset value, with the exception of exchange–traded open–end investment companies which are priced as equity securities. Units of Mount Vernon Liquid Assets Portfolio, LLC are not traded on an exchange and are valued at the investment company’s net asset value per share as provided by the underlying fund’s administrator. Fixed income securities, swaps, currency–, credit– and commodity–linked notes, and other similar instruments will be valued using a pricing service. Fixed income securities having a remaining maturity of 60 days or less when purchased will be valued at cost adjusted for amortization of premiums and accretion of discounts, provided the Valuation Designee has determined that the use of amortized cost is an appropriate reflection of fair value given market and issuer specific conditions existing at the time of the determination. Deposit accounts are valued at acquisition cost. Foreign securities and other assets denominated in foreign currencies are translated into U.S. dollars at the exchange rate of such currencies against the U.S. dollar as provided by the pricing service. All assets denominated in foreign currencies will be converted into U.S. dollars at the exchange rates in effect at the time of valuation. Restricted securities (with the exception of Rule 144A Securities for which market quotations are available) will normally be valued at fair value as determined by the Valuation Designee.
Notes to Financial Statements (Unaudited) (Continued)
Exchange-traded option contracts (other than FLEX Option contracts) will be valued at the closing price in the market where such contracts are principally traded. If no closing price is available, they will be fair valued at the mean of their most recent bid and asked price, if available, and otherwise at their closing bid price. OTC options are fair valued at the mean of the most recent bid and asked price, if available, and otherwise at their closing bid price. FLEX Options will be valued at a model-based price provided by the exchange on which the option is traded at the official close of that exchange’s trading date. If the exchange on which the option is traded is unable to provide a model price, FLEX Options prices will be provided by backup provider Super Derivatives. Otherwise, the value of a FLEX Option will be determined by the Valuation Designee in accordance with the Trust’s valuation procedures.
If no quotation can be obtained from a pricing service, then the Valuation Designee will then attempt to obtain one or more broker quotes for the security. If no quotation is available from either a pricing service or one or more brokers or if the Valuation Designee has reason to question the reliability or accuracy of a quotation supplied or the use of amortized cost, the value of any portfolio security held by the Funds for which reliable market quotations are not readily available will be determined by the Valuation Designee in a manner that most appropriately reflects fair market value of the security on the valuation date. The use of a fair valuation method may be appropriate if, for example: (i) market quotations do not accurately reflect fair value of an investment; (ii) an investment’s value has been materially affected by events occurring after the close of the exchange or market on which the investment is principally traded (for example, a foreign exchange or market); (iii) a trading halt closes an exchange or market early; or (iv) other events result in an exchange or market delaying its normal close.
111
Notes to Financial Statements (Unaudited) (Continued)
Fair Valuation Measurement:
FASB established a framework for measuring fair value in accordance with U.S. GAAP. Under ASC Topic 820, “Fair Value Measurement” (“ASC 820”), various inputs are used in determining the value of the Funds’ investments. The inputs or methodology used for valuing securities are not necessarily an indication of the risk associated with investing in those securities. The three Levels of inputs of the fair value hierarchy are defined as follows:
| | • | Level 1 – | Unadjusted quoted prices in active markets for identical assets or liabilities that the Funds have the ability to access. |
| | • | Level 2 – | Observable inputs other than quoted prices included in level 1 that are observable for the asset or liability, either directly or indirectly. These inputs may include quoted prices for the identical instrument on an inactive market, prices for similar instruments, interest rates, prepayment speeds, credit risk, yield curves, default rates and similar data. |
| | • | Level 3 – | Unobservable inputs for the asset or liability, to the extent relevant observable inputs are not available, representing the Funds’ own assumptions about the assumptions a market participant would use in valuing the asset or liability, and would be based on the best information available. |
The availability of observable inputs can vary from security to security and is affected by a wide variety of factors, including, for example, the type of security, whether the security is new and not yet established in the marketplace, the liquidity of markets, and other characteristics particular to the security. To the extent that valuation is based on models or inputs that are less observable or unobservable in the market, the determination of fair value requires more judgement. Accordingly, the degree of judgement exercised in determining fair value is greatest for instruments categorized in Level 3.
The inputs used to measure fair value may fall into different levels of the fair value hierarchy. In such cases, for disclosure purposes, the level in the fair value hierarchy within which the fair value measurement falls in its entirety, is determined based on the lowest level input that is significant to the fair value measurement in its entirety.
112
Notes to Financial Statements (Unaudited) (Continued)
The following table summarizes valuation of the Funds’ investments under the fair value hierarchy as of April 30, 2023:
FFTY | | | | | | | | | | | | | | | | |
| | | Level 1 | | | Level 2 | | | Level 3 | | | Total | |
Assets | | | | | | | | | | | | | | | | |
Common Stocks | | $ | 77,500,178 | | | $ | - | | | $ | - | | | $ | 77,500,178 | |
Investments Purchased with Proceeds From Securities Lending | | | - | | | | 22,880,354 | | | | - | | | | 22,880,354 | |
Short Term Investments | | | 179,182 | | | | - | | | | - | | | | 179,182 | |
Total Assets | | $ | 77,679,360 | | | $ | 22,880,354 | | | $ | - | | | $ | 100,559,714 | |
| | | | | | | | | | | | | | | | | |
BOUT | | | | | | | | | | | | | | | | |
| | | Level 1 | | | Level 2 | | | Level 3 | | | Total | |
Assets | | | | | | | | | | | | | | | | |
Common Stocks | | $ | 13,606,381 | | | $ | - | | | $ | - | | | $ | 13,606,381 | |
Master Limited Partnerships | | | 208,138 | | | | - | | | | - | | | | 208,138 | |
Investments Purchased with Proceeds From Securities Lending | | | - | | | | 2,841,107 | | | | - | | | | 2,841,107 | |
Short Term Investments | | | 55,992 | | | | - | | | | - | | | | 55,992 | |
Total Assets | | $ | 13,870,511 | | | $ | 2,841,107 | | | $ | - | | | $ | 16,711,618 | |
| | | | | | | | | | | | | | | | | |
LOUP | | | | | | | | | | | | | | | | |
| | | Level 1 | | | Level 2 | | | Level 3 | | | Total | |
Assets | | | | | | | | | | | | | | | | |
Common Stocks | | $ | 33,947,284 | | | $ | - | | | $ | - | | | $ | 33,947,284 | |
Preferred Stocks | | | 1,070,498 | | | | - | | | | - | | | | 1,070,498 | |
Investments Purchased with Proceeds From Securities Lending | | | - | | | | 11,367,570 | | | | - | | | | 11,367,570 | |
Short Term Investments | | | 13,673 | | | | - | | | | - | | | | 13,673 | |
Total Assets | | $ | 35,031,455 | | | $ | 11,367,570 | | | $ | - | | | $ | 46,399,025 | |
| | | | | | | | | | | | | | | | | |
EPRF | | | | | | | | | | | | | | | | |
| | | Level 1 | | | Level 2 | | | Level 3 | | | Total | |
Assets | | | | | | | | | | | | | | | | |
Preferred Stocks | | $ | 115,634,897 | | | $ | - | | | $ | - | | | $ | 115,634,897 | |
Investments Purchased with Proceeds From Securities Lending | | | - | | | | 10,291,453 | | | | - | | | | 10,291,453 | |
Short Term Investments | | | 1,164,794 | | | | - | | | | - | | | | 1,164,794 | |
Total Assets | | $ | 116,799,691 | | | $ | 10,291,453 | | | $ | - | | | $ | 127,091,144 | |
| | | | | | | | | | | | | | | | | |
BUFF | | | | | | | | | | | | | | | | |
| | | Level 1 | | | Level 2 | | | Level 3 | | | Total | |
Assets | | | | | | | | | | | | | | | | |
Affiliated Exchange Traded Funds | | $ | 222,433,381 | | | $ | - | | | $ | - | | | $ | 222,433,381 | |
Investments Purchased with Proceeds From Securities Lending | | | - | | | | 3,518,125 | | | | - | | | | 3,518,125 | |
Short Term Investments | | | 248,607 | | | | - | | | | - | | | | 248,607 | |
Total Assets | | $ | 222,681,988 | | | $ | 3,518,125 | | | $ | - | | | $ | 226,200,113 | |
| | | | | | | | | | | | | | | | | |
BUFB | | | | | | | | | | | | | | | | |
| | | Level 1 | | | Level 2 | | | Level 3 | | | Total | |
Assets | | | | | | | | | | | | | | | | |
Affiliated Exchange Traded Funds | | $ | 35,804,474 | | | $ | - | | | $ | - | | | $ | 35,804,474 | |
Short Term Investments | | | 16,019 | | | | - | | | | - | | | | 16,019 | |
Total Assets | | $ | 35,820,493 | | | $ | - | | | $ | - | | | $ | 35,820,493 | |
113
Notes to Financial Statements (Unaudited) (Continued)
BSTP | | | | | | | | | | | | | | | | |
| | | Level 1 | | | Level 2 | | | Level 3 | | | Total | |
Assets | | | | | | | | | | | | | | | | |
Purchased Options | | $ | - | | | $ | 32,739,775 | | | $ | - | | | $ | 32,739,775 | |
Short Term Investments | | | 21,288 | | | | - | | | | - | | | | 21,288 | |
Total Assets | | $ | 21,288 | | | $ | 32,739,775 | | | $ | - | | | $ | 32,761,063 | |
| | | | | | | | | | | | | | | | | |
Liabilities | | | | | | | | | | | | | | | | |
Options Written | | $ | - | | | $ | 1,179,106 | | | $ | - | | | $ | 1,179,106 | |
Total Liabilities | | $ | - | | | $ | 1,179,106 | | | $ | - | | | $ | 1,179,106 | |
| | | | | | | | | | | | | | | | | |
PSTP | | | | | | | | | | | | | | | | |
| | | Level 1 | | | Level 2 | | | Level 3 | | | Total | |
Assets | | | | | | | | | | | | | | | | |
Purchased Options | | $ | - | | | $ | 71,262,294 | | | $ | - | | | $ | 71,262,294 | |
Short Term Investments | | | 124,963 | | | | - | | | | - | | | | 124,963 | |
Total Assets | | $ | 124,963 | | | $ | 71,262,294 | | | $ | - | | | $ | 71,387,257 | |
| | | | | | | | | | | | | | | | | |
Liabilities | | | | | | | | | | | | | | | | |
Options Written | | $ | - | | | $ | 3,120,828 | | | $ | - | | | $ | 3,120,828 | |
Total Liabilities | | $ | - | | | $ | 3,120,828 | | | $ | - | | | $ | 3,120,828 | |
| | | | | | | | | | | | | | | | | |
TSLH | | | | | | | | | | | | | | | | |
| | | Level 1 | | | Level 2 | | | Level 3 | | | Total | |
Assets | | | | | | | | | | | | | | | | |
Purchased Options | | $ | - | | | $ | 52,990 | | | $ | - | | | $ | 52,990 | |
Short Term Investments | | | 2,514 | | | | 1,768,656 | | | | - | | | | 1,771,170 | |
Total Assets | | $ | 2,514 | | | $ | 1,821,646 | | | $ | - | | | $ | 1,824,160 | |
| | | | | | | | | | | | | | | | | |
Liabilities | | | | | | | | | | | | | | | | |
Options Written | | $ | - | | | $ | 8,688 | | | $ | - | | | $ | 8,688 | |
Total Liabilities | | $ | - | | | $ | 8,688 | | | $ | - | | | $ | 8,688 | |
| | | | | | | | | | | | | | | | | |
XUSP | | | | | | | | | | | | | | | | |
| | | Level 1 | | | Level 2 | | | Level 3 | | | Total | |
Assets | | | | | | | | | | | | | | | | |
Purchased Options | | $ | - | | | $ | 13,089,496 | | | $ | - | | | $ | 13,089,496 | |
Short Term Investments | | | 56,635 | | | | - | | | | - | | | | 56,635 | |
Total Assets | | $ | 56,635 | | | $ | 13,089,496 | | | $ | - | | | $ | 13,146,131 | |
| | | | | | | | | | | | | | | | | |
Liabilities | | | | | | | | | | | | | | | | |
Options Written | | $ | - | | | $ | 1,231,424 | | | $ | - | | | $ | 1,231,424 | |
Total Liabilities | | $ | - | | | $ | 1,231,424 | | | $ | - | | | $ | 1,231,424 | |
114
Notes to Financial Statements (Unaudited) (Continued)
SFLR | | | | | | | | | | | | | | | | |
| | | Level 1 | | | Level 2 | | | Level 3 | | | Total | |
Assets | | | | | | | | | | | | | | | | |
Common Stocks | | $ | 21,268,906 | | | $ | - | | | $ | - | | | $ | 21,268,906 | |
Real Estate Investment Trusts | | | 490,450 | | | | | | | | - | | | | 490,450 | |
Purchased Options | | | - | | | | 314,775 | | | | - | | | | 314,775 | |
Investments Purchased with Proceeds From Securities Lending | | | - | | | | 2,244,485 | | | | - | | | | 2,244,485 | |
Short Term Investments | | | 141,209 | | | | - | | | | - | | | | 141,209 | |
Total Assets | | $ | 21,900,565 | | | $ | 2,559,260 | | | $ | - | | | $ | 24,459,825 | |
| | | | | | | | | | | | | | | | | |
Liabilities | | | | | | | | | | | | | | | | |
Options Written | | $ | - | | | $ | 98,187 | | | $ | - | | | $ | 98,187 | |
Total Liabilities | | $ | - | | | $ | 98,187 | | | $ | - | | | $ | 98,187 | |
| | | | | | | | | | | | | | | | | |
IGTR | | | | | | | | | | | | | | | | |
| | | Level 1 | | | Level 2 | | | Level 3 | | | Total | |
Assets | | | | | | | | | | | | | | | | |
Common Stocks | | $ | 262,574,224 | | | $ | - | | | $ | - | | | $ | 262,574,224 | |
Investments Purchased with Proceeds From Securities Lending | | | - | | | | 23,312,054 | | | | - | | | | 23,312,054 | |
Short Term Investments | | | 18,086 | | | | 942,659 | | | | - | | | | 960,745 | |
Total Assets | | $ | 262,592,310 | | | $ | 24,254,713 | | | $ | - | | | $ | 286,847,023 | |
See the Schedules of Investments for the investments detailed by industry classification.
There were no Level 3 investments for the Funds during the period ended April 30, 2023.
Option Contracts:
In general, an option contract is an agreement between a buyer and seller that gives the purchaser of the option the right to buy or sell a particular asset at a specified future date at an agreed upon price (commonly known as the “strike price”).
BSTP, PSTP, TSLH and XUSP invest primarily in FLEX Option contracts. FLEX Options are customized option contracts that trade on an exchange but provide investors with the ability to customize key contract terms like strike price, style and expiration date while achieving price discovery in competitive, transparent auctions markets and avoiding the counterparty exposure of over-the-counter options positions. Like traditional exchange-traded options, FLEX Options are guaranteed for settlement by the OCC, a market clearinghouse that guarantees performance by counterparties to certain derivatives contracts. The FLEX Options in which the Funds will invest are all European style options (options that are exercisable only on the expiration date). The FLEX Options are listed on the Chicago Board Options Exchange.
115
Notes to Financial Statements (Unaudited) (Continued)
BSTP, PSTP, TSLH and XUSP will purchase and sell call and put FLEX Options. In general, put options give the holder (i.e., the buyer) the right to sell an asset (or deliver the cash value of the index, in case of an index put option) and the seller (i.e., the writer) of the put has the obligation to buy the asset (or receive cash value of the index, in case of an index put option) at a certain defined price. Call options give the holder (i.e., the buyer) the right to buy an asset (or receive cash value of the index, in case of an index call option) and the seller (i.e., the writer) the obligation to sell the asset (or deliver cash value of the index, in case of an index call option) at a certain defined price.
When BSTP, PSTP, TSLH and XUSP purchase an option, an amount equal to the premium paid by the Funds are recorded as an investment and is subsequently adjusted to the current value of the option purchased. If an option expires on the stipulated expiration date or if the Funds enter into a closing sale transaction, a gain or loss is realized. If a call option is exercised, the cost of the security acquired is increased by the premium paid for the call. If a put option is exercised, a gain or loss is realized from the sale of the underlying security, and the proceeds from such sale are decreased by the premium originally paid. Purchased options are non-income producing securities.
When BSTP, PSTP, TSLH and XUSP write an option, an amount equal to the premium received by the Funds are recorded as a liability and is subsequently adjusted to the current value of the option written. Premiums received from writing options that expire unexercised are treated by the Funds on the expiration date as realized gain from written options. The difference between the premium and the amount paid on effecting a closing purchase transaction, including brokerage commissions, is also treated as a realized gain, or if the premium is less than the amount paid for the closing purchase transaction, as a realized loss. If a call option is exercised, the premium is added to the proceeds from the sale of the underlying security in determining whether the Funds have realized a gain or loss. If a put option is exercised, the premium reduces the cost basis of the securities purchased by the Funds. BSTP, PSTP, TSLH and XUSP, as writers of an option, bear the market risk of an unfavorable change in the price of the security underlying the written option.
All of the FLEX Option contracts held by BSTP, PSTP, TSLH and XUSP are fully funded and cash settled, therefore balance sheet offsetting under U.S. GAAP does not apply.
116
Notes to Financial Statements (Unaudited) (Continued)
BSTP, PSTP, TSLH and XUSP bear the risk that the OCC will be unable or unwilling to perform its obligations under the FLEX Options contracts. In the unlikely event that the OCC becomes insolvent or is otherwise unable to meet its settlement obligations, the Funds could suffer significant losses. Additionally, FLEX Options may be less liquid than certain other securities such as standardized options. In less liquid market for the FLEX Options, the Funds may have difficulty closing out certain FLEX Options positions at desired times and prices. The Funds may experience substantial downside from specific FLEX Option positions and certain FLEX Option positions may expire worthless. The value of the underlying FLEX Options will be affected by, among others, changes in the value of the exchange, changes in interest rates, changes in the actual and implied volatility of the Index and the remaining time to until the FLEX Options expire. The value of the FLEX Options does not increase or decrease at the same rate as the level of the Index (although they generally move in the same direction). However, as a FLEX Option approaches its expiration date, its value typically increasingly moves with the value of the Index.
The value of derivative instruments on the Statements of Assets and Liabilities for the Funds as of April 30, 2023 are as follows:
| | | Equity Risk - Call and Put Options not Accounted for as Hedging Instruments | |
| | | Asset Derivatives | | | Liability Derivatives | |
| | | Investments, at value | | | Options written, at value | |
BSTP | | $ | 32,739,775 | | | $ | 1,179,106 | |
PSTP | | | 71,262,294 | | | | 3,120,828 | |
TSLH | | | 52,990 | | | | 8,688 | |
XUSP | | | 13,089,496 | | | | 1,231,424 | |
SFLR | | | 314,775 | | | | 98,187 | |
The effect of derivative instruments on the Statements of Operations for the period ended April 30, 2023:
| | | Equity Risk - Call and Put Options not Accounted for as Hedging Instruments | |
| | | Amount of Realized Gain/(Loss) on Derivatives Recognized in Income | |
| | | Investments | | | Investments in-kind | | | Options written | | | Options written in-kind | |
BSTP | | $ | (1,317,360 | ) | | $ | 66,474 | | | $ | 930,345 | | | $ | 501,444 | |
PSTP | | | (1,485,562 | ) | | | 306,407 | | | | 1,162,328 | | | | 931,647 | |
TSLH (a) | | | 45,139 | | | | 719,077 | | | | (799,332 | ) | | | 758 | |
XUSP | | | (438,385 | ) | | | 76,747 | | | | 77,837 | | | | 167,188 | |
SFLR (a) | | | (262,251 | ) | | | - | | | | 402,799 | | | | - | |
(a) | Amount is included in realized gain/(loss) on investments on the statement of operations. |
Notes to Financial Statements (Unaudited) (Continued)
| | | Equity Risk - Call and Put Options not Accounted for as Hedging Instruments | |
| | | Change in Unrealized Appreciation/(Depreciation) on Derivatives Recognized in Income | |
| | | Investments | | | Options written | |
BSTP | | $ | 2,246,015 | | | $ | (167,658 | ) |
PSTP | | | 3,102,481 | | | | (611,742 | ) |
TSLH (b) | | | 34,193 | | | | (38,711 | ) |
XUSP | | | 977,752 | | | | (248,960 | ) |
SFLR (b) | | | (321,178 | ) | | | (32,967 | ) |
(b) Amount is included in the change in unrealized appreciation/(depreciation) on investments on the statement of operations.
The average volume of derivative activity during the period ended April 30, 2023, is as follows:
| | | Purchased Options | | | Options Written | |
| | | Average Monthly Market Value | | | Average Monthly Market Value | |
BSTP | | $ | 31,563,666 | | | $ | (1,211,228 | ) |
PSTP | | | 52,917,104 | | | | (2,282,042 | ) |
TSLH | | | 641,483 | | | | (430,614 | ) |
XUSP | | | 9,464,335 | | | | (743,923 | ) |
SFLR | | | 366,912 | | | | (102,797 | ) |
Use of Estimates:
In preparing financial statements in conformity with U.S. GAAP, management is required to make estimates and assumptions that affect the reported amounts of assets and liabilities and disclosure of contingent assets and liabilities as of the date of the financial statements and the reported amounts of increases and decreases in net assets from operations during the reporting period. Actual results could differ from these estimates.
Guarantees and Indemnifications:
In the normal course of business, the Trust may enter into a contract with service providers that contain general indemnification clauses. The Trust’s maximum exposure under these arrangements is unknown as this would involve future claims against the Trust that have not yet occurred. Based on experience, the Trust expects the risk of loss to be remote.
118
Notes to Financial Statements (Unaudited) (Continued)
Tax Information:
The Funds are treated as separate entities for federal income tax purposes. The Funds intend to qualify as regulated investment companies (“RICs”) under Subchapter M of the Internal Revenue Code of 1986, as amended (the “Internal Revenue Code”). To qualify and remain eligible for the special tax treatment accorded to RICs, the Funds must meet certain annual income and quarterly asset diversification requirements and must distribute annually at least 90% of the sum of (i) its investment company taxable income (which includes dividends, interest and net short–term capital gains) and (ii) certain net tax–exempt income, if any. If so qualified, the Funds will not be subject to federal income tax to the extent the Funds distribute substantially all of their net investment income and capital gains to shareholders.
Management evaluates the Funds’ tax positions to determine if the tax positions taken meet the minimum recognition threshold in connection with accounting for uncertainties in income tax positions taken or expected to be taken for the purposes of measuring and recognizing tax liabilities in the financial statements. Tax benefits associated with an uncertain tax position can be recognized only when the position is “more likely than not” to be sustained assuming examination by taxing authorities. Interest and penalties related to income taxes would be recorded as tax expense in the Statements of Operations. During the period ended April 30, 2023, the Funds did not incur any interest or penalties. The Funds’ federal income tax returns are subject to examination by the Internal Revenue Service (IRS) for a period of three fiscal years after they are filed. State and local tax returns may be subject to examination for an additional fiscal year depending on the jurisdiction. As of April 30, 2023, the Funds did not have a liability for any unrecognized tax benefits. As of April 30, 2023, the Funds have no examinations in progress and management is not aware of any tax positions for which it is reasonably possible that the amounts of unrecognized tax benefits will significantly change in the next twelve months. The Funds are subject to examination by U.S. Federal tax authorities for all tax years since 2018, as applicable.
119
Notes to Financial Statements (Unaudited) (Continued)
U.S. GAAP requires that certain components of net assets be reclassified between distributable earnings/(accumulated deficit) and additional paid–in capital.
These reclassifications have no effect on net assets or net asset value per share. For the year ended October 31, 2022, the Funds made the following permanent book–to–tax reclassifications primarily related to net operating loss forfeiture and redemptions in kind:
| | | Distributable Earnings/ | | | | |
| | | (Accumulated Deficit) | | | Paid-In Capital | |
FFTY | | $ | (5,274,772 | ) | | $ | 5,274,772 | |
BOUT | | | (1,815,513 | ) | | | 1,815,513 | |
LOUP | | | (766,339 | ) | | | 766,339 | |
EPRF | | | 4,806,503 | | | | (4,806,503 | ) |
BUFF | | | (818,092 | ) | | | 818,092 | |
BUFB | | | 4,544 | | | | (4,544 | ) |
BSTP | | | (1,816,786 | ) | | | 1,816,786 | |
PSTP | | | (1,707,102 | ) | | | 1,707,102 | |
TSLH | | | (128,259 | ) | | | 128,259 | |
XUSP | | | - | | | | - | |
Distributions to Shareholders:
Distributions to shareholders are recorded on the ex–dividend date. FFTY, BOUT, LOUP, BUFF, BUFB, BSTP, PSTP, TSLH, XUSP and IGTR intend to pay out dividends from their net investment income, if any, annually. EPRF and SFLR intends to pay out dividends from its net investment income, if any, monthly and quarterly, respectively. Distributions of net realized capital gains, if any, will be declared and paid at least annually by the Funds. The Funds may periodically make reclassifications among certain of its capital accounts as a result of the recognition and characterization of certain income and capital gain distributions determined annually in accordance with federal tax regulations which may differ from U.S. GAAP. Distributions that exceed earnings and profits for tax purposes are reported as a return of capital.
Investment Transactions and Investment Income:
Investment transactions are recorded on the trade date. The Trust determines the gain or loss realized from investment transactions on the basis of identified cost. Dividend income, if any, is recognized on the ex–dividend date or, in the case of foreign securities, as soon as the Funds are informed of the ex–dividend dates. Interest income, including accretion of discounts and amortization of premiums is recognized on an accrual basis using the effective yield method.
120
Notes to Financial Statements (Unaudited) (Continued)
Distributions received from investments in master limited partnerships (“MLPs”), closed–end funds, real estate investment trusts (“REITs”) and royalty trusts are comprised of ordinary income, capital gains and return of capital. For financial statement purposes, estimates are used to characterize these distributions received as return of capital, capital gains or ordinary income. Such estimates are based on historical information available from each MLP, closed–end fund, REIT or royalty trust and other industry sources. These estimates may subsequently be revised and reflected on the Form 1099 received by shareholders based on information received for the security after its tax reporting periods are concluded, as the actual character of these distributions is not known until after the fiscal year end. The distributions received from MLPs, REITs, closed–end funds, and royalty trust securities that have been classified as income and capital gains are included in dividend income and net realized gain/(loss) on investments, respectively, on the Statements of Operations. The distributions received that are classified as return of capital reduce the cost of investments on the Statements of Assets and Liabilities.
Purchases and sales of investments and dividend and interest income are translated into U.S. dollars using the spot market rates of exchange prevailing on the respective dates of such translations. The gain or loss resulting from changes in foreign exchange rates is included with net realized and unrealized gain or loss from investments, as appropriate. Foreign securities and currency transactions may involve certain considerations and risks not typically associated with those of domestic origin. Foreign securities are recorded in the financial statements after translation to U.S. dollars based on the applicable exchange rate at the end of the period. The Funds report certain foreign currency–related transactions as components of realized gains or losses for financial reporting purposes, whereas such components are treated as ordinary income for federal income tax purposes.
3. | INVESTMENT ADVISOR AND OTHER AFFILIATES |
Innovator Capital Management, LLC (the “Adviser”) acts as investment adviser to the Funds pursuant to investment advisory agreements between the Trust and the Adviser with respect to the Funds (“Advisory Agreements”) and, pursuant to the Advisory Agreements, is responsible for the day–to–day management of the Funds.
Pursuant to an investment advisory agreement between the Trust and the Adviser with respect to FFTY, FFTY pays monthly the Adviser a management fee calculated daily based on the average daily net assets of the Fund.
121
Notes to Financial Statements (Unaudited) (Continued)
Pursuant to an investment advisory agreement between the Trust and the Adviser with respect to the Funds, excluding FFTY, each respective Fund pays monthly the Adviser a unitary fee calculated daily based on the average daily net assets of the Fund. During the term of the Advisory Agreement, the Adviser pays all expenses of the respective Funds, including the cost of transfer agency, custody, fund administration, legal, audit, and other services and license fees, except for the fees paid under the Advisory Agreement, interest, taxes, brokerage commissions and other expenses connected with the execution of portfolio transactions, distribution and service fees payable pursuant to a Rule 12b–1 plan, if any, and extraordinary expenses.
Penserra Capital Management LLC (“Penserra") Milliman Financial Risk Management LLC (“Milliman”) Parametric Portfolio Associates (“Parametric”) and Gradient Investments, LLC (“Gradient”)(collectively the “Sub–Advisers”) act as sub–adviser to the Funds pursuant to sub–advisory agreements between the Adviser and respective Sub–Adviser with respect to the Funds (“Sub–Advisory Agreements”) and, pursuant to the Sub–Advisory Agreements, are responsible for execution of the Sub– Adviser’s strategy for each of the Funds. The Sub–Advisers are responsible for the day–to–day management of the Fund’s portfolios. Pursuant to the Sub–Advisory Agreements between the Adviser and the respective Sub–Adviser, the Adviser pays the Sub–Advisers a fee, based on the Funds’ average daily net assets, for the services and facilities they provide payable on a monthly basis.
| | | Management/Unitary Fee Rate | | Sub-Adviser |
FFTY | | | 0.70 | % | Penserra |
BOUT | | | 0.80 | % | Penserra |
LOUP | | | 0.70 | % | Penserra |
EPRF | | | 0.47 | % | Penserra |
BUFF | | | 0.20 | % | Penserra |
BUFB | | | 0.20 | % | Penserra |
BSTP | | | 0.89 | % | Milliman |
PSTP | | | 0.89 | % | Milliman |
TSLH | | | 0.79 | % | Milliman |
XUSP | | | 0.79 | % | Milliman |
SFLR | | | 0.89 | % | Parametric |
IGTR | | | 0.80 | % | Penserra/Gradient |
Certain trustees and officers of the Trust are affiliated with the Adviser. Excluding FFTY, Trustee compensation is paid for by the Adviser.
Pursuant to the Advisory Agreement between the Trust and the Adviser with respect to BUFF and BUFB, the Adviser has agreed to waive unitary fees of 0.10% of average daily net assets of the respective Fund beginning February 9, 2022 until June 30, 2024. The waiver may be terminated by action of the Trust’s board at any time upon 60 days written notice by the Trust, on behalf of the Funds, or by the adviser on or after June 30, 2024. The Adviser is not entitled to recoup any of the fees that it waived.
Notes to Financial Statements (Unaudited) (Continued)
The Trust entered into an Expense Limitation Agreement on behalf of FFTY with the Adviser. Under the terms of the Expense Limitation Agreement with FFTY, the Adviser contractually agreed to waive their advisory fees and/or assume as their own expense, certain expenses otherwise payable by the Fund to the extent necessary to ensure that total annual fund operating expenses (excluding any Rule 12b–1 fees, taxes, interest, brokerage fees, acquired fund fees and expenses, expenses incurred in connection with any merger, reorganization or proxy solicitation, litigation, and other extraordinary expenses) do not exceed 0.80% of average daily net assets of FFTY until August 31, 2023. Pursuant to the terms of the Expense Limitation Agreement, Innovator is entitled to recoup any fees that it waived and/or Fund expenses that it paid for a period of three years following such fee waivers and/or expense payments. The Fund may only make such repayment to the Adviser if, after the recoupment payment has been taken into account, it does not cause the Fund’s expense ratio to exceed either the expense cap in place at the time the expenses were waived or the Fund’s current expense cap. For the period ended April 30, 2023, the Adviser waived $140,745
of their advisory fees for FFTY without recouping any of their previously waived fees. The table below indicates the amount of fees that the Adviser may recoup:
| | | Recovery Expiring in*: | |
| | | FYE 10/31/2023 | | | FYE 10/31/2024 | | | FYE 10/31/2025 | | | FYE 10/31/2026 | | | Total | |
FFTY | | $ | 101,691 | | | $ | 309,101 | | | $ | 291,430 | | | $ | 140,745 | | | $ | 842,967 | |
* Recoupment expires on a rolling monthly basis three years following the respective fee waivers. | |
4. | INVESTMENT TRANSACTIONS |
For the period ended April 30, 2023, the cost of purchases and proceeds from sales of investment securities, other than in–kind purchases and sales and short–term investments were as follows:
| | | Purchases | | | Sales | |
| | | U.S. Governement | | | Other | | | U.S. Governement | | | Other | |
FFTY | | $ | - | | | $ | 597,589,578 | | | $ | - | | | $ | 598,193,863 | |
BOUT | | | - | | | | 122,099,841 | | | | - | | | | 122,145,132 | |
LOUP | | | - | | | | 29,538,009 | | | | - | | | | 29,745,394 | |
EPRF | | | - | | | | 9,491,822 | | | | - | | | | 9,642,672 | |
BUFF | | | - | | | | 1,204,210 | | | | - | | | | 1,203,580 | |
BUFB | | | - | | | | 238,041 | | | | - | | | | 247,824 | |
BSTP | | | - | | | | - | | | | - | | | | - | |
PSTP | | | - | | | | - | | | | - | | | | - | |
TSLH | | | - | | | | - | | | | - | | | | - | |
XUSP | | | - | | | | - | | | | - | | | | - | |
SFLR | | | - | | | | 486,562 | | | | - | | | | 4,818 | |
IGTR | | | - | | | | 701,884,139 | | | | - | | | | 376,119,420 | |
123
Notes to Financial Statements (Unaudited) (Continued)
For the period ended April 30, 2023, in–kind transactions associated with creations and redemptions were as follows:
| | | In-Kind | | | In-Kind | |
| | | Creations | | | Redemptions | |
FFTY | | $ | 20,462,717 | | | $ | 32,917,488 | |
BOUT | | | 3,038,734 | | | | 3,053,331 | |
LOUP | | | 1,575,465 | | | | 3,023,778 | |
EPRF | | | 919,738 | | | | 9,114,891 | |
BUFF | �� | | 64,826,266 | | | | 3,485,073 | |
BUFB | | | 11,631,984 | | | | 4,681,779 | |
BSTP | | | - | | | | 15,100,834 | |
PSTP | | | - | | | | 19,208,824 | |
TSLH | | | - | | | | 1,267,541 | |
XUSP | | | - | | | | 3,773,508 | |
SFLR | | | 24,295,816 | | | | 4,699,782 | |
IGTR | | | 12,139,407 | | | | 26,031,471 | |
Net capital gains or losses resulting from in–kind redemptions are excluded for the Funds’ taxable gains and are not distributed to shareholders.
5. CREATION AND REDEMPTION TRANSACTIONS
There were an unlimited number of shares of beneficial interest (without par value) authorized by the Trust. Individual shares of the Funds may only be purchased and sold at market prices on the Exchange through a broker–dealer. Such transactions may be subject to customary commission rates imposed by the broker–dealer, and market prices for the Funds’ shares may be at, above or below its NAV depending on the premium or discount at which the Funds’ shares trade.
The Funds issue and redeem shares on a continuous basis at NAV only in blocks of shares, called “Creation Units.” Creation Units are issued and redeemed for cash or in–kind for securities included in a specified universe. Once created, shares generally trade in the secondary market at market prices that change throughout the day in amounts less than a Creation Unit. Except when aggregated in Creation Units, shares are not redeemable securities of the Funds. Shares of the Funds may only be purchased or redeemed by certain financial institutions (“Authorized Participants”). An Authorized Participant is either (i) a broker–dealer or other participant in the clearing process through the Continuous Net Settlement System of the National Securities Clearing Corporation or (ii) a DTC participant and, in each case, must have executed a Participant Agreement with the Distributor. A transaction fee is applicable to each transaction regardless of the number of units purchased or sold in the transaction. Each Fund, subject to approval by the Board of Trustees, may adjust transaction fees from time to time based upon actual experience. Additional charges received by the Funds, if any, are disclosed as Transaction Fees on the Statements of Changes in Net Assets. Most retail investors do not qualify as Authorized Participants nor have the resources to buy and sell whole Creation Units. Therefore, they are unable to purchase or redeem the shares directly from the Funds. Rather, most retail investors may purchase shares in the secondary market with the assistance of a broker and are subject to customary brokerage commissions or fees.
Notes to Financial Statements (Unaudited) (Continued)
The Funds, excluding BUFB, BSTP, PSTP, TSLH and XUSP, may lend up to 331/3% of the value of the securities in their respective portfolios to brokers, dealers and financial institutions (but not individuals) under terms of participation in a securities lending program administered by the securities lending agent. The Trust has entered into a Securities Lending Agreement (“SLA”) with U.S. Bank, N.A., the Funds’ custodian (the “Agent”). Under the terms of the SLA, the Funds may lend securities to certain broker–dealers and banks in exchange for collateral in the amount of at least 102% of the value of U.S. securities loaned or at least 105% of the value of non–U.S. securities loaned, marked to market daily. The collateral can be received in the form of cash collateral and/or non–cash collateral. Non–cash collateral can include U.S. Government Securities and letters of credit. The cash collateral is invested in the Mount Vernon Liquid Assets Portfolio, LLC (“Mount Vernon”), as noted in the Funds’ Schedules of Investments. Mount Vernon seeks to maximize current income to the extent consistent with the preservation of capital and liquidity; and to maintain a stable NAV of $1.00. Mount Vernon has an overnight and continuous maturity. The market value of the loaned securities is determined daily at the close of business of the Funds and any additional required collateral is delivered to the Funds on the next business day. The Funds continue to benefit from interest or dividends on the securities loaned and may also earn a return from the collateral. The Funds pay various fees in connection with the investment of cash collateral. The Funds pay the Agent fees based on the investment income received from securities lending activities. Although risk is mitigated by the collateral, the Funds could experience a delay in recovering their securities and possible loss of income or value if the borrower fails to return them. In the event of a borrower’s material default, the Agent shall take all actions the Agent deems appropriate to liquidate the collateral, purchase replacement securities at the Agents’ expense, or pay the Funds an amount equal to the market value of the loaned securities, subject to certain limitations.
As of April 30, 2023, the values of the securities on loan, cash collateral received, and fees and interest were as follows:
| | | Value of Securities on Loan | | | Cash Collateral Received | | | Fees and Interest Earned | |
FFTY | | $ | 12,127,505 | | | $ | 22,880,354 | | | $ | 31,203 | |
BOUT | | | 2,784,482 | | | | 2,841,107 | | | | 6,482 | |
LOUP | | | 10,960,217 | | | | 11,367,570 | | | | 21,417 | |
EPRF | | | 10,053,416 | | | | 10,291,453 | | | | 78,817 | |
BUFF | | | 3,451,289 | | | | 3,518,125 | | | | 47,653 | |
SFLR | | | 2,208,450 | | | | 2,244,485 | | | | 1,106 | |
IGTR | | | 23,067,634 | | | | 23,312,054 | | | | 11,737 | |
Notes to Financial Statements (Unaudited) (Continued)
Due to the absence of a master netting agreement related to the applicable Funds’ participation in securities lending, no additional offsetting disclosures have been made on behalf of the Funds for the total borrowings listed above.
7. | FEDERAL INCOME TAX INFORMATION |
At October 31, 2022, the cost of investments and net unrealized appreciation/
(depreciation) for federal income tax purposes were as follows:
| | | FFTY | | | BOUT | | | LOUP | | | EPRF | | | BUFF | |
| | | | | | | | | | | | | | | | | | | | | |
Cost of Portfolio | | $ | 129,414,206 | | | $ | 17,352,282 | | | $ | 52,848,194 | | | $ | 155,203,066 | | | $ | 151,444,918 | |
Gross Unrealized Appreciation | | $ | 5,731,855 | | | $ | 806,604 | | | $ | 1,452,208 | | | $ | 384,426 | | | $ | 2,088,342 | |
Gross Unrealized Depreciation | | | (8,195,171 | ) | | | (198,617 | ) | | | (12,818,792 | ) | | | (31,179,375 | ) | | | (2,523,792 | ) |
Net Unrealized Appreciation/(Depreciation) | | $ | (2,463,316 | ) | | $ | 607,987 | | | $ | (11,366,584 | ) | | $ | (30,794,949 | ) | | $ | (435,450 | ) |
| | | | | | | | | | | | | | | | | | | | | |
| | | | | | | | | | | | | | | | | | | | | |
| | | BUFB | | | BSTP | | | PSTP | | | TSLH | | | XUSP | |
| | | | | | | | | | | | | | | | | | | | | |
Cost of Portfolio | | $ | 27,134,997 | | | $ | 29,653,001 | | | $ | 34,220,441 | | | $ | 2,497,240 | | | $ | 5,803,640 | |
Gross Unrealized Appreciation | | $ | 244,007 | | | $ | 566,147 | | | $ | 1,044,690 | | | $ | 177,813 | | | $ | 399,624 | |
Gross Unrealized Depreciation | | | (963,484 | ) | | | (1,345,806 | ) | | | (1,384,429 | ) | | | (328,952 | ) | | | (683,672 | ) |
Net Unrealized Appreciation/(Depreciation) | | $ | (719,477 | ) | | $ | (779,659 | ) | | $ | (339,739 | ) | | $ | (151,139 | ) | | $ | (284,048 | ) |
The differences between book basis and tax basis cost on investments and net unrealized appreciation/(depreciation) are primarily attributable to wash sale loss deferrals.
As of October 31, 2022, the components of distributable earnings/(accumulated deficit) on a tax basis were as follows:
| | | FFTY | | | BOUT | | | LOUP | | | EPRF | | | BUFF | |
| | | | | | | | | | | | | | | | | | | | | |
Accumulated Capital and Other Losses | | $ | (305,590,158 | ) | | $ | (12,865,517 | ) | | $ | (30,347,209 | ) | | $ | (16,102,269 | ) | | $ | (38,641,323 | ) |
Distributions Payable | | | - | | | | - | | | | - | | | | - | | | | - | |
Undistributed Net Ordinary Income | | | 2,131,160 | | | | 148,584 | | | | - | | | | - | | | | - | |
Unrealized Appreciation/(Depreciation) on Investments | | | (2,463,316 | ) | | | 607,987 | | | | (11,366,584 | ) | | | (30,794,949 | ) | | | (435,450 | ) |
Total Distributable Earnings/(Accumulated Deficit) | | $ | (305,922,314 | ) | | $ | (12,108,946 | ) | | $ | (41,713,793 | ) | | $ | (46,897,218 | ) | | $ | (39,076,773 | ) |
| | | | | | | | | | | | | | | | | | | | | |
| | | | | | | | | | | | | | | | | | | | | |
| | | BUFB | | | BSTP | | | PSTP | | | TSLH | | | XUSP | |
| | | | | | | | | | | | | | | | | | | | | |
Accumulated Capital and Other Losses | | $ | (10,076 | ) | | $ | (2,268,571 | ) | | $ | (1,931,880 | ) | | $ | (97,493 | ) | | $ | (231,703 | ) |
Undistributed Net Ordinary Income | | | - | | | | - | | | | - | | | | 9,846 | | | | - | |
Unrealized Appreciation/(Depreciation) on Investments | | | (719,477 | ) | | | (779,659 | ) | | | (339,739 | ) | | | (151,139 | ) | | | (284,048 | ) |
Total Distributable Earnings/(Accumulated Deficit) | | $ | (729,553 | ) | | $ | (3,048,230 | ) | | $ | (2,271,619 | ) | | $ | (238,786 | ) | | $ | (515,751 | ) |
Notes to Financial Statements (Unaudited) (Continued)
Certain qualified late year ordinary losses incurred after December 31, and within the current taxable year, are deemed to arise on the first business day of the next taxable year.
At October 31, 2022, the Funds deferred the following qualified late year ordinary losses:
| | | Late Year Ordinary Losses | |
FFTY | | $ | - | |
BOUT | | | - | |
LOUP | | | 127,219 | |
EPRF | | | - | |
BUFF | | | 48,674 | |
BUFB | | | 10,075 | |
BSTP | | | 107,871 | |
PSTP | | | 106,149 | |
TSLH | | | - | |
XUSP | | | 9,338 | |
At October 31, 2022, for federal income tax purposes, the Funds had capital loss carryforwards available to offset future capital gains for an unlimited period as indicated below:
| | | Indefinite Short-Term | | | Indefinite Long-Term | |
FFTY | | $ | 305,568,055 | | | $ | - | |
BOUT | | | 12,865,496 | | | | - | |
LOUP | | | 26,072,594 | | | | 4,147,532 | |
EPRF | | | 8,231,556 | | | | 7,272,213 | |
BUFF | | | 38,592,649 | | | | - | |
BUFB | | | 1 | | | | - | |
BSTP | | | 2,160,700 | | | | - | |
PSTP | | | 1,825,731 | | | | - | |
TSLH | | | 97,493 | | | | - | |
XUSP | | | 222,365 | | | | - | |
To the extent that these loss carryforwards are utilized, capital gains so offset will not be distributed to shareholders. During the current tax year ended October 31, 2022, no capital loss carryforwards available were utilized.
The tax character of the distributions paid by the Funds during the fiscal years ended October 31, 2022 and October 31, 2021 were as follows:
| | | FFTY | | | EPRF | |
| | | 2022 | | | 2021 | | | 2022 | | | 2021 | |
Distributions paid from: | | | | | | | | | | | | | | | | |
Net Ordinary Income | | $ | 520,522 | | | $ | - | | | $ | 7,781,626 | | | $ | 9,442,181 | |
Net Long-Term Capital Gains | | | - | | | | - | | | | - | | | | - | |
Return of Capital | | | - | | | | - | | | | 179,692 | | | | 570,855 | |
Total Distributions Paid | | $ | 520,522 | | | $ | - | | | $ | 7,961,318 | | | $ | 10,013,036 | |
All other Funds did not pay any distributions during the fiscal years ended October 31, 2022 and October 31, 2021.
Notes to Financial Statements (Unaudited) (Continued)
8. TRANSACTIONS WITH AFFILITATES
BUFF and BUFB had the following transactions during the period ended April 30, 2023 with affiliated companies:
BUFF | | | | | | | | | | | | | | | | | | | | | | | | | | | | | | | | |
| | | | | | | | | | | | | | | | | | | Period Ended April 30, 2023 | |
Security Name | | Value as of November 1, 2022 | | | Purchases | | | Sales | | | Value as of April 30, 2023 | | | Share Balance | | | Dividend Income | | | Net Realized Gain (Loss) on Sale of Shares | | | Net Change in Unrealized Appreciation (Depreciation) | |
Innovator U.S. Equity Power Buffer ETF – January | | $ | 12,531,369 | | | $ | 5,468,300 | | | $ | 642,222 | | | $ | 18,560,666 | | | | 551,908 | | | $ | - | | | $ | 25,262 | | | $ | 1,177,957 | |
Innovator U.S. Equity Power Buffer ETF – February | | | 12,437,292 | | | | 5,472,663 | | | | 291,770 | | | | 18,558,714 | | | | 627,832 | | | | - | | | | 27,987 | | | | 912,542 | |
Innovator U.S. Equity Power Buffer ETF – March | | | 12,426,551 | | | | 5,403,399 | | | | 338,443 | | | | 18,551,929 | | | | 571,532 | | | | - | | | | 25,695 | | | | 1,034,727 | |
Innovator U.S. Equity Power Buffer ETF – April | | | 12,460,886 | | | | 5,429,779 | | | | 372,490 | | | | 18,553,898 | | | | 624,080 | | | | - | | | | 18,542 | | | | 1,017,181 | |
Innovator U.S. Equity Power Buffer ETF – May | | | 12,489,478 | | | | 5,886,955 | | | | 287,440 | | | | 18,425,572 | | | | 642,006 | | | | - | | | | 15,287 | | | | 321,292 | |
Innovator U.S. Equity Power Buffer ETF – June | | | 12,450,896 | | | | 5,707,786 | | | | 287,869 | | | | 18,458,711 | | | | 598,747 | | | | - | | | | 16,491 | | | | 571,407 | |
Innovator U.S. Equity Power Buffer ETF – July | | | 12,463,273 | | | | 5,396,910 | | | | 387,246 | | | | 18,587,492 | | | | 578,689 | | | | - | | | | 21,344 | | | | 1,093,211 | |
Innovator U.S. Equity Power Buffer ETF – August | | | 12,482,121 | | | | 5,510,523 | | | | 289,303 | | | | 18,514,466 | | | | 622,335 | | | | - | | | | 18,106 | | | | 793,019 | |
Innovator U.S. Equity Power Buffer ETF – September | | | 12,461,179 | | | | 5,397,889 | | | | 321,981 | | | | 18,540,135 | | | | 597,876 | | | | - | | | | 24,360 | | | | 978,688 | |
Innovator U.S. Equity Power Buffer ETF – October | | | 12,429,717 | | | | 5,419,652 | | | | 484,300 | | | | 18,564,343 | | | | 578,689 | | | | - | | | | 32,151 | | | | 1,167,123 | |
Innovator U.S. Equity Power Buffer ETF – November | | | 12,682,474 | | | | 5,484,431 | | | | 697,545 | | | | 18,575,636 | | | | 576,525 | | | | - | | | | 27,613 | | | | 1,078,663 | |
Innovator U.S. Equity Power Buffer ETF – December | | | 12,495,227 | | | | 5,452,189 | | | | 288,044 | | | | 18,541,819 | | | | 585,100 | | | | - | | | | 18,502 | | | | 863,945 | |
128
Notes to Financial Statements (Unaudited) (Continued)
BUFB | | | | | | | | | | | | | | | | | | | | | | | | | | | | | | | | |
| | | | | | | | | | | | | | | | | | | Period Ended April 30, 2023 | |
Security Name | | Value as of November 1, 2022 | | | Purchases | | | Sales | | | Value as of April 30, 2023 | | | Share Balance | | | Dividend Income | | | Net Realized Gain (Loss) on Sale of Shares | | | Net Change in Unrealized Appreciation (Depreciation) | |
Innovator U.S. Equity Buffer ETF – January | | $ | 2,214,100 | | | $ | 973,882 | | | $ | 406,635 | | | $ | 2,987,990 | | | | 83,777 | | | $ | - | | | $ | 17,778 | | | $ | 188,865 | |
Innovator U.S. Equity Buffer ETF – February | | | 2,197,661 | | | | 975,174 | | | | 438,539 | | | | 2,987,987 | | | | 92,209 | | | | - | | | | 23,069 | | | | 230,622 | |
Innovator U.S. Equity Buffer ETF – March | | | 2,190,288 | | | | 970,086 | | | | 449,702 | | | | 2,991,859 | | | | 84,996 | | | | - | | | | 24,300 | | | | 256,887 | |
Innovator U.S. Equity Buffer ETF – April | | | 2,192,943 | | | | 971,420 | | | | 455,834 | | | | 2,986,902 | | | | 88,057 | | | | - | | | | 21,230 | | | | 257,143 | |
Innovator U.S. Equity Buffer ETF – May | | | 2,196,237 | | | | 1,053,895 | | | | 386,175 | | | | 2,964,883 | | | | 98,254 | | | | - | | | | 15,065 | | | | 85,861 | |
Innovator U.S. Equity Buffer ETF – June | | | 2,192,199 | | | | 1,025,493 | | | | 386,127 | | | | 2,972,200 | | | | 92,360 | | | | - | | | | 15,742 | | | | 124,893 | |
Innovator U.S. Equity Buffer ETF – July | | | 2,195,892 | | | | 982,376 | | | | 387,713 | | | | 2,985,677 | | | | 90,289 | | | | - | | | | 16,182 | | | | 178,940 | |
Innovator U.S. Equity Buffer ETF – August | | | 2,199,810 | | | | 1,005,282 | | | | 386,345 | | | | 2,979,338 | | | | 93,631 | | | | - | | | | 13,869 | | | | 146,722 | |
Innovator U.S. Equity Buffer ETF – September | | | 2,190,872 | | | | 987,143 | | | | 386,926 | | | | 2,982,739 | | | | 91,871 | | | | - | | | | 17,509 | | | | 174,141 | |
Innovator U.S. Equity Buffer ETF – October | | | 2,188,705 | | | | 968,172 | | | | 405,620 | | | | 2,990,243 | | | | 87,247 | | | | - | | | | 20,470 | | | | 218,516 | |
Innovator U.S. Equity Buffer ETF – November | | | 2,223,883 | | | | 976,612 | | | | 411,848 | | | | 2,988,652 | | | | 93,483 | | | | - | | | | 18,626 | | | | 181,379 | |
Innovator U.S. Equity Buffer ETF – December | | | 2,216,710 | | | | 980,490 | | | | 428,139 | | | | 2,986,004 | | | | 87,245 | | | | - | | | | 22,111 | | | | 194,832 | |
9. OWNERSHIP BY AFFILIATES
The beneficial ownership, either directly or indirectly, of 25% or more of the voting securities of the Fund creates presumption of control of the Fund, under section 2(a)(9) of the Investment Company Act of 1940. As of April 30, 2023, an affiliate of the Funds owned shares in the secondary market of more than 25% of TSLH shares.
10. SUBSEQUENT EVENT
Management has evaluated the impact of all subsequent events of the Funds through the date of the financial statements were issued, and has determined that there were no subsequent events requiring recognition or disclosure in the financial statements.
Trustees and Officers (Unaudited)
Name, Address and Year of Birth | Position with the Trust | Length of Time Served* | Principal Occupation(s) During Past 5 Years | Number of Portfolios in Fund Complex(a) Overseen by Trustee or Officer | Other Directorships Held by Trustee or Officer in the Past Five Years |
Independent Trustees |
Mark Berg 109 N. Hale Street Wheaton, IL 60187 Year of Birth: 1971 | Trustee | Since 2017 | Founding Principal (2001-present), Chief Executive Officer (2019-present), President (2001-2019), Timothy Financial Counsel, Inc. | 95 | Tortazo, LLC (2018-present) |
Joe Stowell 109 N. Hale Street Wheaton, IL 60187 Year of Birth: 1968 | Trustee | Since 2017 | Chief Operating Officer, Woodmen Valley Chapel (2015–present). | 95 | Board of Advisors, Westmont College (2016-2021). |
Brian J. Wildman 109 N. Hale Street Wheaton, IL 60187 Year of Birth: 1963 | Trustee | Since 2017 | President, Timothy Financial Counsel, Inc. (2019–present); Executive Vice President, Consumer Banking (2016–2019), Chief Risk Officer (2013–2016), MB Financial Bank. | 95 | Missionary Furlough Homes, Inc. (since 2008); MB Financial Bank (2003– 2019). |
Trustees and Officers (Unaudited) (Continued)
Interested Trustee & Officer |
H. Bruce Bond (b) 109 N. Hale Street Wheaton, IL 60187 Year of Birth: 1963 | Interested Trustee, President and Principal Executive Officer | Since 2017 | Chief Executive Officer, Innovator Capital Management, LLC (2017–present). | 95 | None |
Officers |
John W. Southard, Jr. 109 N. Hale Street Wheaton, IL 60187 Year of Birth: 1969 | Vice President, Secretary and Assistant Treasurer | Since 2017 | Chief Investment Officer, Innovator Capital Management, LLC (2017–present); Director and Co–Founder, T2 Capital Management, LLC (2010–present). | 95 | Independent Trustee, ETF Managers Group, LLC (2012–2018) |
Kathleen Meyer 109 N. Hale Street Wheaton, IL 60187 Year of Birth: 1964 | Vice President, Treasurer and Principal Financial Accounting Officer | Since 2022 | Chief Financial Officer, Innovator Capital Management, LLC (2018–present) | 95 | None |
Kevin P. Hourihan 3 Canal Plaza 3rd Floor Portland, ME 04101 Year of Birth: 1978 | Chief Compliance Officer and Anti-Money Laundering Officer | Since 2023 | Senior Principal Consultant, Fund Chief Compliance Officer, ACA Global, LLC (since 2022); Chief Compliance Officer, Ashmore Funds (2017-2022); Chief Compliance Officer, Ashmore Investment Management (US) Corp (2014-2022); Chief Compliance Officer, Ashmore Equities Investment Management (2015-2019). | 95 | None |
* | The Funds’ Trustees serve for an indefinite term until their resignation, death or removal. The Funds’ officers are elected annually by the Board and serve at the Board’s pleasure. |
(a) | The Fund Complex includes the Funds, each series of Innovator ETFs Trust. |
(b) | H. Bruce Bond is deemed to be an interested person of the Trust (as defined in the 1940 Act) because of his affiliation with the Adviser. |
The Statement of Additional Information includes additional information about the Trustees and is available upon request, without charge, by calling 1–877–386–3890.
Board Considerations Regarding Approval of Investment Management Agreement (Unaudited)
BOARD CONSIDERATIONS REGARDING APPROVAL OF INVESTMENT MANAGEMENT AGREEMENT AND INVESTMENT SUB-ADVISORY AGREEMENT FOR THE FOLLOWING INNOVATOR FUND:
Innovator Equity Managed Floor ETF
At a quarterly Board meeting held on June 16, 2022, the Trust’s Board considered approval of the Advisory Agreement with Innovator Capital Management, LLC (the “Adviser”), on behalf of the Innovator Equity Managed Floor ETF (the “Fund”), and the Sub-Advisory Agreement among the Trust, on behalf of the Fund, the Adviser and Parametric Portfolio Associates (“Parametric” or the “Sub-Adviser”), for an initial two-year term. The Board determined that the agreements were in the best interests of the Fund in light of the extent and quality of the services expected to be provided and such other matters as the Board considered to be relevant in the exercise of its reasonable business judgment.
To reach this determination, the Board considered its duties under the Investment Company Act of 1940, as amended (the “1940 Act”), as well as under the general principles of state law in reviewing and approving advisory contracts; the requirements of the 1940 Act in such matters; the fiduciary duty of investment advisers with respect to advisory agreements and compensation; the standards used by courts in determining whether investment company boards have fulfilled their duties; and the factors to be considered by the Board in voting on such agreements. To assist the Board in its evaluation of the agreements, the Independent Trustees received a separate report from each of the Adviser and the Sub-Adviser in advance of the Meeting responding to a request for information provided on behalf of the Independent Trustees that, among other things, outlined the services to be provided by the Adviser and the Sub-Adviser to the Fund (including the relevant personnel responsible for these services and their experience); the proposed unitary fee rate payable by the Fund as compared to fees charged to peer groups of the Fund and as compared to fees charged to other clients of the Adviser and the Sub-Adviser, including other ETFs managed by the Adviser and the Sub- Adviser; the estimated expenses of the Fund as compared to the expense ratio of the fund in the Fund’s peer group; the nature of the expenses to be incurred in providing services to the Fund and the potential for economies of scale, if any; financial data on the Adviser and the Sub- Adviser; any fall-out benefits accruing to the Adviser or the Sub-Adviser; and information on the Adviser’s and the Sub-Adviser’s compliance programs. The Independent Trustees also met separately with their Independent Counsel to discuss the information provided by the Adviser and the Sub-Adviser. The Board applied its business judgment to determine whether the arrangements between the Trust and the Adviser and among the Trust, the Adviser and the Sub-Adviser are reasonable business arrangements from the Fund’s perspective as well as from the perspective of the Fund’s shareholders.
Board Considerations Regarding Approval of Investment Management Agreement (Unaudited) (Continued)
In evaluating whether to approve the agreements, the Board applied its business judgment and considered the nature, extent and quality of the services to be provided by the Adviser and Parametric pursuant to the agreements. With respect to the investment management agreement, the Board considered that the Adviser will be responsible for the overall management and administration of the Fund and reviewed all of the services to be provided by the Adviser to the Fund, including oversight of Parametric, as well as the background and experience of the persons responsible for such services. The Board noted that the Adviser will oversee Parametric’s day-to-day management of each of the Fund’s investments, including portfolio risk monitoring and performance review. In reviewing the services to be provided, the Board noted the compliance program that had been developed by the Adviser included an adequate program for monitoring the Adviser’s, Parametric’s and the Fund’s compliance with the 1940 Act, as well as each Fund’s compliance with its investment objective and policies. With respect to the sub-advisory agreement, the Board reviewed the materials provided by Parametric and noted the background and experience of Parametric’s portfolio management team and Parametric’s investment style. In light of the information presented and the considerations made, the Board concluded that the nature, extent and quality of the services to be provided to the Fund by the Adviser and Parametric under the agreements were expected to be satisfactory.
Since the Fund had yet to commence investment operations, the Board could not consider the historical investment performance of the Fund.
The Board considered the proposed unitary fee rate payable by the Fund under the investment management agreement for the services to be provided. The Board noted that, under the unitary fee arrangement, the Fund would pay the Adviser a unitary fee equal to an annual rate of 0.89% of its average daily net assets. The Board considered that, from the unitary fee for the Fund, the Adviser would pay Parametric a tiered monthly sub-advisory fee based on the Fund’s assets under management.
The Board noted that the Adviser would be responsible for the Fund’s expenses, including the cost of transfer agency, custody, fund administration, legal, audit and other services and license fees (if any), but excluding the fee payment under the investment management agreement, interest, taxes, brokerage commissions and other expenses connected with the execution of portfolio transactions, and extraordinary expenses. The Board received and reviewed information for the Fund showing the advisory fee rates and expense ratios of the funds comprising of the Fund’s peer group, as well as advisory fee rates charged by the Adviser and Parametric to other funds (including ETFs) and non-fund clients, as applicable. In light of the information considered and the nature, extent and quality of the services expected to be provided to the Funds under the agreements, the Board determined that the proposed unitary fee for each of the Funds, including the fee rate to be paid by the Adviser to Parametric from the unitary fee, was fair.
Board Considerations Regarding Approval of Investment Management Agreement (Unaudited) (Continued)
The Board noted that the proposed unitary fee for each of the Funds were structured to pass the benefits of any economies of scale on to shareholders as the respective Fund’s assets grow. The Board noted that any reduction in fixed costs associated with the management of the respective Fund would benefit the Adviser and Parametric, but that the unitary fee structure provides a level of certainty in expenses for each of the Funds. The Board noted that the Adviser is continuing to invest in personnel and infrastructure for the Innovator fund complex.
Because the Funds have not yet commenced operations and the actual asset base of the Funds have not yet been determined, the Board noted that there was no historical profitability information with respect to the Funds to be reviewed. The Board noted that it would review profitability information in connection with subsequent renewals of the agreements.
The Board considered potential “fall-out” or ancillary benefits anticipated to be received by the Adviser and Parametric. The Board concluded that the character and amount of potential fall-out benefits to the Adviser and Parametric were consistent with the types of benefits generally derived by investment managers and sub-advisers to funds.
Based on all of the information considered and the conclusions reached, the Board, including the Independent Trustees, unanimously determined that the terms of the agreements are fair and that the approval of the agreements is in the best interests of the Funds. No single factor was determinative in the Board’s analysis.
Board Considerations Regarding Approval of Investment Management Agreement (Unaudited)
BOARD CONSIDERATIONS REGARDING APPROVAL OF INVESTMENT MANAGEMENT AGREEMENT AND INVESTMENT SUB-ADVISORY AGREEMENT FOR THE FOLLOWING INNOVATOR FUND:
Innovator Gradient Tactical Rotation Strategy ETF
At a quarterly Board meeting held on September 13, 2022, the Trust’s Board considered approval of the Advisory Agreement with Innovator Capital Management, LLC (the “Adviser”), on behalf of the Innovator Gradient Tactical Rotation Strategy ETF (the “Fund”), and the Sub-Advisory Agreement among the Trust, on behalf of the Fund, the Adviser, Penserra Capital Management LLC and Gradient Investments, LLC (“Penserra” and “Gradient” or the “Sub-Advisers”), for an initial two-year term. The Board determined that the agreements were in the best interests of the Fund in light of the extent and quality of the services expected to be provided and such other matters as the Board considered to be relevant in the exercise of its reasonable business judgment.
To reach this determination, the Board considered its duties under the Investment Company Act of 1940, as amended (the “1940 Act”), as well as under the general principles of state law in reviewing and approving advisory contracts; the requirements of the 1940 Act in such matters; the fiduciary duty of investment advisers with respect to advisory agreements and compensation; the standards used by courts in determining whether investment company boards have fulfilled their duties; and the factors to be considered by the Board in voting on such agreements. To assist the Board in its evaluation of the agreements, the Independent Trustees received a separate report from each of the Adviser and the Sub-Advisers in advance of the Meeting responding to a request for information provided on behalf of the Independent Trustees that, among other things, outlined the services to be provided by the Adviser and the Sub-Advisers to the Fund (including the relevant personnel responsible for these services and their experience); the proposed unitary fee rate payable by the Fund as compared to fees charged to peer groups of the Fund and as compared to fees charged to other clients of the Adviser and the Sub-Advisers, including other ETFs managed by the Adviser and the Sub-Advisers; the estimated expenses of the Fund as compared to the expense ratio of the fund in the Fund’s peer group; the nature of the expenses to be incurred in providing services to the Fund and the potential for economies of scale, if any; financial data on the Adviser and the Sub-Advisers; any fall-out benefits accruing to the Adviser or the Sub-Advisers; and information on the Adviser’s and the Sub-Adviser’s compliance programs. The Independent Trustees also met separately with their Independent Counsel to discuss the information provided by the Adviser and the Sub-Advisers. The Board applied its business judgment to determine whether the arrangements between the Trust and the Adviser and among the Trust, the Adviser and the Sub-Advisers are reasonable business arrangements from the Fund’s perspective as well as from the perspective of the Fund’s shareholders.
Board Considerations Regarding Approval of Investment Management Agreement (Unaudited) (Continued)
In evaluating whether to approve the agreements, the Board applied its business judgment and considered the nature, extent and quality of the services to be provided by the Adviser, Penserra and Gradient pursuant to the agreements. With respect to the investment management agreement, the Board considered that the Adviser will be responsible for the overall management and administration of the Fund and reviewed all of the services to be provided by the Adviser to the Fund, including oversight of the Sub-Advisers, as well as the background and experience of the persons responsible for such services. The Board noted that the Adviser will oversee the Sub-Adviser’s day-to-day management of the Fund’s investments, including portfolio risk monitoring and performance review. In reviewing the services to be provided, the Board noted the compliance program that had been developed by the Adviser included an adequate program for monitoring the Adviser’s, Sub-Adviser’s and the Fund’s compliance with the 1940 Act, as well as the Fund’s compliance with its investment objective and policies. With respect to the sub-advisory agreement, the Board reviewed the materials provided by the Sub-Advisers and noted the background and experience of the Sub-Adviser’s portfolio management teams and Sub-Advisers investment style. In light of the information presented and the considerations made, the Board concluded that the nature, extent and quality of the services to be provided to the Fund by the Adviser and Sub-Advisers under the agreements were expected to be satisfactory.
Since the Fund had yet to commence investment operations, the Board could not consider the historical investment performance of the Fund.
The Board considered the proposed unitary fee rate payable by the Fund under the investment management agreement for the services to be provided. The Board noted that, under the unitary fee arrangement, the Fund would pay the Adviser a unitary fee equal to an annual rate of 0.80% of its average daily net assets. The Board considered that, from the unitary fee for the Fund, the Adviser would pay Penserra and Gradient an annual sub-advisory fee equal to a 0.05% minimum and 0.20%, respectively, on the Fund’s assets under management, under management.
The Board noted that the Adviser would be responsible for the Fund’s expenses, including the cost of transfer agency, custody, fund administration, legal, audit and other services and license fees (if any), but excluding the fee payment under the investment management agreement, interest, taxes, brokerage commissions and other expenses connected with the execution of portfolio transactions, and extraordinary expenses. The Board received and reviewed information for the Fund showing the advisory fee rates and expense ratios of the funds comprising of the Fund’s peer group, as well as advisory fee rates charged by the Adviser, Penserra and Gradient to other funds (including ETFs) and non-fund clients, as applicable. In light of the information considered and the nature, extent and quality of the services expected to be provided to the Fund under the agreements, the Board determined that the proposed unitary fee for the Fund, including the fee rate to be paid by the Adviser to Penserra and Gradient from the unitary fee, was fair.
Board Considerations Regarding Approval of Investment Management Agreement (Unaudited) (Continued)
The Board noted that the proposed unitary fee for the Fund was structured to pass the benefits of any economies of scale on to shareholders as the Fund’s assets grow. The Board noted that any reduction in fixed costs associated with the management of the Fund would benefit the Adviser, Penserra and Gradient, but that the unitary fee structure provides a level of certainty in expenses for the Fund. The Board noted that the Adviser is continuing to invest in personnel and infrastructure for the Innovator fund complex.
Because the Fund has not yet commenced operations and the actual asset base of the Fund has not yet been determined, the Board noted that there was no historical profitability information with respect to the Fund to be reviewed. The Board noted that it would review profitability information in connection with subsequent renewals of the agreements.
The Board considered potential “fall-out” or ancillary benefits anticipated to be received by the Adviser, Penserra and Gradient. The Board concluded that the character and amount of potential fall-out benefits to the Adviser, Penserra and Gradient were consistent with the types of benefits generally derived by investment managers and sub-advisers to fund.
Based on all of the information considered and the conclusions reached, the Board, including the Independent Trustees, unanimously determined that the terms of the agreements are fair and that the approval of the agreements is in the best interests of the Fund. No single factor was determinative in the Board’s analysis.
Additional Information (Unaudited)
1. | INFORMATION ABOUT PROSPECTUS |
This report has been prepared for shareholders and may be distributed to others only if preceded or accompanied by a current prospectus. Investors should consider the investment objective and policies, risk considerations, charges and ongoing expenses of an investment carefully before investing. The prospectus contains this and other information relevant to an investment in the respective Fund. Please read the Prospectus carefully before investing. A copy of the Prospectus may be obtained without charge by writing to the Trust’s Distributor, or by calling toll free at 1–800–208–5212 or visiting www.innovatoretfs.com.
2. | PROXY VOTING POLICIES AND PROCEDURES |
The Trust’s Proxy Voting Policies and Procedures are available without charge, upon request, by calling 1–877–386–3890 and on the SEC’s website at www.sec.gov. Information relating to how each Fund voted proxies relating to portfolio securities held during each year ended June 30 is also available on the SEC’S website at www.sec.gov.
3. | INFORMATION ABOUT PORTFOLIO SECURITIES |
Each Funds’ complete schedule of portfolio holdings for the first and third quarters is filed with the SEC on Form N–Q or Part F of Form N–PORT (beginning with filings after March 31, 2020). The Trust’s Form N–Q or Part F of Form
N–PORT is available without charge, upon request, by calling 1–877–386–3890, or on the SEC’s website at www.sec.gov. The Trust’s Form N–Q or Part F of Form N–PORT may be reviewed and copied at the SEC’s Public Reference Room in Washington, DC. Information on the operation of the Public Reference Room may be obtained by calling 1–800–SEC–0330.
4. | HOUSEHOLD DELIVERY OF SHAREHOLDER DOCUMENTS |
In order to reduce expenses, the Trust delivers one copy of an annual/semi–annual report, prospectus and/or proxy statement on behalf of two or more shareholders at a shared address (householding). If you do not wish to participate in householding, please indicate this preference on your new account application (if you are opening a new account) or call 1–877–FUND890 (877–386–3890) to change the status of your existing account. You may change your status at any time.
Additional Information (Unaudited) (Continued)
5. | ELECTRONIC DELIVERY OF SHAREHOLDER DOCUMENTS |
You may choose to receive a Fund’s prospectus and annual and semi–annual reports electronically. To sign up for electronic delivery, visit www.icsdelivery.com and select the first letter of your brokerage firm’s name. Then, select your brokerage institution from the list that follows, fill out the appropriate information and provide an e–mail address where you would like your information sent. If your brokerage firm is not listed, electronic delivery may not be available. Please contact your brokerage firm or financial adviser.
For the fiscal year ended October 31, 2022, certain dividends paid by the Funds may be subject to a maximum tax rate of 23.8%, as provided for the Jobs and Growth Tax Relief Reconciliation Act of 2003.
The following table lists the percentages of dividend income distributed for the year ended October 31, 2022, that were designated as qualified dividend income under the Jobs and Growth Tax Relief Reconciliation Act of 2003 and qualify for the corporate dividends received deduction, respectively:
| | | % of Dividend Income Distributed | |
Fund | | Qualified Dividend Income | | | Corporate Dividends Received Deduction | |
FFTY | | | 0.00 | % | | | 0.00 | % |
BOUT | | | 0.00 | | | | 0.00 | |
LOUP | | | 0.00 | | | | 0.00 | |
EPRF | | | 0.00 | | | | 0.00 | |
BUFF | | | 0.00 | | | | 0.00 | |
BUFB | | | 0.00 | | | | 0.00 | |
BSTP | | | 0.00 | | | | 0.00 | |
PSTP | | | 0.00 | | | | 0.00 | |
TSLH | | | 0.00 | | | | 0.00 | |
XUSP | | | 0.00 | | | | 0.00 | |
For the taxable year ended October 31, 2022, the Funds didn’t pay any ordinary income distributions that were designated as short–term capital gain distributions under Internal Revenue Section 871(k)2(c).
INVESTMENT ADVISOR
Innovator Capital Management, LLC
109 North Hale Street
Wheaton, IL 60187
INVESTMENT SUB-ADVISORS |
Penserra Capital Management, LLC | | Milliman Financial Risk Management, LLC |
4 Orinda Way, Suite 100-A | | 71 South Wacker Drive, 31st Floor |
Orinda, CA 94563 | | Chicago, IL 60606 |
| | |
| | | |
Gradient Investments, LLC | | Parametric Portfolio Associates |
4105 Lexington Avenue North | | 3600 Minnesota Drive, Unit 325 |
Arden Hills, MN 55126 | | Minneapolis, MN 55435 |
ADMINISTRATOR, FUND ACCOUNTANT & TRANSFER AGENT
U.S. Bancorp Fund Services, LLC
615 East Michigan Street
Milwaukee, WI 53202
DISTRIBUTOR
Foreside Fund Services, LLC
Three Canal Plaza, Suite 100
Portland, ME 04101
CUSTODIAN
U.S. Bank, N.A.
1555 North RiverCenter Drive, Suite 302
Milwaukee, WI 53212
LEGAL COUNSEL
Chapman and Cutler LLP
320 South Canal Street, 27th Floor
Chicago, IL 60606
INDEPENDENT REGISTERED PUBLIC ACCOUNTING FIRM
Cohen & Company, Ltd.
342 North Water Street, Suite 830
Milwaukee, WI 53202
TABLE OF CONTENTS
Letter to Shareholders | 3 |
Fund Performance | 5 |
Expense Example | 91 |
Schedules of Investments and Options Written | 94 |
Statements of Assets and Liabilities | 180 |
Statements of Operations | 202 |
Statements of Changes in Net Assets | 224 |
Financial Highlights | 246 |
Notes to Financial Statements | 268 |
Trustees and Officers | 300 |
Additional Information | 302 |
Letter to Shareholders (Unaudited)
Dear Valued Shareholders,
The 1-year period ended April 30, 2023 was noteworthy in many ways. During this 12-month stretch, investors witnessed a remarkable chain of events:
| | 1. | Accommodative covid-era monetary policy led to the highest inflation in 40 years |
| | 2. | High and rising inflation led to tighter monetary policy |
| | 3. | Tighter monetary policy led to large bank failures |
| | 4. | Bank failures led to heightened stock market volatility |
On top of all that, the Federal government reached its debt limit in early 2023 and Congress had still not resolved the matter as of April 30.
While many investors have dealt with the effects of high inflation, bank failures and government debt limits, few have experienced such swift and severe Fed policy tightening out of such an accommodative policy stance. If there’s anything to be learned from this period, it may be the simple reminder that the future remains unknown and the ability to have a better sense of your risk in the middle of the storm is invaluable.
We believe that the Fed is likely to hold interest rates higher for longer than the market has anticipated and that investors will need to learn to factor these higher rates into their thinking. In our estimation, this doesn’t translate to a full-blown “risk-off” sentiment; but to the extent that higher rates create greater market uncertainty, we continue to think investors will do well to be risk aware.
The heightened uncertainty during this period led a large swath of investors to look for ways to maintain market exposure with built-in risk management. Many investors looked to Innovator during this period and we were pleased to offer the industry’s largest and widest-ranging suite of Defined Outcome ETFs™, including the latest addition of our Premium Income Barrier ETFs™. Over this period, while the global equity market was up 2.6%, strong inflows resulted in our assets under management nearly doubling, rising by more than $6.5 billion over the 12-month period.
On behalf of the team at Innovator, thank you for the confidence and trust you’ve place in us and our products over the past year. We’ve worked to earn that trust and intend to work hard to keep it. We wish you the best in good health and prosperity in the coming year.

Bruce Bond,
CEO
Letter to Shareholders (Unaudited) (Continued)
The views in this report were those of the Fund’s CEO as of April 30, 2023 and may not reflect his views on the date that this report is first published or anytime thereafter. These views are intended to assist shareholders in understanding their investments and do not constitute investment advice.
The Funds have characteristics unlike many other traditional investment products and may not be suitable for all investors. For more information regarding whether an investment in the Fund is right for you, please see Investor Suitability" in the prospectus.
Investing involves risks. Loss of principal is possible.
This material must be preceded by or accompanied with a prospectus. The Funds' investment objectives, risks, charges and expenses should be considered carefully before investing. The prospectus contains this and other important information, and it may be obtained at innovatoretfs.com. Read it carefully before investing.
Innovator ETFs are distributed by Foreside Fund Services, LLC.
INNOVATOR INTERNATIONAL DEVELOPED POWER BUFFER ETF - JANUARY
Fund Performance |
April 30, 2023 (Unaudited) |
| |
The following chart compares the value of a hypothetical $10,000 investment in the Innovator International Developed Power Buffer ETF - January from its inception (December 31, 2019) to April 30, 2023 as compared with the MSCI EAFE Index - Price Return and Total Return. |
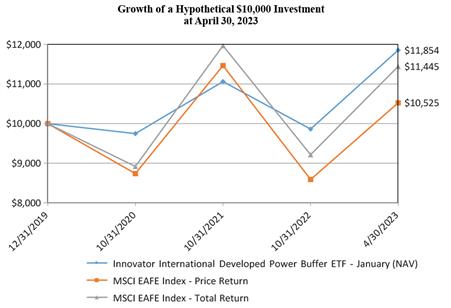
| | | Average Annual Total Returns as of April 30, 2023 | |
| | | One Year | | | Three Years | | | Since Inception (a) | |
Innovator International Developed Power Buffer ETF - January | | | | | | | | | | | | |
NAV Return | | | 14.07 | % | | | 9.05 | % | | | 5.24 | % |
Market Return | | | 13.95 | % | | | 9.06 | % | | | 5.26 | % |
MSCI EAFE Index - Price Return | | | 5.42 | % | | | 8.95 | % | | �� | 1.55 | % |
MSCI EAFE Index - Total Return | | | 8.42 | % | | | 11.68 | % | | | 4.14 | % |
(a) Inception date is December 31, 2019. |
| |
Performance data quoted represents past performance and does not guarantee future results. The investment return and principal value of an investment will fluctuate so that an investor’s shares, when redeemed, may be worth more or less than their original cost. Current performance of the Fund may be lower or higher than the performance quoted. As of the latest prospectus, the net expense ratio of the Fund was 0.85%. For the most recent performance, please visit the Fund’s website at innovatoretfs.com. |
5
INNOVATOR INTERNATIONAL DEVELOPED POWER BUFFER ETF - JANUARY
Fund Performance |
April 30, 2023 (Unaudited) (Continued) |
| |
The line graph and performance table do not reflect the deduction of taxes that a shareholder may pay on fund distributions or the redemption of Fund shares. Returns shown for the Fund and MSCI EAFE Index - Total Return include the reinvestment of all dividends, if any. Returns shown for the MSCI EAFE Index - Price Return do not include the reinvestment of dividends, if any. |
| |
The MSCI EAFE Index is a free float-adjusted market capitalization weighted index that is designed to measure the equity market performance of developed markets, excluding the United States and Canada. |
| |
The Fund’s portfolio holdings may differ significantly from the securities held in the relevant index and, unlike an exchange-traded fund, the performance of an unmanaged index does not reflect deductions for transaction costs, taxes, management fees or other expenses. |
| |
You cannot invest directly in an index. |
| |
Premium/Discount Information: |
| |
Information regarding the differences between the price of the Fund’s shares on the secondary market and the Fund’s net asset value is available at Innovatoretfs.com/IJAN. |
INNOVATOR INTERNATIONAL DEVELOPED POWER BUFFER ETF - APRIL
Fund Performance |
April 30, 2023 (Unaudited) |
The following chart compares the value of a hypothetical $10,000 investment in the Innovator International Developed Power Buffer ETF - April from its inception (March 31, 2021) to April 30, 2023 as compared with the MSCI EAFE Index - Price Return and Total Return. |
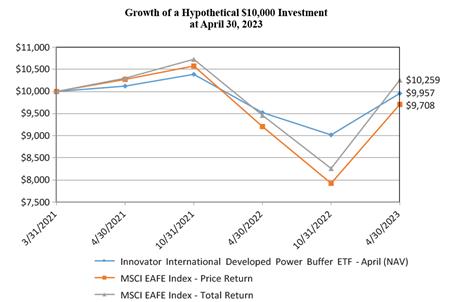
| | | Average Annual Total Returns as of April 30, 2023 | |
| | | One Year | | | Since Inception (a) | |
Innovator International Developed Power Buffer ETF - April | | | | | | | | |
NAV Return | | | 4.56 | % | | | -0.21 | % |
Market Return | | | 4.48 | % | | | -0.21 | % |
MSCI EAFE Index - Price Return | | | 5.42 | % | | | -1.41 | % |
MSCI EAFE Index - Total Return | | | 8.42 | % | | | 1.23 | % |
(a) Inception date is March 31, 2021. |
| |
Performance data quoted represents past performance and does not guarantee future results. The investment return and principal value of an investment will fluctuate so that an investor’s shares, when redeemed, may be worth more or less than their original cost. Current performance of the Fund may be lower or higher than the performance quoted. As of the latest prospectus, the net expense ratio of the Fund was 0.85%. For the most recent performance, please visit the Fund’s website at innovatoretfs.com. |
INNOVATOR INTERNATIONAL DEVELOPED POWER BUFFER ETF - APRIL
Fund Performance |
April 30, 2023 (Unaudited) (Continued) |
The line graph and performance table does not reflect the deduction of taxes that a shareholder may pay on fund distributions or the redemption of Fund shares. Returns shown for the Fund and MSCI EAFE Index - Total Return include the reinvestment of all dividends, if any. Returns shown for the MSCI EAFE Index - Price Return do not include the reinvestment of dividends, if any. |
| |
The MSCI EAFE Index is a free float-adjusted market capitalization weighted index that is designed to measure the equity market performance of developed markets, excluding the United States and Canada. |
| |
The Fund’s portfolio holdings may differ significantly from the securities held in the relevant index and, unlike an exchange-traded fund, the performance of an unmanaged index does not reflect deductions for transaction costs, taxes, management fees or other expenses. |
| |
You cannot invest directly in an index. |
| |
Premium/Discount Information: |
| |
Information regarding the differences between the price of the Fund’s shares on the secondary market and the Fund’s net asset value is available at Innovatoretfs.com/IAPR. |
INNOVATOR INTERNATIONAL DEVELOPED POWER BUFFER ETF - JULY
Fund Performance
April 30, 2023 (Unaudited)
The following chart compares the value of a hypothetical $10,000 investment in the Innovator International Developed Power Buffer ETF - July from its inception (June 28, 2019) to April 30, 2023 as compared with the MSCI EAFE Index – Price Return and Total Return.
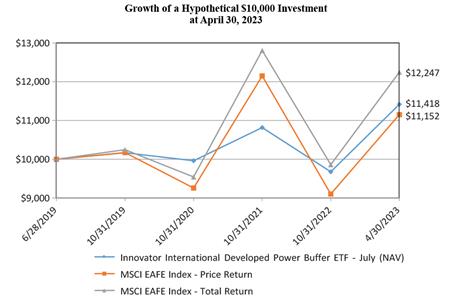
| | | Average Annual Total Returns as of April 30, 2023 | |
| | | One Year | | | Three Years | | | Since Inception (a) | |
Innovator International Developed Power Buffer ETF - July | | | | | | | | | | | | |
NAV Return | | | 10.84 | % | | | 5.90 | % | | | 3.51 | % |
Market Return | | | 10.82 | % | | | 5.87 | % | | | 3.48 | % |
MSCI EAFE Index - Price Return | | | 5.42 | % | | | 8.95 | % | | | 2.88 | % |
MSCI EAFE Index - Total Return | | | 8.42 | % | | | 11.68 | % | | | 5.42 | % |
(a) Inception date is June 28, 2019.
Performance data quoted represents past performance and does not guarantee future results. The investment return and principal value of an investment will fluctuate so that an investor’s shares, when redeemed, may be worth more or less than their original cost. Current performance of the Fund may be lower or higher than the performance quoted. As of the latest prospectus, the net expense ratio of the Fund was 0.85%. For the most recent performance, please visit the Fund’s website at innovatoretfs.com.
9
INNOVATOR INTERNATIONAL DEVELOPED POWER BUFFER ETF - JULY
Fund Performance
April 30, 2023 (Unaudited) (Continued)
The line graph and performance table do not reflect the deduction of taxes that a shareholder may pay on fund distributions or the redemption of Fund shares. Returns shown for the Fund and MSCI EAFE Index – Total Return include the reinvestment of all dividends, if any. Returns shown for the MSCI EAFE Index – Price Return do not include the reinvestment of dividends, if any.
The MSCI EAFE Index is a free float-adjusted market capitalization weighted index that is designed to measure the equity market performance of developed markets, excluding the United States and Canada.
The Fund’s portfolio holdings may differ significantly from the securities held in the relevant index and, unlike an exchange-traded fund, the performance of an unmanaged index does not reflect deductions for transaction costs, taxes, management fees or other expenses.
You cannot invest directly in an index.
Premium/Discount Information:
Information regarding the differences between the price of the Fund’s shares on the secondary market and the Fund’s net asset value is available at Innovatoretfs.com/IJUL.
INNOVATOR INTERNATIONAL DEVELOPED POWER BUFFER ETF - OCTOBER
Fund Performance |
April 30, 2023 (Unaudited) | |
The following chart compares the value of a hypothetical $10,000 investment in the Innovator International Developed Power Buffer ETF - October from its inception (September 30, 2021) to April 30, 2023 as compared with the MSCI EAFE Index - Price Return and Total Return.
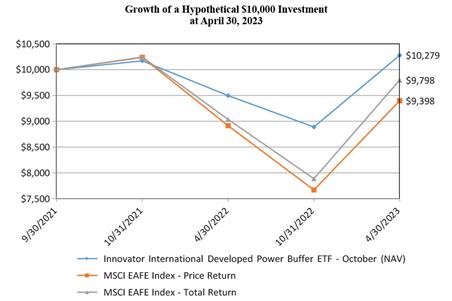
| | | Average Annual Total Returns as of April 30, 2023 | |
| | | One Year | | | Since Inception (a) | |
Innovator International Developed Power Buffer ETF - October | | | | | | | | |
NAV Return | | | 8.22 | % | | | 1.76 | % |
Market Return | | | 7.74 | % | | | 1.57 | % |
MSCI EAFE Index - Price Return | | | 5.42 | % | | | -3.85 | % |
MSCI EAFE Index - Total Return | | | 8.42 | % | | | -1.28 | % |
(a) Inception date is September 30, 2021. |
| |
Performance data quoted represents past performance and does not guarantee future results. The investment return and principal value of an investment will fluctuate so that an investor’s shares, when redeemed, may be worth more or less than their original cost. Current performance of the Fund may be lower or higher than the performance quoted. As of the latest prospectus, the net expense ratio of the Fund was 0.85%. For the most recent performance, please visit the Fund’s website at innovatoretfs.com. |
INNOVATOR INTERNATIONAL DEVELOPED POWER BUFFER ETF - OCTOBER
Fund Performance |
April 30, 2023 (Unaudited) (Continued) | |
The line graph and performance table does not reflect the deduction of taxes that a shareholder may pay on fund distributions or the redemption of Fund shares. Returns shown for the Fund and MSCI EAFE Index - Total Return include the reinvestment of all dividends, if any. Returns shown for the MSCI EAFE Index - Price Return do not include the reinvestment of dividends, if any. |
| |
The MSCI EAFE Index is a free float-adjusted market capitalization weighted index that is designed to measure the equity market performance of developed markets, excluding the United States and Canada. |
| |
The Fund’s portfolio holdings may differ significantly from the securities held in the relevant index and, unlike an exchange-traded fund, the performance of an unmanaged index does not reflect deductions for transaction costs, taxes, management fees or other expenses. |
| |
You cannot invest directly in an index. |
| |
Premium/Discount Information: |
| |
Information regarding the differences between the price of the Fund’s shares on the secondary market and the Fund’s net asset value is available at Innovatoretfs.com/IOCT. |
INNOVATOR EMERGING MARKETS POWER BUFFER ETF - JANUARY
Fund Performance |
April 30, 2023 (Unaudited) |
| |
The following chart compares the value of a hypothetical $10,000 investment in the Innovator Emerging Markets Power Buffer ETF - January from its inception (December 31, 2019) to April 30, 2023 as compared with the MSCI Emerging Markets Index - Price Return and Total Return. |
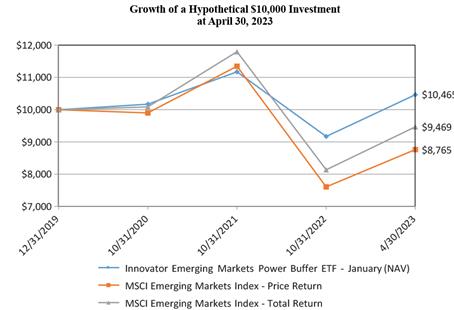
| | | Average Annual Total Returns as of April 30, 2023 | |
| | | One Year | | | Three Years | | | Since Inception (a) | |
Innovator Emerging Markets Power Buffer ETF - January | | | | | | | | | | | | |
NAV Return | | | 1.57 | % | | | 4.78 | % | | | 1.37 | % |
Market Return | | | 1.36 | % | | | 4.85 | % | | | 1.29 | % |
MSCI Emerging Markets Index - Price Return | | | -9.21 | % | | | 1.84 | % | | | -3.88 | % |
MSCI Emerging Markets Index - Total Return | | | -6.51 | % | | | 4.33 | % | | | -1.62 | % |
(a) Inception date is December 31, 2019. |
| |
Performance data quoted represents past performance and does not guarantee future results. The investment return and principal value of an investment will fluctuate so that an investor’s shares, when redeemed, may be worth more or less than their original cost. Current performance of the Fund may be lower or higher than the performance quoted. As of the latest prospectus, the net expense ratio of the Fund was 0.89%. For the most recent performance, please visit the Fund’s website at innovatoretfs.com. |
INNOVATOR EMERGING MARKETS POWER BUFFER ETF - JANUARY
Fund Performance |
April 30, 2023 (Unaudited) (Continued) |
| |
The line graph and performance table do not reflect the deduction of taxes that a shareholder may pay on fund distributions or the redemption of Fund shares. Returns shown for the Fund and MSCI Emerging Markets Index - Total Return include the reinvestment of all dividends, if any. Returns shown for the MSCI Emerging Markets Index - Price Return do not include the reinvestment of dividends, if any. |
| |
The MSCI Emerging Markets Index is a free float-adjusted market capitalization index that is designed to measure equity market performance of emerging markets. |
| |
The Fund’s portfolio holdings may differ significantly from the securities held in the relevant index and, unlike an exchange-traded fund, the performance of an unmanaged index does not reflect deductions for transaction costs, taxes, management fees or other expenses. |
| |
You cannot invest directly in an index. |
| |
Premium/Discount Information: |
| |
Information regarding the differences between the price of the Fund’s shares on the secondary market and the Fund’s net asset value is available at Innovatoretfs.com/EJAN. |
INNOVATOR EMERGING MARKETS POWER BUFFER ETF - APRIL
Fund Performance |
April 30, 2023 (Unaudited) |
The following chart compares the value of a hypothetical $10,000 investment in the Innovator Emerging Markets Power Buffer ETF - April from its inception (March 31, 2021) to April 30, 2023 as compared with the MSCI Emerging Markets Index - Price Return and Total Return. |
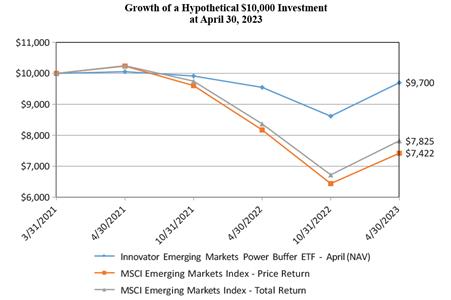
| | | Average Annual Total Returns as of April 30, 2023 | |
| | | One Year | | | Since Inception (a) | |
Innovator Emerging Markets Power Buffer ETF - April | | | | | | | | |
NAV Return | | | 1.59 | % | | | -1.45 | % |
Market Return | | | 2.09 | % | | | -1.41 | % |
MSCI Emerging Markets Index - Price Return | | | -9.21 | % | | | -13.34 | % |
MSCI Emerging Markets Index - Total Return | | | -6.51 | % | | | -11.11 | % |
(a) Inception date is March 31, 2021. |
| |
Performance data quoted represents past performance and does not guarantee future results. The investment return and principal value of an investment will fluctuate so that an investor’s shares, when redeemed, may be worth more or less than their original cost. Current performance of the Fund may be lower or higher than the performance quoted. As of the latest prospectus, the net expense ratio of the Fund was 0.89%. For the most recent performance, please visit the Fund’s website at innovatoretfs.com. |
15
INNOVATOR EMERGING MARKETS POWER BUFFER ETF - APRIL
Fund Performance |
April 30, 2023 (Unaudited) (Continued) |
The line graph and performance table does not reflect the deduction of taxes that a shareholder may pay on fund distributions or the redemption of Fund shares. Returns shown for the Fund and MSCI Emerging Markets Index - Total Return include the reinvestment of all dividends, if any. Returns shown for the MSCI Emerging Markets Index - Price Return do not include the reinvestment of dividends, if any. |
| |
The MSCI Emerging Markets Index is a free float-adjusted market capitalization weighted index that is designed to measure the equity market performance of emerging markets. |
| |
The Fund’s portfolio holdings may differ significantly from the securities held in the relevant index and, unlike an exchange-traded fund, the performance of an unmanaged index does not reflect deductions for transaction costs, taxes, management fees or other expenses. |
| |
You cannot invest directly in an index. |
| |
Premium/Discount Information: |
| |
Information regarding the differences between the price of the Fund’s shares on the secondary market and the Fund’s net asset value is available at Innovatoretfs.com/EAPR. |
INNOVATOR EMERGING MARKETS POWER BUFFER ETF - JULY
Fund Performance
April 30, 2023 (Unaudited)
The following chart compares the value of a hypothetical $10,000 investment in the Innovator Emerging Markets Power Buffer ETF - July from its inception (June 28, 2019) to April 30, 2023 as compared with the MSCI Emerging Markets Index – Price Return and Total Return.
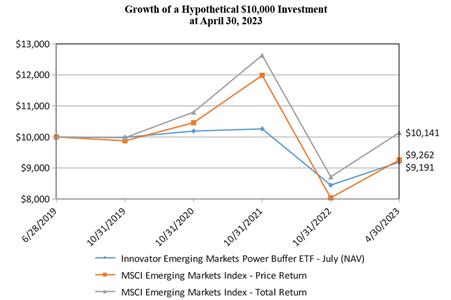
| | | Average Annual Total Returns as of April 30, 2023 | |
| | | One Year | | | Three Years | | | Since Inception (a) | |
Innovator Emerging Markets Power Buffer ETF - July | | | | | | | | | | | | |
NAV Return | | | -4.41 | % | | | -1.12 | % | | | -2.17 | % |
Market Return | | | -4.23 | % | | | -1.23 | % | | | -2.14 | % |
MSCI Emerging Markets Index - Price Return | | | -9.21 | % | | | 1.84 | % | | | -1.98 | % |
MSCI Emerging Markets Index - Total Return | | | -6.51 | % | | | 4.33 | % | | | 0.36 | % |
(a) Inception date is June 28, 2019.
Performance data quoted represents past performance and does not guarantee future results. The investment return and principal value of an investment will fluctuate so that an investor’s shares, when redeemed, may be worth more or less than their original cost. Current performance of the Fund may be lower or higher than the performance quoted. As of the latest prospectus, the net expense ratio of the Fund was 0.89%. For the most recent performance, please visit the Fund’s website at innovatoretfs.com.
17
INNOVATOR EMERGING MARKETS POWER BUFFER ETF - JULY
Fund Performance
April 30, 2023 (Unaudited) (Continued)
The line graph and performance table do not reflect the deduction of taxes that a shareholder may pay on fund distributions or the redemption of Fund shares. Returns shown for the Fund and MSCI Emerging Markets Index – Total Return include the reinvestment of all dividends, if any. Returns shown for the MSCI Emerging Markets Index – Price Return do not include the reinvestment of dividends, if any.
The MSCI Emerging Markets Index is a free float-adjusted market capitalization index that is designed to measure equity market performance of emerging markets.
The Fund’s portfolio holdings may differ significantly from the securities held in the relevant index and, unlike an exchange-traded fund, the performance of an unmanaged index does not reflect deductions for transaction costs, taxes, management fees or other expenses.
You cannot invest directly in an index.
Premium/Discount Information:
Information regarding the differences between the price of the Fund’s shares on the secondary market and the Fund’s net asset value is available at Innovatoretfs.com/EJUL.
INNOVATOR EMERGING MARKETS POWER BUFFER ETF - OCTOBER
Fund Performance |
April 30, 2023 (Unaudited) |
The following chart compares the value of a hypothetical $10,000 investment in the Innovator Emerging Markets Power Buffer ETF - October from its inception (September 30, 2021) to April 30, 2023 as compared with the MSCI Emerging Markets Index - Price Return and Total Return.
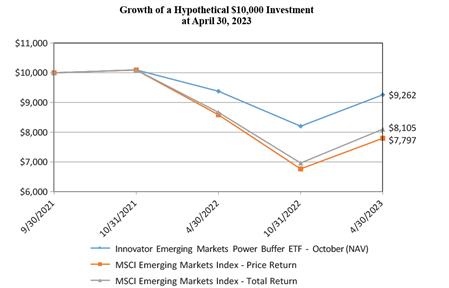
| | | Average Annual Total Returns as of April 30, 2023 | |
| | | One Year | | | Since Inception (a) | |
Innovator Emerging Markets Power Buffer ETF - October | | | | | | | | |
NAV Return | | | -1.26 | % | | | -4.73 | % |
Market Return | | | -0.93 | % | | | -4.72 | % |
MSCI Emerging Markets Index - Price Return | | | -9.21 | % | | | -14.56 | % |
MSCI Emerging Markets Index - Total Return | | | -6.51 | % | | | -12.44 | % |
(a) Inception date is September 30, 2021. |
| |
Performance data quoted represents past performance and does not guarantee future results. The investment return and principal value of an investment will fluctuate so that an investor’s shares, when redeemed, may be worth more or less than their original cost. Current performance of the Fund may be lower or higher than the performance quoted. As of the latest prospectus, the net expense ratio of the Fund was 0.89%. For the most recent performance, please visit the Fund’s website at innovatoretfs.com. |
19
INNOVATOR EMERGING MARKETS POWER BUFFER ETF - OCTOBER
Fund Performance |
April 30, 2023 (Unaudited) (Continued) |
The line graph and performance table does not reflect the deduction of taxes that a shareholder may pay on fund distributions or the redemption of Fund shares. Returns shown for the Fund and MSCI Emerging Markets Index - Total Return include the reinvestment of all dividends, if any. Returns shown for the MSCI Emerging Markets Index - Price Return do not include the reinvestment of dividends, if any. |
| |
The MSCI Emerging Markets Index is a free float-adjusted market capitalization weighted index that is designed to measure the equity market performance of emerging markets. |
| |
The Fund’s portfolio holdings may differ significantly from the securities held in the relevant index and, unlike an exchange-traded fund, the performance of an unmanaged index does not reflect deductions for transaction costs, taxes, management fees or other expenses. |
| |
You cannot invest directly in an index. |
| |
Premium/Discount Information: |
| |
Information regarding the differences between the price of the Fund’s shares on the secondary market and the Fund’s net asset value is available at Innovatoretfs.com/EOCT. |
INNOVATOR GROWTH-100 POWER BUFFER ETF – JANUARY
Fund Performance |
April 30, 2023 (Unaudited) |
| |
The following chart compares the value of a hypothetical $10,000 investment in the Innovator Growth-100 Power Buffer ETF - January from its inception (December 31, 2019) to April 30, 2023 as compared with the NASDAQ-100 Index - Price Return and Total Return. |
'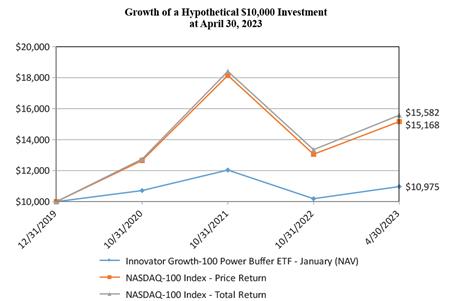
| | | Average Annual Total Returns as of April 30, 2023 | |
| | | One Year | | | Three Years | | | Since Inception (a) | |
Innovator Growth-100 Power Buffer ETF - January | | | | | | | | | | | | |
NAV Return | | | 2.07 | % | | | 3.05 | % | | | 2.83 | % |
Market Return | | | 1.96 | % | | | 2.95 | % | | | 2.79 | % |
NASDAQ-100 Index - Price Return | | | 3.04 | % | | | 13.75 | % | | | 13.32 | % |
NASDAQ-100 Index - Total Return | | | 3.99 | % | | | 14.66 | % | | | 14.24 | % |
(a) Inception date is December 31, 2019. |
| |
Performance data quoted represents past performance and does not guarantee future results. The investment return and principal value of an investment will fluctuate so that an investor’s shares, when redeemed, may be worth more or less than their original cost. Current performance of the Fund may be lower or higher than the performance quoted. As of the latest prospectus, the net expense ratio of the Fund was 0.79%. For the most recent performance, please visit the Fund’s website at innovatoretfs.com. |
21
INNOVATOR GROWTH-100 POWER BUFFER ETF – JANUARY
Fund Performance |
April 30, 2023 (Unaudited) (Continued) |
| |
The line graph and performance table do not reflect the deduction of taxes that a shareholder may pay on fund distributions or the redemption of Fund shares. Returns shown for the Fund and NASDAQ-100 Index - Total Return include the reinvestment of all dividends, if any. Returns shown for the NASDAQ-100 Index - Price Return do not include the reinvestment of dividends, if any. |
| |
The NASDAQ-100 Index includes 100 of the largest domestic and international non-financial companies listed on the Nasdaq Stock Market based on market capitalization. The NASDAQ-100 Price Index reflects companies across major industry groups including computer hardware and software, telecommunications, retail/wholesale trade and biotechnologies. It does not contain securities of financial companies including investment companies. |
| |
The Fund’s portfolio holdings may differ significantly from the securities held in the relevant index and, unlike an exchange-traded fund, the performance of an unmanaged index does not reflect deductions for transaction costs, taxes, management fees or other expenses. |
| |
You cannot invest directly in an index. |
| |
Premium/Discount Information: |
| |
Information regarding the differences between the price of the Fund’s shares on the secondary market and the Fund’s net asset value is available at Innovatoretfs.com/NJAN. |
INNOVATOR GROWTH-100 POWER BUFFER ETF – APRIL
Fund Performance |
April 30, 2023 (Unaudited) | | |
The following chart compares the value of a hypothetical $10,000 investment in the Innovator Growth-100 Power Buffer ETF - April from its inception (March 31, 2020) to April 30, 2023 as compared with the NASDAQ-100 Index - Price Return and Total Return.
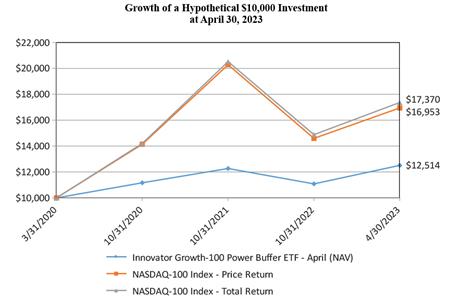
| | | Average Annual Total Returns as of April 30, 2023 | |
| | | One Year | | | Three Years | | | Since Inception (a) | |
Innovator Growth-100 Power Buffer ETF - April | | | | | | | | | | | | |
NAV Return | | | 8.26 | % | | | 5.95 | % | | | 7.55 | % |
Market Return | | | 8.30 | % | | | 5.82 | % | | | 7.56 | % |
NASDAQ-100 Index - Price Return | | | 3.04 | % | | | 13.75 | % | | | 18.68 | % |
NASDAQ-100 Index - Total Return | | | 3.99 | % | | | 14.66 | % | | | 19.62 | % |
(a) Inception date is March 31, 2020. |
| |
Performance data quoted represents past performance and does not guarantee future results. The investment return and principal value of an investment will fluctuate so that an investor’s shares, when redeemed, may be worth more or less than their original cost. Current performance of the Fund may be lower or higher than the performance quoted. As of the latest prospectus, the net expense ratio of the Fund was 0.79%. For the most recent performance, please visit the Fund’s website at innovatoretfs.com. |
23
INNOVATOR GROWTH-100 POWER BUFFER ETF – APRIL
Fund Performance |
April 30, 2023 (Unaudited) (Continued) |
| |
The line graph and performance table do not reflect the deduction of taxes that a shareholder may pay on fund distributions or the redemption of Fund shares. Returns shown for the Fund and NASDAQ-100 Index - Total Return include the reinvestment of all dividends, if any. Returns shown for the NASDAQ-100 Index - Price Return do not include the reinvestment of dividends, if any. |
| |
The NASDAQ-100 Index includes 100 of the largest domestic and international non-financial companies listed on the Nasdaq Stock Market based on market capitalization. The NASDAQ-100 Price Index reflects companies across major industry groups including computer hardware and software, telecommunications, retail/wholesale trade and biotechnologies. It does not contain securities of financial companies including investment companies. |
| |
The Fund’s portfolio holdings may differ significantly from the securities held in the relevant index and, unlike an exchange-traded fund, the performance of an unmanaged index does not reflect deductions for transaction costs, taxes, management fees or other expenses. |
| |
You cannot invest directly in an index. |
| |
Premium/Discount Information: |
| |
Information regarding the differences between the price of the Fund’s shares on the secondary market and the Fund’s net asset value is available at Innovatoretfs.com/NAPR. |
INNOVATOR GROWTH-100 POWER BUFFER ETF – JULY
Fund Performance |
April 30, 2023 (Unaudited) |
The following chart compares the value of a hypothetical $10,000 investment in the Innovator Growth-100 Power Buffer ETF - July from its inception (June 30, 2020) to April 30, 2023 as compared with the NASDAQ-100 Index - Price Return and Total Return.
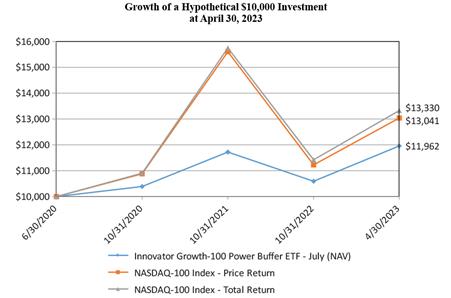
| | | Average Annual Total Returns as of April 30, 2023 | |
| | | One Year | | | Since Inception (a) | |
Innovator Growth-100 Power Buffer ETF - July | | | | | | | | |
NAV Return | | | 9.88 | % | | | 6.53 | % |
Market Return | | | 9.58 | % | | | 6.45 | % |
NASDAQ-100 Index - Price Return | | | 3.04 | % | | | 9.83 | % |
NASDAQ-100 Index - Total Return | | | 3.99 | % | | | 10.68 | % |
(a) Inception date is June 30, 2020.
Performance data quoted represents past performance and does not guarantee future results. The investment return and principal value of an investment will fluctuate so that an investor’s shares, when redeemed, may be worth more or less than their original cost. Current performance of the Fund may be lower or higher than the performance quoted. As of the latest prospectus, the net expense ratio of the Fund was 0.79%. For the most recent performance, please visit the Fund’s website at innovatoretfs.com.
INNOVATOR GROWTH-100 POWER BUFFER ETF – JULY
Fund Performance |
April 30, 2023 (Unaudited) (Continued) |
The line graph and performance table do not reflect the deduction of taxes that a shareholder may pay on fund distributions or the redemption of Fund shares. Returns shown for the Fund and NASDAQ-100 Index - Total Return include the reinvestment of all dividends, if any. Returns shown for the NASDAQ-100 Index - Price Return do not include the reinvestment of dividends, if any.
The NASDAQ-100 Index includes 100 of the largest domestic and international non-financial companies listed on the Nasdaq Stock Market based on market capitalization. The NASDAQ-100 Price Index reflects companies across major industry groups including computer hardware and software, telecommunications, retail/wholesale trade and biotechnologies. It does not contain securities of financial companies including investment companies.
The Fund’s portfolio holdings may differ significantly from the securities held in the relevant index and, unlike an exchange-traded fund, the performance of an unmanaged index does not reflect deductions for transaction costs, taxes, management fees or other expenses.
You cannot invest directly in an index.
Premium/Discount Information:
Information regarding the differences between the price of the Fund’s shares on the secondary market and the Fund’s net asset value is available at Innovatoretfs.com/NJUL.
INNOVATOR GROWTH-100 POWER BUFFER ETF – OCTOBER
Fund Performance |
April 30, 2023 (Unaudited) |
| |
The following chart compares the value of a hypothetical $10,000 investment in the Innovator Growth-100 Power Buffer ETF - October from its inception (September 30, 2019) to April 30, 2023 as compared with the NASDAQ-100 Index - Price Return and Total Return. |
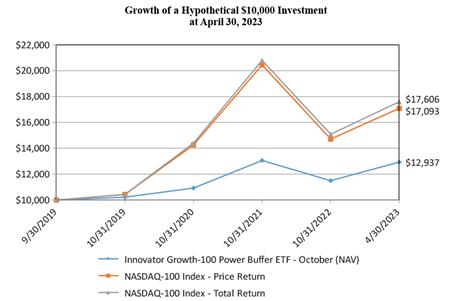
| | | Average Annual Total Returns as of April 30, 2023 | |
| | | One Year | | | Three Years | | | Since Inception (a) | |
Innovator Growth-100 Power Buffer ETF - October | | | | | | | | | | | | |
NAV Return | | | 8.01 | % | | | 6.93 | % | | | 7.45 | % |
Market Return | | | 7.85 | % | | | 6.84 | % | | | 7.38 | % |
NASDAQ-100 Index - Price Return | | | 3.04 | % | | | 13.75 | % | | | 16.14 | % |
NASDAQ-100 Index - Total Return | | | 3.99 | % | | | 14.66 | % | | | 17.10 | % |
(a) Inception date is September 30, 2019. |
| |
Performance data quoted represents past performance and does not guarantee future results. The investment return and principal value of an investment will fluctuate so that an investor’s shares, when redeemed, may be worth more or less than their original cost. Current performance of the Fund may be lower or higher than the performance quoted. As of the latest prospectus, the net expense ratio of the Fund was 0.79%. For the most recent performance, please visit the Fund’s website at innovatoretfs.com. |
INNOVATOR GROWTH-100 POWER BUFFER ETF – OCTOBER
Fund Performance |
April 30, 2023 (Unaudited) (Continued) |
| |
The line graph and performance table do not reflect the deduction of taxes that a shareholder may pay on fund distributions or the redemption of Fund shares. Returns shown for the Fund and NASDAQ-100 Index - Total Return include the reinvestment of all dividends, if any. Returns shown for the NASDAQ-100 Index - Price Return do not include the reinvestment of dividends, if any. |
| |
The NASDAQ-100 Index includes 100 of the largest domestic and international non-financial companies listed on the Nasdaq Stock Market based on market capitalization. The NASDAQ-100 Price Index reflects companies across major industry groups including computer hardware and software, telecommunications, retail/wholesale trade and biotechnologies. It does not contain securities of financial companies including investment companies. |
| |
The Fund’s portfolio holdings may differ significantly from the securities held in the relevant index and, unlike an exchange-traded fund, the performance of an unmanaged index does not reflect deductions for transaction costs, taxes, management fees or other expenses. |
| |
You cannot invest directly in an index. |
| |
Premium/Discount Information: |
| |
Information regarding the differences between the price of the Fund’s shares on the secondary market and the Fund’s net asset value is available at Innovatoretfs.com/NOCT. |
INNOVATOR U.S. SMALL CAP POWER BUFFER ETF – JANUARY
Fund Performance |
April 30, 2023 (Unaudited) |
| |
The following chart compares the value of a hypothetical $10,000 investment in the Innovator U.S. Small Cap Power Buffer ETF - January from its inception (December 31, 2019) to April 30, 2023 as compared with the Russell 2000 Index - Price Return and Total Return. |
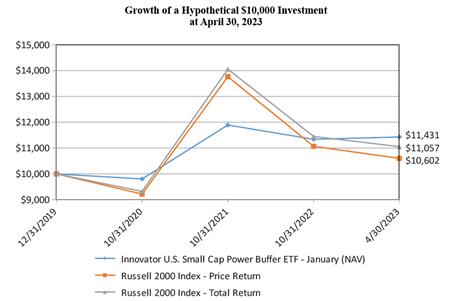
| | | Average Annual Total Returns as of April 30, 2023 | |
| | | One Year | | | Three Years | | | Since Inception (a) | |
Innovator U.S. Small Cap Power Buffer ETF - January | | | | | | | | | | | | |
NAV Return | | | 3.46 | % | | | 8.93 | % | | | 4.10 | % |
Market Return | | | 3.80 | % | | | 8.93 | % | | | 4.15 | % |
Russell 2000 Index - Price Return | | | -5.10 | % | | | 10.51 | % | | | 1.77 | % |
Russell 2000 Index - Total Return | | | -3.65 | % | | | 11.90 | % | | | 3.06 | % |
(a) Inception date is December 31, 2019. |
| |
Performance data quoted represents past performance and does not guarantee future results. The investment return and principal value of an investment will fluctuate so that an investor’s shares, when redeemed, may be worth more or less than their original cost. Current performance of the Fund may be lower or higher than the performance quoted. As of the latest prospectus, the net expense ratio of the Fund was 0.79%. For the most recent performance, please visit the Fund’s website at innovatoretfs.com. |
29
INNOVATOR U.S. SMALL CAP POWER BUFFER ETF – JANUARY
Fund Performance |
April 30, 2023 (Unaudited) (Continued) |
| |
The line graph and performance table do not reflect the deduction of taxes that a shareholder may pay on fund distributions or the redemption of Fund shares. Returns shown for the Fund and Russell 2000 Index - Total Return include the reinvestment of all dividends, if any. Returns shown for the Russell 2000 Index - Price Return do not include the reinvestment of dividends, if any. |
| |
The Russell 2000 Index is a float-adjusted capitalization-weighted index of equity securities issued by the approximately 2,000 smallest issuers in the Russell 3000 Index. The Russell 2000 Price Index measures the performance of the small-capitalization sector of the U.S. equity market, as defined by FTSE Russell. The Russell 2000 Price Index is a subset of the Russell 3000 Index, which measures the performance of the broad U.S. equity market, as defined by FTSE Russell. |
| |
The Fund’s portfolio holdings may differ significantly from the securities held in the relevant index and, unlike an exchange-traded fund, the performance of an unmanaged index does not reflect deductions for transaction costs, taxes, management fees or other expenses. |
| |
You cannot invest directly in an index. |
| |
Premium/Discount Information: |
| |
Information regarding the differences between the price of the Fund’s shares on the secondary market and the Fund’s net asset value is available at Innovatoretfs.com/KJAN. |
INNOVATOR U.S. SMALL CAP POWER BUFFER ETF – APRIL
Fund Performance |
April 30, 2023 (Unaudited) |
The following chart compares the value of a hypothetical $10,000 investment in the Innovator U.S. Small Cap Power Buffer ETF - April from its inception (March 31, 2020) to April 30, 2023 as compared with the Russell 2000 Index - Price Return and Total Return.
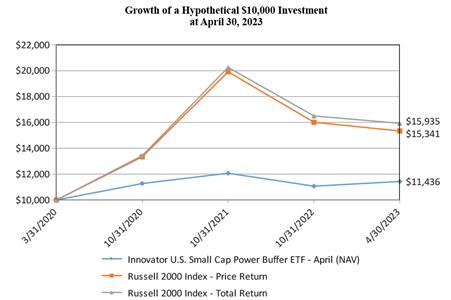
| | | Average Annual Total Returns as of April 30, 2023 | |
| | | One Year | | | Three Years | | | Since Inception (a) | |
Innovator U.S. Small Cap Power Buffer ETF - April | | | | | | | | | | | | |
NAV Return | | | 4.22 | % | | | 2.72 | % | | | 4.45 | % |
Market Return | | | 4.22 | % | | | 2.65 | % | | | 4.43 | % |
Russell 2000 Index - Price Return | | | -5.10 | % | | | 10.51 | % | | | 14.89 | % |
Russell 2000 Index - Total Return | | | -3.65 | % | | | 11.90 | % | | | 16.32 | % |
(a) Inception date is March 31, 2020.
Performance data quoted represents past performance and does not guarantee future results. The investment return and principal value of an investment will fluctuate so that an investor’s shares, when redeemed, may be worth more or less than their original cost. Current performance of the Fund may be lower or higher than the performance quoted. As of the latest prospectus, the net expense ratio of the Fund was 0.79%. For the most recent performance, please visit the Fund’s website at innovatoretfs.com.
31
INNOVATOR U.S. SMALL CAP POWER BUFFER ETF – APRIL
Fund Performance |
April 30, 2023 (Unaudited) (Continued) |
| |
The line graph and performance table do not reflect the deduction of taxes that a shareholder may pay on fund distributions or the redemption of Fund shares. Returns shown for the Fund and Russell 2000 Index - Total Return include the reinvestment of all dividends, if any. Returns shown for the Russell 2000 Index - Price Return do not include the reinvestment of dividends, if any. |
| |
The Russell 2000 Index is a float-adjusted capitalization-weighted index of equity securities issued by the approximately 2,000 smallest issuers in the Russell 3000 Index. The Russell 2000 Price Index measures the performance of the small-capitalization sector of the U.S. equity market, as defined by FTSE Russell. The Russell 2000 Price Index is a subset of the Russell 3000 Index, which measures the performance of the broad U.S. equity market, as defined by FTSE Russell. |
| |
The Fund’s portfolio holdings may differ significantly from the securities held in the relevant index and, unlike an exchange-traded fund, the performance of an unmanaged index does not reflect deductions for transaction costs, taxes, management fees or other expenses. |
| |
You cannot invest directly in an index. |
| |
Premium/Discount Information: |
| |
Information regarding the differences between the price of the Fund’s shares on the secondary market and the Fund’s net asset value is available at Innovatoretfs.com/KAPR. |
INNOVATOR U.S. SMALL CAP POWER BUFFER ETF – JULY
Fund Performance |
April 30, 2023 (Unaudited) | |
The following chart compares the value of a hypothetical $10,000 investment in the Innovator U.S. Small Cap Power Buffer ETF - July from its inception (June 30, 2020) to April 30, 2023 as compared with the Russell 2000 Index - Price Return and Total Return.
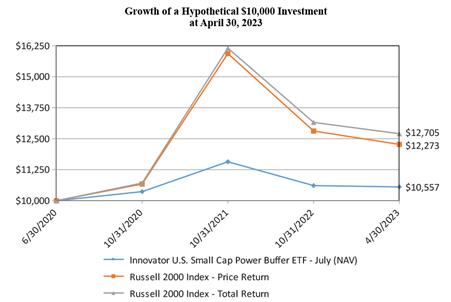
| | | Average Annual Total Returns as of April 30, 2023 | |
| | | One Year | | | Since Inception (a) | |
Innovator U.S. Small Cap Power Buffer ETF - July | | | | | | | | |
NAV Return | | | -1.21 | % | | | 1.93 | % |
Market Return | | | -0.99 | % | | | 1.90 | % |
Russell 2000 Index - Price Return | | | -5.10 | % | | | 7.50 | % |
Russell 2000 Index - Total Return | | | -3.65 | % | | | 8.82 | % |
(a) Inception date is June 30, 2020.
Performance data quoted represents past performance and does not guarantee future results. The investment return and principal value of an investment will fluctuate so that an investor’s shares, when redeemed, may be worth more or less than their original cost. Current performance of the Fund may be lower or higher than the performance quoted. As of the latest prospectus, the net expense ratio of the Fund was 0.79%. For the most recent performance, please visit the Fund’s website at innovatoretfs.com.
INNOVATOR U.S. SMALL CAP POWER BUFFER ETF – JULY
Fund Performance |
April 30, 2023 (Unaudited) (Continued) | |
The line graph and performance table do not reflect the deduction of taxes that a shareholder may pay on fund distributions or the redemption of Fund shares. Returns shown for the Fund and Russell 2000 Index - Total Return include the reinvestment of all dividends, if any. Returns shown for the Russell 2000 Index - Price Return do not include the reinvestment of dividends, if any.
The Russell 2000 Index is a float-adjusted capitalization-weighted index of equity securities issued by the approximately 2,000 smallest issuers in the Russell 3000 Index. The Russell 2000 Price Index measures the performance of the small-capitalization sector of the U.S. equity market, as defined by FTSE Russell. The Russell 2000 Price Index is a subset of the Russell 3000 Index, which measures the performance of the broad U.S. equity market, as defined by FTSE Russell.
The Fund’s portfolio holdings may differ significantly from the securities held in the relevant index and, unlike an exchange-traded fund, the performance of an unmanaged index does not reflect deductions for transaction costs, taxes, management fees or other expenses.
You cannot invest directly in an index.
Premium/Discount Information:
Information regarding the differences between the price of the Fund’s shares on the secondary market and the Fund’s net asset value is available at Innovatoretfs.com/KJUL.
INNOVATOR U.S. SMALL CAP POWER BUFFER ETF – OCTOBER
Fund Performance |
April 30, 2023 (Unaudited) |
| |
The following chart compares the value of a hypothetical $10,000 investment in the Innovator U.S. Small Cap Power Buffer ETF - October from its inception (September 30, 2019) to April 30, 2023 as compared with the Russell 2000 Index - Price Return and Total Return. |
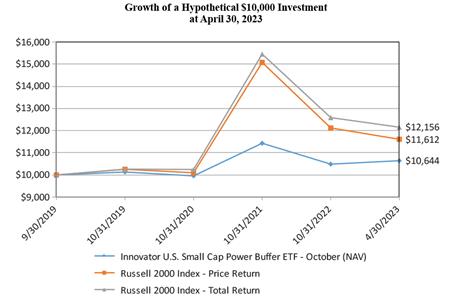
| | | Average Annual Total Returns as of April 30, 2023 | |
| | | One Year | | | Three Years | | | Since Inception (a) | |
Innovator U.S. Small Cap Power Buffer ETF - October | | | | | | | | | | | | |
NAV Return | | | 2.87 | % | | | 4.40 | % | | | 1.76 | % |
Market Return | | | 2.92 | % | | | 4.34 | % | | | 1.73 | % |
Russell 2000 Index - Price Return | | | -5.10 | % | | | 10.51 | % | | | 4.26 | % |
Russell 2000 Index - Total Return | | | -3.65 | % | | | 11.90 | % | | | 5.60 | % |
(a) Inception date is September 30, 2019. |
| |
Performance data quoted represents past performance and does not guarantee future results. The investment return and principal value of an investment will fluctuate so that an investor’s shares, when redeemed, may be worth more or less than their original cost. Current performance of the Fund may be lower or higher than the performance quoted. As of the latest prospectus, the net expense ratio of the Fund was 0.79%. For the most recent performance, please visit the Fund’s website at innovatoretfs.com. |
35
INNOVATOR U.S. SMALL CAP POWER BUFFER ETF – OCTOBER
Fund Performance |
April 30, 2023 (Unaudited) (Continued) |
| |
The line graph and performance table do not reflect the deduction of taxes that a shareholder may pay on fund distributions or the redemption of Fund shares. Returns shown for the Fund and Russell 2000 Index - Total Return include the reinvestment of all dividends, if any. Returns shown for the Russell 2000 Index - Price Return do not include the reinvestment of dividends, if any. |
| |
The Russell 2000 Index is a float-adjusted capitalization-weighted index of equity securities issued by the approximately 2,000 smallest issuers in the Russell 3000 Index. The Russell 2000 Price Index measures the performance of the small-capitalization sector of the U.S. equity market, as defined by FTSE Russell. The Russell 2000 Price Index is a subset of the Russell 3000 Index, which measures the performance of the broad U.S. equity market, as defined by FTSE Russell. |
| |
The Fund’s portfolio holdings may differ significantly from the securities held in the relevant index and, unlike an exchange-traded fund, the performance of an unmanaged index does not reflect deductions for transaction costs, taxes, management fees or other expenses. |
| |
You cannot invest directly in an index. |
| |
Premium/Discount Information: |
| |
Information regarding the differences between the price of the Fund’s shares on the secondary market and the Fund’s net asset value is available at Innovatoretfs.com/KOCT. |
INNOVATOR DOUBLE STACKER ETF – JANUARY
Fund Performance |
April 30, 2023 (Unaudited) |
The following chart compares the value of a hypothetical $10,000 investment in the Innovator Double Stacker ETF - January from its inception (December 31, 2020) to April 30, 2023 as compared with the S&P 500® Index - Total Return, S&P 500® Index - Price Return and NASDAQ-100 Index - Price Return.
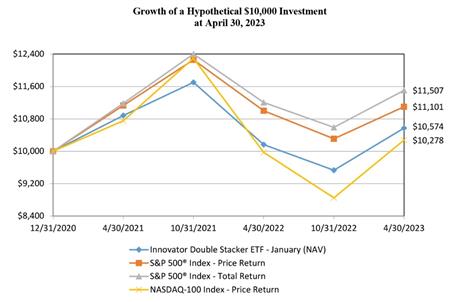
| | | Average Annual Total Returns as of April 30, 2023 | |
| | | One Year | | | Since Inception (a) | |
Innovator Double Stacker ETF - January | | | | | | | | |
NAV Return | | | 4.02 | % | | | 2.43 | % |
Market Return | | | 3.98 | % | | | 2.34 | % |
NASDAQ-100 Index - Price Return | | | 3.04 | % | | | 1.18 | % |
S&P 500® Index - Price Return | | | 0.91 | % | | | 4.59 | % |
S&P 500® Index - Total Return | | | 2.66 | % | | | 6.21 | % |
(a) Inception date is December 31, 2020. |
| |
Performance data quoted represents past performance and does not guarantee future results. The investment return and principal value of an investment will fluctuate so that an investor’s shares, when redeemed, may be worth more or less than their original cost. Current performance of the Fund may be lower or higher than the performance quoted. As of the latest prospectus, the net expense ratio of the Fund was 0.79%. For the most recent performance, please visit the Fund’s website at innovatoretfs.com. |
INNOVATOR DOUBLE STACKER ETF – JANUARY
Fund Performance |
April 30, 2023 (Unaudited) (Continued) |
The line graph and performance table do not reflect the deduction of taxes that a shareholder may pay on fund distributions or the redemption of Fund shares. Returns shown for the Fund and S&P 500® Index - Total Return include the reinvestment of all dividends, if any. Returns shown for the S&P 500® Index - Price Return and NASDAQ-100 Index - Price Return do not include the reinvestment of dividends, if any. |
| |
The S&P 500® Index is an unmanaged, capitalization-weighted index generally representative of the U.S. market for large capitalization stocks. |
| |
The NASDAQ-100 Index includes 100 of the largest domestic and international non-financial companies listed on the Nasdaq Stock Market based on market capitalization. The NASDAQ-100 Price Index reflects companies across major industry groups including computer hardware and software, telecommunications, retail/wholesale trade and biotechnologies. It does not contain securities of financial companies including investment companies. |
| |
The Fund’s portfolio holdings may differ significantly from the securities held in the relevant index and, unlike an exchange-traded fund, the performance of an unmanaged index does not reflect deductions for transaction costs, taxes, management fees or other expenses. |
| |
You cannot invest directly in an index. |
| |
Premium/Discount Information: |
| |
Information regarding the differences between the price of the Fund’s shares on the secondary market and the Fund’s net asset value is available at Innovatoretfs.com/DSJA. |
INNOVATOR DOUBLE STACKER ETF – OCTOBER
Fund Performance |
April 30, 2023 (Unaudited) |
The following chart compares the value of a hypothetical $10,000 investment in the Innovator Double Stacker ETF - October from its inception (September 30, 2020) to April 30, 2023 as compared with the S&P 500® Index - Total Return, S&P 500® Index - Price Return and NASDAQ-100 Index - Price Return. |
| |
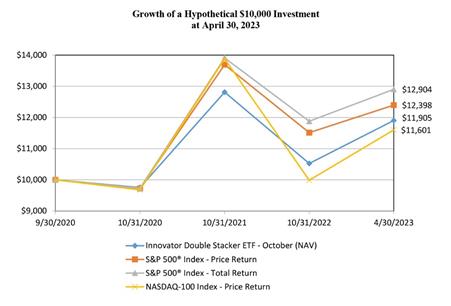
| | | Average Annual Total Returns as of April 30, 2023 | |
| | | One Year | | | Since Inception (a) | |
Innovator Double Stacker ETF - October | | | | | | | | |
NAV Return | | | 2.40 | % | | | 6.99 | % |
Market Return | | | 2.37 | % | | | 6.90 | % |
NASDAQ-100 Index - Price Return | | | 3.04 | % | | | 5.92 | % |
S&P 500® Index - Price Return | | | 0.91 | % | | | 8.69 | % |
S&P 500® Index - Total Return | | | 2.66 | % | | | 10.38 | % |
(a) Inception date is September 30, 2020. |
Performance data quoted represents past performance and does not guarantee future results. The investment return and principal value of an investment will fluctuate so that an investor’s shares, when redeemed, may be worth more or less than their original cost. Current performance of the Fund may be lower or higher than the performance quoted. As of the latest prospectus, the net expense ratio of the Fund was 0.79%. For the most recent performance, please visit the Fund’s website at innovatoretfs.com.
INNOVATOR DOUBLE STACKER ETF – OCTOBER
Fund Performance |
April 30, 2023 (Unaudited) (Continued) | |
The line graph and performance table does not reflect the deduction of taxes that a shareholder may pay on fund distributions or the redemption of Fund shares. Returns shown for the Fund and S&P 500® Index - Total Return include the reinvestment of all dividends, if any. Returns shown for the S&P 500® Index - Price Return and NASDAQ-100 Index - Price Return do not include the reinvestment of dividends, if any.
The S&P 500® Index is an unmanaged, capitalization-weighted index generally representative of the U.S. market for large capitalization stocks.
The NASDAQ-100 Index includes 100 of the largest domestic and international non-financial companies listed on the Nasdaq Stock Market based on market capitalization. The NASDAQ-100 Price Index reflects companies across major industry groups including computer hardware and software, telecommunications, retail/wholesale trade and biotechnologies. It does not contain securities of financial companies including investment companies.
The Fund’s portfolio holdings may differ significantly from the securities held in the relevant index and, unlike an exchange-traded fund, the performance of an unmanaged index does not reflect deductions for transaction costs, taxes, management fees or other expenses.
You cannot invest directly in an index.
Premium/Discount Information:
Information regarding the differences between the price of the Fund’s shares on the secondary market and the Fund’s net asset value is available at Innovatoretfs.com/DSOC.
INNOVATOR TRIPLE STACKER ETF – JANUARY
Fund Performance |
April 30, 2023 (Unaudited) |
The following chart compares the value of a hypothetical $10,000 investment in the Innovator Triple Stacker ETF - January from its inception (December 31, 2020) to April 30, 2023 as compared with the S&P 500® Index - Total Return, S&P 500® Index - Price Return, NASDAQ-100 Index - Price Return and Russell 2000 Index - Price Return.
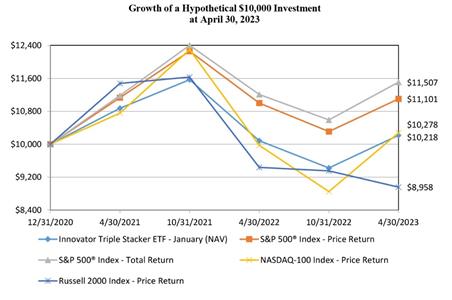
| | | Average Annual Total Returns as of April 30, 2023 | |
| | | One Year | | | Since Inception (a) | |
Innovator Triple Stacker ETF - January | | | | | | | | |
NAV Return | | | 1.32 | % | | | 0.93 | % |
Market Return | | | 1.15 | % | | | 0.83 | % |
NASDAQ-100 Index - Price Return | | | 3.04 | % | | | 1.18 | % |
Russell 2000 Index - Price Return | | | -5.10 | % | | | -4.62 | % |
S&P 500® Index - Price Return | | | 0.91 | % | | | 4.59 | % |
S&P 500® Index - Total Return | | | 2.66 | % | | | 6.21 | % |
(a) Inception date is December 31, 2020. |
| |
Performance data quoted represents past performance and does not guarantee future results. The investment return and principal value of an investment will fluctuate so that an investor’s shares, when redeemed, may be worth more or less than their original cost. Current performance of the Fund may be lower or higher than the performance quoted. As of the latest prospectus, the net expense ratio of the Fund was 0.79%. For the most recent performance, please visit the Fund’s website at innovatoretfs.com. |
INNOVATOR TRIPLE STACKER ETF – JANUARY
Fund Performance |
April 30, 2023 (Unaudited) (Continued) |
| |
The line graph and performance table do not reflect the deduction of taxes that a shareholder may pay on fund distributions or the redemption of Fund shares. Returns shown for the Fund and S&P 500® Index - Total Return include the reinvestment of all dividends, if any. Returns shown for the S&P 500® Index - Price Return, NASDAQ 100 Index - Price Return and Russell 2000 Index - Price Return do not include the reinvestment of dividends, if any. |
| |
The S&P 500® Index is an unmanaged, capitalization-weighted index generally representative of the U.S. market for large capitalization stocks. |
| |
The NASDAQ-100 Index includes 100 of the largest domestic and international non-financial companies listed on the Nasdaq Stock Market based on market capitalization. The NASDAQ-100 Price Index reflects companies across major industry groups including computer hardware and software, telecommunications, retail/wholesale trade and biotechnologies. It does not contain securities of financial companies including investment companies. |
| |
The Russell 2000 Index is a float-adjusted capitalization-weighted index of equity securities issued by the approximately 2,000 smallest issuers in the Russell 3000 Index. The Russell 2000 Price Index measures the performance of the small-capitalization sector of the U.S. equity market, as defined by FTSE Russell. The Russell 2000 Price Index is a subset of the Russell 3000 Index, which measures the performance of the broad U.S. equity market, as defined by FTSE Russell. |
| |
The Fund’s portfolio holdings may differ significantly from the securities held in the relevant index and, unlike an exchange-traded fund, the performance of an unmanaged index does not reflect deductions for transaction costs, taxes, management fees or other expenses. |
| |
You cannot invest directly in an index. |
| |
Premium/Discount Information: |
| |
Information regarding the differences between the price of the Fund’s shares on the secondary market and the Fund’s net asset value is available at Innovatoretfs.com/TSJA. |
INNOVATOR TRIPLE STACKER ETF – OCTOBER
Fund Performance |
April 30, 2023 (Unaudited) |
| |
The following chart compares the value of a hypothetical $10,000 investment in the Innovator Triple Stacker ETF - October from its inception (September 30, 2020) to April 30, 2023 as compared with the S&P 500® Index - Total Return, S&P 500® Index - Price Return, NASDAQ-100 Index - Price Return and Russell 2000 Index - Price Return. |
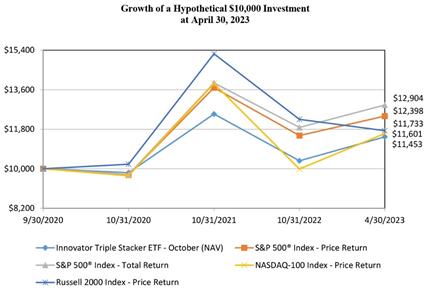
| | | Average Annual Total Returns as of April 30, 2023 | |
| | | One Year | | | Since Inception (a) | |
Innovator Triple Stacker ETF - October | | | | | | | | |
NAV Return | | | 0.83 | % | | | 5.40 | % |
Market Return | | | 0.80 | % | | | 5.30 | % |
NASDAQ-100 Index - Price Return | | | 3.04 | % | | | 5.92 | % |
Russell 2000 Index - Price Return | | | -5.10 | % | | | 6.39 | % |
S&P 500® Index - Price Return | | | 0.91 | % | | | 8.69 | % |
S&P 500® Index - Total Return | | | 2.66 | % | | | 10.38 | % |
(a) Inception date is September 30, 2020. |
| |
Performance data quoted represents past performance and does not guarantee future results. The investment return and principal value of an investment will fluctuate so that an investor’s shares, when redeemed, may be worth more or less than their original cost. Current performance of the Fund may be lower or higher than the performance quoted. As of the latest prospectus, the net expense ratio of the Fund was 0.79%. For the most recent performance, please visit the Fund’s website at innovatoretfs.com. |
INNOVATOR TRIPLE STACKER ETF – OCTOBER
Fund Performance |
April 30, 2023 (Unaudited) (Continued) | |
The line graph and performance table do not reflect the deduction of taxes that a shareholder may pay on fund distributions or the redemption of Fund shares. Returns shown for the Fund and S&P 500® Index - Total Return include the reinvestment of all dividends, if any. Returns shown for the S&P 500® Index - Price Return, NASDAQ 100 Index - Price Return and Russell 2000 Index - Price Return do not include the reinvestment of dividends, if any.
The S&P 500® Index is an unmanaged, capitalization-weighted index generally representative of the U.S. market for large capitalization stocks.
The NASDAQ-100 Index includes 100 of the largest domestic and international non-financial companies listed on the Nasdaq Stock Market based on market capitalization. The NASDAQ-100 Price Index reflects companies across major industry groups including computer hardware and software, telecommunications, retail/wholesale trade and biotechnologies. It does not contain securities of financial companies including investment companies.
The Russell 2000 Index is a float-adjusted capitalization-weighted index of equity securities issued by the approximately 2,000 smallest issuers in the Russell 3000 Index. The Russell 2000 Price Index measures the performance of the small-capitalization sector of the U.S. equity market, as defined by FTSE Russell. The Russell 2000 Price Index is a subset of the Russell 3000 Index, which measures the performance of the broad U.S. equity market, as defined by FTSE Russell.
The Fund’s portfolio holdings may differ significantly from the securities held in the relevant index and, unlike an exchange-traded fund, the performance of an unmanaged index does not reflect deductions for transaction costs, taxes, management fees or other expenses.
You cannot invest directly in an index.
Premium/Discount Information:
Information regarding the differences between the price of the Fund’s shares on the secondary market and the Fund’s net asset value is available at Innovatoretfs.com/TSOC.
INNOVATOR DOUBLE STACKER 9 BUFFER ETF – JANUARY
Fund Performance |
April 30, 2023 (Unaudited) |
The following chart compares the value of a hypothetical $10,000 investment in the Innovator Double Stacker 9 Buffer ETF - January from its inception (December 31, 2020) to April 30, 2023 as compared with the S&P 500® Index - Total Return, S&P 500® Index - Price Return and NASDAQ-100 Index - Price Return.
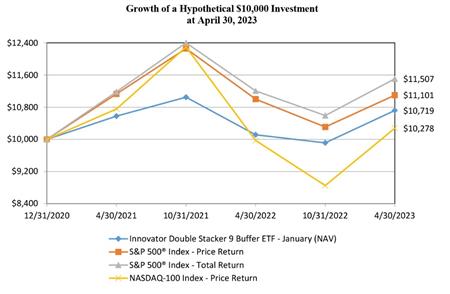
| | | Average Annual Total Returns as of April 30, 2023 | |
| | | One Year | | | Since Inception (a) | |
Innovator Double Stacker 9 Buffer ETF - January | | | | | | | | |
NAV Return | | | 5.98 | % | | | 3.03 | % |
Market Return | | | 5.97 | % | | | 2.96 | % |
NASDAQ-100 Index - Price Return | | | 3.04 | % | | | 1.18 | % |
S&P 500® Index - Price Return | | | 0.91 | % | | | 4.59 | % |
S&P 500® Index - Total Return | | | 2.66 | % | | | 6.21 | % |
(a) Inception date is December 31, 2020. |
| |
Performance data quoted represents past performance and does not guarantee future results. The investment return and principal value of an investment will fluctuate so that an investor’s shares, when redeemed, may be worth more or less than their original cost. Current performance of the Fund may be lower or higher than the performance quoted. As of the latest prospectus, the net expense ratio of the Fund was 0.79%. For the most recent performance, please visit the Fund’s website at innovatoretfs.com. |
45
INNOVATOR DOUBLE STACKER 9 BUFFER ETF – JANUARY
Fund Performance |
April 30, 2023 (Unaudited) (Continued) |
| |
The line graph and performance table do not reflect the deduction of taxes that a shareholder may pay on fund distributions or the redemption of Fund shares. Returns shown for the Fund and S&P 500® Index - Total Return include the reinvestment of all dividends, if any. Returns shown for the S&P 500® Index - Price Return and NASDAQ 100 Index - Price Return do not include the reinvestment of dividends, if any. |
| |
The S&P 500® Index is an unmanaged, capitalization-weighted index generally representative of the U.S. market for large capitalization stocks. |
| |
The NASDAQ-100 Index includes 100 of the largest domestic and international non-financial companies listed on the Nasdaq Stock Market based on market capitalization. The NASDAQ-100 Price Index reflects companies across major industry groups including computer hardware and software, telecommunications, retail/wholesale trade and biotechnologies. It does not contain securities of financial companies including investment companies. |
| |
The Fund’s portfolio holdings may differ significantly from the securities held in the relevant index and, unlike an exchange-traded fund, the performance of an unmanaged index does not reflect deductions for transaction costs, taxes, management fees or other expenses. |
| |
You cannot invest directly in an index. |
| |
Premium/Discount Information: |
| |
Information regarding the differences between the price of the Fund’s shares on the secondary market and the Fund’s net asset value is available at Innovatoretfs.com/DBJA. |
INNOVATOR DOUBLE STACKER 9 BUFFER ETF – OCTOBER
Fund Performance |
April 30, 2023 (Unaudited) |
| |
The following chart compares the value of a hypothetical $10,000 investment in the Innovator Double Stacker 9 Buffer ETF - October from its inception (September 30, 2020) to April 30, 2023 as compared with the S&P 500® Index - Total Return, S&P 500® Index - Price Return and NASDAQ-100 Index - Price Return. |

| | | Average Annual Total Returns as of April 30, 2023 | |
| | | One Year | | | Since Inception (a) | |
Innovator Double Stacker 9 Buffer ETF - October | | | | | | | | |
NAV Return | | | 6.65 | % | | | 6.67 | % |
Market Return | | | 6.57 | % | | | 6.61 | % |
NASDAQ-100 Index - Price Return | | | 3.04 | % | | | 5.92 | % |
S&P 500® Index - Price Return | | | 0.91 | % | | | 8.69 | % |
S&P 500® Index - Total Return | | | 2.66 | % | | | 10.38 | % |
(a) Inception date is September 30, 2020. |
| |
Performance data quoted represents past performance and does not guarantee future results. The investment return and principal value of an investment will fluctuate so that an investor’s shares, when redeemed, may be worth more or less than their original cost. Current performance of the Fund may be lower or higher than the performance quoted. As of the latest prospectus, the net expense ratio of the Fund was 0.79%. For the most recent performance, please visit the Fund’s website at innovatoretfs.com. |
INNOVATOR DOUBLE STACKER 9 BUFFER ETF – OCTOBER
Fund Performance |
April 30, 2023 (Unaudited) (Continued) |
The line graph and performance table do not reflect the deduction of taxes that a shareholder may pay on fund distributions or the redemption of Fund shares. Returns shown for the Fund and S&P 500® Index - Total Return include the reinvestment of all dividends, if any. Returns shown for the S&P 500® Index - Price Return and NASDAQ 100 Index - Price Return do not include the reinvestment of dividends, if any.
The S&P 500® Index is an unmanaged, capitalization-weighted index generally representative of the U.S. market for large capitalization stocks.
The NASDAQ-100 Index includes 100 of the largest domestic and international non-financial companies listed on the Nasdaq Stock Market based on market capitalization. The NASDAQ-100 Price Index reflects companies across major industry groups including computer hardware and software, telecommunications, retail/wholesale trade and biotechnologies. It does not contain securities of financial companies including investment companies.
The Fund’s portfolio holdings may differ significantly from the securities held in the relevant index and, unlike an exchange-traded fund, the performance of an unmanaged index does not reflect deductions for transaction costs, taxes, management fees or other expenses.
You cannot invest directly in an index.
Premium/Discount Information:
Information regarding the differences between the price of the Fund’s shares on the secondary market and the Fund’s net asset value is available at Innovatoretfs.com/DBOC.
INNOVATOR 20+ YEAR TREASURY BOND 9 BUFFER ETF – JULY
Fund Performance |
April 30, 2023 (Unaudited) |
The following chart compares the value of a hypothetical $10,000 investment in the Innovator 20+ Year Treasury Bond 9 Buffer ETF - July from its inception (August 17, 2020) to April 30, 2023 as compared with the ICE U.S. Treasury 20+ Year Index - Total Return.
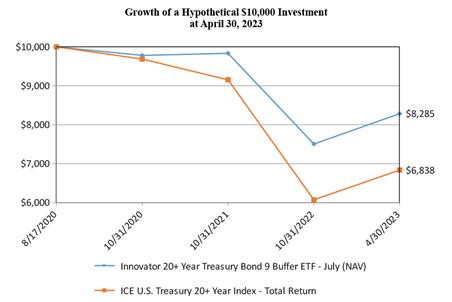
| | | Average Annual Total Returns as of April 30, 2023 | |
| | | One Year | | | Since Inception (a) | |
Innovator 20+ Year Treasury Bond 9 Buffer ETF - July | | | | | | | | |
NAV Return | | | -5.40 | % | | | -6.73 | % |
Market Return | | | -5.08 | % | | | -6.71 | % |
ICE U.S. Treasury 20+ Year Index - Total Return | | | -8.91 | % | | | -13.12 | % |
(a) Inception date is August 17, 2020.
Performance data quoted represents past performance and does not guarantee future results. The investment return and principal value of an investment will fluctuate so that an investor’s shares, when redeemed, may be worth more or less than their original cost. Current performance of the Fund may be lower or higher than the performance quoted. As of the latest prospectus, the net expense ratio of the Fund was 0.79%. For the most recent performance, please visit the Fund’s website at innovatoretfs.com.
49
INNOVATOR 20+ YEAR TREASURY BOND 9 BUFFER ETF – JULY
Fund Performance |
April 30, 2023 (Unaudited) (Continued) |
The line graph and performance table do not reflect the deduction of taxes that a shareholder may pay on fund distributions or the redemption of Fund shares. Returns shown for the Fund and ICE U.S. Treasury 20+ Year Index - Total Return include the reinvestment of all dividends, if any.
The ICE U.S. Treasury 20+ Year Bond Index is market value weighted and is designed to include U.S. dollar denominated, fixed rate U.S. Treasury market securities with minimum term to maturity greater than or equal to twenty years.
The Fund’s portfolio holdings may differ significantly from the securities held in the relevant index and, unlike an exchange-traded fund, the performance of an unmanaged index does not reflect deductions for transaction costs, taxes, management fees or other expenses.
You cannot invest directly in an index.
Premium/Discount Information:
Information regarding the differences between the price of the Fund’s shares on the secondary market and the Fund’s net asset value is available at Innovatoretfs.com/TBJL.
INNOVATOR 20+ YEAR TREASURY BOND 5 FLOOR ETF – QUARTERLY
Fund Performance |
April 30, 2023 (Unaudited) | |
The following chart compares the value of a hypothetical $10,000 investment in the Innovator 20+ Year Treasury Bond 5 Floor ETF - Quarterly from its inception (August 17, 2020) to April 30, 2023 as compared with the ICE U.S. Treasury 20+ Year Index - Total Return.
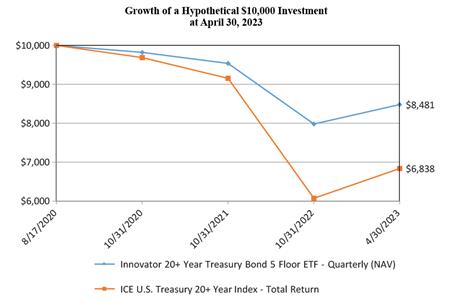
| | | Average Annual Total Returns as of April 30, 2023 | |
| | | One Year | | | Since Inception (a) | |
Innovator 20+ Year Treasury Bond 5 Floor ETF - Quarterly | | | | | | | | |
NAV Return | | | -3.41 | % | | | -5.92 | % |
Market Return | | | -3.70 | % | | | -5.98 | % |
ICE U.S. Treasury 20+ Year Index - Total Return | | | -8.91 | % | | | -13.12 | % |
(a) Inception date is August 17, 2020.
Performance data quoted represents past performance and does not guarantee future results. The investment return and principal value of an investment will fluctuate so that an investor’s shares, when redeemed, may be worth more or less than their original cost. Current performance of the Fund may be lower or higher than the performance quoted. As of the latest prospectus, the net expense ratio of the Fund was 0.79%. For the most recent performance, please visit the Fund’s website at innovatoretfs.com.
51
INNOVATOR 20+ YEAR TREASURY BOND 5 FLOOR ETF – QUARTERLY
Fund Performance |
April 30, 2023 (Unaudited) (Continued) | |
The line graph and performance table do not reflect the deduction of taxes that a shareholder may pay on fund distributions or the redemption of Fund shares. Returns shown for the Fund and ICE U.S. Treasury 20+ Year Index - Total Return include the reinvestment of all dividends, if any.
The ICE U.S. Treasury 20+ Year Bond Index is market value weighted and is designed to include U.S. dollar denominated, fixed rate U.S. Treasury market securities with minimum term to maturity greater than or equal to twenty years.
The Fund’s portfolio holdings may differ significantly from the securities held in the relevant index and, unlike an exchange-traded fund, the performance of an unmanaged index does not reflect deductions for transaction costs, taxes, management fees or other expenses.
You cannot invest directly in an index.
Premium/Discount Information:
Information regarding the differences between the price of the Fund’s shares on the secondary market and the Fund’s net asset value is available at Innovatoretfs.com/TFJL.
INNOVATOR U.S. EQUITY ACCELERATED ETF - JANUARY
Fund Performance |
April 30, 2023 (Unaudited) |
The following chart compares the value of a hypothetical $10,000 investment in the Innovator U.S. Equity Accelerated ETF - January from its inception (December 31, 2021) to April 30, 2023 as compared with the S&P 500® Index - Price Return and Total Return. |
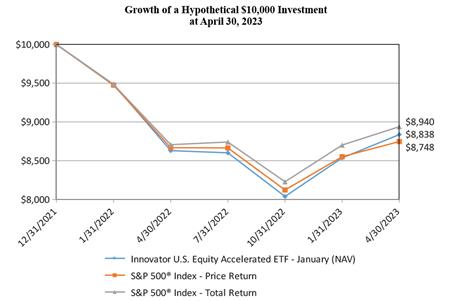
| | | Average Annual Total Returns as of April 30, 2023 | |
| | | One Year | | | Since Inception (a) | |
Innovator U.S. Equity Accelerated ETF - January | | | | | | | | |
NAV Return | | | 2.39 | % | | | -8.88 | % |
Market Return | | | 2.38 | % | | | -9.03 | % |
S&P 500® Index - Price Return | | | 0.91 | % | | | -9.58 | % |
S&P 500® Index - Total Return | | | 2.66 | % | | | -8.08 | % |
(a) Inception date is December 31, 2021. |
| |
Performance data quoted represents past performance and does not guarantee future results. The investment return and principal value of an investment will fluctuate so that an investor’s shares, when redeemed, may be worth more or less than their original cost. Current performance of the Fund may be lower or higher than the performance quoted. As of the latest prospectus, the net expense ratio of the Fund was 0.79%. For the most recent performance, please visit the Fund’s website at innovatoretfs.com. |
INNOVATOR U.S. EQUITY ACCELERATED ETF - JANUARY
Fund Performance |
April 30, 2023 (Unaudited) (Continued) | |
The line graph and performance table does not reflect the deduction of taxes that a shareholder may pay on fund distributions or the redemption of Fund shares. Returns shown for the Fund and S&P 500® Index - Total Return include the reinvestment of all dividends, if any. Returns shown for the S&P 500® Index - Price Return do not include the reinvestment of dividends, if any. |
| |
The S&P 500® Index is an unmanaged, capitalization-weighted index generally representative of the U.S. market for large capitalization stocks. |
| |
The Fund’s portfolio holdings may differ significantly from the securities held in the relevant index and, unlike an exchange-traded fund, the performance of an unmanaged index does not reflect deductions for transaction costs, taxes, management fees or other expenses. |
| |
You cannot invest directly in an index. |
| |
Premium/Discount Information: |
| |
Information regarding the differences between the price of the Fund’s shares on the secondary market and the Fund’s net asset value is available at Innovatoretfs.com/XDJA. |
INNOVATOR U.S. EQUITY ACCELERATED ETF - APRIL
Fund Performance |
April 30, 2023 (Unaudited) |
The following chart compares the value of a hypothetical $10,000 investment in the Innovator U.S. Equity Accelerated ETF - April from its inception (March 31, 2021) to April 30, 2023 as compared with the S&P 500® Index - Price Return and Total Return. |
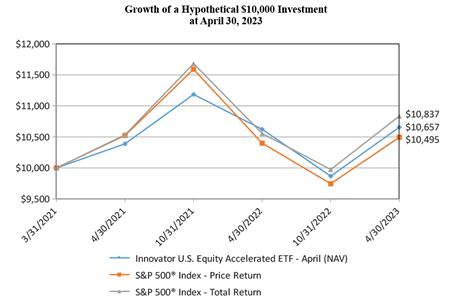
| | | Average Annual Total Returns as of April 30, 2023 | |
| | | One Year | | | Since Inception (a) | |
Innovator U.S. Equity Accelerated ETF - April | | | | | | | | |
NAV Return | | | 0.31 | % | | | 3.10 | % |
Market Return | | | 0.34 | % | | | 3.00 | % |
S&P 500® Index - Price Return | | | 0.91 | % | | | 2.35 | % |
S&P 500® Index - Total Return | | | 2.66 | % | | | 3.94 | % |
(a) Inception date is March 31, 2021. |
| |
Performance data quoted represents past performance and does not guarantee future results. The investment return and principal value of an investment will fluctuate so that an investor’s shares, when redeemed, may be worth more or less than their original cost. Current performance of the Fund may be lower or higher than the performance quoted. As of the latest prospectus, the net expense ratio of the Fund was 0.79%. For the most recent performance, please visit the Fund’s website at innovatoretfs.com. |
55
INNOVATOR U.S. EQUITY ACCELERATED ETF - APRIL
Fund Performance |
April 30, 2023 (Unaudited) (Continued) |
The line graph and performance table do not reflect the deduction of taxes that a shareholder may pay on fund distributions or the redemption of Fund shares. Returns shown for the Fund and S&P 500® Index - Total Return include the reinvestment of all dividends, if any. Returns shown for the S&P 500® Index - Price Return do not include the reinvestment of dividends, if any. |
| |
The S&P 500® Index is an unmanaged, capitalization-weighted index generally representative of the U.S. market for large capitalization stocks. |
| |
The Fund’s portfolio holdings may differ significantly from the securities held in the relevant index and, unlike an exchange-traded fund, the performance of an unmanaged index does not reflect deductions for transaction costs, taxes, management fees or other expenses. |
| |
You cannot invest directly in an index. |
| |
Premium/Discount Information: |
| |
Information regarding the differences between the price of the Fund’s shares on the secondary market and the Fund’s net asset value is available at Innovatoretfs.com/XDAP. |
INNOVATOR U.S. EQUITY ACCELERATED ETF - JULY
Fund Performance |
April 30, 2023 (Unaudited) |
The following chart compares the value of a hypothetical $10,000 investment in the Innovator U.S. Equity Accelerated ETF - July from its inception (June 30, 2021) to April 30, 2023 as compared with the S&P 500® Index - Price Return and Total Return. |
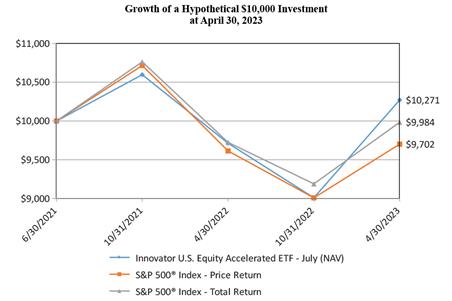
| | | Average Annual Total Returns as of April 30, 2023 | |
| | | One Year | | | Since Inception (a) | |
Innovator U.S. Equity Accelerated ETF - July | | | | | | | | |
NAV Return | | | 5.73 | % | | | 1.47 | % |
Market Return | | | 5.65 | % | | | 1.32 | % |
S&P 500® Index - Price Return | | | 0.91 | % | | | -1.64 | % |
S&P 500® Index - Total Return | | | 2.66 | % | | | -0.09 | % |
(a) Inception date is June 30, 2021. |
| |
Performance data quoted represents past performance and does not guarantee future results. The investment return and principal value of an investment will fluctuate so that an investor’s shares, when redeemed, may be worth more or less than their original cost. Current performance of the Fund may be lower or higher than the performance quoted. As of the latest prospectus, the net expense ratio of the Fund was 0.79%. For the most recent performance, please visit the Fund’s website at innovatoretfs.com. |
INNOVATOR U.S. EQUITY ACCELERATED ETF - JULY
Fund Performance |
April 30, 2023 (Unaudited) (Continued) | |
The line graph and performance table do not reflect the deduction of taxes that a shareholder may pay on fund distributions or the redemption of Fund shares. Returns shown for the Fund and S&P 500® Index - Total Return include the reinvestment of all dividends, if any. Returns shown for the S&P 500® Index - Price Return do not include the reinvestment of dividends, if any. |
| |
The S&P 500® Index is an unmanaged, capitalization-weighted index generally representative of the U.S. market for large capitalization stocks. |
| |
The Fund’s portfolio holdings may differ significantly from the securities held in the relevant index and, unlike an exchange-traded fund, the performance of an unmanaged index does not reflect deductions for transaction costs, taxes, management fees or other expenses. |
| |
You cannot invest directly in an index. |
| |
Premium/Discount Information: |
| |
Information regarding the differences between the price of the Fund’s shares on the secondary market and the Fund’s net asset value is available at Innovatoretfs.com/XDJL. |
INNOVATOR U.S. EQUITY ACCELERATED ETF - OCTOBER
Fund Performance |
April 30, 2023 (Unaudited) | |
The following chart compares the value of a hypothetical $10,000 investment in the Innovator U.S. Equity Accelerated ETF - October from its inception (September 30, 2021) to April 30, 2023 as compared with the S&P 500® Index - Price Return and Total Return.
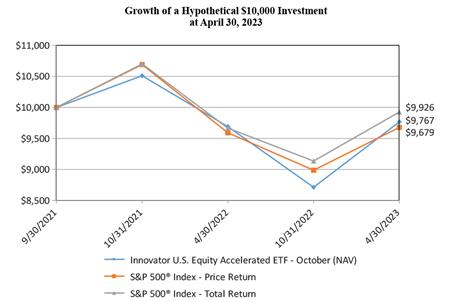
| | | Average Annual Total Returns as of April 30, 2023 | |
| | | One Year | | | Since Inception (a) | |
Innovator U.S. Equity Accelerated ETF - October | | | | | | | | |
NAV Return | | | 0.78 | % | | | -1.48 | % |
Market Return | | | 0.61 | % | | | -1.59 | % |
S&P 500® Index - Price Return | | | 0.91 | % | | | -2.04 | % |
S&P 500® Index - Total Return | | | 2.66 | % | | | -0.47 | % |
(a) Inception date is September 30, 2021. |
| |
Performance data quoted represents past performance and does not guarantee future results. The investment return and principal value of an investment will fluctuate so that an investor’s shares, when redeemed, may be worth more or less than their original cost. Current performance of the Fund may be lower or higher than the performance quoted. As of the latest prospectus, the net expense ratio of the Fund was 0.79%. For the most recent performance, please visit the Fund’s website at innovatoretfs.com. |
INNOVATOR U.S. EQUITY ACCELERATED ETF - OCTOBER
Fund Performance |
April 30, 2023 (Unaudited) (Continued) |
The line graph and performance table does not reflect the deduction of taxes that a shareholder may pay on fund distributions or the redemption of Fund shares. Returns shown for the Fund and S&P 500® Index - Total Return include the reinvestment of all dividends, if any. Returns shown for the S&P 500® Index - Price Return do not include the reinvestment of dividends, if any. |
| |
The S&P 500® Index is an unmanaged, capitalization-weighted index generally representative of the U.S. market for large capitalization stocks. |
| |
The Fund’s portfolio holdings may differ significantly from the securities held in the relevant index and, unlike an exchange-traded fund, the performance of an unmanaged index does not reflect deductions for transaction costs, taxes, management fees or other expenses. |
| |
You cannot invest directly in an index. |
| |
Premium/Discount Information: |
| |
Information regarding the differences between the price of the Fund’s shares on the secondary market and the Fund’s net asset value is available at Innovatoretfs.com/XDOC. |
INNOVATOR U.S. EQUITY ACCELERATED PLUS ETF - JANUARY
Fund Performance |
April 30, 2023 (Unaudited) |
The following chart compares the value of a hypothetical $10,000 investment in the Innovator U.S. Equity Accelerated Plus ETF - January from its inception (December 31, 2021) to April 30, 2023 as compared with the S&P 500® Index - Price Return and Total Return. |
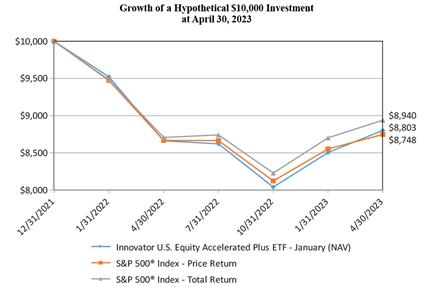
| | | Average Annual Total Returns as of April 30, 2023 | |
| | | One Year | | | Since Inception (a) | |
Innovator U.S. Equity Accelerated Plus ETF - January | | | | | | | | |
NAV Return | | | 1.62 | % | | | -9.15 | % |
Market Return | | | 1.64 | % | | | -9.27 | % |
S&P 500® Index - Price Return | | | 0.91 | % | | | -9.58 | % |
S&P 500® Index - Total Return | | | 2.66 | % | | | -8.08 | % |
(a) Inception date is December 31, 2021. |
| |
Performance data quoted represents past performance and does not guarantee future results. The investment return and principal value of an investment will fluctuate so that an investor’s shares, when redeemed, may be worth more or less than their original cost. Current performance of the Fund may be lower or higher than the performance quoted. As of the latest prospectus, the net expense ratio of the Fund was 0.79%. For the most recent performance, please visit the Fund’s website at innovatoretfs.com. |
INNOVATOR U.S. EQUITY ACCELERATED PLUS ETF - JANUARY
Fund Performance |
April 30, 2023 (Unaudited) (Continued) |
The line graph and performance table does not reflect the deduction of taxes that a shareholder may pay on fund distributions or the redemption of Fund shares. Returns shown for the Fund and S&P 500® Index - Total Return include the reinvestment of all dividends, if any. Returns shown for the S&P 500® Index - Price Return do not include the reinvestment of dividends, if any. |
| |
The S&P 500® Index is an unmanaged, capitalization-weighted index generally representative of the U.S. market for large capitalization stocks. |
| |
The Fund’s portfolio holdings may differ significantly from the securities held in the relevant index and, unlike an exchange-traded fund, the performance of an unmanaged index does not reflect deductions for transaction costs, taxes, management fees or other expenses. |
| |
You cannot invest directly in an index. |
| |
Premium/Discount Information: |
| |
Information regarding the differences between the price of the Fund’s shares on the secondary market and the Fund’s net asset value is available at Innovatoretfs.com/XTJA. |
INNOVATOR U.S. EQUITY ACCELERATED PLUS ETF - APRIL
Fund Performance |
April 30, 2023 (Unaudited) | |
The following chart compares the value of a hypothetical $10,000 investment in the Innovator U.S. Equity Accelerated Plus ETF - April from its inception (March 31, 2021) to April 30, 2023 as compared with the S&P 500® Index - Price Return and Total Return. |
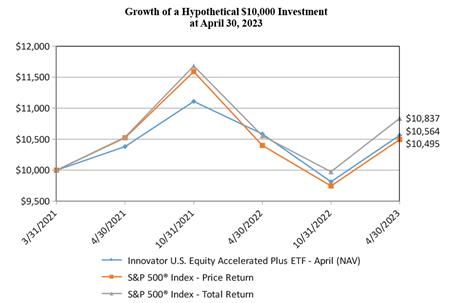
| | | Average Annual Total Returns as of April 30, 2023 | |
| | | One Year | | | Since Inception (a) | |
Innovator U.S. Equity Accelerated Plus ETF - April | | | | | | | | |
NAV Return | | | -0.20 | % | | | 2.67 | % |
Market Return | | | -0.20 | % | | | 2.55 | % |
S&P 500® Index - Price Return | | | 0.91 | % | | | 2.35 | % |
S&P 500® Index - Total Return | | | 2.66 | % | | | 3.94 | % |
(a) Inception date is March 31, 2021. |
| |
Performance data quoted represents past performance and does not guarantee future results. The investment return and principal value of an investment will fluctuate so that an investor’s shares, when redeemed, may be worth more or less than their original cost. Current performance of the Fund may be lower or higher than the performance quoted. As of the latest prospectus, the net expense ratio of the Fund was 0.79%. For the most recent performance, please visit the Fund’s website at innovatoretfs.com. |
INNOVATOR U.S. EQUITY ACCELERATED PLUS ETF - APRIL
Fund Performance |
April 30, 2023 (Unaudited) (Continued) |
The line graph and performance table do not reflect the deduction of taxes that a shareholder may pay on fund distributions or the redemption of Fund shares. Returns shown for the Fund and S&P 500® Index - Total Return include the reinvestment of all dividends, if any. Returns shown for the S&P 500® Index - Price Return do not include the reinvestment of dividends, if any. |
| |
The S&P 500® Index is an unmanaged, capitalization-weighted index generally representative of the U.S. market for large capitalization stocks. |
| |
The Fund’s portfolio holdings may differ significantly from the securities held in the relevant index and, unlike an exchange-traded fund, the performance of an unmanaged index does not reflect deductions for transaction costs, taxes, management fees or other expenses. |
| |
You cannot invest directly in an index. |
| |
Premium/Discount Information: |
| |
Information regarding the differences between the price of the Fund’s shares on the secondary market and the Fund’s net asset value is available at Innovatoretfs.com/XTAP. |
INNOVATOR U.S. EQUITY ACCELERATED PLUS ETF - JULY
Fund Performance |
April 30, 2023 (Unaudited) | |
The following chart compares the value of a hypothetical $10,000 investment in the Innovator U.S. Equity Accelerated Plus ETF - July from its inception (June 30, 2021) to April 30, 2023 as compared with the S&P 500® Index - Price Return and Total Return. |
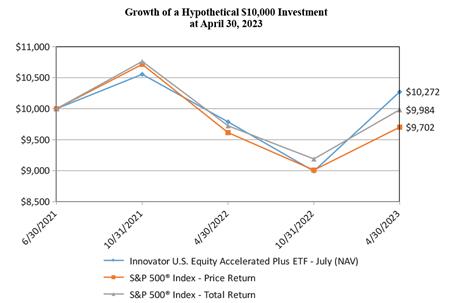
| | | Average Annual Total Returns as of April 30, 2023 | |
| | | One Year | | | Since Inception (a) | |
Innovator U.S. Equity Accelerated Plus ETF - July | | | | | | | | |
NAV Return | | | 4.93 | % | | | 1.47 | % |
Market Return | | | 4.76 | % | | | 1.39 | % |
S&P 500® Index - Price Return | | | 0.91 | % | | | -1.64 | % |
S&P 500® Index - Total Return | | | 2.66 | % | | | -0.09 | % |
(a) Inception date is June 30, 2021. |
| |
Performance data quoted represents past performance and does not guarantee future results. The investment return and principal value of an investment will fluctuate so that an investor’s shares, when redeemed, may be worth more or less than their original cost. Current performance of the Fund may be lower or higher than the performance quoted. As of the latest prospectus, the net expense ratio of the Fund was 0.79%. For the most recent performance, please visit the Fund’s website at innovatoretfs.com. |
INNOVATOR U.S. EQUITY ACCELERATED PLUS ETF - JULY
Fund Performance |
April 30, 2023 (Unaudited) (Continued) |
The line graph and performance table do not reflect the deduction of taxes that a shareholder may pay on fund distributions or the redemption of Fund shares. Returns shown for the Fund and S&P 500® Index - Total Return include the reinvestment of all dividends, if any. Returns shown for the S&P 500® Index - Price Return do not include the reinvestment of dividends, if any. |
| |
The S&P 500® Index is an unmanaged, capitalization-weighted index generally representative of the U.S. market for large capitalization stocks. |
| |
The Fund’s portfolio holdings may differ significantly from the securities held in the relevant index and, unlike an exchange-traded fund, the performance of an unmanaged index does not reflect deductions for transaction costs, taxes, management fees or other expenses. |
| |
You cannot invest directly in an index. |
| |
Premium/Discount Information: |
| |
Information regarding the differences between the price of the Fund’s shares on the secondary market and the Fund’s net asset value is available at Innovatoretfs.com/XTJL. |
INNOVATOR U.S. EQUITY ACCELERATED PLUS ETF - OCTOBER
Fund Performance |
April 30, 2023 (Unaudited) |
The following chart compares the value of a hypothetical $10,000 investment in the Innovator U.S. Equity Accelerated Plus ETF - October from its inception (September 30, 2021) to April 30, 2023 as compared with the S&P 500® Index - Price Return and Total Return.
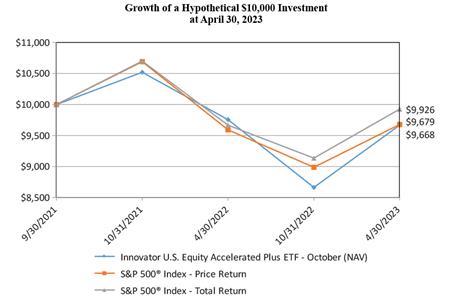
| | | Average Annual Total Returns as of April 30, 2023 | |
| | | One Year | | | Since Inception (a) | |
Innovator U.S. Equity Accelerated Plus ETF - October | | | | | | | | |
NAV Return | | | -0.90 | % | | | -2.11 | % |
Market Return | | | -0.97 | % | | | -2.23 | % |
S&P 500® Index - Price Return | | | 0.91 | % | | | -2.04 | % |
S&P 500® Index - Total Return | | | 2.66 | % | | | -0.47 | % |
(a) Inception date is September 30, 2021. |
| |
Performance data quoted represents past performance and does not guarantee future results. The investment return and principal value of an investment will fluctuate so that an investor’s shares, when redeemed, may be worth more or less than their original cost. Current performance of the Fund may be lower or higher than the performance quoted. As of the latest prospectus, the net expense ratio of the Fund was 0.79%. For the most recent performance, please visit the Fund’s website at innovatoretfs.com. |
INNOVATOR U.S. EQUITY ACCELERATED PLUS ETF - OCTOBER
Fund Performance |
April 30, 2023 (Unaudited) (Continued) |
The line graph and performance table does not reflect the deduction of taxes that a shareholder may pay on fund distributions or the redemption of Fund shares. Returns shown for the Fund and S&P 500® Index - Total Return include the reinvestment of all dividends, if any. Returns shown for the S&P 500® Index - Price Return do not include the reinvestment of dividends, if any. |
| |
The S&P 500® Index is an unmanaged, capitalization-weighted index generally representative of the U.S. market for large capitalization stocks. |
| |
The Fund’s portfolio holdings may differ significantly from the securities held in the relevant index and, unlike an exchange-traded fund, the performance of an unmanaged index does not reflect deductions for transaction costs, taxes, management fees or other expenses. |
| |
You cannot invest directly in an index. |
| |
Premium/Discount Information: |
| |
Information regarding the differences between the price of the Fund’s shares on the secondary market and the Fund’s net asset value is available at Innovatoretfs.com/XTOC. |
INNOVATOR U.S. EQUITY ACCELERATED 9 BUFFER ETF - JANUARY
Fund Performance |
April 30, 2023 (Unaudited) |
The following chart compares the value of a hypothetical $10,000 investment in the Innovator U.S. Equity Accelerated 9 Buffer ETF - January from its inception (December 31, 2021) to April 30, 2023 as compared with the S&P 500® Index - Price Return and Total Return. |
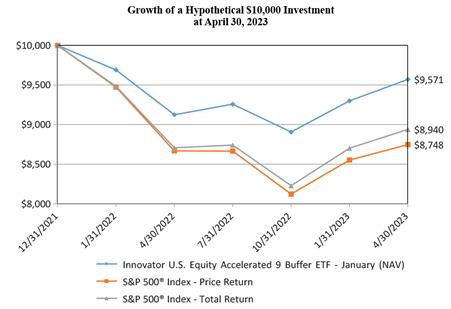
| | | Average Annual Total Returns as of April 30, 2023 | |
| | | One Year | | | Since Inception (a) | |
Innovator U.S. Equity Accelerated 9 Buffer ETF - January | | | | | | | | |
NAV Return | | | 4.88 | % | | | -3.25 | % |
Market Return | | | 4.86 | % | | | -3.29 | % |
S&P 500® Index - Price Return | | | 0.91 | % | | | -9.58 | % |
S&P 500® Index - Total Return | | | 2.66 | % | | | -8.08 | % |
(a) Inception date is December 31, 2021. |
| |
Performance data quoted represents past performance and does not guarantee future results. The investment return and principal value of an investment will fluctuate so that an investor’s shares, when redeemed, may be worth more or less than their original cost. Current performance of the Fund may be lower or higher than the performance quoted. As of the latest prospectus, the net expense ratio of the Fund was 0.79%. For the most recent performance, please visit the Fund’s website at innovatoretfs.com. |
INNOVATOR U.S. EQUITY ACCELERATED 9 BUFFER ETF - JANUARY
Fund Performance |
April 30, 2023 (Unaudited) (Continued) |
The line graph and performance table does not reflect the deduction of taxes that a shareholder may pay on fund distributions or the redemption of Fund shares. Returns shown for the Fund and S&P 500® Index - Total Return include the reinvestment of all dividends, if any. Returns shown for the S&P 500® Index - Price Return do not include the reinvestment of dividends, if any. |
| |
The S&P 500® Index is an unmanaged, capitalization-weighted index generally representative of the U.S. market for large capitalization stocks. |
| |
The Fund’s portfolio holdings may differ significantly from the securities held in the relevant index and, unlike an exchange-traded fund, the performance of an unmanaged index does not reflect deductions for transaction costs, taxes, management fees or other expenses. |
| |
You cannot invest directly in an index. |
| |
Premium/Discount Information: |
| |
Information regarding the differences between the price of the Fund’s shares on the secondary market and the Fund’s net asset value is available at Innovatoretfs.com/XBJA. |
INNOVATOR U.S. EQUITY ACCELERATED 9 BUFFER ETF - APRIL
Fund Performance |
April 30, 2023 (Unaudited) |
The following chart compares the value of a hypothetical $10,000 investment in the Innovator U.S. Equity Accelerated 9 Buffer ETF - April from its inception (March 31, 2021) to April 30, 2023 as compared with the S&P 500® Index - Price Return and Total Return. |
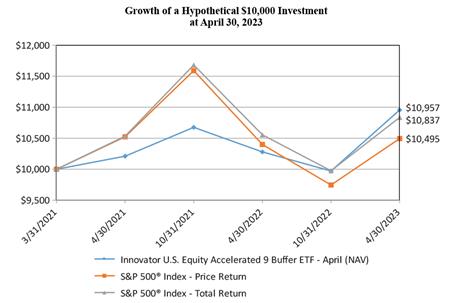
| | | Average Annual Total Returns as of April 30, 2023 | |
| | | One Year | | | Since Inception (a) | |
Innovator U.S. Equity Accelerated 9 Buffer ETF - April | | | | | | | | |
NAV Return | | | 6.59 | % | | | 4.49 | % |
Market Return | | | 6.59 | % | | | 4.53 | % |
S&P 500® Index - Price Return | | | 0.91 | % | | | 2.35 | % |
S&P 500® Index - Total Return | | | 2.66 | % | | | 3.94 | % |
(a) Inception date is March 31, 2021. |
| |
Performance data quoted represents past performance and does not guarantee future results. The investment return and principal value of an investment will fluctuate so that an investor’s shares, when redeemed, may be worth more or less than their original cost. Current performance of the Fund may be lower or higher than the performance quoted. As of the latest prospectus, the net expense ratio of the Fund was 0.79%. For the most recent performance, please visit the Fund’s website at innovatoretfs.com. |
INNOVATOR U.S. EQUITY ACCELERATED 9 BUFFER ETF - APRIL
Fund Performance |
April 30, 2023 (Unaudited) (Continued) | |
The line graph and performance table do not reflect the deduction of taxes that a shareholder may pay on fund distributions or the redemption of Fund shares. Returns shown for the Fund and S&P 500® Index - Total Return include the reinvestment of all dividends, if any. Returns shown for the S&P 500® Index - Price Return do not include the reinvestment of dividends, if any. |
| |
The S&P 500® Index is an unmanaged, capitalization-weighted index generally representative of the U.S. market for large capitalization stocks. |
| |
The Fund’s portfolio holdings may differ significantly from the securities held in the relevant index and, unlike an exchange-traded fund, the performance of an unmanaged index does not reflect deductions for transaction costs, taxes, management fees or other expenses. |
| |
You cannot invest directly in an index. |
| |
Premium/Discount Information: |
| |
Information regarding the differences between the price of the Fund’s shares on the secondary market and the Fund’s net asset value is available at Innovatoretfs.com/XBAP. |
INNOVATOR U.S. EQUITY ACCELERATED 9 BUFFER ETF - JULY
Fund Performance |
April 30, 2023 (Unaudited) |
The following chart compares the value of a hypothetical $10,000 investment in the Innovator U.S. Equity Accelerated 9 Buffer ETF - July from its inception (June 30, 2021) to April 30, 2023 as compared with the S&P 500® Index - Price Return and Total Return. |
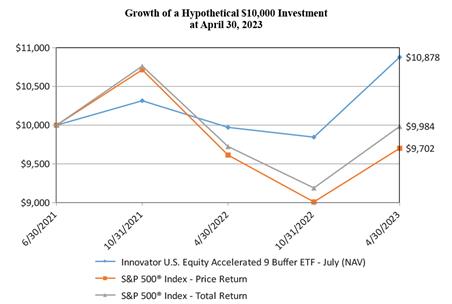
| | | Average Annual Total Returns as of April 30, 2023 | |
| | | One Year | | | Since Inception (a) | |
Innovator U.S. Equity Accelerated 9 Buffer ETF - July | | | | | | | | |
NAV Return | | | 9.08 | % | | | 4.70 | % |
Market Return | | | 9.07 | % | | | 4.63 | % |
S&P 500® Index - Price Return | | | 0.91 | % | | | -1.64 | % |
S&P 500® Index - Total Return | | | 2.66 | % | | | -0.09 | % |
(a) Inception date is June 30, 2021. |
| |
Performance data quoted represents past performance and does not guarantee future results. The investment return and principal value of an investment will fluctuate so that an investor’s shares, when redeemed, may be worth more or less than their original cost. Current performance of the Fund may be lower or higher than the performance quoted. As of the latest prospectus, the net expense ratio of the Fund was 0.79%. For the most recent performance, please visit the Fund’s website at innovatoretfs.com. |
INNOVATOR U.S. EQUITY ACCELERATED 9 BUFFER ETF - JULY
Fund Performance |
April 30, 2023 (Unaudited) (Continued) |
The line graph and performance table do not reflect the deduction of taxes that a shareholder may pay on fund distributions or the redemption of Fund shares. Returns shown for the Fund and S&P 500® Index - Total Return include the reinvestment of all dividends, if any. Returns shown for the S&P 500® Index - Price Return do not include the reinvestment of dividends, if any. |
| |
The S&P 500® Index is an unmanaged, capitalization-weighted index generally representative of the U.S. market for large capitalization stocks. |
| |
The Fund’s portfolio holdings may differ significantly from the securities held in the relevant index and, unlike an exchange-traded fund, the performance of an unmanaged index does not reflect deductions for transaction costs, taxes, management fees or other expenses. |
| |
You cannot invest directly in an index. |
| |
Premium/Discount Information: |
| |
Information regarding the differences between the price of the Fund’s shares on the secondary market and the Fund’s net asset value is available at Innovatoretfs.com/XBJL. |
INNOVATOR U.S. EQUITY ACCELERATED 9 BUFFER ETF - OCTOBER
Fund Performance |
April 30, 2023 (Unaudited) |
The following chart compares the value of a hypothetical $10,000 investment in the Innovator U.S. Equity Accelerated 9 Buffer ETF - October from its inception (September 30, 2021) to April 30, 2023 as compared with the S&P 500® Index - Price Return and Total Return.
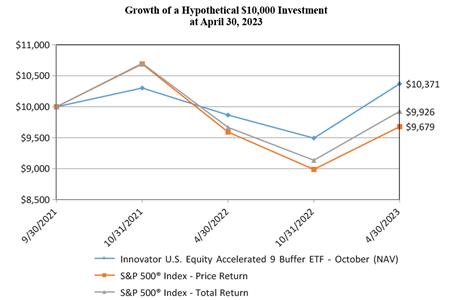
| | | Average Annual Total Returns as of April 30, 2023 | |
| | | One Year | | | Since Inception (a) | |
Innovator U.S. Equity Accelerated 9 Buffer ETF - October | | | | | | | | |
NAV Return | | | 5.11 | % | | | 2.33 | % |
Market Return | | | 4.98 | % | | | 2.20 | % |
S&P 500® Index - Price Return | | | 0.91 | % | | | -2.04 | % |
S&P 500® Index - Total Return | | | 2.66 | % | | | -0.47 | % |
(a) Inception date is September 30, 2021. |
| |
Performance data quoted represents past performance and does not guarantee future results. The investment return and principal value of an investment will fluctuate so that an investor’s shares, when redeemed, may be worth more or less than their original cost. Current performance of the Fund may be lower or higher than the performance quoted. As of the latest prospectus, the net expense ratio of the Fund was 0.79%. For the most recent performance, please visit the Fund’s website at innovatoretfs.com. |
INNOVATOR U.S. EQUITY ACCELERATED 9 BUFFER ETF - OCTOBER
Fund Performance |
April 30, 2023 (Unaudited) (Continued) |
The line graph and performance table does not reflect the deduction of taxes that a shareholder may pay on fund distributions or the redemption of Fund shares. Returns shown for the Fund and S&P 500® Index - Total Return include the reinvestment of all dividends, if any. Returns shown for the S&P 500® Index - Price Return do not include the reinvestment of dividends, if any. |
| |
The S&P 500® Index is an unmanaged, capitalization-weighted index generally representative of the U.S. market for large capitalization stocks. |
| |
The Fund’s portfolio holdings may differ significantly from the securities held in the relevant index and, unlike an exchange-traded fund, the performance of an unmanaged index does not reflect deductions for transaction costs, taxes, management fees or other expenses. |
| |
You cannot invest directly in an index. |
| |
Premium/Discount Information: |
| |
Information regarding the differences between the price of the Fund’s shares on the secondary market and the Fund’s net asset value is available at Innovatoretfs.com/XBOC. |
INNOVATOR GROWTH ACCELERATED PLUS ETF - JANUARY
Fund Performance |
April 30, 2023 (Unaudited) |
The following chart compares the value of a hypothetical $10,000 investment in the Innovator Growth Accelerated Plus ETF - January from its inception (December 31, 2021) to April 30, 2023 as compared with the NASDAQ-100 Index - Price Return and Total Return. |
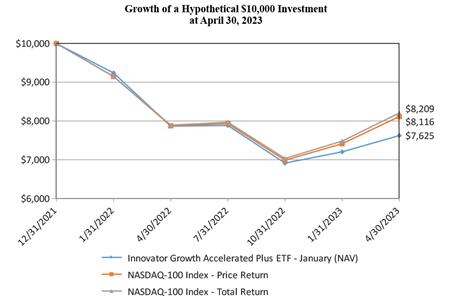
| | | Average Annual Total Returns as of April 30, 2023 | |
| | | One Year | | | Since Inception (a) | |
Innovator Growth Accelerated Plus ETF - January | | | | | | | | |
NAV Return | | | -3.09 | % | | | -18.46 | % |
Market Return | | | -3.02 | % | | | -18.54 | % |
NASDAQ-100 Index - Price Return | | | 3.04 | % | | | -14.54 | % |
NASDAQ-100 Index - Total Return | | | 3.99 | % | | | -13.80 | % |
(a) Inception date is December 31, 2021. |
| |
Performance data quoted represents past performance and does not guarantee future results. The investment return and principal value of an investment will fluctuate so that an investor’s shares, when redeemed, may be worth more or less than their original cost. Current performance of the Fund may be lower or higher than the performance quoted. As of the latest prospectus, the net expense ratio of the Fund was 0.79%. For the most recent performance, please visit the Fund’s website at innovatoretfs.com. |
INNOVATOR GROWTH ACCELERATED PLUS ETF - JANUARY
Fund Performance |
April 30, 2023 (Unaudited) (Continued) |
The line graph and performance table does not reflect the deduction of taxes that a shareholder may pay on fund distributions or the redemption of Fund shares. Returns shown for the Fund and NASDAQ-100 Index - Total Return include the reinvestment of all dividends, if any. Returns shown for the NASDAQ-100 Index - Price Return do not include the reinvestment of dividends, if any. |
| |
The NASDAQ-100 Index includes 100 of the largest domestic and international non-financial companies listed on the Nasdaq Stock Market based on market capitalization. The NASDAQ-100 Price Index reflects companies across major industry groups including computer hardware and software, telecommunications, retail/wholesale trade and biotechnologies. It does not contain securities of financial companies including investment companies. |
| |
The Fund’s portfolio holdings may differ significantly from the securities held in the relevant index and, unlike an exchange-traded fund, the performance of an unmanaged index does not reflect deductions for transaction costs, taxes, management fees or other expenses. |
| |
You cannot invest directly in an index. |
| |
Premium/Discount Information: |
| |
Information regarding the differences between the price of the Fund’s shares on the secondary market and the Fund’s net asset value is available at Innovatoretfs.com/QTJA. |
INNOVATOR GROWTH ACCELERATED PLUS ETF - APRIL
Fund Performance |
April 30, 2023 (Unaudited) |
The following chart compares the value of a hypothetical $10,000 investment in the Innovator Growth Accelerated Plus ETF - April from its inception (March 31, 2021) to April 30, 2023 as compared with the NASDAQ-100 Index - Price Return and Total Return. |
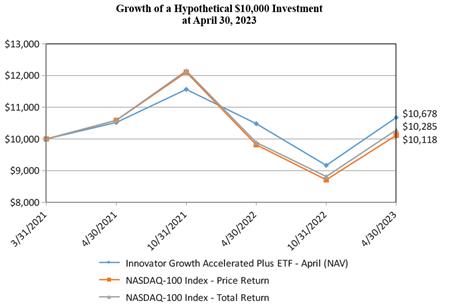
| | | Average Annual Total Returns as of April 30, 2023 | |
| | | One Year | | | Since Inception (a) | |
Innovator Growth Accelerated Plus ETF - April | | | | | | | | |
NAV Return | | | 1.85 | % | | | 3.20 | % |
Market Return | | | 1.90 | % | | | 3.09 | % |
NASDAQ-100 Index - Price Return | | | 3.04 | % | | | 0.57 | % |
NASDAQ-100 Index - Total Return | | | 3.99 | % | | | 1.36 | % |
(a) Inception date is March 31, 2021. |
| |
Performance data quoted represents past performance and does not guarantee future results. The investment return and principal value of an investment will fluctuate so that an investor’s shares, when redeemed, may be worth more or less than their original cost. Current performance of the Fund may be lower or higher than the performance quoted. As of the latest prospectus, the net expense ratio of the Fund was 0.79%. For the most recent performance, please visit the Fund’s website at innovatoretfs.com. |
INNOVATOR GROWTH ACCELERATED PLUS ETF - APRIL
Fund Performance |
April 30, 2023 (Unaudited) (Continued) |
The line graph and performance table do not reflect the deduction of taxes that a shareholder may pay on fund distributions or the redemption of Fund shares. Returns shown for the Fund and NASDAQ-100 Index - Total Return include the reinvestment of all dividends, if any. Returns shown for the NASDAQ-100 Index - Price Return do not include the reinvestment of dividends, if any. |
| |
The NASDAQ-100 Index includes 100 of the largest domestic and international non-financial companies listed on the Nasdaq Stock Market based on market capitalization. The NASDAQ-100 Price Index reflects companies across major industry groups including computer hardware and software, telecommunications, retail/wholesale trade and biotechnologies. It does not contain securities of financial companies including investment companies. |
| |
The Fund’s portfolio holdings may differ significantly from the securities held in the relevant index and, unlike an exchange-traded fund, the performance of an unmanaged index does not reflect deductions for transaction costs, taxes, management fees or other expenses. |
| |
You cannot invest directly in an index. |
| |
Premium/Discount Information: |
| |
Information regarding the differences between the price of the Fund’s shares on the secondary market and the Fund’s net asset value is available at Innovatoretfs.com/QTAP. |
INNOVATOR GROWTH ACCELERATED PLUS ETF - JULY
Fund Performance |
April 30, 2023 (Unaudited) |
The following chart compares the value of a hypothetical $10,000 investment in the Innovator Growth Accelerated Plus ETF - July from its inception (June 30, 2021) to April 30, 2023 as compared with the NASDAQ-100 Index - Price Return and Total Return. |
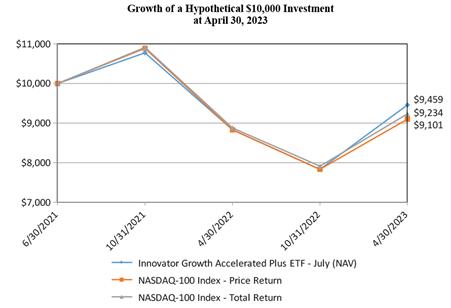
| | | Average Annual Total Returns as of April 30, 2023 | |
| | | One Year | | | Since Inception (a) | |
Innovator Growth Accelerated Plus ETF - July | | | | | | | | |
NAV Return | | | 7.09 | % | | | -2.99 | % |
Market Return | | | 6.87 | % | | | -3.09 | % |
NASDAQ-100 Index - Price Return | | | 3.04 | % | | | -5.01 | % |
NASDAQ-100 Index - Total Return | | | 3.99 | % | | | -4.25 | % |
(a) Inception date is June 30, 2021. |
| |
Performance data quoted represents past performance and does not guarantee future results. The investment return and principal value of an investment will fluctuate so that an investor’s shares, when redeemed, may be worth more or less than their original cost. Current performance of the Fund may be lower or higher than the performance quoted. As of the latest prospectus, the net expense ratio of the Fund was 0.79%. For the most recent performance, please visit the Fund’s website at innovatoretfs.com. |
INNOVATOR GROWTH ACCELERATED PLUS ETF - JULY
Fund Performance |
April 30, 2023 (Unaudited) (Continued) | | |
The line graph and performance table do not reflect the deduction of taxes that a shareholder may pay on fund distributions or the redemption of Fund shares. Returns shown for the Fund and NASDAQ-100 Index - Total Return include the reinvestment of all dividends, if any. Returns shown for the NASDAQ-100 Index - Price Return do not include the reinvestment of dividends, if any. |
| |
The NASDAQ-100 Index includes 100 of the largest domestic and international non-financial companies listed on the Nasdaq Stock Market based on market capitalization. The NASDAQ-100 Price Index reflects companies across major industry groups including computer hardware and software, telecommunications, retail/wholesale trade and biotechnologies. It does not contain securities of financial companies including investment companies. |
| |
The Fund’s portfolio holdings may differ significantly from the securities held in the relevant index and, unlike an exchange-traded fund, the performance of an unmanaged index does not reflect deductions for transaction costs, taxes, management fees or other expenses. |
| |
You cannot invest directly in an index. |
| |
Premium/Discount Information: |
| |
Information regarding the differences between the price of the Fund’s shares on the secondary market and the Fund’s net asset value is available at Innovatoretfs.com/QTJL. |
INNOVATOR GROWTH ACCELERATED PLUS ETF - OCTOBER
Fund Performance |
April 30, 2023 (Unaudited) |
The following chart compares the value of a hypothetical $10,000 investment in the Innovator Growth Accelerated Plus ETF - October from its inception (September 30, 2021) to April 30, 2023 as compared with the NASDAQ-100 Index - Price Return and Total Return.
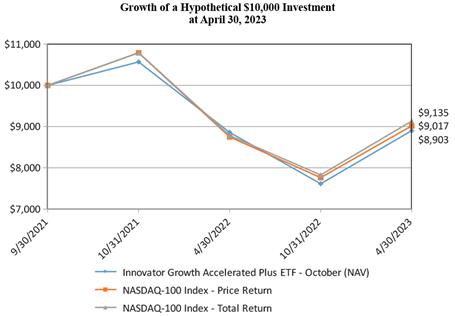
| | | Average Annual Total Returns as of April 30, 2023 | |
| | | One Year | | | Since Inception (a) | |
Innovator Growth Accelerated Plus ETF - October | | | | | | | | |
NAV Return | | | 0.48 | % | | | -7.09 | % |
Market Return | | | 0.53 | % | | | -7.22 | % |
NASDAQ-100 Index - Price Return | | | 3.04 | % | | | -6.33 | % |
NASDAQ-100 Index - Total Return | | | 3.99 | % | | | -5.57 | % |
(a) Inception date is September 30, 2021. |
| |
Performance data quoted represents past performance and does not guarantee future results. The investment return and principal value of an investment will fluctuate so that an investor’s shares, when redeemed, may be worth more or less than their original cost. Current performance of the Fund may be lower or higher than the performance quoted. As of the latest prospectus, the net expense ratio of the Fund was 0.79%. For the most recent performance, please visit the Fund’s website at innovatoretfs.com. |
INNOVATOR GROWTH ACCELERATED PLUS ETF - OCTOBER
Fund Performance |
April 30, 2023 (Unaudited) (Continued) |
The line graph and performance table does not reflect the deduction of taxes that a shareholder may pay on fund distributions or the redemption of Fund shares. Returns shown for the Fund and NASDAQ-100 Index - Total Return include the reinvestment of all dividends, if any. Returns shown for the NASDAQ-100 Index - Price Return do not include the reinvestment of dividends, if any. |
| |
The NASDAQ-100 Index includes 100 of the largest domestic and international non-financial companies listed on the Nasdaq Stock Market based on market capitalization. The NASDAQ-100 Price Index reflects companies across major industry groups including computer hardware and software, telecommunications, retail/wholesale trade and biotechnologies. It does not contain securities of financial companies including investment companies. |
| |
The Fund’s portfolio holdings may differ significantly from the securities held in the relevant index and, unlike an exchange-traded fund, the performance of an unmanaged index does not reflect deductions for transaction costs, taxes, management fees or other expenses. |
| |
You cannot invest directly in an index. |
| |
Premium/Discount Information: |
| |
Information regarding the differences between the price of the Fund’s shares on the secondary market and the Fund’s net asset value is available at Innovatoretfs.com/QTOC. |
INNOVATOR DEFINED WEALTH SHIELD ETF
Fund Performance |
April 30, 2023 (Unaudited) |
The following chart compares the value of a hypothetical $10,000 investment in the Innovator Defined Wealth Shield ETF from its inception (June 30, 2021) to April 30, 2023 as compared with the S&P 500® Index - Price Return and Total Return. |
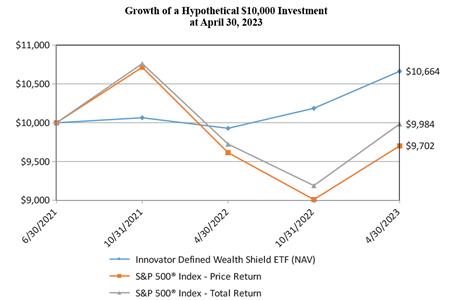
| | | Average Annual Total Returns as of April 30, 2023 | |
| | | One Year | | | Since Inception (a) | |
Innovator Defined Wealth Shield ETF | | | | | | | | |
NAV Return | | | 7.40 | % | | | 3.57 | % |
Market Return | | | 7.36 | % | | | 3.62 | % |
S&P 500® Index - Price Return | | | 0.91 | % | | | -1.64 | % |
S&P 500® Index - Total Return | | | 2.66 | % | | | -0.09 | % |
(a) Inception date is June 30, 2021. |
| |
Performance data quoted represents past performance and does not guarantee future results. The investment return and principal value of an investment will fluctuate so that an investor’s shares, when redeemed, may be worth more or less than their original cost. Current performance of the Fund may be lower or higher than the performance quoted. As of the latest prospectus, the net expense ratio of the Fund was 0.69%. For the most recent performance, please visit the Fund’s website at innovatoretfs.com. |
INNOVATOR DEFINED WEALTH SHIELD ETF
Fund Performance |
April 30, 2023 (Unaudited) (Continued) |
The line graph and performance table do not reflect the deduction of taxes that a shareholder may pay on fund distributions or the redemption of Fund shares. Returns shown for the Fund and S&P 500® Index - Total Return include the reinvestment of all dividends, if any. Returns shown for the S&P 500® Index - Price Return do not include the reinvestment of dividends, if any. |
| |
The S&P 500® Index is an unmanaged, capitalization-weighted index generally representative of the U.S. market for large capitalization stocks. |
| |
The Fund’s portfolio holdings may differ significantly from the securities held in the relevant index and, unlike an exchange-traded fund, the performance of an unmanaged index does not reflect deductions for transaction costs, taxes, management fees or other expenses. |
| |
You cannot invest directly in an index. |
| |
Premium/Discount Information: |
| |
Information regarding the differences between the price of the Fund’s shares on the secondary market and the Fund’s net asset value is available at Innovatoretfs.com/BALT. |
INNOVATOR U.S. EQUITY ACCELERATED ETF – QUARTERLY
Fund Performance |
April 30, 2023 (Unaudited) |
The following chart compares the value of a hypothetical $10,000 investment in the Innovator U.S. Equity Accelerated ETF - Quarterly from its inception (March 31, 2021) to April 30, 2023 as compared with the S&P 500® Index - Price Return and Total Return. |
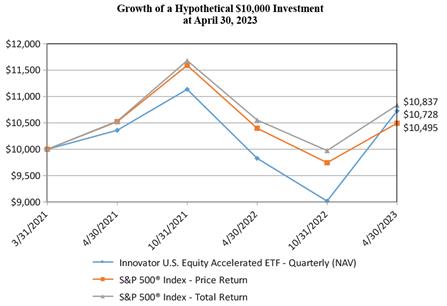
| | | Average Annual Total Returns as of April 30, 2023 | |
| | | One Year | | | Since Inception (a) | |
Innovator U.S. Equity Accelerated ETF - Quarterly | | | | | | | | |
NAV Return | | | 9.14 | % | | | 3.43 | % |
Market Return | | | 9.23 | % | | | 3.37 | % |
S&P 500® Index - Price Return | | | 0.91 | % | | | 2.35 | % |
S&P 500® Index - Total Return | | | 2.66 | % | | | 3.94 | % |
(a) Inception date is March 31, 2021. |
| |
Performance data quoted represents past performance and does not guarantee future results. The investment return and principal value of an investment will fluctuate so that an investor’s shares, when redeemed, may be worth more or less than their original cost. Current performance of the Fund may be lower or higher than the performance quoted. As of the latest prospectus, the net expense ratio of the Fund was 0.79%. For the most recent performance, please visit the Fund’s website at innovatoretfs.com. |
INNOVATOR U.S. EQUITY ACCELERATED ETF – QUARTERLY
Fund Performance |
April 30, 2023 (Unaudited) (Continued) |
The line graph and performance table do not reflect the deduction of taxes that a shareholder may pay on fund distributions or the redemption of Fund shares. Returns shown for the Fund and S&P 500® Index - Total Return include the reinvestment of all dividends, if any. Returns shown for the S&P 500® Index - Price Return do not include the reinvestment of dividends, if any. |
| |
The S&P 500® Index is an unmanaged, capitalization-weighted index generally representative of the U.S. market for large capitalization stocks. |
| |
The Fund’s portfolio holdings may differ significantly from the securities held in the relevant index and, unlike an exchange-traded fund, the performance of an unmanaged index does not reflect deductions for transaction costs, taxes, management fees or other expenses. |
| |
You cannot invest directly in an index. |
| |
Premium/Discount Information: |
| |
Information regarding the differences between the price of the Fund’s shares on the secondary market and the Fund’s net asset value is available at Innovatoretfs.com/XDSQ. |
INNOVATOR GROWTH ACCELERATED ETF – QUARTERLY
Fund Performance |
April 30, 2023 (Unaudited) |
The following chart compares the value of a hypothetical $10,000 investment in the Innovator Growth Accelerated ETF - Quarterly from its inception (March 31, 2021) to April 30, 2023 as compared with the NASDAQ-100 Index - Price Return and Total Return. |
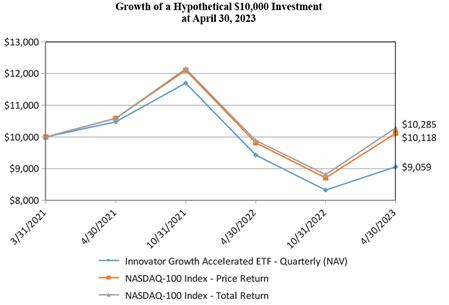
| | | Average Annual Total Returns as of April 30, 2023 | |
| | | One Year | | | Since Inception (a) | |
Innovator Growth Accelerated ETF - Quarterly | | | | | | | | |
NAV Return | | | -3.94 | % | | | -4.63 | % |
Market Return | | | -3.97 | % | | | -4.71 | % |
NASDAQ-100 Index - Price Return | | | 3.04 | % | | | 0.57 | % |
NASDAQ-100 Index - Total Return | | | 3.99 | % | | | 1.36 | % |
(a) Inception date is March 31, 2021. |
| |
Performance data quoted represents past performance and does not guarantee future results. The investment return and principal value of an investment will fluctuate so that an investor’s shares, when redeemed, may be worth more or less than their original cost. Current performance of the Fund may be lower or higher than the performance quoted. As of the latest prospectus, the net expense ratio of the Fund was 0.79%. For the most recent performance, please visit the Fund’s website at innovatoretfs.com. |
INNOVATOR GROWTH ACCELERATED ETF – QUARTERLY
Fund Performance |
April 30, 2023 (Unaudited) (Continued) |
The line graph and performance table do not reflect the deduction of taxes that a shareholder may pay on fund distributions or the redemption of Fund shares. Returns shown for the Fund and NASDAQ-100 Index - Total Return include the reinvestment of all dividends, if any. Returns shown for the NASDAQ-100 Index - Price Return do not include the reinvestment of dividends, if any. |
| |
The NASDAQ-100 Index includes 100 of the largest domestic and international non-financial companies listed on the Nasdaq Stock Market based on market capitalization. The NASDAQ-100 Price Index reflects companies across major industry groups including computer hardware and software, telecommunications, retail/wholesale trade and biotechnologies. It does not contain securities of financial companies including investment companies. |
| |
The Fund’s portfolio holdings may differ significantly from the securities held in the relevant index and, unlike an exchange-traded fund, the performance of an unmanaged index does not reflect deductions for transaction costs, taxes, management fees or other expenses. |
| |
You cannot invest directly in an index. |
| |
Premium/Discount Information: |
| |
Information regarding the differences between the price of the Fund’s shares on the secondary market and the Fund’s net asset value is available at Innovatoretfs.com/XDQQ. |
Expense Example
For the Period Ended April 30, 2023 (Unaudited)
As a shareholder of the Funds, you incur two types of costs: (1) ongoing costs, including management fees, and other Fund expenses; and (2) transaction costs, including brokerage commissions on the purchase and sale of Fund shares. This Example is intended to help you understand your ongoing costs (in dollars) of investing in the Funds and to compare these costs with the ongoing costs of investing in other funds.
The Example is based on an investment of $1,000 invested at the beginning of the respective period and held for the entire period from November 1, 2022 to April 30, 2023 for each Fund.
Actual Expenses
The following table provides information about actual account values and actual expenses. You may use the information in this table, together with the amount you invested, to estimate the expenses you paid over the period. Simply divide your account value by $1,000 (for example, an $8,600 account value divided by $1,000 equals 8.6), then multiply the result by the number in the applicable line under the heading titled “Expenses Paid During the Period” to estimate the expenses you paid on your account during the period.
| | | | | | | | | | | Expenses Paid | |
| | | Beginning | | | Ending | | | During the | |
| | | Account Value | | | Account Value | | | Period (a) | |
Innovator International Developed Power Buffer ETF - January (NAV) | | $ | 1,000.00 | | | $ | 1,201.80 | | | $ | 4.64 | |
Innovator International Developed Power Buffer ETF - April (NAV) | | | 1,000.00 | | | | 1,103.90 | | | | 4.43 | |
Innovator International Developed Power Buffer ETF - July (NAV) | | | 1,000.00 | | | | 1,179.70 | | | | 4.59 | |
Innovator International Developed Power Buffer ETF - October (NAV) | | | 1,000.00 | | | | 1,156.10 | | | | 4.54 | |
Innovator Emerging Markets Power Buffer ETF - January (NAV) | | | 1,000.00 | | | | 1,141.10 | | | | 4.72 | |
Innovator Emerging Markets Power Buffer ETF - April (NAV) | | | 1,000.00 | | | | 1,125.40 | | | | 4.69 | |
Innovator Emerging Markets Power Buffer ETF - July (NAV) | | | 1,000.00 | | | | 1,087.80 | | | | 4.61 | |
Innovator Emerging Markets Power Buffer ETF - October (NAV) | | | 1,000.00 | | | | 1,128.90 | | | | 4.70 | |
Innovator Growth-100 Power Buffer ETF - January (NAV) | | | 1,000.00 | | | | 1,077.10 | | | | 4.07 | |
Innovator Growth-100 Power Buffer ETF - April (NAV) | | | 1,000.00 | | | | 1,128.80 | | | | 4.17 | |
Innovator Growth-100 Power Buffer ETF - July (NAV) | | | 1,000.00 | | | | 1,129.10 | | | | 4.17 | |
Innovator Growth-100 Power Buffer ETF - October (NAV) | | | 1,000.00 | | | | 1,124.90 | | | | 4.16 | |
Innovator U.S. Small Cap Power Buffer ETF - January (NAV) | | | 1,000.00 | | | | 1,007.90 | | | | 3.93 | |
Innovator U.S. Small Cap Power Buffer ETF - April (NAV) | | | 1,000.00 | | | | 1,032.90 | | | | 3.98 | |
Innovator U.S. Small Cap Power Buffer ETF - July (NAV) | | | 1,000.00 | | | | 994.90 | | | | 3.91 | |
Innovator U.S. Small Cap Power Buffer ETF - October (NAV) | | | 1,000.00 | | | | 1,014.70 | | | | 3.95 | |
Innovator Double Stacker ETF - January (NAV) | | | 1,000.00 | | | | 1,109.40 | | | | 4.13 | |
Innovator Double Stacker ETF - October (NAV) | | | 1,000.00 | | | | 1,131.20 | | | | 4.17 | |
Innovator Triple Stacker ETF - January (NAV) | | | 1,000.00 | | | | 1,084.20 | | | | 4.08 | |
Innovator Triple Stacker ETF - October (NAV) | | | 1,000.00 | | | | 1,105.30 | | | | 4.12 | |
Innovator Double Stacker 9 Buffer ETF - January (NAV) | | | 1,000.00 | | | | 1,081.30 | | | | 4.08 | |
Innovator Double Stacker 9 Buffer ETF - October (NAV) | | | 1,000.00 | | | | 1,100.40 | | | | 4.11 | |
Innovator 20+ Year Treasury Bond 9 Buffer ETF - July (NAV) | | | 1,000.00 | | | | 1,103.70 | | | | 4.12 | |
Innovator 20+ Year Treasury Bond 5 Floor ETF - Quarterly (NAV) | | | 1,000.00 | | | | 1,062.60 | | | | 4.04 | |
Innovator U.S. Equity Accelerated ETF - January (NAV) | | | 1,000.00 | | | | 1,099.20 | | | | 4.11 | |
Innovator U.S. Equity Accelerated ETF - April (NAV) | | | 1,000.00 | | | | 1,079.90 | | | | 4.07 | |
Innovator U.S. Equity Accelerated ETF - July (NAV) | | | 1,000.00 | | | | 1,139.80 | | | | 4.19 | |
Innovator U.S. Equity Accelerated ETF - October (NAV) | | | 1,000.00 | | | | 1,120.90 | | | | 4.15 | |
Innovator U.S. Equity Accelerated Plus ETF - January (NAV) | | | 1,000.00 | | | | 1,094.70 | | | | 4.10 | |
Innovator U.S. Equity Accelerated Plus ETF - April (NAV) | | | 1,000.00 | | | | 1,076.40 | | | | 4.07 | |
Innovator U.S. Equity Accelerated Plus ETF - July (NAV) | | | 1,000.00 | | | | 1,142.10 | | | | 4.20 | |
Innovator U.S. Equity Accelerated Plus ETF - October (NAV) | | | 1,000.00 | | | | 1,115.80 | | | | 4.14 | |
Expense Example
For the Period Ended April 30, 2023 (Unaudited) (Continued)
| | | | | | | | | | | Expenses Paid | |
| | | Beginning | | | Ending | | | During the | |
| | | Account Value | | | Account Value | | | Period (a) | |
Innovator U.S. Equity Accelerated 9 Buffer ETF - January (NAV) | | | 1,000.00 | | | | 1,074.50 | | | | 4.06 | |
Innovator U.S. Equity Accelerated 9 Buffer ETF - April (NAV) | | | 1,000.00 | | | | 1,098.80 | | | | 4.11 | |
Innovator U.S. Equity Accelerated 9 Buffer ETF - July (NAV) | | | 1,000.00 | | | | 1,104.80 | | | | 4.12 | |
Innovator U.S. Equity Accelerated 9 Buffer ETF - October (NAV) | | | 1,000.00 | | | | 1,092.30 | | | | 4.10 | |
Innovator Growth Accelerated Plus ETF - January (NAV) | | | 1,000.00 | | | | 1,102.70 | | | | 4.12 | |
Innovator Growth Accelerated Plus ETF - April (NAV) | | | 1,000.00 | | | | 1,164.50 | | | | 4.24 | |
Innovator Growth Accelerated Plus ETF - July (NAV) | | | 1,000.00 | | | | 1,207.50 | | | | 4.32 | |
Innovator Growth Accelerated Plus ETF - October (NAV) | | | 1,000.00 | | | | 1,169.10 | | | | 4.25 | |
Innovator Defined Wealth Shield ETF (NAV) | | | 1,000.00 | | | | 1,046.80 | | | | 3.50 | |
Innovator U.S. Equity Accelerated ETF - Quarterly (NAV) | | | 1,000.00 | | | | 1,189.50 | | | | 4.29 | |
Innovator Growth Accelerated ETF - Quarterly (NAV) | | | 1,000.00 | | | | 1,088.10 | | | | 4.09 | |
(a) Expenses are equal to the Fund’s annualized expense ratio, multiplied by the average account value over the period, multiplied by 181/365 (to reflect the six month period). |
Hypothetical Example for Comparison Purposes
The following table provides information about hypothetical account values and hypothetical expenses based on the Funds’ actual expense ratios and an assumed rate of return of 5% per year before expenses, which are not the Funds’ actual returns. The hypothetical account values and expenses may not be used to estimate the actual ending account balance or expenses you paid for the period. You may use this information to compare the ongoing costs of investing in the Funds with other funds. To do so, compare this 5% hypothetical example with the 5% hypothetical examples that appear in the shareholder reports of other funds.
Please note that the expenses shown in the table are meant to highlight your ongoing costs only and do not reflect any transactional costs, such as brokerage commissions on the purchase and sale of Fund shares with respect to the Funds. Therefore, the table below is useful in comparing the ongoing costs only, and will not help you determine the relative total costs of owning different funds. In addition, if these transactional costs were included, your costs could have been higher.
Expense Example
For the Period Ended April 30, 2023 (Unaudited) (Continued)
| | | | | | | | | | | Expenses Paid | |
| | | Beginning | | | Ending | | | During the | |
| | | Account Value | | | Account Value | | | Period (a) | |
Innovator International Developed Power Buffer ETF - January (NAV) | | $ | 1,000.00 | | | $ | 1,020.58 | | | $ | 4.26 | |
Innovator International Developed Power Buffer ETF - April (NAV) | | | 1,000.00 | | | | 1,020.58 | | | | 4.26 | |
Innovator International Developed Power Buffer ETF - July (NAV) | | | 1,000.00 | | | | 1,020.58 | | | | 4.26 | |
Innovator International Developed Power Buffer ETF - October (NAV) | | | 1,000.00 | | | | 1,020.58 | | | | 4.26 | |
Innovator Emerging Markets Power Buffer ETF - January (NAV) | | | 1,000.00 | | | | 1,020.38 | | | | 4.46 | |
Innovator Emerging Markets Power Buffer ETF - April (NAV) | | | 1,000.00 | | | | 1,020.38 | | | | 4.46 | |
Innovator Emerging Markets Power Buffer ETF - July (NAV) | | | 1,000.00 | | | | 1,020.38 | | | | 4.46 | |
Innovator Emerging Markets Power Buffer ETF - October (NAV) | | | 1,000.00 | | | | 1,020.38 | | | | 4.46 | |
Innovator Growth-100 Power Buffer ETF - January (NAV) | | | 1,000.00 | | | | 1,020.88 | | | | 3.96 | |
Innovator Growth-100 Power Buffer ETF - April (NAV) | | | 1,000.00 | | | | 1,020.88 | | | | 3.96 | |
Innovator Growth-100 Power Buffer ETF - July (NAV) | | | 1,000.00 | | | | 1,020.88 | | | | 3.96 | |
Innovator Growth-100 Power Buffer ETF - October (NAV) | | | 1,000.00 | | | | 1,020.88 | | | | 3.96 | |
Innovator U.S. Small Cap Power Buffer ETF - January (NAV) | | | 1,000.00 | | | | 1,020.88 | | | | 3.96 | |
Innovator U.S. Small Cap Power Buffer ETF - April (NAV) | | | 1,000.00 | | | | 1,020.88 | | | | 3.96 | |
Innovator U.S. Small Cap Power Buffer ETF - July (NAV) | | | 1,000.00 | | | | 1,020.88 | | | | 3.96 | |
Innovator U.S. Small Cap Power Buffer ETF - October (NAV) | | | 1,000.00 | | | | 1,020.88 | | | | 3.96 | |
Innovator Double Stacker ETF - January (NAV) | | | 1,000.00 | | | | 1,020.88 | | | | 3.96 | |
Innovator Double Stacker ETF - October (NAV) | | | 1,000.00 | | | | 1,020.88 | | | | 3.96 | |
Innovator Triple Stacker ETF - January (NAV) | | | 1,000.00 | | | | 1,020.88 | | | | 3.96 | |
Innovator Triple Stacker ETF - October (NAV) | | | 1,000.00 | | | | 1,020.88 | | | | 3.96 | |
Innovator Double Stacker 9 Buffer ETF - January (NAV) | | | 1,000.00 | | | | 1,020.88 | | | | 3.96 | |
Innovator Double Stacker 9 Buffer ETF - October (NAV) | | | 1,000.00 | | | | 1,020.88 | | | | 3.96 | |
Innovator 20+ Year Treasury Bond 9 Buffer ETF - July (NAV) | | | 1,000.00 | | | | 1,020.88 | | | | 3.96 | |
Innovator 20+ Year Treasury Bond 5 Floor ETF - Quarterly (NAV) | | | 1,000.00 | | | | 1,020.88 | | | | 3.96 | |
Innovator U.S. Equity Accelerated ETF - January (NAV) | | | 1,000.00 | | | | 1,020.88 | | | | 3.96 | |
Innovator U.S. Equity Accelerated ETF - April (NAV) | | | 1,000.00 | | | | 1,020.88 | | | | 3.96 | |
Innovator U.S. Equity Accelerated ETF - July (NAV) | | | 1,000.00 | | | | 1,020.88 | | | | 3.96 | |
Innovator U.S. Equity Accelerated ETF - October (NAV) | | | 1,000.00 | | | | 1,020.88 | | | | 3.96 | |
Innovator U.S. Equity Accelerated Plus ETF - January (NAV) | | | 1,000.00 | | | | 1,020.88 | | | | 3.96 | |
Innovator U.S. Equity Accelerated Plus ETF - April (NAV) | | | 1,000.00 | | | | 1,020.88 | | | | 3.96 | |
Innovator U.S. Equity Accelerated Plus ETF - July (NAV) | | | 1,000.00 | | | | 1,020.88 | | | | 3.96 | |
Innovator U.S. Equity Accelerated Plus ETF - October (NAV) | | | 1,000.00 | | | | 1,020.88 | | | | 3.96 | |
Innovator U.S. Equity Accelerated 9 Buffer ETF - January (NAV) | | | 1,000.00 | | | | 1,020.88 | | | | 3.96 | |
Innovator U.S. Equity Accelerated 9 Buffer ETF - April (NAV) | | | 1,000.00 | | | | 1,020.88 | | | | 3.96 | |
Innovator U.S. Equity Accelerated 9 Buffer ETF - July (NAV) | | | 1,000.00 | | | | 1,020.88 | | | | 3.96 | |
Innovator U.S. Equity Accelerated 9 Buffer ETF - October (NAV) | | | 1,000.00 | | | | 1,020.88 | | | | 3.96 | |
Innovator Growth Accelerated Plus ETF - January (NAV) | | | 1,000.00 | | | | 1,020.88 | | | | 3.96 | |
Innovator Growth Accelerated Plus ETF - April (NAV) | | | 1,000.00 | | | | 1,020.88 | | | | 3.96 | |
Innovator Growth Accelerated Plus ETF - July (NAV) | | | 1,000.00 | | | | 1,020.88 | | | | 3.96 | |
Innovator Growth Accelerated Plus ETF - October (NAV) | | | 1,000.00 | | | | 1,020.88 | | | | 3.96 | |
Innovator Defined Wealth Shield ETF (NAV) | | | 1,000.00 | | | | 1,021.37 | | | | 3.50 | |
Innovator U.S. Equity Accelerated ETF - Quarterly (NAV) | | | 1,000.00 | | | | 1,020.88 | | | | 3.96 | |
Innovator Growth Accelerated ETF - Quarterly (NAV) | | | 1,000.00 | | | | 1,020.88 | | | | 3.96 | |
(a) Expenses are equal to the Fund’s annualized expense ratio, multiplied by the average account value over the period, multiplied by 181/365 (to reflect the six month period). |
The accompanying notes are an integral part of these financial statements.
INNOVATOR INTERNATIONAL DEVELOPED POWER BUFFER ETF - JANUARY
Schedule of Investments
April 30, 2023 (Unaudited)
| | | Contracts | | | Notional Amount | | | Value | |
PURCHASED OPTIONS - 102.50% (a)(b) | | | | | | | | | | | | |
CALL OPTIONS - 100.45% | | | | | | | | | | | | |
EFA iShares MSCI EAFE ETF, Expires 12/29/2023, Strike Price $0.66 | | | 28,786 | | | $ | 211,922,532 | | | $ | 205,157,822 | |
| | | | | | | | | | | | 205,157,822 | |
PUT OPTIONS - 2.05% | | | | | | | | | | | | |
EFA iShares MSCI EAFE ETF, Expires 12/29/2023, Strike Price $65.64 | | | 28,786 | | | | 211,922,532 | | | | 4,202,756 | |
| | | | | | | | | | | | 4,202,756 | |
TOTAL PURCHASED OPTIONS (Cost $200,220,359) | | | | | | | | | | | 209,360,578 | |
| | | Principal Amount | | | | | | | | | |
SHORT TERM INVESTMENTS - 0.20% | | | | | | | | | | | | |
Money Market Deposit Account - 0.20% | | | | | | | | | | | | |
U.S. Bank Money Market Deposit Account, 4.650% (c) | | $ | 400,014 | | | | | | | | 400,014 | |
TOTAL SHORT TERM INVESTMENTS (Cost $400,014) | | | | | | | | | | | 400,014 | |
| | | | | | | | | | | | | |
Total Investments (Cost $200,620,373) - 102.70% | | | | | | | | | | | 209,760,592 | |
Liabilities in Excess of Other Assets - (2.70)% | | | | | | | | | | | (5,518,577 | ) |
TOTAL NET ASSETS - 100.00% | | | | | | | | | | $ | 204,242,015 | |
Asset Type | | % of Net Assets | |
Purchased Options | | | 102.50 | % |
Short Term Investments | | | 0.20 | |
Total Investments | | | 102.70 | |
Liabilities in Excess of Other Assets | | | (2.70 | ) |
Net Assets | | | 100.00 | % |
| | | | | |
Percentages are stated as a percent of net assets. | | | | |
(a) | Exchange-Traded. |
(b) | Purchased option contracts are held in connection with corresponding option contracts written short. |
(c) | The U.S. Bank Money Market Deposit Account (the “MMDA”) is a short-term investment vehicle in which the Fund holds cash balances. The MMDA will bear interest at a variable rate that is determined based on conditions and may change daily and by any amount. The rate shown is as of April 30, 2023. |
The accompanying notes are an integral part of these financial statements.
INNOVATOR INTERNATIONAL DEVELOPED POWER BUFFER ETF - JANUARY
Schedule of Options Written (a) | | | | | |
April 30, 2023 (Unaudited) (Continued) | | | | | |
Description | | Expiration | | | Strike Price | | | Contracts | | | Notional Amount | | | Value | |
Call Options | | | | | | | | | | | | | | | | | | | | |
EFA iShares MSCI EAFE ETF | | 12/29/2023 | | | $ | 80.42 | | | | 28,786 | | | $ | (211,922,532 | ) | | $ | (3,713,394 | ) |
| | | | | | | | | | | | | | | | | | | | (3,713,394 | ) |
Put Options | | | | | | | | | | | | | | | | | | | | |
EFA iShares MSCI EAFE ETF | | 12/29/2023 | | | | 55.79 | | | | 28,786 | | | | (211,922,532 | ) | | | (1,698,374 | ) |
| | | | | | | | | | | | | | | | | | | | (1,698,374 | ) |
Total Options Written (Premiums Received $7,545,581) | | | | | | | | | | | | | | | $ | (5,411,768 | ) |
The accompanying notes are an integral part of these financial statements.
INNOVATOR INTERNATIONAL DEVELOPED POWER BUFFER ETF - APRIL
Schedule of Investments | | | | |
April 30, 2023 (Unaudited) | | | | |
| | | Contracts | | | Notional Amount | | | Value | |
PURCHASED OPTIONS - 103.47% (a)(b) | | | | | | | | | | | | |
CALL OPTIONS - 99.20% | | | | | | | | | | | | |
EFA iShares MSCI EAFE ETF, Expires 3/28/2024, Strike Price $0.72 | | | 31,283 | | | $ | 230,305,446 | | | $ | 223,200,138 | |
| | | | | | | | | | | | 223,200,138 | |
PUT OPTIONS - 4.27% | | | | | | | | | | | | |
EFA iShares MSCI EAFE ETF, Expires 3/28/2024, Strike Price $71.52 | | | 31,283 | | | | 230,305,446 | | | | 9,606,071 | |
| | | | | | | | | | | | 9,606,071 | |
TOTAL PURCHASED OPTIONS (Cost $230,552,978) | | | | | | | | | | | 232,806,209 | |
| | | Principal Amount | | | | | | | | | |
SHORT TERM INVESTMENTS - 0.20% | | | | | | | | | | | | |
Money Market Deposit Account - 0.20% | | | | | | | | | | | | |
U.S. Bank Money Market Deposit Account, 4.650% (c) | | $ | 452,950 | | | | | | | | 452,950 | |
TOTAL SHORT TERM INVESTMENTS (Cost $452,950) | | | | | | | | | | | 452,950 | |
| | | | | | | | | | | | | |
Total Investments (Cost $231,005,928) - 103.67% | | | | | | | | | | | 233,259,159 | |
Liabilities in Excess of Other Assets - (3.67)% | | | | | | | | | | | (8,261,186 | ) |
TOTAL NET ASSETS - 100.00% | | | | | | | | | | $ | 224,997,973 | |
Asset Type | | % of Net Assets | |
Purchased Options | | | 103.47 | % |
Short Term Investments | | | 0.20 | |
Total Investments | | | 103.67 | |
Liabilities in Excess of Other Assets | | | (3.67 | ) |
Net Assets | | | 100.00 | % |
| | | | | |
Percentages are stated as a percent of net assets. | | | | |
(a) | Exchange-Traded. |
(b) | Purchased option contracts are held in connection with corresponding option contracts written short. |
(c) | The U.S. Bank Money Market Deposit Account (the “MMDA”) is a short-term investment vehicle in which the Fund holds cash balances. The MMDA will bear interest at a variable rate that is determined based on conditions and may change daily and by any amount. The rate shown is as of April 30, 2023. |
The accompanying notes are an integral part of these financial statements.
INNOVATOR INTERNATIONAL DEVELOPED POWER BUFFER ETF - APRIL
Schedule of Options Written (a) |
April 30, 2023 (Unaudited) (Continued) |
Description | | Expiration | | | Strike Price | | | Contracts | | | Notional Amount | | | Value | |
Call Options | | | | | | | | | | | | | | | | | | | | |
EFA iShares MSCI EAFE ETF | | 3/28/2024 | | | $ | 82.96 | | | | 31,283 | | | $ | (230,305,446 | ) | | $ | (4,180,660 | ) |
| | | | | | | | | | | | | | | | | | | | (4,180,660 | ) |
Put Options | | | | | | | | | | | | | | | | | | | | |
EFA iShares MSCI EAFE ETF | | 3/28/2024 | | | | 60.79 | | | | 31,283 | | | | (230,305,446 | ) | | | (3,966,372 | ) |
| | | | | | | | | | | | | | | | | | | | (3,966,372 | ) |
Total Options Written (Premiums Received $8,122,386) | | | | | | | | | | | | | | | $ | (8,147,032 | ) |
The accompanying notes are an integral part of these financial statements.
INNOVATOR INTERNATIONAL DEVELOPED POWER BUFFER ETF - JULY
Schedule of Investments |
April 30, 2023 (Unaudited) |
| | | Contracts | | | Notional Amount | | | Value | |
PURCHASED OPTIONS - 101.11% (a)(b) | | | | | | | | | | | | |
CALL OPTIONS - 100.88% | | | | | | | | | | | | |
EFA iShares MSCI EAFE ETF, Expires 6/30/2023, Strike Price $0.62 | | | 15,430 | | | $ | 113,595,660 | | | $ | 111,003,420 | |
| | | | | | | | | | | | 111,003,420 | |
PUT OPTIONS - 0.23% | | | | | | | | | | | | |
EFA iShares MSCI EAFE ETF, Expires 6/30/2023, Strike Price $62.49 | | | 15,430 | | | | 113,595,660 | | | | 246,880 | |
| | | | | | | | | | | | 246,880 | |
TOTAL PURCHASED OPTIONS (Cost $96,663,170) | | | | | | | | | | | 111,250,300 | |
| | | Principal Amount | | | | | | | | | |
SHORT TERM INVESTMENTS - 0.17% | | | | | | | | | | | | |
Money Market Deposit Account - 0.17% | | | | | | | | | | | | |
U.S. Bank Money Market Deposit Account, 4.650% (c) | | $ | 189,335 | | | | | | | | 189,335 | |
TOTAL SHORT TERM INVESTMENTS (Cost $189,335) | | | | | | | | | | | 189,335 | |
| | | | | | | | | | | | | |
Total Investments (Cost $96,852,505) - 101.28% | | | | | | | | | | | 111,439,635 | |
Liabilities in Excess of Other Assets - (1.28)% | | | | | | | | | | | (1,398,986 | ) |
TOTAL NET ASSETS - 100.00% | | | | | | | | | | $ | 110,040,649 | |
Asset Type | | % of Net Assets | |
Purchased Options | | | 101.11 | % |
Short Term Investments | | | 0.17 | |
Total Investments | | | 101.28 | |
Liabilities in Excess of Other Assets | | | (1.28 | ) |
Net Assets | | | 100.00 | % |
| | | | | |
Percentages are stated as a percent of net assets. | | | | |
(a) | Exchange-Traded. |
(b) | Purchased option contracts are held in connection with corresponding option contracts written short. |
(c) | The U.S. Bank Money Market Deposit Account (the “MMDA”) is a short-term investment vehicle in which the Fund holds cash balances. The MMDA will bear interest at a variable rate that is determined based on conditions and may change daily and by any amount. The rate shown is as of April 30, 2023. |
The accompanying notes are an integral part of these financial statements.
INNOVATOR INTERNATIONAL DEVELOPED POWER BUFFER ETF - JULY
Schedule of Options Written (a) | | | |
April 30, 2023 (Unaudited) (Continued) | | | |
Description | | Expiration | | | Strike Price | | | Contracts | | | Notional Amount | | | Value | |
Call Options | | | | | | | | | | | | | | | | | | | | |
EFA iShares MSCI EAFE ETF | | 6/30/2023 | | | $ | 74.96 | | | | 15,430 | | | $ | (113,595,660 | ) | | $ | (1,249,830 | ) |
| | | | | | | | | | | | | | | | | | | | (1,249,830 | ) |
Put Options | | | | | | | | | | | | | | | | | | | | |
EFA iShares MSCI EAFE ETF | | 6/30/2023 | | | | 53.12 | | | | 15,430 | | | | (113,595,660 | ) | | | (108,010 | ) |
| | | | | | | | | | | | | | | | | | | | (108,010 | ) |
Total Options Written (Premiums Received $4,931,018) | | | | | | | | | | | | | | | $ | (1,357,840 | ) |
INNOVATOR INTERNATIONAL DEVELOPED POWER BUFFER ETF - OCTOBER
Schedule of Investments |
April 30, 2023 (Unaudited) |
| | | Contracts | | | Notional Amount | | | Value | |
PURCHASED OPTIONS - 108.32% (a)(b) | | | | | | | | | | | | |
CALL OPTIONS - 107.81% | | | | | | | | | | | | |
EFA iShares MSCI EAFE ETF, Expires 9/29/2023, Strike Price $0.56 | | | 15,769 | | | $ | 116,091,378 | | | $ | 113,448,809 | |
| | | | | | | | | | | | 113,448,809 | |
PUT OPTIONS - 0.51% | | | | | | | | | | | | |
EFA iShares MSCI EAFE ETF, Expires 9/29/2023, Strike Price $56.01 | | | 15,769 | | | | 116,091,378 | | | | 541,192 | |
| | | | | | | | | | | | 541,192 | |
TOTAL PURCHASED OPTIONS (Cost $93,298,717) | | | | | | | | | | | 113,990,001 | |
| | | Principal Amount | | | | | | | | | |
SHORT TERM INVESTMENTS - 0.19% | | | | | | | | | | | | |
Money Market Deposit Account - 0.19% | | | | | | | | | | | | |
U.S. Bank Money Market Deposit Account, 4.650% (c) | | $ | 202,834 | | | | | | | | 202,834 | |
TOTAL SHORT TERM INVESTMENTS (Cost $202,834) | | | | | | | | | | | 202,834 | |
| | | | | | | | | | | | | |
Total Investments (Cost $93,501,551) - 108.51% | | | | | | | | | | | 114,192,835 | |
Liabilities in Excess of Other Assets - (8.51)% | | | | | | | | | | | (8,954,842 | ) |
TOTAL NET ASSETS - 100.00% | | | | | | | | | | $ | 105,237,993 | |
Asset Type | | % of Net Assets | |
Purchased Options | | | 108.32 | % |
Short Term Investments | | | 0.19 | |
Total Investments | | | 108.51 | |
Liabilities in Excess of Other Assets | | | (8.51 | ) |
Net Assets | | | 100.00 | % |
| | | | | |
Percentages are stated as a percent of net assets. | | | | |
(a) | Exchange-Traded. |
(b) | Purchased option contracts are held in connection with corresponding option contracts written short. |
(c) | The U.S. Bank Money Market Deposit Account (the “MMDA”) is a short-term investment vehicle in which the Fund holds cash balances. The MMDA will bear interest at a variable rate that is determined based on conditions and may change daily and by any amount. The rate shown is as of April 30, 2023. |
The accompanying notes are an integral part of these financial statements.
INNOVATOR INTERNATIONAL DEVELOPED POWER BUFFER ETF - OCTOBER
Schedule of Options Written (a) | | | |
April 30, 2023 (Unaudited) (Continued) | | | |
Description | | Expiration | | | Strike Price | | | Contracts | | | Notional Amount | | | Value | |
Call Options | | | | | | | | | | | | | | | | | | | | |
EFA iShares MSCI EAFE ETF | | 9/29/2023 | | | $ | 70.15 | | | | 15,769 | | | $ | (116,091,378 | ) | | $ | (8,645,039 | ) |
| | | | | | | | | | | | | | | | | | | | (8,645,039 | ) |
Put Options | | | | | | | | | | | | | | | | | | | | |
EFA iShares MSCI EAFE ETF | | 9/29/2023 | | | | 47.61 | | | | 15,769 | | | | (116,091,378 | ) | | | (237,008 | ) |
| | | | | | | | | | | | | | | | | | | | (237,008 | ) |
Total Options Written (Premiums Received $4,714,655) | | | | | | | | | | | | | | | $ | (8,882,047 | ) |
INNOVATOR EMERGING MARKETS POWER BUFFER ETF – JANUARY
Schedule of Investments |
April 30, 2023 (Unaudited) |
| | | Contracts | | | Notional Amount | | | Value | |
PURCHASED OPTIONS - 102.13% (a)(b) | | | | | | | | | | | | |
CALL OPTIONS - 97.72% | | | | | | | | | | | | |
EEM iShares MSCI Emerging Markets ETF, Expires 12/29/2023, Strike Price $0.38 | | | 29,745 | | | $ | 116,392,185 | | | $ | 113,054,200 | |
| | | | | | | | | | | | 113,054,200 | |
PUT OPTIONS - 4.41% | | | | | | | | | | | | |
EEM iShares MSCI Emerging Markets ETF, Expires 12/29/2023, Strike Price $37.90 | | | 29,745 | | | | 116,392,185 | | | | 5,103,945 | |
| | | | | | | | | | | | 5,103,945 | |
TOTAL PURCHASED OPTIONS (Cost $119,286,833) | | | | | | | | | | | 118,158,145 | |
| | | Principal Amount | | | | | | | | | |
SHORT TERM INVESTMENTS - 0.18% | | | | | | | | | | | | |
Money Market Deposit Account - 0.18% | | | | | | | | | | | | |
U.S. Bank Money Market Deposit Account, 4.650% (c) | | $ | 205,718 | | | | | | | | 205,718 | |
TOTAL SHORT TERM INVESTMENTS (Cost $205,718) | | | | | | | | | | | 205,718 | |
| | | | | | | | | | | | | |
Total Investments (Cost $119,492,551) - 102.31% | | | | | | | | | | | 118,363,863 | |
Liabilities in Excess of Other Assets - (2.31)% | | | | | | | | | | | (2,672,025 | ) |
TOTAL NET ASSETS - 100.00% | | | | | | | | | | $ | 115,691,838 | |
Asset Type | | % of Net Assets | |
Purchased Options | | | 102.13 | % |
Short Term Investments | | | 0.18 | |
Total Investments | | | 102.31 | |
Liabilities in Excess of Other Assets | | | (2.31 | ) |
Net Assets | | | 100.00 | % |
| | | | | |
Percentages are stated as a percent of net assets. | | | | |
(a) | Exchange-Traded. |
(b) | Purchased option contracts are held in connection with corresponding option contracts written short. |
(c) | The U.S. Bank Money Market Deposit Account (the “MMDA”) is a short-term investment vehicle in which the Fund holds cash balances. The MMDA will bear interest at a variable rate that is determined based on conditions and may change daily and by any amount. The rate shown is as of April 30, 2023. |
The accompanying notes are an integral part of these financial statements.
INNOVATOR EMERGING MARKETS POWER BUFFER ETF – JANUARY
Schedule of Options Written (a) | | | |
April 30, 2023 (Unaudited) (Continued) | | | |
Description | | Expiration | | | Strike Price | | | Contracts | | | Notional Amount | | | Value | |
Call Options | | | | | | | | | | | | | | | | | | | | |
EEM iShares MSCI Emerging Markets ETF | | 12/29/2023 | | | $ | 47.21 | | | | 29,745 | | | $ | (116,392,185 | ) | | $ | (717,449 | ) |
| | | | | | | | | | | | | | | | | | | | (717,449 | ) |
Put Options | | | | | | | | | | | | | | | | | | | | |
EEM iShares MSCI Emerging Markets ETF | | 12/29/2023 | | | | 32.22 | | | | 29,745 | | | | (116,392,185 | ) | | | (1,870,961 | ) |
| | | | | | | | | | | | | | | | | | | | (1,870,961 | ) |
Total Options Written (Premiums Received $5,193,440) | | | | | | | | | | | | | | | $ | (2,588,410 | ) |
INNOVATOR EMERGING MARKETS POWER BUFFER ETF – APRIL
Schedule of Investments |
April 30, 2023 (Unaudited) |
| | | Contracts | | | Notional Amount | | | Value | |
PURCHASED OPTIONS - 105.00% (a)(b) | | | | | | | | | | | | |
CALL OPTIONS - 97.84% | | | | | | | | | | | | |
EEM iShares MSCI Emerging Markets ETF, Expires 3/28/2024, Strike Price $0.39 | | | 13,076 | | | $ | 51,166,388 | | | $ | 49,746,204 | |
| | | | | | | | | | | | 49,746,204 | |
PUT OPTIONS - 7.16% | | | | | | | | | | | | |
EEM iShares MSCI Emerging Markets ETF, Expires 3/28/2024, Strike Price $39.46 | | | 13,076 | | | | 51,166,388 | | | | 3,639,966 | |
| | | | | | | | | | | | 3,639,966 | |
TOTAL PURCHASED OPTIONS (Cost $53,533,435) | | | | | | | | | | | 53,386,170 | |
| | | Principal Amount | | | | | | | | | |
SHORT TERM INVESTMENTS - 0.18% | | | | | | | | | | | | |
Money Market Deposit Account - 0.18% | | | | | | | | | | | | |
U.S. Bank Money Market Deposit Account, 4.650% (c) | | $ | 90,012 | | | | | | | | 90,012 | |
TOTAL SHORT TERM INVESTMENTS (Cost $90,012) | | | | | | | | | | | 90,012 | |
| | | | | | | | | | | | | |
Total Investments (Cost $53,623,447) - 105.18% | | | | | | | | | | | 53,476,182 | |
Liabilities in Excess of Other Assets - (5.18)% | | | | | | | | | | | (2,632,739 | ) |
TOTAL NET ASSETS - 100.00% | | | | | | | | | | $ | 50,843,443 | |
Asset Type | | % of Net Assets | |
Purchased Options | | | 105.00 | % |
Short Term Investments | | | 0.18 | |
Total Investments | | | 105.18 | |
Liabilities in Excess of Other Assets | | | (5.18 | ) |
Net Assets | | | 100.00 | % |
| | | | | |
Percentages are stated as a percent of net assets. | | | | |
(a) | Exchange-Traded. |
(b) | Purchased option contracts are held in connection with corresponding option contracts written short. |
(c) | The U.S. Bank Money Market Deposit Account (the “MMDA”) is a short-term investment vehicle in which the Fund holds cash balances. The MMDA will bear interest at a variable rate that is determined based on conditions and may change daily and by any amount. The rate shown is as of April 30, 2023. |
The accompanying notes are an integral part of these financial statements.
INNOVATOR EMERGING MARKETS POWER BUFFER ETF – APRIL
Schedule of Options Written (a) | | | |
April 30, 2023 (Unaudited) (Continued) | | | |
Description | | Expiration | | | Strike Price | | | Contracts | | | Notional Amount | | | Value | |
Call Options | | | | | | | | | | | | | | | | | | | | |
EEM iShares MSCI Emerging Markets ETF | | 3/28/2024 | | | $ | 46.81 | | | | 13,076 | | | $ | (51,166,388 | ) | | $ | (992,469 | ) |
| | | | | | | | | | | | | | | | | | | | (992,469 | ) |
Put Options | | | | | | | | | | | | | | | | | | | | |
EEM iShares MSCI Emerging Markets ETF | | 3/28/2024 | | | | 33.54 | | | | 13,076 | | | | (51,166,388 | ) | | | (1,607,171 | ) |
| | | | | | | | | | | | | | | | | | | | (1,607,171 | ) |
Total Options Written (Premiums Received $2,499,033) | | | | | | | | | | | | | | | $ | (2,599,640 | ) |
INNOVATOR EMERGING MARKETS POWER BUFFER ETF – JULY
Schedule of Investments |
April 30, 2023 (Unaudited) |
| | | Contracts | | | Notional Amount | | | Value | |
PURCHASED OPTIONS - 100.40% (a)(b) | | | | | | | | | | | | |
CALL OPTIONS - 96.73% | | | | | | | | | | | | |
EEM iShares MSCI Emerging Markets ETF, Expires 6/30/2023, Strike Price $0.40 | | | 22,912 | | | $ | 89,654,656 | | | $ | 88,200,661 | |
| | | | | | | | | | | | 88,200,661 | |
PUT OPTIONS - 3.67% | | | | | | | | | | | | |
EEM iShares MSCI Emerging Markets ETF, Expires 6/30/2023, Strike Price $40.10 | | | 22,912 | | | | 89,654,656 | | | | 3,341,944 | |
| | | | | | | | | | | | 3,341,944 | |
TOTAL PURCHASED OPTIONS (Cost $94,726,465) | | | | | | | | | | | 91,542,605 | |
| | | Principal Amount | | | | | | | | | |
SHORT TERM INVESTMENTS - 0.18% | | | | | | | | | | | | |
Money Market Deposit Account - 0.18% | | | | | | | | | | | | |
U.S. Bank Money Market Deposit Account, 4.650% (c) | | $ | 164,748 | | | | | | | | 164,748 | |
TOTAL SHORT TERM INVESTMENTS (Cost $164,748) | | | | | | | | | | | 164,748 | |
| | | | | | | | | | | | | |
Total Investments (Cost $94,891,213) - 100.58% | | | | | | | | | | | 91,707,353 | |
Liabilities in Excess of Other Assets - (0.58)% | | | | | | | | | | | (529,836 | ) |
TOTAL NET ASSETS - 100.00% | | | | | | | | | | $ | 91,177,517 | |
Asset Type | | % of Net Assets | |
Purchased Options | | | 100.40 | % |
Short Term Investments | | | 0.18 | |
Total Investments | | | 100.58 | |
Liabilities in Excess of Other Assets | | | (0.58 | ) |
Net Assets | | | 100.00 | % |
| | | | | |
Percentages are stated as a percent of net assets. | | | | |
(a) | Exchange-Traded. |
(b) | Purchased option contracts are held in connection with corresponding option contracts written short. |
(c) | The U.S. Bank Money Market Deposit Account (the “MMDA”) is a short-term investment vehicle in which the Fund holds cash balances. The MMDA will bear interest at a variable rate that is determined based on conditions and may change daily and by any amount. The rate shown is as of April 30, 2023. |
The accompanying notes are an integral part of these financial statements.
INNOVATOR EMERGING MARKETS POWER BUFFER ETF – JULY
Schedule of Options Written (a) | | | |
April 30, 2023 (Unaudited) (Continued) | | | |
Description | | Expiration | | | Strike Price | | | Contracts | | | Notional Amount | | | Value | |
Call Options | | | | | | | | | | | | | | | | | | | | |
EEM iShares MSCI Emerging Markets ETF | | 6/30/2023 | | | $ | 47.75 | | | | 22,912 | | | $ | (89,654,656 | ) | | $ | (132,889 | ) |
| | | | | | | | | | | | | | | | | | | | (132,889 | ) |
Put Options | | | | | | | | | | | | | | | | | | | | |
EEM iShares MSCI Emerging Markets ETF | | 6/30/2023 | | | | 34.09 | | | | 22,912 | | | | (89,654,656 | ) | | | (331,767 | ) |
| | | | | | | | | | | | | | | | | | | | (331,767 | ) |
Total Options Written (Premiums Received $4,154,106) | | | | | | | | | | | | | | | $ | (464,656 | ) |
INNOVATOR EMERGING MARKETS POWER BUFFER ETF – OCTOBER
Schedule of Investments |
April 30, 2023 (Unaudited) |
| | | Contracts | | | Notional Amount | | | Value | |
PURCHASED OPTIONS - 101.33% (a)(b) | | | | | | | | | | | | |
CALL OPTIONS - 99.88% | | | | | | | | | | | | |
EEM iShares MSCI Emerging Markets ETF, Expires 9/29/2023, Strike Price $0.35 | | | 7,944 | | | $ | 31,084,872 | | | $ | 30,634,448 | |
| | | | | | | | | | | | 30,634,448 | |
PUT OPTIONS - 1.45% | | | | | | | | | | | | |
EEM iShares MSCI Emerging Markets ETF, Expires 9/29/2023, Strike Price $34.88 | | | 7,944 | | | | 31,084,872 | | | | 445,499 | |
| | | | | | | | | | | | 445,499 | |
TOTAL PURCHASED OPTIONS (Cost $29,224,949) | | | | | | | | | | | 31,079,947 | |
| | | Principal Amount | | | | | | | | | |
SHORT TERM INVESTMENTS - 0.15% | | | | | | | | | | | | |
Money Market Deposit Account - 0.15% | | | | | | | | | | | | |
U.S. Bank Money Market Deposit Account, 4.650% (c) | | $ | 45,179 | | | | | | | | 45,179 | |
TOTAL SHORT TERM INVESTMENTS (Cost $45,179) | | | | | | | | | | | 45,179 | |
| | | | | | | | | | | | | |
Total Investments (Cost $29,270,128) - 101.48% | | | | | | | | | | | 31,125,126 | |
Liabilities in Excess of Other Assets - (1.48)% | | | | | | | | | | | (456,341 | ) |
TOTAL NET ASSETS - 100.00% | | | | | | | | | | $ | 30,668,785 | |
Asset Type | | % of Net Assets | |
Purchased Options | | | 101.33 | % |
Short Term Investments | | | 0.15 | |
Total Investments | | | 101.48 | |
Liabilities in Excess of Other Assets | | | (1.48 | ) |
Net Assets | | | 100.00 | % |
| | | | | |
Percentages are stated as a percent of net assets. | | | | |
(a) | Exchange-Traded. |
(b) | Purchased option contracts are held in connection with corresponding option contracts written short. |
(c) | The U.S. Bank Money Market Deposit Account (the “MMDA”) is a short-term investment vehicle in which the Fund holds cash balances. The MMDA will bear interest at a variable rate that is determined based on conditions and may change daily and by any amount. The rate shown is as of April 30, 2023. |
The accompanying notes are an integral part of these financial statements.
INNOVATOR EMERGING MARKETS POWER BUFFER ETF – OCTOBER
Schedule of Options Written (a) | | | |
April 30, 2023 (Unaudited) (Continued) | | | |
Description | | Expiration | | | Strike Price | | | Contracts | | | Notional Amount | | | Value | |
Call Options | | | | | | | | | | | | | | | | | | | | |
EEM iShares MSCI Emerging Markets ETF | | 9/29/2023 | | | $ | 43.65 | | | | 7,944 | | | $ | (31,084,872 | ) | | $ | (291,704 | ) |
| | | | | | | | | | | | | | | | | | | | (291,704 | ) |
Put Options | | | | | | | | | | | | | | | | | | | | |
EEM iShares MSCI Emerging Markets ETF | | 9/29/2023 | | | | 29.65 | | | | 7,944 | | | | (31,084,872 | ) | | | (142,197 | ) |
| | | | | | | | | | | | | | | | | | | | (142,197 | ) |
Total Options Written (Premiums Received $1,655,798) | | | | | | | | | | | | | | | $ | (433,901 | ) |
INNOVATOR GROWTH-100 POWER BUFFER ETF – JANUARY
Schedule of Investments |
April 30, 2023 (Unaudited) |
| | | Contracts | | | Notional Amount | | | Value | |
PURCHASED OPTIONS - 110.26% (a)(b) | | | | | | | | | | | | |
CALL OPTIONS - 107.97% | | | | | | | | | | | | |
QQQ Investco QQQ Trust Series 1, Expires 12/29/2023, Strike Price $2.66 | | | 3,220 | | | $ | 103,864,320 | | | $ | 102,473,280 | |
| | | | | | | | | | | | 102,473,280 | |
PUT OPTIONS - 2.29% | | | | | | | | | | | | |
QQQ Investco QQQ Trust Series 1, Expires 12/29/2023, Strike Price $266.28 | | | 3,220 | | | | 103,864,320 | | | | 2,170,280 | |
| | | | | | | | | | | | 2,170,280 | |
TOTAL PURCHASED OPTIONS (Cost $91,614,656) | | | | | | | | | | | 104,643,560 | |
| | | Principal Amount | | | | | | | | | |
SHORT TERM INVESTMENTS - 0.21% | | | | | | | | | | | | |
Money Market Deposit Account - 0.21% | | | | | | | | | | | | |
U.S. Bank Money Market Deposit Account, 4.650% (c) | | $ | 200,063 | | | | | | | | 200,063 | |
TOTAL SHORT TERM INVESTMENTS (Cost $200,063) | | | | | | | | | | | 200,063 | |
| | | | | | | | | | | | | |
Total Investments (Cost $91,814,719) - 110.47% | | | | | | | | | | | 104,843,623 | |
Liabilities in Excess of Other Assets - (10.47)% | | | | | | | | | | | (9,935,194 | ) |
TOTAL NET ASSETS - 100.00% | | | | | | | | | | $ | 94,908,429 | |
Asset Type | | % of Net Assets | |
Purchased Options | | | 110.26 | % |
Short Term Investments | | | 0.21 | |
Total Investments | | | 110.47 | |
Liabilities in Excess of Other Assets | | | (10.47 | ) |
Net Assets | | | 100.00 | % |
| | | | | |
Percentages are stated as a percent of net assets. | | | | |
(a) | Exchange-Traded. |
(b) | Purchased option contracts are held in connection with corresponding option contracts written short. |
(c) | The U.S. Bank Money Market Deposit Account (the “MMDA”) is a short-term investment vehicle in which the Fund holds cash balances. The MMDA will bear interest at a variable rate that is determined based on conditions and may change daily and by any amount. The rate shown is as of April 30, 2023. |
The accompanying notes are an integral part of these financial statements.
INNOVATOR GROWTH-100 POWER BUFFER ETF – JANUARY
Schedule of Options Written (a) | | | |
April 30, 2023 (Unaudited) (Continued) | | | |
Description | | Expiration | | | Strike Price | | | Contracts | | | Notional Amount | | | Value | |
Call Options | | | | | | | | | | | | | | | | | | | | |
QQQ Investco QQQ Trust Series 1 | | 12/29/2023 | | | $ | 323.72 | | | | 3,220 | | | $ | (103,864,320 | ) | | $ | (8,987,020 | ) |
| | | | | | | | | | | | | | | | | | | | (8,987,020 | ) |
Put Options | | | | | | | | | | | | | | | | | | | | |
QQQ Investco QQQ Trust Series 1 | | 12/29/2023 | | | | 226.34 | | | | 3,220 | | | | (103,864,320 | ) | | | (946,680 | ) |
| | | | | | | | | | | | | | | | | | | | (946,680 | ) |
Total Options Written (Premiums Received $7,239,184) | | | | | | | | | | | | | | | $ | (9,933,700 | ) |
INNOVATOR GROWTH-100 POWER BUFFER ETF – APRIL
Schedule of Investments |
April 30, 2023 (Unaudited) |
| | | Contracts | | | Notional Amount | | | Value | |
PURCHASED OPTIONS - 105.84% (a)(b) | | | | | | | | | | | | |
CALL OPTIONS - 99.08% | | | | | | | | | | | | |
QQQ Investco QQQ Trust Series 1, Expires 3/28/2024, Strike Price $3.21 | | | 3,479 | | | $ | 112,218,624 | | | $ | 110,495,371 | |
| | | | | | | | | | | | 110,495,371 | |
PUT OPTIONS - 6.76% | | | | | | | | | | | | |
QQQ Investco QQQ Trust Series 1, Expires 3/28/2024, Strike Price $320.93 | | | 3,479 | | | | 112,218,624 | | | | 7,540,698 | |
| | | | | | | | | | | | 7,540,698 | |
TOTAL PURCHASED OPTIONS (Cost $117,881,985) | | | | | | | | | | | 118,036,069 | |
| | | Principal Amount | | | | | | | | | |
SHORT TERM INVESTMENTS - 0.25% | | | | | | | | | | | | |
Money Market Deposit Account - 0.25% | | | | | | | | | | | | |
U.S. Bank Money Market Deposit Account, 4.650% (c) | | $ | 279,400 | | | | | | | | 279,400 | |
TOTAL SHORT TERM INVESTMENTS (Cost $279,400) | | | | | | | | | | | 279,400 | |
| | | | | | | | | | | | | |
Total Investments (Cost $118,161,385) - 106.09% | | | | | | | | | | | 118,315,469 | |
Liabilities in Excess of Other Assets - (6.09)% | | | | | | | | | | | (6,789,627 | ) |
TOTAL NET ASSETS - 100.00% | | | | | | | | | | $ | 111,525,842 | |
Asset Type | | % of Net Assets | |
Purchased Options | | | 105.84 | % |
Short Term Investments | | | 0.25 | |
Total Investments | | | 106.09 | |
Liabilities in Excess of Other Assets | | | (6.09 | ) |
Net Assets | | | 100.00 | % |
| | | | | |
Percentages are stated as a percent of net assets. | | | | |
(a) | Exchange-Traded. |
(b) | Purchased option contracts are held in connection with corresponding option contracts written short. |
(c) | The U.S. Bank Money Market Deposit Account (the “MMDA”) is a short-term investment vehicle in which the Fund holds cash balances. The MMDA will bear interest at a variable rate that is determined based on conditions and may change daily and by any amount. The rate shown is as of April 30, 2023. |
The accompanying notes are an integral part of these financial statements.
INNOVATOR GROWTH-100 POWER BUFFER ETF – APRIL
Schedule of Options Written (a) | | | |
April 30, 2023 (Unaudited) (Continued) | | | |
Description | | Expiration | | | Strike Price | | | Contracts | | | Notional Amount | | | Value | |
Call Options | | | | | | | | | | | | | | | | | | | | |
QQQ Investco QQQ Trust Series 1 | | 3/28/2024 | | | $ | 377.61 | | | | 3,479 | | | $ | (112,218,624 | ) | | $ | (3,280,453 | ) |
| | | | | | | | | | | | | | | | | | | | (3,280,453 | ) |
Put Options | | | | | | | | | | | | | | | | | | | | |
QQQ Investco QQQ Trust Series 1 | | 3/28/2024 | | | | 272.79 | | | | 3,479 | | | | (112,218,624 | ) | | | (3,452,908 | ) |
| | | | | | | | | | | | | | | | | | | | (3,452,908 | ) |
Total Options Written (Premiums Received $7,584,049) | | | | | | | | | | | | | | | $ | (6,733,361 | ) |
INNOVATOR GROWTH-100 POWER BUFFER ETF – JULY
Schedule of Investments |
April 30, 2023 (Unaudited) |
| | | Contracts | | | Notional Amount | | | Value | |
PURCHASED OPTIONS - 101.51% (a)(b) | | | | | | | | | | | | |
CALL OPTIONS - 100.98% | | | | | | | | | | | | |
QQQ Investco QQQ Trust Series 1, Expires 6/30/2023, Strike Price $2.80 | | | 2,421 | | | $ | 78,091,776 | | | $ | 77,317,105 | |
| | | | | | | | | | | | 77,317,105 | |
PUT OPTIONS - 0.53% | | | | | | | | | | | | |
QQQ Investco QQQ Trust Series 1, Expires 6/30/2023, Strike Price $280.28 | | | 2,421 | | | | 78,091,776 | | | | 404,428 | |
| | | | | | | | | | | | 404,428 | |
TOTAL PURCHASED OPTIONS (Cost $72,327,193) | | | | | | | | | | | 77,721,533 | |
| | | Principal Amount | | | | | | | | | |
SHORT TERM INVESTMENTS - 0.24% | | | | | | | | | | | | |
Money Market Deposit Account - 0.24% | | | | | | | | | | | | |
U.S. Bank Money Market Deposit Account, 4.650% (c) | | $ | 184,867 | | | | | | | | 184,867 | |
TOTAL SHORT TERM INVESTMENTS (Cost $184,867) | | | | | | | | | | | 184,867 | |
| | | | | | | | | | | | | |
Total Investments (Cost $72,512,060) - 101.75% | | | | | | | | | | | 77,906,400 | |
Liabilities in Excess of Other Assets - (1.75)% | | | | | | | | | | | (1,340,314 | ) |
TOTAL NET ASSETS - 100.00% | | | | | | | | | | $ | 76,566,086 | |
Asset Type | | % of Net Assets | |
Purchased Options | | | 101.51 | % |
Short Term Investments | | | 0.24 | |
Total Investments | | | 101.75 | |
Liabilities in Excess of Other Assets | | | (1.75 | ) |
Net Assets | | | 100.00 | % |
| | | | | |
Percentages are stated as a percent of net assets. | | | | |
(a) | Exchange-Traded. |
(b) | Purchased option contracts are held in connection with corresponding option contracts written short. |
(c) | The U.S. Bank Money Market Deposit Account (the “MMDA”) is a short-term investment vehicle in which the Fund holds cash balances. The MMDA will bear interest at a variable rate that is determined based on conditions and may change daily and by any amount. The rate shown is as of April 30, 2023. |
The accompanying notes are an integral part of these financial statements.
INNOVATOR GROWTH-100 POWER BUFFER ETF – JULY
Schedule of Options Written (a) | | | |
April 30, 2023 (Unaudited) (Continued) | | | |
Description | | Expiration | | | Strike Price | | | Contracts | | | Notional Amount | | | Value | |
Call Options | | | | | | | | | | | | | | | | | | | | |
QQQ Investco QQQ Trust Series 1 | | 6/30/2023 | | | $ | 335.86 | | | | 2,421 | | | $ | (78,091,776 | ) | | $ | (1,206,578 | ) |
| | | | | | | | | | | | | | | | | | | | (1,206,578 | ) |
Put Options | | | | | | | | | | | | | | | | | | | | |
QQQ Investco QQQ Trust Series 1 | | 6/30/2023 | | | | 238.24 | | | | 2,421 | | | | (78,091,776 | ) | | | (82,871 | ) |
| | | | | | | | | | | | | | | | | | | | (82,871 | ) |
Total Options Written (Premiums Received $7,226,352) | | | | | | | | | | | | | | | $ | (1,289,449 | ) |
INNOVATOR GROWTH-100 POWER BUFFER ETF – OCTOBER
Schedule of Investments |
April 30, 2023 (Unaudited) |
| | | Contracts | | | Notional Amount | | | Value | |
PURCHASED OPTIONS - 105.95% (a)(b) | | | | | | | | | | | | |
CALL OPTIONS - 104.59% | | | | | | | | | | | | |
QQQ Investco QQQ Trust Series 1, Expires 9/29/2023, Strike Price $2.67 | | | 2,804 | | | $ | 90,445,824 | | | $ | 89,445,104 | |
| | | | | | | | | | | | 89,445,104 | |
PUT OPTIONS - 1.36% | | | | | | | | | | | | |
QQQ Investco QQQ Trust Series 1, Expires 9/29/2023, Strike Price $267.26 | | | 2,804 | | | | 90,445,824 | | | | 1,160,492 | |
| | | | | | | | | | | | 1,160,492 | |
TOTAL PURCHASED OPTIONS (Cost $81,293,290) | | | | | | | | | | | 90,605,596 | |
| | | Principal Amount | | | | | | | | | |
SHORT TERM INVESTMENTS - 0.24% | | | | | | | | | | | | |
Money Market Deposit Account - 0.24% | | | | | | | | | | | | |
U.S. Bank Money Market Deposit Account, 4.650% (c) | | $ | 203,590 | | | | | | | | 203,590 | |
TOTAL SHORT TERM INVESTMENTS (Cost $203,590) | | | | | | | | | | | 203,590 | |
| | | | | | | | | | | | | |
Total Investments (Cost $81,496,880) - 106.19% | | | | | | | | | | | 90,809,186 | |
Liabilities in Excess of Other Assets - (6.19)% | | | | | | | | | | | (5,288,453 | ) |
TOTAL NET ASSETS - 100.00% | | | | | | | | | | $ | 85,520,733 | |
Asset Type | | % of Net Assets | |
Purchased Options | | | 105.95 | % |
Short Term Investments | | | 0.24 | |
Total Investments | | | 106.19 | |
Liabilities in Excess of Other Assets | | | (6.19 | ) |
Net Assets | | | 100.00 | % |
| | | | | |
Percentages are stated as a percent of net assets. | | | | |
(a) | Exchange-Traded. |
(b) | Purchased option contracts are held in connection with corresponding option contracts written short. |
(c) | The U.S. Bank Money Market Deposit Account (the “MMDA”) is a short-term investment vehicle in which the Fund holds cash balances. The MMDA will bear interest at a variable rate that is determined based on conditions and may change daily and by any amount. The rate shown is as of April 30, 2023. |
The accompanying notes are an integral part of these financial statements.
INNOVATOR GROWTH-100 POWER BUFFER ETF – OCTOBER
Schedule of Options Written (a) | | | |
April 30, 2023 (Unaudited) (Continued) | | | |
Description | | Expiration | | | Strike Price | | | Contracts | | | Notional Amount | | | Value | |
Call Options | | | | | | | | | | | | | | | | | | | | |
QQQ Investco QQQ Trust Series 1 | | 9/29/2023 | | | $ | 329.83 | | | | 2,804 | | | $ | (90,445,824 | ) | | $ | (4,799,775 | ) |
| | | | | | | | | | | | | | | | | | | | (4,799,775 | ) |
Put Options | | | | | | | | | | | | | | | | | | | | |
QQQ Investco QQQ Trust Series 1 | | 9/29/2023 | | | | 227.17 | | | | 2,804 | | | | (90,445,824 | ) | | | (433,049 | ) |
| | | | | | | | | | | | | | | | | | | | (433,049 | ) |
Total Options Written (Premiums Received $7,111,460) | | | | | | | | | | | | | | | $ | (5,232,824 | ) |
INNOVATOR U.S. SMALL CAP POWER BUFFER ETF - JANUARY
Schedule of Investments |
April 30, 2023 (Unaudited) |
| | | Contracts | | | Notional Amount | | | Value | |
PURCHASED OPTIONS - 102.76% (a)(b) | | | | | | | | | | | | |
CALL OPTIONS - 97.03% | | | | | | | | | | | | |
IWM iShares Russell 2000 ETF, Expires 12/29/2023, Strike Price $1.74 | | | 9,927 | | | $ | 173,921,040 | | | $ | 170,283,589 | |
| | | | | | | | | | | | 170,283,589 | |
PUT OPTIONS - 5.73% | | | | | | | | | | | | |
IWM iShares Russell 2000 ETF, Expires 12/29/2023, Strike Price $174.36 | | | 9,927 | | | | 173,921,040 | | | | 10,049,201 | |
| | | | | | | | | | | | 10,049,201 | |
TOTAL PURCHASED OPTIONS (Cost $186,560,194) | | | | | | | | | | | 180,332,790 | |
| | | Principal Amount | | | | | | | | | |
SHORT TERM INVESTMENTS - 0.26% | | | | | | | | | | | | |
Money Market Deposit Account - 0.26% | | | | | | | | | | | | |
U.S. Bank Money Market Deposit Account, 4.650% (c) | | $ | 464,809 | | | | | | | | 464,809 | |
TOTAL SHORT TERM INVESTMENTS (Cost $464,809) | | | | | | | | | | | 464,809 | |
| | | | | | | | | | | | | |
Total Investments (Cost $187,025,003) - 103.02% | | | | | | | | | | | 180,797,599 | |
Liabilities in Excess of Other Assets - (3.02)% | | | | | | | | | | | (5,302,318 | ) |
TOTAL NET ASSETS - 100.00% | | | | | | | | | | $ | 175,495,281 | |
Asset Type | | % of Net Assets | |
Purchased Options | | | 102.76 | % |
Short Term Investments | | | 0.26 | |
Total Investments | | | 103.02 | |
Liabilities in Excess of Other Assets | | | (3.02 | ) |
Net Assets | | | 100.00 | % |
| | | | | |
Percentages are stated as a percent of net assets. | | | | |
(a) | Exchange-Traded. |
(b) | Purchased option contracts are held in connection with corresponding option contracts written short. |
(c) | The U.S. Bank Money Market Deposit Account (the “MMDA”) is a short-term investment vehicle in which the Fund holds cash balances. The MMDA will bear interest at a variable rate that is determined based on conditions and may change daily and by any amount. The rate shown is as of April 30, 2023. |
The accompanying notes are an integral part of these financial statements.
INNOVATOR U.S. SMALL CAP POWER BUFFER ETF - JANUARY
Schedule of Options Written (a) | | | |
April 30, 2023 (Unaudited) (Continued) | | | |
Description | | Expiration | | | Strike Price | | | Contracts | | | Notional Amount | | | Value | |
Call Options | | | | | | | | | | | | | | | | | | | | |
IWM iShares Russell 2000 ETF | | 12/29/2023 | | | $ | 211.92 | | | | 9,927 | | | $ | (173,921,040 | ) | | $ | (1,273,733 | ) |
| | | | | | | | | | | | | | | | | | | | (1,273,733 | ) |
Put Options | | | | | | | | | | | | | | | | | | | | |
IWM iShares Russell 2000 ETF | | 12/29/2023 | | | | 148.21 | | | | 9,927 | | | | (173,921,040 | ) | | | (3,917,591 | ) |
| | | | | | | | | | | | | | | | | | | | (3,917,591 | ) |
Total Options Written (Premiums Received $11,810,891) | | | | | | | | | | | | | | | $ | (5,191,324 | ) |
INNOVATOR U.S. SMALL CAP POWER BUFFER ETF - APRIL
Schedule of Investments |
April 30, 2023 (Unaudited) |
| | | Contracts | | | Notional Amount | | | Value | |
PURCHASED OPTIONS - 104.68% (a)(b) | | | | | | | | | | | | |
CALL OPTIONS - 97.22% | | | | | | | | | | | | |
IWM iShares Russell 2000 ETF, Expires 3/28/2024, Strike Price $1.78 | | | 7,192 | | | $ | 126,003,840 | | | $ | 123,010,026 | |
| | | | | | | | | | | | 123,010,026 | |
PUT OPTIONS - 7.46% | | | | | | | | | | | | |
IWM iShares Russell 2000 ETF, Expires 3/28/2024, Strike Price $178.40 | | | 7,192 | | | | 126,003,840 | | | | 9,438,925 | |
| | | | | | | | | | | | 9,438,925 | |
TOTAL PURCHASED OPTIONS (Cost $134,147,144) | | | | | | | | | | | 132,448,951 | |
| | | Principal Amount | | | | | | | | | |
SHORT TERM INVESTMENTS - 0.26% | | | | | | | | | | | | |
Money Market Deposit Account - 0.26% | | | | | | | | | | | | |
U.S. Bank Money Market Deposit Account, 4.650% (c) | | $ | 330,479 | | | | | | | | 330,479 | |
TOTAL SHORT TERM INVESTMENTS (Cost $330,479) | | | | | | | | | | | 330,479 | |
| | | | | | | | | | | | | |
Total Investments (Cost $134,477,623) - 104.94% | | | | | | | | | | | 132,779,430 | |
Liabilities in Excess of Other Assets - (4.94)% | | | | | | | | | | | (6,256,205 | ) |
TOTAL NET ASSETS - 100.00% | | | | | | | | | | $ | 126,523,225 | |
Asset Type | | % of Net Assets | |
Purchased Options | | | 104.68 | % |
Short Term Investments | | | 0.26 | |
Total Investments | | | 104.94 | |
Liabilities in Excess of Other Assets | | | (4.94 | ) |
Net Assets | | | 100.00 | % |
| | | | | |
Percentages are stated as a percent of net assets. | | | | |
(a) | Exchange-Traded. |
(b) | Purchased option contracts are held in connection with corresponding option contracts written short. |
(c) | The U.S. Bank Money Market Deposit Account (the “MMDA”) is a short-term investment vehicle in which the Fund holds cash balances. The MMDA will bear interest at a variable rate that is determined based on conditions and may change daily and by any amount. The rate shown is as of April 30, 2023. |
The accompanying notes are an integral part of these financial statements.
INNOVATOR U.S. SMALL CAP POWER BUFFER ETF - APRIL
Schedule of Options Written (a) | | | |
April 30, 2023 (Unaudited) (Continued) | | | |
Description | | Expiration | | | Strike Price | | | Contracts | | | Notional Amount | | | Value | |
Call Options | | | | | | | | | | | | | | | | | | | | |
IWM iShares Russell 2000 ETF | | 3/28/2024 | | | $ | 210.89 | | | | 7,192 | | | $ | (126,003,840 | ) | | $ | (2,118,260 | ) |
| | | | | | | | | | | | | | | | | | | | (2,118,260 | ) |
Put Options | | | | | | | | | | | | | | | | | | | | |
IWM iShares Russell 2000 ETF | | 3/28/2024 | | | | 151.64 | | | | 7,192 | | | | (126,003,840 | ) | | | (4,073,837 | ) |
| | | | | | | | | | | | | | | | | | | | (4,073,837 | ) |
Total Options Written (Premiums Received $7,401,545) | | | | | | | | | | | | | | | $ | (6,192,097 | ) |
INNOVATOR U.S. SMALL CAP POWER BUFFER ETF - JULY
Schedule of Investments |
April 30, 2023 (Unaudited) |
| | | Contracts | | | Notional Amount | | | Value | |
PURCHASED OPTIONS - 100.16% (a)(b) | | | | | | | | | | | | |
CALL OPTIONS - 98.29% | | | | | | | | | | | | |
IWM iShares Russell 2000 ETF, Expires 6/30/2023, Strike Price $1.69 | | | 3,940 | | | $ | 69,028,800 | | | $ | 68,225,158 | |
| | | | | | | | | | | | 68,225,158 | |
PUT OPTIONS - 1.87% | | | | | | | | | | | | |
IWM iShares Russell 2000 ETF, Expires 6/30/2023, Strike Price $169.36 | | | 3,940 | | | | 69,028,800 | | | | 1,299,097 | |
| | | | | | | | | | | | 1,299,097 | |
TOTAL PURCHASED OPTIONS (Cost $71,595,507) | | | | | | | | | | | 69,524,255 | |
| | | Principal Amount | | | | | | | | | |
SHORT TERM INVESTMENTS - 0.26% | | | | | | | | | | | | |
Money Market Deposit Account - 0.26% | | | | | | | | | | | | |
U.S. Bank Money Market Deposit Account, 4.650% (c) | | $ | 177,008 | | | | | | | | 177,008 | |
TOTAL SHORT TERM INVESTMENTS (Cost $177,008) | | | | | | | | | | | 177,008 | |
| | | | | | | | | | | | | |
Total Investments (Cost $71,772,515) - 100.42% | | | | | | | | | | | 69,701,263 | |
Liabilities in Excess of Other Assets - (0.42)% | | | | | | | | | | | (290,852 | ) |
TOTAL NET ASSETS - 100.00% | | | | | | | | | | $ | 69,410,411 | |
Asset Type | | % of Net Assets | |
Purchased Options | | | 100.16 | % |
Short Term Investments | | | 0.26 | |
Total Investments | | | 100.42 | |
Liabilities in Excess of Other Assets | | | (0.42 | ) |
Net Assets | | | 100.00 | % |
| | | | | |
Percentages are stated as a percent of net assets. | | | | |
(a) | Exchange-Traded. |
(b) | Purchased option contracts are held in connection with corresponding option contracts written short. |
(c) | The U.S. Bank Money Market Deposit Account (the “MMDA”) is a short-term investment vehicle in which the Fund holds cash balances. The MMDA will bear interest at a variable rate that is determined based on conditions and may change daily and by any amount. The rate shown is as of April 30, 2023. |
The accompanying notes are an integral part of these financial statements.
INNOVATOR U.S. SMALL CAP POWER BUFFER ETF - JULY
Schedule of Options Written (a) | | | |
April 30, 2023 (Unaudited) (Continued) | | | |
Description | | Expiration | | | Strike Price | | | Contracts | | | Notional Amount | | | Value | |
Call Options | | | | | | | | | | | | | | | | | | | | |
IWM iShares Russell 2000 ETF | | 6/30/2023 | | | $ | 203.25 | | | | 3,940 | | | $ | (69,028,800 | ) | | $ | (26,871 | ) |
| | | | | | | | | | | | | | | | | | | | (26,871 | ) |
Put Options | | | | | | | | | | | | | | | | | | | | |
IWM iShares Russell 2000 ETF | | 6/30/2023 | | | | 143.96 | | | | 3,940 | | | | (69,028,800 | ) | | | (219,418 | ) |
| | | | | | | | | | | | | | | | | | | | (219,418 | ) |
Total Options Written (Premiums Received $5,302,376) | | | | | | | | | | | | | | | $ | (246,289 | ) |
INNOVATOR U.S. SMALL CAP POWER BUFFER ETF - OCTOBER
Schedule of Investments |
April 30, 2023 (Unaudited) |
| | | Contracts | | | Notional Amount | | | Value | |
PURCHASED OPTIONS - 101.27% (a)(b) | | | | | | | | | | | | |
CALL OPTIONS - 98.25% | | | | | | | | | | | | |
IWM iShares Russell 2000 ETF, Expires 9/29/2023, Strike Price $1.65 | | | 4,328 | | | $ | 75,826,560 | | | $ | 74,607,795 | |
| | | | | | | | | | | | 74,607,795 | |
PUT OPTIONS - 3.02% | | | | | | | | | | | | |
IWM iShares Russell 2000 ETF, Expires 9/29/2023, Strike Price $164.92 | | | 4,328 | | | | 75,826,560 | | | | 2,289,253 | |
| | | | | | | | | | | | 2,289,253 | |
TOTAL PURCHASED OPTIONS (Cost $77,182,595) | | | | | | | | | | | 76,897,048 | |
| | | Principal Amount | | | | | | | | | |
SHORT TERM INVESTMENTS - 0.25% | | | | | | | | | | | | |
Money Market Deposit Account - 0.25% | | | | | | | | | | | | |
U.S. Bank Money Market Deposit Account, 4.650% (c) | | $ | 187,894 | | | | | | | | 187,894 | |
TOTAL SHORT TERM INVESTMENTS (Cost $187,894) | | | | | | | | | | | 187,894 | |
| | | | | | | | | | | | | |
Total Investments (Cost $77,370,489) - 101.52% | | | | | | | | | | | 77,084,942 | |
Liabilities in Excess of Other Assets - (1.52)% | | | | | | | | | | | (1,148,872 | ) |
TOTAL NET ASSETS - 100.00% | | | | | | | | | | $ | 75,936,070 | |
Asset Type | | % of Net Assets | |
Purchased Options | | | 101.27 | % |
Short Term Investments | | | 0.25 | |
Total Investments | | | 101.52 | |
Liabilities in Excess of Other Assets | | | (1.52 | ) |
Net Assets | | | 100.00 | % |
| | | | | |
Percentages are stated as a percent of net assets. | | | | |
(a) | Exchange-Traded. |
(b) | Purchased option contracts are held in connection with corresponding option contracts written short. |
(c) | The U.S. Bank Money Market Deposit Account (the “MMDA”) is a short-term investment vehicle in which the Fund holds cash balances. The MMDA will bear interest at a variable rate that is determined based on conditions and may change daily and by any amount. The rate shown is as of April 30, 2023. |
The accompanying notes are an integral part of these financial statements.
INNOVATOR U.S. SMALL CAP POWER BUFFER ETF - OCTOBER
Schedule of Options Written (a) | | | |
April 30, 2023 (Unaudited) (Continued) | | | |
Description | | Expiration | | | Strike Price | | | Contracts | | | Notional Amount | | | Value | |
Call Options | | | | | | | | | | | | | | | | | | | | |
IWM iShares Russell 2000 ETF | | 9/29/2023 | | | $ | 205.00 | | | | 4,328 | | | $ | (75,826,560 | ) | | $ | (331,049 | ) |
| | | | | | | | | | | | | | | | | | | | (331,049 | ) |
Put Options | | | | | | | | | | | | | | | | | | | | |
IWM iShares Russell 2000 ETF | | 9/29/2023 | | | | 140.18 | | | | 4,328 | | | | (75,826,560 | ) | | | (767,960 | ) |
| | | | | | | | | | | | | | | | | | | | (767,960 | ) |
Total Options Written (Premiums Received $6,554,198) | | | | | | | | | | | | | | | $ | (1,099,009 | ) |
INNOVATOR DOUBLE STACKER ETF - JANUARY
Schedule of Investments |
April 30, 2023 (Unaudited) |
| | | Contracts | | | Notional Amount | | | Value | |
PURCHASED OPTIONS - 119.32% (a)(b) | | | | | | | | | | | | |
CALL OPTIONS - 119.32% | | | | | | | | | | | | |
QQQ Investco QQQ Trust Series 1, Expires 12/29/2023, Strike Price $266.30 | | | 91 | | | $ | 2,935,296 | | | $ | 640,415 | |
SPY SPDR S&P 500® Trust ETF, Expires 12/29/2023, Strike Price $3.87 | | | 63 | | | | 2,620,359 | | | | 2,568,141 | |
| | | | | | | | | | | | 3,208,556 | |
TOTAL PURCHASED OPTIONS (Cost $2,672,818) | | | | | | | | | | | 3,208,556 | |
| | | Principal Amount | | | | | | | | | |
SHORT TERM INVESTMENTS - 0.70% | | | | | | | | | | | | |
Money Market Deposit Account - 0.70% | | | | | | | | | | | | |
U.S. Bank Money Market Deposit Account, 4.650% (c) | | $ | 18,876 | | | | | | | | 18,876 | |
TOTAL SHORT TERM INVESTMENTS (Cost $18,876) | | | | | | | | | | | 18,876 | |
| | | | | | | | | | | | | |
Total Investments (Cost $2,691,694) - 120.02% | | | | | | | | | | | 3,227,432 | |
Liabilities in Excess of Other Assets - (20.02)% | | | | | | | | | | | (538,367 | ) |
TOTAL NET ASSETS - 100.00% | | | | | | | | | | $ | 2,689,065 | |
Asset Type | | % of Net Assets | |
Purchased Options | | | 119.32 | % |
Short Term Investments | | | 0.70 | |
Total Investments | | | 120.02 | |
Liabilities in Excess of Other Assets | | | (20.02 | ) |
Net Assets | | | 100.00 | % |
| | | | | |
Percentages are stated as a percent of net assets. | | | | |
(a) | Exchange-Traded. |
(b) | Purchased option contracts are held in connection with corresponding option contracts written short. |
(c) | The U.S. Bank Money Market Deposit Account (the “MMDA”) is a short-term investment vehicle in which the Fund holds cash balances. The MMDA will bear interest at a variable rate that is determined based on conditions and may change daily and by any amount. The rate shown is as of April 30, 2023. |
The accompanying notes are an integral part of these financial statements.
INNOVATOR DOUBLE STACKER ETF - JANUARY
Schedule of Options Written (a) |
April 30, 2023 (Unaudited) (Continued) |
Description | | Expiration | | | Strike Price | | | Contracts | | | Notional Amount | | | Value | |
Call Options | | | | | | | | | | | | | | | | | | | | |
QQQ Investco QQQ Trust Series 1 | | 12/29/2023 | | | $ | 299.17 | | | | 91 | | | $ | (2,935,296 | ) | | $ | (405,490 | ) |
SPY SPDR S&P 500® Trust ETF | | 12/29/2023 | | | | 429.66 | | | | 63 | | | | (2,620,359 | ) | | | (131,334 | ) |
| | | | | | | | | | | | | | | | | | | | | |
Total Options Written (Premiums Received $287,077) | | | | | | | | | | | | | | | $ | (536,824 | ) |
INNOVATOR DOUBLE STACKER ETF - OCTOBER
Schedule of Investments |
April 30, 2023 (Unaudited) |
| | | Contracts | | | Notional Amount | | | Value | |
PURCHASED OPTIONS - 117.55% (a)(b) | | | | | | | | | | | | |
CALL OPTIONS - 117.55% | | | | | | | | | | | | |
QQQ Investco QQQ Trust Series 1, Expires 9/29/2023, Strike Price $267.29 | | | 144 | | | $ | 4,644,864 | | | $ | 924,330 | |
SPY SPDR S&P 500® Trust ETF, Expires 9/29/2023, Strike Price $3.60 | | | 108 | | | | 4,492,044 | | | | 4,422,125 | |
| | | | | | | | | | | | 5,346,455 | |
TOTAL PURCHASED OPTIONS (Cost $4,289,128) | | | | | | | | | | | 5,346,455 | |
| | | Principal Amount | | | | | | | | | |
SHORT TERM INVESTMENTS - 0.42% | | | | | | | | | | | | |
Money Market Deposit Account - 0.42% | | | | | | | | | | | | |
U.S. Bank Money Market Deposit Account, 4.650% (c) | | $ | 18,992 | | | | | | | | 18,992 | |
TOTAL SHORT TERM INVESTMENTS (Cost $18,992) | | | | | | | | | | | 18,992 | |
| | | | | | | | | | | | | |
Total Investments (Cost $4,308,120) - 117.97% | | | | | | | | | | | 5,365,447 | |
Liabilities in Excess of Other Assets - (17.97)% | | | | | | | | | | | (817,203 | ) |
TOTAL NET ASSETS - 100.00% | | | | | | | | | | $ | 4,548,244 | |
Asset Type | | % of Net Assets | |
Purchased Options | | | 117.55 | % |
Short Term Investments | | | 0.42 | |
Total Investments | | | 117.97 | |
Liabilities in Excess of Other Assets | | | (17.97 | ) |
Net Assets | | | 100.00 | % |
| | | | | |
Percentages are stated as a percent of net assets. | | | | |
(a) | Exchange-Traded. |
(b) | Purchased option contracts are held in connection with corresponding option contracts written short. |
(c) | The U.S. Bank Money Market Deposit Account (the “MMDA”) is a short-term investment vehicle in which the Fund holds cash balances. The MMDA will bear interest at a variable rate that is determined based on conditions and may change daily and by any amount. The rate shown is as of April 30, 2023. |
The accompanying notes are an integral part of these financial statements.
INNOVATOR DOUBLE STACKER ETF - OCTOBER
Schedule of Options Written (a) |
April 30, 2023 (Unaudited) (Continued) |
Description | | Expiration | | | Strike Price | | | Contracts | | | Notional Amount | | | Value | |
Call Options | | | | | | | | | | | | | | | | | | | | |
QQQ Investco QQQ Trust Series 1 | | 9/29/2023 | | | $ | 303.23 | | | | 144 | | | $ | (4,644,864 | ) | | $ | (501,308 | ) |
SPY SPDR S&P 500® Trust ETF | | 9/29/2023 | | | | 405.26 | | | | 108 | | | | (4,492,044 | ) | | | (313,158 | ) |
| | | | | | | | | | | | | | | | | | | | | |
Total Options Written (Premiums Received $471,501) | | | | | | | | | | | | | | | $ | (814,466 | ) |
INNOVATOR TRIPLE STACKER ETF – JANUARY
Schedule of Investments |
April 30, 2023 (Unaudited) |
| | | Contracts | | | Notional Amount | | | Value | |
PURCHASED OPTIONS - 129.19% (a)(b) | | | | | | | | | | | | |
CALL OPTIONS - 129.19% | | | | | | | | | | | | |
IWM iShares Russell 2000 ETF, Expires 12/29/2023, Strike Price $174.36 | | | 272 | | | $ | 4,765,440 | | | $ | 402,582 | |
QQQ Investco QQQ Trust Series 1, Expires 12/29/2023, Strike Price $266.28 | | | 178 | | | | 5,741,568 | | | | 1,252,974 | |
SPY SPDR S&P 500® Trust ETF, Expires 12/29/2023, Strike Price $3.77 | | | 124 | | | | 5,157,532 | | | | 5,055,942 | |
| | | | | | | | | | | | 6,711,498 | |
TOTAL PURCHASED OPTIONS (Cost $5,778,123) | | | | | | | | | | | 6,711,498 | |
| | | Principal Amount | | | | | | | | | |
SHORT TERM INVESTMENTS - 0.99% | | | | | | | | | | | | |
Money Market Deposit Account - 0.99% | | | | | | | | | | | | |
U.S. Bank Money Market Deposit Account, 4.650% (c) | | $ | 51,455 | | | | | | | | 51,455 | |
TOTAL SHORT TERM INVESTMENTS (Cost $51,455) | | | | | | | | | | | 51,455 | |
| | | | | | | | | | | | | |
Total Investments (Cost $5,829,578) - 130.18% | | | | | | | | | | | 6,762,953 | |
Liabilities in Excess of Other Assets - (30.18)% | | | | | | | | | | | (1,567,939 | ) |
TOTAL NET ASSETS - 100.00% | | | | | | | | | | $ | 5,195,014 | |
Asset Type | | % of Net Assets | |
Purchased Options | | | 129.19 | % |
Short Term Investments | | | 0.99 | |
Total Investments | | | 130.18 | |
Liabilities in Excess of Other Assets | | | (30.18 | ) |
Net Assets | | | 100.00 | % |
| | | | | |
Percentages are stated as a percent of net assets. | | | | |
(a) | Exchange-Traded. |
(b) | Purchased option contracts are held in connection with corresponding option contracts written short. |
(c) | The U.S. Bank Money Market Deposit Account (the “MMDA”) is a short-term investment vehicle in which the Fund holds cash balances. The MMDA will bear interest at a variable rate that is determined based on conditions and may change daily and by any amount. The rate shown is as of April 30, 2023. |
The accompanying notes are an integral part of these financial statements.
INNOVATOR TRIPLE STACKER ETF – JANUARY
Schedule of Options Written (a) | | | |
April 30, 2023 (Unaudited) (Continued) | | | |
Description | | Expiration | | | Strike Price | | | Contracts | | | Notional Amount | | | Value | |
Call Options | | | | | | | | | | | | | | | | | | | | |
IWM iShares Russell 2000 ETF | | 12/29/2023 | | | $ | 187.82 | | | | 272 | | | $ | (4,765,440 | ) | | $ | (208,366 | ) |
QQQ Investco QQQ Trust Series 1 | | 12/29/2023 | | | | 286.84 | | | | 178 | | | | (5,741,568 | ) | | | (958,559 | ) |
SPY SPDR S&P 500® Trust ETF | | 12/29/2023 | | | | 411.95 | | | | 124 | | | | (5,157,532 | ) | | | (397,685 | ) |
| | | | | | | | | | | | | | | | | | | | | |
Total Options Written (Premiums Received $1,183,727) | | | | | | | | | | | | | | | $ | (1,564,610 | ) |
INNOVATOR TRIPLE STACKER ETF – OCTOBER
Schedule of Investments |
April 30, 2023 (Unaudited) |
| | | Contracts | | | Notional Amount | | | Value | |
PURCHASED OPTIONS - 129.37% (a)(b) | | | | | | | | | | | | |
CALL OPTIONS - 129.37% | | | | | | | | | | | | |
IWM iShares Russell 2000 ETF, Expires 9/29/2023, Strike Price $164.92 | | | 344 | | | $ | 6,026,880 | | | $ | 615,966 | |
QQQ Investco QQQ Trust Series 1, Expires 9/29/2023, Strike Price $267.25 | | | 212 | | | | 6,838,272 | | | | 1,361,561 | |
SPY SPDR S&P 500® Trust ETF, Expires 9/29/2023, Strike Price $3.62 | | | 159 | | | | 6,613,287 | | | | 6,510,042 | |
| | | | | | | | | | | | 8,487,569 | |
TOTAL PURCHASED OPTIONS (Cost $7,197,264) | | | | | | | | | | | 8,487,569 | |
| | | Principal Amount | | | | | | | | | |
SHORT TERM INVESTMENTS - 0.46% | | | | | | | | | | | | |
Money Market Deposit Account - 0.46% | | | | | | | | | | | | |
U.S. Bank Money Market Deposit Account, 4.650% (c) | | $ | 29,969 | | | | | | | | 29,969 | |
TOTAL SHORT TERM INVESTMENTS (Cost $29,969) | | | | | | | | | | | 29,969 | |
| | | | | | | | | | | | | |
Total Investments (Cost $7,227,233) - 129.83% | | | | | | | | | | | 8,517,538 | |
Liabilities in Excess of Other Assets - (29.83)% | | | | | | | | | | | (1,956,810 | ) |
TOTAL NET ASSETS - 100.00% | | | | | | | | | | $ | 6,560,728 | |
Asset Type | | % of Net Assets | |
Purchased Options | | | 129.37 | % |
Short Term Investments | | | 0.46 | |
Total Investments | | | 129.83 | |
Liabilities in Excess of Other Assets | | | (29.83 | ) |
Net Assets | | | 100.00 | % |
| | | | | |
Percentages are stated as a percent of net assets. | | | | |
(a) | Exchange-Traded. |
(b) | Purchased option contracts are held in connection with corresponding option contracts written short. |
(c) | The U.S. Bank Money Market Deposit Account (the “MMDA”) is a short-term investment vehicle in which the Fund holds cash balances. The MMDA will bear interest at a variable rate that is determined based on conditions and may change daily and by any amount. The rate shown is as of April 30, 2023. |
The accompanying notes are an integral part of these financial statements.
INNOVATOR TRIPLE STACKER ETF – OCTOBER
Schedule of Options Written (a) |
April 30, 2023 (Unaudited) (Continued) |
Description | | Expiration | | | Strike Price | | | Contracts | | | Notional Amount | | | Value | |
Call Options | | | | | | | | | | | | | | | | | | | | |
IWM iShares Russell 2000 ETF | | 9/29/2023 | | | $ | 178.66 | | | | 344 | | | $ | (6,026,880 | ) | | $ | (304,268 | ) |
QQQ Investco QQQ Trust Series 1 | | 9/29/2023 | | | | 289.52 | | | | 212 | | | | (6,838,272 | ) | | | (963,769 | ) |
SPY SPDR S&P 500® Trust ETF | | 9/29/2023 | | | | 386.93 | | | | 159 | | | | (6,613,287 | ) | | | (684,784 | ) |
| | | | | | | | | | | | | | | | | | | | | |
Total Options Written (Premiums Received $1,510,869) | | | | | | | | | | | | | | | $ | (1,952,821 | ) |
INNOVATOR DOUBLE STACKER 9 BUFFER ETF - JANUARY
Schedule of Investments |
April 30, 2023 (Unaudited) |
| | | Contracts | | | Notional Amount | | | Value | |
PURCHASED OPTIONS - 126.15% (a)(b) | | | | | | | | | | | | |
CALL OPTIONS - 123.25% | | | | | | | | | | | | |
QQQ Investco QQQ Trust Series 1, Expires 12/29/2023, Strike Price $266.27 | | | 237 | | | $ | 7,644,672 | | | $ | 1,668,482 | |
SPY SPDR S&P 500® Trust ETF, Expires 12/29/2023, Strike Price $3.78 | | | 165 | | | | 6,862,845 | | | | 6,727,507 | |
| | | | | | | | | | | | 8,395,989 | |
PUT OPTIONS - 2.90% | | | | | | | | | | | | |
SPY SPDR S&P 500® Trust ETF, Expires 12/29/2023, Strike Price $382.41 | | | 165 | | | | 6,862,845 | | | | 197,161 | |
| | | | | | | | | | | | 197,161 | |
TOTAL PURCHASED OPTIONS (Cost $7,416,687) | | | | | | | | | | | 8,593,150 | |
| | | Principal Amount | | | | | | | | | |
SHORT TERM INVESTMENTS - 0.30% | | | | | | | | | | | | |
Money Market Deposit Account - 0.30% | | | | | | | | | | | | |
U.S. Bank Money Market Deposit Account, 4.650% (c) | | $ | 20,342 | | | | | | | | 20,342 | |
TOTAL SHORT TERM INVESTMENTS (Cost $20,342) | | | | | | | | | | | 20,342 | |
| | | | | | | | | | | | | |
Total Investments (Cost $7,437,029) - 126.45% | | | | | | | | | | | 8,613,492 | |
Liabilities in Excess of Other Assets - (26.45)% | | | | | | | | | | | (1,801,734 | ) |
TOTAL NET ASSETS - 100.00% | | | | | | | | | | $ | 6,811,758 | |
Asset Type | | % of Net Assets | |
Purchased Options | | | 126.15 | % |
Short Term Investments | | | 0.30 | |
Total Investments | | | 126.45 | |
Liabilities in Excess of Other Assets | | | (26.45 | ) |
Net Assets | | | 100.00 | % |
| | | | | |
Percentages are stated as a percent of net assets. | | | | |
(a) | Exchange-Traded. |
(b) | Purchased option contracts are held in connection with corresponding option contracts written short. |
(c) | The U.S. Bank Money Market Deposit Account (the “MMDA”) is a short-term investment vehicle in which the Fund holds cash balances. The MMDA will bear interest at a variable rate that is determined based on conditions and may change daily and by any amount. The rate shown is as of April 30, 2023. |
The accompanying notes are an integral part of these financial statements.
INNOVATOR DOUBLE STACKER 9 BUFFER ETF - JANUARY
Schedule of Options Written (a) | | | |
April 30, 2023 (Unaudited) (Continued) | | | |
Description | | Expiration | | | Strike Price | | | Contracts | | | Notional Amount | | | Value | |
Call Options | | | | | | | | | | | | | | | | | | | | |
QQQ Investco QQQ Trust Series 1 | | 12/29/2023 | | | $ | 290.40 | | | | 237 | | | $ | (7,644,672 | ) | | $ | (1,211,430 | ) |
SPY SPDR S&P 500® Trust ETF | | 12/29/2023 | | | | 417.08 | | | | 165 | | | | (6,862,845 | ) | | | (472,842 | ) |
| | | | | | | | | | | | | | | | | | | | (1,684,272 | ) |
Put Options | | | | | | | | | | | | | | | | | | | | |
SPY SPDR S&P 500® Trust ETF | | 12/29/2023 | | | | 348.02 | | | | 165 | | | | (6,862,845 | ) | | | (112,958 | ) |
| | | | | | | | | | | | | | | | | | | | (112,958 | ) |
Total Options Written (Premiums Received $1,299,788) | | | | | | | | | | | | | | | $ | (1,797,230 | ) |
INNOVATOR DOUBLE STACKER 9 BUFFER ETF - OCTOBER
Schedule of Investments |
April 30, 2023 (Unaudited) |
| | | Contracts | | | Notional Amount | | | Value | |
PURCHASED OPTIONS - 123.58% (a)(b) | | | | | | | | | | | | |
CALL OPTIONS - 122.39% | | | | | | | | | | | | |
QQQ Investco QQQ Trust Series 1, Expires 9/29/2023, Strike Price $267.26 | | | 472 | | | $ | 15,224,832 | | | $ | 3,030,990 | |
SPY SPDR S&P 500® Trust ETF, Expires 9/29/2023, Strike Price $3.55 | | | 353 | | | | 14,682,329 | | | | 14,455,516 | |
| | | | | | | | | | | | 17,486,506 | |
PUT OPTIONS - 1.19% | | | | | | | | | | | | |
SPY SPDR S&P 500® Trust ETF, Expires 9/29/2023, Strike Price $357.17 | | | 353 | | | | 14,682,329 | | | | 169,712 | |
| | | | | | | | | | | | 169,712 | |
TOTAL PURCHASED OPTIONS (Cost $15,123,867) | | | | | | | | | | | 17,656,218 | |
| | | Principal Amount | | | | | | | | | |
SHORT TERM INVESTMENTS - 0.31% | | | | | | | | | | | | |
Money Market Deposit Account - 0.31% | | | | | | | | | | | | |
U.S. Bank Money Market Deposit Account, 4.650% (c) | | $ | 44,212 | | | | | | | | 44,212 | |
TOTAL SHORT TERM INVESTMENTS (Cost $44,212) | | | | | | | | | | | 44,212 | |
| | | | | | | | | | | | | |
Total Investments (Cost $15,168,079) - 123.89% | | | | | | | | | | | 17,700,430 | |
Liabilities in Excess of Other Assets - (23.89)% | | | | | | | | | | | (3,413,298 | ) |
TOTAL NET ASSETS - 100.00% | | | | | | | | | | $ | 14,287,132 | |
Asset Type | | % of Net Assets | |
Purchased Options | | | 123.58 | % |
Short Term Investments | | | 0.31 | |
Total Investments | | | 123.89 | |
Liabilities in Excess of Other Assets | | | (23.89 | ) |
Net Assets | | | 100.00 | % |
| | | | | |
Percentages are stated as a percent of net assets. | | | | |
(a) | Exchange-Traded. |
(b) | Purchased option contracts are held in connection with corresponding option contracts written short. |
(c) | The U.S. Bank Money Market Deposit Account (the “MMDA”) is a short-term investment vehicle in which the Fund holds cash balances. The MMDA will bear interest at a variable rate that is determined based on conditions and may change daily and by any amount. The rate shown is as of April 30, 2023. |
The accompanying notes are an integral part of these financial statements.
INNOVATOR DOUBLE STACKER 9 BUFFER ETF - OCTOBER
Schedule of Options Written (a) | | | |
April 30, 2023 (Unaudited) (Continued) | | | |
Description | | Expiration | | | Strike Price | | | Contracts | | | Notional Amount | | | Value | |
Call Options | | | | | | | | | | | | | | | | | | | | |
QQQ Investco QQQ Trust Series 1 | | 9/29/2023 | | | $ | 294.25 | | | | 472 | | | $ | (15,224,832 | ) | | $ | (1,968,098 | ) |
SPY SPDR S&P 500® Trust ETF | | 9/29/2023 | | | | 393.26 | | | | 353 | | | | (14,682,329 | ) | | | (1,343,338 | ) |
| | | | | | | | | | | | | | | | | | | | (3,311,436 | ) |
Put Options | | | | | | | | | | | | | | | | | | | | |
SPY SPDR S&P 500® Trust ETF | | 9/29/2023 | | | | 325.02 | | | | 353 | | | | (14,682,329 | ) | | | (92,874 | ) |
| | | | | | | | | | | | | | | | | | | | (92,874 | ) |
Total Options Written (Premiums Received $2,634,677) | | | | | | | | | | | | | | | $ | (3,404,310 | ) |
INNOVATOR 20+ YEAR TREASURY BOND 9 BUFFER ETF - JULY
Schedule of Investments |
April 30, 2023 (Unaudited) |
| | | Contracts | | | Notional Amount | | | Value | |
PURCHASED OPTIONS - 101.60% (a)(b) | | | | | | | | | | | | |
CALL OPTIONS - 93.72% | | | | | | | | | | | | |
TLT iShares 20+ Year Treasury Bond ETF, Expires 6/30/2023, Strike Price $1.15 | | | 5,063 | | | $ | 53,900,698 | | | $ | 53,103,732 | |
| | | | | | | | | | | | 53,103,732 | |
PUT OPTIONS - 7.88% | | | | | | | | | | | | |
TLT iShares 20+ Year Treasury Bond ETF, Expires 6/30/2023, Strike Price $115.17 | | | 5,063 | | | | 53,900,698 | | | | 4,463,490 | |
| | | | | | | | | | | | 4,463,490 | |
TOTAL PURCHASED OPTIONS (Cost $57,868,615) | | | | | | | | | | | 57,567,222 | |
| | | Principal Amount | | | | | | | | | |
SHORT TERM INVESTMENTS - 0.27% | | | | | | | | | | | | |
Money Market Deposit Account - 0.27% | | | | | | | | | | | | |
U.S. Bank Money Market Deposit Account, 4.650% (c) | | $ | 153,957 | | | | | | | | 153,957 | |
TOTAL SHORT TERM INVESTMENTS (Cost $153,957) | | | | | | | | | | | 153,957 | |
| | | | | | | | | | | | | |
Total Investments (Cost $58,022,572) - 101.87% | | | | | | | | | | | 57,721,179 | |
Liabilities in Excess of Other Assets - (1.87)% | | | | | | | | | | | (1,058,644 | ) |
TOTAL NET ASSETS - 100.00% | | | | | | | | | | $ | 56,662,535 | |
Asset Type | | % of Net Assets | |
Purchased Options | | | 101.60 | % |
Short Term Investments | | | 0.27 | |
Total Investments | | | 101.87 | |
Liabilities in Excess of Other Assets | | | (1.87 | ) |
Net Assets | | | 100.00 | % |
| | | | | |
Percentages are stated as a percent of net assets. | | | | |
(a) | Exchange-Traded. |
(b) | Purchased option contracts are held in connection with corresponding option contracts written short. |
(c) | The U.S. Bank Money Market Deposit Account (the “MMDA”) is a short-term investment vehicle in which the Fund holds cash balances. The MMDA will bear interest at a variable rate that is determined based on conditions and may change daily and by any amount. The rate shown is as of April 30, 2023. |
The accompanying notes are an integral part of these financial statements.
INNOVATOR 20+ YEAR TREASURY BOND 9 BUFFER ETF - JULY
Schedule of Options Written (a) | | | |
April 30, 2023 (Unaudited) (Continued) | | | |
Description | | Expiration | | | Strike Price | | | Contracts | | | Notional Amount | | | Value | |
Call Options | | | | | | | | | | | | | | | | | | | | |
TLT iShares 20+ Year Treasury Bond ETF | | 6/30/2023 | | | $ | 146.27 | | | | 5,063 | | | $ | (53,900,698 | ) | | $ | (14,937 | ) |
| | | | | | | | | | | | | | | | | | | | (14,937 | ) |
Put Options | | | | | | | | | | | | | | | | | | | | |
TLT iShares 20+ Year Treasury Bond ETF | | 6/30/2023 | | | | 104.80 | | | | 5,063 | | | | (53,900,698 | ) | | | (1,007,992 | ) |
| | | | | | | | | | | | | | | | | | | | (1,007,992 | ) |
Total Options Written (Premiums Received $4,282,096) | | | | | | | | | | | | | | | $ | (1,022,929 | ) |
INNOVATOR 20+ YEAR TREASURY BOND 5 FLOOR ETF – QUARTERLY
Schedule of Investments |
April 30, 2023 (Unaudited) |
| | | Contracts | | | Notional Amount | | | Value | |
PURCHASED OPTIONS - 100.32% (a)(b) | | | | | | | | | | | | |
CALL OPTIONS - 99.48% | | | | | | | | | | | | |
TLT iShares 20+ Year Treasury Bond ETF, Expires 6/30/2023, Strike Price $0.27 | | | 744 | | | $ | 7,920,624 | | | $ | 7,868,402 | |
| | | | | | | | | | | | 7,868,402 | |
PUT OPTIONS - 0.84% | | | | | | | | | | | | |
TLT iShares 20+ Year Treasury Bond ETF, Expires 6/30/2023, Strike Price $100.95 | | | 744 | | | | 7,920,624 | | | | 66,685 | |
| | | | | | | | | | | | 66,685 | |
TOTAL PURCHASED OPTIONS (Cost $7,949,683) | | | | | | | | | | | 7,935,087 | |
| | | | | | | | | | | | | |
SHORT TERM INVESTMENTS - 0.14% | | Principal Amount | | | | | | | | | |
Money Market Deposit Account - 0.14% | | | | | | | | | | | | |
U.S. Bank Money Market Deposit Account, 4.800% (c) | | $ | 11,357 | | | | | | | | 11,357 | |
TOTAL SHORT TERM INVESTMENTS (Cost $11,357) | | | | | | | | | | | 11,357 | |
| | | | | | | | | | | | | |
Total Investments (Cost $7,961,040) - 100.46% | | | | | | | | | | | 7,946,444 | |
Liabilities in Excess of Other Assets - (0.46)% | | | | | | | | | | | (36,530 | ) |
TOTAL NET ASSETS - 100.00% | | | | | | | | | | $ | 7,909,914 | |
Asset Type | | % of Net Assets | |
Purchased Options | | | 100.32 | % |
Short Term Investments | | | 0.14 | |
Total Investments | | | 100.46 | |
Liabilities in Excess of Other Assets | | | (0.46 | ) |
Net Assets | | | 100.00 | % |
Percentages are stated as a percent of net assets.
(b) | Purchased option contracts are held in connection with corresponding option contracts written short. |
(c) | The U.S. Bank Money Market Deposit Account (the “MMDA”) is a short-term investment vehicle in which the Fund holds cash balances. The MMDA will bear interest at a variable rate that is determined based on conditions and may change daily and by any amount. The rate shown is as of April 30, 2023. |
The accompanying notes are an integral part of these financial statements.
INNOVATOR 20+ YEAR TREASURY BOND 5 FLOOR ETF – QUARTERLY
Schedule of Options Written (a) | | | |
April 30, 2023 (Unaudited) (Continued) | | | |
Description | | Expiration | | | Strike Price | | | Contracts | | | Notional Amount | | | Value | |
Call Options | | | | | | | | | | | | | | | | | | | | |
TLT iShares 20+ Year Treasury Bond ETF | | 6/30/2023 | | | $ | 117.93 | | | | 744 | | | $ | (7,920,624 | ) | | $ | (31,627 | ) |
Total Options Written (Premiums Received $60,242) | | | | | | | | | | | | | | | | | | $ | (31,627 | ) |
| | | | | | | | | | | | | | | | | | | | | |
(a) Exchange-Traded. | | | | | | | | | | | | | | | | | | | | |
INNOVATOR U.S. EQUITY ACCELERATED ETF – JANUARY
Schedule of Investments | | | | |
April 30, 2023 (Unaudited) | | | | |
| | | Contracts | | | Notional Amount | | | Value | |
PURCHASED OPTIONS - 109.39% (a)(b) | | | | | | | | | | | | |
CALL OPTIONS - 109.39% | | | | | | | | | | | | |
SPY SPDR S&P 500® Trust ETF, Expires 12/29/2023, Strike Price $382.44 | | | 246 | | | $ | 10,231,878 | | | $ | 1,319,070 | |
SPY SPDR S&P 500® Trust ETF, Expires 12/29/2023, Strike Price $3.85 | | | 246 | | | | 10,231,878 | | | | 10,028,451 | |
| | | | | | | | | | | | 11,347,521 | |
TOTAL PURCHASED OPTIONS (Cost $10,360,013) | | | | | | | | | | | 11,347,521 | |
| | | Principal Amount | | | | | | | | | |
SHORT TERM INVESTMENTS - 0.40% | | | | | | | | | | | | |
Money Market Deposit Account - 0.40% | | | | | | | | | | | | |
U.S. Bank Money Market Deposit Account, 4.650% (c) | | $ | 41,348 | | | | | | | | 41,348 | |
TOTAL SHORT TERM INVESTMENTS (Cost $41,348) | | | | | | | | | | | 41,348 | |
| | | | | | | | | | | | | |
Total Investments (Cost $10,401,361) - 109.79% | | | | | | | | | | | 11,388,869 | |
Liabilities in Excess of Other Assets - (9.79)% | | | | | | | | | | | (1,015,806 | ) |
TOTAL NET ASSETS - 100.00% | | | | | | | | | | $ | 10,373,063 | |
Asset Type | | % of Net Assets | |
Purchased Options | | | 109.39 | % |
Short Term Investments | | | 0.40 | |
Total Investments | | | 109.79 | |
Liabilities in Excess of Other Assets | | | (9.79 | ) |
Net Assets | | | 100.00 | % |
| | | | | |
Percentages are stated as a percent of net assets. | | | | |
(a) | Exchange-Traded. |
(b) | Purchased option contracts are held in connection with corresponding option contracts written short. |
(c) | The U.S. Bank Money Market Deposit Account (the “MMDA”) is a short-term investment vehicle in which the Fund holds cash balances. The MMDA will bear interest at a variable rate that is determined based on conditions and may change daily and by any amount. The rate shown is as of April 30, 2023. |
The accompanying notes are an integral part of these financial statements.
INNOVATOR U.S. EQUITY ACCELERATED ETF – JANUARY
Schedule of Options Written (a) | | | |
April 30, 2023 (Unaudited) (Continued) | | | |
Description | | Expiration | | | Strike Price | | | Contracts | | | Notional Amount | | | Value | |
Call Options | | | | | | | | | | | | | | | | | | | | |
SPY SPDR S&P 500® Trust ETF | | 12/29/2023 | | | $ | 430.23 | | | | 492 | | | $ | (20,463,756 | ) | | $ | (1,009,333 | ) |
| | | | | | | | | | | | | | | | | | | | | |
Total Options Written (Premiums Received $838,807) | | | | | | | | | | | | | | | $ | (1,009,333 | ) |
INNOVATOR U.S. EQUITY ACCELERATED ETF – APRIL
Schedule of Investments |
April 30, 2023 (Unaudited) |
| | | Contracts | | | Notional Amount | | | Value | |
PURCHASED OPTIONS - 106.89% (a)(b) | | | | | | | | | | | | |
CALL OPTIONS - 106.89% | | | | | | | | | | | | |
SPY SPDR S&P 500® Trust ETF, Expires 3/28/2024, Strike Price $409.40 | | | 97 | | | $ | 4,034,521 | | | $ | 393,566 | |
SPY SPDR S&P 500® Trust ETF, Expires 3/28/2024, Strike Price $4.12 | | | 97 | | | | 4,034,521 | | | | 3,941,402 | |
| | | | | | | | | | | | 4,334,968 | |
TOTAL PURCHASED OPTIONS (Cost $4,237,458) | | | | | | | | | | | 4,334,968 | |
| | | Principal Amount | | | | | | | | | |
SHORT TERM INVESTMENTS - 1.11% | | | | | | | | | | | | |
Money Market Deposit Account - 1.11% | | | | | | | | | | | | |
U.S. Bank Money Market Deposit Account, 4.650% (c) | | $ | 44,980 | | | | | | | | 44,980 | |
TOTAL SHORT TERM INVESTMENTS (Cost $44,980) | | | | | | | | | | | 44,980 | |
| | | | | | | | | | | | | |
Total Investments (Cost $4,282,438) - 108.00% | | | | | | | | | | | 4,379,948 | |
Liabilities in Excess of Other Assets - (8.00)% | | | | | | | | | | | (324,482 | ) |
TOTAL NET ASSETS - 100.00% | | | | | | | | | | $ | 4,055,466 | |
Asset Type | | % of Net Assets | |
Purchased Options | | | 106.89 | % |
Short Term Investments | | | 1.11 | |
Total Investments | | | 108.00 | |
Liabilities in Excess of Other Assets | | | (8.00 | ) |
Net Assets | | | 100.00 | % |
| | | | | |
Percentages are stated as a percent of net assets. | | | | |
(a) | Exchange-Traded. |
(b) | Purchased option contracts are held in connection with corresponding option contracts written short. |
(c) | The U.S. Bank Money Market Deposit Account (the “MMDA”) is a short-term investment vehicle in which the Fund holds cash balances. The MMDA will bear interest at a variable rate that is determined based on conditions and may change daily and by any amount. The rate shown is as of April 30, 2023. |
The accompanying notes are an integral part of these financial statements.
INNOVATOR U.S. EQUITY ACCELERATED ETF – APRIL
Schedule of Options Written (a) |
April 30, 2023 (Unaudited) (Continued) |
Description | | Expiration | | | Strike Price | | | Contracts | | | Notional Amount | | | Value | |
Call Options | | | | | | | | | | | | | | | | | | | | |
SPY SPDR S&P 500® Trust ETF | | 3/28/2024 | | | $ | 449.88 | | | | 194 | | | $ | (8,069,042 | ) | | $ | (322,595 | ) |
| | | | | | | | | | | | | | | | | | | | | |
Total Options Written (Premiums Received $307,215) | | | | | | | | | | | | | | | $ | (322,595 | ) |
INNOVATOR U.S. EQUITY ACCELERATED ETF – JULY
Schedule of Investments | | | | | |
April 30, 2023 (Unaudited) | | | | | |
| | | Contracts | | | Notional Amount | | | Value | |
PURCHASED OPTIONS - 101.48% (a)(b) | | | | | | | | | | | | |
CALL OPTIONS - 101.48% | | | | | | | | | | | | |
SPY SPDR S&P 500® Trust ETF, Expires 6/30/2023, Strike Price $377.24 | | | 59 | | | $ | 2,453,987 | | | $ | 253,539 | |
SPY SPDR S&P 500® Trust ETF, Expires 6/30/2023, Strike Price $3.74 | | | 59 | | | | 2,453,987 | | | | 2,424,164 | |
| | | | | | | | | | | | 2,677,703 | |
TOTAL PURCHASED OPTIONS (Cost $2,493,627) | | | | | | | | | | | 2,677,703 | |
| | | Principal Amount | | | | | | | | | |
SHORT TERM INVESTMENTS - 1.24% | | | | | | | | | | | | |
Money Market Deposit Account - 1.24% | | | | | | | | | | | | |
U.S. Bank Money Market Deposit Account, 4.650% (c) | | $ | 32,736 | | | | | | | | 32,736 | |
TOTAL SHORT TERM INVESTMENTS (Cost $32,736) | | | | | | | | | | | 32,736 | |
| | | | | | | | | | | | | |
Total Investments (Cost $2,526,363) - 102.72% | | | | | | | | | | | 2,710,439 | |
Liabilities in Excess of Other Assets - (2.72)% | | | | | | | | | | | (71,797 | ) |
TOTAL NET ASSETS - 100.00% | | | | | | | | | | $ | 2,638,642 | |
Asset Type | | % of Net Assets | |
Purchased Options | | | 101.48 | % |
Short Term Investments | | | 1.24 | |
Total Investments | | | 102.72 | |
Liabilities in Excess of Other Assets | | | (2.72 | ) |
Net Assets | | | 100.00 | % |
| | | | | |
Percentages are stated as a percent of net assets. | | | | |
(a) | Exchange-Traded. |
(b) | Purchased option contracts are held in connection with corresponding option contracts written short. |
(c) | The U.S. Bank Money Market Deposit Account (the “MMDA”) is a short-term investment vehicle in which the Fund holds cash balances. The MMDA will bear interest at a variable rate that is determined based on conditions and may change daily and by any amount. The rate shown is as of April 30, 2023. |
The accompanying notes are an integral part of these financial statements.
INNOVATOR U.S. EQUITY ACCELERATED ETF – JULY
Schedule of Options Written (a) | | | |
April 30, 2023 (Unaudited) (Continued) | | | |
Description | | Expiration | | | Strike Price | | | Contracts | | | Notional Amount | | | Value | |
Call Options | | | | | | | | | | | | | | | | | | | | |
SPY SPDR S&P 500® Trust ETF | | 6/30/2023 | | | $ | 424.86 | | | | 118 | | | $ | (4,907,974 | ) | | $ | (70,246 | ) |
| | | | | | | | | | | | | | | | | | | | | |
Total Options Written (Premiums Received $197,988) | | | | | | | | | | | | | | | $ | (70,246 | ) |
INNOVATOR U.S. EQUITY ACCELERATED ETF – OCTOBER
Schedule of Investments |
April 30, 2023 (Unaudited) |
| | | Contracts | | | Notional Amount | | | Value | |
PURCHASED OPTIONS - 113.29% (a)(b) | | | | | | | | | | | | |
CALL OPTIONS - 113.29% | | | | | | | | | | | | |
SPY SPDR S&P 500® Trust ETF, Expires 9/29/2023, Strike Price $357.17 | | | 961 | | | $ | 39,970,873 | | | $ | 6,558,921 | |
SPY SPDR S&P 500® Trust ETF, Expires 9/29/2023, Strike Price $3.61 | | | 961 | | | | 39,970,873 | | | | 39,347,789 | |
| | | | | | | | | | | | 45,906,710 | |
TOTAL PURCHASED OPTIONS (Cost $37,517,500) | | | | | | | | | | | 45,906,710 | |
| | | Principal Amount | | | | | | | | | |
SHORT TERM INVESTMENTS - 0.23% | | | | | | | | | | | | |
Money Market Deposit Account - 0.23% | | | | | | | | | | | | |
U.S. Bank Money Market Deposit Account, 4.650% (c) | | $ | 93,797 | | | | | | | | 93,797 | |
TOTAL SHORT TERM INVESTMENTS (Cost $93,797) | | | | | | | | | | | 93,797 | |
| | | | | | | | | | | | | |
Total Investments (Cost $37,611,297) - 113.52% | | | | | | | | | | | 46,000,507 | |
Liabilities in Excess of Other Assets - (13.52)% | | | | | | | | | | | (5,480,100 | ) |
TOTAL NET ASSETS - 100.00% | | | | | | | | | | $ | 40,520,407 | |
Asset Type | | % of Net Assets | |
Purchased Options | | | 113.29 | % |
Short Term Investments | | | 0.23 | |
Total Investments | | | 113.52 | |
Liabilities in Excess of Other Assets | | | (13.52 | ) |
Net Assets | | | 100.00 | % |
| | | | | |
Percentages are stated as a percent of net assets. | | | | |
(a) | Exchange-Traded. |
(b) | Purchased option contracts are held in connection with corresponding option contracts written short. |
(c) | The U.S. Bank Money Market Deposit Account (the “MMDA”) is a short-term investment vehicle in which the Fund holds cash balances. The MMDA will bear interest at a variable rate that is determined based on conditions and may change daily and by any amount. The rate shown is as of April 30, 2023. |
The accompanying notes are an integral part of these financial statements.
INNOVATOR U.S. EQUITY ACCELERATED ETF – OCTOBER
Schedule of Options Written (a) |
April 30, 2023 (Unaudited) (Continued) |
Description | | Expiration | | | Strike Price | | | Contracts | | | Notional Amount | | | Value | |
Call Options | | | | | | | | | | | | | | | | | | | | |
SPY SPDR S&P 500® Trust ETF | | 9/29/2023 | | | $ | 406.11 | | | | 1,922 | | | $ | (79,941,746 | ) | | $ | (5,454,636 | ) |
| | | | | | | | | | | | | | | | | | | | | |
Total Options Written (Premiums Received $3,403,508) | | | | | | | | | | | | | | | $ | (5,454,636 | ) |
INNOVATOR U.S. EQUITY ACCELERATED PLUS ETF – JANUARY
Schedule of Investments | | | | | |
April 30, 2023 (Unaudited) | | | | | |
| | | Contracts | | | Notional Amount | | | Value | |
PURCHASED OPTIONS - 122.66% (a)(b) | | | | | | | | | | | | |
CALL OPTIONS - 122.66% | | | | | | | | | | | | |
SPY SPDR S&P 500® Trust ETF, Expires 12/29/2023, Strike Price $382.42 | | | 544 | | | $ | 22,626,592 | | | $ | 2,917,809 | |
SPY SPDR S&P 500® Trust ETF, Expires 12/29/2023, Strike Price $3.79 | | | 272 | | | | 11,313,296 | | | | 11,089,933 | |
| | | | | | | | | | | | 14,007,742 | |
TOTAL PURCHASED OPTIONS (Cost $12,582,606) | | | | | | | | | | | 14,007,742 | |
| | | Principal Amount | | | | | | | | | |
SHORT TERM INVESTMENTS - 0.33% | | | | | | | | | | | | |
Money Market Deposit Account - 0.33% | | | | | | | | | | | | |
U.S. Bank Money Market Deposit Account, 4.650% (c) | | $ | 37,798 | | | | | | | | 37,798 | |
TOTAL SHORT TERM INVESTMENTS (Cost $37,798) | | | | | | | | | | | 37,798 | |
| | | | | | | | | | | | | |
Total Investments (Cost $12,620,404) - 122.99% | | | | | | | | | | | 14,045,540 | |
Liabilities in Excess of Other Assets - (22.99)% | | | | | | | | | | | (2,625,936 | ) |
TOTAL NET ASSETS - 100.00% | | | | | | | | | | $ | 11,419,604 | |
Asset Type | | % of Net Assets | |
Purchased Options | | | 122.66 | % |
Short Term Investments | | | 0.33 | |
Total Investments | | | 122.99 | |
Liabilities in Excess of Other Assets | | | (22.99 | ) |
Net Assets | | | 100.00 | % |
| | | | | |
Percentages are stated as a percent of net assets. | | | | |
(a) | Exchange-Traded. |
(b) | Purchased option contracts are held in connection with corresponding option contracts written short. |
(c) | The U.S. Bank Money Market Deposit Account (the “MMDA”) is a short-term investment vehicle in which the Fund holds cash balances. The MMDA will bear interest at a variable rate that is determined based on conditions and may change daily and by any amount. The rate shown is as of April 30, 2023. |
The accompanying notes are an integral part of these financial statements.
INNOVATOR U.S. EQUITY ACCELERATED PLUS ETF – JANUARY
Schedule of Options Written (a) | | | |
April 30, 2023 (Unaudited) (Continued) | | | |
Description | | Expiration | | | Strike Price | | | Contracts | | | Notional Amount | | | Value | |
Call Options | | | | | | | | | | | | | | | | | | | | |
SPY SPDR S&P 500® Trust ETF | | 12/29/2023 | | | $ | 411.92 | | | | 816 | | | $ | (33,939,888 | ) | | $ | (2,618,683 | ) |
| | | | | | | | | | | | | | | | | | | | | |
Total Options Written (Premiums Received $2,092,774) | | | | | | | | | | | | | | | $ | (2,618,683 | ) |
INNOVATOR U.S. EQUITY ACCELERATED PLUS ETF – APRIL
Schedule of Investments |
April 30, 2023 (Unaudited) |
| | | Contracts | | | Notional Amount | | | Value | |
PURCHASED OPTIONS - 117.64% (a)(b) | | | | | | | | | | | | |
CALL OPTIONS - 117.64% | | | | | | | | | | | | |
SPY SPDR S&P 500® Trust ETF, Expires 3/28/2024, Strike Price $409.38 | | | 194 | | | $ | 8,069,042 | | | $ | 787,393 | |
SPY SPDR S&P 500® Trust ETF, Expires 3/28/2024, Strike Price $4.06 | | | 97 | | | | 4,034,521 | | | | 3,941,957 | |
| | | | | | | | | | | | 4,729,350 | |
TOTAL PURCHASED OPTIONS (Cost $4,632,981) | | | | | | | | | | | 4,729,350 | |
| | | Principal Amount | | | | | | | | | |
SHORT TERM INVESTMENTS - 0.29% | | | | | | | | | | | | |
Money Market Deposit Account - 0.29% | | | | | | | | | | | | |
U.S. Bank Money Market Deposit Account, 4.650% (c) | | $ | 11,528 | | | | | | | | 11,528 | |
TOTAL SHORT TERM INVESTMENTS (Cost $11,528) | | | | | | | | | | | 11,528 | |
| | | | | | | | | | | | | |
Total Investments (Cost $4,644,509) - 117.93% | | | | | | | | | | | 4,740,878 | |
Liabilities in Excess of Other Assets - (17.93)% | | | | | | | | | | | (720,762 | ) |
TOTAL NET ASSETS - 100.00% | | | | | | | | | | $ | 4,020,116 | |
Asset Type | | % of Net Assets | |
Purchased Options | | | 117.64 | % |
Short Term Investments | | | 0.29 | |
Total Investments | | | 117.93 | |
Liabilities in Excess of Other Assets | | | (17.93 | ) |
Net Assets | | | 100.00 | % |
| | | | | |
Percentages are stated as a percent of net assets. | | | | |
(a) | Exchange-Traded. |
(b) | Purchased option contracts are held in connection with corresponding option contracts written short. |
(c) | The U.S. Bank Money Market Deposit Account (the “MMDA”) is a short-term investment vehicle in which the Fund holds cash balances. The MMDA will bear interest at a variable rate that is determined based on conditions and may change daily and by any amount. The rate shown is as of April 30, 2023. |
The accompanying notes are an integral part of these financial statements.
INNOVATOR U.S. EQUITY ACCELERATED PLUS ETF – APRIL
Schedule of Options Written (a) |
April 30, 2023 (Unaudited) (Continued) |
Description | | Expiration | | | Strike Price | | | Contracts | | | Notional Amount | | | Value | |
Call Options | | | | | | | | | | | | | | | | | | | | |
SPY SPDR S&P 500® Trust ETF | | 3/28/2024 | | | $ | 434.69 | | | | 291 | | | $ | (12,103,563 | ) | | $ | (718,968 | ) |
| | | | | | | | | | | | | | | | | | | | | |
Total Options Written (Premiums Received $689,291) | | | | | | | | | | | | | | | $ | (718,968 | ) |
INNOVATOR U.S. EQUITY ACCELERATED PLUS ETF – JULY
Schedule of Investments | | | | | |
April 30, 2023 (Unaudited) | | | | | |
| | | Contracts | | | Notional Amount | | | Value | |
PURCHASED OPTIONS - 112.16% (a)(b) | | | | | | | | | | | | |
CALL OPTIONS - 112.16% | | | | | | | | | | | | |
SPY SPDR S&P 500® Trust ETF, Expires 6/30/2023, Strike Price $377.25 | | | 536 | | | $ | 22,293,848 | | | $ | 2,302,843 | |
SPY SPDR S&P 500® Trust ETF, Expires 6/30/2023, Strike Price $3.75 | | | 268 | | | | 11,146,924 | | | | 11,011,193 | |
| | | | | | | | | | | | 13,314,036 | |
TOTAL PURCHASED OPTIONS (Cost $12,426,150) | | | | | | | | | | | 13,314,036 | |
| | | Principal Amount | | | | | | | | | |
SHORT TERM INVESTMENTS - 0.14% | | | | | | | | | | | | |
Money Market Deposit Account - 0.14% | | | | | | | | | | | | |
U.S. Bank Money Market Deposit Account, 4.650% (c) | | $ | 17,204 | | | | | | | | 17,204 | |
TOTAL SHORT TERM INVESTMENTS (Cost $17,204) | | | | | | | | | | | 17,204 | |
| | | | | | | | | | | | | |
Total Investments (Cost $12,443,354) - 112.30% | | | | | | | | | | | 13,331,240 | |
Liabilities in Excess of Other Assets - (12.30)% | | | | | | | | | | | (1,461,047 | ) |
TOTAL NET ASSETS - 100.00% | | | | | | | | | | $ | 11,870,193 | |
Asset Type | | % of Net Assets | |
Purchased Options | | | 112.16 | % |
Short Term Investments | | | 0.14 | |
Total Investments | | | 112.30 | |
Liabilities in Excess of Other Assets | | | (12.30 | ) |
Net Assets | | | 100.00 | % |
| | | | | |
Percentages are stated as a percent of net assets. | | | | |
(a) | Exchange-Traded. |
(b) | Purchased option contracts are held in connection with corresponding option contracts written short. |
(c) | The U.S. Bank Money Market Deposit Account (the “MMDA”) is a short-term investment vehicle in which the Fund holds cash balances. The MMDA will bear interest at a variable rate that is determined based on conditions and may change daily and by any amount. The rate shown is as of April 30, 2023. |
The accompanying notes are an integral part of these financial statements.
INNOVATOR U.S. EQUITY ACCELERATED PLUS ETF – JULY
Schedule of Options Written (a) | | | |
April 30, 2023 (Unaudited) (Continued) | | | |
Description | | Expiration | | | Strike Price | | | Contracts | | | Notional Amount | | | Value | |
Call Options | | | | | | | | | | | | | | | | | | | | |
SPY SPDR S&P 500® Trust ETF | | 6/30/2023 | | | $ | 406.41 | | | | 804 | | | $ | (33,440,772 | ) | | $ | (1,453,455 | ) |
| | | | | | | | | | | | | | | | | | | | | |
Total Options Written (Premiums Received $2,013,551) | | | | | | | | | | | | | | | $ | (1,453,455 | ) |
INNOVATOR U.S. EQUITY ACCELERATED PLUS ETF – OCTOBER
Schedule of Investments | | | | | |
April 30, 2023 (Unaudited) | | | | | |
| | | Contracts | | | Notional Amount | | | Value | |
PURCHASED OPTIONS - 130.74% (a)(b) | | | | | | | | | | | | |
CALL OPTIONS - 130.74% | | | | | | | | | | | | |
SPY SPDR S&P 500® Trust ETF, Expires 9/29/2023, Strike Price $357.18 | | | 1,030 | | | $ | 42,840,790 | | | $ | 7,028,947 | |
SPY SPDR S&P 500® Trust ETF, Expires 9/29/2023, Strike Price $3.53 | | | 515 | | | | 21,420,395 | | | | 21,090,497 | |
| | | | | | | | | | | | 28,119,444 | |
TOTAL PURCHASED OPTIONS (Cost $23,924,072) | | | | | | | | | | | 28,119,444 | |
| | | Principal Amount | | | | | | | | | |
SHORT TERM INVESTMENTS - 0.28% | | | | | | | | | | | | |
Money Market Deposit Account - 0.28% | | | | | | | | | | | | |
U.S. Bank Money Market Deposit Account, 4.650% (c) | | $ | 59,184 | | | | | | | | 59,184 | |
TOTAL SHORT TERM INVESTMENTS (Cost $59,184) | | | | | | | | | | | 59,184 | |
| | | | | | | | | | | | | |
Total Investments (Cost $23,983,256) - 131.02% | | | | | | | | | | | 28,178,628 | |
Liabilities in Excess of Other Assets - (31.02)% | | | | | | | | | | | (6,671,206 | ) |
TOTAL NET ASSETS - 100.00% | | | | | | | | | | $ | 21,507,422 | |
Asset Type | | % of Net Assets | |
Purchased Options | | | 130.74 | % |
Short Term Investments | | | 0.28 | |
Total Investments | | | 131.02 | |
Liabilities in Excess of Other Assets | | | (31.02 | ) |
Net Assets | | | 100.00 | % |
| | | | | |
Percentages are stated as a percent of net assets. | | | | |
(a) | Exchange-Traded. |
(b) | Purchased option contracts are held in connection with corresponding option contracts written short. |
(c) | The U.S. Bank Money Market Deposit Account (the “MMDA”) is a short-term investment vehicle in which the Fund holds cash balances. The MMDA will bear interest at a variable rate that is determined based on conditions and may change daily and by any amount. The rate shown is as of April 30, 2023. |
The accompanying notes are an integral part of these financial statements.
INNOVATOR U.S. EQUITY ACCELERATED PLUS ETF – OCTOBER
Schedule of Options Written (a) | | | |
April 30, 2023 (Unaudited) (Continued) | | | |
Description | | Expiration | | | Strike Price | | | Contracts | | | Notional Amount | | | Value | |
Call Options | | | | | | | | | | | | | | | | | | | | |
SPY SPDR S&P 500® Trust ETF | | 9/29/2023 | | | $ | 386.90 | | | | 1,545 | | | $ | (64,261,185 | ) | | $ | (6,657,760 | ) |
| | | | | | | | | | | | | | | | | | | | | |
Total Options Written (Premiums Received $4,912,424) | | | | | | | | | | | | | | | $ | (6,657,760 | ) |
INNOVATOR U.S. EQUITY ACCELERATED 9 BUFFER ETF – JANUARY
Schedule of Investments | | | | |
April 30, 2023 (Unaudited) | | | | |
| | | Contracts | | | Notional Amount | | | Value | |
PURCHASED OPTIONS - 115.39% (a)(b) | | | | | | | | | | | | |
CALL OPTIONS - 112.48% | | | | | | | | | | | | |
SPY SPDR S&P 500® Trust ETF, Expires 12/29/2023, Strike Price $382.43 | | | 1,484 | | | $ | 61,724,012 | | | $ | 7,958,455 | |
SPY SPDR S&P 500® Trust ETF, Expires 12/29/2023, Strike Price $3.80 | | | 1,484 | | | | 61,724,012 | | | | 60,503,942 | |
| | | | | | | | | | | | 68,462,397 | |
PUT OPTIONS - 2.91% | | | | | | | | | | | | |
SPY SPDR S&P 500® Trust ETF, Expires 12/29/2023, Strike Price $382.42 | | | 1,484 | | | | 61,724,012 | | | | 1,773,528 | |
| | | | | | | | | | | | 1,773,528 | |
TOTAL PURCHASED OPTIONS (Cost $66,903,866) | | | | | | | | | | | 70,235,925 | |
| | | Principal Amount | | | | | | | | | |
SHORT TERM INVESTMENTS - 0.27% | | | | | | | | | | | | |
Money Market Deposit Account - 0.27% | | | | | | | | | | | | |
U.S. Bank Money Market Deposit Account, 4.650% (c) | | $ | 165,000 | | | | | | | | 165,000 | |
TOTAL SHORT TERM INVESTMENTS (Cost $165,000) | | | | | | | | | | | 165,000 | |
| | | | | | | | | | | | | |
Total Investments (Cost $67,068,866) - 115.66% | | | | | | | | | | | 70,400,925 | |
Liabilities in Excess of Other Assets - (15.66)% | | | | | | | | | | | (9,529,959 | ) |
TOTAL NET ASSETS - 100.00% | | | | | | | | | | $ | 60,870,966 | |
Asset Type | | % of Net Assets | |
Purchased Options | | | 115.39 | % |
Short Term Investments | | | 0.27 | |
Total Investments | | | 115.66 | |
Liabilities in Excess of Other Assets | | | (15.66 | ) |
Net Assets | | | 100.00 | % |
| | | | | |
Percentages are stated as a percent of net assets. | | | | |
(a) | Exchange-Traded. |
(b) | Purchased option contracts are held in connection with corresponding option contracts written short. |
(c) | The U.S. Bank Money Market Deposit Account (the “MMDA”) is a short-term investment vehicle in which the Fund holds cash balances. The MMDA will bear interest at a variable rate that is determined based on conditions and may change daily and by any amount. The rate shown is as of April 30, 2023. |
The accompanying notes are an integral part of these financial statements.
INNOVATOR U.S. EQUITY ACCELERATED 9 BUFFER ETF – JANUARY
Schedule of Options Written (a) | | | |
April 30, 2023 (Unaudited) (Continued) | | | |
Description | | Expiration | | | Strike Price | | | Contracts | | | Notional Amount | | | Value | |
Call Options | | | | | | | | | | | | | | | | | | | | |
SPY SPDR S&P 500® Trust ETF | | 12/29/2023 | | | $ | 417.23 | | | | 2,968 | | | $ | (123,448,024 | ) | | $ | (8,476,341 | ) |
| | | | | | | | | | | | | | | | | | | | (8,476,341 | ) |
Put Options | | | | | | | | | | | | | | | | | | | | |
SPY SPDR S&P 500® Trust ETF | | 12/29/2023 | | | | 348.00 | | | | 1,484 | | | | (61,724,012 | ) | | | (1,015,590 | ) |
| | | | | | | | | | | | | | | | | | | | (1,015,590 | ) |
Total Options Written (Premiums Received $9,405,318) | | | | | | | | | | | | | | | $ | (9,491,931 | ) |
INNOVATOR U.S. EQUITY ACCELERATED 9 BUFFER ETF – APRIL
Schedule of Investments | | | | |
April 30, 2023 (Unaudited) | | | | |
| | | Contracts | | | Notional Amount | | | Value | |
PURCHASED OPTIONS - 113.66% (a)(b) | | | | | | | | | | | | |
CALL OPTIONS - 108.40% | | | | | | | | | | | | |
SPY SPDR S&P 500® Trust ETF, Expires 3/28/2024, Strike Price $409.39 | | | 1,281 | | | $ | 53,280,633 | | | $ | 5,198,375 | |
SPY SPDR S&P 500® Trust ETF, Expires 3/28/2024, Strike Price $4.07 | | | 1,281 | | | | 53,280,633 | | | | 52,056,983 | |
| | | | | | | | | | | | 57,255,358 | |
PUT OPTIONS - 5.26% | | | | | | | | | | | | |
SPY SPDR S&P 500® Trust ETF, Expires 3/28/2024, Strike Price $409.38 | | | 1,281 | | | | 53,280,633 | | | | 2,779,245 | |
| | | | | | | | | | | | 2,779,245 | |
TOTAL PURCHASED OPTIONS (Cost $59,391,634) | | | | | | | | | | | 60,034,603 | |
| | | Principal Amount | | | | | | | | | |
SHORT TERM INVESTMENTS - 0.29% | | | | | | | | | | | | |
Money Market Deposit Account - 0.29% | | | | | | | | | | | | |
U.S. Bank Money Market Deposit Account, 4.650% (c) | | $ | 153,945 | | | | | | | | 153,945 | |
TOTAL SHORT TERM INVESTMENTS (Cost $153,945) | | | | | | | | | | | 153,945 | |
| | | | | | | | | | | | | |
Total Investments (Cost $59,545,579) - 113.95% | | | | | | | | | | | 60,188,548 | |
Liabilities in Excess of Other Assets - (13.95)% | | | | | | | | | | | (7,371,015 | ) |
TOTAL NET ASSETS - 100.00% | | | | | | | | | | $ | 52,817,533 | |
Asset Type | | % of Net Assets | |
Purchased Options | | | 113.66 | % |
Short Term Investments | | | 0.29 | |
Total Investments | | | 113.95 | |
Liabilities in Excess of Other Assets | | | (13.95 | ) |
Net Assets | | | 100.00 | % |
| | | | | |
Percentages are stated as a percent of net assets. | | | | |
(a) | Exchange-Traded. |
(b) | Purchased option contracts are held in connection with corresponding option contracts written short. |
(c) | The U.S. Bank Money Market Deposit Account (the “MMDA”) is a short-term investment vehicle in which the Fund holds cash balances. The MMDA will bear interest at a variable rate that is determined based on conditions and may change daily and by any amount. The rate shown is as of April 30, 2023. |
The accompanying notes are an integral part of these financial statements.
INNOVATOR U.S. EQUITY ACCELERATED 9 BUFFER ETF – APRIL
Schedule of Options Written (a) | | | |
April 30, 2023 (Unaudited) (Continued) | | | |
Description | | Expiration | | | Strike Price | | | Contracts | | | Notional Amount | | | Value | |
Call Options | | | | | | | | | | | | | | | | | | | | |
SPY SPDR S&P 500® Trust ETF | | 3/28/2024 | | | $ | 439.40 | | | | 2,562 | | | $ | (106,561,266 | ) | | $ | (5,651,081 | ) |
| | | | | | | | | | | | | | | | | | | | (5,651,081 | ) |
Put Options | | | | | | | | | | | | | | | | | | | | |
SPY SPDR S&P 500® Trust ETF | | 3/28/2024 | | | | 372.53 | | | | 1,281 | | | | (53,280,633 | ) | | | (1,692,585 | ) |
| | | | | | | | | | | | | | | | | | | | (1,692,585 | ) |
Total Options Written (Premiums Received $7,385,259) | | | | | | | | | | | | | | | $ | (7,343,666 | ) |
INNOVATOR U.S. EQUITY ACCELERATED 9 BUFFER ETF – JULY
Schedule of Investments | | | | | |
April 30, 2023 (Unaudited) | | | | | |
| | | Contracts | | | Notional Amount | | | Value | |
PURCHASED OPTIONS - 107.07% (a)(b) | | | | | | | | | | | | |
CALL OPTIONS - 106.53% | | | | | | | | | | | | |
SPY SPDR S&P 500® Trust ETF, Expires 6/30/2023, Strike Price $377.26 | | | 787 | | | $ | 32,733,691 | | | $ | 3,380,511 | |
SPY SPDR S&P 500® Trust ETF, Expires 6/30/2023, Strike Price $3.80 | | | 787 | | | | 32,733,691 | | | | 32,331,211 | |
| | | | | | | | | | | | 35,711,722 | |
PUT OPTIONS - 0.54% | | | | | | | | | | | | |
SPY SPDR S&P 500® Trust ETF, Expires 6/30/2023, Strike Price $377.27 | | | 787 | | | | 32,733,691 | | | | 181,703 | |
| | | | | | | | | | | | 181,703 | |
TOTAL PURCHASED OPTIONS (Cost $37,553,807) | | | | | | | | | | | 35,893,425 | |
| | | Principal Amount | | | | | | | | | |
SHORT TERM INVESTMENTS - 0.29% | | | | | | | | | | | | |
Money Market Deposit Account - 0.29% | | | | | | | | | | | | |
U.S. Bank Money Market Deposit Account, 4.650% (c) | | $ | 97,042 | | | | | | | | 97,042 | |
TOTAL SHORT TERM INVESTMENTS (Cost $97,042) | | | | | | | | | | | 97,042 | |
| | | | | | | | | | | | | |
Total Investments (Cost $37,650,849) - 107.36% | | | | | | | | | | | 35,990,467 | |
Liabilities in Excess of Other Assets - (7.36)% | | | | | | | | | | | (2,469,857 | ) |
TOTAL NET ASSETS - 100.00% | | | | | | | | | | $ | 33,520,610 | |
Asset Type | | % of Net Assets | |
Purchased Options | | | 107.07 | % |
Short Term Investments | | | 0.29 | |
Total Investments | | | 107.36 | |
Liabilities in Excess of Other Assets | | | (7.36 | ) |
Net Assets | | | 100.00 | % |
| | | | | |
Percentages are stated as a percent of net assets. | | | | |
(a) | Exchange-Traded. |
(b) | Purchased option contracts are held in connection with corresponding option contracts written short. |
(c) | The U.S. Bank Money Market Deposit Account (the “MMDA”) is a short-term investment vehicle in which the Fund holds cash balances. The MMDA will bear interest at a variable rate that is determined based on conditions and may change daily and by any amount. The rate shown is as of April 30, 2023. |
The accompanying notes are an integral part of these financial statements.
INNOVATOR U.S. EQUITY ACCELERATED 9 BUFFER ETF – JULY
Schedule of Options Written (a) | | | |
April 30, 2023 (Unaudited) (Continued) | | | |
Description | | Expiration | | | Strike Price | | | Contracts | | | Notional Amount | | | Value | |
Call Options | | | | | | | | | | | | | | | | | | | | |
SPY SPDR S&P 500® Trust ETF | | 6/30/2023 | | | $ | 410.30 | | | | 1,574 | | | $ | (65,467,382 | ) | | $ | (2,384,862 | ) |
| | | | | | | | | | | | | | | | | | | | (2,384,862 | ) |
Put Options | | | | | | | | | | | | | | | | | | | | |
SPY SPDR S&P 500® Trust ETF | | 6/30/2023 | | | | 343.31 | | | | 787 | | | | (32,733,691 | ) | | | (63,936 | ) |
| | | | | | | | | | | | | | | | | | | | (63,936 | ) |
Total Options Written (Premiums Received $4,962,288) | | | | | | | | | | | | | | | $ | (2,448,798 | ) |
INNOVATOR U.S. EQUITY ACCELERATED 9 BUFFER ETF – OCTOBER
Schedule of Investments | | | | | |
April 30, 2023 (Unaudited) | | | | | |
| | | Contracts | | | Notional Amount | | | Value | |
PURCHASED OPTIONS - 119.43% (a)(b) | | | | | | | | | | | | |
CALL OPTIONS - 118.24% | | | | | | | | | | | | |
SPY SPDR S&P 500® Trust ETF, Expires 9/29/2023, Strike Price $357.19 | | | 1,234 | | | $ | 51,325,762 | | | $ | 8,419,989 | |
SPY SPDR S&P 500® Trust ETF, Expires 9/29/2023, Strike Price $3.54 | | | 1,234 | | | | 51,325,762 | | | | 50,534,089 | |
| | | | | | | | | | | | 58,954,078 | |
PUT OPTIONS - 1.19% | | | | | | | | | | | | |
SPY SPDR S&P 500® Trust ETF, Expires 9/29/2023, Strike Price $357.20 | | | 1,234 | | | | 51,325,762 | | | | 593,628 | |
| | | | | | | | | | | | 593,628 | |
TOTAL PURCHASED OPTIONS (Cost $53,837,640) | | | | | | | | | | | 59,547,706 | |
| | | Principal Amount | | | | | | | | | |
SHORT TERM INVESTMENTS - 0.26% | | | | | | | | | | | | |
Money Market Deposit Account - 0.26% | | | | | | | | | | | | |
U.S. Bank Money Market Deposit Account, 4.650% (c) | | $ | 131,520 | | | | | | | | 131,520 | |
TOTAL SHORT TERM INVESTMENTS (Cost $131,520) | | | | | | | | | | | 131,520 | |
| | | | | | | | | | | | | |
Total Investments (Cost $53,969,160) - 119.69% | | | | | | | | | | | 59,679,226 | |
Liabilities in Excess of Other Assets - (19.69)% | | | | | | | | | | | (9,817,270 | ) |
TOTAL NET ASSETS - 100.00% | | | | | | | | | | $ | 49,861,956 | |
Asset Type | | % of Net Assets | |
Purchased Options | | | 119.43 | % |
Short Term Investments | | | 0.26 | |
Total Investments | | | 119.69 | |
Liabilities in Excess of Other Assets | | | (19.69 | ) |
Net Assets | | | 100.00 | % |
| | | | | |
Percentages are stated as a percent of net assets. | | | | |
(a) | Exchange-Traded. |
(b) | Purchased option contracts are held in connection with corresponding option contracts written short. |
(c) | The U.S. Bank Money Market Deposit Account (the “MMDA”) is a short-term investment vehicle in which the Fund holds cash balances. The MMDA will bear interest at a variable rate that is determined based on conditions and may change daily and by any amount. The rate shown is as of April 30, 2023. |
The accompanying notes are an integral part of these financial statements.
INNOVATOR U.S. EQUITY ACCELERATED 9 BUFFER ETF – OCTOBER
Schedule of Options Written (a) | | | |
April 30, 2023 (Unaudited) (Continued) | | | |
Description | | Expiration | | | Strike Price | | | Contracts | | | Notional Amount | | | Value | |
Call Options | | | | | | | | | | | | | | | | | | | | |
SPY SPDR S&P 500® Trust ETF | | 9/29/2023 | | | $ | 392.90 | | | | 2,468 | | | $ | (102,651,524 | ) | | $ | (9,461,325 | ) |
| | | | | | | | | | | | | | | | | | | | (9,461,325 | ) |
Put Options | | | | | | | | | | | | | | | | | | | | |
SPY SPDR S&P 500® Trust ETF | | 9/29/2023 | | | | 325.04 | | | | 1,234 | | | | (51,325,762 | ) | | | (324,776 | ) |
| | | | | | | | | | | | | | | | | | | | (324,776 | ) |
Total Options Written (Premiums Received $9,047,200) | | | | | | | | | | | | | | | $ | (9,786,101 | ) |
INNOVATOR GROWTH ACCELERATED PLUS ETF – JANUARY
Schedule of Investments |
April 30, 2023 (Unaudited) |
| | | Contracts | | | Notional Amount | | | Value | |
PURCHASED OPTIONS - 150.55% (a)(b) | | | | | | | | | | | | |
CALL OPTIONS - 150.55% | | | | | | | | | | | | |
QQQ Investco QQQ Trust Series 1, Expires 12/29/2023, Strike Price $266.29 | | | 2,164 | | | $ | 69,801,984 | | | $ | 15,230,989 | |
QQQ Investco QQQ Trust Series 1, Expires 12/29/2023, Strike Price $2.67 | | | 1,082 | | | | 34,900,992 | | | | 34,453,791 | |
| | | | | | | | | | | | 49,684,780 | |
TOTAL PURCHASED OPTIONS (Cost $40,369,683) | | | | | | | | | | | 49,684,780 | |
| | | Principal Amount | | | | | | | | | |
SHORT TERM INVESTMENTS - 0.32% | | | | | | | | | | | | |
Money Market Deposit Account - 0.32% | | | | | | | | | | | | |
U.S. Bank Money Market Deposit Account, 4.650% (c) | | $ | 106,688 | | | | | | | | 106,688 | |
TOTAL SHORT TERM INVESTMENTS (Cost $106,688) | | | | | | | | | | | 106,688 | |
| | | | | | | | | | | | | |
Total Investments (Cost $40,476,371) - 150.87% | | | | | | | | | | | 49,791,468 | |
Liabilities in Excess of Other Assets - (50.87)% | | | | | | | | | | | (16,788,424 | ) |
TOTAL NET ASSETS - 100.00% | | | | | | | | | | $ | 33,003,044 | |
Asset Type | | % of Net Assets | |
Purchased Options | | | 150.55 | % |
Short Term Investments | | | 0.32 | |
Total Investments | | | 150.87 | |
Liabilities in Excess of Other Assets | | | (50.87 | ) |
Net Assets | | | 100.00 | % |
| | | | | |
Percentages are stated as a percent of net assets. | | | | |
(a) | Exchange-Traded. |
(b) | Purchased option contracts are held in connection with corresponding option contracts written short. |
(c) | The U.S. Bank Money Market Deposit Account (the “MMDA”) is a short-term investment vehicle in which the Fund holds cash balances. The MMDA will bear interest at a variable rate that is determined based on conditions and may change daily and by any amount. The rate shown is as of April 30, 2023. |
The accompanying notes are an integral part of these financial statements.
INNOVATOR GROWTH ACCELERATED PLUS ETF – JANUARY
Schedule of Options Written (a) |
April 30, 2023 (Unaudited) (Continued) |
Description | | Expiration | | | Strike Price | | | Contracts | | | Notional Amount | | | Value | |
Call Options | | | | | | | | | | | | | | | | | | | | |
QQQ Investco QQQ Trust Series 1 | | 12/29/2023 | | | $ | 289.69 | | | | 3,246 | | | $ | (104,702,976 | ) | | $ | (16,768,057 | ) |
| | | | | | | | | | | | | | | | | | | | | |
Total Options Written (Premiums Received $10,048,680) | | | | | | | | | | | | | | | $ | (16,768,057 | ) |
INNOVATOR GROWTH ACCELERATED PLUS ETF – APRIL
Schedule of Investments |
April 30, 2023 (Unaudited) |
| | | Contracts | | | Notional Amount | | | Value | |
PURCHASED OPTIONS - 120.58% (a)(b) | | | | | | | | | | | | |
CALL OPTIONS - 120.58% | | | | | | | | | | | | |
QQQ Investco QQQ Trust Series 1, Expires 3/28/2024, Strike Price $320.94 | | | 592 | | | $ | 19,095,552 | | | $ | 2,103,790 | |
QQQ Investco QQQ Trust Series 1, Expires 3/28/2024, Strike Price $3.22 | | | 296 | | | | 9,547,776 | | | | 9,400,877 | |
| | | | | | | | | | | | 11,504,667 | |
TOTAL PURCHASED OPTIONS (Cost $11,297,745) | | | | | | | | | | | 11,504,667 | |
| | | Principal Amount | | | | | | | | | |
SHORT TERM INVESTMENTS - 0.34% | | | | | | | | | | | | |
Money Market Deposit Account - 0.34% | | | | | | | | | | | | |
U.S. Bank Money Market Deposit Account, 4.650% (c) | | $ | 32,893 | | | | | | | | 32,893 | |
TOTAL SHORT TERM INVESTMENTS (Cost $32,893) | | | | | | | | | | | 32,893 | |
| | | | | | | | | | | | | |
Total Investments (Cost $11,330,638) - 120.92% | | | | | | | | | | | 11,537,560 | |
Liabilities in Excess of Other Assets - (20.92)% | | | | | | | | | | | (1,996,498 | ) |
TOTAL NET ASSETS - 100.00% | | | | | | | | | | $ | 9,541,062 | |
Asset Type | | % of Net Assets | |
Purchased Options | | | 120.58 | % |
Short Term Investments | | | 0.34 | |
Total Investments | | | 120.92 | |
Liabilities in Excess of Other Assets | | | (20.92 | ) |
Net Assets | | | 100.00 | % |
| | | | | |
Percentages are stated as a percent of net assets. | | | | |
(a) | Exchange-Traded. |
(b) | Purchased option contracts are held in connection with corresponding option contracts written short. |
(c) | The U.S. Bank Money Market Deposit Account (the “MMDA”) is a short-term investment vehicle in which the Fund holds cash balances. The MMDA will bear interest at a variable rate that is determined based on conditions and may change daily and by any amount. The rate shown is as of April 30, 2023. |
The accompanying notes are an integral part of these financial statements.
INNOVATOR GROWTH ACCELERATED PLUS ETF – APRIL
Schedule of Options Written (a) |
April 30, 2023 (Unaudited) (Continued) |
Description | | Expiration | | | Strike Price | | | Contracts | | | Notional Amount | | | Value | |
Call Options | | | | | | | | | | | | | | | | | | | | |
QQQ Investco QQQ Trust Series 1 | | 3/28/2024 | | | $ | 344.23 | | | | 888 | | | $ | (28,643,328 | ) | | $ | (1,993,401 | ) |
| | | | | | | | | | | | | | | | | | | | | |
Total Options Written (Premiums Received $1,920,531) | | | | | | | | | | | | | | | $ | (1,993,401 | ) |
INNOVATOR GROWTH ACCELERATED PLUS ETF – JULY
Schedule of Investments | | | | | |
April 30, 2023 (Unaudited) | | | | | |
| | | Contracts | | | Notional Amount | | | Value | |
PURCHASED OPTIONS - 121.12% (a)(b) | | | | | | | | | | | | |
CALL OPTIONS - 121.12% | | | | | | | | | | | | |
QQQ Investco QQQ Trust Series 1, Expires 6/30/2023, Strike Price $280.28 | | | 462 | | | $ | 14,902,272 | | | $ | 2,125,311 | |
QQQ Investco QQQ Trust Series 1, Expires 6/30/2023, Strike Price $2.81 | | | 231 | | | | 7,451,136 | | | | 7,376,992 | |
| | | | | | | | | | | | 9,502,303 | |
TOTAL PURCHASED OPTIONS (Cost $9,259,148) | | | | | | | | | | | 9,502,303 | |
| | | Principal Amount | | | | | | | | | |
SHORT TERM INVESTMENTS - 0.55% | | | | | | | | | | | | |
Money Market Deposit Account - 0.55% | | | | | | | | | | | | |
U.S. Bank Money Market Deposit Account, 4.650% (c) | | $ | 43,056 | | | | | | | | 43,056 | |
TOTAL SHORT TERM INVESTMENTS (Cost $43,056) | | | | | | | | | | | 43,056 | |
| | | | | | | | | | | | | |
Total Investments (Cost $9,302,204) - 121.67% | | | | | | | | | | | 9,545,359 | |
Liabilities in Excess of Other Assets - (21.67)% | | | | | | | | | | | (1,700,201 | ) |
TOTAL NET ASSETS - 100.00% | | | | | | | | | | $ | 7,845,158 | |
Asset Type | | % of Net Assets | |
Purchased Options | | | 121.12 | % |
Short Term Investments | | | 0.55 | |
Total Investments | | | 121.67 | |
Liabilities in Excess of Other Assets | | | (21.67 | ) |
Net Assets | | | 100.00 | % |
| | | | | |
Percentages are stated as a percent of net assets. | | | | |
(a) | Exchange-Traded. |
(b) | Purchased option contracts are held in connection with corresponding option contracts written short. |
(c) | The U.S. Bank Money Market Deposit Account (the “MMDA”) is a short-term investment vehicle in which the Fund holds cash balances. The MMDA will bear interest at a variable rate that is determined based on conditions and may change daily and by any amount. The rate shown is as of April 30, 2023. |
The accompanying notes are an integral part of these financial statements.
INNOVATOR GROWTH ACCELERATED PLUS ETF – JULY
Schedule of Options Written (a) | | | |
April 30, 2023 (Unaudited) (Continued) | | | |
Description | | Expiration | | | Strike Price | | | Contracts | | | Notional Amount | | | Value | |
Call Options | | | | | | | | | | | | | | | | | | | | |
QQQ Investco QQQ Trust Series 1 | | 6/30/2023 | | | $ | 304.97 | | | | 693 | | | $ | (22,353,408 | ) | | $ | (1,694,940 | ) |
| | | | | | | | | | | | | | | | | | | | | |
Total Options Written (Premiums Received $1,470,939) | | | | | | | | | | | | | | | $ | (1,694,940 | ) |
INNOVATOR GROWTH ACCELERATED PLUS ETF – OCTOBER
Schedule of Investments |
April 30, 2023 (Unaudited) |
| | | Contracts | | | Notional Amount | | | Value | |
PURCHASED OPTIONS - 139.79% (a)(b) | | | | | | | | | | | | |
CALL OPTIONS - 139.79% | | | | | | | | | | | | |
QQQ Investco QQQ Trust Series 1, Expires 9/29/2023, Strike Price $267.27 | | | 778 | | | $ | 25,095,168 | | | $ | 4,995,312 | |
QQQ Investco QQQ Trust Series 1, Expires 9/29/2023, Strike Price $2.68 | | | 389 | | | | 12,547,584 | | | | 12,408,377 | |
| | | | | | | | | | | | 17,403,689 | |
TOTAL PURCHASED OPTIONS (Cost $13,588,866) | | | | | | | | | | | 17,403,689 | |
| | | Principal Amount | | | | | | | | | |
SHORT TERM INVESTMENTS - 0.15% | | | | | | | | | | | | |
Money Market Deposit Account - 0.15% | | | | | | | | | | | | |
U.S. Bank Money Market Deposit Account, 4.650% (c) | | $ | 18,513 | | | | | | | | 18,513 | |
TOTAL SHORT TERM INVESTMENTS (Cost $18,513) | | | | | | | | | | | 18,513 | |
| | | | | | | | | | | | | |
Total Investments (Cost $13,607,379) - 139.94% | | | | | | | | | | | 17,422,202 | |
Liabilities in Excess of Other Assets - (39.94)% | | | | | | | | | | | (4,972,279 | ) |
TOTAL NET ASSETS - 100.00% | | | | | | | | | | $ | 12,449,923 | |
Asset Type | | % of Net Assets | |
Purchased Options | | | 139.79 | % |
Short Term Investments | | | 0.15 | |
Total Investments | | | 139.94 | |
Liabilities in Excess of Other Assets | | | (39.94 | ) |
Net Assets | | | 100.00 | % |
| | | | | |
Percentages are stated as a percent of net assets. | | | | |
(a) | Exchange-Traded. |
(b) | Purchased option contracts are held in connection with corresponding option contracts written short. |
(c) | The U.S. Bank Money Market Deposit Account (the “MMDA”) is a short-term investment vehicle in which the Fund holds cash balances. The MMDA will bear interest at a variable rate that is determined based on conditions and may change daily and by any amount. The rate shown is as of April 30, 2023. |
The accompanying notes are an integral part of these financial statements.
INNOVATOR GROWTH ACCELERATED PLUS ETF – OCTOBER
Schedule of Options Written (a) |
April 30, 2023 (Unaudited) (Continued) |
Description | | Expiration | | | Strike Price | | | Contracts | | | Notional Amount | | | Value | |
Call Options | | | | | | | | | | | | | | | | | | | | |
QQQ Investco QQQ Trust Series 1 | | 9/29/2023 | | | $ | 293.18 | | | | 1,167 | | | $ | (37,642,752 | ) | | $ | (4,964,488 | ) |
| | | | | | | | | | | | | | | | | | | | | |
Total Options Written (Premiums Received $2,890,056) | | | | | | | | | | | | | | | $ | (4,964,488 | ) |
INNOVATOR DEFINED WEALTH SHIELD ETF
Schedule of Investments | | | | | |
April 30, 2023 (Unaudited) | | | | | |
| | | Contracts | | | Notional Amount | | | Value | |
PURCHASED OPTIONS - 102.12% (a)(b) | | | | | | | | | | | | |
CALL OPTIONS - 100.42% | | | | | | | | | | | | |
SPY SPDR S&P 500® Trust ETF, Expires 6/30/2023, Strike Price $1.02 | | | 9,180 | | | $ | 381,823,740 | | | $ | 379,654,506 | |
| | | | | | | | | | | | 379,654,506 | |
PUT OPTIONS - 1.70% | | | | | | | | | | | | |
SPY SPDR S&P 500® Trust ETF, Expires 6/30/2023, Strike Price $409.39 | | | 9,180 | | | | 381,823,740 | | | | 6,447,114 | |
| | | | | | | | | | | | 6,447,114 | |
TOTAL PURCHASED OPTIONS (Cost $385,383,575) | | | | | | | | | | | 386,101,620 | |
| | | Principal Amount | | | | | | | | | |
SHORT TERM INVESTMENTS - 0.14% | | | | | | | | | | | | |
Money Market Deposit Account - 0.14% | | | | | | | | | | | | |
U.S. Bank Money Market Deposit Account, 4.650% (c) | | $ | 513,208 | | | | | | | | 513,208 | |
TOTAL SHORT TERM INVESTMENTS (Cost $513,208) | | | | | | | | | | | 513,208 | |
| | | | | | | | | | | | | |
Total Investments (Cost $385,896,783) - 102.26% | | | | | | | | | | | 386,614,828 | |
Liabilities in Excess of Other Assets - (2.26)% | | | | | | | | | | | (8,558,382 | ) |
TOTAL NET ASSETS - 100.00% | | | | | | | | | | $ | 378,056,446 | |
Asset Type | | % of Net Assets | |
Purchased Options | | | 102.12 | % |
Short Term Investments | | | 0.14 | |
Total Investments | | | 102.26 | |
Liabilities in Excess of Other Assets | | | (2.26 | ) |
Net Assets | | | 100.00 | % |
| | | | | |
Percentages are stated as a percent of net assets. | | | | |
(a) | Exchange-Traded. |
(b) | Purchased option contracts are held in connection with corresponding option contracts written short. |
(c) | The U.S. Bank Money Market Deposit Account (the “MMDA”) is a short-term investment vehicle in which the Fund holds cash balances. The MMDA will bear interest at a variable rate that is determined based on conditions and may change daily and by any amount. The rate shown is as of April 30, 2023. |
The accompanying notes are an integral part of these financial statements.
INNOVATOR DEFINED WEALTH SHIELD ETF
Schedule of Options Written (a) |
April 30, 2023 (Unaudited) (Continued) |
Description | | Expiration | | | Strike Price | | | Contracts | | | Notional Amount | | | Value | |
Call Options | | | | | | | | | | | | | | | | | | | | |
SPY SPDR S&P 500® Trust ETF | | 6/30/2023 | | | $ | 420.12 | | | | 9,180 | | | $ | (381,823,740 | ) | | $ | (7,847,890 | ) |
| | | | | | | | | | | | | | | | | | | | (7,847,890 | ) |
Put Options | | | | | | | | | | | | | | | | | | | | |
SPY SPDR S&P 500® Trust ETF | | 6/30/2023 | | | | 327.51 | | | | 9,180 | | | | (381,823,740 | ) | | | (507,379 | ) |
| | | | | | | | | | | | | | | | | | | | (507,379 | ) |
Total Options Written (Premiums Received $10,402,893) | | | | | | | | | | | | | | | $ | (8,355,269 | ) |
INNOVATOR U.S. EQUITY ACCELERATED ETF – QUARTERLY
Schedule of Investments |
April 30, 2023 (Unaudited) |
| | | Contracts | | | Notional Amount | | | Value | |
PURCHASED OPTIONS - 102.45% (a)(b) | | | | | | | | | | | | |
CALL OPTIONS - 102.45% | | | | | | | | | | | | |
SPY SPDR S&P 500® Trust ETF, Expires 6/30/2023, Strike Price $409.39 | | | 487 | | | $ | 20,255,791 | | | $ | 770,590 | |
SPY SPDR S&P 500® Trust ETF, Expires 6/30/2023, Strike Price $1.04 | | | 487 | | | | 20,255,791 | | | | 20,139,748 | |
| | | | | | | | | | | | 20,910,338 | |
TOTAL PURCHASED OPTIONS (Cost $20,590,603) | | | | | | | | | | | 20,910,338 | |
| | | Principal Amount | | | | | | | | | |
SHORT TERM INVESTMENTS - 0.18% | | | | | | | | | | | | |
Money Market Deposit Account - 0.18% | | | | | | | | | | | | |
U.S. Bank Money Market Deposit Account, 4.650% (c) | | $ | 37,276 | | | | | | | | 37,276 | |
TOTAL SHORT TERM INVESTMENTS (Cost $37,276) | | | | | | | | | | | 37,276 | |
| | | | | | | | | | | | | |
Total Investments (Cost $20,627,879) - 102.63% | | | | | | | | | | | 20,947,614 | |
Liabilities in Excess of Other Assets - (2.63)% | | | | | | | | | | | (535,873 | ) |
TOTAL NET ASSETS - 100.00% | | | | | | | | | | $ | 20,411,741 | |
Asset Type | | % of Net Assets | |
Purchased Options | | | 102.45 | % |
Short Term Investments | | | 0.18 | |
Total Investments | | | 102.63 | |
Liabilities in Excess of Other Assets | | | (2.63 | ) |
Net Assets | | | 100.00 | % |
| | | | | |
Percentages are stated as a percent of net assets. | | | | |
(a) | Exchange-Traded. |
(b) | Purchased option contracts are held in connection with corresponding option contracts written short. |
(c) | The U.S. Bank Money Market Deposit Account (the “MMDA”) is a short-term investment vehicle in which the Fund holds cash balances. The MMDA will bear interest at a variable rate that is determined based on conditions and may change daily and by any amount. The rate shown is as of April 30, 2023. |
The accompanying notes are an integral part of these financial statements.
INNOVATOR U.S. EQUITY ACCELERATED ETF – QUARTERLY
Schedule of Options Written (a) | | | |
April 30, 2023 (Unaudited) (Continued) | | | |
Description | | Expiration | | | Strike Price | | | Contracts | | | Notional Amount | | | Value | |
Call Options | | | | | | | | | | | | | | | | | | | | |
SPY SPDR S&P 500® Trust ETF | | 6/30/2023 | | | $ | 426.05 | | | | 974 | | | $ | (40,511,582 | ) | | $ | (524,294 | ) |
| | | | | | | | | | | | | | | | | | | | | |
Total Options Written (Premiums Received $690,181) | | | | | | | | | | | | | | | $ | (524,294 | ) |
INNOVATOR GROWTH ACCELERATED ETF – QUARTERLY
Schedule of Investments |
April 30, 2023 (Unaudited) |
| | | Contracts | | | Notional Amount | | | Value | |
PURCHASED OPTIONS - 102.48% (a)(b) | | | | | | | | | | | | |
CALL OPTIONS - 102.48% | | | | | | | | | | | | |
QQQ Investco QQQ Trust Series 1, Expires 6/30/2023, Strike Price $320.93 | | | 337 | | | $ | 10,870,272 | | | $ | 429,574 | |
QQQ Investco QQQ Trust Series 1, Expires 6/30/2023, Strike Price $0.80 | | | 337 | | | | 10,870,272 | | | | 10,829,242 | |
| | | | | | | | | | | | 11,258,816 | |
TOTAL PURCHASED OPTIONS (Cost $11,317,568) | | | | | | | | | | | 11,258,816 | |
| | | Principal Amount | | | | | | | | | |
SHORT TERM INVESTMENTS - 0.34% | | | | | | | | | | | | |
Money Market Deposit Account - 0.34% | | | | | | | | | | | | |
U.S. Bank Money Market Deposit Account, 4.650% (c) | | $ | 37,761 | | | | | | | | 37,761 | |
TOTAL SHORT TERM INVESTMENTS (Cost $37,761) | | | | | | | | | | | 37,761 | |
| | | | | | | | | | | | | |
Total Investments (Cost $11,355,329) - 102.82% | | | | | | | | | | | 11,296,577 | |
Liabilities in Excess of Other Assets - (2.82)% | | | | | | | | | | | (310,571 | ) |
TOTAL NET ASSETS - 100.00% | | | | | | | | | | $ | 10,986,006 | |
Asset Type | | % of Net Assets | |
Purchased Options | | | 102.48 | % |
Short Term Investments | | | 0.34 | |
Total Investments | | | 102.82 | |
Liabilities in Excess of Other Assets | | | (2.82 | ) |
Net Assets | | | 100.00 | % |
| | | | | |
Percentages are stated as a percent of net assets. | | | | |
(a) | Exchange-Traded. |
(b) | Purchased option contracts are held in connection with corresponding option contracts written short. |
(c) | The U.S. Bank Money Market Deposit Account (the “MMDA”) is a short-term investment vehicle in which the Fund holds cash balances. The MMDA will bear interest at a variable rate that is determined based on conditions and may change daily and by any amount. The rate shown is as of April 30, 2023. |
The accompanying notes are an integral part of these financial statements.
INNOVATOR GROWTH ACCELERATED ETF – QUARTERLY
Schedule of Options Written (a) | | | |
April 30, 2023 (Unaudited) (Continued) | | | |
Description | | Expiration | | | Strike Price | | | Contracts | | | Notional Amount | | | Value | |
Call Options | | | | | | | | | | | | | | | | | | | | |
QQQ Investco QQQ Trust Series 1 | | 6/30/2023 | | | $ | 337.14 | | | | 674 | | | $ | (21,740,544 | ) | | $ | (303,934 | ) |
| | | | | | | | | | | | | | | | | | | | | |
Total Options Written (Premiums Received $529,224) | | | | | | | | | | | | | | | $ | (303,934 | ) |
The accompanying notes are an integral part of these financial statements.
Statements of Assets and Liabilities
April 30, 2023 (Unaudited)
|
Assets: |
Investments, at value (a) |
Interest receivable |
Receivable for investments sold |
Deposit at broker for options |
Total Assets |
| |
Liabilities: |
Options written, at value (b) |
Payable to Adviser |
Payable for investments purchased |
Total Liabilities |
Net Assets |
| |
Net Assets Consist of: |
Capital stock |
Total distributable earnings/(accumulated deficit) |
Net Assets |
| |
Net Asset Value: |
Net assets |
Shares of beneficial interest outstanding (unlimited shares without par value authorized) |
Net asset value price per share |
| |
(a) Cost of investments |
(b) Premiums received |
The accompanying notes are an integral part of these financial statements.
| | Innovator International Developed Power Buffer ETF - January | | | Innovator International Developed Power Buffer ETF - April | | | Innovator International Developed Power Buffer ETF - July | | | Innovator International Developed Power Buffer ETF - October | |
| | | | | | | | | | | | | | | | |
| | $ | 209,760,592 | | | $ | 233,259,159 | | | $ | 111,439,635 | | | $ | 114,192,835 | |
| | | 1,596 | | | | 1,328 | | | | 801 | | | | 771 | |
| | | 36,360 | | | | – | | | | 36,045 | | | | – | |
| | | 141 | | | | 205 | | | | 228 | | | | 100 | |
| | | 209,798,689 | | | | 233,260,692 | | | | 111,476,709 | | | | 114,193,706 | |
| | | | | | | | | | | | | | | | |
| | | | | | | | | | | | | | | | |
| | | 5,411,768 | | | | 8,147,032 | | | | 1,357,840 | | | | 8,882,047 | |
| | | 143,961 | | | | 115,687 | | | | 77,776 | | | | 73,666 | |
| | | 945 | | | | – | | | | 444 | | | | – | |
| | | 5,556,674 | | | | 8,262,719 | | | | 1,436,060 | | | | 8,955,713 | |
| | $ | 204,242,015 | | | $ | 224,997,973 | | | $ | 110,040,649 | | | $ | 105,237,993 | |
| | | | | | | | | | | | | | | | |
| | | | | | | | | | | | | | | | |
| | $ | 199,683,594 | | | $ | 228,013,145 | | | $ | 96,602,224 | | | $ | 89,883,329 | |
| | | 4,558,421 | | | | (3,015,172 | ) | | | 13,438,425 | | | | 15,354,664 | |
| | $ | 204,242,015 | | | $ | 224,997,973 | | | $ | 110,040,649 | | | $ | 105,237,993 | |
| | | | | | | | | | | | | | | | |
| | | | | | | | | | | | | | | | |
| | $ | 204,242,015 | | | $ | 224,997,973 | | | $ | 110,040,649 | | | $ | 105,237,993 | |
| | | 7,050,000 | | | | 9,075,000 | | | | 4,225,000 | | | | 4,100,000 | |
| | $ | 28.97 | | | $ | 24.79 | | | $ | 26.05 | | | $ | 25.67 | |
| | | | | | | | | | | | | | | | |
| | $ | 200,620,373 | | | $ | 231,005,928 | | | $ | 96,852,505 | | | $ | 93,501,551 | |
| | | 7,545,581 | | | | 8,122,386 | | | | 4,931,018 | | | | 4,714,655 | |
The accompanying notes are an integral part of these financial statements.
Statements of Assets and Liabilities
April 30, 2023 (Unaudited)
|
Assets: |
Investments, at value (a) |
Interest receivable |
Deposit at broker for options |
Total Assets |
| |
Liabilities: |
Options written, at value (b) |
Payable to Adviser |
Total Liabilities |
Net Assets |
| |
Net Assets Consist of: |
Capital stock |
Total distributable earnings/(accumulated deficit) |
Net Assets |
| |
Net Asset Value: |
Net assets |
Shares of beneficial interest outstanding (unlimited shares without par value authorized) |
Net asset value price per share |
| |
(a) Cost of investments |
(b) Premiums received |
The accompanying notes are an integral part of these financial statements.
| | Innovator Emerging Markets Power Buffer ETF -
January | | | Innovator Emerging Markets Power Buffer ETF -
April | | | Innovator Emerging Markets Power Buffer ETF -
July | | | Innovator Emerging Markets Power Buffer ETF - October | |
| | | | | | | | | | | | | | | | |
| | $ | 118,363,863 | | | $ | 53,476,182 | | | $ | 91,707,353 | | | $ | 31,125,126 | |
| | | 778 | | | | 304 | | | | 612 | | | | 182 | |
| | | 99 | | | | 150 | | | | 202 | | | | 104 | |
| | | 118,364,740 | | | | 53,476,636 | | | | 91,708,167 | | | | 31,125,412 | |
| | | | | | | | | | | | | | | | |
| | | | | | | | | | | | | | | | |
| | | 2,588,410 | | | | 2,599,640 | | | | 464,656 | | | | 433,901 | |
| | | 84,492 | | | | 33,553 | | | | 65,994 | | | | 22,726 | |
| | | 2,672,902 | | | | 2,633,193 | | | | 530,650 | | | | 456,627 | |
| | $ | 115,691,838 | | | $ | 50,843,443 | | | $ | 91,177,517 | | | $ | 30,668,785 | |
| | | | | | | | | | | | | | | | |
| | | | | | | | | | | | | | | | |
| | $ | 124,043,493 | | | $ | 56,686,277 | | | $ | 102,756,016 | | | $ | 29,025,190 | |
| | | (8,351,655 | ) | | | (5,842,834 | ) | | | (11,578,499 | ) | | | 1,643,595 | |
| | $ | 115,691,838 | | | $ | 50,843,443 | | | $ | 91,177,517 | | | $ | 30,668,785 | |
| | | | | | | | | | | | | | | | |
| | | | | | | | | | | | | | | | |
| | $ | 115,691,838 | | | $ | 50,843,443 | | | $ | 91,177,517 | | | $ | 30,668,785 | |
| | | 4,125,000 | | | | 2,100,000 | | | | 3,950,000 | | | | 1,325,000 | |
| | $ | 28.05 | | | $ | 24.21 | | | $ | 23.08 | | | $ | 23.15 | |
| | | | | | | | | | | | | | | | |
| | $ | 119,492,551 | | | $ | 53,623,447 | | | $ | 94,891,213 | | | $ | 29,270,128 | |
| | | 5,193,440 | | | | 2,499,033 | | | | 4,154,106 | | | | 1,655,798 | |
The accompanying notes are an integral part of these financial statements.
Statements of Assets and Liabilities
April 30, 2023 (Unaudited)
|
Assets: |
Investments, at value (a) |
Interest receivable |
Receivable for investments sold |
Deposit at broker for options |
Total Assets |
| |
Liabilities: |
Options written, at value (b) |
Payable to Adviser |
Payable for investments purchased |
Total Liabilities |
Net Assets |
| |
Net Assets Consist of: |
Capital stock �� |
Total distributable earnings/(accumulated deficit) |
Net Assets |
| |
Net Asset Value: |
Net assets |
Shares of beneficial interest outstanding (unlimited shares without par value authorized) |
Net asset value price per share |
| |
(a) Cost of investments |
(b) Premiums received |
The accompanying notes are an integral part of these financial statements.
| | Innovator Growth- 100 Power Buffer ETF - January | | | Innovator Growth- 100 Power Buffer ETF - April | | | Innovator Growth- 100 Power Buffer ETF - July | | | Innovator Growth- 100 Power Buffer ETF - October | |
| | | | | | | | | | | | | | | | |
| | $ | 104,843,623 | | | $ | 118,315,469 | | | $ | 77,906,400 | | | $ | 90,809,186 | |
| | | 854 | | | | 862 | | | | 743 | | | | 790 | |
| | | 64,987 | | | | – | | | | – | | | | – | |
| | | 186 | | | | 202 | | | | 265 | | | | 99 | |
| | | 104,909,650 | | | | 118,316,533 | | | | 77,907,408 | | | | 90,810,075 | |
| | | | | | | | | | | | | | | | |
| | | | | | | | | | | | | | | | |
| | | 9,933,700 | | | | 6,733,361 | | | | 1,289,449 | | | | 5,232,824 | |
| | | 61,344 | | | | 57,330 | | | | 51,873 | | | | 56,518 | |
| | | 6,177 | | | | – | | | | – | | | | – | |
| | | 10,001,221 | | | | 6,790,691 | | | | 1,341,322 | | | | 5,289,342 | |
| | $ | 94,908,429 | | | $ | 111,525,842 | | | $ | 76,566,086 | | | $ | 85,520,733 | |
| | | | | | | | | | | | | | | | |
| | | | | | | | | | | | | | | | |
| | $ | 119,440,222 | | | $ | 113,281,901 | | | $ | 77,915,743 | | | $ | 81,047,217 | |
| | | (24,531,793 | ) | | | (1,756,059 | ) | | | (1,349,657 | ) | | | 4,473,516 | |
| | $ | 94,908,429 | | | $ | 111,525,842 | | | $ | 76,566,086 | | | $ | 85,520,733 | |
| | | | | | | | | | | | | | | | |
| | | | | | | | | | | | | | | | |
| | $ | 94,908,429 | | | $ | 111,525,842 | | | $ | 76,566,086 | | | $ | 85,520,733 | |
| | | 2,475,000 | | | | 2,850,000 | | | | 1,575,000 | | | | 2,155,000 | |
| | $ | 38.35 | | | $ | 39.13 | | | $ | 48.61 | | | $ | 39.68 | |
| | | | | | | | | | | | | | | | |
| | $ | 91,814,719 | | | $ | 118,161,385 | | | $ | 72,512,060 | | | $ | 81,496,880 | |
| | | 7,239,184 | | | | 7,584,049 | | | | 7,226,352 | | | | 7,111,460 | |
The accompanying notes are an integral part of these financial statements.
Statements of Assets and Liabilities
April 30, 2023 (Unaudited)
|
Assets: |
Investments, at value (a) |
Interest receivable |
Deposit at broker for options |
Total Assets |
| |
Liabilities: |
Options written, at value (b) |
Payable to Adviser |
Total Liabilities |
Net Assets |
| |
Net Assets Consist of: |
Capital stock |
Total distributable earnings/(accumulated deficit) |
Net Assets |
| |
Net Asset Value: |
Net assets |
Shares of beneficial interest outstanding (unlimited shares without par value authorized) |
Net asset value price per share |
| |
(a) Cost of investments |
(b) Premiums received |
The accompanying notes are an integral part of these financial statements.
| | Innovator U.S. Small Cap Power Buffer ETF - January | | | Innovator U.S. Small Cap Power
Buffer ETF -
April | | | Innovator U.S. Small Cap Power Buffer ETF -
July | | | Innovator U.S. Small Cap Power Buffer ETF - October | |
| | | | | | | | | | | | | | | | |
| | $ | 180,797,599 | | | $ | 132,779,430 | | | $ | 69,701,263 | | | $ | 77,084,942 | |
| | | 1,756 | | | | 1,009 | | | | 677 | | | | 763 | |
| | | 173 | | | | 204 | | | | 197 | | | | 101 | |
| | | 180,799,528 | | | | 132,780,643 | | | | 69,702,137 | | | | 77,085,806 | |
| | | | | | | | | | | | | | | | |
| | | | | | | | | | | | | | | | |
| | | 5,191,324 | | | | 6,192,097 | | | | 246,289 | | | | 1,099,009 | |
| | | 112,923 | | | | 65,321 | | | | 45,437 | | | | 50,727 | |
| | | 5,304,247 | | | | 6,257,418 | | | | 291,726 | | | | 1,149,736 | |
| | $ | 175,495,281 | | | $ | 126,523,225 | | | $ | 69,410,411 | | | $ | 75,936,070 | |
| | | | | | | | | | | | | | | | |
| | | | | | | | | | | | | | | | |
| | $ | 192,472,590 | | | $ | 135,411,443 | | | $ | 85,124,068 | | | $ | 76,676,795 | |
| | | (16,977,309 | ) | | | (8,888,218 | ) | | | (15,713,657 | ) | | | (740,725 | ) |
| | $ | 175,495,281 | | | $ | 126,523,225 | | | $ | 69,410,411 | | | $ | 75,936,070 | |
| | | | | | | | | | | | | | | | |
| | | | | | | | | | | | | | | | |
| | $ | 175,495,281 | | | $ | 126,523,225 | | | $ | 69,410,411 | | | $ | 75,936,070 | |
| | | 5,750,000 | | | | 4,800,000 | | | | 2,850,000 | | | | 2,950,000 | |
| | $ | 30.52 | | | $ | 26.36 | | | $ | 24.35 | | | $ | 25.74 | |
| | | | | | | | | | | | | | | | |
| | $ | 187,025,003 | | | $ | 134,477,623 | | | $ | 71,772,515 | | | $ | 77,370,489 | |
| | | 11,810,891 | | | | 7,401,545 | | | | 5,302,376 | | | | 6,554,198 | |
The accompanying notes are an integral part of these financial statements.
Statements of Assets and Liabilities
April 30, 2023 (Unaudited)
|
Assets: |
Investments, at value (a) |
Interest receivable |
Deposit at broker for options |
Total Assets |
| |
Liabilities: |
Options written, at value (b) |
Payable to Adviser |
Total Liabilities |
Net Assets |
| |
Net Assets Consist of: |
Capital stock |
Total distributable earnings/(accumulated deficit) |
Net Assets |
| |
Net Asset Value: |
Net assets |
Shares of beneficial interest outstanding (unlimited shares without par value authorized) |
Net asset value price per share |
| |
(a) Cost of investments |
(b) Premiums received |
The accompanying notes are an integral part of these financial statements.
| | Innovator Double Stacker ETF - January | | | Innovator Double Stacker ETF - October | | | Innovator Triple Stacker ETF -
January | | | Innovator Triple Stacker ETF - October | |
| | | | | | | | | | | | | | | | |
| | $ | 3,227,432 | | | $ | 5,365,447 | | | $ | 6,762,953 | | | $ | 8,517,538 | |
| | | 74 | | | | 77 | | | | 125 | | | | 121 | |
| | | 105 | | | | 101 | | | | 106 | | | | 108 | |
| | | 3,227,611 | | | | 5,365,625 | | | | 6,763,184 | | | | 8,517,767 | |
| | | | | | | | | | | | | | | | |
| | | | | | | | | | | | | | | | |
| | | 536,824 | | | | 814,466 | | | | 1,564,610 | | | | 1,952,821 | |
| | | 1,722 | | | | 2,915 | | | | 3,560 | | | | 4,218 | |
| | | 538,546 | | | | 817,381 | | | | 1,568,170 | | | | 1,957,039 | |
| | $ | 2,689,065 | | | $ | 4,548,244 | | | $ | 5,195,014 | | | $ | 6,560,728 | |
| | | | | | | | | | | | | | | | |
| | | | | | | | | | | | | | | | |
| | $ | 4,387,311 | | | $ | 10,582,490 | | | $ | 17,480,798 | | | $ | 15,382,747 | |
| | | (1,698,246 | ) | | | (6,034,246 | ) | | | (12,285,784 | ) | | | (8,822,019 | ) |
| | $ | 2,689,065 | | | $ | 4,548,244 | | | $ | 5,195,014 | | | $ | 6,560,728 | |
| | | | | | | | | | | | | | | | |
| | | | | | | | | | | | | | | | |
| | $ | 2,689,065 | | | $ | 4,548,244 | | | $ | 5,195,014 | | | $ | 6,560,728 | |
| | | 100,000 | | | | 150,000 | | | | 200,000 | | | | 225,000 | |
| | $ | 26.89 | | | $ | 30.32 | | | $ | 25.98 | | | $ | 29.16 | |
| | | | | | | | | | | | | | | | |
| | $ | 2,691,694 | | | $ | 4,308,120 | | | $ | 5,829,578 | | | $ | 7,227,233 | |
| | | 287,077 | | | | 471,501 | | | | 1,183,727 | | | | 1,510,869 | |
The accompanying notes are an integral part of these financial statements.
Statements of Assets and Liabilities
April 30, 2023 (Unaudited)
|
Assets: |
Investments, at value (a) |
Interest receivable |
Deposit at broker for options |
Total Assets |
| |
Liabilities: |
Options written, at value (b) |
Payable to Adviser |
Total Liabilities |
Net Assets |
| |
Net Assets Consist of: |
Capital stock |
Total distributable earnings/(accumulated deficit) |
Net Assets |
| |
Net Asset Value: |
Net assets |
Shares of beneficial interest outstanding (unlimited shares without par value authorized) |
Net asset value price per share |
| |
(a) Cost of investments |
(b) Premiums received |
The accompanying notes are an integral part of these financial statements.
| | Innovator Double Stacker 9 Buffer ETF - January | | | Innovator Double Stacker 9 Buffer ETF - October | | | Innovator 20+ Year Treasury Bond 9 Buffer ETF - July | | | Innovator 20+ Year Treasury Bond 5 Floor ETF - Quarterly | |
| | | | | | | | | | | | | | | | |
| | $ | 8,613,492 | | | $ | 17,700,430 | | | $ | 57,721,179 | | | $ | 7,946,444 | |
| | | 89 | | | | 98 | | | | 565 | | | | 49 | |
| | | 48 | | | | 102 | | | | 103 | | | | 204 | |
| | | 8,613,629 | | | | 17,700,630 | | | | 57,721,847 | | | | 7,946,697 | |
| | | | | | | | | | | | | | | | |
| | | | | | | | | | | | | | | | |
| | | 1,797,230 | | | | 3,404,310 | | | | 1,022,929 | | | | 31,627 | |
| | | 4,641 | | | | 9,188 | | | | 36,383 | | | | 5,156 | |
| | | 1,801,871 | | | | 3,413,498 | | | | 1,059,312 | | | | 36,783 | |
| | $ | 6,811,758 | | | $ | 14,287,132 | | | $ | 56,662,535 | | | $ | 7,909,914 | |
| | | | | | | | | | | | | | | | |
| | | | | | | | | | | | | | | | |
| | $ | 11,708,006 | | | $ | 28,704,511 | | | $ | 55,881,082 | | | $ | 9,697,143 | |
| | | (4,896,248 | ) | | | (14,417,379 | ) | | | 781,453 | | | | (1,787,229 | ) |
| | $ | 6,811,758 | | | $ | 14,287,132 | | | $ | 56,662,535 | | | $ | 7,909,914 | |
| | | | | | | | | | | | | | | | |
| | | | | | | | | | | | | | | | |
| | $ | 6,811,758 | | | $ | 14,287,132 | | | $ | 56,662,535 | | | $ | 7,909,914 | |
| | | 250,000 | | | | 475,000 | | | | 2,750,000 | | | | 375,000 | |
| | $ | 27.25 | | | $ | 30.08 | | | $ | 20.60 | | | $ | 21.09 | |
| | | | | | | | | | | | | | | | |
| | $ | 7,437,029 | | | $ | 15,168,079 | | | $ | 58,022,572 | | | $ | 7,961,040 | |
| | | 1,299,788 | | | | 2,634,677 | | | | 4,282,096 | | | | 60,242 | |
The accompanying notes are an integral part of these financial statements.
Statements of Assets and Liabilities
April 30, 2023 (Unaudited)
|
Assets: |
Investments, at value (a) |
Interest receivable |
Deposit at broker for options |
Total Assets |
| |
Liabilities: |
Options written, at value (b) |
Payable to Adviser |
Total Liabilities |
Net Assets |
| |
Net Assets Consist of: |
Capital stock |
Total distributable earnings/(accumulated deficit) |
Net Assets |
| |
Net Asset Value: |
Net assets |
Shares of beneficial interest outstanding (unlimited shares without par value authorized) |
Net asset value price per share |
| |
(a) Cost of investments |
(b) Premiums received |
The accompanying notes are an integral part of these financial statements.
| | Innovator U.S. Equity Accelerated
ETF - January | | | Innovator U.S. Equity Accelerated ETF - April | | | Innovator U.S. Equity Accelerated ETF - July | | | Innovator U.S. Equity Accelerated
ETF - October | |
| | | | | | | | | | | | | | | | |
| | $ | 11,388,869 | | | $ | 4,379,948 | | | $ | 2,710,439 | | | $ | 46,000,507 | |
| | | 167 | | | | 128 | | | | 126 | | | | 403 | |
| | | – | | | | 204 | | | | 2 | | | | 100 | |
| | | 11,389,036 | | | | 4,380,280 | | | | 2,710,567 | | | | 46,001,010 | |
| | | | | | | | | | | | | | | | |
| | | | | | | | | | | | | | | | |
| | | 1,009,333 | | | | 322,595 | | | | 70,246 | | | | 5,454,636 | |
| | | 6,640 | | | | 2,219 | | | | 1,679 | | | | 25,967 | |
| | | 1,015,973 | | | | 324,814 | | | | 71,925 | | | | 5,480,603 | |
| | $ | 10,373,063 | | | $ | 4,055,466 | | | $ | 2,638,642 | | | $ | 40,520,407 | |
| | | | | | | | | | | | | | | | |
| | | | | | | | | | | | | | | | |
| | $ | 10,336,600 | | | $ | 4,452,301 | | | $ | 3,700,077 | | | $ | 41,903,987 | |
| | | 36,463 | | | | (396,835 | ) | | | (1,061,435 | ) | | | (1,383,580 | ) |
| | $ | 10,373,063 | | | $ | 4,055,466 | | | $ | 2,638,642 | | | $ | 40,520,407 | |
| | | | | | | | | | | | | | | | |
| | | | | | | | | | | | | | | | |
| | $ | 10,373,063 | | | $ | 4,055,466 | | | $ | 2,638,642 | | | $ | 40,520,407 | |
| | | 475,000 | | | | 150,000 | | | | 100,000 | | | | 1,725,000 | |
| | $ | 21.84 | | | $ | 27.04 | | | $ | 26.39 | | | $ | 23.49 | |
| | | | | | | | | | | | | | | | |
| | $ | 10,401,361 | | | $ | 4,282,438 | | | $ | 2,526,363 | | | $ | 37,611,297 | |
| | | 838,807 | | | | 307,215 | | | | 197,988 | | | | 3,403,508 | |
The accompanying notes are an integral part of these financial statements.
Statements of Assets and Liabilities
April 30, 2023 (Unaudited)
|
Assets: |
Investments, at value (a) |
Interest receivable |
Deposit at broker for options |
Total Assets |
| |
Liabilities: |
Options written, at value (b) |
Payable to Adviser |
Total Liabilities |
Net Assets |
| |
Net Assets Consist of: |
Capital stock |
Total distributable earnings/(accumulated deficit) |
Net Assets |
| |
Net Asset Value: |
Net assets |
Shares of beneficial interest outstanding (unlimited shares without par value authorized) |
Net asset value price per share |
| |
(a) Cost of investments |
(b) Premiums received |
The accompanying notes are an integral part of these financial statements.
| | Innovator U.S. Equity Accelerated Plus ETF - January | | | Innovator U.S. Equity Accelerated Plus ETF - April | | | Innovator U.S. Equity Accelerated Plus ETF - July | | | Innovator U.S. Equity Accelerated Plus ETF - October | |
| | | | | | | | | | | | | | | | |
| | $ | 14,045,540 | | | $ | 4,740,878 | | | $ | 13,331,240 | | | $ | 28,178,628 | |
| | | 65 | | | | 133 | | | | 134 | | | | 249 | |
| | | – | | | | 205 | | | | 13 | | | | 107 | |
| | | 14,045,605 | | | | 4,741,216 | | | | 13,331,387 | | | | 28,178,984 | |
| | | | | | | | | | | | | | | | |
| | | | | | | | | | | | | | | | |
| | | 2,618,683 | | | | 718,968 | | | | 1,453,455 | | | | 6,657,760 | |
| | | 7,318 | | | | 2,132 | | | | 7,739 | | | | 13,802 | |
| | | 2,626,001 | | | | 721,100 | | | | 1,461,194 | | | | 6,671,562 | |
| | $ | 11,419,604 | | | $ | 4,020,116 | | | $ | 11,870,193 | | | $ | 21,507,422 | |
| | | | | | | | | | | | | | | | |
| | | | | | | | | | | | | | | | |
| | $ | 11,829,690 | | | $ | 5,741,211 | | | $ | 15,202,301 | | | $ | 20,435,681 | |
| | | (410,086 | ) | | | (1,721,095 | ) | | | (3,332,108 | ) | | | 1,071,741 | |
| | $ | 11,419,604 | | | $ | 4,020,116 | | | $ | 11,870,193 | | | $ | 21,507,422 | |
| | | | | | | | | | | | | | | | |
| | | | | | | | | | | | | | | | |
| | $ | 11,419,604 | | | $ | 4,020,116 | | | $ | 11,870,193 | | | $ | 21,507,422 | |
| | | 525,000 | | | | 150,000 | | | | 450,000 | | | | 925,000 | |
| | $ | 21.75 | | | $ | 26.80 | | | $ | 26.38 | | | $ | 23.25 | |
| | | | | | | | | | | | | | | | |
| | $ | 12,620,404 | | | $ | 4,644,509 | | | $ | 12,443,354 | | | $ | 23,983,256 | |
| | | 2,092,774 | | | | 689,291 | | | | 2,013,551 | | | | 4,912,424 | |
The accompanying notes are an integral part of these financial statements.
Statements of Assets and Liabilities
April 30, 2023 (Unaudited)
|
Assets: |
Investments, at value (a) |
Interest receivable |
Deposit at broker for options |
Total Assets |
| |
Liabilities: |
Options written, at value (b) |
Payable to Adviser |
Total Liabilities |
Net Assets |
| |
Net Assets Consist of: |
Capital stock |
Total distributable earnings/(accumulated deficit) |
Net Assets |
| |
Net Asset Value: |
Net assets |
Shares of beneficial interest outstanding (unlimited shares without par value authorized) |
Net asset value price per share |
| |
(a) Cost of investments |
(b) Premiums received |
The accompanying notes are an integral part of these financial statements.
| | Innovator U.S. Equity Accelerated 9 Buffer ETF - January | | | Innovator U.S. Equity Accelerated 9 Buffer ETF -
April | | | Innovator U.S. Equity Accelerated 9 Buffer ETF -
July | | | Innovator U.S. Equity Accelerated 9 Buffer ETF - October | |
| | | | | | | | | | | | | | | | |
| | $ | 70,400,925 | | | $ | 60,188,548 | | | $ | 35,990,467 | | | $ | 59,679,226 | |
| | | 608 | | | | 1,525 | | | | 407 | | | | 439 | |
| | | – | | | | 206 | | | | 18 | | | | 102 | |
| | | 70,401,533 | | | | 60,190,279 | | | | 35,990,892 | | | | 59,679,767 | |
| | | | | | | | | | | | | | | | |
| | | | | | | | | | | | | | | | |
| | | 9,491,931 | | | | 7,343,666 | | | | 2,448,798 | | | | 9,786,101 | |
| | | 38,636 | | | | 29,080 | | | | 21,484 | | | | 31,710 | |
| | | 9,530,567 | | | | 7,372,746 | | | | 2,470,282 | | | | 9,817,811 | |
| | $ | 60,870,966 | | | $ | 52,817,533 | | | $ | 33,520,610 | | | $ | 49,861,956 | |
| | | | | | | | | | | | | | | | |
| | | | | | | | | | | | | | | | |
| | $ | 59,657,482 | | | $ | 54,365,973 | | | $ | 35,830,443 | | | $ | 47,498,518 | |
| | | 1,213,484 | | | | (1,548,440 | ) | | | (2,309,833 | ) | | | 2,363,438 | |
| | $ | 60,870,966 | | | $ | 52,817,533 | | | $ | 33,520,610 | | | $ | 49,861,956 | |
| | | | | | | | | | | | | | | | |
| | | | | | | | | | | | | | | | |
| | $ | 60,870,966 | | | $ | 52,817,533 | | | $ | 33,520,610 | | | $ | 49,861,956 | |
| | | 2,575,000 | | | | 1,900,000 | | | | 1,200,000 | | | | 2,000,000 | |
| | $ | 23.64 | | | $ | 27.80 | | | $ | 27.93 | | | $ | 24.93 | |
| | | | | | | | | | | | | | | | |
| | $ | 67,068,866 | | | $ | 59,545,579 | | | $ | 37,650,849 | | | $ | 53,969,160 | |
| | | 9,405,318 | | | | 7,385,259 | | | | 4,962,288 | | | | 9,047,200 | |
The accompanying notes are an integral part of these financial statements.
Statements of Assets and Liabilities
April 30, 2023 (Unaudited)
|
Assets: |
Investments, at value (a) |
Interest receivable |
Deposit at broker for options |
Total Assets |
| |
Liabilities: |
Options written, at value (b) |
Payable to Adviser |
Total Liabilities |
Net Assets |
| |
Net Assets Consist of: |
Capital stock |
Total distributable earnings/(accumulated deficit) |
Net Assets |
| |
Net Asset Value: |
Net assets |
Shares of beneficial interest outstanding (unlimited shares without par value authorized) |
Net asset value price per share �� |
| |
(a) Cost of investments |
(b) Premiums received |
The accompanying notes are an integral part of these financial statements.
| | Innovator Growth Accelerated Plus ETF - January | | | Innovator Growth Accelerated Plus ETF - April | | | Innovator Growth Accelerated Plus ETF - July | | | Innovator Growth Accelerated Plus ETF - October | |
| | | | | | | | | | | | | | | | |
| | $ | 49,791,468 | | | $ | 11,537,560 | | | $ | 9,545,359 | | | $ | 17,422,202 | |
| | | 344 | | | | 197 | | | | 59 | | | | 84 | |
| | | – | | | | 204 | | | | 2 | | | | 103 | |
| | | 49,791,812 | | | | 11,537,961 | | | | 9,545,420 | | | | 17,422,389 | |
| | | | | | | | | | | | | | | | |
| | | | | | | | | | | | | | | | |
| | | 16,768,057 | | | | 1,993,401 | | | | 1,694,940 | | | | 4,964,488 | |
| | | 20,711 | | | | 3,498 | | | | 5,322 | | | | 7,978 | |
| | | 16,788,768 | | | | 1,996,899 | | | | 1,700,262 | | | | 4,972,466 | |
| | $ | 33,003,044 | | | $ | 9,541,062 | | | $ | 7,845,158 | | | $ | 12,449,923 | |
| | | | | | | | | | | | | | | | |
| | | | | | | | | | | | | | | | |
| | $ | 32,953,339 | | | $ | 15,524,641 | | | $ | 13,578,271 | | | $ | 12,350,998 | |
| | | 49,705 | | | | (5,983,579 | ) | | | (5,733,113 | ) | | | 98,925 | |
| | $ | 33,003,044 | | | $ | 9,541,062 | | | $ | 7,845,158 | | | $ | 12,449,923 | |
| | | | | | | | | | | | | | | | |
| | | | | | | | | | | | | | | | |
| | $ | 33,003,044 | | | $ | 9,541,062 | | | $ | 7,845,158 | | | $ | 12,449,923 | |
| | | 1,700,000 | | | | 350,000 | | | | 325,000 | | | | 575,000 | |
| | $ | 19.41 | | | $ | 27.26 | | | $ | 24.14 | | | $ | 21.65 | |
| | | | | | | | | | | | | | | | |
| | $ | 40,476,371 | | | $ | 11,330,638 | | | $ | 9,302,204 | | | $ | 13,607,379 | |
| | | 10,048,680 | | | | 1,920,531 | | | | 1,470,939 | | | | 2,890,056 | |
The accompanying notes are an integral part of these financial statements.
Statements of Assets and Liabilities
April 30, 2023 (Unaudited)
|
Assets: |
Investments, at value (a) |
Interest receivable |
Deposit at broker for options |
Total Assets |
| |
Liabilities: |
Options written, at value (b) |
Payable to Adviser |
Total Liabilities |
Net Assets |
| |
Net Assets Consist of: |
Capital stock |
Total distributable earnings/(accumulated deficit) |
Net Assets |
| |
Net Asset Value: |
Net assets |
Shares of beneficial interest outstanding (unlimited shares without par value authorized) |
Net asset value price per share |
| |
(a) Cost of investments |
(b) Premiums received |
The accompanying notes are an integral part of these financial statements.
| | | Innovator Defined Wealth Shield ETF | | | Innovator U.S. Equity Accelerated ETF - Quarterly | | | Innovator Growth Accelerated ETF - Quarterly | |
| | | | | | | | | | | | | |
| | | $ | 386,614,828 | | | $ | 20,947,614 | | | $ | 11,296,577 | |
| | | | 3,629 | | | | 246 | | | | 122 | |
| | | | 206 | | | | 108 | | | | 102 | |
| | | | 386,618,663 | | | | 20,947,968 | | | | 11,296,801 | |
| | | | | | | | | | | | | |
| | | | | | | | | | | | | |
| | | | 8,355,269 | | | | 524,294 | | | | 303,934 | |
| | | | 206,948 | | | | 11,933 | | | | 6,861 | |
| | | | 8,562,217 | | | | 536,227 | | | | 310,795 | |
| | | $ | 378,056,446 | | | $ | 20,411,741 | | | $ | 10,986,006 | |
| | | | | | | | | | | | | |
| | | | | | | | | | | | | |
| | | $ | 384,797,921 | | | $ | 22,257,836 | | | $ | 16,505,246 | |
| | | | (6,741,475 | ) | | | (1,846,095 | ) | | | (5,519,240 | ) |
| | | $ | 378,056,446 | | | $ | 20,411,741 | | | $ | 10,986,006 | |
| | | | | | | | | | | | | |
| | | | | | | | | | | | | |
| | | $ | 378,056,446 | | | $ | 20,411,741 | | | $ | 10,986,006 | |
| | | | 13,800,000 | | | | 750,000 | | | | 475,000 | |
| | | $ | 27.40 | | | $ | 27.22 | | | $ | 23.13 | |
| | | | | | | | | | | | | |
| | | $ | 385,896,783 | | | $ | 20,627,879 | | | $ | 11,355,329 | |
| | | | 10,402,893 | | | | 690,181 | | | | 529,224 | |
The accompanying notes are an integral part of these financial statements.
Statements of Operations
For the Period Ended April 30, 2023 (Unaudited)
|
Investment Income: |
Interest |
Total Investment Income |
| |
Expenses: |
Investment advisory fee |
Total Expenses |
Net Investment Income/(Loss) |
| |
Realized & Unrealized Gain/(Loss): |
Net realized gain/(loss) on: |
Investments |
Redemptions sold in-kind on investments |
Redemptions sold in-kind on options written |
Options written |
Net change in unrealized appreciation/(depreciation) on: |
Investments |
Options written |
Net Realized and Unrealized Gain/(Loss) on Investments and Options Written |
Net Increase/(Decrease) in Net Assets Resulting From Operations |
The accompanying notes are an integral part of these financial statements.
| | Innovator International Developed Power Buffer ETF - January | | | Innovator International Developed Power Buffer ETF - April | | | Innovator International Developed Power Buffer ETF - July | | | Innovator International Developed Power Buffer ETF - October | |
| | | | | | | | | | | | | | | | |
| | $ | 5,289 | | | $ | 3,397 | | | $ | 9,474 | | | $ | 4,146 | |
| | | 5,289 | | | | 3,397 | | | | 9,474 | | | | 4,146 | |
| | | | | | | | | | | | | | | | |
| | | | | | | | | | | | | | | | |
| | | 559,904 | | | | 358,634 | | | | 701,342 | | | | 453,048 | |
| | | 559,904 | | | | 358,634 | | | | 701,342 | | | | 453,048 | |
| | | (554,615 | ) | | | (355,237 | ) | | | (691,868 | ) | | | (448,902 | ) |
| | | | | | | | | | | | | | | | |
| | | | | | | | | | | | | | | | |
| | | | | | | | | | | | | | | | |
| | | (7,308,102 | ) | | | (3,182,280 | ) | | | 2,945,241 | | | | (26,528 | ) |
| | | 3,666,110 | | | | 3,000,821 | | | | 6,338,581 | | | | 1,971,228 | |
| | | 1,472,356 | | | | 2,554,451 | | | | 1,396,142 | | | | 151,894 | |
| | | 1,268,767 | | | | 190,430 | | | | 627,247 | | | | (306,362 | ) |
| | | | | | | | | | | | | | | | |
| | | 13,099,661 | | | | 2,866,940 | | | | 17,473,334 | | | | 18,037,820 | |
| | | 6,304,452 | | | | 582,350 | | | | 2,470,674 | | | | (4,085,659 | ) |
| | | 18,503,244 | | | | 6,012,712 | | | | 31,251,219 | | | | 15,742,393 | |
| | $ | 17,948,629 | | | $ | 5,657,475 | | | $ | 30,559,351 | | | $ | 15,293,491 | |
The accompanying notes are an integral part of these financial statements.
Statements of Operations
For the Period Ended April 30, 2023 (Unaudited)
|
Investment Income: |
Interest |
Total Investment Income |
| |
Expenses: |
Investment advisory fee |
Total Expenses |
Net Investment Income/(Loss) |
| |
Realized & Unrealized Gain/(Loss): |
Net realized gain/(loss) on: |
Investments |
Redemptions sold in-kind on investments |
Redemptions sold in-kind on options written |
Options written |
Net change in unrealized appreciation/(depreciation) on: |
Investments |
Options written |
Net Realized and Unrealized Gain/(Loss) on Investments and Options Written |
Net Increase/(Decrease) in Net Assets Resulting From Operations |
The accompanying notes are an integral part of these financial statements.
| | Innovator Emerging Markets Power Buffer ETF - January | | | Innovator Emerging Markets Power Buffer ETF - April | | | Innovator Emerging Markets Power Buffer ETF - July | | | Innovator Emerging Markets Power Buffer ETF - October | |
| | | | | | | | | | | | | | | | |
| | $ | 3,222 | | | $ | 1,649 | | | $ | 2,762 | | | $ | 1,030 | |
| | | 3,222 | | | | 1,649 | | | | 2,762 | | | | 1,030 | |
| | | | | | | | | | | | | | | | |
| | | | | | | | | | | | | | | | |
| | | 357,124 | | | | 160,650 | | | | 345,151 | | | | 142,476 | |
| | | 357,124 | | | | 160,650 | | | | 345,151 | | | | 142,476 | |
| | | (353,902 | ) | | | (159,001 | ) | | | (342,389 | ) | | | (141,446 | ) |
| | | | | | | | | | | | | | | | |
| | | | | | | | | | | | | | | | |
| | | | | | | | | | | | | | | | |
| | | (9,799,972 | ) | | | (3,306,328 | ) | | | (381,531 | ) | | | (164,060 | ) |
| | | 4,866,883 | | | | 806,691 | | | | 1,272,353 | | | | 298,874 | |
| | | 909,201 | | | | 1,258,597 | | | | 639,367 | | | | 104,717 | |
| | | (1,453,287 | ) | | | 986,887 | | | | 9,558 | | | | (20,554 | ) |
| | | | | | | | | | | | | | | | |
| | | 4,305,261 | | | | 2,666,386 | | | | (158,610 | ) | | | 2,281,367 | |
| | | 8,212,461 | | | | 1,611,623 | | | | 4,122,635 | | | | 1,316,841 | |
| | | 7,040,547 | | | | 4,023,856 | | | | 5,503,772 | | | | 3,817,185 | |
| | $ | 6,686,645 | | | $ | 3,864,855 | | | $ | 5,161,383 | | | $ | 3,675,739 | |
The accompanying notes are an integral part of these financial statements.
Statements of Operations
For the Period Ended April 30, 2023 (Unaudited)
|
Investment Income: |
Interest |
Total Investment Income |
| |
Expenses: |
Investment advisory fee |
Total Expenses |
Net Investment Income/(Loss) |
| |
Realized & Unrealized Gain/(Loss): |
Net realized gain/(loss) on: |
Investments |
Redemptions sold in-kind on investments |
Redemptions sold in-kind on options written |
Options written |
Net change in unrealized appreciation/(depreciation) on: |
Investments |
Options written |
Net Realized and Unrealized Gain/(Loss) on Investments and Options Written |
Net Increase/(Decrease) in Net Assets Resulting From Operations |
The accompanying notes are an integral part of these financial statements.
| | Innovator Growth- 100 Power Buffer ETF - January | | | Innovator Growth- 100 Power Buffer ETF - April | | | Innovator Growth- 100 Power Buffer ETF - July | | | Innovator Growth- 100 Power Buffer ETF - October | |
| | | | | | | | | | | | | | | | |
| | $ | 3,768 | | | $ | 2,803 | | | $ | 7,303 | | | $ | 4,574 | |
| | | 3,768 | | | | 2,803 | | | | 7,303 | | | | 4,574 | |
| | | | | | | | | | | | | | | | |
| | | | | | | | | | | | | | | | |
| | | 342,244 | | | | 221,470 | | | | 419,210 | | | | 361,364 | |
| | | 342,244 | | | | 221,470 | | | | 419,210 | | | | 361,364 | |
| | | (338,476 | ) | | | (218,667 | ) | | | (411,907 | ) | | | (356,790 | ) |
| | | | | | | | | | | | | | | | |
| | | | | | | | | | | | | | | | |
| | | | | | | | | | | | | | | | |
| | | (17,903,067 | ) | | | (5,014,327 | ) | | | (2,642,387 | ) | | | 34,329 | |
| | | 11,204,272 | | | | 1,884,434 | | | | 1,266,781 | | | | 794,641 | |
| | | 2,044,095 | | | | 2,638,387 | | | | 2,146,250 | | | | 402,153 | |
| | | (10,941,588 | ) | | | 2,643,158 | | | | 1,734,656 | | | | 126,593 | |
| | | | | | | | | | | | | | | | |
| | | 20,591,611 | | | | 3,844,617 | | | | 9,267,360 | | | | 8,314,060 | |
| | | 2,974,419 | | | | 948,711 | | | | 1,369,318 | | | | 1,693,056 | |
| | | 7,969,742 | | | | 6,944,980 | | | | 13,141,978 | | | | 11,364,832 | |
| | $ | 7,631,266 | | | $ | 6,726,313 | | | $ | 12,730,071 | | | $ | 11,008,042 | |
The accompanying notes are an integral part of these financial statements.
Statements of Operations
For the Period Ended April 30, 2023 (Unaudited)
|
Investment Income: |
Interest |
Total Investment Income |
| |
Expenses: |
Investment advisory fee |
Total Expenses |
Net Investment Income/(Loss) |
| |
Realized & Unrealized Gain/(Loss): |
Net realized gain/(loss) on: |
Investments |
Redemptions sold in-kind on investments |
Redemptions sold in-kind on options written |
Options written |
Net change in unrealized appreciation/(depreciation) on: |
Investments |
Options written |
Net Realized and Unrealized Gain/(Loss) on Investments and Options Written |
Net Increase/(Decrease) in Net Assets Resulting From Operations |
The accompanying notes are an integral part of these financial statements.
| | Innovator U.S. Small Cap Power Buffer ETF
- January | | | Innovator U.S. Small Cap Power Buffer ETF - April | | | Innovator U.S. Small Cap Power Buffer ETF - July | | | Innovator U.S. Small Cap Power Buffer ETF - October | |
| | | | | | | | | | | | | | | | |
| | $ | 6,102 | | | $ | 3,936 | | | $ | 5,971 | | | $ | 4,275 | |
| | | 6,102 | | | | 3,936 | | | | 5,971 | | | | 4,275 | |
| | | | | | | | | | | | | | | | |
| | | | | | | | | | | | | | | | |
| | | 496,945 | | | | 337,872 | | | | 300,823 | | | | 331,114 | |
| | | 496,945 | | | | 337,872 | | | | 300,823 | | | | 331,114 | |
| | | (490,843 | ) | | | (333,936 | ) | | | (294,852 | ) | | | (326,839 | ) |
| | | | | | | | | | | | | | | | |
| | | | | | | | | | | | | | | | |
| | | | | | | | | | | | | | | | |
| | | (11,223,553 | ) | | | (7,066,910 | ) | | | (661,579 | ) | | | (596,959 | ) |
| | | 5,712,983 | | | | 92,917 | | | | 774,746 | | | | 114,596 | |
| | | 1,801,239 | | | | 2,864,246 | | | | 625,224 | | | | 104,836 | |
| | | (343,566 | ) | | | 3,616,040 | | | | 86,665 | | | | 52,503 | |
| | | | | | | | | | | | | | | | |
| | | (186,104 | ) | | | 4,772,434 | | | | (5,352,709 | ) | | | (3,874,431 | ) |
| | | 3,991,281 | | | | (1,438,400 | ) | | | 4,847,326 | | | | 6,484,569 | |
| | | (247,720 | ) | | | 2,840,327 | | | | 319,673 | | | | 2,285,114 | |
| | $ | (738,563 | ) | | $ | 2,506,391 | | | $ | 24,821 | | | $ | 1,958,275 | |
The accompanying notes are an integral part of these financial statements.
Statements of Operations
For the Period Ended April 30, 2023 (Unaudited)
|
Investment Income: |
Interest |
Total Investment Income |
| |
Expenses: |
Investment advisory fee |
Total Expenses |
Net Investment Income/(Loss) |
| |
Realized & Unrealized Gain/(Loss): |
Net realized gain/(loss) on: |
Investments |
Redemptions sold in-kind on investments |
Redemptions sold in-kind on options written |
Options written |
Net change in unrealized appreciation/(depreciation) on: |
Investments |
Options written |
Net Realized and Unrealized Gain/(Loss) on Investments and Options Written |
Net Increase/(Decrease) in Net Assets Resulting From Operations |
The accompanying notes are an integral part of these financial statements.
| | Innovator Double Stacker ETF -
January | | | Innovator Double Stacker ETF - October | | | Innovator Triple
Stacker ETF -
January | | | Innovator Triple Stacker ETF - October | |
| | | | | | | | | | | | | | | | |
| | $ | 460 | | | $ | 530 | | | $ | 530 | | | $ | 704 | |
| | | 460 | | | | 530 | | | | 530 | | | | 704 | |
| | | | | | | | | | | | | | | | |
| | | | | | | | | | | | | | | | |
| | | 10,304 | | | | 16,660 | | | | 20,809 | | | | 23,803 | |
| | | 10,304 | | | | 16,660 | | | | 20,809 | | | | 23,803 | |
| | | (9,844 | ) | | | (16,130 | ) | | | (20,279 | ) | | | (23,099 | ) |
| | | | | | | | | | | | | | | | |
| | | | | | | | | | | | | | | | |
| | | | | | | | | | | | | | | | |
| | | (990,401 | ) | | | – | | | | (2,380,531 | ) | | | 33,782 | |
| | | – | | | | – | | | | (235,116 | ) | | | – | |
| | | – | | | | – | | | | 126,077 | | | | – | |
| | | 311,771 | | | | – | | | | 1,034,354 | | | | (24,409 | ) |
| | | | | | | | | | | | | | | | |
| | | 1,544,529 | | | | 678,896 | | | | 3,612,354 | | | | 408,456 | |
| | | (561,614 | ) | | | (135,429 | ) | | | (1,679,857 | ) | | | 205,791 | |
| | | 304,285 | | | | 543,467 | | | | 477,281 | | | | 623,620 | |
| | $ | 294,441 | | | $ | 527,337 | | | $ | 457,002 | | | $ | 600,521 | |
The accompanying notes are an integral part of these financial statements.
Statements of Operations
For the Period Ended April 30, 2023 (Unaudited)
|
Investment Income: |
Interest |
Total Investment Income |
| |
Expenses: |
Investment advisory fee |
Total Expenses |
Net Investment Income/(Loss) |
| |
Realized & Unrealized Gain/(Loss): |
Net realized gain/(loss) on: |
Investments |
Redemptions sold in-kind on investments |
Redemptions sold in-kind on options written |
Options written |
Net change in unrealized appreciation/(depreciation) on: |
Investments |
Options written |
Net Realized and Unrealized Gain/(Loss) on Investments and Options Written |
Net Increase/(Decrease) in Net Assets Resulting From Operations |
The accompanying notes are an integral part of these financial statements.
| | Innovator Double Stacker 9 Buffer ETF - January | | | Innovator Double Stacker 9 Buffer ETF - October | | | Innovator 20+ Year Treasury Bond 9 Buffer ETF - July | | | Innovator 20+ Year Treasury Bond 5 Floor ETF - Quarterly | |
| | | | | | | | | | | | | | | | |
| | $ | 535 | | | $ | 993 | | | $ | 2,645 | | | $ | 202 | |
| | | 535 | | | | 993 | | | | 2,645 | | | | 202 | |
| | | | | | | | | | | | | | | | |
| | | | | | | | | | | | | | | | |
| | | 28,493 | | | | 56,065 | | | | 189,025 | | | | 38,151 | |
| | | 28,493 | | | | 56,065 | | | | 189,025 | | | | 38,151 | |
| | | (27,958 | ) | | | (55,072 | ) | | | (186,380 | ) | | | (37,949 | ) |
| | | | | | | | | | | | | | | | |
| | | | | | | | | | | | | | | | |
| | | | | | | | | | | | | | | | |
| | | (908,574 | ) | | | 25,555 | | | | (18,095 | ) | | | (346,774 | ) |
| | | 100,498 | | | | 105,566 | | | | – | | | | 533,899 | |
| | | 94,020 | | | | 5,017 | | | | – | | | | 147,848 | |
| | | 357,217 | | | | (30,367 | ) | | | (1,341 | ) | | | 143,103 | |
| | | | | | | | | | | | | | | | |
| | | 2,041,252 | | | | 1,556,636 | | | | 304,702 | | | | 513,720 | |
| | | (1,088,297 | ) | | | (247,964 | ) | | | 4,083,582 | | | | (179,353 | ) |
| | | 596,116 | | | | 1,414,443 | | | | 4,368,848 | | | | 812,443 | |
| | $ | 568,158 | | | $ | 1,359,371 | | | $ | 4,182,468 | | | $ | 774,494 | |
The accompanying notes are an integral part of these financial statements.
Statements of Operations
For the Period Ended April 30, 2023 (Unaudited)
|
Investment Income: |
Interest |
Total Investment Income |
| |
Expenses: |
Investment advisory fee |
Total Expenses |
Net Investment Income/(Loss) |
| |
Realized & Unrealized Gain/(Loss): |
Net realized gain/(loss) on: |
Investments |
Redemptions sold in-kind on investments |
Redemptions sold in-kind on options written |
Options written |
Net change in unrealized appreciation/(depreciation) on: |
Investments |
Options written |
Net Realized and Unrealized Gain/(Loss) on Investments and Options Written |
Net Increase/(Decrease) in Net Assets Resulting From Operations |
The accompanying notes are an integral part of these financial statements.
| | Innovator U.S. Equity Accelerated ETF - January | | | Innovator U.S. Equity Accelerated ETF -
April | | | Innovator U.S. Equity Accelerated ETF -
July | | | Innovator U.S. Equity Accelerated ETF - October | |
| | | | | | | | | | | | | | | | |
| | $ | 702 | | | $ | 513 | | | $ | 685 | | | $ | 1,953 | |
| | | 702 | | | | 513 | | | | 685 | | | | 1,953 | |
| | | | | | | | | | | | | | | | |
| | | | | | | | | | | | | | | | |
| | | 27,656 | | | | 13,582 | | | | 10,027 | | | | 148,376 | |
| | | 27,656 | | | | 13,582 | | | | 10,027 | | | | 148,376 | |
| | | (26,954 | ) | | | (13,069 | ) | | | (9,342 | ) | | | (146,423 | ) |
| | | | | | | | | | | | | | | | |
| | | | | | | | | | | | | | | | |
| | | | | | | | | | | | | | | | |
| | | (812,673 | ) | | | (632,992 | ) | | | (10,501 | ) | | | (1,379 | ) |
| | | (69,626 | ) | | | (166,785 | ) | | | 45,576 | | | | 139,271 | |
| | | 115,083 | | | | 221,255 | | | | 4,969 | | | | (31,325 | ) |
| | | 37,812 | | | | 112,625 | | | | (605 | ) | | | (7,907 | ) |
| | | | | | | | | | | | | | | | |
| | | 1,862,769 | | | | 1,071,177 | | | | 195,621 | | | | 3,927,528 | |
| | | (323,032 | ) | | | (338,624 | ) | | | 115,129 | | | | 477,949 | |
| | | 810,333 | | | | 266,656 | | | | 350,189 | | | | 4,504,137 | |
| | $ | 783,379 | | | $ | 253,587 | | | $ | 340,847 | | | $ | 4,357,714 | |
The accompanying notes are an integral part of these financial statements.
Statements of Operations
For the Period Ended April 30, 2023 (Unaudited)
|
Investment Income: |
Interest |
Total Investment Income |
| |
Expenses: |
Investment advisory fee |
Total Expenses |
Net Investment Income/(Loss) |
| |
Realized & Unrealized Gain/(Loss): |
Net realized gain/(loss) on: |
Investments |
Redemptions sold in-kind on investments |
Redemptions sold in-kind on options written |
Options written |
Net change in unrealized appreciation/(depreciation) on: |
Investments |
Options written |
Net Realized and Unrealized Gain/(Loss) on Investments and Options Written |
Net Increase/(Decrease) in Net Assets Resulting From Operations |
The accompanying notes are an integral part of these financial statements.
| | Innovator U.S. Equity Accelerated Plus ETF - January | | | Innovator U.S. Equity Accelerated Plus ETF - April | | | Innovator U.S. Equity Accelerated Plus ETF - July | | | Innovator U.S. Equity Accelerated Plus ETF - October | |
| | | | | | | | | | | | | | | | |
| | $ | 413 | | | $ | 249 | | | $ | 767 | | | $ | 1,241 | |
| | | 413 | | | | 249 | | | | 767 | | | | 1,241 | |
| | | | | | | | | | | | | | | | |
| | | | | | | | | | | | | | | | |
| | | 33,195 | | | | 12,508 | | | | 49,633 | | | | 76,785 | |
| | | 33,195 | | | | 12,508 | | | | 49,633 | | | | 76,785 | |
| | | (32,782 | ) | | | (12,259 | ) | | | (48,866 | ) | | | (75,544 | ) |
| | | | | | | | | | | | | | | | |
| | | | | | | | | | | | | | | | |
| | | | | | | | | | | | | | | | |
| | | (1,692,813 | ) | | | (751,765 | ) | | | (11,076 | ) | | | (11,310 | ) |
| | | 82,855 | | | | (438,819 | ) | | | 183,479 | | | | 298,417 | |
| | | (22,276 | ) | | | 230,989 | | | | 229,720 | | | | 97,432 | |
| | | 393,975 | | | | 476,178 | | | | 8,787 | | | | (11,523 | ) |
| | | | | | | | | | | | | | | | |
| | | 3,092,816 | | | | 1,407,687 | | | | 1,012,403 | | | | 1,919,534 | |
| | | (921,523 | ) | | | (708,523 | ) | | | 318,559 | | | | (149,804 | ) |
| | | 933,034 | | | | 215,747 | | | | 1,741,872 | | | | 2,142,746 | |
| | $ | 900,252 | | | $ | 203,488 | | | $ | 1,693,006 | | | $ | 2,067,202 | |
The accompanying notes are an integral part of these financial statements.
Statements of Operations
For the Period Ended April 30, 2023 (Unaudited)
|
Investment Income: |
Interest |
Total Investment Income |
| |
Expenses: |
Investment advisory fee |
Total Expenses |
Net Investment Income/(Loss) |
| |
Realized & Unrealized Gain/(Loss): |
Net realized gain/(loss) on: |
Investments |
Redemptions sold in-kind on investments |
Redemptions sold in-kind on options written |
Options written |
Net change in unrealized appreciation/(depreciation) on: |
Investments |
Options written |
Net Realized and Unrealized Gain/(Loss) on Investments and Options Written |
Net Increase/(Decrease) in Net Assets Resulting From Operations |
The accompanying notes are an integral part of these financial statements.
| | Innovator U.S. Equity Accelerated 9 Buffer ETF - January | | | Innovator U.S. Equity Accelerated 9 Buffer ETF - April | | | Innovator U.S. Equity Accelerated 9 Buffer ETF - July | | | Innovator U.S. Equity Accelerated 9 Buffer ETF - October | |
| | | | | | | | | | | | | | | | |
| | $ | 2,166 | | | $ | 2,126 | | | $ | 2,002 | | | $ | 2,492 | |
| | | 2,166 | | | | 2,126 | | | | 2,002 | | | | 2,492 | |
| | | | | | | | | | | | | | | | |
| | | | | | | | | | | | | | | | |
| | | 145,906 | | | | 84,571 | | | | 134,067 | | | | 181,767 | |
| | | 145,906 | | | | 84,571 | | | | 134,067 | | | | 181,767 | |
| | | (143,740 | ) | | | (82,445 | ) | | | (132,065 | ) | | | (179,275 | ) |
| | | | | | | | | | | | | | | | |
| | | | | | | | | | | | | | | | |
| | | | | | | | | | | | | | | | |
| | | (2,744,763 | ) | | | (3,114,220 | ) | | | (49,868 | ) | | | (8,229 | ) |
| | | 937,588 | | | | (320,806 | ) | | | 87,817 | | | | 245,577 | |
| | | 605,556 | | | | 1,592,722 | | | | 850,831 | | | | 173,843 | |
| | | (600,877 | ) | | | 1,062,111 | | | | 6,592 | | | | (9,372 | ) |
| | | | | | | | | | | | | | | | |
| | | 5,281,191 | | | | 4,121,340 | | | | 1,040,500 | | | | 3,139,475 | |
| | | (109,652 | ) | | | (1,141,900 | ) | | | 1,574,301 | | | | 784,668 | |
| | | 3,369,043 | | | | 2,199,247 | | | | 3,510,173 | | | | 4,325,962 | |
| | $ | 3,225,303 | | | $ | 2,116,802 | | | $ | 3,378,108 | | | $ | 4,146,687 | |
The accompanying notes are an integral part of these financial statements.
Statements of Operations
For the Period Ended April 30, 2023 (Unaudited)
|
Investment Income: |
Interest |
Total Investment Income |
| |
Expenses: |
Investment advisory fee |
Total Expenses |
Net Investment Income/(Loss) |
| |
Realized & Unrealized Gain/(Loss): |
Net realized gain/(loss) on: |
Investments |
Redemptions sold in-kind on investments |
Redemptions sold in-kind on options written |
Options written |
Net change in unrealized appreciation/(depreciation) on: |
Investments |
Options written |
Net Realized and Unrealized Gain/(Loss) on Investments and Options Written |
Net Increase/(Decrease) in Net Assets Resulting From Operations |
The accompanying notes are an integral part of these financial statements.
| | Innovator Growth Accelerated Plus ETF - January | | | Innovator Growth Accelerated Plus ETF - April | | | Innovator Growth Accelerated Plus ETF - July | | | Innovator Growth Accelerated Plus ETF - October | |
| | | | | | | | | | | | | | | | |
| | $ | 1,042 | | | $ | 610 | | | $ | 712 | | | $ | 536 | |
| | | 1,042 | | | | 610 | | | | 712 | | | | 536 | |
| | | | | | | | | | | | | | | | |
| | | | | | | | | | | | | | | | |
| | | 62,408 | | | | 17,914 | | | | 47,808 | | | | 38,639 | |
| | | 62,408 | | | | 17,914 | | | | 47,808 | | | | 38,639 | |
| | | (61,366 | ) | | | (17,304 | ) | | | (47,096 | ) | | | (38,103 | ) |
| | | | | | | | | | | | | | | | |
| | | | | | | | | | | | | | | | |
| | | | | | | | | | | | | | | | |
| | | (2,794,162 | ) | | | (2,977,730 | ) | | | (665,223 | ) | | | 3,558 | |
| | | – | | | | (673,712 | ) | | | (494,909 | ) | | | 100,816 | |
| | | – | | | | 320,052 | | | | 1,925,141 | | | | 4,125 | |
| | | 354,086 | | | | 1,611,323 | | | | 64,440 | | | | (5,022 | ) |
| | | | | | | | | | | | | | | | |
| | | 11,999,209 | | | | 4,263,364 | | | | 3,121,671 | | | | 3,367,904 | |
| | | (7,073,526 | ) | | | (1,973,494 | ) | | | (1,855,064 | ) | | | (1,796,127 | ) |
| | | 2,485,607 | | | | 569,803 | | | | 2,096,056 | | | | 1,675,254 | |
| | $ | 2,424,241 | | | $ | 552,499 | | | $ | 2,048,960 | | | $ | 1,637,151 | |
The accompanying notes are an integral part of these financial statements.
Statements of Operations
For the Period Ended April 30, 2023 (Unaudited)
|
Investment Income: |
Interest |
Total Investment Income |
| |
Expenses: |
Investment advisory fee |
Total Expenses |
Net Investment Income/(Loss) |
| |
Realized & Unrealized Gain/(Loss): |
Net realized gain/(loss) on: |
Investments |
Redemptions sold in-kind on investments |
Redemptions sold in-kind on options written |
Options written |
Net change in unrealized appreciation/(depreciation) on: |
Investments |
Options written |
Net Realized and Unrealized Gain/(Loss) on Investments and Options Written |
Net Increase/(Decrease) in Net Assets Resulting From Operations |
The accompanying notes are an integral part of these financial statements.
| | | Innovator Defined Wealth Shield ETF | | | Innovator U.S. Equity Accelerated ETF - Quarterly | | | Innovator Growth Accelerated ETF - Quarterly | |
| | | | | | | | | | | | | |
| | | $ | 10,282 | | | $ | 751 | | | $ | 342 | |
| | | | 10,282 | | | | 751 | | | | 342 | |
| | | | | | | | | | | | | |
| | | | | | | | | | | | | |
| | | | 1,078,923 | | | | 55,054 | | | | 55,048 | |
| | | | 1,078,923 | | | | 55,054 | | | | 55,048 | |
| | | | (1,068,641 | ) | | | (54,303 | ) | | | (54,706 | ) |
| | | | | | | | | | | | | |
| | | | | | | | | | | | | |
| | | | | | | | | | | | | |
| | | | 7,294,729 | | | | 2,092,057 | | | | 2,013,357 | |
| | | | 8,111,661 | | | | 167,612 | | | | 560,695 | |
| | | | 4,172,422 | | | | (37,112 | ) | | | (218,985 | ) |
| | | | (2,766,275 | ) | | | 468,861 | | | | (1,043,037 | ) |
| | | | | | | | | | | | | |
| | | | (10,156,017 | ) | | | (1,001,592 | ) | | | (902,082 | ) |
| | | | 8,998,502 | | | | 837,470 | | | | 389,747 | |
| | | | 15,655,022 | | | | 2,527,296 | | | | 799,695 | |
| | | $ | 14,586,381 | | | $ | 2,472,993 | | | $ | 744,989 | |
The accompanying notes are an integral part of these financial statements.
Statements of Changes in Net Assets
| | | Innovator International Developed Power Buffer ETF - January | |
| | | Period Ended April 30, 2023 (Unaudited) | | | Year Ended October 31, 2022 | |
Operations: | | | | | | | | |
Net Investment income/(loss) | | $ | (554,615 | ) | | $ | (634,417 | ) |
Net realized gain/(loss) | | | (900,869 | ) | | | 2,233,725 | |
Net change in unrealized appreciation/(depreciation) | | | 19,404,113 | | | | (11,602,654 | ) |
Net Increase/(Decrease) in Net Assets Resulting from Operations | | | 17,948,629 | | | | (10,003,346 | ) |
| | | | | | | | | |
| | | | | | | | | |
Capital Share Transactions: | | | | | | | | |
Proceeds from shares sold | | | 166,077,758 | | | | 99,555,597 | |
Cost of shares redeemed | | | (45,540,242 | ) | | | (81,343,988 | ) |
Transaction fees (see Note 5) | | | 68,304 | | | | 29,709 | |
Net Increase/(Decrease) in Net Assets from Capital Share Transactions | | | 120,605,820 | | | | 18,241,318 | |
Total Increase/(Decrease) in Net Assets | | $ | 138,554,449 | | | $ | 8,237,972 | |
| | | | | | | | | |
Net Assets: | | | | | | | | |
Beginning of the period | | $ | 65,687,566 | | | $ | 57,449,594 | |
End of the period | | $ | 204,242,015 | | | $ | 65,687,566 | |
| | | | | | | | | |
Change in Shares Outstanding: | | | | | | | | |
Shares sold | | | 6,025,000 | | | | 3,725,000 | |
Shares redeemed | | | (1,700,000 | ) | | | (3,125,000 | ) |
Net Increase/(Decrease) | | | 4,325,000 | | | | 600,000 | |
The accompanying notes are an integral part of these financial statements.
| | Innovator International Developed Power Buffer ETF - April | | | Innovator International Developed Power Buffer ETF - July | | | Innovator International Developed Power Buffer ETF - October | |
| | Period Ended April 30, 2023 (Unaudited) | | | Year Ended October 31, 2022 | | | Period Ended April 30, 2023 (Unaudited) | | | Year Ended October 31, 2022 | | | Period Ended April 30, 2023 (Unaudited) | | | Year Ended October 31, 2022 | |
| | | | | | | | | | | | | | | | | | | | | | | | |
| | $ | (355,237 | ) | | $ | (400,200 | ) | | $ | (691,868 | ) | | $ | (679,225 | ) | | $ | (448,902 | ) | | $ | (165,842 | ) |
| | | 2,563,422 | | | | (5,217,339 | ) | | | 11,307,211 | | | | (3,568,900 | ) | | | 1,790,232 | | | | (2,165,524 | ) |
| | | 3,449,290 | | | | (1,889,271 | ) | | | 19,944,008 | | | | (2,692,646 | ) | | | 13,952,161 | | | | 2,402,687 | |
| | | 5,657,475 | | | | (7,506,810 | ) | | | 30,559,351 | | | | (6,940,771 | ) | | | 15,293,491 | | | | 71,321 | |
| | | | | | | | | | | | | | | | | | | | | | | | |
| | | | | | | | | | | | | | | | | | | | | | | | |
| | | | | | | | | | | | | | | | | | | | | | | | |
| | | 305,984,203 | | | | 116,462,668 | | | | 24,293,043 | | | | 222,082,910 | | | | 9,949,797 | | | | 88,356,625 | |
| | | (129,977,027 | ) | | | (85,837,085 | ) | | | (133,630,277 | ) | | | (82,609,017 | ) | | | (14,367,345 | ) | | | (3,641,725 | ) |
| | | 96,855 | | | | 70,891 | | | | 61,963 | | | | 82,748 | | | | 7,492 | | | | 43,222 | |
| | | 176,104,031 | | | | 30,696,474 | | | | (109,275,271 | ) | | | 139,556,641 | | | | (4,410,056 | ) | | | 84,758,122 | |
| | $ | 181,761,506 | | | $ | 23,189,664 | | | $ | (78,715,920 | ) | | $ | 132,615,870 | | | $ | 10,883,435 | | | $ | 84,829,443 | |
| | | | | | | | | | | | | | | | | | | | | | | | |
| | | | | | | | | | | | | | | | | | | | | | | | |
| | $ | 43,236,467 | | | $ | 20,046,803 | | | $ | 188,756,569 | | | $ | 56,140,699 | | | $ | 94,354,558 | | | $ | 9,525,115 | |
| | $ | 224,997,973 | | | $ | 43,236,467 | | | $ | 110,040,649 | | | $ | 188,756,569 | | | $ | 105,237,993 | | | $ | 94,354,558 | |
| | | | | | | | | | | | | | | | | | | | | | | | |
| | | | | | | | | | | | | | | | | | | | | | | | |
| | | 12,475,000 | | | | 4,825,000 | | | | 1,025,000 | | | | 9,925,000 | | | | 425,000 | | | | 4,025,000 | |
| | | (5,325,000 | ) | | | (3,675,000 | ) | | | (5,350,000 | ) | | | (3,650,000 | ) | | | (575,000 | ) | | | (150,000 | ) |
| | | 7,150,000 | | | | 1,150,000 | | | | (4,325,000 | ) | | | 6,275,000 | | | | (150,000 | ) | | | 3,875,000 | |
The accompanying notes are an integral part of these financial statements.
Statements of Changes in Net Assets
| | | Innovator Emerging Markets Power Buffer ETF - January | |
| | | Period Ended April 30, 2023 (Unaudited) | | | Year Ended October 31, 2022 | |
Operations: | | | | | | | | |
Net Investment income/(loss) | | $ | (353,902 | ) | | $ | (756,314 | ) |
Net realized gain/(loss) | | | (5,477,175 | ) | | | (3,988,284 | ) |
Net change in unrealized appreciation/(depreciation) | | | 12,517,722 | | | | (10,922,022 | ) |
Net Increase/(Decrease) in Net Assets Resulting from Operations | | | 6,686,645 | | | | (15,666,620 | ) |
| | | | | | | | | |
| | | | | | | | | |
Capital Share Transactions: | | | | | | | | |
Proceeds from shares sold | | | 108,402,205 | | | | 18,399,455 | |
Cost of shares redeemed | | | (55,354,270 | ) | | | (53,166,152 | ) |
Transaction fees (see Note 5) | | | 42,697 | | | | 28,194 | |
Net Increase/(Decrease) in Net Assets from Capital Share Transactions | | | 53,090,632 | | | | (34,738,503 | ) |
Total Increase/(Decrease) in Net Assets | | $ | 59,777,277 | | | $ | (50,405,123 | ) |
| | | | | | | | | |
Net Assets: | | | | | | | | |
Beginning of the period | | $ | 55,914,561 | | | $ | 106,319,684 | |
End of the period | | $ | 115,691,838 | | | $ | 55,914,561 | |
| | | | | | | | | |
Change in Shares Outstanding: | | | | | | | | |
Shares sold | | | 3,900,000 | | | | 625,000 | |
Shares redeemed | | | (2,050,000 | ) | | | (1,900,000 | ) |
Net Increase/(Decrease) | | | 1,850,000 | | | | (1,275,000 | ) |
The accompanying notes are an integral part of these financial statements.
| | Innovator Emerging Markets Power Buffer ETF - April | | | Innovator Emerging Markets Power Buffer ETF - July | | | Innovator Emerging Markets Power Buffer ETF - October | |
| | Period Ended April 30, 2023 (Unaudited) | | | Year Ended October 31, 2022 | | | Period Ended April 30, 2023 (Unaudited) | | | Year Ended October 31, 2022 | | | Period Ended April 30, 2023 (Unaudited) | | | Year Ended October 31, 2022 | |
| | | | | | | | | | | | | | | | | | | | | | | | |
| | $ | (159,001 | ) | | $ | (341,704 | ) | | $ | (342,389 | ) | | $ | (337,472 | ) | | $ | (141,446 | ) | | $ | (79,299 | ) |
| | | (254,153 | ) | | | (1,182,633 | ) | | | 1,539,747 | | | | (4,330,940 | ) | | | 218,977 | | | | (1,332,181 | ) |
| | | 4,278,009 | | | | (4,241,626 | ) | | | 3,964,025 | | | | (2,503,144 | ) | | | 3,598,208 | | | | (556,334 | ) |
| | | 3,864,855 | | | | (5,765,963 | ) | | | 5,161,383 | | | | (7,171,556 | ) | | | 3,675,739 | | | | (1,967,814 | ) |
| | | | | | | | | | | | | | | | | | | | | | | | |
| | | | | | | | | | | | | | | | | | | | | | | | |
| | | | | | | | | | | | | | | | | | | | | | | | |
| | | 37,995,660 | | | | 59,000,490 | | | | 53,947,430 | | | | 62,185,197 | | | | 8,782,872 | | | | 23,128,578 | |
| | | (21,683,138 | ) | | | (56,630,658 | ) | | | (22,607,338 | ) | | | (41,632,505 | ) | | | (7,425,138 | ) | | | (590,100 | ) |
| | | 10,235 | | | | 20,970 | | | | 33,243 | | | | 24,537 | | | | 6,967 | | | | 10,934 | |
| | | 16,322,757 | | | | 2,390,802 | | | | 31,373,335 | | | | 20,577,229 | | | | 1,364,701 | | | | 22,549,412 | |
| | $ | 20,187,612 | | | $ | (3,375,161 | ) | | $ | 36,534,718 | | | $ | 13,405,673 | | | $ | 5,040,440 | | | $ | 20,581,598 | |
| | | | | | | | | | | | | | | | | | | | | | | | |
| | | | | | | | | | | | | | | | | | | | | | | | |
| | $ | 30,655,831 | | | $ | 34,030,992 | | | $ | 54,642,799 | | | $ | 41,237,126 | | | $ | 25,628,345 | | | $ | 5,046,747 | |
| | $ | 50,843,443 | | | $ | 30,655,831 | | | $ | 91,177,517 | | | $ | 54,642,799 | | | $ | 30,668,785 | | | $ | 25,628,345 | |
| | | | | | | | | | | | | | | | | | | | | | | | |
| | | | | | | | | | | | | | | | | | | | | | | | |
| | | 1,575,000 | | | | 2,475,000 | | | | 2,325,000 | | | | 2,750,000 | | | | 400,000 | | | | 1,075,000 | |
| | | (900,000 | ) | | | (2,425,000 | ) | | | (950,000 | ) | | | (1,775,000 | ) | | | (325,000 | ) | | | (25,000 | ) |
| | | 675,000 | | | | 50,000 | | | | 1,375,000 | | | | 975,000 | | | | 75,000 | | | | 1,050,000 | |
The accompanying notes are an integral part of these financial statements.
Statements of Changes in Net Assets
| | | Innovator Growth-100 Power Buffer ETF - January | |
| | | Period Ended April 30, 2023 (Unaudited) | | | Year Ended October 31, 2022 | |
Operations: | | | | | | | | |
Net Investment income/(loss) | | $ | (338,476 | ) | | $ | (829,576 | ) |
Net realized gain/(loss) | | | (15,596,288 | ) | | | 4,528,019 | |
Net change in unrealized appreciation/(depreciation) | | | 23,566,030 | | | | (23,498,625 | ) |
Net Increase/(Decrease) in Net Assets Resulting from Operations | | | 7,631,266 | | | | (19,800,182 | ) |
| | | | | | | | | |
| | | | | | | | | |
Capital Share Transactions: | | | | | | | | |
Proceeds from shares sold | | | 67,324,242 | | | | 150,131,645 | |
Cost of shares redeemed | | | (62,848,175 | ) | | | (134,907,370 | ) |
Transaction fees (see Note 5) | | | 23,612 | | | | 56,240 | |
Net Increase/(Decrease) in Net Assets from Capital Share Transactions | | | 4,499,679 | | | | 15,280,515 | |
Total Increase/(Decrease) in Net Assets | | $ | 12,130,945 | | | $ | (4,519,667 | ) |
| | | | | | | | | |
Net Assets: | | | | | | | | |
Beginning of the period | | $ | 82,777,484 | | | $ | 87,297,151 | |
End of the period | | $ | 94,908,429 | | | $ | 82,777,484 | |
| | | | | | | | | |
Change in Shares Outstanding: | | | | | | | | |
Shares sold | | | 1,925,000 | | | | 3,600,000 | |
Shares redeemed | | | (1,775,000 | ) | | | (3,350,000 | ) |
Net Increase/(Decrease) | | | 150,000 | | | | 250,000 | |
The accompanying notes are an integral part of these financial statements.
| | Innovator Growth-100 Power Buffer ETF - April | | | Innovator Growth-100 Power Buffer ETF - July | | | Innovator Growth-100 Power Buffer ETF - October | |
| | Period Ended April 30, 2023 (Unaudited) | | | Year Ended October 31, 2022 | | | Period Ended April 30, 2023 (Unaudited) | | | Year Ended October 31, 2022 | | | Period Ended April 30, 2023 (Unaudited) | | | Year Ended October 31, 2022 | |
| | | | | | | | | | | | | | | | | | | | | | | | |
| | $ | (218,667 | ) | | $ | (399,515 | ) | | $ | (411,907 | ) | | $ | (562,754 | ) | | $ | (356,790 | ) | | $ | (520,061 | ) |
| | | 2,151,652 | | | | 1,043,406 | | | | 2,505,300 | | | | (5,142,236 | ) | | | 1,357,716 | | | | (6,430,346 | ) |
| | | 4,793,328 | | | | (6,768,741 | ) | | | 10,636,678 | | | | (1,136,637 | ) | | | 10,007,116 | | | | (867,160 | ) |
| | | 6,726,313 | | | | (6,124,850 | ) | | | 12,730,071 | | | | (6,841,627 | ) | | | 11,008,042 | | | | (7,817,567 | ) |
| | | | | | | | | | | | | | | | | | | | | | | | |
| | | | | | | | | | | | | | | | | | | | | | | | |
| | | | | | | | | | | | | | | | | | | | | | | | |
| | | 88,661,650 | | | | 80,087,048 | | | | 11,005,200 | | | | 156,075,852 | | | | 17,423,143 | | | | 43,011,748 | |
| | | (36,762,682 | ) | | | (62,385,170 | ) | | | (65,602,642 | ) | | | (86,882,000 | ) | | | (23,891,963 | ) | | | (32,185,163 | ) |
| | | 34,636 | | | | 35,216 | | | | 29,605 | | | | 65,452 | | | | 16,653 | | | | 27,345 | |
| | | 51,933,604 | | | | 17,737,094 | | | | (54,567,837 | ) | | | 69,259,304 | | | | (6,452,167 | ) | | | 10,853,930 | |
| | $ | 58,659,917 | | | $ | 11,612,244 | | | $ | (41,837,766 | ) | | $ | 62,417,677 | | | $ | 4,555,875 | | | $ | 3,036,363 | |
| | | | | | | | | | | | | | | | | | | | | | | | |
| | | | | | | | | | | | | | | | | | | | | | | | |
| | $ | 52,865,925 | | | $ | 41,253,681 | | | $ | 118,403,852 | | | $ | 55,986,175 | | | $ | 80,964,858 | | | $ | 77,928,495 | |
| | $ | 111,525,842 | | | $ | 52,865,925 | | | $ | 76,566,086 | | | $ | 118,403,852 | | | $ | 85,520,733 | | | $ | 80,964,858 | |
| | | | | | | | | | | | | | | | | | | | | | | | |
| | | | | | | | | | | | | | | | | | | | | | | | |
| | | 2,300,000 | | | | 2,125,000 | | | | 250,000 | | | | 3,550,000 | | | | 490,000 | | | | 1,190,000 | |
| | | (975,000 | ) | | | (1,675,000 | ) | | | (1,425,000 | ) | | | (1,975,000 | ) | | | (630,000 | ) | | | (840,000 | ) |
| | | 1,325,000 | | | | 450,000 | | | | (1,175,000 | ) | | | 1,575,000 | | | | (140,000 | ) | | | 350,000 | |
The accompanying notes are an integral part of these financial statements.
Statements of Changes in Net Assets
| | | Innovator U.S. Small Cap Power Buffer ETF - January | |
| | | Period Ended April 30, 2023 (Unaudited) | | | Year Ended October 31, 2022 | |
Operations: | | | | | | | | |
Net Investment income/(loss) | | $ | (490,843 | ) | | $ | (855,952 | ) |
Net realized gain/(loss) | | | (4,052,897 | ) | | | 6,533,452 | |
Net change in unrealized appreciation/(depreciation) | | | 3,805,177 | | | | (14,706,352 | ) |
Net Increase/(Decrease) in Net Assets Resulting from Operations | | | (738,563 | ) | | | (9,028,852 | ) |
| | | | | | | | | |
| | | | | | | | | |
Capital Share Transactions: | | | | | | | | |
Proceeds from shares sold | | | 148,290,555 | | | | 147,439,086 | |
Cost of shares redeemed | | | (51,607,515 | ) | | | (143,934,103 | ) |
Transaction fees (see Note 5) | | | 59,865 | | | | 56,466 | |
Net Increase/(Decrease) in Net Assets from Capital Share Transactions | | | 96,742,905 | | | | 3,561,449 | |
Total Increase/(Decrease) in Net Assets | | $ | 96,004,342 | | | $ | (5,467,403 | ) |
| | | | | | | | | |
Net Assets: | | | | | | | | |
Beginning of the period | | $ | 79,490,939 | | | $ | 84,958,342 | |
End of the period | | $ | 175,495,281 | | | $ | 79,490,939 | |
| | | | | | | | | |
Change in Shares Outstanding: | | | | | | | | |
Shares sold | | | 4,850,000 | | | | 4,650,000 | |
Shares redeemed | | | (1,725,000 | ) | | | (4,700,000 | ) |
Net Increase/(Decrease) | | | 3,125,000 | | | | (50,000 | ) |
The accompanying notes are an integral part of these financial statements.
| | Innovator U.S. Small Cap Power Buffer ETF - April | | | Innovator U.S. Small Cap Power Buffer ETF - July | | | Innovator U.S. Small Cap Power Buffer ETF - October | |
| | Period Ended April 30, 2023 (Unaudited) | | | Year Ended October 31, 2022 | | | Period Ended April 30, 2023 (Unaudited) | | | Year Ended October 31, 2022 | | | Period Ended April 30, 2023 (Unaudited) | | | Year Ended October 31, 2022 | |
| | | | | | | | | | | | | | | | | | | | | | | | |
| | $ | (333,936 | ) | | $ | (680,673 | ) | | $ | (294,852 | ) | | $ | (514,804 | ) | | $ | (326,839 | ) | | $ | (320,078 | ) |
| | | (493,707 | ) | | | 1,048,164 | | | | 825,056 | | | | (6,861,135 | ) | | | (325,024 | ) | | | (4,584,175 | ) |
| | | 3,334,034 | | | | (6,996,703 | ) | | | (505,383 | ) | | | 2,510,018 | | | | 2,610,138 | | | | 1,633,545 | |
| | | 2,506,391 | | | | (6,629,212 | ) | | | 24,821 | | | | (4,865,921 | ) | | | 1,958,275 | | | | (3,270,708 | ) |
| | | | | | | | | | | | | | | | | | | | | | | | |
| | | | | | | | | | | | | | | | | | | | | | | | |
| | | | | | | | | | | | | | | | | | | | | | | | |
| | | 89,515,382 | | | | 124,453,680 | | | | 11,639,543 | | | | 95,308,208 | | | | 21,665,263 | | | | 57,505,679 | |
| | | (50,381,178 | ) | | | (117,880,038 | ) | | | (20,600,508 | ) | | | (86,223,780 | ) | | | (20,645,465 | ) | | | (17,965,585 | ) |
| | | 27,907 | | | | 34,641 | | | | 11,679 | | | | 32,925 | | | | 20,502 | | | | 36,450 | |
| | | 39,162,111 | | | | 6,608,283 | | | | (8,949,286 | ) | | | 9,117,353 | | | | 1,040,300 | | | | 39,576,544 | |
| | $ | 41,668,502 | | | $ | (20,929 | ) | | $ | (8,924,465 | ) | | $ | 4,251,432 | | | $ | 2,998,575 | | | $ | 36,305,836 | |
| | | | | | | | | | | | | | | | | | | | | | | | |
| | | | | | | | | | | | | | | | | | | | | | | | |
| | $ | 84,854,723 | | | $ | 84,875,652 | | | $ | 78,334,876 | | | $ | 74,083,444 | | | $ | 72,937,495 | | | $ | 36,631,659 | |
| | $ | 126,523,225 | | | $ | 84,854,723 | | | $ | 69,410,411 | | | $ | 78,334,876 | | | $ | 75,936,070 | | | $ | 72,937,495 | |
| | | | | | | | | | | | | | | | | | | | | | | | |
| | | | | | | | | | | | | | | | | | | | | | | | |
| | | 3,425,000 | | | | 4,750,000 | | | | 475,000 | | | | 4,025,000 | | | | 850,000 | | | | 2,275,000 | |
| | | (1,950,000 | ) | | | (4,475,000 | ) | | | (825,000 | ) | | | (3,600,000 | ) | | | (775,000 | ) | | | (725,000 | ) |
| | | 1,475,000 | | | | 275,000 | | | | (350,000 | ) | | | 425,000 | | | | 75,000 | | | | 1,550,000 | |
The accompanying notes are an integral part of these financial statements.
Statements of Changes in Net Assets
| | | Innovator Double Stacker ETF - January | |
| | | Period Ended April 30, 2023 (Unaudited) | | | Year Ended October 31, 2022 | |
Operations: | | | | | | | | |
Net Investment income/(loss) | | $ | (9,844 | ) | | $ | (39,144 | ) |
Net realized gain/(loss) | | | (678,630 | ) | | | 463,881 | |
Net change in unrealized appreciation/(depreciation) | | | 982,915 | | | | (1,440,830 | ) |
Net Increase/(Decrease) in Net Assets Resulting from Operations | | | 294,441 | | | | (1,016,093 | ) |
| | | | | | | | | |
| | | | | | | | | |
Capital Share Transactions: | | | | | | | | |
Proceeds from shares sold | | | 616,548 | | | | 7,264,468 | |
Cost of shares redeemed | | | (1,252,795 | ) | | | (9,916,322 | ) |
Transaction fees (see Note 5) | | | 934 | | | | 1,248 | |
Net Increase/(Decrease) in Net Assets from Capital Share Transactions | | | (635,313 | ) | | | (2,650,606 | ) |
Total Increase/(Decrease) in Net Assets | | $ | (340,872 | ) | | $ | (3,666,699 | ) |
| | | | | | | | | |
Net Assets: | | | | | | | | |
Beginning of the period | | $ | 3,029,937 | | | $ | 6,696,636 | |
End of the period | | $ | 2,689,065 | | | $ | 3,029,937 | |
| | | | | | | | | |
Change in Shares Outstanding: | | | | | | | | |
Shares sold | | | 25,000 | | | | 250,000 | |
Shares redeemed | | | (50,000 | ) | | | (350,000 | ) |
Net Increase/(Decrease) | | | (25,000 | ) | | | (100,000 | ) |
The accompanying notes are an integral part of these financial statements.
| | Innovator Double Stacker ETF - October | | | Innovator Triple Stacker ETF - January | | | Innovator Triple Stacker ETF - October | |
| | Period Ended April 30, 2023 (Unaudited) | | | Year Ended October 31, 2022 | | | Period Ended April 30,
2023 (Unaudited) | | | Year Ended October 31, 2022 | | | Period Ended April 30, 2023 (Unaudited) | | | Year Ended October 31, 2022 | |
| | | | | | | | | | | | | | | | | | | | | | | | |
| | $ | (16,130 | ) | | $ | (55,554 | ) | | $ | (20,279 | ) | | $ | (146,226 | ) | | $ | (23,099 | ) | | $ | (81,751 | ) |
| | | – | | | | (1,141,506 | ) | | | (1,455,216 | ) | | | 2,041,588 | | | | 9,373 | | | | (1,285,511 | ) |
| | | 543,467 | | | | (254,558 | ) | | | 1,932,497 | | | | (5,519,533 | ) | | | 614,247 | | | | (435,495 | ) |
| | | 527,337 | | | | (1,451,618 | ) | | | 457,002 | | | | (3,624,171 | ) | | | 600,521 | | | | (1,802,757 | ) |
| | | | | | | | | | | | | | | | | | | | | | | | |
| | | | | | | | | | | | | | | | | | | | | | | | |
| | | | | | | | | | | | | | | | | | | | | | | | |
| | | – | | | | 2,231,755 | | | | 1,231,798 | | | | 48,692,803 | | | | 1,322,895 | | | | 5,265,070 | |
| | | – | | | | (5,736,838 | ) | | | (2,484,582 | ) | | | (83,205,767 | ) | | | (639,727 | ) | | | (14,897,395 | ) |
| | | – | | | | 2,891 | | | | 1,562 | | | | 19,488 | | | | 981 | | | | 9,032 | |
| | | – | | | | (3,502,192 | ) | | | (1,251,222 | ) | | | (34,493,476 | ) | | | 684,149 | | | | (9,623,293 | ) |
| | $ | 527,337 | | | $ | (4,953,810 | ) | | $ | (794,220 | ) | | $ | (38,117,647 | ) | | $ | 1,284,670 | | | $ | (11,426,050 | ) |
| | | | | | | | | | | | | | | | | | | | | | | | |
| | | | | | | | | | | | | | | | | | | | | | | | |
| | $ | 4,020,907 | | | $ | 8,974,717 | | | $ | 5,989,234 | | | $ | 44,106,881 | | | $ | 5,276,058 | | | $ | 16,702,108 | |
| | $ | 4,548,244 | | | $ | 4,020,907 | | | $ | 5,195,014 | | | $ | 5,989,234 | | | $ | 6,560,728 | | | $ | 5,276,058 | |
| | | | | | | | | | | | | | | | | | | | | | | | |
| | | | | | | | | | | | | | | | | | | | | | | | |
| | | – | | | | 75,000 | | | | 50,000 | | | | 1,650,000 | | | | 50,000 | | | | 175,000 | |
| | | – | | | | (200,000 | ) | | | (100,000 | ) | | | (2,900,000 | ) | | | (25,000 | ) | | | (500,000 | ) |
| | | – | | | | (125,000 | ) | | | (50,000 | ) | | | (1,250,000 | ) | | | 25,000 | | | | (325,000 | ) |
The accompanying notes are an integral part of these financial statements.
Statements of Changes in Net Assets
| | | Innovator Double Stacker 9 Buffer ETF - January | |
| | | Period Ended April 30, 2023 (Unaudited) | | | Year Ended October 31, 2022 | |
Operations: | | | | | | | | |
Net Investment income/(loss) | | $ | (27,958 | ) | | $ | (91,349 | ) |
Net realized gain/(loss) | | | (356,839 | ) | | | (203,199 | ) |
Net change in unrealized appreciation/(depreciation) | | | 952,955 | | | | (1,257,874 | ) |
Net Increase/(Decrease) in Net Assets Resulting from Operations | | | 568,158 | | | | (1,552,422 | ) |
| | | | | | | | | |
Capital Share Transactions: | | | | | | | | |
Proceeds from shares sold | | | 1,320,065 | | | | 18,636,238 | |
Cost of shares redeemed | | | (3,268,052 | ) | | | (22,243,630 | ) |
Transaction fees (see Note 5) | | | 1,982 | | | | 7,400 | |
Net Increase/(Decrease) in Net Assets from Capital Share Transactions | | | (1,946,005 | ) | | | (3,599,992 | ) |
Total Increase/(Decrease) in Net Assets | | $ | (1,377,847 | ) | | $ | (5,152,414 | ) |
| | | | | | | | | |
Net Assets: | | | | | | | | |
Beginning of the period | | $ | 8,189,605 | | | $ | 13,342,019 | |
End of the period | | $ | 6,811,758 | | | $ | 8,189,605 | |
| | | | | | | | | |
Change in Shares Outstanding: | | | | | | | | |
Shares sold | | | 50,000 | | | | 675,000 | |
Shares redeemed | | | (125,000 | ) | | | (825,000 | ) |
Net Increase/(Decrease) | | | (75,000 | ) | | | (150,000 | ) |
The accompanying notes are an integral part of these financial statements.
| | Innovator Double Stacker 9 Buffer ETF - October | | | Innovator 20+ Year Treasury Bond 9 Buffer ETF - July | | | Innovator 20+ Year Treasury Bond 5 Floor ETF - Quarterly | |
| | Period Ended April 30, 2023 (Unaudited) | | | Year Ended October 31, 2022 | | | Period Ended April 30, 2023 (Unaudited) | | | Year Ended October 31, 2022 | | | Period Ended April 30, 2023 (Unaudited) | | | Year Ended October 31, 2022 | |
| | | | | | | | | | | | | | | | | | | | | | | | |
| | $ | (55,072 | ) | | $ | (142,769 | ) | | $ | (186,380 | ) | | $ | (58,931 | ) | | $ | (37,949 | ) | | $ | (67,529 | ) |
| | | 105,771 | | | | (1,372,989 | ) | | | (19,436 | ) | | | (889,093 | ) | | | 478,076 | | | | (1,181,531 | ) |
| | | 1,308,672 | | | | (117,496 | ) | | | 4,388,284 | | | | (1,423,078 | ) | | | 334,367 | | | | (462,702 | ) |
| | | 1,359,371 | | | | (1,633,254 | ) | | | 4,182,468 | | | | (2,371,102 | ) | | | 774,494 | | | | (1,711,762 | ) |
| | | | | | | | | | | | | | | | | | | | | | | | |
| | | | | | | | | | | | | | | | | | | | | | | | |
| | | 679,008 | | | | 2,162,377 | | | | 20,265,708 | | | | 36,476,380 | | | | 14,952,563 | | | | 32,030,360 | |
| | | (2,102,372 | ) | | | (7,744,912 | ) | | | – | | | | (6,808,675 | ) | | | (28,176,275 | ) | | | (19,476,665 | ) |
| | | 1,025 | | | | 4,275 | | | | 10,132 | | | | 15,893 | | | | 11,748 | | | | 16,141 | |
| | | (1,422,339 | ) | | | (5,578,260 | ) | | | 20,275,840 | | | | 29,683,598 | | | | (13,211,964 | ) | | | 12,569,836 | |
| | $ | (62,968 | ) | | $ | (7,211,514 | ) | | $ | 24,458,308 | | | $ | 27,312,496 | | | | (12,437,470 | ) | | $ | 10,858,074 | |
| | | | | | | | | | | | | | | | | | | | | | | | |
| | | | | | | | | | | | | | | | | | | | | | | | |
| | $ | 14,350,100 | | | $ | 21,561,614 | | | $ | 32,204,227 | | | $ | 4,891,731 | | | $ | 20,347,384 | | | $ | 9,489,310 | |
| | $ | 14,287,132 | | | $ | 14,350,100 | | | $ | 56,662,535 | | | $ | 32,204,227 | | | $ | 7,909,914 | | | $ | 20,347,384 | |
| | | | | | | | | | | | | | | | | | | | | | | | |
| | | | | | | | | | | | | | | | | | | | | | | | |
| | | 25,000 | | | | 75,000 | | | | 1,025,000 | | | | 1,850,000 | | | | 725,000 | | | | 1,500,000 | |
| | | (75,000 | ) | | | (275,000 | ) | | | – | | | | (325,000 | ) | | | (1,375,000 | ) | | | (875,000 | ) |
| | | (50,000 | ) | | | (200,000 | ) | | | 1,025,000 | | | | 1,525,000 | | | | (650,000 | ) | | | 625,000 | |
The accompanying notes are an integral part of these financial statements.
Statements of Changes in Net Assets
| | | Innovator U.S. Equity
Accelerated ETF - January | |
| | | Period Ended April 30, 2023 (Unaudited) | | | Period Ended October 31, 2022 (a) | |
Operations: | | | | | | | | |
Net Investment income/(loss) | | $ | (26,954 | ) | | $ | (24,162 | ) |
Net realized gain/(loss) | | | (729,404 | ) | | | – | |
Net change in unrealized appreciation/(depreciation) | | | 1,539,737 | | | | (722,755 | ) |
Net Increase/(Decrease) in Net Assets Resulting from Operations | | | 783,379 | | | | (746,917 | ) |
| | | | | | | | | |
| | | | | | | | | |
Capital Share Transactions: | | | | | | | | |
Proceeds from shares sold | | | 8,082,718 | | | | 4,718,782 | |
Cost of shares redeemed | | | (2,469,702 | ) | | | – | |
Transaction fees (see Note 5) | | | 3,061 | | | | 1,742 | |
Net Increase/(Decrease) in Net Assets from Capital Share Transactions | | | 5,616,077 | | | | 4,720,524 | |
Total Increase/(Decrease) in Net Assets | | $ | 6,399,456 | | | $ | 3,973,607 | |
| | | | | | | | | |
Net Assets: | | | | | | | | |
Beginning of the period | | $ | 3,973,607 | | | $ | – | |
End of the period | | $ | 10,373,063 | | | $ | 3,973,607 | |
| | | | | | | | | |
Change in Shares Outstanding: | | | | | | | | |
Shares sold | | | 400,000 | | | | 200,000 | |
Shares redeemed | | | (125,000 | ) | | | – | |
Net Increase/(Decrease) | | | 275,000 | | | | 200,000 | |
(a) Since Commencement of Operations on December 31, 2021.
The accompanying notes are an integral part of these financial statements.
| | Innovator U.S. Equity
Accelerated ETF - April | | | Innovator U.S. Equity Accelerated ETF - July | | | Innovator U.S. Equity Accelerated ETF - October | |
| | Period Ended April 30, 2023 (Unaudited) | | | Year Ended October 31, 2022 | | | Period Ended April 30, 2023 (Unaudited) | | | Year Ended October 31, 2022 | | | Period Ended April 30, 2023 (Unaudited) | | | Year Ended October 31, 2022 | |
| | | | | | | | | | | | | | | | | | | | | | | | |
| | $ | (13,069 | ) | | $ | (51,876 | ) | | $ | (9,342 | ) | | $ | (36,787 | ) | | $ | (146,423 | ) | | $ | (71,738 | ) |
| | | (465,897 | ) | | | 851,394 | | | | 39,439 | | | | (750,214 | ) | | | 98,660 | | | | (7,607,506 | ) |
| | | 732,553 | | | | (1,357,794 | ) | | | 310,750 | | | | (191,707 | ) | | | 4,405,477 | | | | 1,848,336 | |
| | | 253,587 | | | | (558,276 | ) | | | 340,847 | | | | (978,708 | ) | | | 4,357,714 | | | | (5,830,908 | ) |
| | | | | | | | | | | | | | | | | | | | | | | | |
| | | | | | | | | | | | | | | | | | | | | | | | |
| | | | | | | | | | | | | | | | | | | | | | | | |
| | | 2,586,400 | | | | 6,852,325 | | | | – | | | | 7,340,348 | | | | 1,596,910 | | | | 40,034,238 | |
| | | (2,540,134 | ) | | | (10,342,673 | ) | | | (1,174,652 | ) | | | (6,293,922 | ) | | | (1,061,620 | ) | | | (492,623 | ) |
| | | 330 | | | | – | | | | – | | | | 1,357 | | | | 798 | | | | 20,017 | |
| | | 46,596 | | | | (3,490,348 | ) | | | (1,174,652 | ) | | | 1,047,783 | | | | 536,088 | | | | 39,561,632 | |
| | $ | 300,183 | | | $ | (4,048,624 | ) | | $ | (833,805 | ) | | $ | 69,075 | | | $ | 4,893,802 | | | $ | 33,730,724 | |
| | | | | | | | | | | | | | | | | | | | | | | | |
| | | | | | | | | | | | | | | | | | | | | | | | |
| | $ | 3,755,283 | | | $ | 7,803,907 | | | $ | 3,472,447 | | | $ | 3,403,372 | | | $ | 35,626,605 | | | $ | 1,895,881 | |
| | $ | 4,055,466 | | | $ | 3,755,283 | | | $ | 2,638,642 | | | $ | 3,472,447 | | | $ | 40,520,407 | | | $ | 35,626,605 | |
| | | | | | | | | | | | | | | | | | | | | | | | |
| | | | | | | | | | | | | | | | | | | | | | | | |
| | | 100,000 | | | | 250,000 | | | | – | | | | 300,000 | | | | 75,000 | | | | 1,650,000 | |
| | | (100,000 | ) | | | (375,000 | ) | | | (50,000 | ) | | | (275,000 | ) | | | (50,000 | ) | | | (25,000 | ) |
| | | – | | | | (125,000 | ) | | | (50,000 | ) | | | 25,000 | | | | 25,000 | | | | 1,625,000 | |
The accompanying notes are an integral part of these financial statements.
Statements of Changes in Net Assets
| | | Innovator U.S. Equity
Accelerated Plus ETF - January | |
| | | Period Ended April 30, 2023 (Unaudited) | | | Period Ended October 31, 2022 (a) | |
Operations: | | | | | | | | |
Net Investment income/(loss) | | $ | (32,782 | ) | | $ | (38,272 | ) |
Net realized gain/(loss) | | | (1,238,259 | ) | | | (5,447 | ) |
Net change in unrealized appreciation/(depreciation) | | | 2,171,293 | | | | (1,272,065 | ) |
Net Increase/(Decrease) in Net Assets Resulting from Operations | | | 900,252 | | | | (1,315,784 | ) |
| | | | | | | | | |
| | | | | | | | | |
Capital Share Transactions: | | | | | | | | |
Proceeds from shares sold | | | 6,078,730 | | | | 10,027,000 | |
Cost of shares redeemed | | | (529,735 | ) | | | (3,748,603 | ) |
Transaction fees (see Note 5) | | | 3,039 | | | | 4,705 | |
Net Increase/(Decrease) in Net Assets from Capital Share Transactions | | | 5,552,034 | | | | 6,283,102 | |
Total Increase/(Decrease) in Net Assets | | $ | 6,452,286 | | | $ | 4,967,318 | |
| | | | | | | | | |
Net Assets: | | | | | | | | |
Beginning of the period | | $ | 4,967,318 | | | $ | – | |
End of the period | | $ | 11,419,604 | | | $ | 4,967,318 | |
| | | | | | | | | |
Change in Shares Outstanding: | | | | | | | | |
Shares sold | | | 300,000 | | | | 425,000 | |
Shares redeemed | | | (25,000 | ) | | | (175,000 | ) |
Net Increase/(Decrease) | | | 275,000 | | | | 250,000 | |
(a) Since Commencement of Operations on December 31, 2021.
The accompanying notes are an integral part of these financial statements.
| | Innovator U.S. Equity Accelerated Plus ETF - April | | | Innovator U.S. Equity Accelerated Plus ETF - July | | | Innovator U.S. Equity Accelerated Plus ETF - October | |
| | Period Ended April 30, 2023 (Unaudited) | | | Year Ended October 31, 2022 | | | Period Ended April 30, 2023 (Unaudited) | | | Year Ended October 31, 2022 | | | Period Ended April 30, 2023 (Unaudited) | | | Year Ended October 31, 2022 | |
| | | | | | | | | | | | | | | | | | | | | | | | |
| | $ | (12,259 | ) | | $ | (75,302 | ) | | $ | (48,866 | ) | | $ | (105,222 | ) | | $ | (75,544 | ) | | $ | (50,668 | ) |
| | | (483,417 | ) | | | 1,255,459 | | | | 410,910 | | | | (2,699,087 | ) | | | 373,016 | | | | (1,565,745 | ) |
| | | 699,164 | | | | (1,159,296 | ) | | | 1,330,962 | | | | (269,252 | ) | | | 1,769,730 | | | | 622,764 | |
| | | 203,488 | | | | 20,861 | | | | 1,693,006 | | | | (3,073,561 | ) | | | 2,067,202 | | | | (993,649 | ) |
| | | | | | | | | | | | | | | | | | | | | | | | |
| | | | | | | | | | | | | | | | | | | | | | | | |
| | | | | | | | | | | | | | | | | | | | | | | | |
| | | 1,324,874 | | | | 41,673,345 | | | | – | | | | 30,897,257 | | | | 5,974,350 | | | | 17,446,092 | |
| | | (1,243,795 | ) | | | (46,427,730 | ) | | | (2,525,397 | ) | | | (24,618,888 | ) | | | (1,645,300 | ) | | | (3,882,815 | ) |
| | | 663 | | | | 11,466 | | | | – | | | | 10,156 | | | | 2,987 | | | | 8,721 | |
| | | 81,742 | | | | (4,742,919 | ) | | | (2,525,397 | ) | | | 6,288,525 | | | | 4,332,037 | | | | 13,571,998 | |
| | $ | 285,230 | | | $ | (4,722,058 | ) | | $ | (832,391 | ) | | $ | 3,214,964 | | | $ | 6,399,239 | | | $ | 12,578,349 | |
| | | | | | | | | | | | | | | | | | | | | | | | |
| | | | | | | | | | | | | | | | | | | | | | | | |
| | $ | 3,734,886 | | | $ | 8,456,944 | | | $ | 12,702,584 | | | $ | 9,487,620 | | | $ | 15,108,183 | | | $ | 2,529,834 | |
| | $ | 4,020,116 | | | $ | 3,734,886 | | | $ | 11,870,193 | | | $ | 12,702,584 | | | $ | 21,507,422 | | | $ | 15,108,183 | |
| | | | | | | | | | | | | | | | | | | | | | | | |
| | | | | | | | | | | | | | | | | | | | | | | | |
| | | 50,000 | | | | 1,500,000 | | | | – | | | | 1,300,000 | | | | 275,000 | | | | 800,000 | |
| | | (50,000 | ) | | | (1,650,000 | ) | | | (100,000 | ) | | | (1,100,000 | ) | | | (75,000 | ) | | | (175,000 | ) |
| | | – | | | | (150,000 | ) | | | (100,000 | ) | | | 200,000 | | | | 200,000 | | | | 625,000 | |
The accompanying notes are an integral part of these financial statements.
Statements of Changes in Net Assets
| | | Innovator U.S. Equity
Accelerated 9 Buffer ETF -
January | |
| | | Period Ended April 30, 2023 (Unaudited) | | | Period Ended October 31, 2022 (a) | |
Operations: | | | | | | | | |
Net Investment income/(loss) | | $ | (143,740 | ) | | $ | (85,724 | ) |
Net realized gain/(loss) | | | (1,802,496 | ) | | | 803,359 | |
Net change in unrealized appreciation/(depreciation) | | | 5,171,539 | | | | (1,926,094 | ) |
Net Increase/(Decrease) in Net Assets Resulting from Operations | | | 3,225,303 | | | | (1,208,459 | ) |
| | | | | | | | | |
| | | | | | | | | |
Capital Share Transactions: | | | | | | | | |
Proceeds from shares sold | | | 52,081,557 | | | | 20,627,440 | |
Cost of shares redeemed | | | (8,758,655 | ) | | | (5,128,687 | ) |
Transaction fees (see Note 5) | | | 22,771 | | | | 9,696 | |
Net Increase/(Decrease) in Net Assets from Capital Share Transactions | | | 43,345,673 | | | | 15,508,449 | |
Total Increase/(Decrease) in Net Assets | | $ | 46,570,976 | | | $ | 14,299,990 | |
| | | | | | | | | |
Net Assets: | | | | | | | | |
Beginning of the period | | $ | 14,299,990 | | | $ | – | |
End of the period | | $ | 60,870,966 | | | $ | 14,299,990 | |
| | | | | | | | | |
Change in Shares Outstanding: | | | | | | | | |
Shares sold | | | 2,325,000 | | | | 875,000 | |
Shares redeemed | | | (400,000 | ) | | | (225,000 | ) |
Net Increase/(Decrease) | | | 1,925,000 | | | | 650,000 | |
(a) Since Commencement of Operations on December 31, 2021.
The accompanying notes are an integral part of these financial statements.
| | Innovator U.S. Equity Accelerated 9 Buffer ETF -
April | | | Innovator U.S. Equity Accelerated 9 Buffer ETF -
July | | | Innovator U.S. Equity Accelerated 9 Buffer ETF - October | |
| | Period Ended April 30, 2023 (Unaudited) | | | Year Ended October 31, 2022 | | | Period Ended April 30, 2023 (Unaudited) | | | Year Ended October 31, 2022 | | | Period Ended April 30, 2023 (Unaudited) | | | Year Ended October 31, 2022 | |
| | | | | | | | | | | | | | | | | | | | | | | | |
| | $ | (82,445 | ) | | $ | (183,627 | ) | | $ | (132,065 | ) | | $ | (157,823 | ) | | $ | (179,275 | ) | | $ | (68,471 | ) |
| | | (780,193 | ) | | | 1,240,538 | | | | 895,372 | | | | 293,685 | | | | 401,819 | | | | (1,049,140 | ) |
| | | 2,979,440 | | | | (2,925,265 | ) | | | 2,614,801 | | | | (2,068,870 | ) | | | 3,924,143 | | | | 959,099 | |
| | | 2,116,802 | | | | (1,868,354 | ) | | | 3,378,108 | | | | (1,933,008 | ) | | | 4,146,687 | | | | (158,512 | ) |
| | | | | | | | | | | | | | | | | | | | | | | | |
| | | | | | | | | | | | | | | | | | | | | | | | |
| | | | | | | | | | | | | | | | | | | | | | | | |
| | | 44,312,682 | | | | 38,821,274 | | | | 3,178,413 | | | | 54,270,900 | | | | 11,562,260 | | | | 40,696,985 | |
| | | (13,236,200 | ) | | | (36,994,890 | ) | | | (5,274,454 | ) | | | (30,717,853 | ) | | | (1,800,755 | ) | | | (8,941,070 | ) |
| | | 17,831 | | | | 9,471 | | | | 1,589 | | | | 20,163 | | | | 5,782 | | | | 16,088 | |
| | | 31,094,313 | | | | 1,835,855 | | | | (2,094,452 | ) | | | 23,573,210 | | | | 9,767,287 | | | | 31,772,003 | |
| | $ | 33,211,115 | | | $ | (32,499 | ) | | $ | 1,283,656 | | | $ | 21,640,202 | | | $ | 13,913,974 | | | $ | 31,613,491 | |
| | | | | | | | | | | | | | | | | | | | | | | | |
| | | | | | | | | | | | | | | | | | | | | | | | |
| | $ | 19,606,418 | | | $ | 19,638,917 | | | $ | 32,236,954 | | | $ | 10,596,752 | | | $ | 35,947,982 | | | $ | 4,334,491 | |
| | $ | 52,817,533 | | | $ | 19,606,418 | | | $ | 33,520,610 | | | $ | 32,236,954 | | | $ | 49,861,956 | | | $ | 35,947,982 | |
| | | | | | | | | | | | | | | | | | | | | | | | |
| | | | | | | | | | | | | | | | | | | | | | | | |
| | | 1,625,000 | | | | 1,425,000 | | | | 125,000 | | | | 2,125,000 | | | | 500,000 | | | | 1,800,000 | |
| | | (500,000 | ) | | | (1,375,000 | ) | | | (200,000 | ) | | | (1,250,000 | ) | | | (75,000 | ) | | | (400,000 | ) |
| | | 1,125,000 | | | | 50,000 | | | | (75,000 | ) | | | 875,000 | | | | 425,000 | | | | 1,400,000 | |
The accompanying notes are an integral part of these financial statements.
Statements of Changes in Net Assets
| | | Innovator Growth Accelerated
Plus ETF - January | |
| | | Period Ended April 30, 2023 (Unaudited) | | | Period Ended October 31, 2022 (a) | |
Operations: | | | | | | | | |
Net Investment income/(loss) | | $ | (61,366 | ) | | $ | (44,573 | ) |
Net realized gain/(loss) | | | (2,440,076 | ) | | | (56,791 | ) |
Net change in unrealized appreciation/(depreciation) | | | 4,925,683 | | | | (2,329,964 | ) |
Net Increase/(Decrease) in Net Assets Resulting from Operations | | | 2,424,241 | | | | (2,431,328 | ) |
| | | | | | | | | |
| | | | | | | | | |
Capital Share Transactions: | | | | | | | | |
Proceeds from shares sold | | | 27,073,893 | | | | 11,747,653 | |
Cost of shares redeemed | | | (910,510 | ) | | | (4,920,453 | ) |
Transaction fees (see Note 5) | | | 13,992 | | | | 5,556 | |
Net Increase/(Decrease) in Net Assets from Capital Share Transactions | | | 26,177,375 | | | | 6,832,756 | |
Total Increase/(Decrease) in Net Assets | | $ | 28,601,616 | | | $ | 4,401,428 | |
| | | | | | | | | |
Net Assets: | | | | | | | | |
Beginning of the period | | $ | 4,401,428 | | | $ | – | |
End of the period | | $ | 33,003,044 | | | $ | 4,401,428 | |
| | | | | | | | | |
Change in Shares Outstanding: | | | | | | | | |
Shares sold | | | 1,500,000 | | | | 500,000 | |
Shares redeemed | | | (50,000 | ) | | | (250,000 | ) |
Net Increase/(Decrease) | | | 1,450,000 | | | | 250,000 | |
(a) Since Commencement of Operations on December 31, 2021.
The accompanying notes are an integral part of these financial statements.
| | Innovator Growth Accelerated Plus ETF - April | | | Innovator Growth Accelerated Plus ETF - July | | | Innovator Growth Accelerated Plus ETF - October | |
| | Period Ended April 30, 2023 (Unaudited) | | | Year Ended October 31, 2022 | | | Period Ended April 30, 2023 (Unaudited) | | | Year Ended October 31, 2022 | | | Period Ended April 30, 2023 (Unaudited) | | | Year Ended October 31, 2022 | |
| | | | | | | | | | | | | | | | | | | | | | | | |
| | $ | (17,304 | ) | | $ | (102,815 | ) | | $ | (47,096 | ) | | $ | (104,072 | ) | | $ | (38,103 | ) | | $ | (36,351 | ) |
| | | (1,720,067 | ) | | | 298,970 | | | | 829,449 | | | | (3,664,162 | ) | | | 103,477 | | | | (1,637,201 | ) |
| | | 2,289,870 | | | | (1,513,816 | ) | | | 1,266,607 | | | | (1,680,499 | ) | | | 1,571,777 | | | | 49,224 | |
| | | 552,499 | | | | (1,317,661 | ) | | | 2,048,960 | | | | (5,448,733 | ) | | | 1,637,151 | | | | (1,624,328 | ) |
| | | | | | | | | | | | | | | | | | | | | | | | |
| | | | | | | | | | | | | | | | | | | | | | | | |
| | | | | | | | | | | | | | | | | | | | | | | | |
| | | 5,361,650 | | | | 19,390,637 | | | | – | | | | 38,276,508 | | | | 5,299,378 | | | | 6,543,125 | |
| | | (3,399,777 | ) | | | (29,506,305 | ) | | | (12,196,525 | ) | | | (23,097,298 | ) | | | (508,570 | ) | | | (1,472,862 | ) |
| | | 3,796 | | | | 1,853 | | | | 523 | | | | 12,013 | | | | 2,650 | | | | 2,946 | |
| | | 1,965,669 | | | | (10,113,815 | ) | | | (12,196,002 | ) | | | 15,191,223 | | | | 4,793,458 | | | | 5,073,209 | |
| | $ | 2,518,168 | | | $ | (11,431,476 | ) | | $ | (10,147,042 | ) | | $ | 9,742,490 | | | $ | 6,430,609 | | | $ | 3,448,881 | |
| | | | | | | | | | | | | | | | | | | | | | | | |
| | | | | | | | | | | | | | | | | | | | | | | | |
| | $ | 7,022,894 | | | $ | 18,454,370 | | | $ | 17,992,200 | | | $ | 8,249,710 | | | $ | 6,019,314 | | | $ | 2,570,433 | |
| | $ | 9,541,062 | | | $ | 7,022,894 | | | $ | 7,845,158 | | | $ | 17,992,200 | | | $ | 12,449,923 | | | $ | 6,019,314 | |
| | | | | | | | | | | | | | | | | | | | | | | | |
| | | | | | | | | | | | | | | | | | | | | | | | |
| | | 200,000 | | | | 725,000 | | | | – | | | | 1,750,000 | | | | 275,000 | | | | 300,000 | |
| | | (150,000 | ) | | | (1,050,000 | ) | | | (575,000 | ) | | | (1,150,000 | ) | | | (25,000 | ) | | | (75,000 | ) |
| | | 50,000 | | | | (325,000 | ) | | | (575,000 | ) | | | 600,000 | | | | 250,000 | | | | 225,000 | |
The accompanying notes are an integral part of these financial statements.
Statements of Changes in Net Assets
| | | Innovator Defined Wealth Shield ETF | |
| | | Period Ended April 30, 2023 (Unaudited) | | | Year Ended October 31, 2022 | |
Operations: | | | | | | | | |
Net Investment income/(loss) | | $ | (1,068,641 | ) | | $ | (795,181 | ) |
Net realized gain/(loss) | | | 16,812,537 | | | | 217,238 | |
Net change in unrealized appreciation/(depreciation) | | | (1,157,515 | ) | | | 3,775,588 | |
Net Increase/(Decrease) in Net Assets Resulting from Operations | | | 14,586,381 | | | | 3,197,645 | |
| | | | | | | | | |
| | | | | | | | | |
Capital Share Transactions: | | | | | | | | |
Proceeds from shares sold | | | 310,321,313 | | | | 523,189,050 | |
Cost of shares redeemed | | | (203,391,552 | ) | | | (299,145,558 | ) |
Transaction fees (see Note 5) | | | 78,236 | | | | 133,414 | |
Net Increase/(Decrease) in Net Assets from Capital Share Transactions | | | 107,007,997 | | | | 224,176,906 | |
Total Increase/(Decrease) in Net Assets | | $ | 121,594,378 | | | $ | 227,374,551 | |
| | | | | | | | | |
Net Assets: | | | | | | | | |
Beginning of the period | | $ | 256,462,068 | | | $ | 29,087,517 | |
End of the period | | $ | 378,056,446 | | | $ | 256,462,068 | |
| | | | | | | | | |
Change in Shares Outstanding: | | | | | | | | |
Shares sold | | | 11,525,000 | | | | 20,250,000 | |
Shares redeemed | | | (7,525,000 | ) | | | (11,575,000 | ) |
Net Increase/(Decrease) | | | 4,000,000 | | | | 8,675,000 | |
The accompanying notes are an integral part of these financial statements.
| | Innovator U.S. Equity Accelerated ETF - Quarterly | | | Innovator Growth Accelerated ETF - Quarterly | |
| | Period Ended April 30, 2023 (Unaudited) | | | Year Ended October 31, 2022 | | | Period Ended April 30, 2023 (Unaudited) | | | Year Ended October 31, 2022 | |
| | | | | | | | | | | | | | | | |
| | $ | (54,303 | ) | | $ | (91,751 | ) | | $ | (54,706 | ) | | $ | (116,153 | ) |
| | | 2,691,418 | | | | (2,162,238 | ) | | | 1,312,030 | | | | (4,479,231 | ) |
| | | (164,122 | ) | | | 79,918 | | | | (512,335 | ) | | | (132,088 | ) |
| | | 2,472,993 | | | | (2,174,071 | ) | | | 744,989 | | | | (4,727,472 | ) |
| | | | | | | | | | | | | | | | |
| | | | | | | | | | | | | | | | |
| | | | | | | | | | | | | | | | |
| | | 7,736,360 | | | | 32,813,970 | | | | 2,667,755 | | | | 39,819,130 | |
| | | (1,241,565 | ) | | | (32,627,833 | ) | | | (10,494,965 | ) | | | (32,716,332 | ) |
| | | 3,868 | | | | 6,952 | | | | 1,334 | | | | 6,810 | |
| | | 6,498,663 | | | | 193,089 | | | | (7,825,876 | ) | | | 7,109,608 | |
| | $ | 8,971,656 | | | $ | (1,980,982 | ) | | $ | (7,080,887 | ) | | $ | 2,382,136 | |
| | | | | | | | | | | | | | | | |
| | | | | | | | | | | | | | | | |
| | $ | 11,440,085 | | | $ | 13,421,067 | | | $ | 18,066,893 | | | $ | 15,684,757 | |
| | $ | 20,411,741 | | | $ | 11,440,085 | | | $ | 10,986,006 | | | $ | 18,066,893 | |
| | | | | | | | | | | | | | | | |
| | | | | | | | | | | | | | | | |
| | | 300,000 | | | | 1,275,000 | | | | 125,000 | | | | 1,600,000 | |
| | | (50,000 | ) | | | (1,250,000 | ) | | | (500,000 | ) | | | (1,275,000 | ) |
| | | 250,000 | | | | 25,000 | | | | (375,000 | ) | | | 325,000 | |
The accompanying notes are an integral part of these financial statements.
Financial Highlights
| | | Per Share Operating Performance (For a share outstanding throughout each period) |
| | | | | | | Investment Operations: | | | Capital Share Transactions: | | | | | |
| | | Net Asset Value, Beginning of Period | | | Net investment income/(loss) (b) | | | Net realized and unrealized gain/(loss) | | | Total From Investment Operations | | | Transaction fees (see Note 5) | | | Distributions Paid to Shareholders: Paid from realized gains | |
Innovator International Developed Power Buffer ETF - January | | | | | | | | | | | | | | | | | | | | | | | | |
For the period 11/1/2022 - 4/30/2023 | | $ | 24.11 | | | | (0.12 | ) | | | 4.97 | | | | 4.85 | | | | 0.01 | | | | – | |
For the year ended 10/31/2022 | | $ | 27.04 | | | | (0.22 | ) | | | (2.72 | ) | | | (2.94 | ) | | | 0.01 | | | | – | |
For the year ended 10/31/2021 | | $ | 23.82 | | | | (0.22 | ) | | | 3.43 | | | | 3.21 | | | | 0.01 | | | | – | |
For the period 12/31/2019 (d) - 10/31/2020 | | $ | 24.44 | | | | (0.17 | ) | | | (0.47 | ) | | | (0.64 | ) | | | 0.02 | | | | – | |
Innovator International Developed Power Buffer ETF - April | | | | | | | | | | | | | | | | | | | | | | | | |
For the period 11/1/2022 - 4/30/2023 | | $ | 22.46 | | | | (0.10 | ) | | | 2.40 | | | | 2.30 | | | | 0.03 | | | | – | |
For the year ended 10/31/2022 | | $ | 25.87 | | | | (0.20 | ) | | | (3.25 | ) | | | (3.45 | ) | | | 0.04 | | | | – | |
For the period 3/31/2021 (d) - 10/31/2021 | | $ | 24.90 | | | | (0.13 | ) | | | 1.08 | | | | 0.95 | | | | 0.02 | | | | – | |
Innovator International Developed Power Buffer ETF - July | | | | | | | | | | | | | | | | | | | | | | | | |
For the period 11/1/2022 - 4/30/2023 | | $ | 22.08 | | | | (0.10 | ) | | | 4.06 | | | | 3.96 | | | | 0.01 | | | | – | |
For the year ended 10/31/2022 | | $ | 24.68 | | | | (0.20 | ) | | | (2.42 | ) | | | (2.62 | ) | | | 0.02 | | | | – | |
For the year ended 10/31/2021 | | $ | 22.73 | | | | (0.21 | ) | | | 2.15 | | | | 1.94 | | | | 0.01 | | | | – | |
For the year ended 10/31/2020 | | $ | 23.43 | | | | (0.19 | ) | | | (0.30 | ) | | | (0.49 | ) | | | 0.02 | | | | (0.23 | ) |
For the period 6/28/2019 (d) - 10/31/2019 | | $ | 23.04 | | | | (0.06 | ) | | | 0.43 | | | | 0.37 | | | | 0.02 | | | | – | |
Innovator International Developed Power Buffer ETF - October | | | | | | | | | | | | | | | | | | | | | | | | |
For the period 11/1/2022 - 4/30/2023 | | $ | 22.20 | | | | (0.10 | ) | | | 3.57 | | | | 3.47 | | | – | (e) | | | – | |
For the year ended 10/31/2022 | | $ | 25.40 | | | | (0.20 | ) | | | (3.05 | ) | (g) | | (3.25 | ) | | | 0.05 | | | | – | |
For the period 9/30/2021 (d) - 10/31/2021 | | $ | 24.97 | | | | (0.02 | ) | | | 0.45 | | | | 0.43 | | | | – | (e) | | | – | |
(a) | Annualized for periods less than one year. |
(b) | Net investment income/(loss) per share has been calculated based on average shares outstanding during the period. |
(c) | Not annualized for periods less than one year. |
(d) | Commencement of operations. |
(e) | Amount represents less than $0.01 per share. |
(f) | Includes broker interest expense of 0.01%. |
(g) | Net realized and unrealized gain/(loss) per share includes balancing amounts necessary to reconcile the change in net asset value per share for the period, and may not reconcile with the aggregate gain/(loss) in the Statement of Operations due to share transactions for the period. |
The accompanying notes are an integral part of these financial statements.
| | | | Ratios/Supplemental Data: | |
| | | | | | | | | | | | | | | | | | Ratio to Average Net Assets of: (a) | | | | | |
| | Change in Net Asset Value for the Period | | | Net Asset Value, End of Period | | | Total return (c) | | | Net assets, end of period (000) | | | Expenses | | | Net investment income/(loss) | | | Portfolio turnover rate (c) | |
| | | | | | | | | | | | | | | | | | | | | | | | | | | | |
| | | 4.86 | | | $ | 28.97 | | | | 20.18 | % | | $ | 204,242 | | | | 0.85 | % | | | (0.84 | )% | | | 0 | % |
| | | (2.93 | ) | | $ | 24.11 | | | | (10.84 | )% | | $ | 65,688 | | | | 0.85 | % | | | (0.85 | )% | | | 0 | % |
| | | 3.22 | | | $ | 27.04 | | | | 13.47 | % | | $ | 57,450 | | | | 0.85 | % | | | (0.85 | )% | | | 0 | % |
| | | (0.62 | ) | | $ | 23.82 | | | | (2.52 | )% | | $ | 52,415 | | | | 0.85 | % | | | (0.85 | )% | | | 0 | % |
| | | | | | | | | | | | | | | | | | | | | | | | | | | | |
| | | 2.33 | | | $ | 24.79 | | | | 10.39 | % | | $ | 224,998 | | | | 0.85 | % | | | (0.84 | )% | | | 0 | % |
| | | (3.41 | ) | | $ | 22.46 | | | | (13.17 | )% | | $ | 43,236 | | | | 0.85 | % | | | (0.84 | )% | | | 0 | % |
| | | 0.97 | | | $ | 25.87 | | | | 3.88 | % | | $ | 20,047 | | | | 0.85 | % | | | (0.85 | )% | | | 0 | % |
| | | | | | | | | | | | | | | | | | | | | | | | | | | | |
| | | 3.97 | | | $ | 26.05 | | | | 17.97 | % | | $ | 110,041 | | | | 0.85 | % | | | (0.84 | )% | | | 0 | % |
| | | (2.60 | ) | | $ | 22.08 | | | | (10.54 | )% | | $ | 188,757 | | | | 0.85 | % | | | (0.85 | )% | | | 0 | % |
| | | 1.95 | | | $ | 24.68 | | | | 8.58 | % | | $ | 56,141 | | | | 0.85 | % | | | (0.85 | )% | | | 0 | % |
| | | (0.70 | ) | | $ | 22.73 | | | | (2.04 | )% | | $ | 69,883 | | | | 0.86 | %(f) | | | (0.86 | )% | | | 0 | % |
| | | 0.39 | | | $ | 23.43 | | | | 1.70 | % | | $ | 63,851 | | | | 0.85 | % | | | (0.85 | )% | | | 99 | % |
| | | | | | | | | | | | | | | | | | | | | | | | | | | | |
| | | 3.47 | | | $ | 25.67 | | | | 15.61 | % | | $ | 105,238 | | | | 0.85 | % | | | (0.84 | )% | | | 0 | % |
| | | (3.20 | ) | | $ | 22.20 | | | | (12.60 | )% | | $ | 94,355 | | | | 0.85 | % | | | (0.85 | )% | | | 0 | % |
| | | 0.43 | | | $ | 25.40 | | | | 1.72 | % | | $ | 9,525 | | | | 0.85 | % | | | (0.85 | )% | | | 0 | % |
The accompanying notes are an integral part of these financial statements.
Financial Highlights
| | | Per Share Operating Performance (For a share outstanding throughout each period) |
| | | | | | | Investment Operations: | | | Capital Share Transactions: | | | | | |
| | | Net Asset Value, Beginning of Period | | | Net investment income/(loss) (b) | | | Net realized and unrealized gain/(loss) | | | Total From Investment Operations | | | Transaction fees (see Note 5) | | | Distributions Paid to Shareholders: Paid from realized gains | |
Innovator Emerging Markets Power Buffer ETF - January | | | | | | | | | | | | | | | | | | | | | | | | |
For the period 11/1/2022 - 4/30/2023 | | $ | 24.58 | | | | (0.12 | ) | | | 3.58 | | | | 3.46 | | | | 0.01 | | | | – | |
For the year ended 10/31/2022 | | $ | 29.95 | | | | (0.25 | ) | | | (5.13 | ) | | | (5.38 | ) | | | 0.01 | | | | – | |
For the year ended 10/31/2021 | | $ | 27.26 | | | | (0.27 | ) | | | 2.94 | (f) | | | 2.67 | | | | 0.02 | | | | – | |
For the period 12/31/2019 (d) - 10/31/2020 | | $ | 26.80 | | | | (0.19 | ) | | | 0.62 | (f) | | | 0.43 | | | | 0.03 | | | | – | |
Innovator Emerging Markets Power Buffer ETF - April | | | | | | | | | | | | | | | | | | | | | | | | |
For the period 11/1/2022 - 4/30/2023 | | $ | 21.51 | | | | (0.10 | ) | | | 2.79 | | | | 2.69 | | | | 0.01 | | | | – | |
For the year ended 10/31/2022 | | $ | 24.75 | | | | (0.21 | ) | | | (3.04 | ) | | | (3.25 | ) | | | 0.01 | | | | – | |
For the period 3/31/2021 (d) - 10/31/2021 | | $ | 24.96 | | | | (0.13 | ) | | | (0.10 | )(f) | | | (0.23 | ) | | | 0.02 | | | | – | |
Innovator Emerging Markets Power Buffer ETF - July | | | | | | | | | | | | | | | | | | | | | | | | |
For the period 11/1/2022 - 4/30/2023 | | $ | 21.22 | | | | (0.10 | ) | | | 1.95 | | | | 1.85 | | | | 0.01 | | | | – | |
For the year ended 10/31/2022 | | $ | 25.77 | | | | (0.21 | ) | | | (4.36 | ) | | | (4.57 | ) | | | 0.02 | | | | – | |
For the year ended 10/31/2021 | | $ | 25.60 | | | | (0.23 | ) | | | 0.39 | | | | 0.16 | | | | 0.01 | | | | – | |
For the year ended 10/31/2020 | | $ | 25.25 | | | | (0.22 | ) | | | 0.71 | (f) | | | 0.49 | | | | 0.03 | | | | (0.17 | ) |
For the period 6/28/2019 (d) - 10/31/2019 | | $ | 25.28 | | | | (0.07 | ) | | | 0.02 | (f) | | | (0.05 | ) | | | 0.02 | | | | – | |
Innovator Emerging Markets Power Buffer ETF - October | | | | | | | | | | | | | | | | | | | | | | | | |
For the period 11/1/2022 - 4/30/2023 | | $ | 20.50 | | | | (0.10 | ) | | | 2.75 | | | | 2.65 | | | – | (e) | | | – | |
For the year ended 10/31/2022 | | $ | 25.23 | | | | (0.20 | ) | | | (4.56 | ) | | | (4.76 | ) | | | 0.03 | | | | – | |
For the period 9/30/2021 (d) - 10/31/2021 | | $ | 24.99 | | | | (0.02 | ) | | | (0.26 | ) | | | 0.24 | | | | – | (e) | | | – | |
(a) | Annualized for periods less than one year. |
(b) | Net investment income/(loss) per share has been calculated based on average shares outstanding during the period. |
(c) | Not annualized for periods less than one year. |
(d) | Commencement of operations. |
(e) | Amount represents less than $0.01 per share. |
(f) | Net realized and unrealized gain/(loss) per share includes balancing amounts necessary to reconcile the change in net asset value per share for the period, and may not reconcile with the aggregate gain/(loss) in the Statement of Operations due to share transactions for the period. |
(g) | Includes broker interest expense of 0.01%. |
The accompanying notes are an integral part of these financial statements.
| | | | Ratios/Supplemental Data: | |
| | | | | | | | | | | | | | | | | | Ratio to Average Net Assets of: (a) | | | | | |
| | Change in Net Asset Value for the Period | | | Net Asset Value, End of Period | | | Total return (c) | | | Net assets, end of period (000) | | | Expenses | | | Net investment income/(loss) | | | Portfolio turnover rate (c) | |
| | | | | | | | | | | | | | | | | | | | | | | | | | | | |
| | | 3.47 | | | $ | 28.05 | | | | 14.11 | % | | $ | 115,692 | | | | 0.89 | % | | | (0.88 | )% | | | 0 | % |
| | | (5.37 | ) | | $ | 24.58 | | | | (17.93 | )% | | $ | 55,915 | | | | 0.89 | % | | | (0.89 | )% | | | 0 | % |
| | | 2.69 | | | $ | 29.95 | | | | 9.87 | % | | $ | 106,320 | | | | 0.89 | % | | | (0.89 | )% | | | 0 | % |
| | | 0.46 | | | $ | 27.26 | | | | 1.71 | % | | $ | 27,940 | | | | 0.89 | % | | | (0.89 | )% | | | 0 | % |
| | | | | | | | | | | | | | | | | | | | | | | | | | | | |
| | | 2.70 | | | $ | 24.21 | | | | 12.54 | % | | $ | 50,843 | | | | 0.89 | % | | | (0.88 | )% | | | 0 | % |
| | | (3.24 | ) | | $ | 21.51 | | | | (13.08 | )% | | $ | 30,656 | | | | 0.89 | % | | | (0.89 | )% | | | 0 | % |
| | | (0.21 | ) | | $ | 24.75 | | | | (0.84 | )% | | $ | 34,031 | | | | 0.89 | % | | | (0.89 | )% | | | 0 | % |
| | | | | | | | | | | | | | | | | | | | | | | | | | | | |
| | | 1.86 | | | $ | 23.08 | | | | 8.78 | % | | $ | 91,178 | | | | 0.89 | % | | | (0.88 | )% | | | 0 | % |
| | | (4.55 | ) | | $ | 21.22 | | | | (17.66 | )% | | $ | 54,643 | | | | 0.89 | % | | | (0.89 | )% | | | 0 | % |
| | | 0.17 | | | $ | 25.77 | | | | 0.68 | % | | $ | 41,237 | | | | 0.89 | % | | | (0.89 | )% | | | 0 | % |
| | | 0.35 | | | $ | 25.60 | | | | 2.04 | % | | $ | 35,197 | | | | 0.90 | %(g) | | | (0.90 | )% | | | 0 | % |
| | | (0.03 | ) | | $ | 25.25 | | | | (0.11 | )% | | $ | 43,559 | | | | 0.89 | % | | | (0.89 | )% | | | 31 | % |
| | | | | | | | | | | | | | | | | | | | | | | | | | | | |
| | | 2.65 | | | $ | 23.15 | | | | 12.89 | % | | $ | 30,669 | | | | 0.89 | % | | | (0.88 | )% | | | 0 | % |
| | | (4.73 | ) | | $ | 20.50 | | | | (18.75 | )% | | $ | 25,628 | | | | 0.89 | % | | | (0.89 | )% | | | 0 | % |
| | | 0.24 | | | $ | 25.23 | | | | 0.98 | % | | $ | 5,047 | | | | 0.89 | % | | | (0.89 | )% | | | 0 | % |
The accompanying notes are an integral part of these financial statements.
Financial Highlights
| | | Per Share Operating Performance (For a share outstanding throughout each period) |
| | | | | | | Investment Operations: | | | Capital Share Transactions: | | | | | |
| | | Net Asset Value, Beginning of Period | | | Net investment income/(loss) (b) | | | Net realized and unrealized gain/(loss) | | | Total From Investment Operations | | | Transaction fees (see Note 5) | | | Distributions Paid to Shareholders: Paid from realized gains | |
Innovator Growth-100 Power Buffer ETF - January | | | | | | | | | | | | | | | | | | | | | | | | |
For the period 11/1/2022 - 4/30/2023 | | $ | 35.60 | | | | (0.14 | ) | | | 2.88 | | | | 2.74 | | | | 0.01 | | | | – | |
For the year ended 10/31/2022 | | $ | 42.07 | | | | (0.30 | ) | | | (6.19 | ) | | | (6.49 | ) | | | 0.02 | | | | – | |
For the year ended 10/31/2021 | | $ | 37.44 | | | | (0.31 | ) | | | 4.91 | | | | 4.60 | | | | 0.03 | | | | – | |
For the period 12/31/2019 (d) - 10/31/2020 | | $ | 34.94 | | | | (0.24 | ) | | | 2.69 | | | | 2.45 | | | | 0.05 | | | | – | |
Innovator Growth-100 Power Buffer ETF - April | | | | | | | | | | | | | | | | | | | | | | | | |
For the period 11/1/2022 - 4/30/2023 | | $ | 34.67 | | | | (0.14 | ) | | | 4.58 | | | | 4.44 | | | | 0.02 | | | | – | |
For the year ended 10/31/2022 | | $ | 38.38 | | | | (0.29 | ) | | | (3.45 | ) | | | (3.74 | ) | | | 0.03 | | | | – | |
For the year ended 10/31/2021 | | $ | 34.93 | | | | (0.29 | ) | | | 3.71 | | | | 3.42 | | | | 0.03 | | | | – | |
For the period 3/31/2020 (d) - 10/31/2020 | | $ | 31.27 | | | | (0.16 | ) | | | 3.77 | | | | 3.61 | | | | 0.05 | | | | – | |
Innovator Growth-100 Power Buffer ETF - July | | | | | | | | | | | | | | | | | | | | | | | | |
For the period 11/1/2022 - 4/30/2023 | | $ | 43.06 | | | | (0.17 | ) | | | 5.71 | | | | 5.54 | | | | 0.01 | | | | – | |
For the year ended 10/31/2022 | | $ | 47.65 | | | | (0.35 | ) | | | (4.28 | ) | | | (4.63 | ) | | | 0.04 | | | | – | |
For the year ended 10/31/2021 | | $ | 42.23 | | | | (0.36 | ) | | | 5.74 | | | | 5.38 | | | | 0.04 | | | | – | |
For the period 6/30/2020 (d) - 10/31/2020 | | $ | 40.64 | | | | (0.11 | ) | | | 1.67 | | | | 1.56 | | | | 0.03 | | | | – | |
Innovator Growth-100 Power Buffer ETF - October | | | | | | | | | | | | | | | | | | | | | | | | |
For the period 11/1/2022 - 4/30/2023 | | $ | 35.28 | | | | (0.14 | ) | | | 4.53 | | | | 4.39 | | | | 0.01 | | | | – | |
For the year ended 10/31/2022 | | $ | 40.07 | | | | (0.30 | ) | | | (4.51 | ) | | | (4.81 | ) | | | 0.02 | | | | – | |
For the year ended 10/31/2021 | | $ | 33.53 | | | | (0.30 | ) | | | 6.82 | | | | 6.52 | | | | 0.02 | | | | – | |
For the year ended 10/31/2020 | | $ | 31.70 | | | | (0.26 | ) | | | 2.39 | | | | 2.13 | | | | 0.05 | | | | (0.35 | ) |
For the period 9/30/2019 (d) - 10/31/2019 | | $ | 31.01 | | | | (0.02 | ) | | | 0.70 | | | | 0.68 | | | | 0.01 | | | | – | |
(a) | Annualized for periods less than one year. |
(b) | Net investment income/(loss) per share has been calculated based on average shares outstanding during the period. |
(c) | Not annualized for periods less than one year. |
(d) | Commencement of operations. |
(e) | Includes broker interest expense of 0.02%. |
The accompanying notes are an integral part of these financial statements.
| | | | Ratios/Supplemental Data: | |
| | | | | | | | | | | | | | | | | | Ratio to Average Net Assets of: (a) | | | | | |
| | Change in Net Asset Value for the Period | | | Net Asset Value, End of Period | | | Total return (c) | | | Net assets, end of period (000) | | | Expenses | | | Net investment income/(loss) | | | Portfolio turnover rate (c) | |
| | | | | | | | | | | | | | | | | | | | | | | | | | | | |
| | | 2.75 | | | $ | 38.35 | | | | 7.71 | % | | $ | 94,908 | | | | 0.79 | % | | | (0.78 | )% | | | 0 | % |
| | | (6.47 | ) | | $ | 35.60 | | | | (15.37 | )% | | $ | 82,777 | | | | 0.79 | % | | | (0.79 | )% | | | 0 | % |
| | | 4.63 | | | $ | 42.07 | | | | 12.36 | % | | $ | 87,297 | | | | 0.79 | % | | | (0.79 | )% | | | 0 | % |
| | | 2.50 | | | $ | 37.44 | | | | 7.16 | % | | $ | 39,315 | | | | 0.79 | % | | | (0.79 | )% | | | 0 | % |
| | | | | | | | | | | | | | | | | | | | | | | | | | | | |
| | | 4.46 | | | $ | 39.13 | | | | 12.88 | % | | $ | 111,526 | | | | 0.79 | % | | | (0.78 | )% | | | 0 | % |
| | | (3.71 | ) | | $ | 34.67 | | | | (9.67 | )% | | $ | 52,866 | | | | 0.79 | % | | | (0.79 | )% | | | 0 | % |
| | | 3.45 | | | $ | 38.38 | | | | 9.87 | % | | $ | 41,254 | | | | 0.79 | % | | | (0.79 | )% | | | 0 | % |
| | | 3.66 | | | $ | 34.93 | | | | 11.69 | % | | $ | 15,717 | | | | 0.79 | % | | | (0.79 | )% | | | 0 | % |
| | | | | | | | | | | | | | | | | | | | | | | | | | | | |
| | | 5.55 | | | $ | 48.61 | | | | 12.91 | % | | $ | 76,566 | | | | 0.79 | % | | | (0.78 | )% | | | 0 | % |
| | | (4.59 | ) | | $ | 43.06 | | | | (9.64 | )% | | $ | 118,404 | | | | 0.79 | % | | | (0.79 | )% | | | 0 | % |
| | | 5.42 | | | $ | 47.65 | | | | 12.83 | % | | $ | 55,986 | | | | 0.79 | % | | | (0.79 | )% | | | 0 | % |
| | | 1.59 | | | $ | 42.23 | | | | 3.91 | % | | $ | 57,011 | | | | 0.79 | % | | | (0.79 | )% | | | 0 | % |
| | | | | | | | | | | | | | | | | | | | | | | | | | | | |
| | | 4.40 | | | $ | 39.68 | | | | 12.49 | % | | $ | 85,521 | | | | 0.79 | % | | | (0.78 | )% | | | 0 | % |
| | | (4.79 | ) | | $ | 35.28 | | | | (11.95 | )% | | $ | 80,965 | | | | 0.79 | % | | | (0.79 | )% | | | 0 | % |
| | | 6.54 | | | $ | 40.07 | | | | 19.51 | % | | $ | 77,928 | | | | 0.79 | % | | | (0.79 | )% | | | 0 | % |
| | | 1.83 | | | $ | 33.53 | | | | 6.92 | % | | $ | 40,566 | | | | 0.81 | %(e) | | | (0.81 | )% | | | 0 | % |
| | | 0.69 | | | $ | 31.70 | | | | 2.21 | % | | $ | 26,149 | | | | 0.79 | % | | | (0.79 | )% | | | 0 | % |
The accompanying notes are an integral part of these financial statements.
Financial Highlights
| | | Per Share Operating Performance (For a share outstanding throughout each period) |
| | | | | | | Investment Operations: | | | Capital Share Transactions: | | | | | |
| | | Net Asset Value, Beginning of Period | | | Net investment income/(loss) (b) | | | Net realized and unrealized gain/(loss) | | | Total From Investment Operations | | | Transaction fees (see Note 5) | | | Distributions Paid to Shareholders: Paid from realized gains | |
Innovator U.S. Small Cap Power Buffer ETF - January | | | | | | | | | | | | | | | | | | | | | | | | |
For the period 11/1/2022 - 4/30/2023 | | $ | 30.28 | | | | (0.12 | ) | | | 0.35 | | | | 0.23 | | | | 0.01 | | | | – | |
For the year ended 10/31/2022 | | $ | 31.76 | | | | (0.24 | ) | | | (1.26 | ) | | | (1.50 | ) | | | 0.02 | | | | – | |
For the year ended 10/31/2021 | | $ | 26.18 | | | | (0.24 | ) | | | 5.78 | | | | 5.54 | | | | 0.04 | | | | – | |
For the period 12/31/2019 (d) - 10/31/2020 | | $ | 26.70 | | | | (0.17 | ) | | | (0.40 | ) | | | (0.57 | ) | | | 0.05 | | | | – | |
Innovator U.S. Small Cap Power Buffer ETF - April | | | | | | | | | | | | | | | | | | | | | | | | |
For the period 11/1/2022 - 4/30/2023 | | $ | 25.52 | | | | (0.10 | ) | | | 0.93 | | | | 0.83 | | | | 0.01 | | | | – | |
For the year ended 10/31/2022 | | $ | 27.83 | | | | (0.20 | ) | | | (2.12 | ) | | | (2.32 | ) | | | 0.01 | | | | – | |
For the year ended 10/31/2021 | | $ | 26.00 | | | | (0.22 | ) | | | 2.03 | | | | 1.81 | | | | 0.02 | | | | – | |
For the period 3/31/2020 (d) - 10/31/2020 | | $ | 23.05 | | | | (0.12 | ) | | | 3.05 | | | | 2.93 | | | | 0.02 | | | | – | |
Innovator U.S. Small Cap Power Buffer ETF - July | | | | | | | | | | | | | | | | | | | | | | | | |
For the period 11/1/2022 - 4/30/2023 | | $ | 24.48 | | | | (0.10 | ) | | | (0.03 | ) | | | (0.13 | ) | | – | (e) | | | – | |
For the year ended 10/31/2022 | | $ | 26.70 | | | | (0.20 | ) | | | (2.03 | ) | | | (2.23 | ) | | | 0.01 | | | | – | |
For the year ended 10/31/2021 | | $ | 23.91 | | | | (0.21 | ) | | | 2.99 | | | | 2.78 | | | | 0.01 | | | | – | |
For the period 6/30/2020 (d) - 10/31/2020 | | $ | 23.07 | | | | (0.06 | ) | | | 0.89 | | | | 0.83 | | | | 0.01 | | | | – | |
Innovator U.S. Small Cap Power Buffer ETF - October | | | | | | | | | | | | | | | | | | | | | | | | |
For the period 11/1/2022 - 4/30/2023 | | $ | 25.37 | | | | (0.10 | ) | | | 0.46 | | | | 0.36 | | | | 0.01 | | | | – | |
For the year ended 10/31/2022 | | $ | 27.65 | | | | (0.20 | ) | | | (2.10 | ) | | | (2.30 | ) | | | 0.02 | | | | – | |
For the year ended 10/31/2021 | | $ | 24.08 | | | | (0.21 | ) | | | 3.77 | | | | 3.56 | | | | 0.01 | | | | – | |
For the year ended 10/31/2020 | | $ | 24.71 | | | | (0.19 | ) | | | (0.26 | ) | | | (0.45 | ) | | | 0.02 | | | | (0.20 | ) |
For the period 9/30/2019 (d) - 10/31/2019 | | $ | 24.38 | | | | (0.01 | ) | | | 0.33 | | | | 0.32 | | | | 0.01 | | | | – | |
(a) | Annualized for periods less than one year. |
(b) | Net investment income/(loss) per share has been calculated based on average shares outstanding during the period. |
(c) | Not annualized for periods less than one year. |
(d) | Commencement of operations. |
(e) | Amount represents less than $0.01 per share. |
The accompanying notes are an integral part of these financial statements.
| | | | Ratios/Supplemental Data: | |
| | | | | | | | | | | | | | | | | | Ratio to Average Net Assets of: (a) | | | | | |
| | Change in Net Asset Value for the Period | | | Net Asset Value, End of Period | | | Total return (c) | | | Net assets, end of period (000) | | | Expenses | | | Net investment income/(loss) | | | Portfolio turnover rate (c) | |
| | | | | | | | | | | | | | | | | | | | | | | | | | | | |
| | | 0.24 | | | $ | 30.52 | | | | 0.79 | % | | $ | 175,495 | | | | 0.79 | % | | | (0.78 | )% | | | 0 | % |
| | | (1.48 | ) | | $ | 30.28 | | | | (4.65 | )% | | $ | 79,491 | | | | 0.79 | % | | | (0.79 | )% | | | 0 | % |
| | | 5.58 | | | $ | 31.76 | | | | 21.31 | % | | $ | 84,958 | | | | 0.79 | % | | | (0.79 | )% | | | 0 | % |
| | | (0.52 | ) | | $ | 26.18 | | | | (1.95 | )% | | $ | 165,588 | | | | 0.79 | % | | | (0.79 | )% | | | 0 | % |
| | | | | | | | | | | | | | | | | | | | | | | | | | | | |
| | | 0.84 | | | $ | 26.36 | | | | 3.29 | % | | $ | 126,523 | | | | 0.79 | % | | | (0.78 | )% | | | 0 | % |
| | | (2.31 | ) | | $ | 25.52 | | | | (8.29 | )% | | $ | 84,855 | | | | 0.79 | % | | | (0.79 | )% | | | 0 | % |
| | | 1.83 | | | $ | 27.83 | | | | 7.04 | % | | $ | 84,876 | | | | 0.79 | % | | | (0.79 | )% | | | 0 | % |
| | | 2.95 | | | $ | 26.00 | | | | 12.79 | % | | $ | 33,147 | | | | 0.79 | % | | | (0.79 | )% | | | 0 | % |
| | | | | | | | | | | | | | | | | | | | | | | | | | | | |
| | | (0.13 | ) | | $ | 24.35 | | | | (0.51 | )% | | $ | 69,410 | | | | 0.79 | % | | | (0.77 | )% | | | 0 | % |
| | | (2.22 | ) | | $ | 24.48 | | | | (8.30 | )% | | $ | 78,335 | | | | 0.79 | % | | | (0.79 | )% | | | 0 | % |
| | | 2.79 | | | $ | 26.70 | | | | 11.64 | % | | $ | 74,083 | | | | 0.79 | % | | | (0.79 | )% | | | 0 | % |
| | | 0.84 | | | $ | 23.91 | | | | 3.66 | % | | $ | 23,316 | | | | 0.79 | % | | | (0.79 | )% | | | 0 | % |
| | | | | | | | | | | | | | | | | | | | | | | | | | | | |
| | | 0.37 | | | $ | 25.74 | | | | 1.47 | % | | $ | 75,936 | | | | 0.79 | % | | | (0.78 | )% | | | 0 | % |
| | | (2.28 | ) | | $ | 25.37 | | | | (8.24 | )% | | $ | 72,937 | | | | 0.79 | % | | | (0.79 | )% | | | 0 | % |
| | | 3.57 | | | $ | 27.65 | | | | 14.79 | % | | $ | 36,632 | | | | 0.79 | % | | | (0.79 | )% | | | 0 | % |
| | | (0.63 | ) | | $ | 24.08 | | | | (1.73 | )% | | $ | 48,170 | | | | 0.79 | % | | | (0.79 | )% | | | 0 | % |
| | | 0.33 | | | $ | 24.71 | | | | 1.35 | % | | $ | 27,179 | | | | 0.79 | % | | | (0.74 | )% | | | 0 | % |
The accompanying notes are an integral part of these financial statements.
Financial Highlights
| | | Per Share Operating Performance (For a share outstanding throughout each period) |
| | | | | | | Investment Operations: | | | Capital Share Transactions: | |
| | | Net Asset Value, Beginning of Period | | | Net investment income/(loss) (b) | | | Net realized and unrealized gain/(loss) | | | Total From Investment Operations | | | Transaction fees (see Note 5) | |
Innovator Double Stacker ETF - January | | | | | | | | | | | | | | | | | | | | |
For the period 11/1/2022 - 4/30/2023 | | $ | 24.24 | | | | (0.09 | ) | | | 2.73 | | | | 2.64 | | | | 0.01 | |
For the year ended 10/31/2022 | | $ | 29.76 | | | | (0.21 | ) | | | (5.32 | ) | | | (5.53 | ) | | | 0.01 | |
For the period 12/31/2020 (d) - 10/31/2021 | | $ | 25.43 | | | | (0.18 | ) | | | 4.50 | | | | 4.32 | | | | 0.01 | |
Innovator Double Stacker ETF - October | | | | | | | | | | | | | | | | | | | | |
For the period 11/1/2022 - 4/30/2023 | | $ | 26.81 | | | | (0.11 | ) | | | 3.62 | | | | 3.51 | | | – | (e) |
For the year ended 10/31/2022 | | $ | 32.64 | | | | (0.24 | ) | | | (5.60 | ) | | | (5.84 | ) | | | 0.01 | |
For the year ended 10/31/2021 | | $ | 24.84 | | | | (0.23 | ) | | | 8.01 | | | | 7.78 | | | | 0.02 | |
For the period 9/30/2020 (d) - 10/31/2020 | | $ | 25.47 | | | | (0.02 | ) | | | (0.64 | ) | | | (0.66 | ) | | | 0.03 | |
Innovator Triple Stacker ETF - January | | | | | | | | | | | | | | | | | | | | |
For the period 11/1/2022 - 4/30/2023 | | $ | 23.96 | | | | (0.09 | ) | | | 2.10 | | | | 2.01 | | | | 0.01 | |
For the year ended 10/31/2022 | | $ | 29.40 | | | | (0.22 | ) | | | (5.25 | ) | | | (5.47 | ) | | | 0.03 | |
For the period 12/31/2020 (d) - 10/31/2021 | | $ | 25.42 | | | | (0.18 | ) | | | 4.14 | | | | 3.96 | | | | 0.02 | |
Innovator Triple Stacker ETF - October | | | | | | | | | | | | | | | | | | | | |
For the period 11/1/2022 - 4/30/2023 | | $ | 26.38 | | | | (0.11 | ) | | | 2.89 | | | | 2.78 | | | – | (e) |
For the year ended 10/31/2022 | | $ | 31.81 | | | | (0.24 | ) | | | (5.22 | ) | | | (5.46 | ) | | | 0.03 | |
For the year ended 10/31/2021 | | $ | 25.00 | | | | (0.23 | ) | | | 7.02 | | | | 6.79 | | | | 0.02 | |
For the period 9/30/2020 (d) - 10/31/2020 | | $ | 25.46 | | | | (0.02 | ) | | | (0.45 | ) | | | (0.47 | ) | | | 0.01 | |
(a) | Annualized for periods less than one year. |
(b) | Net investment income/(loss) per share has been calculated based on average shares outstanding during the period. |
(c) | Not annualized for periods less than one year. |
(d) | Commencement of operations. |
(e) | Amount represents less than $0.01 per share. |
(f) | Includes broker interest expense of 0.01%. |
The accompanying notes are an integral part of these financial statements.
| | | | Ratios/Supplemental Data: | |
| | | | | | | | | | | | | | | | | | Ratio to Average Net Assets of: (a) | | | | | |
| | Change in Net Asset Value for the Period | | | Net Asset Value, End of Period | | | Total return (c) | | | Net assets, end of period (000) | | | Expenses | | | Net investment income/(loss) | | | Portfolio turnover rate (c) | |
| | | | | | | | | | | | | | | | | | | | | | | | | | | | |
| | | 2.65 | | | $ | 26.89 | | | | 10.94 | % | | $ | 2,689 | | | | 0.79 | % | | | (0.75 | )% | | | 0 | % |
| | | (5.52 | ) | | $ | 24.24 | | | | (18.56 | )% | | $ | 3,030 | | | | 0.79 | % | | | (0.79 | )% | | | 0 | % |
| | | 4.33 | | | $ | 29.76 | | | | 17.04 | % | | $ | 6,697 | | | | 0.79 | % | | | (0.79 | )% | | | 0 | % |
| | | | | | | | | | | | | | | | | | | | | | | | | | | | |
| | | 3.51 | | | $ | 30.32 | | | | 13.12 | % | | $ | 4,548 | | | | 0.79 | % | | | (0.76 | )% | | | 0 | % |
| | | (5.83 | ) | | $ | 26.81 | | | | (17.86 | )% | | $ | 4,021 | | | | 0.79 | % | | | (0.79 | )% | | | 0 | % |
| | | 7.80 | | | $ | 32.64 | | | | 31.36 | % | | $ | 8,975 | | | | 0.79 | % | | | (0.79 | )% | | | 0 | % |
| | | (0.63 | ) | | $ | 24.84 | | | | (2.46 | )% | | $ | 11,801 | | | | 0.80 | %(f) | | | (0.80 | )% | | | 0 | % |
| | | | | | | | | | | | | | | | | | | | | | | | | | | | |
| | | 2.02 | | | $ | 25.98 | | | | 8.42 | % | | $ | 5,195 | | | | 0.79 | % | | | (0.77 | )% | | | 0 | % |
| | | (5.44 | ) | | $ | 23.96 | | | | (18.53 | )% | | $ | 5,989 | | | | 0.79 | % | | | (0.79 | )% | | | 0 | % |
| | | 3.98 | | | $ | 29.40 | | | | 15.68 | % | | $ | 44,107 | | | | 0.79 | % | | | (0.79 | )% | | | 0 | % |
| | | | | | | | | | | | | | | | | | | | | | | | | | | | |
| | | 2.78 | | | $ | 29.16 | | | | 10.53 | % | | $ | 6,561 | | | | 0.79 | % | | | (0.77 | )% | | | 0 | % |
| | | (5.43 | ) | | $ | 26.38 | | | | (17.08 | )% | | $ | 5,276 | | | | 0.79 | % | | | (0.79 | )% | | | 0 | % |
| | | 6.81 | | | $ | 31.81 | | | | 27.25 | % | | $ | 16,702 | | | | 0.79 | % | | | (0.79 | )% | | | 0 | % |
| | | (0.46 | ) | | $ | 25.00 | | | | (1.80 | )% | | $ | 6,875 | | | | 0.79 | % | | | (0.79 | )% | | | 0 | % |
The accompanying notes are an integral part of these financial statements.
Financial Highlights
| | | Per Share Operating Performance (For a share outstanding throughout each period) |
| | | | | | | Investment Operations: | | | Capital Share Transactions: | |
| | | Net Asset Value, Beginning of Period | | | Net investment income/(loss) (b) | | | Net realized and unrealized gain/(loss) | | | Total From Investment Operations | | | Transaction fees (see Note 5) | |
Innovator Double Stacker 9 Buffer ETF - January | | | | | | | | | | | | | | | | | | | | |
For the period 11/1/2022 - 4/30/2023 | | $ | 25.20 | | | | (0.10 | ) | | | 2.14 | | | | 2.04 | | | | 0.01 | |
For the year ended 10/31/2022 | | $ | 28.09 | | | | (0.21 | ) | | | (2.70 | ) | | | (2.91 | ) | | | 0.02 | |
For the period 12/31/2020 (d) - 10/31/2021 | | $ | 25.42 | | | | (0.18 | ) | | | 2.83 | | | | 2.65 | | | | 0.02 | |
Innovator Double Stacker 9 Buffer ETF - October | | | | | | | | | | | | | | | | | | | | |
For the period 11/1/2022 - 4/30/2023 | | $ | 27.33 | | | | (0.11 | ) | | | 2.86 | | | | 2.75 | | | – | (e) |
For the year ended 10/31/2022 | | $ | 29.74 | | | | (0.23 | ) | | | (2.19 | ) | | | (2.42 | ) | | | 0.01 | |
For the year ended 10/31/2021 | | $ | 24.96 | | | | (0.22 | ) | | | 4.99 | | | | 4.77 | | | | 0.01 | |
For the period 9/30/2020 (d) - 10/31/2020 | | $ | 25.46 | | | | (0.02 | ) | | | (0.51 | ) | | | (0.53 | ) | | | 0.03 | |
Innovator 20+ Year Treasury Bond 9 Buffer ETF - July | | | | | | | | | | | | | | | | | | | | |
For the period 11/1/2022 - 4/30/2023 | | $ | 18.67 | | | | (0.08 | ) | | | 2.01 | | | | 1.93 | | | – | (e) |
For the year ended 10/31/2022 | | $ | 24.46 | | | | (0.17 | ) | | | (5.67 | ) | | | (5.84 | ) | | | 0.05 | |
For the year ended 10/31/2021 | | $ | 24.32 | | | | (0.17 | ) | | | 0.30 | (g) | | | 0.13 | | | | 0.01 | |
For the period 8/17/2020 (d) - 10/31/2020 | | $ | 24.87 | | | | (0.04 | ) | | | (0.52 | ) | | | (0.56 | ) | | | 0.01 | |
Innovator 20+ Year Treasury Bond 5 Floor ETF - Quarterly | | | | | | | | | | | | | | | | | | | | |
For the period 11/1/2022 - 4/30/2023 | | $ | 19.85 | | | | (0.08 | ) | | | 1.30 | | | | 1.22 | | | | 0.02 | |
For the year ended 10/31/2022 | | $ | 23.72 | | | | (0.17 | ) | | | (3.74 | ) | | | (3.91 | ) | | | 0.04 | |
For the year ended 10/31/2021 | | $ | 24.43 | | | | (0.19 | ) | | | (0.56 | )(g) | | | (0.75 | ) | | | 0.04 | |
For the period 8/17/2020 (d) - 10/31/2020 | | $ | 24.87 | | | | (0.04 | ) | | | (0.42 | ) | | | (0.46 | ) | | | 0.02 | |
(a) | Annualized for periods less than one year. |
(b) | Net investment income/(loss) per share has been calculated based on average shares outstanding during the period. |
(c) | Not annualized for periods less than one year. |
(d) | Commencement of operations. |
(e) | Amount represents less than $0.01 per share. |
(f) | Includes broker interest expense of 0.01%. |
(g) | Net realized and unrealized gain/(loss) per share includes balancing amounts necessary to reconcile the change in net asset value per share for the period, and may not reconcile with the aggregate gain/(loss) in the Statement of Operations due to share transactions for the period. |
The accompanying notes are an integral part of these financial statements.
| | | | Ratios/Supplemental Data: | |
| | | | | | | | | | | | | | | | | | Ratio to Average Net Assets of: (a) | | | | | |
| | Change in Net Asset Value for the Period | | | Net Asset Value, End of Period | | | Total return (c) | | | Net assets, end of period (000) | | | Expenses | | | Net investment income/(loss) | | | Portfolio turnover rate (c) | |
| | | | | | | | | | | | | | | | | | | | | | | | | | | | |
| | | 2.05 | | | $ | 27.25 | | | | 8.13 | % | | $ | 6,812 | | | | 0.79 | % | | | (0.78 | )% | | | 0 | % |
| | | (2.89 | ) | | $ | 25.20 | | | | (10.29 | )% | | $ | 8,190 | | | | 0.79 | % | | | (0.79 | )% | | | 0 | % |
| | | 2.67 | | | $ | 28.09 | | | | 10.50 | % | | $ | 13,342 | | | | 0.79 | % | | | (0.79 | )% | | | 0 | % |
| | | | | | | | | | | | | | | | | | | | | | | | | | | | |
| | | 2.75 | | | $ | 30.08 | | | | 10.04 | % | | $ | 14,287 | | | | 0.79 | % | | | (0.78 | )% | | | 0 | % |
| | | (2.41 | ) | | $ | 27.33 | | | | (8.09 | )% | | $ | 14,350 | | | | 0.79 | % | | | (0.79 | )% | | | 0 | % |
| | | 4.78 | | | $ | 29.74 | | | | 19.14 | % | | $ | 21,562 | | | | 0.79 | % | | | (0.79 | )% | | | 0 | % |
| | | (0.50 | ) | | $ | 24.96 | | | | (1.95 | )% | | $ | 31,204 | | | | 0.79 | % | | | (0.79 | )% | | | 0 | % |
| | | | | | | | | | | | | | | | | | | | | | | | | | | | |
| | | 1.93 | | | $ | 20.60 | | | | 10.37 | % | | $ | 56,663 | | | | 0.79 | % | | | (0.78 | )% | | | 0 | % |
| | | (5.79 | ) | | $ | 18.67 | | | | (23.67 | )% | | $ | 32,204 | | | | 0.79 | % | | | (0.79 | )% | | | 0 | % |
| | | 0.14 | | | $ | 24.46 | | | | 0.55 | % | | $ | 4,892 | | | | 0.79 | % | | | (0.72 | )% | | | 0 | % |
| | | (0.55 | ) | | $ | 24.32 | | | | (2.19 | )% | | $ | 5,473 | | | | 0.79 | % | | | (0.79 | )% | | | 0 | % |
| | | | | | | | | | | | | | | | | | | | | | | | | | | | |
| | | 1.24 | | | $ | 21.09 | | | | 6.26 | % | | $ | 7,910 | | | | 0.79 | % | | | (0.79 | )% | | | 0 | % |
| | | (3.87 | ) | | $ | 19.85 | | | | (16.32 | )% | | $ | 20,347 | | | | 0.79 | % | | | (0.79 | )% | | | 0 | % |
| | | 0.71 | | | $ | 23.72 | | | | (2.87 | )% | | $ | 9,489 | | | | 0.79 | % | | | (0.79 | )% | | | 0 | % |
| | | (0.44 | ) | | $ | 24.43 | | | | (1.79 | )% | | $ | 3,053 | | | | 0.80 | %(f) | | | (0.80 | )% | | | 0 | % |
The accompanying notes are an integral part of these financial statements.
Financial Highlights
| | | Per Share Operating Performance (For a share outstanding throughout |
| | | | | | | Investment Operations: | | | Capital Share Transactions: | |
| | | Net Asset Value, Beginning of Period | | | Net investment income/(loss) (b) | | | Net realized and unrealized gain/(loss) | | | Total From Investment Operations | | | Transaction fees (see Note 5) | |
Innovator U.S. Equity Accelerated ETF - January | | | | | | | | | | | | | | | | | | | | |
For the period 11/1/2022 - 4/30/2023 | | $ | 19.87 | | | | (0.08 | ) | | | 2.04 | | | | 1.96 | | | | 0.01 | |
For the period 12/31/2021 (d) - 10/31/2022 | | $ | 24.71 | | | | (0.14 | ) | | | (4.71 | ) | | | (4.85 | ) | | | 0.01 | |
Innovator U.S. Equity Accelerated ETF - April | | | | | | | | | | | | | | | | | | | | |
For the period 11/1/2022 - 4/30/2023 | | $ | 25.04 | | | | (0.10 | ) | | | 2.10 | | | | 2.00 | | | – | (e) |
For the year ended 10/31/2022 | | $ | 28.38 | | | | (0.21 | ) | | | (3.13 | ) | | | (3.34 | ) | | – | (e) |
For the period 3/31/2021 (d) - 10/31/2021 | | $ | 25.37 | | | | (0.13 | ) | | | 3.13 | | | | 3.00 | | | | 0.01 | |
Innovator U.S. Equity Accelerated ETF - July | | | | | | | | | | | | | | | | | | | | |
For the period 11/1/2022 - 4/30/2023 | | $ | 23.15 | | | | (0.09 | ) | | | 3.33 | | | | 3.24 | | | – | (e) |
For the year ended 10/31/2022 | | $ | 27.23 | | | | (0.20 | ) | | | (3.89 | ) | | | (4.09 | ) | | | 0.01 | |
For the period 6/30/2021 (d) - 10/31/2021 | | $ | 25.69 | | | | (0.07 | ) | | | 1.61 | | | | 1.54 | | | | – | (e) |
Innovator U.S. Equity Accelerated ETF - October | | | | | | | | | | | | | | | | | | | | |
For the period 11/1/2022 - 4/30/2023 | | $ | 20.96 | | | | (0.09 | ) | | | 2.62 | | | | 2.53 | | | – | (e) |
For the year ended 10/31/2022 | | $ | 25.28 | | | | (0.17 | ) | | | (4.20 | ) | | | (4.37 | ) | | | 0.05 | |
For the period 9/30/2021 (d) - 10/31/2021 | | $ | 24.05 | | | | (0.02 | ) | | | 1.25 | | | | 1.23 | | | | – | |
(a) | Annualized for periods less than one year. |
(b) | Net investment income/(loss) per share has been calculated based on average shares outstanding during the period. |
(c) | Not annualized for periods less than one year. |
(d) | Commencement of operations. |
(e) | Amount represents less than $0.01 per share. |
The accompanying notes are an integral part of these financial statements.
each period) | | | Ratios/Supplemental Data: | |
| | | | | | | | | | | | | | | | | | Ratio to Average Net Assets of: (a) | | | | | |
| | Change in Net Asset Value for the Period | | | Net Asset Value, End of Period | | | Total return (c) | | | Net assets, end of period (000) | | | Expenses | | | Net investment income/(loss) | | | Portfolio turnover rate (c) | |
| | | | | | | | | | | | | | | | | | | | | | | | | | | | |
| | | 1.97 | | | $ | 21.84 | | | | 9.92 | % | | $ | 10,373 | | | | 0.79 | % | | | (0.77 | )% | | | 0 | % |
| | | (4.84 | ) | | $ | 19.87 | | | | (19.60 | )% | | $ | 3,974 | | | | 0.79 | % | | | (0.79 | )% | | | 0 | % |
| | | | | | | | | | | | | | | | | | | | | | | | | | | | |
| | | 2.00 | | | $ | 27.04 | | | | 7.99 | % | | $ | 4,055 | | | | 0.79 | % | | | (0.76 | )% | | | 0 | % |
| | | (3.34 | ) | | $ | 25.04 | | | | (11.78 | )% | | $ | 3,755 | | | | 0.79 | % | | | (0.79 | )% | | | 0 | % |
| | | 3.01 | | | $ | 28.38 | | | | 11.86 | % | | $ | 7,804 | | | | 0.79 | % | | | (0.79 | )% | | | 0 | % |
| | | | | | | | | | | | | | | | | | | | | | | | | | | | |
| | | 3.24 | | | $ | 26.39 | | | | 13.98 | % | | $ | 2,639 | | | | 0.79 | % | | | (0.74 | )% | | | 0 | % |
| | | (4.08 | ) | | $ | 23.15 | | | | (14.97 | )% | | $ | 3,472 | | | | 0.79 | % | | | (0.78 | )% | | | 0 | % |
| | | 1.54 | | | $ | 27.23 | | | | 5.98 | % | | $ | 3,403 | | | | 0.79 | % | | | (0.79 | )% | | | 0 | % |
| | | | | | | | | | | | | | | | | | | | | | | | | | | | |
| | | 2.53 | | | $ | 23.49 | | | | 12.09 | % | | $ | 40,520 | | | | 0.79 | % | | | (0.78 | )% | | | 0 | % |
| | | (4.32 | ) | | $ | 20.96 | | | | (17.10 | )% | | $ | 35,627 | | | | 0.79 | % | | | (0.79 | )% | | | 0 | % |
| | | 1.23 | | | $ | 25.28 | | | | 5.11 | % | | $ | 1,896 | | | | 0.79 | % | | | (0.85 | )% | | | 0 | % |
The accompanying notes are an integral part of these financial statements.
Financial Highlights
| | | Per Share Operating Performance (For a share outstanding throughout |
| | | | | | | Investment Operations: | | | Capital Share Transactions: | |
| | | Net Asset Value, Beginning of Period | | | Net investment income/(loss) (b) | | | Net realized and unrealized gain/(loss) | | | Total From Investment Operations | | | Transaction fees (see Note 5) | |
Innovator U.S. Equity Accelerated Plus ETF - January | | | | | | | | | | | | | | | | | | | | |
For the period 11/1/2022 - 4/30/2023 | | $ | 19.87 | | | | (0.08 | ) | | | 1.95 | | | | 1.87 | | | | 0.01 | |
For the period 12/31/2021 (d) - 10/31/2022 | | $ | 24.71 | | | | (0.14 | ) | | | (4.72 | ) | | | (4.86 | ) | | | 0.02 | |
Innovator U.S. Equity Accelerated Plus ETF - April | | | | | | | | | | | | | | | | | | | | |
For the period 11/1/2022 - 4/30/2023 | | $ | 24.90 | | | | (0.10 | ) | | | 1.99 | | | | 1.89 | | | | 0.01 | |
For the year ended 10/31/2022 | | $ | 28.19 | | | | (0.22 | ) | | | (3.10 | ) | (f) | | (3.32 | ) | | | 0.03 | |
For the period 3/31/2021 (d) - 10/31/2021 | | $ | 25.37 | | | | (0.13 | ) | | | 2.94 | | | | 2.81 | | | | 0.01 | |
Innovator U.S. Equity Accelerated Plus ETF - July | | | | | | | | | | | | | | | | | | | | |
For the period 11/1/2022 - 4/30/2023 | | $ | 23.10 | | | | (0.09 | ) | | | 3.37 | | | | 3.28 | | | – | (e) |
For the year ended 10/31/2022 | | $ | 27.11 | | | | (0.19 | ) | | | (3.84 | ) | | | (4.03 | ) | | | 0.02 | |
For the period 6/30/2021 (d) - 10/31/2021 | | $ | 25.68 | | | | (0.07 | ) | | | 1.49 | | | | 1.42 | | | | 0.01 | |
Innovator U.S. Equity Accelerated Plus ETF - October | | | | | | | | | | | | | | | | | | | | |
For the period 11/1/2022 - 4/30/2023 | | $ | 20.84 | | | | (0.08 | ) | | | 2.49 | | | | 2.41 | | | – | (e) |
For the year ended 10/31/2022 | | $ | 25.30 | | | | (0.18 | ) | | | (4.31 | ) | | | (4.49 | ) | | | 0.03 | |
For the period 9/30/2021 (d) - 10/31/2021 | | $ | 24.05 | | | | (0.02 | ) | | | 1.27 | | | | 1.25 | | | | – | |
(a) | Annualized for periods less than one year. |
(b) | Net investment income/(loss) per share has been calculated based on average shares outstanding during the period. |
(c) | Not annualized for periods less than one year. |
(d) | Commencement of operations. |
(e) | Amount represents less than $0.01 per share. |
(f) | Net realized and unrealized gain/(loss) per share includes balancing amounts necessary to reconcile the change in net asset value per share for the period, and may not reconcile with the aggregate gain/(loss) in the Statement of Operations due to share transactions for the period. |
The accompanying notes are an integral part of these financial statements.
each period) | | | Ratios/Supplemental Data: | |
| | | | | | | | | | | | | | | | | | Ratio to Average Net Assets of: (a) | | | | | |
| | Change in Net Asset Value for the Period | | | Net Asset Value, End of Period | | | Total return (c) | | | Net assets, end of period (000) | | | Expenses | | | Net investment income/(loss) | | | Portfolio turnover rate (c) | |
| | | | | | | | | | | | | | | | | | | | | | | | | | | | |
| | | 1.88 | | | $ | 21.75 | | | | 9.47 | % | | $ | 11,420 | | | | 0.79 | % | | | (0.78 | )% | | | 0 | % |
| | | (4.84 | ) | | $ | 19.87 | | | | (19.59 | )% | | $ | 4,967 | | | | 0.79 | % | | | (0.79 | )% | | | 0 | % |
| | | | | | | | | | | | | | | | | | | | | | | | | | | | |
| | | 1.90 | | | $ | 26.80 | | | | 7.64 | % | | $ | 4,020 | | | | 0.79 | % | | | (0.77 | )% | | | 0 | % |
| | | (3.29 | ) | | $ | 24.90 | | | | (11.67 | )% | | $ | 3,735 | | | | 0.79 | % | | | (0.79 | )% | | | 0 | % |
| | | 2.82 | | | $ | 28.19 | | | | 11.11 | % | | $ | 8,457 | | | | 0.79 | % | | | (0.79 | )% | | | 0 | % |
| | | | | | | | | | | | | | | | | | | | | | | | | | | | |
| | | 3.28 | | | $ | 26.38 | | | | 14.21 | % | | $ | 11,870 | | | | 0.79 | % | | | (0.78 | )% | | | 0 | % |
| | | (4.01 | ) | | $ | 23.10 | | | | (14.80 | )% | | $ | 12,703 | | | | 0.79 | % | | | (0.79 | )% | | | 0 | % |
| | | 1.43 | | | $ | 27.11 | | | | 5.56 | % | | $ | 9,488 | | | | 0.79 | % | | | (0.79 | )% | | | 0 | % |
| | | | | | | | | | | | | | | | | | | | | | | | | | | | |
| | | 2.41 | | | $ | 23.25 | | | | 11.58 | % | | $ | 21,507 | | | | 0.79 | % | | | (0.78 | )% | | | 0 | % |
| | | (4.46 | ) | | $ | 20.84 | | | | (17.63 | )% | | $ | 15,108 | | | | 0.79 | % | | | (0.79 | )% | | | 0 | % |
| | | 1.25 | | | $ | 25.30 | | | | 5.20 | % | | $ | 2,530 | | | | 0.79 | % | | | (0.83 | )% | | | 0 | % |
The accompanying notes are an integral part of these financial statements.
Financial Highlights
| | | Per Share Operating Performance (For a share outstanding throughout |
| | | | | | | Investment Operations: | | | Capital Share Transactions: | |
| | | Net Asset Value, Beginning of Period | | | Net investment income/(loss) (b) | | | Net realized and unrealized gain/(loss) | | | Total From Investment Operations | | | Transaction fees (see Note 5) | |
Innovator U.S. Equity Accelerated 9 Buffer ETF - January | | | | | | | | | | | | | | | | | | | | |
For the period 11/1/2022 - 4/30/2023 | | $ | 22.00 | | | | (0.09 | ) | | | 1.72 | | | | 1.63 | | | | 0.01 | |
For the period 12/31/2021 (d) - 10/31/2022 | | $ | 24.70 | | | | (0.15 | ) | | | (2.57 | ) | | | (2.72 | ) | | | 0.02 | |
Innovator U.S. Equity Accelerated 9 Buffer ETF - April | | | | | | | | | | | | | | | | | | | | |
For the period 11/1/2022 - 4/30/2023 | | $ | 25.30 | | | | (0.10 | ) | | | 2.58 | | | | 2.48 | | | | 0.02 | |
For the year ended 10/31/2022 | | $ | 27.09 | | | | (0.21 | ) | | | (1.59 | ) | | | (1.80 | ) | | | 0.01 | |
For the period 3/31/2021 (d) - 10/31/2021 | | $ | 25.37 | | | | (0.12 | ) | | | 1.83 | | | | 1.71 | | | | 0.01 | |
Innovator U.S. Equity Accelerated 9 Buffer ETF - July | | | | | | | | | | | | | | | | | | | | |
For the period 11/1/2022 - 4/30/2023 | | $ | 25.28 | | | | (0.10 | ) | | | 2.75 | | | | 2.65 | | | – | (e) |
For the year ended 10/31/2022 | | $ | 26.49 | | | | (0.20 | ) | | | (1.04 | ) | | | (1.24 | ) | | | 0.03 | |
For the period 6/30/2021 (d) - 10/31/2021 | | $ | 25.68 | | | | (0.07 | ) | | | 0.87 | | | | 0.80 | | | | 0.01 | |
Innovator U.S. Equity Accelerated 9 Buffer ETF - October | | | | | | | | | | | | | | | | | | | | |
For the period 11/1/2022 - 4/30/2023 | | $ | 22.82 | | | | (0.09 | ) | | | 2.20 | | | | 2.11 | | | – | (e) |
For the year ended 10/31/2022 | | $ | 24.77 | | | | (0.19 | ) | | | (1.80 | ) | (f) | | (1.99 | ) | | | 0.04 | |
For the period 9/30/2021 (d) - 10/31/2021 | | $ | 24.04 | | | | (0.02 | ) | | | 0.74 | | | | 0.72 | | | | 0.01 | |
(a) | Annualized for periods less than one year. |
(b) | Net investment income/(loss) per share has been calculated based on average shares outstanding during the period. |
(c) | Not annualized for periods less than one year. |
(d) | Commencement of operations. |
(e) | Amount represents less than $0.01 per share. |
(f) | Net realized and unrealized gain/(loss) per share includes balancing amounts necessary to reconcile the change in net asset value per share for the period, and may not reconcile with the aggregate gain/(loss) in the Statement of Operations due to share transactions for the period. |
The accompanying notes are an integral part of these financial statements.
each period) | | | Ratios/Supplemental Data: | |
| | | | | | | | | | | | | | | | | | Ratio to Average Net Assets of: (a) | | | | | |
| | Change in Net Asset Value for the Period | | | Net Asset Value, End of Period | | | Total return (c) | | | Net assets, end of period (000) | | | Expenses | | | Net investment income/(loss) | | | Portfolio turnover rate (c) | |
| | | | | | | | | | | | | | | | | | | | | | | | | | | | |
| | | 1.64 | | | $ | 23.64 | | | | 7.45 | % | | $ | 60,871 | | | | 0.79 | % | | | (0.78 | )% | | | 0 | % |
| | | (2.70 | ) | | $ | 22.00 | | | | (10.93 | )% | | $ | 14,300 | | | | 0.79 | % | | | (0.79 | )% | | | 0 | % |
| | | | | | | | | | | | | | | | | | | | | | | | | | | | |
| | | 2.50 | | | $ | 27.80 | | | | 9.88 | % | | $ | 52,818 | | | | 0.79 | % | | | (0.77 | )% | | | 0 | % |
| | | (1.79 | ) | | $ | 25.30 | | | | (6.61 | )% | | $ | 19,606 | | | | 0.79 | % | | | (0.79 | )% | | | 0 | % |
| | | 1.72 | | | $ | 27.09 | | | | 6.77 | % | | $ | 19,639 | | | | 0.79 | % | | | (0.79 | )% | | | 0 | % |
| | | | | | | | | | | | | | | | | | | | | | | | | | | | |
| | | 2.65 | | | $ | 27.93 | | | | 10.48 | % | | $ | 33,521 | | | | 0.79 | % | | | (0.78 | )% | | | 0 | % |
| | | (1.21 | ) | | $ | 25.28 | | | | (4.56 | )% | | $ | 32,237 | | | | 0.79 | % | | | (0.79 | )% | | | 0 | % |
| | | 0.81 | | | $ | 26.49 | | | | 3.16 | % | | $ | 10,597 | | | | 0.79 | % | | | (0.79 | )% | | | 0 | % |
| | | | | | | | | | | | | | | | | | | | | | | | | | | | |
| | | 2.11 | | | $ | 24.93 | | | | 9.23 | % | | $ | 49,862 | | | | 0.79 | % | | | (0.78 | )% | | | 0 | % |
| | | (1.95 | ) | | $ | 22.82 | | | | (7.85 | )% | | $ | 35,948 | | | | 0.79 | % | | | (0.79 | )% | | | 0 | % |
| | | 0.73 | | | $ | 24.77 | | | | 3.03 | % | | $ | 4,334 | | | | 0.79 | % | | | (0.82 | )% | | | 0 | % |
The accompanying notes are an integral part of these financial statements.
Financial Highlights
| | | Per Share Operating Performance (For a share outstanding throughout |
| | | | | | | Investment Operations: | | | Capital Share Transactions: | |
| | | Net Asset Value, Beginning of Period | | | Net investment income/(loss) (b) | | | Net realized and unrealized gain/(loss) | | | Total From Investment Operations | | | Transaction fees (see Note 5) | |
Innovator Growth Accelerated Plus ETF - January | | | | | | | | | | | | | | | | | | | | |
For the period 11/1/2022 - 4/30/2023 | | $ | 17.61 | | | | (0.07 | ) | | | 1.85 | | | | 1.78 | | | | 0.02 | |
For the period 12/31/2021 (d) - 10/31/2022 | | $ | 25.46 | | | | (0.13 | ) | | | (7.74 | ) | | | (7.87 | ) | | | 0.02 | |
Innovator Growth Accelerated Plus ETF - April | | | | | | | | | | | | | | | | | | | | |
For the period 11/1/2022 - 4/30/2023 | | $ | 23.41 | | | | (0.09 | ) | | | 3.92 | | | | 3.83 | | | | 0.02 | |
For the year ended 10/31/2022 | | $ | 29.53 | | | | (0.22 | ) | | | (5.90 | ) | | | (6.12 | ) | | – | (e) |
For the period 3/31/2021 (d) - 10/31/2021 | | $ | 25.53 | | | | (0.13 | ) | | | 4.11 | | | | 3.98 | | | | 0.02 | |
Innovator Growth Accelerated Plus ETF - July | | | | | | | | | | | | | | | | | | | | |
For the period 11/1/2022 - 4/30/2023 | | $ | 19.99 | | | | (0.08 | ) | | | 4.23 | | | | 4.15 | | | – | (e) |
For the year ended 10/31/2022 | | $ | 27.50 | | | | (0.18 | ) | | | (7.35 | ) | | | (7.53 | ) | | | 0.02 | |
For the period 6/30/2021 (d) - 10/31/2021 | | $ | 25.52 | | | | (0.07 | ) | | | 2.05 | | | | 1.98 | | | | – | |
Innovator Growth Accelerated Plus ETF - October | | | | | | | | | | | | | | | | | | | | |
For the period 11/1/2022 - 4/30/2023 | | $ | 18.52 | | | | (0.08 | ) | | | 3.20 | | | | 3.12 | | | | 0.01 | |
For the year ended 10/31/2022 | | $ | 25.70 | | | | (0.18 | ) | | | (7.01 | ) | | | (7.19 | ) | | | 0.01 | |
For the period 9/30/2021 (d) - 10/31/2021 | | $ | 24.32 | | | | (0.02 | ) | | | 1.40 | | | | 1.38 | | | | – | (e) |
(a) | Annualized for periods less than one year. |
(b) | Net investment income/(loss) per share has been calculated based on average shares outstanding during the period. |
(c) | Not annualized for periods less than one year. |
(d) | Commencement of operations. |
(e) | Amount represents less than $0.01 per share. |
The accompanying notes are an integral part of these financial statements.
each period) | | | Ratios/Supplemental Data: | |
| | | | | | | | | | | | | | | | | | Ratio to Average Net Assets of: (a) | | | | | |
| | Change in Net Asset Value for the Period | | | Net Asset Value, End of Period | | | Total return (c) | | | Net assets, end of period (000) | | | Expenses | | | Net investment income/(loss) | | | Portfolio turnover rate (c) | |
| | | | | | | | | | | | | | | | | | | | | | | | | | | | |
| | | 1.80 | | | $ | 19.41 | | | | 10.27 | % | | $ | 33,003 | | | | 0.79 | % | | | (0.78 | )% | | | 0 | % |
| | | (7.85 | ) | | $ | 17.61 | | | | (30.85 | )% | | $ | 4,401 | | | | 0.79 | % | | | (0.79 | )% | | | 0 | % |
| | | | | | | | | | | | | | | | | | | | | | | | | | | | |
| | | 3.85 | | | $ | 27.26 | | | | 16.45 | % | | $ | 9,541 | | | | 0.79 | % | | | (0.76 | )% | | | 0 | % |
| | | (6.12 | ) | | $ | 23.41 | | | | (20.72 | )% | | $ | 7,023 | | | | 0.79 | % | | | (0.79 | )% | | | 0 | % |
| | | 4.00 | | | $ | 29.53 | | | | 15.66 | % | | $ | 18,454 | | | | 0.79 | % | | | (0.79 | )% | | | 0 | % |
| | | | | | | | | | | | | | | | | | | | | | | | | | | | |
| | | 4.15 | | | $ | 24.14 | | | | 20.75 | % | | $ | 7,845 | | | | 0.79 | % | | | (0.78 | )% | | | 0 | % |
| | | (7.51 | ) | | $ | 19.99 | | | | (27.30 | )% | | $ | 17,992 | | | | 0.79 | % | | | (0.79 | )% | | | 0 | % |
| | | 1.98 | | | $ | 27.50 | | | | 7.75 | % | | $ | 8,250 | | | | 0.79 | % | | | (0.79 | )% | | | 0 | % |
| | | | | | | | | | | | | | | | | | | | | | | | | | | | |
| | | 3.13 | | | $ | 21.65 | | | | 16.91 | % | | $ | 12,450 | | | | 0.79 | % | | | (0.78 | )% | | | 0 | % |
| | | (7.18 | ) | | $ | 18.52 | | | | (27.95 | )% | | $ | 6,019 | | | | 0.79 | % | | | (0.79 | )% | | | 0 | % |
| | | 1.38 | | | $ | 25.70 | | | | 5.69 | % | | $ | 2,570 | | | | 0.79 | % | | | (0.82 | )% | | | 0 | % |
The accompanying notes are an integral part of these financial statements.
Financial Highlights
| | | Per Share Operating Performance (For a share outstanding throughout |
| | | | | | | Investment Operations: | | | Capital Share Transactions: | |
| | | Net Asset Value, Beginning of Period | | | Net investment income/(loss) (b) | | | Net realized and unrealized gain/(loss) | | | Total From Investment Operations | | | Transaction fees (see Note 5) | |
Innovator Defined Wealth Shield ETF | | | | | | | | | | | | | | | | | | | | |
For the period 11/1/2022 - 4/30/2023 | | $ | 26.17 | | | | (0.09 | ) | | | 1.31 | | | | 1.22 | | | | 0.01 | |
For the year ended 10/31/2022 | | $ | 25.86 | | | | (0.18 | ) | | | 0.46 | | | | 0.28 | | | | 0.03 | |
For the period 6/30/2021 (d) - 10/31/2021 | | $ | 25.69 | | | | (0.06 | ) | | | 0.20 | (f) | | | 0.14 | | | | 0.03 | |
Innovator U.S. Equity Accelerated ETF - Quarterly | | | | | | | | | | | | | | | | | | | | |
For the period 11/1/2022 - 4/30/2023 | | $ | 22.88 | | | | (0.10 | ) | | | 4.43 | | | | 4.33 | | | | 0.01 | |
For the year ended 10/31/2022 | | $ | 28.25 | | | | (0.20 | ) | | | (5.19 | ) | | | (5.39 | ) | | | 0.02 | |
For the period 3/31/2021 (d) - 10/31/2021 | | $ | 25.37 | | | | (0.13 | ) | | | 3.00 | | | | 2.87 | | | | 0.01 | |
Innovator Growth Accelerated ETF - Quarterly | | | | | | | | | | | | | | | | | | | | |
For the period 11/1/2022 - 4/30/2023 | | $ | 21.26 | | | | (0.08 | ) | | | 1.95 | | | | 1.87 | | | – | (e) |
For the year ended 10/31/2022 | | $ | 29.88 | | | | (0.20 | ) | | | (8.43 | ) | | | (8.63 | ) | | | 0.01 | |
For the period 3/31/2021 (d) - 10/31/2021 | | $ | 25.53 | | | | (0.13 | ) | | | 4.47 | | | | 4.34 | | | | 0.01 | |
(a) | Annualized for periods less than one year. |
(b) | Net investment income/(loss) per share has been calculated based on average shares outstanding during the period. |
(c) | Not annualized for periods less than one year. |
(d) | Commencement of operations. |
(e) | Amount represents less than $0.01 per share. |
(f) | Net realized and unrealized gain/(loss) per share includes balancing amounts necessary to reconcile the change in net asset value per share for the period, and may not reconcile with the aggregate gain/(loss) in the Statement of Operations due to share transactions for the period. |
The accompanying notes are an integral part of these financial statements.
each period) | | | Ratios/Supplemental Data: | |
| | | | | | | | | | | | | | | | | | Ratio to Average Net Assets of: (a) | | | | | |
| | Change in Net Asset Value for the Period | | | Net Asset Value, End of Period | | | Total return (c) | | | Net assets, end of period (000) | | | Expenses | | | Net investment income/(loss) | | | Portfolio turnover rate (c) | |
| | | | | | | | | | | | | | | | | | | | | | | | | | | | |
| | | 1.23 | | | $ | 27.40 | | | | 4.68 | % | | $ | 378,056 | | | | 0.69 | % | | | (0.68 | )% | | | 0 | % |
| | | 0.31 | | | $ | 26.17 | | | | 1.21 | % | | $ | 256,462 | | | | 0.69 | % | | | (0.69 | )% | | | 0 | % |
| | | 0.17 | | | $ | 25.86 | | | | 0.65 | % | | $ | 29,088 | | | | 0.69 | % | | | (0.69 | )% | | | 0 | % |
| | | | | | | | | | | | | | | | | | | | | | | | | | | | |
| | | 4.34 | | | $ | 27.22 | | | | 18.95 | % | | $ | 20,412 | | | | 0.79 | % | | | (0.78 | )% | | | 0 | % |
| | | (5.37 | ) | | $ | 22.88 | | | | (19.02 | )% | | $ | 11,440 | | | | 0.79 | % | | | (0.79 | )% | | | 0 | % |
| | | 2.88 | | | $ | 28.25 | | | | 11.37 | % | | $ | 13,421 | | | | 0.79 | % | | | (0.79 | )% | | | 0 | % |
| | | | | | | | | | | | | | | | | | | | | | | | | | | | |
| | | 1.87 | | | $ | 23.13 | | | | 8.81 | % | | $ | 10,986 | | | | 0.79 | % | | | (0.78 | )% | | | 0 | % |
| | | (8.62 | ) | | $ | 21.26 | | | | (28.85 | )% | | $ | 18,067 | | | | 0.79 | % | | | (0.79 | )% | | | 0 | % |
| | | 4.35 | | | $ | 29.88 | | | | 17.02 | % | | $ | 15,685 | | | | 0.79 | % | | | (0.79 | )% | | | 0 | % |
The accompanying notes are an integral part of these financial statements.
Notes to Financial Statements (Unaudited)
Innovator ETFs Trust (the “Trust”) was organized under Delaware law as a Delaware statutory trust on October 17, 2007, and is registered with the Securities and Exchange Commission (“SEC”) under the Investment Company Act of 1940, as amended (the “1940 Act”) as an open-end management investment company. The Trust currently consists of multiple operational series, of which forty-three are covered in this report, collectively the (“Funds”):
Name | | Ticker | | Commencement of Operations | | Tracking Fund |
Innovator International Developed Power Buffer ETF - January | | IJAN | | December 31, 2019 | | iShares MSCI EAFE ETF |
Innovator International Developed Power Buffer ETF - April | | IAPR | | March 31, 2021 | | iShares MSCI EAFE ETF |
Innovator International Developed Power Buffer ETF - July | | IJUL | | June 28, 2019 | | iShares MSCI EAFE ETF |
Innovator International Developed Power Buffer ETF - October | | IOCT | | September 30, 2021 | | iShares MSCI EAFE ETF |
Innovator Emerging Markets Power Buffer ETF - January | | EJAN | | December 31, 2019 | | iShares MSCI Emerging Markets ETF |
Innovator Emerging Markets Power Buffer ETF - April | | EAPR | | March 31, 2021 | | iShares MSCI Emerging Markets ETF |
Innovator Emerging Markets Power Buffer ETF - July | | EJUL | | June 28, 2019 | | iShares MSCI Emerging Markets ETF |
Innovator Emerging Markets Power Buffer ETF - October | | EOCT | | September 30, 2021 | | iShares MSCI Emerging Markets ETF |
Innovator Growth-100 Power Buffer ETF - January | | NJAN | | December 31, 2019 | | Invesco QQQ Trust |
Innovator Growth-100 Power Buffer ETF - April | | NAPR | | March 31, 2020 | | Invesco QQQ Trust |
Innovator Growth-100 Power Buffer ETF - July | | NJUL | | June 30, 2020 | | Invesco QQQ Trust |
Innovator Growth-100 Power Buffer ETF - October | | NOCT | | September 30, 2019 | | Invesco QQQ Trust |
Innovator U.S. Small Cap Power Buffer ETF - January | | KJAN | | December 31, 2019 | | iShares Russell 2000 ETF |
Innovator U.S. Small Cap Power Buffer ETF - April | | KAPR | | March 31, 2020 | | iShares Russell 2000 ETF |
Innovator U.S. Small Cap Power Buffer ETF - July | | KJUL | | June 30, 2020 | | iShares Russell 2000 ETF |
Innovator U.S. Small Cap Power Buffer ETF - October | | KOCT | | September 30, 2019 | | iShares Russell 2000 ETF |
Innovator Double Stacker ETF - January | | DSJA | | December 31, 2020 | | SPDR S&P 500® ETF Trust and Invesco QQQ Trust |
Innovator Double Stacker ETF - October | | DSOC | | September 30, 2020 | | SPDR S&P 500® ETF Trust and Invesco QQQ Trust |
Innovator Triple Stacker ETF - January | | TSJA | | December 31, 2020 | | SPDR S&P 500® ETF Trust, Invesco QQQ Trust and iShares Russell 2000 ETF |
Innovator Triple Stacker ETF - October | | TSOC | | September 30, 2020 | | SPDR S&P 500® ETF Trust, Invesco QQQ Trust and iShares Russell 2000 ETF |
Innovator Double Stacker 9 Buffer ETF - January | | DBJA | | December 31, 2020 | | SPDR S&P 500® ETF Trust and Invesco QQQ Trust |
Innovator Double Stacker 9 Buffer ETF - October | | DBOC | | September 30, 2020 | | SPDR S&P 500® ETF Trust and Invesco QQQ Trust |
Innovator U.S. Equity Accelerated ETF - January | | XDJA | | December 31, 2021 | | SPDR S&P 500® ETF Trust |
Innovator U.S. Equity Accelerated ETF - April | | XDAP | | March 31, 2021 | | SPDR S&P 500® ETF Trust |
Innovator U.S. Equity Accelerated ETF - July | | XDJL | | June 30, 2021 | | SPDR S&P 500® ETF Trust |
Innovator U.S. Equity Accelerated ETF - October | | XDOC | | September 30, 2021 | | SPDR S&P 500® ETF Trust |
Innovator U.S. Equity Accelerated Plus ETF - January | | XTJA | | December 31, 2021 | | SPDR S&P 500® ETF Trust |
Innovator U.S. Equity Accelerated Plus ETF - April | | XTAP | | March 31, 2021 | | SPDR S&P 500® ETF Trust |
Innovator U.S. Equity Accelerated Plus ETF - July | | XTJL | | June 30, 2021 | | SPDR S&P 500® ETF Trust |
Innovator U.S. Equity Accelerated Plus ETF - October | | XTOC | | September 30, 2021 | | SPDR S&P 500® ETF Trust |
Innovator U.S. Equity Accelerated 9 Buffer ETF - January | | XBJA | | December 31, 2021 | | SPDR S&P 500® ETF Trust |
Innovator U.S. Equity Accelerated 9 Buffer ETF - April | | XBAP | | March 31, 2021 | | SPDR S&P 500® ETF Trust |
Innovator U.S. Equity Accelerated 9 Buffer ETF - July | | XBJL | | June 30, 2021 | | SPDR S&P 500® ETF Trust |
Innovator U.S. Equity Accelerated 9 Buffer ETF - October | | XBOC | | September 30, 2021 | | SPDR S&P 500® ETF Trust |
Innovator Growth Accelerated Plus ETF - January | | QTJA | | December 31, 2021 | | Invesco QQQ Trust |
Innovator Growth Accelerated Plus ETF - April | | QTAP | | March 31, 2021 | | Invesco QQQ Trust |
Innovator Growth Accelerated Plus ETF - July | | QTJL | | June 30, 2021 | | Invesco QQQ Trust |
Innovator Growth Accelerated Plus ETF - October | | QTOC | | September 30, 2021 | | Invesco QQQ Trust |
Innovator 20+ Year Treasury Bond 9 Buffer ETF - July | | TBJL | | August 17, 2020 | | iShares 20+ Year Treasury Bond ETF |
Innovator 20+ Year Treasury Bond 5 Floor ETF - Quarterly | | TFJL | | August 17, 2020 | | iShares 20+ Year Treasury Bond ETF |
Innovator Defined Wealth Shield ETF | | BALT | | June 30, 2021 | | SPDR S&P 500® ETF Trust |
Innovator U.S. Equity Accelerated ETF - Quarterly | | XDSQ | | March 31, 2021 | | SPDR S&P 500® ETF Trust |
Innovator Growth Accelerated ETF - Quarterly | | XDQQ | | March 31, 2021 | | Invesco QQQ Trust |
| | | | | | | |
268
Notes to Financial Statements (Unaudited) (Continued)
The operational series of the Trust covered outside of this report consist of:
Name | | Ticker | | Commencement of Operations | | Tracking Index/Fund |
Innovator IBD® 50 ETF | | FFTY | | April 8, 2015 | | IBD® 50 Index |
Innovator IBD® Breakout Opportunities ETF | | BOUT | | September 12, 2018 | | IBD® Breakout Stocks Index |
Innovator Deepwater Frontier Tech ETF | | LOUP | | July 24, 2018 | | Loup Frontier Tech Index |
Innovator S&P Investment Grade Preferred ETF | | EPRF | | May 23, 2016 | | S&P U.S. High Quality Preferred Stock Index |
Innovator Laddered Allocation Power Buffer ETF (b) | | BUFF | | October 19, 2016 | | Refinitiv Laddered Power Buffer Strategy Index |
Innovator Laddered Allocation Buffer ETF (c) | | BUFB | | February 8, 2022 | | MerQube U.S. Large Cap Equity Buffer Laddered Index |
Innovator Buffer Step-Up Strategy ETF | | BSTP | | March 7, 2022 | | SPDR S&P 500® ETF Trust |
Innovator Power Buffer Step-Up Strategy ETF | | PSTP | | March 7, 2022 | | SPDR S&P 500® ETF Trust |
Innovator Hedged TSLA Strategy ETF | | TSLH | | July 25, 2022 | | Tesla, Inc. |
Innovator Uncapped Accelerated U.S. Equity ETF | | XUSP | | August 10, 2022 | | SPDR S&P 500® ETF Trust |
Innovator Equity Managed Floor ETF �� | | SFLR | | November 8, 2022 | | SPDR S&P 500® ETF Trust |
Innovator Gradient Tactical Rotation Strategy ETF | | IGTR | | November 16, 2022 | | S&P Global Broad Market Index |
Innovator U.S. Equity Buffer ETF – January | | BJAN | | December 31, 2018 | | SPDR S&P 500® ETF Trust |
Innovator U.S. Equity Buffer ETF – February | | BFEB | | January 31, 2020 | | SPDR S&P 500® ETF Trust |
Innovator U.S. Equity Buffer ETF – March | | BMAR | | February 28, 2020 | | SPDR S&P 500® ETF Trust |
Innovator U.S. Equity Buffer ETF – April | | BAPR | | March 29, 2019 | | SPDR S&P 500® ETF Trust |
Innovator U.S. Equity Buffer ETF – May | | BMAY | | April 30, 2020 | | SPDR S&P 500® ETF Trust |
Innovator U.S. Equity Buffer ETF – June | | BJUN | | May 31, 2019 | | SPDR S&P 500® ETF Trust |
Innovator U.S. Equity Buffer ETF – July | | BJUL | | August 28, 2018 | | SPDR S&P 500® ETF Trust |
Innovator U.S. Equity Buffer ETF – August | | BAUG | | July 31, 2019 | | SPDR S&P 500® ETF Trust |
Innovator U.S. Equity Buffer ETF – September | | BSEP | | August 30, 2019 | | SPDR S&P 500® ETF Trust |
Innovator U.S. Equity Buffer ETF – October | | BOCT | | September 28, 2018 | | SPDR S&P 500® ETF Trust |
Innovator U.S. Equity Buffer ETF – November | | BNOV | | October 31, 2019 | | SPDR S&P 500® ETF Trust |
Innovator U.S. Equity Buffer ETF – December | | BDEC | | November 29, 2019 | | SPDR S&P 500® ETF Trust |
Innovator U.S. Equity Power Buffer ETF – January | | PJAN | | December 31, 2018 | | SPDR S&P 500® ETF Trust |
Innovator U.S. Equity Power Buffer ETF – February | | PFEB | | January 31, 2020 | | SPDR S&P 500® ETF Trust |
Innovator U.S. Equity Power Buffer ETF – March | | PMAR | | February 28, 2020 | | SPDR S&P 500® ETF Trust |
Innovator U.S. Equity Power Buffer ETF – April | | PAPR | | March 29, 2019 | | SPDR S&P 500® ETF Trust |
Innovator U.S. Equity Power Buffer ETF – May | | PMAY | | April 30, 2020 | | SPDR S&P 500® ETF Trust |
Innovator U.S. Equity Power Buffer ETF – June | | PJUN | | May 31, 2019 | | SPDR S&P 500® ETF Trust |
Innovator U.S. Equity Power Buffer ETF – July | | PJUL | | August 7, 2018 | | SPDR S&P 500® ETF Trust |
Innovator U.S. Equity Power Buffer ETF – August | | PAUG | | July 31, 2019 | | SPDR S&P 500® ETF Trust |
Innovator U.S. Equity Power Buffer ETF – September | | PSEP | | August 30, 2019 | | SPDR S&P 500® ETF Trust |
Innovator U.S. Equity Power Buffer ETF – October | | POCT | | September 28, 2018 | | SPDR S&P 500® ETF Trust |
Innovator U.S. Equity Power Buffer ETF – November | | PNOV | | October 31, 2019 | | SPDR S&P 500® ETF Trust |
Innovator U.S. Equity Power Buffer ETF – December | | PDEC | | November 29, 2019 | | SPDR S&P 500® ETF Trust |
Innovator U.S. Equity Ultra Buffer ETF – January | | UJAN | | December 31, 2018 | | SPDR S&P 500® ETF Trust |
Innovator U.S. Equity Ultra Buffer ETF – February | | UFEB | | January 31, 2020 | | SPDR S&P 500® ETF Trust |
Innovator U.S. Equity Ultra Buffer ETF – March | | UMAR | | February 28, 2020 | | SPDR S&P 500® ETF Trust |
Innovator U.S. Equity Ultra Buffer ETF – April | | UAPR | | March 29, 2019 | | SPDR S&P 500® ETF Trust |
Innovator U.S. Equity Ultra Buffer ETF – May | | UMAY | | April 30, 2020 | | SPDR S&P 500® ETF Trust |
Innovator U.S. Equity Ultra Buffer ETF – June | | UJUN | | May 31, 2019 | | SPDR S&P 500® ETF Trust |
Innovator U.S. Equity Ultra Buffer ETF – July | | UJUL | | August 7, 2018 | | SPDR S&P 500® ETF Trust |
Innovator U.S. Equity Ultra Buffer ETF – August | | UAUG | | July 31, 2019 | | SPDR S&P 500® ETF Trust |
Innovator U.S. Equity Ultra Buffer ETF – September | | USEP | | August 30, 2019 | | SPDR S&P 500® ETF Trust |
Innovator U.S. Equity Ultra Buffer ETF – October | | UOCT | | September 28, 2018 | | SPDR S&P 500® ETF Trust |
Innovator U.S. Equity Ultra Buffer ETF – November | | UNOV | | October 31, 2019 | | SPDR S&P 500® ETF Trust |
Innovator U.S. Equity Ultra Buffer ETF – December | | UDEC | | November 29, 2019 | | SPDR S&P 500® ETF Trust |
Innovator Premium Income 10 Barrier ETF - April | | APRD | | March 31, 2023 | | S&P 500® Index |
Innovator Premium Income 20 Barrier ETF - April | | APRH | | March 31, 2023 | | S&P 500® Index |
Innovator Premium Income 30 Barrier ETF - April | | APRJ | | March 31, 2023 | | S&P 500® Index |
Innovator Premium Income 40 Barrier ETF - April | | APRQ | | March 31, 2023 | | S&P 500® Index |
269
Notes to Financial Statements (Unaudited) (Continued)
The Funds are exchange traded funds that offer one class of shares, do not charge a sales load, do not have a redemption fee and currently do not charge a 12b-1 fee to their shareholders. The Innovator International Developed and Emerging Markets ETFs list and principally trade their shares on NYSE Arca (“NYSE”). All other Innovator ETFs included in this report each, respectively, list and principally trade their shares on Cboe BZX Exchange, Inc. (“Cboe BZX”).
Each Fund employs a specific “defined outcome strategy.” Defined outcome strategies generally seek to produce pre-determined investment outcomes based upon the performance of an index or one or more underlying securities. The Funds’ pre-determined outcomes (“Outcomes”) are based upon the price performance of a benchmark index or one or more underlying exchange-traded fund (the “Benchmark”) over a period of approximately one year or another predetermined period (“Outcome Period”). The Funds’ investment strategy provides shareholders with participation in any gains experienced by the applicable Benchmark over the course of the Outcome Period, subject to a cap on upside returns (a “Cap”), and, if applicable, a predetermined buffer (a “Buffer”) against Benchmark losses for the Outcome Period. These defined outcomes are managed by purchasing and selling call and put FLexible EXchange Options (“FLEX Options”) to create layers within a Fund’s portfolio. Each Fund’s FLEX Option has the same reference asset and expiration date, with uniquely selected strike prices for the Fund’s Outcome Period. Due to the customizable nature of FLEX Options that allows for specific strike prices to be selected for the same reference asset and expiration date, when each of the FLEX Options expire on the last day of the Outcome Period, the Funds are expected to achieve a Benchmark investment return with the applicable Buffer and Cap investment parameters.
The Funds are investment companies and accordingly follow the investment company accounting and reporting guidance of the Financial Accounting Standards Board (“FASB”) Accounting Standards Codification (“ASC”) Topic 946 “Financial Services — Investment Companies”.
270
Notes to Financial Statements (Unaudited) (Continued)
2. | SIGNIFICANT ACCOUNTING POLICIES |
The following is a summary of significant accounting policies consistently followed by the Trust in the preparation of its financial statements. These policies are in conformity with accounting principles generally accepted in the United States of America (“U.S. GAAP”).
Valuation:
The net asset values (“NAV”) of the Funds are determined as of the close of regular trading on the NYSE (normally 4:00 p.m. ET). If the NYSE closes early on a valuation day, the Funds shall determine NAV as of that time.
Portfolio securities generally shall be valued utilizing prices provided by independent pricing services. The Adviser, as the Trust’s Valuation Designee (“Valuation Designee”) is responsible for establishing valuation of portfolio securities and other instruments held by the Funds in accordance with the Trust’s valuation procedures.
Common stocks, preferred stocks and other equity securities listed on any national or foreign exchange (excluding the NASDAQ National Market (“NASDAQ”) and the London Stock Exchange Alternative Investment Market (“AIM”)) are generally valued at the last sale price on the exchange on which they are principally traded or, for NASDAQ and AIM securities, the official closing price. Securities traded on more than one securities exchange are valued at the last sale price or official closing price, as applicable, at the close of the exchange representing the principal market for such securities. Securities traded in the over-the-counter market are valued at the mean of the bid and the asked price, if available, and otherwise at their closing bid price. Redeemable securities issued by open-end investment companies shall be valued at the investment company’s applicable net asset value, with the exception of exchange-traded open-end investment companies which are priced as equity securities. Fixed income securities, swaps, currency-, credit- and commodity-linked notes, and other similar instruments will be valued using a pricing service. Fixed income securities having a remaining maturity of 60 days or less when purchased will be valued at cost adjusted for amortization of premiums and accretion of discounts, provided the Valuation Designee has determined that the use of amortized cost is an appropriate reflection of fair value given market and issuer specific conditions existing at the time of the determination. Deposit accounts are valued at acquisition cost. Foreign securities and other assets denominated in foreign currencies are translated into U.S. dollars at the exchange rate of such currencies against the U.S. dollar as provided by the pricing service. All assets denominated in foreign currencies will be converted into U.S. dollars at the exchange rates in effect at the time of valuation. Restricted securities (with the exception of Rule 144A Securities for which market quotations are available) will normally be valued at fair value as determined by the Valuation Designee.
Notes to Financial Statements (Unaudited) (Continued)
Exchange-traded option contracts (other than FLEX Option contracts) will be valued at the closing price in the market where such contracts are principally traded. If no closing price is available, they will be fair valued at the mean of their most recent bid and asked price, if available, and otherwise at their closing bid price. OTC options are fair valued at the mean of the most recent bid and asked price, if available, and otherwise at their closing bid price. FLEX Options will be valued at a model-based price provided by the exchange on which the option is traded at the official close of that exchange’s trading date. If the exchange on which the option is traded is unable to provide a model price, FLEX Options prices will be provided by backup provider Super Derivatives. Otherwise, the value of a FLEX Option will be determined by the Valuation Designee in accordance with the Trust’s valuation procedures.
If no quotation can be obtained from a pricing service, then the Valuation Designee will then attempt to obtain one or more broker quotes for the security. If no quotation is available from either a pricing service or one or more brokers or if the Valuation Designee has reason to question the reliability or accuracy of a quotation supplied or the use of amortized cost, the value of any portfolio security held by the Funds for which reliable market quotations are not readily available will be determined by the Valuation Designee in a manner that most appropriately reflects fair market value of the security on the valuation date. The use of a fair valuation method may be appropriate if, for example: (i) market quotations do not accurately reflect fair value of an investment; (ii) an investment’s value has been materially affected by events occurring after the close of the exchange or market on which the investment is principally traded (for example, a foreign exchange or market); (iii) a trading halt closes an exchange or market early; or (iv) other events result in an exchange or market delaying its normal close.
272
Notes to Financial Statements (Unaudited) (Continued)
Fair Valuation Measurement:
FASB established a framework for measuring fair value in accordance with U.S. GAAP. Under ASC Topic 820, “Fair Value Measurement” (“ASC 820”), various inputs are used in determining the value of the Funds’ investments. The inputs or methodology used for valuing securities are not necessarily an indication of the risk associated with investing in those securities. The three Levels of inputs of the fair value hierarchy are defined as follows:
| | • | Level 1 – | Unadjusted quoted prices in active markets for identical assets or liabilities that the Funds have the ability to access. |
| | • | Level 2 – | Observable inputs other than quoted prices included in level 1 that are observable for the asset or liability, either directly or indirectly. These inputs may include quoted prices for the identical instrument on an inactive market, prices for similar instruments, interest rates, prepayment speeds, credit risk, yield curves, default rates and similar data. |
| | • | Level 3 – | Unobservable inputs for the asset or liability, to the extent relevant observable inputs are not available, representing the Funds’ own assumptions about the assumptions a market participant would use in valuing the asset or liability, and would be based on the best information available. |
The availability of observable inputs can vary from security to security and is affected by a wide variety of factors, including, for example, the type of security, whether the security is new and not yet established in the marketplace, the liquidity of markets, and other characteristics particular to the security. To the extent that valuation is based on models or inputs that are less observable or unobservable in the market, the determination of fair value requires more judgement. Accordingly, the degree of judgement exercised in determining fair value is greatest for instruments categorized in Level 3.
The inputs used to measure fair value may fall into different levels of the fair value hierarchy. In such cases, for disclosure purposes, the level in the fair value hierarchy within which the fair value measurement falls in its entirety, is determined based on the lowest level input that is significant to the fair value measurement in its entirety.
273
Notes to Financial Statements (Unaudited) (Continued)
The following table summarizes valuation of the Funds’ investments under the fair value hierarchy levels as of April 30, 2023:
IJAN | | | | | | | | | | | | | | | | |
| | | Level 1 | | | Level 2 | | | Level 3 | | | Total | |
Assets | | | | | | | | | | | | | | | | |
Purchased Options | | $ | – | | | $ | 209,360,578 | | | $ | – | | | $ | 209,360,578 | |
Short Term Investments | | | 400,014 | | | | – | | | | – | | | | 400,014 | |
Total Assets | | $ | 400,014 | | | $ | 209,360,578 | | | $ | – | | | $ | 209,760,592 | |
| | | | | | | | | | | | | | | | | |
Liabilities | | | | | | | | | | | | | | | | |
Options Written | | $ | – | | | $ | 5,411,768 | | | $ | – | | | $ | 5,411,768 | |
Total Liabilities | | $ | – | | | $ | 5,411,768 | | | $ | – | | | $ | 5,411,768 | |
| | | | | | | | | | | | | | | | | |
IAPR | | | | | | | | | | | | | | | | |
| | | Level 1 | | | Level 2 | | | Level 3 | | | Total | |
Assets | | | | | | | | | | | | | | | | |
Purchased Options | | $ | – | | | $ | 232,806,209 | | | $ | – | | | $ | 232,806,209 | |
Short Term Investments | | | 452,950 | | | | – | | | | – | | | | 452,950 | |
Total Assets | | $ | 452,950 | | | $ | 232,806,209 | | | $ | – | | | $ | 233,259,159 | |
| | | | | | | | | | | | | | | | | |
Liabilities | | | | | | | | | | | | | | | | |
Options Written | | $ | – | | | $ | 8,147,032 | | | $ | – | | | $ | 8,147,032 | |
Total Liabilities | | $ | – | | | $ | 8,147,032 | | | $ | – | | | $ | 8,147,032 | |
| | | | | | | | | | | | | | | | | |
IJUL | | | | | | | | | | | | | | | | |
| | | Level 1 | | | Level 2 | | | Level 3 | | | Total | |
Assets | | | | | | | | | | | | | | | | |
Purchased Options | | $ | – | | | $ | 111,250,300 | | | $ | – | | | $ | 111,250,300 | |
Short Term Investments | | | 189,335 | | | | – | | | | – | | | | 189,335 | |
Total Assets | | $ | 189,335 | | | $ | 111,250,300 | | | $ | – | | | $ | 111,439,635 | |
| | | | | | | | | | | | | | | | | |
Liabilities | | | | | | | | | | | | | | | | |
Options Written | | $ | – | | | $ | 1,357,840 | | | $ | – | | | $ | 1,357,840 | |
Total Liabilities | | $ | – | | | $ | 1,357,840 | | | $ | – | | | $ | 1,357,840 | |
| | | | | | | | | | | | | | | | | |
IOCT | | | | | | | | | | | | | | | | |
| | | Level 1 | | | Level 2 | | | Level 3 | | | Total | |
Assets | | | | | | | | | | | | | | | | |
Purchased Options | | $ | – | | | $ | 113,990,001 | | | $ | – | | | $ | 113,990,001 | |
Short Term Investments | | | 202,834 | | | | – | | | | – | | | | 202,834 | |
Total Assets | | $ | 202,834 | | | $ | 113,990,001 | | | $ | – | | | $ | 114,192,835 | |
| | | | | | | | | | | | | | | | | |
Liabilities | | | | | | | | | | | | | | | | |
Options Written | | $ | – | | | $ | 8,882,047 | | | $ | – | | | $ | 8,882,047 | |
Total Liabilities | | $ | – | | | $ | 8,882,047 | | | $ | – | | | $ | 8,882,047 | |
| | | | | | | | | | | | | | | | | |
EJAN | | | | | | | | | | | | | | | | |
| | | Level 1 | | | Level 2 | | | Level 3 | | | Total | |
Assets | | | | | | | | | | | | | | | | |
Purchased Options | | $ | – | | | $ | 118,158,145 | | | $ | – | | | $ | 118,158,145 | |
Short Term Investments | | | 205,718 | | | | – | | | | – | | | | 205,718 | |
Total Assets | | $ | 205,718 | | | $ | 118,158,145 | | | $ | – | | | $ | 118,363,863 | |
| | | | | | | | | | | | | | | | | |
Liabilities | | | | | | | | | | | | | | | | |
Options Written | | $ | – | | | $ | 2,588,410 | | | $ | – | | | $ | 2,588,410 | |
Total Liabilities | | $ | – | | | $ | 2,588,410 | | | $ | – | | | $ | 2,588,410 | |
274
Notes to Financial Statements (Unaudited) (Continued)
EAPR | | | | | | | | | | | | | | | | |
| | | Level 1 | | | Level 2 | | | Level 3 | | | Total | |
Assets | | | | | | | | | | | | | | | | |
Purchased Options | | $ | – | | | $ | 53,386,170 | | | $ | – | | | $ | 53,386,170 | |
Short Term Investments | | | 90,012 | | | | – | | | | – | | | | 90,012 | |
Total Assets | | $ | 90,012 | | | $ | 53,386,170 | | | $ | – | | | $ | 53,476,182 | |
| | | | | | | | | | | | | | | | | |
Liabilities | | | | | | | | | | | | | | | | |
Options Written | | $ | – | | | $ | 2,599,640 | | | $ | – | | | $ | 2,599,640 | |
Total Liabilities | | $ | – | | | $ | 2,599,640 | | | $ | – | | | $ | 2,599,640 | |
| | | | | | | | | | | | | | | | | |
EJUL | | | | | | | | | | | | | | | | |
| | | Level 1 | | | Level 2 | | | Level 3 | | | Total | |
Assets | | | | | | | | | | | | | | | | |
Purchased Options | | $ | – | | | $ | 91,542,605 | | | $ | – | | | $ | 91,542,605 | |
Short Term Investments | | | 164,748 | | | | – | | | | – | | | | 164,748 | |
Total Assets | | $ | 164,748 | | | $ | 91,542,605 | | | $ | – | | | $ | 91,707,353 | |
| | | | | | | | | | | | | | | | | |
Liabilities | | | | | | | | | | | | | | | | |
Options Written | | $ | – | | | $ | 464,656 | | | $ | – | | | $ | 464,656 | |
Total Liabilities | | $ | – | | | $ | 464,656 | | | $ | – | | | $ | 464,656 | |
| | | | | | | | | | | | | | | | | |
EOCT | | | | | | | | | | | | | | | | |
| | | Level 1 | | | Level 2 | | | Level 3 | | | Total | |
Assets | | | | | | | | | | | | | | | | |
Purchased Options | | $ | – | | | $ | 31,079,947 | | | $ | – | | | $ | 31,079,947 | |
Short Term Investments | | | 45,179 | | | | – | | | | – | | | | 45,179 | |
Total Assets | | $ | 45,179 | | | $ | 31,079,947 | | | $ | – | | | $ | 31,125,126 | |
| | | | | | | | | | | | | | | | | |
Liabilities | | | | | | | | | | | | | | | | |
Options Written | | $ | – | | | $ | 433,901 | | | $ | – | | | $ | 433,901 | |
Total Liabilities | | $ | – | | | $ | 433,901 | | | $ | – | | | $ | 433,901 | |
| | | | | | | | | | | | | | | | | |
NJAN | | | | | | | | | | | | | | | | |
| | | Level 1 | | | Level 2 | | | Level 3 | | | Total | |
Assets | | | | | | | | | | | | | | | | |
Purchased Options | | $ | – | | | $ | 104,643,560 | | | $ | – | | | $ | 104,643,560 | |
Short Term Investments | | | 200,063 | | | | – | | | | – | | | | 200,063 | |
Total Assets | | $ | 200,063 | | | $ | 104,643,560 | | | $ | – | | | $ | 104,843,623 | |
| | | | | | | | | | | | | | | | | |
Liabilities | | | | | | | | | | | | | | | | |
Options Written | | $ | – | | | $ | 9,933,700 | | | $ | – | | | $ | 9,933,700 | |
Total Liabilities | | $ | – | | | $ | 9,933,700 | | | $ | – | | | $ | 9,933,700 | |
| | | | | | | | | | | | | | | | | |
NAPR | | | | | | | | | | | | | | | | |
| | | Level 1 | | | Level 2 | | | Level 3 | | | Total | |
Assets | | | | | | | | | | | | | | | | |
Purchased Options | | $ | – | | | $ | 118,036,069 | | | $ | – | | | $ | 118,036,069 | |
Short Term Investments | | | 279,400 | | | | – | | | | – | | | | 279,400 | |
Total Assets | | $ | 279,400 | | | $ | 118,036,069 | | | $ | – | | | $ | 118,315,469 | |
| | | | | | | | | | | | | | | | | |
Liabilities | | | | | | | | | | | | | | | | |
Options Written | | $ | – | | | $ | 6,733,361 | | | $ | – | | | $ | 6,733,361 | |
Total Liabilities | | $ | – | | | $ | 6,733,361 | | | $ | – | | | $ | 6,733,361 | |
275
Notes to Financial Statements (Unaudited) (Continued)
NJUL | | | | | | | | | | | | | | | | |
| | | Level 1 | | | Level 2 | | | Level 3 | | | Total | |
Assets | | | | | | | | | | | | | | | | |
Purchased Options | | $ | – | | | $ | 77,721,533 | | | $ | – | | | $ | 77,721,533 | |
Short Term Investments | | | 184,867 | | | | – | | | | – | | | | 184,867 | |
Total Assets | | $ | 184,867 | | | $ | 77,721,533 | | | $ | – | | | $ | 77,906,400 | |
| | | | | | | | | | | | | | | | | |
Liabilities | | | | | | | | | | | | | | | | |
Options Written | | $ | – | | | $ | 1,289,449 | | | $ | – | | | $ | 1,289,449 | |
Total Liabilities | | $ | – | | | $ | 1,289,449 | | | $ | – | | | $ | 1,289,449 | |
NOCT | | | | | | | | | | | | | | | | |
| | | Level 1 | | | Level 2 | | | Level 3 | | | Total | |
Assets | | | | | | | | | | | | | | | | |
Purchased Options | | $ | – | | | $ | 90,605,596 | | | $ | – | | | $ | 90,605,596 | |
Short Term Investments | | | 203,590 | | | | – | | | | – | | | | 203,590 | |
Total Assets | | $ | 203,590 | | | $ | 90,605,596 | | | $ | – | | | $ | 90,809,186 | |
| | | | | | | | | | | | | | | | | |
Liabilities | | | | | | | | | | | | | | | | |
Options Written | | $ | – | | | $ | 5,232,824 | | | $ | – | | | $ | 5,232,824 | |
Total Liabilities | | $ | – | | | $ | 5,232,824 | | | $ | – | | | $ | 5,232,824 | |
KJAN | | | | | | | | | | | | | | | | |
| | | Level 1 | | | Level 2 | | | Level 3 | | | Total | |
Assets | | | | | | | | | | | | | | | | |
Purchased Options | | $ | – | | | $ | 180,332,790 | | | $ | – | | | $ | 180,332,790 | |
Short Term Investments | | | 464,809 | | | | – | | | | – | | | | 464,809 | |
Total Assets | | $ | 464,809 | | | $ | 180,332,790 | | | $ | – | | | $ | 180,797,599 | |
| | | | | | | | | | | | | | | | | |
Liabilities | | | | | | | | | | | | | | | | |
Options Written | | $ | – | | | $ | 5,191,324 | | | $ | – | | | $ | 5,191,324 | |
Total Liabilities | | $ | – | | | $ | 5,191,324 | | | $ | – | | | $ | 5,191,324 | |
KAPR | | | | | | | | | | | | | | | | |
| | | Level 1 | | | Level 2 | | | Level 3 | | | Total | |
Assets | | | | | | | | | | | | | | | | |
Purchased Options | | $ | – | | | $ | 132,448,951 | | | $ | – | | | $ | 132,448,951 | |
Short Term Investments | | | 330,479 | | | | – | | | | – | | | | 330,479 | |
Total Assets | | $ | 330,479 | | | $ | 132,448,951 | | | $ | – | | | $ | 132,779,430 | |
| | | | | | | | | | | | | | | | | |
Liabilities | | | | | | | | | | | | | | | | |
Options Written | | $ | – | | | $ | 6,192,097 | | | $ | – | | | $ | 6,192,097 | |
Total Liabilities | | $ | – | | | $ | 6,192,097 | | | $ | – | | | $ | 6,192,097 | |
KJUL | | | | | | | | | | | | | | | | |
| | | Level 1 | | | Level 2 | | | Level 3 | | | Total | |
Assets | | | | | | | | | | | | | | | | |
Purchased Options | | $ | – | | | $ | 69,524,255 | | | $ | – | | | $ | 69,524,255 | |
Short Term Investments | | | 177,008 | | | | – | | | | – | | | | 177,008 | |
Total Assets | | $ | 177,008 | | | $ | 69,524,255 | | | $ | – | | | $ | 69,701,263 | |
| | | | | | | | | | | | | | | | | |
Liabilities | | | | | | | | | | | | | | | | |
Options Written | | $ | – | | | $ | 246,289 | | | $ | – | | | $ | 246,289 | |
Total Liabilities | | $ | – | | | $ | 246,289 | | | $ | – | | | $ | 246,289 | |
276
Notes to Financial Statements (Unaudited) (Continued)
KOCT | | | | | | | | | | | | | | | | |
| | | Level 1 | | | Level 2 | | | Level 3 | | | Total | |
Assets | | | | | | | | | | | | | | | | |
Purchased Options | | $ | – | | | $ | 76,897,048 | | | $ | – | | | $ | 76,897,048 | |
Short Term Investments | | | 187,894 | | | | – | | | | – | | | | 187,894 | |
Total Assets | | $ | 187,894 | | | $ | 76,897,048 | | | $ | – | | | $ | 77,084,942 | |
| | | | | | | | | | | | | | | | | |
Liabilities | | | | | | | | | | | | | | | | |
Options Written | | $ | – | | | $ | 1,099,009 | | | $ | – | | | $ | 1,099,009 | |
Total Liabilities | | $ | – | | | $ | 1,099,009 | | | $ | – | | | $ | 1,099,009 | |
| | | | | | | | | | | | | | | | | |
DSJA | | | | | | | | | | | | | | | | |
| | | Level 1 | | | Level 2 | | | Level 3 | | | Total | |
Assets | | | | | | | | | | | | | | | | |
Purchased Options | | $ | – | | | $ | 3,208,556 | | | $ | – | | | $ | 3,208,556 | |
Short Term Investments | | | 18,876 | | | | – | | | | – | | | | 18,876 | |
Total Assets | | $ | 18,876 | | | $ | 3,208,556 | | | $ | – | | | $ | 3,227,432 | |
| | | | | | | | | | | | | | | | | |
Liabilities | | | | | | | | | | | | | | | | |
Options Written | | $ | – | | | $ | 536,824 | | | $ | – | | | $ | 536,824 | |
Total Liabilities | | $ | – | | | $ | 536,824 | | | $ | – | | | $ | 536,824 | |
| | | | | | | | | | | | | | | | | |
DSOC | | | | | | | | | | | | | | | | |
| | | Level 1 | | | Level 2 | | | Level 3 | | | Total | |
Assets | | | | | | | | | | | | | | | | |
Purchased Options | | $ | – | | | $ | 5,346,455 | | | $ | – | | | $ | 5,346,455 | |
Short Term Investments | | | 18,992 | | | | – | | | | – | | | | 18,992 | |
Total Assets | | $ | 18,992 | | | $ | 5,346,455 | | | $ | – | | | $ | 5,365,447 | |
| | | | | | | | | | | | | | | | | |
Liabilities | | | | | | | | | | | | | | | | |
Options Written | | $ | – | | | $ | 814,466 | | | $ | – | | | $ | 814,466 | |
Total Liabilities | | $ | – | | | $ | 814,466 | | | $ | – | | | $ | 814,466 | |
| | | | | | | | | | | | | | | | | |
TSJA | | | | | | | | | | | | | | | | |
| | | Level 1 | | | Level 2 | | | Level 3 | | | Total | |
Assets | | | | | | | | | | | | | | | | |
Purchased Options | | $ | – | | | $ | 6,711,498 | | | $ | – | | | $ | 6,711,498 | |
Short Term Investments | | | 51,455 | | | | – | | | | – | | | | 51,455 | |
Total Assets | | $ | 51,455 | | | $ | 6,711,498 | | | $ | – | | | $ | 6,762,953 | |
| | | | | | | | | | | | | | | | | |
Liabilities | | | | | | | | | | | | | | | | |
Options Written | | $ | – | | | $ | 1,564,610 | | | $ | – | | | $ | 1,564,610 | |
Total Liabilities | | $ | – | | | $ | 1,564,610 | | | $ | – | | | $ | 1,564,610 | |
| | | | | | | | | | | | | | | | | |
TSOC | | | | | | | | | | | | | | | | |
| | | Level 1 | | | Level 2 | | | Level 3 | | | Total | |
Assets | | | | | | | | | | | | | | | | |
Purchased Options | | $ | – | | | $ | 8,487,569 | | | $ | – | | | $ | 8,487,569 | |
Short Term Investments | | | 29,969 | | | | – | | | | – | | | | 29,969 | |
Total Assets | | $ | 29,969 | | | $ | 8,487,569 | | | $ | – | | | $ | 8,517,538 | |
| | | | | | | | | | | | | | | | | |
Liabilities | | | | | | | | | | | | | | | | |
Options Written | | $ | – | | | $ | 1,952,821 | | | $ | – | | | $ | 1,952,821 | |
Total Liabilities | | $ | – | | | $ | 1,952,821 | | | $ | – | | | $ | 1,952,821 | |
| | | | | | | | | | | | | | | | | |
277
Notes to Financial Statements (Unaudited) (Continued)
DBJA | | | | | | | | | | | | | | | | |
| | | Level 1 | | | Level 2 | | | Level 3 | | | Total | |
Assets | | | | | | | | | | | | | | | | |
Purchased Options | | $ | – | | | $ | 8,593,150 | | | $ | – | | | $ | 8,593,150 | |
Short Term Investments | | | 20,342 | | | | – | | | | – | | | | 20,342 | |
Total Assets | | $ | 20,342 | | | $ | 8,593,150 | | | $ | – | | | $ | 8,613,492 | |
| | | | | | | | | | | | | | | | | |
Liabilities | | | | | | | | | | | | | | | | |
Options Written | | $ | – | | | $ | 1,797,230 | | | $ | – | | | $ | 1,797,230 | |
Total Liabilities | | $ | – | | | $ | 1,797,230 | | | $ | – | | | $ | 1,797,230 | |
| | | | | | | | | | | | | | | | | |
DBOC | | | | | | | | | | | | | | | | |
| | | Level 1 | | | Level 2 | | | Level 3 | | | Total | |
Assets | | | | | | | | | | | | | | | | |
Purchased Options | | $ | – | | | $ | 17,656,218 | | | $ | – | | | $ | 17,656,218 | |
Short Term Investments | | | 44,212 | | | | – | | | | – | | | | 44,212 | |
Total Assets | | $ | 44,212 | | | $ | 17,656,218 | | | $ | – | | | $ | 17,700,430 | |
| | | | | | | | | | | | | | | | | |
Liabilities | | | | | | | | | | | | | | | | |
Options Written | | $ | – | | | $ | 3,404,310 | | | $ | – | | | $ | 3,404,310 | |
Total Liabilities | | $ | – | | | $ | 3,404,310 | | | $ | – | | | $ | 3,404,310 | |
TBJL | | | | | | | | | | | | | | | | |
| | | Level 1 | | | Level 2 | | | Level 3 | | | Total | |
Assets | | | | | | | | | | | | | | | | |
Purchased Options | | $ | – | | | $ | 57,567,222 | | | $ | – | | | $ | 57,567,222 | |
Short Term Investments | | | 153,957 | | | | – | | | | – | | | | 153,957 | |
Total Assets | | $ | 153,957 | | | $ | 57,567,222 | | | $ | – | | | $ | 57,721,179 | |
| | | | | | | | | | | | | | | | | |
Liabilities | | | | | | | | | | | | | | | | |
Options Written | | $ | – | | | $ | 1,022,929 | | | $ | – | | | $ | 1,022,929 | |
Total Liabilities | | $ | – | | | $ | 1,022,929 | | | $ | – | | | $ | 1,022,929 | |
TFJL | | | | | | | | | | | | | | | | |
| | | Level 1 | | | Level 2 | | | Level 3 | | | Total | |
Assets | | | | | | | | | | | | | | | | |
Purchased Options | | $ | – | | | $ | 7,935,087 | | | $ | – | | | $ | 7,935,087 | |
Short Term Investments | | | 11,357 | | | | – | | | | – | | | | 11,357 | |
Total Assets | | $ | 11,357 | | | $ | 7,935,087 | | | $ | – | | | $ | 7,946,444 | |
| | | | | | | | | | | | | | | | | |
Liabilities | | | | | | | | | | | | | | | | |
Options Written | | $ | – | | | $ | 31,627 | | | $ | – | | | $ | 31,627 | |
Total Liabilities | | $ | – | | | $ | 31,627 | | | $ | – | | | $ | 31,627 | |
XDJA | | | | | | | | | | | | | | | | |
| | | Level 1 | | | Level 2 | | | Level 3 | | | Total | |
Assets | | | | | | | | | | | | | | | | |
Purchased Options | | $ | – | | | $ | 11,347,521 | | | $ | – | | | $ | 11,347,521 | |
Short Term Investments | | | 41,348 | | | | – | | | | – | | | | 41,348 | |
Total Assets | | $ | 41,348 | | | $ | 11,347,521 | | | $ | – | | | $ | 11,388,869 | |
| | | | | | | | | | | | | | | | | |
Liabilities | | | | | | | | | | | | | | | | |
Options Written | | $ | – | | | $ | 1,009,333 | | | $ | – | | | $ | 1,009,333 | |
Total Liabilities | | $ | – | | | $ | 1,009,333 | | | $ | – | | | $ | 1,009,333 | |
278
Notes to Financial Statements (Unaudited) (Continued)
XDAP | | | | | | | | | | | | | | | | |
| | | Level 1 | | | Level 2 | | | Level 3 | | | Total | |
Assets | | | | | | | | | | | | | | | | |
Purchased Options | | $ | – | | | $ | 4,334,968 | | | $ | – | | | $ | 4,334,968 | |
Short Term Investments | | | 44,980 | | | | – | | | | – | | | | 44,980 | |
Total Assets | | $ | 44,980 | | | $ | 4,334,968 | | | $ | – | | | $ | 4,379,948 | |
| | | | | | | | | | | | | | | | | |
Liabilities | | | | | | | | | | | | | | | | |
Options Written | | $ | – | | | $ | 322,595 | | | $ | – | | | $ | 322,595 | |
Total Liabilities | | $ | – | | | $ | 322,595 | | | $ | – | | | $ | 322,595 | |
XDJL | | | | | | | | | | | | | | | | |
| | | Level 1 | | | Level 2 | | | Level 3 | | | Total | |
Assets | | | | | | | | | | | | | | | | |
Purchased Options | | $ | – | | | $ | 2,677,703 | | | $ | – | | | $ | 2,677,703 | |
Short Term Investments | | | 32,736 | | | | – | | | | – | | | | 32,736 | |
Total Assets | | $ | 32,736 | | | $ | 2,677,703 | | | $ | – | | | $ | 2,710,439 | |
| | | | | | | | | | | | | | | | | |
Liabilities | | | | | | | | | | | | | | | | |
Options Written | | $ | – | | | $ | 70,246 | | | $ | – | | | $ | 70,246 | |
Total Liabilities | | $ | – | | | $ | 70,246 | | | $ | – | | | $ | 70,246 | |
| | | | | | | | | | | | | | | | | |
XDOC | | | | | | | | | | | | | | | | |
| | | Level 1 | | | Level 2 | | | Level 3 | | | Total | |
Assets | | | | | | | | | | | | | | | | |
Purchased Options | | $ | – | | | $ | 45,906,710 | | | $ | – | | | $ | 45,906,710 | |
Short Term Investments | | | 93,797 | | | | – | | | | – | | | | 93,797 | |
Total Assets | | $ | 93,797 | | | $ | 45,906,710 | | | $ | – | | | $ | 46,000,507 | |
| | | | | | | | | | | | | | | | | |
Liabilities | | | | | | | | | | | | | | | | |
Options Written | | $ | – | | | $ | 5,454,636 | | | $ | – | | | $ | 5,454,636 | |
Total Liabilities | | $ | – | | | $ | 5,454,636 | | | $ | – | | | $ | 5,454,636 | |
| | | | | | | | | | | | | | | | | |
XTJA | | | | | | | | | | | | | | | | |
| | | Level 1 | | | Level 2 | | | Level 3 | | | Total | |
Assets | | | | | | | | | | | | | | | | |
Purchased Options | | $ | – | | | $ | 14,007,742 | | | $ | – | | | $ | 14,007,742 | |
Short Term Investments | | | 37,798 | | | | – | | | | – | | | | 37,798 | |
Total Assets | | $ | 37,798 | | | $ | 14,007,742 | | | $ | – | | | $ | 14,045,540 | |
| | | | | | | | | | | | | | | | | |
Liabilities | | | | | | | | | | | | | | | | |
Options Written | | $ | – | | | $ | 2,618,683 | | | $ | – | | | $ | 2,618,683 | |
Total Liabilities | | $ | – | | | $ | 2,618,683 | | | $ | – | | | $ | 2,618,683 | |
| | | | | | | | | | | | | | | | | |
XTAP | | | | | | | | | | | | | | | | |
| | | Level 1 | | | Level 2 | | | Level 3 | | | Total | |
Assets | | | | | | | | | | | | | | | | |
Purchased Options | | $ | – | | | $ | 4,729,350 | | | $ | – | | | $ | 4,729,350 | |
Short Term Investments | | | 11,528 | | | | – | | | | – | | | | 11,528 | |
Total Assets | | $ | 11,528 | | | $ | 4,729,350 | | | $ | – | | | $ | 4,740,878 | |
| | | | | | | | | | | | | | | | | |
Liabilities | | | | | | | | | | | | | | | | |
Options Written | | $ | – | | | $ | 718,968 | | | $ | – | | | $ | 718,968 | |
Total Liabilities | | $ | – | | | $ | 718,968 | | | $ | – | | | $ | 718,968 | |
279
Notes to Financial Statements (Unaudited) (Continued)
XTJL | | | | | | | | | | | | | | | | |
| | | Level 1 | | | Level 2 | | | Level 3 | | | Total | |
Assets | | | | | | | | | | | | | | | | |
Purchased Options | | $ | – | | | $ | 13,314,036 | | | $ | – | | | $ | 13,314,036 | |
Short Term Investments | | | 17,204 | | | | – | | | | – | | | | 17,204 | |
Total Assets | | $ | 17,204 | | | $ | 13,314,036 | | | $ | – | | | $ | 13,331,240 | |
| | | | | | | | | | | | | | | | | |
Liabilities | | | | | | | | | | | | | | | | |
Options Written | | $ | – | | | $ | 1,453,455 | | | $ | – | | | $ | 1,453,455 | |
Total Liabilities | | $ | – | | | $ | 1,453,455 | | | $ | – | | | $ | 1,453,455 | |
XTOC | | | | | | | | | | | | | | | | |
| | | Level 1 | | | Level 2 | | | Level 3 | | | Total | |
Assets | | | | | | | | | | | | | | | | |
Purchased Options | | $ | – | | | $ | 28,119,444 | | | $ | – | | | $ | 28,119,444 | |
Short Term Investments | | | 59,184 | | | | – | | | | – | | | | 59,184 | |
Total Assets | | $ | 59,184 | | | $ | 28,119,444 | | | $ | – | | | $ | 28,178,628 | |
| | | | | | | | | | | | | | | | | |
Liabilities | | | | | | | | | | | | | | | | |
Options Written | | $ | – | | | $ | 6,657,760 | | | $ | – | | | $ | 6,657,760 | |
Total Liabilities | | $ | – | | | $ | 6,657,760 | | | $ | – | | | $ | 6,657,760 | |
| | | | | | | | | | | | | | | | | |
XBJA | | | | | | | | | | | | | | | | |
| | | Level 1 | | | Level 2 | | | Level 3 | | | Total | |
Assets | | | | | | | | | | | | | | | | |
Purchased Options | | $ | – | | | $ | 70,235,925 | | | $ | – | | | $ | 70,235,925 | |
Short Term Investments | | | 165,000 | | | | – | | | | – | | | | 165,000 | |
Total Assets | | $ | 165,000 | | | $ | 70,235,925 | | | $ | – | | | $ | 70,400,925 | |
| | | | | | | | | | | | | | | | | |
Liabilities | | | | | | | | | | | | | | | | |
Options Written | | $ | – | | | $ | 9,491,931 | | | $ | – | | | $ | 9,491,931 | |
Total Liabilities | | $ | – | | | $ | 9,491,931 | | | $ | – | | | $ | 9,491,931 | |
| | | | | | | | | | | | | | | | | |
XBAP | | | | | | | | | | | | | | | | |
| | | Level 1 | | | Level 2 | | | Level 3 | | | Total | |
Assets | | | | | | | | | | | | | | | | |
Purchased Options | | $ | – | | | $ | 60,034,603 | | | $ | – | | | $ | 60,034,603 | |
Short Term Investments | | | 153,945 | | | | – | | | | – | | | | 153,945 | |
Total Assets | | $ | 153,945 | | | $ | 60,034,603 | | | $ | – | | | $ | 60,188,548 | |
| | | | | | | | | | | | | | | | | |
Liabilities | | | | | | | | | | | | | | | | |
Options Written | | $ | – | | | $ | 7,343,666 | | | $ | – | | | $ | 7,343,666 | |
Total Liabilities | | $ | – | | | $ | 7,343,666 | | | $ | – | | | $ | 7,343,666 | |
| | | | | | | | | | | | | | | | | |
XBJL | | | | | | | | | | | | | | | | |
| | | Level 1 | | | Level 2 | | | Level 3 | | | Total | |
Assets | | | | | | | | | | | | | | | | |
Purchased Options | | $ | – | | | $ | 35,893,425 | | | $ | – | | | $ | 35,893,425 | |
Short Term Investments | | | 97,042 | | | | – | | | | – | | | | 97,042 | |
Total Assets | | $ | 97,042 | | | $ | 35,893,425 | | | $ | – | | | $ | 35,990,467 | |
| | | | | | | | | | | | | | | | | |
Liabilities | | | | | | | | | | | | | | | | |
Options Written | | $ | – | | | $ | 2,448,798 | | | $ | – | | | $ | 2,448,798 | |
Total Liabilities | | $ | – | | | $ | 2,448,798 | | | $ | – | | | $ | 2,448,798 | |
280
Notes to Financial Statements (Unaudited) (Continued)
XBOC | | | | | | | | | | | | | | | | |
| | | Level 1 | | | Level 2 | | | Level 3 | | | Total | |
Assets | | | | | | | | | | | | | | | | |
Purchased Options | | $ | – | | | $ | 59,547,706 | | | $ | – | | | $ | 59,547,706 | |
Short Term Investments | | | 131,520 | | | | – | | | | – | | | | 131,520 | |
Total Assets | | $ | 131,520 | | | $ | 59,547,706 | | | $ | – | | | $ | 59,679,226 | |
| | | | | | | | | | | | | | | | | |
Liabilities | | | | | | | | | | | | | | | | |
Options Written | | $ | – | | | $ | 9,786,101 | | | $ | – | | | $ | 9,786,101 | |
Total Liabilities | | $ | – | | | $ | 9,786,101 | | | $ | – | | | $ | 9,786,101 | |
| | | | | | | | | | | | | | | | | |
QTJA | | | | | | | | | | | | | | | | |
| | | Level 1 | | | Level 2 | | | Level 3 | | | Total | |
Assets | | | | | | | | | | | | | | | | |
Purchased Options | | $ | – | | | $ | 49,684,780 | | | $ | – | | | $ | 49,684,780 | |
Short Term Investments | | | 106,688 | | | | – | | | | – | | | | 106,688 | |
Total Assets | | $ | 106,688 | | | $ | 49,684,780 | | | $ | – | | | $ | 49,791,468 | |
| | | | | | | | | | | | | | | | | |
Liabilities | | | | | | | | | | | | | | | | |
Options Written | | $ | – | | | $ | 16,768,057 | | | $ | – | | | $ | 16,768,057 | |
Total Liabilities | | $ | – | | | $ | 16,768,057 | | | $ | – | | | $ | 16,768,057 | |
| | | | | | | | | | | | | | | | | |
QTAP | | | | | | | | | | | | | | | | |
| | | Level 1 | | | Level 2 | | | Level 3 | | | Total | |
Assets | | | | | | | | | | | | | | | | |
Purchased Options | | $ | – | | | $ | 11,504,667 | | | $ | – | | | $ | 11,504,667 | |
Short Term Investments | | | 32,893 | | | | – | | | | – | | | | 32,893 | |
Total Assets | | $ | 32,893 | | | $ | 11,504,667 | | | $ | – | | | $ | 11,537,560 | |
| | | | | | | | | | | | | | | | | |
Liabilities | | | | | | | | | | | | | | | | |
Options Written | | $ | – | | | $ | 1,993,401 | | | $ | – | | | $ | 1,993,401 | |
Total Liabilities | | $ | – | | | $ | 1,993,401 | | | $ | – | | | $ | 1,993,401 | |
| | | | | | | | | | | | | | | | | |
QTJL | | | | | | | | | | | | | | | | |
| | | Level 1 | | | Level 2 | | | Level 3 | | | Total | |
Assets | | | | | | | | | | | | | | | | |
Purchased Options | | $ | – | | | $ | 9,502,303 | | | $ | – | | | $ | 9,502,303 | |
Short Term Investments | | | 43,056 | | | | – | | | | – | | | | 43,056 | |
Total Assets | | $ | 43,056 | | | $ | 9,502,303 | | | $ | – | | | $ | 9,545,359 | |
| | | | | | | | | | | | | | | | | |
Liabilities | | | | | | | | | | | | | | | | |
Options Written | | $ | – | | | $ | 1,694,940 | | | $ | – | | | $ | 1,694,940 | |
Total Liabilities | | $ | – | | | $ | 1,694,940 | | | $ | – | | | $ | 1,694,940 | |
281
Notes to Financial Statements (Unaudited) (Continued)
QTOC | | | | | | | | | | | | | | | | |
| | | Level 1 | | | Level 2 | | | Level 3 | | | Total | |
Assets | | | | | | | | | | | | | | | | |
Purchased Options | | $ | – | | | $ | 17,403,689 | | | $ | – | | | $ | 17,403,689 | |
Short Term Investments | | | 18,513 | | | | – | | | | – | | | | 18,513 | |
Total Assets | | $ | 18,513 | | | $ | 17,403,689 | | | $ | – | | | $ | 17,422,202 | |
| | | | | | | | | | | | | | | | | |
Liabilities | | | | | | | | | | | | | | | | |
Options Written | | $ | – | | | $ | 4,964,488 | | | $ | – | | | $ | 4,964,488 | |
Total Liabilities | | $ | – | | | $ | 4,964,488 | | | $ | – | | | $ | 4,964,488 | |
| | | | | | | | | | | | | | | | | |
BALT | | | | | | | | | | | | | | | | |
| | | Level 1 | | | Level 2 | | | Level 3 | | | Total | |
Assets | | | | | | | | | | | | | | | | |
Purchased Options | | $ | – | | | $ | 386,101,620 | | | $ | – | | | $ | 386,101,620 | |
Short Term Investments | | | 513,208 | | | | – | | | | – | | | | 513,208 | |
Total Assets | | $ | 513,208 | | | $ | 386,101,620 | | | $ | – | | | $ | 386,614,828 | |
| | | | | | | | | | | | | | | | | |
Liabilities | | | | | | | | | | | | | | | | |
Options Written | | $ | – | | | $ | 8,355,269 | | | $ | – | | | $ | 8,355,269 | |
Total Liabilities | | $ | – | | | $ | 8,355,269 | | | $ | – | | | $ | 8,355,269 | |
| | | | | | | | | | | | | | | | | |
XDSQ | | | | | | | | | | | | | | | | |
| | | Level 1 | | | Level 2 | | | Level 3 | | | Total | |
Assets | | | | | | | | | | | | | | | | |
Purchased Options | | $ | – | | | $ | 20,910,338 | | | $ | – | | | $ | 20,910,338 | |
Short Term Investments | | | 37,276 | | | | – | | | | – | | | | 37,276 | |
Total Assets | | $ | 37,276 | | | $ | 20,910,338 | | | $ | – | | | $ | 20,947,614 | |
| | | | | | | | | | | | | | | | | |
Liabilities | | | | | | | | | | | | | | | | |
Options Written | | $ | – | | | $ | 524,294 | | | $ | – | | | $ | 524,294 | |
Total Liabilities | | $ | – | | | $ | 524,294 | | | $ | – | | | $ | 524,294 | |
| | | | | | | | | | | | | | | | | |
XDQQ | | | | | | | | | | | | | | | | |
| | | Level 1 | | | Level 2 | | | Level 3 | | | Total | |
Assets | | | | | | | | | | | | | | | | |
Purchased Options | | $ | – | | | $ | 11,258,816 | | | $ | – | | | $ | 11,258,816 | |
Short Term Investments | | | 37,761 | | | | – | | | | – | | | | 37,761 | |
Total Assets | | $ | 37,761 | | | $ | 11,258,816 | | | $ | – | | | $ | 11,296,577 | |
| | | | | | | | | | | | | | | | | |
Liabilities | | | | | | | | | | | | | | | | |
Options Written | | $ | – | | | $ | 303,934 | | | $ | – | | | $ | 303,934 | |
Total Liabilities | | $ | – | | | $ | 303,934 | | | $ | – | | | $ | 303,934 | |
282
Notes to Financial Statements (Unaudited) (Continued)
There were no Level 3 investments for the Funds during the period ended April 30, 2023.
Option Contracts:
In general, an option contract is an agreement between a buyer and seller that gives the purchaser of the option the right to buy or sell a particular asset at a specified future date at an agreed upon price (commonly known as the “strike price”).
The Funds invest primarily in FLEX Option contracts. FLEX Options are customized option contracts that trade on an exchange but provide investors with the ability to customize key contract terms like strike price, style and expiration date while achieving price discovery in competitive, transparent auctions markets and avoiding the counterparty exposure of over-the-counter options positions. Like traditional exchange-traded options, FLEX Options are guaranteed for settlement by the OCC, a market clearinghouse that guarantees performance by counterparties to certain derivatives contracts. The FLEX Options in which the Funds will invest are all European style options (options that are exercisable only on the expiration date). The FLEX Options are listed on the Chicago Board Options Exchange.
The Funds will purchase and sell call and put FLEX Options. In general, put options give the holder (i.e., the buyer) the right to sell an asset (or deliver the cash value of the index, in case of an index put option) and the seller (i.e., the writer) of the put has the obligation to buy the asset (or receive cash value of the index, in case of an index put option) at a certain defined price. Call options give the holder (i.e., the buyer) the right to buy an asset (or receive cash value of the index, in case of an index call option) and the seller (i.e., the writer) the obligation to sell the asset (or deliver cash value of the index, in case of an index call option) at a certain defined price.
283
Notes to Financial Statements (Unaudited) (Continued)
When the Funds purchase an option, an amount equal to the premium paid by the Funds are recorded as an investment and is subsequently adjusted to the current value of the option purchased. If an option expires on the stipulated expiration date or if the Funds enter into a closing sale transaction, a gain or loss is realized. If a call option is exercised, the cost of the security acquired is increased by the premium paid for the call. If a put option is exercised, a gain or loss is realized from the sale of the underlying security, and the proceeds from such sale are decreased by the premium originally paid. Purchased options are non-income producing securities.
When the Funds write an option, an amount equal to the premium received by the Funds are recorded as a liability and is subsequently adjusted to the current value of the option written. Premiums received from writing options that expire unexercised are treated by the Funds on the expiration date as realized gain from written options. The difference between the premium and the amount paid on effecting a closing purchase transaction, including brokerage commissions, is also treated as a realized gain, or if the premium is less than the amount paid for the closing purchase transaction, as a realized loss. If a call option is exercised, the premium is added to the proceeds from the sale of the underlying security in determining whether the Funds have realized a gain or loss. If a put option is exercised, the premium reduces the cost basis of the securities purchased by the Funds. The Funds, as writers of an option, bear the market risk of an unfavorable change in the price of the security underlying the written option.
All of the FLEX Option contracts held by the Funds are fully funded and cash settled, therefore balance sheet offsetting under U.S. GAAP does not apply.
The Funds bear the risk that the OCC will be unable or unwilling to perform its obligations under the FLEX Options contracts. In the unlikely event that the OCC becomes insolvent or is otherwise unable to meet its settlement obligations, the Funds could suffer significant losses. Additionally, FLEX Options may be less liquid than certain other securities such as standardized options. In less liquid market for the FLEX Options, the Funds may have difficulty closing out certain FLEX Options positions at desired times and prices. The Funds may experience substantial downside from specific FLEX Option positions and certain FLEX Option positions may expire worthless. The value of the underlying FLEX Options will be affected by, among others, changes in the value of the exchange, changes in interest rates, changes in the actual and implied volatility of the Index and the remaining time to until the FLEX Options expire. The value of the FLEX Options does not increase or decrease at the same rate as the level of the Index (although they generally move in the same direction). However, as a FLEX Option approaches its expiration date, its value typically increasingly moves with the value of the Index.
284
Notes to Financial Statements (Unaudited) (Continued)
The value of derivative instruments on the Statements of Assets and Liabilities for the Funds as of April 30, 2023 are as follows:
| | | Equity Risk - Call and Put Options not Accounted for as Hedging Instruments | |
| | | Asset Derivatives | | | Liability Derivatives | |
| | | Investments, at value | | | Options written, at value | |
IJAN | | $ | 209,360,578 | | | $ | 5,411,768 | |
IAPR | | | 232,806,209 | | | | 8,147,032 | |
IJUL | | | 111,250,300 | | | | 1,357,840 | |
IOCT | | | 113,990,001 | | | | 8,882,047 | |
EJAN | | | 118,158,145 | | | | 2,588,410 | |
EAPR | | | 53,386,170 | | | | 2,599,640 | |
EJUL | | | 91,542,605 | | | | 464,656 | |
EOCT | | | 31,079,947 | | | | 433,901 | |
NJAN | | | 104,643,560 | | | | 9,933,700 | |
NAPR | | | 118,036,069 | | | | 6,733,361 | |
NJUL | | | 77,721,533 | | | | 1,289,449 | |
NOCT | | | 90,605,596 | | | | 5,232,824 | |
KJAN | | | 180,332,790 | | | | 5,191,324 | |
KAPR | | | 132,448,951 | | | | 6,192,097 | |
KJUL | | | 69,524,255 | | | | 246,289 | |
KOCT | | | 76,897,048 | | | | 1,099,009 | |
DSJA | | | 3,208,556 | | | | 536,824 | |
DSOC | | | 5,346,455 | | | | 814,466 | |
TSJA | | | 6,711,498 | | | | 1,564,610 | |
TSOC | | | 8,487,569 | | | | 1,952,821 | |
DBJA | | | 8,593,150 | | | | 1,797,230 | |
DBOC | | | 17,656,218 | | | | 3,404,310 | |
TBJL | | | 57,567,222 | | | | 1,022,929 | |
TFJL | | | 7,935,087 | | | | 31,627 | |
XDJA | | | 11,347,521 | | | | 1,009,333 | |
XDAP | | | 4,334,968 | | | | 322,595 | |
XDJL | | | 2,677,703 | | | | 70,246 | |
XDOC | | | 45,906,710 | | | | 5,454,636 | |
XTJA | | | 14,007,742 | | | | 2,618,683 | |
XTAP | | | 4,729,350 | | | | 718,968 | |
XTJL | | | 13,314,036 | | | | 1,453,455 | |
XTOC | | | 28,119,444 | | | | 6,657,760 | |
XBJA | | | 70,235,925 | | | | 9,491,931 | |
XBAP | | | 60,034,603 | | | | 7,343,666 | |
XBJL | | | 35,893,425 | | | | 2,448,798 | |
XBOC | | | 59,547,706 | | | | 9,786,101 | |
QTJA | | | 49,684,780 | | | | 16,768,057 | |
QTAP | | | 11,504,667 | | | | 1,993,401 | |
QTJL | | | 9,502,303 | | | | 1,694,940 | |
QTOC | | | 17,403,689 | | | | 4,964,488 | |
BALT | | | 386,101,620 | | | | 8,355,269 | |
XDSQ | | | 20,910,338 | | | | 524,294 | |
XDQQ | | | 11,258,816 | | | | 303,934 | |
Notes to Financial Statements (Unaudited) (Continued)
The effect of derivative instruments on the Statements of Operations for the period ended April 30, 2023:
| | | Equity Risk - Call and Put Options not Accounted for as Hedging Instruments | |
| | | Amount of Realized Gain/(Loss) on Derivatives Recognized in Income | |
| | | Investments | | | Investments in-kind | | | Options written | | | Options written in-kind | |
IJAN | | $ | (7,308,102 | ) | | $ | 3,666,110 | | | $ | 1,268,767 | | | $ | 1,472,356 | |
IAPR | | | (3,182,280 | ) | | | 3,000,821 | | | | 190,430 | | | | 2,554,451 | |
IJUL | | | 2,945,241 | | | | 6,338,581 | | | | 627,247 | | | | 1,396,142 | |
IOCT | | | (26,528 | ) | | | 1,971,228 | | | | (306,362 | ) | | | 151,894 | |
EJAN | | | (9,799,972 | ) | | | 4,866,883 | | | | (1,453,287 | ) | | | 909,201 | |
EAPR | | | (3,306,328 | ) | | | 806,691 | | | | 986,887 | | | | 1,258,597 | |
EJUL | | | (381,531 | ) | | | 1,272,353 | | | | 9,558 | | | | 639,367 | |
EOCT | | | (164,060 | ) | | | 298,874 | | | | (20,554 | ) | | | 104,717 | |
NJAN | | | (17,903,067 | ) | | | 11,204,272 | | | | (10,941,588 | ) | | | 2,044,095 | |
NAPR | | | (5,014,327 | ) | | | 1,884,434 | | | | 2,643,158 | | | | 2,638,387 | |
NJUL | | | (2,642,387 | ) | | | 1,266,781 | | | | 1,734,656 | | | | 2,146,250 | |
NOCT | | | 34,329 | | | | 794,641 | | | | 126,593 | | | | 402,153 | |
KJAN | | | (11,223,553 | ) | | | 5,712,983 | | | | (343,566 | ) | | | 1,801,239 | |
KAPR | | | (7,066,910 | ) | | | 92,917 | | | | 3,616,040 | | | | 2,864,246 | |
KJUL | | | (661,579 | ) | | | 774,746 | | | | 86,665 | | | | 625,224 | |
KOCT | | | (596,959 | ) | | | 114,596 | | | | 52,503 | | | | 104,836 | |
DSJA | | | (990,401 | ) | | | – | | | | 311,771 | | | | – | |
DSOC | | | – | | | | – | | | | – | | | | – | |
TSJA | | | (2,380,531 | ) | | | (235,116 | ) | | | 1,034,354 | | | | 126,077 | |
TSOC | | | 33,782 | | | | – | | | | (24,409 | ) | | | – | |
DBJA | | | (908,574 | ) | | | 100,498 | | | | 357,217 | | | | 94,020 | |
DBOC | | | 25,555 | | | | 105,566 | | | | (30,367 | ) | | | 5,017 | |
TBJL | | | (18,095 | ) | | | – | | | | (1,341 | ) | | | – | |
TFJL | | | (346,774 | ) | | | 533,899 | | | | 143,103 | | | | 147,848 | |
XDJA | | | (812,673 | ) | | | (69,626 | ) | | | 37,812 | | | | 115,083 | |
XDAP | | | (632,992 | ) | | | (166,785 | ) | | | 112,625 | | | | 221,255 | |
XDJL | | | (10,501 | ) | | | 45,576 | | | | (605 | ) | | | 4,969 | |
XDOC | | | (1,379 | ) | | | 139,271 | | | | (7,907 | ) | | | (31,325 | ) |
XTJA | | | (1,692,812 | ) | | | 82,855 | | | | 393,975 | | | | (22,276 | ) |
XTAP | | | (751,765 | ) | | | (438,819 | ) | | | 476,178 | | | | 230,989 | |
XTJL | | | (11,076 | ) | | | 183,479 | | | | 8,787 | | | | 229,720 | |
XTOC | | | (11,310 | ) | | | 298,417 | | | | (11,523 | ) | | | 97,432 | |
XBJA | | | (2,744,763 | ) | | | 937,588 | | | | (600,877 | ) | | | 605,556 | |
XBAP | | | (3,114,220 | ) | | | (320,806 | ) | | | 1,062,111 | | | | 1,592,722 | |
XBJL | | | (49,868 | ) | | | 87,817 | | | | 6,592 | | | | 850,831 | |
XBOC | | | (8,229 | ) | | | 245,577 | | | | (9,372 | ) | | | 173,843 | |
QTJA | | | (2,794,162 | ) | | | – | | | | 354,086 | | | | – | |
QTAP | | | (2,977,730 | ) | | | (673,712 | ) | | | 1,611,323 | | | | 320,052 | |
QTJL | | | (665,223 | ) | | | (494,909 | ) | | | 64,440 | | | | 1,925,141 | |
QTOC | | | 3,558 | | | | 100,816 | | | | (5,022 | ) | | | 4,125 | |
BALT | | | 7,294,729 | | | | 8,111,661 | | | | (2,766,275 | ) | | | 4,172,422 | |
XDSQ | | | 2,092,057 | | | | 167,612 | | | | 468,861 | | | | (37,112 | ) |
XDQQ | | | 2,013,357 | | | | 560,695 | | | | (1,043,037 | ) | | | (218,985 | ) |
286
Notes to Financial Statements (Unaudited) (Continued)
| | | Equity Risk - Call and Put Options not Accounted for as Hedging Instruments | |
| | | Change in Unrealized Appreciation/(Depreciation) on Derivatives Recognized in Income | |
| | | Investments | | | Options written | |
IJAN | | $ | 13,099,661 | | | $ | 6,304,452 | |
IAPR | | | 2,866,940 | | | | 582,350 | |
IJUL | | | 17,473,334 | | | | 2,470,674 | |
IOCT | | | 18,037,820 | | | | (4,085,659 | ) |
EJAN | | | 4,305,261 | | | | 8,212,461 | |
EAPR | | | 2,666,386 | | | | 1,611,623 | |
EJUL | | | (158,610 | ) | | | 4,122,635 | |
EOCT | | | 2,281,367 | | | | 1,316,841 | |
NJAN | | | 20,591,611 | | | | 2,974,419 | |
NAPR | | | 3,844,617 | | | | 948,711 | |
NJUL | | | 9,267,360 | | | | 1,369,318 | |
NOCT | | | 8,314,060 | | | | 1,693,056 | |
KJAN | | | (186,104 | ) | | | 3,991,281 | |
KAPR | | | 4,772,434 | | | | (1,438,400 | ) |
KJUL | | | (5,352,709 | ) | | | 4,847,326 | |
KOCT | | | (3,874,431 | ) | | | 6,484,569 | |
DSJA | | | 1,544,529 | | | | (561,614 | ) |
DSOC | | | 678,896 | | | | (135,429 | ) |
TSJA | | | 3,612,354 | | | | (1,679,857 | ) |
TSOC | | | 408,456 | | | | 205,791 | |
DBJA | | | 2,041,252 | | | | (1,088,297 | ) |
DBOC | | | 1,556,636 | | | | (247,964 | ) |
TBJL | | | 304,702 | | | | 4,083,582 | |
TFJL | | | 513,720 | | | | (179,353 | ) |
XDJA | | | 1,862,769 | | | | (323,032 | ) |
XDAP | | | 1,071,177 | | | | (338,624 | ) |
XDJL | | | 195,621 | | | | 115,129 | |
XDOC | | | 3,927,528 | | | | 477,949 | |
XTJA | | | 3,092,816 | | | | (921,523 | ) |
XTAP | | | 1,407,687 | | | | (708,523 | ) |
XTJL | | | 1,012,403 | | | | 318,559 | |
XTOC | | | 1,919,534 | | | | (149,804 | ) |
XBJA | | | 5,281,191 | | | | (109,652 | ) |
XBAP | | | 4,121,340 | | | | (1,141,900 | ) |
XBJL | | | 1,040,500 | | | | 1,574,301 | |
XBOC | | | 3,139,475 | | | | 784,668 | |
QTJA | | | 11,999,209 | | | | (7,073,526 | ) |
QTAP | | | 4,263,364 | | | | (1,973,494 | ) |
QTJL | | | 3,121,671 | | | | (1,855,064 | ) |
QTOC | | | 3,367,904 | | | | (1,796,127 | ) |
BALT | | | (10,156,017 | ) | | | 8,998,502 | |
XDSQ | | | (1,001,592 | ) | | | 837,470 | |
XDQQ | | | (902,082 | ) | | | 389,747 | |
287
Notes to Financial Statements (Unaudited) (Continued)
The average volume of derivative activity during the period ended April 30, 2023, is as follows:
| | | Purchased Options | | | Options Written | |
| | | Average Monthly Market Value | | | Average Monthly Market Value | |
IJAN | | $ | 146,932,020 | | | $ | (4,670,125 | ) |
IAPR | | | 101,245,613 | | | | (2,580,112 | ) |
IJUL | | | 164,553,011 | | | | (4,264,934 | ) |
IOCT | | | 117,257,424 | | | | (8,622,406 | ) |
EJAN | | | 88,483,655 | | | | (3,277,144 | ) |
EAPR | | | 39,389,499 | | | | (1,672,207 | ) |
EJUL | | | 82,914,265 | | | | (1,371,733 | ) |
EOCT | | | 34,164,445 | | | | (1,469,660 | ) |
NJAN | | | 96,807,583 | | | | (8,648,382 | ) |
NAPR | | | 65,066,169 | | | | (4,301,703 | ) |
NJUL | | | 105,050,206 | | | | (3,294,144 | ) |
NOCT | | | 97,570,666 | | | | (5,678,348 | ) |
KJAN | | | 140,848,804 | | | | (6,236,471 | ) |
KAPR | | | 92,827,019 | | | | (3,047,730 | ) |
KJUL | | | 78,634,499 | | | | (2,294,098 | ) |
KOCT | | | 88,915,670 | | | | (4,023,696 | ) |
DSJA | | | 3,007,867 | | | | (353,458 | ) |
DSOC | | | 4,975,325 | | | | (679,863 | ) |
TSJA | | | 6,491,011 | | | | (1,271,146 | ) |
TSOC | | | 8,116,218 | | | | (1,945,569 | ) |
DBJA | | | 8,812,761 | | | | (1,476,247 | ) |
DBOC | | | 17,374,277 | | | | (3,091,019 | ) |
TBJL | | | 52,820,617 | | | | (2,243,902 | ) |
TFJL | | | 7,424,742 | | | | (52,971 | ) |
XDJA | | | 8,472,349 | | | | (675,602 | ) |
XDAP | | | 3,561,826 | | | | (99,530 | ) |
XDJL | | | 2,575,390 | | | | (118,852 | ) |
XDOC | | | 43,878,688 | | | | (5,395,421 | ) |
XTJA | | | 11,004,560 | | | | (1,823,816 | ) |
XTAP | | | 3,430,839 | | | | (201,094 | ) |
XTJL | | | 14,536,907 | | | | (1,820,081 | ) |
XTOC | | | 26,251,083 | | | | (6,132,809 | ) |
XBJA | | | 47,226,429 | | | | (6,212,481 | ) |
XBAP | | | 25,362,413 | | | | (2,257,817 | ) |
XBJL | | | 37,501,445 | | | | (3,362,137 | ) |
XBOC | | | 57,255,189 | | | | (9,662,950 | ) |
QTJA | | | 26,307,359 | | | | (7,936,362 | ) |
QTAP | | | 5,737,787 | | | | (488,544 | ) |
QTJL | | | 12,872,104 | | | | (1,840,975 | ) |
QTOC | | | 13,424,112 | | | | (3,299,353 | ) |
BALT | | | 336,779,800 | | | | (14,454,513 | ) |
XDSQ | | | 15,596,007 | | | | (831,877 | ) |
XDQQ | | | 14,824,484 | | | | (1,088,220 | ) |
288
Notes to Financial Statements (Unaudited) (Continued)
Use of Estimates:
In preparing financial statements in conformity with U.S. GAAP, management is required to make estimates and assumptions that affect the reported amounts of assets and liabilities and disclosure of contingent assets and liabilities as of the date of the financial statements and the reported amounts of increases and decreases in net assets from operations during the reporting period. Actual results could differ from these estimates.
Guarantees and Indemnifications:
In the normal course of business, the Trust may enter into a contract with service providers that contain general indemnification clauses. The Trust’s maximum exposure under these arrangements is unknown as this would involve future claims against the Trust that have not yet occurred. Based on experience, the Trust expects the risk of loss to be remote.
Tax Information:
The Funds are treated as separate entities for federal income tax purposes. The Funds intend to qualify as regulated investment companies (“RICs”) under Subchapter M of the Internal Revenue Code of 1986, as amended (the “Internal Revenue Code”). To qualify and remain eligible for the special tax treatment accorded to RICs, the Funds must meet certain annual income and quarterly asset diversification requirements and must distribute annually at least 90% of the sum of (i) its investment company taxable income (which includes dividends, interest and net short-term capital gains) and (ii) certain net tax-exempt income, if any. If so qualified, the Funds will not be subject to federal income tax to the extent the Funds distribute substantially all of their net investment income and capital gains to shareholders.
Management evaluates the Funds’ tax positions to determine if the tax positions taken meet the minimum recognition threshold in connection with accounting for uncertainties in income tax positions taken or expected to be taken for the purposes of measuring and recognizing tax liabilities in the financial statements. Tax benefits associated with an uncertain tax position can be recognized only when the position is “more likely than not” to be sustained assuming examination by taxing authorities. Interest and penalties related to income taxes would be recorded as tax expense in the Statements of Operations. During the period ended April 30, 2023, the Funds did not incur any interest or penalties. The Funds’ federal income tax returns are subject to examination by the Internal Revenue Service (IRS) for a period of three fiscal years after they are filed. State and local tax returns may be subject to examination for an additional fiscal year depending on the jurisdiction. As of April 30, 2023, the Funds did not have a liability for any unrecognized tax benefits. As of April 30, 2023, the Funds have no examinations in progress and management is not aware of any tax positions for which it is reasonably possible that the amounts of unrecognized tax benefits will significantly change in the next twelve months. The Funds are subject to examination by U.S. Federal tax authorities for all tax years since inception.
Notes to Financial Statements (Unaudited) (Continued)
U.S. GAAP requires that certain components of net assets be reclassified between distributable earnings/(accumulated deficit) and additional paid-in capital. These reclassifications have no effect on net assets or net asset value per share. For the year or period ended October 31, 2022, the Funds made the following permanent book-to-tax reclassifications due to deemed distributions, net operating losses, and redemption in-kind transactions:
| | | Distributable Earnings/ (Accumulated Deficit) | | | Paid-In Capital | |
IJAN | | $ | (6,859,436 | ) | | $ | 6,859,436 | |
IAPR | | | (1,582,655 | ) | | | 1,582,655 | |
IJUL | | | (10,925,880 | ) | | | 10,925,880 | |
IOCT | | | (174,292 | ) | | | 174,292 | |
EJAN | | | 1,540,336 | | | | (1,540,336 | ) |
EAPR | | | (3,220,258 | ) | | | 3,220,258 | |
EJUL | | | (6,595,221 | ) | | | 6,595,221 | |
EOCT | | | (96,774 | ) | | | 96,774 | |
NJAN | | | (22,629,861 | ) | | | 22,629,861 | |
NAPR | | | (5,099,640 | ) | | | 5,099,640 | |
NJUL | | | (9,069,301 | ) | | | 9,069,301 | |
NOCT | | | (767,941 | ) | | | 767,941 | |
KJAN | | | (18,503,230 | ) | | | 18,503,230 | |
KAPR | | | (7,804,265 | ) | | | 7,804,265 | |
KJUL | | | (11,852,758 | ) | | | 11,852,758 | |
KOCT | | | (354,251 | ) | | | 354,251 | |
DSJA | | | (1,689,424 | ) | | | 1,689,424 | |
DSOC | | | 59,974 | | | | (59,974 | ) |
TSJA | | | (13,052,901 | ) | | | 13,052,901 | |
TSOC | | | (161,467 | ) | | | 161,467 | |
DBJA | | | (4,628,219 | ) | | | 4,628,219 | |
DBOC | | | 104,027 | | | | (104,027 | ) |
TBJL | | | (745,914 | ) | | | 745,914 | |
TFJL | | | 76,042 | | | | (76,042 | ) |
XDJA | | | - | | | | - | |
XDAP | | | (767,169 | ) | | | 767,169 | |
XDJL | | | (608,206 | ) | | | 608,206 | |
XDOC | | | 6,444 | | | | (6,444 | ) |
XTJA | | | 5,447 | | | | (5,447 | ) |
XTAP | | | (2,446,354 | ) | | | 2,446,354 | |
XTJL | | | (2,319,729 | ) | | | 2,319,729 | |
XTOC | | | (58,560 | ) | | | 58,560 | |
XBJA | | | (803,359 | ) | | | 803,359 | |
XBAP | | | (2,338,191 | ) | | | 2,338,191 | |
XBJL | | | (4,036,977 | ) | | | 4,036,977 | |
XBOC | | | (1,710,721 | ) | | | 1,710,721 | |
QTJA | | | 56,791 | | | | (56,791 | ) |
QTAP | | | (4,491,711 | ) | | | 4,491,711 | |
QTJL | | | (2,751,220 | ) | | | 2,751,220 | |
QTOC | | | (32,136 | ) | | | 32,136 | |
BALT | | | (24,450,011 | ) | | | 24,450,011 | |
XDSQ | | | (2,088,648 | ) | | | 2,088,648 | |
XDQQ | | | (2,038,586 | ) | | | 2,038,586 | |
Notes to Financial Statements (Unaudited) (Continued)
Distributions to Shareholders:
Distributions to shareholders are recorded on the ex-dividend date. The Funds intend to pay out dividends from their net investment income, if any, annually. Distributions of net realized capital gains, if any, will be declared and paid at least annually by the Funds. The Funds may periodically make reclassifications among certain of its capital accounts as a result of the recognition and characterization of certain income and capital gain distributions determined annually in accordance with federal tax regulations which may differ from U.S. GAAP. Distributions that exceed earnings and profits for tax purposes are reported as return of capital.
Investment Transactions and Investment Income:
Investment transactions are recorded on the trade date. The Trust determines the gain or loss realized from investment transactions on the basis of identified cost. Dividend income, if any, is recognized on the ex-dividend date. Interest income, including accretion of discounts and amortization of premiums is recognized on an accrual basis using the effective yield method.
3. | INVESTMENT ADVISOR AND OTHER AFFILIATES |
Innovator Capital Management, LLC (the “Adviser”) acts as investment adviser to the Funds pursuant to an investment advisory agreement between the Trust and the Adviser with respect to the Funds (“Advisory Agreement”) and, pursuant to the Advisory Agreement, is responsible for the day-to-day management of the Funds.
Pursuant to the Advisory Agreement, IJAN, IAPR, IJUL, and IOCT each pay monthly the Adviser a unitary fee calculated daily based on the average daily net assets of the Fund at the annual rate of 0.85%, EJAN, EAPR, EJUL and EOCT each pay monthly the Adviser a unitary fee calculated daily based on the average daily net assets of the Fund at the annual rate of 0.89%, BALT pays monthly the Adviser a unitary fee calculated daily based on the average daily net assets of the Fund at the annual rate of 0.69%. All other Innovator ETFs included in this report each, respectively, pay monthly the Adviser a unitary fee calculated daily based on the average daily net assets of each Fund at the annual rate of 0.79%. During the term of the Advisory Agreement, the Adviser pays all expenses of the Funds, including the cost of transfer agency, custody, fund administration, legal, audit, and other services and license fees, except for the fees paid under the Advisory Agreement, interest, taxes, brokerage commissions and other expenses connected with the execution of portfolio transactions, distribution and service fees payable pursuant to a Rule 12b-1 plan, if any, and extraordinary expenses.
291
Notes to Financial Statements (Unaudited) (Continued)
Milliman Financial Risk Management LLC (the “Sub-Adviser”) acts as sub-adviser to the Funds pursuant to a sub-advisory agreement between the Adviser and the Sub-Adviser with respect to the Funds (“Sub-Advisory Agreement”) and, pursuant to the Sub-Advisory Agreement, is responsible for execution of the Sub-Adviser’s strategy for each of the Funds. The Sub-Adviser is responsible for the day-to-day management of the Funds’ portfolios. Pursuant to the Sub-Advisory Agreement between the Adviser and the Sub-Adviser, the Adviser pays the Sub-Adviser a fee, based on the Funds’ average daily net assets, for the services and facilities it provides payable on a monthly basis.
Certain trustees and officers of the Trust are affiliated with the Adviser. Trustee compensation is paid for by the Adviser.
292
Notes to Financial Statements (Unaudited) (Continued)
4. | INVESTMENT TRANSACTIONS |
For the period ended April 30, 2023, there were no purchases or proceeds from long-term sales of investment securities.
For the period ended April 30, 2023, in-kind transactions associated with creations and redemptions were as follows:
| | | In-Kind | | | In-Kind | |
| | | Creations | | | Redemptions | |
IJAN | | $ | - | | | $ | 13,116,329 | |
IAPR | | | - | | | | 22,499,162 | |
IJUL | | | - | | | | 35,038,959 | |
IOCT | | | - | | | | 10,510,360 | |
EJAN | | | - | | | | 36,560,140 | |
EAPR | | | - | | | | 3,510,186 | |
EJUL | | | - | | | | 10,431,936 | |
EOCT | | | - | | | | 2,424,323 | |
NJAN | | | - | | | | 25,126,782 | |
NAPR | | | - | | | | 9,293,233 | |
NJUL | | | - | | | | 17,997,678 | |
NOCT | | | - | | | | 8,722,031 | |
KJAN | | | - | | | | 15,674,668 | |
KAPR | | | - | | | | 2,458,621 | |
KJUL | | | - | | | | 9,221,588 | |
KOCT | | | - | | | | 1,360,872 | |
DSJA | | | - | | | | - | |
DSOC | | | - | | | | - | |
TSJA | | | - | | | | 565,052 | |
TSOC | | | - | | | | - | |
DBJA | | | - | | | | 729,756 | |
DBOC | | | - | | | | 1,005,507 | |
TBJL | | | - | | | | - | |
TFJL | | | - | | | | 10,231,928 | |
XDJA | | | - | | | | 504,703 | |
XDAP | | | - | | | | 604,883 | |
XDJL | | | - | | | | 1,274,650 | |
XDOC | | | - | | | | 1,314,671 | |
XTJA | | | - | | | | 747,764 | |
XTAP | | | - | | | | 1,233,199 | |
XTJL | | | - | | | | 3,002,263 | |
XTOC | | | - | | | | 2,421,926 | |
XBJA | | | - | | | | 5,021,277 | |
XBAP | | | - | | | | 6,336,584 | |
XBJL | | | - | | | | 5,934,198 | |
XBOC | | | - | | | | 2,366,091 | |
QTJA | | | - | | | | - | |
QTAP | | | - | | | | 1,157,517 | |
QTJL | | | - | | | | 13,129,861 | |
QTOC | | | - | | | | 750,160 | |
BALT | | | - | | | | 198,682,736 | |
XDSQ | | | - | | | | 1,446,530 | |
XDQQ | | | - | | | | 12,085,350 | |
293
Notes to Financial Statements (Unaudited) (Continued)
5. CREATION AND REDEMPTION TRANSACTIONS
There were an unlimited number of shares of beneficial interest (without par value) authorized by the Trust. Individual shares of the Funds may only be purchased and sold at market prices on the Exchange through a broker-dealer. Such transactions may be subject to customary commission rates imposed by the broker-dealer, and market prices for the Funds’ shares may be at, above or below its NAV depending on the premium or discount at which the Funds’ shares trade.
The Funds issue and redeem shares on a continuous basis at NAV only in blocks of shares called “Creation Units.” Creation Units are issued and redeemed principally for cash. Once created, shares generally trade in the secondary market at market prices that change throughout the day in amounts less than a Creation Unit. Except when aggregated in Creation Units, shares are not redeemable securities of the Funds. Shares of the Funds may only be purchased or redeemed by certain financial institutions (“Authorized Participants”). An Authorized Participant is either (i) a broker-dealer or other participant in the clearing process through the Continuous Net Settlement System of the National Securities Clearing Corporation or (ii) a DTC participant and, in each case, must have executed a Participant Agreement with the Distributor. A transaction fee is applicable to each transaction regardless of the number of units purchased or sold in the transaction. Each Fund, subject to approval by the Board of Trustees, may adjust transaction fees from time to time based upon actual experience. Additional charges received by the Funds, if any, are disclosed as Transaction Fees on the Statements of Changes in Net Assets. Most retail investors do not qualify as Authorized Participants nor have the resources to buy and sell whole Creation Units. Therefore, they are unable to purchase or redeem the shares directly from the Funds. Rather, most retail investors may purchase shares in the secondary market with the assistance of a broker and are subject to customary brokerage commissions or fees.
294
Notes to Financial Statements (Unaudited) (Continued)
6. | FEDERAL INCOME TAX INFORMATION |
At October 31, 2022, the cost of investments including options written and net unrealized appreciation/(depreciation) for federal income tax purposes were as follows:
| | | Cost of Portfolio | | | Gross Unrealized Appreciation | | | Gross Unrealized Depreciation | | | Net Unrealized Appreciation / (Depreciation) | |
IJAN | | $ | 73,864,650 | | | $ | 14,176,153 | | | $ | (22,306,234 | ) | | $ | (8,130,081 | ) |
IAPR | | | 44,492,842 | | | | 5,134,901 | | | | (6,355,605 | ) | | | (1,220,704 | ) |
IJUL | | | 190,670,252 | | | | 1,102,504 | | | | (2,886,204 | ) | | | (1,783,700 | ) |
IOCT | | | 91,830,185 | | | | 5,914,227 | | | | (3,342,496 | ) | | | 2,571,731 | |
EJAN | | | 66,999,880 | | | | 16,616,465 | | | | (27,657,843 | ) | | | (11,041,378 | ) |
EAPR | | | 35,208,394 | | | | 5,447,738 | | | | (9,973,618 | ) | | | (4,525,880 | ) |
EJUL | | | 58,141,481 | | | | 4,009,097 | | | | (7,467,532 | ) | | | (3,458,435 | ) |
EOCT | | | 26,165,595 | | | | 459,404 | | | | (980,717 | ) | | | (521,313 | ) |
NJAN | | | 96,064,293 | | | | 23,736,429 | | | | (36,968,071 | ) | | | (13,231,642 | ) |
NAPR | | | 56,689,672 | | | | 10,514,872 | | | | (14,303,428 | ) | | | (3,788,556 | ) |
NJUL | | | 117,742,041 | | | | 4,567,585 | | | | (3,873,021 | ) | | | 694,564 | |
NOCT | | | 79,828,058 | | | | 3,203,602 | | | | (2,019,778 | ) | | | 1,183,824 | |
KJAN | | | 82,975,905 | | | | 9,896,078 | | | | (13,309,092 | ) | | | (3,413,014 | ) |
KAPR | | | 88,721,893 | | | | 3,308,950 | | | | (7,131,730 | ) | | | (3,822,780 | ) |
KJUL | | | 74,893,690 | | | | 7,601,640 | | | | (4,111,423 | ) | | | 3,490,217 | |
KOCT | | | 70,381,497 | | | | 6,381,980 | | | | (3,822,477 | ) | | | 2,559,503 | |
DSJA | | | 3,728,933 | | | | 311,867 | | | | (1,008,792 | ) | | | (696,925 | ) |
DSOC | | | 3,852,784 | | | | 378,431 | | | | (207,536 | ) | | | 170,895 | |
TSJA | | | 7,373,515 | | | | 1,298,974 | | | | (2,678,978 | ) | | | (1,380,004 | ) |
TSOC | | | 5,045,371 | | | | 881,849 | | | | (647,743 | ) | | | 234,106 | |
DBJA | | | 8,468,225 | | | | 1,470,789 | | | | (1,744,724 | ) | | | (273,935 | ) |
DBOC | | | 13,905,328 | | | | 1,677,280 | | | | (1,223,233 | ) | | | 454,047 | |
TBJL | | | 33,648,067 | | | | 1,429,756 | | | | (2,860,264 | ) | | | (1,430,508 | ) |
TFJL | | | 20,676,368 | | | | 439,064 | | | | (759,413 | ) | | | (320,349 | ) |
XDJA | | | 4,698,870 | | | | 152,506 | | | | (875,260 | ) | | | (722,754 | ) |
XDAP | | | 4,408,101 | | | | 323,244 | | | | (973,666 | ) | | | (650,422 | ) |
XDJL | | | 3,474,178 | | | | 12,613 | | | | (11,544 | ) | | | 1,069 | |
XDOC | | | 33,716,894 | | | | 4,461,683 | | | | (2,529,077 | ) | | | 1,932,606 | |
XTJA | | | 6,242,720 | | | | 395,615 | | | | (1,667,680 | ) | | | (1,272,065 | ) |
XTAP | | | 4,369,491 | | | | 678,846 | | | | (1,311,317 | ) | | | (632,471 | ) |
XTJL | | | 12,596,112 | | | | 347,847 | | | | (230,826 | ) | | | 117,021 | |
XTOC | | | 14,434,281 | | | | 2,275,838 | | | | (1,595,532 | ) | | | 680,306 | |
XBJA | | | 16,235,570 | | | | 1,526,457 | | | | (3,452,551 | ) | | | (1,926,094 | ) |
XBAP | | | 21,916,003 | | | | 3,010,963 | | | | (5,305,842 | ) | | | (2,294,879 | ) |
XBJL | | | 34,023,711 | | | | 939,189 | | | | (2,700,883 | ) | | | (1,761,694 | ) |
XBOC | | | 34,895,037 | | | | 3,852,525 | | | | (2,805,504 | ) | | | 1,047,021 | |
QTJA | | | 6,734,237 | | | | 354,148 | | | | (2,684,112 | ) | | | (2,329,964 | ) |
QTAP | | | 9,183,018 | | | | 1,900,625 | | | | (4,056,443 | ) | | | (2,155,818 | ) |
QTJL | | | 19,251,453 | | | | 1,631,063 | | | | (2,878,515 | ) | | | (1,247,452 | ) |
QTOC | | | 5,853,448 | | | | 446,921 | | | | (278,305 | ) | | | 168,616 | |
BALT | | | 252,661,367 | | | | 20,562,185 | | | | (16,639,001 | ) | | | 3,923,184 | |
XDSQ | | | 10,797,485 | | | | 1,321,326 | | | | (671,581 | ) | | | 649,745 | |
XDQQ | | | 17,400,073 | | | | 843,330 | | | | (164,456 | ) | | | 678,874 | |
Notes to Financial Statements (Unaudited) (Continued)
At October 31, 2022, the components of distributable earnings/(accumulated deficit) on a tax basis were as follows:
| | | Accumulated Capital and Other Losses | | | Undistributed
Capital Gains | | | Undistributed Net Ordinary Income | | | Unrealized Appreciation / (Depreciation) on Investments | | | Total Distributable Earnings /(Accumulated Deficit) | |
IJAN | | $ | (5,260,128 | ) | | $ | - | | | $ | - | | | $ | (8,130,081 | ) | | $ | (13,390,209 | ) |
IAPR | | | (7,451,944 | ) | | | - | | | | - | | | | (1,220,704 | ) | | | (8,672,648 | ) |
IJUL | | | (15,337,226 | ) | | | - | | | | - | | | | (1,783,700 | ) | | | (17,120,926 | ) |
IOCT | | | (2,510,557 | ) | | | - | | | | - | | | | 2,571,731 | | | | 61,174 | |
EJAN | | | (3,996,921 | ) | | | - | | | | - | | | | (11,041,378 | ) | | | (15,038,299 | ) |
EAPR | | | (5,181,808 | ) | | | - | | | | - | | | | (4,525,880 | ) | | | (9,707,688 | ) |
EJUL | | | (13,281,445 | ) | | | - | | | | - | | | | (3,458,435 | ) | | | (16,739,880 | ) |
EOCT | | | (1,510,830 | ) | | | - | | | | - | | | | (521,313 | ) | | | (2,032,143 | ) |
NJAN | | | (18,931,417 | ) | | | - | | | | - | | | | (13,231,642 | ) | | | (32,163,059 | ) |
NAPR | | | (4,693,817 | ) | | | - | | | | - | | | | (3,788,556 | ) | | | (8,482,373 | ) |
NJUL | | | (14,774,292 | ) | | | - | | | | - | | | | 694,564 | | | | (14,079,728 | ) |
NOCT | | | (7,718,348 | ) | | | - | | | | - | | | | 1,183,824 | | | | (6,534,524 | ) |
KJAN | | | (12,825,732 | ) | | | - | | | | - | | | | (3,413,014 | ) | | | (16,238,746 | ) |
KAPR | | | (7,571,828 | ) | | | - | | | | - | | | | (3,822,780 | ) | | | (11,394,608 | ) |
KJUL | | | (19,228,696 | ) | | | - | | | | - | | | | 3,490,217 | | | | (15,738,479 | ) |
KOCT | | | (5,258,504 | ) | | | - | | | | - | | | | 2,559,503 | | | | (2,699,001 | ) |
DSJA | | | (1,295,762 | ) | | | - | | | | - | | | | (696,925 | ) | | | (1,992,687 | ) |
DSOC | | | (6,732,479 | ) | | | - | | | | - | | | | 170,895 | | | | (6,561,584 | ) |
TSJA | | | (11,362,783 | ) | | | - | | | | - | | | | (1,380,004 | ) | | | (12,742,787 | ) |
TSOC | | | (9,656,646 | ) | | | - | | | | - | | | | 234,106 | | | | (9,422,540 | ) |
DBJA | | | (5,190,471 | ) | | | - | | | | - | | | | (273,935 | ) | | | (5,464,406 | ) |
DBOC | | | (16,230,797 | ) | | | - | | | | - | | | | 454,047 | | | | (15,776,750 | ) |
TBJL | | | (1,970,507 | ) | | | - | | | | - | | | | (1,430,508 | ) | | | (3,401,015 | ) |
TFJL | | | (2,241,374 | ) | | | - | | | | - | | | | (320,349 | ) | | | (2,561,723 | ) |
XDJA | | | (24,163 | ) | | | - | | | | - | | | | (722,754 | ) | | | (746,917 | ) |
XDAP | | | - | | | | - | | | | - | | | | (650,422 | ) | | | (650,422 | ) |
XDJL | | | (1,403,351 | ) | | | - | | | | - | | | | 1,069 | | | | (1,402,282 | ) |
XDOC | | | (7,673,899 | ) | | | - | | | | - | | | | 1,932,606 | | | | (5,741,293 | ) |
XTJA | | | (38,272 | ) | | | - | | | | - | | | | (1,272,065 | ) | | | (1,310,337 | ) |
XTAP | | | (1,292,112 | ) | | | - | | | | - | | | | (632,471 | ) | | | (1,924,583 | ) |
XTJL | | | (5,142,136 | ) | | | - | | | | - | | | | 117,021 | | | | (5,025,115 | ) |
XTOC | | | (1,675,767 | ) | | | - | | | | - | | | | 680,306 | | | | (995,461 | ) |
XBJA | | | (85,724 | ) | | | - | | | | - | | | | (1,926,094 | ) | | | (2,011,818 | ) |
XBAP | | | (1,370,363 | ) | | | - | | | | - | | | | (2,294,879 | ) | | | (3,665,242 | ) |
XBJL | | | (3,926,248 | ) | | | - | | | | - | | | | (1,761,694 | ) | | | (5,687,942 | ) |
XBOC | | | (2,830,271 | ) | | | - | | | | - | | | | 1,047,021 | | | | (1,783,250 | ) |
QTJA | | | (44,573 | ) | | | - | | | | - | | | | (2,329,964 | ) | | | (2,374,537 | ) |
QTAP | | | (4,380,261 | ) | | | - | | | | - | | | | (2,155,818 | ) | | | (6,536,079 | ) |
QTJL | | | (6,534,621 | ) | | | - | | | | - | | | | (1,247,452 | ) | | | (7,782,073 | ) |
QTOC | | | (1,706,844 | ) | | | - | | | | - | | | | 168,616 | | | | (1,538,228 | ) |
BALT | | | (25,251,042 | ) | | | - | | | | - | | | | 3,923,184 | | | | (21,327,858 | ) |
XDSQ | | | (4,968,833 | ) | | | - | | | | - | | | | 649,745 | | | | (4,319,088 | ) |
XDQQ | | | (6,943,105 | ) | | | - | | | | - | | | | 678,874 | | | | (6,264,231 | ) |
296
Notes to Financial Statements (Unaudited) (Continued)
Certain qualified late year ordinary losses incurred after December 31, and within the current taxable year, are deemed to arise on the first business day of the next taxable year. At October 31, 2022, the Funds deferred the following qualified late year ordinary losses:
| | | Late Year Ordinary Losses | |
IJAN | | $ | 554,087 | |
IAPR | | | 371,799 | |
IJUL | | | 600,381 | |
IOCT | | | 147,726 | |
EJAN | | | 597,590 | |
EAPR | | | 290,648 | |
EJUL | | | 275,632 | |
EOCT | | | 69,926 | |
NJAN | | | 722,722 | |
NAPR | | | 346,461 | |
NJUL | | | 489,461 | |
NOCT | | | 413,710 | |
KJAN | | | 742,063 | |
KAPR | | | 562,807 | |
KJUL | | | 414,930 | |
KOCT | | | 265,090 | |
DSJA | | | 29,801 | |
DSOC | | | 43,618 | |
TSJA | | | 87,124 | |
TSOC | | | 59,346 | |
DBJA | | | 73,260 | |
DBOC | | | 114,227 | |
TBJL | | | 52,455 | |
TFJL | | | 55,023 | |
XDJA | | | 24,162 | |
XDAP | | | - | |
XDJL | | | 32,216 | |
XDOC | | | 69,222 | |
XTJA | | | 38,272 | |
XTAP | | | 64,063 | |
XTJL | | | 92,612 | |
XTOC | | | 46,259 | |
XBJA | | | 85,724 | |
XBAP | | | 157,081 | |
XBJL | | | 143,487 | |
XBOC | | | 61,513 | |
QTJA | | | 44,573 | |
QTAP | | | 78,357 | |
QTJL | | | 92,227 | |
QTOC | | | 31,329 | |
BALT | | | 756,826 | |
XDSQ | | | 73,320 | |
XDQQ | | | 95,278 | |
297
Notes to Financial Statements (Unaudited) (Continued)
At October 31, 2022, for federal income tax purposes, the Funds had capital loss carryforwards available to offset future capital gains for an unlimited period as indicated below:
| | | Indefinite Short-Term | | | Indefinite Long-Term | |
IJAN | | $ | 4,706,041 | | | $ | - | |
IAPR | | | 7,080,146 | | | | - | |
IJUL | | | 14,736,846 | | | | - | |
IOCT | | | 2,362,833 | | | | - | |
EJAN | | | 3,399,331 | | | | - | |
EAPR | | | 4,891,158 | | | | - | |
EJUL | | | 11,928,277 | | | | 1,077,537 | |
EOCT | | | 1,440,904 | | | | - | |
NJAN | | | 18,208,696 | | | | - | |
NAPR | | | 4,347,357 | | | | - | |
NJUL | | | 14,284,830 | | | | - | |
NOCT | | | 7,304,638 | | | | - | |
KJAN | | | 12,083,667 | | | | - | |
KAPR | | | 7,009,021 | | | | - | |
KJUL | | | 18,813,767 | | | | - | |
KOCT | | | 4,993,414 | | | | - | |
DSJA | | | 1,265,962 | | | | - | |
DSOC | | | 6,688,860 | | | | - | |
TSJA | | | 11,275,660 | | | | - | |
TSOC | | | 9,597,302 | | | | - | |
DBJA | | | 5,117,214 | | | | - | |
DBOC | | | 16,116,570 | | | | - | |
TBJL | | | 1,918,050 | | | | - | |
TFJL | | | 2,186,352 | | | | - | |
XDJA | | | - | | | | - | |
XDAP | | | - | | | | - | |
XDJL | | | 1,371,136 | | | | - | |
XDOC | | | 7,604,677 | | | | - | |
XTJA | | | - | | | | - | |
XTAP | | | 1,228,048 | | | | - | |
XTJL | | | 5,049,521 | | | | - | |
XTOC | | | 1,629,507 | | | | - | |
XBJA | | | - | | | | - | |
XBAP | | | 1,213,282 | | | | - | |
XBJL | | | 3,782,761 | | | | - | |
XBOC | | | 2,768,758 | | | | - | |
QTJA | | | - | | | | - | |
QTAP | | | 4,301,905 | | | | - | |
QTJL | | | 6,442,393 | | | | - | |
QTOC | | | 1,675,514 | | | | - | |
BALT | | | 24,494,216 | | | | - | |
XDSQ | | | 4,895,511 | | | | - | |
XDQQ | | | 6,847,827 | | | | - | |
To the extent that these loss carryforwards are utilized, capital gains so offset will not be distributed to shareholders. During the current tax year ended October 31, 2022, no capital loss carryforwards available were utilized.
298
Notes to Financial Statements (Unaudited) (Continued)
The Funds did not pay any distributions during the fiscal years or periods ended October 31, 2022 and October 31, 2021, respectively.
7. SUBSEQUENT EVENT
Management has evaluated the impact of all subsequent events of the Funds through the date of the financial statements were issued, and has determined that there were no subsequent events requiring recognition or disclosure in the financial statements.
INNOVATOR ETFs TRUST
Trustees and Officers (Unaudited)
Name, Address and Year of Birth | Position with the Trust | Length of Time Served* | Principal Occupation(s) During Past 5 Years | Number of Portfolios in Fund Complex(a) Overseen by Trustee or Officer | Other Directorships Held by Trustee or Officer in the Past Five Years |
Independent Trustees |
Mark Berg 109 N. Hale Street, Wheaton, IL 60187 Year of Birth: 1971 | Trustee | Since 2017 | Founding Principal (2001-present), Chief Executive Officer (2019-present), President (2001-2019), Timothy Financial Counsel, Inc. | 95 | Tortazo, LLC (2018-present) |
Joe Stowell 109 N. Hale Street, Wheaton, IL 60187 Year of Birth: 1968 | Trustee | Since 2017 | Chief Operating Officer, Woodmen Valley Chapel (2015-present). | 95 | Board of Advisors, Westmont College (2016-2021). |
Brian J. Wildman 109 N. Hale Street, Wheaton, IL 60187 Year of Birth: 1963 | Trustee | Since 2017 | President, Timothy Financial Counsel, Inc. (2019-present); Executive Vice President, Consumer Banking (2016-2019), Chief Risk Officer (2013-2016), MB Financial Bank. | 95 | Missionary Furlough Homes, Inc. (since 2008); MB Financial Bank (2003-2019). |
Trustees and Officers (Unaudited) (Continued)
Interested Trustee & Officer |
H. Bruce Bond (b) 109 N. Hale Street, Wheaton, IL 60187 Year of Birth: 1963 | Interested Trustee, President and Principal Executive Officer | Since 2017 | Chief Executive Officer, Innovator Capital Management, LLC (2017-present). | 95 | None |
Officers |
John W. Southard, Jr. 109 N. Hale Street, Wheaton, IL 60187 Year of Birth: 1969 | Vice President, Secretary and Assistant Treasurer | Since 2017 | Chief Investment Officer, Innovator Capital Management, LLC (2017-present); Director and Co-Founder, T2 Capital Management, LLC (2010-present). | 95 | Independent Trustee, ETF Managers Group, LLC (2012-2018) |
Kathleen Meyer 109 N. Hale Street Wheaton, IL 60187 Year of Birth: 1964 | Vice President, Treasurer and Principal Financial Accounting Officer | Since 2022 | Chief Financial Officer, Innovator Capital Management, LLC (2018–present). | 95 | None |
Kevin P. Hourihan 3 Canal Plaza 3rd Floor Portland, ME 04101 Year of Birth: 1978 | Chief Compliance Officer and Anti-Money Laundering Officer | Since 2023 | Senior Principal Consultant, Fund Chief Compliance Officer, ACA Global, LLC (since 2022); Chief Compliance Officer, Ashmore Funds (2017-2022); Chief Compliance Officer, Ashmore Investment Management (US) Corp (2014-2022); Chief Compliance Officer, Ashmore Equities Investment Management (2015-2019). | 95 | None |
* | The Funds’ Trustees serve for an indefinite term until their resignation, death or removal. The Funds’ officers are elected annually by the Board and serve at the Board’s pleasure. |
(a) | The Fund Complex includes the Funds, each series of Innovator ETFs Trust. |
(b) | H. Bruce Bond is deemed to be an interested person of the Trust (as defined in the 1940 Act) because of his affiliation with the Adviser. |
The Statement of Additional Information includes additional information about the Trustees and is available upon request, without charge, by calling 1-877-386-3890.
Additional Information (Unaudited)
1. INFORMATION ABOUT PROSPECTUS
This report has been prepared for shareholders and may be distributed to others only if preceded or accompanied by a current prospectus. Investors should consider the investment objective and policies, risk considerations, charges and ongoing expenses of an investment carefully before investing. The prospectus contains this and other information relevant to an investment in the respective Fund. Please read the Prospectus carefully before investing. A copy of the Prospectus may be obtained without charge by writing to the Trust’s Distributor, or by calling toll free at 1-800-208-5212 or visiting www.innovatoretfs.com.
2. | PROXY VOTING POLICIES AND PROCEDURES |
The Trust’s Proxy Voting Policies and Procedures are available without charge, upon request, by calling 1-877-386-3890 and on the SEC’s website at www.sec.gov. Information relating to how each Fund voted proxies relating to portfolio securities held during each year ended June 30 is also available on the SEC’S website at www.sec.gov.
3. | INFORMATION ABOUT PORTFOLIO SECURITIES |
Each Funds’ complete schedule of portfolio holdings for the first and third quarters is filed with the SEC on Form N-Q or Part F of Form N-PORT (beginning with filings after March 31, 2020). The Trust’s Form N-Q or Part F of Form N-PORT is available without charge, upon request, by calling 1-877-386-3890, or on the SEC’s website at www.sec.gov. The Trust’s Form N-Q or Part F of Form N-PORT may be reviewed and copied at the SEC’s Public Reference Room in Washington, DC. Information on the operation of the Public Reference Room may be obtained by calling 1-800-SEC-0330.
4. | HOUSEHOLD DELIVERY OF SHAREHOLDER DOCUMENTS |
In order to reduce expenses, the Trust delivers one copy of an annual/semi-annual report, prospectus and/or proxy statement on behalf of two or more shareholders at a shared address (householding). If you do not wish to participate in householding, please indicate this preference on your new account application (if you are opening a new account) or call 1-877-FUND890 (877-386-3890) to change the status of your existing account. You may change your status at any time.
5. | ELECTRONIC DELIVERY OF SHAREHOLDER DOCUMENTS |
You may choose to receive a Fund’s prospectus and annual and semi-annual reports electronically. To sign up for electronic delivery, visit www.icsdelivery.com and select the first letter of your brokerage firm’s name. Then, select your brokerage institution from the list that follows, fill out the appropriate information and provide an e-mail address where you would like your information sent. If your brokerage firm is not listed, electronic delivery may not be available. Please contact your brokerage firm or financial adviser.
INNOVATOR ETFs TRUST
Additional Information (Unaudited) (Continued)
For the fiscal year ended October 31, 2022, certain dividends paid by the Funds may be subject to a maximum tax rate of 23.8%, as provided for by the Jobs and Growth Tax Relief Reconciliation Act of 2003.
For the taxable year ended October 31, 2022, the percentage of ordinary income dividends paid by the Funds that qualify for the dividends received deduction available to corporations was 0.00%.
For the taxable year ended October 31, 2022, the percentage of ordinary income distributions that were designated as short-term capital gain distributions under Internal Revenue Section 871(k)2(c) was 0.00%.
7. LIQUIDITY RISK MANAGEMENT PROGRAM
Consistent with Rule 22e-4 under the Investment Company Act of 1940, as amended, Innovator ETFs Trust (“Trust”), on behalf of each of its series (each a “Fund” and, collectively, the “Funds”), has established a liquidity risk management program to govern the Funds’ approach to managing liquidity risk (the “Program”). The Program is overseen by the Trust’s Valuation Committee as the Program Administrator, a committee comprised of representatives of the Trust’s investment adviser, Innovator Capital Management LLC and representatives of Milliman Financial Risk Management LLC, the sub-adviser for certain of the Funds (the “Committee”). The Trust’s Board of Trustees (the “Board”) has approved the designation of the Committee to administer the Program.
The Program’s principal objectives include supporting the Funds’ compliance with limits on investments in illiquid assets and mitigating the risk that a Fund will be unable to meet its redemption obligations in a timely manner. The Program also includes a number of elements that support the management and assessment of liquidity risk, including an annual assessment of factors that influence each Fund’s liquidity and the periodic classification and re-classification of certain Funds’ investments into groupings that reflect the Committee’s assessment of their relative liquidity under current market conditions.
At a meeting of the Board held on September 13, 2022, the Trustees received a written report from the Committee regarding the design and operational effectiveness of the Program which has been in operation since September 2019. The Committee determined, and reported to the Board, that the Program is reasonably designed to assess and manage the Funds’ liquidity risk and has operated adequately and effectively to manage the Funds’ liquidity risk since implementation. The Committee reported that during the period covered by the report, there were no liquidity events that impacted the Funds or their ability to timely meet redemptions without dilution to existing shareholders. The Committee also noted no Fund has filed a Form N-LIQUID with the SEC.
INVESTMENT ADVISOR
Innovator Capital Management, LLC
109 North Hale Street
Wheaton, IL 60187
INVESTMENT SUB-ADVISOR
Milliman Financial Risk Management, LLC
71 South Wacker Drive, 31st Floor
Chicago, IL 60606
ADMINISTRATOR, FUND ACCOUNTANT & TRANSFER AGENT
U.S. Bancorp Fund Services, LLC
615 East Michigan Street
Milwaukee, WI 53202
DISTRIBUTOR
Foreside Fund Services, LLC
Three Canal Plaza, Suite 100
Portland, ME 04101
CUSTODIAN
U.S. Bank, N.A.
1555 North RiverCenter Drive, Suite 302
Milwaukee, WI 53212
LEGAL COUNSEL
Chapman and Cutler LLP
320 South Canal Street, 27th Floor
Chicago, IL 60606
INDEPENDENT REGISTERED PUBLIC ACCOUNTING FIRM
Cohen & Company, Ltd.
342 North Water Street, Suite 830
Milwaukee, WI 53202
Item 2. Code of Ethics.
Not applicable for semi-annual reports.
Item 3. Audit Committee Financial Expert.
Not applicable for semi-annual reports.
Item 4. Principal Accountant Fees and Services.
Not applicable for semi-annual reports.
Item 5. Audit Committee of Listed Registrants.
Not applicable for semi-annual reports.
Item 6. Investments.
(a) | Schedule of Investments is included as part of the report to shareholders filed under Item 1 of this Form. |
Item 7. Disclosure of Proxy Voting Policies and Procedures for Closed-End Management Investment Companies.
Not applicable to open-end investment companies.
Item 8. Portfolio Managers of Closed-End Management Investment Companies.
Not applicable to open-end investment companies.
Item 9. Purchases of Equity Securities by Closed‑End Management Investment Company and Affiliated Purchasers.
Not applicable to open-end investment companies.
Item 10. Submission of Matters to a Vote of Security Holders.
There have been no material changes to the procedures by which shareholders may recommend nominees to the registrant’s board of trustees.
Item 11. Controls and Procedures.
(a) | The Registrant’s Principal Executive Officer and Principal Financial Officer have reviewed the Registrant's disclosure controls and procedures (as defined in Rule 30a-3(c) under the Investment Company Act of 1940 (the “Act”)) as of a date within 90 days of the filing of this report, as required by Rule 30a-3(b) under the Act and Rules 13a-15(b) or 15d‑15(b) under the Securities Exchange Act of 1934. Based on their review, such officers have concluded that the disclosure controls and procedures are effective in ensuring that information required to be disclosed in this report is appropriately recorded, processed, summarized and reported and made known to them by others within the Registrant and by the Registrant’s service provider. |
(b) | There were no changes in the Registrant's internal control over financial reporting (as defined in Rule 30a-3(d) under the Act) that occurred during the period covered by this report that have materially affected, or are reasonably likely to materially affect, the Registrant's internal control over financial reporting. |
Item 12. Disclosure of Securities Lending Activities for Closed-End Management Investment Companies
Not applicable to open-end investment companies.
Item 13. Exhibits.
(a) | (1) Any code of ethics or amendment thereto, that is the subject of the disclosure required by Item 2, to the extent that the registrant intends to satisfy Item 2 requirements through filing an exhibit. Not Applicable |
(2) A separate certification for each principal executive officer and principal financial officer pursuant to Section 302 of the Sarbanes-Oxley Act of 2002. Filed herewith.
(3) Any written solicitation to purchase securities under Rule 23c‑1 under the Act sent or given during the period covered by the report by or on behalf of the registrant to 10 or more persons. Not applicable to open-end investment companies.
(4) Change in the registrant’s independent public accountant. There was no change in the registrant’s independent public accountant for the period covered by this report.
SIGNATURES
Pursuant to the requirements of the Securities Exchange Act of 1934 and the Investment Company Act of 1940, the registrant has duly caused this report to be signed on its behalf by the undersigned, thereunto duly authorized.
(Registrant) Innovator ETFs Trust
By (Signature and Title)* /s/ Bruce Bond
Bruce Bond, Principal Executive Officer
Date 6/29/2023
Pursuant to the requirements of the Securities Exchange Act of 1934 and the Investment Company Act of 1940, this report has been signed below by the following persons on behalf of the registrant and in the capacities and on the dates indicated.
By (Signature and Title)* /s/ Bruce Bond
Bruce Bond, Principal Executive Officer
Date 6/29/2023
By (Signature and Title)* /s/ Kathleen Meyer
Kathleen Meyer, Principal Financial Officer
Date 6/29/2023
* Print the name and title of each signing officer under his or her signature.