UNITED STATES
SECURITIES AND EXCHANGE COMMISSION
Washington, D.C. 20549
FORM N-CSR
CERTIFIED SHAREHOLDER REPORT OF REGISTERED MANAGEMENT
INVESTMENT COMPANIES
Investment Company Act file number 811-22227
Rye Brook, NY 10573
IndexIQ Advisors LLC
800 Westchester Ave, Suite N-611
Rye Brook, NY 10573
Registrant's telephone number, including area code: 1-888-934-0777
Date of fiscal year end: April 30
Date of reporting period: April 30, 2010
Form N-CSR is to be used by management investment companies to file reports with the Commission not later than 10 days after the transmission to stockholders of any report that is required to be transmitted to stockholders under Rule 30e-1 under the Investment Company Act of 1940 (17 CFR 270.30e-1). The Commission may use the information provided on Form N-CSR in its regulatory, disclosure review, inspection, and policymaking roles.
A registrant is required to disclose the information specified by Form N-CSR, and the Commission will make this information public. A registrant is not required to respond to the collection of information contained in Form N-CSR unless the Form displays a currently valid Office of Management and Budget (“OMB”) control number. Please direct comments concerning the accuracy of the information collection burden estimate and any suggestions for reducing the burden to Secretary, Securities and Exchange Commission, 450 Fifth Street, NW, Washington, DC 20549-0609. The OMB has reviewed this collection of information under the clearance requirements of 44 U.S.C. § 3507.
Item 1. Reports to Stockholders.
ANNUAL REPORT | APRIL 30, 2010
IndexIQ ETF Trust
IQ Hedge Multi-Strategy Tracker ETF
IQ Hedge Macro Tracker ETF
IQ CPI Inflation Hedged ETF
IQ ARB Global Resources ETF
IQ ARB Merger Arbitrage ETF
IQ Australia Small Cap ETF
IQ Canada Small Cap ETF
IQ South Korea Small Cap ETF

The investment return and value of each of the Funds’ shares will fluctuate so that an investor’s shares, when sold, may be worth more or less than their original cost. Performance may be lower or higher than performance data quoted. Consider the Funds’ investment objectives, risks, charges and expenses carefully before investing. The prospectus and the statement of additional information include this and other relevant information about the Funds and are available by visiting www.indexiq.com or by calling 1-888-934-0777. Read the prospectus carefully before investing.
Each of the Funds’ performance that is current to the most recent month-end is available by visiting www.indexiq.com or by calling 1-888-934-0777.
The Funds file their complete schedules of portfolio holdings with the Commission for the first and third quarters of each fiscal year on Form N-Q. The Funds’ Forms N-Q are available on the Commission’s web site at www.sec.gov. The Funds’ Forms N-Q also may be reviewed and copied at the Commission’s Public Reference Room in Washington, DC; information on the operation of the Public Reference Room may be obtained by calling 1-800-SEC-0330.
The Funds are distributed by ALPS Distributors, Inc., which is not affiliated with IndexIQ or the Funds’ investment advisor.
IndexIQ® and IQ® are registered service marks of IndexIQ.
3
Shareholder Letter (unaudited)
Dear Shareholder:
The twelve months ended April 30, 2010 marked a considerable recovery in the global markets. Many of the asset classes that were hit hardest during the financial crisis were the top performers during this period. The real estate and emerging market equity segments, for example, were two of the strongest performers after they were amongst the worst performers in the crisis. Although most asset classes, including equities, bonds and currencies, fared well during this period, there were significant differences in the magnitude of returns.
As a result, investors have recognized that having a well-diversified portfolio is critical to long-term investment success. Alternative investments have historically provided investors with added diversification to their portfolios. By marrying the diversification benefits of alternative investments and the growth of exchange-traded funds (ETFs), IndexIQ is seeking to provide investors with innovative tools in a dynamic market environment.*
During the past year, alternative asset strategies, including hedge fund replication strategies such as our IQ Hedge Multi-Strategy Tracker ETF (QAI), continued to gain wider market acceptance. IndexIQ decided to leverage off its success with QAI by launching a range of products designed to provide investors with various investment solutions. These funds include: a global tactical asset allocation fund, the IQ Hedge Macro Tracker ETF; a multi-asset class real return fund, the IQ CPI Inflation Hedged ETF; a diversified global natural resources fund, the IQ ARB Global Resources ETF; the first merger arbitrage ETF, IQ ARB Merger Arbitrage ETF; and a number of small cap country ETFs (IQ Australia Small Cap ETF, IQ Canada Small Cap ETF, IQ South Korea Small Cap ETF). All of these funds are designed to give investors more options in meeting their multi-faceted investment objectives.
We at IndexIQ call ourselves “The alternative to alternatives” because, despite the attractive features of alternative assets, for the most part, these strategies have not been available to the majority of investors in a liquid and transparent manner. We believe that our solutions bridge this gap by giving investors the alternative asset performance characteristics they are looking for, but in a more liquid and transparent (daily holdings are published) manner relative to typical alternative asset strategies.
I want to personally thank you for your interest in IndexIQ and our investment products. I invite you to visit us at www.indexiq.com or call us at (888) 934-0777 for more information on our company and our investment solutions.
Adam S. Patti
Chief Executive Officer
Registered Representative of ALPS Distributors, Inc.
| * | Diversification does not eliminate the risk of experiencing investment loss. |
4
Management’s Discussion and Analysis (unaudited)
IQ Hedge Multi-Strategy Tracker ETF
The Fund seeks investment results that correspond (before fees and expenses) generally to the price and yield performance of the IQ Hedge Multi-Strategy Index, which seeks to track the “beta” portion of the returns (i.e., that portion of the returns of hedge funds that are non-idiosyncratic, or unrelated to manager skill) of hedge funds that employ various hedge fund investment styles, which may include but are not limited to macro, long/short, event-driven, market neutral, emerging markets, fixed-income arbitrage and other strategies commonly used by hedge fund managers. The Fund implements its strategy by investing primarily in ETFs representing various asset classes. The Fund does not invest directly in hedge funds.
For the 12-month period ended April 30, 2010, the Fund (NAV) returned 8.00% versus 12.49% and 38.84% for the HFRI Fund of Funds Composite Index and the Standard & Poor’s 500® Composite Stock Price Index (the “S&P 500 Index”), respectively.
The principal positive contributors to Fund performance for the period, in aggregate, were the Fund’s exposures, through investments in ETFs, to emerging equity markets and the high yield bond market. The Fund also benefitted from positions in broad bond ETFs as interest rates remained at historical lows.
The primary drivers of negative performance were the Fund’s negative exposures to international equities, U.S. small cap equities, and real estate.
Hypothetical Growth of a $10,000 Investment
(Since Inception Through 4/30/2010)
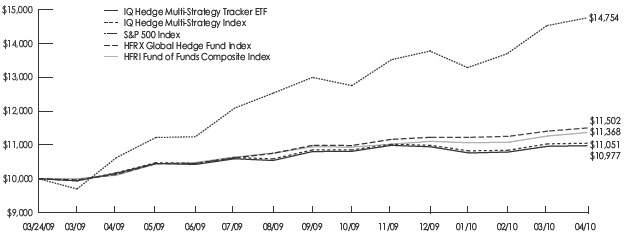
This chart illustrates the performance of a hypothetical $10,000 investment made on the Fund’s inception, and is not intended to imply any future performance.
Fund Performance History
IQ Hedge Multi-Strategy Tracker ETF
(as of April 30, 2010)
| 1 Year | Since Inception1 | |||||
| Average Annual | Average Annual | Cumulative | ||||
| IQ Hedge Multi-Strategy Tracker ETF Market Price2 | 7.46 | % | 8.61 | % | 9.52 | % |
| IQ Hedge Multi-Strategy Tracker ETF NAV | 8.00 | % | 8.83 | % | 9.77 | % |
| IQ Hedge Multi-Strategy Index | 8.60 | % | 10.02 | % | 10.51 | % |
| HFRI Fund of Funds Composite Index3 | 12.49 | % | 12.56 | %4 | 13.68 | %4 |
| HFRX Global Hedge Fund Index3 | 13.52 | % | 13.78 | %4 | 15.02 | %4 |
| S&P 500 Index | 38.84 | % | 46.02 | % | 47.54 | % |
| 1 | Fund Inception Date: 3/24/2009 |
| 2 | The price used to calculate Market Price returns is determined by using the closing price listed on the NYSE Arca and does not represent returns an investor would receive if shares were traded at other times. |
| 3 | The Advisor has removed the HFRX Global Hedge Fund Index as a benchmark for the Fund and replaced it with the HFRI Fund of Funds Composite Index because the Advisor believes the HFRI Fund of Funds Composite Index is more consistent with the investment strategy of the Fund and the manner in which the Fund’s Underlying Index is constructed. |
| 4 | From 3/31/2009 |
5
Management’s Discussion and Analysis (unaudited) (continued)
Since the shares of the Fund did not trade in the secondary market until the day after the Fund’s commencement, for the period from commencement (3/24/2009) to the first day of secondary market trading in shares of the Fund (3/25/2009), the NAV of the Fund is used as a proxy for the secondary market trading price to calculate market returns.
The performance data quoted above represents past performance. Past performance does not guarantee future results. The investment return and value of the Fund shares will fluctuate so that an investor’s shares, when sold, may be worth more or less than their original cost. Current Fund performance may be lower or higher than performance data quoted. Fund performance that is current to the most recent month-end is available by calling 1-888-934-0777 or by visiting www.indexiq.com. Returns shown include the reinvestment of all dividends and other distributions and do not reflect taxes that a shareholder would pay on the Fund’s distributions or redemption of the Fund’s shares. The gross total annual operating expense ratio of the Fund was 0.77%.
Index performance is for illustrative purposes only and does not represent actual Fund performance. One cannot invest directly in an index. Performance data for the Index assumes reinvestment of dividends and is net of the management fees for the Index’s components, as applicable, but it does not reflect management fees, transaction costs or other expenses that you would pay if you invested in the Fund directly.
The HFRI Fund of Funds Composite Index (“HFRI FoF Composite Index”) is an equally weighted hedge fund index including over 800 domestic and off-shore funds of funds.
The S&P 500 Index is a broad-based unmanaged index of 500 stocks, which is designed to represent the equity market in general (performance data assumes reinvestment of dividends, but it does not reflect management fees, transaction costs or other expenses).
The Fund is non-diversified and may be susceptible to greater losses if a single portfolio investment declines than would a diversified mutual fund. The Fund is not suitable for all investors. The Fund does not invest in hedge funds.
There is no guarantee that the Fund itself, or each of the ETFs in the Fund’s portfolio, will perform exactly as their underlying indexes. The Fund’s investment performance depends on the investment performance of the underlying ETFs in which it invests. The Fund’s underlying ETFs invest in: foreign securities, which subject them to risk of loss not typically associated with domestic markets, such as currency fluctuations and political uncertainty; commodities markets, which subject them to greater volatility than investments in traditional securities, such as stocks and bonds; and fixed income securities, which subject them to credit risk, the possibility that the issuer of a security will be unable to make interest payments and/or repay the principal on its debt, and interest rate risk, changes in the value of a fixed-income security resulting from changes in interest rates. Leverage, including borrowing, will cause some of the Fund’s underlying ETFs to be more volatile than if the underlying ETFs had not been leveraged.
6
Management’s Discussion and Analysis (unaudited) (continued)
IQ Hedge Macro Tracker ETF
The Fund seeks investment results that correspond (before fees and expenses) generally to the price and yield performance of the IQ Hedge Macro Index, which seeks to track the “beta” portion of the returns (i.e., that portion of the returns of hedge funds that are non-idiosyncratic, or unrelated to manager skill) of a combination of hedge funds pursuing a macro strategy and hedge funds pursuing an emerging markets strategy. The Fund implements its strategy by investing primarily in ETFs representing various asset classes. The Fund does not invest directly in hedge funds.
For the period since Fund inception (June 8, 2009) through April 30, 2010, the Fund (NAV) returned 7.16% versus 8.88% and 24.47% for the HFRI Fund of Funds Composite Index and the MSCI World Index.
The principal positive contributors to Fund performance for the period, in aggregate, were the Fund’s exposures, through investments in ETFs, to emerging equity markets and the commodity market. The Fund also benefitted from positions in global currencies as declining interests enabled a profitable carry trade strategy.
The primary drivers of negative performance were the Fund’s negative exposures to U.S. small cap equities and real estate.
Hypothetical Growth of a $10,000 Investment
(Since Inception Through 4/30/2010)
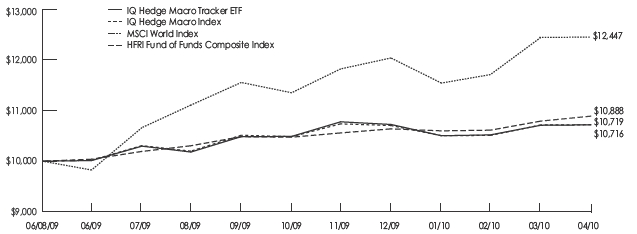
This chart illustrates the performance of a hypothetical $10,000 investment made on the Fund’s inception, and is not intended to imply any future performance.
Fund Performance History
IQ Hedge Macro Tracker ETF
(as of April 30, 2010)
| Since Inception1 | ||
| Cumulative | ||
| IQ Hedge Macro Tracker ETF Market Price2 | 7.43 | % |
| IQ Hedge Macro Tracker ETF NAV | 7.16 | % |
| IQ Hedge Macro Index | 7.19 | % |
| HFRI Fund of Funds Composite Index | 8.88 | %3 |
| MSCI World Index | 24.47 | % |
| 1 | Fund Inception Date: 6/08/2009 |
| 2 | The price used to calculate Market Price returns is determined by using the closing price listed on the NYSE Arca and does not represent returns an investor would receive if shares were traded at other times. |
| 3 | From 5/31/2009 |
7
Management’s Discussion and Analysis (unaudited) (continued)
Since the shares of the Fund did not trade in the secondary market until the day after the Fund’s commencement, for the period from commencement (6/8/2009) to the first day of secondary market trading in shares of the Fund (6/9/2009), the NAV of the Fund is used as a proxy for the secondary market trading price to calculate market returns.
The performance data quoted above represents past performance. Past performance does not guarantee future results. The investment return and value of the Fund shares will fluctuate so that an investor’s shares, when sold, may be worth more or less than their original cost. Current Fund performance may be lower or higher than performance data quoted. Fund performance that is current to the most recent month-end is available by calling 1-888-934-0777 or by visiting www.indexiq.com. Returns shown include the reinvestment of all dividends and other distributions and do not reflect taxes that a shareholder would pay on the Fund’s distributions or redemption of the Fund’s shares. The gross total annual operating expense ratio of the Fund was 0.76%.
Index performance is for illustrative purposes only and does not represent actual Fund performance. One cannot invest directly in an index. Performance data for the Index assumes reinvestment of dividends and is net of the management fees for the Index’s components, as applicable, but it does not reflect management fees, transaction costs or other expenses that you would pay if you invested in the Fund directly.
The HFRI Fund of Funds Composite Index (“HFRI FoF Composite Index”) is an equally weighted hedge fund index including over 800 domestic and off-shore funds of funds.
The S&P 500 Index is a broad-based unmanaged index of 500 stocks, which is designed to represent the equity market in general (performance data assumes reinvestment of dividends, but it does not reflect management fees, transaction costs or other expenses).
The Fund is non-diversified and may be susceptible to greater losses if a single portfolio investment declines than would a diversified mutual fund. The Fund is not suitable for all investors. The Fund does not invest in hedge funds.
There is no guarantee that the Fund itself, or each of the ETFs in the Fund’s portfolio, will perform exactly as their underlying indexes. The Fund’s investment performance depends on the investment performance of the underlying ETFs in which it invests. The Fund’s underlying ETFs invest in: foreign securities, which subject them to risk of loss not typically associated with domestic markets, such as currency fluctuations and political uncertainty; commodities markets, which subject them to greater volatility than investments in traditional securities, such as stocks and bonds; and fixed income securities, which subject them to credit risk, the possibility that the issuer of a security will be unable to make interest payments and/or repay the principal on its debt, and interest rate risk, changes in the value of a fixed income security resulting from changes in interest rates. Leverage, including borrowing, will cause some of the Fund’s underlying ETFs to be more volatile than if the underlying ETFs had not been leveraged.
8
Management’s Discussion and Analysis (unaudited) (continued)
IQ CPI Inflation Hedged ETF
The Fund seeks investment results that correspond (before fees and expenses) generally to the price and yield performance of the IQ CPI Inflation Hedged Index, which seeks to provide investors with a hedge against the U.S. inflation rate by providing a “real return” or a return above the rate of inflation, as represented by the Consumer Price Index, a leading government measure of inflation in the U.S. economy.
For the period since Fund (NAV) inception (October 26, 2009) through April 30, 2010, the Fund returned –0.04%.
The principal positive contributors to Fund performance for the period, in aggregate, were the Fund’s exposures, through investments in ETFs, to gold and oil. The Fund also benefitted from positions in short term bonds.
The primary drivers of negative performance were the Fund’s long exposures to the Japanese Yen and long term bonds as the yield curve steepened.*
* “Yield curve” refers to the difference in yield between long-term U.S. Treasury securities and short-term U.S. Treasury securities.
Hypothetical Growth of a $10,000 Investment
(Since Inception Through 4/30/2010)
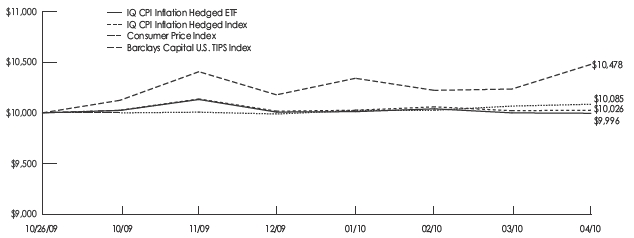
This chart illustrates the performance of a hypothetical $10,000 investment made on the Fund’s inception, and is not intended to imply any future performance.
Fund Performance History
IQ CPI Inflation Hedged ETF
(as of April 30, 2010)
| Since Inception1 | ||
| Cumulative | ||
| IQ CPI Inflation Hedged ETF Market Price2 | –0.24 | % |
| IQ CPI Inflation Hedged ETF NAV | –0.04 | % |
| IQ CPI Inflation Hedged Index | 0.26 | % |
| Consumer Price Index | 0.85 | %3 |
| Barclays Capital U.S. TIPS Index | 4.78 | % |
| 1 | Fund Inception Date: 10/26/2009 |
| 2 | The price used to calculate Market Price returns is determined by using the closing price listed on the NYSE Arca and does not represent returns an investor would receive if shares were traded at other times. |
| 3 | From 10/31/2009. |
9
Management’s Discussion and Analysis (unaudited) (continued)
Since the shares of the Fund did not trade in the secondary market until the day after the Fund’s commencement, for the period from commencement (10/26/2009) to the first day of secondary market trading in shares of the Fund (10/27/2009), the NAV of the Fund is used as a proxy for the secondary market trading price to calculate market returns.
The performance data quoted above represents past performance. Past performance does not guarantee future results. The investment return and value of the Fund shares will fluctuate so that an investor’s shares, when sold, may be worth more or less than their original cost. Current Fund performance may be lower or higher than performance data quoted. Fund performance that is current to the most recent month-end is available by calling 1-888-934-0777 or by visiting www.indexiq.com. Returns shown include the reinvestment of all dividends and other distributions and do not reflect taxes that a shareholder would pay on the Fund’s distributions or redemption of the Fund’s shares. The gross total annual operating expense ratio of the Fund was 0.50%.
Index performance is for illustrative purposes only and does not represent actual Fund performance. One cannot invest directly in an index. Performance data for the Index assumes reinvestment of dividends and is net of the management fees for the Index’s components, as applicable, but it does not reflect management fees, transaction costs or other expenses that you would pay if you invested in the Fund directly.
The Consumer Price Index (the “CPI”) is published by the Bureau of Labor Statistics. The CPI is a measure of the average change in prices over time of goods and services purchased by households.
The Barclays Capital U.S. TIPS Index measures the performance of inflation protected public obligations of the U.S. Treasury, also known as “TIPS.”
The Fund is non-diversified and may be susceptible to greater losses if a single portfolio investment declines than would a diversified mutual fund. The Fund is not suitable for all investors.
There is no guarantee that the Fund itself, or each of the ETFs in the Fund’s portfolio, will perform exactly as their underlying indexes. The Fund’s investment performance depends on the investment performance of the underlying ETFs in which it invests. The Fund’s underlying ETFs invest in: foreign securities, which subject them to risk of loss not typically associated with domestic markets, such as currency fluctuations and political uncertainty; commodities markets, which subject them to greater volatility than investments in traditional securities, such as stocks and bonds; and fixed income securities, which subject them to credit risk, the possibility that the issuer of a security will be unable to make interest payments and/or repay the principal on its debt, and interest rate risk, changes in the value of a fixed income security resulting from changes in interest rates.
10
Management’s Discussion and Analysis (unaudited) (continued)
IQ ARB Global Resources ETF
The Fund seeks investment results that correspond (before fees and expenses) generally to the price and yield performance of the IQ ARB Global Resources Index, which seeks to identify investment opportunities in the global resources market segment based on momentum and valuation factors.
For the period since Fund (NAV) inception (October 26, 2009) through April 30, 2010, the Fund returned 10.18% versus –0.27% for the Dow Jones-UBS Commodity Index.
The principal positive contributors to Fund performance for the period, in aggregate, were the Fund’s exposures, through investments in equities, to precious metals, coal and timber. The Fund also benefitted from long equity positions in Industrial metals and water.
The primary drivers of negative performance were the Fund’s negative exposure as a market hedge to U.S. and international equity markets.
Hypothetical Growth of a $10,000 Investment
(Since Inception Through 4/30/2010)
![]()
This chart illustrates the performance of a hypothetical $10,000 investment made on the Fund’s inception, and is not intended to imply any future performance.
Fund Performance History
IQ ARB Global Resources ETF
(as of April 30, 2010)
| Since Inception1 | ||
| Cumulative | ||
| IQ ARB Global Resources ETF Market Price2 | 10.10 | % |
| IQ ARB Global Resources ETF NAV | 10.18 | % |
| IQ ARB Global Resources Index | 11.11 | % |
| Dow Jones-UBS Commodity Index | –0.27 | % |
| 1 | Fund Inception Date: 10/26/2009 |
| 2 | The price used to calculate Market Price returns is determined by using the closing price listed on the NYSE Arca and does not represent returns an investor would receive if shares were traded at other times. |
11
Management’s Discussion and Analysis (unaudited) (continued)
Since the shares of the Fund did not trade in the secondary market until the day after the Fund’s commencement, for the period from commencement (10/26/2009) to the first day of secondary market trading in shares of the Fund (10/27/2009), the NAV of the Fund is used as a proxy for the secondary market trading price to calculate market returns.
The performance data quoted above represents past performance. Past performance does not guarantee future results. The investment return and value of the Fund shares will fluctuate so that an investor’s shares, when sold, may be worth more or less than their original cost. Current Fund performance may be lower or higher than performance data quoted. Fund performance that is current to the most recent month-end is available by calling 1-888-934-0777 or by visiting www.indexiq.com. Returns shown include the reinvestment of all dividends and other distributions and do not reflect taxes that a shareholder would pay on the Fund’s distributions or redemption of the Fund’s shares. The gross total annual operating expense ratio of the Fund was 0.79%.
Index performance is for illustrative purposes only and does not represent actual Fund performance. One cannot invest directly in an index. Performance data for the Index assumes reinvestment of dividends and is net of the management fees for the Index’s components, as applicable, but it does not reflect management fees, transaction costs or other expenses that you would pay if you invested in the Fund directly.
The Dow Jones-UBS Commodity Index is composed of futures contracts on physical commodities traded on U.S. exchanges, with the exception of aluminum, nickel and zinc, which trade on the London Metal Exchange.
As the Fund’s investments are concentrated in the global resources sector, the value of its shares will be affected by factors specific to that sector and generally will fluctuate more widely than that of a fund which invests in a broad range of industries. The Fund is susceptible to foreign securities risk. Since the Fund invests in foreign markets, it will be subject to risk of loss not typically associated with domestic markets. Loss may result because of less foreign government regulation, less public information, less economic, political and social stability, or other factors. The Fund is exposed to mid and small capitalization companies risk. Stock prices of mid and small capitalization companies generally are more volatile than those of larger companies and also are more vulnerable than those of large capitalization companies to adverse business and economic developments. Since the Fund may invest directly in foreign currencies or in securities that trade in, and receive revenues in, foreign currencies, the Fund is subject to the risk that those currencies will decline in value relative to the U.S. that the U.S. dollar will decline in value relative to the currency being hedged. The ETF is new and has limited operating history. The ETF should be considered a speculative investment with a high degree of risk, does not represent a complete investment program and is not suitable for all investors.
12
Management’s Discussion and Analysis (unaudited) (continued)
IQ ARB Merger Arbitrage ETF
The Fund seeks investment results that correspond (before fees and expenses) generally to the price and yield performance of the IQ ARB Merger Arbitrage Index, which seeks to identify investment opportunities in the acquisition and merger market segment globally.
For the period since Fund (NAV) inception (November 16, 2009) through April 30, 2010, the Fund returned 5.37% versus 3.05% for the MSCI World Index.
The principle positive contributors to Fund performance for the period were the Fund’s positions to Smith International (SII), BJ Services Co (BJS), and Sun Microsystems (JAVA). The Fund also benefitted from long equity positions in Allied Capital Group (ALD).
The primary drivers of negative performance were the Fund’s positions in Allegheny Energy Inc. (AYE), Airgas (ARG) and Cimpor Cimentos.
Hypothetical Growth of a $10,000 Investment
(Since Inception Through 4/30/2010)
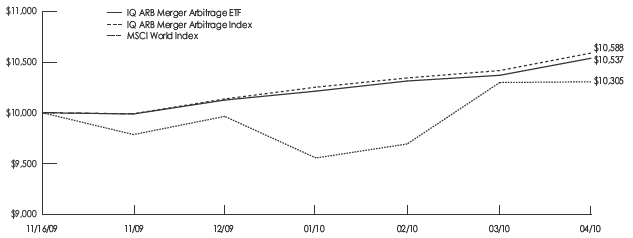
This chart illustrates the performance of a hypothetical $10,000 investment made on the Fund’s inception, and is not intended to imply any future performance.
Fund Performance History
IQ ARB Merger Arbitrage ETF
(as of April 30, 2010)
| Since Inception1 | ||
| Cumulative | ||
| IQ ARB Merger Arbitrage ETF Market Price2 | 5.61 | % |
| IQ ARB Merger Arbitrage ETF NAV | 5.37 | % |
| IQ ARB Merger Arbitrage Index | 5.88 | % |
| MSCI World Index | 3.05 | % |
| 1 | Fund Inception Date: 11/16/2009 |
| 2 | The price used to calculate Market Price returns is determined by using the closing price listed on the NYSE Arca and does not represent returns an investor would receive if shares were traded at other times. |
13
Management’s Discussion and Analysis (unaudited) (continued)
Since the shares of the Fund did not trade in the secondary market until the day after the Fund’s commencement, for the period from commencement (11/16/2009) to the first day of secondary market trading in shares of the Fund (11/17/2009), the NAV of the Fund is used as a proxy for the secondary market trading price to calculate market returns.
The performance data quoted above represents past performance. Past performance does not guarantee future results. The investment return and value of the Fund shares will fluctuate so that an investor’s shares, when sold, may be worth more or less than their original cost. Current Fund performance may be lower or higher than performance data quoted. Fund performance that is current to the most recent month-end is available by calling 1-888-934-0777 or by visiting www.indexiq.com. Returns shown include the reinvestment of all dividends and other distributions and do not reflect taxes that a shareholder would pay on the Fund’s distributions or redemption of the Fund’s shares. The gross total annual operating expense ratio of the Fund was 0.77%.
Index performance is for illustrative purposes only and does not represent actual Fund performance. One cannot invest directly in an index. Performance data for the Index assumes reinvestment of dividends and is net of the management fees for the Index’s components, as applicable, but it does not reflect management fees, transaction costs or other expenses that you would pay if you invested in the Fund directly.
The MSCI World Index is a free-float adjusted market capitalization weighted index that is designed to measure the equity market performance of developed market (performance data assumes reinvestment of dividends, but it does not reflect management fees, transaction costs or other expenses).
Certain of the proposed takeover transactions in which the Fund invests may be renegotiated, terminated or involve a longer time frame than originally contemplated, which may negatively impact the Fund’s returns. The Fund’s investment strategy may result in high portfolio turnover, which, in turn, may result in increased transaction costs to the Fund and lower total returns. The Fund is susceptible to foreign securities risk — since the Fund invests in foreign markets, it will be subject to risk of loss not typically associated with domestic markets, including currency transaction risk. Diversification does not eliminate the risk of experiencing investment losses. Stock prices of mid and small capitalization companies generally are more volatile than those of larger companies and also more vulnerable than those of larger capitalization companies to adverse economic developments. The ETF is new and has limited operating history. The ETF should be considered a speculative investment with a high degree of risk, does not represent a complete investment program and is not suitable for all investors.
IQ Canada Small Cap ETF
The Fund seeks investment results that correspond (before fees and expenses) generally to the price and yield performance of the IQ Canada Small Cap Index, which seeks to give investors a means of tracking the overall performance of the small capitalization sector of publicly traded companies domiciled and primarily listed on an exchange in Canada.
Fund performance information has been excluded due to the limited time for which the Fund was active during the reporting period (Fund inception date: March 22, 2010).
As the Fund’s investments are concentrated in Canada, the value of its shares will be affected by factors specific to Canada and may fluctuate more widely than that of a fund which invests in a broad range of countries. Any negative changes in the agricultural or mining industries could have an adverse impact on the Canadian economy. The Canadian economy is heavily dependent upon trading with its key partners. Any reduction in this trading may cause an adverse impact on the economy in which the Fund invests. The Fund is susceptible to foreign securities risk. Since the Fund invests in foreign markets, it will be subject to risk of loss not typically associated with domestic markets. The Fund is concentrated in small capitalization companies, whose stock prices generally are more volatile than those of larger companies and also are more vulnerable than those of large capitalization companies to adverse business and economic developments.
14
Management’s Discussion and Analysis (unaudited) (continued)
IQ Australia Small Cap ETF
The Fund seeks investment results that correspond (before fees and expenses) generally to the price and yield performance of the IQ Australia Small Cap Index, which seeks to give investors a means of tracking the overall performance of the small capitalization sector of publicly traded companies domiciled and primarily listed on an exchange in Australia.
Fund performance information has been excluded due to the limited time for which the Fund was active during the reporting period (Fund inception date: March 22, 2010).
As the Fund’s investments are concentrated in Australia, the value of its shares will be affected by factors specific to Australia and may fluctuate more widely than that of a fund which invests in a more diversified manner. Any negative changes in the agricultural or mining industries could have an adverse impact on the Australian economy. The Australian economy is heavily dependent upon trading with its key partners, including the U.S., Asia and Europe. Any reduction in this trading may cause an adverse impact on the economy in which the Fund invests. The Fund is susceptible to foreign securities risk — since the Fund invests in foreign markets, it will be subject to risk of loss not typically associated with domestic markets. The Fund is concentrated in small capitalization companies, whose stock prices generally are more volatile than those of larger companies and also are more vulnerable than those of large capitalization companies to adverse business and economic developments.
IQ South Korea Small Cap ETF
The Fund seeks investment results that correspond (before fees and expenses) generally to the price and yield performance of the IQ South Korea Small Cap Index, which seeks to give investors a means of tracking the overall performance of the small capitalization sector of publicly traded companies domiciled and primarily listed on an exchange in South Korea.
Fund performance information has been excluded due to the limited time for which the Fund was active during the reporting period (Fund inception date: April 13, 2010).
As the Fund’s investments are concentrated in South Korea, the value of its shares will be affected by factors specific to South Korea and may fluctuate more widely than that of a fund which invests in abroad range of countries and in developed markets. Investments in South Korea can be impacted by several factors, including a natural disaster in South Korea, a reduction in trading activity with its key trading partners, labor-related issues, and security issues, as any outbreak of hostilities between North and South Korea could have a severe adverse effect on the South Korean economy and its securities markets. The Fund is susceptible to foreign securities risk. Since the Fund invests in foreign markets, it will be subject to risk of loss not typically associated with domestic markets. The Fund is concentrated in small capitalization companies, whose stock prices generally are more volatile than those of larger companies and also are more vulnerable than those of large capitalization companies to adverse business and economic developments.
15
As a shareholder of a Fund, you incur two types of costs: (1) transaction costs and (2) ongoing costs, including management fees and other Fund expenses. This example is intended to help you understand your ongoing costs (in dollars) of investing in a Fund and to compare these costs with the ongoing costs of investing in other mutual funds.
The Examples are based on an investment of $1,000 invested at the beginning of the period and held for the entire period as indicated below.
Actual Expenses
The first line of the table below provides information about actual account values and actual expenses. You may use the information together with the amount you invested, in a particular Fund, to estimate the expenses that you paid over the period. Simply divide your account value by $1,000 (for example, an $8,600 account value divided by $1,000 = 8.6), then multiply the result by the number in the first line under the heading entitled “Expenses Paid for Period Ended 4/30/10” to estimate the expenses you paid on your account during this period. Each Fund will indirectly bear its pro rata share of the expenses incurred by the underlying ETF investments in which each Fund invests. These expenses are not included in the table.
Hypothetical Example for Comparison Purposes
The second line of the table below also provides information about hypothetical account values and hypothetical expenses based on each Funds’ actual expense ratio and an assumed annual rate of return of 5% before expenses, which are not the Funds’ actual returns. The hypothetical account values and expenses may not be used to estimate the actual ending account balance or expenses you paid for the period. You may use this information to compare the ongoing costs of investing in the Fund and other funds. To do so, compare this 5% hypothetical example with the 5% hypothetical examples that appear in the shareholder reports of other funds. The Funds will indirectly bear their pro rata share of the expenses incurred by the underlying ETF investments in which the Funds invest. These expenses are not included in the table.
Please note that the expenses shown in the table are meant to highlight your ongoing costs only and do not reflect any transactional costs. Therefore, the hypothetical example is useful in comparing ongoing costs only, and will not help you determine the relative total costs of owning different funds. In addition, if these transactional costs were included, your costs would have been higher.
16
Fund Expenses (unaudited) (continued)
| Beginning Account Value | Ending Account Value 04/30/10 | Annualized Expense Ratios for the Period | Expenses Paid for Period Ended 04/30/2010 | ||||||||
| IQ Hedge Multi-Strategy Tracker ETF | |||||||||||
| Actual | $ | 1,000.00 | $ | 1,015.26 | 0.77 | % | $ | 3.85 | * | ||
| Hypothetical (5% return before expenses) | $ | 1,000.00 | $ | 1,020.98 | 0.77 | % | $ | 3.86 | * | ||
| IQ Hedge Macro Tracker ETF | |||||||||||
| Actual | $ | 1,000.00 | $ | 1,021.71 | 0.76 | % | $ | 3.81 | * | ||
| Hypothetical (5% return before expenses) | $ | 1,000.00 | $ | 1,021.03 | 0.76 | % | $ | 3.81 | * | ||
| IQ CPI Inflation Hedged ETF | |||||||||||
| Actual | $ | 1,000.00 | $ | 997.20 | 0.50 | % | $ | 2.48 | * | ||
| Hypothetical (5% return before expenses) | $ | 1,000.00 | $ | 1,022.32 | 0.50 | % | $ | 2.51 | * | ||
| IQ ARB Global Resources ETF | |||||||||||
| Actual | $ | 1,000.00 | $ | 1,134.05 | 0.79 | % | $ | 4.18 | * | ||
| Hypothetical (5% return before expenses) | $ | 1,000.00 | $ | 1,020.88 | 0.79 | % | $ | 3.96 | * | ||
| IQ ARB Merger Arbitrage ETF1 | |||||||||||
| Actual | $ | 1,000.00 | $ | 1,053.68 | 0.77 | % | $ | 3.57 | ** | ||
| Hypothetical (5% return before expenses) | $ | 1,000.00 | $ | 1,020.98 | 0.77 | % | $ | 3.86 | * | ||
| IQ Australia Small Cap ETF2 | |||||||||||
| Actual | $ | 1,000.00 | $ | 1,025.60 | 0.71 | % | $ | 0.77 | † | ||
| Hypothetical (5% return before expenses) | $ | 1,000.00 | $ | 1,021.27 | 0.71 | % | $ | 3.56 | * | ||
| IQ Canada Small Cap ETF3 | |||||||||||
| Actual | $ | 1,000.00 | $ | 1,040.80 | 0.71 | % | $ | 0.77 | † | ||
| Hypothetical (5% return before expenses) | $ | 1,000.00 | $ | 1,021.27 | 0.71 | % | $ | 3.56 | * | ||
| IQ South Korea Small Cap ETF4 | |||||||||||
| Actual | $ | 1,000.00 | $ | 1,020.00 | 0.79 | % | $ | 0.37 | †† | ||
| Hypothetical (5% return before expenses) | $ | 1,000.00 | $ | 1,020.88 | 0.79 | % | $ | 3.96 | * | ||
| 1 | IQ ARB Merger Arbitrage ETF commenced operations on November 16, 2009. |
| 2 | IQ Australia Small Cap ETF commenced operations on March 22, 2010. |
| 3 | IQ Canada Small Cap ETF commenced operations on March 22, 2010. |
| 4 | IQ South Korea Small Cap ETF commenced operations on April 13, 2010. |
| * | Expenses are calculated using the Fund’s annualized expense ratio, multiplied by the average account value for the period, multiplied by 181/365 (to reflect the six-month period). |
| ** | Expenses are calculated using the Fund’s annualized expense ratio, multiplied by the average account value for the period, multiplied by 166/365 (to reflect the period since commencement of operations). |
| † | Expenses are calculated using the Fund’s annualized expense ratio, multiplied by the average account value for the period, multiplied by 40/365 (to reflect the period since commencement of operations). |
| †† | Expenses are calculated using the Fund’s annualized expense ratio, multiplied by the average account value for the period, multiplied by 18/365 (to reflect the period since commencement of operations). |
17
Premium and Discount Frequency Data (unaudited)
The tables that follow present information about the differences between the daily market price on secondary markets for shares of a Fund and that Fund’s net asset value. Net asset value, or “NAV”, is the price per share at which each Fund issues and redeems shares. It is calculated in accordance with the standard formula for valuing mutual fund shares. The “Closing Price” of each Fund generally is determined using the midpoint between the highest bid and the lowest offer on the stock exchange on which the shares of such Fund is listed for trading, as of the time that the Fund’s NAV is calculated. Each Fund’s Market Price may be at, above or below its NAV. The NAV of each Fund will fluctuate with changes in the market value of its portfolio holdings. The Market Price of each Fund will fluctuate in accordance with changes in its NAV, as well as market supply and demand.
Premiums or discounts are the differences (expressed as a percentage) between the NAV and Market Price of a Fund on a given day, generally at the time NAV is calculated. A premium is the amount that a Fund is trading above the reported NAV, expressed as a percentage of the NAV. A discount is the amount that a Fund is trading below the reported NAV, expressed as a percentage of the NAV.
The following information shows the frequency distributions of premiums and discounts for each of the Funds. The information shown for each Fund is for the period from the inception date of such fund through April 30, 2010.
Each line in the table shows the number of trading days in which the Fund traded within the premium/discount range indicated. The number of trading days in each premium/discount range is also shown as a percentage of the total number of trading days in the period covered by each table. All data presented here represents past performance, which cannot be used to predict future results.
| Premium | Discount | ||||||||||
| Differential | Number of Days Market Price >= NAV | Market Price >= NAV % of Total Days | Number of Days Market Price < NAV | Market Price < NAV % of Total Days | |||||||
| IQ Hedge Multi-Strategy ETF | |||||||||||
| March 24, 2009 – April 30, 2010 | |||||||||||
| $.00-$.249 | 166 | 60.15 | % | 106 | 38.41 | % | |||||
| $.25-$.499 | 1 | 0.36 | % | 2 | 0.72 | % | |||||
| $.50-$.749 | 0 | 0.00 | % | 0 | 0.00 | % | |||||
| $.75-$1.00 | 0 | 0.00 | % | 0 | 0.00 | % | |||||
| >$1.00 | 1 | 0.36 | % | 0 | 0.00 | % | |||||
| Total | 168 | 60.87 | % | 108 | 39.13 | % | |||||
| IQ Hedge Macro Tracker ETF | |||||||||||
| June 8, 2009 – April 30, 2010 | |||||||||||
| $.00-$.249 | 98 | 43.75 | % | 118 | 52.68 | % | |||||
| $.25-$.499 | 1 | 0.45 | % | 3 | 1.34 | % | |||||
| $.50-$.749 | 0 | 0.00 | % | 2 | 0.89 | % | |||||
| $.75-$1.00 | 0 | 0.00 | % | 0 | 0.00 | % | |||||
| >$1.00 | 2 | 0.89 | % | 0 | 0.00 | % | |||||
| Total | 101 | 45.09 | % | 123 | 54.91 | % | |||||
| IQ CPI Inflation Hedged ETF | |||||||||||
| October 26, 2009 – April 30, 2010 | |||||||||||
| $.00-$.249 | 71 | 56.35 | % | 52 | 41.27 | % | |||||
| $.25-$.499 | 2 | 1.59 | % | 1 | 0.79 | % | |||||
| $.50-$.749 | 0 | 0.00 | % | 0 | 0.00 | % | |||||
| $.75-$1.00 | 0 | 0.00 | % | 0 | 0.00 | % | |||||
| >$1.00 | 0 | 0.00 | % | 0 | 0.00 | % | |||||
| Total | 73 | 57.94 | % | 53 | 42.06 | % | |||||
18
Premium and Discount Frequency Data (unaudited) (continued)
April 30, 2010
| Premium | Discount | ||||||||||
| Differential | Number of Days Market Price >= NAV | Market Price >= NAV % of Total Days | Number of Days Market Price < NAV | Market Price < NAV % of Total Days | |||||||
| IQ ARB Global Resources ETF | |||||||||||
| October 26, 2009 – April 30, 2010 | |||||||||||
| $.00-$.249 | 62 | 49.21 | % | 18 | 14.29 | % | |||||
| $.25-$.499 | 23 | 18.25 | % | 7 | 5.56 | % | |||||
| $.50-$.749 | 8 | 6.35 | % | 4 | 3.17 | % | |||||
| $.75-$1.00 | 0 | 0.00 | % | 1 | 0.79 | % | |||||
| >$1.00 | 2 | 1.59 | % | 1 | 0.79 | % | |||||
| Total | 95 | 75.40 | % | 31 | 24.60 | % | |||||
| IQ ARB Merger Arbitrage ETF | |||||||||||
| November 16, 2009 – April 30, 2010 | |||||||||||
| $.00-$.249 | 55 | 48.67 | % | 7 | 6.19 | % | |||||
| $.25-$.499 | 32 | 28.32 | % | 1 | 0.89 | % | |||||
| $.50-$.749 | 12 | 10.62 | % | 2 | 1.77 | % | |||||
| $.75-$1.00 | 4 | 3.54 | % | 0 | 0.00 | % | |||||
| >$1.00 | 0 | 0.00 | % | 0 | 0.00 | % | |||||
| Total | 103 | 91.15 | % | 10 | 8.85 | % | |||||
| IQ Canada Small Cap ETF | |||||||||||
| March 22, 2010 – April 30, 2010 | |||||||||||
| $.00-$.249 | 16 | 57.14 | % | 7 | 25.00 | % | |||||
| $.25-$.499 | 4 | 14.29 | % | 0 | 0.00 | % | |||||
| $.50-$.749 | 0 | 0.00 | % | 0 | 0.00 | % | |||||
| $.75-$1.00 | 0 | 0.00 | % | 0 | 0.00 | % | |||||
| >$1.00 | 1 | 3.57 | % | 0 | 0.00 | % | |||||
| Total | 21 | 75.00 | % | 7 | 25.00 | % | |||||
| IQ Australia Small Cap ETF | |||||||||||
| March 22, 2010 – April 30, 2010 | |||||||||||
| $.00-$.249 | 12 | 42.86 | % | 4 | 14.29 | % | |||||
| $.25-$.499 | 7 | 25.00 | % | 1 | 3.57 | % | |||||
| $.50-$.749 | 2 | 7.14 | % | 1 | 3.57 | % | |||||
| $.75-$1.00 | 1 | 3.57 | % | 0 | 0.00 | % | |||||
| >$1.00 | 0 | 0.00 | % | 0 | 0.00 | % | |||||
| Total | 22 | 78.57 | % | 6 | 21.43 | % | |||||
| IQ South Korea Small Cap ETF | |||||||||||
| April 13, 2010 – April 30, 2010 | |||||||||||
| $.00-$.249 | 7 | 53.85 | % | 1 | 7.69 | % | |||||
| $.25-$.499 | 3 | 23.08 | % | 1 | 7.69 | % | |||||
| $.50-$.749 | 0 | 0.00 | % | 1 | 7.69 | % | |||||
| $.75-$1.00 | 0 | 0.00 | % | 0 | 0.00 | % | |||||
| >$1.00 | 0 | 0.00 | % | 0 | 0.00 | % | |||||
| Total | 10 | 76.93 | % | 3 | 23.07 | % | |||||
19
Portfolio Summaries (unaudited)
April 30, 2010
SCHEDULES OF INVESTMENTS SUMMARY TABLE
| IQ Hedge Multi-Strategy Tracker ETF Net Assets ($ mil): $92.6 | ||
| Investments | % of Net Assets | |
| Debt Funds | 56.0 | % |
| Equity Funds | 29.5 | |
| Asset Allocation Fund | 7.4 | |
| Commodity Fund | 3.0 | |
| Total Investments | 95.9 | |
| Other Assets in Excess of Liabilities | 4.1 | |
| Net Assets | 100.0 | % |
| IQ Hedge Macro Tracker ETF Net Assets ($ mil): $10.6 | ||
| Investments | % of Net Assets | |
| Debt Funds | 53.5 | % |
| Equity Funds | 32.5 | |
| Commodity Fund | 6.5 | |
| Asset Allocation Fund | 3.9 | |
| Total Investments | 96.4 | |
| Other Assets in Excess of Liabilities | 3.6 | |
| Net Assets | 100.0 | % |
| IQ CPI Inflation Hedged ETF Net Assets ($ mil): $13.7 | ||
| Investments | % of Net Assets | |
| Debt Funds | 86.3 | % |
| Asset Allocation Fund | 8.0 | |
| Commodity Fund | 1.9 | |
| Equity Funds | 0.1 | |
| Total Investments | 96.3 | |
| Other Assets in Excess of Liabilities | 3.7 | |
| Net Assets | 100.0 | % |
| IQ ARB Global Resources ETF Net Assets ($ mil): $8.2 | ||
| Investments | % of Net Assets | |
| Coal | 20.7 | % |
| Precious Metals | 18.2 | |
| Timber | 17.2 | |
| Grains, Food & Fiber | 13.9 | |
| Energy | 10.0 | |
| Water | 6.3 | |
| Livestock | 2.6 | |
| Industrial Metals | 1.6 | |
| Total Investments | 90.5 | |
| Other Assets in Excess of Liabilities | 9.5 | |
| Net Assets | 100.0 | % |
| IQ ARB Merger Arbitrage ETF Net Assets ($ mil): $31.6 | ||
| Investments | % of Net Assets | |
| Energy | 29.4 | % |
| Pharmaceuticals, Biotechnology & | ||
| Life Sciences | 10.6 | |
| Materials | 8.4 | |
| Utilities | 4.4 | |
| Consumer Services | 2.1 | |
| Information Technology | 1.9 | |
| Software & Services | 1.7 | |
| Industrials | 1.4 | |
| Consumer Discretionary | 1.4 | |
| Financials | 0.3 | |
| Total Investments | 61.6 | |
| Other Assets in Excess of Liabilities | 38.4 | |
| Net Assets | 100.0 | % |
| IQ Australia Small Cap ETF | ||
| Net Assets ($ mil): $9.0 | ||
| Investments | % of Net Assets | |
| Materials | 23.3 | % |
| Capital Goods | 11.4 | |
| Energy | 9.9 | |
| Commercial & Professional Services | 8.8 | |
| Retailing | 7.7 | |
| Health Care Equipment & Services | 6.8 | |
| Banks | 5.7 | |
| Media | 5.4 | |
| Consumer Services | 4.3 | |
| Diversified Financials | 2.9 | |
| Consumer Durables & Apparel | 2.7 | |
| Food, Beverage & Tobacco | 2.7 | |
| Utilities | 1.8 | |
| Transportation | 1.4 | |
| Software & Services | 1.3 | |
| Insurance | 1.2 | |
| Pharmaceuticals, Biotechnology & | ||
| Life Sciences | 0.8 | |
| Real Estate | 0.6 | |
| Semiconductors & Semiconductor | ||
| Equipment | 0.6 | |
| Telecommunication Services | 0.6 | |
| Total Investments | 99.9 | |
| Other Assets in Excess of Liabilities | 0.1 | |
| Net Assets | 100.0 | % |
20
Portfolio Summaries (unaudited) (continued)
April 30, 2010
| IQ Canada Small Cap ETF Net Assets ($ mil): $9.1 | ||
| Investments | % of Net Assets | |
| Materials | 49.0 | % |
| Energy | 19.9 | |
| Diversified Financials | 5.7 | |
| Capital Goods | 4.0 | |
| Pharmaceuticals, Biotechnology & | ||
| Life Sciences | 3.0 | |
| Consumer Durables & Apparel | 2.6 | |
| Retailing | 2.6 | |
| Insurance | 2.4 | |
| Software & Services | 2.0 | |
| Transportation | 1.6 | |
| Commercial & Professional Services | 1.4 | |
| Banks | 1.3 | |
| Media | 1.2 | |
| Food & Staples Retailing | 0.9 | |
| Food, Beverage & Tobacco | 0.6 | |
| Telecommunication Services | 0.6 | |
| Consumer Services | 0.4 | |
| Utilities | 0.4 | |
| Technology Hardware & Equipment | 0.2 | |
| Total Investments | 99.8 | |
| Other Assets in Excess of Liabilities | 0.2 | |
| Net Assets | 100.0 | % |
| IQ South Korea Small Cap ETF Net Assets ($ mil): $2.6 | ||
| Investments | % of Net Assets | |
| Materials | 19.1 | % |
| Capital Goods | 18.5 | |
| Diversified Financials | 13.4 | |
| Software & Services | 9.1 | |
| Technology Hardware & Equipment | 6.6 | |
| Automobiles & Components | 4.4 | |
| Insurance | 4.1 | |
| Transportation | 4.1 | |
| Consumer Durables & Apparel | 3.8 | |
| Consumer Services | 3.4 | |
| Semiconductors & Semiconductor | ||
| Equipment | 3.1 | |
| Health Care Equipment & Services | 2.4 | |
| Media | 2.3 | |
| Pharmaceuticals, Biotechnology & | ||
| Life Sciences | 1.9 | |
| Retailing | 1.3 | |
| Banks | 1.2 | |
| Food, Beverage & Tobacco | 1.2 | |
| Total Investments | 99.9 | |
| Other Assets in Excess of Liabilities | 0.1 | |
| Net Assets | 100.0 | % |
21
Schedules of Investments — IQ Hedge Multi-Strategy Tracker ETF
April 30, 2010
| Shares | Value | |||
| Investment Companies — 95.9% | ||||
| Asset Allocation Fund — 7.4% | ||||
| PowerShares DB G10 Currency | ||||
| Harvest Fund* | 284,709 | $ | 6,867,181 | |
| Commodity Fund — 3.0% | ||||
| PowerShares DB Commodity Index | ||||
| Tracking Fund* | 113,464 | 2,773,060 | ||
| Debt Funds — 56.0% | ||||
| iShares Barclays 1-3 Year Treasury | ||||
| Bond Fund | 18,928 | 1,581,245 | ||
| iShares Barclays Aggregate Bond Fund | 30,105 | 3,159,219 | ||
| iShares Barclays Credit Bond Fund | 12,849 | 1,331,927 | ||
| iShares Barclays Short Treasury Bond Fund | 4,521 | 498,169 | ||
| iShares Barclays US Treasury Inflation | ||||
| Protected Securities Fund | 88 | 9,333 | ||
| iShares iBoxx $ High Yield Corporate | ||||
| Bond Fund | 66,481 | 5,943,402 | ||
| iShares iBoxx $ Investment Grade | ||||
| Corporate Bond Fund | 262,619 | 28,181,645 | ||
| iShares JPMorgan USD Emerging Markets | ||||
| Bond Fund | 12,868 | 1,342,132 | ||
| PowerShares Emerging Markets Sovereign | ||||
| Debt Portfolio | 21,539 | 566,476 | ||
| SPDR Barclays Capital 1-3 Month T-Bill ETF | 3,663 | 167,912 | ||
| SPDR Barclays Capital Aggregate Bond ETF | 1,157 | 64,283 | ||
| SPDR Barclays Capital High Yield Bond ETF | 123,885 | 4,978,938 | ||
| SPDR Barclays Capital International | ||||
| Treasury Bond ETF | 22,174 | 1,222,896 | ||
| Vanguard Short-Term Bond ETF | 10,957 | 878,751 | ||
| Vanguard Total Bond Market ETF | 24,930 | 1,989,913 | ||
| Total Debt Funds | 51,916,241 | |||
| Equity Funds — 29.5% | ||||
| iShares MSCI EAFE Index Fund | 174,193 | 9,481,325 | ||
| iShares MSCI Emerging Markets Index Fund | 238,501 | 10,028,967 | ||
| iShares Russell 2000 Index Fund | 729 | 52,182 | ||
| Vanguard Emerging Markets ETF | 155,846 | 6,554,883 | ||
| Vanguard Europe Pacific ETF | 35,833 | 1,206,139 | ||
| Total Equity Funds | 27,323,496 | |||
| Total Investments — 95.9% | ||||
| (Cost $84,089,393) | $ | 88,879,978 | ||
| Other Assets in Excess of Liabilities — 4.1%(a) | 3,759,410 | |||
| Net Assets — 100.0% | $ | 92,639,388 | ||
* Non-income producing securities.
(a) Other Assets in Excess of Liabilities includes net unrealized depreciation on swaps.
ETF — Exchange Traded Fund
Swap contract outstanding at April 30, 2010:
| Total Return Benchmark | Annual Financing Rate | Expiration Date | Notional Amount | Unrealized Depreciation | |||
| iShares Dow Jones Real Estate | (1.06)% | 07/06/2010 | $(8,864,989) | $(484,566) |
Cash held as collateral with broker for swap contracts was $2,551,188 at April 30, 2010.
Morgan Stanley acts as the counterparty to the total return swap contract listed above. The Fund either receives fees from, or pay fees to, the counterparty, depending upon the total return of the benchmark, and the agreed-upon financing rate.
See notes to financial statements.
22
Schedules of Investments — IQ Hedge Macro Tracker ETF
April 30, 2010
| Shares | Value | |||
| Investment Companies — 96.4% | ||||
| Asset Allocation Fund — 3.9% | ||||
| PowerShares DB G10 Currency | ||||
| Harvest Fund* | 17,401 | $ | 419,712 | |
| Commodity Fund — 6.5% | ||||
| PowerShares DB Commodity Index | ||||
| Tracking Fund* | 28,076 | 686,178 | ||
| Debt Funds — 53.5% | ||||
| iShares Barclays 1-3 Year Treasury | ||||
| Bond Fund | 18,383 | 1,535,716 | ||
| iShares Barclays Credit Bond Fund | 744 | 77,123 | ||
| iShares Barclays Short Treasury Bond Fund | 6,139 | 676,456 | ||
| iShares iBoxx $ Investment Grade | ||||
| Corporate Bond Fund | 15,534 | 1,666,953 | ||
| iShares JPMorgan USD Emerging Markets | ||||
| Bond Fund | 2,912 | 303,722 | ||
| PowerShares Emerging Markets Sovereign | ||||
| Debt Portfolio | 4,861 | 127,844 | ||
| SPDR Barclays Capital 1-3 Month T-Bill ETF | 3,480 | 159,523 | ||
| SPDR Barclays Capital International | ||||
| Treasury Bond ETF | 5,017 | 276,688 | ||
| Vanguard Short-Term Bond ETF | 10,619 | 851,644 | ||
| Total Debt Funds | 5,675,669 | |||
| Equity Funds — 32.5% | ||||
| iShares MSCI Emerging Markets Index Fund | 49,470 | 2,080,214 | ||
| iShares Russell 2000 Index Fund | 87 | 6,227 | ||
| Vanguard Emerging Markets ETF | 32,313 | 1,359,085 | ||
| Total Equity Funds | 3,445,526 | |||
| Total Investments — 96.4% | ||||
| (Cost $9,657,873) | $ | 10,227,085 | ||
| Other Assets in Excess of Liabilities — 3.6%(a) | 387,334 | |||
| Net Assets — 100.0% | $ | 10,614,419 | ||
* Non-income producing securities.
(a) Other Assets in Excess of Liabilities includes net unrealized depreciation on swaps.
ETF — Exchange Traded Fund
Swap contract outstanding at April 30, 2010:
| Total Return Benchmark | Annual Financing Rate | Expiration Date | Notional Amount | Unrealized Depreciation | |||
| iShares Dow Jones Real Estate | (1.08)% | 07/06/2010 | $(1,001,825) | $(49,574) |
Cash held as collateral with broker for swap contracts was $242,605 at April 30, 2010.
Morgan Stanley acts as the counterparty to the total return swap contract listed above. The Fund either receives fees from, or pay fees to, the counterparty, depending upon the total return of the benchmark, and the agreed-upon financing rate.
Schedules of Investments — IQ CPI Inflation Hedged ETFApril 30, 2010
| Shares | Value | |||
| Investment Companies — 96.3% | ||||
| Asset Allocation Fund — 8.0% | ||||
| CurrencyShares Japanese Yen Trust* | 10,364 | $ | 1,093,920 | |
| Commodity Fund — 1.9% | ||||
| SPDR Gold Trust* | 2,302 | 265,605 | ||
| Debt Funds — 86.3% | ||||
| iShares Barclays Short Treasury Bond Fund | 85,856 | 9,460,473 | ||
| SPDR Barclays Capital 1-3 Month T-Bill ETF | 52,449 | 2,404,262 | ||
| Total Debt Funds | 11,864,735 | |||
| Equity Funds — 0.1% | ||||
| iShares MSCI Emerging Markets Index Fund | 81 | 3,406 | ||
| Vanguard Emerging Markets ETF | 67 | 2,818 | ||
| Total Equity Funds | 6,224 | |||
| Total Investments — 96.3% | ||||
| (Cost $13,239,414) | $ | 13,230,484 | ||
| Other Assets in Excess of Liabilities — 3.7% | 513,147 | |||
| Net Assets — 100.0% | $ | 13,743,631 | ||
* Non-income producing securities.
ETF — Exchange Traded Fund
See notes to financial statements.
23
Schedules of Investments — IQ ARB Global Resources ETF
April 30, 2010
| Shares | Value | |||
| Common Stocks — 90.5% | ||||
| Australia — 7.5% | ||||
| Aquila Resources Ltd.* | 5,985 | $ | 57,216 | |
| BHP Billiton Ltd. | 1,142 | 43,318 | ||
| Coal & Allied Industries Ltd. | 1,608 | 145,939 | ||
| Lihir Gold Ltd. | 18,096 | 64,178 | ||
| Macarthur Coal Ltd. | 4,723 | 68,012 | ||
| New Hope Corp. Ltd. | 15,362 | 70,498 | ||
| Newcrest Mining Ltd. | 3,651 | 112,458 | ||
| Whitehaven Coal Ltd. | 9,165 | 45,386 | ||
| Woodside Petroleum Ltd. | 321 | 13,565 | ||
| Total Australia | 620,570 | |||
| Canada — 16.7% | ||||
| Agnico-Eagle Mines Ltd. | 1,198 | 76,208 | ||
| Barrick Gold Corp. | 6,907 | 302,098 | ||
| Canadian Natural Resources Ltd. | 223 | 17,224 | ||
| Canfor Corp.* | 5,392 | 55,472 | ||
| Centerra Gold, Inc.* | 1,916 | 21,584 | ||
| Eldorado Gold Corp.* | 3,355 | 51,674 | ||
| Goldcorp, Inc. | 5,149 | 223,224 | ||
| IAMGOLD Corp. | 2,995 | 53,758 | ||
| Imperial Oil Ltd. | 349 | 14,696 | ||
| Kinross Gold Corp. | 5,504 | 105,423 | ||
| Pan American Silver Corp.* | 839 | 22,341 | ||
| Red Back Mining, Inc.* | 1,628 | 42,884 | ||
| Silver Wheaton Corp.* | 2,756 | 54,312 | ||
| Sino-Forest Corp.* | 9,118 | 162,582 | ||
| Suncor Energy, Inc. | 950 | 32,594 | ||
| Teck Resources Ltd. Class B* | 198 | 7,804 | ||
| West Fraser Timber Co. Ltd. | 1,507 | 65,467 | ||
| Yamana Gold, Inc. | 6,009 | 65,794 | ||
| Total Canada | 1,375,139 | |||
| Finland — 3.9% | ||||
| M-real Oyj Class B* | 10,990 | 38,286 | ||
| UPM-Kymmene Oyj | 19,582 | 282,764 | ||
| Total Finland | 321,050 | |||
| France — 3.0% | ||||
| GDF Suez | 966 | 34,416 | ||
| Suez Environnement Co. | 2,993 | 64,908 | ||
| Total SA | 974 | 53,059 | ||
| Veolia Environnement | 3,036 | 95,854 | ||
| Total France | 248,237 | |||
| Germany — 0.2% | ||||
| Suedzucker AG | 865 | 17,523 | ||
| Hong Kong — 2.7% | ||||
| Chaoda Modern Agriculture Holdings Ltd. | 12,000 | 13,957 | ||
| China Agri-Industries Holdings Ltd. | 13,000 | 17,347 | ||
| CNOOC Ltd. | 21,803 | 38,866 | ||
| Lee & Man Paper Manufacturing Ltd. | 171,000 | 152,191 | ||
| Total Hong Kong | 222,361 | |||
| Ireland — 0.3% | ||||
| Kerry Group PLC Class A | 786 | 25,198 | ||
| Italy — 0.5% | ||||
| Eni SpA | 1,878 | 42,101 | ||
| Japan — 4.1% | ||||
| Ajinomoto Co., Inc. | 4,552 | 42,852 | ||
| Daio Paper Corp. | 5,000 | 41,325 | ||
| Hokuetsu Kishu Paper Co., Ltd. | 8,000 | 40,506 | ||
| Nippon Meat Packers, Inc. | 2,312 | 29,266 | ||
| Nippon Paper Group, Inc. | 4,390 | 123,514 | ||
| Nisshin Seifun Group, Inc. | 2,000 | 24,678 | ||
| Nissin Foods Holdings Co., Ltd. | 800 | 26,848 | ||
| Yamazaki Baking Co., Ltd. | 1,000 | 12,807 | ||
| Total Japan | 341,796 | |||
| Netherlands — 1.7% | ||||
| New World Resources NV Class A | 4,909 | 70,255 | ||
| Nutreco Holding NV | 377 | 23,618 | ||
| Schlumberger Ltd.* | 673 | 48,066 | ||
| Total Netherlands | 141,939 | |||
| Norway — 0.4% | ||||
| Statoil ASA | 1,452 | 35,187 | ||
| Portugal — 0.7% | ||||
| Portucel-Empresa Produtora de Pasta y | ||||
| Papel SA | 20,232 | 54,206 | ||
| Singapore — 2.5% | ||||
| Golden Agri-Resources Ltd.* | 49,000 | 21,095 | ||
| Olam International Ltd. | 10,000 | 19,191 | ||
| Straits Asia Resources Ltd. | 26,161 | 39,133 | ||
| Wilmar International Ltd. | 25,003 | 127,163 | ||
| Total Singapore | 206,582 | |||
| Spain — 0.6% | ||||
| Ebro Puleva SA | 1,193 | 22,208 | ||
| Sociedad General de Aguas de | ||||
| Barcelona SA Class A | 1,111 | 29,426 | ||
| Total Spain | 51,634 | |||
| Sweden — 4.6% | ||||
| Holmen AB B Shares* | 2,340 | 59,399 | ||
| Sandvik AB* | 22,030 | 319,117 | ||
| Total Sweden | 378,516 | |||
| Switzerland — 0.7% | ||||
| Aryzta AG | 484 | 18,543 | ||
| Sulzer AG | 270 | 26,975 | ||
| Transocean Ltd.* | 178 | 12,896 | ||
| Total Switzerland | 58,414 | |||
| United Kingdom — 6.0% | ||||
| Anglo American PLC* | 448 | 19,238 | ||
| Associated British Foods PLC | 3,686 | 56,758 | ||
| BG Group PLC | 1,685 | 28,706 | ||
| BP PLC | 8,190 | 72,145 | ||
| Pennon Group PLC | 3,109 | 24,746 | ||
| Petropavlovsk PLC | 1,449 | 26,061 | ||
| Randgold Resources Ltd. | 652 | 55,737 | ||
| Rio Tinto PLC | 724 | 37,446 | ||
| Royal Dutch Shell PLC Class A | 1,642 | 51,460 | ||
| Severn Trent PLC | 1,826 | 32,394 | ||
| United Utilities Group PLC | 5,023 | 41,287 | ||
See notes to financial statements.
24
Schedules of Investments — IQ ARB Global Resources ETF (continued)
April 30, 2010
| Shares | Value | |||||
| Common Stocks (continued) | ||||||
| United Kingdom (continued) | ||||||
| Weir Group PLC | 1,132 | $ | 17,154 | |||
| Xstrata PLC* | 1,636 | 27,208 | ||||
| Total United Kingdom | 490,340 | |||||
| United States — 34.4% | ||||||
| Alpha Natural Resources, Inc.* | 2,247 | 105,789 | ||||
| American Water Works Co., Inc. | 1,435 | 31,254 | ||||
| Anadarko Petroleum Corp. | 389 | 24,180 | ||||
| Apache Corp. | 138 | 14,043 | ||||
| Aqua America, Inc. | 736 | 13,491 | ||||
| Arch Coal, Inc. | 3,017 | 81,459 | ||||
| Archer-Daniels-Midland Co. | 2,662 | 74,376 | ||||
| Bucyrus International, Inc. Class A | 1,503 | 94,704 | ||||
| Bunge Ltd. | 583 | 30,870 | ||||
| Chevron Corp. | 902 | 73,459 | ||||
| ConAgra Foods, Inc. | 1,983 | 48,524 | ||||
| ConocoPhillips | 806 | 47,707 | ||||
| CONSOL Energy, Inc. | 4,221 | 188,594 | ||||
| Deltic Timber Corp. | 471 | 24,784 | ||||
| Domtar Corp. | 1,585 | 112,281 | ||||
| Exxon Mobil Corp. | 2,086 | 141,535 | ||||
| Flowserve Corp. | 355 | 40,676 | ||||
| General Mills, Inc. | 1,356 | 96,520 | ||||
| Green Mountain Coffee Roasters, Inc.* | 167 | 12,134 | ||||
| Hershey Co. | 835 | 39,253 | ||||
| Hormel Foods Corp. | 1,385 | 56,453 | ||||
| IDEX Corp. | 733 | 24,629 | ||||
| ITT Corp. | 986 | 54,792 | ||||
| J.M. Smucker Co. | 555 | 33,894 | ||||
| Joy Global, Inc. | 1,911 | 108,564 | ||||
| Kellogg Co. | 1,626 | 89,332 | ||||
| Kraft Foods, Inc. Class A | 6,596 | 195,242 | ||||
| Massey Energy Co. | 2,062 | 75,531 | ||||
| McCormick & Co., Inc. | 457 | 18,084 | ||||
| MeadWestvaco Corp. | 6,455 | 175,382 | ||||
| Newmont Mining Corp. | 3,683 | 206,543 | ||||
| Occidental Petroleum Corp. | 371 | 32,893 | ||||
| Peabody Energy Corp. | 4,992 | 233,226 | ||||
| Pentair, Inc. | 718 | 25,963 | ||||
| Ralcorp Holdings, Inc.* | 208 | 13,842 | ||||
| Royal Gold, Inc. | 296 | 15,149 | ||||
| Sara Lee Corp. | 3,096 | 44,025 | ||||
| Seaboard Corp* | 14 | 20,440 | ||||
| Smithfield Foods, Inc.* | 1,596 | 29,909 | ||||
| Tyson Foods, Inc. Class A | 2,933 | 57,457 | ||||
| Universal Forest Products, Inc. | 730 | 30,697 | ||||
| Total United States | 2,837,680 | |||||
| Total Investments — 90.5% | ||||||
| (Cost $6,985,774) | $ | 7,468,473 | ||||
| Other Assets in Excess of Liabilities — 9.5%(a) | 780,555 | |||||
| Net Assets — 100.0% | $ | 8,249,028 | ||||
| Industry | Value | % of Net Assets | ||||
| Coal | $ | 1,703,423 | 20.7 | % | ||
| Precious Metals | 1,499,426 | 18.2 | ||||
| Timber | 1,418,856 | 17.2 | ||||
| Grains, Food & Fiber | 1,142,264 | 13.9 | ||||
| Energy | 828,798 | 10.0 | ||||
| Water | 523,549 | 6.3 | ||||
| Livestock | 217,143 | 2.6 | ||||
| Industrial Metals | 135,014 | 1.6 | ||||
| Total Investments | $ | 7,468,473 | 90.5 | % | ||
| Other Assets in Excess of Liabilities(a) | 780,555 | 9.5 | ||||
| Net Assets | $ | 8,249,028 | 100.0 | % | ||
* Non-income producing securities.
(a) Other Assets in Excess of Liabilities includes net unrealized depreciation on futures contracts.
Open futures contracts outstanding at April 30, 2010:
| Type | Broker | Expiration Date | Number of Contracts | Value at Trade Date | Value at April 30, 2010 | Unrealized Appreciation (Depreciation) | ||||||||||||
| E-Mini MSCI EAFE Index Future | Morgan Stanley | June 2010 | (10 | ) | $ | (785,792 | ) | $ | (762,750 | ) | $ | 23,042 | ||||||
| S&P 500 E-Mini Future | Morgan Stanley | June 2010 | (13 | ) | (742,568 | ) | (769,210 | ) | (26,642 | ) | ||||||||
| $ | (3,600 | ) | ||||||||||||||||
Cash held as collateral with broker for futures contracts was $144,939 at April 30, 2010.
See notes to financial statements.
25
Schedules of Investments — IQ ARB Merger Arbitrage ETF
April 30, 2010
| Shares | Value | |||
| Common Stocks — 61.6% | ||||
| Consumer Discretionary — 1.4% | ||||
| CKE Restaurants, Inc. | 20,863 | $ | 257,450 | |
| Lions Gate Entertainment Corp.* | 13,513 | 93,510 | ||
| RCN Corp.* | 5,590 | 82,061 | ||
| Total Consumer Discretionary | 433,021 | |||
| Consumer Services — 2.1% | ||||
| Bowne & Co., Inc. | 7,149 | 79,926 | ||
| Brink’s Home Security Holdings, Inc.* | 13,614 | 570,971 | ||
| Total Consumer Services | 650,897 | |||
| Energy — 29.4% | ||||
| Arrow Energy Ltd.* | 89,141 | 428,991 | ||
| Smith International, Inc. | 98,124 | 4,686,402 | ||
| XTO Energy, Inc. | 88,093 | 4,186,179 | ||
| Total Energy | 9,301,572 | |||
| Financials — 0.3% | ||||
| Riskmetrics Group, Inc.* | 4,790 | 107,488 | ||
| Industrials — 1.4% | ||||
| Arriva PLC | 15,928 | 186,508 | ||
| VT Group PLC | 22,948 | 262,738 | ||
| Total Industrials | 449,246 | |||
| Information Technology — 1.9% | ||||
| Switch & Data Facilities Co., Inc.* | 31,284 | 600,340 | ||
| Materials — 8.4% | ||||
| Airgas, Inc. | 35,368 | 2,244,100 | ||
| FNX Mining Co., Inc.* | 32,064 | 422,940 | ||
| Total Materials | 2,667,040 | |||
| Pharmaceuticals, Biotechnology & | ||||
| Life Sciences — 10.6% | ||||
| Millipore Corp.* | 20,538 | 2,180,109 | ||
| OSI Pharmaceuticals, Inc.* | 19,665 | 1,153,745 | ||
| Total Pharmaceuticals, Biotechnology & | ||||
| Life Sciences | 3,333,854 | |||
| Software & Services — 1.7% | ||||
| Novell, Inc.* | 97,543 | 547,216 | ||
| Utilities — 4.4% | ||||
| Allegheny Energy, Inc. | 63,186 | 1,376,191 | ||
| Total Investments — 61.6% | ||||
| (Cost $19,208,937) | $ | 19,466,865 | ||
| Other Assets in Excess of | ||||
| Liabilities — 38.4%(a) | 12,135,439 | |||
| Net Assets — 100.0% | $ | 31,602,304 | ||
* Non-income producing securities.
(a) Other Assets in Excess of Liabilities includes net unrealized appreciation on futures contracts.
Open futures contracts outstanding at April 30, 2010:
| Type | Broker | Expiration Date | Number of Contracts | Value at Trade Date | Value at April 30, 2010 | Unrealized Appreciation (Depreciation) | ||||||||||||
| E-Mini MSCI EAFE Index Future | Morgan Stanley | June 2010 | (38 | ) | $ | (3,003,420 | ) | $ | (2,898,450 | ) | $ | 104,970 | ||||||
| S&P 500 E-Mini Future | Morgan Stanley | June 2010 | (48 | ) | (2,806,215 | ) | (2,840,160 | ) | (33,945 | ) | ||||||||
| $ | 71,025 | |||||||||||||||||
Cash held as collateral with broker for futures contracts was $520,000 at April 30, 2010.
See notes to financial statements.
26
Schedules of Investments — IQ Australia Small Cap ETF
April 30, 2010
| Shares | Value | |||
| Common Stocks — 99.8% | ||||
| Banks — 5.7% | ||||
| Bank of Queensland Ltd. | 19,064 | $ | 224,484 | |
| Bendigo and Adelaide Bank Ltd. | 31,668 | 291,244 | ||
| Total Banks | 515,728 | |||
| Capital Goods — 11.4% | ||||
| Austal Ltd. | 10,796 | 23,817 | ||
| Boart Longyear Group* | 417,182 | 128,150 | ||
| Bradken Ltd. | 11,483 | 78,350 | ||
| Clough Ltd. | 28,499 | 24,141 | ||
| Crane Group Ltd. | 6,979 | 58,728 | ||
| CSR Ltd. | 140,037 | 228,119 | ||
| Emeco Holdings Ltd. | 56,601 | 36,354 | ||
| GWA International Ltd. | 26,965 | 80,070 | ||
| Monadelphous Group Ltd. | 7,171 | 102,997 | ||
| Seven Group Holdings Ltd. | 8,139 | 56,443 | ||
| UGL Ltd. | 14,808 | 203,590 | ||
| Total Capital Goods | 1,020,759 | |||
| Commercial & Professional Services — 8.8% | ||||
| Cabcharge Australia Ltd. | 9,971 | 55,689 | ||
| Corporate Express Australia Ltd. | 6,195 | 32,120 | ||
| Downer EDI Ltd. | 29,945 | 195,120 | ||
| Mineral Resources Ltd. | 6,270 | 48,501 | ||
| SAI Global Ltd. | 13,918 | 55,709 | ||
| Seek Ltd. | 29,535 | 230,663 | ||
| Spotless Group Ltd. | 22,039 | 58,057 | ||
| Transfield Services Ltd. | 32,034 | 118,679 | ||
| Total Commercial & Professional Services | 794,538 | |||
| Consumer Durables & Apparel — 2.7% | ||||
| Billabong International Ltd. | 18,798 | 200,003 | ||
| G.U.D Holdings Ltd. | 5,235 | 44,101 | ||
| Total Consumer Durables & Apparel | 244,104 | |||
| Consumer Services — 4.3% | ||||
| Aristocrat Leisure Ltd. | 38,944 | 155,517 | ||
| Flight Centre Ltd. | 4,991 | 92,220 | ||
| Invocare Ltd. | 9,174 | 53,714 | ||
| Navitas Ltd. | 17,280 | 83,643 | ||
| Total Consumer Services | 385,094 | |||
| Diversified Financials — 2.9% | ||||
| Challenger Financial Services Group Ltd. | 42,172 | 163,304 | ||
| IOOF Holdings Ltd. | 16,313 | 100,221 | ||
| Total Diversified Financials | 263,525 | |||
| Energy — 9.9% | ||||
| Aquila Resources Ltd.* | 13,087 | 125,109 | ||
| AWE Ltd.* | 48,428 | 111,346 | ||
| Beach Energy Ltd. | 97,793 | 71,459 | ||
| Centennial Coal Co., Ltd. | 35,504 | 142,110 | ||
| Eastern Star Gas Ltd.* | 55,316 | 47,114 | ||
| Extract Resources Ltd.* | 8,257 | 56,108 | ||
| Gloucester Coal Ltd.* | 4,003 | 45,273 | ||
| Karoon Gas Australia Ltd.* | 12,534 | 87,505 | ||
| Linc Energy Ltd.* | 21,443 | 30,839 | ||
| Riversdale Mining Ltd.* | 10,874 | 93,123 | ||
| Whitehaven Coal Ltd. | 15,150 | 75,025 | ||
| Total Energy | 885,011 | |||
| Food, Beverage & Tobacco — 2.7% | ||||
| Goodman Fielder Ltd. | 119,851 | 162,882 | ||
| GrainCorp Ltd. | 15,482 | 83,154 | ||
| Total Food, Beverage & Tobacco | 246,036 | |||
| Health Care Equipment & Services — 6.8% | ||||
| Ansell Ltd. | 12,254 | 146,347 | ||
| Healthscope Ltd. | 28,427 | 115,636 | ||
| iSOFT Group Ltd. | 57,910 | 29,379 | ||
| Primary Health Care Ltd. | 37,762 | 143,064 | ||
| Ramsay Health Care Ltd. | 10,296 | 130,055 | ||
| Sigma Pharmaceuticals Ltd. | 103,077 | 43,177 | ||
| Total Health Care Equipment & Services | 607,658 | |||
| Insurance — 1.2% | ||||
| NIB Holdings Ltd. | 46,873 | 55,194 | ||
| Tower Australia Group Ltd. | 22,765 | 55,520 | ||
| Total Insurance | 110,714 | |||
| Materials — 23.2% | ||||
| Adelaide Brighton Ltd. | 42,195 | 115,082 | ||
| Andean Resources Ltd.* | 33,059 | 98,473 | ||
| Aquarius Platinum Ltd. | 41,794 | 276,607 | ||
| Atlas Iron Ltd.* | 32,758 | 76,842 | ||
| Coal of Africa Ltd.* | 26,399 | 57,993 | ||
| CuDeco Ltd.* | 11,209 | 46,952 | ||
| Gindalbie Metals Ltd.* | 37,037 | 40,682 | ||
| Gunns Ltd. | 75,854 | 37,070 | ||
| Iluka Resources Ltd.* | 37,855 | 163,854 | ||
| Independence Group NL | 10,156 | 43,865 | ||
| Kagara Ltd.* | 46,940 | 32,989 | ||
| Kingsgate Consolidated Ltd. | 8,154 | 65,199 | ||
| Lynas Corp., Ltd.* | 146,201 | 73,489 | ||
| Macarthur Coal Ltd. | 11,437 | 164,696 | ||
| Medusa Mining Ltd.* | 11,724 | 51,511 | ||
| Minara Resources Ltd.* | 31,033 | 25,421 | ||
| Mincor Resources NL | 17,411 | 30,955 | ||
| Mineral Deposits Ltd.* | 50,998 | 45,573 | ||
| Mirabela Nickel Ltd.* | 30,891 | 69,012 | ||
| Mount Gibson Iron Ltd.* | 58,009 | 92,336 | ||
| Murchison Metals Ltd.* | 30,284 | 64,837 | ||
| Nufarm Ltd. | 16,146 | 114,825 | ||
| OM Holdings Ltd. | 25,678 | 47,685 | ||
| PanAust Ltd.* | 212,495 | 101,867 | ||
| Panoramic Resources Ltd. | 17,215 | 40,222 | ||
| St. Barbara Ltd.* | 176,203 | 45,105 | ||
| Western Areas NL | 12,883 | 57,922 | ||
| Total Materials | 2,081,064 | |||
| Media — 5.4% | ||||
| APN News & Media Ltd. | 36,665 | 83,618 | ||
| Austar United Communications Ltd.* | 52,615 | 57,303 | ||
| Austereo Group Ltd. | 15,353 | 24,438 | ||
| Consolidated Media Holdings Ltd. | 23,617 | 69,249 | ||
| Ten Network Holdings Ltd.* | 82,995 | 139,833 | ||
| West Australian Newspapers Holdings Ltd. | 14,460 | 106,335 | ||
| Total Media | 480,776 | |||
See notes to financial statements.
27
Schedules of Investments — IQ Australia Small Cap ETF (continued)
April 30, 2010
| Shares | Value | |||
| Common Stocks (continued) | ||||
| Pharmaceuticals, Biotechnology & | ||||
| Life Sciences — 0.8% | ||||
| Biota Holdings Ltd.* | 15,983 | $ | 20,085 | |
| Pharmaxis Ltd.* | 19,723 | 56,363 | ||
| Total Pharmaceuticals, Biotechnology & | ||||
| Life Sciences | 76,448 | |||
| Real Estate — 0.6% | ||||
| Cromwell Group | 73,124 | 50,370 | ||
| Retailing — 7.7% | ||||
| David Jones Ltd. | 45,284 | 197,696 | ||
| JB Hi-Fi Ltd. | 9,772 | 176,831 | ||
| Myer Holdings Ltd. | 52,601 | 159,132 | ||
| Pacific Brands Ltd.* | 84,262 | 93,730 | ||
| Wotif.com Holdings Ltd. | 10,350 | 62,719 | ||
| Total Retailing | 690,108 | |||
| Semiconductors & Semiconductor | ||||
| Equipment — 0.6% | ||||
| Silex Systems Ltd.* | 10,063 | 55,734 | ||
| Software & Services — 1.3% | ||||
| carsales.com.au Ltd. | 8,999 | 45,067 | ||
| Iress Market Technology Ltd. | 9,022 | 71,468 | ||
| Total Software & Services | 116,535 | |||
| Telecommunication Services — 0.6% | ||||
| TPG Telecom Ltd. | 25,097 | 52,330 | ||
| Transportation — 1.4% | ||||
| Mermaid Marine Australia Ltd. | 15,586 | 40,768 | ||
| Virgin Blue Holdings Ltd.* | 148,902 | 82,470 | ||
| Total Transportation | 123,238 | |||
| Utilities — 1.8% | ||||
| Energy World Corp., Ltd.* | 75,468 | 36,178 | ||
| Envestra Ltd. | 62,061 | 30,040 | ||
| Spark Infrastructure Group | 83,293 | 93,815 | ||
| Total Utilities | 160,033 | |||
| Total Common Stocks — 99.8% | ||||
| (Cost $8,947,344) | 8,959,803 | |||
| Rights — 0.1% | ||||
| Materials — 0.1% | ||||
| Nufarm Ltd. | ||||
| (Cost $0) | 3,082 | 5,422 | ||
| Total Investments — 99.9% | ||||
| (Cost $8,947,344) | $ | 8,965,225 | ||
| Other Assets in Excess of Liabilities — 0.1% | 7,601 | |||
| Net Assets — 100.0% | $ | 8,972,826 | ||
| * | Non-income producing securities. |
See notes to financial statements.
28
Schedules of Investments — IQ Canada Small Cap ETF
April 30, 2010
| Shares | Value | |||
| Common Stocks — 99.8% | ||||
| Banks — 1.3% | ||||
| Canadian Western Bank | 5,061 | $ | 119,873 | |
| Capital Goods — 4.0% | ||||
| Aecon Group, Inc. | 4,228 | 52,806 | ||
| ATS Automation Tooling Systems, Inc.* | 5,362 | 37,111 | ||
| CAE, Inc. | 19,677 | 180,674 | ||
| Russel Metals, Inc. | 4,585 | 96,512 | ||
| Total Capital Goods | 367,103 | |||
| Commercial & Professional Services — 1.4% | ||||
| IESI-BFC Ltd. | 6,321 | 124,442 | ||
| Consumer Durables & Apparel — 2.6% | ||||
| Gildan Activewear, Inc.* | 7,987 | 232,470 | ||
| Consumer Services — 0.4% | ||||
| Great Canadian Gaming Corp.* | 4,746 | 35,143 | ||
| Diversified Financials — 5.7% | ||||
| AGF Management Ltd. Class B | 5,614 | 96,389 | ||
| Canaccord Financial, Inc. | 3,486 | 36,139 | ||
| Dundee Corp. Class A* | 5,229 | 72,277 | ||
| DundeeWealth, Inc. | 3,584 | 52,441 | ||
| GMP Capital, Inc. | 4,760 | 57,570 | ||
| Onex Corp. | 7,105 | 206,447 | ||
| Total Diversified Financials | 521,263 | |||
| Energy — 19.9% | ||||
| AltaGas Income Trust | 2,961 | 50,634 | ||
| Bankers Petroleum Ltd.* | 17,668 | 156,297 | ||
| Birchcliff Energy Ltd.* | 9,520 | 84,875 | ||
| BlackPearl Resources, Inc.* | 17,703 | 55,756 | ||
| Connacher Oil and Gas Ltd.* | 32,809 | 56,687 | ||
| Crew Energy, Inc.* | 6,027 | 108,597 | ||
| Denison Mines Corp.* | 26,075 | 41,706 | ||
| Ensign Energy Services, Inc. | 9,646 | 130,759 | ||
| Flint Energy Services Ltd.* | 2,653 | 35,125 | ||
| Galleon Energy, Inc. Class A* | 5,418 | 37,712 | ||
| Gran Tierra Energy, Inc.* | 16,590 | 100,898 | ||
| Ivanhoe Energy, Inc.* | 19,957 | 62,855 | ||
| Legacy Oil + Gas, Inc. Class A* | 5,691 | 73,494 | ||
| Nuvista Energy Ltd. | 6,783 | 81,770 | ||
| OPTI Canada, Inc.* | 21,623 | 48,888 | ||
| Paramount Resources Ltd. Class A* | 2,219 | 38,449 | ||
| Peyto Energy Trust | 4,326 | 56,592 | ||
| Progress Energy Resources Corp. | 14,208 | 170,718 | ||
| Questerre Energy Corp. Class A* | 14,084 | 47,556 | ||
| Savanna Energy Services Corp. | 6,069 | 39,128 | ||
| Trican Well Service Ltd. | 9,646 | 122,855 | ||
| Uranium One, Inc.* | 45,087 | 114,404 | ||
| UTS Energy Corp.* | 36,421 | 94,932 | ||
| Total Energy | 1,810,687 | |||
| Food & Staples Retailing — 0.9% | ||||
| Jean Coutu Group, Inc. Class A | 9,072 | 81,060 | ||
| Food, Beverage & Tobacco — 0.6% | ||||
| Cott Corp.* | 6,244 | 52,401 | ||
| Insurance — 2.4% | ||||
| Industrial Alliance Insurance and | ||||
| Financial Services, Inc. | 6,405 | 221,584 | ||
| Materials — 49.0% | ||||
| Alamos Gold, Inc. | 8,407 | 125,252 | ||
| Aura Minerals, Inc.* | 7,343 | 28,564 | ||
| Aurizon Mines Ltd.* | 12,208 | 69,788 | ||
| Canfor Corp.* | 6,454 | 66,397 | ||
| Capstone Mining Corp.* | 15,127 | 43,610 | ||
| Cascades, Inc. | 5,075 | 39,684 | ||
| Centerra Gold, Inc.* | 12,082 | 136,107 | ||
| Consolidated Thompson Iron Mines Ltd.* | 14,140 | 120,620 | ||
| Corriente Resources, Inc. Class A* | 5,208 | 43,089 | ||
| Detour Gold Corp.* | 5,327 | 111,394 | ||
| Eastern Platinum Ltd.* | 52,290 | 74,342 | ||
| Equinox Minerals Ltd.* | 45,619 | 181,062 | ||
| European Goldfields Ltd.* | 9,765 | 71,634 | ||
| Exeter Resource Corp.* | 4,795 | 36,974 | ||
| FNX Mining Co., Inc.* | 7,833 | 103,321 | ||
| Fronteer Gold, Inc.* | 9,191 | 56,715 | ||
| Gabriel Resources Ltd.* | 15,617 | 64,605 | ||
| Gammon Gold, Inc.* | 10,542 | 78,686 | ||
| Gold Wheaton Gold Corp.* | 8,218 | 21,745 | ||
| Golden Star Resources Ltd.* | 19,754 | 89,911 | ||
| Grande Cache Coal Corp.* | 7,406 | 48,844 | ||
| Great Basin Gold Ltd.* | 25,928 | 49,406 | ||
| Hanfeng Evergreen, Inc.* | 2,800 | 20,070 | ||
| Harry Winston Diamond Corp.* | 4,704 | 51,877 | ||
| HudBay Minerals, Inc.* | 10,514 | 134,118 | ||
| Inmet Mining Corp. | 3,829 | 199,342 | ||
| Jaguar Mining, Inc.* | 6,447 | 72,054 | ||
| Jinshan Gold Mines, Inc.* | 7,595 | 41,917 | ||
| Lake Shore Gold Corp.* | 15,729 | 50,160 | ||
| Lundin Mining Corp.* | 39,599 | 187,273 | ||
| Mercator Minerals Ltd.* | 14,952 | 33,510 | ||
| Methanex Corp. | 7,070 | 164,945 | ||
| Minefinders Corp., Ltd.* | 5,047 | 50,776 | ||
| Neo Material Technologies, Inc.* | 7,280 | 29,038 | ||
| New Gold, Inc.* | 29,855 | 175,384 | ||
| North American Palladium Ltd.* | 6,160 | 28,828 | ||
| Northern Dynasty Minerals Ltd.* | 5,726 | 54,442 | ||
| Northgate Minerals Corp.* | 22,316 | 72,709 | ||
| NovaGold Resources, Inc.* | 12,166 | 107,985 | ||
| Osisko Mining Corp.* | 18,340 | 194,654 | ||
| Pan American Silver Corp. | 8,204 | 218,455 | ||
| Quadra Mining Ltd.* | 7,637 | 116,269 | ||
| Rubicon Minerals Corp.* | 12,439 | 50,107 | ||
| SEMAFO, Inc.* | 19,264 | 123,247 | ||
| Sherritt International Corp. | 22,568 | 176,025 | ||
| Silvercorp Metals, Inc. | 12,621 | 103,799 | ||
| Taseko Mines Ltd.* | 14,126 | 80,473 | ||
| Thompson Creek Metals Co., Inc.* | 10,710 | 137,569 | ||
| Ventana Gold Corp.* | 4,844 | 47,347 | ||
| Western Coal Corp.* | 14,154 | 81,890 | ||
| Total Materials | 4,466,013 | |||
| Media — 1.2% | ||||
| Corus Entertainment, Inc. Class B | 5,194 | 104,870 | ||
See notes to financial statements.
29
Schedules of Investments — IQ Canada Small Cap ETF (continued)
April 30, 2010
| Shares | Value | |||
| Common Stocks (continued) | ||||
| Pharmaceuticals, Biotechnology & | ||||
| Life Sciences — 3.0% | ||||
| Biovail Corp. | 12,152 | $ | 206,723 | |
| MDS, Inc.* | 7,469 | 66,958 | ||
| Total Pharmaceuticals, Biotechnology & | ||||
| Life Sciences | 273,681 | |||
| Retailing — 2.6% | ||||
| Dollarama, Inc.* | 2,569 | 63,359 | ||
| RONA, Inc.* | 9,954 | 170,511 | ||
| Total Retailing | 233,870 | |||
| Software & Services — 2.0% | ||||
| Open Text Corp.* | 4,333 | 184,083 | ||
| Technology Hardware & Equipment — 0.2% | ||||
| DragonWave, Inc.* | 2,359 | 20,146 | ||
| Telecommunication Services — 0.6% | ||||
| Manitoba Telecom Services, Inc. | 1,638 | 52,560 | ||
| Transportation — 1.6% | ||||
| WestJet Airlines Ltd.* | 11,095 | 149,854 | ||
| Utilities — 0.4% | ||||
| Capital Power Corp. | 1,666 | 36,993 | ||
| Total Investments — 99.8% | ||||
| (Cost $8,964,395) | $ | 9,088,096 | ||
| Other Assets in Excess of Liabilities — 0.2% | 18,641 | |||
| Net Assets — 100.0% | $ | 9,106,737 | ||
| * | Non-income producing securities. |
Schedules of Investments — IQ South Korea Small Cap ETF
April 30, 2010
| Shares | Value | |||
| Common Stocks — 99.9% | ||||
| Automobiles & Components — 4.4% | ||||
| Global & Yuasa Battery Co., Ltd. | 800 | $ | 20,571 | |
| Kumho Tire Co., Inc.* | 2,918 | 9,531 | ||
| Nexen Tire Corp. | 3,540 | 17,694 | ||
| S&T Dynamics Co., Ltd. | 2,360 | 33,856 | ||
| Ssangyong Motor Co.* | 640 | 7,131 | ||
| Sungwoo Hitech Co., Ltd. | 1,676 | 22,758 | ||
| Total Automobiles & Components | 111,541 | |||
| Banks — 1.2% | ||||
| Jeonbuk Bank | 4,920 | 30,541 | ||
| Capital Goods — 18.5% | ||||
| BHI Co., Ltd. | 404 | 9,514 | ||
| Dongkuk Structures & Construction Co., Ltd. . | 2,332 | 20,577 | ||
| Doosan Engineering & Construction Co., Ltd. | 3,928 | 19,421 | ||
| Hanjin Heavy Industries & Construction | ||||
| Holdings Co., Ltd. | 1,470 | 17,043 | ||
| HNK Machine Tool Co., Ltd. | 500 | 14,300 | ||
| Hyunjin Materials Co., Ltd. | 1,066 | 22,891 | ||
| Iljin Electric Co., Ltd. | 1,740 | 15,558 | ||
| Kumho Industrial Co., Ltd.* | 3,378 | 12,877 | ||
| Namkwang Engineering & Construction | ||||
| Co., Ltd.* | 1,600 | 8,084 | ||
| NEPES Corp. | 1,504 | 25,782 | ||
| NK Co., Ltd. | 840 | 8,526 | ||
| Pyeong San Co., Ltd.* | 708 | 9,646 | ||
| RNL Bio Co., Ltd.* | 7,720 | 29,812 | ||
| Sewon Cellontech Co., Ltd. | 2,300 | 11,683 | ||
| STX Corp.* | 3,236 | 56,057 | ||
| STX Engine Co., Ltd. | 2,134 | 43,225 | ||
| STX Metal Co., Ltd. | 920 | 10,791 | ||
| Sung Kwang Bend Co., Ltd. | 1,596 | 34,128 | ||
| Taeyoung Engineering & Construction | 5,610 | 24,473 | ||
| TK Corp.* | 1,610 | 40,019 | ||
| Unison Co., Ltd.* | 1,268 | 14,587 | ||
| Wooree ETI Co., Ltd. | 2,758 | 22,420 | ||
| Total Capital Goods | 471,414 | |||
| Consumer Durables & Apparel — 3.8% | ||||
| Hansae Co., Ltd. | 1,380 | 8,616 | ||
| LG Fashion Corp. | 2,024 | 48,119 | ||
| Samchuly Bicycle Co., Ltd. | 922 | 11,729 | ||
| Youngone Corp. | 3,300 | 28,106 | ||
| Total Consumer Durables & Apparel | 96,570 | |||
| Consumer Services — 3.4% | ||||
| Hotel Shilla Co., Ltd. | 3,488 | 70,650 | ||
| Paradise Co., Ltd. | 5,706 | 16,732 | ||
| Total Consumer Services | 87,382 | |||
| Diversified Financials — 13.4% | ||||
| Aju Capital Co., Ltd. | 3,780 | 16,592 | ||
| Daishin Securities Co., Ltd. | 4,550 | 61,373 | ||
| Dongbu Securities Co., Ltd. | 2,560 | 13,882 | ||
| Eugene Investment & Securities Co., Ltd.* | 50,160 | 37,110 | ||
| Hanwha Securities Co., Ltd. | 5,564 | 36,546 | ||
| HMC Investment Securities Co., Ltd.* | 1,660 | 30,254 | ||
| KTB Securities Co., Ltd.* | 6,160 | 20,897 | ||
| Kumho Investment Bank | 15,300 | 14,909 | ||
| Kyobo Securities Co., Ltd. | 1,780 | 15,948 | ||
| Meritz Securities Co., Ltd. | 23,120 | 23,154 | ||
| NH Investment & Securities Co., Ltd. | 2,630 | 24,441 | ||
| SK Securities Co., Ltd. | 21,150 | 46,084 | ||
| Total Diversified Financials | 341,190 | |||
See notes to financial statements.
30
Schedules of Investments — IQ South Korea Small Cap ETF (continued)
April 30, 2010
| Shares | Value | |||
| Common Stocks (continued) | ||||
| Food, Beverage & Tobacco — 1.2% | ||||
| Daesang Corp.* | 2,020 | $ | 14,398 | |
| Halim Co., Ltd.* | 5,070 | 15,507 | ||
| Total Food, Beverage & Tobacco | 29,905 | |||
| Health Care Equipment & Services — 2.4% | ||||
| Chabio & Diostech Co., Ltd.* | 4,660 | 41,372 | ||
| Standard Diagnostics, Inc. | 574 | 20,405 | ||
| Total Health Care Equipment & Services | 61,777 | |||
| Insurance — 4.1% | ||||
| Hanwha Non-Life Insurance Co., Ltd.* | 2,700 | 24,093 | ||
| HungKuk Fire & Marine Insurance Co., Ltd.* | 1,200 | 6,236 | ||
| Lotte Non-Life Insurance Co., Ltd. | 1,700 | 11,350 | ||
| Meritz Fire & Marine Insurance Co., Ltd. | 9,825 | 64,179 | ||
| Total Insurance | 105,858 | |||
| Materials — 19.1% | ||||
| Capro Corp.* | 2,390 | 25,661 | ||
| Dongbu HiTek Co., Ltd.* | 2,580 | 19,600 | ||
| Dongbu Steel Co., Ltd. | 2,830 | 26,299 | ||
| Dongkuk Industries Co., Ltd. | 2,878 | 13,321 | ||
| Foosung Co., Ltd.* | 5,180 | 17,269 | ||
| Han Kuk Carbon Co., Ltd. | 2,060 | 13,122 | ||
| Hansol Paper Co., Ltd. | 3,720 | 38,262 | ||
| Huchems Fine Chemical Corp. | 1,340 | 31,918 | ||
| Kolon Corp. | 450 | 12,728 | ||
| Korea Kumho Petrochemical Co., Ltd.* | 1,684 | 56,369 | ||
| KP Chemical Corp. | 3,880 | 32,941 | ||
| Poongsan Corp. | 2,840 | 69,184 | ||
| Shinwha Intertek Corp. | 1,430 | 23,095 | ||
| SKC Co., Ltd. | 2,106 | 39,047 | ||
| Songwon Industrial Co., Ltd. | 1,480 | 14,021 | ||
| TechnoSemiChem Co., Ltd. | 752 | 14,859 | ||
| Tong Yang Major Corp.* | 4,780 | 11,989 | ||
| Woongjin Chemical Co., Ltd.* | 28,720 | 27,337 | ||
| Total Materials | 487,022 | |||
| Media — 2.3% | ||||
| CJ Internet Corp. | 1,738 | 22,110 | ||
| ON*Media Corp.* | 7,460 | 22,649 | ||
| Tera Resource Co., Ltd.* | 16,786 | 13,631 | ||
| Total Media | 58,390 | |||
| Pharmaceuticals, Biotechnology & | ||||
| Life Sciences — 1.9% | ||||
| Bukwang Pharmaceutical Co., Ltd. | 1,490 | 24,467 | ||
| Il Yang Pharmaceutical Co., Ltd.* | 1,000 | 22,827 | ||
| Total Pharmaceuticals, Biotechnology | ||||
| & Life Sciences | 47,294 | |||
| Retailing — 1.3% | ||||
| Daewoo Motor Sales Corp.* | 4,460 | 9,456 | ||
| Interpark Corp.* | 5,093 | 24,584 | ||
| Total Retailing | 34,040 | |||
| Semiconductors & Semiconductor | ||||
| Equipment — 3.1% | ||||
| Duksan Hi-Metal Co., Ltd.* | 1,188 | 19,400 | ||
| Jusung Engineering Co., Ltd.* | 2,389 | 45,157 | ||
| L&F Co., Ltd. | 806 | 15,526 | ||
| Total Semiconductors & Semiconductor | ||||
| Equipment | 80,083 | |||
| Software & Services — 9.1% | ||||
| Danal Co., Ltd.* | 1,248 | 20,606 | ||
| Daou Technology, Inc. | 2,910 | 24,155 | ||
| Daum Communications Corp.* | 1,095 | 65,798 | ||
| Korea Digital Communications Corp.* | 7,075 | 20,586 | ||
| KTHitel Co., Ltd.* | 1,200 | 8,748 | ||
| Neowiz Games Corp.* | 1,135 | 41,371 | ||
| POSCO ICT Co., Ltd.* | 3,145 | 25,198 | ||
| SK Communications Co., Ltd.* | 1,552 | 26,045 | ||
| Total Software & Services | 232,507 | |||
| Technology Hardware & Equipment — 6.6% | ||||
| Ace Digitech Co., Ltd.* | 1,661 | 38,065 | ||
| Daeduck Electronics Co. | 4,030 | 21,707 | ||
| Digitech Systems Co., Ltd. | 1,166 | 21,303 | ||
| Lumens Co., Ltd.* | 3,035 | 40,390 | ||
| Partron Co., Ltd. | 1,592 | 26,717 | ||
| Sam Young Electronics Co., Ltd. | 1,060 | 10,568 | ||
| Suprema, Inc. | 752 | 8,515 | ||
| Total Technology Hardware & Equipment | 167,265 | |||
| Transportation — 4.1% | ||||
| Asiana Airlines, Inc.* | 9,822 | 52,551 | ||
| Korea Line Corp.* | 964 | 52,186 | ||
| Total Transportation | 104,737 | |||
| Total Investments — 99.9% | ||||
| (Cost $2,462,484) | $ | 2,547,516 | ||
| Other Assets in Excess of Liabilities — 0.1% | 2,557 | |||
| Net Assets — 100.0% | $ | 2,550,073 | ||
| * | Non-income producing securities. |
See notes to financial statements.
31
Statements of Assets and Liabilities
April 30, 2010
| IQ Hedge Multi-Strategy Tracker ETF | IQ Hedge Macro Tracker ETF | IQ CPI Inflation Hedged ETF | IQ ARB Global Resources ETF | |||||||||||
| Assets | ||||||||||||||
| Investments, at cost: | $ | 84,089,393 | $ | 9,657,873 | $ | 13,239,414 | $ | 6,985,774 | ||||||
| Investments, at value | $ | 88,879,978 | $ | 10,227,085 | $ | 13,230,484 | $ | 7,468,473 | ||||||
| Cash* | 4,302,389 | 442,973 | 526,940 | 752,038 | ||||||||||
| Foreign cash** | — | — | — | 2,940 | ||||||||||
| Prepaid expenses | 781 | 168 | — | — | ||||||||||
| Due from broker | — | — | 96,470 | — | ||||||||||
| Variation margin receivable | — | — | — | 23,335 | ||||||||||
| Dividend and interest receivable | — | — | — | 7,376 | ||||||||||
| Total assets | 93,183,148 | 10,670,226 | 13,853,894 | 8,254,162 | ||||||||||
| Liabilities | ||||||||||||||
| Unrealized depreciation on swap transactions | 484,566 | 49,574 | — | — | ||||||||||
| Advisory fees payable | 56,008 | 5,923 | 5,229 | 4,854 | ||||||||||
| Trustee fees payable | 3,186 | 310 | 437 | 261 | ||||||||||
| Due to broker | — | — | 104,548 | — | ||||||||||
| Compliance fees payable | — | — | 49 | 19 | ||||||||||
| Total liabilities | 543,760 | 55,807 | 110,263 | 5,134 | ||||||||||
| Net Assets | $ | 92,639,388 | $ | 10,614,419 | $ | 13,743,631 | $ | 8,249,028 | ||||||
| Composition of Net Assets | ||||||||||||||
| Paid-in capital | $ | 90,613,780 | $ | 10,309,521 | $ | 13,767,919 | $ | 7,569,694 | ||||||
| Undistributed net investment income | 412,162 | 956 | 140 | 19,539 | ||||||||||
| Undistributed (accumulated) net realized gain | ||||||||||||||
| (loss) on investments, swap transactions, | ||||||||||||||
| futures contracts and foreign currency | ||||||||||||||
| transactions | (2,692,573 | ) | (215,696 | ) | (15,498 | ) | 180,769 | |||||||
| Net unrealized appreciation (depreciation) on | ||||||||||||||
| investments, swap transactions, futures | ||||||||||||||
| contracts and foreign currency transactions | 4,306,019 | 519,638 | (8,930 | ) | 479,026 | |||||||||
| Net Assets | $ | 92,639,388 | $ | 10,614,419 | $ | 13,743,631 | $ | 8,249,028 | ||||||
| NET ASSET VALUE PER SHARE | ||||||||||||||
| Shares Outstanding (no par value, unlimited | ||||||||||||||
| shares authorized) | 3,404,000 | 400,000 | 550,000 | 300,000 | ||||||||||
| Net Asset Value | $ | 27.21 | $ | 26.54 | $ | 24.99 | $ | 27.50 | ||||||
| *Includes cash held as collateral as follows: | $ | 2,551,188 | $ | 242,605 | $ | 444,750 | $ | 144,939 | ||||||
| **Cost of foreign cash as follows: | $ | — | $ | — | $ | — | $ | 2,943 | ||||||
See notes to financial statements.
32
Statements of Assets and Liabilities (continued)
April 30, 2010
| IQ ARB Merger Arbitrage ETF | IQ Australia Small Cap ETF | IQ Canada Small Cap ETF | IQ South Korea Small Cap ETF | ||||||||||||
| Assets | |||||||||||||||
| Investments, at cost: | $ | 19,208,937 | $ | 8,947,344 | $ | 8,964,395 | $ | 2,462,484 | |||||||
| Investments, at value | $ | 19,466,865 | $ | 8,965,226 | $ | 9,088,095 | $ | 2,547,516 | |||||||
| Cash* | 11,328,662 | 35,545 | 17,040 | 3,168 | |||||||||||
| Foreign cash** | 16,509 | 68 | 2,498 | 330 | |||||||||||
| Receivable for investments sold | 543,306 | — | — | — | |||||||||||
| Variation margin receivable | 253,965 | — | — | — | |||||||||||
| Dividend and interest receivable | 9,857 | 9,227 | 757 | — | |||||||||||
| Unrealized appreciation on foreign currency | |||||||||||||||
| transactions | — | 127 | — | — | |||||||||||
| Receivable for capital shares transactions | — | — | 1,300,960 | — | |||||||||||
| Total assets | 31,619,164 | 9,010,193 | 10,409,350 | 2,551,014 | |||||||||||
| Liabilities | |||||||||||||||
| Advisory fees payable | 16,149 | 4,557 | 4,165 | 937 | |||||||||||
| Trustee fees payable | 582 | 152 | 129 | — | |||||||||||
| Compliance fees payable | 129 | 16 | 16 | 4 | |||||||||||
| Payable for investments purchased | — | 32,642 | 1,298,303 | — | |||||||||||
| Total liabilities | 16,860 | 37,367 | 1,302,613 | 941 | |||||||||||
| Net Assets | $ | 31,602,304 | $ | 8,972,826 | $ | 9,106,737 | $ | 2,550,073 | |||||||
| Composition of Net Assets | |||||||||||||||
| Paid-in capital | $ | 31,057,218 | $ | 8,946,114 | $ | 8,984,430 | $ | 2,499,891 | |||||||
| Undistributed (accumulated) net investment | |||||||||||||||
| income (loss) | (3,603 | ) | 8,699 | (1,366 | ) | (34,767 | ) | ||||||||
| Undistributed (accumulated) net realized gain | |||||||||||||||
| (loss) on investments, swap transactions, | |||||||||||||||
| futures contracts and foreign currency | |||||||||||||||
| transactions | 219,481 | — | — | (85 | ) | ||||||||||
| Net unrealized appreciation (depreciation) on | |||||||||||||||
| investments, swap transactions, futures | |||||||||||||||
| contracts and foreign currency transactions | 329,208 | 18,013 | 123,673 | 85,034 | |||||||||||
| Net Assets | $ | 31,602,304 | $ | 8,972,826 | $ | 9,106,737 | $ | 2,550,073 | |||||||
| NET ASSET VALUE PER SHARE | |||||||||||||||
| Shares Outstanding (no par value, unlimited | |||||||||||||||
| shares authorized) | 1,200,000 | 350,000 | 350,000 | 100,000 | |||||||||||
| Net Asset Value | $ | 26.34 | $ | 25.64 | $ | 26.02 | $ | 25.50 | |||||||
| *Includes cash held as collateral as follows: | $ | 520,000 | $ | — | $ | — | $ | — | |||||||
| **Cost of foreign cash as follows: | $ | 16,271 | $ | 67 | $ | 2,520 | $ | 328 | |||||||
See notes to financial statements.
33
Statements of Operations
April 30, 2010
| IQ Hedge Multi-Strategy Tracker ETF | IQ Hedge Macro Tracker ETF | IQ CPI Inflation Hedged ETF | IQ ARB Global Resources ETF | ||||||||||||
| For the Year Ended April 30, 2010 | For the Period June 08, 2009* to April 30, 2010 | For the Period October 26, 2009* to April 30, 2010 | For the Period October 26, 2009* to April 30, 2010 | ||||||||||||
| Investment Income | |||||||||||||||
| Dividend income** | $ | 1,595,662 | $ | 109,550 | $ | 17,669 | $ | 58,052 | |||||||
| Interest income | 340 | 16 | — | — | |||||||||||
| Total investment income | 1,596,002 | 109,566 | 17,669 | 58,052 | |||||||||||
| Expenses | |||||||||||||||
| Advisory fees | 443,578 | 44,028 | 23,873 | 25,221 | |||||||||||
| Trustee fees | 5,575 | 503 | 506 | 336 | |||||||||||
| Compliance fees | 2,737 | 266 | 204 | 143 | |||||||||||
| Miscellaneous | 2,414 | — | 56 | 983 | |||||||||||
| �� | |||||||||||||||
| Total expenses | 454,304 | 44,797 | 24,639 | 26,683 | |||||||||||
| Net investment income (loss) | 1,141,698 | 64,769 | (6,970 | ) | 31,369 | ||||||||||
| Realized and Unrealized Gain (Loss) on | |||||||||||||||
| Investments, Swap Transactions, Futures | |||||||||||||||
| Contracts and Foreign Currency Transactions | |||||||||||||||
| Net realized gain (loss) from: | |||||||||||||||
| Investment securities | (653,092 | ) | (88,767 | ) | (6,924 | ) | 273,256 | ||||||||
| In-kind redemptions | 448,083 | — | — | — | |||||||||||
| Swap transactions | (995,828 | ) | (96,662 | ) | (15,190 | ) | — | ||||||||
| Futures contracts | (1,154,869 | ) | (38,030 | ) | — | (92,487 | ) | ||||||||
| Foreign currency transactions | — | — | — | (2,060 | ) | ||||||||||
| Net realized gain (loss) | (2,355,706 | ) | (223,459 | ) | (22,114 | ) | 178,709 | ||||||||
| Net change in net unrealized appreciation | |||||||||||||||
| (depreciation) on: | |||||||||||||||
| Investment securities | 4,661,149 | 569,212 | (8,930 | ) | 482,699 | ||||||||||
| Swap transactions | (484,566 | ) | (49,574 | ) | — | — | |||||||||
| Futures contracts | — | — | — | (3,600 | ) | ||||||||||
| Foreign currency translations | — | — | — | (73 | ) | ||||||||||
| Net change in net unrealized appreciation | |||||||||||||||
| (depreciation) | 4,176,583 | 519,638 | (8,930 | ) | 479,026 | ||||||||||
| Net gain and unrealized appreciation | |||||||||||||||
| (depreciation) | 1,820,877 | 296,179 | (31,044 | ) | 657,735 | ||||||||||
| Net Increase (Decrease) in Net Assets | |||||||||||||||
| Resulting from Operations | $ | 2,962,575 | $ | 360,948 | $ | (38,014 | ) | $ | 689,104 | ||||||
| *Commencement of operations | |||||||||||||||
| **Net of foreign taxes withheld of: | $ | — | $ | — | $ | — | $ | 3,902 | |||||||
See notes to financial statements.
34
Statements of Operations (continued)
April 30, 2010
| IQ ARB Merger Arbitrage ETF | IQ Australia Small Cap ETF | IQ Canada Small Cap ETF | IQ South Korea Small Cap ETF | ||||||||||||
| For the Period November 16, 2009* to April 30, 2010 | For the Period March 22, 2010* to April 30, 2010 | For the Period March 22, 2010* to April 30, 2010 | For the Period April 13, 2010* to April 30, 2010 | ||||||||||||
| Investment Income | |||||||||||||||
| Dividend income** | $ | 49,659 | $ | 14,168 | $ | 3,446 | $ | — | |||||||
| Expenses | |||||||||||||||
| Advisory fees | 37,801 | 5,411 | 4,640 | 937 | |||||||||||
| Trustee fees | 582 | 152 | 129 | — | |||||||||||
| Compliance fees | 225 | 30 | 23 | 4 | |||||||||||
| Miscellaneous | 21 | — | — | — | |||||||||||
| Total expenses | 38,629 | 5,593 | 4,792 | 941 | |||||||||||
| Net investment income (loss) | 11,030 | 8,575 | (1,346 | ) | (941 | ) | |||||||||
| Realized and Unrealized Gain (Loss) on | |||||||||||||||
| Investments, Swap Transactions, Futures | |||||||||||||||
| Contracts and Foreign Currency | |||||||||||||||
| Transactions | |||||||||||||||
| Net realized gain (loss) from: | |||||||||||||||
| Investment securities | 308,400 | — | — | 747 | |||||||||||
| Futures contracts | (88,919 | ) | — | — | — | ||||||||||
| Foreign currency transactions | (14,413 | ) | 124 | (20 | ) | (34,767 | ) | ||||||||
| Net realized gain (loss) | 205,068 | 124 | (20 | ) | (34,020 | ) | |||||||||
| Net change in net unrealized appreciation | |||||||||||||||
| (depreciation) on: | |||||||||||||||
| Investment securities | 257,928 | 17,882 | 123,700 | 85,032 | |||||||||||
| Futures contracts | 71,025 | — | — | — | |||||||||||
| Foreign currency translations | 255 | 131 | (27 | ) | 2 | ||||||||||
| Net change in net unrealized appreciation | |||||||||||||||
| (depreciation) | 329,208 | 18,013 | 123,673 | 85,034 | |||||||||||
| Net gain and unrealized appreciation | |||||||||||||||
| (depreciation) | 534,276 | 18,137 | 123,653 | 51,014 | |||||||||||
| Net Increase (Decrease) in Net Assets | |||||||||||||||
| Resulting from Operations. | $ | 545,306 | $ | 26,712 | $ | 122,307 | $ | 50,073 | |||||||
| *Commencement of operations | |||||||||||||||
| **Net of foreign taxes withheld of: | $ | 87 | $ | 107 | $ | 608 | $ | — | |||||||
See notes to financial statements.
35
Statements of Changes in Net Assets
| IQ Hedge Multi-Strategy Tracker ETF | IQ Hedge Macro Tracker ETF | IQ CPI Inflation Hedged ETF | IQ ARB Global Resources ETF | ||||||||||||||||
| For the Year Ended April 30, 2010 | For the Period March 24, 2009* to April 30, 2009 | For the Period June 08, 2009* to April 30, 2010 | For the Period October 26, 2009* to April 30, 2010 | For the Period October 26, 2009* to April 30, 2010 | |||||||||||||||
| Increase (Decrease) in Net Assets | |||||||||||||||||||
| from Operations | |||||||||||||||||||
| Net investment income (loss) | $ | 1,141,698 | $ | 5,666 | $ | 64,769 | $ | (6,970 | ) | $ | 31,369 | ||||||||
| Net realized gain (loss) | (2,355,706 | ) | 25,556 | (223,459 | ) | (22,114 | ) | 178,709 | |||||||||||
| Net change in net unrealized | |||||||||||||||||||
| appreciation (depreciation) | 4,176,583 | 129,436 | 519,638 | (8,930 | ) | 479,026 | |||||||||||||
| Net increase (decrease) in net assets | |||||||||||||||||||
| resulting from operations | 2,962,575 | 160,658 | 360,948 | (38,014 | ) | 689,104 | |||||||||||||
| Dividends and Distributions to | |||||||||||||||||||
| Shareholders from: | |||||||||||||||||||
| Net investment income | (646,883 | ) | — | (61,910 | ) | — | (10,753 | ) | |||||||||||
| Capital Share Transactions | |||||||||||||||||||
| Proceeds from shares created | 82,803,467 | 12,532,454 | 10,315,381 | 13,781,645 | 7,570,677 | ||||||||||||||
| Cost of shares redeemed | (4,015,606 | ) | (1,257,277 | ) | — | — | — | ||||||||||||
| Net increase from capital share | |||||||||||||||||||
| transactions | 78,787,861 | 11,275,177 | 10,315,381 | 13,781,645 | 7,570,677 | ||||||||||||||
| Total increase in net assets | 81,103,553 | 11,435,835 | 10,614,419 | 13,743,631 | 8,249,028 | ||||||||||||||
| Net Assets | |||||||||||||||||||
| Beginning of period | 11,535,835 | 100,000 | — | — | — | ||||||||||||||
| End of period | $ | 92,639,388 | $ | 11,535,835 | $ | 10,614,419 | $ | 13,743,631 | $ | 8,249,028 | |||||||||
| Including undistributed net | |||||||||||||||||||
| investment income as follows: | $ | 412,162 | $ | 5,666 | $ | 956 | $ | 140 | $ | 19,539 | |||||||||
| Changes in Shares Outstanding | |||||||||||||||||||
| Shares outstanding, beginning | |||||||||||||||||||
| of period | 454,000 | 4,000 | — | — | — | ||||||||||||||
| Shares created | 3,100,000 | 500,000 | 400,000 | 550,000 | 300,000 | ||||||||||||||
| Shares redeemed | (150,000 | ) | (50,000 | ) | — | — | — | ||||||||||||
| Shares outstanding, end of period | 3,404,000 | 454,000 | 400,000 | 550,000 | 300,000 | ||||||||||||||
| * | Commencement of operations |
See notes to financial statements.
36
Statements of Changes in Net Assets (continued)
| IQ ARB Merger Arbitrage ETF | IQ Australia Small Cap ETF | IQ Canada Small Cap ETF | IQ South Korea Small Cap ETF | |||||||||||
| For the Period November 16, 2009* to April 30, 2010 | For the Period March 22, 2010* to April 30, 2010 | For the Period March 22, 2010* to April 30, 2010 | For the Period April 13, 2010* to April 30, 2010 | |||||||||||
| Increase (Decrease) in Net Assets from Operations | ||||||||||||||
| Net investment income (loss) | $ | 11,030 | $ | 8,575 | $ | (1,346 | ) | $ | (941 | ) | ||||
| Net realized gain (loss) | 205,068 | 124 | (20 | ) | (34,020 | ) | ||||||||
| Net change in net unrealized appreciation | ||||||||||||||
| (depreciation) | 329,208 | 18,013 | 123,673 | 85,034 | ||||||||||
| Net increase (decrease) in net assets resulting | ||||||||||||||
| from operations | 545,306 | 26,712 | 122,307 | 50,073 | ||||||||||
| Dividends and Distributions to Shareholders from: | ||||||||||||||
| Net investment income | (241 | ) | — | — | — | |||||||||
| Capital Share Transactions | ||||||||||||||
| Proceeds from shares created | 31,057,239 | 8,946,114 | 8,984,430 | 2,500,000 | ||||||||||
| Cost of shares redeemed | — | — | — | — | ||||||||||
| Net increase from capital share transactions | 31,057,239 | 8,946,114 | 8,984,430 | 2,500,000 | ||||||||||
| Total increase in net assets | 31,602,304 | 8,972,826 | 9,106,737 | 2,550,073 | ||||||||||
| Net Assets | ||||||||||||||
| Beginning of period | — | — | — | — | ||||||||||
| End of period | $ | 31,602,304 | $ | 8,972,826 | $ | 9,106,737 | $ | 2,550,073 | ||||||
| Including undistributed net investment income | ||||||||||||||
| (net of accumulated net investment loss) | ||||||||||||||
| as follows: | $ | (3,603 | ) | $ | 8,699 | $ | (1,366 | ) | $ | (34,767 | ) | |||
| Changes in Shares Outstanding | ||||||||||||||
| Shares outstanding, beginning of period | — | — | — | — | ||||||||||
| Shares created | 1,200,000 | 350,000 | 350,000 | 100,000 | ||||||||||
| Shares redeemed | — | — | — | — | ||||||||||
| Shares outstanding, end of period | 1,200,000 | 350,000 | 350,000 | 100,000 | ||||||||||
| * | Commencement of operations |
See notes to financial statements.
37
Financial Highlights
Selected Data for a Share of Capital Stock Outstanding
| IQ Hedge Multi-Strategy Tracker ETF | IQ Hedge Macro Tracker ETF | IQ CPI Inflation Hedged ETF | IQ ARB Global Resources ETF | ||||||||||||||||
| For the Year Ended April 30, 2010 | For the Period March 24, 20091 to April 30, 2009 | For the Period June 08, 20091 to April 30, 2010 | For the Period October 26, 20091 April 30, 2010 | For the Period October 26, 20091 April 30, 2010 | |||||||||||||||
| Net asset value, beginning of period | $ | 25.41 | $ | 25.00 | $ | 25.00 | $ | 25.00 | $ | 25.00 | |||||||||
| Investment Operations | |||||||||||||||||||
| Net investment income (loss)2 | 0.52 | 0.02 | 0.26 | (0.02 | ) | 0.12 | |||||||||||||
| Net realized and unrealized gain | |||||||||||||||||||
| on investments | 1.51 | 0.39 | 1.53 | 0.01 | 2.42 | ||||||||||||||
| Net increase (decrease) in net | |||||||||||||||||||
| assets resulting from investment | |||||||||||||||||||
| operations | 2.03 | 0.41 | 1.79 | (0.01 | ) | 2.54 | |||||||||||||
| Distributions from net investment | |||||||||||||||||||
| income | (0.23 | ) | — | (0.25 | ) | — | (0.04 | ) | |||||||||||
| Net asset value, end of period | $ | 27.21 | $ | 25.41 | $ | 26.54 | $ | 24.99 | $ | 27.50 | |||||||||
| Total Return | |||||||||||||||||||
| Total investment return based on | |||||||||||||||||||
| net asset value4 | 8.00 | % | 1.64 | % | 7.16 | % | (0.04 | )% | 10.18 | % | |||||||||
| Ratios/Supplemental Data | |||||||||||||||||||
| Net assets, end of period | |||||||||||||||||||
| (000’s omitted) | $ | 92,639 | $ | 11,536 | $ | 10,614 | $ | 13,744 | $ | 8,249 | |||||||||
| Ratio to average net assets of: | |||||||||||||||||||
| Expenses | 0.77 | % | 0.13 | %5 | 0.76 | %6 | 0.50 | %6 | 0.79 | %6 | |||||||||
| Net investment income (loss) | 1.93 | % | 0.08 | %5 | 1.10 | %6 | (0.14 | )%6 | 0.93 | %6 | |||||||||
| Portfolio turnover rate7 | 169 | % | 0 | %8 | 77 | % | 44 | % | 158 | % | |||||||||
See footnotes on page 39.
See notes to financial statements.
38
Financial Highlights (continued)
Selected Data for a Share of Capital Stock Outstanding
| IQ ARB Merger Arbitrage ETF | IQ Australia Small Cap ETF | IQ Canada Small Cap ETF | IQ South Korea Small Cap ETF | ||||||||||||
| For the Period November 16, 20091 to April 30, 2010 | For the Period March 22, 20101 to April 30, 2010 | For the Period March 22, 20101 to April 30, 2010 | For the Period April 13, 20101 to April 30, 2010 | ||||||||||||
| Net asset value, beginning of period | $ | 25.00 | $ | 25.00 | $ | 25.00 | $ | 25.00 | |||||||
| Investment Operations | |||||||||||||||
| Net investment income (loss)2 | 0.03 | 0.03 | (0.01 | ) | (0.01 | ) | |||||||||
| Net realized and unrealized gain on investments | 1.31 | 0.61 | 1.03 | 0.51 | |||||||||||
| Net increase (decrease) in net assets resulting | |||||||||||||||
| from investment operations | 1.34 | 0.64 | 1.02 | 0.50 | |||||||||||
| Distributions from net investment income | —3 | — | — | — | |||||||||||
| Net asset value, end of period | $ | 26.34 | $ | 25.64 | $ | 26.02 | $ | 25.50 | |||||||
| Total Return | |||||||||||||||
| Total investment return based on net | |||||||||||||||
| asset value4 | 5.37 | % | 2.56 | % | 4.08 | % | 2.00 | % | |||||||
| Ratios/Supplemental Data | |||||||||||||||
| Net assets, end of period (000’s omitted) | $ | 31,602 | $ | 8,973 | $ | 9,107 | $ | 2,550 | |||||||
| Ratio to average net assets of: | |||||||||||||||
| Expenses | 0.77 | %6 | 0.71 | %6 | 0.71 | %6 | 0.79 | %6 | |||||||
| Net investment income (loss) | 0.22 | %6 | 1.09 | %6 | (0.20 | )%6 | (0.79 | )%6 | |||||||
| Portfolio turnover rate7 | 141 | % | 0 | % | 0 | % | 1 | % | |||||||
| 1 | Commencement of operations. |
| 2 | Based on average shares outstanding. |
| 3 | Greater than $(0.005) per share. |
| 4 | Total investment return is calculated assuming an initial investment made at the net asset value at the beginning of the period, reinvestment of all dividends and distributions, if any, at net asset value during the period, and redemption on the last day of the period. |
| 5 | Not annualized. |
| 6 | Annualized. |
| 7 | Portfolio turnover rate is not annualized and excludes the value of portfolio securities received or delivered as in-kind creations or redemptions of the Fund’s capital shares. |
| 8 | Portfolio turnover rate for the period was greater than 0% yet less than 0.5%. |
See notes to financial statements.
39
Notes to Financial Statements
April 30, 2010
1. ORGANIZATION
IndexIQ ETF Trust (the “Trust”) was organized as a Delaware statutory trust on July 1, 2008 and is registered with the Securities and Exchange Commission (“SEC”) as a non-diversified, open-end, management investment company, as defined by the Investment Company Act of 1940, as amended (the “1940 Act”), which is currently comprised of eight active funds (collectively, the “Funds” and each individually, a “Fund”): IQ Hedge Multi-Strategy Tracker ETF, IQ Hedge Macro Tracker ETF, IQ CPI Inflation Hedged ETF, IQ ARB Global Resources ETF, IQ ARB Merger Arbitrage ETF, IQ Australia Small Cap ETF, IQ Canada Small Cap ETF and IQ South Korea Small Cap ETF. The Funds are exchange-traded funds (“ETFs”), whose shares are listed on a stock exchange and traded like equity securities at market prices. The IQ Hedge Multi-Strategy Tracker ETF commenced operations on March 24, 2009; IQ Hedge Macro Tracker ETF commenced operations on June 8, 2009; IQ CPI Inflation Hedged ETF and IQ ARB Global Resources ETF commenced operations on October 26, 2009; IQ ARB Merger Arbitrage ETF commenced operations on November 16, 2009; IQ Australia Small Cap ETF and IQ Canada Small Cap ETF commenced operations on March 22, 2010; and IQ South Korea Small Cap ETF commenced operations on April 13, 2010.
The investment objective of the IQ Hedge Multi-Strategy Tracker ETF is to seek investment results that correspond, before fees and expenses, generally to the price and yield performance of the IQ Hedge Multi-Strategy Index, developed by Financial Development Holdco LLC (“IndexIQ”), the parent company of IndexIQ Advisors, LLC (the “Advisor”), the Fund’s investment advisor.
The objective of the IQ Hedge Multi-Strategy Index is to track the “beta” portion of the returns (i.e., that portion of the returns of hedge funds that are non-idiosyncratic, or unrelated to manager skill) of hedge funds that employ various hedge fund investment styles, which may include but are not limited to global macro, long/short, event-driven, market neutral, emerging markets, fixed-income arbitrage and other strategies commonly used by hedge fund managers.
The investment objective of the IQ Hedge Macro Tracker ETF is to seek investment results that correspond, before fees and expenses, generally to the price and yield performance of the IQ Hedge Macro Index, developed by IndexIQ, the parent company of the Advisor.
The objective of the IQ Hedge Macro Index is to track the “beta” portion of the returns (i.e., that portion of the returns of hedge funds that are non-idiosyncratic, or unrelated to manager skill) of a combination of hedge funds pursuing a macro strategy and hedge funds pursuing an emerging markets strategy.
The investment objective of the IQ CPI Inflation Hedged ETF is to seek investment results that correspond, before fees and expenses, generally to the price and yield performance of the IQ CPI Inflation Hedged Index, developed by IndexIQ, the parent company of the Advisor.
The objective of the IQ CPI Inflation Hedged Index is to provide investors with a hedge against the U.S. inflation rate by providing a “real return” or a return above the rate of inflation, as represented by the Consumer Price Index, a leading government measure of inflation in the U.S. economy.
The investment objective of the IQ ARB Global Resources ETF is to seek investment results that correspond, before fees and expenses, generally to the price and yield performance of the IQ ARB Global Resources Index, developed by IndexIQ, the parent company of the Advisor.
The objective of the IQ ARB Global Resources Index is to identify investment opportunities in the global resources market segment.
The objective of the IQ ARB Merger Arbitrage ETF is to seek investment results that correspond, before fees and expenses, generally to the price and yield performance of the IQ ARB Merger Arbitrage Index, developed by IndexIQ, the parent company of the Advisor.
The objective of the IQ ARB Merger Arbitrage Index is to seek to identify investment opportunities in the acquisition and merger market segment globally.
The objective of the IQ Australia Small Cap ETF is to seek investment results that correspond, before fees and expenses, generally to the price and yield performance of the IQ Australia Small Cap Index, developed by IndexIQ, the parent company of the Advisor.
40
Notes to Financial Statements (continued)
April 30, 2010
The objective of the IQ Australia Small Cap Index is to give investors a means of tracking the overall performance of the small capitalization sector of publicly traded companies domiciled and primarily listed on an exchange in Australia.
The objective of the IQ Canada Small Cap ETF is to seek investment results that correspond, before fees and expenses, generally to the price and yield performance of the IQ Canada Small Cap Index, developed by IndexIQ, the parent company of the Advisor.
The objective of the IQ Canada Small Cap Index is to give investors a means of tracking the overall performance of the small capitalization sector of publicly traded companies domiciled and primarily listed on an exchange in Canada.
The objective of the IQ South Korea Small Cap ETF is to seek investment results that correspond, before fees and expenses, generally to the price and yield performance of the IQ South Korea Small Cap Index, developed by IndexIQ, the parent company of the Advisor.
The objective of the IQ South Korea Small Cap Index is to give investors a means of tracking the overall performance of the small capitalization sector of publicly traded companies domiciled and primarily listed on an exchange in South Korea.
2. SIGNIFICANT ACCOUNTING POLICIES
Use of Estimates
These financial statements are prepared in conformity with U.S. generally accepted accounting principles (“U.S. GAAP”), which require management to make certain estimates and assumptions that affect the reported amounts of assets and liabilities and disclosure of contingent assets and liabilities at the date of the financial statements and reported amounts of increases and decreases in the net assets from operations during the reporting period. Actual results could differ from those estimates. The following is a summary of significant accounting policies followed by the Funds:
Indemnification
In the normal course of business, the Funds may enter into contracts that contain a variety of representations which provide general indemnifications for certain liabilities. Each Fund’s maximum exposure under these arrangements is unknown. However, since their commencement of operations, the Funds have not had claims or losses pursuant to these contracts and expect the risk of loss to be remote.
Investment Valuation
The Net Asset Value (“NAV”) is determined as of the close of trading (generally, 4:00 PM Eastern Time) on each day the New York Stock Exchange Arca (“NYSE”) is open for trading. NAV per share is calculated by dividing a fund’s net assets by the number of fund shares outstanding. Securities and investment funds traded on any recognized national or foreign stock exchange are valued at the last quoted sale price or, if no sale price is available, at the bid price. Securities not listed on a national or foreign stock exchange may be valued on the basis of prices furnished by approved pricing services or at the closing bid price on the over-the-counter market.
If market quotations are not readily available, or if the Advisor determines that a quotation of a security does not represent a fair value, then the security is valued at a fair value as determined in good faith using procedures adopted by the Trust’s Board of Trustees (the “Board”). Market prices may not represent fair value, for example, if a security is thinly traded or if an event occurs between the market quotation and the time the security is to be valued which is expected affect the value of the security. The circumstances in which the Board may fair value a security include, among others: the occurrence of events that are significant to a particular issuer, such as mergers, restructurings or defaults; the occurrence of events that are significant to an entire market, such as natural disasters in a particular region or government actions; trading restrictions on securities; thinly traded securities; and market events such as trading halts and early market closings. Short-term securities with 60 days or less remaining to maturity are valued using the amortized cost method, which approximates current market value.
41
Notes to Financial Statements (continued)
April 30, 2010
The Funds utilized various inputs in determining the value of their investments. These inputs are summarized in the three broad levels as follows:
Level 1 — quoted prices in active markets for identical investments
Level 2 — other significant observable inputs (including quoted prices for similar investments, interest rates, prepayment speeds, credit risk, etc.)
Level 3 — significant unobservable inputs (including the Fund’s own assumptions in determining the fair value of investments)
The inputs or methodology used for valuing securities are not necessarily an indication of the risk associated with investing in those securities. The following is a summary of the inputs used to value the Funds’ investments at April 30, 2010:
| Level 1 | Level 2 | Level 3 | |||||||
| IQ Hedge Multi-Strategy Tracker ETF | |||||||||
| Investment Companies* | $ | 88,879,978 | $ | — | $ | — | |||
| Other Financial Instruments** | — | (484,566 | ) | — | |||||
| Total | $ | 88,879,978 | $ | (484,566 | ) | $ | — | ||
| IQ Hedge Macro Tracker ETF | |||||||||
| Investment Companies* | $ | 10,227,085 | $ | — | $ | — | |||
| Other Financial Instruments** | — | (49,574 | ) | — | |||||
| Total | $ | 10,227,085 | $ | (49,574 | ) | $ | — | ||
| IQ CPI Inflation Hedged ETF | |||||||||
| Investment Companies* | $ | 13,230,484 | $ | — | $ | — | |||
| Other Financial Instruments | — | — | — | ||||||
| Total | $ | 13,230,484 | $ | — | $ | — | |||
| IQ ARB Global Resources ETF | |||||||||
| Common Stocks† | $ | 7,468,473 | $ | — | $ | — | |||
| Other Financial Instruments** | — | (3,600 | ) | — | |||||
| Total | $ | 7,468,473 | $ | (3,600 | ) | $ | — | ||
| IQ ARB Merger Arbitrage ETF | |||||||||
| Common Stocks* | $ | 19,466,865 | $ | — | $ | — | |||
| Other Financial Instruments** | — | 71,025 | — | ||||||
| Total | $ | 19,466,865 | $ | 71,025 | $ | — | |||
| IQ Australia Small Cap ETF | |||||||||
| Common Stocks* | $ | 8,959,803 | $ | — | $ | — | |||
| Rights | — | 5,422 | — | ||||||
| Other Financial Instruments | — | — | — | ||||||
| Total | $ | 8,959,803 | $ | 5,422 | $ | — | |||
| IQ Canada Small Cap ETF | |||||||||
| Common Stocks* | $ | 9,088,095 | $ | — | $ | — | |||
| Other Financial Instruments | — | — | — | ||||||
| Total | $ | 9,088,095 | $ | — | $ | — | |||
| IQ South Korea Small Cap ETF | |||||||||
| Common Stocks* | $ | 2,547,516 | $ | — | $ | — | |||
| Other Financial Instruments | — | — | — | ||||||
| Total | $ | 2,547,516 | $ | — | $ | — | |||
| * | Please refer to the Schedule of Investments to view securities segregated by industry type. |
| ** | Derivative instruments, including swap transactions and futures contracts, are valued at the net unrealized appreciation (depreciation) on the instrument. |
| † | Please refer to the Schedule of Investments to view securities segregated by country. |
42
Notes to Financial Statements (continued)
April 30, 2010
Tax Information, Dividends and Distributions to Shareholders and Uncertain Tax Positions
Each Fund intends to qualify as a regulated investment company by complying with the requirements under Subchapter M of the Internal Revenue Code of 1986, as amended (“the Code”), by distributing substantially all of their net investment income and net realized gains to shareholders. Net investment income and net capital gains are typically distributed to shareholders at least annually. Dividends may be declared and paid more frequently to improve index tracking or to comply with the distribution requirements of the Code. In addition, the Funds may determine to distribute at least annually amounts representing the full dividend yield net of expenses on the underlying investment securities, as if the Fund owned the underlying investment securities for the entire dividend period in which case some portion of each distribution may result in a return of capital. The amount of dividends and distributions from net investment income and net realized capital gains are determined in accordance with Federal income tax regulations which may differ from U.S. GAAP. These “book/tax” differences are either considered temporary or permanent in nature. To the extent these differences are permanent in nature, such amounts are reclassified within the components of net assets based on their Federal Tax basis treatment; temporary differences do not require reclassification. Dividends and distributions, which exceed earnings and profit for tax purposes are reported as a tax return of capital.
Management evaluates tax positions taken or expected to be taken in the course of preparing the Funds’ tax returns to determine whether the tax positions are “more-likely-than-not” of being sustained by the applicable tax authority. Tax positions not deemed to meet the more-likely-than-not threshold would be recorded as a tax expense. The Funds are required to analyze uncertain tax positions for all open tax years. Open tax years are those years that are open to examination by the relevant income taxing authority. The returns of the Funds for the period from commencement of operations through April 30, 2010 are open for examination. As of April 30, 2010, the Funds have no examinations in progress.
The Funds have concluded that there is no tax liability resulting from uncertain income tax positions taken or expected to be taken. The Funds are also not aware of any tax positions for which it is reasonably possible that the total amounts of unrecognized tax expense will significantly change in twelve months.
Cash and Cash Equivalents
Cash and cash equivalents consist of highly liquid investments, with maturities of three months or less when acquired.
Security Transactions
Security transactions are recorded as of the trade date. Realized gains and losses on sales of investment securities are calculated using the identified cost method.
Foreign Currency Translation
The books and records of the Funds are maintained in the U.S. dollars. Foreign currency amounts are translated into U.S. dollars at the prevailing exchange rates of such currencies against the U.S. dollar. The market value of investment securities and the other assets and liabilities are translated at the exchange rate as of the valuation date. Purchases and sales of investment securities, income and expenses are translated at the exchange rate prevailing on the respective dates of such transactions.
Although the net assets of the Funds are presented at the foreign exchange rates and market values at the close of the period, the Funds do not isolate that portion of the results of operations arising as a result of changes in the foreign exchange rates from the fluctuations arising from changes in the market prices of securities held or sold during the period. Accordingly, such foreign currency gains (losses) are included in the reported net realized and unrealized gains (losses) on investment transactions.
Reported realized foreign currency gains or losses arise from the disposition of foreign currency, currency gains or losses realized between the trade and settlement dates on securities transactions, and the difference between the amounts of dividends, interest and foreign withholding taxes recorded on each Fund’s books on the transaction date and the U.S. dollar equivalent of the amounts actually received or paid. Unrealized foreign exchange gains and losses arise from changes (due to the changes in the exchange rate) in the value of foreign currency and other assets and liabilities denominated in foreign currencies, which are held at period end.
43
Notes to Financial Statements (continued)
April 30, 2010
Investment Income
Dividend income is recognized on the ex-dividend date. Interest income is accrued daily. Distributions of realized capital gains by underlying funds are recorded as realized capital gains on the ex-date. The Funds’ investment income, expenses and unrealized and realized gains and losses are allocated daily. The Funds distribute substantially all of their net investment income to shareholders in the form of dividends. Realized capital gains or losses are recorded whenever a Fund sells securities.
Expenses
The Advisor has agreed to pay all expenses of the Funds, except brokerage and other transaction expenses; extraordinary legal fees or expenses, such as those for litigation or arbitration; compensation and expenses of the Independent Trustees, counsel to the Independent Trustees, and the Funds’ chief compliance officer; extraordinary expenses; distribution fees and expenses paid by the Funds under any distribution plan adopted pursuant to Rule 12b-1 under the 1940 Act; and the advisory fee payable to the Advisor hereunder.
3. INVESTMENT MANAGEMENT AND OTHER AGREEMENTS
Advisory Agreement
Under the terms of the Investment Advisory Agreement (the “Advisory Agreement”) the Funds pay the Advisor an advisory fee, based on of the average daily net assets of each fund, at the following annual rates:
| Fund | Rate | |
| IQ Hedge Multi-Strategy Tracker ETF | 0.75 | % |
| IQ Hedge Macro Tracker ETF | 0.75 | % |
| IQ CPI Inflation Hedged ETF | 0.48 | % |
| IQ ARB Global Resources ETF | 0.75 | % |
| IQ ARB Merger Arbitrage ETF | 0.75 | % |
| IQ Australia Small Cap ETF | 0.69 | % |
| IQ Canada Small Cap ETF | 0.69 | % |
| IQ South Korea Small Cap ETF | 0.79 | % |
Such fee is accrued daily and paid monthly. The Advisor has retained Mellon Capital Management Corporation (“MCM”), which is unaffiliated with the Advisor, to serve as the sub-advisor to the Funds (other than the IQ ARB Merger Arbitrage ETF) pursuant to a sub-advisory agreement, to conduct the day-to-day portfolio management of the Funds. Pursuant to MCM’s sub-advisory agreement, the Advisor pays MCM an annual fee, payable monthly for its services. The Advisor has retained Esposito Partners, LLC (“Esposito”), which is unaffiliated with the Advisor, to serve as the sub-advisor to the IQ ARB Merger Arbitrage ETF pursuant to a sub-advisory agreement, to conduct the day-to-day portfolio management of the Fund. Pursuant to Esposito’s sub-advisory agreement, the Advisor pays Esposito an annual fee, payable monthly, for its services.
Distribution Agreement
The Funds have adopted a Distribution Services Agreement with ALPS Distributors, Inc. (the “Distributor”) pursuant to Rule 12b-1 under the 1940 Act. In accordance with its Rule 12b-1 plan, the Funds are authorized to pay an amount up to 0.10% of each Fund’s average daily net assets each year for certain distribution-related activities. The Board has resolved not to authorize the payment of Rule 12b-1 fees prior to June 30, 2011. However, in the event Rule 12b-1 fees are charged in the future, they will be paid out of each Fund’s assets. The Advisor and its affiliates may, out of their own resources, pay amounts to third parties for distribution or marketing services on behalf of the Funds.
Administrator, Custodian and Transfer Agent
The Bank of New York Mellon (in each capacity, the “Administrator,” “Custodian” or “Transfer Agent”) is an affiliate of MCM and serves as the Funds’ Administrator, Custodian and Transfer Agent pursuant to the Fund Administration and Accounting Agreement. Under the terms of this agreement, the Advisor pays the Funds’ Administrative, Custody and Transfer Agency fees. The Bank of New York is a subsidiary of The Bank of New York Mellon Corporation, a financial holding company.
44
Notes to Financial Statements (continued)
April 30, 2010
4. ORGANIZATIONAL AND OFFERING COSTS
Expenses incurred in connection with organizing and the offering of the Trust and each Fund were paid by the Advisor. The Funds do not have an obligation to reimburse the Advisor or its affiliates for organizational and offering expenses paid on their behalf.
5. CAPITAL SHARE TRANSACTIONS
As of April 30, 2010, there was an unlimited number of no par value shares of beneficial interest authorized by the Trust. Shares are created and redeemed on a continuous basis at NAV only in groups of 50,000 shares called Creation Units. Except when aggregated in Creation Units, shares are not redeemable. Transactions in shares of the Funds are disclosed in detail in statement of changes in net assets. Only “Authorized Participants” may purchase or redeem shares directly from the Funds. An Authorized Participant is either (i) a broker-dealer or other participant in the clearing process through the Continuous Net Settlement System of National Securities Clearing Corporation or (ii) a Depository Trust Company (“DTC”) participant and, in each case, must have executed a Participant Agreement with the Distributor. Most retail investors will not qualify as Authorized Participants or have the resources to create and redeem whole Creation Units. Therefore, they will be unable to purchase or redeem the shares directly from the Funds. Rather, most retail investors will purchase shares in the secondary market with the assistance of a broker and will be subject to customary brokerage commissions or fees.
6. FEDERAL INCOME TAX
At April 30, 2010, the cost of investments and net unrealized appreciation (depreciation) for federal income tax purposes were as follows:
| Fund | Cost | Gross Unrealized Appreciation | Gross Unrealized Depreciation | Net Unrealized Appreciation/ (Depreciation) | ||||||||
| IQ Hedge Multi-Strategy Tracker ETF | $ | 84,622,821 | $ | 4,790,591 | $ | 533,434 | $ | 4,257,157 | ||||
| IQ Hedge Macro Tracker ETF | 9,676,388 | 569,236 | 18,539 | 550,697 | ||||||||
| IQ CPI Inflation Hedged ETF | 13,243,159 | 28,756 | 41,431 | (12,675 | ) | |||||||
| IQ ARB Global Resources ETF | 7,019,365 | 561,844 | 112,736 | 449,108 | ||||||||
| IQ ARB Merger Arbitrage ETF | 19,210,525 | 478,318 | 221,978 | 256,340 | ||||||||
| IQ Australia Small Cap ETF | 8,965,113 | 229,520 | 229,407 | 113 | ||||||||
| IQ Canada Small Cap ETF | 9,041,314 | 356,652 | 309,871 | 46,781 | ||||||||
| IQ South Korea Small Cap ETF | 2,462,569 | 129,560 | 44,613 | 84,947 | ||||||||
The differences between book and tax basis cost of investments and net unrealized appreciation (depreciation) are primarily attributable to wash sale loss deferrals and the realization for tax purposes of unrealized gains on investments in passive foreign investment companies held at April 30, 2010.
At April 30, 2010, the components of distributable earnings/loss on a tax-basis were as follows:
| Fund | Undistributed Net Investment Income | Undistributed Capital and Other Losses | Net Unrealized Appreciation (Depreciation) | Total Earnings (Losses) | |||||||||||
| IQ Hedge Multi-Strategy Tracker ETF | $ | 396,083 | $ | (2,143,066 | ) | $ | 3,772,591 | $ | 2,025,608 | ||||||
| IQ Hedge Macro Tracker ETF | — | (196,225 | ) | 501,123 | 304,898 | ||||||||||
| IQ CPI Inflation Hedged ETF | — | (11,613 | ) | (12,675 | ) | (24,288 | ) | ||||||||
| IQ ARB Global Resources ETF | 19,539 | 210,760 | 449,035 | 679,334 | |||||||||||
| IQ ARB Merger Arbitrage ETF | (3,604 | ) | 292,095 | 256,595 | 545,086 | ||||||||||
| IQ Australia Small Cap ETF | 26,595 | — | 117 | 26,712 | |||||||||||
| IQ Canada Small Cap ETF | 75,553 | — | 46,754 | 122,307 | |||||||||||
| IQ South Korea Small Cap ETF | (34,767 | ) | — | 84,949 | 50,182 | ||||||||||
The differences between book and tax basis components of net assets are primarily attributable to wash sale loss deferrals and other book and tax differences including foreign currency contracts, swap contracts and post-October losses.
45
Notes to Financial Statements (continued)
April 30, 2010
At April 30, 2010, the effect of permanent book/tax reclassifications resulted in increases (decreases) to the components of net assets as follows:
| Fund | Undistributed Net Investment Income (Accumulated Net Investment Loss) | Accumulated Net Realized Gain (Loss) on Investments | Paid-in Capital | ||||||||
| IQ Hedge Multi-Strategy Tracker ETF | $ | (88,319 | ) | $ | (336,742 | ) | $ | 425,061 | |||
| IQ Hedge Macro Tracker ETF | (1,903 | ) | 7,763 | (5,860 | ) | ||||||
| IQ CPI Inflation Hedged ETF | 7,110 | 6,616 | (13,726 | ) | |||||||
| IQ ARB Global Resources ETF | (1,077 | ) | 2,060 | (983 | ) | ||||||
| IQ ARB Merger Arbitrage ETF | (14,392 | ) | 14,413 | (21 | ) | ||||||
| IQ Australia Small Cap ETF | 124 | (124 | ) | — | |||||||
| IQ Canada Small Cap ETF | (20 | ) | 20 | — | |||||||
| IQ South Korea Small Cap ETF | (33,826 | ) | 33,935 | (109 | ) | ||||||
For financial reporting purposes, capital accounts are adjusted to reflect the tax character of permanent book/tax differences. Reclassifications are primarily due to the tax treatment of net operating losses, distribution reclassifications and foreign currency reclassifications.
The tax character of distributions paid during the period ended April 30, 2010 is as follows:
| Fund | Ordinary Income | |
| IQ Hedge Multi-Strategy Tracker ETF | $ | 646,883 |
| IQ Hedge Macro Tracker ETF | 61,910 | |
| IQ CPI Inflation Hedged ETF | — | |
| IQ ARB Global Resources ETF | 10,753 | |
| IQ ARB Merger Arbitrage ETF | 241 | |
| IQ Australia Small Cap ETF | — | |
| IQ Canada Small Cap ETF | — | |
| IQ South Korea Small Cap ETF | — | |
Capital losses incurred after October 31 (“Post-October Losses”) within the taxable year can be deemed to arise on the first business day of the Funds’ next taxable year. For the period ended April 30, 2010, the Funds incurred and elected to defer to May 1, 2010 post-October losses of:
| Fund | Post-October Currency Losses | Post-October Capital Losses | |||
| IQ Hedge Multi-Strategy Tracker ETF | $ | — | $ | 1,334,217 | |
| IQ Hedge Macro Tracker ETF | — | 121,334 | |||
| IQ CPI Inflation Hedged ETF | — | 11,614 | |||
| IQ ARB Global Resources ETF | 1,605 | 58,260 | |||
| IQ ARB Merger Arbitrage ETF | 14,413 | 10,736 | |||
| IQ Australia Small Cap ETF | — | — | |||
| IQ Canada Small Cap ETF | — | — | |||
| IQ South Korea Small Cap ETF | 34,767 | — | |||
46
Notes to Financial Statements (continued)
April 30, 2010
At April 30, 2010, the Funds listed below had net capital loss carryforwards for federal income tax purposes which are available for offset against future taxable net capital gains. The amounts were determined after adjustments for certain differences between financial reporting and tax purposes, such as wash sale losses. Accordingly, no capital gain distributions are expected to be paid to shareholders of these Funds until future net capital gains have been realized in excess of the available capital loss carryforwards. There is no assurance that any Fund will be able to utilize all of its capital loss carryforwards before they expire. These loss carryforwards expire in amounts and fiscal years as follows:
| Fund | April 30, 2018 | |
| IQ Hedge Multi-Strategy Tracker ETF | $ | 808,849 |
| IQ Hedge Macro Tracker ETF | 74,891 | |
| IQ CPI Inflation Hedged ETF | — | |
| IQ ARB Global Resources ETF | — | |
| IQ ARB Merger Arbitrage ETF | — | |
| IQ Australia Small Cap ETF | — | |
| IQ Canada Small Cap ETF | — | |
| IQ South Korea Small Cap ETF | — | |
7. INVESTMENT TRANSACTIONS
Purchases and sales of investments for the period ended April 30, 2010 are as follows:
| Fund | Purchases | Sales | Purchases In-Kind | Sales In-Kind | |||||||
| IQ Hedge Multi-Strategy Tracker ETF | $ | 94,433,942 | $ | 94,281,606 | $ | 76,555,967 | $ | 3,794,957 | |||
| IQ Hedge Macro Tracker ETF | 4,988,914 | 5,287,007 | 10,044,732 | — | |||||||
| IQ CPI Inflation Hedged ETF | 4,202,702 | 4,732,771 | 13,776,407 | — | |||||||
| IQ ARB Global Resources ETF | 9,072,783 | 9,597,556 | 7,237,292 | — | |||||||
| IQ ARB Merger Arbitrage ETF | 11,248,107 | 13,521,772 | 21,174,202 | — | |||||||
| IQ Australia Small Cap ETF | 299,329 | — | 8,648,014 | — | |||||||
| IQ Canada Small Cap ETF | 17,839 | — | 8,946,557 | — | |||||||
| IQ South Korea Small Cap ETF | 2,479,518 | 17,782 | — | — | |||||||
8. DERIVATIVE FINANCIAL INSTRUMENTS
Certain Funds in the Trust use total return swaps to achieve the same exposures as those of certain of their underlying index components. The Funds segregate liquid assets, which may include securities, cash or cash equivalents, to cover their daily marked-to-market net obligations under outstanding swap agreements. At April 30, 2010, the IQ Multi-Strategy Tracker ETF and IQ Macro Tracker ETF held $2,551,188 and $242,605, respectively, in cash as collateral for swaps.
Certain Funds may invest in futures contracts (“futures”) in order to replicate exposures to their respective underlying index components. Investments in futures may increase or leverage exposure to a particular market risk, thereby increasing price volatility of derivative instruments a Fund holds. No price is paid or received by a Fund upon the purchase or sale of a futures contract. Initially, a Fund is required to deposit with the broker an amount of cash or cash equivalents, known as initial margin, based on the value of the contract. Subsequent payments, called variation margin, to and from the broker, will be made on a daily basis as the price of the underlying instruments fluctuates, making the long and short positions in the futures contract more or less valuable, a process known as ‘marking-to-the-market.’ Once a final determination of variation margin is made, additional cash is required to be paid by or released to a Fund, and a Fund will realize a loss or gain.
47
Notes to Financial Statements (continued)
April 30, 2010
At April 30, 2010, the fair values of derivative instruments were as follows:
Asset Derivatives1
| Equity Risk | Total | ||||
| IQ Hedge Multi-Strategy Tracker ETF | $ | — | $ | — | |
| IQ Hedge Macro Tracker ETF | — | — | |||
| IQ CPI Inflation Hedged ETF | — | — | |||
| IQ ARB Global Resources ETF | 23,335 | 23,335 | |||
| IQ ARB Merger Arbitrage ETF | 253,965 | 253,965 | |||
| IQ Australia Small Cap ETF | — | — | |||
| IQ Canada Small Cap ETF | — | — | |||
| IQ South Korea Small Cap ETF | — | — | |||
| 1 | Statement of Assets and Liabilities location: Variation margin receivable. |
Liability Derivatives2
| Equity Risk | Total | ||||
| IQ Hedge Multi-Strategy Tracker ETF | $ | 484,566 | $ | 484,566 | |
| IQ Hedge Macro Tracker ETF | 49,574 | 49,574 | |||
| IQ CPI Inflation Hedged ETF | — | — | |||
| IQ ARB Global Resources ETF | — | — | |||
| IQ ARB Merger Arbitrage ETF | — | — | |||
| IQ Australia Small Cap ETF | — | — | |||
| IQ Canada Small Cap ETF | — | — | |||
| IQ South Korea Small Cap ETF | — | — | |||
| 2 | Statement of Assets and Liabilities location: Unrealized depreciation on swap transactions. |
Transactions in derivative instruments during the period ended April 30, 2010, were as follows:
| Equity Risk | Total | ||||||
| IQ Hedge Multi-Strategy Tracker ETF | |||||||
| Realized loss3 | |||||||
| Futures contracts | $ | (1,154,869 | ) | $ | (1,154,869 | ) | |
| Swap transactions | (995,828 | ) | (995,828 | ) | |||
| Total realized loss | $ | (2,150,697 | ) | $ | (2,150,697 | ) | |
| Unrealized depreciation4 | |||||||
| Swap transactions | $ | (484,566 | ) | $ | (484,566 | ) | |
| Total unrealized depreciation | $ | (484,566 | ) | $ | (484,566 | ) | |
| IQ Hedge Macro Tracker ETF | |||||||
| Realized loss3 | |||||||
| Futures contracts | $ | (38,030 | ) | $ | (38,030 | ) | |
| Swap transactions | (96,662 | ) | (96,662 | ) | |||
| Total realized loss | $ | (134,692 | ) | $ | (134,692 | ) | |
| Unrealized depreciation4 | |||||||
| Swap transactions | $ | (49,574 | ) | $ | (49,574 | ) | |
| Total unrealized depreciation | $ | (49,574 | ) | $ | (49,574 | ) | |
| IQ CPI Inflation Hedged ETF | |||||||
| Realized loss3 | |||||||
| Swap transactions | $ | (15,190 | ) | $ | (15,190 | ) | |
| Total realized loss | $ | (15,190 | ) | $ | (15,190 | ) | |
48
Notes to Financial Statements (continued)
April 30, 2010
| Equity Risk | Total | ||||||
| IQ ARB Global Resources ETF | |||||||
| Realized loss3 | |||||||
| Futures contracts | $ | (92,487 | ) | $ | (92,487 | ) | |
| Total realized loss | $ | (92,487 | ) | $ | (92,487 | ) | |
| Unrealized depreciation4 | |||||||
| Futures contracts | $ | (3,600 | ) | $ | (3,600 | ) | |
| Total unrealized depreciation | $ | (3,600 | ) | $ | (3,600 | ) | |
| IQ ARB Merger Arbitrage ETF | |||||||
| Realized loss3 | |||||||
| Futures contracts | $ | (88,919 | ) | $ | (88,919 | ) | |
| Total realized loss | $ | (88,919 | ) | $ | (88,919 | ) | |
| Unrealized appreciation4 | |||||||
| Futures contracts | $ | 71,025 | $ | 71,025 | |||
| Total unrealized appreciation | $ | 71,025 | $ | 71,025 | |||
| 3 | Statement of Operations location: Net realized gain (loss) from swap transactions, futures contracts or foreign currency transactions. |
| 4 | Statement of Operations location: Net change in net unrealized appreciation (depreciation) on swap transactions and futures contracts. |
For the period ended April 30, 2010, the monthly average values of the derivatives held by the Funds were as follows:
| Fund | Swap Contracts | Futures Contracts | |||||
| IQ Multi-Strategy ETF | $ | 1,615,668 | $ | (3,831,163 | ) | ||
| IQ Macro Tracker ETF | 207,147 | (448,453 | ) | ||||
| IQ CPI Inflation ETF | (1,449 | ) | — | ||||
| IQ ARB Global Resources ETF | — | (1,225,042 | ) | ||||
| IQ ARB Merger Arbitrage ETF | — | (2,284,558 | ) | ||||
9. RISKS INVOLVED WITH INVESTING IN THE FUNDS
The Funds are subject to the principal risks described below, some or all of these risks may adversely affect a Fund’s NAV, trading price, yield, total return and ability to meet its investment objective. As with any investment, an investment in a Fund could result in a loss or the performance of the Fund could be inferior to that of other investments.
Fund of Funds Risk*
Certain of the Funds’ investment performance, because they are funds of funds, depends on the investment performance of the Underlying ETFs in which they invest. An investment in any such Fund is subject to the risks associated with the Underlying ETFs that comprise its Underlying Index. Such a Fund will indirectly pay a proportional share of the asset-based fees, if any, of the Underlying ETFs in which it invests.
Index Risk
The Underlying Indexes are new and have limited historical performance data that is not predictive of future results. In addition, the Underlying Indexes and the Funds rebalance only on a monthly or quarterly basis, which may cause the performance of the Underlying Indexes and the Funds to deviate from that of the market exposure that they are trying to achieve.
| * | Applies to IQ Hedge Multi-Strategy Tracker ETF, IQ Hedge Macro Tracker ETF and IQ CPI Inflation Hedged ETF. |
49
Notes to Financial Statements (continued)
April 30, 2010
Tracking Error Risk
Each Fund’s performance may not match its Underlying Index during any period of time. Although each Fund attempts to track the performance of its Underlying Index, a Fund may not be able to duplicate its exact composition or return for any number of reasons, including but not limited to risk that the strategies used by the Advisor and MCM or Esposito, as applicable, to match the performance of the Underlying Index may fail to produce the intended results, liquidity risk and new fund risk, as well as the incurring of Fund expenses, which the Underlying Index does not incur.
Foreign Securities Risk
The Funds invest directly or indirectly (through Underlying ETFs) in the securities of non-U.S. issuers, which involves risks beyond those associated with investments in U.S. securities. These additional risks include greater market volatility, the availability of less reliable financial information, higher transactional and custody costs, taxation by foreign governments, decreased market liquidity and political instability.
Small Capitalization Companies Risk**
Certain of the Funds invest primarily in the stocks of small capitalization companies, which may be more volatile than those of larger companies. Stock prices of small capitalization companies are also more vulnerable than those of large capitalization companies to adverse business and economic developments, and the stocks of small capitalization companies may be thinly traded, making it difficult to buy and sell them.
New Fund Risk
The Funds are new funds. As new funds, there can be no assurance that the Funds will grow to or maintain an economically viable size, in which case the Funds may experience greater tracking error to their Underlying Indexes than they otherwise would be at higher asset levels or they could ultimately liquidate.
| ** | Applies to IQ Australia Small Cap ETF, IQ Canada Small Cap ETF and IQ South Korea Small Cap ETF. |
10. UNAUDITED TAX INFORMATION
Qualified Dividend Income — Certain dividends paid by the Fund may be subject to a maximum tax rate of 15%, as provided for by the Jobs and Growth Tax Relief Reconciliation Act of 2003. The percentage of ordinary income distributions for the period ended April 30, 2010 taxed at a maximum rate of 15% is as follows:
| IQ Hedge Multi-Strategy Tracker ETF | 16.34 | % |
| IQ Hedge Macro Tracker ETF | 44.63 | % |
| IQ CPI Inflation Hedged ETF | 0.00 | % |
| IQ ARB Global Resources ETF | 15.50 | % |
| IQ ARB Merger Arbitrage ETF | 3.05 | % |
| IQ Australia Small Cap ETF | 0.00 | % |
| IQ Canada Small Cap ETF | 0.00 | % |
| IQ South Korea Small Cap ETF | 0.00 | % |
Dividends Received Deduction — For corporate shareholders, the percentage of ordinary income distributions for the period ended April 30, 2010 that qualifies for the dividends received deduction is as follows:
| IQ Hedge Multi-Strategy Tracker ETF | 0.00 | % |
| IQ Hedge Macro Tracker ETF | 0.00 | % |
| IQ CPI Inflation Hedged ETF | 0.00 | % |
| IQ ARB Global Resources ETF | 7.60 | % |
| IQ ARB Merger Arbitrage ETF | 8.65 | % |
| IQ Australia Small Cap ETF | 0.00 | % |
| IQ Canada Small Cap ETF | 0.00 | % |
| IQ South Korea Small Cap ETF | 0.00 | % |
50
Notes to Financial Statements (continued)
April 30, 2010
Foreign Taxes Paid — The following Funds elect under the Internal Revenue Code Section 853 to pass through foreign taxes paid to their shareholders. The total amounts of foreign taxes passed through to shareholders on a per share basis for the period ended April 30, 2010, are as follows:
| Foreign Taxes Per Share | ||
| IQ Hedge Multi-Strategy Tracker ETF | $ | — |
| IQ Hedge Macro Tracker ETF | — | |
| IQ CPI Inflation Hedged ETF | — | |
| IQ ARB Global Resources ETF | 0.0129 | |
| IQ ARB Merger Arbitrage ETF | — | |
| IQ Australia Small Cap ETF | 0.0003 | |
| IQ Canada Small Cap ETF | 0.0017 | |
| IQ South Korea Small Cap ETF | — | |
11. SUBSEQUENT EVENTS
The Funds have adopted authoritative standards of accounting for and disclosure of, events that occur after the Statement of Assets and Liabilities date but before financial statements are issued or are available to be issued. These standards require the Funds to recognize in the financial statements the effects of all recognized subsequent events that provide additional evidence about conditions that existed at the date of the Statements of Assets and Liabilities. For non-recognized subsequent events that must be disclosed to keep the financial statements from being misleading, the Funds are required to disclose the nature of the event as well as an estimate of its financial effect, or a statement that such an estimate cannot be made. The Funds have evaluated subsequent events through the date of issuance of this report and have determined that there are no material events that would require disclosure.
51
Report of Independent Registered Public Accounting Firm
To the Board of Trustees and Shareholders of IndexIQ ETF Trust:
We have audited the accompanying statements of assets and liabilities, including the schedules of investments, of IQ Hedge Multi-Strategy Tracker ETF, IQ Hedge Macro Tracker ETF, IQ CPI Inflation Hedged ETF, IQ ARB Global Resources ETF, IQ ARB Merger Arbitrage ETF, IQ Australia Small Cap ETF, IQ Canada Small Cap ETF and IQ South Korea Small Cap ETF (eight of the funds constituting the IndexIQ ETF Trust) (the “Funds”), as of April 30, 2010, and the related statements of operations and the changes in net assets and the financial highlights for the periods indicated therein. These financial statements and financial highlights are the responsibility of the Funds’ management. Our responsibility is to express an opinion on these financial statements and financial highlights based on our audits.
We conducted our audit in accordance with the standards of the Public Company Accounting Oversight Board (United States). Those standards require that we plan and perform the audit to obtain reasonable assurance about whether the financial statements and financial highlights are free of material misstatement. We were not engaged to perform an audit of the Funds’ internal control over financial reporting. Our audits included consideration of internal control over financial reporting as a basis for designing audit procedures that are appropriate in the circumstances, but not for the purpose of expressing an opinion on the effectiveness of the Funds’ internal control over financial reporting. Accordingly, we express no such opinion. An audit also includes examining, on a test basis, evidence supporting the amounts and disclosures in the financial statements and financial highlights, assessing the accounting principles used and significant estimates made by management, and evaluating the overall financial statement presentation. Our procedures included confirmation of securities owned as of April 30, 2010, by correspondence with the custodian and brokers or by other appropriate auditing procedures where replies from brokers were not received. We believe that our audits provide a reasonable basis for our opinion.
In our opinion, the financial statements and financial highlights referred to above present fairly, in all material respects, the financial position of the funds constituting the IndexIQ ETF Trust at April 30, 2010, and the results of its operations, the changes in its net assets and the financial highlights for the periods indicated therein, in conformity with U.S. generally accepted accounting principles.

New York, New York
June 28, 2010
52
Board Review of Investment Advisory and Sub-Advisory Agreements (unaudited)
General Background
IndexIQ Advisors LLC (“Advisor”) acts as the Trust’s investment advisor and has been appointed by the Trust to provide to the Funds directly, or to arrange for the provision through third parties of, investment advisory services pursuant to an investment advisory agreement with the Funds (the “Investment Advisory Agreement”). The Advisor is a registered investment adviser under the U.S. Investment Advisers Act of 1940, as amended (the “Advisers Act”). Each Fund pays the Advisor a fee for its investment advisory services as a percentage of the Fund’s assets. That fee is accrued daily and payable monthly at an annual rate of the Fund’s average daily net assets as follows:
| IQ Hedge Multi-Strategy Tracker ETF | 0.75 | % |
| IQ Hedge Macro Tracker ETF | 0.75 | % |
| IQ CPI Inflation Hedged ETF | 0.48 | % |
| IQ ARB Merger Arbitrage ETF | 0.75 | % |
| IQ ARB Global Resources ETF | 0.75 | % |
| IQ Australia Small Cap ETF | 0.69 | % |
| IQ Canada Small Cap ETF | 0.69 | % |
| IQ South Korea Small Cap ETF | 0.79 | % |
| IQ Taiwan Small Cap ETF | 0.79 | % |
The Advisor has arranged for the provision of investment advisory services by a third party pursuant to a sub-advisory agreement between the Advisor and Mellon Capital Management Corporation (“MCM”), a registered investment adviser under the Advisers Act (the “MCM Investment Sub-Advisory Agreement”) for all funds other than the IQ ARB Merger Arbitrage ETF. The Advisor pays MCM a fee for its investment advisory services. That fee is accrued daily and payable monthly at an annual rate of 0.12% of the Funds’ (excluding IQ CPI Inflation Hedged ETF) average daily net assets up to $100 million and at an annual rate of 0.07% of the Funds’ (excluding IQ CPI Inflation Hedged ETF) average daily net assets in excess of $100 million (for the IQ CPI Inflation hedged ETF, the annual rates are 0.08% and 0.04%, respectively, of average daily net assets). With respect to the IQ ARB Merger Arbitrage ETF, the Advisor has entered into a sub-advisory agreement with Esposito Partners, LLC (“Esposito”), a registered investment adviser under the Advisers Act (the “Esposito Investment Sub-Advisory Agreement” and together with the MCM Investment Sub-Advisory Agreement, the “Investment Sub-Advisory Agreements”). The Advisor pays Esposito a fee for its investment advisory services. That fee is accrued daily and payable monthly at an annual rate of 0.08% of the Fund’s average daily net assets up to $100 million and at an annual rate of 0.04% of the Fund’s average daily net assets in excess of $100 million.
Annual Approval Process
The Trust’s Board of Trustees (the “Board”), including those Trustees who would not be considered “interested persons” of the Trust (the “Independent Trustees”), as that term is defined in the Investment Company Act of 1940, as amended, voting separately, is legally required to review and approve the Investment Advisory Agreement and the Investment Sub-Advisory Agreements initially and thereafter annually following the completion of an initial two year term. In determining whether it was appropriate to approve the Investment Advisory Agreement and the Investment Sub-Advisory Agreements, the Board requested from the Advisor, MCM and Esposito information that the Board believed to be reasonably necessary to reach its conclusion. At an “in-person” meeting held on March 16, 2010 (the “Meeting”), the Board discussed issues pertaining to the proposed approval of the Investment Advisory Agreement and the Investment Sub-Advisory Agreements with representatives from the Advisor and with legal counsel, including a separate consultation between the Independent Trustees and legal counsel. This information formed the primary basis for the Trustees’ determinations. During the Meeting the Trustees reviewed a memorandum which detailed the duties and responsibilities of the Trustees with respect to their consideration of the Investment Advisory Agreement and the Investment Sub-Advisory Agreements. The Trustees reviewed the contract approval materials provided by the Advisor, MCM and Esposito, including, but not limited to (1) organizational overviews of the Advisor, MCM and Esposito and biographies of the personnel providing services to the Funds, (2) a copy of the Investment Advisory Agreement and the Investment Sub-Advisory Agreements, (3) Forms ADV of the Advisor, MCM and Esposito, and (4) exchange-traded fund and mutual fund industry fee comparison data.
53
Board Review of Investment Advisory and Sub-Advisory Agreements (unaudited) (continued)
In view of the broad scope and variety of factors and information reviewed by the Board, the Board did not find it practicable to, and did not, make specific assessments of, quantify, or otherwise assign relative weights to the specific factors considered in reaching its conclusions and determinations to approve the Investment Advisory Agreement and the Investment Sub-Advisory Agreements. The Board did not identify any particular information that was all-important or controlling. The approval determination was made on the basis of each Trustee’s business judgment after consideration of all of the factors taken as a whole, although individual Trustees may have given different weights to certain factors and assigned various degrees of materiality to conclusions made.
Specifically, the Board reviewed information that included: (1) the nature, extent, quality and costs of the services that the Advisor, MCM and Esposito are expected to provide to the Funds; (2) the management philosophies, personnel and processes of the Advisor, MCM and Esposito; (3) the structures of the Advisor, MCM and Esposito and their ability to provide services to the Funds, based on their financial condition, as well as the credentials, reputation, background and investment experience of its personnel; (4) the anticipated costs of services provided and the projected profits to be realized by the Advisor, MCM and Esposito and their affiliates from the relationship with the Funds; and (5) the economies of scale, or lack thereof in the case of the Advisor, in the structure of the affiliation of the Advisor, MCM and Esposito with the Funds and whether such factor impacts the performance for investors as the Funds grow. The Advisor had no prior performance figures to be considered.
The Board gave substantial consideration to the fees payable under the Advisory Agreement. In this connection, the Board evaluated the Advisor’s anticipated costs and profitability in serving as investment adviser to the Funds, including the costs associated with the personnel, systems and equipment necessary to manage the Funds and the costs associated with compensating the Sub-Advisor. The Board also examined the fees to be paid by each Fund in light of fees paid to other investment managers by comparable funds and the method of computing each Fund’s fee. After comparing the fees with those of comparable funds and in light of the quality and extent of services to be provided and the costs anticipated to be incurred by the Advisor, the Board concluded that the level of the fees paid to the Advisor with respect to each Fund is fair and reasonable.
Approval of Investment Advisory Agreement and the Investment Sub-Advisory Agreements
At the Meeting, based on its conclusions, and with the assistance of counsel, the Board including the Independent Trustees determined that the proposed agreements with the Advisor and MCM and the Advisor and Esposito were fair and reasonable. Accordingly, the Board voted, and the Independent Trustees voted separately, to unanimously approve the Investment Advisory Agreement and the Investment Sub-Advisory Agreements.
54
Board of Trustees and Officers (unaudited)
The business of the Trust is managed under the direction of the Trust’s Board of Trustees. The Board elects the officers of the Trust who are responsible for administering the Trust’s day-to-day operations. Each Trustee serves until his or her successor is duly elected or appointed and qualified.
The name, year of birth, address and principal occupations during the past five years for each Trustee and officer of the Trust is set forth below, along with the other public directorships held by the Trustees.
| Independent Trustees | ||||||||||
| Name and Year of Birth1 | Position(s) Held with Trust | Term of Office and Length of Time Served2 | Principal Occupation(s) During Past 5 Years3 | Number of Portfolios in Fund Complex Overseen by Trustee4 | Other Directorships Held by Trustee | |||||
| Reena Aggarwal 1957 | Trustee | Since August 2008 | Deputy Dean, McDonough School of Business, Georgetown University (2006 to 2008); Visiting Professor of Finance, Sloan School of Management, MIT (2005-2006); Interim Dean, McDonough School of Business, Georgetown University (2004-2005); Stallkamp Faculty Fellow and Professor of Finance, McDonough School of Business, Georgetown University (2003-Present). | 10 | FBR Funds (11 portfolios) | |||||
| Gene Chao 1970 | Trustee | Since August 2008 | Vice President — Strategic Services, Dimension Data, Americas (2007 to present); Senior Vice President — Strategic Outsourcing, France Telecom Americas (2004-2007); Managing Director — Business Consulting, Xansa, North America (2003-2004). | 10 | None | |||||
| Interested Trustee5 | ||||||||||
| Adam S. Patti 1970 | Chairman and Trustee President and Principal Executive Officer | Since November 2008 Since July 2008 | Chairman, Trustee, President and Principal Executive, IndexIQ Trust (2008 to present); Chief Executive Officer, the Advisor (2007 to present); Chief Executive Officer, IndexIQ (2006 to present); Associate Publisher, Time Inc. (2006); Executive Director, Time Inc. (2005); Director, Time Inc. (2003 to 2004). | 10 | None | |||||
| Officers of the Trust | ||||||
| Name and Year of Birth1 | Position(s) Held with Trust | Term of Office and Length of Time Served | Principal Occupation(s) During Past 5 Years | |||
| Gregory D. Bassuk 1972 | Secretary | Since July 2008 | Chief Compliance Officer, the Advisor (2008 to present); Secretary, IndexIQ Trust (2008 to present); Chairman and Trustee, IndexIQ ETF Trust (July 2008 to November 2008); Chairman and Trustee, IndexIQ Trust (February 2008 to November 2008); Chief Operating Officer, the Advisor (2007 to present); Chief Operating Officer, IndexIQ (2006 to present); Director, Time Inc. (2004 to 2006). | |||
| David Fogel 1971 | Treasurer, Principal Financial Officer and Chief Compliance Officer | Since October 2008 | Treasurer, Principal Financial Officer and Chief Compliance Officer, IndexIQ Trust (2008 to present); Executive Vice President, IndexIQ (2006 to present); Vice President, Groton Partners LLC (2005 to 2006); Principal, Circle Peak Capital LLC (2003 to 2005). | |||
| 1 | The address of each Trustee or officer is c/o IndexIQ, 800 Westchester Avenue, Suite N-611, Rye Brook, New York 10573. |
| 2 | Trustees and Officers serve until their successors are duly elected and qualified. |
| 3 | Principal occupation(s) of the Trustees may cover more than the past five years. |
| 4 | The Funds are part of a “fund complex” as defined in the 1940 Act. The fund complex includes all open-end funds (including all of their portfolios) advised by the Advisor and any funds that have an investment advisor that is an affiliated person of the Advisor. |
| 5 | Mr. Patti is an “interested person” of the Trust (as that term is defined in the 1940 Act) because of his affiliations with the Advisor. |
55
ANNUAL REPORT | APRIL 30, 2010
IndexIQ ETF Trust

IQ Hedge Multi-Strategy Tracker ETF
IQ Hedge Macro Tracker ETF
IQ CPI Inflation Hedged ETF
IQ ARB Global Resources ETF
IQ ARB Merger Arbitrage ETF
IQ Australia Small Cap ETF
IQ Canada Small Cap ETF
IQ South Korea Small Cap ETF
Investment Advisor
IndexIQ Advisors LLC
800 Westchester Avenue,
Suite N-611
Rye Brook, NY 10573
Sub-Advisor
Mellon Capital Management Corp.
50 Fremont Street, Suite 3900
San Francisco, CA 94105
Distributor
ALPS Distributors, Inc.
1290 Broadway, Suite 1100
Denver, CO 80203
Custodian/Fund Administrator/Transfer Agent
The Bank of New York Mellon
One Wall Street
New York, NY 10286
Legal Counsel
Katten Muchin Rosenman, LLP
575 Madison Avenue
New York, New York 10022
Independent Registered Public Accounting Firm
Ernst & Young LLP
Five Times Square
New York, NY 10036
Item 2. Code of Ethics.
a). The Registrant has adopted a code of ethics that applies to the Registrant’s Principal Executive Officer, Principal Financial Officer or persons performing similar functions.
b). There have not been any changes to the Code of Ethics.
c). Not Applicable
d). During the period, Registrant granted no waivers from the provisions of its code of ethics that applies to the Registrant's Principal Executive Officer, Principal Financial Officer or persons performing similar functions.
e). Not Applicable
f). Attached
Item 3. Audit Committee Financial Expert.
a). The Registrant’s Board of Trustees has one audit committee financial expert serving on its audit committee, an “independent” Trustee, Reena Aggarwal. Under applicable securities laws, a person who is determined to be an audit committee financial expert will not be deemed an “expert” for any purpose, including without limitation for the purposes of Section 11 of the Securities Act of 1933, as a result of being designated or identified as an audit committee financial expert. The designation or identification of a person as an audit committee financial expert does not impose on such person any duties, obligations, or liabilities that are greater than the duties, obligations, and liabilities imposed on such person as a member of the audit committee and Board of Trustees in the absence of such designation or identification.
Item 4. Principal Accountant Fees and Services.
a). Audit Fees: the aggregate fees billed in each of the last two fiscal years for professional services rendered by the principal accountant for the audit are as follows:
| 2010: | $125,000 |
| 2009: | $28,000 |
b). Audit-Related Fees: the aggregate fees billed in each of the previous last two fiscal years for assurance and related services by the principal accountant that are principally related to the
Registrant’s tax return reviews and are not reported under paragraph (a) of this item are as follows:
| 2010: | $22,500 |
| 2009: | $1,500 |
c). Tax Fees, the aggregate fees billed in each of the previous last two fiscal years for professional services rendered by the principal accountant for tax compliance, tax advice, and tax planning are as follows:
| 2010: | $36,400 |
| 2009: | $0 |
d). All Other Fees, the aggregate fees billed in each of the last two fiscal years for products and services provided by the principal accountant, other than the services reported in paragraphs (a) and (c) of this Item are as follows:
| 2010: | $0 |
| 2009: | $0 |
e) Audit Committee Pre-Approval Policies and Procedures.
(i) Per Rule 2-01(c)(7)(A), the Audit Committee pre-approves all of the Audit, Audit-Related, Tax and Other Fees of the Registrant.
(ii) 100% of services described in each of Items 4(b) through (d) were approved by the audit committee pursuant to paragraph (c)(7)(A) of Rule 2-01 of Regulation S-X.
(f) No response required.
(g) The aggregate non-audit fees billed by the Registrant's accountant for services rendered to the Funds, the Advisor or any entity controlling, controlled by, or under common control with the Advisor that provides ongoing services to the Registrant (except for any sub-advisor whose role is primarily portfolio management and is subcontracted with or overseen by another investment advisor) that directly impacted the Funds for the period ended April 30, 2010 were as follows:
| 2010: | $58,900 |
| 2009: | $29,500 |
(h) Not Applicable
Item 5. Audit Committee of Listed Registrants.
(a) The Fund has a designated Audit Committee in accordance with Section 3(a)(58)(A) of the Securities and Exchange Act of 1934 (the “Exchange Act”) and the members of such committee are Reena Aggarwal and Gene Chao.
(b) Not applicable.
Item 6. Schedule of Investments.
| (a) | Schedule is included as part of the report to shareholders filed under Item 1 of this Form. |
| (b) | Not applicable. |
Item 7. Disclosure of Proxy Voting Policies and Procedures for Closed-End Management Investment Companies.
Not applicable.
Item 8. Portfolio Managers of Closed-End Management Investment Companies.
Not applicable.
Item 9. Purchases of Equity Securities by Closed-End Management Investment Company & Affiliated Purchasers.
Not applicable.
Item 10. Submission of Matters to a Vote of Security Holders.
Not applicable.
Item 11. Controls and Procedures.
| (a) | The Principal Executive Officer and Principal Financial Officer have evaluated the Registrant's disclosure controls and procedures within 90 days of the filing date of this report and have concluded that these controls and procedures are effective. |
| (b) | There were no significant changes in the Registrant's internal controls over financial reporting or in other factors that could significantly affect these controls subsequent to the date of their evaluation. |
Item 12. Exhibits.
(a) Any code of ethics, or amendment thereto, that is the subject of the disclosure required by Item 2, to the extent that the Registrant intends to satisfy the Item 2 requirements through filing of an exhibit: Attached
(b) Separate certifications for each Principal Executive Officer and Principal Financial Officer of the Registrant as required by Rule 30a-2(a) under the 1940 Act (17CFR 270.30a-(a)).
SIGNATURES
Pursuant to the requirements of the Securities Exchange Act of 1934 and the Investment Company Act of 1940, the Registrant has duly caused this report to be signed on its behalf by the undersigned, thereunto duly authorized.
| Registrant: IndexIQ ETF Trust | |
| By: /s/ Adam S. Patti | |
| Adam S. Patti, Principal Executive Officer | |
| Date: June 28, 2010 | |
Pursuant to the requirements of the Securities Exchange Act of 1934 and the Investment Company Act of 1940, this report has been signed below by the following persons on behalf of the Registrant and in the capacities and on the dates indicated.
| Registrant: IndexIQ ETF Trust |
| By: /s/ Adam S. Patti |
| Adam S. Patti, Principal Executive Officer |
| Date: June 28, 2010 |
| By: /s/ David L. Fogel |
| David L. Fogel, Principal Financial Officer |
| Date: June 28, 2010 |