FOR IMMEDIATE RELEASE
Fincera Reports First Quarter 2018 Financial Results
Shijiazhuang, Hebei Province, China – July 5, 2018 – Fincera Inc. (“Fincera” or the “Company”) (OTCQB: YUANF), a leading provider of web-based financing and ecommerce services for small and medium-sized businesses and individuals in China, today reported financial results for the first quarter ended March 31, 2018.
2018 First Quarter Financial Highlights
●
Income for the three months ended March 31, 2018, was RMB227.6 million (US$36.2 million), compared to RMB244.1 million in the prior-year period.
●
Net income of RMB103.5 million (US$16.5 million) compared to a net loss of RMB17.7 million in the prior-year period.
Operational Highlights
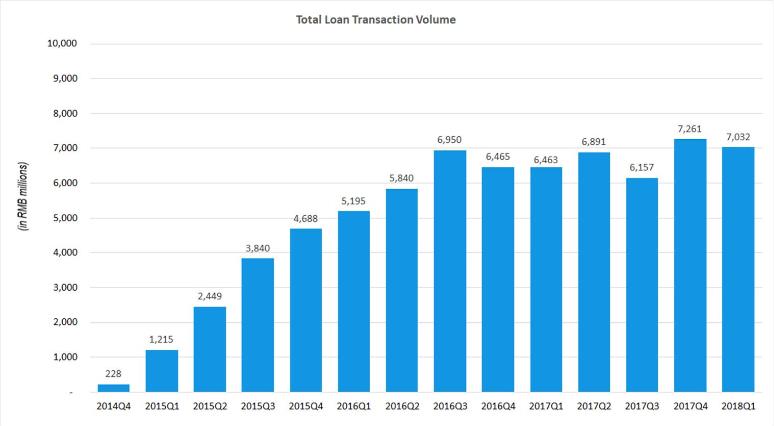
Loan transaction volume across all loan types for the first quarter of 2018 totaled approximately RMB7.0 billion (US$1.1 billion), an increase of approximately 8.8% compared to approximately RMB6.5 billion in the first quarter of 2017.
30-day Lines of Credit
Fincera issues interest-free revolving credit lines to small and medium-sized businesses (“SMBs”) to fund their short-term working capital needs. The credit lines have a 30-day billing cycle. Outstanding balances after the bill due date are considered delinquent and subject to certain penalties. Fincera collaborates with cooperative borrowers in delinquency to help them bring their accounts into good standing.
Similar to credit cards, Fincera’s credit lines contain no fees for borrowers as long as any outstanding balances are paid in full each month. Fincera generates revenue primarily by charging transaction fees, which are currently approximately 2.4%. Merchants may use funds received from transactions to make payments to other users or merchants, or to cash out the funds via transfer to a bank account. Credit line users are subject to an application and credit approval process and are required to provide us with guarantees and collateral. For certain payments, such as driver salary payments, a fee is charged to the borrower as the merchant in these scenarios typically will not accept paying a fee for such a transaction.
In the first quarter of 2018, Fincera facilitated RMB3.8 billion (US$0.6 billion) in 30-day lines of credit transactions.
180-Day Term Loans
Currently, Fincera’s 180-day term loans accrue interest at 4.25% (or 8.62% on an annualized basis). Fincera charges a facilitation fee between 2%-5% depending on the type of the loan. The fee portion is collected by the Company while the investor holding the loan at maturity receives the interest payment. In addition, the borrower remits 5%-8% of the principal loan balance to the Company as a security deposit that is refunded to the borrower upon timely repayment of principal and interest. Payment of principal and interest is due in a lump sum at the maturity date at the end of the 180-day term. Outstanding balances after the maturity date are considered delinquent. In the event of delinquency, the Company will keep the security deposit as a one-time penalty fee and may assess additional penalties. Fincera collaborates with cooperative borrowers in delinquency to help them bring their accounts into good standing.
In the first quarter of 2018, Fincera facilitated RMB1.9 billion (US$0.3 billion) in 180-day term loans.
Installment Loans
Fincera offers installment loans primarily to fund purchases of trucks and consumer discretionary goods and services in December 2016, with the borrowed purchase funds being transferred directly to the merchant via Fincera’s payment network. Based on the term of the loan and the type of purchase, Fincera charges a merchant fee of between 6.9%-8.6% on the transaction and requires some borrowers to provide collateral to partially secure their obligations. Terms of these installment loans may vary between three and 24 months; however, the majority of the installment loans carry a term of 12 months.
In the first quarter of 2018, Fincera facilitated RMB1.3 billion (US$0.2 billion) in installment loans.
Operational Updates
Fincera is pleased to announce that it has made progress with certain corporate initiatives, including:
●
Increasing focus and efforts on facilitating sales of delinquent loans to regional third-party collection agencies;
●
Implementing mobile app solutions for its sales personnel to enhance its data-driven sales process and increase customer conversion through offline channels; and
●
Completing the implementation of a fund custody system with XWBank as its custodian for all customer accounts.
Management Commentary
Mr. Jason Wang, CFO of Fincera, stated, “We were pleased to begin 2018 on a strong note, achieving 8.8% in year-over-year loan transaction volume growth across all loan types for a total of RMB7.0 billion in the first quarter of the year. As we mentioned in our year-end 2017 earnings report, the Company made several changes to its products and services in the second half of 2017 to maintain compliance with government regulations that recently went into effect in China. We have continued to see strong demand for our products, returned to profitability on lower operating costs and expenses, enhanced our sales platform with data-driven mobile app solutions, and reduced our financial exposure by selling underperforming loans to third parties.”
Currency Conversion
This release contains approximate translations of certain RMB amounts into US$ for convenience. Unless otherwise noted, all translations from RMB to US$ are made at a rate of USD1.00 = RMB6.2881 on March 30, 2018, representing the certificated exchange rate published by the People’s Bank of China’s Monetary Policy Division. No representation is intended to imply that the RMB amounts could have been, or could be, converted, realized or settled into US$ at such rate, or at any other rate.
First Quarter 2018 Financial Results
Income (Revenues)
The table below sets forth certain line items from the Company’s Consolidated Statement of Income as a percentage of income:
(RMB in thousands) | Three months ended March 31, 2018 | Three months ended March 31, 2017 | |
| | | | | | |
| Facilitation fee | 94,814 | 41.7% | - | - | N/A |
| Interest income | 50,174 | 22.0% | 44,890 | 18.4% | 11.8% |
| Service charges | 225 | 0.1% | 105,581 | 43.3% | -99.8% |
| Property lease and management | 51,325 | 22.6% | 41,604 | 17.0% | 23.4% |
| Other income | 31,059 | 13.6% | 52,060 | 21.3% | -40.3% |
| Total income | 227,597 | 100.0% | 244,135 | 100.0% | -6.8% |
●
Total income for the three months ended March 31, 2018, decreased 6.8% to RMB227.6 million (US$36.2 million), from RMB244.1 million in the prior-year period.
●
Facilitation fees, which represent upfront fees charged for facilitating loan transactions via Fincera’s marketplace lending platform, totaled RMB94.8 million (US$15.1 million) during the three months ended March 31, 2018. The Company began charging these fees in July 2017 when Fincera redeveloped its loan transaction process to comply with online lending regulations.
●
Interest income, which represents interest earned on CeraVest loans held by the Company, increased 11.8% to RMB50.2 million (US$8.0 million) in the three months ended March 31, 2018, from RMB44.9 million in the prior-year period, mainly due to an increase in the amount of loans made by the Company directly to certain third-parties.
●
Service charges, which represent CeraPay transaction fees, decreased 99.8% to RMB0.2 million (US$0.04 million) in the three months ended March 31, 2018, from RMB105.6 million in the prior-year period. Since July 2017, CeraPay loan transactions have been facilitated through a revised transaction process via Fincera’s peer-to-peer lending platform. As a result, the service charges earned under the previous transaction process are now allocated as a facilitation fee to the Company and as interest payable to investors of each loan once the facilitation is successful. Thus, service charges have declined drastically since July 2017, and the Company anticipates it will eventually discontinue reporting this revenue item in future financial reports.
●
Property lease and management revenues increased 23.4% to RMB51.3 million (US$8.2 million) in the three months ended March 31, 2018, compared to RMB41.6 million in the prior-year period. The average occupancy rate of the Kaiyuan Finance Center during the quarter ended March 31, 2018, increased to 85%, compared to 64% during the prior-year period. Income from the Company’s hotel operation at the Kaiyuan Finance Center also increased during the period.
●
Other income is mainly comprised of late payment fees (penalty income) from both CeraPay and CeraVest. Other income decreased 40.3% to RMB31.1 million (US$4.9 million) in the three months ended March 31, 2018, compared to RMB52.1 million in the prior-year period due to the strengthening of collection efforts and the sale of delinquent loans to third parties during the quarter.
Operating Costs and Expenses
●
The Company’s operating costs and expenses decreased 65.8% to RMB92.4 million (US$14.7 million) in the three months ended March 31, 2018, from RMB270.3 million in the prior-year period, primarily due to decreased interest expense, provision for credit losses and selling and marketing expenses. Interest expense decreased as a result of the change to our new business model in July 2017 in response to new regulations in China. Under the new business model, loans that are successfully subscribed to by investors on the Company’s peer-to-peer lending platform are derecognized from the Company’s balance sheet. Therefore, interest due to these investors is also not recognized by the Company. In addition, large amounts of underperforming loans were sold to third parties during the quarter, which resulted in a reduction to the provision for credit losses, a portion of which is allocated to selling and marketing expenses as an accrued marketing expense per the Company’s accounting policies, resulting in a reversal of selling and marketing expenses during the first quarter of 2018.
Income (Loss) from Continuing Operations Before Income Taxes
●
Income from continuing operations before income taxes totaled RMB135.2 million (US$21.5 million) in the three months ended March 31, 2018, compared to a loss of RMB26.2 million in the prior-year period, primarily as a result of the decreased operating costs and expenses mentioned above.
Income from Discontinued Operations, Net of Taxes
●
Income from discontinued operations, net of taxes, totaled RMB2.7 million (US$0.4 million) in the three months ended March 31, 2018, compared to RMB5.5 million in the prior-year period. The Company continues the winding down of its legacy truck-leasing business, which is classified as discontinued operations. This income is a result of the collection of overdue traditional leasing receivables, thus reversing the corresponding provision recorded against them on the Company’s financial statements.
Net Income (Loss)
●
Net income improved to RMB103.5 million (US$16.5 million) in the three months ended March 31, 2018, from a net loss of RMB17.7 million in the prior-year period.
Balance Sheet Highlights
At March 31, 2018, Fincera’s cash and cash equivalents (not including restricted cash) were RMB1.2 billion, compared to RMB1.1 billion at December 31, 2017. Total liabilities were RMB6.0 billion and stockholders’ equity was RMB182.3 million, compared to RMB6.9 billion and negative RMB119.6 million, respectively, at March 31, 2018 and December 31, 2017. The increase in stockholders’ equity was primarily a result of a transaction into which the Company entered to exchange debt for equity during the quarter. During the first quarter of 2018, the Company issued RMB188.6 million (US$30.0 million) in shares to Mr. Yong Hui Li, its Chairman and CEO, as repayment of certain debts. The repayment consisted of an RMB22.0 million (US$3.5 million) partial repayment of a loan Mr. Li had previously provided to the Company in March 2017 and payment of RMB166.6 million (US$26.5 million) still owed to Mr. Li from the US$2.00 per share dividend the Company declared in June 2017. The resulting issuance of 1.32 million shares was calculated using the trailing 90 trading day average price of US$22.71 per share.
About Fincera Inc.
Founded in 2005, Fincera Inc. (OTCQB: YUANF) provides innovative web-based financing and ecommerce services for small and medium-sized businesses and individuals in China. The Company also operates a network of branch offices in 31 provinces, municipalities, and autonomous regions across China. Fincera’s primary service offerings include a credit advance/online payment-processing network and a web-based small business lending platform. The Company’s website is http://www.fincera.net. Fincera trades on the OTCQB venture stage marketplace for early stage and developing U.S. and international companies. OTCQB companies are current in their reporting and undergo an annual verification and management certification process.
Safe Harbor Statement
This press release may contain forward-looking statements within the meaning of the Private Securities Litigation Reform Act of 1995 about the Company. Forward-looking statements are statements that are not historical facts. Such forward-looking statements, based upon the current beliefs and expectations of the Company's management, are subject to risks and uncertainties, which could cause actual results to differ from the forward-looking statements. The following factors, among others, could cause actual results to materially differ from those set forth in the forward-looking statements:
●
changing principles of generally accepted accounting principles;
●
outcomes of any government or government-related reviews, inquiries, investigations, and related litigation;
●
continued compliance with government regulations;
●
legislation or regulatory environments, requirements or changes adversely affecting the financial services industry in China;
●
fluctuations in consumer demand;
●
management of rapid growth;
●
general economic conditions;
●
changes in government policy;
●
fluctuations in sales of commercial vehicles in China;
●
China’s overall economic conditions and local market economic conditions;
●
the Company’s business strategy and plans, including its ability to expand through strategic acquisitions, the establishment of new locations, the discontinuance of certain products and services, and the introduction of new products and services;
●
the Company’s ability to successfully integrate acquisitions;
●
credit risk affecting the Company’s revenue and profitability, including its ability to manage the default risk of customers;
●
the results of future financing efforts; and
The information set forth herein should be read in light of such risks. The Company does not assume any obligation to update the information, including forward looking statements, contained in this press release.
CONTACT At the Company Jason Wang Chief Financial Officer (858) 997-0680 / jcwang@fincera.net | Investor Relations The Equity Group Inc. Carolyne Y. Sohn Senior Associate (415) 568-2255 / csohn@equityny.com Adam Prior Senior Vice President (212) 836-9606 / aprior@equityny.com |
FINCERA INC. AND SUBSIDIARIES
CONSOLIDATED STATEMENTS OF OPERATIONS
(in thousands except share and per share data)
| | Three months ended March 31, |
| | | | |
| | | | |
| Income | | | |
| Facilitation fee | 15,078 | 94,814 | — |
| Interest income | 7,979 | 50,174 | 44,890 |
| Service charges | 36 | 225 | 105,581 |
| Property lease and management | 8,162 | 51,325 | 41,604 |
| Other income | 4,939 | 31,059 | 52,060 |
| Total income | 36,194 | 227,597 | 244,135 |
| | | | |
| Operating Costs and Expenses (Income) | | | |
| Interest expense | 2,640 | 16,601 | 82,952 |
| Interest expense, related parties | 5,314 | 33,414 | 33,677 |
| Provision for credit losses | (1,094) | (6,880) | 18,497 |
| Product development expense | 3,154 | 19,834 | 19,888 |
| Property and management cost | 4,502 | 28,306 | 27,150 |
| Selling and marketing | (8,519) | (53,571) | 30,524 |
| General and administrative | 8,697 | 54,685 | 57,660 |
| Total operating costs and expenses | 14,694 | 92,389 | 270,348 |
| | | | |
| Income (loss) from continuing operations before income taxes | 21,500 | 135,208 | (26,213) |
| Income tax provision (benefit) | 5,473 | 34,415 | (2,974) |
| Income (loss) from continuing operations | 16,027 | 100,793 | (23,239) |
| | | | |
| Income from discontinued operations, net of taxes | 432 | 2,714 | 5,507 |
| Net income (loss) | 16,459 | 103,507 | (17,732) |
Earnings (losses) per share(1) | | | |
| Basic | | | |
| Continuing operations | 0.34 | 2.11 | (0.49) |
| Discontinued operations | 0.01 | 0.06 | 0.12 |
| | 0.35 | 2.17 | (0.37) |
| Diluted | | | |
| Continuing operations | 0.32 | 2.02 | (0.49) |
| Discontinued operations | 0.01 | 0.05 | 0.12 |
| | 0.33 | 2.07 | (0.37) |
| | | | |
Weighted average shares outstanding(1) | | | |
| Basic | 47,728,629 | 47,728,629 | 47,127,530 |
| Diluted | 49,957,072 | 49,957,072 | 47,127,530 |
(1) All per share amounts and shares outstanding for all periods have been retroactively restated to reflect Fincera’s 2-for-1 stock split, which was effective on November 1, 2017.
FINCERA INC. AND SUBSIDIARIES
CONSOLIDATED BALANCE SHEETS
(in thousands except share and per share data)
| | | |
| | | |
| | | | |
| | | |
| ASSETS | | | |
| Current assets | | | |
| Cash and cash equivalents | 183,720 | 1,155,251 | 1,123,296 |
| Restricted cash | 23,737 | 149,261 | 127,762 |
| Loans, net | 273,551 | 1,720,119 | 1,851,001 |
| Other financing receivables, net | 226,489 | 1,424,185 | 1,936,213 |
| Prepaid expenses and other current assets | 11,008 | 69,212 | 62,913 |
| Current assets of discontinued operations | 7,136 | 44,875 | 49,872 |
| Total current assets | 725,641 | 4,562,903 | 5,151,057 |
| | | | |
| Property, equipment and leasehold improvements, net | 212,673 | 1,337,309 | 1,350,858 |
| Deferred tax assets, net | 30,536 | 192,011 | 209,587 |
| Non-current assets of discontinued operations | 6,461 | 40,628 | 42,002 |
| | | | |
| Total assets | 975,311 | 6,132,851 | 6,753,504 |
LIABILITIES AND STOCKHOLDERS’ EQUITY |
| Current liabilities |
| Dividends payable | — | — | 172,932 |
| Short-term bank borrowings (including short-term bank borrowings of the consolidated VIEs without recourse to Fincera of RMB420,000 and RMB520,000 as of March 31, 2018 and December 31, 2017, respectively) | 66,793 | 420,000 | 520,000 |
| Long-term bank borrowings, current portion | 12,126 | 76,250 | 73,000 |
| Borrowed funds from CeraVest investor, related party (including borrowed funds from CeraVest investor, related party of the consolidated VIEs without recourse to Fincera of nil and RMB1,161 as of March 31, 2018 and December 31, 2017, respectively) | — | — | 1,161 |
| Borrowed funds from CeraVest investors (including borrowed funds from CeraVest investors of the consolidated VIEs without recourse to Fincera of nil and RMB743,496 as of March 31, 2018 and December 31, 2017, respectively) | — | — | 743,496 |
| Financing payables, related parties (including financing payables, related parties of the consolidated VIEs without recourse to Fincera of RMB1,589,456 and RMB1,729,327 as of March 31, 2018 and December 31, 2017, respectively) | 266,097 | 1,673,244 | 1,836,203 |
| Other payables and accrued liabilities (including other payables and accrued liabilities of the consolidated VIEs without recourse to Fincera of RMB7,599,165 and RMB2,358,109 as of March 31, 2018 and December 31, 2017, respectively) | 424,461 | 2,669,052 | 2,635,604 |
| Income tax payable (including income tax payable of the consolidated VIEs without recourse to Fincera of RMB44,592 and RMB36,733 as of March 31, 2018 and December 31, 2017, respectively) | 10,808 | 67,959 | 53,278 |
FINCERA INC. AND SUBSIDIARIES
CONSOLIDATED BALANCE SHEETS - CONTINUED
(in thousands except share and per share data)
| | |
| | | | |
| | | | |
| Current liabilities of discontinued operations (including current liabilities of discontinued operations of the consolidated VIEs without recourse to Fincera of RMB187 and RMB5 as of March 31, 2018 and December 31, 2017, respectively) | 1,764 | 11,095 | 10,916 |
| Total current liabilities | 782,049 | 4,917,600 | 6,046,590 |
| | | | |
| Non-current liabilities | | | |
| Long-term bank borrowings | 122,772 | 772,000 | 591,000 |
| Long-term financing payables, related party | 41,500 | 260,954 | 235,527 |
| Total liabilities | 946,321 | 5,950,554 | 6,873,117 |
| | | | |
| Commitments and Contingencies | | | |
| | | | |
| Stockholders’ equity | | | |
| Preferred shares, $0.001 par value authorized - 1,000,000 shares; issued – none | — | — | — |
Ordinary shares - $0.001 par value authorized – 1,000,000,000 shares; issued and outstanding – 48,870,310 shares at March 31, 2018; issued and outstanding – 47,531,799 shares at December 31, 2017 (1) | 53 | 336 | 327 |
| Additional paid-in capital | 141,900 | 892,283 | 693,889 |
| Statutory reserves | 25,483 | 160,241 | 160,289 |
| Accumulated deficit | (138,446) | (870,563) | (974,118) |
| Total stockholders’ equity | 28,990 | 182,297 | (119,613) |
| | | | |
| Total liabilities and stockholders’ equity | 975,311 | 6,132,851 | 6,753,504 |
(1) All per share amounts and shares outstanding for all periods have been retroactively restated to reflect Fincera’s 2-for-1 stock split, which was effective on November 1, 2017.