Exhibit 99.1
FOR IMMEDIATE RELEASE
Fincera Reports Third Quarter 2018 Financial Results
Shijiazhuang, Hebei Province, China – December 3, 2018 – Fincera Inc. (“Fincera” or the “Company”) (OTCQB: YUANF), a leading provider of internet-based financing and ecommerce services for small and medium-sized businesses and individuals in China, today reported financial results for the third quarter ended September 30, 2018.
2018 Third Quarter Financial Highlights
●
Income (revenue) for the three months ended September 30, 2018, increased 18.3% to RMB347.5 million (US$50.5 million), from RMB293.7 million in the prior-year period.
●
Net income was RMB98.1 million (US$14.3 million) compared to RMB14.2 million in the prior-year period, an increase of 590.8%.
Operational Highlights
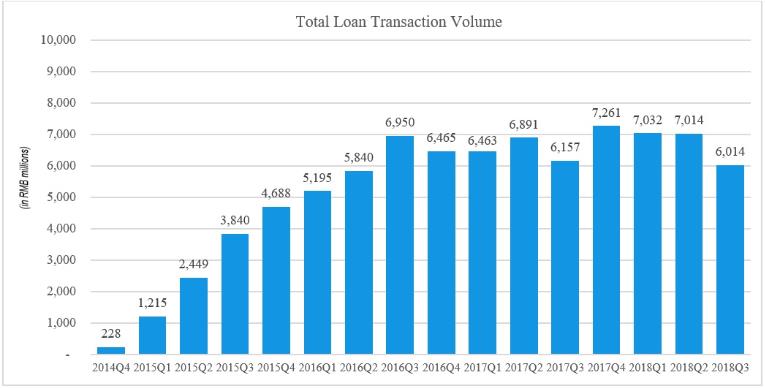
Loan transaction volume across all loan types for the third quarter of 2018 totaled approximately RMB6.0 billion (US$0.87 billion), a decrease of approximately 2.3% compared to approximately RMB6.2 billion in the third quarter of 2017.
30-day Lines of Credit
Fincera facilitates revolving credit lines that are interest-free to small and medium-sized businesses (“SMBs”) to fund their short-term working capital needs. Branded as Yueying, these credit lines have a 30-day billing cycle. Outstanding balances after the bill due date are considered delinquent and subject to certain penalties. Fincera collaborates with cooperative borrowers in delinquency by working out payment terms to help them bring their accounts into good standing.
Similar to credit cards, Fincera’s credit lines contain no fees for borrowers as long as any outstanding balances are paid in full each month. A fee is charged to the merchants where the credit lines are used of between 1.8-2.2%. When the credit line is successfully facilitated by the Company’s online peer-to-peer (P2P) platform, which is called Qingyidai, Fincera collects a portion of this fee as facilitation fee income. The remainder of the fee goes to the investor of the loan.
Merchants may use funds received from transactions to make payments to other users or merchants, or to cash out the funds via transfer to a bank account. Credit line users are subject to an application and credit approval process and are required to provide guarantees and collateral. For certain payments, such as driver salary payments, a fee is charged to the borrower as the merchant in these scenarios typically will not accept paying a fee for such a transaction.
In the third quarter of 2018, Fincera facilitated RMB2.88 billion (US$0.4 billion) in Yueying 30-day lines of credit transactions.
180-Day Term Loans
Fincera facilitates 180-day term loans that accrue interest at 4.25% (or 8.62% on an annualized basis) and are branded as Qingying. Fincera charges a facilitation fee between 2.5-3.5% depending on the type of the loan. The fee portion is collected by the Company while the investor holding the loan at maturity receives the entirety of the interest payments. In addition, the borrower remits 10.0% of the principal loan balance to the Company as a security deposit that is refunded to the borrower upon timely repayment of principal and interest. Payment of principal and interest is due in a lump sum at the maturity date at the end of the 180-day term. Outstanding balances after the maturity date are considered delinquent. In the event of delinquency, the Company will keep the security deposit as a one-time penalty fee and may assess additional penalties. As with the 30-day credit lines, Fincera collaborates with cooperative borrowers in delinquency to help them bring their accounts into good standing.
In the third quarter of 2018, Fincera facilitated RMB3.0 billion (US$0.4 billion) in Qingying 180-day term loans.
Installment Loans
Fincera facilitates installment loans, branded as Zhongying, that are utilized by borrowers primarily to fund purchases of trucks and consumer discretionary goods and services, with the borrowed purchase funds being transferred directly to the merchant via Fincera’s payment network. Based on the term of the loan and the type of purchase, Fincera charges the merchants where the funds are used a fee of between 6.5%-8.9% on the transaction. Similar to Yueying, when the loan is successfully facilitated by the Company’s online P2P platform, Fincera collects a portion of this fee as facilitation fee income. The remainder of the fee goes to the investor of the loan in the form of interest payments. The loans require some borrowers to provide collateral to partially secure their obligations. Terms of these installment loans may vary between three and 24 months; however, the majority of the installment loans carry a term of 12 months.
In the third quarter of 2018, Fincera facilitated RMB87.8 million (US$12.8 million) in Zhongying installment loans.
New Broker Network Business Model
In September 2018, Fincera began converting its existing wholly-owned store distribution network into a broker distribution network that is not owned by the Company. Fincera believes there are many advantages to making its distribution network independently owned and operated. The new broker distribution network will operate under a revenue sharing arrangement where predetermined amounts of revenues will be shared with the brokers. In addition, since the new distribution network will be owned by third-parties, Fincera will no longer be responsible for funding its operating costs. The Company believes that the broker network will provide greater incentive to the brokers than before, when the associated personnel were direct employees of the Company. Overall, the Company believes that the change will result in increased efficiency and profitability for Fincera.
Operational Updates
Fincera is pleased to announce that it has made progress with certain corporate initiatives, including:
●
Efforts to sell off delinquent loans to regional third-party collection agencies continue as part of the Company’s risk management process; and
●
Slight adjustments to the business models for the Company’s 180-Day Term Loans and Installment Loans products in order to bring them into compliance with China’s regulations regarding P2P; and
●
The Company believes it has come into compliance with all announced regulations in China regarding peer-to-peer lenders. However, the registration process for peer-to-peer lenders in China has been delayed by at least a year and more detailed regulations are expected to be forthcoming; and
Management Commentary
Mr. Jason Wang, CFO of Fincera, stated, “The P2P industry in China continues to face uncertainty as the government implements regulations in order to protect investors. The uncertainty has resulted in reduced investor activity and caused us to moderate the pace of our growth initiatives. However, a key focus of our business model has always been risk management, and we share the government’s interest in protecting investors. As China’s P2P industry continues to mature, we maintain a very favorable long-term outlook on the industry overall and particularly the transportation sector that we focus on. We believe we have built a durable P2P business that will ultimately benefit from the government’s investor protection efforts.”
Currency Conversion
This release contains approximate translations of certain RMB amounts into US$ for convenience. Unless otherwise noted, all translations from RMB to US$ are made at a rate of USD1.00 = RMB6.8792 on September 30, 2018, representing the certificated exchange rate published by the People’s Bank of China’s Monetary Policy Division. No representation is intended to imply that the RMB amounts could have been, or could be, converted, realized or settled into US$ at such rate, or at any other rate.
Third Quarter 2018 Financial Results
Income (Revenues)
The table below sets forth certain line items from the Company’s Consolidated Statement of Income as a percentage of income:
(RMB in thousands) | Three months ended September 30, 2018 | Three months ended September 30, 2017
| |
| | | | | | |
| Facilitation fee | 131,143 | 37.7% | 95,505 | 32.5% | 37.3% |
| Interest income | 65,960 | 19.0% | 89,396 | 30.4% | -26.2% |
| Service charges | - | 0.0% | 33,909 | 11.6% | -100.0% |
| Property lease and management | 53,291 | 15.4% | 51,451 | 17.5% | 3.6% |
| Other income | 97,099 | 27.9% | 23,431 | 8.0% | 314.4% |
| Total income | 347,493 | 100.0% | 293,692 | 100.0% | 18.3% |
●
Total income for the three months ended September 30, 2018, increased 18.3% to RMB347.5 million (US$50.5 million), from RMB293.7 million in the prior-year period.
●
Facilitation fees, which represent upfront fees charged for facilitating loan transactions via Fincera’s marketplace lending platform, totaled RMB131.1 million (US$19.1 million) during the three months ended September 30, 2018. The Company began charging these fees in July 2017 when Fincera redeveloped its loan transaction process to comply with online lending regulations.
●
Interest income, which represents interest earned on 30-day lines of credit loans, 180-day term loans and installment loans held by the Company, decreased 26.2% to RMB66.0 million (US$9.6 million) in the three months ended September 30, 2018, from RMB89.4 million in the prior-year period, due to a decrease of the interest income generated from installment loans, which went down significantly during the third quarter of 2018 because more loans were facilitated by the Company instead of directly held. In addition, unamortized origination fees originating prior to the Company’s business model change in July 2017 were still being recognized in the prior-year period, whereas they were no longer being recognized to interest income during the third quarter of 2018.
●
Service charges, which represent 30-day lines of credit loans and installment loans transaction fees, decreased 100.0% to zero in the three months ended September 30, 2018, from RMB33.9 million in the prior-year period. Since July 2017, 30-day lines of credit loans and installment loans transactions have been facilitated through a revised transaction process via Fincera’s peer-to-peer lending platform. As a result, the service charges earned under the previous transaction process are now recorded as a facilitation fee to the Company and as interest payable to investors of each loan once the facilitation is successful. Thus, the Company does not have this revenue item to report in the third quarter of 2018.
●
Property lease and management revenues increased 3.6% to RMB53.3 million (US$7.7 million) in the three months ended September 30, 2018, compared to RMB51. 5 million in the prior-year period. The average occupancy rate of the Kaiyuan Finance Center during the quarter ended September 30, 2018, increased to 89.0%, compared to 82.0% during the prior-year period. Income from the Company’s hotel operation at the Kaiyuan Finance Center slightly decreased due to a low season in tourism during the period.
●
Other income is mainly comprised of late payment fees (penalty income) from borrowers, as well as the receipts of the fees when delinquent loans are sold to third parties. Other income increased 314.4% to RMB97.1 million (US$14.1 million) in the three months ended September 30, 2018, from RMB23.4 million in the prior-year period, due to the strengthening of collection efforts and the sale of delinquent loans to third parties during the third quarter of 2018.
Operating Costs and Expenses
●
The Company’s operating costs and expenses decreased 22.4% to RMB213.5 million (US$31.0 million) in the three months ended September 30, 2018, from RMB275.2 million in the prior-year period. Interest expense decreased significantly as a result of the change to our new business model in July 2017 in response to new regulations in China. Under the new business model, loans that are successfully subscribed by investors on the Company’s peer-to-peer lending platform are derecognized from the Company’s balance sheet. Therefore, interest due to these investors is also not recognized by the Company. In addition, during the nine months ended September 30, 2018, large amounts of underperforming loans were sold to third parties, which resulted in a reduction to the provision for credit losses, a portion of which is allocated to selling and marketing expenses as an accrued marketing expense per the Company’s accounting policies, resulting in a reversal of selling and marketing expenses during the period. The provision for credit losses still increased due to an increased provision being taken for certain loans to some large offline borrowers.
Income (Loss) from Continuing Operations Before Income Taxes
●
Income from continuing operations before income taxes totaled RMB134.0 million (US$19.5 million) in the three months ended September 30, 2018, compared to RMB18.5 million in the prior-year period, primarily as a result of increased total income as mentioned above.
Income from Discontinued Operations, Net of Taxes
●
Loss from discontinued operations, net of taxes, totaled RMB0.7 million (US$0.1 million) in the three months ended September 30, 2018, compared to income of RMB2.3 million in the prior-year period. The Company continues the winding down of its legacy truck-leasing business, which is classified as discontinued operations.
Net Income
●
Net income improved to RMB98.1 million (US$14.3 million) in the three months ended September 30, 2018, compared to RMB14.2 million in the prior-year period.
Balance Sheet Highlights
At September 30, 2018, Fincera’s cash and cash equivalents (not including restricted cash) were 664.9 million, compared to RMB1.1 billion at December 31, 2017. Other financing receivables were RMB29.6 million, compared to RMB1.9 billion at December 31, 2017, due to a change in business model made in July 2017 in order to comply with regulations whereas certain loans became facilitated on the Company’s peer-to-peer lending platform and therefore no longer recognized as other financing receivables on the Company’s balance sheet. Total liabilities were RMB5.1 billion and stockholders’ equity was 418.7 million, compared to RMB6.9 billion and negative RMB119.6 million, respectively, at September 30, 2018 and December 31, 2017. The increase in stockholders’ equity was primarily a result of a transaction into which the Company entered to exchange debt for equity during the first quarter of 2018. During the first quarter of 2018, the Company issued RMB188.6 million (US$28.5 million) in shares to Mr. Yong Hui Li, its Chairman and CEO, as repayment of certain debts. The repayment consisted of an RMB22.0 million (US$3.3 million) partial repayment of a loan Mr. Li had previously provided to the Company in March 2017 and payment of RMB166.6 million (US$25.2 million) still owed to Mr. Li from the US$2.00 per share dividend the Company declared in June 2017. The resulting issuance of 1.32 million shares was calculated using the trailing 90 trading day average price of US$22.71 per share.
About Fincera Inc.
Founded in 2005, Fincera Inc. (OTCQB: YUANF) provides innovative internet-based financing and ecommerce services for small and medium-sized businesses and individuals in China. The Company also operates a network of branch offices in 31 provinces, municipalities, and autonomous regions across China. Fincera’s primary service offerings include a credit advance/online payment-processing network and a web-based small business lending platform. The Company’s website is http://www.fincera.net. Fincera trades on the OTCQB venture stage marketplace for early stage and developing U.S. and international companies. OTCQB companies are current in their reporting and undergo an annual verification and management certification process.
Safe Harbor Statement
This press release may contain forward-looking statements within the meaning of the Private Securities Litigation Reform Act of 1995 about the Company. Forward-looking statements are statements that are not historical facts. Such forward-looking statements, based upon the current beliefs and expectations of the Company's management, are subject to risks and uncertainties, which could cause actual results to differ from the forward-looking statements. The following factors, among others, could cause actual results to materially differ from those set forth in the forward-looking statements:
●
legislation or regulatory environments, requirements, policies or changes affecting the financial services industry in China;
●
continued compliance with government regulations and policies;
●
changing principles of generally accepted accounting principles;
●
outcomes of any government or government-related reviews, inquiries, investigations, and related litigation;
●
fluctuations in consumer demand;
●
management of rapid growth;
●
general economic conditions;
●
changes in government policy generally, both in China and in the U.S.;
●
fluctuations in sales of commercial vehicles in China;
●
China’s overall economic conditions and local market economic conditions;
●
the Company’s business strategy and plans, including its ability to expand through strategic acquisitions, the establishment of new locations, the discontinuance of certain products and services, and the introduction of new products and services;
●
the Company’s ability to successfully integrate acquisitions;
●
credit risk affecting the Company’s revenue and profitability, including its ability to manage the default risk of customers;
●
the results of future financing efforts; and
The information set forth herein should be read in light of such risks. The Company does not assume any obligation to update the information, including forward looking statements, contained in this press release.
CONTACT At the Company | Investor Relations |
Jason Wang Chief Financial Officer (858) 997-0680 / jcwang@fincera.net | The Equity Group Inc. Adam Prior Senior Vice President (212) 836-9606 / aprior@equityny.com |
FINCERA INC. AND SUBSIDIARIES
UNAUDITED CONSOLIDATED STATEMENTS OF OPERATIONS
(in thousands except share and per share data)
| | Three months ended September 30, | Nine months ended September 30, |
| | | | | | | |
| | | | | | | |
| | | | | | | |
| Income | | | | | | |
| Facilitation fee | 19,064 | 131,143 | 95,505 | 54,046 | 371,794 | 95,505 |
| Interest income | 9,588 | 65,960 | 89,396 | 25,256 | 173,740 | 242,349 |
| Service charges | — | — | 33,909 | 2,820 | 19,396 | 250,248 |
| Property lease and management | 7,747 | 53,291 | 51,451 | 22,749 | 156,495 | 138,338 |
| Other income | 14,115 | 97,099 | 23,431 | 49,078 | 337,616 | 73,469 |
| Total income | 50,514 | 347,493 | 293,692 | 153,949 | 1,059,041 | 799,909 |
| | | | | | | |
| Operating Costs and Expenses | | | | | | |
| Interest expense | 2,957 | 20,342 | 82,974 | 7,573 | 52,095 | 269,063 |
| Interest expense, related parties | 6,035 | 41,519 | 43,653 | 16,661 | 114,615 | 112,849 |
| Provision for credit losses | 1,155 | 7,943 | 6,735 | 26,047 | 179,185 | 37,687 |
| Product development expense | 3,131 | 21,542 | 21,076 | 8,800 | 60,537 | 62,269 |
| Property and management cost | 4,439 | 30,539 | 28,201 | 12,614 | 86,772 | 82,627 |
| Selling and marketing | 6,958 | 47,863 | 41,504 | (3,436) | (23,638) | 104,941 |
| General and administrative | 6,355 | 43,714 | 51,091 | 20,829 | 143,286 | 166,701 |
| Total operating costs and expenses | 31,030 | 213,462 | 275,234 | 89,088 | 612,852 | 836,137 |
| | | | | | | |
| Income (loss) from continuing operations before income taxes | 19,484 | 134,031 | 18,458 | 64,861 | 446,189 | (36,228) |
| Income tax provision (benefit) | 5,124 | 35,249 | 6,567 | 16,814 | 115,665 | (5,583) |
| Income (loss) from continuing operations | 14,360 | 98,782 | 11,891 | 48,047 | 330,524 | (30,645) |
| | | | | | | |
| Income (loss) from discontinued operations, net of taxes | (104) | (715) | 2,286 | 437 | 3,008 | 8,374 |
| Net income (loss) | 14,256 | 98,067 | 14,177 | 48,484 | 333,532 | (22,271) |
| | | | | | | |
| | | | | | | |
Earnings (losses) per share(1) | | | | | | |
| Basic | | | | | | |
| Continuing operations | 0.29 | 2.02 | 0.25 | 0.99 | 6.81 | (0.65) |
| Discontinued operations | 0.00 | (0.01) | 0.05 | 0.01 | 0.06 | 0.18 |
| | 0.29 | 2.01 | 0.30 | 1.00 | 6.87 | (0.47) |
| | | | | | | |
| Diluted | | | | | | |
| Continuing operations | 0.28 | 1.96 | 0.24 | 0.96 | 6.58 | (0.65) |
| Discontinued operations | 0.00 | (0.01) | 0.05 | 0.01 | 0.06 | 0.18 |
| | 0.28 | 1.95 | 0.29 | 0.97 | 6.64 | (0.47) |
| | | | | | | |
| Weighted average shares outstanding | | | | | | |
| Basic | 48,891,494 | 48,891,494 | 47,276,456 | 48,502,753 | 48,502,753 | 47,216,027 |
| Diluted | 50,395,464 | 50,395,464 | 49,043,297 | 50,200,734 | 50,200,734 | 47,216,027 |
(1) All per share amounts and shares outstanding for all periods have been retroactively restated to reflect Fincera’s 2-for-1 stock split, which was effective on November 1, 2017.
FINCERA INC. AND SUBSIDIARIES
CONSOLIDATED BALANCE SHEETS
(in thousands except share and per share data)
| | | |
| | | |
| | | | |
| | | |
| ASSETS | | | |
| Current assets | | | |
| Cash and cash equivalents | 96,647 | 664,856 | 1,123,296 |
| Restricted cash | 104 | 714 | 127,762 |
| Loans, net | 467,246 | 3,214,280 | 1,851,001 |
| Other financing receivables, net | 4,301 | 29,588 | 1,936,213 |
| Prepaid expenses and other current assets | 11,858 | 81,570 | 62,913 |
| Current assets of discontinued operations | 5,659 | 38,926 | 49,872 |
| Total current assets | 586,815 | 4,029,934 | 5,151,057 |
| | | | |
| Property, equipment and leasehold improvements, net | 191,033 | 1,314,152 | 1,350,858 |
| Deferred tax assets, net | 25,664 | 176,545 | 209,587 |
| Non-current assets of discontinued operations | 5,866 | 40,350 | 42,002 |
| | | | |
| Total assets | 808,378 | 5,560,981 | 6,753,504 |
| LIABILITIES AND STOCKHOLDERS’ EQUITY | | | |
| Current liabilities | | | |
| | | | |
| Borrowing from third party | 21,805 | 150,000 | — |
| Dividends payable | — | — | 172,932 |
| Short-term bank borrowings (including short-term bank borrowings of the consolidated VIEs without recourse to Fincera of RMB480,000 and RMB520,000 as of September 30, 2018 and December 31, 2017, respectively) | 69,776 | 480,000 | 520,000 |
| Long-term bank borrowings, current portion | 12,029 | 82,750 | 73,000 |
| Borrowed funds from CeraVest investor, related party (including borrowed funds from CeraVest investor, related party of the consolidated VIEs without recourse to Fincera of nil and RMB1,161 as of September 30, 2018 and December 31, 2017, respectively) | — | — | 1,161 |
| Borrowed funds from CeraVest investors (including borrowed funds from CeraVest investors of the consolidated VIEs without recourse to Fincera of nil and RMB743,496 as of September 30, 2018 and December 31, 2017, respectively) | — | — | 743,496 |
| Financing payables, related parties (including financing payables, related parties of the consolidated VIEs without recourse to Fincera of RMB 2,079,686 and RMB1,729,327 as of September 30, 2018 and December 31, 2017, respectively) | 315,321 | 2,169,159 | 1,836,203 |
| Other payables and accrued liabilities (including other payables and accrued liabilities of the consolidated VIEs without recourse to Fincera of RMB1,007,834 and RMB2,358,109 as of September 30, 2018 and December 31, 2017, respectively) | 177,491 | 1,220,997 | 2,635,604 |
Income tax payable (including income tax payable of the consolidated VIEs without recourse to Fincera of RMB67,474 and RMB36,733 as of September 30, 2018 and December 31, 2017, respectively) | 15,073 | 103,689 | 53,278 |
FINCERA INC. AND SUBSIDIARIES
CONSOLIDATED BALANCE SHEETS - CONTINUED
(in thousands except share and per share data)
| | | |
| | | |
| | | | |
| Current liabilities of discontinued operations (including current liabilities of discontinued operations of the consolidated VIEs without recourse to Fincera of nil and RMB5 as of September 30, 2018 and December 31, 2017, respectively) | 1,552 | 10,677 | 10,916 |
| Total current liabilities | 613,047 | 4,217,272 | 6,046,590 |
| | | | |
| Non-current liabilities | | | |
| Long-term bank borrowings | 105,972 | 729,000 | 591,000 |
| Long-term financing payables, related party | 28,488 | 195,974 | 235,527 |
| Total liabilities | 747,507 | 5,142,246 | 6,873,117 |
| | | | |
| Commitments and Contingencies | | | |
| | | | |
| Stockholders’ equity | | | |
| Preferred shares, $0.001 par value authorized - 1,000,000 shares; issued – none | — | — | — |
Ordinary shares - $0.001 par value authorized – 1,000,000,000 shares; issued and outstanding – 48,905,944 shares at September 30, 2018; issued and outstanding – 47,531,799 shares at December 31, 2017 (1) | 49 | 336 | 327 |
| Additional paid-in capital | 130,640 | 898,696 | 693,889 |
| Statutory reserves | 23,301 | 160,289 | 160,289 |
| Accumulated deficit | (93,119) | (640,586) | (974,118) |
| Total stockholders’ equity | 60, 871 | 418,735 | (119,613) |
| | | | |
| Total liabilities and stockholders’ equity | 808,378 | 5,560,981 | 6,753,504 |
(1) All per share amounts and shares outstanding for all periods have been retroactively restated to reflect Fincera’s 2-for-1 stock split, which was effective on November 1, 2017.