Table of Contents
As filed with the Securities and Exchange Commission on December 22, 2011
Registration No. 333-174801
UNITED STATES
SECURITIES AND EXCHANGE COMMISSION
Washington, D.C. 20549
Amendment No. 4
to
Form S-1
REGISTRATION STATEMENT
UNDER
THE SECURITIES ACT OF 1933
AVAYA HOLDINGS CORP.
(Exact name of registrant as specified in its charter)
| Delaware | 3661 | 26-1119726 | ||
| (State or other jurisdiction of incorporation or organization) | (Primary Standard Industrial Classification Code Number) | (I.R.S. Employer Identification No.) |
211 Mount Airy Road
Basking Ridge, New Jersey 07920
(908) 953-6000
(Address, including zip code, and telephone number, including area code, of registrant’s principal executive offices)
Pamela F. Craven, Esq.
Chief Administrative Officer
Avaya Holdings Corp.
211 Mount Airy Road
Basking Ridge, New Jersey 07920
(908) 953-6000
(Name, address, including zip code, and telephone number, including area code, of agent for service)
With copies to:
Julie H. Jones, Esq. 800 Boylston St. | Daniel J. Zubkoff, Esq. Douglas S. Horowitz, Esq. Cahill Gordon & ReindelLLP 80 Pine Street New York, NY 10005 Telephone (212) 701-3000 Fax (212) 269-5420 |
Approximate date of commencement of proposed sale to public: As soon as practicable after this Registration Statement becomes effective.
If any of the securities being registered on this Form are to be offered on a delayed or continuous basis pursuant to Rule 415 under the Securities Act of 1933 check the following box. ¨
If this Form is filed to register additional securities for an offering pursuant to Rule 462(b) under the Securities Act, please check the following box and list the Securities Act registration statement number of the earlier effective registration statement for the same offering. ¨
If this Form is a post-effective amendment filed pursuant to Rule 462(c) under the Securities Act, check the following box and list the Securities Act registration statement number of the earlier effective registration statement for the same offering. ¨
If this Form is a post-effective amendment filed pursuant to Rule 462(d) under the Securities Act, check the following box and list the Securities Act registration statement number of the earlier effective registration statement for the same offering. ¨
Indicate by check mark whether the registrant is a large accelerated filer, an accelerated filer, a non-accelerated filer, or a smaller reporting company. See the definitions of “large accelerated filer,” “accelerated filer” and “smaller reporting company” in Rule 12b-2 of the Exchange Act. (Check one):
| Large accelerated filer | ¨ | Accelerated filer | ¨ | |||||||
| Non-accelerated filer | x | (Do not check if a smaller reporting company) | Smaller reporting company | ¨ | ||||||
The Registrant hereby amends this Registration Statement on such date or dates as may be necessary to delay its effective date until the Registrant shall file a further amendment which specifically states that this Registration Statement shall thereafter become effective in accordance with Section 8(a) of the Securities Act of 1933, as amended, or until the Registration Statement shall become effective on such date as the Securities and Exchange Commission, acting pursuant to said Section 8(a), may determine.
Table of Contents
The information in this preliminary prospectus is not complete and may be changed. These securities may not be sold until the registration statement filed with the Securities and Exchange Commission is effective. This preliminary prospectus is not an offer to sell these securities and it is not soliciting an offer to buy these securities in any jurisdiction where the offer or sale is not permitted.
PROSPECTUS (Subject to Completion)
Issued December 22, 2011
Shares

COMMON STOCK
Avaya Holdings Corp. is offering shares of its common stock. This is the initial public offering of shares of our common stock and no public market currently exists for our shares. We expect the initial public offering price of our common stock to be between $ and $ per share.
After the completion of this offering, funds affiliated with our Sponsors (as defined herein) will continue to own a majority of the voting power of our outstanding common stock. As a result, we expect to be a “controlled company” within the meaning of the corporate governance standards of the New York Stock Exchange. See “Principal Stockholders.”
We have applied to list our common stock on the New York Stock Exchange under the symbol “AVYA.”
Investing in our common stock involves a high degree of risk. See “Risk Factors” beginning on page 16.
PRICE $ A SHARE
| Public Offering Price | Underwriting | Proceeds | ||||
Per Share | $ | $ | $ | |||
Total | $ | $ | $ |
We have granted the underwriters the right to purchase up to an additional shares of common stock for a period of 30 days.
Neither the Securities and Exchange Commission nor any other regulatory body has approved or disapproved of these securities or passed upon the accuracy or adequacy of this prospectus. Any representation to the contrary is a criminal offense.
The underwriters expect to deliver the shares to purchasers on , 2012.
| MORGAN STANLEY | GOLDMAN, SACHS & CO. | J.P. MORGAN |
| CITI | DEUTSCHE BANK SECURITIES | |
BofA MERRILL LYNCH | BARCLAYS CAPITAL UBS INVESTMENT BANK | CREDIT SUISSE | ||
, 2012
Table of Contents

Table of Contents

Table of Contents

Table of Contents
| Page | ||||
| 1 | ||||
| 16 | ||||
| 30 | ||||
| 32 | ||||
| 33 | ||||
| 34 | ||||
| 36 | ||||
| 38 | ||||
| 44 | ||||
Management’s Discussion and Analysis of Financial Condition and Results of Operations | 52 | |||
| 104 | ||||
| 127 | ||||
| 128 | ||||
| Page | ||||
| 138 | ||||
| 168 | ||||
| 173 | ||||
| 177 | ||||
| 186 | ||||
| 191 | ||||
Certain Material U.S. Federal Income Tax Considerations For Non-U.S. Holders Of Common Stock | 193 | |||
| 197 | ||||
| 204 | ||||
| 204 | ||||
| 204 | ||||
| F-1 | ||||
We have not authorized anyone to provide any information or to make any representations other than those contained in this prospectus or in any free writing prospectuses we file with the Securities and Exchange Commission, or the SEC. We take no responsibility for, and can provide no assurance as to the reliability of, any other information that others may give you. This prospectus is an offer to sell only the shares offered hereby, but only under circumstances and in jurisdictions where it is lawful to do so. The information contained in this prospectus is current only as of its date.
Until , 2012 (25 days after the commencement of this offering), all dealers that buy, sell or trade shares of our common stock, whether or not participating in this offering, may be required to deliver a prospectus. This delivery requirement is in addition to the obligation of dealers to deliver a prospectus when acting as underwriters and with respect to their unsold allotments or subscriptions.
For investors outside the United States: we have not and the underwriters have not done anything that would permit this offering or possession or distribution of this prospectus in any jurisdiction where action for that purpose is required, other than in the United States. Persons outside the United States who come into possession of this prospectus must inform themselves about, and observe any restrictions relating to, the offering of the shares of common stock and the distribution of this prospectus outside the United States.
When we use the terms “we,” “us,” “our,” “Avaya” or the “Company,” we mean Avaya Holdings Corp., a Delaware corporation, and its consolidated subsidiaries, including Avaya Inc., our principal U.S. operating subsidiary, taken as a whole, unless the context otherwise indicates.
Avaya Aura®, Avaya Flare® and Avaya web.alive™ and other trademarks or service marks of Avaya are the property of Avaya Holdings Corp. and/or its affiliates. This prospectus also contains additional tradenames, trademarks or service marks belonging to us and to other companies. We do not intend our use or display of other parties’ trademarks, tradenames or service marks to imply, and such use or display should not be construed to imply, a relationship with, or endorsement or sponsorship of us by, these other parties.
i
Table of Contents
This summary highlights information contained elsewhere in this prospectus. This summary does not contain all of the information you should consider before investing in our common stock. You should read this entire prospectus carefully, especially the “Risk Factors” section of this prospectus and our consolidated financial statements and related notes appearing at the end of this prospectus, before making an investment decision. This summary contains forward-looking statements that involve risks and uncertainties. Our actual results may differ significantly from the results discussed in the forward-looking statements as a result of certain factors, including those set forth in “Risk Factors” and “Special Note Regarding Forward-Looking Statements.”
Our Company
We are a leading global provider of next-generation business collaboration and communications solutions that bring people together with the right information at the right time in the right context, enabling business users to improve their efficiency and quickly solve critical business challenges. Our solutions are designed to enable business users to work together more effectively as a team internally or with their customers and suppliers, increasing innovation, improving productivity and accelerating decision-making and business outcomes.
We develop software and hardware products and offer related services that we market and sell directly and through our channel partners as part of our collaboration and communications solutions for large enterprises, small- and mid-sized businesses and government organizations. Our software delivers rich value-added applications for enterprise collaboration and communications, including messaging, telephony, voice, video and web conferencing, mobility and customer service. These applications operate on our own hardware, which includes a broad range of desk phones, servers and gateways, and LAN/WAN switching wireless access points and gateways, as well as on third-party devices, including desk phones, tablets and desktop PCs. In addition, our award-winning portfolio of services supports our products to help customers achieve enhanced business results both directly and indirectly through partners. Market opportunities associated with our business collaboration and communications solutions include spending on unified communications (which includes, among others, enterprise telephony and messaging), contact center applications and data networking equipment, as well as spending on support and maintenance services to implement and support these tools. These areas are expected to attract $77 billion of spending in 2011 in the aggregate, with unified communications accounting for $14 billion, contact center accounting for $3 billion, data networking accounting for $25 billion and maintenance, managed and professional services accounting for the remaining $35 billion.
We are highly focused on and structured to serve our core business collaboration and communications markets with fit-for-purpose products, targeted sales coverage and distributed software services and support models. We offer solutions in five key business collaboration and communications categories:
| • | Unified Communications Software, Infrastructure and Endpoints; |
| • | Real Time Video Collaboration; |
| • | Contact Center; |
| • | Data Networking; and |
| • | Applications, including their Integration and Enablement. |
Our next-generation business collaboration solutions are designed to be highly scalable, flexible and easy to manage. They can be deployed in numerous ways, including on a customer’s own premise, in the cloud and in a virtualized environment. We are committed to open standards-based solutions, using Session Initiation Protocol, or SIP, extensively throughout our portfolio. SIP is a signaling protocol used to establish voice, video or data communication sessions over an IP network. At the core of our next-generation business collaboration portfolio
1
Table of Contents
is Avaya Aura, our SIP-based software suite that brings together voice, video and data into a single, integrated communications and collaboration platform.
Through our next-generation collaboration solutions, including Avaya Aura, we are reshaping our product portfolio to drive revenue growth and business model cash cycle time. Our portfolio of business collaboration and communications solutions is designed to deliver an intuitive and personalized user experience, seamlessly integrating various modes of communications and collaboration, including real-time voice, video, instant messaging and conferencing, and non real-time email, voicemail and social networking. These solutions target high growth market segments and we believe accelerate our sales cycle as customers more frequently upgrade their solutions to take advantage of our ongoing product innovation and to deploy our user experience across an array of endpoints, including our own and those of other vendors.
Over the past several years, we have invested significantly in research and development, introducing more than 70 new product offerings to the market since the beginning of fiscal year 2010. For example, in September 2010 we released our Avaya Flare Experience, a real-time, enterprise video communications and collaboration solution that can help to break down the barriers commonly seen in today’s communications and collaboration tools with a distinctive user interface for quick, easy access to voice and video, social media, presence, instant messaging, audio/video/web conferencing, a consolidated view of multiple directories and context history.
Our solutions address the needs of a diverse range of customers, including large multinational enterprises, small- and medium-sized businesses and government organizations. As of September 30, 2011, we had over 400,000 customers, including more than 90% of the Fortune 500 companies and one million customer locations worldwide. Our customers operate in a broad range of industries, including financial services, manufacturing, retail, transportation, energy, media and communications, healthcare, education and government, and include, among others, Morgan Stanley & Co. LLC, Progressive Casualty Insurance Company, Whirlpool Corporation, The Hewlett-Packard Company, Home Depot, Inc., United Air Lines, Inc., Marriott International, Inc., the Blue Cross and Blue Shield Association, Australia National University and the Federal Deposit Insurance Corporation, or the FDIC. We employ a flexible go-to-market strategy with direct and indirect presence in over 160 countries. As of September 30, 2011, we had approximately 9,100 channel partners and for fiscal year 2011, our product revenue from indirect sales represented approximately 76% of our total product revenue. We are expanding our sales coverage model, including both partners and direct sales, while supporting our customers’ channel preferences. In December 2009, we acquired the enterprise solutions business of Nortel Networks Corporation, or NES, which expanded our customer base, broadened and strengthened our indirect sales channel, enhanced our technology portfolio, established our presence in data networking and improved our ability to compete globally.
For fiscal years 2011 and 2010, we generated revenue of $5,547 million and $5,060 million, respectively. For fiscal year 2011, product revenue represented 54% of our total revenue and services revenue represented 46%. For fiscal year 2010, product revenue represented 51% of our total revenue and services revenue represented 49%. For fiscal year 2011, approximately 54% of our revenue was generated in the United States. For fiscal years 2011 and 2010, we had a net loss of $863 million and $871 million, respectively, and Adjusted EBITDA of $971 million and $795 million, respectively.
Adjusted EBITDA is a non-GAAP measure we use to measure our financial performance based on operational factors that management can impact in the short-term, namely our pricing strategies, volume, costs and expenses of the organization. See “Prospectus Summary—Summary Historical Financial Data” on pages 12 to 15 and “Management’s Discussion and Analysis of Financial Condition and Results of Operations—Non-GAAP Financial Measures and Supplemental Disclosure—EBITDA and Adjusted EBITDA” for an explanation and reconciliation of net loss to Adjusted EBITDA.”
2
Table of Contents
Our Industry
Enterprises are increasingly focused on deploying collaboration solutions in order to increase productivity, reduce costs and complexity and gain competitive advantages. The requirements of enterprises have evolved over the past few years in response to the following trends and challenges:
Increasingly Mobile and Connected Workforce Needs Anytime/Anywhere Collaboration Tools.As enterprises move toward a more geographically dispersed, 24x7 workforce, they need tools to enable their users to quickly solve business challenges while improving their efficiency. To do this, enterprises need collaboration technology that can bring people together with the right information at the right time in the right context to make critical business decisions.
Proliferation of Devices and Applications and Consumerization of the Enterprise are Changing Users’ Expectations and Needs.The number and types of endpoints are growing rapidly and business users are also increasingly using consumer-focused products and applications for business tasks, particularly in the areas of collaboration and communications. In order to communicate seamlessly and securely across these devices, applications and endpoints, collaboration solutions must be integrated into the communications infrastructure and allow IT professionals to manage them effectively and reliably.
Customer Expectations of Contact Centers and Customer Service are Changing. The way customers communicate with the enterprise is rapidly changing, especially in contact centers where interactions have evolved from voice-centric to multimedia and multi-modal communications. Customers increasingly expect enterprises to know the history of their interactions regardless of whether they are communicating by phone or through email, social media or another method of communication.
Business Leaders are Increasingly Challenged to Deliver New Business Capabilities to Support Growth While Facing Tight IT Budgets. Business leaders continue to manage their overall spending closely due to continued macro-economic uncertainty. At the same time, business leaders are focused on strategic IT investments to gain competitive advantage and improve productivity, while expecting acceptable levels of return on their investments. As a result, they are seeking solutions that cost-effectively scale with their businesses.
Businesses Need Comprehensive, Scalable Solutions.To address these rapidly developing trends and needs, enterprises often have deployed tools that loosely tie various communication systems together with a single user interface, rather than fully integrating the underlying architectures. The resulting solutions often are difficult to deploy and manage, and may not provide businesses with the expected benefits, such as simultaneous conversations across different media. These solutions frequently employ proprietary, closed architectures, which do not integrate well with those of other vendors or enable integration of new consumer devices. This may require customers to abandon existing infrastructure and face additional complexity and costs to deploy new equipment or applications.
Our Solutions
We are a leader in business collaboration and communications and have created next-generation solutions that offer an innovative approach, delivering our customers fit-for-purpose, open solutions that we believe enable them to experience enhanced levels of productivity at a lower total cost of ownership than our competitors. The key benefits of our solutions include:
Innovative Real-Time, Multimedia, Multi-Platform Collaboration Tools that Promote Business Collaboration.Our next-generation business collaboration and communications solutions are designed to provide our customers with the software and infrastructure needed to bring people together with the right information at the right time in the right context regardless of the communications technology, devices or location.
3
Table of Contents
Fit-for-Purpose Solutions that Offer an Enhanced User Experience, Productivity Benefits and Lower Total Cost of Ownership.Our solutions are specifically designed to address the needs of today’s unified communications environment, seamlessly integrating various modes of communications and collaboration, including real-time voice, video, instant messaging and conferencing, and non real-time email, voicemail and social networking. We believe our solutions require less hardware and perform better than our competitors.
Open Standards-Based Architecture that Enables Flexible and Extensible Collaboration.Our open standards-based solutions, including Avaya Aura, accommodate customers with multi-vendor environments seeking to leverage their existing investments, supplement their existing solutions with specific collaboration products that they need, and rapidly create and deploy applications. These next-generation business collaboration solutions are designed to be highly scalable, flexible and easy to manage and can be deployed in numerous ways, including on a customer’s own premise, in the cloud and in a virtualized environment.
Enterprise-Class Solutions that are Scalable, Secure, Reliable and Backed by Our Award-Winning Services.Our product portfolio has been designed to be highly reliable, secure and scalable, and is backed by our award-winning global services. Avaya Global Services, or AGS, is a leading provider of maintenance services relating to business collaboration and communications solutions, offering services support tools to help our customers monitor, troubleshoot and manage their infrastructure. In addition, AGS delivers managed and professional services, providing the integration expertise necessary to help customers migrate from their current communications environment to next-generation business collaboration and communications environments.
Centralized Application Integration and Management that Makes it Easier to Integrate, Deploy and Manage. Our solutions provide enterprises with the ability to perform integration and management tasks as part of a central service rather than from individual platforms, reducing the amount of time required to perform integration activities and to support and manage unified communications services.
Our Competitive Strengths
In addition to the strengths of our solutions, we believe the following competitive strengths position us well to capitalize on the opportunities presented by the market trends impacting our industry.
Leading Position Across Our Key End Markets.We are a leader in business collaboration and communications, with leading market share in worldwide unified communications, contact center infrastructure, voice maintenance services and enterprise messaging.
Large, Diverse and Global Customer Installed Base.Our solutions address the needs of a diverse range of customers from large multinational enterprises to small- and medium-sized businesses in a number of industries. We believe our large and diverse customer base provides us with recurring revenue and a continuing growth opportunity to further expand within our customer base.
History of Innovation with Large Pipeline of New Products and Differentiated Approach to Commercialization.As of September 30, 2011, we had approximately 5,600 patents and pending patent applications, including foreign counterparts. Since the beginning of fiscal year 2010, we have introduced more than 70 new offerings across our portfolio. We have a differentiated commercialization approach that we believe results in new products with broad appeal and accelerates the timeline for development and adoption.
Flexible Go-to-Market Strategy Expands Reach of Our Products and Services.We sell our solutions both directly and through an indirect sales channel, enabling us to reach customers across industries and globally. With the acquisition of NES, we significantly expanded our channel coverage and deepened our vertical expertise.
4
Table of Contents
Global End-to-End Services Capability Provides Large Recurring Revenue Stream. AGS provides us with a key advantage over many of our competitors whose customers must contract with third-party service providers, adding to the overall cost and complexity of the deployment of their solutions. In addition, our services contracts tend to be multi-year arrangements, have high renewal rates and have provided us with a large recurring revenue base and significant visibility into our customers’ future needs.
Experienced Management Team with Track Record of Execution. We have an experienced team of senior executives that has demonstrated an ability to identify critical trends in the technology and communications sectors and develop a comprehensive strategic vision to enable businesses to capitalize on those trends.
Our Growth Strategy
We intend to be the preeminent provider of business collaboration solutions with a commitment to open standards and innovative products, services and solutions. Key elements of our strategy include:
Leverage our Leading Market Positions to Drive the Adoption of our Next-Generation Collaboration Solutions. Our market leadership, global scale, extensive customer interaction and credibility with customers and prospects position us to drive and shape the evolution of enterprise communications toward greater business collaboration.
Capture Additional Market Share Across our Portfolio of Products and Services. Our open architecture integrates with competitor systems and provides a path for gradual transition, while still achieving cost savings and improved functionality. In addition, with the NES acquisition, we acquired a data networking portfolio, which we believe provides a compelling value proposition to both our large installed base and new customers. Although we have a modest market presence in data networking, we believe we have a strong portfolio from which to expand our customer base. There is also significant opportunity to sell new maintenance contracts to customers acquired in the NES acquisition.
Expand Margins and Profitability. Our increasing focus on higher-margin software revenue, efficiencies achieved through enhanced product design and services productivity, cost-savings initiatives and achieving greater economies of scale is designed to drive profitable growth worldwide and further increase our profit margins.
Continue to Develop Products and Services Around Our Next Generation Business Collaboration Solutions to Drive Revenue Growth and Shorter Sales Cycles. Through our continued focus on product innovation and substantial investment in research and development for new products and services in high-growth areas, we believe our customers are more likely to upgrade their business collaboration solutions more frequently. We believe our ability to develop innovative solutions is advanced by feedback gathered from our extensive customer relationships and our customer focus, which allow us to better meet our customers’ needs and anticipate market demand.
Continue to Invest in and Expand our Sales and Distribution Capabilities to Attack New Markets and Better Penetrate Existing Markets. Our continued investment in our channel partners and sales force is designed to help optimize their market focus, improve segmentation, enter new geographies and provide our channel partners with compelling business incentives and discounts, along with training, marketing programs and technical support through Avaya Connect, our business partner program. We also plan to leverage our sales and distribution channels to accelerate customer adoption and generate an increasing percentage of our revenue from our new high value software solutions and user experience-centric applications.
5
Table of Contents
Pursue Strategic Relationships and Develop Talent Globally. We plan to continue our global growth by continuing to establish relationships and alliances and selectively acquiring capability-enhancing businesses. We intend to support this growth by developing a workforce that has both exceptional technical and leadership capabilities.
Risks Associated with Our Company
Our business is subject to a number of risks of which you should be aware before making an investment
decision. These risks are discussed more fully in the “Risk Factors” section of this prospectus immediately following this prospectus summary. These risks include, but are not limited to, the following:
| • | Our revenues are dependent on general economic conditions and the willingness of enterprises to make capital investments. The impact of economic conditions on the willingness of enterprises to make capital investments, particularly in business collaboration technology and related services can significantly affect our operating results and we believe that enterprises continue to be cautious about sustained economic growth. |
| • | The market opportunity for advanced communications products and services, including our next-generation business collaboration solutions may not develop in the ways that we anticipate. The demand for our offerings can change quickly and in ways that we may not anticipate because the market in which we operate is characterized by rapid, and sometimes disruptive, technological developments, evolving industry standards, frequent new product introductions and enhancements, changes in customer requirements and a limited ability to accurately forecast future customer demand. |
| • | We are dependent on our intellectual property. As a leader in technology and innovation in business collaboration, we are dependent on the maintenance of our current intellectual property rights and the establishment of new intellectual property rights. If we are not able to protect our intellectual property rights or if those rights are invalidated or circumvented, our business may be adversely affected. |
| • | Our degree of leverage could adversely affect our ability to raise additional capital to fund our operations and limit our ability to react to changes in the economy or our industry. Our degree of leverage could have important consequences, including making it more difficult for us to make payments on our indebtedness and increasing our vulnerability to general economic and industry conditions. |
| • | We face formidable competition from numerous established firms that provide both traditional enterprise voice communications solutions as well as providers of technology related to business collaboration and contact center solutions. In addition to the competition we face from traditional enterprise voice communications solutions and providers of technology related to business collaboration and contact center solutions, we expect competition to intensify and expand to include companies that do not currently compete directly against us. |
| • | The Sponsors have significant influence over corporate transactions. Following the completion of this offering, funds affiliated with TPG Capital, or TPG, and Silver Lake Partners, or Silver Lake, which are collectively referred to as our Sponsors, will have the ability to control the outcome of matters submitted for stockholder approval and may have interests that differ from those of our other stockholders. |
| • | We expect to be a “controlled company” within the meaning of the rules of the New York Stock Exchange. After completion of this offering, the Sponsors will continue to control a majority of the voting power of our outstanding common stock. As a result, we will qualify for, and intend to rely on, exemptions from certain corporate governance requirements. |
6
Table of Contents
Company Information and Corporate Structure
Our principal executive offices are located at 211 Mt. Airy Road, Basking Ridge, NJ 07920. Our telephone number is (908) 953-6000. Our website address is www.avaya.com. Information contained in, and that can be accessed through, our website is not incorporated into and does not form a part of this prospectus.
Avaya Holdings Corp., formerly known as Sierra Holdings Corp., was incorporated under the laws of the State of Delaware on June 1, 2007 by affiliates of the Sponsors. The Sponsors, through a subsidiary holding company, acquired Avaya Inc., our principal U.S. operating subsidiary, and each of its subsidiaries in a merger transaction that was completed on October 26, 2007, which we refer to in this prospectus as the Merger. Since Avaya Inc.’s obligation to file periodic and current reports with the SEC ended on October 1, 2010, it has voluntarily filed such reports with the SEC to comply with the terms of the indentures governing its senior secured and unsecured notes. Avaya Holdings Corp. is a holding company with no stand-alone operations and has no material assets other than its ownership interest in Avaya Inc. and its subsidiaries. All of Avaya Holdings Corp.’s operations are conducted through its various subsidiaries, which are organized and operated according to the laws of their jurisdiction of incorporation, and consolidated by Avaya Holdings Corp.
As of September 30, 2011, our total outstanding indebtedness was $6,157 million (excluding capital lease obligations and $9 million of debt discount due upon settlement of our indebtedness), of which $5,148 million was attributable to financing associated with the Merger and $1,009 million was attributable to financing associated with the acquisition of NES. For a complete discussion of our financing see Note 9, “Financing Arrangements,” to our consolidated financial statements included elsewhere in this prospectus.
The following chart shows our organizational structure immediately following the consummation of this offering:
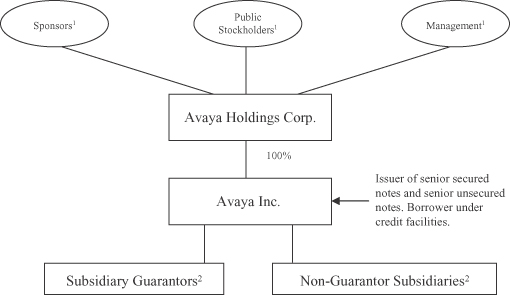
| (1) | Represents %, % and % of the total voting power in our company, respectively. |
| (2) | Substantially all of our domestic 100% owned subsidiaries as of September 30, 2011 guarantee our notes and our credit facilities. Other subsidiaries, including non-U.S. subsidiaries, do not guarantee our notes or our credit facilities. See “Description of Certain Outstanding Indebtedness” for more information. |
7
Table of Contents
THE OFFERING
Common stock we are offering | Shares | |
Common stock to be outstanding after this offering | Shares | |
Option to purchase additional shares offered to underwriters | Shares | |
Use of proceeds | We intend to use the net proceeds received by us in connection with this offering for the following purposes: | |
• to repay a portion of our long-term indebtedness; | ||
• to redeem all of our outstanding Series A Preferred Stock; and | ||
• to pay certain amounts in connection with the termination of our management services agreement with affiliates of our Sponsors pursuant to its terms. | ||
See “Use of Proceeds.” | ||
Risk factors | You should carefully read the “Risk Factors” section of this prospectus beginning on page 16 for a discussion of factors to consider carefully before deciding whether to purchase shares of our common stock. | |
Proposed NYSE symbol | “AVYA” | |
As of September 30, 2011, we had 487,401,790 shares of common stock outstanding. This excludes the following numbers of shares of our common stock issuable in connection with the exercise of warrants outstanding as of September 30, 2011 and equity awards under our Amended and Restated 2007 Equity Incentive Plan, or the 2007 Plan:
| • | 100,000,000 shares of common stock issuable upon the exercise of warrants held by affiliates of our Sponsors, which warrants are subject to the lock-up agreements described under “Underwriters” and exercisable at any time prior to December 18, 2019 at an exercise price of $3.25 per share, see “Description of Capital Stock—Warrants” and “Principal Stockholders”; |
| • | 429,761 shares of common stock issuable on the exercise of options that were awarded to executive officers prior to the Merger and were permitted to be rolled over into equity awards issued by us upon consummation of the Merger, or Continuation Options, each with an exercise price of $1.25 per share; |
| • | 972,341 shares of common stock issuable on the distribution of units that were awarded to executive officers prior to the Merger and were permitted to be rolled over into equity awards issued by us upon consummation of the Merger, or Continuation Units; |
| • | 43,595,906 shares of common stock issuable upon the exercise of options with exercise prices ranging from $3.00 to $5.00 per share and a weighted average exercise price of $3.11 per share; |
| • | 1,560,000 shares of common stock issuable on the vesting and distribution of restricted stock units, or RSUs; and |
8
Table of Contents
| • | 4,674,875 additional shares of common stock as of September 30, 2011 reserved for future grants under the 2007 Plan. |
This also excludes additional shares of common stock reserved for future equity incentive plans to be effective upon the completion of this offering.
Unless otherwise indicated, all information in this prospectus:
| • | assumes the adoption of our amended and restated certificate of incorporation and our amended and restated bylaws to be effective upon the closing of this offering; |
| • | assumes no exercise by the underwriters of their option to purchase up to additional shares of our common stock in this offering; and |
| • | reflects, for all prior periods, a for of our common stock to be effected prior to the consummation of this offering. |
9
Table of Contents
SUMMARY HISTORICAL FINANCIAL DATA
The following table sets forth our summary historical consolidated financial data at the dates and for the periods indicated. Avaya Holdings Corp. was incorporated on June 1, 2007 by affiliates of the Sponsors. Avaya Holdings Corp., through a subsidiary holding company, entered into a merger agreement with Avaya Inc., or the Predecessor, pursuant to which the holding company merged with and into Avaya Inc., with Avaya Inc. continuing as the surviving entity and a wholly owned subsidiary of Avaya Holdings Corp., in a transaction that was completed on October 26, 2007. Avaya Holdings Corp. is a holding company and has no material assets or stand-alone operations other than its ownership in Avaya Inc. and its subsidiaries. The summary historical consolidated financial data set forth below are those of Avaya Holdings Corp. and its consolidated subsidiaries, or the Successor, from its inception on June 1, 2007 through September 30, 2011 and those of its predecessor, Avaya Inc., for all prior periods through the closing date of the Merger.
The Predecessor summary historical consolidated financial data set forth below as of and for the year ended September 30, 2007 and for the period October 1, 2007 through October 26, 2007 have been derived from our Predecessor’s audited consolidated financial statements and related notes, which are not included in this prospectus. The Successor summary historical consolidated financial data set forth below as of and for the years ended September 30, 2009, 2010 and 2011 have been derived from our audited consolidated financial statements and related notes included elsewhere in this prospectus. The Successor summary historical consolidated financial data set forth below for the year ended September 30, 2008 have been derived from our audited consolidated financial statements and related notes, which are not included in this prospectus. The Successor summary historical consolidated financial data set forth below as of and for the period June 1, 2007 through September 30, 2007 has been derived from our consolidated financial statements, which are not included in this prospectus. The Successor had no operations prior to the Merger. As part of the Merger on October 26, 2007, we entered into various financing arrangements and, as a result, had a different capital structure following the Merger. Accordingly, the results of operations for periods subsequent to the Merger will not necessarily be comparable to prior periods.
The following summary should be read together with our consolidated financial statements and the related notes appearing elsewhere in this prospectus and the “Management’s Discussion and Analysis of Financial Condition and Results of Operations” section of this prospectus.
10
Table of Contents
| Successor | Predecessor | |||||||||||||||||||||||||||||
| Fiscal year ended September 30, | Period from June 1, 2007 through September 30, 2007(2) | Period from October 1, 2007 through October 26, 2007 | Fiscal year ended September 30, 2007 | |||||||||||||||||||||||||||
| 2011 | 2010 | 2009 | 2008(1) | |||||||||||||||||||||||||||
| (in millions, except per share amounts) | ||||||||||||||||||||||||||||||
STATEMENT OF OPERATIONS DATA: | ||||||||||||||||||||||||||||||
REVENUE | ||||||||||||||||||||||||||||||
Products | $ | 2,976 | $ | 2,602 | $ | 1,923 | $ | 2,595 | $ | — | $ | 96 | $ | 2,875 | ||||||||||||||||
Services | 2,571 | 2,458 | 2,227 | 2,328 | — | 150 | 2,403 | |||||||||||||||||||||||
|
|
|
|
|
|
|
|
|
|
|
|
|
| |||||||||||||||||
| 5,547 | 5,060 | 4,150 | 4,923 | — | 246 | 5,278 | ||||||||||||||||||||||||
|
|
|
|
|
|
|
|
|
|
|
|
|
| |||||||||||||||||
COSTS | ||||||||||||||||||||||||||||||
Products: | ||||||||||||||||||||||||||||||
Costs (exclusive of amortization of intangible assets) | 1,314 | 1,243 | 872 | 1,256 | — | 56 | 1,295 | |||||||||||||||||||||||
Amortization of technology intangible assets | 257 | 291 | 248 | 231 | — | 1 | 20 | |||||||||||||||||||||||
Services | 1,344 | 1,354 | 1,164 | 1,403 | — | 100 | 1,512 | |||||||||||||||||||||||
|
|
|
|
|
|
|
|
|
|
|
|
|
| |||||||||||||||||
| 2,915 | 2,888 | 2,284 | 2,890 | — | 157 | 2,827 | ||||||||||||||||||||||||
|
|
|
|
|
|
|
|
|
|
|
|
|
| |||||||||||||||||
GROSS MARGIN | 2,632 | 2,172 | 1,866 | 2,033 | — | 89 | 2,451 | |||||||||||||||||||||||
|
|
|
|
|
|
|
|
|
|
|
|
|
| |||||||||||||||||
OPERATING EXPENSES | ||||||||||||||||||||||||||||||
Selling, general and administrative | 1,845 | 1,721 | 1,272 | 1,456 | — | 111 | 1,552 | |||||||||||||||||||||||
Research and development | 461 | 407 | 309 | 376 | — | 29 | 444 | |||||||||||||||||||||||
Amortization of intangible assets | 226 | 218 | 207 | 187 | — | 4 | 48 | |||||||||||||||||||||||
Impairment of long-lived assets | — | 16 | 2 | 10 | — | — | — | |||||||||||||||||||||||
Impairment of indefinite-lived intangible assets | — | — | 60 | 130 | — | — | — | |||||||||||||||||||||||
Goodwill impairment | — | — | 235 | 899 | — | — | — | |||||||||||||||||||||||
Restructuring charges, net | 189 | 171 | 160 | — | — | 1 | 36 | |||||||||||||||||||||||
In-process research and development charge | — | — | 12 | 112 | — | — | — | |||||||||||||||||||||||
Acquistion-related costs | 5 | 20 | 29 | — | — | — | — | |||||||||||||||||||||||
Merger-related costs | — | — | — | 1 | — | 57 | 105 | |||||||||||||||||||||||
|
|
|
|
|
|
|
|
|
|
|
|
|
| |||||||||||||||||
| 2,726 | 2,553 | 2,286 | 3,171 | — | 202 | 2,185 | ||||||||||||||||||||||||
|
|
|
|
|
|
|
|
|
|
|
|
|
| |||||||||||||||||
OPERATING (LOSS) INCOME | (94 | ) | (381 | ) | (420 | ) | (1,138 | ) | — | (113 | ) | 266 | ||||||||||||||||||
Interest expense | (460 | ) | (487 | ) | (409 | ) | (377 | ) | — | — | (1 | ) | ||||||||||||||||||
Loss on extinguishment of debt | (246 | ) | — | — | — | — | — | — | ||||||||||||||||||||||
Other income, net | 5 | 15 | 14 | 27 | — | 1 | 43 | |||||||||||||||||||||||
|
|
|
|
|
|
|
|
|
|
|
|
|
| |||||||||||||||||
(LOSS) INCOME BEFORE INCOME TAXES | (795 | ) | (853 | ) | (815 | ) | (1,488 | ) | — | (112 | ) | 308 | ||||||||||||||||||
Provision for (benefit from) income taxes | 68 | 18 | 30 | (183 | ) | — | (24 | ) | 93 | |||||||||||||||||||||
|
|
|
|
|
|
|
|
|
|
|
|
|
| |||||||||||||||||
NET (LOSS) INCOME | (863 | ) | (871 | ) | (845 | ) | (1,305 | ) | — | (88 | ) | 215 | ||||||||||||||||||
Less net income attributable to noncontrolling interests | — | 3 | 2 | 2 | — | — | 3 | |||||||||||||||||||||||
|
|
|
|
|
|
|
|
|
|
|
|
|
| |||||||||||||||||
NET (LOSS) INCOME ATTRIBUTABLE TO AVAYA HOLDINGS CORP. | (863 | ) | (874 | ) | (847 | ) | (1,307 | ) | — | (88 | ) | 212 | ||||||||||||||||||
Less: Accretion and accrued dividendson Series A preferred stock | (7 | ) | (62 | ) | — | — | — | — | — | |||||||||||||||||||||
|
|
|
|
|
|
|
|
|
|
|
|
|
| |||||||||||||||||
NET (LOSS) INCOME ATTRIBUTABLE TO AVAYA HOLDINGS CORP. COMMON STOCKHOLDERS | $ | (870 | ) | $ | (936 | ) | $ | (847 | ) | $ | (1,307 | ) | $ | — | $ | (88 | ) | $ | 212 | |||||||||||
|
|
|
|
|
|
|
|
|
|
|
|
|
| |||||||||||||||||
SHARE DATA: | ||||||||||||||||||||||||||||||
Net (loss) income per share attributable to common stockholders—basic | $ | (1.78 | ) | $ | (1.92 | ) | $ | (1.74 | ) | $ | (2.87 | ) | $ | — | $ | (0.19 | ) | $ | 0.47 | |||||||||||
Weighted average shares outstanding—basic | 489.0 | 488.6 | 488.1 | 455.9 | — | 462.9 | 454.2 | |||||||||||||||||||||||
Net (loss) income per share attributable to common stockholders—diluted | (1.78 | ) | (1.92 | ) | (1.74 | ) | (2.87 | ) | — | (0.19 | ) | 0.46 | ||||||||||||||||||
Weighted average shares outstanding—diluted | 489.0 | 488.6 | 488.1 | 455.9 | — | 462.9 | 461.3 | |||||||||||||||||||||||
11
Table of Contents
| Successor | Predecessor | |||||||||||||||||||||||||||||
| Fiscal year ended September 30, | Period from June 1, 2007 through September 30, 2007(2) | Period from October 1, 2007 through October 26, 2007 | Fiscal year ended September 30, 2007 | |||||||||||||||||||||||||||
| 2011 | 2010 | 2009 | 2008(1) | |||||||||||||||||||||||||||
| (in millions) | ||||||||||||||||||||||||||||||
BALANCE SHEET DATA (at end of period): | ||||||||||||||||||||||||||||||
Cash and cash equivalents | $ | 415 | $ | 594 | $ | 582 | $ | 594 | $ | — | $ | 1,270 | ||||||||||||||||||
Intangible assets, net | 2,129 | 2,603 | 2,636 | 3,154 | — | 248 | ||||||||||||||||||||||||
Goodwill | 4,079 | 4,075 | 3,695 | 3,956 | — | 1,157 | ||||||||||||||||||||||||
Total assets | 8,561 | 9,276 | 8,665 | 10,010 | — | 5,933 | ||||||||||||||||||||||||
Total debt (excluding capital lease obligations) | 6,157 | 5,928 | 5,150 | 5,222 | — | — | ||||||||||||||||||||||||
Preferred stock, Series A | 137 | 130 | — | — | — | — | ||||||||||||||||||||||||
Total Avaya Holdings Corp. stockholders’ equity (deficiency) | (2,500 | ) | (1,543 | ) | (682 | ) | 1,063 | — | 2,586 | |||||||||||||||||||||
STATEMENT OF CASH FLOWS DATA: | ||||||||||||||||||||||||||||||
Net cash provided by (used in) | ||||||||||||||||||||||||||||||
Operating activities | $ | (300 | ) | $ | 42 | $ | 242 | $ | 304 | $ | — | $ | 133 | $ | 637 | |||||||||||||||
Investing activities | (101 | ) | (864 | ) | (155 | ) | (7,205 | ) | — | (16 | ) | (360 | ) | |||||||||||||||||
Financing activities | 228 | 853 | (101 | ) | 7,512 | — | 11 | 54 | ||||||||||||||||||||||
OTHER FINANCIAL DATA: | ||||||||||||||||||||||||||||||
EBITDA | $ | 313 | $ | 320 | $ | 240 | $ | (515 | ) | $ | — | $ | (94 | ) | $ | 557 | ||||||||||||||
Adjusted EBITDA(3) | 971 | 795 | 753 | 859 | — | (27 | ) | 832 | ||||||||||||||||||||||
Capital expenditures, net | 83 | 79 | 76 | 120 | — | 8 | 120 | |||||||||||||||||||||||
Capitalized software development costs | 42 | 43 | 43 | 74 | — | 7 | 93 | |||||||||||||||||||||||
| (1) | The summary historical consolidated financial data above as of and for the year ended September 30, 2008 reflect the results of Avaya Holdings Corp. for the entire fiscal year and includes the results of Avaya Inc. and its consolidated subsidiaries subsequent to October 26, 2007, the date of the Merger. |
| (2) | Avaya Holdings Corp. is a holding company formed on June 1, 2007 by affiliates of the Sponsors for the purpose of consummating the Merger. Avaya Holdings Corp. has no material assets or stand-alone operations other than its ownership in Avaya Inc. and its subsidiaries. The summary historical consolidated financial data above as of September 30, 2007 and for the period from June 1, 2007 through September 30, 2007 reflects the results of Avaya Holdings Corp., which did not have assets or operations prior to the Merger. |
| (3) | Adjusted EBITDA is calculated in accordance with Avaya Inc.’s debt agreements entered into in connection with the Merger. For the fiscal year ended September 30, 2007, Adjusted EBITDA is calculated in accordance with the debt agreements for comparative purposes. |
EBITDA is defined as net income (loss) before income taxes, interest and depreciation and amortization. EBITDA provides us with a measure of operating performance that excludes items that are outside the control of management, which can differ significantly from company to company depending on capital structure, the tax jurisdictions in which companies operate and capital investments. Under Avaya Inc.’s debt agreements, its ability to draw on its revolving credit facilities or engage in activities such as incurring additional indebtedness, making investments and paying dividends is tied in part to ratios based on Adjusted EBITDA. EBITDA and Adjusted EBITDA are non-GAAP measures. GAAP is a reference to generally accepted accounting principles in the United States of America. As defined in Avaya Inc.’s debt agreements, Adjusted EBITDA is a measure of EBITDA further adjusted to exclude certain charges and other adjustments permitted in calculating covenant compliance under Avaya Inc.’s debt agreements. We believe that including supplementary information concerning Adjusted EBITDA is appropriate to provide additional information to investors to demonstrate compliance with Avaya Inc.’s debt agreements and because it serves as a basis for determining management compensation. In addition, we believe Adjusted EBITDA provides more comparability between our historical results and results that reflect purchase accounting and our new capital structure following the Merger. Accordingly, Adjusted EBITDA measures our financial performance based on operational factors that management can impact in the short-term, namely the Company’s pricing strategies, volume, costs and expenses of the organization.
12
Table of Contents
EBITDA and Adjusted EBITDA have limitations as analytical tools. Adjusted EBITDA does not represent net income (loss) or cash flow from operations as those terms are defined by GAAP and does not necessarily indicate whether cash flows will be sufficient to fund cash needs. While Adjusted EBITDA and similar measures are frequently used as measures of operations and the ability to meet debt service requirements, these terms are not necessarily comparable to other similarly titled captions of other companies due to the potential inconsistencies in the method of calculation. Adjusted EBITDA does not reflect the impact of earnings or charges resulting from matters that we consider not to be indicative of our ongoing operations. In particular, the definition of Adjusted EBITDA in Avaya Inc.’s debt agreements allows us to add back certain non-cash charges that are deducted in calculating net income (loss). Avaya Inc.’s debt agreements also allows us to add back restructuring charges, Sponsor monitoring fees and other specific cash costs and expenses as defined in the agreements and that portion of our pension costs, other post-employment benefit costs, and non-retirement post-employment benefit costs representing the amortization of prior service costs and net actuarial gains/losses associated with these employment benefits. However, these are expenses that may recur, may vary and are difficult to predict. Further, Avaya Inc.’s debt agreements require that Adjusted EBITDA be calculated for the most recent four fiscal quarters. As a result, the measure can be disproportionately affected by a particularly strong or weak quarter. Further, it may not be comparable to the measure for any subsequent four-quarter period or any complete fiscal year.
13
Table of Contents
The unaudited reconciliation of net (loss) income, which is a GAAP measure, to EBITDA and Adjusted EBITDA is presented below:
| Successor |
| Predecessor | ||||||||||||||||||||||||||||
| Fiscal year ended September 30, | Period from June 1, 2007 through September 30, 2007(2) |
| Period from October 1, 2007 through October 26, 2007 | Fiscal year ended September 30, 2007 | ||||||||||||||||||||||||||
| 2011 | 2010 | 2009 | 2008(1) | |||||||||||||||||||||||||||
| (in millions) | ||||||||||||||||||||||||||||||
Net (loss) income | $ | (863 | ) | $ | (871 | ) | $ | (845 | ) | $ | (1,305 | ) | $ | — | $ | (88 | ) | $ | 215 | |||||||||||
Interest expense | 460 | 487 | 409 | 377 | — | — | 1 | |||||||||||||||||||||||
Interest income | (5 | ) | (5 | ) | (6 | ) | (20 | ) | — | (5 | ) | (49 | ) | |||||||||||||||||
Income tax expense (benefit) | 68 | 18 | 30 | (183 | ) | — | (24 | ) | 93 | |||||||||||||||||||||
Depreciation and amortization | 653 | 691 | 652 | 616 | — | 23 | 297 | |||||||||||||||||||||||
|
|
|
|
|
|
|
|
|
|
|
|
|
|
| ||||||||||||||||
EBITDA | 313 | 320 | 240 | (515 | ) | — | (94 | ) | 557 | |||||||||||||||||||||
Impact of purchase accounting adjustments(3) | — | 5 | (1 | ) | 230 | — | — | — | ||||||||||||||||||||||
Restructuring charges, net | 189 | 171 | 160 | — | — | 1 | 36 | |||||||||||||||||||||||
Sponsors’ fees(4) | 7 | 7 | 7 | 6 | — | — | — | |||||||||||||||||||||||
Merger-related costs(5) | — | — | — | 1 | — | 57 | 105 | |||||||||||||||||||||||
Acquisition-related costs(6) | 5 | 20 | 29 | — | — | — | — | |||||||||||||||||||||||
Integration-related costs(7) | 132 | 208 | 5 | — | — | — | — | |||||||||||||||||||||||
Debt registration fees | — | 1 | — | — | — | — | — | |||||||||||||||||||||||
Loss on extinguishment of debt(8) | 246 | — | — | — | — | — | — | |||||||||||||||||||||||
Third-party fees expensed in connection with debt modification(9) | 9 | — | — | — | — | — | — | |||||||||||||||||||||||
Strategic initiative costs(10) | — | 6 | 21 | 27 | — | — | — | |||||||||||||||||||||||
Non-cash share-based compensation | 12 | 19 | 10 | 21 | — | — | 39 | |||||||||||||||||||||||
Write-down of held for sale assets to net realizable value | 1 | — | — | — | — | — | — | |||||||||||||||||||||||
Loss (gain) on sale of long-lived assets | 1 | (4 | ) | 1 | 1 | — | — | (8 | ) | |||||||||||||||||||||
Impairment of long-lived assets | — | 16 | 62 | 140 | — | — | 8 | |||||||||||||||||||||||
Goodwill impairment | — | — | 235 | 899 | — | — | — | |||||||||||||||||||||||
Bank fees | — | — | — | — | — | — | 7 | |||||||||||||||||||||||
Net (income) loss of unrestricted subsidiaries, net of dividends received | — | (6 | ) | (4 | ) | (5 | ) | — | 2 | (6 | ) | |||||||||||||||||||
(Gain) loss on foreign currency transactions | (12 | ) | 1 | (8 | ) | (15 | ) | — | 1 | — | ||||||||||||||||||||
Pension/OPEB/nonretirement postemployment benefits and long-term disability costs(11) | 68 | 31 | (4 | ) | 69 | — | 6 | 94 | ||||||||||||||||||||||
|
|
|
|
|
|
|
|
|
|
|
|
|
|
| ||||||||||||||||
Adjusted EBITDA | $ | 971 | $ | 795 | $ | 753 | $ | 859 | $ | — | $ | (27 | ) | $ | 832 | |||||||||||||||
|
|
|
|
|
|
|
|
|
|
|
|
|
|
| ||||||||||||||||
| (1) | The summary historical consolidated financial data above as of and for the year ended September 30, 2008 reflect the results of Avaya Holdings Corp. for the entire fiscal year and includes the results of Avaya Inc. and its consolidated subsidiaries subsequent to October 26, 2007, the date of the Merger. |
| (2) | Avaya Holdings Corp. is a holding company formed on June 1, 2007 by affiliates of the Sponsors for the purpose of consummating the Merger. Avaya Holdings Corp. has no material assets or stand-alone operations other than its ownership in Avaya Inc. and its subsidiaries. The summary historical consolidated financial data above as of September 30, 2007 and for the period from June 1, 2007 through September 30, 2007 reflects the results of Avaya Holdings Corp., which did not have assets or operations prior to the Merger. |
| (3) | For fiscal years 2011 and 2010, represents adjustments to eliminate the impact of certain purchase accounting adjustments recorded as a result of the acquisitions of NES and Konftel AB, or Konftel, and the Merger, including the recognition of the amortization of business partner commissions, which were eliminated in purchase accounting, the recognition of revenue and costs that were deferred in prior periods and eliminated in purchase accounting and the elimination of the impact of estimated fair value adjustments |
14
Table of Contents
| for certain assets and liabilities, such as inventory. For fiscal year 2009, represents the recognition of the amortization of business partner commissions which were eliminated in purchase accounting, partially offset by the recognition of revenues and costs that were deferred in prior years and eliminated in purchase accounting as a result of the Merger. For fiscal year 2008, represents adjustments to eliminate the impact of certain purchase accounting adjustments recorded as a result of the Merger, including: the recognition of the amortization of business partner commissions, which were eliminated in purchase accounting; elimination of certain deferred revenues and deferred costs and expenses; elimination of previously capitalized software development costs; write-off of in-process research and development, or IPRD, costs and adjustment to estimated fair values of certain assets and liabilities, such as inventory. |
| (4) | Sponsors’ fees represent monitoring fees payable to affiliates of the Sponsors pursuant to a management services agreement entered into at the time of the Merger. See “Certain Relationships and Related Party Transactions.” |
| (5) | Merger-related costs are costs directly attributable to the Merger and include investment banking, legal and other third-party costs. |
| (6) | Acquisition-related costs include legal and other costs related to the acquisition of NES and other acquisitions. |
| (7) | Integration-related costs primarily represent third-party consulting fees and other administrative costs associated with consolidating and coordinating the operations of Avaya and NES. These costs were incurred in connection with, among other things, the on-boarding of NES personnel, developing compatible IT systems and internal processes and developing and implementing a strategic operating plan to help enable a smooth transition with minimal disruption to NES customers. Integration-related costs also include fees paid to certain Nortel-controlled entities for logistics and other support functions being performed on a temporary basis pursuant to a transition services agreement. |
| (8) | Loss on extinguishment of debt represents the loss recognized in connection with the payment in full of the senior secured incremental term B-2 loans. The loss is based on the difference between the reacquisition price and the carrying value of the senior secured incremental term B-2 loans. See Note 9, “Financing Arrangements,” to our consolidated financial statements located elsewhere in this prospectus. |
| (9) | The third-party fees expensed in connection with the modification of the senior secured credit facility are discussed in Note 9, “Financing Arrangements,” to our consolidated financial statements located elsewhere in this prospectus. |
| (10) | Strategic initiative costs represent consulting fees in connection with management’s cost-savings actions, which commenced subsequent to the Merger. |
| (11) | Represents that portion of our pension costs, other post-employment benefit costs, non-retirement post-employment benefit costs representing the amortization of prior service costs and net actuarial gains/losses associated with these employment benefits. For the fiscal year ended September 30, 2011, the amount includes a curtailment charge of $7 million associated with workforce reductions in Germany. |
15
Table of Contents
Investing in our common stock involves a high degree of risk. You should carefully consider the following risk factors, as well as the other information in this prospectus, before deciding to invest in our common stock. The occurrence of any of the following risks could harm our business, financial condition, results of operations or prospects. In that case, the trading price of our common stock could decline, and you may lose all or part of your investment.
Risks Associated with Our Company
Our solutions may fail to keep pace with rapidly changing technology and evolving industry standards.
The market in which we operate is characterized by rapid, and sometimes disruptive, technological developments, evolving industry standards, frequent new product introductions and enhancements and changes in customer requirements. In addition, both traditional and new competitors are investing heavily in this market and competing for customers. As next-generation business collaboration technology continues to evolve, we must keep pace in order to maintain or expand our market leading position. We recently introduced a significant number of new product offerings and are increasingly focused on new high, value software solutions, as a revenue driver. If we are not able to successfully develop and bring these new solutions to market in a timely manner, achieve market acceptance of our solutions or identify new market opportunities for our solutions, our business and results of operations may be materially and adversely affected.
The market opportunity for business collaboration, unified communications solutions and other products and services may not develop in the ways that we anticipate.
The demand for our offerings can change quickly and in ways that we may not anticipate because the market in which we operate is characterized by rapid, and sometimes disruptive, technological developments, evolving industry standards, frequent new product introductions and enhancements, changes in customer requirements and a limited ability to accurately forecast future customer orders. Our operating results may be adversely affected if the market opportunity for our products and services does not develop in the ways that we anticipate.
We cannot predict whether:
| • | our solutions will attract and retain customers and channel partners or that we can execute our sales strategy successfully; |
| • | the demand for our products and services, including Avaya Aura and the Avaya Flare Experience, will grow as quickly as we anticipate or current or future competitors or new technologies will cause the market to evolve in a manner different than we expect; |
| • | other technologies will become more accepted or standard in our industry or will disrupt our SIP-based technology platform; or |
| • | we will be able to maintain a leadership or profitable position as this opportunity develops. |
We face formidable competition from numerous established firms that provide both traditional enterprise voice communications solutions as well as providers of technology related to business collaboration and contact center solutions; as these markets evolve, we expect competition to intensify and expand to include companies that do not currently compete directly against us.
We compete against providers of both traditional enterprise voice communications solutions as well as providers of technology related to business collaboration and contact center solutions. For example, we compete with Alcatel-Lucent, Genesys Telecommunications Laboratories, Inc., or Genesys, Aspect Software, Inc., or Aspect, Brocade Communications Systems, Inc., or Brocade, Cisco Systems, Inc., or Cisco, Juniper Networks,
16
Table of Contents
Inc., or Juniper, Microsoft Corporation, or Microsoft, NEC Corporation, or NEC, and Siemens Enterprise Communications Group, or SEN. Our video conferencing solutions both partner and compete with solutions offered by Polycom Inc., TANDBERG (now Cisco) and LifeSize (now a division of Logitech International S.A.). We also face competition in the small and medium enterprise market from many competitors, including Cisco, Alcatel-Lucent, NEC, Matsushita Electric Corporation of America, and Mitel Networks Corp., or Mitel, although the market for these products is more fragmented. We face competition in certain geographies with companies that have a particular strength and focus in particular countries or regions, such as Huawei Technologies Co., Ltd. in China and Intelbras S.A. in Latin America. Our services business competes with companies like those above in offering services, either directly or indirectly through their channel partners, with respect to their own product offerings, as well as with many value-added resellers, consulting and systems integration firms and network service providers.
In addition, because the business collaboration market continues to evolve and technology continues to develop rapidly, we may face competition in the future from companies that do not currently compete against us, but whose current business activities may bring them into competition with us in the future. In particular, this may be the case as business, information technology and communications applications deployed on converged networks become more integrated to support business collaboration. We may face increased competition from current leaders in information technology infrastructure, information technology, consumer products companies, personal and business applications and the software that connects the network infrastructure to those applications. With respect to services, we may also face competition from companies that seek to sell remotely hosted services or software as a service directly to the end customer. Competition from these potential market entrants may take many forms, including offering products and applications similar to those we offer as part of another offering. In addition, these technologies continue to move from a proprietary environment to an open standards-based environment.
Several of our existing competitors have, and many of our future competitors may have, greater financial, personnel, technical, research and development and other resources, more well-established brands or reputations and broader customer bases than we do and, as a result, these competitors may be in a stronger position to respond quickly to potential acquisitions and other market opportunities, new or emerging technologies and changes in customer requirements. Some of these competitors may have customer bases that are more geographically balanced than ours and, therefore, may be less affected by an economic downturn in a particular region. Other competitors may have deeper expertise in a particular stand-alone technology that develops more quickly than we anticipate. Competitors with greater resources also may be able to offer lower prices, additional products or services or other incentives that we cannot match or do not offer. Industry consolidations may also create competitors with broader and more geographic coverage and the ability to reach enterprises through communications service providers. Existing customers of data networking companies that compete against us may be inclined to purchase enterprise communications solutions from their current data networking or software vendors rather than from us. Also, as communications and data networks converge, we may face competition from systems integrators that traditionally have been focused on data network integration.
We cannot predict which competitors may enter our markets in the future, what form such competition may take or whether we will be able to respond effectively to the entry of new competitors into competition with us or the rapid evolution in technology and product development that has characterized our businesses. In addition, in order to effectively compete with any new market entrant, we may need to make additional investments in our business, use more capital resources than our business currently requires or reduce prices, any of which may materially and adversely affect our profitability.
Our revenues are dependent on general economic conditions and the willingness of enterprises to make capital investments.
One factor that significantly affects our operating results is the impact of economic conditions on the willingness of enterprises to make capital investments, particularly in business collaboration technology and
17
Table of Contents
related services. Given the current state of the economy, we believe that enterprises continue to be cautious about sustained economic growth and have tried to maintain or improve profitability through cost control and constrained capital spending, which places additional pressure on IT departments to demonstrate acceptable return on investment and may cause them to delay or reject capital projects, including implementing our solutions. Because it is not certain whether enterprises will increase spending on business collaboration technology significantly in the near term, we could experience continued pressure on our ability to increase our revenue. Our ability to grow revenue also may be affected by other factors, such as competitive pricing pressures, price erosion and our ability to effectively and consistently price new and existing offers in the marketplace. If these or other conditions limit our ability to grow revenue or cause our revenue to decline and we cannot reduce costs on a timely basis or at all, our operating results may be materially and adversely affected.
Our strategy depends in part on our ability to rely on our indirect sales channel.
We continue to take steps to sell our products and services into new and expanded geographic markets and to a broader customer base. An important element of our go-to-market strategy, therefore, involves our indirect sales channel, which includes our global network of alliance partners, distributors, dealers, value-added resellers, telecommunications service providers and system integrators. For example, although we expanded our indirect channel network and gained relationships with new channel partners through our acquisition of NES, in order to be successful we must further monetize the NES installed base by increasing the services attach rate for the Nortel customers we acquired. Our relationships with channel partners are important elements of our marketing and sales efforts and certain of our contractual agreements with our largest distributors and channel partners generally permit termination of the relationship by either party for convenience upon prior notice of 30 to 180 days. See “Our Business—Customers, Sales, Partners and Distribution—Sales, Partners and Distribution” for more information on Avaya Connect, our global business partner program, and the standard terms of our program agreements. Our financial results could be adversely affected if our contracts with channel partners were terminated, if our relationships with channel partners were to deteriorate, if our maintenance pricing or other services strategies conflict with those of our channel partners, if any of our competitors were to enter into strategic relationships with or acquire a significant channel partner or if the financial condition of our channel partners were to weaken. In addition, we may expend time, money and other resources on developing and maintaining channel relationships that are ultimately unsuccessful. There can be no assurance that we will be successful in maintaining, expanding or developing relationships with channel partners, including those obtained as a result of the acquisition of NES. If we are not successful, we may lose sales opportunities, customers and market share.
We are dependent on our intellectual property. If we are not able to protect our proprietary rights or if those rights are invalidated or circumvented, our business may be adversely affected.
We believe that developing new products and technology is critical to our success. As a leader in technology and innovation in business collaboration, we are dependent on the maintenance of our current intellectual property rights and the establishment of new intellectual property rights. We generally protect our intellectual property through patents, trademarks, trade secrets, copyrights, confidentiality and nondisclosure agreements and other measures. There can be no assurance that patents will be issued from pending applications that we have filed or that our patents will be sufficient to protect our key technology. Although we have been granted and have acquired many patents, have obtained other intellectual property rights and continue to file new patent applications and seek additional proprietary rights, there can be no assurances made that any of our patents, patent applications or our other intellectual property or proprietary rights will not be challenged, invalidated or circumvented. In addition, our business is global and the level of protection of our proprietary technology will vary by country, particularly in countries that do not have well developed judicial systems or laws that adequately protect intellectual property rights. Any actions taken in these countries may have results that are different than if such actions were taken under the laws of the U.S. Patent litigation and other challenges to our patents and other proprietary rights are costly and unpredictable and may prevent us from marketing and selling a product in a particular geographic area. Patent filings by third parties, whether made before or after the date of our filings, could render our intellectual property less valuable. Competitors and others may also misappropriate
18
Table of Contents
our intellectual property, disputes as to ownership of intellectual property may arise and our intellectual property may otherwise fall into the public domain. If we are unable to protect our proprietary rights, we may be at a disadvantage to others who did not incur the substantial time and expense we incurred to create our products. In addition, our efforts to enforce or protect our proprietary rights may be ineffective, could result in substantial costs and diversion of resources and could substantially harm operating results.
If we fail to retain or attract key employees, our business may be harmed.
The success of our business depends on the skill, experience and dedication of our employee base. If we are unable to retain and recruit sufficiently experienced and capable personnel, especially in the key areas of product development, sales, services and management, our business and financial results may suffer. Experienced and capable personnel in the technology industry remain in high demand, and there is continual competition for their talents among our competitors. When talented employees leave, we may have difficulty replacing them and our business may suffer. While we strive to maintain our competitiveness in the marketplace, there can be no assurance that we will be able to successfully retain and attract the personnel that we need to achieve our business objectives.
We rely on third-party providers for the manufacture, warehousing and distribution logistics associated with our products.
We have outsourced substantially all of our manufacturing operations to several electronic manufacturing services, or EMS, providers. Our EMS providers produce the vast majority of products in facilities located in China, with other products produced in facilities located in Israel, Mexico, Malaysia, Taiwan, Germany, Indonesia, the United Kingdom and the U.S. All manufacturing of our products is performed in accordance with detailed specifications and product designs furnished or approved by us and is subject to rigorous quality control standards. We periodically review our product manufacturing operations and consider changes we believe may be necessary or appropriate. Although we closely manage the transition process when manufacturing changes are required, we could experience disruption to our operations during any such transition. Any such disruption could negatively affect our reputation and our results of operations. We also purchase certain hardware components and license certain software components and resell them under the Avaya brand. In some cases, certain components are available only from a single source or from a limited source of suppliers. Delays or shortages associated with these components could cause significant disruption to our operations.
As our business and operations related relationships have expanded globally in the last few years, changes in economic or political conditions, as well as natural disasters, in a specific country or region could negatively affect our revenue, costs, expenses and financial condition or those of our channel partners and distributors.
We conduct significant sales and customer support operations and increasing amounts of our research and development activities in countries outside of the U.S. and also depend on non-U.S. operations of our contract manufacturers and our distribution partners. For the fiscal year ended September 30, 2011, we derived 46% of our revenue from sales outside the U.S. The vast majority of our contract manufacturing also takes place outside the U.S., primarily in China. Our future operating results, including our ability to import our products from, export our products to, or sell our products in various countries, could be adversely affected by a variety of uncontrollable and changing factors. These factors include political conditions, economic conditions, legal and regulatory constraints, protectionist legislation, relationships with employees and works councils, currency regulations, health or similar issues, natural disasters and other matters in any of the countries or regions in which we and our contract manufacturers and business partners currently operate or intend to operate in the future. Additional risks inherent in our global operations generally include, among other things, the costs and difficulties of managing international operations, adverse tax consequences, including imposition of withholding or other taxes on payments by subsidiaries, and greater difficulty in enforcing intellectual property rights (including the increased risk of counterfeiting of our products). Our prospective effective tax rate could be adversely affected by, among others, an unfavorable geographical distribution of our earnings and losses, by changes in the valuation of our deferred tax assets or liabilities or by changes in tax laws, regulations, accounting principles, or
19
Table of Contents
interpretations thereof. The various risks inherent in doing business in the U.S. generally also exist when doing business outside of the U.S., and may be exaggerated by the difficulty of doing business in numerous sovereign jurisdictions due to differences in culture, laws and regulations.
If we perform more of our operations outside the U.S., we may be exposed to increased operational and logistical risks associated with foreign operations, many of which are beyond our control and could affect our ability to operate successfully.
In order to enhance the cost-effectiveness of our operations, increasingly we have been shifting portions of certain of our operations to jurisdictions with lower cost structures than those available in certain of the countries in which we traditionally operate. This includes certain research and development, customer support and corporate infrastructure activities. We may encounter complications associated with the set-up, migration and operation of business systems and equipment in expanded or new facilities. The transition of even a portion of our research and development or customer support operations to a foreign country involves a number of logistical and technical challenges that could result in delays and other disruptions to our operations. If such delays or disruptions occur, they could damage our reputation and otherwise adversely affect our business and results of operations. To the extent that we shift any operations or functions outside of the U.S. to jurisdictions with lower cost structures, we may experience challenges in effectively managing those operations as a result of several factors, including time zone differences and regulatory, legal, employment, cultural and logistical issues. Additionally, the relocation of workforce resources may have a negative impact on our existing employees, which could negatively impact our operations. If we are unable to effectively manage our offshore operations, our business and results of operations could be adversely affected. We cannot be certain that any shifts in our operations to offshore jurisdictions will ultimately produce the expected cost savings. We cannot predict the extent of government support, availability of qualified workers, future labor rates or monetary and economic conditions in any offshore locations where we may operate. Although some of these factors may influence our decision to establish or increase our offshore operations, there are other inherent risks beyond our control, including issues such as political uncertainties and currency regulations as discussed above under “—As our business and operations related relationships have expanded globally in the last few years, changes in economic or political conditions, as well as natural disasters, in a specific country or region could negatively affect our revenue, costs, expenses and financial condition or those of our channel partners and distributors.” We are faced with competition in these offshore markets for qualified personnel, including skilled design and technical personnel, and we expect this competition to increase as companies expand their operations offshore, which could increase our costs and employee turnover rates. One or more of these factors or other factors relating to foreign operations could result in increased operating expenses and make it more difficult for us to manage our costs and operations, which could cause our operating results to decline and result in reduced revenues.
Fluctuations in foreign currency exchange rates could negatively impact our operating results.
Foreign currency exchange rates and fluctuations may have an impact on our revenue, costs or cash flows from our international operations, which could adversely affect our financial performance. Our primary currency exposures are to the euro, British pound, Indian rupee and Canadian dollar. These exposures may change over time as business practices evolve and as the geographic mix of our business changes. From time to time we enter into foreign exchange forward contracts to reduce the short-term impact of foreign currency fluctuations. However, any attempts to hedge against foreign currency fluctuation risks may be unsuccessful and result in an adverse impact to our operating results.
If we are unable to integrate acquired businesses into ours effectively, our operating results may be adversely affected.
From time to time, we seek to expand our business through acquisitions. We may not be able to successfully integrate acquired businesses into ours, and therefore we may not be able to realize the intended benefits from an acquisition. If we fail to successfully integrate acquisitions or if they fail to perform as we anticipate, our existing
20
Table of Contents
businesses and our revenue and operating results could be adversely affected. If the due diligence of the operations of these acquired businesses performed by us and by third parties on our behalf is inadequate or flawed, or if we later discover unforeseen financial or business liabilities, acquired businesses may not perform as expected. Additionally, acquisitions could result in difficulties assimilating acquired operations and products and the diversion of capital and management’s attention away from other business issues and opportunities. We may fail to retain employees acquired through acquisitions, which may negatively impact the integration efforts.
For all the reasons set forth above, the failure to integrate acquired businesses effectively may adversely impact Avaya’s business, results of operations or financial condition.
We may be subject to litigation and infringement claims, which could cause us to incur significant expenses or prevent us from selling our products or services.
From time to time, we receive notices and claims from third parties asserting that our proprietary or licensed products, systems and software infringe their intellectual property rights. The number of such claims has increased recently and there can be no assurance that the number of these notices and claims will not increase in the future and that others will not claim that our proprietary or licensed products, systems and software are infringing their intellectual property rights or that we do not in fact infringe those intellectual property rights. We may be unaware of intellectual property rights of others that may cover some of our technology. Irrespective of the merits of these claims, if a third party claimed that our proprietary or licensed systems and software infringed their intellectual property rights, any resulting litigation could be costly and time consuming and could divert the attention of management and key personnel from other business issues. The complexity of the technology involved and the uncertainty of intellectual property litigation increase these risks. These matters may result in any number of outcomes for us, including entering into licensing agreements, redesigning our products to avoid infringement, being enjoined from selling products that are found to infringe, paying damages if products are found to infringe and indemnifying customers from infringement claims as part of our contractual obligations. Royalty or license agreements may be very costly and we may be unable to obtain royalty or license agreements on terms acceptable to us or at all. Such agreements may cause operating margins to decline. We also may be subject to significant damages or an injunction against us or our use of our proprietary or licensed systems or products. In addition, some of our employees previously have been employed at other companies that provide integrated communications solutions. We may be subject to claims that these employees or we have inadvertently or otherwise used or disclosed trade secrets or other proprietary information of their former employers. These claims and other successful claims of patent or other intellectual property infringement against us could materially adversely affect our operating results. We have made and will likely continue to make investments to license and/or acquire the use of third-party intellectual property rights and technology as part of our strategy to manage this risk, but there can be no assurance that we will be successful or that any costs relating to such activity will not be material. We may also be subject to additional notice, attribution and other compliance requirements to the extent we incorporate open source software into our applications. In addition, third parties have claimed, and may in the future claim, that a customer’s use of our products, systems or software infringes the third party’s intellectual property rights. Under certain circumstances, we may be required to indemnify our customers for some of the costs and damages related to such an infringement claim. Any indemnification requirement could have a material adverse effect on our business and our operating results. For a description of certain legal proceedings regarding intellectual property, please see Note 19, “Commitments and Contingencies,” to our consolidated financial statements for the year ended September 30, 2011.
A breach of the security of our information systems or those of our third party providers could adversely affect our operating results.
We rely on the security of our information systems and, in certain circumstances, those of our third party providers, such as vendors, consultants and contract manufacturers, to protect our proprietary information and information of our customers. Information technology system failures, including a breach of our third party providers’ data security, could disrupt our ability to function in the normal course of business by potentially
21
Table of Contents
causing, among other things, delays in the fulfillment or cancellation of customer orders, disruptions in the manufacture or shipment of products, or delivery of services or an unintentional disclosure of customer, employee or our information. Additionally, despite our security procedures or those of our third party providers, information systems may be vulnerable to threats such as computer hacking, cyber-terrorism or other unauthorized attempts by third parties to access, modify or delete our or our customers’ proprietary information. Any such breach could have a material adverse effect on our operating results and our reputation as a provider of mission critical business collaboration and communications solutions. Such consequences could be exacerbated if we or our third party providers are unable to adequately recover critical systems following a systems failure.
We may be adversely affected by environmental, health and safety, laws, regulations, costs and other liabilities.
We are subject to a wide range of governmental requirements relating to employee safety and health and to environmental protection. If we violate or fail to comply with these requirements, we could be fined or otherwise sanctioned by regulators. We are subject to certain provisions of environmental laws governing the cleanup of soil and groundwater contamination that may impose joint and several liability for the costs of investigating and remediating releases of regulated materials at currently or formerly owned or operated sites and at third-party waste disposal sites. In certain circumstances, this liability may also include the cost of cleaning up historical contamination, whether or not caused by us. We are also subject to various state, federal and international laws and regulations relating to the presence of certain substances in our products and making producers of certain electrical products financially responsible for the collection, treatment, recycling and disposal of those products. For example, the European Union, or the EU, has adopted the Restriction on Hazardous Substances, or RoHS, and Waste Electrical and Electronic Equipment, or WEEE, directives. Similar laws and regulations have been or may be enacted in other regions. Additionally, new requirements addressing the operating characteristics of our products are emerging, such as the EU Energy Using Product, or EuP, directive, which may necessitate reengineering of some products.
Environmental laws are complex, change frequently and have tended to become more stringent over time. It is often difficult to estimate the future impact of environmental matters, including potential liabilities. There can be no assurance that our costs of complying with current and future environmental and health and safety laws, including existing, pending and future environmental laws addressing climate change, and our liabilities arising from past or future releases of, or exposure to, regulated materials will not exceed any amounts reflected in our reserves or adversely affect our business, results of operations or financial condition.
Business collaboration solutions are complex, and design defects, errors, failures or “bugs” may be difficult to detect and correct.
Business collaboration solutions are complex, integrating hardware, software and many elements of a customers’ existing network and communications infrastructure. Despite testing conducted prior to the release of products to the market and quality assurance programs, hardware may malfunction and software may contain “bugs” that are difficult to detect and fix. Any such issues could interfere with the expected operation of a solution, which might negatively impact customer satisfaction, reduce sales opportunities or affect gross margins. Depending upon the size and scope of any such issue, remediation may have a material impact on our business. Our inability to cure an application or product defect, should one occur, could result in the failure of an application or product line, the temporary or permanent withdrawal from an application, product or market, damage to our reputation, inventory costs, an increase in warranty claims, lawsuits by customers or customers’ or channel partners’ end users, or application or product reengineering expenses. Our insurance may not cover or may be insufficient to cover claims that are successfully asserted against us.
Integral aspects of our operations may be subject to climate change risks.
We recognize that climate change is an issue of global concern. In addition, a number of climate change regulations and initiatives are either in force or pending at the state, regional, Federal and international levels that
22
Table of Contents
focus on reducing greenhouse gas emissions. Integral aspects of our operations that may be subject to climate change risks include, but are not limited to, the following: increased regulations that have either been promulgated or may be promulgated in the future in jurisdictions in which we operate; the procurement and transport of raw materials and components used by our outsourced manufacturers and the use of those raw materials and components in the manufacturing process; emissions by our outsourced manufacturers; packaging and transport of finished goods; emissions and waste generated by our business operations; emissions associated with business travel (air, vehicular, fleet services); and emissions generated by our products. We continue to monitor those risks and will develop policies and processes designed to mitigate those risks where possible. We cannot assure you that our efforts to mitigate climate change risks will be successful or that risks associated with climate change will not have a negative impact on our business, results of operations or financial condition.
Pension and postretirement healthcare and life insurance liabilities could impair our liquidity or financial condition.
We sponsor non-contributory defined benefit pension plans covering a portion of our U.S. employees and retirees, and postretirement benefit plans for U.S. retirees that include healthcare benefits and life insurance coverage. We froze benefit accruals and additional participation in our plans for our U.S. management employees effective December 31, 2003. Certain of our non-U.S. operations also have various retirement benefit programs covering substantially all of their employees. Some of these programs are considered to be defined benefit pension plans for accounting purposes. If one or more of our U.S. pension plans were to be terminated without being fully funded on a termination basis, the Pension Benefit Guaranty Corporation, or PBGC, could obtain a lien on our assets for the amount of our liability, which would result in an event of default under each of our credit facilities. As a result, any such liens would have a material adverse effect on the Company, including our liquidity and financing arrangements. The measurement of our obligations, costs and liabilities associated with benefits pursuant to our pension and postretirement benefit plans requires that we estimate the present value of projected future payments to all participants, including assumptions related to discount rates, investment returns on designated plan assets, health care cost trends, and demographic experience. If future economic or demographic trends and results are different from our assumptions, then our obligations could be higher than we currently estimate. If our cash flows and capital resources are insufficient to fund our pension or postretirement healthcare and life insurance obligations, or if we are required or elect to fund any material portion of the liability now or in the future, we could be forced to reduce or delay investments and capital expenditures, seek additional capital, or restructure or refinance our indebtedness. In addition, if our operating results and available cash are insufficient to meet our pension or postretirement healthcare and life insurance obligations, we could face substantial liquidity problems and may be required to dispose of material assets or operations in order to meet our pension or postretirement healthcare and life insurance obligations. We may not be able to consummate those dispositions or to obtain any proceeds on terms acceptable to us or at all, and any such proceeds may not be adequate to meet any pension or postretirement healthcare and life insurance obligations then due. In addition, our U.S. defined benefit pension plans are subject to the provisions of the Employee Retirement Income Security Act of 1974, as amended, or ERISA. ERISA, along with certain provisions of the Internal Revenue Code of 1986, or the Code, requires minimum funding contributions and the PBGC has the authority under certain circumstances to petition a court to terminate an underfunded pension plan. One of those circumstances is the occurrence of an event with respect to which the PBGC determines that the possible long-term loss of the PBGC with respect to the plan may reasonably be expected to increase unreasonably if the plan is not terminated. If our U.S. defined benefit pension plans were to be terminated, we would incur a liability to the plans or the PBGC equal to the amount by which the liabilities of the plans, calculated on a termination basis, exceed the assets of the plans, which amount would likely exceed the amount that we have estimated to be the underfunded amount as of September 30, 2011.
Please see Note 13, “Benefit Obligations,” to our consolidated financial statements for the year ended September 30, 2011 for further details on our pension and postretirement benefit plans, including funding status.
23
Table of Contents
We may incur liabilities as a result of our obligation to indemnify, and to share certain liabilities with, Lucent Technologies Inc., or Lucent, in connection with Avaya Inc.’s spin-off from Lucent in September 2000.
Pursuant to the Contribution and Distribution Agreement between Avaya Inc. and Lucent, a predecessor to Alcatel-Lucent, Lucent contributed to Avaya Inc. substantially all of the assets, liabilities and operations associated with its enterprise networking businesses and distributed all of the outstanding shares of Avaya Inc.’s common stock to its stockholders. The Contribution and Distribution Agreement, among other things, provides that, in general, Avaya Inc. will indemnify Lucent for all liabilities including certain pre-distribution tax obligations of Lucent relating to our businesses and all contingent liabilities accruing pre-distribution primarily relating to Avaya Inc.’s businesses or otherwise assigned to Avaya Inc. In addition, the Contribution and Distribution Agreement provides that certain contingent liabilities not directly identifiable with one of the parties accruing pre-distribution will be shared in the proportion of 90% by Lucent and 10% by Avaya Inc. The Contribution and Distribution Agreement also provides that contingent liabilities accruing pre-distribution in excess of $50 million that are primarily related to Lucent’s businesses shall be borne 90% by Lucent and 10% by Avaya Inc. and contingent liabilities accruing pre-distribution in excess of $50 million that are primarily related to Avaya Inc.’s businesses shall be borne equally by the parties. Please see Note 19, “Commitments and Contingencies,” to our consolidated financial statements for the fiscal year ended September 30, 2011 for a description of certain matters involving Lucent for which Avaya Inc. has assumed responsibility under the Contribution and Distribution Agreement. We cannot assure you that Lucent will not submit a claim for indemnification or cost sharing to us in connection with any future matter. In addition, our ability to assess the impact of matters for which Avaya Inc. may have to indemnify or share the cost with Lucent is made more difficult by the fact that we do not control the defense of these matters.
In addition, in connection with the distribution, we and Lucent entered into a Tax Sharing Agreement that governs the parties’ respective rights, responsibilities and obligations after the distribution with respect to taxes for the periods ending on or before the distribution. Generally, pre-distribution taxes that are clearly attributable to the business of one party will be borne solely by that party, and other pre-distribution taxes will be shared by the parties based on a formula set forth in the Tax Sharing Agreement. Costs borne by Avaya under the Tax Sharing Agreement could have an adverse impact on Avaya’s business results of operations or financial condition.
Risks Related to Our Debt
Our degree of leverage could adversely affect our ability to raise additional capital to fund our operations, limit our ability to react to changes in the economy or our industry, expose us to interest rate risk to the extent of our variable rate debt and prevent us from meeting obligations on our indebtedness.
A summary of the material terms of our financing agreements can be found in Note 9, “Financing Arrangements,” to the consolidated financial statements as of September 30, 2011. As of September 30, 2011, our total indebtedness was $6,157 million (excluding capital lease obligations and $9 million of debt discount due upon settlement of our indebtedness).
Our degree of leverage could have important consequences, including:
| • | making it more difficult for us to make payments on our indebtedness; |
| • | increasing our vulnerability to general economic and industry conditions; |
| • | requiring a substantial portion of cash flow from operations to be dedicated to the payment of principal and interest on our indebtedness, thereby reducing our ability to use our cash flow to fund our operations, capital expenditures and future business opportunities; |
| • | exposing us to the risk of increased interest rates as borrowings under the senior secured multi-currency asset-based revolving credit facility and the senior secured credit facility are at variable rates of interest; |
24
Table of Contents
| • | limiting our ability to make strategic acquisitions; |
| • | limiting our ability to obtain additional financing for working capital, capital expenditures, debt service requirements, acquisitions and general corporate or other purposes; and |
| • | limiting our ability to adjust to changing market conditions and placing us at a competitive disadvantage compared to our competitors who are less highly leveraged. |
Our debt agreements contain restrictions that limit our flexibility in operating our business.
Avaya Inc.’s credit facilities, the indenture governing its senior unsecured cash-pay notes (the “cash pay notes”) and its senior unsecured payment-in-kind, or PIK, toggle notes (the “PIK toggle notes” and together with the cash pay notes, the “senior unsecured notes”), each due 2015, and the indenture governing its senior secured notes due 2019 (the “senior secured notes” and together with the senior unsecured notes, the “notes”), contain various covenants that limit our ability to engage in specific types of transactions. These covenants limit Avaya Inc.’s and its restricted subsidiaries’ ability to:
| • | incur or guarantee additional debt and issue or sell certain preferred stock; |
| • | pay dividends on, redeem or repurchase our capital stock; |
| • | make certain acquisitions or investments; |
| • | incur or assume certain liens; |
| • | enter into transactions with affiliates; and |
| • | sell assets to, or merge or consolidate with, another company. |
A breach of any of these covenants could result in a default under one or both of our credit facilities and/or the indentures governing the notes. In the event of any default under either of the credit facilities, the applicable lenders could elect to terminate borrowing commitments and declare all borrowings and loans outstanding, together with accrued and unpaid interest and any fees and other obligations, to be due and payable, which would be an event of default under the indentures governing the notes.
If we were unable to repay or otherwise refinance these borrowings and loans when due, the applicable secured lenders could proceed against the collateral granted to them to secure that indebtedness, which could force us into bankruptcy or liquidation. In the event our lenders accelerate the repayment of our borrowings, we and our subsidiaries may not have sufficient assets to repay that indebtedness.
We may not be able to generate sufficient cash to service all of our indebtedness and our other ongoing liquidity needs, and we may be forced to take other actions to satisfy our obligations under our indebtedness, which may not be successful.
Our ability to make scheduled payments on or to refinance our debt obligations and to fund our planned capital expenditures, acquisitions and other ongoing liquidity needs depends on our financial condition and operating performance, which is subject to prevailing economic and competitive conditions and to certain financial, business and other factors beyond our control. There can be no assurance that we will maintain a level of cash flow from operating activities or that future borrowings will be available to us under either of our credit facilities or otherwise in an amount sufficient to permit us to pay the principal, premium, if any, and interest on our indebtedness. If our cash flow and capital resources are insufficient to fund our debt service obligations, we may be forced to reduce or delay investments and capital expenditures, or to seek additional capital or restructure or refinance our indebtedness. These alternative measures may not be successful and may not permit us to meet our scheduled debt service obligations. In the absence of such operating results and resources, we could face substantial liquidity problems and might be required to dispose of material assets or operations to meet our debt service and other obligations. Our credit facilities and the indentures governing the notes restrict the ability of Avaya Inc. and its restricted subsidiaries to dispose of assets and use the proceeds from the disposition.
25
Table of Contents
Accordingly, we may not be able to consummate those dispositions or to obtain any proceeds on terms acceptable to us or at all, and any such proceeds may not be adequate to meet any debt service obligations then due.
Despite our level of indebtedness, we and our subsidiaries may be able to incur additional indebtedness, which could further exacerbate the risks associated with our degree of leverage.
We and our subsidiaries may be able to incur additional indebtedness in the future. Although the credit facilities and the indentures governing the notes contain restrictions on the incurrence of additional indebtedness, these restrictions are subject to a number of significant qualifications and exceptions, and any indebtedness incurred in compliance with these restrictions could be substantial. To the extent new debt is added to our and our subsidiaries’ currently anticipated debt levels, the related risks that we and our subsidiaries face could intensify.
A ratings downgrade of Avaya Inc. or other negative action by a ratings organization could adversely affect the trading price of the shares of our common stock.
Credit rating agencies continually revise their ratings for companies they follow. The condition of the financial and credit markets and prevailing interest rates have fluctuated in the past and are likely to fluctuate in the future. In addition, developments in our business and operations could lead to a ratings downgrade for Avaya Inc. Any such fluctuation in the rating of Avaya Inc. may impact Avaya Inc.’s ability to access debt markets in the future or increase its cost of future debt which could have a material adverse effect on the operations and financial condition of Avaya Inc., which in return may adversely affect the trading price of shares of our common stock.
Risks Related to this Offering and Ownership of Our Common Stock
An active trading market for our common stock may not develop.
Prior to this offering, there has been no public market for our common stock. Although we have applied to list our common stock on the New York Stock Exchange, an active trading market for our shares may never develop or be sustained following this offering. If the market does not develop or is not sustained, it may be difficult for you to sell your shares of common stock at a price that is attractive to you or at all. In addition, an inactive market may impair our ability to raise capital by selling shares and may impair our ability to acquire other companies by using our shares as consideration, which, in turn, could materially adversely affect our business.
The price of our common stock may be volatile and fluctuate substantially, which could result in substantial losses for investors purchasing shares in this offering.
The initial public offering price for the shares of our common stock sold in this offering will be determined by negotiation between the representatives of the underwriters and us. This price may not reflect the market price of our common stock following this offering. In addition, the market price of our common stock is likely to be highly volatile and may fluctuate substantially due to the following factors (in addition to the other risk factors described in this section):
| • | actual or anticipated fluctuations in our results of operations; |
| • | variance in our financial performance from the expectations of equity research analysts; |
| • | conditions and trends in the markets we serve; |
26
Table of Contents
| • | announcements of significant new services or products by us or our competitors; |
| • | additions or changes to key personnel; |
| • | changes in market valuation or earnings of our competitors; |
| • | the trading volume of our common stock; |
| • | future sale of our equity securities; |
| • | changes in the estimation of the future size and growth rate of our markets; |
| • | legislation or regulatory policies, practices or actions; and |
| • | general economic conditions. |
In addition, the stock markets in general have experienced extreme price and volume fluctuations that have often been unrelated or disproportionate to the operating performance of the particular companies affected. These broad market and industry factors may materially harm the market price of our common stock irrespective of our operating performance. As a result of these factors, you might be unable to resell your shares at or above the initial public offering price after this offering.
The Sponsors will have the ability to control the outcome of matters submitted for stockholder approval and may have interests that differ from those of our other stockholders.
After the completion of this offering, the Sponsors will own approximately % of our common stock, or % on a fully diluted basis. The Sponsors have significant influence over corporate transactions. So long as investment funds associated with or designated by the Sponsors continue to own a significant amount of the outstanding shares of our common stock, even if such amount is less than 50%, the Sponsors will continue to be able to strongly influence or effectively control our decisions, regardless of whether or not other stockholders believe that the transaction is in their own best interests. Such concentration of voting power could also have the effect of delaying, deterring or preventing a change of control or other business combination that might otherwise be beneficial to our stockholders.
In addition, the Sponsors and their affiliates are in the business of making investments in companies and may, from time to time in the future, acquire interests in businesses that directly or indirectly compete with certain portions of our business. To the extent the Sponsors invest in such other businesses, the Sponsors may have differing interests than our other stockholders. The Sponsors may also pursue acquisition opportunities that may be complementary to our business and, as a result, those acquisition opportunities may not be available to us. Also, as of September 30, 2011, the Sponsors hold approximately $173 million of Avaya Inc.’s senior secured term B-1 loans, approximately $123 million of Avaya Inc.’s senior secured term B-3 loans and 77,728.26 shares of our Series A Preferred Stock, although we intend to redeem all of the outstanding Series A Preferred Stock with the proceeds of this offering. As a result, their continued interests as creditors may conflict with the interests of our common stock holders.
We are a “controlled company” within the meaning of the rules of the New York Stock Exchange and, as a result, will qualify for, and intend to rely on, exemptions from certain corporate governance requirements.
After completion of this offering, the Sponsors will continue to control a majority of the voting power of our outstanding common stock. As a result, we are a “controlled company” within the meaning of the corporate governance rules of the New York Stock Exchange. Under these rules, a company of which more than 50% of the voting power is held by an individual, group or another company is a “controlled company” and may elect not to comply with certain corporate governance requirements, including:
| • | the requirement that a majority of the board of directors consist of independent directors; |
| • | the requirement that we have a nominating/corporate governance committee that is composed entirely of independent directors; |
27
Table of Contents
| • | the requirement that we have a compensation committee that is composed entirely of independent directors; and |
| • | the requirement for an annual performance evaluation of the nominating/corporate governance and compensation committees. |
Following this offering, we intend to utilize some or all of those exemptions. As a result, we may not have a majority of independent directors, our nominating and corporate governance committee and compensation committee may not consist entirely of independent directors and, while we may choose to do so, such committees will not be required to conduct annual performance evaluations.
Accordingly, you will not be similarly situated to stockholders of companies that are subject to all of the corporate governance requirements of the New York Stock Exchange.
New investors in our common stock will experience immediate and substantial book value dilution after this offering.
The initial public offering price of our common stock will be substantially higher than the pro forma net tangible book value, or deficit, per share of the outstanding shares immediately after the offering. Based on an assumed initial public offering price of $ per share, the midpoint of the price range set forth on the cover of this prospectus, and our as-adjusted deficit at September 30, 2011, if you purchase our shares in this offering, you will suffer immediate dilution in net tangible book value per share of approximately $ per share. See “Dilution” included elsewhere in this prospectus.
Upon expiration of lock-up arrangements between the underwriters and our officers, directors and certain holders of our common stock, a substantial number of shares of our common stock could be sold into the public market shortly after this offering, which could depress our stock price.
Our officers, directors and certain holders of our common stock, options and warrants, holding substantially all of our outstanding shares of common stock prior to completion of this offering, have entered into lock-up agreements with our underwriters which prohibit, subject to certain limited exceptions, the disposal or pledge of, or the hedging against, any of their common stock or securities convertible into or exchangeable for shares of common stock for a period through the date 180 days after the date of this prospectus, subject to extension in certain circumstances. Our management stockholders’ agreement also restricts the parties thereto from transferring their shares of common stock or any securities convertible into or exchangeable or exercisable for shares of common stock (other than shares acquired in the public market subsequent to this offering and other than certain transfers to their affiliates) until 180 days after the effective date of the registration statement. The market price of our common stock could decline as a result of sales by our existing stockholders in the market after this offering and after the expiration of these lock-up periods, or the perception that these sales could occur. If a trading market develops for our common stock, and after these lock-up periods expire, many of our stockholders will have an opportunity to sell their stock for the first time. These factors could also make it difficult for us to raise additional capital by selling stock. Please see the section titled “Shares Eligible for Future Sale” for additional information regarding these factors. In addition, in the future, we may issue securities to raise additional capital or to acquire interests in other companies or technologies. As a result, your interest in our company may be further diluted and the market price of our common stock could decline.
We are a holding company and rely on dividends, distributions and other payments, advances and transfers of funds from our subsidiaries to meet our obligations.
We have no direct operations and derive all of our cash flow from our subsidiaries. Because we conduct our operations through our subsidiaries, we depend on those entities for dividends and other payments or distributions to meet our obligations. The deterioration of the earnings from, or other available assets of, our subsidiaries for any reason could limit or impair their ability to pay dividends or other distributions to us.
28
Table of Contents
We currently do not intend to pay dividends on our common stock and, consequently, your only opportunity to achieve a return on your investment is if the price of our common stock appreciates.
Following the completion of this offering, we do not anticipate that we will pay any cash dividends on shares of our common stock for the foreseeable future. Any determination to pay dividends in the future will be at the discretion of our board of directors and will depend on results of operations, financial condition, contractual restrictions, restrictions imposed by applicable law and other factors our board of directors deems relevant. Accordingly, if you purchase shares in this offering, realization of a gain on your investment will depend on the appreciation of the price of our common stock, which may never occur. Investors seeking cash dividends in the foreseeable future should not purchase our common stock. Please see the section titled “Dividend Policy” for additional information.
Anti-takeover provisions in our certificate of incorporation and bylaws could prevent or delay a change in control of our company.
Our certificate of incorporation and our bylaws contain certain provisions that may discourage, delay or prevent a change in our management or control over us that stockholders may consider favorable, including the following, some of which may only become effective when the Sponsors collectively beneficially own less than 40% of our outstanding shares of common stock:
| • | the division of our board of directors into three classes and the election of each class for three-year terms; |
| • | the sole ability of the board of directors to fill a vacancy created by the expansion of the board of directors; |
| • | advance notice requirements for stockholder proposals and director nominations; |
| • | limitations on the ability of stockholders to call special meetings and to take action by written consent; |
| • | the approval of holders of at least two-thirds of the shares entitled to vote generally on the making, alteration, amendment or repeal of our certificate of incorporation or bylaws, will be required to adopt, amend or repeal our bylaws, or amend or repeal certain provisions of our certificate of incorporation; |
| • | the required approval of holders of at least two-thirds of the shares entitled to vote at an election of the directors to remove directors and, following the classification of the board of directors, removal only for cause; and |
| • | the ability of our board of directors to designate the terms of and issue new series of preferred stock, without stockholder approval, which could be used to institute a rights plan, or a poison pill, that would work to dilute the stock ownership or a potential hostile acquirer, likely preventing acquisitions that have not been approved by our board of directors. |
The existence of the foregoing provisions and other anti-takeover measures could limit the price that investors might be willing to pay in the future for shares of our common stock. They could also deter potential acquirers of our company, thereby reducing the likelihood that you could receive a premium for your common stock in an acquisition. For more information, please see the section titled “Description of Capital Stock.”
If securities or industry analysts do not publish research or reports or publish unfavorable research or reports about our business, our stock price and trading volume could decline.
The trading market for our common stock will depend in part on the research and reports that securities or industry analysts publish about us, our business, our market or our competitors. We may not obtain research coverage by securities and industry analysts. If no securities or industry analysts commence coverage of our company, the trading price for our stock could be negatively impacted. In the event we obtain securities or industry analyst coverage, if one or more of the analysts who covers us publishes unfavorable research or reports or downgrades our stock, our stock price would likely decline. If one or more of these analysts ceases to cover us or fails to regularly publish reports on us, interest in our stock could decrease, which could cause our stock price or trading volume to decline.
29
Table of Contents
SPECIAL NOTE REGARDING FORWARD-LOOKING STATEMENTS
This prospectus contains “forward-looking statements.” In some cases, these statements may be identified by the use of forward-looking terminology such as “anticipate,” “believe,” “continue,” “could,” “estimate,” “expect,” “intend,” “may,” “might,” “our vision,” “plan,” “potential,” “predict,” “should,” “will” or “would” or other similar words. These statements discuss future expectations, contain projections of results of operations or of financial condition, or state trends and known uncertainties or other forward-looking information. You are cautioned that forward-looking statements are inherently uncertain. Each forward-looking statement contained in this prospectus is subject to risks and uncertainties that could cause actual results to differ materially from those expressed or implied by such statement. We refer you to the section entitled “Risk Factors” in this prospectus for identification of important factors with respect to these risks and uncertainties. We caution readers not to place considerable reliance on such statements. Our business is subject to substantial risks and uncertainties, including those identified in this prospectus. The information contained in this prospectus is provided by us as of the date of this prospectus, and we do not undertake any obligation to update any forward-looking statements contained in this document as a result of new information, future events or otherwise. Forward-looking statements include, without limitation, statements regarding:
| • | our expectations regarding our revenue, cost of revenue, selling, general and administrative expenses, research and development expenses, amortization of intangible assets and interest expense; |
| • | our expectations regarding the demand for our next-generation business collaboration solutions and the market trends contributing to such demand; |
| • | our strategy for worldwide growth, including our ability to develop and sell advanced communications products and services, including unified communications, data networking solutions and contact center solutions; |
| • | the strength of our current intellectual property portfolio and our intention to obtain patents and other intellectual property rights used in connection with our business; |
| • | our anticipated competition as the business collaboration market evolves; |
| • | the product sales to be generated by our backlog; |
| • | our future cash requirements, including our primary cash requirements for the period October 1, 2011 through September 30, 2012; |
| • | our intention to use the net proceeds of the initial public offering to repay certain of our existing indebtedness and to redeem our Series A Preferred Stock; |
| • | our future sources of liquidity, including any future refinancing of our existing debt or issuance of additional securities; |
| • | the uncertainties regarding our liquidity, including our ability to generate revenue, reduce costs, make future acquisitions and defend against litigation; |
| • | the impact of new accounting pronouncements; and |
| • | our expectations regarding the impact of legal proceedings, including antitrust, intellectual property or employment litigation. |
Many factors could cause our actual results, performance or achievements to differ materially from any future results, performance or achievements expressed or implied by these forward-looking statements. Some of the key factors that could cause actual results to differ from our expectations include:
| • | our ability to develop and sell advanced communications products and services, including unified communications, data networking solutions and contact center solutions; |
| • | our reliance on our indirect sales channel; |
30
Table of Contents
| • | economic conditions and the willingness of enterprises to make capital investments; |
| • | the market for our products and services, including unified communications solutions; |
| • | our ability to remain competitive in the markets we serve; |
| • | the ability to retain and attract key employees; |
| • | our degree of leverage and its effect on our ability to raise additional capital and to react to changes in the economy or our industry; |
| • | our ability to manage our supply chain and logistics functions; |
| • | liquidity and our access to capital markets; |
| • | the ability to protect our intellectual property and avoid claims of infringement; |
| • | our ability to maintain adequate security over our information systems; |
| • | environmental, health and safety laws, regulations, costs and other liabilities; |
| • | climate change risks; |
| • | an adverse result in any significant litigation, including antitrust, intellectual property or employment litigation; |
| • | risks relating to the transaction of business internationally; and |
| • | pension and post-retirement healthcare and life insurance liabilities. |
31
Table of Contents
We estimate that the net proceeds of the sale of the common stock that we are offering will be approximately $ million after deducting estimated underwriting discounts and commissions and estimated offering expenses payable by us. This assumes an initial public offering price of $ per share, which is the midpoint of the range listed on the cover page of this prospectus.
We currently expect to use the net proceeds to us from this offering for the following purposes and in the following amounts:
| • | approximately $ million will be used to repay a portion of our long-term indebtedness; |
| • | approximately $ million will be used to redeem all of our outstanding Series A Preferred Stock. For more information on our Series A Preferred Stock, including the terms of redemption, see “Description of Capital Stock—Preferred Stock”; and |
| • | approximately $ million will be used to pay certain amounts in connection with the termination of our management services agreement with affiliates of our Sponsors as described under “Certain Relationships and Related Party Transactions” pursuant to its terms. |
While we currently anticipate that we will use the net proceeds of this offering as described above, we may reallocate the net proceeds from time to time depending upon market and other conditions in effect at the time. To the extent the net proceeds of this offering are greater or less than the estimated amount, because either the offering does not price at the midpoint of the estimated price range or the size of the offering changes, the difference will increase or decrease the amount of net proceeds available for the purposes set forth above. Pending their application, we intend to invest the net proceeds in short-term, interest-bearing, investment-grade securities.
32
Table of Contents
Our payment of dividends on our common stock in the future will be determined by our board of directors in its sole discretion and will depend on business conditions, our financial condition, earnings, liquidity and capital requirements, the covenants in agreements governing our indebtedness and other factors. We have no current plans to pay dividends on our common stock.
As disclosed above under “Use of Proceeds,” we intend to use a portion of the net proceeds from this offering to redeem all of our outstanding Series A Preferred Stock. The certificate of designations for the Series A Preferred Stock grants holders of our Series A Preferred Stock the right to receive, as, when and if declared by our board of directors and in preference to the holders of any and all other series or classes of capital stock, payable either in cash or, at our option, by issuance of additional shares of Series A Preferred Stock, cumulative annual dividends at a rate of 5% per annum on $1,000 per share (which value is to be proportionately adjusted to reflect any stock dividend, stock split, combination of shares, reclassification, reorganization, recapitalization or other similar event affecting the Series A Preferred Stock), compounded quarterly from and after the date of issuance of such shares of Series A Preferred Stock. So long as any share of our Series A Preferred Stock remains outstanding, no dividend or distribution may be declared or paid on our common stock unless all accrued and unpaid dividends have been paid on our Series A Preferred Stock and dividends paid on our common stock may not be paid at a rate greater than the rate paid on Series A Preferred Stock. As of September 30, 2011, there were accrued unpaid dividends totaling $12 million on our Series A Preferred Stock in addition to its redemption value of $125 million. In addition, because Avaya Holdings Corp. is a holding company, its ability to pay cash dividends on its common stock may be limited by restrictions on its ability to obtain sufficient funds through dividends from subsidiaries, including restrictions under the terms of the agreements governing Avaya Inc.’s indebtedness. Refer to the section of this prospectus entitled “Description of Certain Outstanding Indebtedness” for a more detailed discussion of the agreements governing our indebtedness and the section of this prospectus entitled “Description of Capital Stock” for a more detailed description of the terms of our Series A Preferred Stock.
33
Table of Contents
The following table sets forth our capitalization as of September 30, 2011:
| • | on an actual basis; and |
| • | on a pro forma basis after giving effect to (i) the sale by us of shares of common stock at an assumed initial public offering price of $ per share and after deducting estimated underwriting discounts and commissions and estimated offering expenses payable by us and (ii) the application of such net proceeds as described under “Use of Proceeds.” For purpose of this table, the assumed initial public offering price is $ per share, which is the midpoint of the range listed on the cover page of this prospectus. |
You should read the following table in conjunction with our consolidated financial statements and related notes, “Selected Historical Consolidated Financial Data” and “Management’s Discussion and Analysis of Financial Condition and Results of Operations,” all included elsewhere in this prospectus.
| As of September 30, 2011 | ||||||
| Actual | Pro Forma(1) | |||||
| (in millions, except share amounts) | ||||||
Cash and cash equivalents | $ | 415 | ||||
|
|
| ||||
Debt:(2) | ||||||
Senior secured term B-1 loans | $ | 1,449 | ||||
Senior secured term B-3 loans | 2,165 | |||||
Senior secured notes | 1,009 | |||||
Senior unsecured cash-pay notes | 700 | |||||
Senior unsecured PIK toggle notes | 834 | |||||
|
|
| ||||
Total debt | 6,157 | |||||
|
|
| ||||
Preferred stock, par value $.001 per share; authorized 250,000 shares, Series A, 125,000 and nil shares outstanding on an actual and pro forma basis, respectively | 137 | |||||
Deficiency: | ||||||
Common stock, par value $.001 per share; authorized 750 million shares, outstanding 487,401,790 and shares on an actual and pro forma basis, respectively | — | |||||
Additional paid-in capital | 2,569 | |||||
Accumulated deficit | (3,891 | ) | ||||
Accumulated other comprehensive loss | (1,178 | ) | ||||
|
|
| ||||
Total deficiency | (2,500 | ) | ||||
|
|
| ||||
Total capitalization | $ | 3,794 | ||||
|
|
| ||||
| (1) | Assumes the net proceeds from this offering, together with cash on hand, are used on the closing date to redeem all outstanding shares of our Series A Preferred Stock for $137 million, which includes accrued dividends of $12 million; to repay $ million of long-term indebtedness; and to make a payment to affiliates of our Sponsors in connection with the termination of the management services agreement as described under “Certain Relationships and Related Party Transactions” and to pay certain fees and expenses relating to this offering. The pro forma amounts do not give effect to any accounting charges that may be recorded as a result of such payment. A $1.00 increase (decrease) in the assumed initial public offering price of $ per share, the mid-point of the estimated price range set forth on the cover page of this prospectus and the application of the net proceeds therefrom, would (i) increase (decrease) the net proceeds to us by $ million, assuming the number of shares offered by us, as set forth on the cover |
34
Table of Contents
| page of this prospectus, remains the same and after deducting underwriting discounts and commissions and estimated offering expenses payable by us, and (ii) would increase (decrease) our total long-term debt reduction by $ million and decrease (increase) our stockholders’ deficiency by $ million. |
| (2) | For additional information regarding our outstanding indebtedness, please refer to “Management’s Discussion and Analysis of Financial Condition and Results of Operations—Liquidity and Capital Resources—Financing Activities,” “Description of Certain Outstanding Indebtedness” and Note 9, “Financing Arrangements,” to our consolidated financial statements included elsewhere in this prospectus. |
35
Table of Contents
If you invest in shares of our common stock in this offering, your interest will be diluted to the extent of the difference between the public offering price per share of our common stock and the as-adjusted net tangible book value, or deficit, per share of our common stock after this offering. The deficit is calculated as the liabilities in excess of our net tangible book value. The deficit per share is determined by dividing the numerator of total liabilities plus the book value of our Series A Preferred Stock less total tangible assets (total assets less intangible assets) by the denominator of the number of outstanding shares of common stock. Our deficit value at September 30, 2011 was $8,708 million or $17.87 per share of common stock.
Our as-adjusted deficit at September 30, 2011, after giving effect to the sale by us of shares of common stock at an assumed initial public offering price of $ per share, which is the midpoint of the range listed on the cover of this prospectus, and after deducting estimated underwriting discounts and commissions and estimated offering expenses payable by us, would have been approximately $ million, or $ per share. This represents an immediate increase in as-adjusted deficit of $ per share to existing stockholders and an immediate dilution of $ per share to new investors, or approximately % of the assumed initial public offering price of $ per share. The following table illustrates this per share dilution:
Assumed initial public offering price per share | $ | |||||||
Deficit per share as of September 30, 2011, before giving effect to this offering | $ | (8,708 | ) | |||||
Decrease in deficit per share attributable to investors purchasing shares in this offering | ||||||||
As adjusted deficit per share, after giving effect to this offering |
A $1.00 increase (decrease) in the assumed initial public offering price of $ per share would decrease (increase) our as-adjusted deficit by $ million, the as-adjusted deficit per share after this offering by $ per share and the dilution in as-adjusted deficit per share to investors in this offering by $ per share, assuming that the number of shares offered by us, as set forth on the cover page of this prospectus, remains the same and after deducting the estimated underwriting discount and estimated offering expenses payable by us.
The following table summarizes, as of September 30, 2011, the number of shares of common stock purchased from us since inception, the total consideration paid to us and the average price per share paid by existing shareholders and by new investors purchasing shares of common stock in this offering at an assumed initial public offering price of $ per share, before deducting underwriting discount and estimated offering expenses payable by us.
| Shares Purchased | Total Consideration | Average Price Per Share | ||||||||||||
| Number | Percent | Amount | Percent | |||||||||||
Existing shareholders | $ | $ | ||||||||||||
New investors | ||||||||||||||
|
|
|
|
| ||||||||||
Total | ||||||||||||||
|
|
|
|
| ||||||||||
A $1.00 increase (decrease) in the assumed initial public offering price of $ per share would increase (decrease) total consideration paid by new investors, total consideration paid by all stockholders and the average price per share paid by all stockholders by $ million, $ million and $ per share, assuming the number of shares offered by us, as set forth on the cover page of this prospectus, remains the same and before deducting underwriting discounts and commissions and estimated offering expenses payable by us.
36
Table of Contents
The above discussion and table are based on 487,401,790 shares of common stock outstanding as of September 30, 2011. This excludes the following numbers of shares of our common stock issuable in connection with the exercise of warrants outstanding as of September 30, 2011 and equity awards under our 2007 Plan:
| • | 100,000,000 shares of common stock issuable upon the exercise of warrants held by affiliates of our Sponsors, which warrants are subject to the lock-up agreements described under “Underwriters” and exercisable at any time prior to December 18, 2019 at an exercise price of $3.25 per share (see “Description of Capital Stock—Warrants”); |
| • | 429,761 Continuation Options that were awarded by the Company to executive officers prior to the Merger that were permitted to be rolled over into equity awards issued by us upon consummation of the Merger, each with an exercise price of $1.25 per share; |
| • | 972,341 Continuation Units that were awarded by the Company to executive officers prior to the Merger that were permitted to be rolled over into equity awards issued by us upon consummation of the Merger; |
| • | 43,595,906 shares of common stock issuable upon the exercise of options with exercise prices ranging from $3.00 to $5.00 per share and a weighted average exercise price of $3.11 per share; |
| • | 1,560,000 shares of common stock issuable on the vesting and distribution of RSUs; and |
| • | 4,674,875 additional shares of common stock as of September 30, 2011 reserved for future grants under the 2007 Plan. |
This also excludes additional shares of common stock reserved for future equity incentive plans to be effective upon the completion of this offering.
To the extent the options or warrants are exercised and awards are granted under these plans, there may be further economic dilution to our stockholders.
37
Table of Contents
SELECTED HISTORICAL CONSOLIDATED FINANCIAL DATA
The following table sets forth our selected historical consolidated financial data at the dates and for the periods indicated. Avaya Holdings Corp. was incorporated on June 1, 2007 by affiliates of the Sponsors. Avaya Holdings Corp., through a subsidiary holding company, entered into a Merger Agreement with Avaya Inc., or the Predecessor, pursuant to which the holding company merged with and into Avaya Inc., with Avaya Inc. continuing as the surviving entity and a wholly owned subsidiary of Avaya Holdings Corp., in a transaction that was completed on October 26, 2007. Avaya Holdings Corp. is a holding company and has no material assets or stand-alone operations other than its ownership in Avaya Inc. and its subsidiaries. The selected historical consolidated financial data set forth below are those of Avaya Holdings Corp. and its consolidated subsidiaries, or the Successor, from its inception on June 1, 2007 through September 30, 2011 and those of its Predecessor, Avaya Inc., for all prior periods through the closing date of the Merger.
The Predecessor selected historical consolidated financial data set forth below as of and for the year ended September 30, 2007 and for the period October 1, 2007 through October 26, 2007 have been derived from our Predecessor’s audited consolidated financial statements and related notes which are not included in this prospectus. The Successor selected historical consolidated financial data set forth below as of and for the years ended September 30, 2009, 2010 and 2011 have been derived from our audited consolidated financial statements and related notes included elsewhere in this prospectus. The Successor selected historical consolidated financial data set forth below for the year ended September 30, 2008 have been derived from our audited consolidated financial statements and related notes, which are not included in this prospectus. The Successor selected historical consolidated financial data set forth below as of and for the period June 1, 2007 through September 30, 2007 has been derived from our consolidated financial statements, which are not included in this prospectus. The Successor had no operations prior to the Merger. As part of the Merger on October 26, 2007, we entered into various financing arrangements and, as a result, had a different capital structure following the Merger. Accordingly, the results of operations for periods subsequent to the Merger will not necessarily be comparable to prior periods.
The following selected historical consolidated financial data should be read together with our consolidated financial statements and the related notes appearing elsewhere in this prospectus and the “Management’s Discussion and Analysis of Financial Condition and Results of Operations” section of this prospectus.
38
Table of Contents
| Successor | Predecessor | |||||||||||||||||||||||||||||
| Fiscal year ended September 30, | Period from June 1, 2007 through September 30, 2007(2) | Period from October 1, 2007 through October 26, 2007 | Fiscal year ended September 30, 2007 | |||||||||||||||||||||||||||
| 2011 | 2010 | 2009 | 2008(1) | |||||||||||||||||||||||||||
| (in millions, except per share amounts) | ||||||||||||||||||||||||||||||
STATEMENT OF OPERATIONS DATA: | ||||||||||||||||||||||||||||||
REVENUE | ||||||||||||||||||||||||||||||
Products | $ | 2,976 | $ | 2,602 | $ | 1,923 | $ | 2,595 | $ | — | $ | 96 | $ | 2,875 | ||||||||||||||||
Services | 2,571 | 2,458 | 2,227 | 2,328 | — | 150 | 2,403 | |||||||||||||||||||||||
|
|
|
|
|
|
|
|
|
|
|
|
|
| |||||||||||||||||
| 5,547 | 5,060 | 4,150 | 4,923 | — | 246 | 5,278 | ||||||||||||||||||||||||
|
|
|
|
|
|
|
|
|
|
|
|
|
| |||||||||||||||||
COSTS | ||||||||||||||||||||||||||||||
Products: | ||||||||||||||||||||||||||||||
Costs (exclusive of amortization of intangible assets) | 1,314 | 1,243 | 872 | 1,256 | — | 56 | 1,295 | |||||||||||||||||||||||
Amortization of technology intangible assets | 257 | 291 | 248 | 231 | — | 1 | 20 | |||||||||||||||||||||||
Services | 1,344 | 1,354 | 1,164 | 1,403 | — | 100 | 1,512 | |||||||||||||||||||||||
|
|
|
|
|
|
|
|
|
|
|
|
|
| |||||||||||||||||
| 2,915 | 2,888 | 2,284 | 2,890 | — | 157 | 2,827 | ||||||||||||||||||||||||
|
|
|
|
|
|
|
|
|
|
|
|
|
| |||||||||||||||||
GROSS MARGIN | 2,632 | 2,172 | 1,866 | 2,033 | — | 89 | 2,451 | |||||||||||||||||||||||
|
|
|
|
|
|
|
|
|
|
|
|
|
| |||||||||||||||||
OPERATING EXPENSES | ||||||||||||||||||||||||||||||
Selling, general and administrative | 1,845 | 1,721 | 1,272 | 1,456 | — | 111 | 1,552 | |||||||||||||||||||||||
Research and development | 461 | 407 | 309 | 376 | — | 29 | 444 | |||||||||||||||||||||||
Amortization of intangible assets | 226 | 218 | 207 | 187 | — | 4 | 48 | |||||||||||||||||||||||
Impairment of long-lived assets | — | 16 | 2 | 10 | — | — | — | |||||||||||||||||||||||
Impairment of indefinite-lived intangible assets | — | — | 60 | 130 | — | — | — | |||||||||||||||||||||||
Goodwill impairment | — | — | 235 | 899 | — | — | — | |||||||||||||||||||||||
Restructuring charges, net | 189 | 171 | 160 | — | — | 1 | 36 | |||||||||||||||||||||||
In-process research and development charge | — | — | 12 | 112 | — | — | — | |||||||||||||||||||||||
Acquistion-related costs | 5 | 20 | 29 | — | — | — | — | |||||||||||||||||||||||
Merger-related costs | — | — | — | 1 | — | 57 | 105 | |||||||||||||||||||||||
|
|
|
|
|
|
|
|
|
|
|
|
|
| |||||||||||||||||
| 2,726 | 2,553 | 2,286 | 3,171 | — | 202 | 2,185 | ||||||||||||||||||||||||
|
|
|
|
|
|
|
|
|
|
|
|
|
| |||||||||||||||||
OPERATING (LOSS) INCOME | (94 | ) | (381 | ) | (420 | ) | (1,138 | ) | — | (113 | ) | 266 | ||||||||||||||||||
Interest expense | (460 | ) | (487 | ) | (409 | ) | (377 | ) | — | — | (1 | ) | ||||||||||||||||||
Loss on extinguishment of debt | (246 | ) | — | — | — | — | — | — | ||||||||||||||||||||||
Other income, net | 5 | 15 | 14 | 27 | — | 1 | 43 | |||||||||||||||||||||||
|
|
|
|
|
|
|
|
|
|
|
|
|
| |||||||||||||||||
(LOSS) INCOME BEFORE INCOME TAXES | (795 | ) | (853 | ) | (815 | ) | (1,488 | ) | — | (112 | ) | 308 | ||||||||||||||||||
Provision for (benefit from) income taxes | 68 | 18 | 30 | (183 | ) | — | (24 | ) | 93 | |||||||||||||||||||||
|
|
|
|
|
|
|
|
|
|
|
|
|
| |||||||||||||||||
NET (LOSS) INCOME | (863 | ) | (871 | ) | (845 | ) | (1,305 | ) | — | (88 | ) | 215 | ||||||||||||||||||
Less net income attributable to noncontrolling interests | — | 3 | 2 | 2 | — | — | 3 | |||||||||||||||||||||||
|
|
|
|
|
|
|
|
|
|
|
|
|
| |||||||||||||||||
NET (LOSS) INCOME ATTRIBUTABLE TO AVAYA HOLDINGS CORP. | (863 | ) | (874 | ) | (847 | ) | (1,307 | ) | — | (88 | ) | 212 | ||||||||||||||||||
Less: Accretion and accrued dividends on Series A preferred stock | (7 | ) | (62 | ) | — | — | — | — | — | |||||||||||||||||||||
|
|
|
|
|
|
|
|
|
|
|
|
|
| |||||||||||||||||
NET (LOSS) INCOME ATTRIBUTABLE TO AVAYA HOLDINGS CORP. COMMON STOCKHOLDERS | $ | (870 | ) | $ | (936 | ) | $ | (847 | ) | $ | (1,307 | ) | $ | — | $ | (88 | ) | $ | 212 | |||||||||||
|
|
|
|
|
|
|
|
|
|
|
|
|
| |||||||||||||||||
SHARE DATA: | ||||||||||||||||||||||||||||||
Net (loss) income per share attributable to common stockholders—basic | $ | (1.78 | ) | $ | (1.92 | ) | $ | (1.74 | ) | $ | (2.87 | ) | $ | — | $ | (0.19 | ) | $ | 0.47 | |||||||||||
Weighted average shares outstanding—basic | 489.0 | 488.6 | 488.1 | 455.9 | — | 462.9 | 454.2 | |||||||||||||||||||||||
Net (loss) income per share attributable to common stockholders—diluted | (1.78 | ) | (1.92 | ) | (1.74 | ) | (2.87 | ) | — | (0.19 | ) | 0.46 | ||||||||||||||||||
Weighted average shares outstanding—diluted | 489.0 | 488.6 | 488.1 | 455.9 | — | 462.9 | 461.3 | |||||||||||||||||||||||
39
Table of Contents
| Successor | Predecessor | |||||||||||||||||||||||||||||
| Fiscal year ended September 30, | Period from June 1, 2007 through September 30, 2007(2) | Period from October 1, 2007 through October 26, 2007 | Fiscal year ended September 30, 2007 | |||||||||||||||||||||||||||
| 2011 | 2010 | 2009 | 2008(1) | |||||||||||||||||||||||||||
| (in millions) | ||||||||||||||||||||||||||||||
BALANCE SHEET DATA (at end of period): | ||||||||||||||||||||||||||||||
Cash and cash equivalents | $ | 415 | $ | 594 | $ | 582 | $ | 594 | $ | — | $ | 1,270 | ||||||||||||||||||
Intangible assets, net | 2,129 | 2,603 | 2,636 | 3,154 | — | 248 | ||||||||||||||||||||||||
Goodwill | 4,079 | 4,075 | 3,695 | 3,956 | — | 1,157 | ||||||||||||||||||||||||
Total assets | 8,561 | 9,276 | 8,665 | 10,010 | — | 5,933 | ||||||||||||||||||||||||
Total debt (excluding capital lease obligations) | 6,157 | 5,928 | 5,150 | 5,222 | — | — | ||||||||||||||||||||||||
Preferred stock, Series A | 137 | 130 | — | — | — | — | ||||||||||||||||||||||||
Total Avaya Holdings Corp. stockholders’ equity (deficiency) | (2,500 | ) | (1,543 | ) | (682 | ) | 1,063 | — | 2,586 | |||||||||||||||||||||
STATEMENT OF CASH FLOWS DATA: | ||||||||||||||||||||||||||||||
Net cash provided by (used in) | ||||||||||||||||||||||||||||||
Operating activities | $ | (300 | ) | $ | 42 | $ | 242 | $ | 304 | $ | — | $ | 133 | $ | 637 | |||||||||||||||
Investing activities | (101 | ) | (864 | ) | (155 | ) | (7,205 | ) | — | (16 | ) | (360 | ) | |||||||||||||||||
Financing activities | 228 | 853 | (101 | ) | 7,512 | — | 11 | 54 | ||||||||||||||||||||||
OTHER FINANCIAL DATA: | ||||||||||||||||||||||||||||||
EBITDA | $ | 313 | $ | 320 | $ | 240 | $ | (515 | ) | $ | — | $ | (94 | ) | $ | 557 | ||||||||||||||
Adjusted EBITDA(3) | 971 | 795 | 753 | 859 | — | (27 | ) | 832 | ||||||||||||||||||||||
Capital expenditures, net | 83 | 79 | 76 | 120 | — | 8 | 120 | |||||||||||||||||||||||
Capitalized software development costs | 42 | 43 | 43 | 74 | — | 7 | 93 | |||||||||||||||||||||||
| (1) | The selected historical consolidated financial data above as of and for the year ended September 30, 2008 reflect the results of Avaya Holdings Corp. for the entire fiscal year and includes the results of Avaya Inc. and its consolidated subsidiaries subsequent to October 26, 2007, the date of the Merger. |
| (2) | Avaya Holdings Corp. is a holding company formed on June 1, 2007 by affiliates of the Sponsors for the purpose of consummating the Merger. Avaya Holdings Corp. has no material assets or stand-alone operations other than its ownership in Avaya Inc. and its subsidiaries. The selected historical consolidated financial data above as of September 30, 2007 and for the period from June 1, 2007 through September 30, 2007 reflects the results of Avaya Holdings Corp., which did not have assets or operations prior to the Merger. |
| (3) | Adjusted EBITDA is calculated in accordance with Avaya Inc.’s debt agreements entered into in connection with the Merger and disclosed herein to demonstrate compliance with Avaya Inc.’s debt agreements. For the fiscal year ended September 30, 2007, Adjusted EBITDA is calculated in accordance with the debt agreements for comparative purposes. See “Management’s Discussion and Analysis of Financial Condition and Results of Operations—Non-GAAP Financial Measures and Supplemental Disclosure—EBITDA and Adjusted EBITDA” for a definition and explanation of Adjusted EBITDA and reconciliation of net loss to Adjusted EBITDA. |
The following are some of the items affecting the comparability of the selected historical consolidated financial data for the periods presented:
| • | On February 11, 2011, Avaya Inc. completed a private placement of $1,009 million of senior secured notes. The senior secured notes were issued at par, bear interest at a rate of 7% per annum and mature on April 1, 2019. The proceeds from the notes were used to repay in full the senior secured incremental term B-2 loans outstanding under the senior secured credit facility (representing $988 million in aggregate principal amount and $12 million in accrued and unpaid interest) and to pay related fees and expenses. The issuance of the senior secured notes and repayment of the senior secured incremental term B-2 loans was accounted for as an extinguishment of the senior secured incremental term B-2 loans and issuance of new debt. Accordingly, the Company recognized a loss on extinguishment of debt of $246 million based on the difference between the reacquisition price and the carrying value of the incremental term B-2 loans (including unamortized debt discount and debt issue costs) during the year ended September 30, 2011. |
40
Table of Contents
| • | As a result of the acquisition of NES, our operating results include the operations of the NES business as of December 19, 2009. |
| • | In connection with the acquisition of NES, we have incurred acquisition-related costs during fiscal years 2009 and 2010 of $29 million and $20 million, respectively. |
| • | We incurred integration costs with respect to the NES acquisition of $132 million and $208 million, for fiscal years 2011 and 2010, respectively. Integration costs primarily represent third-party consulting fees and other administrative costs associated with consolidating and coordinating the operations of Avaya and NES. These costs were incurred in connection with, among other things, the on-boarding of NES personnel, developing compatible IT systems and internal processes and developing and implementing a strategic operating plan to help enable a smooth transition with minimal disruption to NES customers. Such costs also include fees paid to Nortel for logistics and other support functions being performed on a temporary basis according to a transition services agreement. |
| • | During the year ended September 30, 2011, we continued to identify opportunities to streamline operations and generate cost savings, which include exiting facilities and reducing headcount. Restructuring charges recorded during the year ended September 30, 2011 associated with these initiatives, net of adjustments to previous periods, were $189 million and include employee separation costs primarily associated with employee severance actions in Germany, as well as in Europe, the Middle East and Africa, or EMEA, and U.S. regions. Employee separation charges include $56 million associated with an agreement reached with the works council representing employees of certain of Avaya Inc.’s German subsidiaries for the elimination of 210 positions. Severance and employment benefits payments associated with this action are expected to be paid through the quarter ending September 30, 2012, and include, but are not limited to, social pension fund payments and healthcare and unemployment insurance costs to be paid to or on behalf of the affected employees. Future rental payments, net of estimated sublease income, related to operating lease obligations for unused space in connection with the closing or consolidation of facilities are expected to continue through fiscal year 2020. |
| • | On August 31, 2010, we sold our 59.13% ownership in AGC Networks Ltd., or AGC, (formerly Avaya GlobalConnect Ltd.), our reseller in India, and recognized a $7 million gain on the sale. AGC remains a key channel partner of Avaya serving customers in the India market, one of the fastest growing enterprise communications markets in the world, and in Australia. |
| • | Impairment charges of $16 million were incurred in fiscal year 2010 associated with certain technologies with overlapping functionality to technologies acquired with NES. |
| • | Amortization of intangible assets was $483 million, $509 million and $455 million for the years ended September 30, 2011, 2010 and 2009, respectively. The fluctuations are attributable to amortization associated with intangible assets recorded in connection with our acquisition of NES partially offset by any impairment and fully amortized intangibles. In acquisition accounting, we recorded technologies, customer relationships and other intangibles of NES with an estimated fair value of $476 million. These assets are amortized over their estimated economic lives ranging from less than one year to thirteen years. |
| • | In connection with the financing of the acquisition of NES, we received cash proceeds of $783 million in exchange for senior secured incremental term B-2 loans with a face value of $1,000 million and the issuance of detachable warrants to purchase 61.5 million shares of common stock. |
| • | In connection with the financing of the acquisition of NES, we issued 125,000 shares of Series A Preferred Stock with detachable warrants to purchase 38.5 million shares of common stock for cash proceeds of $125 million. |
| • | During the period from December 19, 2009 through September 30, 2010, we incurred incremental interest expense from the financing associated with the acquisition of NES of $117 million, which includes non-cash interest expense of $33 million. |
41
Table of Contents
| • | During the year ended September 30, 2010, we continued our focus on controlling costs. In response to the global economic climate and, in connection with the acquisition of NES, we began implementing additional initiatives designed to streamline our operations, generate cost savings and eliminate overlapping processes and expenses associated with the NES business. These initiatives include exiting facilities and reducing the workforce or relocating positions to lower cost geographies. Restructuring charges associated with these initiatives were $151 million for employee separation costs primarily associated with involuntary employee severance actions in EMEA and the U.S. and an additional $24 million in future net lease payments associated with the closing and consolidating of facilities. |
| • | The provision for income taxes was $68 million, $18 million and $30 million for the years ended September 30, 2011, 2010 and 2009, respectively. The provision is substantially different from income taxes determined at the U.S. Federal statutory rate. For the year ended September 30, 2009, we were in a three-year cumulative U.S. book tax loss position and had determined that it is more likely than not that our U.S. net deferred tax assets would not be realized. Accordingly, we had provided a valuation allowance against our U.S. net deferred tax assets. As a result, we recorded a tax provision associated with earnings in certain profitable non-U.S. tax jurisdictions for the period offset by a minimal tax benefit relating to our U.S. pre-tax losses in fiscal year 2009. In the years ended September 30, 2010 and 2011, we provided additional allowances associated with the U.S. valuation allowance and our income tax provision primarily relates to earnings of certain profitable non-U.S. tax jurisdictions. |
| • | During fiscal year 2009, we recorded impairments to goodwill and trademark and trade name indefinite-lived intangible assets of $235 million and $60 million, respectively. The impairments are primarily attributable to lower expected future discounted cash flows as a result of the continued weakness in the global economy and changes in discount rates. |
| • | During fiscal year 2009, as a response to the global economic downturn, we began implementing certain initiatives designed to further streamline our operations and generate cost savings. Restructuring charges associated with these initiatives were $160 million and include employee separation costs primarily related to workforce actions in the EMEA and U.S. regions. |
| • | In connection with the Merger, we entered into financing arrangements on October 26, 2007 providing for $5,250 million in financing. |
| • | As a result of the Merger, all of the assets and liabilities of the Predecessor company were recorded at estimated fair values by the Successor company at October 27, 2007. The purchase price allocation resulted in significant changes to our balance sheet accounts including inventory, deferred income tax assets and liabilities, property, plant and equipment, intangible assets, goodwill, employee benefit obligations, deferred revenue and other assets, liabilities and stockholders’ equity accounts. These adjustments included increases to goodwill of $3,698 million and trademark and trade name indefinite-lived intangible assets of $545 million. |
| • | Amortization of intangible assets for fiscal year 2008 was $418 million. The increase over fiscal year 2007 is attributable to the amortization expense associated with significant intangible asset values recorded in connection with the Merger. In purchase accounting, we recorded technologies, patents, licenses, customer relationships and other intangibles with an estimated fair value of $3,157 million. These assets are amortized over their estimated economic lives ranging from five to ten years. |
| • | During fiscal year 2008 we expensed IPRD of $112 million which represented certain technologies that, at the time of the Merger, were in the initial development stages and did not meet the technological feasibility standard necessary for capitalization at the time. Accordingly, these amounts were expensed at the date of the Merger. |
| • | As a result of the Merger, we increased the inventory of the Predecessor by $182 million to reflect its estimated fair value less costs to sell. This adjustment in value was fully expensed as cost of goods sold during fiscal year 2008 as the inventory was sold. |
42
Table of Contents
| • | During fiscal year 2008, we recorded impairments as part of our annual impairment tests to goodwill and trademark and trade name indefinite-lived intangible assets of $899 million and $130 million, respectively. The impairments are primarily the result of lower expected future cash flows as a result of the weakness in the global economy. |
| • | The benefit from income taxes for fiscal year 2008 was $183 million and reflects an effective benefit rate of 12.3%. The difference between our effective benefit rate and the U.S. federal statutory rate of 35% is primarily attributable to the non-deductible portions of the impairment of goodwill and the IPRD charge. The unrecognized tax benefits associated with the non-deductible portions of these charges is $334 million or 22% of pre-tax loss for fiscal year 2008. |
| • | During fiscal year 2007 and the period October 1, 2007 through October 26, 2007 the Predecessor incurred approximately $105 million and $57 million, respectively, of Merger-related costs. These costs included investment banking, legal and other third-party costs, as well as $96 million of non-cash stock compensation expense resulting from the accelerated vesting of stock options and RSUs in connection with the Merger. |
| • | During fiscal year 2007 and the period October 1, 2007 through October 26, 2007, respectively, the Predecessor recorded $36 million and $1 million of restructuring charges related to employee separation and lease termination costs in EMEA and the U.S. Restructuring actions taken during the period October 27, 2007 through September 30, 2008 were charged against the $330 million liability established in purchase accounting for employee separation costs and lease obligations, rather than impacting the Consolidated Statement of Operations. |
43
Table of Contents
UNAUDITED PRO FORMA FINANCIAL STATEMENTS
The following presents the unaudited pro forma balance sheet as of September 30, 2011, and the unaudited pro forma statement of operations for the year ended September 30, 2011.
The following unaudited pro forma financial statements have been developed by applying pro forma adjustments to the historical consolidated statements of financial position and operations of Avaya Holdings Corp. appearing elsewhere in this prospectus. The unaudited pro forma balance sheet as of September 30, 2011 gives effect to the sale of the common stock as contemplated in this offering and the use of the proceeds thereof as if they had occurred on September 30, 2011. The unaudited pro forma statement of operations for the fiscal year ended September 30, 2011 gives effect to the refinancing of certain Company debt that took place on February 11, 2011, and the sale of the common stock as contemplated in this offering and the use of the proceeds thereof as if they had occurred on October 1, 2010. All pro forma adjustments and underlying assumptions are described more fully in the notes to the unaudited pro forma financial statements.
The pro forma information presented is for illustrative purposes only and is not necessarily indicative of the financial position or results of operations that would have been realized if the refinancing of certain Company debt that took place on February 11, 2011, and the sale of the common stock as contemplated in this offering and the use of the proceeds thereof were completed on the dates indicated, nor is it indicative of future operating results. The pro forma adjustments are based upon available information and certain assumptions that management believes to be reasonable.
The unaudited pro forma statement of operations does not include the effects of:
| • | compensation expense relative to the market-based “multiple-of-money” options or cash awards under the Long-Term Incentive Cash Bonus Plan granted by the Company and recognized upon the completion of this offering; or |
| • | accounting charges that may be recorded as a result of the termination of the management services agreement with affiliates of the Sponsors pursuant to the terms of the agreement. |
You should read this information in conjunction with the:
| • | accompanying notes to the unaudited pro forma financial statements; and audited historical consolidated financial statements of Avaya Holdings Corp. as of and for the year ended September 30, 2011, included elsewhere in this prospectus. |
44
Table of Contents
Avaya Holdings Corp.
Unaudited Pro Forma Balance Sheet
September 30, 2011
| Historical | IPO Pro Forma Adjustment (Note 3) | Pro Forma | ||||||||||||
| (in millions) | ||||||||||||||
ASSETS | ||||||||||||||
Current assets: | ||||||||||||||
Cash and cash equivalents | $ | 415 | $ | — | (a), (b), (c), (d) | $ | ||||||||
Accounts receivable, net | 755 | — | ||||||||||||
Inventory | 280 | — | ||||||||||||
Deferred income taxes, net | 8 | — | ||||||||||||
Other current assets | 272 | — | (c) | |||||||||||
|
|
|
|
|
| |||||||||
TOTAL CURRENT ASSETS | 1,730 | — | ||||||||||||
|
|
|
|
|
| |||||||||
Property, plant and equipment, net | 397 | — | ||||||||||||
Deferred income taxes, net | 28 | — | ||||||||||||
Intangible assets, net | 2,129 | — | ||||||||||||
Goodwill | 4,079 | — | ||||||||||||
Other assets | 198 | — | (c) | |||||||||||
|
|
|
|
|
| |||||||||
TOTAL ASSETS | $ | 8,561 | $ | — | $ | |||||||||
|
|
|
|
|
| |||||||||
LIABILITIES | ||||||||||||||
Current liabilities: | ||||||||||||||
Debt maturing within one year | $ | 37 | $ | — | $ | |||||||||
Accounts payable | 465 | — | ||||||||||||
Payroll and benefit obligations | 323 | — | ||||||||||||
Deferred revenue | 639 | — | ||||||||||||
Business restructuring reserves, current portion | 130 | — | ||||||||||||
Other current liabilities | 352 | — | ||||||||||||
|
|
|
|
|
| |||||||||
TOTAL CURRENT LIABILITIES | 1,946 | — | ||||||||||||
|
|
|
|
|
| |||||||||
Long-term debt | 6,120 | — | (c) | |||||||||||
Pension obligations | 1,636 | — | ||||||||||||
Other postretirement obligations | 502 | |||||||||||||
Deferred income taxes, net | 168 | — | ||||||||||||
Business restructuring reserves, non-current portion | 56 | — | ||||||||||||
Other liabilities | 496 | — | (e) | |||||||||||
|
|
|
|
|
| |||||||||
TOTAL NON-CURRENT LIABILITIES | 8,978 | — | ||||||||||||
|
|
|
|
|
| |||||||||
Preferred stock, Series A | 137 | — | (b) | |||||||||||
TOTAL STOCKHOLDERS’ DEFICIENCY | (2,500 | ) | — | (a), (c), (d), (e) | ||||||||||
|
|
|
|
|
| |||||||||
TOTAL LIABILITIES AND STOCKHOLDERS’ DEFICIENCY | $ | 8,561 | $ | — | $ | |||||||||
|
|
|
|
|
| |||||||||
See accompanying notes to unaudited pro forma financial statements.
45
Table of Contents
Avaya Holdings Corp.
Unaudited Pro Forma Statement of Operations
Year Ended September 30, 2011
| Debt Refinancing Pro Forma Adjustments (Note 2) | IPO Pro Forma Adjustments (Note 3) | Pro Forma | ||||||||||||||||
| Historical | ||||||||||||||||||
| (in millions, except per share amounts) | ||||||||||||||||||
REVENUE | ||||||||||||||||||
Products | $ | 2,976 | $ | — | $ | — | $ | |||||||||||
Services | 2,571 | — | — | |||||||||||||||
|
|
|
|
|
|
|
| |||||||||||
| 5,547 | — | — | ||||||||||||||||
|
|
|
|
|
|
|
| |||||||||||
COSTS | ||||||||||||||||||
Products: | ||||||||||||||||||
Costs (exclusive of amortization of intangibles) | 1,314 | — | — | |||||||||||||||
Amortization of technology intangible assets | 257 | — | — | |||||||||||||||
Services | 1,344 | — | — | |||||||||||||||
|
|
|
|
|
|
|
| |||||||||||
| 2,915 | — | — | ||||||||||||||||
|
|
|
|
|
|
|
| |||||||||||
GROSS MARGIN | 2,632 | — | — | |||||||||||||||
|
|
|
|
|
|
|
| |||||||||||
OPERATING EXPENSES | ||||||||||||||||||
Selling, general and administrative | 1,845 | — | — | (g), (i) | ||||||||||||||
Research and development | 461 | — | — | |||||||||||||||
Amortization of intangible assets | 226 | — | — | |||||||||||||||
Restructuring charges, net | 189 | — | — | |||||||||||||||
Acquisition-related costs | 5 | — | — | |||||||||||||||
|
|
|
|
|
|
|
| |||||||||||
TOTAL OPERATING EXPENSES | 2,726 | — | — | |||||||||||||||
|
|
|
|
|
|
|
| |||||||||||
OPERATING LOSS | (94 | ) | — | — | ||||||||||||||
Interest expense | (460 | ) | 15 | — | (f) | |||||||||||||
Loss on extinguishment of debt | (246 | ) | — | — | ||||||||||||||
Other income, net | 5 | — | — | |||||||||||||||
|
|
|
|
|
|
|
| |||||||||||
LOSS BEFORE INCOME TAXES | (795 | ) | 15 | — | ||||||||||||||
Provision for income taxes | 68 | — | — | |||||||||||||||
|
|
|
|
|
|
|
| |||||||||||
NET LOSS | (863 | ) | 15 | — | ||||||||||||||
Less: Accretion and accrued dividends on Series A preferred stock | (7 | ) | — | — | (h) | |||||||||||||
|
|
|
|
|
|
|
| |||||||||||
NET LOSS ATTRIBUTABLE TO AVAYA HOLDINGS CORP. COMMON STOCKHOLDERS | $ | (870 | ) | $ | 15 | $ | — | $ | ||||||||||
|
|
|
|
|
|
|
| |||||||||||
SHARE DATA: | ||||||||||||||||||
Net loss per share attributable to common stockholders | $ | (1.78 | ) | $ | ||||||||||||||
|
|
|
| |||||||||||||||
Weighted average basic and diluted shares outstanding | 489.0 | |||||||||||||||||
|
|
|
| |||||||||||||||
See accompanying notes to unaudited pro forma financial statements.
46
Table of Contents
NOTES TO UNAUDITED PRO FORMA FINANCIAL STATEMENTS
NOTE 1: BASIS OF PRESENTATION
The unaudited pro forma financial statements include the following for all applicable periods:
| • | The historical consolidated financial statements of Avaya Holdings Corp. |
| • | Debt refinancing pro forma adjustments related to interest expense which give effect to the refinancing of certain Company debt that took place on February 11, 2011 as if it had occurred on October 1, 2010. |
| • | Initial public offering pro forma adjustments which give effect to the sale of the number of shares set forth on the cover of this prospectus at an assumed initial public offering price of $ , which is the midpoint of the range listed on the cover of this prospectus and the use of the proceeds as set forth under “Use of Proceeds” as if the initial public offering had occurred on October 1, 2010 for purposes of the unaudited pro forma statement of operations and on September 30, 2011 for purposes of the unaudited pro forma balance sheet. |
As more fully discussed in the notes to Avaya Holdings Corp.’s consolidated financial statements appearing elsewhere in this prospectus, on February 11, 2011 the senior secured credit facility was amended and restated and $988 million par value of senior secured incremental term B-2 loans was repaid with the proceeds from a private placement of $1,009 million of senior secured notes.
The most significant modifications to the senior secured credit facility include an amendment that permitted us to effect a refinancing (see below) in which the maturity of a portion of the senior secured term B-1 loans, or term B-1 loans, representing outstanding par value of $2.2 billion was extended from October 26, 2014 to October 26, 2017 by converting such loans into a new tranche of senior secured B-3 loans, or term B-3 loans, and changing the applicable interest rate for the new tranche of term B-3 loans. The term B-1 loans, as well as the new tranche of term B-3 loans bear interest at a rate per annum equal to either a base rate or a LIBOR rate, in each case plus an applicable margin. However, the applicable margin for borrowings of term B-3 loans is 3.50% per annum with respect to base rate borrowings and 4.50% per annum with respect to LIBOR borrowings as compared to the applicable margin for borrowings of term B-1 loans, which is 1.75% per annum with respect to base rate borrowings and 2.75% per annum with respect to LIBOR borrowings. The amendment and restatement of the senior secured credit facility represents a debt modification for accounting purposes. As a result of the amendment and restatement of the senior secured credit facility, the Company incurred third-party expenses of $9 million, which were expensed as incurred and included in other income, net for the year ended September 30, 2011. Although the unaudited pro forma statement of operations for the year ended September 30, 2011 reflects the amendment and restatement as if it had occurred on October 1, 2010, such third-party expenses have not been eliminated and are included in the unaudited pro forma statement of operations.
On February 11, 2011, we completed a private placement of $1,009 million of senior secured notes, which bear interest at a rate of 7% per annum and mature on April 1, 2019. The proceeds of the private placement were used to repay in full the senior secured incremental term B-2 loans outstanding under Avaya Inc.’s senior secured credit facility (representing $988 million par value and $12 million in accrued and unpaid interest through February 11, 2011), which was incurred to effect the acquisition of NES and to pay related fees and expenses. The issuance of the senior secured notes and repayment of the incremental term B-2 loans was accounted for as an extinguishment of the incremental term B-2 loans and issuance of new debt. Accordingly, the Company recognized a loss on extinguishment of debt of $246 million based on the difference between the reacquisition price and the carrying value of the incremental term B-2 loans (including unamortized debt discount and debt issue costs) for the year ended September 30, 2011. Although the unaudited pro forma statement of operations for the year ended September 30, 2011 reflects the issuance of the $1,009 million of senior secured notes and the repayment of the incremental term B-2 loans as if they had occurred on October 1, 2010, the loss on extinguishment of debt has not been eliminated and is included in the unaudited pro forma statement of operations.
47
Table of Contents
As more fully discussed under “Use of Proceeds,” the Company estimates that it will receive net proceeds of approximately $ million from the sale of the number of shares set forth on the cover of this prospectus at an assumed initial public offering price of $ , which is the midpoint of the range listed on the cover of this prospectus, after deducting the underwriting discounts and commissions and estimated offering expenses payable by the Company. The Company intends to use the net proceeds received in connection with this offering to redeem all outstanding shares of Series A Preferred Stock for $ million, including accretion and accrued unpaid dividends of $ million, repay $ million of our long-term indebtedness, and to pay $ million in connection with the termination of the management services agreement with affiliates of our Sponsors. Under the terms of the Management Services Agreement, the agreement will terminate upon an initial public offering, and, upon such termination the one-time success fee referenced in the preceding sentence is due.
NOTE 2: DEBT REFINANCING PRO FORMA ADJUSTMENTS
The unaudited pro forma financial statements reflect the pro forma adjustments of the refinancing of certain Company debt that took place on February 11, 2011, as fully discussed in the notes to Avaya Holding Corp.’s consolidated financial statements included elsewhere in this prospectus. The tax effects of these pro forma adjustments are not material to the unaudited pro forma statement of operations as a result of the valuation allowance established against the Company’s U.S. deferred tax assets.
The pro forma adjustment included in the unaudited pro forma statement of operations for the year ended September 30, 2011 related to the refinancing of certain Company debt eliminates interest expense recognized on the incremental term B-2 loans and the portion of the term B-1 loans that were converted into a new tranche of term B-3 loans and increases interest expense for interest associated with the new tranche of term B-3 loans and the $1,009 million of senior secured notes as if the refinancing had occurred on October 1, 2010. The debt refinancing pro forma adjustment was determined as follows:
| Historical Avaya Holdings. Corp | Pro Forma Interest Expense | Debt Refinancing Pro Forma Adjustments | ||||||||||
(in millions) | ||||||||||||
Interest expense on term B-1 loans(1) | $ | 27 | $ | — | $ | (27 | ) | |||||
Cash interest expense on term B-3 loans(2) | 68 | 105 | 37 | |||||||||
Amortization of debt issuance costs on term B-3 loans(3) | 2 | 4 | 2 | |||||||||
Accretion of debt discount on term B-3 loans(4) | 1 | 2 | 1 | |||||||||
Interest expense on incremental term B-2 loans(5) | 55 | — | (55 | ) | ||||||||
Cash interest expense on $1,009 senior secured notes(6) | 45 | 71 | 26 | |||||||||
Amortization of debt issuance costs on $1,009 senior secured notes(7) | 2 | 3 | 1 | |||||||||
|
|
|
|
|
| |||||||
Total pro forma interest expense adjustment | $ | 200 | $ | 185 | $ | (15 | ) | |||||
|
|
|
|
|
| |||||||
| (1) | Interest expense on term B-1 loans—The pro forma adjustment of $(27) million has been provided to eliminate the interest expense, including amortization of debt issuance costs on $2.2 billion of term B-1 loans that were converted into a new tranche of term B-3 loans included in Avaya Holdings Corp.’s historical statement of operations for the year ended September 30, 2011. |
| (2) | Cash interest expense on term B-3 loans—The pro forma adjustment of $37 million reflects the incremental interest expense on the new tranche of term B-3 loans for the period from October 1, 2010 through February 11, 2011 as if the refinancing had occurred on October 1, 2010. The interest expense on the term B-3 loans was determined by applying a margin of 4.5% per annum to the 3-month LIBOR rate at February 11, 2011 of 0.313%. A 0.125% change in this rate would result in a change to pro forma interest expense of $3 million. |
48
Table of Contents
| (3) | Amortization of debt issuance costs on term B-3 loans—The pro forma adjustment of $2 million reflects the incremental amortization of debt issuance costs on the new tranche of term B-3 loans for the period from October 1, 2010 through February 11, 2011 as if the refinancing had occurred on October 1, 2010. Unamortized debt issuance costs of $28 million associated with the senior secured credit facility were allocated to the term B-3 loans and are amortized over the modified term of the debt. |
| (4) | Accretion of debt discount on term B-3 loans—The pro forma adjustment of $1 million reflects the incremental accretion of the debt discount on the new tranche of term B-3 loans for the period from October 1, 2010 through February 11, 2011 as if the refinancing had occurred on October 1, 2010. Fees paid to or on behalf of the creditors of $10 million in connection with the modification were recorded as a discount to the face value of the debt. This discount is accreted over the modified term of the debt. |
| (5) | Interest expense on incremental term B-2 loans—The pro forma adjustment of $(55) million has been provided to eliminate interest expense, including amortization of debt issuance costs and accretion of debt discount on the incremental term B-2 loans included in Avaya Holding Corp.’s historical statement of operations for the year ended September 30, 2011. |
| (6) | Cash interest expense on $1,009 million senior secured notes—The pro forma adjustment of $26 million has been provided to record the incremental interest expense on the $1,009 million senior secured notes issued on February 11, 2011 for the period from October 1, 2010 through February 11, 2011 as if the refinancing had occurred on October 1, 2010. The interest expense on the senior secured notes was determined using the fixed stated rate of the senior secured notes of interest of 7.0% per annum. The notes were issued at par. |
| (7) | Amortization of debt issuance costs on $1,009 million senior secured notes—The pro forma adjustment of $1 million reflects the incremental amortization of debt issuance costs on the $1,009 million senior secured notes for the period from October 1, 2010 through February 11, 2011 as if the refinancing had occurred on October 1, 2010. Debt issuance costs of $23 million were incurred in connection with the issuance of the senior secured notes and are amortized over the term of the debt, which is approximately 8 years. |
NOTE 3: INITIAL PUBLIC OFFERING PRO FORMA ADJUSTMENTS
The unaudited pro forma financial statements reflect the pro forma adjustments of the sale of the number of shares set forth on the cover of this prospectus at an assumed initial public offering price of $ , which is the midpoint of the range listed on the cover of this prospectus and the use of the proceeds as set forth under “Use of Proceeds.” The tax effects of these pro forma adjustments are not material to the unaudited pro forma statement of operations as a result of the valuation allowance established against the Company’s U.S. deferred tax assets.
49
Table of Contents
ADJUSTMENTS TO UNAUDITED PRO FORMA BALANCE SHEET
The pro forma adjustments included in the unaudited pro forma balance sheet as of September 30, 2011 related to the sale of the number of shares set forth on the cover of this prospectus at an assumed initial public offering price of $ , which is the midpoint of the range listed on the cover of this prospectus and the use of the proceeds as set forth under “Use of Proceeds” are as follows:
| Pro Forma Adjustments | ||||||||||||
| Sale of Shares (a) | Redemption of Preferred Stock (b) | Repayment of debt (c) | Payment of Monitoring Fee (d) | Compensation expense (e) | Net Adjustments | |||||||
Increases / (Decreases) in | (in millions) | |||||||||||
Cash and cash equivalents | ||||||||||||
Other current assets | ||||||||||||
Other assets | ||||||||||||
Debt maturing within one year | ||||||||||||
Long-term debt | ||||||||||||
Preferred Stock: Series A | ||||||||||||
Stockholder’s deficiency | ||||||||||||
(a)Sale of Shares—As more fully discussed under “Use of Proceeds,” the Company estimates that it will receive net proceeds of approximately $ million from the sale of the common stock offered in this offering, after deducting the underwriting discounts and commissions and estimated offering expenses payable by the Company. These proceeds assume that the underwriters do not exercise their option to purchase additional shares.
(b) Redemption of Preferred Stock—The Company intends to use the net proceeds received in connection with this offering in part to redeem all outstanding shares of Series A Preferred Stock for $ million, including accrued unpaid dividends of $ million.
(c)Repayment of debt—The Company intends to use the net proceeds received in connection with this offering in part to repay $ million of Avaya Inc.’s long-term indebtedness.
(d)Payment of Monitoring Fee—The Company intends to use the net proceeds received in connection with this offering in part to pay $ million in connection with the termination of the management services agreement with affiliates of our Sponsors pursuant to its terms.
(e)Compensation expense—The pro forma adjustment of $ million has been provided to give effect to $ million of stock-based compensation expense associated with market-based “multiple-of-money” options granted by the Company and $ million of compensation expense relative to cash awards granted by the Company under the Long-Term Incentive Cash Bonus Plan, which will be recognized upon completion of this offering.
ADJUSTMENTS TO UNAUDITED PRO FORMA STATEMENTS OF OPERATIONS
The pro forma adjustments included in the unaudited pro forma statement of operations for the year ended September 30, 2011 related to the sale of the common stock offered in this offering and the use of the proceeds thereof are as follows:
(f)Interest expense—The pro forma adjustment of $ million has been provided to eliminate a portion of the interest expense associated with certain long-term indebtedness reflected in the historical consolidated financial statements of Avaya Holdings Corp. for the year ended September 30, 2011. The Company intends to use the net proceeds received in connection with this offering in part to repay $ million of Avaya Inc.’s long-term indebtedness.
50
Table of Contents
(g)Selling, general and administrative expense—The pro forma adjustment of $ million has been provided to eliminate the annual monitoring fee payable under the management services agreement with affiliates of our Sponsors reflected in the historical consolidated financial statements of Avaya Holdings Corp. for the year ended September 30, 2011. Under the terms of the management services agreement, the agreement will terminate upon consummation of this offering and the Company is required to pay a success fee of $ to affiliates of our Sponsors.
(h)Accretion and dividends on Series A Preferred Stock—The pro forma adjustment of $ has been provided to eliminate accretion and accrued dividends on the Company’s Series A Preferred Stock for the year ended September 30, 2011. The Company intends to use the net proceeds received in connection with this offering in part to redeem all outstanding shares of its Series A Preferred Stock for $ million, including accrued unpaid dividends of $ million.
(i)Compensation expense—The pro forma adjustment of $ million reflects $ million of stock-based compensation expense associated with market-based “multiple-of-money” options granted by the Company and $ million of compensation expense relative to cash awards granted by the Company under the Long-Term Incentive Cash Bonus Plan for the year ended September 30, 2011 as if the sale of the common stock as contemplated in this offering had occurred on October 1, 2010.
51
Table of Contents
MANAGEMENT’S DISCUSSION AND ANALYSIS OF FINANCIAL CONDITION AND RESULTS OF OPERATIONS
The following is a discussion and analysis of our financial condition and results of operations for the fiscal years ended September 30, 2011, 2010 and 2009. You should read this discussion and analysis together with our consolidated financial statements and related notes and the other financial information included elsewhere in this prospectus. This discussion contains forward-looking statements that involve significant risks and uncertainties. As a result of many factors, such as those set forth under “Risk Factors” and elsewhere in this prospectus, our actual results may differ materially from those anticipated in these forward-looking statements.
When we use the terms “we,” “us,” “our,” “Avaya” or the “Company,” we mean Avaya Holdings Corp., a Delaware corporation, and its consolidated subsidiaries, including Avaya Inc., our principal U.S. operating subsidiary, taken as a whole, unless the context otherwise indicates.
Overview
We are a leading global provider of next-generation business collaboration and communications solutions that bring people together with the right information at the right time in the right context, enabling business users to improve their efficiency and solve critical business challenges more quickly. Our highly intuitive and personalized user experience enables business users to collaborate seamlessly across various modes of communication, including real-time voice, video, instant messaging and conferencing, and non real-time email, voicemail and social networking. Our open SIP-based collaboration platform is designed to facilitate the development and rollout of next-generation business collaboration tools within our customers’ existing IT infrastructure, reducing the cost of implementing our solution. We have established ourselves as a leader in the business collaboration market in part due to our long-standing heritage of delivering mission critical unified communications, contact center and voice communications solutions.
Our solutions address the needs of a diverse range of customers, including large multinational enterprises, small- and medium-sized businesses and government organizations. As of September 30, 2011, we had over 400,000 customers, including more than 90% of the Fortune 500 companies and one million customer locations worldwide. Our customers operate in a broad range of industries, including financial services, manufacturing, retail, transportation, energy, media and communications, health care, education and government.
We sell solutions directly and through our channel partners. As of September 30, 2011, we had approximately 9,100 channel partners worldwide, including system integrators, service providers, value-added resellers and business partners that provide sales and service support.
For fiscal years 2011 and 2010, we had total revenue of $5,547 million and $5,060 million, respectively. For fiscal year 2011, product revenue represented 54% of our total revenue and services revenue represented 46%. For fiscal year 2010, product revenue represented 51% of our total revenue and services revenue represented 49%. Revenue generated in the United States for fiscal years 2011 and 2010 was 54% and 55%, respectively. For fiscal years 2011 and 2010, we had a net loss of $863 million and $871 million, respectively, and Adjusted EBITDA of $971 million and $795 million, respectively. See “Non-GAAP Financial Measures and Supplemental Disclosure—EBITDA and Adjusted EBITDA” for a definition and explanation of Adjusted EBITDA and a reconciliation of net loss to Adjusted EBITDA.
History
We have a long history of innovation dating back to our research and development roots in Bell Laboratories when we were a part of AT&T. Avaya was formerly the Business Communications business unit of Lucent, a 1996 spin-off from AT&T. Since our own spin-off from Lucent in 2000, we have been a leading
52
Table of Contents
provider of unified communications, contact center solutions and more recently business collaboration solutions to our customers. Avaya Inc., our wholly owned subsidiary, operated as a public company with common stock traded on the New York Stock Exchange from October 1, 2000 until acquired by affiliates of our Sponsors on October 26, 2007.
Business Trends
There are a number of trends and uncertainties affecting our business. For example, the effect that general economic conditions have on our customers’ willingness to spend on information technology, and particularly enterprise communications technology, impacts the demand for our products and, as a result, our revenue. The global economic downturn during 2008 through 2010 negatively affected most of the markets we serve. However, despite declining revenue during this period we maintained our focus on profitability levels and investing in our future results. We also invested significantly in research and development, introducing more than 70 new product offerings to the market since the beginning of fiscal year 2010. We implemented various initiatives designed to streamline our operations, generate cost savings, and to eliminate overlapping processes and expenses associated with the NES business. We acquired NES in order to further expand our technology portfolio, enhance our customer base, broaden our indirect sales channel and provide us greater ability to compete globally. We believe these investments are helping us to capitalize on the increasing focus of enterprises on deploying collaboration solutions in order to increase productivity, reduce costs and complexity and gain competitive advantage, which is being further accelerated by a trend toward a more mobile workforce and the associated proliferation of devices. In addition, we believe that the limitations of traditional collaboration solutions present an opportunity for differentiated vendors to gain market share.
We have also successfully expanded our indirect channel. While sales through the indirect channel generally generate lower margins than direct sales due to higher discounts, we believe this expansion of our indirect channel favorably impacts our financial results by lowering selling expenses and allowing us to reach more end users and grow our business. In furtherance of our effort to maintain an effective business partner program, we continue to refine and expand our global coverage. For example, in August 2010 we sold our 59.13% ownership interest in AGC, a publicly traded reseller of our products and services in India, which allowed us to pursue additional channel partners in India while continuing to sell through AGC.
Certain trends and uncertainties also impact our global services organization, which provides us a large recurring revenue stream. Due to advances in technology, our customers continue to expect to pay less for traditional services. In addition, despite the benefits of a robust indirect channel, our channel partners have direct contact with our customers that may foster independent relationships between them and a loss of certain services agreements for us. We have been able to offset these impacts by focusing on other types of services not traditionally provided by our channel partners, such as professional and managed or operations services.
We expect our gross margin and gross margin percentage to continue to improve in the foreseeable future as we implement our numerous gross margin initiatives and continue to apply our business model discipline to the NES business we acquired. Historically, lower margins experienced by the acquired NES business and competitor and customer pricing pressures have been challenges to gross margin. However, we have undertaken numerous initiatives to accomplish our gross margin objectives, including increasing our focus on higher margin software revenue, optimizing design of products and services productivity to drive efficiencies, executing on certain cost savings initiatives and achieving greater economies of scale.
For the fiscal years 2011 and 2010, revenue outside of the United States represented 46% and 45% of total revenue, respectively. Foreign currency exchange rates and fluctuations may have an impact on our revenue, costs or cash flows from our international operations. Our primary currency exposures are to the euro, British pound, Indian rupee, Japanese yen and Canadian dollar. These exposures may change over time as business practices evolve and as the geographic mix of our business changes and we are not able to predict the impact that foreign currency fluctuations will have on future periods.
53
Table of Contents
Continued Focus on Cost Structure
In connection with the Merger in fiscal year 2008, Avaya’s management and board of directors developed and began implementing various plans and initiatives designed to streamline the operations of the Company and generate cost savings. In addition, in response to the global economic downturn and in connection with its acquisition of NES, the Company identified and initiated additional cost savings programs throughout fiscal years 2009, 2010 and 2011. These cost savings programs include: (1) reducing headcount, (2) off-shoring certain job functions to lower cost geographies, including service delivery, customer care, research and development, human resources and finance and (3) eliminating real estate costs associated with unused or under-utilized facilities.
Reductions in headcount included the elimination of redundancies by re-defining and consolidating job functions, reductions in management and in back-office headcount of our sales organization, reduced headcount in our services business, the use of remote monitoring of customer systems, which made our services segment more efficient, and a shift in the mix of the Company’s distribution channels toward the indirect channel which reduced our personnel needs. We were also able to attain additional salary savings as the Company placed greater emphasis on shifting job functions to its shared service centers in India and Argentina.
Reductions in real estate costs were achieved by: (1) eliminating redundant facilities in similar geographic areas as part of transitioning and integrating the operations of NES, (2) reductions in headcount, which decreased our real estate needs, and (3) the shift toward the indirect distribution channel. These initiatives enabled us to vacate and consolidate facilities without affecting the quality or distribution of our products and services, and reduce our real estate costs.
In connection with the Merger, the Company rolled out initiatives to eliminate approximately 2,800 employee positions, of which 2,200 positions were located in the U.S. and 600 were located outside the U.S., predominantly in EMEA. In addition, the Company took action to vacate facilities in the U.S., Germany, United Kingdom and the Netherlands. The costs associated with these actions were $330 million and were recorded as a liability in purchase accounting. The liability included $251 million of costs associated with terminated employees and $79 million of lease termination obligations, net of expected future sub-lease income, for the vacated facilities. We partially realized the cost saving benefits associated with these initiatives during the period October 27, 2007 through September 30, 2008 and continued to realize the benefits in fiscal years 2009, 2010 and 2011. The headcount reductions associated with this program were completed in fiscal year 2010. The cash payments associated with the headcount reductions are expected to be completed in fiscal year 2017 and the cash payments associated with the lease obligations are expected to continue through fiscal year 2020.
As described above, the Company initiated additional cost saving programs, which resulted in a reduction of headcount in fiscal year 2009. As a result of these actions, the Company recognized $160 million of business restructuring charges, which were primarily associated with involuntary employee separation actions in EMEA and the U.S. The Company’s workforce at September 30, 2008 and 2009 was approximately 17,500 and 15,500, respectively, which excludes the headcount of our then 59.13% owned subsidiary, AGC, which we sold in August 2010. During fiscal year 2009 the Company also successfully relocated approximately 750 employee positions to our shared service centers in India and Argentina. While we began realizing the benefits of these actions during fiscal year 2009, the personnel reductions and related payments were not completed until fiscal year 2010. The future rental payments related to operating lease obligations for unused space in connection with the closing or consolidation of facilities during fiscal year 2009 were not material.
During the first quarter of fiscal year 2010, in response to the global economic downturn and in anticipation of the acquisition of NES, the Company implemented initiatives to eliminate overlapping processes and expenses associated with that acquisition. Restructuring charges recorded during fiscal year 2010, net of adjustments to previous periods, were $171 million and included employee separation costs of $147 million associated with involuntary employee severance actions primarily in EMEA and the U.S., as well as $24 million of costs associated with closing and consolidating utilized or under-utilized facilities primarily located in the U.S. and Germany, eliminating redundant facilities in similar geographic areas as part of transitioning and integrating the
54
Table of Contents
operations of NES and accounting for reductions in headcount. As part of the acquisition of NES, the Company acquired a workforce of approximately 5,900 and assumed leases in the U.S. that were redundant to existing Avaya facilities, thereby creating excess real estate capacity. The Company’s workforce at September 30, 2009 and 2010 was approximately 15,500 and 18,900, respectively, excluding AGC, which we sold in August 2010. During fiscal year 2010 the Company also successfully relocated approximately 70 employee positions to Argentina. The personnel reductions and related payments identified in this action are expected to be completed in fiscal year 2013. The future rental payments, net of estimated sublease income, related to operating lease obligations for unused space in connection with the closing or consolidation of facilities are expected to continue through fiscal year 2020.
In fiscal year 2011, the Company continued to streamline operations, generate cost savings and eliminate overlapping processes and expenses. For example, on June 20, 2011, the Company entered into an agreement with the works council representing employees of certain of the Company’s German subsidiaries for the elimination of 210 employee positions. As a result of this action, during the quarter ending June 30, 2011, the Company recognized incremental restructuring charges of approximately 40 million euros (or $56 million based on the prevailing currency exchange rate on June 20, 2011). These charges consist of severance and employment benefit payments that are expected to be paid through the quarter ending September 30, 2012, including, but not limited to, social pension fund payments and healthcare and unemployment insurance costs to be paid to or on behalf of the affected employees. Additionally, as a result of the workforce reduction plan in Germany, the Company re-measured certain pension benefit plans and recognized a curtailment charge of approximately $7 million. These involuntary employee departures are expected to continue through the quarter ending December 31, 2011. However, we do not expect to incur additional expenses in connection with our agreement with the works council. The program in Germany does allow for additional voluntary personnel reductions in which employees would receive the same or similar benefits as those provided to employees under the agreement with the works council. However, under the related authoritative accounting guidance, the conditions for recognizing such costs have not been met at this time. Further, due to the inherent limitations in estimating the extent of voluntary termination costs, a reliable estimate of the cost of such actions cannot be made at this time.
The Company continues to evaluate opportunities to streamline its operations and identify cost savings globally. Although a specific plan does not exist at this time, the Company may take additional restructuring actions in the future and the costs of those actions could be material. All costs associated with such actions would be recognized in accordance with authoritative accounting guidance and the Company’s accounting policies as outlined in Note 2, “Summary of Significant Accounting Policies – Restructuring Programs” to our consolidated financial statements located elsewhere in this prospectus. For further details on our restructuring programs see Note 8, “Business Restructuring Reserves and Programs” to our consolidated financial statements located elsewhere in this prospectus.
Refinancing of Debt
On February 11, 2011, we successfully completed a debt refinancing that deferred the maturity of $3.18 billion of senior secured loans. As part of the transaction, $2.2 billion outstanding par value of the senior secured term B-1 loans was converted into a new tranche of senior secured term B-3 loans, extending the maturity of that indebtedness from October 26, 2014 to October 25, 2017, and $988 million par value of senior secured incremental term B-2 loans was repaid with the proceeds from a private placement of $1,009 million of senior secured notes, extending the maturity of that indebtedness from October 26, 2014 to April 1, 2019.
On August 8, 2011, the Company amended the terms of each of the multi-currency revolvers available under its senior secured credit facility and its multi-currency asset-based revolving credit facility to extend the final maturity of each from October 26, 2013 to October 26, 2016. All other terms and conditions of the senior secured credit facility and the multi-currency asset-based revolving credit facility remain unchanged.
55
Table of Contents
Key Performance Indicators
Key performance indicators that we use to manage our business and evaluate our financial results and operating performance include: Revenue, Gross Margin, Gross Margin Percentage, Adjusted EBITDA and Cash Balance. We evaluate revenue performance against the overall economic environment, the underlying growth in our core markets, changes in our competitive environment, the impact of new product launches and applications and our customers’ willingness to spend on information technology. Gross margin is primarily affected by our ability to manage costs, including obtaining volume discount pricing from our suppliers and personnel costs. Adjusted EBITDA provides us with a measure of our financial performance based on operational factors that management can impact in the short-term, namely our pricing strategies, volume, costs and expenses of the organization. Cash balance is used as an indicator of the Company’s ability to generate cash flows from operations and to evaluate management’s ability to control its accounts receivable, inventory and accounts payable balances.
These key performance indicators as of and for the fiscal years ended September 30, 2011, 2010 and 2009 were as follows:
| September 30, | ||||||||||||
| 2011(2) | 2010(2) | 2009 | ||||||||||
(dollars in millions) | ||||||||||||
Revenue | $ | 5,547 | $ | 5,060 | $ | 4,150 | ||||||
Gross Margin | 2,632 | 2,172 | 1,866 | |||||||||
Gross Margin Percentage | 47 | % | 43 | % | 45 | % | ||||||
Adjusted EBITDA(1) | 971 | 795 | 753 | |||||||||
Cash Balance | 415 | 594 | 582 | |||||||||
| (1) | Adjusted EBITDA is a non-GAAP measure, evaluated by comparing actual results to management forecasts and prior period performance. A definition and explanation of Adjusted EBITDA, as well as a reconciliation of net loss to Adjusted EBITDA, is provided in “Non-GAAP Financial Measures and Supplemental Disclosure—EBITDA and Adjusted EBITDA.” |
| (2) | Our key performance indicators for 2010 and 2011 include the results of the NES business beginning with the first quarter of fiscal year 2010. NES was acquired December 18, 2009. |
Financial Operations Overview
The following describes certain components of our statement of operations and considerations impacting those results.
Revenue. We derive our revenue primarily from the sale and service of communications systems and applications. Our product revenue includes the sale of unified communications, contact center, small and medium enterprise communications and data networking solutions. Product revenue accounted for 54%, 51% and 46% of our total revenue for fiscal years 2011, 2010 and 2009, respectively. Our services revenue includes product maintenance and support, professional services, including design and integration, and operations services. We expect that as we continue to introduce new product offerings and enterprises increase their spending, we will generate more revenue from our installed base and our product revenue will become a larger part of our total revenue.
Our distribution network includes, as of September 30, 2011, approximately 9,100 channel partners, including a global network of alliance partners, distributors, dealers, value-added resellers, telecommunications service providers and system integrators. Our indirect sales channel represented 76%, 71% and 53% of our product revenues for fiscal years 2011, 2010 and 2009, respectively. Our revenue outside the United States represented 46%, 45% and 45% of our total revenue in fiscal years 2011, 2010 and 2009, respectively.
56
Table of Contents
Because we sell our products to end-users in a wide range of industries and geographies, demand for our products is generally driven more by the level of general economic activity than by conditions in one particular industry or geographic region.
Cost of Revenue. Cost of product revenue consists primarily of hardware costs, royalties and license fees for third-party software included in our systems, personnel and related overhead costs of operation, freight, warranty costs, amortization of technology intangible assets and provisions for excess inventory. We outsource substantially all of our manufacturing operations to several EMS providers. Our EMS providers produce the vast majority of our products in facilities located in China, with other products produced in facilities located in Israel, Mexico, Malaysia, Taiwan, Germany, Indonesia, the United Kingdom and the U.S. The majority of these costs vary with the unit volumes of product sold. We expect over time to increase the software content of our products, decrease our product costs and improve product gross margins. Cost of services revenue consists of salary and related overhead costs of personnel engaged in support and services. As we continue to realize the benefit of cost saving initiatives, which include the benefit of productivity improvements from reducing the workforce and relocating positions to lower cost geographies, we expect our cost of services revenue will decrease.
Selling, General and Administrative Expenses. Selling, general and administrative expenses consist primarily of costs relating to our sales and marketing activities and administrative, legal, finance functions and related overhead and other corporate expenses.
Sales and marketing expenses primarily include personnel costs, sales commissions, travel, marketing promotional and lead generation programs, trade shows, professional services fees and related overhead expenses. We plan to continue to invest in development of our distribution channels by increasing the size of our field sales force and continue to develop the capabilities of our channel partners to enable us to expand into new geographies and further increase our sales to small and medium enterprises across the world.
Administrative expenses consist primarily of salary and benefit costs for executive and administrative staff, the use and maintenance of administrative offices, including depreciation expense, logistics, information systems and legal and accounting services. Administrative expenses generally do not increase or decrease directly with changes in sales volume.
Research and Development Expenses. Research and development expenses primarily include personnel costs, outside engineering costs, professional services, prototype costs, test equipment, software usage fees and related overhead expenses. Research and development expenses are recognized when incurred. The level of research and development expense is related to the number of products in development, the stage of development process, the complexity of the underlying technology, the potential scale of the product upon successful commercialization and the level of our exploratory research. We conduct such activities in areas we believe will accelerate our longer term net revenue growth.
We are devoting substantial resources to the development of additional functionality for existing products and the development of new products and related software applications. We intend to continue to make significant investments in our research and development efforts because we believe they are essential to maintaining and improving our competitive position. Accordingly, we expect research and development expenses to continue to increase.
Amortization of Intangible Assets. As a result of the Merger and acquisition of NES significant amounts were recognized in purchase accounting for the estimated fair values of customer relationships associated with the businesses acquired. The fair value of these intangible assets was estimated by independent valuations at the time of acquisition and is amortized into our operating expenses over their estimated useful lives.
Impairment of Indefinite-Lived Intangible Assets and Goodwill. As a result of the global economic climate and the continued deterioration in the credit and financial markets, we reduced our near-term and long-term
57
Table of Contents
revenue projections and increased discount rates used in our valuation assumptions during the fourth quarter of fiscal year 2008 and the second quarter of fiscal year 2009. Due to these adverse business indicators and the declining revenue trends, the carrying values of our tradenames and trademarks and the goodwill associated with certain reporting units exceeded their estimated fair values at that time and we recognized impairment losses. In accordance with GAAP, we continue to test these assets for impairment annually or more frequently if events occur or circumstances change that indicate the fair value of these assets may be below their carrying values. Based on our most recent annual impairment assessments performed as of September 30, 2011, we determined that our indefinite-lived assets were not at risk of impairment and that none of our reporting units with significant goodwill was at risk for failing step one of the goodwill impairment test.
Restructuring Charges.In response to the global economic climate, the acquisition of NES and the Company’s commitment to control costs, the Company implemented initiatives designed to streamline the operations of the Company and generate cost savings. The Company exited and consolidated facilities and terminated or relocated certain employees. The expenses associated with these actions are reflected in our operating results. As the Company continues to evaluate and identify additional operational synergies, additional cost saving opportunities may be identified and future restructuring charges may be incurred.
Interest Expense. Interest expense consists primarily of interest on indebtedness under our credit facilities and on our unsecured notes. Interest expense also includes the amortization of deferred financing costs, the amortization of debt discount associated with our incremental B-2 term loans that we refinanced in February 2011, amortization of the debt discount on our term B-3 loans, and the expense associated with interest rate derivative instruments we use to minimize our exposure to variable rate interest payments associated with our debt. We regularly evaluate market conditions, our liquidity profile, and various financing alternatives for opportunities to enhance our capital structure. If market conditions are favorable, we may refinance existing debt or issue additional debt securities. Further, we intend to use a portion of the net proceeds of this offering to repay certain of our existing indebtedness and redeem our Series A Preferred Stock, which would improve our leverage ratio and our interest expense in the future should decrease.
Loss on Extinguishment of Debt.In connection with the issuance of Avaya Inc.’s senior secured notes and the payment in full of the incremental term B-2 loans, we recognized a loss on extinguishment of debt in fiscal year 2011 of $246 million. The loss represents the difference between the reacquisition price of the senior secured incremental term B-2 loans (including consent fees paid by Avaya to the holders of the senior secured incremental term B-2 loans that consented to the amendment and restatement of the senior secured credit facility of $1 million) and the carrying value of the incremental term B-2 loans (including unamortized debt discount and debt issue costs). See Note 9, “Financing Arrangements,” to our consolidated financial statements for further details.
Selected Segment Information
We conduct our business operations in three segments. Two of those segments, Global Communications Solutions, or GCS, and Avaya Networking, or Networking (formerly known as Data Networking or Data), make up Avaya’s product portfolio. The third segment contains our service portfolio and is called Avaya Global Services, or AGS.
In GCS, we deliver business collaboration and communications solutions primarily for unified communications, contact center solutions and small and medium enterprise communications. Our unified communications solutions are designed to promote collaboration, innovation, productivity and real-time decision-making by providing business users a highly intuitive and personalized user experience that enables them to collaborate seamlessly across various modes of communication, including voice, video, email, instant messaging, text messaging, web conferencing, voicemail and social networking. Our contact center solutions are highly reliable, scalable communications-centric applications suites designed to optimize customer service. SME communications solutions are focused on enterprises with up to 250 employees and include telephony,
58
Table of Contents
messaging, networking, conferencing and customer management products that are designed for the requirements of SMEs and help our customers increase the productivity of their employees, deliver superior customer service and reduce costs.
Our Networking segment provides a broad range of internet protocol networking infrastructure products including ethernet switches, routers and Virtual Private Network appliances, wireless networking routers, access control solutions, unified management solutions and end-to-end virtualization strategies and architectures.
Through our AGS segment, we help our customers evaluate, plan, design, implement, support, manage and optimize their enterprise communications networks to help them achieve enhanced business results. Our award-winning service portfolio includes product support, integration and professional and managed services that enable customers to optimize and manage their converged communications networks worldwide.
The following table presents revenue and gross profit by segment for the years indicated:
| Fiscal Year Ended September 30, 2011 | Fiscal Year Ended September 30, 2010 | |||||||||||||||||||||||||||||||
| Revenues | Gross Margin | Revenues | Gross Margin | |||||||||||||||||||||||||||||
| Dollar Amount | Percent of Total Revenue | Dollar Amount | Percent of Revenue | Dollar Amount | Percent of Total Revenue | Dollar Amount | Percent of Revenue | |||||||||||||||||||||||||
| (dollars in millions) | ||||||||||||||||||||||||||||||||
Global Communications Solutions | $ | 2,675 | 49 | % | $ | 1,532 | 57 | % | $ | 2,329 | 46 | % | $ | 1,249 | 54 | % | ||||||||||||||||
Avaya Networking | 304 | 5 | % | 131 | 43 | % | 280 | 5 | % | 117 | 42 | % | ||||||||||||||||||||
Avaya Global Services | 2,573 | 46 | % | 1,222 | 47 | % | 2,463 | 49 | % | 1,119 | 45 | % | ||||||||||||||||||||
Unallocated Amounts(1) | (5 | ) | 0 | % | (253 | ) | (2) | (12 | ) | 0 | % | (313 | ) | (2) | ||||||||||||||||||
|
|
|
|
|
|
|
|
|
|
|
|
|
|
|
| |||||||||||||||||
| $ | 5,547 | 100 | % | $ | 2,632 | 47 | % | $ | 5,060 | 100 | % | $ | 2,172 | 43 | % | |||||||||||||||||
|
|
|
|
|
|
|
|
|
|
|
|
|
|
|
| |||||||||||||||||
| (1) | Unallocated Amounts in gross margin include the amortization of technology intangible assets that are not identified with a specific segment. Unallocated amounts in revenue and gross margin include the impacts of certain fair value adjustments recorded in purchase accounting in connection with the Merger and acquisition of NES. |
| (2) | Not meaningful. |
59
Table of Contents
Financial Results Summary
The following table sets forth for the years ended September 30, 2011, 2010 and 2009, our results of operations as reported in our audited consolidated financial statements located elsewhere in this prospectus.
| Year ended September 30, | ||||||||||||
| 2011 | 2010 | 2009 | ||||||||||
| (in millions, except per share amounts) | ||||||||||||
REVENUE | ||||||||||||
Products | $ | 2,976 | $ | 2,602 | $ | 1,923 | ||||||
Services | 2,571 | 2,458 | 2,227 | |||||||||
|
|
|
|
|
| |||||||
| 5,547 | 5,060 | 4,150 | ||||||||||
|
|
|
|
|
| |||||||
COSTS | ||||||||||||
Products: | ||||||||||||
Costs (exclusive of amortization of intangibles) | 1,314 | 1,243 | 872 | |||||||||
Amortization of technology intangible assets | 257 | 291 | 248 | |||||||||
Services | 1,344 | 1,354 | 1,164 | |||||||||
|
|
|
|
|
| |||||||
| 2,915 | 2,888 | 2,284 | ||||||||||
|
|
|
|
|
| |||||||
GROSS MARGIN | 2,632 | 2,172 | 1,866 | |||||||||
|
|
|
|
|
| |||||||
OPERATING EXPENSES | ||||||||||||
Selling, general and administrative | 1,845 | 1,721 | 1,272 | |||||||||
Research and development | 461 | 407 | 309 | |||||||||
Amortization of intangible assets | 226 | 218 | 207 | |||||||||
Impairment of long-lived assets | — | 16 | 2 | |||||||||
Impairment of indefinite-lived intangible assets | — | — | 60 | |||||||||
Goodwill impairment | — | — | 235 | |||||||||
Restructuring charges, net | 189 | 171 | 160 | |||||||||
In-process research and development charge | — | — | 12 | |||||||||
Acquisition-related costs | 5 | 20 | 29 | |||||||||
Merger-related costs | — | — | — | |||||||||
|
|
|
|
|
| |||||||
| 2,726 | 2,553 | 2,286 | ||||||||||
|
|
|
|
|
| |||||||
OPERATING LOSS | (94 | ) | (381 | ) | (420 | ) | ||||||
Interest expense | (460 | ) | (487 | ) | (409 | ) | ||||||
Loss on extinguishment of debt | (246 | ) | — | — | ||||||||
Other income, net | 5 | 15 | 14 | |||||||||
|
|
|
|
|
| |||||||
LOSS BEFORE INCOME TAXES | (795 | ) | (853 | ) | (815 | ) | ||||||
Provision for income taxes | 68 | 18 | 30 | |||||||||
|
|
|
|
|
| |||||||
NET LOSS | (863 | ) | (871 | ) | (845 | ) | ||||||
Less net income attributable to non-controlling interests | — | 3 | 2 | |||||||||
|
|
|
|
|
| |||||||
NET LOSS ATTRIBUTABLE TO AVAYA HOLDINGS CORP. | (863 | ) | (874 | ) | (847 | ) | ||||||
Less: Accretion and accrued dividends on Series A preferred stock | (7 | ) | (62 | ) | — | |||||||
|
|
|
|
|
| |||||||
NET LOSS ATTRIBUTABLE TO AVAYA HOLDINGS CORP. COMMON STOCKHOLDERS | $ | (870 | ) | $ | (936 | ) | $ | (847 | ) | |||
|
|
|
|
|
| |||||||
Net loss per share attributable to common stockholders | $ | (1.78 | ) | $ | (1.92 | ) | $ | (1.74 | ) | |||
|
|
|
|
|
| |||||||
Weighted average basic and diluted shares outstanding | 489.0 | 488.6 | 488.1 | |||||||||
|
|
|
|
|
| |||||||
60
Table of Contents
Results of Operations
Summary of the Fiscal Year Ended September 30, 2011 Compared with Fiscal Year Ended September 30, 2010
Revenue
Our revenue for fiscal year 2011 and 2010 was $5,547 million and $5,060 million, respectively, an increase of $487 million or 10%. The following table sets forth a comparison of revenue by segment:
| Fiscal years ended September 30, | ||||||||||||||||||||||||
| Percent of Total Revenue | Yr. to Yr. Percent Change | Yr. to Yr. Percent Change, net of Foreign Currency Impact | ||||||||||||||||||||||
| 2011 | 2010 | 2011 | 2010 | |||||||||||||||||||||
| In millions | ||||||||||||||||||||||||
GCS | $ | 2,675 | $ | 2,329 | 49 | % | 46 | % | 15 | % | 14 | % | ||||||||||||
Purchase accounting adjustments | (3 | ) | (7 | ) | 0 | % | 0 | % | (1) | (1) | ||||||||||||||
Networking | 304 | 280 | 5 | % | 5 | % | 9 | % | 8 | % | ||||||||||||||
|
|
|
|
|
|
|
|
|
|
|
| |||||||||||||
Total product revenue | 2,976 | 2,602 | 54 | % | 51 | % | 14 | % | 13 | % | ||||||||||||||
|
|
|
|
|
|
|
|
|
|
|
| |||||||||||||
AGS | 2,573 | 2,463 | 46 | % | 49 | % | 4 | % | 3 | % | ||||||||||||||
Purchase accounting adjustments | (2 | ) | (5 | ) | 0 | % | 0 | % | (1) | (1) | ||||||||||||||
|
|
|
|
|
|
|
|
|
|
|
| |||||||||||||
Total service revenue | 2,571 | 2,458 | 46 | % | 49 | % | 5 | % | 3 | % | ||||||||||||||
|
|
|
|
|
|
|
|
|
|
|
| |||||||||||||
Total revenue | $ | 5,547 | $ | 5,060 | 100 | % | 100 | % | 10 | % | 8 | % | ||||||||||||
|
|
|
|
|
|
|
|
|
|
|
| |||||||||||||
| (1) | Not meaningful |
GCS revenue for fiscal year 2011 and 2010 was $2,675 million and $2,329 million, respectively. GCS revenue increased $346 million or 15% primarily due to incremental revenue from the NES business and increased sales volume. The NES business is included in our results for the full fiscal year 2011 as compared to results for fiscal year 2010, which included the results of the NES business for only the period of December 19, 2009 through September 30, 2010. In 2011, GCS revenue also benefited from the introduction of new product offerings during the second half of 2010 and fiscal year 2011 and an increase in new Avaya Aura licenses sold. We believe the additional functionality created by our Avaya Aura technology has also resulted in increased demand across many of our infrastructure solutions. The increase in contact center application solutions revenues was driven by new product offerings. These increases were partially offset by the impact of our divestiture of our 59.13% ownership interest in AGC in August 2010. Until August 31, 2010 AGC was our majority-owned subsidiary and its sales to end users were included in our revenues. Our divestiture of AGC allowed us to pursue additional channel partners in India while continuing to sell through AGC.
Networking revenue for fiscal year 2011 and 2010 was $304 million and $280 million, respectively. Networking revenue increased $24 million or 9% primarily due to incremental revenue from the NES business for fiscal year 2011 as compared to results for fiscal year 2010, which included the results of the NES business for only the period of December 19, 2009 through September 30, 2010. Our networking business was acquired as part of the acquisition of NES on December 18, 2009. The addition of the NES businesses has given us a position within the global data networking industry, one in which we did not participate immediately prior to the acquisition.
AGS revenue for fiscal year 2011 and 2010 was $2,573 million and $2,463 million, respectively. AGS revenues increased $110 million or 4% primarily due to incremental revenue from the NES business for fiscal year 2011 as compared to fiscal year 2010, which included the results of the NES business for only the period of December 19, 2009 through September 30, 2010.
61
Table of Contents
The following table sets forth a comparison of revenue by location:
| Fiscal years ended September 30, | Yr. to Yr. Percent Change | Yr. to Yr. Percent Change, net of Foreign Currency Impact | ||||||||||||||||||||||
| Percent of Total Revenue | ||||||||||||||||||||||||
| 2011 | 2010 | 2011 | 2010 | |||||||||||||||||||||
| In millions | ||||||||||||||||||||||||
U.S. | $ | 2,998 | $ | 2,764 | 54 | % | 55 | % | 8 | % | 8 | % | ||||||||||||
International: | ||||||||||||||||||||||||
Germany | 505 | 537 | 9 | % | 10 | % | -6 | % | -7 | % | ||||||||||||||
EMEA (Excluding Germany) | 983 | 846 | 18 | % | 17 | % | 16 | % | 14 | % | ||||||||||||||
|
|
|
|
|
|
|
|
|
|
|
| |||||||||||||
Total EMEA | 1,488 | 1,383 | 27 | % | 27 | % | 8 | % | 6 | % | ||||||||||||||
APAC—Asia Pacific | 515 | 464 | 9 | % | 9 | % | 11 | % | 8 | % | ||||||||||||||
Americas International—Canada and Central and Latin America | 546 | 449 | 10 | % | 9 | % | 22 | % | 18 | % | ||||||||||||||
|
|
|
|
|
|
|
|
|
|
|
| |||||||||||||
Total International | 2,549 | 2,296 | 46 | % | 45 | % | 11 | % | 9 | % | ||||||||||||||
|
|
|
|
|
|
|
|
|
|
|
| |||||||||||||
Total revenue | $ | 5,547 | $ | 5,060 | 100 | % | 100 | % | 10 | % | 8 | % | ||||||||||||
|
|
|
|
|
|
|
|
|
|
|
| |||||||||||||
Revenue in the U.S. for fiscal year 2011 and 2010 was $2,998 million and $2,764 million, respectively. Revenue in the U.S. increased $234 million or 8% primarily due to incremental revenue from the NES business for fiscal year 2011 as compared to results for fiscal year 2010, which included the results of the NES business for only the period of December 19, 2009 through September 30, 2010. This also included an increase in sales volume driven by new product offerings. Revenue in EMEA for fiscal year 2011 and 2010 was $1,488 million and $1,383 million, respectively. Revenue in EMEA increased $105 million or 8% primarily due to incremental revenue from the NES business for fiscal year 2011 as compared to results for fiscal year 2010, which included the results of the NES business for only the period of December 19, 2009 through September 30, 2010 and an increase in sales volume of unified communications products. The increase of revenue in EMEA was partially offset by a decrease of revenue in Germany attributable to customers reducing spending on maintenance contracts and the decline in our rental base as lease renewals are typically at lower rates, which is expected to continue in fiscal year 2012. Revenue in APAC and Americas International increased $51 million and $97 million, respectively. The increases were due to incremental revenue from the NES business for fiscal year 2011 as compared to results for fiscal year 2010, which included the results of the NES business for only the period of December 19, 2009 through September 30, 2010, increased sales volume driven by new product offerings and an increase in professional services, as well as the favorable impact of foreign currency. The increase in revenue in APAC was partially offset by the impact of our divestiture of AGC in August 2010. Although we continue to market to end users in the APAC region through the indirect channel using AGC as a business partner, sales through our indirect channel generally generate lower top line revenue due to volume discounts.
The following table sets forth a comparison of revenue from sales of products by channel:
| Fiscal years ended September 30, | ||||||||||||||||||||||||
| Percent of Product Revenue | Yr. to Yr. Percent Change | Yr. to Yr. Percent Change, net of Foreign Currency Impact | ||||||||||||||||||||||
| 2011 | 2010 | 2011 | 2010 | |||||||||||||||||||||
| In millions | ||||||||||||||||||||||||
Direct | $ | 700 | $ | 763 | 24 | % | 29 | % | -8 | % | -10 | % | ||||||||||||
Indirect | 2,276 | 1,839 | 76 | % | 71 | % | 24 | % | 23 | % | ||||||||||||||
|
|
|
|
|
|
|
|
|
|
|
| |||||||||||||
Total sales of products | $ | 2,976 | $ | 2,602 | 100 | % | 100 | % | 14 | % | 13 | % | ||||||||||||
|
|
|
|
|
|
|
|
|
|
|
| |||||||||||||
The percentage of product sales through the indirect channel increased by 5 percentage points to 76% in fiscal year 2011 as compared to 71% in fiscal year 2010. The increase was primarily attributable to the impact of
62
Table of Contents
the sale of AGC in August 2010. As a result of our divestiture of AGC, we continue to market to end users through AGC and those sales in fiscal year 2011 are included in our indirect revenues. Until August 31, 2010 AGC was our majority-owned subsidiary and its sales to end users were included in our direct revenues. In addition, the increase is also attributable to the incremental product sales from the NES business, which, prior to the acquisition of NES, were substantially generated through the indirect channel. Due to higher volume discounts, sales through the indirect channel generally generate lower margins than direct sales. However, our use of the indirect channel lowers selling expenses and allows us to reach more end users.
Gross Margin
The following table sets forth a comparison of gross margin by segment:
| Fiscal years ended September 30, | ||||||||||||||||||||||||
| Percent of Revenue | ||||||||||||||||||||||||
| 2011 | 2010 | 2011 | 2010 | Change | ||||||||||||||||||||
| In millions | ||||||||||||||||||||||||
GCS margin | $ | 1,532 | $ | 1,249 | 57.3 | % | 53.6 | % | $ | 283 | 23 | % | ||||||||||||
Networking margin | 131 | 117 | 43.1 | % | 41.8 | % | 14 | 12 | % | |||||||||||||||
AGS margin | 1,222 | 1,119 | 47.5 | % | 45.4 | % | 103 | 9 | % | |||||||||||||||
Amortization of technology intangible assets and the impact of purchase accounting adjustments | (253 | ) | (313 | ) | (1) | (1) | 60 | (1) | ||||||||||||||||
|
|
|
|
|
|
|
|
|
|
|
| |||||||||||||
Total gross margin | $ | 2,632 | $ | 2,172 | 47.4 | % | 42.9 | % | $ | 460 | 21 | % | ||||||||||||
|
|
|
|
|
|
|
|
|
|
|
| |||||||||||||
| (1) | Not meaningful |
Gross margin for fiscal year 2011 and 2010 was $2,632 million and $2,172 million, respectively. Gross margin increased by $460 million or 21% primarily due to the incremental margin from the NES business for fiscal year 2011 as compared to results for fiscal year 2010, which included the results of the NES business for only the period of December 19, 2009 through September 30, 2010 and an increase in sales volume. The gross margin percentage increased to 47.4% for fiscal year 2011 from 42.9% for the fiscal year 2010. The increase in gross margin and gross margin percentage is primarily due to higher sales volume which leveraged our fixed costs, prior period cost saving initiatives including exiting facilities and reducing the workforce and relocating positions to lower-cost geographies and lower amortization of technology intangible assets, partially offset by higher costs associated with our employee incentive programs, which are driven by our actual financial results relative to established targets.
GCS gross margin for fiscal year 2011 and 2010 was $1,532 million and $1,249 million, respectively. GCS gross margin increased $283 million or 23% primarily due to the incremental margin provided by the NES business for fiscal year 2011 as compared to results for fiscal year 2010, which included the results of the NES business for only the period of December 19, 2009 through September 30, 2010 and an increase in sales volume driven by new product offerings. The GCS gross margin percentage increased to 57.3% for fiscal year 2011 from 53.6% for fiscal year 2010. The increase in gross margin percentage is primarily due to the increase in sales volume which leveraged our fixed costs and prior period cost saving initiatives including exiting facilities and reducing the workforce and relocating positions to lower-cost geographies.
Networking gross margin for the fiscal year 2011 and 2010 was $131 million and $117 million, respectively. Our data business was acquired as part of the acquisition of NES on December 18, 2009. Results for fiscal year 2011 includes the impact of the NES business for the entire year as compared to fiscal year 2010, which included the results of the NES business for only the period of December 19, 2009 through September 30, 2010. The gross margin percentage increased to 43.1% for fiscal year 2011 from 41.8% in fiscal year 2010. The increase in gross margin percentage is primarily due to a reduction in costs of our networking products, partially offset by pricing pressures impacting revenues.
63
Table of Contents
AGS gross margin for fiscal year 2011 and 2010 was $1,222 million and $1,119 million, respectively. AGS gross margin increased $103 million or 9% primarily due to an increase in revenues from professional services. The increase in AGS gross margin also included the incremental margin provided by the NES business for fiscal year 2011 as compared to results for fiscal year 2010, which included the results of the NES business for only the period of December 19, 2009 through September 30, 2010. The AGS gross margin percentage increased to 47.5% for fiscal year 2011 from 45.4% for fiscal year 2010. The change in gross margin percentage is primarily attributable to the continued benefit from cost saving initiatives, which include the benefit of productivity improvements from reducing the workforce and relocating positions to lower cost geographies partially offset by the effects of the acquired NES business for the period December 19, 2009 through September 30, 2010. The acquired NES business historically experienced lower services margins prior to the acquisition. Accordingly, the acquisition of NES negatively impacts the gross margin percentage of AGS for the period presented.
Total gross margin for fiscal year 2011 and 2010 included the effect of certain acquisition adjustments including the amortization of acquired technology intangibles and the amortization of the inventory step-up related to the acquisition of NES and the Merger.
Operating expenses
| Fiscal years ended September 30, | ||||||||||||||||||||||||
| Percent of Revenue | ||||||||||||||||||||||||
| 2011 | 2010 | 2011 | 2010 | Change | ||||||||||||||||||||
| In millions | ||||||||||||||||||||||||
Selling, general and administrative | $ | 1,845 | $ | 1,721 | 33.3 | % | 34.0 | % | $ | 124 | 7 | % | ||||||||||||
Research and development | 461 | 407 | 8.3 | % | 8.0 | % | 54 | 13 | % | |||||||||||||||
Amortization of intangible assets | 226 | 218 | 4.1 | % | 4.3 | % | 8 | 4 | % | |||||||||||||||
Impairment of long-lived assets | — | 16 | 0.0 | % | 0.3 | % | (16 | ) | -100 | % | ||||||||||||||
Restructuring charges, net | 189 | 171 | 3.4 | % | 3.4 | % | 18 | 11 | % | |||||||||||||||
Acquisition-related costs | 5 | 20 | 0.1 | % | 0.4 | % | (15 | ) | -75 | % | ||||||||||||||
|
|
|
|
|
|
|
|
|
|
|
| |||||||||||||
Total operating expenses | $ | 2,726 | $ | 2,553 | 49.2 | % | 50.4 | % | $ | 173 | 7 | % | ||||||||||||
|
|
|
|
|
|
|
|
|
|
|
| |||||||||||||
SG&A expenses for fiscal year 2011 and 2010 were $1,845 million and $1,721 million, respectively, an increase of $124 million. The increase in expenses was due to incremental SG&A expenses incurred by the NES business for fiscal year 2011 as compared to results for fiscal year 2010, which included the results of the NES business for only the period of December 19, 2009 through September 30, 2010. In addition, the increases included unfavorable impacts of foreign currency, as well as higher costs under our employee incentive plans, which are driven by actual results versus established targets. These increases were partially offset by decreases in integration-related costs. Integration-related costs included in SG&A were $102 million and $154 million for fiscal year 2011 and 2010, respectively. Integration-related costs primarily represent third-party consulting fees and other administrative costs associated with consolidating and coordinating the operations of Avaya and NES. These costs were incurred in connection with, among other things, the on-boarding of NES personnel, developing compatible IT systems and internal processes, and developing and implementing a strategic operating plan to enable a smooth transition with minimal disruption to NES customers. Such costs also include fees paid to certain Nortel-controlled entities for logistics and other support functions being performed on a temporary basis pursuant to a transition services agreement. SG&A also decreased as a result of the continued benefit from cost savings initiatives implemented in prior periods, which included exiting facilities and reducing the workforce and relocating positions to lower-cost geographies and the impact of our divestiture of AGC in August 2010. Until August 31, 2010 AGC was our majority-owned subsidiary and its SG&A expenses were included in our SG&A expenses.
R&D expenses for fiscal year 2011 and 2010 were $461 million and $407 million, respectively, an increase of $54 million. The increase in R&D expenses was due to incremental R&D expenses from the acquired NES business for fiscal year 2011 as compared to results for fiscal year 2010, which included the results of the NES
64
Table of Contents
business for only the period of December 19, 2009 through September 30, 2010, as well as higher costs under our employee incentive programs. This increase was partially offset by reductions resulting from continued focus on cost saving initiatives and the re-prioritization of projects.
Amortization of intangible assets for fiscal year 2011 and 2010 was $226 million and $218 million, respectively, an increase of $8 million.
Our acquisition of NES provided us with access to several proprietary technologies that previously were not available to Avaya. Some of these technologies, based on their functionality, overlapped with our pre-existing technologies. In order to realize synergies and reduce our expenditures on research and development and marketing, the number of technologies Avaya supports is being reduced. As a result, we identified certain technologies associated with our GCS products segment that are redundant to others that Avaya no longer aggressively develops and markets. The Company recorded an impairment charge of $16 million in fiscal year 2010 associated with these technologies. The Company determined that no events or circumstances changed during fiscal year 2011 that would indicate that any technologies were impaired.
Restructuring charges, net, for fiscal year 2011 and 2010 were $189 million and $171 million, respectively, an increase of $18 million. During fiscal years 2011 and 2010, we continued our focus on controlling costs. In response to the global economic climate and in anticipation of the acquisition of NES, we began implementing additional initiatives designed to streamline our operations, generate cost savings, and eliminate overlapping processes and expenses associated with the NES business. These initiatives include exiting facilities and reducing the workforce or relocating positions to lower cost geographies. Restructuring charges recorded during fiscal year 2011 include employee separation costs of $153 million and lease obligations of $36 million. Employee separation charges for this period include $56 million associated with an agreement reached with the works council representing employees of certain of the Company’s German subsidiaries for the elimination of 210 employee positions. Severance and employment benefits payments associated with this action are expected to be paid through the quarter ending September 30, 2012, and include, but are not limited to, social pension fund payments and health care and unemployment insurance costs to be paid to or on behalf of the affected employees. These employee departures are expected to continue through the quarter ending December 31, 2011. However, we do not expect to incur additional expenses in connection with our agreement with the works council. The program in Germany does allow for additional voluntary personnel reductions in which employees would receive the same or similar benefits as those provided to employees under the agreement with the works council. However, under the related authoritative accounting guidance, the conditions for recognizing such costs have not been met at this time. Further, due to the inherent limitations in estimating the extent of voluntary termination costs, a reliable estimate of the cost of such actions cannot be made at this time. For fiscal year 2011, lease obligations included in restructuring charges represent the remaining lease obligations associated with facilities vacated during the period primarily in Ireland and the U.S. Restructuring charges recorded during fiscal year 2010 include employee separation costs of $147 million and lease obligations of $24 million and primarily include costs associated with involuntary employee severance actions in EMEA and the U.S. and facilities vacated during the period primarily in the U.S. and United Kingdom. The Company continues to evaluate opportunities to streamline its operations and identify cost savings globally. Although a specific plan does not exist at this time, the Company may take additional restructuring actions in the future and the costs of those actions could be material. All costs associated with such actions would be recognized in accordance with authoritative accounting guidance and the Company’s accounting policies.
Acquisition-related costs for fiscal year 2011 and 2010 were $5 million and $20 million, respectively, a decrease of $15 million, and include third-party legal and other costs related to business acquisitions in fiscal year 2011 and the acquisition of NES in fiscal year 2010.
65
Table of Contents
Operating Loss
Operating loss for fiscal year 2011 was $94 million compared to $381 million for fiscal year 2010.
Results for fiscal year 2011 include the impact of the operating results associated with the NES business, which includes the effect of certain acquisition adjustments and the amortization of acquired technology and customer intangibles, for fiscal year 2011 as compared to results for fiscal year 2010, which included the results of the NES business for only the period of December 19, 2009 through September 30, 2010. In addition, for fiscal year 2011, we incurred integration-related costs (included in SG&A and elsewhere) of $132 million and acquisition-related costs of $5 million, as described above. For fiscal year 2010, we incurred integration-related costs (included in SG&A and elsewhere) of $208 million, acquisition-related costs of $20 million and an impairment of $16 million to our long-lived assets.
Our operating loss for fiscal year 2011 includes non-cash expenses for depreciation and amortization of $653 million and share-based compensation of $12 million. Operating income before non-cash depreciation and amortization and share-based compensation was $571 million for fiscal year 2011. Our operating loss for fiscal year 2010 includes non-cash expenses for depreciation and amortization of $691 million and share-based compensation of $19 million. Operating income before non-cash depreciation and amortization and share-based compensation was $329 million for fiscal year 2010.
Interest Expense
Interest expense for fiscal year 2011 and 2010 was $460 million and $487 million, which includes non-cash interest expense of $42 million and $105 million, respectively. Non-cash interest expense for fiscal year 2011 includes (1) amortization of debt issuance costs, (2) accretion of debt discount attributable to Avaya Inc.’s senior secured incremental term B-2 loans, which were issued in connection with the acquisition of NES, through February 11, 2011, the date on which those loans were repaid in full and (3) accretion of debt discount attributable to Avaya Inc.’s senior secured term B-3 loans, which were issued on February 11, 2011 as a result of the modification to certain provisions of the senior secured credit facility. Non-cash interest expense for fiscal year 2010 includes (1) amortization of debt issuance costs, (2) accretion of debt discount attributable to Avaya Inc.’s senior secured incremental term B-2 loans and (3) PIK interest, which we elected to finance through Avaya Inc.’s senior unsecured PIK toggle notes for the period of May 1, 2009 through October 31, 2009 and November 1, 2009 through April 30, 2010.
Cash interest expense for fiscal year 2011 increased as a result of (1) our election to pay cash interest on Avaya Inc.’s senior unsecured PIK toggle notes for the periods of May 1, 2010 through October 31, 2010, November 1, 2010 through April 30, 2011, and May 1, 2011 through October 31, 2011 and (2) the amendment and restatement of the senior secured credit facility. The amendment and restatement of the senior secured credit facility permitted the extension of the maturity of a portion of the senior secured term B-1 loans representing outstanding principal amounts of $2.2 billion from October 26, 2014 to October 26, 2017 by converting such loans into a new tranche of senior secured B-3 loans that bear interest at a higher rate per annum than the senior secured term B-1 loans that they replaced. This increase was partially offset by decreased cash interest expense as a result of the expiration of certain interest rate swap contracts associated with our senior secured credit facility. See Note 9, “Financing Arrangements,” to our audited consolidated financial statements for further details on the amendment and extension of the senior secured credit facility.
Loss on Extinguishment of Debt
In connection with the issuance of the senior secured notes and the payment in full of the senior secured incremental term B-2 loans, we recognized a loss on extinguishment of debt for fiscal year 2011 of $246 million. The loss represents the difference between the reacquisition price of the senior secured incremental term B-2 loans (including $1 million of consent fees paid to the holders of the senior secured incremental term B-2 loans
66
Table of Contents
that consented to the amendment and restatement of the senior secured credit facility) and the carrying value of the senior secured incremental term B-2 loans (including unamortized debt discount and debt issue costs). See Note 9, “Financing Arrangements,” to our audited consolidated financial statements for further details on the issuance of our senior secured notes and repayment of the senior secured incremental term B-2 loans.
Other Income, Net
Other income, net for fiscal year 2011 and 2010 was $5 million and $15 million, respectively, a decrease of $10 million. For fiscal year 2011 other income, net includes fees paid to third parties in connection with the modification of the senior secured term B-1 loan of $9 million offset by interest income and net foreign currency transaction gains. For fiscal year 2010 other income, net includes interest income and a $7 million gain on our divestiture of AGC.
Provision for Income Taxes
The provision for income taxes was $68 million and $18 million for fiscal year 2011 and 2010, respectively. The effective tax rate for fiscal year 2011 and 2010 was 8.5% and 2.1%, respectively, and differs from the U.S. federal tax rate primarily due to the effect of taxable income in non-U.S. jurisdictions and the valuation allowance principally established against our U.S. deferred tax assets. Additionally, the tax provision for fiscal year 2011 includes an $8 million benefit for the reversal of a valuation allowance related to NOLs, which are now expected to be utilized by a non-U.S. entity and a $5 million benefit for a reduction in unrecognized tax benefits due to reduction of uncertain tax positions plus the reversal of interest in the amount of $3 million. The tax benefit for fiscal year 2010 includes a $10 million reduction in our unrecognized tax benefits due to the settlement of a tax issue plus the reversal of interest in the amount of $5 million.
Fiscal Year Ended September 30, 2010 Compared with Fiscal Year Ended September 30, 2009
Revenue
Our revenue for fiscal year 2010 and 2009 was $5,060 million and $4,150 million, respectively, an increase of $910 million or 22%. The following table sets forth a comparison of revenue by segment:
| Fiscal year ended September 30, | ||||||||||||||||||||||||
| Percent of Total Revenue | Yr. to Yr. Percent Change | Yr. to Yr. Percent Change, net of Foreign Currency Impact | ||||||||||||||||||||||
| 2010 | 2009 | 2010 | 2009 | |||||||||||||||||||||
| (dollars in millions) | ||||||||||||||||||||||||
GCS | $ | 2,329 | $ | 1,939 | 46 | % | 46 | % | 20 | % | 19 | % | ||||||||||||
Purchase accounting adjustments | (7 | ) | (16 | ) | 0 | % | 0 | % | (1) | (1) | ||||||||||||||
Networking | 280 | — | 5 | % | 0 | % | (1) | (1) | ||||||||||||||||
|
|
|
|
|
|
|
|
|
|
|
| |||||||||||||
Total product revenue | 2,602 | 1,923 | 51 | % | 46 | % | 35 | % | 34 | % | ||||||||||||||
|
|
|
|
|
|
|
|
|
|
|
| |||||||||||||
AGS | 2,463 | 2,227 | 49 | % | 54 | % | 11 | % | 10 | % | ||||||||||||||
Purchase accounting adjustments | (5 | ) | — | 0 | % | 0 | % | (1) | (1) | |||||||||||||||
|
|
|
|
|
|
|
|
|
|
|
| |||||||||||||
Total service revenue | 2,458 | 2,227 | 49 | % | 54 | % | 10 | % | 10 | % | ||||||||||||||
|
|
|
|
|
|
|
|
|
|
|
| |||||||||||||
Total revenue | $ | 5,060 | $ | 4,150 | 100 | % | 100 | % | 22 | % | 21 | % | ||||||||||||
|
|
|
|
|
|
|
|
|
|
|
| |||||||||||||
| (1) | Not meaningful. |
GCS revenue for fiscal year 2010 and 2009 was $2,329 million and $1,939 million, respectively. GCS revenue increased $390 million or 20% primarily due to incremental revenue from the NES business and the favorable impact of foreign currency. The increase in GCS revenues was partially offset by lower sales volume of
67
Table of Contents
communications infrastructure primarily attributable to global economic conditions and cautious spending by Avaya’s established customer base as Avaya’s product line was in transition during the first half of fiscal year 2010. The acquisition of NES in fiscal year 2010 resulted in an increase in the number of products under development and presented challenges in sales force and partner training and product positioning. We believe this resulted in lower comparable revenues during the first half of fiscal year 2010 as many customers curtailed purchases and upgrades until we completed the integration of the Avaya and NES product portfolios. During the second half of fiscal year 2010, we completed the integration of the Avaya and NES product lines as we continued to execute our new product roadmap and launched a series of new products across our portfolio. For example, we released the Avaya Aura 6.0 platform for call control and session management, along with solutions in messaging, conferencing and presence services, delivering an integrated platform that supports voice, video and IM communications. We also released a new contact center solution suite including intelligent software routing, IP Office 7.0 and our new video portfolio consisting of the Avaya Flare Experience, the Avaya Desktop Video Device and the Avaya 1000 Series Video Conferencing system of endpoints for desktop and conference rooms.
Networking revenue for fiscal year 2010 was $280 million. Our data business was acquired as part of the acquisition of NES on December 18, 2009, which gave Avaya a modest position within the global data networking industry.
AGS revenue for fiscal year 2010 and 2009 was $2,463 million and $2,227 million, respectively. AGS revenue increased $236 million or 11% primarily due to incremental revenue from the NES business and the favorable impact of foreign currency. The increase in AGS revenues was partially offset by lower revenues due to customers reducing their spending by cancelling or reducing maintenance contract services, which we believe was in response to economic conditions. As we implemented the strategic decision to broaden our market coverage through the indirect channel, we incurred a loss of certain service agreements to channel partners. In addition, due to the decline in comparable product revenues, associated revenues for certain product support, implementation and professional services also declined.
The following table sets forth a comparison of revenue by location:
| Fiscal Year ended September 30, | ||||||||||||||||||||||||
| Mix | Yr. to Yr. Percent Change | Yr. to Yr. Percent Change, net of Foreign Currency Impact | ||||||||||||||||||||||
| 2010 | 2009 | 2010 | 2009 | |||||||||||||||||||||
| (dollars in millions) | ||||||||||||||||||||||||
U.S. | $ | 2,764 | $ | 2,276 | 55 | % | 55 | % | 21 | % | 21 | % | ||||||||||||
International: | ||||||||||||||||||||||||
Germany | 537 | 579 | 10 | % | 14 | % | -7 | % | -8 | % | ||||||||||||||
EMEA (excluding Germany) | 846 | 613 | 17 | % | 15 | % | 38 | % | 38 | % | ||||||||||||||
|
|
|
|
|
|
|
|
|
|
|
| |||||||||||||
Total EMEA | 1,383 | 1,192 | 27 | % | 29 | % | 16 | % | 16 | % | ||||||||||||||
APAC—Asia Pacific | 464 | 350 | 9 | % | 8 | % | 33 | % | 29 | % | ||||||||||||||
Americas International—Canada and Central and Latin America | 449 | 332 | 9 | % | 8 | % | 35 | % | 29 | % | ||||||||||||||
|
|
|
|
|
|
|
|
|
|
|
| |||||||||||||
Total International | 2,296 | 1,874 | 45 | % | 45 | % | 23 | % | 20 | % | ||||||||||||||
|
|
|
|
|
|
|
|
|
|
|
| |||||||||||||
Total revenue | $ | 5,060 | $ | 4,150 | 100 | % | 100 | % | 22 | % | 21 | % | ||||||||||||
|
|
|
|
|
|
|
|
|
|
|
| |||||||||||||
Revenue in the U.S. for fiscal year 2010 and 2009 was $2,764 million and $2,276 million, respectively. Revenue in the U.S. increased $488 million or 21% primarily due to incremental revenue from the NES business partially offset by a decline in services revenue due to customers cancelling or renegotiating maintenance contracts, a decrease in demand as a result of the global economy and cautious spending by our customers, as well as the curtailment of purchases and upgrades by many customers while the Company completed its consolidation of the NES and Avaya product lines. Revenue in EMEA for fiscal year 2010 and 2009 was
68
Table of Contents
$1,383 million and $1,192 million, respectively. Revenue in EMEA increased $191 million or 16% primarily as a result of incremental revenue from the NES business and the impact of foreign currency. The increase was partially offset by decreases attributable to the exiting of lower-margin product and service offerings and weakness in the European economy. Excluding the impacts of the incremental revenue from the NES business and foreign currency, revenues in APAC increased slightly, while revenues in Central and Latin America, or CALA, decreased slightly.
We continue to expand our market coverage by investing more in the indirect channel through our partners worldwide, including system integrators, service providers, value-added resellers and business partners that provide sales and service support. The following table sets forth a comparison of revenue from sales of products by channel:
| Year ended September 30, | ||||||||||||||||||||||||
| Percent of Product Revenue | Yr. to Yr. Percent Change | Yr. to Yr. Percent Change, net of Foreign Currency Impact | ||||||||||||||||||||||
| 2010 | 2009 | 2010 | 2009 | |||||||||||||||||||||
| (dollars in millions) | ||||||||||||||||||||||||
Direct | $ | 763 | $ | 900 | 29 | % | 47 | % | -15 | % | -17 | % | ||||||||||||
Indirect | 1,839 | 1,023 | 71 | % | 53 | % | 80 | % | 79 | % | ||||||||||||||
|
|
|
|
|
|
|
|
|
|
|
| |||||||||||||
Total sales of products | $ | 2,602 | $ | 1,923 | 100 | % | 100 | % | 35 | % | 34 | % | ||||||||||||
|
|
|
|
|
|
|
|
|
|
|
| |||||||||||||
The percentage of product sales through the indirect channel increased by 18 percentage points to 71% in fiscal year 2010 as compared to 53% in fiscal year 2009. The increase was predominantly attributable to the incremental product sales from the NES business, which, prior to the acquisition of NES, were substantially generated through the indirect channel. Excluding the impact of NES, the percentage of product sales through the indirect channel also increased for fiscal year 2010 as compared to fiscal year 2009. As a result of higher volume discounts, sales through the indirect channel generally generate lower margins than direct sales. Avaya’s use of the indirect channel lowers selling expenses and allows us to reach more end users.
Gross Margin
The following table sets forth a comparison of gross margin by segment:
| Fiscal year ended September 30, | ||||||||||||||||||||||||
| Percent of Revenue | ||||||||||||||||||||||||
| 2010 | 2009 | 2010 | 2009 | Change | ||||||||||||||||||||
| (dollars in millions) | ||||||||||||||||||||||||
GCS margin | $ | 1,249 | $ | 1,066 | 53.6 | % | 55.0 | % | $ | 183 | 17 | % | ||||||||||||
Networking margin | 117 | — | 41.8 | % | (1) | 117 | (1) | |||||||||||||||||
AGS margin | 1,119 | 1,065 | 45.4 | % | 47.8 | % | 54 | 5 | % | |||||||||||||||
Amortization of technology intangible assets and the impact of purchase accounting adjustments | (313 | ) | (265 | ) | (1) | (1) | (48 | ) | (1) | |||||||||||||||
|
|
|
|
|
|
|
|
|
|
|
| |||||||||||||
Total gross margin | $ | 2,172 | $ | 1,866 | 42.9 | % | 45.0 | % | $ | 306 | 16 | % | ||||||||||||
|
|
|
|
|
|
|
|
|
|
|
| |||||||||||||
| (1) | Not meaningful. |
Gross margin for fiscal year 2010 and 2009 was $2,172 million and $1,866 million, respectively. Gross margin increased by $306 million or 16% primarily due to the incremental margin from the NES business and the favorable impact of foreign currency.
GCS gross margin for fiscal year 2010 and 2009 was $1,249 million and $1,066 million, respectively. GCS gross margin increased $183 million or 17% primarily due to incremental margin provided by the NES business and the favorable impact of foreign currency. The increase in gross margin was partially offset by the decline in
69
Table of Contents
sales volume and pricing in the U.S. and EMEA. The GCS gross margin percentage decreased to 53.6% for fiscal year 2010 from 55.0% for fiscal year 2009. The decrease in gross margin percentage is primarily due to the lower gross margin percentage of the NES business.
Networking gross margin for fiscal year 2010 was $117 million with a gross margin percentage of 41.8%. We acquired our data business as part of the acquisition of NES on December 18, 2009.
AGS gross margin for fiscal year 2010 and 2009 was $1,119 million and $1,065 million, respectively. AGS gross margin increased $54 million or 5% primarily due to incremental margin provided by the NES business and the favorable impact of foreign currency. The AGS gross margin percentage decreased to 45.4% for fiscal year 2010 from 47.8% for fiscal year 2009. The decrease in gross margin percentage is primarily due to the lower gross margin percentage of the NES business.
Total gross margin for fiscal year 2010 and 2009 included the effect of certain acquisition adjustments including the amortization of acquired technology intangibles and the amortization of the inventory step-up related to the acquisition of NES and the Merger.
Operating expenses
The following table sets forth a comparison of operating expenses:
| Fiscal year ended September 30, | ||||||||||||||||||||||||
| Percent of Revenue | ||||||||||||||||||||||||
| 2010 | 2009 | 2010 | 2009 | Change | ||||||||||||||||||||
| (dollars in millions) | ||||||||||||||||||||||||
Selling, general and administrative | $ | 1,721 | $ | 1,272 | 34.0 | % | 30.7 | % | $ | 449 | 35 | % | ||||||||||||
Research and development | 407 | 309 | 8.0 | % | 7.4 | % | 98 | 32 | % | |||||||||||||||
Amortization of intangible assets | 218 | 207 | 4.3 | % | 5.0 | % | 11 | 5 | % | |||||||||||||||
Impairment of long-lived assets | 16 | 2 | 0.3 | % | 0.0 | % | 14 | 700 | % | |||||||||||||||
Impairment of indefinite-lived intangible assets | — | 60 | 0.0 | % | 1.4 | % | (60 | ) | -100 | % | ||||||||||||||
Goodwill impairment | — | 235 | 0.0 | % | 5.7 | % | (235 | ) | -100 | % | ||||||||||||||
Restructuring charges, net | 171 | 160 | 3.4 | % | 3.9 | % | 11 | 7 | % | |||||||||||||||
In-process research and development charge | — | 12 | 0.0 | % | 0.3 | % | (12 | ) | -100 | % | ||||||||||||||
Acquisition-related costs | 20 | 29 | 0.4 | % | 0.7 | % | (9 | ) | -31 | % | ||||||||||||||
|
|
|
|
|
|
|
|
|
|
|
| |||||||||||||
Total operating expenses | $ | 2,553 | $ | 2,286 | 50.4 | % | 55.1 | % | $ | 267 | 12 | % | ||||||||||||
|
|
|
|
|
|
|
|
|
|
|
| |||||||||||||
SG&A expenses for fiscal year 2010 and 2009 were $1,721 million and $1,272 million, respectively, an increase of $449 million. The increase was due to incremental SG&A expenses arising as a result of operating the acquired NES business, as well as integration-related costs included in SG&A of $154 million for fiscal year 2010 and an unfavorable foreign currency impact. Integration-related costs primarily represent third-party consulting fees and other administrative costs associated with consolidating and coordinating the operations of Avaya and NES. These costs were incurred in connection with, among other things, the on-boarding of NES personnel, developing compatible IT systems and internal processes and developing and implementing a strategic operating plan to help enable a smooth transition with minimal disruption to NES customers. Such costs also include fees paid to certain Nortel-controlled entities for logistics and other support functions being performed on a temporary basis pursuant to a transition services agreement. These costs were partially offset by the continued benefit from cost savings initiatives.
R&D expenses for fiscal year 2010 and 2009 were $407 million and $309 million, respectively, an increase of $98 million. The increase was due to incremental R&D expenses incurred by the NES business and an unfavorable foreign currency impact. The increase was partially offset by reductions resulting from continued focus on cost saving initiatives and the re-prioritization of projects.
70
Table of Contents
Amortization of intangible assets for fiscal year 2010 and 2009 was $218 million and $207 million, respectively, an increase of $11 million. The increase was due to amortization related to intangible assets acquired in connection with the acquisition of NES.
Our acquisition of NES provided us with access to several proprietary technologies that previously were not available to Avaya. Some of these technologies, based on their functionality, overlapped with our pre-existing technologies. In order to realize synergies and reduce our expenditures on research and development and marketing, the number of technologies Avaya supported was reduced. As a result, we identified certain technologies associated with our products segment that were redundant to others which Avaya no longer aggressively developed and marketed. The Company recorded an impairment charge of $16 million in the three months ended December 31, 2009 associated with these technologies. During fiscal year 2009, we also recognized an impairment loss of $2 million relating to capitalized software. Based on our analysis, we determined that this asset had no future use to the Company.
During the second quarter of fiscal year 2009, we recognized impairment losses associated with our indefinite-lived intangible assets of $60 million and goodwill of $235 million. During the three months ended March 31, 2009, the global economic downturn experienced during 2008 continued and negatively affected most of our markets beyond the Company’s expectations utilized in its annual testing of goodwill at September 30, 2008. Several of the Company’s customers and competitors had reduced their financial outlooks or disclosed that they were experiencing very challenging market conditions with little visibility of a rebound. As a result we had seen indications that enterprises were not willing to spend on enterprise communications technology, and the rate of revenue growth we experienced in previous years was not expected to resume in the near term. Our product revenues for the six months ended March 31, 2009 were down 25% when compared to the same period of the prior year. Cutbacks in spending, access to credit, employment variability, corporate profit growth, interest rates, energy prices, and other factors in specific markets were expected to further impact corporate willingness to spend on communications technology in the near term. In March 2009, in response to these adverse business indicators and the rapidly declining revenue trends experienced during the second quarter of our 2009 fiscal year, we reduced our near-term and long-term revenue projections. As a result of the deteriorating business climate during the second quarter of fiscal year 2009, we determined that our long-lived assets and goodwill should be tested for potential impairment.
We performed step one of the impairment test of long-lived assets included in our reporting units and determined that the net book values of each of our reporting units were recoverable. We also tested our indefinite-lived intangible assets for impairment and determined that, as a result of the lower revenue projections and higher discount rates, the carrying values of our tradenames and trademarks exceeded their estimated fair values. Accordingly, we recorded an impairment charge of $60 million to reflect such intangible assets at their estimated fair values.
We also performed an analysis of goodwill for impairment. Based on our performance of step one of the goodwill impairment test, we determined that the net book value of two of our GCS reporting units exceeded their estimated fair values. Based on the second step of the goodwill impairment test, we determined that the book value of goodwill of one of the two reporting units exceeded its implied fair value. Accordingly, we wrote down the goodwill balance by $235 million as of March 31, 2009 in order to state the goodwill balance of that reporting unit at its implied fair value. The reduced valuation of the affected reporting unit reflects the additional market risks, higher discount rates and the lower sales forecasts for the Company’s GCS product lines consistent with economic trends at that time. Specifically, the valuations at March 31, 2009 and September 30, 2008, were prepared assuming, among other things, discount rates of 14% and 13% and long-term growth rates of 3% and 3%, respectively. These key assumptions, along with other assumptions for lower short-term revenue growth rates, increased restructuring charges and changes in other operating costs and expenses resulted in lower estimated values for our reporting units. Although we did not identify a specific timetable for the full recovery of the economy within our forecasts, we provided for lower short-term growth and projected revenue growth to normalize over time. The adverse effect of these changes in assumptions was further compounded for the
71
Table of Contents
remainder of fiscal year 2009 and beyond, as the growth rate assumptions were applied to our actual results through March 31, 2009, which were below the levels estimated in September 2008. We do not believe that our historical results, which were impacted by the downturn in the global economy, are indicative of our future operating results.
Upon classification of the AGC business, which represents a portion of certain GCS and AGS reporting units, as held for sale, the Company tested the goodwill remaining in the portion of the reporting units to be retained for impairment in accordance with the authoritative guidance. Based on this goodwill impairment test, the Company determined that the respective book values for these reporting units did not exceed their estimated fair values and that it was not necessary to record impairment charges. Excluding the AGC transaction, which requires that goodwill be tested for impairment, the Company determined that no events occurred or circumstances changed during fiscal year 2010 that would indicate that the fair value of a reporting unit may be below its carrying amount.
At September 30, 2010 and 2009, the Company performed its annual test of recoverability of indefinite-lived intangible assets and its annual goodwill impairment test. The Company determined that the respective book values of the Company’s reporting units did not exceed their estimated fair values and therefore no impairment existed. However, if market conditions continue to deteriorate, or if we are unable to execute on our cost reduction efforts and other strategies, it may be necessary to record additional impairment charges in the future. See Note 5, “Goodwill,” and Note 6, “Intangible Assets,” to our consolidated financial statements included elsewhere in this prospectus.
Restructuring charges, net for fiscal year 2010 and 2009 were $171 million and $160 million, respectively, an increase of $11 million. During fiscal year 2010, we continued our focus on controlling costs. In response to the global economic climate and in anticipation of the acquisition of NES, we began implementing additional initiatives designed to streamline our operations, generate cost savings and eliminate overlapping processes and expenses associated with the NES business. These initiatives include exiting facilities and reducing the workforce or relocating positions to lower cost geographies. Restructuring charges recorded during fiscal year 2010 include employee separation costs primarily associated with involuntary employee severance actions in EMEA and the U.S. As the Company continues to evaluate its cost structure, additional restructuring opportunities may be identified.
As fully discussed in Note 4, “Business Combinations and Other Transactions,” to our consolidated financial statements, as a result of our acquisition of Adomo, Inc., or Adomo, a developer of unified messaging solutions, the Company recognized IPRD charges in fiscal year 2009 of $12 million. IPRD represents certain technologies expected to enhance the Company’s products when completed in future years and were recorded in purchase accounting of the acquisition of Adomo at their estimated fair values. At the time of the acquisition of Adomo and the Merger, these technologies were in the initial development stages and did not meet the technological feasibility standard necessary for capitalization. Accordingly, these amounts were charged to the Consolidated Statement of Operations at the date of the acquisition of Adomo and completion of the Merger.
Acquisition-related costs for fiscal year 2010 and 2009 were $20 million and $29 million, respectively and include legal and other costs related to the acquisition of NES.
Operating Loss
Our operating loss for fiscal year 2010 was $381 million compared to $420 million for fiscal year 2009, a decrease of $39 million.
For the period December 19, 2009 through September 30, 2010, results include the impact of the unfavorable operating results from the acquisition of NES, which includes the effect of certain acquisition adjustments and the amortization of acquired technology and customer intangibles. In addition, we incurred
72
Table of Contents
integration costs (included in SG&A and elsewhere) of $208 million, restructuring charges that were $11 million higher for fiscal year 2010 as compared to fiscal year 2009 and an impairment of $16 million to our long-lived assets, as described above. For fiscal year 2009, results included the impact of the impairment of goodwill and indefinite-lived intangible assets of $235 million and $60 million, respectively,
Our operating loss for fiscal years 2010 and 2009 includes non-cash expenses for depreciation and amortization of $691 million and $652 million and share-based compensation of $19 million and $10 million, respectively.
Interest Expense
Interest expense for fiscal year 2010 and 2009 was $487 million and $409 million, which includes non-cash interest expense of $105 million and $57 million, respectively. Non-cash interest expense for fiscal year 2010 includes (1) amortization of debt issuance costs, (2) accretion of debt discount attributable to Avaya Inc.’s incremental term B-2 loans issued in connection with the acquisition of NES and (3) PIK interest for the period of October 1, 2009 through April 30, 2010 which we elected to finance through Avaya Inc.’s senior unsecured PIK toggle notes. Non-cash interest expense for fiscal year 2009 represents (1) amortization of debt issuance costs and (2) PIK interest for the period of May 1, 2009 through September 30, 2009 which we elected to finance through Avaya Inc.’s senior unsecured PIK toggle notes.
Cash interest expense for fiscal year 2010 increased as a result of cash interest expense associated with Avaya Inc’s senior secured incremental term B-2 loans issued in connection with the acquisition of NES. This increase was partially offset by decreased cash interest expense as a result of lower interest rates combined with the expiration of certain interest rate swap contracts associated with Avaya Inc.’s term B-1 loans under the senior secured credit facility issued in connection with the Merger, combined with the fact that the Company elected to pay in kind interest on Avaya Inc.’s senior unsecured PIK toggles notes for a longer period during 2010.
Other Income, Net
Other income, net for fiscal year 2010 was $15 million as compared to $14 million for fiscal year 2009. Net foreign currency transaction losses were $1 million for fiscal year 2010 as compared to a net gain of $8 million for fiscal year 2009. Interest income was $5 million and $6 million for fiscal year 2010 and 2009, respectively. The decrease in net foreign currency transaction gains and losses is consistent with the weakening of the U.S. dollar during fiscal year 2010 and its negative impact on certain foreign currency hedges. The decrease in interest income for fiscal year 2010 is due to a decrease in interest rates earned on cash balances compared to fiscal year 2009. Also included in fiscal year 2010 is a $7 million gain on our divestiture of AGC.
Provision for Income Taxes
The provision for income taxes was $18 million and $30 million for fiscal year 2010 and 2009, respectively. The effective tax rate for fiscal year 2010 and 2009 was 2.1% and 3.7%, respectively. The rates differ from the U.S. Federal tax rate primarily due to the effect of taxable income in non-U.S. jurisdictions and due to the valuation allowance established against our U.S. deferred tax assets.
Non-GAAP Financial Measures and Supplemental Disclosure
EBITDA and Adjusted EBITDA
EBITDA is defined as net income (loss) before income taxes, interest and depreciation and amortization. EBITDA provides us with a measure of operating performance that excludes items that are outside the control of management, which can differ significantly from company to company depending on capital structure, the tax jurisdictions in which companies operate and capital investments. Under Avaya Inc.’s debt agreements, its ability to draw on its revolving credit facilities or engage in activities such as incurring additional indebtedness, making
73
Table of Contents
investments and paying dividends is tied in part to ratios based on Adjusted EBITDA. As defined in Avaya Inc.’s debt agreements, Adjusted EBITDA is a non-GAAP measure of EBITDA further adjusted to exclude certain charges and other adjustments permitted in calculating covenant compliance under Avaya Inc.’s debt agreements. We believe that including supplementary information concerning Adjusted EBITDA is appropriate to provide additional information to investors to demonstrate compliance with Avaya Inc.’s debt agreements and because it serves as a basis for determining management compensation. In addition, we believe Adjusted EBITDA provides more comparability between our historical results and results that reflect purchase accounting and our new capital structure following the Merger. Accordingly, Adjusted EBITDA measures our financial performance based on operational factors that management can impact in the short-term, namely the Company’s pricing strategies, volume, costs and expenses of the organization.
EBITDA and Adjusted EBITDA have limitations as analytical tools. Adjusted EBITDA does not represent net income (loss) or cash flow from operations as those terms are defined by GAAP and does not necessarily indicate whether cash flows will be sufficient to fund cash needs. While Adjusted EBITDA and similar measures are frequently used as measures of operations and the ability to meet debt service requirements, these terms are not necessarily comparable to other similarly titled captions of other companies due to the potential inconsistencies in the method of calculation. Adjusted EBITDA does not reflect the impact of earnings or charges resulting from matters that we consider not to be indicative of our ongoing operations. In particular, the definition of Adjusted EBITDA in Avaya Inc.’s debt agreements allows us to add back certain non-cash charges that are deducted in calculating net income (loss). Avaya Inc.’s debt agreements also allow us to add back restructuring charges, Sponsor monitoring fees and other specific cash costs and expenses as defined in the agreements and that portion of our pension costs, other post-employment benefit costs, and non-retirement post-employment benefit costs representing the amortization of prior service costs and net actuarial gains/losses associated with these employment benefits. However, these are expenses that may recur, may vary and are difficult to predict. Further, Avaya Inc.’s debt agreements require that Adjusted EBITDA be calculated for the most recent four fiscal quarters. As a result, the measure can be disproportionately affected by a particularly strong or weak quarter. Further, it may not be comparable to the measure for any subsequent four-quarter period or any complete fiscal year.
74
Table of Contents
The unaudited reconciliation of net loss, which is a GAAP measure, to EBITDA and Adjusted EBITDA is presented below:
| Fiscal years ended September 30, | ||||||||||||
| 2011 | 2010 | 2009 | ||||||||||
| (in millions) | ||||||||||||
Net loss | $ | (863 | ) | $ | (871 | ) | $ | (845 | ) | |||
Interest expense | 460 | 487 | 409 | |||||||||
Interest income | (5 | ) | (5 | ) | (6 | ) | ||||||
Income tax expense | 68 | 18 | 30 | |||||||||
Depreciation and amortization | 653 | 691 | 652 | |||||||||
|
|
|
|
|
| |||||||
EBITDA | 313 | 320 | 240 | |||||||||
Impact of purchase accounting adjustments(a) | — | 5 | (1 | ) | ||||||||
Restructuring charges, net | 189 | 171 | 160 | |||||||||
Sponsors’ fees(b) | 7 | 7 | 7 | |||||||||
Acquisition-related costs(c) | 5 | 20 | 29 | |||||||||
Integration-related costs(d) | 132 | 208 | 5 | |||||||||
Debt registration fees | — | 1 | — | |||||||||
Loss on extinguishment of debt(e) | 246 | — | — | |||||||||
Third-party fees expensed in connection with the debt modification(f) | 9 | — | — | |||||||||
Strategic initiative costs(g) | — | 6 | 21 | |||||||||
Non-cash share-based compensation | 12 | 19 | 10 | |||||||||
Write-down of assets held for sale to net realizable value | 1 | — | — | |||||||||
Loss (gain) on sale of long-lived assets | 1 | (4 | ) | 1 | ||||||||
Impairment of long-lived assets | — | 16 | 62 | |||||||||
Goodwill impairment | — | — | 235 | |||||||||
Net income of unrestricted subsidiaries, net of dividends received | — | (6 | ) | (4 | ) | |||||||
(Gain) loss on foreign currency transactions | (12 | ) | 1 | (8 | ) | |||||||
Pension/OPEB/nonretirement postemployment benefits and long-term disability costs(h) | 68 | 31 | (4 | ) | ||||||||
|
|
|
|
|
| |||||||
Adjusted EBITDA | $ | 971 | $ | 795 | $ | 753 | ||||||
|
|
|
|
|
| |||||||
| (a) | For fiscal years 2011 and 2010, represents adjustments to eliminate the impact of certain purchase accounting adjustments recorded as a result of the acquisitions of NES and Konftel and the Merger, including the recognition of the amortization of business partner commissions, which were eliminated in purchase accounting, the recognition of revenue and costs that were deferred in prior periods and eliminated in purchase accounting and the elimination of the impact of estimated fair value adjustments for certain assets and liabilities, such as inventory. For fiscal year 2009, represents the recognition of the amortization of business partner commissions which were eliminated in purchase accounting, partially offset by the recognition of revenues and costs that were deferred in prior years and eliminated in purchase accounting as a result of the Merger. |
| (b) | Sponsors’ fees represent monitoring fees payable to affiliates of the Sponsors pursuant to a management services agreement entered into at the time of the Merger. See “Certain Relationships and Related Party Transactions.” |
| (c) | Acquisition-related costs include legal and other costs related to the acquisition of NES and other acquisitions. |
| (d) | Integration-related costs primarily represent third-party consulting fees and other administrative costs associated with consolidating and coordinating the operations of Avaya and NES. These costs were incurred in connection with, among other things, the on-boarding of NES personnel, developing compatible IT systems and internal processes and developing and implementing a strategic operating plan to help enable a smooth transition with minimal disruption to NES customers. Integration-related costs also include fees paid to certain Nortel-controlled entities for logistics and other support functions being performed on a temporary basis pursuant to a transition services agreement. |
75
Table of Contents
| (e) | Loss on extinguishment of debt represents the loss recognized in connection with the payment in full of the senior secured incremental term B-2 loans. The loss is based on the difference between the reacquisition price and the carrying value of the senior secured incremental term B-2 loans. See Note 9, “Financing Arrangements,” to our consolidated financial statements located elsewhere in this prospectus. |
| (f) | The third-party fees expensed in connection with debt modification represent fees paid to third parties in connection with the modification of the senior secured credit facility. See Note 9, “Financing Arrangements,” to our consolidated financial statements located elsewhere in this prospectus. |
| (g) | Strategic initiative costs represent consulting fees in connection with management’s cost-savings actions, which commenced subsequent to the Merger. |
| (h) | Represents that portion of our pension costs, other post-employment benefit costs, non-retirement post-employment benefit costs representing the amortization of prior service costs and net actuarial gains/losses associated with these employment benefits. For the fiscal year ended September 30, 2011, the amount includes a curtailment charge of $7 million associated with workforce reductions in Germany. |
76
Table of Contents
Supplemental Quarterly Financial Information
Our quarterly revenues and other financial measures have varied in the past and can be expected to vary in the future due to numerous factors, including modest seasonality related to the structure of our incentive compensation plan, which has been based on annual targets rather than quarterly targets, and customer budget cycles generally resulting in higher revenue in the fourth fiscal quarter relative to other quarters. The following table sets forth our unaudited (a) revenue, (b) gross margin and (c) reconciliations of net loss to EBITDA and Adjusted EBITDA for each of the twelve quarters ended September 30, 2011. Operating results for these periods are not necessarily indicative of the operating results for a full year or of the results expected in future periods. You should read this data together with our consolidated financial statements and the related notes included elsewhere in this prospectus.
| Three Months Ended | ||||||||||||||||||||||||||||||||||||||||||||||||
| September 30, 2011 | June 30, 2011 | March 31, 2011 | December 30, 2010 | September 30, 2010 | June 30, 2010 | March 31, 2010 | December 31, 2009 | September 30, 2009 | June 30, 2009 | March 31, 2009 | December 31, 2008 | |||||||||||||||||||||||||||||||||||||
(in millions) | ||||||||||||||||||||||||||||||||||||||||||||||||
Revenue | ||||||||||||||||||||||||||||||||||||||||||||||||
Products | $ | 768 | $ | 729 | $ | 757 | $ | 722 | $ | 709 | $ | 700 | $ | 680 | $ | 513 | $ | 502 | $ | 437 | $ | 452 | $ | 532 | ||||||||||||||||||||||||
Services | 651 | 643 | 633 | 644 | 639 | 632 | 640 | 547 | 549 | 549 | 548 | 581 | ||||||||||||||||||||||||||||||||||||
|
|
|
|
|
|
|
|
|
|
|
|
|
|
|
|
|
|
|
|
|
|
|
| |||||||||||||||||||||||||
| 1,419 | 1,372 | 1,390 | 1,366 | 1,348 | 1,332 | 1,320 | 1,060 | 1,051 | 986 | 1,000 | 1,113 | |||||||||||||||||||||||||||||||||||||
|
|
|
|
|
|
|
|
|
|
|
|
|
|
|
|
|
|
|
|
|
|
|
| |||||||||||||||||||||||||
Costs | ||||||||||||||||||||||||||||||||||||||||||||||||
Products | ||||||||||||||||||||||||||||||||||||||||||||||||
Costs | 320 | 319 | 343 | 332 | 346 | 349 | 325 | 223 | 228 | 207 | 203 | 234 | ||||||||||||||||||||||||||||||||||||
Amortization of technology intangible assets | 59 | 65 | 66 | 67 | 70 | 79 | 83 | 59 | 62 | 62 | 62 | 62 | ||||||||||||||||||||||||||||||||||||
Services | 322 | 335 | 339 | 348 | 361 | 349 | 376 | 268 | 278 | 278 | 292 | 316 | ||||||||||||||||||||||||||||||||||||
|
|
|
|
|
|
|
|
|
|
|
|
|
|
|
|
|
|
|
|
|
|
|
| |||||||||||||||||||||||||
| 701 | 719 | 748 | 747 | 777 | 777 | 784 | 550 | 568 | 547 | 557 | 612 | |||||||||||||||||||||||||||||||||||||
|
|
|
|
|
|
|
|
|
|
|
|
|
|
|
|
|
|
|
|
|
|
|
| |||||||||||||||||||||||||
Gross Margin | $ | 718 | $ | 653 | $ | 642 | $ | 619 | $ | 571 | $ | 555 | $ | 536 | $ | 510 | $ | 483 | $ | 439 | $ | 443 | $ | 501 | ||||||||||||||||||||||||
|
|
|
|
|
|
|
|
|
|
|
|
|
|
|
|
|
|
|
|
|
|
|
| |||||||||||||||||||||||||
Reconciliation of Adjusted EBITDA | ||||||||||||||||||||||||||||||||||||||||||||||||
Net loss | $ | (99 | ) | $ | (152 | ) | $ | (432 | ) | $ | (180 | ) | $ | (214 | ) | $ | (240 | ) | $ | (281 | ) | $ | (136 | ) | $ | (130 | ) | $ | (224 | ) | $ | (401 | ) | $ | (90 | ) | ||||||||||||
Interest expense | 109 | 111 | 113 | 127 | 131 | 127 | 127 | 102 | 103 | 101 | 101 | 104 | ||||||||||||||||||||||||||||||||||||
Interest income | (2 | ) | (1 | ) | (1 | ) | (1 | ) | (1 | ) | (1 | ) | (1 | ) | (2 | ) | (1 | ) | — | (2 | ) | (3 | ) | |||||||||||||||||||||||||
Income tax expense (benefit) | 79 | (52 | ) | 19 | 22 | 25 | 9 | (19 | ) | 3 | 35 | 11 | (17 | ) | 1 | |||||||||||||||||||||||||||||||||
Depreciation and amortization | 155 | 163 | 167 | 168 | 173 | 176 | 185 | 157 | 169 | 162 | 160 | 161 | ||||||||||||||||||||||||||||||||||||
|
|
|
|
|
|
|
|
|
|
|
|
|
|
|
|
|
|
|
|
|
|
|
| |||||||||||||||||||||||||
EBITDA | 242 | 69 | (134 | ) | 136 | 114 | 71 | 11 | 124 | 176 | 50 | (159 | ) | 173 | ||||||||||||||||||||||||||||||||||
Impact of purchase accounting adjustments | 2 | — | (1 | ) | (1 | ) | 1 | 2 | 3 | (1 | ) | 7 | (3 | ) | (3 | ) | (2 | ) | ||||||||||||||||||||||||||||||
Restructuring charges, net | 23 | 102 | 42 | 22 | 37 | 51 | 68 | 15 | (5 | ) | 114 | 33 | 18 | |||||||||||||||||||||||||||||||||||
Sponsors’ fees | 2 | 1 | 2 | 2 | 1 | 2 | 2 | 2 | 2 | 2 | 3 | — | ||||||||||||||||||||||||||||||||||||
Acquisition-related costs | 1 | — | — | 4 | — | 1 | 2 | 17 | 29 | — | — | — | ||||||||||||||||||||||||||||||||||||
Integration-related costs | 10 | 35 | 39 | 48 | 61 | 64 | 59 | 24 | 5 | — | — | — | ||||||||||||||||||||||||||||||||||||
Debt registration fees | — | — | — | — | — | — | 1 | — | — | — | — | — | ||||||||||||||||||||||||||||||||||||
Loss on extinguishment of debt | — | — | 246 | — | — | — | — | — | — | — | — | — | ||||||||||||||||||||||||||||||||||||
Third-party fees expensed in connection with the debt modification | — | — | 9 | — | — | — | — | — | — | — | — | — | ||||||||||||||||||||||||||||||||||||
Strategic initiative costs | — | — | — | — | 2 | — | 1 | 3 | 4 | 10 | 2 | 5 | ||||||||||||||||||||||||||||||||||||
Non-cash share-based compensation | 3 | 3 | 3 | 3 | 4 | 4 | 4 | 7 | 4 | 1 | 1 | 4 | ||||||||||||||||||||||||||||||||||||
Write-down of held for sale assets to net realizable value | — | — | — | 1 | — | — | — | — | — | — | — | — | ||||||||||||||||||||||||||||||||||||
Loss (gain) on sale of long-lived assets | — | 2 | (1 | ) | — | (4 | ) | — | 1 | (1 | ) | (1 | ) | 2 | — | — | ||||||||||||||||||||||||||||||||
Impairment of long-lived assets | — | — | — | — | — | — | — | 16 | — | — | 60 | 2 | ||||||||||||||||||||||||||||||||||||
Goodwill impairment | — | — | — | — | — | — | — | — | — | — | 235 | — | ||||||||||||||||||||||||||||||||||||
Net income of unrestricted subsidiaries, net of dividends received | — | — | — | — | (1 | ) | (1 | ) | (2 | ) | (2 | ) | (2 | ) | (2 | ) | — | — | ||||||||||||||||||||||||||||||
(Gain) loss on foreign currency transactions | (5 | ) | 2 | (1 | ) | (8 | ) | 3 | — | (1 | ) | (1 | ) | (3 | ) | 4 | — | (9 | ) | |||||||||||||||||||||||||||||
Pension/OPEB/nonretirement postemployment benefits and long-term disability costs | 15 | 22 | 16 | 15 | 8 | 8 | 8 | 7 | (1 | ) | (1 | ) | (1 | ) | (1 | ) | ||||||||||||||||||||||||||||||||
|
|
|
|
|
|
|
|
|
|
|
|
|
|
|
|
|
|
|
|
|
|
|
| |||||||||||||||||||||||||
Adjusted EBITDA(a) | $ | 293 | $ | 236 | $ | 220 | $ | 222 | $ | 226 | $ | 202 | $ | 157 | $ | 210 | $ | 215 | $ | 177 | $ | 171 | $ | 190 | ||||||||||||||||||||||||
|
|
|
|
|
|
|
|
|
|
|
|
|
|
|
|
|
|
|
|
|
|
|
| |||||||||||||||||||||||||
77
Table of Contents
| (a) | For a description of the components of EBITDA and Adjusted EBITDA, see footnotes to “Non-GAAP Financial Measures and Supplemental Disclosure” located elsewhere in this prospectus. |
Liquidity and Capital Resources
Our existing cash balance generated by operations and borrowings available under our credit facilities are our primary sources of short-term liquidity. Based on our current level of operations, we believe these sources will be adequate to meet our liquidity needs for the next several years. As part of our analysis, we have assessed the implications of the recent financial events on our current business and determined that these market conditions have not resulted in an inability to meet our obligations as they come due in the ordinary course of business and have not had a significant impact on our liquidity as of September 30, 2011. However, we cannot assure you that our business will generate sufficient cash flow from operations or that future borrowings will be available to us under our credit facilities in an amount sufficient to enable us to repay our indebtedness, or to fund our other liquidity needs. See “—Contractual Obligations and Sources of Liquidity—Credit Facilities.”
Sources and Uses of Cash
The following table provides the condensed statements of cash flows for the periods indicated:
| Fiscal Year ended September 30, | ||||||||||||
| 2011 | 2010 | 2009 | ||||||||||
| (in millions) | ||||||||||||
Net cash provided by (used for): | ||||||||||||
Net loss | $ | (863 | ) | $ | (871 | ) | $ | (845 | ) | |||
Adjustments to net loss for non-cash items | 630 | 880 | 976 | |||||||||
Changes in operating assets and liabilities | (67 | ) | 33 | 111 | ||||||||
|
|
|
|
|
| |||||||
Operating activities | (300 | ) | 42 | 242 | ||||||||
Investing activities | (101 | ) | (864 | ) | (155 | ) | ||||||
Financing activities | 228 | 853 | (101 | ) | ||||||||
Effect of exchange rate changes on cash and cash equivalents | (6 | ) | (19 | ) | 2 | |||||||
|
|
|
|
|
| |||||||
Net (decrease) increase in cash and cash equivalents | (179 | ) | 12 | (12 | ) | |||||||
Cash and cash equivalents at beginning of period | 594 | 582 | 594 | |||||||||
|
|
|
|
|
| |||||||
Cash and cash equivalents at end of period | $ | 415 | $ | 594 | $ | 582 | ||||||
|
|
|
|
|
| |||||||
Operating Activities
Cash used for operating activities was $300 million for fiscal year 2011 as compared to cash provided by operating activities of $42 million for fiscal year 2010. The change in cash used for operating activities for fiscal year 2011 as compared to fiscal year 2010 was primarily due to the payment of the discount upon redemption of the incremental term B-2 loans of $291 million combined with higher cash interest expense and changes in operating assets and liabilities in 2011. These increases in cash flow used by operating activities were partially offset by lower operating losses for fiscal year 2011 when compared to the fiscal year 2010.
The changes in our operating assets and liabilities resulted in a net decrease in cash and cash equivalents of $67 million for fiscal year 2011. The net decrease in operating assets and liabilities was primarily driven by a decrease in foreign exchange contracts due to the settlement and changes in exchange rates associated with these contracts, an increase in inventory and a decrease in payroll and benefit obligations. These decreases in operating assets and liabilities were partially offset by the increase in accrued interest as a result of the issuance of the senior secured notes and repayment of the senior secured incremental term B-2 loans, which resulted in a change in the timing of when our interest payments are due. These decreases in operating assets and liabilities were also
78
Table of Contents
partially offset by managing the timing of our payments to vendors, improvements in the collections of our accounts receivable, and the effects of non-cash business restructuring reserves net of cash payments against our reserves.
The change in operating assets and liabilities of $33 million in fiscal year 2010 was due to increases in accounts payable and deferred revenues partially offset by increases in accounts receivable and deferred costs and payments made in connection with our restructuring activities. Payments related to restructuring charges were $39 million, net of restructuring charges related to the acquisition of NES.
The change in operating assets and liabilities of $111 million in fiscal year 2009 was primarily due to continued improvements in the collection of accounts receivable and reduction in inventories which were partially offset by payments associated with our fiscal year 2008 annual cash bonus program under our STIP, which was paid in the first quarter of 2009, the payments made in connection with our restructuring activities and a reduction in our accounts payable balance.
Investing Activities
Cash used for investing activities was $101 million and $864 million for fiscal year 2011 and 2010, respectively. Cash used for investing activities in fiscal year 2011 included capital expenditures and capitalized software development costs of $83 million and $42 million, respectively. Further, during the first quarter of fiscal year 2011, the Company and Nortel agreed on a final purchase price of $933 million for the acquisition of NES and we received $6 million representing all remaining amounts due to Avaya from funds held in escrow. In addition, restricted cash of $24 million that formerly secured a standby letter of credit related to a facility lease in Germany is included in cash and cash equivalents, as the standby letter of credit is now secured by a letter of credit issued under the senior secured multi-currency asset-based revolving credit facility. We also used $16 million for other acquisitions during fiscal year 2011. The primary use of cash in fiscal year 2010 was related to payments in connection with the acquisition of NES of $800 million (net of cash acquired of $38 million, the application of the $100 million good-faith deposit made in fiscal year 2009 and the return of funds held in escrow of $5 million). In addition, during that period we used cash for capital expenditures and capitalized software development costs of $79 million and $43 million, respectively. This was partially offset by $18 million related to the liquidation of auction rate securities acquired in connection with the acquisition of NES and proceeds received from the divestiture of our 59.13% ownership in AGC (net of cash sold of $13 million).
Cash used for investing activities was $864 million for fiscal year 2010. The primary use of cash in fiscal year 2010 was related to payments in connection with the acquisition of NES of $800 million (in August 2010, the Company received $5 million from funds held in escrow as a partial working capital adjustment to the purchase price of NES). In addition, during fiscal year 2010 we used cash for capital expenditures and capitalized software development costs of $79 million and $43 million, respectively. Cash used for investing activities during fiscal year 2010 was partially offset by $18 million of proceeds from the liquidation of auction rate securities acquired in connection with the acquisition of NES and the $32 million of proceeds received from the divestiture of our 59.13% ownership in AGC (net of cash sold of $13 million).
Cash used for investing activities was $155 million for fiscal year 2009 and included cash used for capital expenditures and capitalized software development costs of $76 million and $43 million, respectively, and the $100 million good-faith deposit made in connection with the purchase of NES. These payments were partially offset by $98 million related to the liquidation of short-term securities.
Financing Activities
Net cash provided by financing activities was $228 million for fiscal year 2011, as compared to $853 million for fiscal year 2010. Activity for the fiscal year 2011 included proceeds from the issuance of the senior secured notes of $1,009 million which were used to repay in full the senior secured incremental term B-2 loans (including $696 million for the repayment of principal, net of discount included as a cash out flow for financing activities and $291 million for the repayment of debt discount as discussed under “Operating Activities” above).
79
Table of Contents
Additionally, activity for fiscal year 2011 included $42 million in associated debt issuance and modification costs and $42 million in scheduled debt payments. Net cash provided by financing activities for the prior year included net proceeds of $783 million from the issuance of senior secured incremental term B-2 loans with detachable warrants to purchase 61.5 million shares of the Company’s common stock and proceeds of $125 million from the issuance of 125,000 shares of Series A preferred stock with detachable warrants to purchase 38.5 million shares of common stock. This was partially offset by $48 million in debt payments and debt issuance costs of $5 million.
Net cash provided by financing activities for fiscal year 2010 was $853 million as compared to net cash used for financing activities for fiscal year 2009 of $101 million. Financing activities for fiscal year 2010 included net proceeds of $783 million from the issuance of incremental term B-2 loans with detachable warrants to purchase 61.5 million shares of the Company’s common stock and proceeds of $125 million from the issuance of 125,000 shares of Series A preferred stock with detachable warrants to purchase 38.5 million shares of common stock. This was partially offset by $48 million in debt payments and debt issuance costs of $5 million. Net cash used for financing activities for fiscal year 2009 included $72 million for debt payments, including a $34 million principal payment required by Avaya Inc.’s debt agreements as a result of generating excess cash flows from operations, as defined in the debt agreements. In addition, $29 million of cash was used in fiscal year 2009 for costs incurred in connection with the conversion of the loans under the senior unsecured credit facility into the senior unsecured notes.
Contractual Obligations and Sources of Liquidity
Contractual Obligations
The following table summarizes our contractual obligations as of September 30, 2011:
| Payments due by period | ||||||||||||||||||||
| Total | Less than 1 year | 1-3 years | 3-5 years | More than 5 years | ||||||||||||||||
| In millions | ||||||||||||||||||||
Capital lease obligations(1) | $ | 23 | $ | 2 | $ | 5 | $ | 6 | $ | 10 | ||||||||||
Operating lease obligations(2) | 579 | 110 | 165 | 121 | 183 | |||||||||||||||
Purchase obligations with contract manufacturers and suppliers(3) | 82 | 82 | — | — | — | |||||||||||||||
Other purchase obligations(4) | 132 | 53 | 67 | 12 | — | |||||||||||||||
Senior secured term B-1 loans(5) | 1,449 | 15 | 30 | 1,404 | — | |||||||||||||||
Senior secured term B-3 loans(5) | 2,174 | 23 | 46 | 46 | 2,059 | |||||||||||||||
Senior secured notes(6) | 1,009 | — | — | — | 1,009 | |||||||||||||||
9.75% senior unsecured notes due 2015(7) | 700 | — | — | 700 | — | |||||||||||||||
10.125%/10.875% senior PIK toggle unsecured notes due 2015(7) | 834 | — | — | 834 | — | |||||||||||||||
Interest payments due on long-term debt(8) | 2,262 | 416 | 787 | 663 | 396 | |||||||||||||||
Pension benefit obligations(9) | 172 | 172 | — | — | — | |||||||||||||||
|
|
|
|
|
|
|
|
|
| |||||||||||
Total | $ | 9,416 | $ | 873 | $ | 1,100 | $ | 3,786 | $ | 3,657 | ||||||||||
|
|
|
|
|
|
|
|
|
| |||||||||||
| (1) | The payments due for capital lease obligations do not include future payments for interest. |
| (2) | Contractual obligations for operating leases include $71 million of future minimum lease payments that have been accrued for in accordance with GAAP pertaining to restructuring and exit activities. |
| (3) | We purchase components from a variety of suppliers and use several contract manufacturers to provide manufacturing services for our products. During the normal course of business, in order to manage manufacturing lead times and to help assure adequate component supply, we enter into agreements with contract manufacturers and suppliers that allow them to produce and procure inventory based upon forecasted requirements provided by us. If we do not meet these specified purchase commitments, we could |
80
Table of Contents
| be required to purchase the inventory. See Note 19, “Commitments and Contingencies—Guarantees of Indebtedness and Other Off-Balance Sheet Arrangements—Purchase Commitments and Termination Fees,” to our consolidated financial statements. |
| (4) | Other purchase obligations represent an estimate of contractual obligations in the ordinary course of business, other than commitments with contract manufacturers and suppliers, for which we have not received the goods or services as of September 30, 2011. Although contractual obligations are considered enforceable and legally binding, the terms generally allow us the option to cancel, reschedule and adjust our requirements based on our business needs prior to the delivery of goods or performance of services. |
| (5) | The contractual cash obligations for the senior secured credit facility represent the minimum principal payments owed per year. The contractual cash obligations do not reflect contingent mandatory annual principal repayments that may be required to be made upon us achieving certain excess cash flow targets, as defined in the senior secured credit facility. |
| (6) | The contract obligations for the senior secured notes, which mature on April 1, 2019, represent principal payments only. |
| (7) | The contractual cash obligations for the 9.75% senior unsecured notes due 2015 and 10.125%/10.875% senior PIK toggle unsecured notes due 2015 (see Note 9, “Financing Arrangements,” to our consolidated financial statements) represent principal payments only. |
| (8) | The contractual cash obligations for interest payments represent the related interest payments on long-term debt and the contractual obligations associated with the related interest rate swaps which hedge approximately 97% of the floating rate interest risk associated with the senior secured credit facility. The interest payments for the senior secured term B-1 loans and senior secured term B-3 loans were calculated by applying an applicable margin to a projected 3-month LIBOR rate. The interest payments were calculated using a 7% rate for the senior secured notes. The interest payments were calculated using a 9.75% and 10.125% rate for the cash-pay notes and PIK toggle notes, respectively. |
| (9) | The Company sponsors non-contributory defined pension and postretirement plans covering certain employees and retirees. The Company’s general funding policy with respect to qualified pension plans is to contribute amounts at least sufficient to satisfy the minimum amount required by applicable law and regulations, or to directly pay benefits where appropriate. Most postretirement medical benefits are not pre-funded. Consequently, the Company makes payments as these retiree medical benefits are disbursed. |
Additionally, as of September 30, 2011, the Company had gross unrecognized tax benefits of $226 million. Also, included in non-current liabilities is $8 million relating to audits by state and local and foreign taxing authorities for the periods prior to the Company’s separation from Lucent-Technologies Inc. (now Alcatel-Lucent) pursuant to the Tax Sharing Agreement between the Company and Lucent. Further, an additional $30 million for gross interest and penalties relating to these amounts had been classified as non-current liabilities. At this time, the Company is unable to make a reasonably reliable estimate of the timing of payments in connection with these tax liabilities; therefore, such amounts are not included in the above contractual obligation table.
On February 11, 2011, the senior secured credit facility was amended and restated. The most significant modifications include an amendment that permitted us to effect a refinancing (see below) in which the maturity of a portion of the senior secured term B-1 loans representing outstanding principal amounts of $2.2 billion was extended from October 26, 2014 to October 26, 2017 by converting such loans into a new tranche of senior secured term B-3 loans and increasing the applicable interest rate for the new tranche of senior secured term B-3 loans.
81
Table of Contents
The refinancing referenced above was accomplished through a private placement of $1,009 million of senior secured notes. The senior secured notes were issued at par, bear interest at a rate of 7% per annum and mature on April 1, 2019. The proceeds from the notes were used to repay in full the senior secured incremental term B-2 loans outstanding under the senior secured credit facility (representing $988 million in aggregate principal amount and $12 million in accrued and unpaid interest through February 11, 2011) and to pay related fees and expenses. The private placement effectively deferred $950 million of principal payments originally due in October 2014 to April 2019. Please refer to Note 9, “Financing Arrangements,” to our consolidated financial statements for further details.
We intend to use the net proceeds of this offering to (1) repay a portion of our long-term indebtedness; (2) redeem all of our outstanding Series A Preferred Stock; and (3) pay a one-time success fee of $ million in connection with the termination of our management services agreement with affiliates of the Sponsors pursuant to its terms. The use of proceeds is expected to reduce the amounts due included in the table of contractual obligations as follows:
| • | obligations under our outstanding debt will decrease by $ million; |
| • | related interest payments will decrease by $ million; and |
| • | annual monitoring fees of $7 million due under the terms of our management services agreement with affiliates of our Sponsors will be terminated. |
Our primary future cash requirements will be to fund working capital, debt service, capital expenditures, restructuring payments and benefit obligations. In addition, we may use cash in the future to make strategic acquisitions.
In addition to our working capital requirements, we expect our primary cash requirements for fiscal year 2012 to be as follows:
| • | Debt service—We expect to make payments of $454 million during the fiscal year 2012 for principal and interest associated with our long-term debt, as refinanced. We will also make payments associated with our interest rate swaps used to reduce the Company’s exposure to variable-rate interest payments. Currently, we do not foresee the need to repatriate earnings of foreign subsidiaries in order to make our scheduled debt payments; |
| • | Capital expenditures—We expect to spend $145 million for capital expenditures and capitalized software development costs during the fiscal year 2012; |
| • | Restructuring payments—We expect to make payments of $265 million during the remainder of fiscal year 2011 for employee separation costs and lease termination obligations associated with restructuring actions we have implemented through September 30, 2011; and |
| • | Benefit obligations—We estimate we will make payments under our pension and postretirement obligations totaling $172 million during fiscal year 2012. These payments include: $90 million to satisfy the minimum statutory funding requirements of our U.S. qualified pension plans, $6 million of payments under our U.S. benefit plans that are not pre-funded, $26 million under our non-U.S. benefit plans that are predominately not pre-funded, and $50 million under our U.S. retiree medical benefit plan that is not pre-funded. See discussion in Note 13, “Benefit Obligations,” to our consolidated financial statements for further details of our benefit obligations. |
We and our subsidiaries, affiliates and significant shareholders may from time to time seek to retire or repurchase our outstanding debt (including publicly issued debt) and equity (including shares issued in this offering) through cash purchases and/or exchanges, in open market purchases, privately negotiated transactions, by tender offer or otherwise. Such repurchases or exchanges, if any, will depend on prevailing market conditions, liquidity requirements, contractual restrictions and other factors. The amounts involved may be material.
82
Table of Contents
Future Sources of Liquidity
We expect our primary source of cash to be positive net cash flows provided by operating activities. We expect that profitable revenues and continued focus on accounts receivable, inventory management and cost containment will enable us to generate positive net cash from operating activities. Further, we continue to focus on cost reductions and have initiated restructuring plans during fiscal year 2011 designed to reduce overhead and provide cash savings. Avaya Inc. currently has two revolving credit facilities providing for borrowings of up to an aggregate of $535 million subject to certain contractual limitations. Avaya Inc.’s senior secured multi-currency asset-based revolving credit facility provides senior secured revolving financing of up to $335 million, subject to availability under a borrowing base which, at any time, equals the sum of 85% of eligible accounts receivable plus 85% of the net orderly liquidation value of eligible inventory, subject to certain reserves and other adjustments. In addition, although the senior secured multi-currency asset-based revolving credit facility does not require Avaya Inc. to comply with any financial ratio maintenance covenants, if Avaya Inc. has Excess Availability under the facility of less than $33.5 million at any time, it will not be permitted to borrow any additional amounts thereunder unless its pro forma Consolidated Fixed Charge Coverage Ratio (each such term as defined in the credit agreement governing the facility) is at least 1.0 to 1.0. At September 30, 2011 there were no borrowings under the facility, however there were letters of credit issued in the ordinary course of business which reduces the amount available. Based on the borrowing base as calculated at September 30, 2011, the remaining availability under the facility was $252 million which is net of $75 million in issued letters of credit. Avaya Inc. also has a senior secured multi-currency revolver, which allows for borrowings of up to $200 million. At September 30, 2011, there were no amounts outstanding under the senior secured multi-currency revolver and the $200 million was available in full. Both revolving credit facilities include other customary conditions that, if not complied with, could restrict our availability to borrow.
On August 8, 2011, the Company amended the terms of each of the multi-currency revolvers available under its senior secured credit facility and its multi-currency asset-based revolving credit facility to extend the final maturity of each from October 26, 2013 to October 26, 2016. All other terms and conditions of the senior secured credit facility and the multi-currency asset-based revolving credit facility remain unchanged. For more information on the revolving credit facilities and the restrictions on borrowing thereunder, please refer to “Description of Certain Outstanding Indebtedness” and Note 9, “Financing Arrangements,” to our consolidated financial statements included elsewhere in this prospectus.
The Company is planning to make an initial public offering of its common stock as contemplated in this prospectus. We intend to use the net proceeds of this offering to repay certain of our existing indebtedness and to redeem our Series A preferred stock.
If we do not generate sufficient cash from operations, face unanticipated cash needs such as the need to fund significant strategic acquisitions or do not otherwise have sufficient cash and cash equivalents, we may need to incur additional debt or issue additional equity. In order to meet our cash needs Avaya Inc. may, from time to time, borrow under its credit facilities or issue long-term or short-term debt or equity, if the market and our credit facilities and the indentures governing our notes permit us to do so. Furthermore, if we acquire a business in the future that has existing debt, our debt service requirements may increase. We regularly evaluate market conditions, our liquidity profile, and various financing alternatives for opportunities to enhance our capital structure. If market conditions are favorable, we may refinance our existing debt or issue additional securities.
Based on past performance and current expectations, we believe that our existing cash and cash equivalents of $415 million and $594 million as of September 30, 2011 and 2010, respectively, and future cash provided by operating activities will be sufficient to meet our future cash requirements described above. Our ability to meet these requirements will depend on our ability to generate cash in the future, which is subject to general economic, financial, competitive, legislative, regulatory and other factors that are beyond our control.
83
Table of Contents
Uncertainties Regarding Our Liquidity
We believe the following uncertainties exist regarding our liquidity:
| • | Revenues—Our ability to generate net cash from operating activities has been a primary source of our liquidity. If our revenues and margins were to decline significantly during this economic downturn and challenging market conditions, particularly in the U.S., our ability to generate net cash from operating activities in a sufficient amount to meet our cash needs could be adversely affected. Furthermore, our net cash provided by operating activities may be insufficient if we face unanticipated cash needs such as the funding of a future acquisition or other capital investment; |
| • | Cost Saving Initiatives—Our ability to reduce costs through cost saving initiatives will have a direct effect on our cash flows and available cash balances, as certain restructuring charges are recorded in the current year but are paid in future periods. Further, although we may identify additional cost saving initiatives in the future, we may be unsuccessful in these actions or the amount required for severance payments may be so prohibitive as to preclude the implementation of such cost savings initiatives, which could negatively impact our future of cash flows; |
| • | Future Acquisitions—We may from time to time in the future make acquisitions. Such acquisitions may require significant amounts of cash or may result in increased debt service requirements to the extent we assume or incur debt in connection with such acquisitions; and |
| • | Litigation—In the ordinary course of business, the Company is involved in litigation, claims, government inquiries, investigations, charges and proceedings. See Note 19, “Commitments and Contingencies,” to our consolidated financial statements. Our defense of the Company against future litigation may impact cash flows. |
Debt Service Obligations
As a result of the Merger and the acquisition of NES, our level of indebtedness increased. As of September 30, 2011, principal payments due under our indebtedness was $6,166 million, excluding capital lease obligations of $23 million. Our interest expense for fiscal years 2011, 2010 and 2009 was $460 million, $487 million, and $409 million, respectively, and includes $42 million, $105 million and $57 million of non-cash interest expense, respectively.
Our leverage requires that a substantial portion of our cash flows from operations be dedicated to the payment of principal and interest on our indebtedness.
We continually monitor our exposure to the risk of increased interest rates as portions of our borrowings under our credit facilities are at variable rates of interest. We use interest rate swap agreements to manage the amount of our floating rate debt to the extent we deem appropriate. At September 30, 2011 the outstanding notional amount of these swap agreements was $3.5 billion. Subsequent to September 30, 2011, we chose to let swap agreements with aggregated notional amounts of $1.7 billion expire pursuant to their terms. The remaining outstanding swap agreements with notional amounts aggregating $1.8 billion expire through August 2013.
For the periods May 1, 2009 through October 31, 2009 and November 1, 2009 through April 30, 2010, the Company elected to pay interest in kind on Avaya Inc.’s senior unsecured PIK toggle notes. As a result, payment in kind interest of $41 million and $43 million was added to the principal amount of the notes effective November 1, 2009 and May 1, 2010, respectively, and will be payable when the notes become due. For the interest periods of May 1, 2010 to October 31, 2010 and November 1, 2010 to April 30, 2011, the Company made such payments in cash interest. On April 29, the Company delivered notice to its creditors that, with respect to the interest period of May 1, 2011 to October 31, 2011, the Company will make such payments in cash interest. The Company has made all scheduled payments timely and is not in default under the senior secured credit facility, the indenture governing Avaya Inc.’s senior secured notes, the indenture governing Avaya Inc.’s senior unsecured notes or Avaya Inc.’s senior secured multi-currency asset-based revolving credit facility.
84
Table of Contents
Strategic Uses of Cash and Cash Equivalents
Cash and cash equivalents decreased by $179 million to $415 million at September 30, 2011 from $594 million at September 30, 2010. Cash and cash equivalents at September 30, 2011 and September 30, 2010 do not include restricted cash of $1 million and $28 million, respectively. The restricted cash balance at September 30, 2010 related primarily to the securing of a standby letter of credit related to a facility lease in Germany, which was classified as other non-current assets, and is now secured by a letter of credit issued under Avaya Inc.’s senior secured multi-currency asset-based revolving credit facility as of September 30, 2011.
Our cash and cash equivalents balance at September 30, 2010 and 2009 was $594 million and $582 million, respectively, an increase of $12 million. Cash and cash equivalents at September 30, 2009 does not include $100 million that had been placed in an interest bearing escrow account as a good faith deposit in connection with the acquisition of NES and classified as other non-current assets. This deposit was included in the funds used for the acquisition of NES on December 18, 2009. In addition, at September 30, 2010 and 2009 there was restricted cash of $28 million and $32 million, respectively, primarily securing a standby letter of credit related to a facility lease in Germany which is classified as other non-current assets and is not included in the cash and cash equivalents balance.
Deferred Tax Assets
Our deferred tax assets are primarily a result of deductible temporary differences related to pension, tax credit carryforwards, net operating loss, or NOL, carryforwards, and other accruals which are available to reduce taxable income in future periods. As of September 30, 2011, the Company had tax-effected NOL carryforwards of $972 million, comprised of $628 million for U.S. Federal, state and local taxes and $344 million for foreign taxes, including $160 million, $110 million and $24 million in Germany, Luxembourg and France, respectively. U.S. Federal and state NOL carryforwards expire through the year 2031, with the majority expiring in excess of 10 years. The majority of foreign NOL carryforwards have no expiration. Additionally, the Company has various other tax credit carryforwards totaling $66 million. Of this total, $17 million expire within five years, $27 million expire between five and 15 years and $22 million expire in excess of 15 years.
The Internal Revenue Code contains certain provisions which may limit the use of U.S. Federal net operating losses and U.S. Federal tax credits upon a change in ownership (determined under very broad and complex direct and indirect ownership rules) in the Company within a three-year testing period. As a result of the Merger, a significant change in the ownership of the Company occurred that limits, on an annual basis, the Company’s ability to utilize its U.S. Federal NOLs and U.S. Federal tax credits. The Company’s NOLs and tax credits will continue to be available to offset taxable income (until such NOLs are either used or expire) subject to the annual limitation. If the annual limitation amount is not fully utilized in a particular tax year, then the unused portion from that particular tax year will be added to the annual limitation in subsequent years. We do not believe that the share issuance as contemplated in this prospectus will itself, or when aggregated with other prior shareholder ownership changes during the applicable testing period, cause an ownership change that would further limit, on an annual basis, our ability to utilize our current U.S. Federal NOLs and U.S. Federal tax credits.
In fiscal years 2008 and 2009, we recognized significant impairments of our intangible assets and goodwill which contributed to a significant book taxable loss in the U.S. We also incurred and expect to continue to incur significant interest expense related to our debt and amortization and depreciation expense associated with the step-up in basis of our assets in purchase accounting associated with the Merger and the acquisition of NES. As a result of continuing pre-tax losses incurred subsequent to the Merger, as of September 30, 2010, excluding the U.S. deferred tax liabilities on indefinite-lived intangible assets, our deferred tax assets exceed our deferred tax liabilities in the U.S. and we are in a three-year cumulative book taxable loss position.
Further, as a result of operational losses and continued business restructuring accruals in Germany and France as well as intercompany interest expense in Luxembourg, the Company’s subsidiaries in Germany, Luxembourg and France are in a three-year cumulative book taxable loss position.
In assessing the realization of deferred tax assets, the Company considers whether it is more likely than not that some portion or all of the deferred tax assets will not be realized. The Company considered the scheduled
85
Table of Contents
reversal of deferred tax assets and liabilities, projected future taxable income, and certain tax planning strategies in making this assessment. Based on this assessment in fiscal year 2009, 2010 and 2011, the Company determined that it is more likely than not that the U.S., German, Luxembourg and French deferred tax assets will not be realized to the extent they exceed the scheduled reversal of deferred tax liabilities. Accordingly, we have provided a valuation allowance against our U.S., German, Luxembourg and French net deferred tax assets which has and will continue to adversely affect our effective income tax rate.
At September 30, 2011, the valuation allowance of $1,410 million is comprised of $1,052 million relating to U.S. deferred tax assets and $358 million relating to foreign deferred tax assets for which $193 million, $110 million and $24 million relates to our German, Luxembourg and French subsidiaries, respectively. In fiscal year 2011, the Company recorded an increase of $316 million to its valuation allowance. The increase in the valuation allowance is comprised of a $238 million charge included in the provision for income taxes and a $78 million charge to the balance sheet.
Credit Facilities
In connection with the Merger on October 26, 2007, Avaya Inc. entered into borrowing arrangements with several financial institutions, certain of which arrangements were amended December 18, 2009 in connection with the acquisition of NES and amended on February 11, 2011 in connection with the refinancing. Long-term debt under Avaya Inc.’s borrowing arrangements includes a senior secured credit facility consisting of term loans and a revolving credit facility, senior unsecured notes, and a senior secured multi-currency asset based revolving credit facility. On August 8, 2011, the Company amended the terms each of the multi-currency revolvers available under its senior secured credit facility and its multi-currency asset-based revolving credit facility to extend the final maturity of each from October 26, 2013 to October 26, 2016. All other terms and conditions of the senior secured credit facility and the multi-currency asset-based revolving credit facility remain unchanged. We are not in default under the senior secured credit facility, the indentures governing Avaya Inc.’s notes or Avaya Inc.’s senior secured multi-currency asset-based revolving credit facility. See Note 9, “Financing Arrangements,” to our consolidated financial statements for further details.
Guarantees of Indebtedness and Other Off-Balance Sheet Arrangements
We are party to several types of agreements, including surety bonds, purchase commitments, product financing arrangements and performance guarantees, which are fully discussed in Note 19, “Commitments and Contingencies,” to our consolidated financial statements located elsewhere in this prospectus.
Legal Proceedings and Environmental, Health and Safety Matters
We are subject to certain legal proceedings and environmental, health and safety matters, which are fully discussed in Note 19, “Commitments and Contingencies—Legal Proceedings,” to our consolidated financial statements.
Critical Accounting Policies and Estimates
Our consolidated financial statements are based on the selection and application of GAAP, which require us to make estimates and assumptions about future events that affect the amounts reported in our financial statements and the accompanying notes. Future events and their effects cannot be determined with absolute certainty. Therefore, the determination of estimates requires the exercise of judgment. Actual results could differ from those estimates, and any such differences may be material to the financial statements. We believe that the following policies may involve a higher degree of judgment and complexity in their application and represent the critical accounting policies used in the preparation of our financial statements. If different assumptions or conditions were to prevail, the results could be materially different from our reported results.
86
Table of Contents
Revenue Recognition
The Company derives revenue primarily from the sale of products, software, and services for communications systems and applications. The Company’s products are sold directly through its worldwide sales force and indirectly through its global network of distributors, dealers, value-added resellers and systems integrators. Services includes (i) supplemental maintenance service, including services provided under contracts to monitor and optimize customers’ communications network performance; (ii) professional services for implementation and integration of converged voice and data networks, network security, and unified communications; and (iii) operations services. Maintenance contracts typically have terms that range from one to five years. Contracts for professional services typically have terms that range from two to four weeks for standard solutions and from six months to one year for customized solutions. Contracts for operations services typically have terms that range from one to seven years.
In accordance with GAAP, revenue is recognized when persuasive evidence of an arrangement exists, delivery has occurred, the fee is fixed or determinable, and collectability is reasonably assured. For arrangements that require final acceptance of the product, system or solution as specified by the customer, revenue is deferred until all acceptance criteria have been met.
The Company’s indirect sales to distribution partners are generally recognized at the time of shipment if all contractual obligations have been satisfied. The Company accrues a provision for estimated sales returns and other allowances, including promotional marketing programs and other incentives as a reduction of revenue at time of sale.
Multiple Deliverable Arrangements in Fiscal Year 2011
In October 2009, the Financial Accounting Standards Board, or the FASB, amended the software revenue recognition guidance to remove from its scope tangible products containing software components and non-software components that function together to deliver the product’s essential functionality. The FASB also amended the guidance for multiple deliverable revenue arrangements (formerly Emerging Issues Task Force No. 08-1) to: (i) provide updated guidance on how the deliverables in an arrangement should be separated and how the consideration should be allocated; and (ii) change the term “fair value” to “selling price” and require an entity to allocate revenue using the estimated selling prices of the deliverables when a vendor does not have vendor-specific or third-party evidence of selling price. The Company adopted the new guidance on a prospective basis as of the beginning of fiscal year 2011 for revenue arrangements entered into or materially modified on or after October 1, 2010.
The new guidance did not generally change the units of accounting for the Company’s revenue transactions as delivered and undelivered items generally qualified as separate units of accounting under the historical guidance. The new guidance affects the timing of revenue recognition for multiple deliverable arrangements that included delivered items and undelivered items for which the Company was unable to demonstrate fair value pursuant to the historical guidance. In such cases, the delivered items were combined with the undelivered items to form a single unit of accounting and revenue was recognized either on a straight-line basis over the services period or deferred until the earlier of when the fair value requirements were met or when the last item was delivered. In addition, the Company previously used the residual method to allocate the arrangement consideration in cases where fair value could only be determined for the undelivered items. Under the new guidance, the Company allocates the total arrangement consideration based upon the relative selling price of each deliverable and revenue is recognized as each item is delivered. As a result of adopting the new guidance, net revenues for the fiscal year ended September 30, 2011 were not materially different from the net revenues that would have been recorded under the historical guidance. The Company cannot reasonably estimate the effect of adopting the new guidance on future financial periods as the impact will vary depending on the nature and volume of new or materially modified multiple deliverable arrangements in any given period.
87
Table of Contents
The Company enters into multiple deliverable arrangements, which may include various combinations of products, software and services. Most product and service deliverables qualify as separate units of accounting and can be sold on a standalone basis. A deliverable constitutes a separate unit of accounting when it has standalone value and, where return rights exist, delivery or performance of the undelivered items is considered probable and substantially within the Company’s control.
Most of the Company’s solutions have both software and non-software components that function together to deliver the products’ essential functionality. For these multiple deliverable arrangements, the Company allocates revenue to the deliverables based on their relative selling prices. To the extent that a deliverable is subject to specific guidance on whether and/or how to allocate the consideration in a multiple deliverable arrangement, that deliverable is accounted for in accordance with such specific guidance. The Company limits the amount of revenue recognition for delivered items to the amount that is not contingent on the future delivery of products or services or meeting other future performance obligations.
The Company allocates revenue based on a selling price hierarchy of vendor-specific objective evidence, third-party evidence, and then selling price. Vendor-specific objective evidence is based on the price charged when the deliverable is sold separately. Third-party evidence is based on largely interchangeable competitor products or services in standalone sales to similarly situated customers. As the Company is unable to reliably determine what competitors products’ selling prices are on a standalone basis, the Company is not typically able to determine third-party evidence. Estimated selling price is based on the Company’s best estimates of what the selling prices of deliverables would be if they were sold regularly on a standalone basis. Estimated selling price is established considering multiple factors including, but not limited to, pricing practices in different geographies and through different sales channels, major product and services groups and customer classifications.
Once the Company allocates revenue to each deliverable, the Company recognizes revenue in accordance with its policies when all revenue recognition criteria are met. Products revenue is generally recognized upon delivery and services revenue is generally recognized ratably over the period during which the services are performed. However, revenue for professional services arrangements is generally recognized upon delivery or completion of performance and revenue for arrangements that require final acceptance of the product, system, or solution, is generally deferred until all acceptance criteria have been met.
Standalone or subsequent sales of software or software-related products are recognized in accordance with the software revenue recognition guidance. For multiple deliverable arrangements that only include software items, the Company generally uses the residual method to allocate the arrangement consideration. Under the residual method, the amount of consideration allocated to the delivered items equals the total arrangement consideration, less the fair value of the undelivered items. Where vendor-specific objective evidence for the undelivered items cannot be determined, the Company defers revenue until all items are delivered and services have been performed, or until such evidence of fair value can be determined for the undelivered items.
Multiple Deliverable Arrangements in Fiscal Years 2010 and Prior
For periods prior to fiscal year 2011, a multiple deliverable arrangement is separated into more than one unit of accounting if all of the following criteria are met: (i) the delivered item(s) has value to the customer on a standalone basis; (ii) there is objective and reliable evidence of the fair value of the undelivered item(s); and (iii) if the arrangement includes a general right of return relative to the delivered item(s), delivery or performance of the undelivered item(s) is considered probable and substantially within the control of the Company. If these criteria are not met, the delivered items are combined with the undelivered items to form a single unit of accounting and revenue is recognized on either a straight-line basis over the services period or deferred until the earlier of when such criteria are met or when the last item is delivered.
The Company uses the residual method to allocate the arrangement consideration for multiple deliverable arrangements for which objective and reliable evidence of fair value can only be determined for the undelivered items. Under the residual method, the amount of consideration allocated to the delivered items equals the total arrangement consideration, less the fair value of the undelivered items.
88
Table of Contents
The Company uses objective and reliable evidence of fair value to separate the deliverables into more than one unit of accounting if the Company has vendor-specific objective evidence or third-party evidence of fair value for all of the deliverables. The accounting guidance does not permit the Company to use an estimated selling price for these arrangements when objective and reliable evidence of fair value is not available.
The Company recognizes revenue in accordance with the software revenue recognition guidance for arrangements that include software that is more than incidental to the products or services as a whole. In multiple deliverable software arrangements, the Company generally uses the residual method to allocate the arrangement consideration. When vendor-specific objective evidence of fair value cannot be determined for the undelivered items, the Company defers revenue until all items have been delivered or until such evidence can be determined.
Income Taxes
Income taxes are accounted for under the asset and liability method. Under this method, deferred tax assets and liabilities are recognized for the estimated future tax consequences attributable to differences between the financial statement carrying amounts of existing assets and liabilities and their respective tax bases, and operating loss and tax credit carryforwards. Deferred tax assets and liabilities are measured using enacted tax rates in effect for the year in which those temporary differences are expected to be recovered or settled. The effect on deferred tax assets and liabilities of a change in tax rates is recognized in the Consolidated Statements of Operations in the period that includes the enactment date. A valuation allowance is recorded to reduce the carrying amounts of deferred tax assets if it is more likely than not that such assets will not be realized.
FASB ASC subtopic 740-10, “Income Taxes—Overall,” or ASC 740-10, prescribes a comprehensive model for the financial statement recognition, measurement, classification and disclosure of uncertain tax positions. ASC 740-10 contains a two-step approach to recognizing and measuring uncertain tax positions. The first step is to evaluate the tax position for recognition by determining if the weight of available evidence indicates that it is more likely than not that the position will be sustained on audit, based on the technical merits of the position. The second step is to measure the tax benefit as the largest amount that is more than 50% likely of being realized upon settlement.
Significant judgment is required in evaluating our uncertain tax position and determining our provision for income taxes. Although we believe our reserves are reasonable, no assurance can be given that the final tax outcome of these matters will not be different from that which is reflected in our historical income tax provision and accruals. We adjust these reserves in light of changing facts and circumstances.
Acquisition Accounting
Effective October 1, 2009, the Company accounts for business combinations using the acquisition method, which requires an allocation of the purchase price of an acquired entity to the assets acquired and liabilities assumed based on their estimated fair values at the date of acquisition. Goodwill represents the excess of the purchase price over the net tangible and intangible assets acquired.
Intangible and Long-lived Assets
Intangible assets include technology, customer relationships, trademarks and trade names and other intangibles. Intangible assets with finite lives are amortized using the straight-line method over the estimated economic lives of the assets, which range from two to fifteen years. Long-lived assets, including intangible assets with finite lives, are reviewed for impairment whenever events or changes in circumstances indicate that the carrying amount of such assets may not be recoverable in accordance with FASB ASC Topic 360, “Property, Plant, and Equipment”, or ASC 360. Determination of recoverability is based on an estimate of undiscounted future cash flows resulting from the use of the asset and its eventual disposition. Measurement of an impairment loss for long-lived assets that management expects to hold and use is based on the estimated fair value of the
89
Table of Contents
asset. Long-lived assets to be disposed of are reported at the lower of carrying amount or estimated fair value less costs to sell. Intangible assets determined to have indefinite useful lives are not amortized but are tested for impairment annually each September 30th, and more frequently if events occur or circumstances change that indicate an asset may be impaired. The estimated useful life of intangible and long-lived assets are based on many factors, including assumptions regarding the effects of obsolescence, demand, competition and other economic factors, expectations regarding the future use of the asset, and our historical experience with similar assets. The assumptions used to determine the estimated useful lives could change due to numerous factors including product demand, market conditions, technological developments, economic conditions and competition.
Goodwill
Goodwill is not amortized but is subject to periodic testing for impairment in accordance with FASB ASC Topic 350, “Intangibles—Goodwill and Other,” or ASC 350, at the reporting unit level which is one level below the Company’s operating segments. The assessment of goodwill impairment is conducted by estimating and comparing the fair value of the Company’s reporting units’ net assets, as defined in ASC 350, to their carrying value as of that date. The fair value is estimated using an income approach whereby the fair value of the asset is based on the future cash flows that each reporting unit’s assets can be expected to generate. Future cash flows are based on forward-looking information regarding market share and costs for each reporting unit and are discounted using an appropriate discount rate. Future discounted cash flows can be affected by changes in industry or market conditions or the rate and extent to which anticipated synergies or cost savings are realized with newly acquired entities. The test for impairment is conducted annually each September 30th, and more frequently if events occur or circumstances change that indicate that the fair value of a reporting unit may be below its carrying amount.
At September 30, 2011 the Company performed its annual goodwill impairment test and determined that the respective book values of the Company’s reporting units did not exceed their estimated fair values and that it was not necessary to record impairment charges. In order to evaluate the sensitivity of the fair value calculations on the goodwill impairment test the Company applied a hypothetical 10% decrease to the fair value of each reporting unit. This hypothetical 10% decrease in the fair value of each reporting unit at September 30, 2011 would not result in an impairment of goodwill for any reporting unit. Based on our most recent annual goodwill impairment assessment performed as of September 30, 2011, we determined that none of our reporting units with significant goodwill was at risk for failing step one of the goodwill impairment test.
Fair value determinations require considerable judgment and are sensitive to changes in underlying assumptions and factors. As a result, there can be no assurance that the estimates and assumptions made for purposes of the annual goodwill impairment test will prove to be accurate predictions of the future. Examples of events or circumstances that could reasonably be expected to negatively affect the underlying key assumptions and ultimately impact the estimated fair value of our reporting units may include such items as follows:
| • | A prolonged downturn in the business environment which negatively effects our forecasted sales volumes and prices; |
| • | An economic recovery that differs from our assumptions in timing or degree; |
| • | Volatility in equity and debt markets resulting in higher discount rates; and |
| • | Unexpected regulatory changes. |
While historical performance and current expectations have resulted in fair values of goodwill in excess of carrying values, if our assumptions are not realized, it is possible that in the future an impairment charge may need to be recorded. However, it is not possible at this time to determine if an impairment charge would result or if such a charge would be material.
90
Table of Contents
Restructuring Programs
The Company accounts for exit or disposal of activities in accordance with FASB ASC Topic 420, “Exit or Disposal Cost Obligations,” or ASC 420. In accordance with ASC 420, a business restructuring is defined as an exit or disposal activity that includes but is not limited to a program that is planned and controlled by management, and materially changes either the scope of a business or the manner in which that business is conducted. Business restructuring charges include (i) one-time termination benefits related to employee separations, (ii) contract termination costs and (iii) other costs associated with exit or disposal activities including, but not limited to, costs for consolidating or closing facilities and relocating employees.
A liability is recognized and measured at its fair value for one-time termination benefits once the plan of termination is communicated to affected employees and it meets all of the following criteria: (i) management commits to a plan of termination, (ii) the plan identifies the number of employees to be terminated and their job classifications or functions, locations and the expected completion date, (iii) the plan establishes the terms of the benefit arrangement and (iv) it is unlikely that significant changes to the plan will be made or the plan will be withdrawn. Contract termination costs include costs to terminate a contract or costs that will continue to be incurred under the contract without benefit to the Company. A liability is recognized and measured at its fair value when the Company either terminates the contract or ceases using the rights conveyed by the contract. A liability is recognized and measured at its fair value for other associated costs in the period in which the liability is incurred.
In connection with the Merger, the Company adopted a plan to exit certain activities of the newly acquired company. A liability was recognized as of the consummation date of the acquisition for the costs under the exit plan in accordance with the authoritative guidance at that time if these costs were not associated with or were not incurred to generate revenues of the combined entity after the consummation date and either (i) had no future economic benefit to the combined company, were incremental to other costs incurred by either the acquired company or the acquiring company in the conduct of activities prior to the consummation date, and were expected to be incurred as a direct result of the plan to exit an activity of the acquired company or (ii) the cost represented an amount to be incurred by the combined company under a contractual obligation of the acquired company that existed prior to the consummation date and will either continue after the plan is completed with no economic benefit to the combined company or be a penalty incurred by the combined company to cancel that contractual obligation.
Pension and Postretirement Benefit Obligations
The Company sponsors non-contributory defined benefit pension plans covering certain of its U.S. employees and retirees and postretirement benefit plans for certain U.S. retirees that include healthcare benefits and life insurance coverage. Certain non-U.S. operations have various retirement benefit programs covering substantially all of their employees. Some of these programs are considered to be defined benefit pension plans for accounting purposes.
The Company’s pension and postretirement benefit costs are developed from actuarial valuations. Inherent in these valuations are key assumptions, including the discount rate and expected long-term rate of return on plan assets. Material changes in pension and postretirement benefit costs may occur in the future due to changes in these assumptions, changes in the number of plan participants, changes in the level of benefits provided, changes in asset levels and changes in legislation.
The discount rate is subject to change each year, consistent with changes in rates of return on high-quality fixed-income investments currently available and expected to be available during the expected benefit payment period. The Company selects the assumed discount rate for its U.S. pension and postretirement plans by applying the published rates of existing yield curves, such as the Citigroup Pension Discount Curve and the Citigroup Above Median Pension Discount Curve, to the expected benefit payment streams and develops a rate at which it
91
Table of Contents
is believed the benefit obligations could be effectively settled. The Company follows a similar process for its non-U.S. pension plans by applying the published iBoxx indices. Based on the published rates as of September 30, 2011, the Company used a weighted average discount rate of 4.65% for the U.S. pension plans, 4.99% for the non-U.S. pension plans, and 4.58% for the postretirement plans. For the U.S. pension plans, non-U.S. pension plans, and the postretirement plans, every one-percentage-point increase or decrease in the discount rate reduces or increases our benefit obligation by $384 million, $73 million, and $73 million, respectively.
The market-related value of the Company’s plan assets as of the measurement date is developed using a 5-year smoothing technique. First, a preliminary market-related value is calculated by adjusting the market-related value at the beginning of the year for payments to and from plan assets and the expected return on assets during the year. The expected return on assets represents the expected long-term rate of return on plan assets adjusted up to plus or minus 2% based on the actual 10-year average rate of return on plan assets. A final market-related value is determined as the preliminary market-related value, plus 20% of the difference between the actual return and expected return for each of the past five years.
These pension and other postretirement benefits are accounted for in accordance with FASB ASC Topic 715, “Compensation—Retirement Benefits,” or ASC 715. ASC 715 requires that plan assets and obligations be measured as of the reporting date and the over-funded, under-funded or unfunded status of plans be recognized as of the reporting date as an asset or liability in the Consolidated Balance Sheets. In addition, ASC 715 requires costs and related obligations and assets arising from pensions and other postretirement benefit plans to be accounted for based on actuarially-determined estimates.
The plans use different factors, including years of service, eligible compensation and age, to determine the benefit amount for eligible participants. The Company funds its U.S. pension plans in compliance with applicable laws. See Note 13, “Benefit Obligations,” to our consolidated financial statements for a discussion of the Company’s pension and postretirement plans.
Commitments and Contingencies
In the ordinary course of business we are subject to legal proceedings related to environmental, product, employment, intellectual property, licensing and other matters. In addition, we are subject to indemnification and liability sharing claims by Lucent (now Alcatel-Lucent) under the terms of the Contribution and Distribution Agreement. In order to determine the amount of reserves required, we assess the likelihood of any adverse judgments or outcomes to these matters as well as potential ranges of probable losses. A determination of the amount of reserves required for these contingencies is made after analysis of each individual issue. The estimates of required reserves may change in the future due to new developments in each matter or changes in approach such as a change in settlement strategy. Assessing the adequacy of any reserve for matters for which we may have to indemnify Alcatel-Lucent is especially difficult, as we do not control the defense of those matters and have limited information. In addition, estimates are made for our repurchase obligations related to products sold to various distributors who obtain financing from certain third party lending institutions, as described in Note 19, “Commitments and Contingencies,” in the notes to our consolidated financial statements located elsewhere in this prospectus.
Share-based Compensation
Expense Recognition
The Company measures and recognizes compensation expense for all share-based payment awards based on their estimated fair values at the date of grant. The 2007 Plan governs the issuance of equity awards, including RSUs and stock options, to eligible plan participants. Key employees, directors, and consultants of the Company may be eligible to receive awards under the 2007 Plan. As of September 30, 2011, the Company had authorized the issuance of up to 49,848,157 shares of its stock under the 2007 Plan and there remained 4,674,875 shares available for future grant.
92
Table of Contents
Option Awards
During fiscal years 2008 and 2009, the Company granted time-based, performance-based “EBITDA,” and market-based “multiple-of-money” options to purchase stock. Options granted during the year ended September 30, 2008 have an exercise price of $5.00, and options granted during the year ended September 30, 2009 have an exercise price of $3.80, which was the fair value of the underlying shares at the time granted, in each case as determined by the board of directors at the date of grant.
In November 2009, our compensation committee approved a stock option exchange program through which individuals holding stock options having exercise prices of $5.00 and $3.80 per share could exchange them on a one-option-for-one-option basis, for replacement options with an exercise price of $3.00 per share, the fair value of the underlying shares at the time of exchange, and with new vesting terms. The replacement options issued to participants in the exchange program include time-based and market-based multiple-of-money options. The time-based options vest ratably over four years following the date of exchange. The multiple-of-money options vest upon the achievement of defined returns on the Sponsors’ initial investment in the Company. The exchange offer was closed on November 16, 2009 and substantially all eligible options were tendered for exchange and have an effective exchange date of November 17, 2009. A complete discussion of the terms and conditions of the granted awards and the exchange offer is provided in Note 14,“Share-based Compensation,” to our consolidated financial statements included elsewhere in this prospectus.
For the fiscal years ended September 30, 2011, 2010, and 2009, the Company recognized share-based compensation associated with these options of $10 million, $16 million, $9 million, respectively, which is included in costs and operating expenses. At September 30, 2011, there was $11 million of unrecognized share-based compensation that the Company expects to recognize as expense over the next three to four years associated with 2007 Plan options. The expected expense does not include any compensation associated with the multiple-of-money awards as vesting of the multiple-of-money awards is outside of the control of the Company and the award recipients. Vesting of the multiple-of-money awards will only occur upon achievement of defined returns of the Sponsors’ initial investment in the Company. The offering contemplated by this prospectus will not meet the vesting condition included in the multiple-of-money awards because the Sponsors will not be selling shares in the offering. At September 30, 2011, exercisable options and unvested time-based options that are expected to vest aggregate to 27,344,510 and have a weighted average exercise price of $3.10, a fair value at the date of grant of $52 million and an intrinsic value of $35 million.
93
Table of Contents
The following table summarizes option awards under the 2007 Plan:
Options | Time- based | EBITDA | Multiple-of- Money | Total | Weighted Average Exercise Price | Fair Value at Date of Grant (in 000s) | ||||||||||||||||||
| (number of options granted and fair value in thousands) | ||||||||||||||||||||||||
Outstanding—September 30, 2008 | 19,901 | 5,357 | 5,357 | 30,615 | $ | 5.00 | 69,802 | |||||||||||||||||
Granted | 8,161 | 2,197 | 2,197 | 12,555 | $ | 3.80 | 26,240 | |||||||||||||||||
Forfeited | (7,628 | ) | (2,123 | ) | (2,123 | ) | (11,874 | ) | $ | 4.94 | (26,953 | ) | ||||||||||||
|
|
|
|
|
|
|
|
|
|
|
| |||||||||||||
Outstanding—September 30, 2009 | 20,434 | 5,431 | 5,431 | 31,296 | $ | 4.54 | 69,089 | |||||||||||||||||
Tendered—November 2009 | (18,587 | ) | (5,004 | ) | (5,004 | ) | (28,595 | ) | $ | 4.53 | (63,064 | ) | ||||||||||||
Exchanged—November 2009 | 18,587 | — | 10,008 | 28,595 | $ | 3.00 | 52,173 | |||||||||||||||||
Granted | 12,584 | — | 5,341 | 17,925 | $ | 3.00 | 22,013 | |||||||||||||||||
Forfeited | (3,421 | ) | (273 | ) | (1,393 | ) | (5,087 | ) | $ | 3.52 | (9,411 | ) | ||||||||||||
|
|
|
|
|
|
|
|
|
|
|
| |||||||||||||
Outstanding—September 30, 2010 | 29,597 | 154 | 14,383 | 44,134 | $ | 3.03 | 70,800 | |||||||||||||||||
Granted | 4,466 | — | 2,404 | 6,870 | $ | 3.58 | 8,705 | |||||||||||||||||
Exercised | (55 | ) | — | — | (55 | ) | $ | 3.00 | (105 | ) | ||||||||||||||
Forfeited | (4,905 | ) | (58 | ) | (2,390 | ) | (7,353 | ) | $ | 3.08 | (11,846 | ) | ||||||||||||
|
|
|
|
|
|
|
|
|
|
|
| |||||||||||||
Outstanding—September 30, 2011 | 29,103 | 96 | 14,397 | 43,596 | $ | 3.11 | $ | 67,554 | ||||||||||||||||
|
|
|
|
|
|
|
|
|
|
|
| |||||||||||||
Restricted Stock Units
The Company has issued RSUs each of which represents the right to receive one share of the Company’s stock when fully vested.
Compensation expense relating to RSUs is based upon the fair market value of common stock underlying the grant, which was determined in accordance with the terms of the 2007 Plan. For the year ended September 30, 2011, 2010 and 2009, the Company recognized compensation expense associated with RSUs of $2 million, $3 million and $1 million, respectively. As of September 30, 2011, there was $3 million of unrecognized share based compensation associated with RSUs that the Company expects to recognize as expense through June 2013. The following table summarizes the RSUs granted under the 2007 Plan:
Nonvested Shares | Shares | |||
Non-vested shares at October 1, 2008 | 50,000 | |||
Granted | 730,789 | |||
Vested | (40,000 | ) | ||
|
| |||
Non-vested shares at September 30, 2009 | 740,789 | |||
Granted | 495,000 | |||
Forfeited | (15,000 | ) | ||
Vested | (295,000 | ) | ||
|
| |||
Non-vested shares at September 30, 2010 | 925,789 | |||
Granted | 305,000 | |||
Forfeited | (65,789 | ) | ||
Vested | (432,500 | ) | ||
|
| |||
Non-vested shares at September 30, 2011 | 732,500 | |||
|
| |||
94
Table of Contents
Fair Value Measurement and Valuation Methodologies
Valuation of Common Stock.Since our common stock is not publicly traded, the terms of the 2007 Plan require that our board or a committee of the board, as plan administrator, determine the fair market value of a share of our common stock. The determination is based in part upon the recommendation of our CEO and an independent third-party appraisal that is obtained at least annually and is reassessed by the plan administrator at least semi-annually. The table below summarizes equity awards granted by the Company and the valuation of our common stock as determined by the plan administrator for fiscal years 2008 through 2011:
| Option Grants | ||||||||||||||||||||
Period | Fair Value of Common Stock | Number | Exercise Price | RSU Grants(2) | Fair Value at Date of Grant | |||||||||||||||
| (units granted and fair value in thousands) | ||||||||||||||||||||
Year ended September 30, 2008 | $ | 5.00 | 39,185 | $ | 5.00 | 110 | $ | 89,892 | ||||||||||||
Year ended September 30, 2009 | $ | 3.80 | 12,555 | $ | 3.80 | 331 | $ | 27,498 | ||||||||||||
2009 Stock option exchange—tendered(1) | (28,595 | ) | — | $ | (63,064 | ) | ||||||||||||||
2009 Stock option exchange—replacement | $ | 3.00 | 28,595 | $ | 3.00 | — | $ | 52,173 | ||||||||||||
Year ended September 30, 2010 | $ | 3.00 | 17,925 | $ | 3.00 | 345 | $ | 23,048 | ||||||||||||
Eight months ended May 31, 2011 | $ | 3.00 | 4,025 | $ | 3.00 | 215 | $ | 4,823 | ||||||||||||
Four months ended September 30, 2011 | $ | 4.40 | 2,845 | $ | 4.40 | 90 | $ | 4,924 | ||||||||||||
| (1) | Represents the original grant date fair value of stock options tendered for exchange under the stock option exchange program in November 2009. The replacement options issued included time-based and market-based multiple-of-money options. A complete discussion of the terms and conditions of the granted awards and the exchange offer is provided in Note 14, “Share-based Compensation,” to our consolidated financial statements included elsewhere in this prospectus. |
| (2) | Excludes 400,000 and 150,000 of RSUs granted with put features which are valued based on their put features. See Note 14, “Share-based Compensation,” to our consolidated financial statements included elsewhere in this prospectus. |
We considered numerous objective and subjective factors in valuing our common stock at each valuation date consistent with the guidance in the American Institute of Certified Public Accountants Practice Aid,Valuation of Privately-Held-Company Equity Securities Issued as Compensation, or the Practice Aid. These objective and subjective factors included, but were not limited to:
| • | arm’s-length sales of our common stock in privately negotiated transactions; |
| • | valuations of our common stock; |
| • | our stage of development and financial position; and |
| • | our future financial projections. |
Consistent with these objective and subjective factors, the plan administrator obtained independent third-party valuations. Other factors that went into the determination of the fair value of our stock price included: (1) our then current and projected financial performance, including the consideration of the potential outcomes of such performance and their corresponding impact on our common stock valuation, (2) general economic conditions, (3) our peer group of companies and their performance and (4) the volatility in equity markets.
In October 2007, the board estimated the fair value of the Company’s common stock to be $5.00 per share. This is consistent with the net book value of each share immediately following the closing of the Merger. The Practice Aid indicates that a third-party transaction between a willing buyer and a willing seller is the best indication of fair value. As Avaya Holdings Corp. has no material assets or standalone operations other than its ownership in Avaya Inc., we believe Avaya Holdings Corp.’s net investment in Avaya Inc. immediately after the
95
Table of Contents
Merger to be the best estimate of the fair value of the Company and that the resulting net book value per share of common stock to be the best estimate of the fair value of our common stock at the time of the Merger. At each grant date subsequent to the Merger until a new valuation was performed in October 2008, the plan administrator considered the objective and subjective factors discussed above and determined that the $5.00 value was a reasonable estimation of fair value.
Subsequent to fiscal year 2008, independent third-party valuations of the Company’s common stock were performed as of October 15, 2008, September 30, 2009, September 30, 2010 and May 31, 2011. The valuations prepared used a weighted-average value calculated under two different valuation approaches, the income approach and market approach, to determine the value of the Company’s common stock.
The Income Approach quantifies the future cash flows that management expects to achieve consistent with our annual business plan and forecasting process. These future cash flows are discounted to their net present values using a rate corresponding to an estimated weighted-average cost of capital. The discount rate reflects the risks inherent in the cash flows and the market rates of return available from alternative investments of similar type and quality as of the valuation date. Our weighted average cost of capital is calculated by weighting the required returns on interest-bearing debt and common equity capital in proportion to their estimated percentages in our capital structure as well as the capital structure of comparable publicly-traded companies. The weighted average cost of capital assumption utilized in the valuations of the Company ranged from 11% to 13%.
The Market Approach considers the fair value of an asset based on the price at which comparable assets have been purchased under similar circumstances. The market approach used relies on published transactions, based on a weighted average of multiples of actual and forecasted revenue and actual and forecasted EBITDA, which is consistent with the primary performance indicators underlying our annual business plan and forecasting process. The multiples were determined based on trading multiples of a peer group of companies that are periodically reviewed by management for consistency with our business strategy, the businesses and markets in which we operate, and our competitive landscape. For the valuations performed, the multiples of actual and forecasted revenue utilized ranged from 1.3 times to 2.0 times and actual and forecasted EBITDA utilized ranged from 6.2 times to 12.4 times. These multiples were then adjusted for specific characteristics of the Company such as size, projected growth and EBITDA Percentage as it relates to our peer group. Additionally, a 10% “equity control premium” was applied in order to estimate the value of equity on a marketable, controlling basis, as the peer group included only widely-held publicly traded companies and we are controlled by the Sponsors.
We believe both of these approaches provide reliable estimates of the Company’s operating value and have historically yielded consistent estimated operating values for our Company. Therefore we apply an equal weighting to each approach and have not applied a discounting factor for the lack of marketability of the common stock for being a private company.
The independent third-party valuations yielded an estimated Company value attributable to our common stock of $2.1 billion, $1.0 billion, $1.3 billion and $2.3 billion and an implied per share value of $4.38, $1.96, $2.71 and $4.28 at October 15, 2008, September 30, 2009 September 30, 2010 and May 31, 2011, respectively. In addition, the plan administrator considered input from management and the CEO as well as other factors when assessing fair value, including: (1) our then current and projected financial performance, and the consideration of the potential outcomes of such performance, (2) general economic conditions, (3) the performance of our peer companies and (4) volatility in the equity markets. The independent third-party valuations as of September 30, 2009 did not consider the results of NES, which was consummated in December 2009. However, management and the plan administrator did consider the likelihood of consummating the acquisition of NES in valuing our common stock in October 2009. Based on those considerations, the plan administrator valued our common stock at $3.80, $3.00, $3.00 and $4.40 in November 2008, October 2009 December 2010 and May 2011, respectively.
96
Table of Contents
For each grant date subsequent to the then most recent valuation, the plan administrator considered whether it was necessary to update the estimated fair value considering, among other factors, financial performance, changes in general economic conditions and recent business and industry developments. Based on a consideration of these factors, the plan administrator determined that the latest value was a reasonable estimate of fair value at each grant date.
During fiscal year 2008 and the first half of fiscal year 2009, the global economy experienced a downturn, which negatively affected most markets. Several of our customers and competitors reduced their financial outlooks or disclosed that they were experiencing very challenging market conditions with little visibility of a rebound. Indications were that enterprises were not willing to spend on enterprise communications technology, and the revenue growth experienced in previous years was not expected in the near term. As demonstrated by the Company’s results, the demand for products fell as revenues were down when compared to the same period of the prior year. Cutbacks in spending, access to credit, employment variability, corporate profit growth, interest rates, energy prices, and other factors in specific markets were expected to further impact customer willingness to spend on communications technology in the near term. As a result, the Company’s projected future cash flows indicated a loss in fair value and in September 2008 and March 2009, the Company recognized goodwill impairments of $899 million and $235 million, respectively. We believe that these factors support the decline in the fair value of our common stock from $5.00 to $3.80 and subsequently to $3.00 and that these declines were consistent with the trends in our business and the global economy at that time.
Although the global economic downturn during 2008 and 2010 negatively affected most of the markets we serve, during this period we maintained our focus on profitability levels and investing in our future results. Additionally, market conditions improved globally during the period December 2010 through May 2011. Equity markets in general demonstrated growth and interest rates declined during this period. These trends had a significant effect on the value of our equity and accordingly the Board of Directors reassessed its valuation of the Company’s common stock in accordance with the provisions of the 2007 Plan and in May 2011 established its fair value at $4.40 per share. The increase in our valuation was primarily driven by two factors: (1) the decrease in interest rates, which contributed to the decrease in the estimated weighted average cost of capital used to discount our estimated future cash flows under the income approach, and (2) the improvements in the equity markets during the period December 2010 through May 2011, which increased the multiples used under the market approach.
As more fully discussed in Note 14, “Share-based Compensation,” to our consolidated financial statements included elsewhere in this prospectus, in November 2009, the plan administrator approved a stock option exchange program through which individuals holding stock options having exercise prices of $5.00 and $3.80 per share could exchange them on a one-option-for-one-option basis, for replacement options with an exercise price of $3.00 per share, the fair market value as of the underlying shares. The exchange offer was closed on November 16, 2009 and 28,595,000 options were tendered for exchange. As a result of the stock option exchange program, substantially all outstanding options as of May 31, 2011 have an exercise price of $3.00 per share, based on the fair market value of the underlying shares at the time granted. All options and RSUs issued subsequent to May 31, 2011 through September 30, 2011 were issued assuming the fair value of the underlying common shares is $4.40.
Valuation of Option Awards.The fair value of option awards is determined at the date of grant utilizing the Cox-Ross-Rubinstein binomial option pricing model which is affected by the fair value of the Company’s stock as well as a number of complex and subjective assumptions. Expected volatility is based primarily on a combination of the Company’s peer group’s historical volatility and estimates of implied volatility of the Company’s peer group. The risk-free interest rate assumption was derived from reference to the U.S. Treasury Spot rates for the expected term of the stock options. The dividend yield assumption is based on the Company’s current intent not to issue a dividend under its dividend policy. The expected holding period assumption was estimated based on the Company’s historical experience.
97
Table of Contents
The assumptions used in calculating the fair value of stock-based awards represent our best estimates, but these estimates involve inherent uncertainties and the application of management’s judgment. Some of the critical assumptions used in estimating the grant date fair value are presented in the table below:
| Year Ended September 30, 2008 | Year Ended September 30, 2009 | Year Ended September 30, 2010 | Eight Months Ended May 31, 2011 | Four Months Ended September 30, 2011 | ||||||||||||||||
Expected life (years) | 5 | 5 | 5 | 5 | 5 | |||||||||||||||
Risk-free interest rate | 3.93 | % | 2.24 | % | 2.28 | % | 1.64 | % | 1.48 | % | ||||||||||
Expected dividend yield | 0 | % | 0 | % | 0 | % | 0 | % | 0 | % | ||||||||||
Expected volatility | 46.5 | % | 63.94 | % | 51.01 | % | 47.82 | % | 48.55 | % | ||||||||||
Under the 2007 Plan, the exercise price of stock options cannot be set at a price below the estimated fair market value of our common stock on the date of grant.
New Accounting Guidance Recently Adopted
Business Combinations and Noncontrolling Interests
In the first quarter of fiscal year 2010, the Company adopted new guidance under the acquisition method for business combinations. The more significant changes include: an expanded definition of a business and a business combination; recognition of acquisition-related expenses and restructuring costs separately from the business combination; recognition of assets acquired and liabilities assumed at their acquisition-date fair values with subsequent changes recognized in earnings; and capitalization of in-process research and development at fair value as an indefinite-lived intangible asset. The guidance also amends and clarifies the application issues on initial recognition and measurement, subsequent measurement and accounting, and disclosure of assets and liabilities arising from contingencies in a business combination. The impact of the revised accounting guidance on the Company’s results of operations and financial position will vary depending on each future specific business combination or asset purchase.
Effective the first quarter of fiscal year 2010, the Company adopted revised accounting guidance which requires noncontrolling interests (formerly minority interest) to be presented as a separate component within the equity section of the Consolidated Balance Sheets and separate presentation of net income attributable to noncontrolling interests on the Consolidated Statements of Operations. The relevant presentation and disclosures have been applied retrospectively for all periods presented. The adoption of this accounting guidance did not have a material impact on the Company’s consolidated financial statements.
Fair Value Measures
In September 2006, the FASB issued an accounting standard related to fair value measurements of financial and non-financial assets and liabilities. The provisions of the standard applicable to financial assets and liabilities were effective and adopted by the Company on October 1, 2008. On October 1, 2009 the provisions of this standard became effective for the Company’s non-financial assets and liabilities. The adoption of this accounting guidance did not have a material impact on the Company’s consolidated statement of operations.
In January 2010, the FASB issued revised guidance intended to improve disclosures related to fair value measurements. This guidance requires new disclosures and clarifies certain existing disclosure requirements. New disclosures under this guidance require separate information about significant transfers into and out of Level 1 and Level 2 and the reasons for such transfers, and also require purchases, sales, issuances, and settlements information for Level 3 measurements to be included in the rollforward of activity on a gross basis.
98
Table of Contents
The guidance also clarifies the requirement to determine the level of disaggregation for fair value measurement disclosures and the requirement to disclose valuation techniques and inputs used for both recurring and nonrecurring fair value measurements in either Level 2 or Level 3. This accounting guidance became effective for the Company beginning in the second quarter of fiscal year 2010, except for the rollforward of activity on a gross basis for Level 3 fair value measurements, which will be effective for the Company in the first quarter of fiscal year 2012. The adoption of this accounting guidance is reflected in Note 11, “Fair Value Measures,” and did not have a material impact on the Company’s financial statement disclosures.
In August 2009, the FASB issued guidance to clarify the fair value measurements and disclosure requirements related to the measurement of liabilities at fair value. The guidance provides clarification that in circumstances in which a quoted price in an active market for the identical liability is not available, a reporting entity is required to measure fair value using one or more of the following methods: 1) a valuation technique that uses a) the quoted market price of the identical liability when traded as an asset or b) quoted prices for similar liabilities or similar liabilities when traded as assets and/or 2) a valuation technique that is consistent with the principles of FASB ASC Topic 820, “Fair Value Measurements and Disclosures.” The accounting guidance became effective for the Company beginning in fiscal year 2010. The adoption of this accounting guidance did not have a material impact on the Company’s consolidated statement of operations.
Intangibles-Goodwill and Other
In April 2008, the FASB issued guidance on the determination of useful lives of intangible assets, which amends the factors that should be considered in developing renewal or extension assumptions used to determine the useful life of an intangible asset. This guidance applies prospectively to intangible assets that are acquired individually or with a group of other assets in business combinations or asset acquisitions. The guidance became effective for the Company beginning in fiscal year 2010. The adoption of this guidance did not have a material impact on the Company’s consolidated financial statements.
Compensation-Retirement Benefits
In December 2008, the FASB issued guidance related to employers’ disclosure about postretirement benefit plan assets. The guidance requires enhanced disclosures to provide users of financial statements with an understanding of (i) how investment allocation decisions are made, (ii) major categories of plan assets, (iii) how fair value of plan assets is measured, (iv) the effect of fair value measurements on changes in plan assets during a period and (v) significant concentrations of risk within plan assets. The accounting guidance became effective for the Company for the fiscal year ending on September 30, 2010. The adoption of this accounting guidance is reflected in Note 13, “Benefit Obligations,” and did not have a material impact on the Company’s financial statement disclosures.
Revenue Recognition
In April 2010, the FASB issued accounting guidance on the milestone method of revenue recognition. The guidance defines the term “milestone” and the prescribed criteria that should be met to apply the milestone method of revenue recognition for research or development transactions. The guidance requires that the milestone should meet all criteria to be considered substantive to recognize consideration that is contingent upon the achievement of a milestone in its entirety as revenue in the period in which the milestone is achieved. This accounting guidance became effective for the Company beginning October 1, 2010. The adoption of this accounting guidance did not have an impact on the Company’s consolidated financial statements.
In October 2009, the FASB amended the software revenue recognition guidance to remove from its scope tangible products containing software components and non-software components that function together to deliver the product’s essential functionality. The FASB also amended the guidance for multiple deliverable revenue arrangements (formerly Emerging Issues Task Force No. 08-1) to: (i) provide updated guidance on how the
99
Table of Contents
deliverables in an arrangement should be separated and how the consideration should be allocated; and (ii) change the term “fair value” to “selling price” and require an entity to allocate revenue using the estimated selling prices of the deliverables when a vendor does not have vendor-specific or third-party evidence of selling price. The Company adopted the new guidance on a prospective basis as of the beginning of fiscal year 2011 for revenue arrangements entered into or materially modified on or after October 1, 2010.
The new guidance did not generally change the units of accounting for the Company’s revenue transactions as delivered and undelivered items generally qualified as separate units of accounting under the historical guidance. The new guidance affects the timing of revenue recognition for multiple deliverable arrangements that included delivered items and undelivered items for which the Company was unable to demonstrate fair value pursuant to the historical guidance. In such cases, the delivered items were combined with the undelivered items to form a single unit of accounting and revenue was recognized either on a straight-line basis over the services period or deferred until the earlier of when the fair value requirements were met or when the last item was delivered. In addition, the Company previously used the residual method to allocate the arrangement consideration in cases where fair value could only be determined for the undelivered items. Under the new guidance, the Company allocates the total arrangement consideration based upon the relative selling price of each deliverable and revenue is recognized as each item is delivered. As a result of adopting the new guidance, net revenues for the fiscal year ended September 30, 2011 were not materially different from the net revenues that would have been recorded under the historical guidance. The Company cannot reasonably estimate the effect of adopting the new guidance on future financial periods as the impact will vary depending on the nature and volume of new or materially modified multiple deliverable arrangements in any given period.
The Company derives revenue primarily from the sale of products, software and services for communications systems and applications. The Company’s products are sold directly through its worldwide sales force and indirectly through its global network of distributors, dealers, value-added resellers and systems integrators. Services includes (i) supplemental maintenance service, including services provided under contracts to monitor and optimize customers’ communications network performance; (ii) professional services for implementation and integration of converged voice and data networks, network security and unified communications; and (iii) operations services. Maintenance contracts typically have terms that range from one to five years. Contracts for professional services typically have terms that range from two to four weeks for standard solutions and from six months to one year for customized solutions. Contracts for operations services typically have terms that range from one to seven years.
In accordance with GAAP, revenue is recognized when persuasive evidence of an arrangement exists, delivery has occurred, the fee is fixed or determinable, and collectability is reasonably assured. For arrangements that require final acceptance of the product, system, or solution as specified by the customer, revenue is deferred until all acceptance criteria have been met.
The Company’s indirect sales to distribution partners are generally recognized at the time of shipment if all contractual obligations have been satisfied. The Company accrues a provision for estimated sales returns and other allowances, including promotional marketing programs and other incentives as a reduction of revenue at time of sale.
The Company enters into multiple deliverable arrangements, which may include various combinations of products, software and services. Most product and service deliverables qualify as separate units of accounting and can be sold on a standalone basis. A deliverable constitutes a separate unit of accounting when it has standalone value and, where return rights exist, delivery or performance of the undelivered items is considered probable and substantially within the Company’s control.
100
Table of Contents
Most of the Company’s solutions have both software and non-software components that function together to deliver the products’ essential functionality. For these multiple deliverable arrangements, the Company allocates revenue to the deliverables based on their relative selling prices. To the extent that a deliverable is subject to specific guidance on whether and/or how to allocate the consideration in a multiple deliverable arrangement, that deliverable is accounted for in accordance with such specific guidance. The Company limits the amount of revenue recognition for delivered items to the amount that is not contingent on the future delivery of products or services or meeting other future performance obligations.
The Company allocates revenue based on a selling price hierarchy of vendor-specific objective evidence, third-party evidence, and then selling price. Vendor-specific objective evidence is based on the price charged when the deliverable is sold separately. Third-party evidence is based on largely interchangeable competitor products or services in standalone sales to similarly situated customers. As the Company is unable to reliably determine what competitors products’ selling prices are on a standalone basis, the Company is not typically able to determine third-party evidence. Estimated selling price is based on the Company’s best estimates of what the selling prices of deliverables would be if they were sold regularly on a standalone basis. Estimated selling price is established considering multiple factors including, but not limited to, pricing practices in different geographies and through different sales channels, major product and services groups, and customer classifications.
Once the Company allocates revenue to each deliverable, the Company recognizes revenue in accordance with its policies when all revenue recognition criteria are met. Products revenue is generally recognized upon delivery and services revenue is generally recognized ratably over the period during which the services are performed. However, revenue for professional services arrangements is generally recognized upon delivery or completion of performance and revenue for arrangements that require final acceptance of the product, system, or solution, is generally deferred until all acceptance criteria have been met.
Standalone or subsequent sales of software or software-related products are recognized in accordance with the software revenue recognition guidance. For multiple deliverable arrangements that only include software items, the Company generally uses the residual method to allocate the arrangement consideration. Under the residual method, the amount of consideration allocated to the delivered items equals the total arrangement consideration, less the fair value of the undelivered items. Where vendor-specific objective evidence for the undelivered items cannot be determined, the Company defers revenue until all items are delivered and services have been performed, or until such evidence of fair value can be determined for the undelivered items.
Recent Accounting Guidance Not Yet Effective
In December 2010, the FASB issued revised guidance which requires that if a company presents pro forma comparative financial statements for business combinations, the company should disclose revenue and earnings of the combined entity as though the business combination(s) that occurred during the current year had occurred as of the beginning of the comparable prior annual reporting period only. This guidance also expands the supplemental pro forma disclosures to include a description of the nature and amount of material, nonrecurring pro forma adjustments directly attributable to the business combination included in the reported pro forma revenue and earnings. This accounting guidance is effective for the Company on a prospective basis beginning in fiscal year 2012. The adoption of this guidance is not expected to have a material impact on the Company’s financial statement disclosures.
In December 2010, the FASB issued revised guidance on when a company should perform step two of the goodwill impairment test for reporting units with zero or negative carrying amounts. This guidance requires that for reporting units with zero or negative carrying amounts, a company is required to perform step two of the goodwill impairment test if it is more likely than not that a goodwill impairment exists. In determining whether it is more likely than not that a goodwill impairment exists, an entity should consider whether there are any adverse qualitative factors indicating that an impairment may exist. This accounting guidance is effective for the Company beginning in fiscal year 2012. The adoption of this guidance is not expected to have a material impact on the Company’s consolidated financial statements.
101
Table of Contents
In May 2011, the FASB issued revised guidance which is intended to achieve common fair value measurement and disclosure guidance in GAAP and International Financial Reporting Standards. The majority of the changes represent a clarification to existing GAAP. Additionally, the revised guidance includes expanded disclosure requirements. This accounting guidance is effective for the Company beginning in the second quarter of fiscal year 2012 and is not expected to have a material impact on the Company’s consolidated financial statements or financial statement disclosures.
In June 2011, the FASB issued revised guidance on the presentation of comprehensive income and its components in the financial statements. As a result of the guidance, companies will now be required to present net income and other comprehensive income either in a single continuous statement or in two separate, but consecutive statements. This standard eliminates the current option to report other comprehensive income and its components in the statement of changes in equity. The standard does not, however, change the items that must be reported in other comprehensive income or the determination of net income. The new guidance is to be applied retrospectively. This accounting guidance is effective for the Company beginning in fiscal year 2013 and is only expected to impact the presentation of the Company’s financial statements.
In September 2011, the FASB issued revised guidance intended to simplify how an entity tests goodwill for impairment. As a result of the guidance, an entity will be allowed to first assess qualitative factors to determine whether it is necessary to perform the two-step quantitative goodwill impairment test. An entity will not be required to calculate the fair value of a reporting unit unless the entity determines, based on a qualitative assessment, that it is more likely than not that its fair value is less than its carrying amount. The accounting guidance is effective for the Company beginning in fiscal year 2013 and early adoption is permitted. The accounting guidance is not expected to have a material impact on the consolidated financial statements or financial statement disclosures.
In September 2011, the FASB issued revised guidance that requires additional disclosure about an employer’s participation in a multiemployer pension plan. The accounting guidance is effective for the Company for fiscal year 2012 and is to be applied retrospectively for all prior periods presented. The accounting guidance is not expected to have a material impact on the Company’s consolidated financial statement disclosures.
Quantitative and Qualitative Disclosure About Market Risk
Foreign Currency Impact on Revenue
Our revenues outside of the U.S. were 46%, 45% and 45% of total revenue for the fiscal years ended September 30, 2011, 2010 and 2009, respectively. Any strengthening of the U.S. dollar against other currencies, particularly the euro, will have a negative impact on our reported revenues and, to a lesser degree, on our profitability. Conversely, any weakening of the U.S. dollar will have a positive impact. Revenues for the fiscal year ended September 30, 2009 included an unfavorable foreign currency impact of 4% when compared to fiscal year ended September 30, 2008. Revenues for the fiscal year ended September 30, 2010 included a favorable foreign currency impact of 1% when compared to fiscal year ended September 30, 2009. Revenues for the fiscal year ended September 30, 2011 included a favorable foreign currency impact of 2% when compared to the fiscal year ended September 30, 2010.
Foreign Currency Transactions
Recorded Transactions—We utilize foreign currency forward contracts primarily to manage short-term exchange rate exposures on certain receivables, payables and loans residing on foreign subsidiaries’ books, which are denominated in currencies other than the subsidiary’s functional currency. For fiscal years 2011, 2010, and 2009 the changes in the fair value of the foreign currency forward contracts were substantially offset by changes resulting from the revaluation of the hedged items.
102
Table of Contents
The fair value of foreign currency forward contracts is sensitive to changes in currency exchange rates. A 10% upward shift in the value of the foreign currencies that we trade against from the prevailing market rates would have had a negative impact of $9 million, $3 million and $9 million for fiscal years 2011, 2010 and 2009, respectively. A 10% downward shift in the value of the foreign currencies that we trade against from the prevailing market rates would have had a positive impact of $9 million, a negative impact of $28 million, and a positive impact of $8 million for fiscal years 2011, 2010 and 2009, respectively.
Forecasted Transactions—From time to time, we use foreign currency forward contracts to offset certain forecasted foreign currency transactions primarily related to the purchase or sale of product expected to occur during the ensuing twelve months. The change in the fair value of foreign currency forward contracts is recognized as other income or expense in the period in which the exchange rates change. For fiscal years 2011, 2010 and 2009, these gains and losses were not material to our results of operations.
Interest Rate Risk
The Company uses interest rate swaps to manage the amount of its floating rate debt in order to reduce its exposure to variable rate interest payments associated with the senior secured credit facility. In connection with the debt arrangements entered into upon closing of the Merger, the Company entered into five interest rate swap agreements in November 2007, or the 2007 swaps. These swaps had an aggregate notional amount of $2,400 million. One of the 2007 swaps with a notional amount of $200 million matured on November 26, 2008, one with a notional amount of $700 million matured on November 26, 2009, and one with a notional amount of $1,000 million matured on November 26, 2010. On March 5, 2008 the Company entered into two additional interest rate swaps, or the 2008 swaps, with an aggregate notional amount of $800 million. One of the 2008 swaps with a notional amount of $550 million matured on November 27, 2009, and one with a notional amount of $250 million matured on November 26, 2010. On August 23, 2010 the Company entered into two additional interest rate swaps, or the 2010 swaps, with an aggregate notional amount of $1,500 million. On August 26, 2011 the Company entered into one interest rate swap with a notional amount of $1.5 billion, which matures on November 26, 2011. At September 30, 2011 the outstanding notional amount of these swap agreements was $3.5 billion. Subsequent to September 30, 2011, we chose to let swap agreements with aggregated notional amounts of $1.7 billion expire pursuant to their terms. The remaining outstanding swap agreements with notional amounts aggregating $1.8 billion expire through August 2013. The Company pays the counterparty fixed interest payments for the term of the swap, and receives variable interest payments based on three-month LIBOR from the counterparties. The net receipt or payment from the interest rate swap agreements is included in interest expense and is paid on the 26th day of each February, May, August and November. As of September 30, 2011, a 0.125% change in interest rates would result in a change in our annual interest expense of less than $1 million. Upon the expiration of two of our interest rate swap agreements in November 2011, a 0.125% change in interest rates would have resulted in a change in our annual interest of $2 million.
See Note 10, “Derivatives and Other Financial Instruments,” to our consolidated financial statements appearing elsewhere in this prospectus for further details related to these interest rate swap agreements.
103
Table of Contents
Our Company
We are a leading global provider of next-generation business collaboration and communications solutions that bring people together with the right information at the right time in the right context, enabling business users to improve their efficiency and quickly solve critical business challenges. Our solutions are designed to enable business users to work together more effectively as a team internally or with their customers and suppliers, increasing innovation, improving productivity and accelerating decision-making and business outcomes.
We develop software and hardware products and offer related services that we market and sell directly and through our channel partners as part of our collaboration and communications solutions for large enterprises, small- and mid-sized businesses and government organizations. Our software delivers rich value-added applications for enterprise collaboration and communications, including messaging, telephony, voice, video and web conferencing, mobility and customer service. These applications operate on our own hardware, which includes a broad range of desk phones, servers and gateways, and LAN/WAN switching wireless access points and gateways, as well as on third-party devices, including desk phones, tablets and desktop PCs. In addition, our award-winning portfolio of services supports our products to help customers achieve enhanced business results both directly and indirectly through partners. We have a long track record of innovation and our customers historically have relied on us to deliver mission critical communications solutions. Market opportunities associated with our business collaboration and communications solutions include spending on unified communications (which includes, among others, enterprise telephony and messaging), contact center applications and data networking equipment, as well as spending on support and maintenance services to implement and support these tools, which are expected to represent a $77 billion market in 2011 in the aggregate.
We are highly focused on and structured to serve our core business collaboration and communications markets with fit-for-purpose products, targeted sales coverage, and distributed software services and support models. We offer solutions in five key business collaboration and communications product categories:
| • | Unified Communications Software, Infrastructure and Endpoints; |
| • | Real Time Video Collaboration; |
| • | Contact Center; |
| • | Data Networking; and |
| • | Applications, including their Integration and Enablement. |
Our next-generation business collaboration solutions are designed to be highly scalable, flexible and easy to manage. They can be deployed in numerous ways including on a customer’s own premise, in the cloud and in a virtualized environment. Our research and development investments are focused on software at the user experience and business application layers, and software and hardware at the infrastructure layer and endpoints. In addition, we are investing in software for monitoring, troubleshooting and managing distributed communications architectures that we believe will reduce the total cost of ownership and improve end-to-end serviceability of our solutions versus our competitors.
Through our next-generation collaboration solutions, including Avaya Aura, our SIP-based software suite that brings together voice, video and data into a single, integrated communications and collaboration platform, we are reshaping our product portfolio to continue to grow our business. SIP, or Session Initiation Protocol, is a signaling protocol used to establish voice, video or data communication sessions over an IP network. Over the past several years, we have invested significantly in research and development, introducing more than 70 new product offerings to the market since the beginning of fiscal year 2010. We have reshaped our product portfolio through this investment and innovation in order to drive revenue growth and business model cash cycle time. In addition, our portfolio of business collaboration and communications solutions is designed to deliver an intuitive and personalized user experience, seamlessly integrating various modes of communications and collaboration,
104
Table of Contents
including real-time voice, video, instant messaging and conferencing, and non real-time email, voicemail and social networking. These solutions target high growth market segments and we believe accelerate our sales cycle as customers more frequently upgrade their solutions to take advantage of our ongoing product innovation and to deploy our user experience across an array of endpoints, including our own and those of other vendors. We have further enhanced our business through acquisitions that have amplified our innovation and growth strategy. In addition, we have restructured or divested businesses that dilute our focus from our principal markets.
We are also engaged in a critical strategic initiative to leverage our sales and distribution channels to accelerate customer adoption and generate an increasing percentage of our revenue from these new high value software solutions and user experience-centric applications. We are expanding our sales coverage model, including both partners and direct sales, while supporting our customers’ channel preference. In December 2009, we acquired NES, which expanded our customer base, broadened and strengthened our indirect sales channel, enhanced our technology portfolio, established our leading presence in data communications and improved our ability to compete globally.
Our market leadership in next-generation business collaboration is due in part to our long-standing heritage of delivering mission critical unified communications, contact center and voice communications solutions. As a market leader in enterprise voice telephony and messaging for more than 10 years and in unified communications for the past four years, we believe that our VoIP solutions have enabled customers to centralize communications applications and hardware to serve geographically dispersed users, significantly reducing management cost, complexity and annual spend to telecommunication service providers. Leveraging this experience, we have now developed innovative, next-generation unified communications and contact center solutions that focus on business collaboration and, unlike earlier solutions, are designed from the ground up to support multiple media and modes of communication, reducing cost and complexity while improving collaboration effectiveness. The experience that we are delivering provides a rich environment in which users can find the right individuals and the right information by accessing the context of their communications sessions, including call history, conversation threads across email, voice and other media, related documents, directories and other relevant data.
Significant industry trends are driving enterprises to seek 24x7, device and location agnostic collaboration solutions to increase employee productivity, reduce costs and gain competitive advantages in the marketplace. In addition, businesses that have grown through acquisition or that lack central controls on infrastructure often are left with inefficient, disparate communications infrastructure needing consolidation. As a result of these trends, we believe that enterprises require a holistic, next-generation business collaboration solution that is designed from the ground up to facilitate collaboration, or fit-for-purpose, and incorporates enterprise-class stability, scalability and security. SIP provides a basis to address this need. SIP is a fundamental architectural building block of Avaya Aura, our next-generation, enterprise-class collaboration platform, because it shifts communications from voice-centric, dedicated media channels, as was the case in legacy communication environments, toward session-based environments, where multiple people, media and resources can be brought together into an integrated communications session. In addition to decoupling collaboration solutions from the user’s geographical location and allowing consolidation of infrastructure in the data center, our next-generation business collaboration solutions take the critical next step of replacing the voice-centric call control used by traditional VoIP and unified communications solutions with standards-based SIP session management. This decouples communications applications from the underlying infrastructure and supports both multiple media and modes of communication over the same session. Our Avaya Aura Session Manager architecture is designed to allow collaboration applications to be rapidly developed, tightly integrated, run anywhere in the network and be managed more easily than traditional unified communications solutions. Avaya Aura Contact Center solutions also leverage our session management architecture and apply these principles to customer interactions. We believe our Avaya Aura architecture embraces and attracts software application partners. In addition, our award-winning, global services-delivery infrastructure helps customers address their critical needs from initial planning and design, through implementation, monitoring and maintenance.
Enterprise IT infrastructure has historically included only devices developed specifically for enterprise customers and installed, owned and managed by enterprise IT departments. However, with business users
105
Table of Contents
bringing consumer-focused devices into the enterprise, sometimes owned and managed by the individual users themselves, IT professionals increasingly require that these devices are reliably integrated, supported and secured. We believe that we are at the forefront of this industry trend. For example, in September 2010 we released our Avaya Flare Experience, a real-time, enterprise video communications and collaboration solution, which offers an intuitive, easy-to-use experience. The Avaya Flare Experience is currently available on our own Desktop Video Device and is expected to be made available on consumer devices such as Apple iPad and Google Android tablets, Windows laptops and other consumer device classes and platforms. The Avaya Flare Experience is designed to help break down the barriers commonly seen in today’s communications and collaboration tools with a distinctive user interface for quick, device-agnostic, easy access to voice and video, social media, presence, instant messaging, audio/video/web conferencing and a consolidated view of multiple directories and context history. The Avaya Flare Experience provides enterprise users with the sophisticated enterprise-class functions they need on the devices they prefer, while also providing enterprise IT departments with the control, compliance and reporting functions they require.
Our solutions address the needs of a diverse range of customers, including large multinational enterprises, small- and medium-sized businesses and government organizations. As of September 30, 2011, we had over 400,000 customers, including more than 90% of the Fortune 500 companies and one million customer locations worldwide. Our customers operate in a broad range of industries, including financial services, manufacturing, retail, transportation, energy, media and communications, healthcare, education and government, and include, among others, Morgan Stanley & Co. LLC, Progressive Casualty Insurance Company, Whirlpool Corporation, The Hewlett-Packard Company, Home Depot, Inc., United Air Lines, Inc., Marriott International, Inc., the Blue Cross and Blue Shield Association, Australia National University and the FDIC. We employ a flexible go-to-market strategy with direct and indirect presence in over 160 countries. As of September 30, 2011, we had approximately 9,100 channel partners and for fiscal year 2011, our product revenue from indirect sales represented approximately 76% of our total product revenue.
For fiscal years 2011 and 2010, we generated revenue of $5,547 million and $5,060 million, respectively. For fiscal year 2011, product revenue represented 54% of our total revenue and services revenue represented 46%. For fiscal year 2010, product revenue represented 51% of our total revenue and services revenue represented 49%. Revenue generated in the United States for fiscal years 2011 and 2010 was 54% and 55%, respectively. For fiscal years 2011 and 2010, we had a net loss of $863 million and $871 million, respectively, and Adjusted EBITDA of $971 million and $795 million, respectively. See “Management’s Discussion and Analysis of Financial Condition and Results of Operations—Non-GAAP Financial Measures and Supplemental Disclosure—EBITDA and Adjusted EBITDA” for a definition and explanation of Adjusted EBITDA and a reconciliation of net loss to Adjusted EBITDA.
Our Industry
Trends Driving Business Collaboration Spending
Enterprises are increasingly focused on deploying collaboration solutions in order to increase productivity, reduce costs and complexity and gain competitive advantages. The requirements of enterprises have evolved over the past few years in response to the following trends:
Increasingly Mobile and Connected Workforce Needs Anytime/Anywhere Collaboration Tools.According to a 2009 International Data Corporation, or IDC, report, the number of mobile workers worldwide is projected to increase 29% from 2008 to 2013, increasing the demand in today’s enterprise for both reliable wired and wireless access.(1) As enterprises move toward a more geographically dispersed, 24x7 workforce, they need tools to quickly solve business challenges while improving their efficiency. To do this, enterprises need collaboration technology that can bring people together with the right information at the right time in the right context to make
| (1) | IDC Worldwide PC 2011-2015 Forecast Update, Doc. #230192, September, 2011. |
106
Table of Contents
critical business decisions. These increasingly mobile workers need to be able to connect remotely to their business applications from wherever they are and demand the same experience and capabilities they have when at their office desk.
Proliferation of Devices and Applications Expanding the Number of Points of Integration.The number and types of endpoints are growing rapidly. Whereas in the past, business users communicated primarily via desk-phones, today they continue to use desk-based devices, but also various mobile devices such as laptops, smartphones and tablets. IDC reports from September and October 2011 forecasted the 211 million laptops used in 2011 will grow to 380 million in 2015(1), 475 million smartphones used in 2011 will grow to 1,033 million in 2015(2) and 63 million media tablets in use in 2011 will grow to 135 million in 2015(3). In order to communicate seamlessly and securely across these devices, applications and endpoints, collaboration solutions must be integrated into the communications infrastructure and provide a way for IT professionals to have a consolidated view of these devices and applications so that the environment can be managed effectively and reliably.
Consumerization of the Enterprise has Changed Expectations of Business Users and Put More Pressure on IT Departments.With the proliferation of consumer devices such as the AppleiPhone and iPad, Google Android smartphones and tablets and the RIM Blackberry, business applications available through online stores such as the Apple iTunes store and social networking applications such as Facebook and Twitter, business users are increasingly using consumer-focused products and applications for business tasks, particularly in the areas of collaboration and communication. This has put a significant strain on IT departments to support and secure these devices and applications within the enterprise. In addition, business users expect their enterprise IT solutions to mimic the intuitive experience they enjoy with their consumer devices and applications, forcing IT departments to seek solutions that can deliver this kind of experience and enterprise vendors to design their products so that they are easier to use.
Customer Expectations of Contact Centers and Customer Service are Changing.Customer interactions are evolving from voice-centric, point-in-time, contact center transactions to persistent customer conversations over multiple interactions and across multiple media and modes of communication. Customers expect enterprises to know about the history of their interactions, even when they occur across a mix of self-service and agent assisted communications methods including voice, video, email and chat. With the growth of social networking, customers are even beginning to expect that the most customer service focused companies will capture and react to their comments made through Twitter or Facebook postings.
Business Leaders are Increasingly Challenged to Deliver New Business Capabilities to Support Growth While Facing Tight IT Budgets.Business leaders continue to manage overall spending closely due to continued macro-economic uncertainty. At the same time, business leaders are making strategic IT investments to gain competitive advantage. As IT departments become increasingly sophisticated and strategically important within the enterprise, business leaders are increasingly held accountable to demonstrate an acceptable level of return for their IT investments. According to a March 2011 Gartner survey, two of the top five challenges for CIOs today are attracting and retaining new customers and improving productivity.(4) To meet these challenges, enterprises
| (1) | IDC Worldwide PC 2011-2015 Forecast Update, Doc. #230192, September, 2011. |
| (2) | IDC Worldwide Smartphone 2011-2015 Forecast Update, Doc. #230173, September, 2011. |
| (3) | IDC Worldwide and U.S. Media Tablet 2011-2014 Forecast Update, Doc. #230896, October, 2011. |
| (4) | Gartner, Inc., Executive Advisory: In Comparing Gartner’s Board, CEO and CIO Surveys, CIOs Take Last Year’s Challenge and Build for Growth, Jorge Lopez, March 25, 2011. |
Gartner does not endorse any vendor, product or service depicted in its research publications, and does not advise technology users to select only those vendors with the highest ratings. Gartner research publications consist of the opinions of Gartner’s research organization and should not be construed as statements of fact. Gartner disclaims all warranties, expressed or implied, with respect to this research, including any warranties of merchantability or fitness for a particular purpose.
The Gartner Report(s) described herein, (the “Gartner Report(s)”) represent(s) data, research opinion or viewpoints published, as part of a syndicated subscription service, by Gartner, Inc. (“Gartner”), and are not representations of fact. Each Gartner Report speaks as of its original publication date (and not as of the date of this prospectus) and the opinions expressed in the Gartner Report(s) are subject to change without notice.
107
Table of Contents
are deploying collaboration solutions that allow them to leverage their existing IT investments while providing a flexible roadmap to gradually upgrade their systems. In addition, CIOs are seeking to rationalize their network infrastructure and computing hardware to simplify their IT environments and reduce expenses while also increasing the reliability and scalability of their business collaboration and communications environments to avoid lost productivity and revenue due to systems outages.
Together these trends add to the complexity of enabling business collaboration, and drive business leaders to seek more simple, holistic solutions that are easy-to-use, scalable and cost-effective.
Business Collaboration Solutions of Our Competitors Do Not Adequately Address These Trends
Despite the aforementioned trends, competitors’ solutions still fall short of delivering a seamless real-time collaboration experience. Historically, enterprises deployed separate, independent systems to satisfy their communication needs, deploying a different system for voice, email and video usually from different vendors. This siloed approach to communications presents challenges when trying to enable seamless, real-time collaboration. Earlier solutions attempted to aggregate these disparate systems under a common user interface, but failed to integrate them from the ground up on a common platform. As a result, in our view, these solutions suffer from the following limitations:
Most Collaboration Solutions Today are One-Size-Fits-All and Often Cannot Accommodate Customers’ Specific Needs.Competitors’ collaboration solutions are not designed for the demands of unified communications. Many collaboration vendors see demand for unified communications as an opportunity to sell more of their core products by bundling their products with other communication systems, and loosely tying the systems together with a single interface. The resulting solutions are poorly architected, difficult to deploy and manage and do not deliver a seamless, real-time business collaboration experience. Also, because the solutions are not customized to customers’ specific needs, customers often have to integrate third-party technologies to address communication requirements that are not being met out of the box, adding to the overall complexity and cost of the solution.
Competitors’ Solutions were Built from an Email or Data Networking Focus, Not for Real-Time Collaboration. As organizations become more decentralized and decisions are increasingly made by groups rather than individuals, business users need to be able to collaborate and communicate in real-time while being able to access the information that they need. Many traditional collaboration tools fall short of their promise to enable cross-enterprise cooperation, often simply aggregating different modes of communication around their core competency (email or data) with a single interface to integrate the underlying architectures. As a result, users have a disjointed experience, where the different modes of communication are independent and do not share a common context. For example, an ongoing conversation between people within an enterprise or between an enterprise and their customers that includes emails, phone calls, instant messages and social media occurs over independent and unrelated applications in most competitor environments. As a result, these interactions cannot be seamlessly integrated in real-time or intelligently routed along with the conversation history across various modes and media. The limitations of existing solutions force users to fall back on using the various modes of communication independently, resulting in inefficient interactions and delays in solving complex business problems needing input from multiple constituents.
Traditional Solutions are Closed and Proprietary, Forcing Customers to use a Single Vendor and Abandon Existing IT Investments.Many of our competitors’ collaboration solutions use proprietary, closed architectures, which do not integrate well with those of other vendors. This forces customers to choose a platform that does not offer all the desired features and functionality and makes it difficult to integrate third-party applications to address broader enterprise requirements. As a result, customers often either have to abandon their existing infrastructure investments, or accept unnecessary levels of complexity and costs in order to deploy new infrastructure equipment and/or new applications. In addition, because these solutions employ proprietary architectures, it is difficult for developers to create third-party applications that can support them, giving the customer less flexibility and choice with respect to new functionality that may be introduced.
108
Table of Contents
Limited Consumer Device Support.We believe that because of their proprietary nature, competitors’ solutions do not easily lend themselves to enabling new consumer devices with seamless, real-time collaboration applications. These solutions lack the infrastructure to reliably integrate, support and secure these consumer devices and therefore inhibit the potential benefits these devices can bring to the enterprise.
Most Collaboration Solutions Vendors Lack an In-House Global Services Organization to Support Customers and Partners Through Implementation and Maintenance. Given the complexity of deploying a collaboration solution, many customers require some level of assistance to migrate from their current communications environment and may also require help to integrate the new system with their existing infrastructure and business applications. However, most collaboration vendors lack a full scale in-house services organization or the integration expertise to help customers and partners manage this transition. As a result customers are forced to contract with third-party service providers, adding to the overall cost and complexity of deployment.
High Total Cost of Ownership.Because many traditional solutions employ proprietary architectures, they require a significant investment in new infrastructure and significant customized integration to address communication requirements not met out of the box. In addition, because many of these solutions were not fit-for-purpose, they have loosely integrated systems that are difficult to deploy and manage and often require significant professional services support upfront and ongoing IT costs to manage and maintain. Such traditional solutions require more complex system integration and achieve reliability through the over deployment of equipment rather than the optimization of product. The result is reliability at a higher cost that is more difficult to scale as business needs change.
Addressable Market for Business Collaboration Solutions is Large and Growing
We believe that the trend toward a more mobile workforce and the proliferation of devices and applications creates a significant market opportunity for business collaboration. In addition, we believe that the limitations of traditional collaboration solutions present an opportunity for differentiated vendors to gain market share.
We believe that the business collaboration market includes spending on unified communications, contact center applications and data networking equipment as well as spending on support and maintenance services to implement and support these tools. Industry analysts project that in 2011, these markets will grow to $77 billion of spending in aggregate, with unified communications accounting for $14 billion, contact center accounting for $3 billion, data networking accounting for $25 billion and maintenance, managed and professional services accounting for the remaining $35 billion. All of these markets are impacted positively by the need for enterprises to increase productivity and upgrade their unified communications strategy to a more integrated approach. In response to this need, industry analysts expect that from 2011 through 2014 unified communications, contact center, data networking and maintenance, managed and professional services will grow at CAGRs of 5%, 5%, 4%, 2%, 6% and 8%, respectively.
Our Solutions
We are a leader in business collaboration and communications and are leveraging our leadership to recognize the challenges impacting our industry and innovate around them. We have created next-generation business collaboration solutions that offer an innovative approach, delivering our customers fit-for-purpose, open solutions that we believe enable them to experience enhanced levels of productivity at a lower total cost of ownership than our competitors. The key benefits of our solutions include:
Innovative Real-Time, Multimedia, Multi-Platform Collaboration Tools that Promote Business Collaboration.Our next-generation business collaboration and communications solutions are designed to provide our customers with the software and infrastructure needed to bring together the right people with the right information at the right time in the right context regardless of the communications technology, devices or location. Our solutions can seamlessly integrate different media, enabling interactions with simultaneous video, voice, instant messaging and content, as well as more efficient and effective business collaboration for real-time decision-making.
109
Table of Contents
Fit-For-Purpose Solutions that Offer an Enhanced User Experience, Productivity Benefits and Lower Total Cost of Ownership.We deliver comprehensive, fit-for-purpose solutions that are designed for the needs of today’s distributed, collaborative workforce, while addressing what we believe are the three key performance challenges for an enterprise-class communications environment: resiliency, efficiency and scalability. Most vendors try to address these demands by layering on more architectures and protocols. In the process, they sacrifice simplicity, flexibility and total cost of ownership. In contrast, our solutions are specifically designed to address these needs, require less hardware and perform better than our competitors.
Open Standards-Based Architecture that Enables Flexible and Extensible Collaboration.Our open standards-based solutions, including Avaya Aura, accommodate customers with multi-vendor environments seeking to leverage their existing investments and supplement what they have with the specific collaboration products and/or services they need, and rapidly create and deploy applications. Providing enterprises with strong integration capabilities gives them the flexibility to take advantage of new collaboration and contact center tools and devices as they are introduced, rather than being confined to a single vendor and having to compromise on functionality. We continue to invest in our developer ecosystem, Avaya DevConnect, which boasted over 16,500 members as of September 30, 2011. This, together with our Agile Communication Environment, or ACE, toolkits, application programming interfaces, or APIs, and integration environments allow businesses to derive unique value from our architecture.
Enterprise-Class Solutions that are Scalable, Secure, Reliable and Backed by Our Award-Winning Services.Our product portfolio has been designed to be highly reliable, secure and scalable and is backed by our award-winning global services. AGS is a leading provider of maintenance services relating to business collaboration and communications solutions, offering services support tools to help our customers monitor, troubleshoot and manage their infrastructure. In addition, AGS delivers managed and professional services, providing the integration expertise necessary to help customers migrate from their current communications environment to next-generation business collaboration and communications environments.
Centralized Application Integration and Management that Makes it Easier to Integrate, Deploy and Manage.Our solutions provide enterprises with the ability to perform integration and management tasks as part of a central service rather than from individual platforms, reducing the amount of time required to perform integration activities and to support and manage unified communications services. Enterprises also can make changes to unified communications services, which can be automatically populated and published throughout the environment, speeding up deployment of new services, infrastructure or unified communications applications.
By implementing our solutions, we believe customers benefit from:
| • | improved productivity, efficiency and decision-making of business users; |
| • | an easy-to-use and flexible solution that enables seamless communication across multiple modes and devices in real-time; |
| • | enterprise-class reliability, scalability and security backed by our award-winning global in-house services organization; |
| • | lower total cost of ownership; and |
| • | closer and more targeted communication with their customers. |
Our Competitive Strengths
In addition to the strengths of our solutions, we believe the following competitive strengths position us well to capitalize on the opportunities created by the market trends affecting our industry.
110
Table of Contents
Leading Position Across Our Key End Markets.We are a leader in business collaboration and communications, with leading market share in worldwide unified communications(5), contact center infrastructure(6), voice maintenance services(7) and enterprise messaging(8), and a position in the Leader’s quadrant in each of Gartner’s Magic Quadrants for Corporate Telephony, Unified Communications and Contact Center Infrastructure.(9) We believe that our market leadership and our incumbent position within our customer base will better enable us to cross-sell to existing customers and win new customers.
Large, Diverse and Global Customer Installed Base.Our solutions address the needs of a diverse range of customers from large multinational enterprises to small- and medium-sized businesses in a number of industries, including financial services, manufacturing, retail, transportation, energy, media and communications, health care, education and government. As of September 30, 2011, we had over 400,000 total customers, including more than 90% of the Fortune 500 companies and one million customer locations worldwide. We have thousands of direct customers and no end-user customers represented more than two percent of our revenue for the year ended September 30, 2011. In addition, many of our largest enterprise customers have been buying from us for over 10 years. We believe our large and diverse customer base provides us with recurring revenue and a continuing growth opportunity to further expand within our customer base.
History of Innovation with Large Pipeline of New Products and Differentiated Approach to Commercialization.We continue to innovate rapidly, expanding on our technical heritage from Bell Labs. As of September 30, 2011, we had approximately 5,600 patents and pending patent applications, including foreign counterparts. Our patents and pending patent applications cover a wide range of products and services covering a variety of technologies, including, but not limited to, unified communications (including video, social media, telephony and messaging), contact centers, wireless communications and data networking. Since the beginning of fiscal year 2010, we have introduced more than 70 new offerings across our portfolio, the largest product pipeline in our history. In March 2009, we introduced Avaya Aura, our SIP-based software suite that brings together voice, video and data into a single, integrated communications and collaboration platform that provides a simple means of connecting legacy, multi-vendor systems to new open standards SIP-based applications. In July 2010, we introduced Avaya Aura Contact Center, which forms the core of our SIP contact center technology, enabling multi-channel integration of social media, email, instant messaging and video applications. We introduced the Avaya Flare Experience in September 2010, demonstrating how simple and elegant communications can be and in November 2010 we introduced Avaya Virtual Enterprise Network Architecture, or Avaya VENA, an end-to-end virtualization strategy and architecture that will help simplify data center and campus networking. In order to accelerate the commercialization of innovation, we have modeled our Emerging Products and Technology team after smaller, entrepreneurial start-ups, leveraging our Avaya Labs research team and innovating together with our customers, understanding their challenges and collaborating on their visions. We believe that this approach to commercialization results in new products with broad appeal and accelerates the timeline for development and adoption.
| (5) | Dell’Oro Group, Enterprise Telephony Report, 2Q11, August, 2011. |
| (6) | Gartner, Inc., Market Share, Contact Center: Worldwide, 2010, Drew Kraus, May, 2011. Gartner ranks Avaya the leader in Contact Center Agent End-User Revenue by Manufacturer, Worldwide in 2010. |
| (7) | IntelliCom Analytics, Services Market Dashboard, Q2 2011 Global Lifecycle Services Market Workbook, September, 2011. |
| (8) | T3i Group, InfoTrack for Converged Applications, Full Year 2010, Messaging, April, 2011. |
| (9) | Gartner Magic Quadrants |
| • | Gartner Magic Quadrant for Corporate Telephony, Jay Lassman, et al, September, 2011. |
| • | Gartner Magic Quadrant for Unified Communications, Bern Elliot et al, August 2011. |
| • | Gartner Magic Quadrant for Contact Center Infrastructure, Worldwide, Drew Kraus, et al, June 2011. |
Gartner does not endorse any vendor, product or service depicted in its research publications, and does not advise technology users to select only those vendors with the highest ratings. Gartner research publications consist of the opinions of Gartner’s research organization and should not be construed as statements of fact. Gartner disclaims all warranties, expressed or implied, with respect to this research, including any warranties of merchantability or fitness for a particular purpose.
The Gartner Report(s) described herein, (the “Gartner Report(s)”) represent(s) data, research opinion or viewpoints published, as part of a syndicated subscription service, by Gartner, Inc. (“Gartner”), and are not representations of fact. Each Gartner Report speaks as of its original publication date (and not as of the date of thisprospectus) and the opinions expressed in the Gartner Report(s) are subject to change without notice.
111
Table of Contents
Flexible Go-to-Market Strategy Expands Reach of Our Products and Services.We sell our solutions both directly and through an indirect sales channel, tailoring our go-to-market strategy to our target markets. Our indirect sales channel is comprised of an extensive network of alliance partners, distributors, dealers, value-added resellers, telecommunications service providers and system integrators that allows us to reach customers across industries and globally. We have an extensive set of vertical specific solutions ranging from industries such as Finance/Insurance, Healthcare/Hospitality, Manufacturing and Retail. As of September 30, 2011, we had approximately 9,100 channel partners worldwide. Our indirect sales channel represented approximately 76% and 71% of our product revenues for the fiscal year ended September 30, 2011 and 2010, respectively. With the acquisition of NES, we significantly expanded our channel coverage and deepened our vertical expertise.
Global End-to-End Services Capability Provides Large Recurring Revenue Stream.AGS provides us with a key advantage over many of our competitors whose customers must contract with third-party service providers, adding to the overall cost and complexity of the deployment of their solutions. Our worldwide services-delivery infrastructure and services tools help customers address their critical business collaboration and communications needs from initial planning and design through implementation, monitoring and ongoing maintenance. Contracts for support services typically have terms that range from one to five years, and contracts for operations services typically have terms that range from one to seven years. The U.S. accounted for approximately 63% of our support revenue, with contract renewal rates of more than 80%. We generated 46% of our revenues for the fiscal year ended September 30, 2011 from services. As such, our services relationships have provided us with a large recurring revenue base and significant visibility into our customers’ future collaboration needs.
Experienced Management Team with Track Record of Execution. We have an experienced team of senior executives with diverse and complementary backgrounds that combine extensive knowledge of the communications industry. During their service at our company and past service at other leading enterprises, our management team has demonstrated an ability to identify critical trends in the technology and communications sectors and develop a comprehensive strategic vision to enable businesses to capitalize on those trends.
Our Growth Strategy
We believe we are well-positioned for growth worldwide and have a multi-faceted strategy that builds upon our brand, strong client relationships and ability to continue to be on the cutting edge of innovation. Our vision is to be the preeminent provider of business collaboration solutions with a commitment to open standards and innovative products, services and solutions. Key elements of our strategy include:
Leverage our Leading Market Positions to Drive the Adoption of our Next-Generation Collaboration Solutions. We believe that our market leadership, global scale and extensive customer interaction creates a strong platform from which to drive and shape the evolution of enterprise communications toward greater business collaboration. Our track record with our customers gives us the credibility that we believe provides us with a competitive advantage in helping them cope with this evolution. Additionally, extensive interaction with our large, global and diversified customer base helps us gain greater insight into market needs, which we incorporated into the design of Avaya Aura, the Avaya Flare Experience, Avaya ACE and our other new products. This insight will continue to help shape our product roadmap into the future.
Capture Additional Market Share Across our Portfolio of Products and Services. While we have leading market presence in the majority of the markets we serve, most of our markets still have numerous competitors of varying size. Changes in business communications needs will challenge many of these competitors to innovate and allow us to gain share with our broader portfolio of products and services. We also believe that scale and service capability become increasingly important as the complexity and importance of communications grows within the enterprise. As potential customers look to migrate to our solutions, our open architecture can integrate with competitor systems and provide a path for gradual transition while still achieving cost savings and improved functionality. Additionally, we believe the market for data networking will be $25 billion in 2011. While we believe our data products are best-in-class, we still have a modest market presence in data and believe our new
112
Table of Contents
product offerings can solve important customer needs around efficiency and resiliency, and offer a compelling value proposition to both our large installed base and new customers. We also believe there is significant opportunity to sell maintenance contracts to customers acquired in the NES acquisition. This effort began in the third quarter of fiscal year 2010 and is expected to contribute to growth in the maintenance coverage for our installed base.
Expand Margins and Profitability. We are focused on driving profitable growth worldwide and have multiple initiatives to increase our profit margins, including expanding gross margins and reducing operating expenses. From 2007 to September 2011 we increased our gross margins, excluding the amortization of technology intangible assets and the impact of purchase accounting adjustments, from 47% to 52% and we are pursuing the following gross margin initiatives to further expand our gross margins:
| • | driving lower material cost through our increased scale as a result of the NES transaction, improved supplier mix and increased component commonality; |
| • | greater use of low cost regions for supplier sourcing, contract manufacturing and provisioning of some support services; |
| • | optimizing design of products to drive material and supply chain efficiencies; |
| • | increasing the percentage of our revenue represented by higher-margin software; and |
| • | generating service productivity improvements through methodology and diagnostic tools as well as promoting greater web-based self-service tools. |
We also have the following initiatives to reduce operating expenses as a percentage of revenues:
| • | cost savings initiatives associated with the NES integration and other restructuring activities including exiting facilities and reducing the workforce or relocating positions to lower cost geographies have generated significant cost savings and we expect further cost savings to be generated; |
| • | achieving greater economies of scale thus reducing general and administrative expense as a percentage of revenues; and |
| • | sales productivity improvements and distribution channel optimization. |
Taken as a whole, we expect to be able to achieve increased adjusted gross margins and reduced operating expenses as a percentage of revenues, thus driving increased profit margins.
Continue to Develop Innovative Products and Services Around our Next-Generation Business Collaboration Solutions to Drive Revenue Growth and Shorter Sales Cycle. We intend to extend our industry-leading position through continued focus on product innovation and substantial investment in research and development for new products and services. Evidence of this focus is our more than 70 new product offerings since the beginning of fiscal year 2010. Examples include: the Avaya Flare Experience, Avaya web.alive, Avaya Aura 6.0, Avaya Aura Contact Center, Avaya IP Office 7.0, Avaya Video Conferencing Solution, Avaya ACE, Avaya VENA and Avaya Partner-Enabled Managed Services. We believe our ability to innovate is advanced by feedback gathered from our extensive customer relationships and our customer focus. We have been recognized by third-party industry analysts for our customer service and support three years in a row. We believe this customer focus allows us to better meet our customers’ needs and anticipate market demand. In addition, we plan to continue to make investments across the portfolio to create enhancements and breakthroughs in a number of key areas, which we believe will encourage customers to upgrade their solutions more frequently to take advantage of our ongoing product innovation and to deploy our user experience across an array of Avaya and third-party endpoints. For example, we intend to expand our market leading Avaya Flare Experience onto non-Avaya hardware platforms and operating systems such as the Apple iPad and Windows-based personal computers, or PCs. We also plan to continue to embrace the opportunity presented by cloud computing,
113
Table of Contents
endorsing a model that allows enterprises to benefit from deploying applications both on premise and in the cloud. We will seek new ways to leverage the Virtual Desktop Integration, or VDI, trend to securely deliver business collaboration to users.
Continue to Invest in and Expand our Sales and Distribution Capabilities to Attack New Markets and Better Penetrate Existing Markets. Our flexible go-to-market strategy, which consists of both a direct sales force and approximately 9,100 channel partners (as of September 30, 2011), allows us to reach customers across industries and around the globe while allowing them to interact with Avaya in a way that fits their organization. We intend to continue investing in our channel partners and sales force to optimize their market focus, improve segmentation, enter new geographies and provide our channel partners with compelling business incentives and discounts, along with training, marketing programs, and technical support through our Avaya Connect program. We also plan to leverage our sales and distribution channels to accelerate customer adoption and generate an increasing percentage of our revenue from our new high-value software solutions and user experience-centric applications.
Pursue Strategic Relationships, Alliances and Acquisitions. Continuing to establish relationships and alliances and selectively acquiring capability-enhancing businesses will play a key role in our growth strategy going forward. We believe we have one of the largest communications-focused developer and technology partner ecosystems. This is evidenced by the Avaya DevConnect program, which promotes the development, compliance-testing and co-marketing of innovative third-party products that are compatible with Avaya’s standards-based solutions, and has more than 16,500 registered companies as of September 30, 2011. We also maintain key relationships with large technology vendors such as International Business Machines Corporation or IBM, Hewlett-Packard Company, or HP and Microsoft. Additionally, we will continue to make acquisitions when we find opportunities with compelling strategic and financial rationales. Our acquisition and integration of NES is an example of our success with this strategy.
Retain, Recruit and Develop Talent Globally. We are focused on developing a workforce that has both exceptional technical capabilities and the leadership skills that are required to support our technological and geographical growth. Building and nurturing a committed, diverse and engaged workforce with the highest levels of ethics and integrity is at the heart of our strategy, as evidenced by our selection as one of the World’s Most Ethical Companies by the Ethisphere™ institute in 2011 for the fifth consecutive year. We have dramatically reshaped our workforce throughout our entire organization and have an executive team with significant experience in operating leading technology companies. Our transformation to being the leader in business collaboration will be fueled by developing new workforce capabilities and building upon our talented team in place today.
Our Products
Our product portfolio spans a broad range of unified communications, collaboration, customer service, video and data products designed to meet the diverse needs of small and mid-size businesses, as well as large enterprises. The majority of our portfolio comprises software products that reside on either a client or server. Client software resides on both our own and third-party devices, including desk phones, tablets, desktop PCs and mobile phones. Server-side software controls communication and collaboration for the enterprise, and delivers rich value-added applications such as messaging, telephony, voice, video and web conferencing, mobility and customer service. Hardware includes a broad range of desk phones, servers and gateways and LAN/WAN switching wireless access points and gateways. Highlights of our portfolio include:
Avaya Aura
At the core of our next-generation collaboration solutions is Avaya Aura, our SIP-based software suite of collaboration applications, including voice, video, messaging, presence, web applications and more. Avaya Aura is part of our infrastructure solutions portfolio. The Avaya Aura architecture simplifies complex communications
114
Table of Contents
networks and reduces infrastructure costs. Using this architecture, organizations are able to rapidly and cost-effectively deploy applications from a centralized data center to users regardless of the device they are using or the network to which they are connected. Avaya Aura provides a simple means of connecting legacy, multi-vendor systems to new open standards SIP-based applications, helping enterprises to reduce costs and increase user productivity and choice simultaneously. We believe Avaya Aura is one of the most reliable, secure and comprehensive offerings in the industry and that our commitment to open, standards-based solutions helps provide our customers with the flexibility to be more efficient and successful.
At the heart of Avaya Aura is Session Manager, which provides multimedia communications control and management. Multi-vendor voice, video and data communications can all be managed and controlled from one centralized software platform. Avaya Aura uses virtualization technology across all applications to reduce the physical number of servers relative to existing offerings, reducing total cost of ownership for medium sized and large enterprises alike. Avaya Aura allows business users to work from any location, on any device, by providing collaboration and communication capabilities on a broad variety of operating systems, devices, desktop, laptop and tablet computers, smart phones, mobile devices and dedicated deskphones.
Highlights of the Avaya Aura portfolio include the following:
| • | Avaya Aura Messaging, an application which enables migration from traditional voice messaging systems to SIP-based multimedia messaging with enterprise-class features, scalability and reliability. |
| • | Avaya Aura Presence Services, an application which provides contextual information and availability from across multiple devices and applications to users, delivering a richer collaboration experience. These capabilities are leveraged across the entire spectrum of communications applications, ranging from voice calls and instant messaging to customer services and business processes. |
| • | Avaya Aura Conferencing, which offers a rich set of scalable conferencing configurations and delivers audio conferencing, web conferencing, document-based collaboration and video-enabled web conferencing while letting users leverage familiar desktop applications and interfaces for increased conference control. |
| • | Avaya Aura Video Conferencing solutions, a wide suite of high-definition, low-bandwidth, SIP-based video endpoints combined with software applications to enable rich video conferencing to serve individual desktop users and small workgroups as well as large conference rooms. |
| • | Avaya Aura supports communications and collaboration endpoints including telephones, speaker phones, personal video collaboration devices and client software designed to provide enterprise class communications and the Avaya Flare Experience on our own devices as well as laptops, smartphones and tablets. |
Avaya Flare Experience
In September 2010, we unveiled the Avaya Flare Experience, a real-time, enterprise video communications and collaboration solution. The Avaya Flare Experience is part of our Unified Communication Applications, or UC Applications, solutions portfolio and helps break down the barriers between today’s communications and collaboration tools with a distinctive user interface for quick, easy access to voice and video, social media, presence and instant messaging and audio/video/web conferencing, a consolidated view of multiple directories, context history and more.
The Avaya Flare Experience features a central spotlight that highlights active or in-progress collaboration sessions. Initiating a communication session is as easy as moving one or more contacts from the directory into the spotlight. For text messages, a pop-up keyboard appears when a user taps a text-based icon under a contact’s photo. The Avaya Flare Experience combines contacts from multiple sources into a single “fan,” synchronizes email/calendars with Microsoft ActiveSync and integrates collaboration activity into a common interaction history, providing context to any session. We believe these capabilities deliver a simpler, more compelling experience to end-users using video, voice and text.
115
Table of Contents
Currently, the Avaya Flare Experience runs on the Avaya Desktop Video Device, an Android-based, video-enabled desktop collaboration endpoint for executive desktops or power communicators that can also perform as a customer kiosk. We are adapting the Avaya Flare software for other devices and operating systems such as the Apple iPad and Google Android tablets, Windows laptops and other consumer device classes and platforms. Overall, we believe our software-centric solutions are helping to enable customers to be more productive and compete more effectively by changing the way users collaborate.
Avaya Agile Communication Environment (ACE)
Avaya ACE is a multi-vendor application enablement framework that allows developers to integrate communications and collaboration applications into other business applications (such as CRM, ERP, BPM and social application frameworks). Avaya ACE is part of our infrastructure solutions portfolio and includes pre-packaged applications (such as integrations with mobile devices, click to call from web-based applications and real-time response applications to streamline time-dependent business processes), SOA-oriented web services and toolkits to enable rapid development of custom applications, which helps reduce costs and increase flexibility for enterprises. Programmers with limited communications expertise can readily embed real-time communications in business applications and workflows, expanding both the ability and opportunity to use Avaya collaboration capabilities. Avaya ACE provides a versatile platform for the members of DevConnect to build applications.
Avaya IP Office
Avaya IP Office is our award-winning global flagship SME communications solution specially designed to meet communications challenges facing small and medium enterprises. Avaya IP Office is part of our infrastructure solutions portfolio. IP Office provides solutions that help simplify processes and streamline information exchange within systems. Communications capabilities can be added as needed, and IP Office connects to both traditional and the latest IP lines—to give growing companies flexibility and the ability to retain and leverage their existing investment. We recently unveiled the latest version of our communications solution for this market — Avaya IP Office 7.0 — which we believe will drive improved savings, user experiences and collaboration for a new generation of entrepreneurs, early-stage companies and mid-size firms.
Avaya Contact Centers
We have been a leader in the contact center market since our founding over a decade ago with our Avaya Call Center Elite solution, and have recently significantly expanded beyond our large call center origins. We have developed a highly reliable, scalable, communications-centric applications suite focused on enabling companies to optimize sales and service delivery across their entire value chain from small and medium businesses to large, global enterprises. Our Avaya Aura Contact Center, a SIP-based multimedia solution that forms the core of our SIP contact center application solutions portfolio, leverages session management to create a single integrated customer queue, regardless of the type of media or modality, including voice, video, email, chat or social media, and delivers a highly personalized customer experience. The tight integration of our contact center applications with Avaya Aura has allowed us to change the nature of a contact center from the previous approach of routing customers to agents and self-service applications, often with a loss of customer information or context, to a model where we use session management to bring customer service people and applications from around the enterprise to the customer. We believe this leads to a much better customer experience than traditionally seen, where customers are transferred around the enterprise and asked frequently to re-confirm their identity and other personal information. The capabilities of our contact center solutions include:
| • | Assisted and Automated Experience Management, which provides intelligent routing of voice and multimedia contacts and a variety of applications for customer service agents, as well as outbound and self-service applications to manage collaboration and workflow between an enterprise and its customers; |
| • | Workforce Optimization, which includes call recording, quality monitoring and workforce management applications; and |
116
Table of Contents
| • | Performance Management, which provides contact center reporting, analytics and operations performance management solutions, as well as agent performance management and scheduling to ensure optimal use of resources and improve customer satisfaction. |
We believe these capabilities are imperative given the industry trends identified above, including, but not limited to, the adoption of social media, smartphones and cloud-based applications. For example, our solutions are designed to allow a social network post to be picked up by the enterprise, combined with intelligence about account history and previous conversations, and finished in an audio or video call from the customer’s browser to the contact center. This solution enables agents to respond to their customers’ feedback in a highly personal and efficient manner. This ability to meet a customer’s need, in the manner that is relevant to that customer at any given time, is critical to our customer’s success. Providing this type of multi-modal, multi-channel customer experience management capability allows us to deliver a unique experience for our customers’ end clients.
Avaya web.alive
Avaya web.alive™ is a unique online, immersive conferencing and social collaboration environment that lets users collaborate as though they were face to face. Avaya web.alive is part of our UC Applications solutions portfolio and replicates real life interactions using personalized avatars, which users control to navigate through an online, three-dimensional environment, with the ability to talk, chat, share, collaborate and present in real-time. Key to the experience is Avaya web.alive’s spatial audio technology, which lets participants talk interactively and hear each other based on their relative position and distance, creating a more realistic and natural experience than traditional conference calls. A cloud-based solution requiring only a web browser plug-in, the product allows collaboration between users from any browser, inside or outside of the enterprise. The service can be purchased with standard templated environments through ecommerce and automatically provisioned, or customized environments can be created for larger customers. Avaya web.alive has been used in various business use cases, including training, e-commerce, product launches and virtual tradeshows.
Avaya Networking
In support of our data communications strategy, our data networking product portfolio is designed to address and surpass competitors’ products with respect to three key requirements: resiliency, efficiency and performance.
Our data networking portfolio is complementary to our business collaboration, unified communications and contact center portfolio based on the Avaya Aura architecture. We believe that customers today benefit from end-to-end solution design, testing and support. Over time we expect customers to benefit from development work in integrated provisioning, system management, quality of experience and bandwidth utilization.
Our data networking portfolio includes:
| • | Ethernet Switching—a range of Local Area Network switches for data center, core, edge and branch applications; |
| • | Unified Branch—a range of routers and Virtual Private Network appliances that provide a secure connection for branches; |
| • | Wireless Networking—a cost-effective and scalable solution enabling enterprises to deploy wireless coverage; |
| • | Access Control—solutions that provide policy decision to enforce role-based access control to the network; |
| • | Unified Management—providing support for data and voice networks by simplifying the requirements associated across functional areas; and |
117
Table of Contents
| • | Avaya VENA—an end-to-end virtualization strategy and architecture that helps simplify data center and campus networking and optimizes business applications and service deployments in and between data centers and campuses, while helping to reduce costs and improve time to service. |
We sell our portfolio of data networking products globally into enterprises of all types, with particular strength in healthcare, education, hospitality, financial services and local and state government.
Our Technology
We believe that technology enhances the way in which people collaborate. At Avaya, we work with customers, industry groups and technical bodies to foster innovation. Across our portfolio we leverage critical technology to our customers’ advantage. Avaya is a leading innovator in leveraging the use of SIP for business collaboration. This open-standard based protocol shifts communications from having to coordinate multiple, independent media and communications systems, as was the case in legacy communication environments, toward session management based environments, where multiple media and resources can flexibly be brought into a fully-integrated, session-based interaction. This fundamental difference supports more fluid, effective and persistent collaboration across multiple media and modes of communication.
Centralized SIP-Based Architecture
At the core of our architecture, SIP-based Avaya Aura Session Manager centralizes communications control and application integration. Session Manager orchestrates a wide array of communication and collaboration applications and systems by decoupling them from the network. Applications can be deployed to individual users based on their need, rather than by where they work or the capabilities of the system to which they are connected. Session Manager instantly reduces complexity and provides the foundation for broader unified communications and collaboration strategies.
Unique SIP-Based Experiences
The Avaya Flare Experience leverages Avaya Aura and its session control and management, presence, unified communications features and services, application creation and enablement capabilities. Social network interfaces to services, such as Facebook, allow for integrated directories across platforms. Users can access Microsoft Exchange services like email, contacts and calendar, directly from a user’s contact card and, via the Avaya Aura Presence Services, can exchange instant message and presence information with Microsoft Lync users (i.e., Microsoft Communicator clients). Point-to-point video calls do not require a separate video conferencing server, and multi-party conferencing is enabled by Avaya Aura Conferencing.
Redefining the Customer Experience
Avaya Aura Contact Center is a SIP-based multimedia solution that contextually assigns inbound and outbound voice and multimedia contacts (e-mail, voice mail, Web chat, text messaging/ Short Message Service, video, fax and Social Media contacts) through an integrated, session-based queue. Contacts can be routed to the same agent who previously handled the customer, providing personalized service. At the agent desktop, a context-sensitive user interface facilitates agent transition between media types, and enables collaboration with customers, other agents, supervisors and experts. Advanced skill-based routing ensures individual contact treatment and connects customers with the agents who are the most qualified to serve them, locally or across a network.
Additional Technologies
In addition to SIP, we use technologies including:
| • | SIP/SIMPLE and XMP: the Avaya Aura Presence Services collects, publishes, aggregates and federates using SIP/SIMPLE and XMPP standards, providing interoperability with systems from other vendors, including but not limited to Microsoft, IBM and Google; |
118
Table of Contents
| • | Service Oriented Architecture, or SOA, oriented web services, including SOAP, REST and WSDL, are used extensively in Avaya ACE, leveraging open, extensible standards and protocols to facilitate rapid deployment and deliver customer choice; |
| • | Operating System, or OS, Support: our software applications run on a broad range of operating systems including, but not limited to, Microsoft Windows, Apple MAC OS, Google Android and RIM Blackberry; |
| • | Virtualization Technology is used in our core Avaya Aura portfolio to reduce the physical server footprint using hypervisor technology to run multiple applications concurrently on a single physical platform; and |
| • | Resilient data networking: our data portfolio provides highly resilient IPv4 and IPv6 routing services, with redundant hardware components, forwarding and restart capabilities that minimize interruptions, including one of the industry’s few sub second failover capabilities. |
Our Services
AGS evaluates, plans, designs, implements, supports, manages and optimizes enterprise communications networks to help customers achieve enhanced business results both directly and through partners. Our award-winning portfolio of services includes product support, integration and professional and managed services that enable customers to optimize and manage their converged communications networks worldwide and achieve enhanced business results. AGS is supported by patented design and management tools and network operations and technical support centers around the world.
The portfolio of AGS services includes:
| • | Avaya Client Services—We monitor and improve customers’ communications network performance, helping to ensure network availability and keeping communications networks current with the latest software releases. This includes our managed and operations services in which we manage complex multi-vendor, multi-technology networks, help optimize network performance and manage customers’ communications environments and related assets. |
| • | Professional Services—Our planning, design and integration specialists and communications consultants provide solutions that help reduce costs and enhance business agility. We also provide vertical solutions designed to leverage existing product environments, contact centers and unified communications networks. |
Avaya Client Services contracts tend to be longer term in nature. For example, contracts for support services typically have terms that range from one to five years. Contracts for operations services typically have terms that range from one to seven years.
Alliances
We have formed alliances with companies where we can improve our offerings to customers through collaboration. Our alliances can take different forms, including those intended, among other things, to extend our market reach through the use of complementary technologies, to develop new products or enhance existing ones, and to exchange technology. Our go to market alliances enable us to support large multinational unified communications, contact center and networking customers on a global basis. We jointly package our products and services and integrate applications to execute our market penetration strategy. Each of the alliance partners has resources certified in the Avaya solutions portfolios extending our global sales, implementation and support capabilities. We currently have alliances with IBM, HP, AT&T, Verizon and British Telecom, among others.
119
Table of Contents
Avaya DevConnect
The Avaya DevConnect program is designed to promote the development, compliance-testing and co-marketing of innovative third-party products that are compatible with Avaya’s standards-based solutions. Member organizations have expertise in a broad range of technologies, including IP telephony, contact center and unified communications applications.
As of September 30, 2011, more than 16,500 companies have registered with the program, including more than 400 companies operating at a higher level of program membership that are eligible to submit their products or services for compatibility testing by the Avaya Solution Interoperability and Test Lab.
Avaya Test Lab engineers work in concert with each submitting member company to develop comprehensive test plans for each application to validate the product integrations.
Customers; Sales, Partners and Distribution
Customers
Our customer base is diverse, ranging in size from small businesses employing a few employees to large government agencies and multinational companies with over 100,000 employees. As of September 30, 2011, we had over 400,000 customers, including more than 90% of the Fortune 500 companies and one million customer locations worldwide. Our customers operate in a broad range of industries, including financial services, manufacturing, retail, transportation, energy, media and communications, health care, education and government, and include, among others, Morgan Stanley & Co. LLC, Progressive Casualty Insurance Company, Whirlpool Corporation, The Hewlett-Packard Company, Home Depot, Inc., United Air Lines, Inc., Marriott International, Inc., the Blue Cross and Blue Shield Association, Australia National University and the FDIC. We employ a flexible go-to-market strategy with direct and indirect presence in over 160 countries. As of September 30, 2011, we had approximately 9,100 channel partners and for fiscal year 2011, our product revenue from indirect sales represented approximately 76% of our total product revenue.
No single customer represented more than 10% of our revenue for the years ended September 30, 2011, 2010 and 2009. For customer geographic information, please see Note 17, “Reportable Segments,” to our consolidated financial statements located elsewhere in this prospectus.
Sales, Partners and Distribution
Our global go-to-market strategy is designed to focus and strengthen our reach and impact on large multinational enterprises, mid-market and more regional enterprises and small businesses. Our go-to-market strategy is to serve our customers the way they prefer to work with us, either directly with Avaya or through our indirect sales channel, which includes our global network of alliance partners, distributors, dealers, value-added resellers, telecommunications service providers and system integrators. Our sales organizations are equipped with a broad product and software portfolio, complemented with services offerings including product support, integration and professional and managed services.
The Avaya sales organization is globally deployed with direct and indirect (e.g., channel partner) presence in over 160 countries. We continue to focus on efficient deployment of Avaya sales resources, both directly and indirectly, for maximum market penetration and global growth. Our investment in our sales organization includes training curricula to support the evolution of our sales strategy toward a solutions-based sales process targeted at helping businesses reduce costs, lower risk and grow their revenues. The program includes sales process, skills and solutions curricula for all roles within our sales organization.
120
Table of Contents
Avaya Connect
As of September 30, 2011, there were approximately 9,100 channel partners that serve our customers worldwide through Avaya Connect, our business partner program. Through the use of certifications, the program positions partners to sell, implement and maintain our communications systems, applications and services. Avaya Connect offers clearly defined partner categories with financial, technical, sales and marketing benefits that grow in parallel with levels of certification. We support partners in the program by providing a portfolio of industry-leading solutions in addition to sales, marketing and technical support. Although the terms of individual channel partner agreements may deviate from our standard program terms, our standard program agreements for resellers generally provide for a term of one year with automatic renewal for successive one year terms and may be terminated by either party for convenience upon 30 days’ prior notice and our standard program agreements for distributors may be terminated by either party for convenience upon 90 days’ prior notice. Our partner agreements generally provide for responsibilities, conduct, order and delivery, pricing and payment, and include customary indemnification, warranty and other similar provisions. No single channel partner represents more than 10% of our revenue for the years ended September 30, 2011, 2010 and 2009.
Research and Development
We make substantial investments in research and development to develop new systems, services and software in support of business collaboration, including, but not limited to, converged communications systems, communications applications, multimedia contact center innovations, collaboration tools, messaging applications, speech enabled applications, business infrastructure and architectures, converged mobility systems, hosted offerings, web services, communications-enabled business processes and applications, data networks and services for our customers. In addition, in 2009 we created an Emerging Products and Technology team, which includes Avaya Labs research and has over 260 people working in an entrepreneurial team focused on accelerating the commercialization of innovation.
We invested $461 million and $407 million for the years ended September 30, 2011 and 2010, respectively, on research and development. Customer-sponsored research and development activities that we have conducted have not been material.
Manufacturing and Suppliers
We have outsourced substantially all of our manufacturing operations to several EMS providers. Our EMS providers produce the vast majority of our products in facilities located in China, with other products produced in facilities located in Israel, Mexico, Malaysia, Taiwan, Germany, Indonesia, the United Kingdom and the U.S. All manufacturing of our products is performed in accordance with detailed specifications and product designs furnished or approved by us and is subject to rigorous quality control standards. We periodically review our product manufacturing operations and consider changes we believe may be necessary or appropriate. We also purchase certain hardware components and license certain software components from third-party OEMs and resell them both under the Avaya brand and, in some cases, under the brand of the OEMs.
In some cases, certain components are available only from a single source or from a limited source of suppliers. Delays or shortages associated with these components could cause significant disruption to our operations. For more information on risks related to products and components, see “Risk Factors—Risks Related to Our Business—We rely on third-party providers for the manufacture, warehousing and distribution logistics associated with our products” and “Risk Factors—Risks Related to Our Business—As our business and operations related relationships have expanded globally in the last few years, changes in economic or political conditions, as well as natural disasters, in a specific country or region could negatively affect our revenue, costs, expenses and financial condition.”
121
Table of Contents
Competition
We compete against providers of both traditional enterprise voice communications solutions as well as providers of technology related to business collaboration and contact center solutions. For example, we compete with Alcatel-Lucent, Genesys, Aspect, Brocade, Cisco, Juniper, Microsoft, NEC and SEN. Our video conferencing solutions both partner and compete with solutions offered by Polycom Inc., TANDBERG (now Cisco) and LifeSize (now a division of Logitech International S.A.). We also face competition in the small and medium enterprise market from many competitors, including Cisco, Alcatel-Lucent, NEC, Matsushita Electric Corporation of America and Mitel, although the market for these products is more fragmented. We face competition in certain geographies with companies that have a particular strength and focus in particular countries or regions, such as Huawei in China and Intelbras in Latin America. While we believe our global, in-house end-to-end services organization provides us with a competitive advantage, it faces competition from companies like those above offering services, either directly or indirectly through their channel partners, with respect to their own product offerings, as well as many value-added resellers, consulting and systems integration firms and network service providers.
In addition, because the business collaboration market continues to evolve and technology continues to develop rapidly, we may face competition in the future from companies that do not currently compete against us, but whose current business activities may bring them into competition with us in the future. In particular, this may be the case as business, information technology and communications applications deployed on converged networks become more integrated to support business collaboration. We may face increased competition from current leaders in information technology infrastructure, information technology, consumer products companies, personal and business applications and the software that connects the network infrastructure to those applications. With respect to services, we may also face competition from companies that seek to sell remotely hosted services or software as a service directly to the end customer. Competition from these potential market entrants may take many forms, including offering products and applications similar to those we offer as part of another offering. In addition, these technologies continue to move from a proprietary environment to an open standards-based environment.
Technological developments and consolidation within the industry, as well as changes in the solutions that we offer, result in frequent changes to our group of competitors. The principal competitive factors applicable to our solutions include:
| • | product features, performance and reliability; |
| • | customer service and technical support; |
| • | relationships with distributors, value-added resellers and systems integrators; |
| • | an installed base of similar or related products; |
| • | relationships with buyers and decision makers; |
| • | price; |
| • | the relative financial condition of competitors; |
| • | brand recognition; |
| • | the ability to integrate various products into a customer’s existing environment, including the ability of a provider’s products to interoperate with other providers’ business collaboration products; and |
| • | the ability to be among the first to introduce new products and services. |
For more information on risks related to our competition, see “Risk Factors—Risks Related to Our Business—We face formidable competition from numerous established firms in the enterprise communications, business collaboration and information technology markets; as these markets evolve, we expect competition to intensify and expand to include new companies that do not currently compete directly against us.”
122
Table of Contents
Patents, Trademarks and Other Intellectual Property
We own a significant number of patents important to our business and we expect to continue to file new applications to protect our research and development investments in new products and services across all areas of the business. As of September 30, 2011, we had approximately 5,600 patents and pending patent applications, including foreign counterpart patents and foreign applications. Our patents and pending patent applications cover a wide range of products and services covering a variety of technologies, including, but not limited to, unified communications (including video, social media, telephony and messaging), contact centers, wireless communications and data networking. The duration of our patents is determined by the laws of the country of issuance and for U.S. patents may be 17 years from the date of issuance of the patent or 20 years from the date of its filing, depending upon when the patent application was filed. In addition, we hold numerous trademarks, both in the U.S. and in other countries.
Our intellectual property holdings include those assigned to us by Lucent Technologies (now Alcatel-Lucent) at Avaya’s inception, which included a number of patents, trademarks, copyrights, trade secrets and other intellectual property directly related to and important to our business. Lucent and its subsidiaries also granted certain rights and licenses to specified patents, trademarks, copyrights, trade secrets and other intellectual property needed for the manufacture, use and sale of our products. Rights to these patents were granted through a cross license entered into with Lucent. In addition, Lucent conveyed to Avaya numerous licenses and sublicenses under patents of third parties.
We will obtain patents and other intellectual property rights used in connection with our business when practicable and appropriate. Historically, we have done so organically or through commercial relationships as well as in connection with acquisitions, including the acquisition of NES. For example, in the acquisition of NES, we acquired over 800 patents and patent applications and were licensed a significant number of patents, trademarks, copyrights, trade secrets and other intellectual property.
Our intellectual property policy is to protect our products, technology and processes by asserting our intellectual property rights where appropriate and prudent. From time to time, assertions of infringement of certain patents or other intellectual property rights of others have been made against us. In addition, certain pending claims are in various stages of litigation. Based on industry practice, we believe that any licenses or other rights that might be necessary for us to continue with our current business could be obtained on commercially reasonable terms. However, we cannot assure you that any of those licenses or other rights will always be available on acceptable terms or that litigation will not occur. The failure to obtain necessary licenses or other rights, or litigation arising out of such claims, could adversely affect our business.
For more information concerning the risks related to patents, trademarks and other intellectual property, please see “Risk Factors—Risks Related to Our Business—If we are unable to protect our proprietary rights, our business and future prospects may be harmed” and “Risk Factors—Risks Related to Our Business—We may be subject to litigation and infringement claims, which could cause us to incur significant expenses or prevent us from selling our products or services.”
Backlog
Our backlog for product sales generated, which represents the aggregate of the sales price of orders received from customers, but not yet recognized as revenue, was $149 million, $185 million and $141 million on September 30, 2011, 2010 and 2009, respectively. However, all orders are subject to possible rescheduling by customers. Although we believe that the orders included in the backlog are firm, some orders may be cancelled by the customer without penalty, and we may elect to permit cancellation of orders without penalty where management believes it is in our best interests to do so. We do not believe that our backlog, as of any particular date, is necessarily indicative of actual net sales for any future period.
123
Table of Contents
Employees
As of September 30, 2011, we employed 18,588 employees, of which 18,422 were full-time employees (16,324 were management and non-represented employees and 2,098 were represented employees covered by collective bargaining agreements) and 166 were part-time employees (126 were management and non-represented employees and 40 were represented employees covered by collective bargaining agreements).
Of the 2,138 full-time and part-time employees covered by collective bargaining agreements as of September 30, 2011, 1,018 employees are covered by collective bargaining agreements in the U.S.
In the U.S., our current three-year agreements with the Communications Workers of America and the International Brotherhood of Electrical Workers have recently been extended and will expire on June 7, 2014.
Environmental, Health and Safety Matters
We are subject to a wide range of governmental requirements relating to employee safety and health and environmental protection, including (a) certain provisions of environmental laws governing the cleanup of soil and groundwater contamination, (b) various state, federal and international laws and regulations governing the design, disposal and materials composition of our products, including those restricting the presence of certain substances in electronic products and making producers of those products financially responsible for the collection, treatment, recycling and disposal of certain products, and (c) various employee safety and health regulations that are imposed in various countries within which we operate. For example, we are currently involved in several remediations at currently or formerly owned or leased sites, which we do not believe will have a material impact on our business or results of operation. Please see “Risk Factors—Risks Associated with Our Business—We may be adversely affected by environmental, health and safety, laws, regulations, costs and other liabilities” for a discussion of the potential impact such governmental requirements may have on our business.”
Sustainability at Avaya
We have developed a sustainability program supported by an Environmental Steering Committee, which is a cross-functional team that oversees the Avaya-wide sustainability work by providing supervision, direction, guidance, objectives and targets. We recognize that climate change is an issue of global concern. Integral aspects of our operations that may be subject to climate change risks include, but are not limited to, the following: increased regulations that have either been promulgated or may be promulgated in the future in jurisdictions in which we operate; the procurement and transport of raw materials and components used by our manufacturers and the use of those raw materials and components in the manufacturing process; manufacturing emissions; packaging and transport of finished goods; emissions and waste generated by our business operations; emissions associated with business travel (air, vehicular, fleet services); and emissions associated with business activities and emissions generated by our products. We continue to monitor those risks and will develop policies and processes designed to mitigate those risks where possible. In addition, to minimize the physical risk associated with climate change, we leverage our global Business Continuity Plan to mitigate business interruptions and to help ensure continued operations in the face of risks such as increased intensity and frequency of extreme weather events. Business Continuity Plans are tested throughout the year using various business disruption scenarios to help ensure our ability to respond to challenges, such as any significant events that may be tied to climate change. Please see “Risk Factors—Risks Associated with Our Business—Integral aspects of our business may be subject to climate change risks.”
Properties
As of September 30, 2011, we had 231 leased facilities (which included 16 storage locations containing between 75 to 418 square feet) and 8 owned facilities, located in 53 countries. These included 11 primary
124
Table of Contents
research and development facilities located in Canada, Germany, India, Israel, Ireland and the U.S. Our real property portfolio consists of aggregate floor space of 7.7 million square feet, of which 5.4 million square feet is leased and 2.3 million square feet is owned. Our lease terms range from monthly leases to 15 years. We believe that all of our facilities and equipment are in good condition and are well maintained. Our facilities are used for current operations of all operating segments. For additional information regarding obligations under operating leases, see Note 19, “Commitments and Contingencies,” to our consolidated financial statements for the period ended September 30, 2011.
Legal Proceedings
In the ordinary course of business, the Company is involved in litigation, claims, government inquiries, investigations and proceedings, including, but not limited to, those identified below, relating to intellectual property, commercial, securities, employment, employee benefits, environmental and regulatory matters. Other than as described below, the Company believes there is no litigation pending or environmental and regulatory matters against the Company that could have, individually or in the aggregate, a material adverse effect on the Company’s financial position, results of operations or cash flows. Please see “Risk Factors—Risks Associated with Our Business—We may be subject to litigation and infringement claims, which could cause us to incur significant expenses or prevent us from selling products or services.”
Antitrust Litigation
In 2006, the Company instituted an action in the U.S. District Court, District of New Jersey, against defendants Telecom Labs, Inc., TeamTLI.com Corp. and Continuant Technologies, Inc. and subsequently amended its complaint to include certain individual officers of these companies as defendants. Defendants purportedly provide maintenance services to customers who have purchased or leased the Company’s communications equipment. The Company asserts in its amended complaint that, among other things, defendants, or each of them, have engaged in tortious conduct and/or violated federal intellectual property laws by improperly accessing and utilizing the Company’s proprietary software, including passwords, logins and maintenance service permissions, to perform certain maintenance services on the Company’s customers’ equipment. Defendants have filed a counterclaim against the Company, alleging a number of tort claims and alleging that the Company has violated the Sherman Act’s prohibitions against anticompetitive conduct through the manner in which the Company sells its products and services. The parties have engaged in extensive discovery and motion practice to, among other things, amend and dismiss pleadings and compel and oppose discovery requests. A trial date originally set for September 2011 has been adjourned and no new date has been set by the court. In November 2011, defendant’s motion to dismiss Avaya’s Digital Millennium Copyright Act claims was granted in part and denied in part. Other dispositive motions are pending. At this point in the proceeding, expert discovery on the Company’s claims and the defendants’ surviving counter-claims continues. Therefore, at this time an outcome cannot be predicted and, as a result, the Company cannot be assured that this case will not have a material adverse effect on the manner in which it does business, its financial position, results of operations or cash flows.
Intellectual Property
In the ordinary course of business, the Company is involved in litigation alleging it has infringed upon third parties’ intellectual property rights, including patents. Some litigation may involve claims for infringement against customers by third parties relating to the use of Avaya’s products as to which the Company may provide indemnifications of varying scope to certain customers. These matters are on-going and the outcomes are subject to inherent uncertainties. As a result, the Company cannot be assured that any such matter will not have a material adverse effect on its financial position, results of operations or cash flows. However, management does provide for estimated losses if and when it believes the facts and circumstances indicate that a loss is probable
125
Table of Contents
and the loss can be reasonably estimated. While it is not possible at this time to determine with certainty the ultimate outcome of these cases, the Company believes there are no such infringement matters that could have, individually or in aggregate, a material adverse effect on the Company’s financial position, results of operations or cash flows.
Other
In October 2009, a former supplier in France, Combel, made a claim for improper termination of the Company’s relationship under French law seeking damages of at least €10 million and a provisional (interim) indemnity by the Company of €5 million. The Company disputes that Combel is entitled to any such damages and that it has not improperly terminated the relationship. In December 2010, the court rejected all claims of Combel based on the allegedly improper termination of the commercial relationship and only a claim with respect to the buyback of inventory remains open. To assess the value of the remaining inventory, the court appointed an expert. Combel filed an appeal against the Court decision. In November 2011, the Court of Appeals affirmed the lower court decision denying Combel’s improper termination claim and ordered Avaya to pay Combel an amount for the inventory buy back. The amount ordered is not material. At this time it is unclear whether either party will appeal the decision, and an outcome cannot be predicted. Therefore the Company cannot be assured that this case will not have a material adverse effect on its financial position, results of operations or cash flow.
In October 2009, a group of former employees of Avaya’s former Shreveport, Louisiana manufacturing facility brought suit in Louisiana state court, naming as defendants Alcatel-Lucent USA, Inc., Lucent Technologies Services Company, Inc., and AT&T Technologies, Inc. The former employees allege hearing loss due to hazardous noise exposure from the facility dating back over forty years, and stipulate that the total amount of each individual’s damages does not exceed fifty thousand dollars. In February 2010 plaintiffs amended their complaint to add Avaya Inc. as a named defendant. There are 101 plaintiffs in the case. This matter is in the early phases of discovery. The Company cannot determine if this matter will have an effect on our business or, if it does, whether its outcome will have a material adverse effect on our financial position, results of operations or cash flow.
126
Table of Contents
MARKET, RANKING AND OTHER INDUSTRY DATA
This prospectus includes industry and trade association data, forecasts and information that we have prepared based, in part, upon data, forecasts and information obtained from independent trade associations, industry publications and surveys and other information available to us. Some data is also based on our good faith estimates, which are derived from management’s knowledge of the industry and independent sources. Industry publications and surveys and forecasts generally state that the information contained therein has been obtained from sources believed to be reliable. We have not independently verified any of the data from third-party sources nor have we ascertained the underlying economic assumptions relied upon therein. Statements as to our market position are based on market data currently available to us. Our estimates involve risks and uncertainties and are subject to change based on various factors, including those discussed under the heading “Risk Factors” in this prospectus.
127
Table of Contents
Executive Officers and Directors
The following table sets forth the name, age and position of each of our executive officers and directors as of November 1, 2011:
Name | Age | Position | ||||
Mohamad S. Ali | 41 | Senior Vice President and President, Avaya Global Services | ||||
Stephen J. Bandrowczak | 51 | Vice President and General Manager, Avaya Networking | ||||
Alan E. Baratz | 56 | Senior Vice President and President, Global Communications Solutions | ||||
James M. Chirico, Jr. | 53 | Executive Vice President, Business Operations | ||||
Pamela F. Craven | 58 | Senior Vice President and Chief Administrative Officer | ||||
Christopher M. Formant | 59 | Senior Vice President and President, Avaya Government Solutions | ||||
Roger C. Gaston | 55 | Senior Vice President, Human Resources | ||||
Jaroslaw S. Glembocki | 55 | Senior Vice President, Quality Program Office | ||||
Stephen J. Gold | 52 | Senior Vice President and Chief Information Officer | ||||
J. Joel Hackney, Jr. | 42 | Senior Vice President, Global Sales and Marketing and President, Field Operations | ||||
Kevin J. Kennedy | 55 | Director, President and Chief Executive Officer | ||||
Anthony J. Massetti | 50 | Senior Vice President and Chief Financial Officer | ||||
Thomas G. Mitchell | 53 | Senior Vice President and President, SME and Avaya Go to Market | ||||
Brett A. Shockley | 52 | Senior Vice President, Corporate Development and Strategy | ||||
Directors | ||||||
Eugene J. Frantz | 45 | Director | ||||
Charles H. Giancarlo | 53 | Chairman of the Board of Directors | ||||
Afshin Mohebbi | 48 | Director | ||||
Greg K. Mondre | 37 | Director | ||||
Kevin B. Rollins | 58 | Director | ||||
David J. Roux | 54 | Director | ||||
Gary B. Smith | 51 | Director | ||||
Mohamad S. Ali, Senior Vice President and President, Avaya Global Services
Mr. Ali has been our Senior Vice President and President, Avaya Global Services, since April 2011. Prior to that time, he served as our Senior Vice President, Corporate Development and Strategy since December 2009 and, prior to that time and since July 15, 2009, he was our Senior Vice President, Corporate Development. Previously, Mr. Ali spent 13 years at International Business Machines Corporation, or IBM, a global provider of information technology products and services, most recently as Vice President, Business Development and Strategy for IBM’s Information Management Division from 2005 until July 2009.
Steven J. Bandrowczak,Vice President and General Manager, Avaya Networking
Mr. Bandrowczak has been our Vice President and General Manager, Avaya Networking since June 14, 2010. Previously, from December 18, 2009 until June 14, 2010, he served as our Vice President, Sales and Marketing for the Avaya data business. From January 1, 2009 until December 18, 2009, Mr. Bandrowczak was the President, Enterprise Sales Americas for Nortel Networks Inc. and, from July 16, 2007 until January 1, 2009,
128
Table of Contents
he served as Chief Information Officer for Nortel Networks Corporation and Nortel Networks Limited. Previously, from September 2005 until July 2007, he served as Senior Vice President and Chief Information Officer for Lenovo Group Ltd., a global producer of PC products and value-added professional services. Prior to that, he served as Executive Vice President and Chief Information Officer at DHL Worldwide, a global market leader in the international express and logistics industry.
Alan E. Baratz, Senior Vice President and President, Global Communications Solutions
Dr. Baratz has been our Senior Vice President and President, Global Communications Solutions since October 2, 2008. From June 1, 2007 to January 31, 2008, Dr. Baratz served as Senior Vice President of the Network Software and Systems Technology Group at Cisco Systems, Inc., a provider of communications and networking products. Previously, he served as President and Chief Executive Officer of NeoPath Networks, a provider of network file management solutions, from February 25, 2005 until it was acquired by Cisco on March 13, 2007.
James M. Chirico, Jr., Executive Vice President, Business Operations
Mr. Chirico has been our Executive Vice President, Business Operations since June 14, 2010. Previously, from February 3, 2009 until June 14, 2010, he served as our Chief Restructure Officer and President, Operations. From January 2, 2008 until February 3, 2009, he served as our Senior Vice President and President, Operations. From February 1998 to November 2007, Mr. Chirico held various senior management positions at Seagate Technology, a designer, manufacturer and marketer of hard disc drives, including Executive Vice President, Global Disc Storage Operations, from February 2006 until November 2007, and Senior Vice President and General Manager, Asia Operations, from September 2000 to February 2006.
Pamela F. Craven, Senior Vice President and Chief Administrative Officer
Mrs. Craven has been our Senior Vice President and Chief Administrative Officer since August 2006. In that role, she continues to serve as our General Counsel, which is a position she has held since September 2000. She also served as Corporate Secretary from September 2000 to January 2007. She was a Senior Vice President from August 2002 to August 2006.
Christopher M. Formant, Senior Vice President and President, Avaya Government Solutions
Mr. Formant has been our Senior Vice President and President, Avaya Government Solutions since August 16, 2010. Previously, from February 25, 2008 until August 16, 2010, he served as our Senior Vice President and President, Avaya Global Services. Mr. Formant was previously Executive Vice President and Executive Committee Member at Bearing-Point, Inc., a consulting firm, from February 2003 to January 2008.
Roger C. Gaston, Senior Vice President, Human Resources
Mr. Gaston has been our Senior Vice President, Human Resources since May 2006. In his role, Mr. Gaston is responsible for employee compensation and benefits, employee communications, workforce relations, organizational development and transformation, recruitment, talent management and labor relations.
Jaroslaw S. Glembocki, Senior Vice President, Quality Program Office
Jaroslaw S. Glembocki has served as our Senior Vice President, Quality Program Office, since November 7, 2011. Previously, he served as Chief Operating Officer of Solexant Corp., a developer of ultra-thin film technology, from March 2011 to October 2011. From June 2009 to March 2011, Mr. Glembocki was engaged in various consulting projects. Prior to that, Mr. Glembocki served as Senior Vice President of Recording Heads and Media Operations at Seagate Technology HDD Holdings, a designer, manufacturer and marketer of hard disc drives, from October 2000 to May 2009.
129
Table of Contents
Stephen J. Gold, Senior Vice President and Chief Information Officer
Mr. Gold has been our Senior Vice President and Chief Information Officer since May 24, 2010. Previously, from July 2009 until May 2010, he served as Executive Vice President, Chief Information Officer and Corporate Chief Technology Officer at GSI Commerce, Inc., a provider of e-commerce and digital marketing solutions, and, from February 2005 until July 2009, he served as Executive Vice President and Chief Information Officer.
J. Joel Hackney, Jr., Senior Vice President, Global Sales and Marketing and President, Field Operations
Mr. Hackney has been our Senior Vice President, Global Sales and Marketing and President, Field Operations since June 14, 2010. From December 19, 2009 until June 14, 2010 he was our Senior Vice President and President, Avaya Government and Data Solutions. Previously, he spent four years at Nortel Networks Corporation where, from September 2007 to December 2009, he served as President, Nortel Enterprise Solutions and, from December 2005 to September 2007, he served as Senior Vice President of Global Operations and Quality.
Kevin J. Kennedy, Director, President and Chief Executive Officer
Mr. Kennedy has been our President and Chief Executive Officer and a member of our board of directors since December 22, 2008. Previously, from September 2003 to December 2008, he served as Chief Executive Officer of JDS Uniphase Corporation, or JDSU, a provider of optical communications products, and from March 2004 until December 2008, he also served as President of JDSU. He joined JDSU’s board of directors in November 2001 and, since December 2008, has served as Vice Chairman of their board of directors. Mr. Kennedy is also on the board of directors of KLA-Tencor Corporation, a supplier of process control and yield management solutions for the semiconductor industry. Mr. Kennedy served on the boards of directors of Rambus Inc., a developer of a high-speed chip-to-chip interface technology from April 2003 until July 2008, Freescale Semiconducter, Inc., an embedded processing semiconductor and solutions company, from July 2004 until December 2006, and Polycom Inc., a provider of telepresence, voice and video conferencing solutions, from May 2008 until January 2009. Mr. Kennedy was selected to serve as a director in light of his role as Chief Executive Officer, the management perspective he brings to board deliberations, his extensive management experience and his experience on multiple public company boards.
Anthony J. Massetti, Senior Vice President and Chief Financial Officer
Mr. Massetti has been our Senior Vice President and Chief Financial Officer since October 26, 2009. From January 2008 to October 2009, Mr. Massetti was Chief Financial Officer and Senior Vice President at NCR Corporation, a global provider of financial and retail self service solutions and services. From 2002 to 2008, he was with QLogic Corporation, a storage networking solutions company, most recently as Chief Financial Officer and Senior Vice President from 2004 to 2008.
Thomas G. Mitchell, Senior Vice President and President, SME and Avaya Go to Market
Mr. Mitchell has been our Senior Vice President and President, SME and Avaya Go to Market, since March 2011. Prior to that time, he served as our Senior Vice President, Channel Transformation since May 3, 2010. From 2005 to April 2010, Mr. Mitchell was a consultant specializing in developing and refining complex global go-to-market strategies in the IT marketplace.
Brett A. Shockley, Senior Vice President, Corporate Development and Strategy
Mr. Shockley has served as our Senior Vice President, Corporate Development and Strategy since April 2011. Prior to that time, from July 2009 to April 2011, Mr. Shockley served as our Vice President of Emerging Products and Technology. From January 2002 to October 2008, Mr. Shockley was Chairman, Chief Executive Officer and President of Spanlink Communications, Inc., a provider of unified communications and contact
130
Table of Contents
center solutions. Mr. Shockley is on the board of directors of Wireless Ronin Technologies, Inc., a wireless communications development company focused on digital signage.
Eugene J. Frantz, Director
Mr. Frantz has been a member of our board of directors since October 26, 2007. Mr. Frantz joined TPG Capital in 1999 and is a Partner. Mr. Frantz sat on the board of directors of SMART Modular Technologies, Inc., a provider of memory products and liquid-crystal displays, from April 2004 until January 2010. Mr. Frantz’s experience in financial matters, service as a director of other companies, experience in working with companies controlled by private equity sponsors, related industry experience and affiliation with TPG, which, prior to the completion of this offering, has the right to select three of our directors, led to the conclusion that he should serve as a director of our Company.
Charles H. Giancarlo, Chairman of the Board of Directors
Mr. Giancarlo has been a member of our board of directors since June 30, 2008 and has been our Chairman of the board of directors since December 22, 2008. He served as our President and Chief Executive Officer from June 30, 2008 until December 22, 2008. Mr. Giancarlo has been a Managing Director of Silver Lake since 2007. Prior to joining Silver Lake in 2007, he was employed by Cisco Systems, Inc., a provider of communications and networking products and services, which he joined in 1994 and where he was Executive Vice President and Chief Development Officer from 2004 to 2007. Mr. Giancarlo is also on the boards of directors of Accenture Ltd., a management consulting business, Netflix, Inc., an online movie rental subscription service, and various private companies. Mr. Giancarlo’s related industry experience, experience in financial matters, service as an executive officer and director of other companies, prior service as our Chief Executive Officer, experience in working with companies controlled by private equity sponsors, and affiliation with Silver Lake, which, prior to the completion of this offering, has the right to select three of our directors, led to the conclusion that he should serve as a director of our Company.
Afshin Mohebbi, Director
Mr. Mohebbi has been a member of our board of directors since April 2011. Mr. Mohebbi is a Senior Advisor to TPG, supporting the firm’s portfolio of private and public companies throughout the world. Most recently, he was president and chief operating officer of Qwest Communications International Inc., a provider of broadband Internet-based data, voice and image communications, from April 2001 to December 2002. Mr. Mohebbi served on the board of directors of Hanaro Telecom, a provider of long distance service and wholesale of IT-related products, from March 2005 until December 2007. Mr. Mohebbi’s related industry experience, service as an executive officer and director of other companies, experience in working with companies controlled by private equity sponsors, and affiliation with TPG, which, prior to the completion of this offering, has the right to select three of our directors, led to the conclusion that he should serve as a director of our Company.
Greg K. Mondre, Director
Mr. Mondre has been a member of our board of directors since October 26, 2007. Mr. Mondre has been a Managing Director of Silver Lake since 2005. Prior to joining Silver Lake in 1999, he was a principal at TPG and an investment banker at Goldman, Sachs & Co., a global investment banking and securities firm. Mr. Mondre is also on the boards of directors of various private companies. Mr. Mondre’s experience in financial matters, service as a director of other companies, experience in working with companies controlled by private equity sponsors and affiliation with Silver Lake, which, prior to the completion of this offering, has the right to select three of our directors, led to the conclusion that he should serve as a director of our Company.
131
Table of Contents
Kevin B. Rollins, Director
Mr. Rollins has been a director of Avaya since October 26, 2007. Mr. Rollins has been a senior advisor focusing on investment strategies in global technology at TPG since he joined in 2007. From April 1996 to January 2007, Mr. Rollins held various positions at Dell, Inc., or Dell, a technology solutions, services and support provider, including President and Chief Executive Officer, from March 2004 to January 2007, and President and Chief Operating Officer, from 2001 to March 2004. Mr. Rollins served on the board of directors of Sears Holdings Corporation, a large broadline retailer, from February 2008 until May 2010. On July 22, 2010, the SEC filed a civil injunctive action involving Dell, which included allegations against Dell and certain of its senior officers, including Mr. Rollins, concerning the failure to provide adequate disclosure in its SEC filings with respect to Dell’s commercial relationship with Intel Corp. Dell and the relevant officers, including Mr. Rollins, agreed, without admitting or denying the allegations, to settle the matter, and the U.S. District Court for the District of Columbia approved such settlement on October 13, 2010. Mr. Rollins’ settlement included a monetary penalty and a permanent injunction prohibiting violations of Sections 17(a)(2) & (3) of the Securities Act and violations, including aiding and abetting violations, of Section 13(a) of the Securities Exchange Act of 1934, or the Exchange Act. Mr. Rollins’ industry experience, service as an executive officer and director of other companies, experience in working with companies controlled by private equity sponsors, experience in financial matters and affiliation with TPG, which, prior to the completion of this offering, has the right to select three of our directors, led to the conclusion that he should serve as a director of our Company.
David J. Roux, Director
Mr. Roux has been a member of our board of directors since October 26, 2007 and served as Chairman of the board of directors from November 2, 2007 until December 22, 2008. Mr. Roux is Chairman of Silver Lake. Prior to co-founding Silver Lake in 1999, he served as Chairman and Chief Executive Officer of Liberate Technologies, a software company specializing in telecommunications technology, Executive Vice President at Oracle Corporation, a software and technology company, and Senior Vice President at Lotus Development Corporation, a software manufacturer that was acquired by IBM in 1995. Mr. Roux is also on the boards of directors of various private companies. Mr. Roux served on the boards of directors of Business Objects S.A., a provider of business intelligence software and services, from December 2003 until January 2006, Symantec Corporation, a personal computer security software company, from July 2005 until September 2007, and Thomson S.A., a consumer electronics company from September 2004 until October 2008. Mr. Roux’s experience in financial matters, service as an executive officer and director of other companies, experience in working with companies controlled by private equity sponsors, affiliation with Silver Lake, which, prior to the completion of this offering, has the right to select three directors, and related industry experience, led to the conclusion that he should serve as a director of our Company.
Gary B. Smith, Director
Mr. Smith has been a Director of the Company since his appointment on December 6, 2011. Mr. Smith currently serves as President, Chief Executive Officer and Director of Ciena Corporation, or Ciena, a network infrastructure company. Mr. Smith began serving as chief executive officer of Ciena in May 2001, in addition to his existing responsibilities as president and director, positions he has held since October 2000. Mr. Smith also serves on the board of directors of CommVault Systems, Inc., a provider of data and information management software applications and related services, a position he has held since May 2004. Mr. Smith’s nearly 30 years of experience in the global telecommunications industry, experience in financial matters and independence from the Company, led to the conclusion that he should serve as a director of the Company.
Board Composition and Director Independence
Our business and affairs are managed under the direction of the board of directors. Our board of directors is currently composed of seven directors: Mr. Kennedy and three representatives from each of the Sponsors. We expect that, effective upon completion of this offering, our board of directors will appoint and to
132
Table of Contents
serve on our board of directors and that our board of directors will determine that each such director is an independent director under the applicable rules of the New York Stock Exchange and Rule 10A-3 under the Exchange Act. Currently Mr. Smith is our only non-affiliated director, and he has been determined by the Board to meet the independence rules of the New York Stock Exchange and Rule 10A-3 under the Exchange Act.
Under our certificate of incorporation that will be in effect upon the completion of this offering, until such time as the Sponsors collectively cease to beneficially own at least 40% or more of our outstanding common stock (such time referred to in this section as the “triggering event”), the number of directors shall be no fewer than three and no more than fifteen. At each annual meeting of stockholders, the directors will be elected to serve until the earlier of their death, resignation or removal, or until their successors have been elected and qualified. Vacancies and newly-created directorships on the board may be filled by the remaining directors, and until the triggering event, vacancies on the board may also be filled by holders of a majority of the outstanding shares of common stock.
Currently, each director is elected for a one-year term. Our certificate of incorporation that will become effective upon the closing of this offering provides that at the first annual meeting after the triggering event, the board shall be divided into three classes with staggered three-year terms.
Prior to the triggering event, directors may be removed with or without cause by holders of a majority of the outstanding shares of common stock. Following the triggering event, our directors may be removed only for cause by the affirmative vote of the holders of at least two-thirds of the voting power of our outstanding shares of capital stock entitled to vote generally in the election of directors, voting together as a single class.
A stockholders’ agreement between us and our current shareholders contains an agreement among the parties pursuant to which each of the Sponsors, in its sole discretion, designates three of the current directors. In connection with the consummation of this offering, certain of the provisions in the stockholders’ agreement are likely to be amended or terminated. In addition, Mr. Kennedy’s employment agreement provides that, for so long as he is the Company’s Chief Executive Officer, our Sponsors shall ensure that their affiliates vote to elect him as a member of our board of directors.
Following the completion of this offering, we expect to be a “controlled company” under the rules of the New York Stock Exchange because more than 50% of our outstanding voting power will be held by the Sponsors. See “Principal Stockholders.” We intend to rely upon the “controlled company” exception relating to the board of directors and committee independence requirements under the rules of the New York Stock Exchange. Pursuant to this exception, we will be exempt from the rules that would otherwise require that our board of directors consist of a majority of independent directors and that our compensation committee and nominating and governance committee be composed entirely of independent directors. The “controlled company” exception does not modify the independence requirements for the audit committee, and we intend to comply with the requirements of the Exchange Act and the rules of the New York Stock Exchange, which require that our audit committee have at least one independent director upon consummation of this offering, consist of a majority of independent directors within 90 days following the effective date of the registration statement of which this prospectus forms a part and exclusively of independent directors within one year following the effective date of the registration statement of which this prospectus forms a part.
Board Committees
We currently have an audit committee, a compensation committee and a nominating and governance committee with the composition and responsibilities described below. The members of each committee are appointed by the board of directors and serve until their successor is elected and qualified, unless they are earlier removed or resign. In addition, from time to time, special committees may be established under the direction of the board of directors when necessary to address specific issues.
133
Table of Contents
Audit Committee
Following the offering, the Audit Committee will be composed of Messrs. Frantz, Mondre, Smith and . Mr. Smith became an Audit Committee member in December 2011. will serve as the Chairperson of the Audit Committee.
Mr. Smith is our only non-affiliated Director, and he has been determined by the Board to meet the independence rules of the New York Stock Exchange and Rule 10A-3 of the Exchange Act. We anticipate that, prior to the completion of this offering, our Board will determine that and meet the independence rules as well. Within 90 days following the effective date of the registration statement of which this prospectus forms a part, we anticipate that the Audit Committee will consist of a majority of independent directors, and within one year following the effective date of the registration statement of which this prospectus forms a part, the Audit Committee will consist exclusively of independent directors. None of our Audit Committee members simultaneously serves on the audit committees of more than three public companies, including ours. The board of directors has affirmatively determined that Messrs. Frantz, Mondre, and qualify as audit committee financial experts under the applicable requirements of the rules and regulations of the SEC.
Our Audit Committee is responsible for, among other things:
| • | selecting the independent auditors; |
| • | pre-approving all audit engagement fees and terms, as well as audit and permitted non-audit services to be provided by the independent auditors; |
| • | at least annually, obtaining and reviewing a report of the independent auditors describing the audit firm’s internal quality-control procedures and any material issues raised by its most recent review of internal quality controls; |
| • | annually evaluating the qualifications, performance and independence of the independent auditors; |
| • | discussing the scope of the audit and any problems or difficulties; |
| • | reviewing and discussing the annual audited and quarterly unaudited financial statements and “Management’s Discussion and Analysis of Financial Conditions in Results of Operations” with management and the independent auditor; |
| • | discussing types of information to be disclosed in earnings press releases and provided to analysts and rating agencies; |
| • | discussing policies governing the process by which risk assessment and risk management are to be undertaken; |
| • | reviewing and evaluating the adequacy of the Company’s ethics and compliance program, including our Code of Conduct,Operating with Integrity; |
| • | reviewing disclosures made by the chief executive officer and chief financial officer regarding any significant deficiencies or material weaknesses in our internal control over financial reporting; |
| • | reviewing internal audit activities and qualifications of the internal audit function; |
| • | establishing procedures for receipt, retention and treatment of complaints received by us regarding accounting, auditing or internal controls and the submission of anonymous employee concerns regarding accounting and auditing; |
| • | discussing with our general counsel any material government investigations, litigation or legal matters that could reasonably be expected to have a material impact on business or financial statements; |
| • | approving all related party transactions; |
| • | annually reviewing and reassessing the Audit Committee charter; and |
| • | preparing the report required by the SEC to be included in our annual report on Form 10-K or our proxy or information statement. |
134
Table of Contents
The Audit Committee has authority under its charter to obtain advice and assistance from outside legal counsel, accounting, or other outside advisors as deemed appropriate to perform its duties and responsibilities. A copy of the charter will be available on our website at www.avaya.com upon completion of this offering. Information contained in, and that can be accessed through, our website is not incorporated into and does not form a part of this prospectus.
Compensation Committee
All of our executive officers are employees of Avaya Inc. Prior to June 1, 2011, compensation and related matters were reviewed and approved by the compensation committee of the board of directors of Avaya Inc. On and after June 1, 2011, all such matters are reviewed and approved by the compensation committee of the board of directors of Avaya Holdings Corp. The compensation committees of Avaya Inc. and Avaya Holdings Corp., which we refer to in this prospectus collectively as the “Compensation Committee,” consist of the same members—Messrs. Rollins, Giancarlo, Roux and Smith. Mr. Smith became a Compensation Committee member in December 2011. Mr. Rollins serves as Chairman of the Compensation Committee. During fiscal year 2011, the Compensation Committee held seven meetings. We anticipate that, prior to the completion of this offering, the Compensation Committee, or a subcommittee, will be composed of “outside directors” as defined in Section 162(m) of the Code.
The Compensation Committee is responsible for:
| • | reviewing and approving individual performance of each of the Company’s senior officers reporting directly to the CEO and setting their compensation based on that evaluation; |
| • | reviewing the individual goals and objectives of, and evaluating the performance of, the chief executive officer, and setting the chief executive officer’s compensation based on that evaluation; |
| • | making recommendations to the board of directors regarding the adoption of new incentive compensation and equity-based plans, and administering our existing incentive compensation and equity-based plans; |
| • | making recommendations to the board of directors regarding compensation of the board members and its committee members; |
| • | annually reviewing the Compensation Committee charter and recommending any proposed changes to the Board; |
| • | reviewing and discussing with management the compensation discussion and analysis to be included in our filings with the SEC and preparing an annual compensation committee report for inclusion in our annual report on Form 10-K or proxy statement; and |
| • | overseeing any other such matters as the board of directors shall deem appropriate from time to time. |
The Compensation Committee has authority under its charter to access such internal and external resources, including retaining legal, financial, or other advisors, as the Compensation Committee deems necessary or appropriate to fulfill its responsibilities. A copy of the charter will be available on our website at www.avaya.com upon completion of this offering. Information contained in, and that can be accessed through, our website is not incorporated into and does not form a part of this prospectus.
Nominating and Governance Committee
The Nominating and Governance Committee of our board of directors consists initially of Messrs. Giancarlo, Mohebbi and Kennedy. Mr. Giancarlo serves as Chairman of the Nominating and Governance Committee.
The Nominating and Governance Committee is responsible for and oversees:
| • | evaluating the performance, size and composition of the full board of directors annually to determine the qualifications and areas of expertise needed to further enhance the composition of the board of directors and working with management in attracting candidates with those qualifications; |
135
Table of Contents
| • | establishing criteria for the selection of new directors; |
| • | identifying individuals qualified to become directors and reviewing the qualifications of prospective nominees; |
| • | recommending the slate of nominees for inclusion in the Company’s proxy statement and presentation to the Company’s shareholders at each annual meeting, if any; |
| • | establishing a policy for considering shareholder nominees for election to our board of directors and reviewing any candidates for board membership nominated by shareholders; |
| • | recommending qualified individuals to serve as committee members on the various board committees and recommending to the full board of directors, as appropriate, changes in number, function or composition of committees; |
| • | reviewing the performance of any board member eligible to stand for re-election at our annual meeting, if any, as well as other criteria prescribed by Company policies; |
| • | establish criteria and processes for, and overseeing, the performance and self-evaluation process of our board of directors; |
| • | reviewing and assessing any director who retires, changes from the principal occupation or principal background association held when such director was originally invited to join the board of directors, joins any new board of directors of a public company or private company or joins a governmental commission, and in each case, determining whether it believes that such director’s change in circumstances represents a conflict of interest or otherwise inhibits such director’s ability to serve the best interest of the Company and its stockholders; |
| • | evaluating the need and, if necessary, create a plan for the orientation and continuing education of directors; |
| • | monitoring, with the assistance of our General Counsel, current developments in the regulation and practice of corporate governance; and |
| • | reviewing our corporate governance guidelines once adopted and providing recommendations to the board of directors regarding possible changes. |
The Nominating and Governance Committee has sole authority under its charter to retain and terminate, at the Company’s expense, any search firm or advisor to be used to identify director candidates and has sole authority to approve the search firm’s or advisor’s fees and other retention terms. A copy of the charter will be available on our website at www.avaya.com upon completion of this offering.
Board Leadership Structure
Our board of directors understands that there is no single, generally accepted approach to providing board leadership and that given the dynamic and competitive environment in which we operate, the right board leadership structure may vary as circumstances warrant. To this end, our board of directors has no policy mandating the combination or separation of the roles of Chairman and Chief Executive Officer. We currently have a separate Chairman and Chief Executive Officer. This leadership structure has been determined to be appropriate for us at this time in light of our current relationship with our Sponsors, though our board of directors believes the matter should be discussed and considered from time to time as circumstances change.
Board Oversight of Risk Management
While the full board of directors has the ultimate oversight responsibility for the risk management process, its committees oversee risk in certain specified areas. In particular, our Compensation Committee is responsible for overseeing the management of risks relating to our executive compensation plans and arrangements and the incentives created by the compensation awards it administers. Our Audit Committee oversees management of
136
Table of Contents
enterprise risks as well as financial risks and effective upon the consummation of this offering will also be responsible for overseeing potential conflicts of interests. Pursuant to the board of directors’ instruction, management regularly reports on applicable risks to the relevant committee or the full board of directors, as appropriate, with additional review or reporting on risks conducted as needed or as requested by the board of directors and its committees.
Code of Ethics and Business Conduct
Our Code of Conduct,Operating with Integrity, is designed to help directors and employees worldwide to resolve ethical issues in an increasingly complex global business environment. The Code of Conduct applies to all directors and employees, including, without limitation, the Chief Executive Officer, the Chief Financial Officer, the Corporate Controller and any other employee with any responsibility for the preparation and filing of documents with the SEC. The Code of Conduct covers a variety of topics, including those required to be addressed by the SEC. Topics covered include, but are not limited to, conflicts of interest, confidentiality of information and compliance with applicable laws and regulations. Directors and employees of the Company receive periodic updates regarding policies governed by and changes to the Code of Conduct. The Code of Conduct is available at our Investor Relations website located at http://investors.avaya.com. We will post amendments to or waivers of the provisions of the Code of Conduct made with respect to any of our directors and executive officers on that website within four business days. The information contained on, or accessible through, our website is not part of this prospectus, and is therefore not incorporated by reference. During fiscal year 2011, no amendments to or waivers of the provisions of the Code of Conduct were made with respect to any of our directors or executive officers.
Compensation Committee Interlocks and Insider Participation
Prior to June 1, 2011, all compensation and related matters were reviewed by the compensation committee of Avaya Inc. During fiscal year 2011, the compensation committee of Avaya Inc. was comprised of Messrs. Rollins (Chairman), Roux and Giancarlo. Mr. Rollins is affiliated with TPG, and Messrs. Roux and Giancarlo are affiliated with Silver Lake. Mr. Smith became a member of the Compensation Committee in December 2011. For additional information regarding transactions between those entities and Avaya, please see “Certain Relationships and Related Party Transactions” below.
137
Table of Contents
General
Compensation Philosophy and Objectives
Avaya’s general compensation philosophy is that total compensation should be designed to attract, motivate and retain executive officers and employees in such a way as to create value for the benefit of the Company and its owners. The Company believes that the main objective of its compensation program should be to create a competitive total compensation package that rewards employees for performance against stated goals and objectives. The Company believes that performance should be measured at both the corporate and the individual levels. Employees are rewarded for both their contributions to short-term and long-term corporate performance as well as their demonstrated behaviors and performance measured against individual objectives.
Avaya competes with other companies in the market for talented employees. As a result, Avaya’s market-based pay platform, which defines market pay relative to specific and varying roles and responsibilities, emphasizes the commitment to provide employees with a pay opportunity that is externally competitive. The platform aims to provide Avaya with an increased ability to attract and retain top talent and make more informed pay decisions. The Company has not adopted any formal policies or guidelines for allocating compensation between short-term and long-term compensation, between cash and non-cash compensation, or among different forms of cash and non-cash compensation.
How Compensation Decisions are Made
Compensation Committee
All of our executive officers are employees of Avaya Inc. Prior to June 1, 2011, compensation and related matters were reviewed and approved by the compensation committee of the board of directors of Avaya Inc. On and after June 1, 2011, all such matters are and will be reviewed and approved by the compensation committee of the board of directors of Avaya Holdings Corp. The compensation committees of Avaya Inc. and Avaya Holdings Corp., which we refer to in this prospectus collectively as the “Compensation Committee,” consist of the same members—Messrs. Rollins (Chairman), Giancarlo, Roux and Smith. Mr. Smith became a member of the Compensation Committee in December 2011. During fiscal year 2011, the Compensation Committee held seven meetings.
The Compensation Committee establishes the Company’s compensation philosophy and strategy and discharges the board of directors’ responsibilities relating to the compensation of executive officers. When making individual compensation decisions for each of the executives named in the Summary Compensation Table, who we refer to as the Named Executive Officers, the Compensation Committee takes many factors into account including the officer’s experience, responsibilities, management abilities, job performance and the Company’s performance as a whole and sets compensation based on that evaluation in conjunction with a review of market-based compensation elements. These factors are considered by the Compensation Committee in a subjective manner without any specific formula or weighting. A Compensation Committee member serves until his successor is elected and qualified. Under its charter, the Compensation Committee must consist of at least three members.
Compensation Consultant
For the first half of fiscal year 2011, we retained an advisor on compensation matters, Aon Radford Consulting, on a project by project basis. For the second half of fiscal year 2011, we retained an advisor on compensation matters, Pearl Meyer and Partners, on a project by project basis. In addition, from time to time the Compensation Committee received support from compensation advisors at each of Silver Lake and TPG, our Sponsors.
138
Table of Contents
Role of Management
From time to time, management may recommend that the Compensation Committee adjust executive officer compensation for various reasons, such as changes in executive officer responsibilities or based on information regarding competitive benchmarking of compensation practices. The CEO provides his perspective on each executive officer’s individual performance for the year as part of our annual performance review and succession planning process.
Benchmarking and Competitive Analysis
For fiscal year 2011, we used benchmarking information to align the executive officers’ compensation with a competitive compensation structure, including national surveys that cover a broad group of companies in a variety of industries. Additionally, specific compensation detail was reviewed for benchmarking purposes regarding a number of companies, including the following, or the Peer Group:
• Adobe Systems Incorporated
• Broadcom Corporation
• DST Systems, Inc.
• Intuit Inc.
• NetApp, Inc.
• Qualcomm Incorporated
• Xerox Corporation | • Agilent Technologies, Inc.
• CA, Inc.
• EMC Corporation
• Juniper Networks Inc.
• NCR Corporation
• Symantec Corporation | • Anixter International Inc.
• CommScope Inc.(1)
• Harris Corporation
• Level 3 Communications, Inc.
• Pitney Bowes Inc.
• Unisys Corporation |
| (1) | CommScope was acquired in January 2011, and will not be considered part of the Peer Group in fiscal year 2012. |
Companies were selected to be in the Peer Group based upon factors including, but not limited to, industry (focusing on technology, software and services companies) and revenue.
With respect to each of the following, we strive to be near the median of compensation for executive officers of the Peer Group who hold positions similar to those of the Company’s executive officers:
| • | base salaries; |
| • | total target cash compensation (consisting of base salaries plus annual cash bonuses); and |
| • | total direct compensation (consisting of total target cash compensation plus long-term cash and equity awards). |
We also monitor compensation policies and practices of our competitors who, because of their revenues or other factors, do not meet the criteria to be included within the Peer Group, but with whom we compete in the market for talented employees. These competitors include Brocade, Cisco, Dell Inc., HP, IBM and Microsoft.
Reviewing Compensation Decisions
Following the conclusion of each fiscal year, the Compensation Committee reviews the individual objectives and performance of the CEO and the Company’s executive officers, including the Named Executive Officers. The Compensation Committee then reviews each executive officer’s total compensation package, including, but not limited to, base salary, short-term incentive awards, long-term incentive awards, perquisites, retirement and other benefits. Following the reviews of performance and compensation arrangements, the Compensation Committee sets the compensation for each of those individuals for the following fiscal year. The Compensation Committee generally reviews its decisions with the board of directors to ensure that there is alignment regarding the Compensation Committees’ evaluations and compensation actions, if any.
139
Table of Contents
Fiscal Year 2011 Analysis
During fiscal year 2011, the Compensation Committee actively reviewed executive officer compensation and made adjustments based upon a number of different factors and for a variety of reasons, including with respect to hiring and retaining talent. For example, in December 2010, the Compensation Committee approved changes to the compensation packages for executive officers of the Company, including certain of the Named Executive Officers, following a competitive benchmarking exercise. Also in that month, the Compensation Committee approved a long-term cash bonus performance recognition program for certain employees, including certain of the Named Executive Officers, designed to retain those individuals through fiscal year 2013. Each of these actions is described in greater detail below and in the accompanying tables, including where applicable, the Summary Compensation Table.
Elements of Executive Officer Compensation
We rely upon a mix of compensation elements, including salary, short-term and long-term incentives and other compensation vehicles. The Compensation Committee recognizes that decisions regarding any one element may impact how the Company relies upon or makes use of another element. As a result, the Compensation Committee does not review each element in isolation and instead reviews them in total when making compensation decisions, without any particular weighting. In addition, prior to this offering, we considered the Company’s status as a privately-held entity when making compensation decisions. Because neither Avaya Holdings Corp. nor Avaya Inc. had equity that was publicly traded prior to this offering, at times we have utilized direct cash compensation to a greater extent than, or in lieu of, equity awards to attract and retain employees and to drive incentive-based outcomes. Following the completion of this offering, the Compensation Committee expects to assess the mix of cash compensation and equity awards given to our executive officers compared to external and Peer Group benchmark practices to determine if changes are advisable.
The following highlights the elements of the Company’s compensation program for executive officers, including the Named Executive Officers.
Base Salaries
Base salaries are designed to compensate individuals for their current contributions to the Company as reflected in their day-to-day performance. Base salaries are intended to be competitive relative to similar positions at companies of comparable size in our and similar industries. The Company structures base salaries to help attract, motivate and retain employees with a broad, proven track record of performance. Base salaries are reviewed annually by the Compensation Committee. Consideration of salary adjustments, if any, generally is based on competitive market data collected regarding the Peer Group and individual performance of the executive officers in question. During fiscal year 2011, the base salaries for Messrs. Kennedy and Chirico remained unchanged at $1,250,000 and $625,000 respectively. In consideration of individual performance leading up to and during fiscal year 2011, the Compensation Committee adjusted the base salary for Messrs. Massetti and Ali from $550,000 to $563,750 and from $430,000 to $440,750 respectively, effective on January 1, 2011 as it believed an adjustment was warranted given their positions relative to peers in the market. Effective on April 1, 2011, Mr. Mitchell received an increase in his base salary from $450,000 to $500,000 in connection with a change in his total compensation arrangement upon being named Senior Vice President, SME and Avaya Go To Market. Finally, effective April 15, 2011 in conjunction with his being named Senior Vice President and President, Avaya Client Services, Mr. Ali’s base salary was increased from $440,750 to $500,000.
Short-Term Incentives
Annual Non-Equity Incentive Plan Cash Bonus Program
The Avaya Inc. Short Term Incentive Plan, or STIP, is Avaya’s annual cash bonus program that is designed to reward employees, including the Named Executive Officers, for the achievement of objectives that
140
Table of Contents
are short-term in nature. The STIP provides an opportunity for eligible employees to receive cash bonuses based on the combination of corporate performance and individual performance. The opportunity for a more significant award increases when both the Company and the employee achieve higher levels of performance.
At the beginning of each fiscal year, the Compensation Committee establishes corporate financial objectives that must be met before bonuses will be considered under the STIP. The aggregate amount of cash available for awards under the STIP varies depending on how the Company performs against those financial objectives, as follows:
| • | If corporate performance is less than the minimum thresholds established by the Compensation Committee, then no STIP bonuses are available unless the Compensation Committee exercises its discretion to modify the thresholds or to allocate funds for employee awards. For example, the Compensation Committee may choose to exercise its discretion in the event that an unforeseen one-time item impacts financial performance during the fiscal year. |
| • | If corporate performance is above the minimum thresholds established by the Compensation Committee, then STIP bonuses may be paid to eligible employees. Starting with the minimum thresholds, the aggregate cash pool available to fund employee awards will increase based upon an established formula. There is no cap on the amounts that may be used to fund employee awards under the established formula. Payments associated with these awards are typically made during the first quarter of the subsequent fiscal year. |
Corporate Performance
For fiscal year 2011, the Compensation Committee determined that corporate performance would be measured based upon “Management EBITDA” and total revenue, with each having an equal weighting. “Management EBITDA” is Adjusted EBITDA, as defined in “Management’s Discussion and Analysis of Financial Condition and Results of Operations,” with certain adjustments. Unlike Adjusted EBITDA, to determine Management EBITDA, the Company does not adjust for the amortization of unrecognized prior service cost or unrecognized net actuarial gains/losses associated with non-retirement post employment benefits and long-term disability costs, the Company does not deduct income from unrestricted subsidiaries, net of dividends received, the Company does not adjust for purchase accounting impacts related to the Merger for the recognition of deferred revenue and reduction for deferred costs and business partner commissions written off in purchase accounting, the Company does adjust for the full expense related to pension and other post-employment benefit obligations and the Company does deduct software development costs from the calculation.
The Company believes that the Management EBITDA and total revenue metrics best represented how it measured short-term performance during fiscal year 2011.
For fiscal year 2011, Management EBITDA was measured against quarterly targets. As Management EBITDA represented 50% of the total available STIP funding, each of the four quarters represented 12.5% of the total opportunity against the Management EBITDA goals. Each quarter was measured separately against individual quarterly targets, with a 90% attainment threshold necessary in each quarter to fund the Management EBITDA portion of STIP awards for employees. The remaining 50% of the total available STIP funding was based on the Company’s achievement on total revenue during fiscal year 2011 adjusted for the effect of foreign exchange rates.
The fiscal year 2011 STIP program also provided for payout of an individual’s annual STIP opportunity to occur in two phases. The first phase included a potential mid-year STIP payout to the extent that Management EBITDA performance for the first two quarters of the year met the applicable thresholds. This meant that an individual potentially could have received a mid-year STIP payment of up to 25% of his or her annual STIP opportunity. The second phase included a potential year-end STIP payout where the remainder of his or her STIP opportunity (or up to 75%) could be paid following the end of the fiscal year based on the results of third and fourth quarter Management EBITDA and annual total revenue adjusted for the effect of foreign exchange rates.
141
Table of Contents
Quarterly Management EBITDA targets, representing half of the total potential STIP funding for fiscal year 2011 in the aggregate, were established at $243 million, $269 million, $319 million and $374 million for each of the first, second, third and fourth quarters of fiscal year 2011, respectively. Actual Management EBITDA results for fiscal year 2011 were $246 million, $240 million, $247 million and $289 million for quarters one through four, respectively. The first quarter’s Management EBITDA result funded the mid-year STIP in full (or 12.5% of the total STIP opportunity for the fiscal year) and the second quarter’s Management EBITDA result funded the mid-year STIP at 25% (or 3.1% of the total STIP opportunity for the fiscal year). Management EBITDA results for the third and fourth quarters did not meet the 90% attainment threshold for each quarter’s goal, and thus did not contribute funding for year-end STIP payments. Overachievement of annual EBITDA targets may have funded additional amounts to fiscal 2011 STIP funding had the targets been exceeded, however annual targets were not reached, and no additional funding was applied.
The total revenue target, representing half of the total potential STIP funding for fiscal year 2011, was established at $5,600 million. Actual revenue for fiscal year 2011 was $5,547 million, providing for a year-end STIP funding of up to 57.6% of the total revenue opportunity (or 28.8% of the total STIP opportunity for the fiscal year). The amount of funding was adjusted to reflect the impact of certain shortfalls in Company performance impacting revenue and EBITDA, which were then reflected in individual performance assessments.
Calculation of Individual Awards
The fiscal year 2011 mid-year payment of STIP was calculated per eligible employee as their STIP opportunity (base salary as of March 31, 2011, multiplied by the employee’s STIP target percentage (based on job level and pro-rated for changes in STIP targets during the year), multiplied by 25%—the weighting of the mid-year award) multiplied by 62.5% (the achieved funding level). This calculation resulted in a mid-year STIP payment of 15.6% of an employee’s annual STIP opportunity. The mid-year payment generally was not tied to individual performance, as the design for the full year STIP heavily weighs individual performance in conjunction with the year-end payment.
The fiscal year 2011 year-end payment of STIP was calculated per eligible employee as their STIP opportunity (base salary as of September 30, 2011, multiplied by the employee’s STIP target percentage (based on job level and pro-rated for changes in STIP targets during the year), multiplied by 75%—the weighting of the year-end award) multiplied by 38.4% (the achieved funding level). This calculation resulted in a possible year-end STIP payment of 28.8% of employee’s annual STIP opportunity. An individual employee’s possible year-end award was then adjusted based on individual performance at the discretion of the employee’s supervisor, or in the case of the Named Executive Officers, at the discretion of the Compensation Committee. Adjustments could place actual year-end STIP payments below, equal to or greater than the total year-end STIP opportunity an individual could receive.
The assessment of an executive officer’s individual performance included consideration of that executive officer’s leadership qualities and achievement of stated objectives. Award targets for executive officers are set as a percentage of their base salaries and are based upon their respective roles and responsibilities and competitive market data.
In December 2010, the Compensation Committee approved changes to certain executive officer STIP targets, including those for certain Named Executive Officers, effective January 1, 2011. The changes were based upon reviews of the performance of those executive officers during fiscal year 2010 as well as competitive market data. As a result of the changes, which were effective January 1, 2011, the annual target incentive opportunities for Messrs. Kennedy and Massetti were increased to 125% and 90%, respectively. The target incentive opportunity for Messrs. Chirico and Ali remained unchanged at 85% and 75%, respectively. Effective April 1, 2011, Mr. Mitchell became eligible to participate in the Company’s STIP program with an award target incentive opportunity of 80% of his base salary upon being named Senior Vice President, SME and Avaya Go to Market. Finally, effective April 15, 2011 in conjunction with his being named Senior Vice President and
142
Table of Contents
President, Avaya Client Services, Mr. Ali’s target award under the STIP program was increased from 75% to 80%. The Compensation Committee believes those adjustments were warranted given each officer’s relative compensation as compared to the compensation of executives holding similar roles at other companies.
For fiscal year 2011, included within the Summary Compensation Table under the heading “Non-Equity Incentive Plan Compensation,” based on the fiscal year 2011 mid-year and year-end performance results, each of Messrs. Kennedy, Massetti, Chirico, Mitchell and Ali received $959,227, $294,232, $389,008, $115,200 and $248,700, respectively, under the STIP.
The following table illustrates the calculation of each STIP award for fiscal year 2011:
Mid-Year STIP Payment
Name(1) | Base Salary 3/31/11 | Mid-Year STIP Opportunity(2) | Mid-Year STIP Weighting | Achievement Results | Mid-Year STIP Award | |||||||||||||||||
Kevin J. Kennedy | $ | 1,250,000 | 112.5% | 25% | 62.5% | $ | 219,727 | |||||||||||||||
Anthony J. Massetti | $ | 563,750 | X | 87.5% | X | 25% | X | 62.5% | = | $ | 77,075 | |||||||||||
James M. Chirico, Jr. | $ | 625,000 | 85.0% | 25% | 62.5% | $ | 83,008 | |||||||||||||||
Mohamad S. Ali | $ | 440,750 | 75.0% | 25% | 62.5% | $ | 51,650 | |||||||||||||||
| (1) | As noted above, Mr. Mitchell became eligible to participate in the Company’s STIP program on April 1, 2011, and was not eligible to receive a mid-year STIP payment. |
| (2) | Represents pro-rated STIP opportunity for mid-year portion of STIP award, based on changes in STIP targets during the course of fiscal year 2011. For further information see “—Elements of Executive Compensation—Short-Term Incentives—Calculation of Individual Awards.” |
Year-End STIP Payment
Name(1) | Base Salary 9/30/11 | Year-End STIP Opportunity(1) | Year-End STIP Weighting | Achievement Results | Individual Performance Adjustment | Year-End STIP Award | ||||||||||||||||||||
Kevin J. Kennedy | $ | 1,250,000 | 120.8 | % | 75% | 38.4% | 170% | $739,500 | ||||||||||||||||||
Anthony J. Massetti | $ | 563,750 | 89.2 | % | 75% | 38.4% | 150% | $217,157 | ||||||||||||||||||
James M. Chirico, Jr. | $ | 625,000 | X | 85.0 | % | X | 75% | X | 38.4% | X | 200% | = | $306,000 | |||||||||||||
Thomas G. Mitchell | $ | 500,000 | 53.3 | % | 75% | 38.4% | 150% | $115,200 | ||||||||||||||||||
Mohamad S. Ali | $ | 500,000 | 78.2 | % | 75% | 38.4% | 175% | $197,050 | ||||||||||||||||||
| (1) | Represents pro-rated STIP opportunity for year-end portion of STIP award, based on changes in STIP targets during the course of fiscal year 2011. The year-end pro-ration is weighted separately for service during the year toward the annual revenue opportunity and the six month year-end EBITDA opportunity. For further information see “—Elements of Executive Compensation—Short-Term Incentives—Calculation of Individual Awards.” |
Additional Cash Payments
Cash awards are occasionally made to employees for a variety of reasons, including, but not limited to, immediate retention purposes, pursuant to offers of employment and in recognition of significant individual contributions for specific projects or performance during the fiscal year. The Compensation Committee or the board of directors must approve all cash awards made to each executive officer of the Company, including the Named Executive Officers.
During fiscal year 2009, the Compensation Committee approved two cash retention awards for Mr. Chirico in conjunction with his being named Chief Restructure Officer, the position he held before being named
143
Table of Contents
Executive Vice President, Business Operations. The first award, which is for $2,700,000, is payable in 2 installments of $1,000,000 and $1,700,000, the first of which he received in fiscal year 2009 and the second of which he received in fiscal year 2011. The second award, which is for $900,000, was paid in equal installments during a three-fiscal-year period beginning in fiscal year 2009. During fiscal year 2011, Mr. Chirico received a total of $2,000,000 pursuant to the second award.
During fiscal year 2010, Avaya Inc. adopted an employee cash bonus program in connection with the NES acquisition designed to help retain certain employees, including the Named Executive Officers, during the critical period required to integrate that business with the Company. Of the Named Executive Officers, Messrs. Massetti and Chirico each received awards of $200,000, and Mr. Ali received an award of $150,000. Each of the Named Executive Officers received the first of two equal installments under this program during fiscal year 2011, as reflected below in the Summary Compensation Table.
At the beginning of fiscal year 2011, Mr. Mitchell was not eligible to participate in the Company’s STIP program, however he was eligible to receive a cash bonus according to the terms of his employment agreement. Mr. Mitchell was eligible to receive $550,000 at target, based on his achievement against established performance targets. In December 2010, Mr. Mitchell received a payment of $228,250 for results associated with the first half of his annual target, and, in April 2011, he received a payment of $275,000 for results associated with the second half of his annual target. These amounts are included within the Summary Compensation Table below under the column labeled “Bonus.” Effective April 1, 2011, Mr. Mitchell became eligible to participate in the STIP program in connection with his revised offer of employment. See “Employment, Change in Control and Separation Agreements—Mr. Mitchell’s Offer of Employment” for more information.
For additional information regarding all of these awards, please see the Summary Compensation Table.
Long-Term Incentives
Following the consummation of the Merger, our shareholders approved the 2007 Plan and our Long-Term Incentive Cash Bonus Plan, or the Cash Plan. These plans are intended to advance the interests of the Company and its affiliates by providing for the grant to select individuals, including the Named Executive Officers, of long-term equity and cash incentive awards. These equity and cash awards are designed to help achieve long-term goals and objectives and, in the process, align management interests with those of shareholders.
As of September 30, 2011, 49,848,157 shares of our common stock were authorized for issuance in connection with awards granted pursuant to the 2007 Plan, in addition to 2,924,125 shares available for issuance in satisfaction of Continuation Options and Continuation Units, or together the Continuation Awards. None of the Named Executive Officers holds any Continuation Awards. Also as of September 30, 2011, we were authorized to issue up to $60,000,000 in aggregated awards under the Cash Plan. None of the Named Executive Officers holds any awards under the Cash Plan.
The sizes of equity awards are structured by balancing the interests of shareholders, in terms of the impact of dilution, with the need to align the interests of management with those of shareholders. An objective is to provide long-term incentive compensation that is competitive with that offered by peer companies. Individual grants of equity awards are based on various factors, including a review of Peer Group and other competitive market data, demonstrated sustained performance and each individual’s demonstrated ability to contribute to the Company’s future success. The Company’s ability and desire to retain key talent is also considered. With the exception of considerations regarding dilution, similar factors are used when determining long-term cash incentive awards.
Long-term incentive awards were made during fiscal year 2011 in connection with new-hire employment offers, for purposes of promotion and retention of existing employees and in recognition of significant individual contributions for specific projects or performance during the fiscal year.
144
Table of Contents
To the extent any of the Named Executive Officers received grants of long-term incentive awards during fiscal year 2011, they are included in the “Grants of Plan-Based Awards” table below.
Since our common stock is not publicly traded, the terms of the 2007 Plan require that our board of directors or a committee of the board, as plan administrator, determine the fair market value of a share of our common stock. The determination is based in part upon the recommendation of our CEO and an independent third-party appraisal that is obtained at least annually and reassessed by the plan administrator at least semi-annually. For fiscal year 2011, the Compensation Committee obtained an independent valuation and considered that valuation as well as other factors when setting the exercise price of stock option awards granted throughout the year. See “Management’s Discussion and Analysis—Critical Accounting Policies—Share-based Compensation.”
Our Compensation Committee regularly considers the accounting implications of significant compensation decisions, especially in connection with decisions that relate to our equity incentive award plans and programs. As accounting standards change, we may revise certain programs to appropriately align accounting expenses of our equity awards with our overall executive compensation philosophy and objectives.
2011 Equity Incentive Plan
Effective upon completion of this offering, our board of directors intends to adopt an incentive plan to be named the Avaya Holdings Corp. 2011 Equity Incentive Plan, or the 2011 Plan. The 2011 Plan will be in addition to the 2007 Plan. The following summary describes the material terms of the 2011 Plan but is not a complete description of all its terms. This summary is qualified in its entirety by reference to the 2011 Plan, which will be filed as an exhibit to the registration statement of which this prospectus is a part.
The 2011 Plan will be administered by the Compensation Committee, and participants will be selected from among the key employees, directors and consultants of, and advisors to, the Company or its affiliates, subject to certain limitations in the case of incentive stock options, or ISOs. The awards that can be granted under the 2011 Plan include stock options, restricted and unrestricted stock and stock units, performance awards, stock appreciation rights, other stock-based awards and cash awards. In the Compensation Committee’s discretion, an award may also provide for dividend equivalents, subject to applicable legal and tax requirements.
Subject to adjustment, the maximum number of shares of common stock that may be delivered in satisfaction of awards under the 2011 Plan will be shares. The number of shares that may be delivered under the 2011 Plan will not be reduced by shares of common stock withheld by the Company in payment of the exercise price of an award or in satisfaction of tax withholding obligations, and a share of common stock underlying an award settled in cash or an award that expires or becomes unexercisable without having been exercised or is forfeited to or repurchased by the Company as a result of not having vested.
No more than shares of common stock may be issued pursuant to ISOs under the 2011 Plan. The maximum number of shares of common stock for which stock options may be granted and the maximum number of shares of common stock subject to stock appreciation rights that may be granted to any person in any calendar year will each be shares. In addition, the maximum number of shares subject to awards, other than stock options and stock appreciation rights, that may be granted to any person in any calendar year will be shares. The maximum amount payable to any person as cash awards under the 2011 Plan will be $ .
The Compensation Committee will have the authority to determine the vesting schedule applicable to each award, and to accelerate the vesting or exercisability of any award. The Compensation Committee will also determine the effect of termination of employment or service on an award.
The 2011 Plan will provide that grants of performance awards will be made subject to the achievement of “performance criteria” over a performance period, which may be one or more periods as established by the
145
Table of Contents
Compensation Committee. Performance criteria with respect to those awards that are intended to qualify as “performance-based compensation” for purposes of Section 162(m) of the Code will mean one or more objectively determinable measures of performance relating to any, or any combination, of the following (measured either absolutely or by reference to an index or indices or the performance of one or more companies and determined either on a consolidated basis or, as the context permits, on a divisional, subsidiary, line of business, project or geographical basis or in combinations thereof): net sales; system-wide sales; revenue; revenue growth or product or services revenue growth; operating income (before or after taxes); pre- or after-tax income or loss (before or after allocation of corporate overhead and bonus); earnings or loss per share; net income or loss (before or after taxes); adjusted operating income; adjusted net income; adjusted earnings per share; return on equity; total stockholder return; return on assets or net assets; appreciation in and/or maintenance of the price of the shares or any other publicly-traded securities of the Company; market share; gross profits; earnings or losses (including earnings or losses before taxes, before interest and taxes, or before interest, taxes, depreciation and/or amortization, and including with further adjustments as deemed appropriate by the administrator); economic value-added models or equivalent metrics; comparisons with various stock market indices; reductions in costs; cash flow or cash flow per share (before or after dividends); return on capital (including return on total capital or return on invested capital); cash flow return on investment; improvement in or attainment of expense levels or working capital levels, including cash, inventory and accounts receivable; operating margin; gross margin; gross margin percentage; adjusted gross margin, cash balance; cash margin; debt reduction; stockholders equity; operating efficiencies; customer satisfaction and/or loyalty; customer growth; employee engagement and/or satisfaction; supply chain achievements (including establishing relationships with manufacturers or suppliers of component materials and manufacturers of the Company’s products); points of distribution; co-development, co-marketing, profit sharing, joint venture or other similar arrangements; financial ratios, including those measuring liquidity, activity, profitability or leverage; cost of capital or assets under management; success in implementing financing and other capital raising transactions (including sales of the Company’s equity or debt securities; factoring transactions; sales or licenses of the Company’s assets, including its intellectual property, whether in a particular jurisdiction or territory or globally; or through partnering transactions); implementation, completion or attainment of measurable objectives with respect to research, development, manufacturing, commercialization, products or projects, production volume levels, acquisitions and divestitures; and recruiting and maintaining personnel. To the extent consistent with the requirements for satisfying the performance-based compensation exception under Section 162(m), the administrator may establish that, in the case of any award intended to qualify for such exception, one or more of the performance criteria applicable to such award will be adjusted in an objectively determinable manner to reflect events (for example, the impact of charges for restructurings, discontinued operations, mergers, acquisitions, extraordinary items, and other unusual or non-recurring items, and the cumulative effects of tax or accounting changes, each as defined by U.S. generally accepted accounting principles) occurring during the performance period that affect the applicable performance criterion or criteria.
We anticipate that, prior to the completion of their offering, the Compensation Committee, or a subcommittee, will be composed of “outside directors” as defined in Section 162(m) of the Code.
In the event of a consolidation, merger or similar transaction, a sale or transfer of all or substantially all of the Company’s assets or a dissolution or liquidation of the Company, the Compensation Committee may, among other things, provide for continuation or assumption of outstanding awards, for new grants in substitution of outstanding awards, or for the accelerated vesting or delivery of shares under awards, in each case on such terms and with such restrictions as it deems appropriate. Except as otherwise provided in an award agreement, awards not assumed will terminate upon the consummation of such corporate transaction.
In the event of certain corporate transactions that involve a change in the Company’s capital structure, the Compensation Committee will make appropriate adjustments to the maximum number of shares that may be delivered under the 2011 Plan and the individual limits included in the 2011 Plan, and will also make appropriate adjustments to the number and kind of shares of stock or securities subject to awards, the exercise prices of such awards or any other terms of awards affected by such change in the Company’s capital structure. The
146
Table of Contents
Compensation Committee will also make the types of adjustments described above to take into account events other than those listed above if it determines that such adjustments are appropriate to avoid distortion and preserve the value of awards.
The Compensation Committee will be able to amend the 2011 Plan or outstanding awards, or terminate the 2011 Plan as to future grants of awards, except that the Compensation Committee will not, without the participant’s consent, be able alter the terms of an award if it would affect materially and adversely a participant’s rights under the award.
Employee Stock Purchase Plan
Effective upon completion of this offering, our board of directors intends to adopt an employee stock purchase plan, or the ESPP. The purpose of the ESPP is to enable eligible employees of the Company and of certain of its subsidiaries to purchase shares of our common stock and thereby acquire an interest in the future of the Company. The ESPP will be administered by our board of directors or its delegate. The maximum aggregate number of shares of our common stock available for purchase under the ESPP will be .
Employees will be offered the option to purchase shares of our common stock during offering periods whose duration will be determined by the board. Unless the board provides otherwise, there generally will be two offering periods each year, one running for the first half of our fiscal year and the other running for the second half of our fiscal year, with the initial offering period expected to begin on . During each offering period, eligible employees will be given the option to purchase shares of our common stock at % of their fair market value on the date of exercise of the option, which will be the last day of the offering period. The board will determine procedures for eligible employees to elect to participate in the ESPP.
Participation in the ESPP will be limited to eligible employees of the Company and of those subsidiaries of the Company that our board may designate not including highly compensated employees subject to the disclosure requirements of Section 16(a) of the Exchange Act. Any employee who owns (or is deemed under statutory attribution rules to own) stock possessing 5% or more of the total combined voting power or value of all classes of stock of the Company or of any of our subsidiaries will not be permitted to participate in the ESPP. Also, any employee who is not employed by the Company or one of our subsidiaries at the start of an option period will not be permitted to participate in the ESPP for that offering period.
A participant in the ESPP will be permitted to designate an amount of up to 10% of the participant’s compensation (for these purposes, the participant’s base salary plus any sales commissions, paid by the Company to the participant during an offering period) to acquire shares of our common stock. In no event will a participant be granted an option under the ESPP that would permit the participant in any calendar year to purchase stock under the ESPP or any other employee stock purchase plan of the Company or any of our subsidiaries with a fair market value (determined as of the beginning of the relevant offering periods) of more than $25,000.
Participants may pay for the common stock purchased under the ESPP through authorization of payroll deductions, which will be accomplished by means of withholding at a whole percentage of a participant’s compensation. The board may, however, authorize other means of payment, such as a lump sum cash payment. An authorization of payroll deductions will remain in effect for subsequent offering periods unless a participant revokes or changes the authorization. A participant may cancel his or her election to participate, and may terminate any payroll deductions, at any time prior to the purchase of our common stock by written notice delivered to the Company. Upon cancellation, any amount contributed by a participant or withheld from a participant’s compensation will be returned to the participant.
A participant may not transfer any rights under the ESPP, and, upon death or termination of employment during an offering period, any right held by a participant to purchase shares of our common stock under the ESPP is deemed canceled.
147
Table of Contents
In the event of a merger or similar transaction or change of control, the board will provide that any outstanding right to purchase shares of our common stock under the ESPP is assumed or substituted for, or is canceled with a return of any amounts contributed by or withheld from the compensation of a participant, or that the offering period ends before the date of the proposed sale or merger.
The board has discretion to amend the ESPP to any extent and in any manner it may deem advisable, provided that any amendment that would be treated as the adoption of a new plan for purposes of Section 423 of the Code will take effect only if approved by shareholders of the Company within twelve months before or after its adoption.
Stock Option Awards
Key employees, directors, and consultants of the Company may be eligible to receive stock options under the 2007 Plan. Each stock option, when vested and exercised, entitles the holder to receive one share of our common stock, subject to certain restrictions on transfer and sale as provided for in the 2007 Plan and the related award agreements.
Fiscal Year 2011 Awards
During fiscal year 2011, awards of time-based and market based multiple of money, or MoM, stock options were made to Company employees including executive officers and Named Executive Officers. Each grant of stock options included both time-based stock options and MoM-based stock options, weighted 65% and 35%, respectively, of the total number of shares subject to each award. The time-based portions of the awards vest 25% on the first anniversary of the grant date and thereafter vest in equal installments annually over the following three-year period, becoming fully vested four years after the grant date. The MoM stock options vest 50% upon the achievement of a multiple of 1.6 times, and 100% upon the achievement of a multiple of 2.0 times or greater, of the initial amount invested in us by the Sponsors, which is defined in the award agreements to be $1.5 billion. By way of example, if the Sponsors were to divest their common stock in Avaya in exchange for cash equal to or greater than $3 billion, then 100% of these MoM stock options held by an award recipient would vest. In the event that the Company’s stock is traded on a national securities exchange following October 2011, the replacement MoM stock options vest 50% upon the achievement for a full quarter of both (i) a multiple of 0.8 times and (ii) the combination of the average trading price together with cash proceeds received prior to the determination equaled or exceeded a multiple of 1.6 times. The remaining 50% vested upon the achievement of both (i) a multiple of 1.0 times and (ii) the combination of the average trading price together with cash proceeds received prior to the determination equaling or exceeding a multiple of 2.0 times. By way of example, following the completion of this offering, if in any full calendar quarter after October 2011 the Sponsors divest a portion of their Avaya common stock in exchange for cash equal to $1.2 billion (a multiple of 0.8 times) and the aggregate value of the remaining portion of shares of Avaya common stock that the Sponsors continue to hold equals $1.2 billion (based on the average trading price), then 50% of these MoM stock options held by an award recipient would vest.
During fiscal year 2011, Mr. Mitchell received a stock option award in connection with being named Senior Vice President, SME and Avaya Go To Market, and Mr. Ali received a stock option award in connection with being named Senior Vice President and President, Avaya Client Services, each with weightings and vesting periods as set forth in the immediately preceding paragraph. The details of those awards are set forth in the “Grants of Plan-Based Awards” table below.
Restricted Stock Unit Awards
Key employees, directors and consultants of the Company may be eligible to receive RSUs under the 2007 Plan. Each restricted stock unit, when vested, entitles the holder to receive one share of our common stock, subject to certain restrictions on their transfer and sale as provided for in the 2007 Plan and the related award
148
Table of Contents
agreements. RSUs vest over time according to the provisions set forth in their individual award agreements. As reflected in the “Grants of Plan-Based Awards” table, during fiscal year 2011 Mr. Mitchell received an award of 50,000 RSUs in conjunction with being named Senior Vice President, Small and Medium Enterprise Go to Market.
2011-2013 Performance Recognition Plan
On December 22, 2010, the Compensation Committee approved a plan to provide cash incentives to certain executive officers, including its Named Executive Officers, to help promote the long-term value of the Company, referred to as the Avaya Inc. Executive Committee 2011-2013 Performance Recognition Plan, or the EC LTIP. The Compensation Committee currently serves as that plan’s administrator. On May 11, 2011, the Compensation Committee approved the final plan document and form of award agreement. The plan was amended on that date as well.
Each award under the EC LTIP consists of the grant to a plan participant of the conditional right to receive a dollar amount credited to an account for such participant based on the Company’s performance during fiscal years 2011, 2012 and 2013. The amount credited to a participant’s account for each of the respective fiscal years will be determined based on the Company’s actual Management EBITDA (as defined above) excluding the impact of payments under the STIP, or Pre-STIP EBITDA, compared to performance thresholds and targets established by the plan administrator for the applicable fiscal year, subject to a multiplier for each threshold and target. The amount credited to a participant’s account for a fiscal year will equal his or her targeted award multiplied by the multiplier determined based on the Company’s actual performance. Attainment of Pre-STIP EBITDA between the threshold and target levels will result in a pro rata adjustment (based on straight line interpolation) to the applicable multipliers. For fiscal year 2011, the threshold Pre-STIP EBITDA was established at $820 million and the target Pre-STIP EBITDA was established at $994 million. Achievement of corporate performance equal to the applicable threshold and target would result in multipliers of 75% and 100%, respectively, of the award amounts identified for each of the Named Executive Officers below. The Compensation Committee expects to establish thresholds and targets under the EC LTIP for fiscal years 2012 and 2013 during the first quarter of each respective year.
If the Pre-STIP EBITDA attained for any fiscal year is less than the applicable threshold, then no amount will be credited to a participant’s account for that fiscal year. For any fiscal year where the actual Pre-STIP EBITDA equals or exceeds the target for such year, the plan administrator may, in its sole discretion, credit an additional amount to one or more participant’s accounts based on any factors it determines are appropriate, including, but not limited to, individual performance and contribution to the business. In no event, however, will the amount credited to a participant’s account for any fiscal year exceed 160 percent of that participant’s targeted award.
The dollar amount of all awards that may be issued under the EC LTIP at target payout is $25 million and shall not exceed $40 million in the aggregate for all participants.
If during the one-year period following a change of control transaction involving us, a participant in the plan is involuntarily terminated other than for “cause” or voluntarily terminates for “good reason” (as each such term is defined in the EC LTIP plan document), a pro rata portion of the targeted award for such fiscal year shall be credited to the participant’s account for that year.
In addition, a participant will (i) forfeit any or all rights with respect to the award or to amounts previously paid under an award and (ii) be required to pay back any such previously paid amounts, if the participant breaches any nondisclosure, non-competition, non-solicitation or other undertakings set forth in the award agreement.
Fiscal year 2011 results for Pre-STIP EBITDA of $1,022 million exceeded the annual target established by the Committee.
149
Table of Contents
The table below reflects the threshold and target award established for the Named Executive Officers for fiscal year 2011, and the resulting earned amount factoring individual performance and contribution to the business during the year. The earned amounts are included in the Summary Compensation Table below, under the heading “Non Equity Incentive Plan Compensation.”
Named Executive Officer | Annual Opportunity @ Threshold | Annual Opportunity @ Target | Actual FY11 Award Received | |||||||||
Kevin J. Kennedy | $ | 937,500 | $ | 1,250,000 | $ | 1,625,000 | ||||||
Anthony J. Massetti | $ | 422,813 | $ | 563,750 | $ | 620,125 | ||||||
James M. Chirico, Jr. | $ | 468,750 | $ | 625,000 | $ | 937,500 | ||||||
Thomas G. Mitchell | $ | 125,000 | $ | 166,667 | $ | 183,333 | ||||||
Mohamad S. Ali | $ | 375,000 | $ | 500,000 | $ | 625,000 | ||||||
Long-Term Cash Bonus Awards
Key employees, directors, and consultants of the Company may be eligible to receive an award under our Long-Term Incentive Cash Bonus Plan. Under this plan, each award will become payable upon the achievement of a multiple of 1.6 times or greater of the initial amount invested in us by the Sponsors, which is defined in the plan to be $1.5 billion. Executives of the Company at the level of Vice President or higher, including the Named Executive Officers, generally do not receive awards under this plan.
Long-Term Incentive Award Agreement Provisions
All long-term equity and cash incentive awards are subject to the terms and conditions of the award agreements and the plans under which they were issued. In addition to provisions regarding vesting, all awards made in fiscal year 2011, including those made to the Named Executive Officers, contain provisions restricting award recipients from, among other things, disclosing proprietary Company information and, for a period of twelve months from the date of termination of employment, soliciting the Company’s customers or employees. A breach of any of the imposed restrictions will cause the underlying award to be cancelled in its entirety and any benefit already paid out prior to the Company’s notice to the award recipient of the violation shall, at the Company’s sole discretion, be required to be repaid to the Company.
In addition to the restrictions noted in the above paragraph, each long-term incentive award made to an employee at the Vice President level or above, including each of the Named Executive Officers, includes a provision restricting the recipient from working directly or indirectly for, and from providing services in any capacity, to a material competitor of the Company for a period of twelve months following their termination of employment.
To the extent an individual acquires shares of our common stock upon exercise of a stock option or vesting of an RSU, those shares are subject to the restrictions on transfer and other provisions contained in a management stockholders’ agreement and, in the case of certain executive officers, including certain of the Named Executive Officers, a registration rights agreement. See “Certain Relationships and Related Party Transactions.”
Other Compensation
In addition to base salaries, short-term incentives and long-term incentives, the Company provides its executive officers with certain other benefits to remain competitive in the market for a high-caliber management team.
Perquisites
Certain temporary relocation expenses are paid on behalf of executive officers, including the Named Executive Officers, in order to attract and retain critical talent. During fiscal year 2011, tax gross up payments
150
Table of Contents
were made with respect to eligible temporary relocation expenses. For additional information regarding perquisites made available to the Named Executive Officers during fiscal year 2011, please see the “All Other Compensation” column of the Summary Compensation Table and the corresponding footnotes.
Post-Employment Benefit Information
Pension Plans
Avaya maintains a non-contributory qualified pension plan, known as the Avaya Inc. Pension Plan for Salaried Employees, or APPSE, which covers U.S. salaried employees hired before January 1, 2004. Pension amounts based on the pension plan formula that exceed the applicable Code limitations with respect to qualified pension plans are paid to qualifying individuals under a non-contributory unfunded supplemental pension plan, called the Avaya Inc. Supplemental Pension Plan, or ASPP. Effective December 31, 2003, pension benefit accruals provided under the APPSE and accruals provided under the ASPP were frozen with respect to all employees. Additionally, no new employees hired after December 31, 2003, including all of the Named Executive Officers, are eligible to participate in the APPSE or the ASPP. Please see “Pension Benefits” below for additional information.
Savings Plans
At the same time the changes were made to the APPSE and the ASPP described above, the Company enhanced the Avaya Inc. Savings Plan for Salaried Employees, or ASPSE, a qualified savings plan that covers U.S. salaried employees, and created the Avaya Inc. Savings Restoration Plan, or ASRP. The ASRP is an unfunded non-qualified deferred compensation plan designed to restore contribution opportunities lost under the ASPSE as a result of Internal Revenue Service, or IRS, Code limits. The ASRP provides that executives will be able to defer compensation and receive Company allocations (automatic company contributions and company matching contributions) that cannot be made or received under the ASPSE due to limitations imposed by the Code.
Prior to January 1, 2009, the ASPSE included an automatic 2% Company contribution and a match formula of 100% on the first 2% of eligible compensation contributed by a participant and 50% on the next 4% of eligible compensation contributed by a participant. Effective January 1, 2009, the ASPSE was revised to remove the automatic 2% Company contribution and to change the matching formula to 100% of the first 4% of eligible compensation contributed by each participant. The entire Company matching portion for both plans was then suspended effective March 1, 2009.
Effective April 1, 2010, the Company reinstated ASPSE matching contributions. The formula for matching contributions was 50% on the first 3% of eligible compensation contributed by a participant. Effective October 1, 2010, the Company matching allocation for the ASPSE was further enhanced to 100% on the first 2% of eligible compensation contributed by a participant and 50% on the next 1% of eligible compensation contributed by a participant. The Company matching allocation for the ASRP has not been restored since its suspension on March 1, 2009.
For more information regarding each of these plans, please see “Pension Benefits” and “Nonqualified Defined Contribution and Other Deferred Compensation Plans” below.
Employment, Change in Control and Separation Arrangements
Mr. Kennedy’s Employment Agreement
Mr. Kennedy is party to an employment agreement with the Company under which he agrees to serve as the Company’s President and CEO. The agreement, which became effective December 22, 2008, has an initial three-year term that is automatically renewed for subsequent one-year periods unless notice of non-renewal is
151
Table of Contents
delivered by the Company. Under the agreement, Mr. Kennedy’s base salary is $1,250,000. It provides that his target cash award under the STIP is 100% of his base salary, with the maximum award payable to him under the STIP being subject to a cap of 200% of his base salary. Pursuant to the agreement, Mr. Kennedy received a guaranteed incentive award for fiscal year 2009 of $965,754 and a transition bonus of $850,000. As noted above, the Compensation Committee approved a change to Mr. Kennedy’s target opportunity under the STIP, to 125% of his base salary, effective January 1, 2011.
Under the agreement, Mr. Kennedy received, effective as of the date his employment with the Company commenced, a grant of 5,000,000 stock options having an exercise price equal to the fair market value of a share of our common stock at the time of grant, which was $3.80. These awards were exchanged for replacement options with an exercise price of $3.00 per share under a stock option exchange program conducted in fiscal year 2010.
Effective December 22, 2008, Mr. Kennedy also received 400,000 RSUs, which vest equally on the first, second, third and fourth anniversary dates of the grant date. Currently, the RSUs are subject to certain puts and calls that expire on the offering. Prior to an initial public offering, (i) if Mr. Kennedy’s employment is terminated other than for cause, (ii) if he voluntarily resigns for any reason or (iii) upon his death or disability, Mr. Kennedy has the right to require us to purchase from him any or all of the shares of common stock subject to his vested RSUs at fair market value, unless fair market value is less than $10 per share, in which case the purchase price shall be $10 per share, or the RSU Price. Further, in the event that certain “drag-along” or “tag-along” provisions under the management stockholders’ agreement are exercised and Mr. Kennedy sells shares of common stock underlying vested RSUs in certain transactions and receives less than $10 per share, then we are obligated to pay to Mr. Kennedy the difference between $10 per share and the amount realized by Mr. Kennedy in such transaction.
In addition, the agreement provides that, for so long as Mr. Kennedy is the Company’s CEO, the Sponsors shall ensure that their affiliates vote to elect him as a member of our board of directors.
Mr. Massetti’s Offer of Employment
Mr. Massetti became the Company’s Senior Vice President and Chief Financial Officer on October, 26, 2009. Under the terms of his offer of employment, Mr. Massetti’s annual base salary is $550,000 and his annual target award under the Avaya STIP is 85% of his annual base salary. Pursuant to the terms of his offer, the amount of his fiscal year 2010 award under the STIP was prorated for his days of service during the fiscal year. In addition, he received a cash sign-on bonus payment of $375,000 in January 2010 and a cash sign-on bonus payment of $750,000 in March 2011. Each award requires repayment to the Company if Mr. Massetti terminates his employment for any reason or if the Company terminates his employment for cause, in either case within 12 months following each payment. The repayment amount will be prorated based on the number of months employed in the 12 month period following payment. As noted above, the Compensation Committee approved a change to Mr. Massetti’s base salary and target opportunity under the STIP to $563,750 and 90% respectively, effective in January 2011.
As part of the offer of employment, Mr. Massetti was awarded 1,000,000 stock options pursuant to the 2007 Plan. The grant was comprised of time-based stock options and MoM stock options, weighted 65% and 35% respectively, having an exercise price equal to the fair market value of a share of our common stock at the time of grant, which was $3.00. The vesting terms are similar to those granted to employees during fiscal year 2011.
Mr. Massetti also was granted 150,000 RSUs on November 19, 2009, which vest 50% on the first anniversary of the grant date and 25% on each of the second and third anniversaries of the grant date. Following Mr. Massetti’s termination of employment, we have the right to purchase from him shares issued on the vesting of these RSUs at a purchase price per share equal to the greater of the fair market value of a share of our common stock and $13. Further, (i) if Mr. Massetti’s employment is terminated other than for cause, (ii) if he voluntarily resigns for good reason or (iii) upon his death or disability, Mr. Massetti has the right to require us to purchase
152
Table of Contents
from him any or all of the shares of common stock subject to his vested RSUs at a purchase price per share equal to the greater of the fair market value of a share of our common stock and $13. If Mr. Massetti exercises this right, then we will have the right to defer the payment to a change in control event, as defined in the 2007 Plan.
Mr.Mitchell’s Offer of Employment
Mr. Mitchell entered into an Executive Employment Agreement effective May 3, 2010 pursuant to which he became the Company’s Senior Vice President, Channel Integration. Mr. Mitchell’s employment agreement had an initial term that expired on November 3, 2011 and could be extended for a subsequent six month period pursuant to a mutual agreement of Mr. Mitchell and the Company. Under the employment agreement, Mr. Mitchell’s base salary was established at $450,000. In addition, Mr. Mitchell was eligible to receive a discretionary bonus of $550,000 based on achievement against established performance targets. As noted above, Mr. Mitchell received a payment in December 2010 of $228,250 for results associated with the first half of his annual target, and a second payment in April 2011 of $275,000 for results associated with the second half of his annual target.
On March 22, 2011, Mr. Mitchell accepted a revised offer of employment in connection with his appointment as Senior Vice President, SME and Avaya Go to Market, effective April 1, 2011. Under the terms of his revised offer letter, which superseded Mr. Mitchell’s existing Executive Employment Agreement, Mr. Mitchell’s annual base salary was increased from $450,000 to $500,000. In addition, effective April 1, 2011, in lieu of the discretionary cash bonus described above, Mr. Mitchell became eligible to participate in the Company’s STIP program at 80% of his base salary, with Mr. Mitchell’s fiscal year 2011 STIP to be prorated to reflect his actual STIP eligibility period (April 1, 2011 through September 30, 2011). Mr. Mitchell was also awarded 900,000 stock options pursuant to the 2007 Plan. The grant was comprised of time-based stock options and MoM stock options, weighted 65% and 35% respectively, having an exercise price equal to the fair market value of a share of our common stock at the time of grant, which was $3.00. The vesting terms are similar to those granted to employees during fiscal year 2011. Finally, under the terms of Mr. Mitchell’s revised offer letter, he was awarded a grant of 50,000 RSUs on March 22, 2011, which vest equally on the first and second anniversaries of the grant date.
Mr. Ali’s Offer of Employment
Mr. Ali became an officer of the Company on July 13, 2009 and was appointed Senior Vice President, Corporate Business Development & Strategy. Under the terms of his offer of employment, Mr. Ali’s initial annual base salary was $430,000 and his annual target award under the Avaya STIP was 75% of his annual base salary. In addition he received a cash sign-on bonus payment of $225,000 in December 2009 and additional cash sign-on bonus payments of $275,000 payable in three equal installments in each of May 2010, November 2010 and May 2011. The amount paid in December 2009 required repayment to the Company if Mr. Ali terminated his employment for any reason or if the Company terminated his employment for cause, in either case within 12 months following his date of hire. The repayment amount would have been prorated based on the number of months employed in the 12 month period following payment.
As part of the offer of employment, Mr. Ali was awarded 750,000 stock options pursuant to the 2007 Plan. The grant was comprised of time-based stock options and MoM stock options, weighted 65% and 35%, respectively, having an exercise price equal to the fair market value of a share of our common stock at the time of grant, which was $3.00. The vesting terms are similar to those granted generally to employees who receive stock options. Also as part of the employment offer, Mr. Ali received a secondary stock option award of 250,000 stock options, weighted 65% time based and 35% MoM based. The secondary award included time based options vesting 20% on the close of the NES acquisition and 20% annually thereafter. For additional information please see “Elements of Executive Officer Compensation—Long Term Incentives—Fiscal Year 2011 Awards.”
As noted above, the Compensation Committee approved a change to Mr. Ali’s base salary to $440,750 effective in January 2011. Additionally, in connection with his appointment as Senior Vice President and
153
Table of Contents
President, Avaya Client Services, effective April 15, 2011, Mr. Ali’s annual base salary was changed to $500,000 and his annual target award under the STIP was adjusted from 75% to 80%.
Change in Control Agreements
Certain executive officers of the Company are parties to agreements providing for severance benefits in the event of the termination of their employment following a change in control of the Company. The agreements were entered into prior to the Merger and at a time when the Company was publicly traded to provide assurances that, in the event a change in control transaction was contemplated, these executive officers would negotiate and conduct the underlying transaction smoothly and efficiently, without concern that their positions and their financial livelihoods may be in jeopardy. None of the Named Executive Officers are parties to these agreements.
Involuntary Separation Plan
The Avaya Inc. Involuntary Separation Plan for Senior Officers, amended and restated as of February 1, 2009, is designed to provide a specific payment and certain benefit enhancements to eligible executive officers of the Company and its affiliated companies and subsidiaries, including the Named Executive Officers, in the event that their employment is involuntarily terminated under certain conditions. Eligible executive officers include the CEO and all executive officers elected by the Company’s board of directors at a level above Vice President who are designated “At Risk” under the Avaya Force Management Program Guidelines. For a description of the potential amounts that could be received by each of the Named Executive Officers assuming an involuntary separation had occurred as of September 30, 2011, please see the section below titled “Potential Payments on Occurrence of Change in Control and Other Events.”
Fiscal Year 2012 Actions and Changes to Compensation Approach Post-Initial Public Offering
Following the conclusion of fiscal year 2011, the Compensation Committee approved changes to certain executive officer compensation arrangements, including those for certain Named Executive Officers, effective January 1, 2012. On December 5, 2011, the Compensation Committee increased the salaries of Messrs. Chirico, Massetti and Ali from $625,000, $564,000 and $500,000 to $640,000, $585,000 and $525,000, respectively. The increases were made in recognition of their respective contribution during fiscal year 2011 and following a review of benchmark data of peer companies and survey data.
2012 Sales Incentive Program
On December 5, 2011, the Compensation Committee approved a plan to provide incentives to certain executive officers of the Company, including Thomas G. Mitchell and J. Joel Hackney, Jr., to continue to grow revenue in fiscal year 2012 (the “2012 Sales Incentive Program”). Under the terms of the 2012 Sales Incentive Program, effective December 6, 2011 each program participant has been granted the conditional right to receive a number of RSUs under our 2007 Plan upon the achievement of certain revenue objectives. All RSUs awarded under the 2012 Sales Incentive Program are based upon the fair market value of our common stock on December 6, 2011, the date of grant, which was $4.40 per share.
The number of RSUs that a participating employee in the 2012 Sales Incentive Program will have the right to receive (subject to vesting requirements and the other terms and conditions of the applicable award agreement) will be determined based upon achievement of both of the following: (i) revenue targets for specific sales territories/divisions/product houses (each, a “Performance Gateway”) and (ii) an overall revenue target for the Company. For each of Messrs. Mitchell and Hackney, achievement of three of five specified Performance Gateways will result in an award of 50% of his opportunity and achievement of all five specified Performance Gateways will result in an award of 100% of his opportunity. Achievement of targets under the 2012 Sales Incentive Program will be measured twice in fiscal year 2012, with a participating employee being able to earn half of his total opportunity based on results for the first half of fiscal year 2012 and the second half of his total
154
Table of Contents
opportunity based on results for the second half of fiscal year 2012. All RSU awards granted under the 2012 Sales Incentive Program will vest on December 6, 2013 for each program participant who achieves the performance objectives. Mr. Mitchell has been awarded the opportunity to receive up to 45,455 RSUs under the 2012 Sales Incentive Program and Mr. Hackney has been awarded the opportunity to receive up to 56,818 RSUs under the 2012 Sales Incentive Program. The form of RSU award agreement applicable to the 2012 Sales Incentive Program is attached as Exhibit 10.31 to the registration statement of which this prospectus forms a part.
We anticipate a number of changes to our compensation approach following this offering.
In addition to our 2007 Plan, we intend to adopt an omnibus equity incentive plan that will permit the granting of various types of awards to our key employees, directors, consultants and advisors. Types of awards that may be granted are: stock options, stock appreciation rights, restricted stock, unrestricted stock, stock units, restricted stock units and cash awards. It is our policy that stock options granted after the completion of this offering will have a per share exercise price that is not less than the fair market value of a share of our common stock on the date of grant.
Section 162(m) disallows a tax deduction for any publicly held corporation for individual compensation exceeding $1 million in any taxable year for a company’s named executive officers, other than its chief financial officer, unless compensation is performance-based. As we are not currently publicly traded, our Compensation Committee has not previously taken the deductibility limit imposed by Section 162(m) into consideration in setting compensation. Following this offering, at such times as we are subject to the deduction limitations of Section 162(m), we expect that our Compensation Committee will seek to qualify the variable compensation paid to our Named Executive Officers for an exemption from the deductibility limits of Section 162(m). However, our Compensation Committee may, in its judgment, authorize compensation payments that do not comply with the exemptions in Section 162(m) when it believes that such payments are appropriate to attract and retain executive talent.
Our Compensation Committee regularly considers the accounting implications of significant compensation decisions, especially in connection with decisions that relate to our equity incentive award plans and programs. As accounting standards change, we may revise certain programs to appropriately align accounting expenses of our equity awards with our overall executive compensation philosophy and objectives.
Conclusion
The Compensation Committee believes that the Company’s compensation program for executive officers supports the Company’s philosophy that compensation should be designed to attract, motivate and retain executive officers and employees in such a way as to create value for the benefit of the Company’s shareholders. The Company feels confident that the Company’s salary, short-term incentive, long-term incentive and other compensation programs help enable the Company to create a competitive total compensation package. In addition, the Company believes that this total compensation package helps reinforce the Company’s commitment to reward employees for performance against stated goals and objectives, both at the corporate and individual levels.
155
Table of Contents
Summary Compensation Table
The following table sets forth the compensation earned by the Company’s Named Executive Officers for services rendered in all capacities to the Company and its subsidiaries for the fiscal years indicated. The Company’s Named Executive Officers for fiscal year 2011 include our Chief Executive Officer, Chief Financial Officer and our three most highly compensated executive officers in fiscal year 2011 other than the Chief Executive Officer and Chief Financial Officer.
Name | Year | Salary ($)(6) | Bonus ($)(7) | Stock Awards ($)(8) | Option Awards ($)(8) | Non-Equity Incent. Plan Comp ($)(9) | Change in Pension Value ($)(10) | All Other Comp. ($)(11) | Total ($) | |||||||||||||||||||||||||||
Kevin J. Kennedy(1) | 2011 | $ | 1,250,000 | $ | — | $ | — | $ | — | $ | 2,584,227 | $ | — | $ | 25,112 | $ | 3,859,339 | |||||||||||||||||||
President and Chief Executive Officer | 2010 | $ | 1,153,846 | $ | — | $ | — | $ | 903,500 | $ | 44,363 | $ | — | $ | 507,637 | $ | 2,609,345 | |||||||||||||||||||
| 2009 | $ | 965,754 | $ | 850,000 | $ | 4,000,000 | $ | 8,164,063 | $ | 965,754 | $ | — | $ | 594,843 | $ | 15,540,414 | ||||||||||||||||||||
Anthony J. Massetti(2) | 2011 | $ | 560,313 | $ | 850,000 | $ | — | $ | — | $ | 914,357 | $ | — | $ | 66,924 | $ | 2,391,593 | |||||||||||||||||||
| SVP and Chief Financial Officer | 2010 | $ | 489,198 | $ | 375,000 | $ | 1,950,000 | $ | 1,129,375 | $ | 12,635 | $ | — | $ | 67,858 | $ | 4,024,066 | |||||||||||||||||||
James M. Chirico, Jr.(3) | 2011 | $ | 625,000 | $ | 2,100,000 | $ | — | $ | — | $ | 1,326,508 | $ | — | $ | 106,750 | $ | 4,158,258 | |||||||||||||||||||
| EVP, Business Operations | 2010 | $ | 559,615 | $ | 300,000 | $ | 225,000 | $ | 517,400 | $ | 14,546 | $ | — | $ | 125,642 | $ | 1,742,203 | |||||||||||||||||||
| 2009 | $ | 558,333 | $ | 1,500,000 | $ | — | $ | 408,203 | $ | — | $ | — | $ | 285,558 | $ | 2,752,094 | ||||||||||||||||||||
Thomas G. Mitchell(4) | 2011 | $ | 475,000 | $ | 503,250 | $ | 150,000 | $ | 754,650 | $ | 298,533 | $ | — | $ | 2,960 | $ | 2,184,393 | |||||||||||||||||||
| SVP, SME and Avaya Go to Market | ||||||||||||||||||||||||||||||||||||
Mohamad S. Ali(5) | 2011 | $ | 462,750 | $ | 258,333 | $ | — | $ | 248,300 | $ | 873,700 | $ | — | $ | 5,601 | $ | 1,848,685 | |||||||||||||||||||
| SVP & President, Avaya Client Services | ||||||||||||||||||||||||||||||||||||
| (1) | Mr. Kennedy was elected President and Chief Executive Officer effective December 22, 2008. His salary for fiscal year 2009 is prorated for the number of days he was employed during the year. |
| (2) | Mr. Massetti was elected Senior Vice President and Chief Financial Officer effective October 26, 2009. His salary for fiscal year 2010 is prorated for the number of days he was employed during the year. |
| (3) | Mr. Chirico was named Executive Vice President, Business Operations on June 14, 2010. He formerly held the title of Senior Vice President and Chief Restructure Officer and President, Operations. His salary for fiscal year 2010 reflects an adjustment to his base salary effective July 1, 2010, in connection with his change in title. |
| (4) | Mr. Mitchell joined the Company as Senior Vice President, Channel Integration on May 3, 2010 and was subsequently named Senior Vice President, SME and Avaya Go to Market effective April 1, 2011, when his base salary was adjusted from $450,000 to $500,000. His salary for fiscal year 2011 reflects an adjustment to his base salary in connection with his change in title. |
| (5) | Mr. Ali joined the Company as Senior Vice President, Corporate Development & Strategy on July 13, 2009. He was subsequently appointed Senior Vice President and President, Avaya Client Services, effective April 15, 2011. The salary amount indicated is prorated to reflect his salary adjustments during fiscal year 2011 as described under “—Elements of Executive Officer Compensation—Base Salaries.” |
| (6) | Reflects the impact of participation in the Company’s mandatory two-week furlough program for all employees (except to the extent prohibited by local law, in which case participation was voluntary), for 2009 and 2010, where applicable. Had these individuals not participated in the program, base salaries in fiscal year 2010 for Messrs. Kennedy, Massetti and Chirico would have been as set forth above under “—Elements of Executive Officer Compensation—Base Salaries.” |
156
Table of Contents
| (7) | The following table represents a detailed view of bonus payments received by each of the Named Executive Officers pursuant to offers of employment and retention: |
Name | Year | NES Acquisition Retention (A) | Sign-On Payments (B) | Special Retention Arrangement | Bonus Pursuant to Employment Offer | Q4 2009 Recognition (C) | Total Bonus | |||||||||||||||||||||
Kevin J. Kennedy | 2011 | — | — | — | — | — | $ | 0 | ||||||||||||||||||||
| 2010 | — | — | — | — | — | $ | 0 | |||||||||||||||||||||
| 2009 | — | $ | 850,000 | — | — | — | $ | 850,000 | ||||||||||||||||||||
Anthony J. Massetti | 2011 | $ | 100,000 | $ | 750,000 | — | — | — | $ | 850,000 | ||||||||||||||||||
| 2010 | — | $ | 375,000 | �� | — | — | — | $ | 375,000 | |||||||||||||||||||
James M. Chirico, Jr. | 2011 | $ | 100,000 | — | $ | 2,000,000 | — | — | $ | 2,100,000 | ||||||||||||||||||
| 2010 | — | — | $ | 300,000 | — | — | $ | 300,000 | ||||||||||||||||||||
| 2009 | — | — | $ | 1,300,000 | — | $ | 200,000 | $ | 1,500,000 | |||||||||||||||||||
Thomas G. Mitchell | 2011 | — | — | — | $ | 503,250 | — | $ | 503,250 | |||||||||||||||||||
Mohamad S. Ali | 2011 | $ | 75,000 | $ | 183,333 | — | — | — | $ | 258,333 | ||||||||||||||||||
| (A) | Reflects the first of two installments received in connection with the cash bonus program adopted to retain employees assisting with the integration of NES. Please see “—Executive Officer Compensation—Short-Term Incentives—Additional Cash Payments.” |
| (B) | Includes a transition bonus for Mr. Kennedy. Please see “—Employment, Change in Control and Separation Arrangements—Mr. Kennedy’s Employment Agreement”, “—Employment, Change in Control and Separation Arrangements—Mr. Massetti’s Offer of Employment” and “—Employment, Change in Control and Separation Arrangements—Mr. Ali’s Offer of Employment” for more information. |
| (C) | Payment made under a recognition program related to the Company’s performance specific to the fourth quarter of fiscal year 2009. |
| (8) | Amounts indicated for the “Stock Awards” and “Option Awards” columns represent the aggregate grant date fair value of the awards during the respective years as calculated in accordance with FASB ASC Topic 718, “Compensation-Stock Compensation,” or ASC 718, without regard to forfeiture assumption. For more information regarding the valuation of stock-based awards (including assumptions made in such valuation), refer to Note 14, “Share-based Compensation,” to our audited consolidated financial statements included elsewhere in this prospectus. |
Not included in fiscal year 2011 are any amounts attributable to MoM stock options as it is not possible to determine if the performance condition (e.g., sale or initial public offering of the Company) will be satisfied until such event actually occurs. Assuming the highest level of achievement, the aggregate grant date fair value for such awards made to Messrs. Mitchell and Ali during fiscal year 2011 would have been $434,700 and $168,000, respectively.
Included in fiscal year 2010 is the incremental fair value of the replacement options received under the stock option exchange program as calculated in accordance with ASC 718. Not included in fiscal year 2010 are any amounts attributable to MoM stock options as it is not possible to determine if the performance condition (e.g., sale or initial public offering of the Company) will be satisfied until such event actually occurs. Assuming the highest level of achievement, the aggregate grant date fair value for such awards for Messrs. Kennedy, Massetti and Chirico would be $3,240,720, $675,150 and $891,198, respectively. For MoM stock option awards issued in the stock option exchange program, the highest level of achievement represents the new awards’ full fair value at the date of issuance as the old awards were not expected to vest under their vesting conditions at the date the stock option exchange offer was completed.
Not included in fiscal year 2009 are any amounts attributable to the MoM stock options as it is not possible to determine if the performance condition (e.g., sale or initial public offering of the Company) will be satisfied until such event actually occurs. Included in the fiscal year 2009 amounts is the fair value at the date of grant of EBITDA options for which achievement of the annual or cumulative targets was considered probable as of that date. Not included in fiscal year 2009 are any amounts for those EBITDA options as to which the achievement of the annual and cumulative targets was considered less than probable as of that date. Assuming the highest level of achievement, the aggregate grant date fair value for the MoM awards for Messrs. Kennedy and Chirico
157
Table of Contents
would be $1,828,750 and $91,438, respectively, and the aggregate grant date fair value for the EBITDA awards would be $1,828,750 and $91,438, respectively. Please see the tables named “Outstanding Equity Awards at Fiscal Year End” and “Grants of Plan-Based Awards” for further information.
Please note that the amounts shown for fiscal year 2009 differ from those amounts previously disclosed for fiscal year 2009 in Avaya Inc.’s registration statement on Form S-4 (registration no. 333-163998). This is because SEC disclosure rules at that time required that we present stock award information based on the amount recognized during the fiscal year for financial statement reporting purposes in accordance with SFAS 123(R) (predecessor to ASC 718). However, recent changes in the SEC’s disclosure rules require that we now present the stock award amounts in this column using the grant date fair value. As a result, each Named Executive Officer’s total compensation amount for fiscal year 2009 also differs from amounts previously reported, if any.
| (9) | Represents annual incentive award payments as discussed under “—Elements of Executive Compensation—Short-Term Incentives,” and, for fiscal year 2011, the number includes allocations earned under “—Elements of Executive Compensation—Long Term Incentives—2011-2013 Performance Recognition Plan.” The amount for Mr. Kennedy fiscal year 2009 represents a guaranteed incentive award pursuant to his employment agreement. Please see “—Employment, Change in Control and Separation Arrangements—Mr. Kennedy’s Employment Agreement” for more information. |
| (10) | The Named Executive Officers did not receive any preferential earnings on compensation deferred on a basis that is not tax-qualified. |
| (11) | During fiscal year 2011, the Named Executive Officers received certain perquisites provided by or paid for by the Company pursuant to Company policies. Amounts may include benefit amounts associated with Company contributions to the ASPSE, the ASRP, life insurance premiums paid for by the Company and temporary housing expenses and relocation benefits. The Company also provided to certain executives a payment for purposes of tax gross-up on the temporary housing and relocation benefits. |
Amounts paid by the Company during fiscal year 2011 in the “All Other Compensation” column are as follows:
Name | Year | Company Contributions to ASPSE | Company Contributions to ASRP | Insurance Premiums | Temp Housing & Relocation Benefits (A) | Temp Housing & Relocation Gross-Up (A) | Financial Counseling Services & Gross-Up (B) | Automobile Allowance (B) | Total “All Other Compensation” | |||||||||||||||||||||||||||
Kevin J. Kennedy | 2011 | $ | 6,125 | — | $ | 7,979 | $ | 10,144 | $ | 864 | — | — | $ | 25,112 | ||||||||||||||||||||||
| 2010 | — | — | $ | 6,984 | $ | 498,267 | $ | 2,386 | — | — | $ | 507,637 | ||||||||||||||||||||||||
| �� | 2009 | $ | 9,058 | — | $ | 5,293 | $ | 359,507 | $ | 208,385 | — | $ | 12,600 | $ | 594,843 | |||||||||||||||||||||
Anthony J. Massetti | 2011 | $ | 6,125 | — | $ | 2,294 | $ | 33,019 | $ | 25,486 | — | — | $ | 66,924 | ||||||||||||||||||||||
| 2010 | $ | 1,613 | — | $ | 2,507 | $ | 49,861 | $ | 13,877 | — | — | $ | 67,858 | |||||||||||||||||||||||
James M. Chirico, Jr. | 2011 | $ | 6,125 | — | $ | 2,960 | $ | 97,245 | $ | 420 | — | — | $ | 106,750 | ||||||||||||||||||||||
| 2010 | $ | 1,425 | — | $ | 2,701 | $ | 104,511 | $ | 17,005 | — | — | $ | 125,642 | |||||||||||||||||||||||
| 2009 | $ | 3,583 | $ | 25,465 | $ | 2,396 | $ | 131,913 | $ | 65,401 | $ | 40,000 | $ | 16,800 | $ | 285,558 | ||||||||||||||||||||
Thomas G. Mitchell | 2011 | $ | — | — | $ | 2,960 | — | — | — | — | $ | 2,960 | ||||||||||||||||||||||||
Mohamad S. Ali | 2011 | $ | 4,506 | — | $ | 1,095 | — | — | — | — | $ | 5,601 | ||||||||||||||||||||||||
| (A) | Represents amounts payable under the Company’s relocation policies in connection with offers of employment. The amount for Mr. Chirico for fiscal year 2011 is comprised of $40,227 of expenses paid by the Company for him to commute to his primary work office and $57,018 of temporary living expenses. |
| (B) | The Company did not provide benefits of financial counseling or automobile allowances for executive officers in fiscal year 2011. |
158
Table of Contents
Grants of Plan-Based Awards in Fiscal Year 2011
The following table sets forth information concerning individual grants of stock options made under the 2007 Plan during fiscal year 2011 to each of the Named Executive Officers.
Name | Grant Date | Board Approval Date | Estimated Future Payouts Under Non-Equity Incentive Plan Awards | Estimated Future Payouts Under Equity Incentive Plan Awards | Exercise or Base Price of Option Awards(3) | Grant Date Fair Value of Stock and Option Awards(4) | ||||||||||||||||||||||||||||||||||
| Threshold | Target | Maximum | Threshold | Target | Maximum | |||||||||||||||||||||||||||||||||||
Kevin J. Kennedy | — | — | — | $ | 1,484,375 | $ | 2,500,000 | (1) | — | — | — | — | ||||||||||||||||||||||||||||
| 12/22/10 | $ | 937,500 | $ | 1,250,000 | $ | 2,000,000 | (2) | — | — | — | — | — | ||||||||||||||||||||||||||||
Anthony J. Massetti | — | — | — | $ | 500,328 | — | (1) | — | — | — | — | — | ||||||||||||||||||||||||||||
| 12/22/10 | $ | 422,813 | $ | 563,750 | $ | 902,000 | (2) | — | — | — | — | — | ||||||||||||||||||||||||||||
James M. Chirico, Jr. | — | — | — | $ | 531,250 | — | (1) | — | — | — | — | — | ||||||||||||||||||||||||||||
| 12/22/10 | $ | 468,750 | $ | 625,000 | $ | 1,000,000 | (2) | — | — | — | — | — | ||||||||||||||||||||||||||||
Thomas G. Mitchell | — | — | — | $ | 200,000 | — | (1) | — | — | — | — | — | ||||||||||||||||||||||||||||
| 12/22/10 | $ | 125,000 | $ | 166,667 | $ | 266,667 | (2) | — | — | — | — | — | ||||||||||||||||||||||||||||
| 03/31/11 | 02/17/11 | (5) | — | — | — | — | 585,000 | — | $ | 3.00 | $ | 754,650 | ||||||||||||||||||||||||||||
| 03/31/11 | 02/17/11 | (6) | — | — | — | 157,500 | 315,000 | — | $ | 3.00 | — | |||||||||||||||||||||||||||||
| 03/31/11 | 02/17/11 | (7) | — | — | — | — | 50,000 | — | — | $ | 150,000 | |||||||||||||||||||||||||||||
Mohamad S. Ali | — | — | — | $ | 375,870 | — | (1) | — | — | — | — | — | ||||||||||||||||||||||||||||
| 12/22/10 | $ | 375,000 | $ | 500,000 | $ | 800,000 | (2) | — | — | — | — | — | ||||||||||||||||||||||||||||
| 06/23/11 | 06/23/11 | (5) | — | — | — | — | 130,000 | — | $ | 4.40 | $ | 248,300 | ||||||||||||||||||||||||||||
| 06/23/11 | 06/23/11 | (6) | 35,000 | 70,000 | — | $ | 4.40 | — | ||||||||||||||||||||||||||||||||
| (1) | Represents fiscal year 2011 target awards under the STIP. The maximum target amount for Mr. Kennedy’s STIP award reflects the fact that his employment agreement places a limit of 200% of his annual base salary on his total STIP award, if any. The STIP targets are prorated based on the detail provided under “—Elements of Executive Officer Compensation—Base Salaries” and “—Elements of Executive Officer Compensation—Short Term Incentives.” |
| (2) | Represents fiscal year 2011 threshold, target and maximum potential awards under the EC LTIP, which is discussed above within “—Elements of Executive Officer Compensation—Long Term Incentives.” |
| (3) | Under the terms of the 2007 Plan, the grant price for an award cannot be less than the fair market value of a share of our common stock on the date of grant. The exercise prices indicated represent the fair market value of our common stock on the applicable grant dates, as determined by the Compensation Committee, the administrator under the 2007 Plan. |
| (4) | Amounts shown represent the grant date fair value of each award as calculated in accordance with ASC 718, without regard to forfeiture assumptions. For more information regarding the valuation of stock-based awards (including assumptions made in such valuation), refer to Note 14, “Share-based Compensation,” to our audited consolidated financial statements included elsewhere in this prospectus. Not included are any amounts attributable to MoM stock options as it is not possible to determine if the performance condition (e.g., sale or initial public offering of the Company) will be satisfied until such event actually occurs. |
| (5) | Represents time-based stock option awards vesting 25% annually until fully vested four years from the date of grant, or in the case of Mr. Ali 25% annually beginning on May 20, 2012. |
| (6) | Represents MoM stock options vesting 50% or 100% upon the achievement of certain returns on the Sponsors’ initial investment in the Company as described under “—Elements of Executive Officer Compensation—Long-Term Incentives—Stock Option Awards.” |
| (7) | Amounts represent awards of RSUs made to Mr. Mitchell in recognition of his increased role and responsibilities within the Company, as described above. The award becomes fully vested and non-forfeitable in equal installments on each of the first and second anniversaries of the date of grant. |
159
Table of Contents
Outstanding Equity Awards at Fiscal Year End
The following table sets forth the outstanding equity awards at the end of fiscal year 2011 for each of the Named Executive Officers:
| OPTION AWARDS | STOCK AWARDS | |||||||||||||||||||||||||||
Name | Number of Securities Underlying Unexercised Options # Exercisable(1) | Number of Securities Underlying Unexercised Options # Unexercisable | Equity Incentive Plan Awards : Number of Securities Underlying Unexercised Unearned Options(2) | Option Exercise Price | Option Expiration Date | Equity Incentive Plan Awards: Number of Unearned Shares, Units or Other Rights That have Not Vested(3) | Equity Incentive Plan Awards: Market or Payout Value of Unearned Shares, Units or Other Rights That Have Not Vested(4) | |||||||||||||||||||||
Kevin J. Kennedy | 812,500 | — | 4,187,500 | $ | 3.00 | 11/17/19 | ||||||||||||||||||||||
| 260,000 | — | 740,000 | $ | 3.00 | 11/19/19 | |||||||||||||||||||||||
| 200,000 | $ | 2,000,000 | ||||||||||||||||||||||||||
Anthony J. Massetti | 162,500 | — | 837,500 | $ | 3.00 | 11/19/19 | ||||||||||||||||||||||
| 65,000 | — | 185,000 | $ | 3.00 | 11/19/19 | |||||||||||||||||||||||
| 75,000 | $ | 975,000 | ||||||||||||||||||||||||||
James M. Chirico, Jr. | 162,500 | — | 837,500 | $ | 3.00 | 11/17/19 | ||||||||||||||||||||||
| 40,625 | — | 209,375 | $ | 3.00 | 11/17/19 | |||||||||||||||||||||||
| 104,000 | — | 296,000 | $ | 3.00 | 11/19/19 | |||||||||||||||||||||||
| 37,500 | $ | 165,000 | ||||||||||||||||||||||||||
Thomas G. Mitchell | — | — | 900,000 | $ | 3.00 | 03/31/21 | ||||||||||||||||||||||
| 50,000 | $ | 220,000 | ||||||||||||||||||||||||||
Mohamad S. Ali | 121,875 | — | 628,125 | $ | 3.00 | 11/17/19 | ||||||||||||||||||||||
| 65,000 | — | 185,000 | $ | 3.00 | 11/19/19 | |||||||||||||||||||||||
| — | — | 200,000 | $ | 4.40 | 06/23/21 | |||||||||||||||||||||||
| (1) | Represents the exercisable portion of stock options granted and outstanding. |
160
Table of Contents
| (2) | The vesting dates for the stock option awards indicated are as follows: |
Name | Original Stock Option Grant | Grant Date | Type Of Stock Option Award | Options Per Type | Vesting Description | |||||||||||
Kevin J. Kennedy | 5,000,000 | 11/17/09 | Time-Based | 3,250,000 | 25% annually (4 year full vest) | |||||||||||
| MoM | 1,750,000 | 50% or 100% on the achievement of certain returns on the Sponsors’ initial investment in us | ||||||||||||||
| 1,000,000 | 11/19/09 | Time-Based | 650,000 | 20% on 12/19/09; 20% annually thereafter (fully vested 12/19/13) | ||||||||||||
| MoM | 350,000 | 50% or 100% on the achievement of certain returns on the Sponsors’ initial investment in us | ||||||||||||||
Anthony J. Massetti | 1,000,000 | 11/19/09 | Time-Based | 650,000 | 25% annually (4 year full vest) | |||||||||||
| MoM | 350,000 | 50% or 100% on the achievement of certain returns on the Sponsors’ initial investment in us | ||||||||||||||
| 250,000 | 11/19/09 | Time-Based | 162,500 | 20% on 12/19/09; 20% annually thereafter (fully vested 12/19/13) | ||||||||||||
| MoM | 87,500 | 50% or 100% on the achievement of certain returns on the Sponsors’ initial investment in us | ||||||||||||||
James M. Chirico, Jr. | 1,000,000 | 11/17/09 | Time-Based | 650,000 | 25% annually (4 year full vest) | |||||||||||
| MoM | 350,000 | 50% or 100% on the achievement of certain returns on the Sponsors’ initial investment in us | ||||||||||||||
| 250,000 | 11/17/09 | Time-Based | 162,500 | 25% annually (4 year full vest) | ||||||||||||
| MoM | 87,500 | 50% or 100% on the achievement of certain returns on the Sponsors’ initial investment in us | ||||||||||||||
| 400,000 | 11/19/09 | Time-Based | 260,000 | 20% on 12/19/09; 20% annually thereafter (fully vested 12/19/13) | ||||||||||||
| MoM | 140,000 | 50% or 100% on the achievement of certain returns on the Sponsors’ initial investment in us | ||||||||||||||
Thomas G. Mitchell | 900,000 | 03/31/11 | Time-Based | 585,000 | 25% annually (4 year full vest) | |||||||||||
| MoM | 315,000 | 50% or 100% on the achievement of certain returns on the Sponsors’ initial investment in us | ||||||||||||||
Mohamad S. Ali | 750,000 | 11/17/09 | Time-Based | 487,500 | 25% annually (4 year full vest) | |||||||||||
| MoM | 262,500 | 50% or 100% on the achievement of certain returns on the Sponsors’ initial investment in us | ||||||||||||||
| 250,000 | 11/19/09 | Time-Based | 162,500 | 20% on 12/19/09; 20% annually thereafter (fully vested 12/19/13) | ||||||||||||
| MoM | 87,500 | 50% or 100% on the achievement of certain returns on the Sponsors’ initial investment in us | ||||||||||||||
| 200,000 | 06/23/11 | Time-Based | 130,000 | 25% annually beginning on May 20, 2012 | ||||||||||||
| MoM | 70,000 | 50% or 100% on the achievement of certain returns on the Sponsors’ initial investment in us | ||||||||||||||
| (3) | Represents awards of RSUs made pursuant to Mr. Kennedy’s employment agreement, Mr. Massetti’s offer of employment and, in the case of Messrs. Chirico and Mitchell, recognition of their increased roles and responsibilities at the Company as discussed above. Please see “—Elements of Executive Officer Compensation—Base Salaries” for further details. These awards vest as follows: |
Name | RSU Award | Grant Date | RSUs Vested | RSUs Unvested | Vesting Description | |||||||||||||
Kevin J. Kennedy | 400,000 | 12/22/08 | 200,000 | 200,000 | 25% Annually (4 years to full vest) | |||||||||||||
Anthony J. Massetti | 150,000 | 11/19/09 | 75,000 | 75,000 | 50% on 11/19/10; 25% on each of 11/19/11 and 11/19/12 | |||||||||||||
James M. Chirico, Jr. | 75,000 | 07/01/10 | 37,500 | 37,500 | 50% Annually (2 years to full vest) | |||||||||||||
Thomas G. Mitchell | 50,000 | 03/31/11 | — | 50,000 | 50% Annually (2 years to full vest) | |||||||||||||
| (4) | Determined using the fair market value of our common stock on the last day of the fiscal year, which was $4.40 per share, except in the case of Mr. Kennedy and Mr. Massetti, who have the right under certain circumstances to require us to repurchase issued shares from the vesting of their RSU awards at a predetermined price—$10 per share in the case of Mr. Kennedy and $13 per share in the case of Mr. Massetti (please see “—Employment, Change in Control and Separation Agreements” for further details). |
161
Table of Contents
Options Exercised and Stock Vested
During fiscal year 2011, there were no exercises of stock options by any of the Named Executive Officers. The following table sets forth the vesting of RSU awards in fiscal year 2011:
| OPTION AWARDS | STOCK AWARDS | |||||||||||||||
Name | Number of Shares Acquired on Exercise | Value Realized on Exercise | Number of Shares Acquired on Vesting | Value Realized on Vesting(4) | ||||||||||||
Kevin J. Kennedy | — | $ | — | 100,000 | (1) | $ | — | |||||||||
Anthony J. Massetti | — | — | 75,000 | (2) | — | |||||||||||
James M. Chirico, Jr. | — | — | 37,500 | (3) | — | |||||||||||
Thomas G. Mitchell | — | — | — | — | ||||||||||||
Mohamad S. Ali | — | — | — | — | ||||||||||||
| (1) | Represents shares subject to an RSU award granted to Mr. Kennedy pursuant to his employment agreement, the receipt of which shares has been deferred. The shares will be delivered on, or within 30 days before or after, the earliest to occur of the following: (i) a “change in control event,” (ii) December 22, 2012, (iii) Mr. Kennedy’s termination by the Company without “cause” or (iv) Mr. Kennedy’s voluntary termination of employment for “good reason” (with each term having the meaning assigned to it in his RSU award agreement and the 2007 Plan). The amount that vested represents the second of four equal vesting installments of this award of RSUs (see “Outstanding Equity Awards at Fiscal Year End” above for more information). |
| (2) | Represents shares subject to an RSU award granted to Mr. Massetti pursuant to his offer of employment, the receipt of which shares has been deferred. The shares will be delivered on, or within 30 days before or after, the earliest to occur of the following: (i) a “change in control event,” (ii) November 19, 2014, (iii) Mr. Massetti’s termination by the Company without “cause” or (iv) Mr. Massetti’s voluntary termination of employment for “good reason” (with each term having the meaning assigned to it in his RSU award agreement and the 2007 Plan). The amount that vested represents the first of three vesting installments of this award of RSUs (see “Outstanding Equity Awards at Fiscal Year End” above for more information). |
| (3) | Represents shares subject to an RSU award granted to Mr. Chirico, the receipt of which shares has been deferred. The shares will be delivered on, or within 30 days before or after, the earliest to occur of the following: (i) a “change in control event,” (ii) July 1, 2015, (iii) Mr. Chirico’s death or disability, (iv) Mr. Chirico’s termination by the Company without “cause” or (v) Mr. Chirico’s voluntary termination of employment for “good reason” (with each term having the meaning assigned to it in his RSU award agreement and the 2007 Plan). This amount represents 50% of the shares subject to this award of RSUs. |
| (4) | As noted above, the receipt of shares subject to each of these RSU awards has been deferred. Had the shares been delivered to the recipients on vesting, the value realized by each individual per share would have been $3.00 for each of Messrs. Kennedy and Massetti, and $4.40 for Mr. Chirico, which was the fair market value of one share of our common stock on each of their respective vesting dates. The value realized by each of Messrs. Kennedy, Massetti and Chirico would have been $300,000, $225,000 and $165,000, respectively. Mr. Kennedy and Mr. Massetti also maintain the right under certain circumstances to require us to repurchase issued shares from the vesting of their RSU awards at a predetermined price of $10 per share for Mr. Kennedy and $13 per share for Mr. Massetti (please see “—Employment, Change in Control and Separation Agreements—Mr. Kennedy’s Employment Agreement,” and “—Mr. Massetti’s Employment Agreement” for further details). |
162
Table of Contents
Nonqualified Deferred Compensation
The table below sets forth information concerning all nonqualified deferred compensation earned by each of the Named Executive Officers during fiscal year 2011.
All information represents data from the ASRP, a nonqualified defined contribution plan designed to restore lost tax-deferred savings opportunities for executives unavailable under the ASPSE, the Company’s qualified savings plan, due to Code limitations. Executives may contribute from 1-25% of eligible compensation (including base pay, short-term disability payments, short-term incentive compensation and marketing/sales compensation paid after the executive reaches the maximum contribution and/or compensation limit established by the Code). Effective March 1, 2009 and through the end of fiscal year 2011, the Company suspended matching contributions to this plan. Earnings are based on the individual fund allocations selected by each participant from among the variety of different investment fund choices available; investment elections can be changed daily, subject to certain funds’ trading restrictions.
Name | Executive Contributions in the Last Fiscal Year | Registrant Contributions in the Last Fiscal Year | Aggregate Earnings in the Last Fiscal Year | Aggregate Withdrawals / Distributions in the Last Fiscal Year | Aggregate Balance at the Last Fiscal Year End(1) | |||||||||||||||
Kevin J. Kennedy | $ | 50,764 | — | $ | 7,491 | — | $ | 166,805 | ||||||||||||
Anthony J. Massetti | — | — | — | — | — | |||||||||||||||
James M. Chirico, Jr. | $ | 28,653 | — | ($ | 2,314 | ) | — | $ | 142,654 | (2) | ||||||||||
Thomas G. Mitchell | — | — | — | — | — | |||||||||||||||
Mohamad S. Ali | — | — | — | — | — | |||||||||||||||
| (1) | Amounts reported as Aggregate Balances reflect the account balances as of September 30, 2011. Effective January 1, 2009 all company contributions became fully vested, therefore all participants were vested as of September 30, 2011. |
| (2) | Of the amount indicated, $25,465 previously was reported as compensation to Mr. Chirico in fiscal year 2009 in the Summary Compensation Table included in Avaya Inc.’s registration statement on Form S-4 (registration no. 333-163998). |
Potential Payments on Occurrence of Change of Control and Other Events
General
The sections below indicate amounts that could have been received by each of the Named Executive Officers following, or in connection with, involuntary separation and resignation/retirement. The sections assume that the triggering event happened as of September 30, 2011. It should be noted that each of the sections below represents the various amounts that could have been received by the Named Executive Officers under alternative scenarios, and they are not cumulative in nature.
Involuntary Separation
Cash and Benefits
During fiscal year 2011, the Named Executive Officers were participants under the Avaya Inc. Involuntary Separation Plan for Senior Officers, or the Senior Officer Plan. The Plan is designed to provide a specific payment and certain benefit enhancements to eligible “Senior Officers” of Avaya and its affiliated companies and subsidiaries in the event that their employment is involuntarily terminated under certain conditions.
The Senior Officer Plan covers the CEO and each other officer of the Company who is elected by the Company’s board of directors at a level above vice president and who is designated “At Risk” under the Avaya Force Management Program Guidelines.
163
Table of Contents
The Senior Officer Plan provides that a Senior Officer is “At Risk” if there is a Company initiated termination other than for “cause,” defined as: (i) a material breach of duties and responsibilities as an executive officer of the Company (other than as a result of incapacity due to physical or mental illness) which is demonstrably willful and deliberate, which is committed in bad faith or without reasonable belief that such breach is in the best interests of the Company and which is not remedied in a reasonable period of time after receipt of written notice from the Company specifying such breach; (ii) conviction (including a plea of guilty or nolo contendere) of a felony involving moral turpitude; (iii) the commission of theft, fraud, breach of trust or any act of dishonesty involving the Company or its subsidiaries; or (iv) any significant violation of the Company’s Code of Conduct or any statutory or common law duty of loyalty to the Company or its subsidiaries.
In the event that a Senior Officer (other than Mr. Kennedy) is terminated by the Company other than for “cause,” that Senior Officer is entitled to receive under the Senior Officer Plan, upon executing a termination agreement and release, 100% of final annual base salary, along with certain other benefits to continue for a period of time post-termination of employment, including certain medical benefits as prescribed by applicable law, and outplacement services. With respect to Mr. Kennedy, the terms of his employment agreement provide that his involuntary termination would be governed by the same plan, but he would be entitled to 200% of his base salary plus 200% of his target STIP award for the year of termination, in addition to the other benefits offered generally to Senior Officers under the Senior Officer Plan.
The table below represents amounts that could have been received by each of the Named Executive Officers as of September 30, 2011, assuming an involuntary separation occurred on that date.
Name | Cash Payment Based on Salary(1) | Cash Payment Based on Target Bonus(2) | Outplacement Services(3) | Total | ||||||||||||
Kevin J. Kennedy | $ | 2,500,000 | $ | 3,125,000 | $ | 10,000 | $ | 5,635,000 | ||||||||
Anthony J. Massetti | 563,750 | 507,375 | 10,000 | 1,081,125 | ||||||||||||
James M. Chirico, Jr. | 625,000 | 531,250 | 10,000 | 1,166,250 | ||||||||||||
Thomas G. Mitchell | 500,000 | 400,000 | 10,000 | 910,000 | ||||||||||||
Mohamad S. Ali | 500,000 | 400,000 | 10,000 | 910,000 | ||||||||||||
| (1) | Amounts represent two times annual base salary for Mr. Kennedy, and one times annual base salary for each of Messrs. Massetti, Chirico, Mitchell and Ali, each as of September 30, 2011. |
| (2) | Amount for Mr. Kennedy is equal to two times his target STIP award as per his employment agreement. Amounts indicated for Named Executive Officers other than Mr. Kennedy assume that the last date of employment was September 30, 2011 and that the Company paid STIP at target. Amounts are reflective of total target STIP opportunity for the fiscal year, regardless of actual results for fiscal 2011 as set forth above under “—Elements of Executive Officer Compensation—Short Term Incentives.” |
| (3) | Represents an estimated cost to the Company for outplacement services based upon historical experience. |
Stock Options
Termination without Cause (Outside of the Change in Control Context)
If an employee is terminated without “cause,” generally there would be an acceleration of vesting of time-based stock options as follows: one quarter of the shares that otherwise would have vested at the end of the vesting year had the termination not occurred will vest for each partial or full quarter in which the optionee was employed during that vesting year. “Vesting year” means a twelve-month period beginning on the date of grant or an anniversary of the date of grant, as applicable, and ending on the first anniversary of such beginning date. There would be no acceleration of vesting of MoM stock options.
Generally, the employee would have 90 days post-termination of employment to exercise any vested stock options, and any unvested stock options would be forfeited as of the date of termination. However, Mr. Kennedy’s employment agreement would allow him 12 months, and not 90 days, to exercise his vested stock
164
Table of Contents
options in such an event. Had each of Messrs. Kennedy, Massetti, Chirico, Mitchell and Ali been involuntarily terminated without cause as of September 30, 2011, they would have 942,500, 195,000, 255,125, 73,125, and 186,875 stock options, respectively, for which vesting would be accelerated. As the fair market value of a share of our common stock on September 30, 2011 was $4.40, and the exercise price of each option held by the Named Executive Officers was $3.00, with the exception of one award for Mr. Ali having an exercise price of $4.40, the value of the accelerated options for Messrs. Kennedy, Massetti, Chirico, Mitchell and Ali would have been $1,319,500, $273,000, $357,175, $102,375 and $216,125, respectively.
Termination without Cause (Change in Control Context)
Stock option award agreements also contain certain provisions that are triggered upon a change in control. Under the 2007 Plan, “change in control” is defined to mean the acquisition by a person or group of at least forty percent (40%) of the issued and outstanding shares of common stock or securities representing at least forty percent (40%) of the voting power of Avaya Holdings Corp.
With respect to time-based stock options, if an employee is terminated without cause within one-year following a change in control, then, unless the stock option has been terminated, exercised or exchanged for other current or deferred cash or property in connection with the change in control, the time-based stock option is treated as having vested in full immediately prior to such termination of employment. There would be no acceleration of vesting of MoM stock options.
Generally, a terminated employee would have 90 days post-termination of employment to exercise any of such vested time-based stock options. Mr. Kennedy’s employment agreement would allow him 12 months to exercise all of his stock options, including any vested MoM stock options, in such an event. Messrs. Kennedy, Massetti, Chirico, Mitchell and Ali would have 2,827,500, 585,000, 765,375, 585,000 and 593,125 stock options, respectively, for which vesting would be accelerated upon termination following a change in control as of September 30, 2011. As the fair market value of a share of our common stock on September 30, 2011 was $4.40, and the exercise price of each option held by the Named Executive Officers was $3.00, with the exception of one award for Mr. Ali having an exercise price of $4.40, the value of the accelerated options for Messrs. Kennedy, Massetti, Chirico, Mitchell and Ali would have been $3,958,500, $819,000, $1,071,525, $819,000 and $648,375, respectively.
Restricted Stock Units
RSU awards issued under the 2007 Plan generally provide for accelerated vesting upon termination without “cause” or upon a termination following a change in control. Had a termination occurred on September 30, 2011, the unvested RSUs granted to each of Messrs. Kennedy, Massetti, Chirico and Mitchell representing 200,000, 75,000, 37,500 and 50,000 shares, respectively, would have vested on an accelerated basis. Using the fair market value of a share of our common stock on September 30, 2011 of $4.40, the value of accelerated RSUs for each of those individuals would be $880,000, $330,000, $165,000 and $220,000, respectively. In addition to the acceleration of RSUs noted, to the extent that receipt of shares underlying previously vested RSUs has been deferred, those shares would also be distributed upon termination without “cause.” With respect to each of the shares previously vested and deferred for Messrs. Kennedy, Massetti and Chirico of 200,000, 75,000 and 87,500, respectively, the value as of September 30, 2011 would have been $880,000, $330,000 and $385,000, respectively. Pursuant to Mr. Kennedy’s employment agreement and Mr. Massetti’s offer of employment, each has the right to require us to repurchase shares issued upon the vesting of their initial awards of RSUs at $10 and $13 per share, respectively, under certain circumstances (see “—Employment, Change in Control and Separation Agreements” for further details). If those provisions had been invoked in the circumstances described above, Mr. Kennedy and Mr. Massetti would have received $4 million and $1.95 million, respectively, for their initial awards of 400,000 and 150,000 RSUs, respectively.
165
Table of Contents
Resignation/Retirement
Cash and Benefits
Mr. Kennedy’s employment agreement provides that, in the event he resigns for “good reason,” he would be entitled to receive the same amount as set forth under “Involuntary Separation—Cash and Benefits” above. Under the agreement, “good reason” means: a material reduction by the Company in his base salary; a material breach of the agreement by the Company which shall include a material reduction or material negative change by the Company in the type or level of compensation and benefits (other than base salary) to which he is entitled under the agreement, other than any such reduction or change that is part of and consistent with a general reduction or change applicable to all senior officers of the Company; a material failure by the Company to pay or provide to him any compensation or benefits to which he is entitled; a change in Mr. Kennedy’s status, positions, titles, offices or responsibilities that constitutes a material and adverse change from his status, positions, titles, offices or responsibilities as in effect immediately before such change; the assignment to him of any duties or responsibilities that are materially and adversely inconsistent with his status, positions, titles, offices or responsibilities as in effect immediately before such assignment; any removal of Mr. Kennedy from or failure to reappoint or reelect him to any of such positions, titles or offices; the Company changing the location of its principal executive offices to a location more than 50 miles from its current principal office; any material breach by us or the Company of the agreement or any other agreement between us or Avaya Inc. and Mr. Kennedy incorporated by reference in the agreement; or the provision of notice by Avaya Inc. of its intention not to renew the agreement.
In all other contexts, upon resignation or retirement, there would be no continuation of benefits (other than certain medical benefits as prescribed by applicable law) and no additional payments made under any of the Company’s defined contribution (qualified and nonqualified) plans to any of the Named Executive Officers, other than as set forth under the “Nonqualified Deferred Compensation Plans” table.
Equity Awards
Generally, each of the Named Executive Officers has up to 30 days subsequent to a resignation to exercise vested stock options, and any unvested stock options as of the date of termination of employment are forfeited. If the resignation is for “good reason” (as defined in the 2007 Plan), then each of the Named Executive Officers would have 90 days from the date of such termination to exercise any vested stock options. However, Mr. Kennedy’s employment agreement provides that, with respect to his stock option awards, he would have 12 months, and not 90 days, following his termination of employment to exercise those stock options.
In addition, with respect to time-based stock options, if the resignation is for “good reason” and it occurs within one-year following a change in control (as defined under the 2007 Plan), then, unless the time-based stock option has been terminated, exercised or exchanged for other current or deferred cash or property in connection with the change in control, the time-based stock option is treated as having vested in full immediately prior to such termination of employment. For a summary of the time-based stock options held by each of the Named Executive Officers, please see “Outstanding Equity Awards at Fiscal Year-End.” The number and value of the shares accelerated on resignation for “good reason” are described in the section labeled “Termination without cause (Change in Control Context).”
Confidentiality; Non-Compete; Non-Solicitation; Recoupment of Profits
All of the Company’s senior officers, including the Named Executive Officers, have signed confidentiality agreements as a requirement for receiving certain stock-based compensation. The agreements stipulate that these officers will not misappropriate or disclose the Company’s proprietary information.
166
Table of Contents
The agreements generally provide that, during the term of their employment and for a period of twelve months from the date of termination of employment, the officers will not directly or indirectly: (i) subject to certain exceptions, work for or provide services to, in any capacity, whether as an employee, independent contractor or otherwise, whether with or without compensation, a material competitor of the Company; (ii) hire or solicit for hire any employee of the Company or seek to persuade or induce any employee of the Company to discontinue employment with the Company; (iii) hire or engage any independent contractor providing services to the Company, or solicit, encourage or induce any independent contractor providing services to the Company to terminate or diminish in any substantial respect its relationship with the Company; (iv) subject to certain limitations, (a) solicit, encourage or induce any customer of the Company to terminate or diminish in any substantial respect its relationship with the Company or (b) seek to persuade or induce any such customer or prospective customer of the Company to conduct with anyone else any substantial business or activity which such customer or prospective customer conducts or could conduct with the Company.
If the officers breach the provisions of these agreements, then the Company shall, in addition to any other remedies available to it, have the right to institute legal proceedings to enjoin the offending conduct. In addition, the Company generally has the immediate right to call and repurchase any shares of stock that have been issued under any stock options that have been awarded to the optionee by the Company at a purchase price that is the lesser of cost or fair market value.
Director Compensation
No director received compensation from us for service on the board of directors during the fiscal year ended September 30, 2011.
In August 2011, we implemented a non-affiliated director compensation program in which independent directors will receive an initial grant of restricted stock units with a market value of $200,000 upon joining the board of directors and an annual retainer of $100,000 in cash (which shall be reduced to $80,000 at such time as we have at least three independent directors on our board of directors) plus restricted stock units with a market value of $150,000. Each independent director who serves on the Audit Committee, Compensation Committee and Nominating and Governance Committee will receive an additional $10,000 as part of his annual retainer in lieu of meeting attendance fees. The Audit Committee chairperson will receive an additional $20,000 as part of his annual retainer and each of the Compensation Committee chairperson and the Nominating and Governance Committee chairperson will receive an additional $15,000 as part of his annual retainer. Eligible directors may elect to receive their cash retainers in the form of restricted stock units, provided that at least 50% of their aggregate annual compensation must be in the form of restricted stock units. Each restricted stock unit granted under the director compensation program will vest immediately upon issuance and be distributed to a director upon his or her resignation or removal from the board of directors. The market value of all restricted stock units granted under the director compensation program will be established based on the closing price of a share of our common stock on the date prior to the date on which such director is elected or appointed to serve.
In December 2011, the Company and Avaya Inc. appointed Mr. Gary Smith as an independent director to serve on their respective boards of directors and on our Audit and Compensation Committees. Upon his election, he received an initial grant of 79,546 restricted stock units, representing an inaugural grant of 45,455 restricted stock units and an annual equity grant of 34,091 restricted stock units. In addition, of his total annual retainer worth $120,000, based on his service on the board and his appointment as a member of the Audit and Compensation Committees, Mr. Smith elected to receive that retainer $60,000 in cash and $60,000 in restricted stock units (equaling 13,636 restricted stock units). All restricted stock units were awarded to Mr. Smith based upon the fair market value of our common stock on December 6, 2011, the date of grant, which was $4.40 per share. The restricted stock units were granted pursuant to the terms of the 2007 Plan and were fully vested on the date of grant. The shares underlying the restricted stock units will not be distributed to him until his resignation or removal from the board of directors.
167
Table of Contents
CERTAIN RELATIONSHIPS AND RELATED PARTY TRANSACTIONS
Arrangements with Our Sponsors
In connection with their investment in us, we entered into certain stockholder agreements and registration rights agreements with the Sponsors and various co-investors. Certain of those agreements were amended in connection with the financing of the NES acquisition (see Note 9, “Financing Arrangements,” to our consolidated financial statements for the fiscal year ended September 30, 2011 for more information). The co-investors include individuals and entities invited by our Sponsors to participate in our financings, such as affiliated investment funds, individuals employed by affiliates of our Sponsors, limited partners of our Sponsors and members of our management. In addition, we entered into a management services agreement with affiliates of the Sponsors and, from time to time, we may enter into various other contracts with companies affiliated with our Sponsors.
Stockholders’ Agreement
In connection with the Merger, we entered into a stockholders’ agreement with the Sponsors and certain of their affiliates. This stockholders’ agreement was amended and restated in connection with the financing of the NES acquisition. The stockholders’ agreement contains certain restrictions on the Sponsors’ and their affiliates’ transfer of our equity securities, contains provisions regarding participation rights, contains standard tag-along and drag-along provisions, provides for the election of our directors, mandates board approval of certain matters to include the consent of each Sponsor and generally sets forth the respective rights and obligations of the stockholders who are parties to that agreement. None of our officers or directors are parties to this agreement, although our non-employee directors may have an indirect interest in the agreement to the extent of their affiliations with the Sponsors.
Registration Rights Agreement
In addition, in connection with the Merger, we entered into a registration rights agreement with the Sponsors and certain of their affiliates which was amended and restated in connection with the financing of the NES acquisition. Pursuant to the registration rights agreement, as amended, we will provide the Sponsors and certain of their affiliates party thereto with certain demand registration rights following the expiration of the 180-day lockup period in respect of the shares of our common stock held by them. In addition, in the event that we register additional shares of common stock for sale to the public following the consummation of this offering, we will be required to give notice of such registration to the Sponsors and their affiliates party to the agreement of our intention to effect such a registration, and, subject to certain limitations, the Sponsors and such holders will have piggyback registration rights providing them with the right to require us to include shares of common stock held by them in such registration. We will be required to bear the registration expenses, other than underwriting discounts and commissions and transfer taxes, if any, associated with any registration of shares by the Sponsors or other holders described above. We have agreed to indemnify each holder of our common stock covered by the registration rights agreement for violations of federal or state securities laws by us in connection with any registration statement, prospectus or any preliminary prospectus. Each holder of such securities has in turn agreed to indemnify us for federal or state securities law violations that occur in reliance upon written information the holder provides to the Company in connection with any registration statement in which a holder of such securities is participating. None of our officers or directors are parties to this agreement, although our non-employee directors may have an indirect interest in the agreement to the extent of their affiliations with the Sponsors.
Management Services Agreement and Consulting Services
Both Avaya Holdings Corp. and Avaya Inc. are party to a management services agreement with Silver Lake Management Company, L.L.C., an affiliate of Silver Lake, and TPG, who are collectively referred to as the
168
Table of Contents
Managers, pursuant to which the Managers provide management and financial advisory services to us. Pursuant to the management services agreement, the Managers receive a monitoring fee of $7 million per annum, or the monitoring fees, and reimbursement on demand for out-of-pocket expenses incurred in connection with the provision of such services. In the event of a financing, acquisition, disposition or change of control transaction involving us during the term of the management services agreement, the Managers have the right to require us to pay to the Managers a fee equal to customary fees charged by internationally-recognized investment banks for serving as a financial advisor in similar transactions. The management services agreement may be terminated at any time by the Managers, but otherwise has an initial term ending on December 31, 2017 that automatically extends each December 31st for an additional year unless earlier terminated by us or the Managers. The term has automatically extended four times since the execution of the agreement such that the current term is December 31, 2021. The management services agreement will terminate pursuant to its terms upon consummation of this offering, and, upon termination, the Managers will receive a one-time fee in an amount equal to $ , which is the net present values of the monitoring fees that would have been payable during the remaining term of the management services agreement. The termination fee will be calculated using the current term ending December 31, 2021. The management services agreement contains customary exculpation and indemnification provisions in favor of the Managers and their affiliates.
In the course of business, Avaya will enter into arrangements with affiliates of the Sponsors pursuant to which consultants are engaged to provide services to the Company. For the fiscal year ended September 30, 2011, expenses associated with these consulting agreements were less than $1 million. For each of the fiscal years 2010 and 2009, we recorded $2 million of expenses associated with these consulting agreements with affiliates of TPG.
Transactions with Other Sponsor Portfolio Companies
The Sponsors are private equity firms that have investments in companies that do business with Avaya. For fiscal years 2011, 2010 and 2009, we recorded $8 million, $8 million and $11 million, respectively, associated with sales of the Company’s products and services to companies in which one or both of the Sponsors have investments. For fiscal years 2011, 2010 and 2009, we purchased goods and services of $3 million, $1 million and $1 million, respectively from companies in which one or both of the Sponsors have investments.
Financing
In April 2008, affiliates of TPG acquired $200 million of Avaya Inc.’s senior secured term B-1 loans. Based on the amount of the senior secured term loans that were held during fiscal years 2011, 2010 and 2009, and consistent with the terms of the loan, those affiliates received payments of principal and interest aggregating approximately $6 million, $6 million and $12 million, respectively. In September 2008, an affiliate of Silver Lake acquired $200 million of Avaya Inc.’s senior secured term B-1 loans. Based on the amount of the senior secured term loans that were held during fiscal year 2011, 2010 and 2009, and consistent with the terms of the loan, that affiliate received payments of principal and interest aggregating approximately $4 million, $8 million and $12 million respectively. In connection with the financing of the NES acquisition, affiliates of TPG and Silver Lake each funded approximately $222 million of incremental term B-2 loans. The incremental term B-2 loans were repaid in full on February 11, 2011 (see Note 9, “Financing Arrangements,” to our consolidated financial statements for the fiscal year ended September 30, 2011). Similar to other holders of senior secured incremental term B-2 loans, those senior secured incremental term B-2 loans held by TPG and Silver Lake were repaid in connection with the issuance of Avaya Inc.’s senior secured notes. Consistent with the terms of the incremental term B-2 loans, affiliates of TPG and Silver Lake each received payments (consisting of principal and interest, inclusive of amounts paid in connection with the payment in full of all incremental term B-2 loans on February 11, 2011) of approximately $285 million for fiscal year 2011 and approximately $25 million for fiscal year 2010.
In addition, on February 11, 2011, certain of the term B-1 loans were reclassified as term B-3 loans (see Note 9, “Financing Arrangements,” to our consolidated financial statements for the fiscal year ended
169
Table of Contents
September 30, 2011). During fiscal year 2011, an affiliate of Silver Lake received payments of principal and interest aggregating approximately $4 million with respect to its holdings of senior secured term B-3 loans. As of September 30, 2011, affiliates of TPG owned approximately $119 million principal amount of senior secured term B-1 loans, and no senior secured term B-3 loans and affiliates of Silver Lake owned approximately $54 million principal amount of senior secured term B-1 loans and approximately $123 million principal amount of senior secured term B-3 loan.
In addition, in connection with the financing of the NES acquisition, we issued shares of our Series A Preferred Stock. As of September 30, 2011, affiliates of TPG owned 38,864.13 shares of our non-voting Series A Preferred Stock (representing 31.1% of the issued and outstanding shares of Series A Preferred Stock) and affiliates of Silver Lake owned 38,864.13 shares of our non-voting Series A Preferred Stock (representing 31.1% of the issued and outstanding shares of Series A Preferred Stock). See “Description of Our Capital Stock—Preferred Stock.” As described in “Use of Proceeds” above, we intend to redeem all outstanding shares of Series A Preferred Stock plus accrued unpaid dividends, in an aggregate amount of $ with the net proceeds from this offering.
Arrangements Involving our Directors and Executive Officers
Sponsor Board Appointments
Messrs. Giancarlo, Mondre and Roux are Directors of each of Avaya Holdings Corp. and Avaya Inc. and they hold the positions of Managing Director, Managing Director and Chairman, respectively, of Silver Lake. Messrs. Frantz, Mohebbi and Rollins are Directors of each of Avaya Holdings Corp. and Avaya Inc. and they hold the positions of Partner, Senior Advisor and Senior Advisor, respectively, of TPG.
Share Ownership of Mr. Giancarlo
Effective June 30, 2008, Mr. Giancarlo was elected President and CEO of each of Avaya Holdings Corp. and Avaya Inc. on an interim basis. On November 24, 2008, Mr. Giancarlo received a grant of 500,000 stock options having an exercise price of $3.80 per share, the fair market value of a share of our common stock on the date of the grant. The stock options were issued with standard vesting provisions using the standard weightings of time-based, EBITDA-based and MoM-based awards as discussed in the section “Executive Compensation—Compensation Discussion and Analysis—Elements of Executive Officer Compensation—Long-Term Incentives.” Mr. Giancarlo resigned as President and CEO when Mr. Kennedy took such office effective December 22, 2008. Mr. Giancarlo participated in the Company’s stock option tender offer and tendered all of his stock options for new stock options with an exercise price of $3.00 per share, a grant date of November 17, 2009 and new vesting terms. See Note 14, “Share-based Compensation,” to our consolidated financial statements for the year ended September 30, 2011 and “Compensation Disclosure and Analysis” for more information regarding the stock option exchange offer in which Mr. Giancarlo and our executive officers participated.
Senior Manager Registration and Preemptive Rights Agreement and Management Stockholders’ Agreement
In connection with the Merger, we entered into a senior manager registration and preemptive rights agreement with certain current and former members of our senior management who own shares of our common stock and options and RSUs convertible into shares of our common stock, including Messrs, Chirico, Giancarlo and Kennedy. Pursuant to the senior manager registration and preemptive rights agreement we will provide the senior managers party thereto that hold registrable securities thereunder with certain registration rights upon either (a) the exercise of the Sponsors or their affiliates of demand registration rights under the Sponsors’ registration rights agreement discussed above or (b) any request by the Sponsors to file a shelf registration statement for the resale of such shares. In addition, in the event that we register additional shares of common stock for sale to the public following the consummation of this offering, pursuant to the senior manager registration and preemptive rights agreement, senior managers party thereto that hold registrable securities
170
Table of Contents
thereunder are entitled to notice of such registration and, subject to certain limitations, such senior managers will have piggyback registration rights providing them with the right to require us to include shares of common stock held by them in such registration. We will be required to bear the registration expenses, other than underwriting discounts and commissions and transfer taxes, if any, associated with any registration of stock by the senior managers as described above. We have agreed to indemnify each holder of registrable securities covered by this agreement for violations of federal or state securities laws by us in connection with any registration statement, prospectus or any preliminary prospectus. Each holder of such registrable securities has in turn agreed to indemnify us for federal or state securities law violations that occur in reliance upon written information the holder provides to the Company in connection with any registration statement in which a holder of such registrable securities is participating.
In addition, pursuant to the senior manager registration and preemptive rights agreement, the Company agreed to provide each senior manager party thereto with certain preemptive rights to participate in any future issuance of shares of our common stock to the Sponsors or their affiliates. The preemptive rights granted under the senior manager registration and preemptive rights agreement will terminate upon completion of this offering.
In connection with the Merger, we also entered into a management stockholders’ agreement with management stockholders, including all of our named executive officers and Mr. Giancarlo. The stockholders’ agreement contains certain restrictions on such stockholders’ transfer of our equity securities, contains rights of first refusal upon disposition of shares, contains standard tag-along and drag-along provisions, and generally sets forth the respective rights and obligations of the stockholders who are parties to that agreement.
Transactions with Ciena Corporation
Gary B. Smith, serves on the Board of Directors of Avaya Holdings Corp. and Avaya Inc. and also currently serves as President, Chief Executive Officer and Director of Ciena Corporation, a network infrastructure company. During fiscal year 2011, and prior to Mr. Smith’s appointment as a Director of the Company, the Company recorded approximately $5 million associated with sales of the Company’s products and services to Ciena. The Company also purchased goods and services of less than $1 million from Ciena during fiscal year 2011.
Related Party Transaction Policy
In February 2009, the Avaya Inc. board of directors adopted procedures for the review, approval and/or ratification of “related party transactions,” which are those transactions required to be disclosed pursuant to Item 404 of Regulation S-K as promulgated by the SEC. In August 2011, our board of directors adopted procedures that are substantially identical to those that are currently in effect for the review, approval and/or ratification of such transactions by Avaya Inc.
The procedures give our Audit Committee the power to approve or disapprove existing and potential related party transactions involving our directors and certain of our executive officers. Upon becoming aware of an existing or potential related party transaction, the Audit Committee is required to conduct a full inquiry into the facts and circumstances concerning that transaction and to determine the appropriate actions, if any, for us to take. If the Audit Committee does not approve a transaction that is brought before it, then the matter is automatically forwarded to our full board of directors for consideration. A director who is the subject of a potential related party transaction is not permitted to participate in the decision-making process of the Audit Committee or full board of directors, as applicable, relating to what actions, if any, shall be taken by us in light of that transaction. For one year following the effective date of the registration statement of which this prospectus forms a part, the audit Committee may not consist entirely of independent directors. See “Management—Board Committees—Audit Committee.”
171
Table of Contents
Because Avaya Inc.’s procedures were adopted subsequent to the related party transaction disclosures listed above (other than those relating to the financing of the NES acquisition and the stock option exchange offer), those matters were not subject to the procedures. All related party transactions arising out of the financing of the NES acquisition were placed before and approved by the full Avaya Inc. board of directors. The stock option exchange offer was unanimously approved by the Compensation Committee. As indicated in Note 14, “Share-based Compensation,” to our consolidated financial statements for the fiscal year ended September 30, 2011, the exchange offer was made available to all individuals holding eligible stock options on the same terms and conditions as those offered to Mr. Giancarlo.
172
Table of Contents
The following table sets forth certain information with respect to the beneficial ownership of our common stock at November 1, 2011 for:
| • | each person whom we know beneficially owns more than five percent of our common stock; |
| • | each of our directors; |
| • | each of our named executive officers; and |
| • | all of our directors and executive officers as a group. |
The number of shares beneficially owned by each stockholder is determined under rules issued by the SEC.
The percentage of common stock beneficially owned by each person before the offering is based on 487,403,082 shares of common stock outstanding as of November 1, 2011, and shares of common stock expected to be outstanding following this offering after giving effect to the shares of common stock offered hereby. See “Description of Capital Stock.” Shares of common stock that may be acquired within 60 days following November 1, 2011 pursuant to the exercise of options or warrants are deemed to be outstanding for the purpose of computing the percentage ownership of such holder but are not deemed to be outstanding for computing the percentage ownership of any other person shown in the table. Beneficial ownership representing less than one percent is denoted with an “*.”
Upon the completion of this offering, investment funds affiliated with the Sponsors will own, in the aggregate, approximately % of our common stock, assuming the underwriters do not exercise their option to purchase additional shares of our common stock. As a result, we intend to be a “controlled company” within the meaning of the corporate governance rules of the New York Stock Exchange.
| Shares Beneficially Owned Prior to this Offering | % of Common Stock Beneficially Owned After this Offering | |||||||||||
Name | Number | Percentage | Without Option | With Option | ||||||||
Silver Lake Funds and affiliates(1) | 403,457,030 | 72.3 | % | |||||||||
TPG Funds and affiliates(2) | 403,457,030 | 72.3 | % | |||||||||
Mohamad S. Ali(5) | 341,250 | * | ||||||||||
James M. Chirico Jr.(3)(4) | 649,750 | * | ||||||||||
Kevin J. Kennedy(3)(4) | 2,643,947 | * | ||||||||||
Anthony J. Massetti(3)(4) | 535,000 | * | ||||||||||
Thomas G. Mitchell | — | * | ||||||||||
Eugene J. Frantz(2)(5) | — | * | ||||||||||
Charles H. Giancarlo(1)(3)(6) | 162,500 | * | ||||||||||
Afshin Mohebbi(2)(7) | — | * | ||||||||||
Greg K. Mondre(1)(8) | — | * | ||||||||||
Kevin B. Rollins(2)(9) | — | * | ||||||||||
David J. Roux(1)(10) | — | * | ||||||||||
Gary B. Smith(4) | 93,182 | * | ||||||||||
Directors and executive officers as a group, including those named above (21 Persons)(3)(4)(5)(6)(7)(8)(9)(10) | 8,200.256 | 1.7 | % | |||||||||
| (1) | The shares of our common stock that are attributed to Silver Lake Funds (as defined below) and affiliates consist of an aggregate of 332,450,000 shares of our common stock and 71,007,030 warrants to purchase shares of our common stock. The warrants have an exercise price of $3.25 per share and are exercisable at any time prior to December 18, 2019. Excluding warrants, the shares of our common stock that are |
173
Table of Contents
| attributed to Silver Lake Funds and affiliates represent 68.2% of all shares of common stock outstanding as of November 1, 2011. In addition, funds affiliated with Silver Lake own an aggregate of 38,864.13 shares of our non-voting Series A Preferred Stock (representing 31.1% of the issued and outstanding shares of Series A Preferred Stock) that are not convertible into our common stock and are excluded from the table above. The warrants and the Series A Preferred Stock were issued in connection with the financing of the NES acquisition (see Note 9, “Financing Arrangements,” to our consolidated financial statements for the fiscal year ended September 30, 2011 for more information). The shares of Series A Preferred Stock, plus accrued unpaid dividends, are expected to be redeemed with the proceeds of this offering (see “Use of Proceeds”). |
| The shares of common stock and warrants (rounded to the nearest whole share) that are attributed to the Silver Lake Funds and their affiliates in this table represent direct holdings by the following entities: |
| Common Stock | Warrants | |||||||
Silver Lake Partners II, L.P., or SLP II | 39,815,641 | 7,695,824 | ||||||
Silver Lake Partners III, L.P., or SLP III | 109,624,955 | 21,189,020 | ||||||
Silver Lake Technology Investors II, L.P., or SLTI II | 184,359 | 35,634 | ||||||
Silver Lake Technology Investors III, L.P., or SLTI III | 375,045 | 72,491 | ||||||
Total fractional shares held by SLP II, SLP III, SLTI II and | — | 1 | ||||||
Sierra Co-Invest, LLC, or Sierra Co-Invest | 182,450,000 | — | ||||||
Sierra Co-Invest II, LLC, or Sierra Co-Invest II | — | 42,014,060 | ||||||
|
|
|
| |||||
Total | 332,450,000 | 71,007,030 | ||||||
| For ease of reference, we refer to SLP II, SLP III, SLTI II and SLTI III collectively as the Silver Lake Funds. The general partner of each of SLP II and SLTI II is Silver Lake Technology Associates II, L.L.C., whose managing member is Silver Lake Group, L.L.C. The general partner of each of SLP III and SLTI III is Silver Lake Technology Associates III, L.P., whose general partner is SLTA III (GP), L.L.C., whose managing member is Silver Lake Group, L.L.C. |
| The managing member of Sierra Co-Invest and Sierra Co-Invest II is Sierra Manager Co-Invest, LLC, or Sierra Manager. Pursuant to Sierra Manager’s limited liability company operating agreement, each of TPG GenPar V, L.P. and Silver Lake Technology Associates III, L.P. has the right to designate one of the two members of Sierra Manager’s management committee. Greg Mondre currently serves as Silver Lake’s designee. |
| The mailing address for Charles Giancarlo, Greg Mondre and David Roux and for each of the Silver Lake Funds and their direct and indirect general partners is c/o Silver Lake, 2775 Sand Hill Road, Suite 100, Menlo Park, CA 94025. |
| (2) | The shares of our common stock that are attributed to the TPG Funds (as defined below) and affiliates in this table consist of an aggregate of 332,450,000 shares of our common stock and 71,007,030 warrants to purchase shares of our common stock. The warrants have an exercise price of $3.25 per share and are exercisable at any time prior to December 18, 2019. Excluding warrants, the shares of our common stock that are attributed to the TPG Funds and affiliates represent 68.2% of all shares of common stock outstanding as of November 1, 2011. In addition, funds affiliated with TPG own an aggregate of 38,864.13 shares of our non-voting Series A Preferred Stock (representing 31.1% of the issued and outstanding shares of Series A Preferred Stock) that are not convertible into common stock and are excluded from the table above. The warrants and the Series A Preferred Stock were issued in connection with the financing of the NES acquisition (see Note 9, “Financing Arrangements,” to our consolidated financial statements for the fiscal year ended September 30, 2011 for more information). The shares of Series A Preferred Stock, plus accrued unpaid dividends, will be redeemed with the proceeds of this offering (see “Use of Proceeds”). |
The shares of our common stock and warrants (rounded to the nearest whole share) that are attributed to TPG Partners V, L.P., a Delaware limited partnership, or Partners, TPG FOF V-A, L.P., a Delaware limited partnership, or FOF A, and TPG FOF V-B, L.P., a Delaware limited partnership, or FOF B, which, together |
174
Table of Contents
| with Partners and FOF A, are collectively referred to as the TPG Funds, and their affiliates in this table represent direct holdings by the following entities: |
| Common Stock | Warrants | |||||||
Partners | 149,294,510 | 28,856,608 | ||||||
FOF A | 390,556 | 75,489 | ||||||
FOF B | 314,933 | 60,872 | ||||||
Total fractional shares held by Partners, FOF A and FOF B | 1 | 1 | ||||||
Sierra Co-Invest | 182,450,000 | — | ||||||
Sierra Co-Invest II | — | 42,014,060 | ||||||
|
|
|
| |||||
Total | 332,450,000 | 71,007,030 | ||||||
| The general partner of each of the TPG Funds is TPG GenPar V, L.P., a Delaware limited partnership, or GenPar, whose general partner is TPG GenPar V Advisors, LLC, a Delaware limited liability company, or GenPar Advisors, whose sole member is TPG Holdings I, L.P., a Delaware limited partnership, or Holdings I, whose general partner is TPG Holdings I-A, LLC, a Delaware limited liability company, or Holdings I GP, whose sole member is TPG Group Holdings (SBS), L.P., a Delaware limited partnership, or Group Holdings, whose general partner is TPG Group Holdings (SBS) Advisors, Inc., a Delaware corporation, or Group Advisors, which, together with the TPG Funds, GenPar, GenPar Advisors, Holdings I, Holdings I GP and Group Holdings we collectively refer to as the TPG Entities). The managing member of Sierra Co-Invest and Sierra Co-Invest II is Sierra Manager. Pursuant to the Sierra Manager’s limited liability company operating agreement, each of GenPar and Silver Lake Technology Associates III, L.P. has the right to designate one of the two members of the management committee of Sierra Manager. Eugene Frantz currently serves as GenPar’s designee. |
| Because of these relationships, Group Advisors may be deemed to beneficially own the shares and warrants directly held by the TPG Funds, Sierra Co-Invest and Sierra Co-Invest II. David Bonderman and James G. Coulter are officers, directors and sole shareholders of Group Advisors and may therefore be deemed to be the beneficial owners of the shares directly held by the TPG Funds, Sierra Co-Invest and Sierra Co-Invest II. |
The mailing address for each of Group Advisors and Messrs. Bonderman, Coulter and Frantz is c/o TPG Capital, L.P., 301 Commerce Street, Suite 3300, Fort Worth, TX 76102. The mailing address for Sierra Co-Invest is 301 Commerce Street, Suite 3300, Fort Worth, TX 76102. The mailing address for Sierra Manager is 9 West 57th Street, 32nd Floor, New York, NY 10019. |
| (3) | Includes beneficial ownership of the following numbers of shares of common stock that may be acquired within 60 days of November 1, 2011 pursuant to stock options (inclusive of Continuation Options): |
| • Mohamad S. Ali | 341,250 | • Anthony J. Massetti | 422,500 | |||||||
| • James M. Chirico, Jr. | 562,250 | • Charles H. Giancarlo | 162,500 | |||||||
| • Kevin J. Kennedy | 2,015,000 | • Directors and executive officers | 6,034,250 |
| (4) | Includes ownership of the following numbers of shares of common stock underlying RSUs that have vested or that may vest within 60 days of November 1, 2011 for which receipt has been deferred such that, absent an event triggering issuance of the shares in accordance with the terms of the award agreement under which the RSUs were issued, the shares would not be received within 60 days of November 1, 2011 (inclusive of Continuation Units). |
• James M. Chirico, Jr. | 87,500 | • Anthony J. Massetti | 112,500 | |||||||
• Kevin J. Kennedy | 300,000 | • Directors and executive officers as | 793,182 | |||||||
| • Gary B. Smith | 93,182 |
175
Table of Contents
| (5) | Mr. Frantz is (a) a member of the management committee of Sierra Manager and (b) a partner of TPG Capital, L.P., an affiliate of the TPG Entities. Given the relationships described in Footnote (2) above, he may be deemed to have shared voting or dispositive power over the 182,450,000 shares of our common stock that Sierra Co-Invest holds directly as well as the 42,014,060 warrants exercisable for our common stock that Sierra Co-Invest II holds directly. As described in Footnote (2) above, the TPG Funds directly hold 150,000,000 shares of our common stock as well as 28,992,970 warrants exercisable for shares of our common stock. Mr. Frantz has no voting or investment power over the shares and warrants held directly by the TPG Funds and disclaims beneficial ownership of any shares of our common stock and warrants exercisable for shares of our common stock held directly or indirectly by the TPG Entities, Sierra Co-Invest and Sierra Co-Invest II. |
| (6) | Charles Giancarlo is a managing director of Silver Lake Group, L.L.C. Mr. Giancarlo has no voting or investment power over the shares and warrants held directly by the Silver Lake Funds and disclaims beneficial ownership of any shares of our common stock and warrants exercisable for shares of our common stock held by the Silver Lake Funds, Sierra Co-Invest or Sierra Co-Invest II. |
| (7) | Afshin Mohebbi is a senior advisor to TPG Capital, L.P., an affiliate of the TPG Entities. Mr. Mohebbi has no voting or investment power over and disclaims beneficial ownership of any shares of our common stock and warrants exercisable for shares of our common stock held directly or indirectly by the TPG Entities, Sierra Co-Invest or Sierra Co-Invest II. |
| (8) | Greg Mondre is (a) a managing director of Silver Lake Group, L.L.C., (b) a member of Sierra Manager’s management committee and (c) a vice president of Sierra Manager. Mr. Mondre has no voting or investment power over the shares and warrants held directly by the Silver Lake Funds and disclaims beneficial ownership of any shares of our common stock and warrants exercisable for shares of our common stock held by the Silver Lake Funds, Sierra Co-Invest or Sierra Co-Invest II. |
| (9) | Kevin Rollins is a senior advisor to TPG Capital, L.P., an affiliate of the TPG Entities. Mr. Rollins has no voting or investment power over and disclaims beneficial ownership of any shares of our common stock and warrants exercisable for shares of our common stock held directly or indirectly by the TPG Entities, Sierra Co-Invest and Sierra Co-Invest II. |
| (10) | David Roux is (a) a Chairman of Silver Lake Group, L.L.C. and (b) a co-president of Sierra Manager. Mr. Roux has no voting or investment power over the shares and warrants held directly by the Silver Lake Funds and disclaims beneficial ownership of any shares of our common stock and warrants exercisable for shares of our common stock held by the Silver Lake Funds, Sierra Co-Invest or Sierra Co-Invest II. |
176
Table of Contents
DESCRIPTION OF CERTAIN OUTSTANDING INDEBTEDNESS
Senior secured multi-currency asset-based revolving credit facility
Overview
In connection with the Merger, Avaya Inc. entered into a credit agreement and related security and other agreements, dated as of October 26, 2007, or the Merger date, for a senior secured multi-currency asset-based revolving credit facility.
The senior secured multi-currency asset-based revolving credit facility provides senior secured revolving financing of up to $335 million, subject to availability under a borrowing base. The borrowing base at any time equals the sum of 85% of eligible accounts receivable plus 85% of the net orderly liquidation value of eligible inventory, subject to certain reserves and other adjustments. The senior secured multi-currency asset-based revolving credit facility includes borrowing capacity available for letters of credit and for short-term borrowings, referred to as swingline loans, and is available in euros in addition to dollars. At September 30, 2011, there were no borrowings under this facility and $75 million of letters of credit issued in the ordinary course of business under this facility resulting in remaining availability of $252 million.
Avaya Inc. has the right to request up to $100 million of additional commitments under this facility, although the lenders under this facility are not under any obligation to provide any such additional commitments, and any increase in commitments is subject to certain conditions precedent. If Avaya Inc. were to request any such additional commitments and the existing lenders or new lenders were to agree to provide such commitments, the facility size could be increased by up to $100 million, but Avaya Inc.’s ability to borrow under this facility would still be limited by the amount of the borrowing base.
Interest rate and fees
Borrowings under the senior secured multi-currency asset-based revolving credit facility bear interest at a rate per annum equal to, at Avaya Inc.’s option, either (a) a base rate determined by reference to the higher of (1) the prime rate of Citicorp USA, Inc. and (2) the federal funds effective rate plus 1/2 of 1% or (b) a LIBOR rate determined by reference to the costs of funds for U.S. dollar deposits for the interest period relevant to such borrowing adjusted for certain additional costs, in each case plus an applicable margin. The applicable margin for borrowings under the senior secured multi-currency asset-based revolving credit facility is based on excess availability under that facility and ranges from (1) 0.50% to 0.75% per annum with respect to base rate borrowings and (2) 1.50% to 1.75% per annum with respect to LIBOR borrowings. Swingline loans bear interest at a rate per annum equal to the base rate plus the applicable margin.
In addition to paying interest on outstanding principal under the senior secured multi-currency asset-based revolving credit facility, Avaya Inc. is required to pay a commitment fee of 0.25% per annum in respect of the unutilized commitments thereunder. Avaya Inc. must also pay customary letter of credit fees equal to the applicable margin on LIBOR loans and agency fees.
Mandatory repayments
If at any time the aggregate amount of outstanding loans, unreimbursed letter of credit drawings and undrawn letters of credit under the senior secured multi-currency asset-based revolving credit facility exceeds the lesser of (i) the commitment amount and (ii) the borrowing base, Avaya Inc. will be required to repay outstanding loans and cash collateralize letters of credit in an aggregate amount equal to such excess, with no reduction of the commitment amount. If the amount available under the senior secured multi-currency asset-based revolving credit facility is less than $33.5 million for five consecutive business days or a payment or bankruptcy event of default has occurred, Avaya Inc. will be required to deposit cash from specified
177
Table of Contents
concentration accounts daily in a collection account maintained with the administrative agent under the senior secured multi-currency asset-based revolving credit facility, which will be used to repay outstanding loans and cash collateralize letters of credit.
Voluntary repayments
Avaya Inc. may voluntarily reduce the unutilized portion of the commitment amount and repay outstanding loans at any time without premium or penalty other than customary “breakage” costs with respect to LIBOR loans.
Amortization and final maturity
There is no scheduled amortization under the senior secured multi-currency asset-based revolving credit facility. Pursuant to an amendment to this facility effective August 8, 2011, all outstanding loans under the facility are due and payable in full on October 26, 2016.
Co-borrowers, guarantees and security
All obligations under the senior secured multi-currency asset-based revolving credit facility are unconditionally guaranteed by Avaya Holdings Corp. In addition, all of our existing 100% owned domestic subsidiaries (with certain agreed-upon exceptions), or the subsidiary borrowers, act as co-borrowers under the facility, and certain of our future domestic 100% owned subsidiaries will act as co-borrowers under the facility. All obligations under the senior secured multi-currency asset-based revolving credit facility, and the guarantees of those obligations, are secured, subject to certain exceptions, by substantially all of our assets and the assets of Avaya Inc. and the subsidiary borrowers, including:
| • | a first-priority security interest in personal property consisting of accounts receivable, inventory, cash, deposit accounts, securities accounts, chattel paper and certain related assets and proceeds of the foregoing, which are collectively referred to as ABL Priority Collateral; |
| • | a second-priority pledge of all of Avaya Inc.’s capital stock and all of the capital stock held by Avaya Inc. and the subsidiary borrowers (which pledge, in the case of the capital stock of any foreign subsidiary or of any U.S. subsidiary that holds capital stock of a foreign subsidiary and is a disregarded entity for U.S. federal income tax purposes, is limited to 65% of the voting stock of such subsidiary); and |
| • | a second-priority security interest in, and mortgages on, substantially all other tangible and intangible assets of us, Avaya Inc. and each subsidiary borrower, including substantially all of our material owned real property and equipment, fixtures, intellectual property, investment property, instruments, commercial tort claims, documents and general intangibles, which are collectively, and together with the pledge of capital stock described in the previous bullet-point, referred to as Non-ABL Priority Collateral. |
Certain covenants and events of default
The senior secured multi-currency asset-based revolving credit facility contains a number of covenants that, among other things and subject to certain exceptions, restrict Avaya Inc.’s ability and the ability of Avaya Inc.’s subsidiaries to:
| • | incur or guarantee additional debt and issue or sell certain preferred stock; |
| • | pay dividends on, redeem or repurchase our capital stock; |
| • | make certain acquisitions or investments; |
| • | incur or assume certain liens; |
178
Table of Contents
| • | enter into transactions with affiliates; |
| • | merge or consolidate with another company; |
| • | transfer or otherwise dispose of assets; |
| • | redeem subordinated debt; |
| • | incur obligations that restrict the ability of its subsidiaries to make dividends or other payments to us; and |
| • | create or designate unrestricted subsidiaries. |
The covenants limiting the incurrence of unsecured or subordinated debt, dividends and other restricted payments, investments, loans, advances and acquisitions, and prepayments or redemptions of Avaya Inc.’s subordinated indebtedness, each permit the restricted actions in an unlimited amount, subject to the satisfaction of certain payment conditions, principally that Avaya Inc. must have pro forma excess availability greater than $33.5 million under the senior secured multi-currency asset-based revolving credit facility and that it must be in pro forma compliance with the fixed charge coverage ratio described in the next paragraph.
Although the senior secured multi-currency asset-based revolving credit facility does not require Avaya Inc. to comply with any financial ratio maintenance covenants, if Avaya Inc. has excess availability under the facility of less than $33.5 million at any time, it will not be permitted to borrow any additional amounts thereunder unless its pro forma Consolidated Fixed Charge Coverage Ratio (as defined in the credit agreement governing the facility) is at least 1.0 to 1.0.
The senior secured multi-currency asset-based revolving credit facility also contains certain customary affirmative covenants and events of default, including an event of default that would result from the failure to make payment beyond any applicable grace period in respect of any indebtedness having an aggregate principal amount of not less than $75 million, the failure to observe or perform any other agreement or condition relating to any such indebtedness (other than the senior secured credit facility) which results in the acceleration of, or permits the holders of such indebtedness to accelerate, the maturity of such indebtedness or the failure to observe or perform any other agreement or condition relating to the senior secured credit facility which results in the lenders thereunder accelerating the maturity of such facility.
Senior secured credit facility
Overview
In connection with the Merger, Avaya Inc. also entered into a credit agreement and related security and other agreements, dated as of the Merger date. The senior secured credit facility was amended and restated as of February 11, 2011 as discussed under “—Amendment and restatement of senior secured credit facility” below.
The senior secured credit facility consists of (a) a senior secured multi-currency revolver allowing for borrowings of up to $200 million, (b) $3,800 million of senior secured term loans borrowed on the Merger date and of which $3,623 million of remaining face value was outstanding as of September 30, 2011, consisting of $1,449 million senior secured term B-1 loans and $2,174 million senior secured term B-3 loans (as such terms are defined below) and (c) $1,000 million of incremental senior secured term B-2 loans, which was drawn in full at an original issue discount of 20% on December 18, 2009 in connection with the NES acquisition and which was repaid in full on February 11, 2011 from the proceeds of the senior secured note issuance (which is discussed in greater detail below). The senior secured multi-currency revolver includes borrowing capacity available for letters of credit and for short-term borrowings, referred to as swingline loans, and is available in euros in addition to dollars. As of September 30, 2011, there were no amounts outstanding under the senior secured multi-currency revolver.
179
Table of Contents
Amendment and restatement of senior secured credit facility
On February 11, 2011, the senior secured credit facility was amended and restated. The modified terms included amendments to:
| • | permit the Company to effect a refinancing (see below) in which the maturity of 60% of the senior secured term loans representing outstanding principal amounts of $2.2 billion was extended from October 26, 2014 to October 26, 2017 by converting such loans into a new tranche of senior secured term loans (the senior secured term loans that remain due October 26, 2014 are referred to as the senior secured term B-1 loans and the senior secured term loans that are due October 26, 2017 are referred to as the senior secured term B-3 loans); |
| • | permit, at the election of Avaya Inc., prepayments to the senior secured incremental term B-2 loans prior to the senior secured term B-1 loans and senior secured term B-3 loans and thereafter to the class of term loans with the next earliest maturity; |
| • | permit the issuance of indebtedness (including the senior secured notes) to refinance a portion of the term loans under the senior secured credit facility and to secure such indebtedness (including the senior secured notes) on a pari passu basis with the obligations under the senior secured credit facility; |
| • | permit future refinancing of the term loans under the senior secured credit facility; and |
| • | permit future extensions of the term loans and revolving credit commitments (including, in the case of the revolving credit commitments, by obtaining new revolving credit commitments) under the senior secured credit facility. |
Interest rate and fees
Borrowings under the senior secured credit facility bear interest at a rate per annum equal to, at Avaya Inc.’s option, either a base rate or a LIBOR rate, in each case plus an applicable margin. The base rate is determined by reference to the higher of (1) the prime rate of Citibank, N.A. and (2) the federal funds effective rate plus 1/2 of 1%. The LIBOR rate is determined by reference to the costs of funds for U.S. dollar deposits for the interest period relevant to such borrowing adjusted for certain additional costs.
The applicable margins for borrowings of revolving loans and senior secured term B-1 loans under the senior secured credit facility are subject to adjustment each fiscal quarter based on its senior secured leverage ratio and range from (A) (1) 1.00% to 1.75% per annum with respect to revolving loans that are base rate borrowings and (2) 2.00% to 2.75% per annum with respect to revolving loans that are LIBOR borrowings and (B) (1) 1.50% to 1.75% per annum with respect to senior secured term B-1 loans that are base rate borrowings and (2) 2.50% to 2.75% per annum with respect to senior secured term B-1 loans that are LIBOR borrowings.
The applicable margins for borrowings of revolving loans and senior secured term B-3 loans under the senior secured credit facility is equal at all times to (1) 3.50% per annum with respect to loans that are base rate borrowings and (2) 4.50% per annum with respect to loans that are LIBOR borrowings.
The applicable margin for borrowings of senior secured incremental term B-2 loans was equal at all times to (1) 6.50% per annum with respect to loans that are base rate borrowings and (2) 7.50% per annum with respect to loans that are LIBOR borrowings; provided that (i) base rate borrowings were subject to a floor of 4.00% and (ii) LIBOR borrowings were subject to a floor of 3.00%.
In addition to paying interest on outstanding principal under the senior secured credit facility, Avaya Inc. is required to pay a commitment fee of 0.50% per annum in respect of the unutilized commitments under the senior secured multi-currency revolver. This commitment fee is subject to adjustment to 0.375% each fiscal quarter based on Avaya Inc.’s senior secured leverage ratio. Avaya Inc. is also required to pay customary letter of credit fees equal to the applicable margin on LIBOR loans and agency fees under this facility.
180
Table of Contents
Mandatory repayments
Avaya Inc. is required to prepay outstanding term loans under its senior secured credit facility with (x) 100% of the net cash proceeds of any debt issued by it or its subsidiaries (with exceptions for certain debt permitted to be incurred under the facility), (y) 50% (which percentage is reduced to 25% and to 0% if Avaya Inc.’s senior secured leverage ratio is less than or equal to 3.00:1.00 and 2.50:1.00, respectively) of Avaya Inc.’s annual excess cash flow (as defined in the facility) and (z) if Avaya Inc.’s senior secured leverage ratio exceeds 2.50:1.00, 100% of the net cash proceeds of all non-ordinary course asset sales, casualty events or other dispositions of property by it or its subsidiaries, subject to reinvestment rights and certain other exceptions.
Voluntary repayments
Avaya Inc. may voluntarily prepay outstanding loans under its senior secured credit facility and reduce the unutilized portion of the commitment amount in respect of the senior secured multi-currency revolver at any time without premium or penalty other than customary “breakage” costs with respect to LIBOR loans; provided, that if Avaya Inc. prepays the senior secured term B-3 loans with certain secured loans having a lower effective yield than the senior secured term B-3 loans or effects an amendment which reduces the interest rate margin on the senior secured term B-3 loans, in each case on or prior to February 11, 2012, then Avaya Inc. will be required to pay to the senior secured term B-3 lenders a fee equal to 1.0% of the aggregate principal amount of the senior secured term B-3 loans so prepaid or amended.
Amortization and final maturity
Avaya Inc. is required to make scheduled quarterly payments under its senior secured term loan facility equal to 0.25% of the original principal amount of the senior secured term loans, with the balance of the senior secured B-1 term loans paid on October 26, 2014 and the balance of the senior secured B-3 term loans paid on October 26, 2017;providedthat the maturity of the senior secured term B-3 loans will automatically become July 26, 2015 unless (i) the total net leverage ratio as tested on such date based upon the most recent financial statements provided to the lenders under the senior secured credit facility is no greater than 5.0 to 1.0 or (ii) on or prior to such date, either (x) an initial public offering shall have occurred or (y) at least $750 million in aggregate principal amount of Avaya Inc.’s existing senior unsecured cash-pay notes or senior unsecured PIK toggle notes have been repaid or refinanced or their maturity has been extended to a date no earlier than 91 days after October 26, 2017. Pursuant to an amendment to this facility effective August 8, 2011, the principal amount outstanding of the loans under the senior secured multi-currency revolver is due and payable in full on October 26, 2016.
Guarantees and security
All obligations under the senior secured credit facility are unconditionally guaranteed by Avaya Holdings Corp. and all of our existing 100% owned domestic subsidiaries (with certain agreed-upon exceptions) and will be required to be guaranteed by certain of our future domestic 100% owned subsidiaries. All obligations under the senior secured credit facility, and the guarantees of those obligations, are secured, subject to certain exceptions, by substantially all of our assets and the assets of Avaya Inc. and the subsidiary guarantors, including:
| • | a second-priority security interest in personal property consisting of accounts receivable, inventory, cash, deposit accounts, securities accounts, chattel paper and certain related assets and proceeds of the foregoing; |
| • | a first-priority pledge of all of Avaya Inc.’s capital stock and all of the capital stock held by Avaya Inc. and the subsidiary guarantors (which pledge, in the case of the capital stock of any foreign subsidiary or of any U.S. subsidiary that holds capital stock of a foreign subsidiary and is a disregarded entity for U.S. federal income tax purposes, is limited to 65% of the voting stock of such subsidiary); and |
| • | a first-priority security interest in, and mortgages on, substantially all other tangible and intangible assets of us, Avaya Inc. and each subsidiary guarantor, including substantially all of our material |
181
Table of Contents
owned real property and equipment, fixtures, intellectual property, investment property, instruments, commercial tort claims, demands and general intangibles. |
Certain covenants and events of default
The credit agreement governing the senior secured credit facility contains a number of covenants that, among other things and subject to certain exceptions, restrict Avaya Inc.’s ability and the ability of its subsidiaries to:
| • | incur or guarantee additional debt and issue or sell certain preferred stock; |
| • | pay dividends on, redeem or repurchase its capital stock; |
| • | make certain acquisitions or investments; |
| • | incur or assume certain liens; |
| • | enter into transactions with affiliates; |
| • | merge or consolidate with another company; |
| • | transfer or otherwise dispose of assets; |
| • | redeem subordinated debt; |
| • | incur obligations that restrict the ability of its subsidiaries to make dividends or other payments to Avaya Inc.; and |
| • | create or designate unrestricted subsidiaries. |
The facility also contains certain customary affirmative covenants and events of default, including an event of default that would result from the failure to make payment beyond any applicable grace period in respect of any indebtedness having an aggregate principal amount of not less than $75 million, the failure to observe or perform any other agreement or condition relating to any such indebtedness (other than the senior secured multi-currency asset-based revolving credit facility) which results in the acceleration of, or permits the holders of such indebtedness to accelerate, the maturity of such indebtedness or the failure to observe or perform any other agreement or condition relating to the senior secured multi-currency asset-based revolving credit facility which results in the lenders thereunder accelerating the maturity of such facility.
Senior unsecured cash-pay notes and senior unsecured PIK toggle notes due 2015
Overview
As of September 30, 2011, Avaya Inc. had outstanding an aggregate principal amount of $700.0 million senior unsecured cash-pay notes due 2015 and $834.0 million senior unsecured PIK toggle notes due 2015, which were issued on October 24, 2008 in exchange for all of the outstanding loans under a bridge loan facility entered into in connection with the Merger.
Interest rate
The senior unsecured cash-pay notes were issued in the aggregate principal amount of $700.0 million and bear interest in cash at the rate of 9.75% per annum.
The senior unsecured PIK toggle notes were issued in the aggregate principal amount of $750.0 million. Cash interest on the senior unsecured PIK toggle notes accrues at the rate of 10.125% per annum. PIK interest on the senior unsecured PIK toggle notes accrues at the rate of 10.875% per annum. For any interest period through November 1, 2011, Avaya Inc. may elect to pay interest on the senior unsecured PIK toggle notes, at its option, (i) entirely in cash, (ii) entirely by increasing the principal amount of the senior unsecured PIK toggle notes or
182
Table of Contents
issuing new senior unsecured PIK toggle notes (such increase or issuance referred to as PIK interest) or (iii) by paying interest 50% in cash and 50% as PIK interest. After November 1, 2011, Avaya Inc. must make all interest payments on the senior unsecured PIK toggle notes entirely in cash. For the periods May 1, 2009 through October 31, 2009 and November 1, 2009 through April 30, 2010, Avaya Inc. elected to pay interest in kind on its senior unsecured PIK toggle notes. As a result, payment-in-kind interest of $41 million and $43 million was added, for these periods, respectively, to the principal amount of the senior unsecured PIK toggle notes effective November 1, 2009 and May 1, 2010, respectively, and will be payable when those notes become due. For the period of May 1, 2010 through October 31, 2010 and November 1, 2010 through April 30, 2011, and May 1, 2011 to October 31, 2011 the Company has elected to make such payments in cash interest.
Interest is payable semi-annually on April 15 and October 15.
Optional redemption
On and after November 1, 2011, Avaya Inc. may redeem the senior unsecured cash-pay notes and senior unsecured PIK toggle notes, in whole or in part, at a price equal to 100% of the principal amount thereof, plus the applicable premium declining ratably to par, plus accrued and unpaid interest.
Prior to November 1, 2011, Avaya Inc. may redeem the senior unsecured cash-pay notes and senior unsecured PIK toggle notes, in whole or in part, at a price equal to 100% of the principal amount thereof, plus a “make-whole” premium, plus accrued and unpaid interest.
Change of control offer
If a change of control occurs, Avaya Inc. must give holders of its senior unsecured cash-pay notes and holders of its senior unsecured PIK toggle notes an opportunity to sell their notes to Avaya Inc. at a purchase price equal to 101% of the principal amount thereof, plus accrued and unpaid interest.
Mandatory offer to purchase following certain asset sales
If Avaya Inc. or its subsidiaries engage in certain asset sales, unless they invest the cash proceeds from such sales in their business or use the proceeds to prepay secured indebtedness (including under the credit facilities) within a specified period of time, Avaya Inc. must offer to repurchase the senior unsecured cash-pay notes and the senior unsecured PIK toggle notes at 100% of the principal amount thereof, plus accrued and unpaid interest, if any, with such proceeds (if applicable, on a pro rata basis with certain pari passu indebtedness).
Final maturity
The senior unsecured cash-pay notes and the senior unsecured PIK toggle notes mature on November 1, 2015, and do not have required principal payments prior to maturity with the exception of a $15 million payment required on the senior unsecured PIK toggle notes on May 1, 2015.
Guarantees
Avaya Inc.’s domestic 100% owned subsidiaries that are borrowers or guarantors of the senior secured multi-currency asset-based revolving credit facility, the senior secured credit facility and the senior secured notes guarantee the senior unsecured cash-pay notes and the senior unsecured PIK toggle notes.
Certain covenants and events of default
The indenture governing the senior unsecured cash-pay notes and senior unsecured PIK toggle notes contains a number of covenants that, among other things and subject to certain exceptions, restrict Avaya Inc.’s ability and the ability of its subsidiaries to:
| • | incur additional debt and issue preferred stock; |
183
Table of Contents
| • | pay dividends on, redeem or repurchase capital stock; |
| • | issue capital stock of restricted subsidiaries; |
| • | make certain investments; |
| • | enter into certain types of transactions with affiliates; |
| • | create liens; and |
| • | sell certain assets or merge with or into other companies. |
The indenture governing these notes also contains certain customary affirmative covenants and events of default, including an event of default that would result from either the failure to pay at stated final maturity, or acceleration of the maturity of, a principal amount of any other indebtedness of Avaya Inc. or any of its restricted subsidiaries if the aggregate principal amount of such indebtedness, together with the principal amount of any other such indebtedness in default for failure to pay principal at final maturity or the maturity of which has been accelerated, aggregates $85 million or more at any time.
Senior secured notes due 2019
Overview
As of September 30, 2011, Avaya Inc. had outstanding an aggregate principal amount of $1,009 million senior secured notes due 2019, which were issued on February 11, 2011.
Interest rate
The senior secured notes were issued in the aggregate principal amount of $1,009 million and bear interest in cash at the rate of 7.00% per annum.
Interest is payable semi-annually on April 1 and October 1 commencing on October 1, 2011.
Optional redemption
On and after April 1, 2015, Avaya Inc. may redeem the senior secured notes, in whole or in part, at a price equal to 100% of the principal amount thereof, plus the applicable premium declining ratably to par, plus accrued and unpaid interest.
Prior to April 1, 2015, Avaya Inc. may redeem the senior secured notes, in whole or in part, at a price equal to 100% of the principal amount thereof, plus a “make-whole” premium, plus accrued and unpaid interest.
In addition, at any time until April 1, 2014, Avaya Inc. may redeem up to 35% of the aggregate principal amount of the senior secured notes at a redemption price equal to 107% of the face amount thereof plus accrued and unpaid interest, if any, to the redemption date, with the net cash proceeds raised in or more equity offerings by Avaya Inc. or Avaya Holdings Corp.; provided that the aggregate principal amount of senior secured notes that remain outstanding immediately after such redemption is equal to or greater than 50% of the aggregate principal amount of senior secured notes issued under the indenture governing the senior secured notes.
Change of control offer
If a change of control occurs, Avaya Inc. must give holders of its senior secured notes an opportunity to sell their notes to Avaya Inc. at a purchase price equal to 101% of the principal amount thereof, plus accrued and unpaid interest.
184
Table of Contents
Mandatory offer to purchase following certain asset sales
If Avaya Inc. or its subsidiaries engage in certain asset sales, unless they invest the cash proceeds from such sales in their business or use the proceeds to prepay secured indebtedness (including under the credit facilities) within a specified period of time, Avaya Inc. must offer to repurchase the senior secured notes at 100% of the principal amount thereof, plus accrued and unpaid interest, if any, with such proceeds (if applicable, on a pro rata basis with certain pari passu indebtedness).
Final maturity
The senior secured notes mature on April 1, 2019, and do not have required principal payments prior to maturity.
Guarantees and security
Avaya Inc.’s domestic 100% owned subsidiaries that are borrowers or guarantors of the senior secured multi-currency asset-based revolving credit facility, the senior secured credit facility, the senior unsecured notes and the senior unsecured PIK toggle notes guarantee the senior secured notes.
All obligations under the indenture governing the senior secured notes, and the guarantees of those obligations, are secured, subject to certain exceptions, by a first-priority lien on substantially all of the assets of Avaya Inc. and the subsidiary guarantors other than real estate and other than the ABL Priority Collateral and by a second-priority lien on the ABL Priority Collateral, subject to certain limited exceptions.
Certain covenants and events of default
The indenture governing the senior secured notes contains a number of covenants that, among other things and subject to certain exceptions, restrict Avaya Inc.’s ability and the ability of its subsidiaries to:
| • | incur additional debt and issue preferred stock; |
| • | pay dividends on, redeem or repurchase capital stock; |
| • | issue capital stock of restricted subsidiaries; |
| • | make certain investments; |
| • | enter into certain types of transactions with affiliates; |
| • | create liens; and |
| • | sell certain assets or merge with or into other companies. |
The indenture governing the senior secured notes also contains certain customary affirmative covenants and events of default, including an event of default that would result from either the failure to pay at stated final maturity, or acceleration of the maturity of, a principal amount of any other indebtedness of Avaya Inc. or any of its restricted subsidiaries if the aggregate principal amount of such indebtedness, together with the principal amount of any other such indebtedness in default for failure to pay principal at final maturity or the maturity of which has been accelerated, aggregates $85 million or more at any time.
185
Table of Contents
The following is a description of the material terms of our certificate of incorporation and bylaws as each is anticipated to be in effect upon the consummation of this offering.
General
Upon the consummation of this offering, the total amount of our authorized capital stock will consist of shares of common stock, par value $0.001 per share and shares of preferred stock, par value $0.001 per share. As of December 12, 2011, we had 487,404,453 shares of common stock outstanding, held by 99 holders and 125,000 shares of Series A Preferred Stock outstanding, held by 33 holders.
Immediately following the consummation of this offering, and giving effect to the application of the net proceeds from this offering as described in “Use of Proceeds” above, we expect to have issued and outstanding shares of common stock ( common stock if the underwriters’ over-allotment option is exercised in full) and no Series A Preferred Stock outstanding. Immediately outstanding following the closing of this offer, we also expect to have:
| • | outstanding vested and unvested options to acquire common stock and options available for grant under our 2007 Plan to acquire common stock; |
| • | outstanding RSUs issued under the 2007 Plan, each representing the right to receive one share of common stock, subject to certain restrictions on their transfer and sale as provided for in the 2007 Plan and the related award agreements; and |
| • | outstanding warrants to acquire a total of 100,000,000 shares of common stock (see “—Warrants”). |
Common Stock
Holders of our common stock are entitled to one vote for each share held on all matters submitted to a vote of stockholders and do not have cumulative voting rights. An election of directors by our stockholders shall be determined by a plurality of the votes cast by the stockholders entitled to vote on the election. Holders of common stock are entitled to receive proportionately any dividends as may be declared by our board of directors, subject to any preferential dividend rights of any series of preferred stock that is outstanding at the time of the dividend.
In the event of our liquidation or dissolution, the holders of common stock are entitled to receive proportionately our net assets available for distribution to stockholders after payment of all debts and other liabilities and subject to the prior rights of any outstanding preferred stock.
All shares of common stock will, when issued, be duly authorized, fully paid and nonassessable. The rights, preferences and privileges of holders of common stock are subject to the rights of the holders of shares of any series of preferred stock that we may designate and issue in the future.
Warrants
In connection with the financing of the acquisition of NES, on December 18, 2009, we issued warrants to purchase 100,000,000 shares of our common stock. The warrants have a cashless exercise feature. The warrants contain customary adjustment provisions for stock splits, capital reorganizations and certain other distributions. The warrants have an exercise price of $3.25 per share and are exercisable at any time prior to December 18, 2019.
Options and Restricted Stock Units
As of December 12, 2011, we had outstanding options to acquire 43,655,212 shares of common stock which are held by our employees, directors and advisors, with exercise prices ranging from $3.00 to $5.00 per share and
186
Table of Contents
a weighted average exercise price of $3.17 per share. As of December 12, 2011, we also had 2,356,363 outstanding RSUs issued under the 2007 Plan. Each RSU represents the right to receive one share of common stock, subject to certain restrictions on their transfer and sale as provided for in the 2007 Plan and the related award agreements. In addition, as of December 12, 2011, we had outstanding Continuation Options to acquire 429,761 shares of common stock which are held by employees, with an exercise price of $1.25 per share, and Continuation Units to acquire 972,341 shares of common stock which are held by current and former employees.
Preferred Stock
Our board of directors is authorized to issue shares of preferred stock in one or more series, with such designations, preferences and relative participating, optional or other special rights, qualifications, limitations or restrictions as determined by our board of directors, without any further vote or action by our stockholders. We believe that the board of directors’ authority to set the terms of, and our ability to issue, preferred stock will provide flexibility in connection with possible financing transactions in the future. The issuance of preferred stock, however, could adversely affect the voting power of holders of common stock and the likelihood that such holders will receive dividend payments and payments upon a liquidation, dissolution or winding up of us.
Our board of directors has designated 125,000 shares of preferred stock as Series A Preferred Stock. As of December 12, 2011 we had 125,000 shares of Series A Preferred Stock issued and outstanding. The certificate of designations for the Series A Preferred Stock grants holders of our Series A Preferred Stock the right to receive, as when and if declared by our board of directors and in preference to the holders of any and all other series or classes of capital stock, payable either in cash or, at our option, by issuance of additional shares of Series A Preferred Stock, cumulative annual dividends at a rate of 5% per annum on $1,000 per share (which value is to be proportionately adjusted to reflect any stock dividend, stock split, combination of shares, reclassification, reorganization, recapitalization or other similar event affecting the Series A Preferred Stock), compounded quarterly from and after the date of issuance of such shares of Series A Preferred Stock. Except as required by Delaware law or as otherwise provided by our certificate of incorporation, the holders of Series A Preferred Stock have no right to vote their shares at any stockholders’ meeting or provide consent to any action taken by stockholders in writing in lieu of a meeting.
In the event of certain events including our liquidation, dissolution or winding up, either voluntarily or involuntarily, a sale of all or substantially all of our assets, or our merger or consolidation, the holders of the Series A Preferred Stock are entitled to receive, in cash, prior and in preference to any other distribution of any of our assets to the holders of all series and classes of our stock, an amount per share equal to the sum of $1,000 (as adjusted to reflect any stock dividend, stock split, combination of shares, reclassification, reorganization, recapitalization or other similar event affecting the Series A Preferred Stock) plus the amount of accrued unpaid dividends for any prior dividend periods on such share, if any (such sum being referred to as the Series A Preferential Amount). We may at any time redeem, in cash, to the extent of lawfully available funds therefor, any or all Series A Preferred Shares at a price per share equal to the Series A Preferential Amount allocable to each share of Series A Preferred Stock.
As disclosed under “Use of Proceeds” above, we intend to use a portion of the net proceeds from this offering to redeem all outstanding shares of Series A Preferred Stock.
Anti-takeover Effects of the Delaware General Corporation Law and Our Certificate of Incorporation and Bylaws
Our certificate of incorporation and our bylaws contain provisions that may delay, defer or discourage another party from acquiring control of us, some of which may only become effective when the Sponsors collectively cease to beneficially own at least 40% or more of our outstanding common stock (such time referred to in this section as the “triggering event”). We expect that these provisions, which are summarized below, will discourage coercive takeover practices or inadequate takeover bids. These provisions are also designed to
187
Table of Contents
encourage persons seeking to acquire control of us to negotiate first with the board of directors, which we believe may result in an improvement of the terms of any such acquisition in favor of our stockholders. However, they may also discourage acquisitions that some stockholders may favor. This offering will not constitute a triggering event.
Board of Directors
Immediately following this offering, the board of directors will consist of nine members, though it is the Company’s intention that another independent director will be added to the board of directors within one year of completion of this offering. Our certificate of incorporation provides that the board of directors will not have more than fifteen members. See “Certain Relationships and Related Party Transactions—Arrangements with Our Sponsors.”
Potential Staggered Board
Our current board is, and upon completion of this offering will be, comprised of a single class of directors. Our certificate of incorporation provides that at the first annual meeting after the triggering event, the Board shall be divided into three classes with staggered three-year terms. The classification of our Board could make it more difficult for a third party to acquire, or discourage a third party from seeking to acquire, control of our company.
Action by Written Consent
The Delaware General Corporation Law, or the DGCL, provides that, unless otherwise stated in a corporation’s certificate of incorporation, the stockholders may act by written consent without a meeting. Our certificate of incorporation and bylaws provide that, following the triggering event, any action required or permitted to be taken by our stockholders at an annual meeting or special meeting of the stockholders may only be taken if it is properly brought before such meeting, and not by written consent without a meeting. Prior to the triggering event, stockholders may act by written consent without a meeting.
Special Meeting of Stockholders and Advance Notice Requirements for Stockholder Proposals
Our certificate of incorporation and bylaws provide that, except as otherwise required by law, special meetings of the stockholders can only be called by (a) our chairman or, if one is appointed, vice chairman of the Board, (b) our president, (c) a majority of the board of directors through a special resolution or (d) prior to the triggering event, a Sponsor-nominated director.
In addition, following the first annual meeting of stockholders that occurs at least 90 days after the triggering event described above, our bylaws will require advance notice procedures for stockholder proposals to be brought before an annual meeting of the stockholders, including the nomination of directors. Stockholders at an annual meeting may only consider the proposals specified in the notice of meeting or brought before the meeting by or at the direction of the board of directors, or by a stockholder of record on the record date for the meeting, who is entitled to vote at the meeting and who has delivered a timely written notice in proper form to our secretary, of the stockholder’s intention to bring such business before the meeting.
These provisions could have the effect of delaying until the next stockholder meeting any stockholder actions that are favored by the holders of a majority of our outstanding voting securities.
Requirements for Removal and Interim Election of Directors
Our certificate of incorporation and bylaws provide that, prior to the triggering event, directors may be removed, with or without cause, by the holders of a majority of the shares entitled to vote on the election of directors, voting together as a single class.
188
Table of Contents
Following the triggering event, our certificate of incorporation and bylaws provide that the directors may only be removed for cause and only by the affirmative vote of the holders of at least two-thirds of the voting power of our outstanding capital stock entitled to vote generally in the election of directors, voting together as a single class.
Vacancies and newly created directorships may be filled only by a vote of a majority of the directors then in office, even though less than a quorum, and not by the stockholders, except that, prior to a triggering event, such vacancies may be filled by a vote of holders of a majority of the outstanding common stock. In addition, the certificate of incorporation provides that any vacancy created by the removal of a director by the stockholders shall only be filled by, in addition to any other vote otherwise required by law, the affirmative vote of a majority of the outstanding common stock. Our bylaws allow the presiding officer at a meeting of the stockholders to adopt rules and regulations for the conduct of meetings, which may have the effect of precluding the conduct of certain business at a meeting if the rules and regulations are not followed.
These provisions may have the effect of deferring, delaying or discouraging hostile takeovers, or changes in control or management of our company.
Amendment to Certificate of Incorporation and Bylaws
The DGCL provides generally that the affirmative vote of a majority of the shares entitled to vote on any matter is required to amend a corporation’s certificate of incorporation or bylaws, unless a corporation’s certificate of incorporation or bylaws, as the case may be, requires a greater percentage. Prior to the triggering event, our bylaws may be amended by a majority vote of our board of directors or the affirmative vote of the holders of a majority of the outstanding common stock. Following the triggering event, our bylaws may be amended or repealed by a majority vote of our board of directors or, in addition to any other vote otherwise required by law, the affirmative vote of the holders of at least two-thirds of the voting power of our outstanding shares of common stock. Additionally, prior to the triggering event, our certificate of incorporation may be amended by the affirmative vote of the holders of a majority of the outstanding common stock. Following the triggering event, the affirmative vote of at least two-thirds of the voting power of the outstanding shares of capital stock entitled to vote on the adoption, alteration, amendment or repeal of our certificate of incorporation, voting as a single class, is required to amend or repeal or to adopt any provision inconsistent with the “Board of Directors,” “No Action by Written Consent,” “Special Meetings of Stockholders,” “Amendments to the Amended and Restated Certificate of Incorporation and Bylaws” and “Business Combinations” provisions described in our certificate of incorporation. These provisions may have the effect of deferring, delaying or discouraging the removal of any anti-takeover defenses provided for in our certificate of incorporation and our bylaws.
Exclusive Jurisdiction of Certain Actions
Our certificate of incorporation requires, to the fullest extent permitted by law, that derivative actions brought in the name of the company, actions against directors, officers and employees for breach of fiduciary duty and other similar actions may be brought only in the Court of Chancery in the State of Delaware. Although we believe this provision benefits the Company by providing increased consistency in the application of Delaware law in the types of lawsuits to which it applies, the provision may have the effect of discouraging lawsuits against our directors and officers.
Authorized but Unissued Shares
The authorized but unissued shares of common stock and preferred stock are available for future issuance without stockholder approval, subject to any limitations imposed by the listing standards of the New York Stock Exchange. These additional shares may be used for a variety of corporate finance transactions, acquisitions and employee benefit plans. The existence of authorized but unissued common stock and preferred stock could make more difficult or discourage an attempt to obtain control of us by means of a proxy contest, tender offer, merger or otherwise.
189
Table of Contents
Business Combinations
We have elected to not be subject to Section 203 of the DGCL, which regulates business combinations with “interested stockholders,” until such time as neither Sponsor is an “interested stockholder” under the DGCL.
Corporate Opportunities
Our certificate of incorporation will provide that none of our Sponsors or non-employee directors, or any of their respective affiliates, partners, principals, directors, officers, members, managers or employees, shall have any fiduciary duty to refrain from engaging directly or indirectly in the same or similar business activities or lines of business as we do or offer us business opportunities of which they become aware. The affirmative vote of eighty percent (80%) of the voting power of the outstanding shares of capital stock entitled to vote on the adoption, alteration, amendment or repeal of amendments to our certificate of incorporation, voting together as a single class, shall be required to alter, amend or repeal, or to adopt any provision inconsistent with that provision.
Transfer Agent and Registrar
The transfer agent and registrar for our common stock is .
Listing
We have applied to list our shares of common stock on the New York Stock Exchange under the symbol “AVYA.”
190
Table of Contents
SHARES ELIGIBLE FOR FUTURE SALE
Before this offering, there has not been a public market for our common stock. As described below, only a limited number of shares currently outstanding will be available for sale immediately after this offering due to contractual and legal restrictions on resale. Nevertheless, future sales of substantial amounts of our common stock, including shares issued upon exercise of outstanding options and warrants, in the public market after the restrictions lapse, or the possibility of such sales, could cause the prevailing market price of our common stock to fall or impair our ability to raise equity capital in the future.
Upon the consummation of this offering, we will have outstanding an aggregate of approximately shares of common stock. In addition, as of the closing of this offering, (a) options to purchase an aggregate of approximately shares of our common stock will be outstanding, (b) restricted stock units, each representing the right to receive one share of common stock will be outstanding and (c) warrants to acquire 100,000,000 shares of our common stock will be outstanding. Of the outstanding shares, the shares sold in this offering will be freely tradable in the public market without restriction or further registration under the Securities Act, unless these shares are held by our affiliates, as that term is defined in Rule 144 under the Securities Act. Shares purchased by our affiliates may not be resold except pursuant to an effective registration statement or an exemption from registration.
The remaining shares of our common stock will be “restricted securities,” as that term is defined in Rule 144 under the Securities Act. These restricted securities may be sold in the public market only pursuant to an effective registration statement or an exemption from registration under Rule 144 and Rule 701 under the Securities Act. These rules are summarized below. Subject to our stockholders’ agreement and the lock-up agreements described below and the provisions of Rule 144 and Rule 701, these restricted securities will be available for sale in the public market as follows:
Number of Shares | Date of Availability for Sale | |
| Various times after the date of this prospectus pursuant to Rule 144 | ||
| Various times beginning 180 days after the date of this prospectus |
Lock-Up Arrangements
We and our officers, directors, employees and certain stockholders, including the Sponsors, who together hold an aggregate of shares of our common stock after the consummation of this offering, have agreed, subject to limited exceptions, not to directly or indirectly sell or dispose of any shares of common stock or any securities convertible into or exchangeable or exercisable for shares of common stock for a period of 180 days after the date of this prospectus, unless extended pursuant to its terms, without the prior written consent of Morgan Stanley & Co. LLC, Goldman, Sachs & Co. and J.P. Morgan Securities LLC. For additional information, see “Underwriters.”
Rule 144
In general, under Rule 144, immediately upon the completion of this offering, a person who is not our affiliate and has not been our affiliate at any time during the preceding three months will be entitled to sell any shares of our common stock that such person has held for at least six months, including the holding period of any prior owner other than one of our affiliates, without regard to volume limitations. Sales of our common stock by any such person would be subject to the availability of current public information about us if the shares to be sold were held by such person for less than one year.
191
Table of Contents
Our affiliates who have beneficially owned shares of our common stock for at least six months, including the holding period of any prior owner other than another of our affiliates, would be entitled to sell within any three-month period those shares and any other shares they have acquired that are not restricted securities, provided that the aggregate number of shares sold does not exceed the greater of:
| • | 1% of the number of shares of our common stock then outstanding, which will equal approximately shares immediately after this offering, and |
| • | the average weekly trading volume in our common stock on during the four calendar weeks preceding the date of filing of a Notice of Proposed Sale of Securities Pursuant to Rule 144 with respect to the sale. |
Sales under Rule 144 by our affiliates are also subject to manner of sale provisions and notice requirements and to the availability of current public information about us.
Rule 701
In general, under Rule 701, any of an issuer’s employees, directors, officers, consultants or advisors who purchases shares from the issuer in connection with a compensatory stock or option plan or other written agreement before the effective date of a registration statement under the Securities Act is entitled to sell such shares 90 days after such effective date in reliance on Rule 144. An affiliate of the issuer can resell shares in reliance on Rule 144 without having to comply with the holding period requirement, and non-affiliates of the issuer can resell shares in reliance on Rule 144 without having to comply with the current public information and holding period requirements.
The SEC has indicated that Rule 701 will apply to typical stock options granted by an issuer before it becomes subject to the reporting requirements of the Exchange Act, along with the shares acquired upon exercise of such options, including exercises after an issuer becomes subject to the reporting requirements of the Exchange Act.
Stock Plans
We intend to file a registration statement on Form S-8 under the Securities Act covering shares of our common stock issuable upon exercise of outstanding options under the 2007 Plan and for future equity incentive plans to be effective upon consummation of this offering. Resale of these shares will be subject to any applicable contractual lock-up periods.
Registration Rights
Subject to the lock-up agreements described above, certain holders of our common stock may demand that we register their shares under the Securities Act or, if we file another registration statement under the Securities Act other than a Form S-8 covering securities issuable under our equity plans or on Form S-4, may elect to include their shares of common stock in such registration. Shares sold pursuant to any such registration statement will be freely tradable without restriction under the Securities Act, unless held by our affiliates.
192
Table of Contents
CERTAIN MATERIAL U.S. FEDERAL TAX CONSIDERATIONS FOR NON-U.S. HOLDERS OF COMMON STOCK
The following is a summary of certain material U.S. federal income and estate tax considerations relating to the purchase, ownership and disposition of our common stock by Non-U.S. Holders (defined below). This summary does not purport to be a complete analysis of all the potential tax considerations relevant to Non-U.S. Holders of our common stock. This summary is based upon the Internal Revenue Code, as amended, the Treasury regulations promulgated or proposed thereunder and administrative and judicial interpretations thereof, all as of the date hereof and all of which are subject to change at any time, possibly on a retroactive basis.
This summary deals only with shares of our common stock that are purchased in this offering and held as “capital assets” within the meaning of Section 1221 of the Code. This summary does not purport to deal with all aspects of U.S. federal income and estate taxation that might be relevant to particular Non-U.S. Holders in light of their particular investment circumstances or status, nor does it address specific tax considerations that may be relevant to particular persons (including, for example, financial institutions, broker-dealers, insurance companies, partnerships or other pass-through entities, certain U.S. expatriates, tax-exempt organizations, pension plans, “controlled foreign corporations,” “passive foreign investment companies,” corporations that accumulate earnings to avoid U.S. federal income tax, persons in special situations, such as those who have elected to mark securities to market or those who hold common stock as part of a straddle, hedge, conversion transaction, synthetic security or other integrated investment, or holders subject to the alternative minimum tax). In addition, this summary does not address considerations under the tax laws of any state, local or non-U.S. jurisdiction.
For purposes of this summary, a “Non-U.S. Holder” means a beneficial owner of common stock that for U.S. federal income tax purposes is not:
| • | an individual who is a citizen or resident of the United States; |
| • | a corporation or any other organization taxable as a corporation for U.S. federal income tax purposes, created or organized in or under the laws of the United States, any state thereof or the District of Columbia; |
| • | an estate, the income of which is included in gross income for U.S. federal income tax purposes regardless of its source; or |
| • | a trust if (1) a U.S. court is able to exercise primary supervision over the trust’s administration and one or more U.S. persons have the authority to control all of the trust’s substantial decisions or (2) the trust has a valid election in effect under applicable U.S. Treasury Regulations to be treated as a U.S. person. |
If an entity that is classified as a partnership for U.S. federal income tax purposes holds our common stock, the tax treatment of its partners will generally depend upon the status of the partner and the activities of the partnership. Partnerships and other entities that are classified as partnerships for U.S. federal income tax purposes and persons holding our common stock through a partnership or other entity classified as a partnership for U.S. federal income tax purposes are urged to consult their own tax advisors.
There can be no assurance that the IRS will not challenge one or more of the tax consequences described herein, and we have not obtained, nor do we intend to obtain, an opinion of counsel with respect to the U.S. federal income or estate tax consequences to a Non-U.S. Holder of the purchase, ownership or disposition of our common stock.
THIS SUMMARY IS NOT INTENDED TO BE TAX ADVICE. NON-U.S. HOLDERS ARE URGED TO CONSULT THEIR TAX ADVISORS CONCERNING THE U.S. FEDERAL INCOME AND ESTATE TAXATION, STATE, LOCAL AND NON-U.S. TAXATION AND OTHER TAX CONSEQUENCES TO THEM OF THE PURCHASE, OWNERSHIP AND DISPOSITION OF OUR COMMON STOCK, AS WELL AS THE APPLICATION OF STATE, LOCAL AND NON-U.S. INCOME AND OTHER TAX LAWS.
193
Table of Contents
Distributions on Our Common Stock
As discussed under “Dividend Policy” above, we do not currently expect to pay dividends. In the event that we do make a distribution of cash or property with respect to our common stock, any such distributions generally will constitute dividends for U.S. federal income tax purposes to the extent of our current or accumulated earnings and profits, as determined under U.S. federal income tax principles. If a distribution exceeds our current and accumulated earnings and profits, the excess will be treated as a tax-free return of the Non-U.S. Holder’s investment, up to such holder’s tax basis in the common stock. Any remaining excess will be treated as capital gain, subject to the tax treatment described below in “Gain on Sale, Exchange or Other Taxable Disposition of Our Common Stock.”
Dividends paid to a Non-U.S. Holder generally will be subject to a 30% U.S. federal withholding tax unless such Non-U.S. Holder provides us or our agent, as the case may be, with the appropriate IRS Form W-8, such as:
| • | IRS Form W-8BEN (or successor form) claiming, under penalties of perjury, a reduction in withholding under an applicable income tax treaty; or |
| • | IRS Form W-8ECI (or successor form) stating that a dividend paid on common stock is not subject to withholding tax because it is effectively connected with a trade or business in the United States of the Non-U.S. Holder (in which case such dividend generally will be subject to regular graduated U.S. tax rates as described below). |
The certification requirement described above also may require a Non-U.S. Holder that provides an IRS form or that claims treaty benefits to provide its U.S. taxpayer identification number.
Each Non-U.S. Holder is urged to consult its own tax advisor about the specific methods for satisfying these requirements. A claim for exemption will not be valid if the person receiving the applicable form has actual knowledge or reason to know that the statements on the form are false.
If dividends are effectively connected with a trade or business in the United States of the Non-U.S. Holder (and, if required by an applicable income tax treaty, attributable to a U.S. permanent establishment), the Non-U.S. Holder, although exempt from the withholding tax described above (provided that the certifications described above are satisfied), will be subject to U.S. federal income tax on such dividends on a net income basis in the same manner as if it were a U.S. person. In addition, if such Non-U.S. Holder is a non-U.S. corporation and dividends are effectively connected with its trade or business in the United States (and, if required by an applicable income tax treaty, attributable to a U.S. permanent establishment), such Non-U.S. Holder may be subject to an additional “branch profits tax” equal to 30% (unless reduced by an applicable income treaty) in respect of such effectively-connected income.
If a Non-U.S. Holder is eligible for a reduced rate of U.S. federal withholding tax pursuant to an income tax treaty, such holder may obtain a refund or credit of any excess amount withheld by timely filing an appropriate claim for refund with the IRS.
Gain on Sale, Exchange or Other Taxable Disposition of Our Common Stock
Subject to the discussion below under the Section titled “Recently Enacted Legislation Affecting Taxation of Our Common Stock Held By or Through Foreign Entities,” in general, a Non-U.S. holder will not be subject to U.S. federal income tax or withholding tax on gain realized upon such holder’s sale, exchange or other taxable disposition of shares of our common stock unless (i) such Non-U.S. Holder is an individual who is present in the United States for 183 days or more in the taxable year of disposition, and certain other conditions are met, (ii) we are or have been a “United States real property holding corporation,” or a USRPHC as defined in the Code, at any time within the shorter of the five-year period preceding the disposition and the Non-U.S. Holder’s holding period the share our common stock, or (iii) such gain is effectively connected with the conduct by such Non-U.S. Holder of a trade or business in the United States (and, if required by an applicable income tax treaty, is attributable to a permanent establishment maintained by such Non-U.S. Holder).
194
Table of Contents
If the first exception applies, the Non-U.S. Holder generally will be subject to U.S. federal income tax at a rate of 30% (or at a reduced rate under an applicable income tax treaty) on the amount by which such Non-U.S. Holder’s capital gains allocable to U.S. sources exceed capital losses allocable to U.S. sources during the taxable year of the disposition. If the third exception applies, the Non-U.S. Holder generally will be subject to U.S. federal income tax with respect to such gain in the same manner as a U.S. holder, unless otherwise provided in an applicable income tax treaty, and a Non-U.S. Holder that is a corporation for U.S. federal income tax purposes may also be subject to a branch profits tax with respect to such gain at a rate of 30% (or at a reduced rate under an applicable income tax treaty).
For purposes of the second exception, a corporation generally is a U.S. real property holding corporation only if the fair market value of its U.S. real property interests (as defined in the Code) equals or exceeds 50% of the sum of the fair market value of its worldwide real property interests plus its other assets used or held for use in a trade or business. Although there can be no assurance, we believe that we are not, and do not anticipate becoming, a USRPHC. However, because the determination of whether we are a USRPHC depends on the fair market value of our U.S. real property relative to the fair market value of other business assets, there can be no assurance that we will not become a USRPHC in the future. Even if we become a USRPHC, a Non-U.S. Holder would not be subject to U.S. federal income tax on a sale, exchange or other taxable disposition of our common stock so long as our common stock continues to be regularly traded on an established securities market and such Non-U.S. Holder does not own and is not deemed to own (directly, indirectly or constructively) more than 5% of our common stock at any time during the shorter of the five-year period ending on the date of disposition and the holder’s holding period.
Recently Enacted Legislation Affecting Taxation of Our Common Stock Held By or Through Foreign Entities
Under recently enacted legislation, the relevant withholding agent may be required to withhold 30% of any dividends and the proceeds of a sale of our common stock paid after December 31, 2012 to (i) a foreign financial institution (whether holding stock for its own account or on behalf of its account holders/investors) unless such foreign financial institution agrees to verify, report and disclose its U.S. account holders and meets certain other specified requirements or (ii) a non-financial foreign entity that is the beneficial owner of the payment unless such entity certifies that it does not have any substantial U.S. owners or provides the name, address and taxpayer identification number of each substantial U.S owner and such entity meets certain other specified requirements. The scope of these requirements remains unclear and potentially subject to material changes resulting from any future guidance. Non-U.S. Holders should consult their own tax advisors regarding the effect of this newly enacted legislation.
Backup Withholding and Information Reporting
Subject to the discussion in the preceding paragraph, we must report annually to the IRS and to each Non-U.S. Holder the gross amount of the distributions on our common stock paid to such holder and the tax withheld, if any, with respect to such distributions. Non-U.S. holders may have to comply with specific certification procedures to establish that the holder is not a U.S. person (as defined in the Code) in order to avoid backup withholding at the applicable rate, currently 28% and scheduled to increase to 31% in 2013, with respect to dividends on our common stock. Dividends paid to Non-U.S. Holders subject to the U.S. withholding tax, as described above in “Distributions on Our Common Stock,” generally will be exempt from U.S. backup withholding.
Information reporting and backup withholding will generally apply to the proceeds of a disposition of our common stock by a Non-U.S. Holder effected by or through the U.S. office of any broker, U.S. or foreign, unless the holder certifies its status as a Non-U.S. Holder and satisfies certain other requirements, or otherwise establishes an exemption. Generally, information reporting and backup withholding will not apply to a payment of disposition proceeds to a Non-U.S. Holder where the transaction is effected outside the United States through
195
Table of Contents
a non-U.S. office of a broker. However, for information reporting purposes, dispositions effected through a non-U.S. office of a broker with substantial U.S. ownership or operations generally will be treated in a manner similar to dispositions effected through a U.S. office of a broker. Non-U.S. holders should consult their own tax advisors regarding the application of the information reporting and backup withholding rules to them.
Copies of information returns may be made available to the tax authorities of the country in which the Non-U.S. Holder resides or is incorporated under the provisions of a specific treaty or agreement.
Backup withholding is not an additional tax. Any amounts withheld under the backup withholding rules from a payment to a Non-U.S. Holder can be refunded or credited against the Non-U.S. Holder’s U.S. federal income tax liability, if any, provided that an appropriate claim is timely filed with the IRS.
Federal Estate Tax
Common stock held by an individual who is not a citizen or resident of the United States at the time of death for U.S. federal estate tax purposes, and common stock held by certain entities the property of which is includible in such an individual’s gross estate for U.S. federal estate tax purposes, will be included in such an individual’s gross estate for U.S. federal estate tax purposes, unless an applicable estate tax treaty provides otherwise. Under current law, the taxable estate of a decedent dying in 2011 or 2012 is subject to U.S. federal estate tax at a maximum rate of 35%. The taxable estate of a decedent dying after 2012 will be subject to U.S. federal estate tax at a maximum rate of 55%, but before the end of 2012 Congress may pass legislation amending the U.S. federal estate tax rates or other aspects of the U.S. federal estate tax applicable to estates of decedents dying after 2012.
196
Table of Contents
Under the terms and subject to the conditions contained in an underwriting agreement dated the date of this prospectus, Morgan Stanley & Co. LLC, Goldman, Sachs & Co. and J.P. Morgan Securities LLC are acting as the representatives and joint book-running managers. Citigroup Global Markets Inc., Deutsche Bank Securities Inc., Merrill Lynch, Pierce, Fenner & Smith Incorporated, Barclays Capital Inc., UBS Securities LLC and Credit Suisse Securities (USA) LLC are also acting as joint book-running managers for the offering. The underwriters have severally agreed to purchase, and we have agreed to sell to them, severally the number of shares indicated below:
Name | Number of Shares | |||
Morgan Stanley & Co. LLC | $ | |||
Goldman, Sachs & Co. | ||||
J.P. Morgan Securities LLC | ||||
Citigroup Global Markets Inc. | ||||
Deutsche Bank Securities Inc. | ||||
Merrill Lynch, Pierce, Fenner & Smith | ||||
Barclays Capital Inc. | ||||
UBS Securities LLC | ||||
Credit Suisse Securities (USA) LLC | ||||
|
| |||
Total | $ | |||
The underwriters and the representatives are collectively referred to as the “underwriters” and the “representatives,” respectively. The underwriters are offering the shares of common stock subject to their acceptance of the shares from us and subject to prior sale. The underwriting agreement provides that the obligations of the several underwriters to pay for and accept delivery of the shares of common stock offered by this prospectus are subject to the approval of certain legal matters by their counsel and to certain other conditions. The underwriters are obligated to take and pay for all of the shares of common stock offered by this prospectus if any such shares are taken. However, the underwriters are not required to take or pay for the shares covered by the underwriters’ over-allotment option described below. The offering of the shares by the underwriters is subject to receipt and acceptance and subject to the underwriters’ right to reject any order in whole or in part.
The underwriters initially propose to offer part of the shares of common stock directly to the public at the public offering price listed on the cover page of this prospectus and part to certain dealers at a price that represents a concession not in excess of $ a share under the public offering price. After the initial offering of the shares of common stock, the offering price and other selling terms may from time to time be varied by the representatives, including in connection with sales of unsold allotments of common stock or subsequent sales of common stock purchased by the representatives in stabilizing and related transactions.
We granted to the underwriters an option, exercisable for 30 days from the date of this prospectus, to purchase up to additional shares of our common stock at the public offering price listed on the cover page of this prospectus, less underwriting discounts and commissions. To the extent the option is exercised, each underwriter will become obligated, subject to certain conditions, to purchase about the same percentage of the additional shares of common stock as the number listed next to the underwriter’s name in the preceding table bears to the total number of shares of common stock listed next to the names of all underwriters in the preceding table.
197
Table of Contents
The following table shows the per share and total public offering price, underwriting discounts and commissions and proceeds before expenses to us. These amounts are shown assuming both no exercise and full exercise of the underwriters’ option to purchase up to additional shares of our common stock.
| Total | ||||||||||||
| Per Share | No Exercise | Full Exercise | ||||||||||
Public offering price | $ | $ | $ | |||||||||
Underwriting discounts and commissions | $ | $ | $ | |||||||||
Proceeds, before expenses, to us | $ | $ | $ | |||||||||
The estimated offering expenses payable by us, are approximately $ million, which includes legal, accounting and printing costs and various other fees associated with the registration of the common stock to be sold pursuant to this prospectus.
The underwriters have informed us that they do not intend sales to discretionary accounts to exceed 5% of the total number of shares of common stock offered by them.
We have applied to list our common stock on the New York Stock Exchange under the symbol “AVYA.”
We and all of our directors and officers have agreed that, without the prior written consent of Morgan Stanley & Co. LLC, Goldman, Sachs & Co. and J.P. Morgan Securities LLC on behalf of the underwriters, we and they will not, during the period ending 180 days after the date of this prospectus:
| • | offer, pledge, sell, contract to sell, sell any option or contract to purchase, purchase any option or contract to sell, grant any option, right or warrant to purchase, lend or otherwise transfer or dispose of, directly or indirectly, any shares of common stock or any securities convertible into or exercisable or exchangeable for shares of common stock; or |
| • | enter into any swap or other arrangement that transfers to another, in whole or in part, any of the economic consequences of ownership of the common stock. |
| • | in our case, file any registration statement with the SEC relating to the offering of any shares of common stock or any securities convertible into or exercisable or exchangeable for common stock; |
whether any such transaction described in the first two bullet points above is to be settled by delivery of common stock or such other securities, in cash or otherwise. In addition, we and each such person agrees that, without the prior written consent of Morgan Stanley & Co. LLC, Goldman, Sachs & Co. and J.P. Morgan Securities LLC, on behalf of the underwriters, it will not, during the period ending 180 days after the date of this prospectus, make any demand for, or exercise any right with respect to, the registration of any shares of common stock or any security convertible into or exercisable or exchangeable for common stock.
The restrictions described in the immediately preceding paragraph do not apply to:
| • | the sale of shares to the underwriters; |
| • | transactions by persons other than us relating to shares of our common stock or other securities acquired in open market transactions after the completion of the offering of the shares,provided that no filing under Section 16(a) of the Exchange Act shall be required or shall be voluntarily made in connection with subsequent sales of our common stock or other securities acquired in such open market transactions; |
| • | transfers by any person other than us of shares of our common stock or any security convertible into our common stock as abona fide gift,provided that each donee shall enter into a written agreement accepting the restrictions set forth herein and no filing under Section 16(a) of the Exchange Act, |
198
Table of Contents
reporting a reduction in beneficial ownership of shares of our common stock, shall be required or shall be voluntarily made during the restricted period; |
| • | distributions by any persons other than us of shares of common stock or any security convertible into our common stock to partners, members, stockholders, affiliates or any entity which is directly or indirectly controlled by, or is under common control with, such person,provided that each distributee shall enter into a written agreement accepting the restrictions set forth herein and no filing under Section 16(a) of the Exchange Act, reporting a reduction in beneficial ownership of shares of our common stock, shall be required or shall be voluntarily made during the restricted period; or |
| • | the establishment of a trading plan pursuant to Rule 10b5-1 under the Exchange Act for the transfer of shares of our common stock,provided that such plan does not provide for the transfer of our common stock during the restricted period and no public announcement or filing under the Exchange Act regarding the establishment of such plan shall be required of or voluntarily made by or on behalf of such person or us. |
The 180-day restricted period described in the preceding paragraphs will be extended if:
| • | during the last 17 days of the 180-day restricted period, we issue an earnings release or material news or a material event relating to us occurs; or |
| • | prior to the expiration of the 180-day restricted period, we announce that we will release earnings results during the 16-day period beginning on the last day of the 180-day period; |
in which case the restrictions described in the preceding paragraphs will continue to apply until the expiration of the 18-day period beginning on the issuance of the earnings release or the occurrence of the material news or material event.
In order to facilitate this offering of the common stock, the underwriters may engage in transactions that stabilize, maintain or otherwise affect the price of the common stock. Specifically, the underwriters may sell more shares than they are obligated to purchase under the underwriting agreement, creating a short position. A short sale is covered if the short position is no greater than the number of shares available for purchase by the underwriters under the over-allotment option. The underwriters can close out a covered short sale by exercising the over-allotment option or purchasing shares in the open market. In determining the source of shares to close out a covered short sale, the underwriters will consider, among other things, the open market price of shares compared to the price available under the over-allotment option. The underwriters may also sell shares in excess of the over-allotment option, creating a naked short position. The underwriters must close out any naked short position by purchasing shares in the open market. A naked short position is more likely to be created if the underwriters are concerned that there may be downward pressure on the price of the common stock in the open market after pricing that could adversely affect investors who purchase in this offering. In addition, to stabilize the price of common stock, the underwriters may bid for, and purchase, shares of common stock in the open market. Finally, the underwriting syndicate may reclaim selling concessions allowed to an underwriter or a dealer for distributing the common stock in this offering, if the syndicate repurchases previously distributed common stock to cover syndicate short positions or to stabilize the price of the common stock. These activities may raise or maintain the market price of the common stock above independent market levels or prevent or retard a decline in the market price of the common stock. The underwriters are not required to engage in these activities and may end any of these activities at any time.
The underwriters may also impose a penalty bid. This occurs when a particular underwriter repays to the underwriters a portion of the underwriting discount received by it because the representatives have repurchased shares sold by or for the account of such underwriter in stabilizing or short covering transactions.
The underwriters and their respective affiliates are full-service financial institutions engaged in various activities, which may include securities trading, commercial and investment banking, financial advisory,
199
Table of Contents
investment management, investment research, principal investment, hedging, financing and brokerage activities. From time to time, certain of the underwriters and/or their respective affiliates may provide investment banking services to us. In addition, affiliates of certain of the underwriters are our customers and the contracts governing such relationships were entered into at arm’s length and on customary terms. In the ordinary course of their various business activities, the underwriters and their respective affiliates may make or hold a broad array of investments and actively trade debt and equity securities (or related derivative securities) and financial instruments (including bank loans) for their own account and for the accounts of their customers, and such investment and securities activities may involve securities and/or instruments of Avaya, including the existing senior unsecured notes. The underwriters and their respective affiliates may also make investment recommendations and/or publish or express independent research views in respect of such securities or instruments and may at any time hold, or recommend to clients that they acquire, long and/or short positions in such securities and instruments. The underwriters and their affiliates have in the past engaged, currently engage and may in the future engage, in transactions with and perform services for, including commercial banking, financial advisory and investment banking services, us and our affiliates in the ordinary course of business for which they have received or will receive customary fees and expenses. We also have, and expect to continue to have, economic hedges, cash management relationships and/or other swaps and hedges in place with certain of the underwriters or their affiliates on customary economic terms. An affiliate of J.P. Morgan Securities LLC owns shares representing less than 5% of our outstanding stock. Affiliates of certain of the underwriters are lenders and/or agents under our existing credit facilities.
We and the several underwriters have agreed to indemnify each other against certain liabilities, including liabilities under the Securities Act.
A prospectus in electronic format may be made available on websites maintained by one or more underwriters, or selling group members, if any, participating in this offering. The representatives may agree to allocate a number of shares of common stock to underwriters for sale to their online brokerage account holders. Internet distributions will be allocated by the representatives to underwriters that may make Internet distributions on the same basis as other allocations.
Selling Restrictions
European Economic Area
In relation to each Member State of the European Economic Area which has implemented the Prospectus Directive (each referred to as a Relevant Member State), each underwriter has represented and agreed that with effect from and including the date on which the Prospectus Directive is implemented in that Relevant Member State, or the Relevant Implementation Date, it has not made and will not make an offer of shares which are the subject of the offering contemplated by this prospectus to the public in that Relevant Member State other than:
(a) to any legal entity which is a qualified investor as defined in the Prospectus Directive.
(b) to fewer than 100 or, if the Relevant Member State has implemented the relevant provision of the 2010 PD Amending Directive, 150, natural or legal persons (other than qualified investors as defined in the Prospectus Directive), as permitted under the Prospectus Directive subject to obtaining the prior consent of the relevant Dealer or Dealers nominated by the Issuer for any such offer; or
(c) in any other circumstances falling within Article 3(2) of the Prospectus Directive,
provided that no such offer of shares shall require the Issuer or any underwriter to publish a prospectus pursuant to Article 3 of the Prospectus Directive.
For the purposes of this provision, the expression an “offer of shares to the public” in relation to any shares in any Relevant Member State means the communication in any form and by any means of sufficient information on the terms of the offer and the shares to be offered so as to enable an investor to decide to purchase or
200
Table of Contents
subscribe the shares, as the same may be varied in that Member State by any measure implementing the Prospectus Directive in that Member State, the expression “Prospectus Directive” means Directive 2003/71/EC (and amendments thereto, including the 2010 PD Amending Directive, to the extent implemented in the Relevant Member State), and includes any relevant implementing measure in the Relevant Member State and the expression “2010 PD Amending Directive” means Directive 2010/73/EU.
United Kingdom
Each underwriter has represented and agreed that:
(a) (i) it is a person whose ordinary activities involve it in acquiring, holding, managing or disposing of investments (as principal or agent) for the purposes of its business and (ii) it has not offered or sold and will not offer or sell the shares other than to persons whose ordinary activities involve them in acquiring, holding, managing or disposing of investments (as principal or as agent) for the purposes of their businesses or who it is reasonable to expect will acquire, hold, manage or dispose of investments (as principal or agent) for the purposes of their businesses where the issue of the shares would otherwise constitute a contravention of Section 19 of the FSMA by the Issuer;
(b) it has only communicated or caused to be communicated and will only communicate or cause to be communicated an invitation or inducement to engage in investment activity (within the meaning of Section 21 of the FSMA) received by it in connection with the issue or sale of the shares in circumstances in which Section 21(1) of the FSMA does not apply to the Issuer or the Guarantors; and
(c) it has complied and will comply with all applicable provisions of the FSMA with respect to anything done by it in relation to the shares in, from or otherwise involving the United Kingdom.
France
Neither this prospectus nor any other offering material relating to the shares described in this prospectus has been submitted to the clearance procedures of the Autorité des Marchés Financiers or of the competent authority of another member state of the European Economic Area and notified to the Autorité des Marchés Financiers. The shares have not been offered or sold and will not be offered or sold, directly or indirectly, to the public in France. Neither this prospectus nor any other offering material relating to the shares has been or will be:
| • | released, issued, distributed or caused to be released, issued or distributed to the public in France; or |
| • | used in connection with any offer for subscription or sale of the shares to the public in France. |
Such offers, sales and distributions will be made in France only:
| • | to qualified investors (investisseurs qualifiés) and/or to a restricted circle of investors (cercle restreint d’investisseurs), in each case investing for their own account, all as defined in, and in accordance with articles L.411-2, D.411-1, D.411-2, D.734-1, D.744-1, D.754-1 and D.764-1 of the French Code monétaire et financier; |
| • | to investment services providers authorized to engage in portfolio management on behalf of third parties; or |
| • | in a transaction that, in accordance with article L.411-2-II-1°-or-2°-or 3° of the French Code monétaire et financier and article 211-2 of the General Regulations (Règlement Général) of the Autorité des Marchés Financiers, does not constitute a public offer (appel public à l’épargne). |
The shares may be resold directly or indirectly, only in compliance with articles L.411-1, L.411-2, L.412-1 and L.621-8 through L.621-8-3 of the French Code monétaire et financier.
201
Table of Contents
Hong Kong
The shares may not be offered or sold by means of any document other than (i) in circumstances which do not constitute an offer to the public within the meaning of the Companies Ordinance (Cap.32, Laws of Hong Kong), or (ii) to “professional investors” within the meaning of the Securities and Futures Ordinance (Cap.571, Laws of Hong Kong) and any rules made thereunder, or (iii) in other circumstances which do not result in the document being a “prospectus” within the meaning of the Companies Ordinance (Cap.32, Laws of Hong Kong), and no advertisement, invitation or document relating to the shares may be issued or may be in the possession of any person for the purpose of issue (in each case whether in Hong Kong or elsewhere), which is directed at, or the contents of which are likely to be accessed or read by, the public in Hong Kong (except if permitted to do so under the laws of Hong Kong) other than with respect to shares which are or are intended to be disposed of only to persons outside Hong Kong or only to “professional investors” within the meaning of the Securities and Futures Ordinance (Cap. 571, Laws of Hong Kong) and any rules made thereunder.
Singapore
This prospectus has not been registered as a prospectus with the Monetary Authority of Singapore. Accordingly, this prospectus and any other document or material in connection with the offer or sale, or invitation for subscription or purchase, of the shares may not be circulated or distributed, nor may the shares be offered or sold, or be made the subject of an invitation for subscription or purchase, whether directly or indirectly, to persons in Singapore other than (i) to an institutional investor under Section 274 of the Securities and Futures Act, Chapter 289 of Singapore (the “SFA”), (ii) to a relevant person, or any person pursuant to Section 275(1A), and in accordance with the conditions, specified in Section 275 of the SFA or (iii) otherwise pursuant to, and in accordance with the conditions of, any other applicable provision of the SFA.
Where the shares are subscribed or purchased under Section 275 by a relevant person which is: (a) a corporation (which is not an accredited investor) the sole business of which is to hold investments and the entire share capital of which is owned by one or more individuals, each of whom is an accredited investor; or (b) a trust (where the trustee is not an accredited investor) whose sole purpose is to hold investments and each beneficiary is an accredited investor, shares, debentures and units of shares and debentures of that corporation or the beneficiaries’ rights and interest in that trust shall not be transferable for 6 months after that corporation or that trust has acquired the shares under Section 275 except: (1) to an institutional investor under Section 274 of the SFA or to a relevant person, or any person pursuant to Section 275(1A), and in accordance with the conditions, specified in Section 275 of the SFA; (2) where no consideration is given for the transfer; or (3) by operation of law.
Japan
The shares offered in this prospectus have not been registered under the Financial Instruments and Exchange Law of Japan. The shares have not been offered or sold and will not be offered or sold, directly or indirectly, in Japan or to or for the account of any resident of Japan, (which term as used herein means any person resident in Japan, including any corporation or other entity organized under the laws of Japan) or to others for re-offering or resale, directly or indirectly, in Japan or to a resident of Japan, except (i) pursuant to an exemption from the registration requirements of the Securities and Exchange Law and (ii) in compliance with any other applicable requirements of the Financial Instruments and Exchange Law and any other applicable laws, regulations and ministerial guidelines of Japan.
Switzerland
This document as well as any other material relating to the shares which are the subject of the offering contemplated by this Prospectus, or the Shares, do not constitute an issue prospectus pursuant to Article 652a of the Swiss Code of Obligations. The Shares will not be listed on the SWX Swiss Exchange and, therefore, the documents relating to the Shares, including, but not limited to, this document, do not claim to comply with the disclosure standards of the listing rules of SWX Swiss Exchange and corresponding prospectus schemes annexed to the listing rules of the SWX Swiss Exchange.
202
Table of Contents
The Shares are being offered in Switzerland by way of a private placement, i.e. to a small number of selected investors only, without any public offer and only to investors who do not purchase the Shares with the intention to distribute them to the public. The investors will be individually approached by the Company from time to time.
This document as well as any other material relating to the Shares is personal and confidential and do not constitute an offer to any other person. This document may only be used by those investors to whom it has been handed out in connection with the offering described herein and may neither directly nor indirectly be distributed or made available to other persons without express consent of the Company. It may not be used in connection with any other offer and shall in particular not be copied and/or distributed to the public in (or from) Switzerland.
Dubai International Financial Centre
This document relates to an exempt offer in accordance with the Offered Securities Rules of the Dubai Financial Services Authority. This document is intended for distribution only to persons of a type specified in those rules. It must not be delivered to, or relied on by, any other person. The Dubai Financial Services Authority has no responsibility for reviewing or verifying any documents in connection with exempt offers. The Dubai Financial Services Authority has not approved this document nor taken steps to verify the information set out in it, and has no responsibility for it. The shares which are the subject of the offering contemplated by this Prospectus, or the Shares, may be illiquid and/or subject to restrictions on their resale.
Prospective purchasers of the Shares offered should conduct their own due diligence on the Shares. If you do not understand the contents of this document you should consult an authorised financial adviser.
203
Table of Contents
Ropes & Gray LLP, Boston, Massachusetts, will pass for us on the validity of the shares of common stock offered by this prospectus. The underwriters are being represented by Cahill Gordon & ReindelLLP, New York, New York. Ropes & Gray LLP and some partners of Ropes & Gray LLP are members of RGIP, LLC, which is an investor in certain investment funds associated with Silver Lake and TPG and often a co-investor with such funds. RGIP, LLC directly or indirectly owns shares of our common stock representing less than 1% of the outstanding shares of each of our common stock, Series A Preferred Stock and Warrants.
The consolidated financial statements of Avaya Holdings Corp. as of September 30, 2011 and 2010, and for each of the three years in the period ended September 30, 2011 included in this prospectus have been so included in reliance on the report of PricewaterhouseCoopers LLP, an independent registered public accounting firm, given on the authority of said firm as experts in auditing and accounting.
The combined financial statements of NES, as of September 30, 2009 and December 31, 2008, and for the nine months ended September 30, 2009 and the year ended December 31, 2008, have been included herein and in the registration statement in reliance upon the report of KPMG LLP, independent auditors, appearing elsewhere herein, and upon the authority of said firm as experts in accounting and auditing. The audit report covering the September 30, 2009, combined financial statements contains an explanatory paragraph that states that: (i) NES’s owner, Nortel Networks Corporation, and certain of its Canadian subsidiaries filed for creditor protection pursuant to the provisions of the Companies’ Creditors Arrangement Act; certain of Nortel Networks Corporation’s United States subsidiaries filed voluntary petitions seeking to reorganize under Chapter 11 of the United States Bankruptcy Code; certain of Nortel Networks Corporation’s subsidiaries in Europe, the Middle East and Africa made consequential filings under the Insolvency Act 1986 in the United Kingdom; and Nortel Networks Corporation’s Israeli subsidiaries made consequential filings under the Israeli Companies Law 1999; (ii) these conditions raise substantial doubt about Nortel Networks Corporation’s and NES’s ability to continue as a going concern; and (iii) combined financial statements do not include any adjustments that might result from the outcome of that uncertainty. The report of KPMG LLP also refers to changes in NES’s method of accounting for fair value measurements and the date at which it measures the funded status of its defined benefit pension plans and other postretirement plans.
WHERE YOU CAN FIND ADDITIONAL INFORMATION
We have filed with the SEC a registration statement on Form S-1 under the Securities Act that registers the shares of our common stock to be sold in this offering. This prospectus does not contain all of the information set forth in the registration statement and the exhibits and schedules filed as part of the registration statement. For further information with respect to us and our common stock, we refer you to the registration statement and the exhibits and schedules filed as a part of the registration statement. Statements contained in this prospectus concerning the contents of any contract or any other document are not necessarily complete. If a contract or document has been filed as an exhibit to the registration statement, we refer you to the copy of the contract or document that has been filed. Each statement in this prospectus relating to a contract or document filed as an exhibit is qualified in all respects by the filed exhibit.
The reports and other information we file with the SEC can be read and copied at the SEC’s Public Reference Room at 100 F Street, N.E., Washington D.C. 20549. You may obtain information regarding the operation of the public reference room by calling 1-800-SEC-0330. The SEC also maintains a website (http://www.sec.gov) that contains reports, proxy and information statements and other information that we file electronically with the SEC. Our website address is www.avaya.com. Our subsidiary, Avaya Inc., currently is a
204
Table of Contents
voluntary filer and makes available free of charge, through our website, its annual report on Form 10-K, quarterly reports on Form 10-Q, current reports on Form 8-K and all amendments to those reports, as soon as reasonably practicable after such material is electronically filed with or furnished to the SEC. Please note that our website address is provided as an inactive textual reference only. The information contained on, or accessible through, our website is not part of this prospectus, and is therefore not incorporated by reference.
205
Table of Contents
Index to Consolidated and Combined Financial Statements
Avaya Holdings Corp. and Avaya Inc. | Page | |
| F-2 | ||
| F-3 | ||
| F-4 | ||
Consolidated Statements of Changes in Stockholders’ Equity (Deficiency) and Comprehensive Loss | F-5 | |
| F-6 | ||
| F-7 | ||
Enterprise and Government Solutions, Businesses of Nortel Networks Corporation | ||
| F-73 | ||
| F-74 | ||
| F-75 | ||
Combined Statements of Changes in Invested Equity and Comprehensive Loss | F-76 | |
| F-77 | ||
| F-78 | ||
F-1
Table of Contents
Report of Independent Registered Public Accounting Firm
To the Board of Directors and Stockholders of Avaya Holdings Corp.:
In our opinion, the accompanying consolidated balance sheets and the related consolidated statements of operations, of changes in stockholders’ equity (deficiency) and comprehensive loss and of cash flows present fairly, in all material respects, the financial position of Avaya Holdings Corp. and its subsidiaries at September 30, 2011 and 2010, and the results of their operations and their cash flows for each of the three years in the period ended September 30, 2011 in conformity with accounting principles generally accepted in the United States of America. These financial statements are the responsibility of the Company’s management. Our responsibility is to express an opinion on these financial statements based on our audits. We conducted our audits of these statements in accordance with the standards of the Public Company Accounting Oversight Board (United States). Those standards require that we plan and perform the audit to obtain reasonable assurance about whether the financial statements are free of material misstatement. An audit includes examining, on a test basis, evidence supporting the amounts and disclosures in the financial statements, assessing the accounting principles used and significant estimates made by management, and evaluating the overall financial statement presentation. We believe that our audits provide a reasonable basis for our opinion.
As discussed in Note 2 to the consolidated financial statements, the Company changed the manner in which it accounts for revenue recognition in 2011.
/s/ PricewaterhouseCoopers LLP
Florham Park, New Jersey
December 22, 2011
F-2
Table of Contents
Consolidated Statements of Operations
(In millions, except per share amounts)
| Years ended September 30, | ||||||||||||
| 2011 | 2010 | 2009 | ||||||||||
REVENUE | ||||||||||||
Products | $ | 2,976 | $ | 2,602 | $ | 1,923 | ||||||
Services | 2,571 | 2,458 | 2,227 | |||||||||
|
|
|
|
|
| |||||||
| 5,547 | 5,060 | 4,150 | ||||||||||
|
|
|
|
|
| |||||||
COSTS | ||||||||||||
Products: | ||||||||||||
Costs (exclusive of amortization of intangibles) | 1,314 | 1,243 | 872 | |||||||||
Amortization of technology intangible assets | 257 | 291 | 248 | |||||||||
Services | 1,344 | 1,354 | 1,164 | |||||||||
|
|
|
|
|
| |||||||
| 2,915 | 2,888 | 2,284 | ||||||||||
|
|
|
|
|
| |||||||
GROSS MARGIN | 2,632 | 2,172 | 1,866 | |||||||||
|
|
|
|
|
| |||||||
OPERATING EXPENSES | ||||||||||||
Selling, general and administrative | 1,845 | 1,721 | 1,272 | |||||||||
Research and development | 461 | 407 | 309 | |||||||||
Amortization of intangible assets | 226 | 218 | 207 | |||||||||
Impairment of long-lived assets | — | 16 | 2 | |||||||||
Impairment of indefinite-lived intangible assets | — | — | 60 | |||||||||
Goodwill impairment | — | — | 235 | |||||||||
Restructuring charges, net | 189 | 171 | 160 | |||||||||
In-process research and development charge | — | — | 12 | |||||||||
Acquisition-related costs | 5 | 20 | 29 | |||||||||
|
|
|
|
|
| |||||||
| 2,726 | 2,553 | 2,286 | ||||||||||
|
|
|
|
|
| |||||||
OPERATING LOSS | (94 | ) | (381 | ) | (420 | ) | ||||||
Interest expense | (460 | ) | (487 | ) | (409 | ) | ||||||
Loss on extinguishment of debt | (246 | ) | — | — | ||||||||
Other income, net | 5 | 15 | 14 | |||||||||
|
|
|
|
|
| |||||||
LOSS BEFORE INCOME TAXES | (795 | ) | (853 | ) | (815 | ) | ||||||
Provision for income taxes | 68 | 18 | 30 | |||||||||
|
|
|
|
|
| |||||||
NET LOSS | (863 | ) | (871 | ) | (845 | ) | ||||||
Less net income attributable to non-controlling interests | — | 3 | 2 | |||||||||
|
|
|
|
|
| |||||||
NET LOSS ATTRIBUTABLE TO AVAYA HOLDINGS CORP. | (863 | ) | (874 | ) | (847 | ) | ||||||
Less: Accretion and accrued dividends on Series A preferred stock | (7 | ) | (62 | ) | — | |||||||
|
|
|
|
|
| |||||||
NET LOSS ATTRIBUTABLE TO AVAYA HOLDINGS CORP. COMMON STOCKHOLDERS | $ | (870 | ) | $ | (936 | ) | $ | (847 | ) | |||
|
|
|
|
|
| |||||||
Net loss per share attributable to common stockholders | $ | (1.78 | ) | $ | (1.92 | ) | $ | (1.74 | ) | |||
|
|
|
|
|
| |||||||
Weighted average basic and diluted shares outstanding | 489.0 | 488.6 | 488.1 | |||||||||
|
|
|
|
|
| |||||||
The accompanying Notes to Consolidated Financial Statements are an integral part of these statements.
F-3
Table of Contents
Consolidated Balance Sheets
(In millions, except share amounts)
| September 30, | ||||||||
| 2011 | 2010 | |||||||
ASSETS | ||||||||
Current assets: | ||||||||
Cash and cash equivalents | $ | 415 | $ | 594 | ||||
Accounts receivable, net | 755 | 792 | ||||||
Inventory | 280 | 234 | ||||||
Deferred income taxes, net | 8 | 3 | ||||||
Other current assets | 272 | 276 | ||||||
|
|
|
| |||||
TOTAL CURRENT ASSETS | 1,730 | 1,899 | ||||||
|
|
|
| |||||
Property, plant and equipment, net | 397 | 450 | ||||||
Deferred income taxes, net | 28 | 22 | ||||||
Intangible assets, net | 2,129 | 2,603 | ||||||
Goodwill | 4,079 | 4,075 | ||||||
Other assets | 198 | 227 | ||||||
|
|
|
| |||||
TOTAL ASSETS | $ | 8,561 | $ | 9,276 | ||||
|
|
|
| |||||
LIABILITIES | ||||||||
Current liabilities: | ||||||||
Debt maturing within one year | $ | 37 | $ | 48 | ||||
Accounts payable | 465 | 464 | ||||||
Payroll and benefit obligations | 323 | 311 | ||||||
Deferred revenue | 639 | 650 | ||||||
Business restructuring reserve, current portion | 130 | 113 | ||||||
Other current liabilities | 352 | 430 | ||||||
|
|
|
| |||||
TOTAL CURRENT LIABILITIES | 1,946 | 2,016 | ||||||
|
|
|
| |||||
Long-term debt | 6,120 | 5,880 | ||||||
Pension obligations | 1,636 | 1,540 | ||||||
Other postretirement obligations | 502 | 478 | ||||||
Deferred income taxes, net | 168 | 154 | ||||||
Business restructuring reserve, non-current portion | 56 | 52 | ||||||
Other liabilities | 496 | 569 | ||||||
|
|
|
| |||||
TOTAL NON-CURRENT LIABILITIES | 8,978 | 8,673 | ||||||
|
|
|
| |||||
Commitments and contingencies | ||||||||
Preferred stock, par value $.001 per share, authorized 250,000 and 250,000 at September 30, 2011 and September 30, 2010, respectively | ||||||||
Series A, 125,000 and 125,000 shares issued and outstanding at September 30, 2011 and September 30, 2010, respectively | 137 | 130 | ||||||
STOCKHOLDERS’ DEFICIENCY | ||||||||
Common stock, par value $.001 per share; 750,000,000 and 750,000,000 shares authorized; 487,401,790 and 487,389,017 shares issued and outstanding at September 30, 2011 and September 30, 2010, respectively | — | — | ||||||
Additional paid-in capital | 2,569 | 2,566 | ||||||
Accumulated deficit | (3,891 | ) | (3,028 | ) | ||||
Accumulated other comprehensive loss | (1,178 | ) | (1,081 | ) | ||||
|
|
|
| |||||
TOTAL STOCKHOLDERS’ DEFICIENCY | (2,500 | ) | (1,543 | ) | ||||
|
|
|
| |||||
TOTAL LIABILITIES AND STOCKHOLDERS’ DEFICIENCY | $ | 8,561 | $ | 9,276 | ||||
|
|
|
| |||||
The accompanying Notes to Consolidated Financial Statements are an integral part of these statements.
F-4
Table of Contents
CONSOLIDATED STATEMENTS OF CHANGES IN STOCKHOLDERS’ EQUITY (DEFICIENCY) AND COMPREHENSIVE LOSS
(In millions)
| Number of Shares | Common Stock | Additional Paid-In Capital | Accumulated Deficit | Accumulated Other Comprehensive Loss | Total Avaya Stockholders’ Equity / (Deficiency) | Noncontrolling Interest | Total Stockholders’ Equity / (Deficiency) | Comprehensive Loss | ||||||||||||||||||||||||||||
Balance as of October 1, 2008 | 486.6 | $ | — | $ | 2,471 | $ | (1,307 | ) | $ | (101 | ) | $ | 1,063 | $ | 44 | $ | 1,107 | |||||||||||||||||||
Issuance of common stock | 0.3 | 1 | 1 | 1 | ||||||||||||||||||||||||||||||||
Issuance of common stock, net of shares redeemed and cancelled, under employee stock option plan | 0.4 | (1 | ) | (1 | ) | (1 | ) | |||||||||||||||||||||||||||||
Amortization of share-based compensation | 9 | 9 | 9 | |||||||||||||||||||||||||||||||||
Net loss | (847 | ) | (847 | ) | 2 | (845 | ) | $ | (845 | ) | ||||||||||||||||||||||||||
Change in unamortized pension, postretirement and postemployment actuarial losses, net of tax effect of $0 | (791 | ) | (791 | ) | (791 | ) | (791 | ) | ||||||||||||||||||||||||||||
Foreign currency translation | (59 | ) | (59 | ) | (59 | ) | (59 | ) | ||||||||||||||||||||||||||||
Unrealized loss on interest rate swap instruments, net of tax effect of $0 | (56 | ) | (56 | ) | (56 | ) | (56 | ) | ||||||||||||||||||||||||||||
Other | (1 | ) | (1 | ) | (1 | ) | (1 | ) | ||||||||||||||||||||||||||||
|
| |||||||||||||||||||||||||||||||||||
Total comprehensive loss | $ | (1,752 | ) | |||||||||||||||||||||||||||||||||
|
|
|
|
|
|
|
|
|
|
|
|
|
|
|
|
|
| |||||||||||||||||||
Balance as of September 30, 2009 | 487.3 | $ | — | $ | 2,480 | $ | (2,154 | ) | $ | (1,008 | ) | $ | (682 | ) | $ | 46 | $ | (636 | ) | |||||||||||||||||
|
|
|
|
|
|
|
|
|
|
|
|
|
|
|
| |||||||||||||||||||||
Issuance of common stock, net of shares redeemed and cancelled, under employee stock option plan | 0.1 | |||||||||||||||||||||||||||||||||||
Issuance of warrants on preferred stock | 57 | 57 | 57 | |||||||||||||||||||||||||||||||||
Accretion on Series A preferred stock | (57 | ) | (57 | ) | (57 | ) | ||||||||||||||||||||||||||||||
Issuance of warrants in connection with B-2 loans | 74 | 74 | 74 | |||||||||||||||||||||||||||||||||
Amortization of share-based compensation | 17 | 17 | 17 | |||||||||||||||||||||||||||||||||
Accrued dividends on Series A preferred stock | (5 | ) | (5 | ) | (5 | ) | ||||||||||||||||||||||||||||||
Net loss | (874 | ) | (874 | ) | 3 | (871 | ) | $ | (871 | ) | ||||||||||||||||||||||||||
Change in unamortized pension, postretirement and postemployment actuarial losses, net of tax effect of $0 | (187 | ) | (187 | ) | (187 | ) | (187 | ) | ||||||||||||||||||||||||||||
Foreign currency translation | 67 | 67 | 67 | 67 | ||||||||||||||||||||||||||||||||
Unrealized gain on interest rate swap instruments, net of tax effect of $0 | 45 | 45 | 45 | 45 | ||||||||||||||||||||||||||||||||
Sale of AGC | (49 | ) | (49 | ) | ||||||||||||||||||||||||||||||||
Other | 2 | 2 | 2 | 2 | ||||||||||||||||||||||||||||||||
|
| |||||||||||||||||||||||||||||||||||
Total comprehensive loss | $ | (944 | ) | |||||||||||||||||||||||||||||||||
|
|
|
|
|
|
|
|
|
|
|
|
|
|
|
|
|
| |||||||||||||||||||
Balance as of September 30, 2010 | 487.4 | $ | — | $ | 2,566 | $ | (3,028 | ) | $ | (1,081 | ) | $ | (1,543 | ) | $ | — | $ | (1,543 | ) | |||||||||||||||||
|
|
|
|
|
|
|
|
|
|
|
|
|
|
|
| |||||||||||||||||||||
Amortization of share-based compensation | 10 | 10 | 10 | |||||||||||||||||||||||||||||||||
Accrued dividends on Series A preferred stock | (7 | ) | (7 | ) | (7 | ) | ||||||||||||||||||||||||||||||
Net loss | (863 | ) | (863 | ) | (863 | ) | $ | (863 | ) | |||||||||||||||||||||||||||
Change in unamortized pension, postretirement | (97 | ) | (97 | ) | (97 | ) | (97 | ) | ||||||||||||||||||||||||||||
Foreign currency translation | (22 | ) | (22 | ) | (22 | ) | (22 | ) | ||||||||||||||||||||||||||||
Unrealized gain on interest rate swap instruments, net of tax effect of $0 | 23 | 23 | 23 | 23 | ||||||||||||||||||||||||||||||||
Other | (1 | ) | (1 | ) | (1 | ) | (1 | ) | ||||||||||||||||||||||||||||
|
| |||||||||||||||||||||||||||||||||||
Total comprehensive loss | $ | (960 | ) | |||||||||||||||||||||||||||||||||
|
|
|
|
|
|
|
|
|
|
|
|
|
|
|
|
|
| |||||||||||||||||||
Balance as of September 30, 2011 | 487.4 | $ | — | $ | 2,569 | $ | (3,891 | ) | $ | (1,178 | ) | $ | (2,500 | ) | $ | — | $ | (2,500 | ) | |||||||||||||||||
|
|
|
|
|
|
|
|
|
|
|
|
|
|
|
| |||||||||||||||||||||
The accompanying Notes to Consolidated Financial Statements are an integral part of these statements.
F-5
Table of Contents
Consolidated Statements of Cash Flows
(In millions)
| Years ended September 30 | ||||||||||||
| 2011 | 2010 | 2009 | ||||||||||
OPERATING ACTIVITIES: | ||||||||||||
Net loss | $ | (863 | ) | $ | (871 | ) | $ | (845 | ) | |||
Adjustments to reconcile net loss to net cash provided (used for) by operating activities: | ||||||||||||
Depreciation and amortization | 653 | 691 | 652 | |||||||||
Share-based compensation | 12 | 19 | 10 | |||||||||
Amortization of debt issuance costs | 23 | 23 | 22 | |||||||||
Accretion of debt discount | 18 | 33 | — | |||||||||
Payment of amortized discount of incremental B-2 term loans | (50 | ) | — | — | ||||||||
Non-cash charge for debt issuance costs upon redemption of incremental B-2 term loans | 5 | — | — | |||||||||
Third-party fees expensed in connection with the debt modification | 9 | — | — | |||||||||
Payment in kind interest | — | 49 | 35 | |||||||||
Provision for uncollectible receivables | — | 5 | (6 | ) | ||||||||
Deferred income taxes, net | (3 | ) | 7 | (18 | ) | |||||||
Impairment of goodwill | — | — | 235 | |||||||||
Impairment of long-lived and intangible assets | — | 16 | 62 | |||||||||
Loss on sale of long-lived assets | 1 | 3 | 2 | |||||||||
Gain on sale of AGC | — | (7 | ) | — | ||||||||
In-process research and development charge | — | — | 12 | |||||||||
Unrealized (gains) losses on foreign currency exchange | (38 | ) | 41 | (30 | ) | |||||||
Changes in operating assets and liabilities: | ||||||||||||
Accounts receivable | 34 | (119 | ) | 211 | ||||||||
Inventory | (45 | ) | 1 | 101 | ||||||||
Accounts payable | 2 | 144 | (45 | ) | ||||||||
Payroll and benefit obligations | (25 | ) | (6 | ) | (191 | ) | ||||||
Business restructuring reserve | 27 | (39 | ) | 15 | ||||||||
Deferred revenue | (29 | ) | 126 | 29 | ||||||||
Other assets and liabilities | (31 | ) | (74 | ) | (9 | ) | ||||||
|
|
|
|
|
| |||||||
NET CASH (USED FOR) PROVIDED BY OPERATING ACTIVITIES | (300 | ) | 42 | 242 | ||||||||
|
|
|
|
|
| |||||||
INVESTING ACTIVITIES: | ||||||||||||
Capital expenditures | (83 | ) | (79 | ) | (76 | ) | ||||||
Capitalized software development costs | (42 | ) | (43 | ) | (43 | ) | ||||||
Escrow payment for proposed acquisition | — | — | (100 | ) | ||||||||
Acquisition of businesses, net of cash acquired | (16 | ) | (805 | ) | (11 | ) | ||||||
Return of funds held in escrow from the NES acquisition | 6 | 5 | — | |||||||||
Liquidation of securities available for sale | — | 18 | 98 | |||||||||
Purchase of securities available for sale | — | (5 | ) | (1 | ) | |||||||
Proceeds from sale of long-lived assets | 7 | 11 | 4 | |||||||||
Net proceeds from sale of AGC, net of cash sold | — | 32 | — | |||||||||
Restricted cash | 27 | 2 | (26 | ) | ||||||||
|
|
|
|
|
| |||||||
NET CASH USED FOR INVESTING ACTIVITIES | (101 | ) | (864 | ) | (155 | ) | ||||||
|
|
|
|
|
| |||||||
FINANCING ACTIVITIES: | ||||||||||||
Issuance of common stock | — | — | 1 | |||||||||
Withholding taxes—share-based compensation | — | — | (1 | ) | ||||||||
Net proceeds from incremental B-2 term loans and warrants | — | 783 | — | |||||||||
Proceeds from issuance of preferred stock and warrants | — | 125 | — | |||||||||
Repayment of incremental B-2 term loans | (696 | ) | — | — | ||||||||
Debt issuance costs and third-party debt modification costs | (42 | ) | (5 | ) | (29 | ) | ||||||
Proceeds from senior secured notes | 1,009 | — | — | |||||||||
Repayment of long-term debt | (42 | ) | (48 | ) | (72 | ) | ||||||
Other financing activities, net | (1 | ) | (2 | ) | — | |||||||
|
|
|
|
|
| |||||||
NET CASH PROVIDED BY (USED FOR) FINANCING ACTIVITIES | 228 | 853 | (101 | ) | ||||||||
|
|
|
|
|
| |||||||
Effect of exchange rate changes on cash and cash equivalents | (6 | ) | (19 | ) | 2 | |||||||
|
|
|
|
|
| |||||||
NET (DECREASE) INCREASE IN CASH AND CASH EQUIVALENTS | (179 | ) | 12 | (12 | ) | |||||||
Cash and cash equivalents at beginning of year | 594 | 582 | 594 | |||||||||
|
|
|
|
|
| |||||||
Cash and cash equivalents at end of year | $ | 415 | $ | 594 | $ | 582 | ||||||
|
|
|
|
|
| |||||||
The accompanying Notes to Consolidated Financial Statements are an integral part of these statements.
F-6
Table of Contents
Notes to Consolidated Financial Statements
1. Description of Business, Merger and NES Acquisition
Business
Avaya Holdings Corp. (formerly Sierra Holdings Corp.) together with its consolidated subsidiaries (collectively, the “Company” or “Avaya”) is a leading global provider of business collaboration and communications solutions. The Company’s solutions are designed to enable business users to work together more effectively as a team internally or with their customers and suppliers, increasing innovation, improving productivity and accelerating decision-making and business outcomes.
At the core of the Company’s business is a large and diverse global installed customer base which includes large enterprises, small- and medium-sized businesses and government organizations. Avaya provides solutions in five key business collaboration and communications product and related services categories:
| • | Unified Communications Software, Infrastructure and Endpoints |
| • | Real Time Video Collaboration |
| • | Contact Center |
| • | Data Networking |
| • | Applications, including their Integration and Enablement |
Avaya sells solutions directly and through its channel partners. As of September 30, 2011, Avaya had approximately 9,100 channel partners worldwide, including system integrators, service providers, value-added resellers and business partners that provide sales and service support.
Merger
Avaya Holdings Corp. is a holding company formed by affiliates of two private equity firms, Silver Lake Partners (“Silver Lake”) and TPG (“TPG”) (collectively, the “Sponsors”) on June 1, 2007, solely for the purpose of entering into an Agreement and Plan of Merger (the “Merger Agreement”) with Avaya Inc. Prior to the Merger Agreement, Avaya Inc. was a registered company with the U.S. Securities and Exchange Commission (“SEC”) and had common stock traded on the New York Stock Exchange. On June 4, 2007, the Company and its wholly owned subsidiary, Sierra Merger Corp., a Delaware corporation, (“Merger Sub”), entered into a Merger Agreement with Avaya Inc. pursuant to which Merger Sub would be merged with and into Avaya Inc., with Avaya Inc. continuing as the surviving corporation and a wholly owned subsidiary of Avaya Holdings Corp. (the “Merger”). The Merger Agreement provided for a purchase price of $8.4 billion of Avaya Inc.’s common stock and was completed on October 26, 2007 pursuant to the terms of the Merger Agreement.
In connection with the Merger, Avaya Inc. entered into financing arrangements consisting of (i) a senior secured multi-currency asset-based revolving credit facility that provides financing of up to $335 million, subject to availability under a borrowing base, (ii) a senior secured credit facility including (a) a senior secured term loan in the aggregate principal amount of $3.8 billion and (b) a senior secured multi-currency revolver in an aggregate commitment amount of up to $200 million and (iii) a senior unsecured credit facility consisting of (a) a $700 million senior unsecured cash pay loan and (b) a $750 million senior unsecured PIK toggle loan. On October 24, 2008, the senior unsecured cash-pay loan was converted into senior unsecured cash-pay notes and the senior unsecured PIK toggle loan was converted into senior unsecured PIK toggle notes. See Note 9, “Financing Arrangements” for further details.
F-7
Table of Contents
Acquisition of Enterprise Solutions Business of Nortel Networks Corporation
On December 18, 2009, Avaya acquired certain assets and assumed certain liabilities of the enterprise solutions business (“NES”) of Nortel Networks Corporation (“Nortel”), including all the shares of Nortel Government Solutions Incorporated, for $943 million in cash consideration. The Company and Nortel were required to determine the final purchase price post-closing based upon the various purchase price adjustments included in the acquisition agreements. During the first quarter of fiscal 2011, the Company and Nortel agreed on a final purchase price of $933 million, and the Company received $6 million, representing all remaining amounts due to Avaya from funds held in escrow. The terms of the acquisition do not include any significant contingent consideration arrangements. During the years ended September 30, 2010 and 2009, acquisition costs of $20 million and $29 million were expensed as incurred, respectively. These consolidated financial statements include the operating results of NES as of December 19, 2009.
Basis of Presentation
Avaya Holdings Corp. has no material assets or standalone operations other than its ownership in Avaya Inc. and its subsidiaries. The consolidated financial statements as of September 30, 2011 and 2010 and for the years ended September 30, 2011, 2010 and 2009 reflect the operating results of Avaya Holdings Corp. and its consolidated subsidiaries.
2. Summary of Significant Accounting Policies
Use of Estimates
The consolidated financial statements and related disclosures are prepared in conformity with accounting principles generally accepted in the United States of America. Management is required to make estimates and assumptions that affect the reported amounts of assets and liabilities, the disclosure of contingent assets and liabilities at the date of the financial statements, and revenue and expenses during the periods reported. These estimates include assessing the collectibility of accounts receivable, sales returns and allowances, the use and recoverability of inventory, the realization of deferred tax assets, business restructuring reserves, pension and
F-8
Table of Contents
postretirement benefit costs, the fair value of equity compensation, the fair value of assets and liabilities acquired in business combinations, the recoverability of long-lived assets, and useful lives and impairment of tangible and intangible assets including goodwill, the amount of exposure from potential loss contingencies, and fair value measurements, among others. The markets for the Company’s products are characterized by intense competition, rapid technological development and frequent new product introductions, all of which could affect the future recoverability of the Company’s assets. Estimates and assumptions are reviewed periodically and the effects of revisions are reflected in the consolidated financial statements in the period they are determined to be necessary. Actual results could differ from these estimates.
Principles of Consolidation
The consolidated financial statements include the accounts of Avaya and its subsidiaries. In the event that the Company is a primary beneficiary of a variable interest entity, the assets, liabilities and results of operations of the variable interest entity will be included in the Company’s consolidated financial statements. All intercompany transactions and balances have been eliminated in consolidation. Certain prior year amounts have been reclassified to conform to the current presentation.
Acquisition Accounting
The Company accounts for business combinations using the acquisition method, which requires an allocation of the purchase price of an acquired entity to the assets acquired and liabilities assumed based on their estimated fair values at the date of acquisition. Goodwill represents the excess of the purchase price over the net tangible and intangible assets acquired.
Revenue Recognition
The Company derives revenue primarily from the sale of products, software, and services for communications systems and applications. The Company’s products are sold directly through its worldwide sales force and indirectly through its global network of distributors, dealers, value-added resellers and systems integrators. Services includes (i) supplemental maintenance service, including services provided under contracts to monitor and optimize customers’ communications network performance; (ii) professional services for implementation and integration of converged voice and data networks, network security and unified communications; and (iii) operations services. Maintenance contracts typically have terms that range from one to five years. Contracts for professional services typically have terms that range from two to four weeks for standard solutions and from six months to one year for customized solutions. Contracts for operations services typically have terms that range from one to seven years.
In accordance with GAAP, revenue is recognized when persuasive evidence of an arrangement exists, delivery has occurred, the fee is fixed or determinable, and collectability is reasonably assured. For arrangements that require final acceptance of the product, system, or solution as specified by the customer, revenue is deferred until all acceptance criteria have been met.
The Company’s indirect sales to distribution partners are generally recognized at the time of shipment if all contractual obligations have been satisfied. The Company accrues a provision for estimated sales returns and other allowances, including promotional marketing programs and other incentives as a reduction of revenue at time of sale.
Multiple deliverable arrangements in fiscal year 2011
In October 2009, the Financial Accounting Standards Board (“FASB”) amended the software revenue recognition guidance to remove from its scope tangible products containing software components and non-software components that function together to deliver the product’s essential functionality. The FASB also
F-9
Table of Contents
amended the guidance for multiple deliverable revenue arrangements (formerly Emerging Issues Task Force No. 08-1) to: (i) provide updated guidance on how the deliverables in an arrangement should be separated and how the consideration should be allocated; and (ii) change the term “fair value” to “selling price” and require an entity to allocate revenue using the estimated selling prices of the deliverables when a vendor does not have vendor-specific or third-party evidence of selling price. The Company adopted the new guidance on a prospective basis as of the beginning of fiscal 2011 for revenue arrangements entered into or materially modified on or after October 1, 2010.
The new guidance did not generally change the units of accounting for the Company’s revenue transactions as delivered and undelivered items generally qualified as separate units of accounting under the historical guidance. The new guidance affects the timing of revenue recognition for multiple deliverable arrangements that included delivered items and undelivered items for which the Company was unable to demonstrate fair value pursuant to the historical guidance. In such cases, the delivered items were combined with the undelivered items to form a single unit of accounting and revenue was recognized on either a straight-line basis over the services period or deferred until the earlier of when the fair value requirements were met or when the last item was delivered. In addition, the Company previously used the residual method to allocate the arrangement consideration in cases where fair value could only be determined for the undelivered items. Under the new guidance, the Company allocates the total arrangement consideration based upon the relative selling price of each deliverable and revenue is recognized as each item is delivered. As a result of adopting the new guidance, net revenues for the fiscal year ended September 30, 2011 were not materially different from the net revenues that would have been recorded under the historical guidance. The Company cannot reasonably estimate the effect of adopting the new guidance on future financial periods as the impact will vary depending on the nature and volume of new or materially modified multiple deliverable arrangements in any given period.
The Company enters into multiple deliverable arrangements, which may include various combinations of products, software and services. Most product and service deliverables qualify as separate units of accounting and can be sold on a standalone basis. A deliverable constitutes a separate unit of accounting when it has standalone value and, where return rights exist, delivery or performance of the undelivered items is considered probable and substantially within the Company’s control.
Most of the Company’s solutions have both software and non-software components that function together to deliver the products’ essential functionality. For these multiple deliverable arrangements, the Company allocates revenue to the deliverables based on their relative selling prices. To the extent that a deliverable is subject to specific guidance on whether and/or how to allocate the consideration in a multiple element arrangement, that deliverable is accounted for in accordance with such specific guidance. The Company limits the amount of revenue recognition for delivered items to the amount that is not contingent on the future delivery of products or services or meeting other future performance obligations.
The Company allocates revenue based on a selling price hierarchy of vendor-specific objective evidence, third-party evidence, and then estimated selling price. Vendor-specific objective evidence is based on the price charged when the deliverable is sold separately. Third-party evidence is based on largely interchangeable competitor products or services in standalone sales to similarly situated customers. As the Company is unable to reliably determine what competitors products’ selling prices are on a standalone basis, the Company is not typically able to determine third-party evidence. Estimated selling price is based on the Company’s best estimates of what the selling prices of deliverables would be if they were sold regularly on a standalone basis. Estimated selling price is established considering multiple factors including, but not limited to, pricing practices in different geographies and through different sales channels, major product and services groups, and customer classifications.
Once the Company allocates revenue to each deliverable, the Company recognizes revenue in accordance with its policies when all revenue recognition criteria are met. Product revenue is generally recognized upon delivery and services revenue is generally recognized ratably over the period during which the services are
F-10
Table of Contents
performed. However, revenue for professional services arrangements is generally recognized upon delivery or completion of performance and revenue for arrangements that require final acceptance of the product, system or solution, is generally deferred until all acceptance criteria have been met.
Standalone or subsequent sales of software or software-related products are recognized in accordance with the software revenue recognition guidance. For multiple deliverable arrangements that only include software items, the Company generally uses the residual method to allocate the arrangement consideration. Under the residual method, the amount of consideration allocated to the delivered items equals the total arrangement consideration, less the fair value of the undelivered items. Where vendor-specific objective evidence of fair value for the undelivered items cannot be determined, the Company defers revenue until all items are delivered and services have been performed, or until such evidence of fair value can be determined for the undelivered items.
Multiple deliverable arrangements in fiscal years 2010 and prior
Prior to fiscal year 2011, a multiple deliverable arrangement is separated into more than one unit of accounting if all of the following criteria are met: (i) the delivered item(s) has value to the customer on a standalone basis; (ii) there is objective and reliable evidence of the fair value of the undelivered item(s); and (iii) if the arrangement includes a general right of return relative to the delivered item(s), delivery or performance of the undelivered item(s) is considered probable and substantially within the control of the Company. If these criteria are not met, the delivered items are combined with the undelivered items to form a single unit of accounting and revenue is recognized on either a straight-line basis over the services period or deferred until the earlier of when such criteria are met or when the last item is delivered.
The Company uses the residual method to allocate the arrangement consideration for multiple deliverable arrangements for which objective and reliable evidence of fair value can only be determined for the undelivered items. Under the residual method, the amount of consideration allocated to the delivered items equals the total arrangement consideration, less the fair value of the undelivered items.
The Company uses objective and reliable evidence of fair value to separate the deliverables into more than one unit of accounting if the Company has vendor-specific objective evidence or third-party evidence of fair value for all of the deliverables. The accounting guidance does not permit the Company to use an estimated selling price for these arrangements when objective and reliable evidence of fair value is not available.
The Company recognizes revenue in accordance with the software revenue recognition guidance for arrangements that include software that is more than incidental to the products or services as a whole. In multiple deliverable software arrangements, the Company generally uses the residual method to allocate the arrangement consideration. When vendor-specific objective evidence of fair value cannot be determined for the undelivered items, the Company defers revenue until all items have been delivered or until such evidence can be determined.
Cash and Cash Equivalents
Cash and cash equivalents consist of highly liquid investments with original maturities of three months or less when purchased, and are stated at cost, which approximates market value.
Concentrations of Risk
The Company’s cash and cash equivalents are invested in various investment grade institutional money market accounts and bank term deposits, with a significant portion of these investments having government backing. Deposits held at banks may exceed the amount of insurance provided on such deposits. Generally, these deposits may be redeemed upon demand and are maintained with financial institutions with reputable credit and therefore bear minimal credit risk. The Company seeks to mitigate such risks by spreading its risk across multiple counterparties and monitoring the risk profiles of these counterparties.
F-11
Table of Contents
The Company relies on a limited number of contract manufacturers and suppliers to provide manufacturing services for its products. The inability of a contract manufacturer or supplier to fulfill supply requirements of the Company could materially impact future operating results.
Accounts Receivable and Allowance for Doubtful Accounts
Accounts receivable are recorded net of reserves for sales returns and allowances and provisions for doubtful accounts. The Company performs ongoing credit evaluations of its customers and generally does not require collateral from its customers. The allowances are based on analyses of historical trends, aging of accounts receivable balances and the creditworthiness of customers as determined by credit checks and analyses, as well as customers’ payment history. At September 30, 2011, one customer accounted for more than 10% of accounts receivable. At September 30, 2010 no single customer accounted for more than 10% of accounts receivable.
Inventory
Inventory includes goods awaiting sale (finished goods), equipment that is being installed at customer locations for various installations that are not yet complete and goods to be used in connection with providing maintenance services. Inventory is stated at the lower of cost or market, determined on a first-in, first-out method. Reserves to reduce the inventory cost to market value are based on current inventory levels, assumptions about future demand and product life cycles for the various inventory types.
As discussed in detail in Note 19, the Company has outsourced the manufacturing of substantially all of its products and may be obligated to purchase certain excess inventory levels from its outsourced manufacturers if actual sales of product vary from forecast, in which case additional inventory provisions may need to be recorded in the future.
Research and Development Costs
Research and development costs are charged to expense as incurred. The costs incurred for the development of communications software that will be sold, leased or otherwise marketed, however, are capitalized when technological feasibility has been established in accordance with FASB Accounting Standards Codification (“ASC”) Topic 985, “Software” (“ASC 985”). These capitalized costs are subject to an ongoing assessment of recoverability based on anticipated future revenues and costs and changes in hardware and software technologies. Costs that are capitalized include direct labor and related overhead.
Amortization of capitalized software development costs begins when the product is available for general release to customers. Amortization is recognized on a product-by-product basis generally on the straight-line method over a period of up to two years. Unamortized software development cost determined to be in excess of net realizable value of the product is expensed immediately. Included in other assets at September 30, 2011 and 2010 is unamortized software development cost of $58 million and $55 million, respectively.
Property, Plant and Equipment
Property, plant and equipment are stated at cost less accumulated depreciation. Depreciation is determined using a straight-line method over the estimated useful lives of the assets. Estimated lives range from three to ten years for machinery and equipment, five years for rental equipment and up to forty years for buildings. Improvements that extend the useful life of assets are capitalized and maintenance and repairs are charged to expense as incurred. Upon retirement or disposal of assets, the cost and related accumulated depreciation are removed from the Consolidated Balance Sheets and any gain or loss is reflected in the Consolidated Statements of Operations.
F-12
Table of Contents
Internal Use Software
Certain costs of computer software developed or obtained for internal use are capitalized and amortized on a straight-line basis generally over three to seven years. General and administrative costs, overhead, maintenance and training, as well as the cost of software that does not add functionality to the existing system, are expensed as incurred. The Company had unamortized internal use software costs of $26 million and $38 million as of September 30, 2011 and 2010, respectively.
Goodwill
Goodwill is not amortized but is subject to periodic testing for impairment in accordance with FASB ASC Topic 350, “Intangibles-Goodwill and Other” (“ASC 350”) at the reporting unit level which is one level below the Company’s operating segments. The assessment of goodwill impairment is conducted by estimating and comparing the fair value of the Company’s reporting units’ net assets, as defined in ASC 350, to their carrying value as of that date. The fair value is estimated using an income approach whereby the fair value of the asset is based on the future cash flows that each reporting unit’s assets can be expected to generate. Future cash flows are based on forward-looking information regarding market share and costs for each reporting unit and are discounted using an appropriate discount rate. Future discounted cash flows can be affected by changes in industry or market conditions or the rate and extent to which anticipated synergies or cost savings are realized with newly acquired entities. The test for impairment is conducted annually each September 30th, and more frequently if events occur or circumstances change that indicate that the fair value of a reporting unit may be below its carrying amount.
Intangible and Long-lived Assets
Intangible assets include technology, customer relationships, trademarks and trade names and other intangibles. Intangible assets with finite lives are amortized using the straight-line method over the estimated economic lives of the assets, which range from two to fifteen years. Long-lived assets, including intangible assets with finite lives, are reviewed for impairment whenever events or changes in circumstances indicate that the carrying amount of such assets may not be recoverable in accordance with FASB ASC Topic 360, “Property, Plant and Equipment” (“ASC 360”). Determination of recoverability is based on an estimate of undiscounted future cash flows resulting from the use of the asset and its eventual disposition. Measurement of an impairment loss for long-lived assets that management expects to hold and use is based on the estimated fair value of the asset. Long-lived assets to be disposed of are reported at the lower of carrying amount or estimated fair value less costs to sell. Intangible assets determined to have indefinite useful lives are not amortized but are tested for impairment annually each September 30th and more frequently if events occur or circumstances change that indicate an asset may be impaired.
Financial Instruments
The Company uses foreign currency forward contracts to manage and reduce risk to the Company by generating cash flows that offset the cash flows of certain transactions in foreign currencies in relation to their amounts and timing. The Company’s derivative financial instruments are used as risk management tools and not for speculative or trading purposes. These derivative instruments represent assets and liabilities and are classified as other current assets or other current liabilities on the Consolidated Balance Sheets. Gains and losses on the changes in the fair values of the Company’s derivative instruments are included in other income, net. As permitted under FASB ASC Topic 815 “Derivatives and Hedging” (“ASC 815”), the Company has elected not to designate its forward contracts as hedges thereby precluding the use of hedge accounting for these instruments.
The Company uses interest rate swap agreements in order to reduce its exposure to variable rate interest payments associated with its senior secured term loan. The interest rate swaps are designated and qualify as cash flow hedges under ASC 815 and are included at estimated fair value as an asset or liability in the Consolidated
F-13
Table of Contents
Balance Sheets. These are bifurcated into current and non-current components depending upon the timing of the cash flows. Fair values related to the cash flows occurring within one year are classified as current and beyond one year as non-current. Unrealized gains/losses related to the change in market value on interest rate swaps are recorded in other comprehensive loss and reclassified to earnings in the same period or periods during which the hedged transaction affects earnings. The market value of the interest rate swaps recorded in other comprehensive loss may be recognized in the Consolidated Statement of Operations earlier if the interest rate swaps are determined to be ineffective, for example, if certain terms of the senior secured term loan change, if the loan is extinguished, if the counterparty’s ability to honor its obligation under the agreement changes, or if the interest rate swap agreements are terminated prior to maturity.
The Company also utilizes non-derivative financial instruments including letters of credit and commitments to extend credit.
Restructuring Programs
The Company accounts for exit or disposal activities in accordance with FASB ASC Topic 420, “Exit or Disposal Cost Obligations” (“ASC 420”). In accordance with ASC 420, a business restructuring is defined as an exit or disposal activity that includes but is not limited to a program that is planned and controlled by management and materially changes either the scope of a business or the manner in which that business is conducted. Business restructuring charges includes (i) one-time termination benefits related to employee separations, (ii) contract termination costs and (iii) other costs associated with exit or disposal activities including, but not limited to, costs for consolidating or closing facilities and relocating employees.
A liability is recognized and measured at its fair value for one-time termination benefits once the plan of termination is communicated to affected employees and it meets all of the following criteria: (i) management commits to a plan of termination, (ii) the plan identifies the number of employees to be terminated and their job classifications or functions, locations and the expected completion date, (iii) the plan establishes the terms of the benefit arrangement and (iv) it is unlikely that significant changes to the plan will be made or the plan will be withdrawn. Contract termination costs include costs to terminate a contract or costs that will continue to be incurred under the contract without benefit to the Company. A liability is recognized and measured at its fair value when the Company either terminates the contract or ceases using the rights conveyed by the contract. A liability is recognized and measured at its fair value for other associated costs in the period in which the liability is incurred.
In connection with the Merger, the Company adopted a plan to exit certain activities of the newly acquired company. A liability was recognized as of the consummation date of the acquisition for the costs under the exit plan in accordance with the authoritative guidance at that time if these costs were not associated with or were not incurred to generate revenues of the combined entity after the consummation date and either (i) had no future economic benefit to the combined company, were incremental to other costs incurred by either the acquired company or the acquiring company in the conduct of activities prior to the consummation date, and were expected to be incurred as a direct result of the plan to exit an activity of the acquired company or (ii) the cost represented an amount to be incurred by the combined company under a contractual obligation of the acquired company that existed prior to the consummation date and will either continue after the plan is completed with no economic benefit to the combined company or be a penalty incurred by the combined company to cancel that contractual obligation.
Pension and Postretirement Benefit Obligations
The Company sponsors non-contributory defined benefit pension plans covering certain of its U.S. employees and retirees, and postretirement benefit plans for certain U.S. retirees that include healthcare benefits and life insurance coverage. Certain non-U.S. operations have various retirement benefit programs covering substantially all of their employees. Some of these programs are considered to be defined benefit pension plans for accounting purposes.
F-14
Table of Contents
The Company’s pension and postretirement benefit costs are developed from actuarial valuations. Inherent in these valuations are key assumptions, including the discount rate and expected long-term rate of return on plan assets. Material changes in pension and postretirement benefit costs may occur in the future due to changes in these assumptions, changes in the number of plan participants, changes in the level of benefits provided, changes in asset levels and changes in legislation.
The market-related value of the Company’s plan assets as of the measurement date is developed using a 5-year smoothing technique. First, a preliminary market-related value is calculated by adjusting the market-related value at the beginning of the year for payments to and from plan assets and the expected return on assets during the year. The expected return on assets represents the expected long-term rate of return on plan assets adjusted up to plus or minus 2% based on the actual 10-year average rate of return on plan assets. A final market-related value is determined as the preliminary market-related value, plus 20% of the difference between the actual return and expected return for each of the past five years.
These pension and other postretirement benefits are accounted for in accordance with FASB ASC Topic 715, “Compensation—Retirement Benefits” (“ASC 715”). ASC 715 requires that plan assets and obligations be measured as of the reporting date and the over-funded, under-funded or unfunded status of plans be recognized as of the reporting date as an asset or liability in the Consolidated Balance Sheets. In addition, ASC 715 requires costs and related obligations and assets arising from pensions and other postretirement benefit plans to be accounted for based on actuarially-determined estimates.
The plans use different factors, including years of service, eligible compensation and age, to determine the benefit amount for eligible participants. The Company funds its U.S. qualified pension plans in compliance with applicable laws. See Note 13, “Benefit Obligations,” for a discussion of the Company’s pension and postretirement plans.
Share-based Compensation
The Company accounts for share-based compensation in accordance with FASB Topic ASC 718, “Compensation—Stock Compensation” (“ASC 718”), which requires the measurement and recognition of compensation expense for all share-based payment awards made to employees and directors including stock options, restricted stock units and stock purchases based on estimated fair values.
The Company adopted the alternative transition method for calculating the tax effects of share-based compensation pursuant to authoritative guidance provided by the FASB. The alternative transition method includes simplified methods to establish the beginning balance of the additional paid-in capital pool (“APIC pool”) related to the tax effects of employee share-based compensation, and to determine the subsequent impact on the APIC pool and Consolidated Statements of Cash Flows of the tax effects of employee share-based compensation awards that are outstanding upon adoption of ASC 718.
Income Taxes
Income taxes are accounted for under the asset and liability method. Under this method, deferred tax assets and liabilities are recognized for the estimated future tax consequences attributable to differences between the financial statement carrying amounts of existing assets and liabilities and their respective tax bases, and operating loss and tax credit carryforwards. Deferred tax assets and liabilities are measured using enacted tax rates in effect for the year in which those temporary differences are expected to be recovered or settled. The effect on deferred tax assets and liabilities of a change in tax rates is recognized in the Consolidated Statements of Operations in the period that includes the enactment date. A valuation allowance is recorded to reduce the carrying amounts of deferred tax assets if it is more likely than not that such assets will not be realized.
FASB ASC Subtopic 740-10, “Income Taxes—Overall” (“ASC 740-10”) prescribes a comprehensive model for the financial statement recognition, measurement, classification and disclosure of uncertain tax positions.
F-15
Table of Contents
ASC 740-10 contains a two-step approach to recognizing and measuring uncertain tax positions. The first step is to evaluate the tax position for recognition by determining if the weight of available evidence indicates that it is more likely than not that the position will be sustained on audit, based on the technical merits of the position. The second step is to measure the tax benefit as the largest amount that is more than 50% likely of being realized upon settlement.
Significant judgment is required in evaluating our uncertain tax positions and determining our provision for income taxes. Although we believe our reserves are reasonable, no assurance can be given that the final tax outcome of these matters will not be different from that which is reflected in our historical income tax provision and accruals. We adjust these reserves in light of changing facts and circumstances.
Net Loss Per Share
Basic net loss per share is computed by dividing the net loss attributable to common stockholders by the weighted average number of common shares outstanding during the period. Net loss attributable to common stockholders is adjusted (increased) for preferred stock dividends earned during the period. Diluted loss per share is computed by dividing the net loss attributable to common stockholders by the weighted average number of common shares outstanding plus potentially dilutive common shares. Because the Company reported losses for the periods presented, all potentially dilutive common shares comprised of stock options, unvested restricted stock and warrants are anti-dilutive.
Deferred Financing Costs
Deferred financing costs, which are included in other assets, are amortized as interest expense over the contractual lives of the related credit facilities.
Foreign Currency Translation
Assets and liabilities of non-U.S. subsidiaries that operate in a local currency environment, where the local currency is the functional currency, are translated from foreign currencies into U.S. dollars at period-end exchange rates while income and expenses are translated at the spot rate. Translation gains or losses related to net assets located outside the U.S. are shown as a component of accumulated other comprehensive loss in the Consolidated Statements of Changes in Stockholders’ Equity (Deficiency) and of Comprehensive Loss. Gains and losses resulting from foreign currency transactions, which are denominated in currencies other than the entity’s functional currency, are included in other income, net in the Consolidated Statements of Operations.
Other Comprehensive Loss
Other comprehensive loss is recorded directly to a separate section of stockholders’ equity (deficiency) in accumulated other comprehensive loss and primarily includes unrealized gains and losses excluded from the Consolidated Statements of Operations. These unrealized gains and losses consist of changes in our foreign currency translation, interest rate swaps, and changes in unamortized pension, postretirement and postemployment actuarial gains and losses.
3. Recent Accounting Pronouncements
New Accounting Guidance Recently Adopted
Milestone Method of Revenue Reconition
In April 2010, the FASB issued accounting guidance on the milestone method of revenue recognition. The guidance defines the term “milestone” and the prescribed criteria that should be met to apply the milestone method of revenue recognition for research or development transactions. The guidance requires that the milestone should meet all criteria to be considered substantive to recognize consideration that is contingent upon the achievement of a milestone in its entirety as revenue in the period in which the milestone is achieved. This accounting guidance became effective for the Company beginning October 1, 2010. The adoption of this accounting guidance did not have an impact on the Company’s consolidated financial statements.
F-16
Table of Contents
Fair Value Measures
In September 2006, the FASB issued an accounting standard related to fair value measurements of financial and non-financial assets and liabilities. The provisions of the standard applicable to financial assets and liabilities were effective and adopted by the Company on October 1, 2008. On October 1, 2009 the provisions of this standard became effective for the Company’s non-financial assets and liabilities. The adoption of this accounting guidance did not have a material impact on the Company’s consolidated statement of operations.
In January 2010, the FASB issued revised guidance intended to improve disclosures related to fair value measurements. This guidance requires new disclosures and clarifies certain existing disclosure requirements. New disclosures under this guidance require separate information about significant transfers into and out of Level 1 and Level 2 and the reasons for such transfers, and also require purchases, sales, issuances, and settlements information for Level 3 measurements to be included in the rollforward of activity on a gross basis. The guidance also clarifies the requirement to determine the level of disaggregation for fair value measurement disclosures and the requirement to disclose valuation techniques and inputs used for both recurring and nonrecurring fair value measurements in either Level 2 or Level 3. This accounting guidance became effective for the Company beginning in the second quarter of fiscal 2010, except for the rollforward of activity on a gross basis for Level 3 fair value measurements, which will be effective for the Company in the first quarter of fiscal 2012. The adoption of this accounting guidance is reflected in Note 11, “Fair Value Measures” and did not have a material impact on the Company’s financial statement disclosures.
In August 2009, the FASB issued guidance to clarify the fair value measurements and disclosure requirements related to the measurement of liabilities at fair value. The guidance provides clarification that in circumstances in which a quoted price in an active market for the identical liability is not available, a reporting entity is required to measure fair value using one or more of the following methods: 1) a valuation technique that uses a) the quoted market price of the identical liability when traded as an asset or b) quoted prices for similar liabilities or similar liabilities when traded as assets and/or 2) a valuation technique that is consistent with the principles of FASB Topic ASC 820, “Fair Value Measurements and Disclosures” (“ASC 820”). The accounting guidance became effective for the Company beginning in fiscal 2010. The adoption of this accounting guidance did not have an impact on the Company’s consolidated statement of operations.
Variable Interest Entities
In December 2009, the FASB issued revised guidance for the accounting for variable interest entities. The revised guidance replaces the quantitative-based risks and rewards approach with a qualitative approach that focuses on which enterprise has the power to direct the activities of a variable interest entity that most significantly impact the entity’s economic performance. The accounting guidance also requires an entity to perform an ongoing analysis to determine whether the entity’s variable interest or interests give it a controlling financial interest in a variable interest entity. This accounting guidance became effective for the Company beginning October 1, 2010 and did not have an impact on the Company’s consolidated financial statements.
Recent Accounting Guidance Not Yet Effective
In December 2010, the FASB issued revised guidance which requires that if a company presents pro forma comparative financial statements for business combinations, the company should disclose revenue and earnings of the combined entity as though the business combination(s) that occurred during the current year had occurred as of the beginning of the comparable prior annual reporting period only. This guidance also expands the supplemental pro forma disclosures to include a description of the nature and amount of material, nonrecurring pro forma adjustments directly attributable to the business combination included in the reported pro forma revenue and earnings. This accounting guidance is effective for the Company on a prospective basis beginning in fiscal 2012. The adoption of this guidance is not expected to have a material impact on the Company’s financial statement disclosures.
F-17
Table of Contents
In December 2010, the FASB issued revised guidance on when a company should perform step two of the goodwill impairment test for reporting units with zero or negative carrying amounts. This guidance requires that for reporting units with zero or negative carrying amounts, a company is required to perform step two of the goodwill impairment test if it is more likely than not that a goodwill impairment exists. In determining whether it is more likely than not that a goodwill impairment exists, an entity should consider whether there are any adverse qualitative factors indicating that an impairment may exist. This accounting guidance is effective for the Company beginning in fiscal 2012. The adoption of this guidance is not expected to have a material impact on the Company’s consolidated financial statements.
In May 2011, the FASB issued revised guidance which is intended to achieve common fair value measurement and disclosure guidance in GAAP and International Financial Reporting Standards. The majority of the changes represent a clarification to existing GAAP. Additionally, the revised guidance includes expanded disclosure requirements. This accounting guidance is effective for the Company beginning in the second quarter of fiscal year 2012 and is not expected to have a material impact on the Company’s consolidated financial statements or financial statement disclosures.
In June 2011, the FASB issued revised guidance on the presentation of comprehensive income and its components in the financial statements. As a result of the guidance, companies will now be required to present net income and other comprehensive income either in a single continuous statement or in two separate, but consecutive statements. This standard eliminates the current option to report other comprehensive income and its components in the statement of changes in equity. The standard does not, however, change the items that must be reported in other comprehensive income or the determination of net income. The new guidance is to be applied retrospectively. This accounting guidance is effective for the Company beginning in fiscal 2013 and is only expected to impact the presentation of the Company’s financial statements.
In September 2011, the FASB issued revised guidance intended to simplify how an entity tests goodwill for impairment. As a result of the guidance, an entity will be allowed to first assess qualitative factors to determine whether it is necessary to perform the two-step quantitative goodwill impairment test. An entity will not be required to calculate the fair value of a reporting unit unless the entity determines, based on a qualitative assessment, that it is more likely than not that its fair value is less than its carrying amount. The accounting guidance is effective for the Company beginning in fiscal 2013 and early adoption is permitted. The accounting guidance is not expected to have a material impact on the consolidated financial statements or financial statement disclosures.
In September 2011, the FASB issued revised guidance which requires additional disclosure about an employer’s participation in a multiemployer pension plan. The accounting guidance is effective for the Company for fiscal year 2012 and is to be applied retrospectively for all prior periods presented. The accounting guidance is not expected to have a material impact on the Company’s consolidated financial statement disclosures.
4. Business Combinations and Other Transactions
Acquisition of Enterprise Solutions Business of Nortel Networks Corporation
On September 16, 2009, the Company emerged as the winning bidder in bankruptcy court proceedings to acquire NES for $900 million in cash consideration subject to certain purchase price adjustments as set forth in the acquisition agreements (the “Acquisition”). On December 18, 2009 (the “acquisition date”), Avaya acquired certain assets and assumed certain liabilities of NES, including all the shares of Nortel Government Solutions Incorporated, for $943 million in cash consideration. The Company and Nortel were required to determine the final purchase price post-closing based upon the various purchase price adjustments included in the acquisition agreements. During the first quarter of fiscal 2011, the Company and Nortel agreed on a final purchase price of $933 million. The adjustment to the purchase price has been reflected in the allocation of the purchase price to the assets acquired and liabilities assumed in the Acquisition. The terms of the Acquisition do not include any significant contingent consideration arrangements. During the years ended September 30, 2010 and 2009, $20 million and $29 million of acquisition costs were expensed as incurred, respectively.
F-18
Table of Contents
The purchase price of NES and the payment of related fees and expenses (including integration expenses) were funded with (i) cash proceeds of $783 million received by Avaya from its issuance of $1,000 million in aggregate principal amount of term loans and detachable warrants to purchase up to 61.5 million shares of common stock (see Note 9, “Financing Arrangements”), (ii) proceeds of $125 million received from the issuance of Series A preferred stock and warrants to purchase up to 38.5 million shares of common stock (see Note 15, “Capital Stock”), and (iii) $112 million of Avaya’s existing cash.
Funds affiliated with Silver Lake and TPG purchased an aggregate of $78 million of Series A preferred stock, with each sponsor-affiliated group of investors investing $39 million of such amount. In consideration for such investment, the Silver Lake and TPG funds received an aggregate of 77,728 shares of Series A preferred stock and warrants to purchase 23,916,384 shares of common stock at an exercise price of $3.25 per share.
The acquisition of NES has been accounted for under the acquisition method, which requires an allocation of the purchase price of the acquired entity to the assets acquired and liabilities assumed based on their estimated fair values from a market-participant perspective at the date of acquisition. The allocation of the purchase price has been finalized as of December 18, 2010 as reflected within these consolidated financial statements. The fair values of the assets acquired and liabilities assumed were determined using the income, cost and market approaches. The fair values of acquired technologies and customer relationships were estimated using the income approach, which values the subject asset using the projected cash flows to be generated by the asset, discounted at a required rate of return that reflects the relative risk of achieving the cash flow and the time value of money. The cost approach was used to estimate the fair values of property, plant, and equipment and reflects the estimated reproduction or replacement cost for the asset, less an allowance for loss in value due to depreciation. The market approach was utilized in combination with the income approach to estimate the fair values of most working capital accounts.
The following table summarizes the consideration paid and the allocation of the purchase price to the assets acquired and the liabilities assumed in the acquisition based on their estimated fair values as of the close of the acquisition.
In millions | ||||
Cash and cash equivalents | $ | 38 | ||
Accounts receivable | 47 | |||
Inventory | 115 | |||
Property, plant and equipment | 103 | |||
Intangible assets | 476 | |||
Accounts payable | (17 | ) | ||
Payroll and benefit obligations | (124 | ) | ||
Deferred revenue | (79 | ) | ||
Other assets and liabilities | (51 | ) | ||
|
| |||
Net assets acquired | 508 | |||
Goodwill | 425 | |||
|
| |||
Purchase price | $ | 933 | ||
|
| |||
Adjustments to the preliminary purchase price allocation were made to reflect revised estimates of the fair values of the assets acquired and liabilities assumed at December 18, 2009. The most significant revisions were associated with valuations of property, plant and equipment and identifiable intangible assets, and the resulting changes to goodwill. Providing for these adjustments in previous periods would have had an immaterial impact on the reported operating results for the three month periods ended December 31, 2009, March 31, 2010 and June 30, 2010 and therefore such amounts were recorded in the quarter in which the adjustments were identified.
F-19
Table of Contents
Intangible assets include existing technologies of $188 million and customer relationships of $288 million. The existing technologies and customer relationships are being amortized over a weighted average useful life of five years and twelve years, respectively, on a straight-line basis. No in-process research and development was acquired in the Acquisition.
The excess of the purchase price over the net tangible and intangible assets acquired resulted in goodwill of $425 million which is attributable to the synergies and economies of scale provided to a market participant including marketing efforts principally located within the Company’s primary operating jurisdiction. The tax-deductible portion of goodwill was $383 million.
In connection with the acquisition of NES, management has identified certain technologies that were acquired, that, based on their functionality, overlapped the Company’s pre-existing technologies. In order to take advantage of synergies and reduce expenditures on research and development and marketing, management identified certain pre-existing technologies associated with the Company’s Global Communications Solutions segment which it no longer aggressively develops and markets and will eventually phase out. The net book value of these technologies was $16 million and, based on management’s plans, these technologies have a minimal estimated net realizable value. The Company had recorded an impairment charge of $16 million in the three months ended December 31, 2009 to reflect these technologies at their net realizable values.
These audited consolidated financial statements include the operating results of the NES business as of December 19, 2009. Revenues specific to the NES business for the period December 19, 2009 through September 30, 2010 were $1,247 million. As the Company has begun eliminating overlapping processes and expenses and integrating its products and sales efforts with those of the acquired NES business, it is impractical to determine the earnings specific to the NES business for the period December 19, 2009 through September 30, 2010, included in the Consolidated Statement of Operations.
Unaudited Pro Forma Financial Information
The following unaudited pro forma financial information presents certain information of the combined results of operations of the Company as though the Acquisition and related financing had been consummated as of the beginning of the periods presented. The unaudited pro forma financial information reflects certain adjustments associated with the Acquisition and related financing, including increases in amortization and depreciation expenses related to intangible assets and property, plant and equipment acquired, additional interest expense associated with the financing relating to the Acquisition and incremental employee compensation costs. No adjustments to the unaudited pro forma financial information have been made related to conforming Avaya and NES accounting policies. The unaudited pro forma financial information is not necessarily indicative of the results of operations that would have been realized if the Acquisition and related financing were completed on October 1, 2009 and October 1, 2008, nor is it indicative of future operating results.
The unaudited pro forma financial information for the fiscal year ended September 30, 2010 combines the historical results of Avaya for the fiscal year ended September 30, 2010 and the historical results of NES for the period October 1 to December 18, 2009, and the effects of the pro forma adjustments listed above. The unaudited pro forma financial information for the fiscal year ended September 30, 2009 combined the historical results of Avaya and NES for the fiscal year ended September 30, 2009, and the effects of the pro forma adjustments listed above.
The unaudited pro forma financial information for the fiscal year ended September 30, 2010 and 2009 was as follows:
| Years ended September 30, | ||||||||
In millions | 2010 | 2009 | ||||||
Revenue | $ | 5,476 | $ | 6,259 | ||||
Net loss | $ | (1,004 | ) | $ | (1,991 | ) | ||
F-20
Table of Contents
Sale of AGC Networks Ltd.
On May 30, 2010, Avaya entered into a Share Purchase Agreement with Essar Services Holdings Limited (“Essar”) to sell its 59.13% ownership interest in AGC Networks Limited (formerly Avaya GlobalConnect Ltd.) (“AGC”), a publicly-traded Indian reseller of the Company’s products and services in the Indian and Australian markets, for $44.5 million in cash. The sale was consummated August 31, 2010. As a result of the sale, a $7 million gain was recognized and included in other income, net.
The assets and liabilities of AGC sold are as follows and were not reduced for noncontrolling interest:
In millions | ||||
ASSETS SOLD | ||||
Cash and cash equivalents | $ | 13 | ||
Accounts receivable | 25 | |||
Inventory | 5 | |||
Property, plant and equipment | 5 | |||
Goodwill | 36 | |||
Other | 32 | |||
|
| |||
| $ | 116 | |||
|
| |||
LIABILITIES SOLD | ||||
Accounts payable | $ | 14 | ||
Payroll and benefit obligations | 4 | |||
Other | 14 | |||
|
| |||
| $ | 32 | |||
|
| |||
Other Acquisitions
The total consideration for acquisitions during the fiscal year ended September 30, 2011 was $17 million, which includes $16 million of cash payments, and includes our acquisition of all outstanding shares of Konftel AB (“Konftel”) on January 3, 2011. Konftel is a Swedish-based vendor of conference room terminals, offering analog, internet protocol, soft, cellular and session initiation protocol terminals.
The acquisitions have been accounted for under the acquisition method, which requires an allocation of the purchase price of the acquired entity to the assets acquired and liabilities assumed based on their estimated fair values from a market-participant perspective at the date of acquisition. The allocation of the purchase price as reflected within these consolidated financial statements is based on the best information available to management at the time these consolidated financial statements were issued and is provisional pending the completion of the valuation analysis of the assets and liabilities of each acquisition. During the measurement period (which is not to exceed one year from the acquisition date), the Company will be required to retrospectively adjust the provisional amounts recognized to reflect new information obtained about facts and circumstances that existed as of the acquisition date that, if known, would have affected the measurement of the amounts recognized as of that date. Further, during the measurement period, the Company is also required to recognize additional assets or liabilities if new information is obtained about facts and circumstances that existed as of the acquisition date that, if known, would have resulted in the recognition of those assets or liabilities as of that date.
The fair values of the assets acquired and liabilities assumed were preliminarily determined using the income and market approaches. The fair values of acquired technologies and customer relationships were estimated using the income approach which values the subject asset using the projected cash flows to be generated by the asset, discounted at a required rate of return that reflects the relative risk of achieving the cash flow and the time value of money. The market approach was utilized in combination with the income approach to estimate the fair values of most working capital accounts.
F-21
Table of Contents
The following table summarizes the consideration paid and the preliminary allocation of the purchase price to the assets acquired and the liabilities assumed in the acquisitions based on their estimated fair values as of the close of the acquisitions:
In millions | ||||
Accounts receivable | $ | 5 | ||
Inventory | 2 | |||
Intangible assets | 8 | |||
Accounts payable | (2 | ) | ||
Payroll and benefit obligations | (1 | ) | ||
Other assets and liabilities | (2 | ) | ||
|
| |||
Net assets acquired | 10 | |||
Goodwill | 7 | |||
|
| |||
Purchase price | $ | 17 | ||
|
| |||
Intangible assets include acquired technologies of $6 million and customer relationships of $2 million, respectively. The acquired technologies and customer relationships are being amortized over a weighted average useful life of 5 years, on a straight-line basis. No in-process research and development was acquired in the acquisitions. Pro forma financial information was not prepared as the acquisitions were not material.
The excess of the purchase price over the net tangible and intangible assets acquired resulted in goodwill of $7 million. The premiums paid by the Company in the transaction are largely attributable to the acquisition of an assembled workforce and the synergies and economies of scale provided to a market participant, particularly as it pertains to marketing efforts and customer base. None of the goodwill is deductible for tax purposes.
Adomo, Inc.
On July 24, 2009, Avaya acquired all outstanding shares of Adomo, Inc. (“Adomo”) for $11 million, net of cash acquired. Adomo developed and held the rights to certain unified messaging solutions which Avaya intends to further develop and incorporate into future product lines. The purchase price was allocated to the net assets acquired based on their estimated fair values which included $12 million of in-process research and development (“IPRD”), the fair value of which was determined using a royalty savings method. This technology is anticipated to benefit the Company when completed in fiscal 2011 after additional development and testing. At the time of acquisition, these technologies were in the development stages and did not meet the technological feasibility standard necessary for capitalization. In accordance with authoritative guidance on business combinations, these amounts were charged to the Consolidated Statements of Operations at the date of the acquisition. No goodwill was recognized in connection with this acquisition.
5. Goodwill
Goodwill is not amortized but is subject to periodic testing for impairment in accordance with ASC 350 at the reporting unit level which is one level below the Company’s operating segments. The test for impairment is conducted annually each September 30th or when events occur or circumstances change indicating that the fair value of a reporting unit may be below its carrying amount.
The impairment test for goodwill is a two-step process. Step one consists of a comparison of the fair value of a reporting unit with its carrying amount, including the goodwill allocated to that reporting unit. The Company estimated the fair value of each reporting unit using an income approach which values the unit based on the future cash flows expected from that reporting unit. Future cash flows are based on forward-looking information regarding market share and costs for each reporting unit and are discounted using an appropriate discount rate. Future discounted cash flows can be affected by changes in industry or market conditions or the rate and extent to
F-22
Table of Contents
which anticipated synergies or cost savings are realized with newly acquired entities. In step one of the test, a market approach was used as a reasonableness test but was not given significant weighting in the final determination of fair value.
The discounted cash flows model used in the Company’s income approach relies on assumptions regarding revenue growth rates, gross margin percentages, projected working capital needs, selling, general and administrative expenses, research and development expenses, business restructuring costs, capital expenditures, income tax rates, discount rates and terminal growth rates. To estimate fair value, the Company discounts the expected cash flows of each reporting unit. The discount rate Avaya uses represents the estimated weighted average cost of capital, which reflects the overall level of inherent risk involved in its reporting unit operations and the rate of return an outside investor would expect to earn. To estimate cash flows beyond the final year of its model, Avaya uses a terminal value approach. Under this approach, Avaya uses the estimated cash flows in the final year of its models and applies a perpetuity growth assumption and discount by a perpetuity discount factor to determine the terminal value. Avaya incorporates the present value of the resulting terminal value into its estimate of fair value.
The Company forecasted cash flows for each of its reporting units and took into consideration current economic conditions and trends, estimated future operating results, Avaya’s view of growth rates and anticipated future economic conditions. Revenue growth rates inherent in this forecast are based on input from internal and external market intelligence research sources that compare factors such as growth in global economies, regional trends in the telecommunications industry and product evolution from a technological segment basis. Macro economic factors such as changes in economies, product evolutions, industry consolidations and other changes beyond Avaya’s control could have a positive or negative impact on achieving its targets.
September 30, 2011 and 2010
At September 30, 2011 and 2010, the Company performed its annual goodwill impairment test and determined that the respective book values of the Company’s reporting units did not exceed their estimated fair values and that it was not necessary to record impairment charges.
June 30, 2010
Upon classification of the AGC business, which represents a portion of certain Global Communication Solutions (“GCS”) and Avaya Global Services (“AGS”) reporting units, as held for sale, the Company tested the goodwill remaining in the portion of the reporting units to be retained for impairment, as of May 31, 2010, in accordance with the authoritative guidance. Based on this goodwill impairment test, the Company determined that the respective book values for these reporting units did not exceed their estimated fair values and goodwill was not impaired. Excluding the AGC transaction, which requires that goodwill be tested for impairment, the Company determined that no events occurred or circumstances changed during the nine months ended June 30, 2010 that would indicate that the fair value of a reporting unit may be below its carrying amount.
September 30, 2009
At September 30, 2009, the Company performed its annual goodwill impairment test and determined that the respective book values of the Company’s reporting units did not exceed their estimated fair values and that it was not necessary to record impairment charges.
March 31, 2009
During the three months ended March 31, 2009, the global economic downturn experienced during fiscal 2008 continued and negatively affected most markets beyond the Company’s expectations utilized in its annual testing of goodwill at September 30, 2008. Several of the Company’s customers and competitors reduced their
F-23
Table of Contents
financial outlooks or disclosed that they were experiencing very challenging market conditions with little visibility of a rebound. Indications were that companies were not willing to spend on enterprise communications technology, and the revenue growth experienced in previous years was not expected in the near term. As demonstrated by the Company’s results, the demand for products fell as revenues for the six months ended March 31, 2009 were down when compared to the same period of the prior year. Cutbacks in spending, access to credit, employment variability, corporate profit growth, interest rates, energy prices, and other factors in specific markets were expected to further impact customer willingness to spend on communications technology in the near term. In March 2009, in response to these adverse business indicators, and the rapidly declining revenue trends experienced during the second quarter of the 2009 fiscal year, the Company reduced its near and long term financial projections. As a result of the deteriorating business climate during the second quarter of fiscal 2009, the Company determined that goodwill and long-lived assets should be tested for impairment.
The results from step one of the goodwill impairment test indicated that the estimated fair value of two GCS reporting units was less than the respective carrying value of its net assets (including goodwill) as of March 31, 2009 and as such the Company performed step two of the impairment test for these reporting units. The second step of the goodwill impairment test compares the implied fair value of the reporting unit’s goodwill with the carrying value of that goodwill. If the carrying amount of the reporting unit’s goodwill exceeds the implied fair value of that goodwill, an impairment loss is recognized in an amount equal to that excess. The implied fair value of the goodwill is determined in the same manner as the amount of goodwill recognized in a business combination. That is, the fair value of the reporting unit is allocated to all of the assets and liabilities of that unit as if the reporting unit had been acquired in a business combination and the fair value of the reporting unit was the purchase price paid to acquire the reporting unit.
During the three months ended March 31, 2009, the Company recorded an impairment to goodwill of $235 million associated with these GCS reporting units. The impairment was primarily the result of the continued weakness in the global economy. The reduced valuation of the affected reporting unit reflects the additional market risks, higher discount rates and the lower sales forecasts for the Company’s GCS product lines, which is consistent with economic trends at that time. The allocation discussed above is performed only for purposes of assessing goodwill for impairment; accordingly Avaya did not adjust the net book value of the assets and liabilities on its Consolidated Balance Sheets other than goodwill as a result of this process.
The changes in the carrying amount of goodwill by operating segment are as follows:
In millions | Global Communications Solutions | Data Networking | Avaya Global Services | Total | ||||||||||||
October 1, 2009 | $ | 1,218 | — | $ | 2,477 | $ | 3,695 | |||||||||
Acquisition of NES | 219 | — | 206 | 425 | ||||||||||||
Goodwill allocated to AGC | (13 | ) | — | (23 | ) | (36 | ) | |||||||||
Adjustments | (3 | ) | — | (6 | ) | (9 | ) | |||||||||
|
|
|
|
|
|
|
| |||||||||
September 30, 2010 | $ | 1,421 | $ | — | $ | 2,654 | $ | 4,075 | ||||||||
Acquisitions | 7 | — | — | 7 | ||||||||||||
Adjustments | (2 | ) | — | (1 | ) | (3 | ) | |||||||||
|
|
|
|
|
|
|
| |||||||||
September 30, 2011 | $ | 1,426 | $ | — | $ | 2,653 | $ | 4,079 | ||||||||
|
|
|
|
|
|
|
| |||||||||
Balance as of September 30, 2011: | ||||||||||||||||
Goodwill | $ | 2,560 | $ | — | $ | 2,653 | $ | 5,213 | ||||||||
Accumulated Impairment | (1,134 | ) | — | — | (1,134 | ) | ||||||||||
|
|
|
|
|
|
|
| |||||||||
| $ | 1,426 | $ | — | $ | 2,653 | $ | 4,079 | |||||||||
|
|
|
|
|
|
|
| |||||||||
“Adjustments” substantially pertain to the reversal of business restructuring reserves and tax valuation allowances.
F-24
Table of Contents
6. Intangible Assets
Intangible assets include acquired technology, customer relationships, trademarks and trade-names and other intangibles. Intangible assets with finite lives are amortized using the straight-line method over the estimated economic lives of the assets, which range from five to fifteen years.
The Company’s intangible assets consist of:
In millions | Acquired technology and patents | Customer relationships and other intangibles | Trademarks and trade names | Total | ||||||||||||
Gross Carrying Amount | $ | 1,371 | $ | 2,258 | $ | 545 | $ | 4,174 | ||||||||
Accumulated Amortization | (777 | ) | (604 | ) | — | (1,381 | ) | |||||||||
Accumulated Impairment | — | — | (190 | ) | (190 | ) | ||||||||||
|
|
|
|
|
|
|
| |||||||||
September 30, 2010 | $ | 594 | $ | 1,654 | $ | 355 | $ | 2,603 | ||||||||
|
|
|
|
|
|
|
| |||||||||
Gross Carrying Amount | $ | 1,366 | $ | 2,261 | $ | 545 | $ | 4,172 | ||||||||
Accumulated Amortization | (1,025 | ) | (828 | ) | — | (1,853 | ) | |||||||||
Accumulated Impairment | — | — | (190 | ) | (190 | ) | ||||||||||
|
|
|
|
|
|
|
| |||||||||
Balance as of September 30, 2011 | $ | 341 | $ | 1,433 | $ | 355 | $ | 2,129 | ||||||||
|
|
|
|
|
|
|
| |||||||||
Long-lived assets, including intangible assets with finite lives, are reviewed for impairment whenever events or changes in circumstances indicate that the carrying amount of such assets may not be recoverable. Intangible assets determined to have indefinite useful lives are not amortized but are tested for impairment annually, or more frequently if events or changes in circumstances indicate the asset may be impaired.
The Company’s trademarks and trade names are expected to generate cash flows indefinitely. Consequently, these assets are classified as indefinite-lived intangibles and are not amortized but reviewed for impairment annually, or sooner under certain circumstances.
Prior to the goodwill testing discussed above, the Company tested its intangible assets with indefinite lives in accordance with ASC 360. ASC 360 requires that the fair value of intangible assets with indefinite lives be compared to the carrying value of those assets. In situations where the carrying value exceeds the fair value of the intangible asset, an impairment loss equal to the difference is recognized. The Company estimates the fair value of its indefinite-lived intangible assets using an income approach; specifically, based on discounted cash flows.
September 30, 2011, 2010 and 2009
At September 30, 2011, 2010 and 2009, the Company performed annual tests of recoverability of indefinite-lived intangible assets. The Company determined that the respective book values of the Company’s indefinite-lived intangible assets did not exceed their estimated fair values and that it was not necessary to record impairment charges.
March 31, 2009
The Company determined that the continued deterioration in the business climate discussed above was also an indicator requiring the interim testing of its long-lived assets and performed the appropriate testing as of March 31, 2009.
The estimated fair values of the Company’s indefinite-lived intangible assets using the discounted cash flows model was $355 million and accordingly, the Company recorded an impairment charge of $60 million
F-25
Table of Contents
related to trademark and trade name indefinite-lived intangible assets during the three months ended March 31, 2009. The impairment is predominantly the result of the weakness in the global economy that existed at that time. The reduced valuation of these intangible assets reflects the additional market risks, higher discount rates and the lower sales forecasts associated with these indefinite-lived intangible assets consistent with economic trends that existed at that time.
Future amortization expense of intangible assets for the years ending September 30 is as follows:
In millions | Estimated future amortization expense | |||
2012 | $ | 409 | ||
2013 | 277 | |||
2014 | 266 | |||
2015 | 243 | |||
2016 and thereafter | 579 | |||
|
| |||
Total | $ | 1,774 | ||
|
| |||
7. Supplementary Financial Information
Consolidated Statements of Operations Information
| Years ended September 30, | ||||||||||||
In millions | 2011 | 2010 | 2009 | |||||||||
DEPRECIATION AND AMORTIZATION | ||||||||||||
Amortization of software development costs included in costs | $ | 39 | $ | 42 | $ | 32 | ||||||
Amortization of intangible assets | 483 | 509 | 455 | |||||||||
Depreciation and amortization of property, plant and equipment and internal use software included in costs and operating expenses | 131 | 140 | 165 | |||||||||
|
|
|
|
|
| |||||||
Total depreciation and amortization | $ | 653 | $ | 691 | $ | 652 | ||||||
|
|
|
|
|
| |||||||
OTHER INCOME, NET | ||||||||||||
Interest income | $ | 5 | $ | 5 | $ | 6 | ||||||
Gain (loss) on foreign currency transactions and forward contracts | 12 | (1 | ) | 8 | ||||||||
Third-party fees incurred in connection with debt modification | (9 | ) | — | — | ||||||||
Gain on sale of AGC | — | 7 | — | |||||||||
Other, net | (3 | ) | 4 | — | ||||||||
|
|
|
|
|
| |||||||
Total other income, net | $ | 5 | $ | 15 | $ | 14 | ||||||
|
|
|
|
|
| |||||||
F-26
Table of Contents
Consolidated Balance Sheet Information
| Years ended September 30, | ||||||||||||
In millions | 2011 | 2010 | 2009 | |||||||||
VALUATION AND QUALIFYING ACCOUNTS | ||||||||||||
Allowance for Accounts Receivable: | ||||||||||||
Balance at beginning of year | $ | 39 | $ | 49 | $ | 58 | ||||||
Charged to expense | (7 | ) | — | (3 | ) | |||||||
Deductions | (4 | ) | (10 | ) | (6 | ) | ||||||
|
|
|
|
|
| |||||||
Balance at end of year | $ | 28 | $ | 39 | $ | 49 | ||||||
|
|
|
|
|
| |||||||
Deferred Tax Asset Valuation Allowance: | ||||||||||||
Balance at beginning of year | $ | 1,094 | $ | 738 | $ | 185 | ||||||
Charged to expense | 238 | 330 | 193 | |||||||||
Additions | 78 | 26 | 360 | |||||||||
|
|
|
|
|
| |||||||
Balance at end of year | $ | 1,410 | $ | 1,094 | $ | 738 | ||||||
|
|
|
|
|
| |||||||
In millions | September 30, | |||||||
| 2011 | 2010 | |||||||
PROPERTY, PLANT AND EQUIPMENT, NET | ||||||||
Land and improvements | $ | 38 | $ | 37 | ||||
Buildings and improvements | 296 | 279 | ||||||
Machinery and equipment | 260 | 247 | ||||||
Rental equipment | 164 | 157 | ||||||
Assets under construction | 2 | 3 | ||||||
Internal use software | 120 | 129 | ||||||
|
|
|
| |||||
Total property, plant and equipment | 880 | 852 | ||||||
Less: Accumulated depreciation and amortization | (483 | ) | (402 | ) | ||||
|
|
|
| |||||
Property, plant and equipment, net | $ | 397 | $ | 450 | ||||
|
|
|
| |||||
Included in buildings and improvements is $21 million under a capital lease related to an office facility acquired in the Acquisition.
In millions | September 30, | |||||||||||
| 2011 | 2010 | 2009 | ||||||||||
ACCUMULATED OTHER COMPREHENSIVE LOSS | ||||||||||||
Change in unamortized pension, postretirement and postemployment benefit-related items, net of tax | $ | (1,111 | ) | $ | (1,014 | ) | $ | (827 | ) | |||
Foreign currency translation | (50 | ) | (28 | ) | (95 | ) | ||||||
Unrealized loss on term loan interest rate swap | (14 | ) | (37 | ) | (82 | ) | ||||||
Other | (3 | ) | (2 | ) | (4 | ) | ||||||
|
|
|
|
|
| |||||||
Accumulated other comprehensive loss | $ | (1,178 | ) | $ | (1,081 | ) | $ | (1,008 | ) | |||
|
|
|
|
|
| |||||||
F-27
Table of Contents
Supplemental Cash Flow Information
| Years ended September 30, | ||||||||||||
In millions | 2011 | 2010 | 2009 | |||||||||
OTHER PAYMENTS | ||||||||||||
Interest payments | $ | 371 | $ | 345 | $ | 348 | ||||||
Income tax payments | $ | 44 | $ | 39 | $ | 35 | ||||||
8. Business Restructuring Reserves and Programs
Fiscal 2011 Restructuring Program (unaudited)
During fiscal 2011, the Company continued to identify opportunities to streamline operations and generate cost savings which include exiting facilities and eliminating employee positions. Restructuring charges recorded during fiscal 2011 associated with these initiatives, net of adjustments to previous periods, were $189 million and include employee separation costs primarily associated with employee severance actions in Germany, as well as in Europe, the Middle East and Africa (“EMEA”) and U.S. regions. Employee separation charges includes $56 million associated with an agreement reached with the works council representing employees of certain of Avaya Inc’s German subsidiaries for the elimination of 210 positions. Severance and employment benefits payments associated with this action are expected to be paid through the quarter ending September 30, 2012, and include, but are not limited to, social pension fund payments and healthcare and unemployment insurance costs to be paid to or on behalf of the affected employees. Future rental payments, net of estimated sublease income, related to operating lease obligations for unused space in connection with the closing or consolidation of facilities are expected to continue through fiscal 2020. As the Company continues to evaluate and identify additional operational synergies, additional cost saving opportunities may be identified.
The following table summarizes the components of the fiscal 2011 restructuring program:
In millions | Employee Separation Costs | Lease Obligations | Total | |||||||||
2011 restructuring charges | $ | 155 | $ | 30 | $ | 185 | ||||||
Cash payments | (49 | ) | (6 | ) | (55 | ) | ||||||
Impact of foreign currency fluctuations | (5 | ) | — | (5 | ) | |||||||
|
|
|
|
|
| |||||||
Balance as of September 30, 2011 | $ | 101 | $ | 24 | $ | 125 | ||||||
|
|
|
|
|
| |||||||
Fiscal 2010 Restructuring Program
During fiscal 2010, in response to the global economic climate and the acquisition of NES, the Company began implementing initiatives designed to streamline the operations of the Company and generate cost savings and developed initiatives to eliminate overlapping processes and expenses associated with that acquisition. During the second and third quarters of fiscal 2010, the Company exited certain facilities and separated or relocated certain employees. Restructuring charges recorded during the fiscal year ended September 30, 2010, net of adjustments to previous periods, were $171 million, and include employee separation costs associated with involuntary employee severance actions primarily in EMEA and the U.S., as well as costs associated with closing and consolidating facilities. The headcount reductions and related payments identified in these actions are expected to be completed in fiscal 2013. Future rental payments, net of estimated sublease income, related to operating lease obligations for unused space in connection with the closing or consolidation of facilities are expected to continue through fiscal 2020.
F-28
Table of Contents
The following table summarizes the components of the fiscal 2010 restructuring program:
In millions | Employee Separation Costs | Lease Obligations | Total | |||||||||
2010 restructuring charges | $ | 151 | $ | 24 | $ | 175 | ||||||
Reserves acquired with NES | — | 8 | 8 | |||||||||
Cash payments | (76 | ) | (8 | ) | (84 | ) | ||||||
Impact of foreign currency fluctuations | 1 | — | 1 | |||||||||
|
|
|
|
|
| |||||||
Balance as of September 30, 2010 | 76 | 24 | 100 | |||||||||
Cash payments | (64 | ) | (13 | ) | (77 | ) | ||||||
Adjustments(1) | (7 | ) | 4 | (3 | ) | |||||||
Impact of foreign currency fluctuations | — | (1 | ) | (1 | ) | |||||||
|
|
|
|
|
| |||||||
Balance as of September 30, 2011 | $ | 5 | $ | 14 | $ | 19 | ||||||
|
|
|
|
|
| |||||||
| (1) | Included in adjustments are changes in estimates, whereby all increases and decreases in costs related to the Fiscal 2010 restructuring program are recorded to the restructuring charges line item in operating expenses in the period of the adjustment. |
Fiscal 2009 Restructuring Program
During fiscal 2009, as a response to the global economic downturn, the Company began implementing initiatives designed to streamline the operations of the Company and generate cost savings, which include exiting facilities and separating or relocating employees. Restructuring charges recorded during fiscal 2009 associated with these initiatives were $160 million and include employee separation costs primarily associated with involuntary employee severance actions in Germany, as well as in the EMEA and U.S. regions. The headcount reductions and related payments identified in this action are expected to be completed in fiscal 2013. Future rental payments, net of estimated sublease income, related to operating lease obligations for unused space in connection with the closing or consolidation of facilities are expected to continue through fiscal 2020.
The following table summarizes the components of the fiscal 2009 restructuring program:
In millions | Employee Separation Costs | Lease Obligations | Total | |||||||||
2009 restructuring charges | $ | 151 | $ | 9 | $ | 160 | ||||||
Cash payments | (44 | ) | (1 | ) | (45 | ) | ||||||
Impact of foreign currency fluctuations | 5 | — | 5 | |||||||||
|
|
|
|
|
| |||||||
Balance as of September 30, 2009 | 112 | 8 | 120 | |||||||||
Cash payments | (88 | ) | (3 | ) | (91 | ) | ||||||
Adjustments (1) | (5 | ) | — | (5 | ) | |||||||
Impact of foreign currency fluctuations | (7 | ) | — | (7 | ) | |||||||
|
|
|
|
|
| |||||||
Balance as of September 30, 2010 | 12 | 5 | 17 | |||||||||
Cash payments | (13 | ) | (4 | ) | (17 | ) | ||||||
Adjustments (1) | 5 | 2 | 7 | |||||||||
Impact of foreign currency fluctuations | (1 | ) | — | (1 | ) | |||||||
|
|
|
|
|
| |||||||
Balance as of September 30, 2011 | $ | 3 | $ | 3 | $ | 6 | ||||||
|
|
|
|
|
| |||||||
| (1) | Included in adjustments are changes in estimates, whereby all increases and decreases in costs related to the Fiscal 2009 restructuring program are recorded to the restructuring charges line item in operating expenses in the period of the adjustment. |
F-29
Table of Contents
Fiscal 2008 Restructuring Reserve
In connection with the Merger, Avaya’s management and board of directors developed various plans and initiatives designed to streamline the operations of the Company and generate cost savings, which include exiting facilities and separating or relocating employees. As a result, the Company recorded approximately $251 million of liabilities associated with involuntary employee severance actions and approximately $79 million established for future lease payments on properties expected to be closed or consolidated as part of these initiatives. These amounts include the remaining payments associated with the restructuring reserves of periods prior to the Merger. The headcount reductions associated with this restructuring program were substantially completed in 2009 and the related payments are expected to be completed in fiscal 2017. Cash payments associated with the lease obligations, net of sub-lease income, are expected to continue through 2020.
The following table summarizes the components of this reserve:
In millions | Employee Separation Costs | Lease Obligations | Total | |||||||||
Balance as of October 1, 2008 | $ | 146 | $ | 67 | $ | 213 | ||||||
Cash payments | (89 | ) | (11 | ) | (100 | ) | ||||||
Adjustments (1) | (15 | ) | (7 | ) | (22 | ) | ||||||
Impact of foreign currency fluctuations | 3 | — | 3 | |||||||||
|
|
|
|
|
| |||||||
Balance as of September 30, 2009 | 45 | 49 | 94 | |||||||||
Cash payments | (29 | ) | (6 | ) | (35 | ) | ||||||
Adjustments (1) | 1 | (8 | ) | (7 | ) | |||||||
Impact of foreign currency fluctuations | (3 | ) | (1 | ) | (4 | ) | ||||||
|
|
|
|
|
| |||||||
Balance as of September 30, 2010 | 14 | 34 | 48 | |||||||||
Cash payments | (9 | ) | (4 | ) | (13 | ) | ||||||
Adjustments (1) | (1 | ) | (1 | ) | (2 | ) | ||||||
Impact of foreign currency fluctuations | 2 | 1 | 3 | |||||||||
|
|
|
|
|
| |||||||
Balance as of September 30, 2011 | $ | 6 | $ | 30 | $ | 36 | ||||||
|
|
|
|
|
| |||||||
| (1) | Included in adjustments are changes in estimates, whereby all increases in costs related to the Fiscal 2008 restructuring program are recorded to the restructuring charges line item in operating expenses in the period of the adjustment and decreases in costs are recorded as adjustments to goodwill, as these reserves relate to actions taken prior to the Company’s adoption of ASC 805, “Business Combinations.” |
F-30
Table of Contents
9. Financing Arrangements
In connection with the Merger, on October 26, 2007, Avaya Inc. entered into financing arrangements consisting of a senior secured credit facility, a senior unsecured credit facility, which later became senior unsecured notes, and a senior secured multi-currency asset-based revolving credit facility. On February 11, 2011, Avaya Inc. amended and extended its senior secured credit facility and issued senior secured notes, the proceeds of which were used to repay the senior secured incremental term B-2 loans in full under Avaya Inc.’s senior secured credit facility and related fees and expenses. Long-term debt consists of the following:
| September 30, | ||||||||
In millions | 2011 | 2010 | ||||||
Senior secured term B-1 loans | $ | 1,449 | $ | 3,662 | ||||
Senior secured incremental term B-2 loans | — | 732 | ||||||
Senior secured term B-3 loans | 2,165 | — | ||||||
Senior secured notes | 1,009 | — | ||||||
9.75% senior unsecured cash pay notes due 2015 | 700 | 700 | ||||||
10.125%/10.875% senior unsecured PIK toggle notes due 2015 | 834 | 834 | ||||||
|
|
|
| |||||
| 6,157 | 5,928 | |||||||
Debt maturing within one year | (37 | ) | (48 | ) | ||||
|
|
|
| |||||
Long-term debt | $ | 6,120 | $ | 5,880 | ||||
|
|
|
| |||||
Senior Secured Credit Facility
Prior to refinancing on February 11, 2011, the senior secured credit facility consisted of (a) a senior secured multi-currency revolver allowing for borrowings of up to $200 million, (b) a $3,800 million senior secured term loan (the “term B-1 loans”), which was drawn in full on the closing date of the Merger and (c) a $1,000 million incremental senior secured term loan (the “incremental term B-2 loans”), which was drawn in full at an original issue discount of 20.0% on December 18, 2009, the date of the Acquisition.
Borrowings under the term B-1 loans originally bore interest at a rate per annum equal to either a base rate or a LIBOR rate, in each case plus an applicable margin. The base rate is determined by reference to the higher of (1) the prime rate of Citibank, N.A. and (2) the federal funds effective rate plus 1/2 of 1%. The LIBOR rate is determined by a reference rate. The applicable margin for borrowings was 1.75% per annum with respect to the base rate and 2.75% per annum with respect to LIBOR borrowings.
In connection with the financing of the Acquisition, Avaya Inc. received $800 million in exchange for incremental term B-2 loans payable with a face value of $1,000 million and detachable warrants to purchase 61.5 million shares of the Avaya Holdings Corp.’s common stock. The incremental term B-2 loans bore interest at a rate equal to, at Avaya Inc.’s option, either (1) a LIBOR rate (subject to a floor of 3.0%) plus a margin of 7.5%, or (2) a base rate (subject to a floor of 4.0%) plus a margin of 6.5%. Except with respect to interest rates, the incremental term B-2 loans had substantially the same terms as the term B-1 loans, including the maturity dates, security interests, amortization, covenants and events of default. The terms of the incremental term B-2 loans were negotiated and agreed during the spring of 2009 at the time Avaya Inc. submitted its stalking horse bid for the Acquisition, and based on the agreed terms in relation to the market conditions existing at the time, the discount from the face amount of the loans was determined. In addition to receiving payments of principal and interest, upon funding of their loans at the closing of the Acquisition, the financing sources that committed to provide the new term loans in July 2009 in connection with Avaya Inc.’s proposal to purchase NES received an aggregate commitment fee of $16 million. Proceeds from the issuance of the incremental term B-2 loans and associated warrants, net of commitment fees and reimbursement of the creditors’ costs of $1 million, was $783 million.
F-31
Table of Contents
In accordance with GAAP, Avaya Inc. allocated the net proceeds received at closing between debt and warrants based on their relative fair values. The estimated fair value of the incremental term B-2 loans on December 18, 2009 was $1,096 million and was estimated using a discounted cash flow analysis based on the Avaya Inc.’s current incremental borrowing rates for similar types of borrowing arrangements (e.g. a Level 2 Input). The warrants have a term of 10 years, have an exercise price of $3.25 per share and an aggregate estimated fair value of $114 million. The fair value of each warrant was determined utilizing the Cox-Ross-Rubinstein (“CRR”) binomial option under the following assumptions: estimated fair value of underlying stock of $3.00; expected term to exercise of 10 years; expected volatility of 48.8%; risk-free interest rate of 3.6%; and no dividend yield. Avaya Inc. allocated the net cash proceeds of $783 million received to the incremental term B-2 loans and the warrants based on their relative fair values, or $709 million and $74 million, respectively. The difference between the carrying value of the incremental term B-2 loans as calculated and the $1,000 million face value of the incremental term B-2 loans at the date of issuance was recorded as a debt discount to be accreted over the term of the debt as interest expense using the effective interest rate method.
Funds affiliated with Silver Lake and TPG provided an aggregate of $443 million of cash proceeds from the issuance of the incremental term B-2 loans, with each sponsor-affiliated lending group providing approximately $222 million of such cash proceeds. In connection with their financing commitment, the Silver Lake and TPG funds received an aggregate of $14 million of commitment fees. Based upon funding of their loans at the closing of the Acquisition, the Silver Lake and TPG funds received warrants to purchase an aggregate of 34,069,554 shares of our common stock at an exercise price equal to $3.25 per share.
On February 11, 2011, Avaya Inc. amended and restated the senior secured credit facility to reflect modifications to certain provisions thereof. The modified terms of the senior secured credit facility include (1) an amendment which allowed the Company to extend the maturity of a portion of the term B-1 loans representing outstanding principal amounts of $2.2 billion from October 26, 2014 to October 26, 2017 (potentially springing to July 26, 2015, under the circumstances described below) by converting such loans into a new tranche of senior secured B-3 loans (the “term B-3 loans”); (2) permission, at the election of Avaya Inc., to apply prepayments of term loans to the incremental term B-2 loans prior to the term B-1 loans and term B-3 loans and thereafter to the class of term loans with the next earliest maturity; (3) permission to issue indebtedness (including the senior secured notes described below) to refinance a portion of the term loans under the senior secured credit facility and to secure such indebtedness (including the senior secured notes) on a pari passu basis with the obligations under the senior secured credit facility; (4) permission for future refinancing of the term loans under the senior secured credit facility; and (5) permission for future extensions of the term loans and revolving credit commitments (including, in the case of the revolving credit commitments, by obtaining new revolving credit commitments) under the senior secured credit facility.
The new tranche of term B-3 loans bears interest at a rate per annum equal to either a base rate or a LIBOR rate, in each case plus an applicable margin. The base rate is determined by reference to the higher of (1) the prime rate of Citibank, N.A. and (2) the federal funds effective rate plus 1/2 of 1%. The applicable margin for borrowings of term B-3 loans is 3.50% per annum with respect to base rate borrowings and 4.50% per annum with respect to LIBOR borrowings. No changes were made to the maturity date or interest rates payable with respect to the non-extended term B-1 loans described above.
The maturity of the term B-3 loans will automatically become due July 26, 2015 unless (i) the total net leverage ratio as tested on that date based upon the most recent financial statements provided to the lenders under the senior secured credit facility is no greater than 5.0 to 1.0 or (ii) on or prior to such date, either (x) an initial public offering shall have occurred or (y) at least $750 million in aggregate principal amount of Avaya Inc.’s senior unsecured cash-pay notes and/or senior unsecured paid-in-kind (“PIK”) toggle notes have been repaid or refinanced or their maturity has been extended to a date no earlier than 91 days after October 26, 2017.
The amendment and restatement of the senior secured credit facility represents a debt modification for accounting purposes. Accordingly, third party expenses of $9 million incurred in connection with the transaction
F-32
Table of Contents
were expensed as incurred and included in other income, net. Avaya Inc.’s financing sources that held term B-1 loans and/or revolving credit commitments under the senior secured credit facility and consented to the amendment and restatement of the senior secured credit facility received in aggregate a consent fee of $10 million. Fees paid to or on behalf of the creditors in connection with the modification were recorded as a discount to the face value of the debt and will be accreted over the term of the debt as interest expense.
Additionally, as discussed more fully below, on February 11, 2011, Avaya Inc. completed a private placement of $1,009 million of senior secured notes, the proceeds of which were used to repay in full the incremental term B-2 loans outstanding under the senior secured credit facility.
The senior secured multi-currency revolver, which allows for borrowings of up to $200 million, was not impacted by the refinancing. The senior secured multi-currency revolver includes capacity available for letters of credit and for short-term borrowings, and is available in euros in addition to dollars. Borrowings are guaranteed by the Company and substantially all of Avaya Inc.’s U.S. subsidiaries. The senior secured facility, consisting of term loans and a senior secured multi-currency revolver, is secured by substantially all assets of Avaya Holdings Corp., Avaya, Inc. and the subsidiary guarantors. As of September 30, 2011, there were no amounts outstanding under the senior secured multi-currency revolver.
On August 8, 2011, the Company amended the terms of the senior secured multi-currency revolver to extend the final maturity from October 26, 2013 to October 26, 2016. All other terms and conditions of the senior secured credit facility remain unchanged.
During fiscal 2011 and 2010, the Company paid $42 million and $48 million, respectively in aggregate quarterly principal payments on the senior secured term loans outstanding under the senior secured credit facility. In addition, Avaya Inc. is required to prepay outstanding term loans based on its annual excess cash flow, as defined in the senior secured credit facility. No such excess cash payment was required during fiscal 2011 and 2010 based on fiscal 2010 and 2009 cash flows, respectively.
As a result of the refinancing transaction, the term loans outstanding under the senior secured credit facility include term B-1 loans and term B-3 loans with remaining face values as of September 30, 2011 (after all principal payments to date) of $1,449 million and $2,174 million, respectively. Avaya Inc. is required to make scheduled quarterly principal payments under the term B-1 loans and the term B-3 loans, equal to $10 million in the aggregate.
In connection with the senior secured credit facility, Avaya Inc. entered into interest rate swaps to effectively convert a portion of the floating-rate debt into fixed rate debt. During fiscal 2011 and 2010, Avaya Inc. made interest payments aggregating $218 million and $277 million, respectively, related to the term B-1 loans, term B-3 loans and incremental term B-2 loans portion of this facility, net of related swaps. In addition to paying interest on outstanding principal under the senior secured credit facility, Avaya Inc. is required to pay a commitment fee of 0.50% per annum in respect of unutilized commitments under the revolver portion of this facility.
Senior Unsecured Notes
Avaya Inc. issued $700 million of senior unsecured cash-pay notes and $750 million of senior unsecured PIK toggle notes. The interest rate for the cash-pay notes is fixed at 9.75% and the interest rates for the cash interest and PIK interest portions of the PIK toggle notes are fixed at 10.125% and 10.875%, respectively. Avaya Inc. may prepay the senior unsecured notes commencing November 1, 2011 at 104.875% of the cash pay note and at 105.0625% of PIK toggle note principal amount, which decreases to 102.4375% and 102.5313%, respectively, on November 1, 2012 and to 100% of each on or after November 1, 2013.
In accordance with its debt agreements, Avaya Inc. was required to file a registration statement with the SEC to provide for the exchange of the senior unsecured notes for publicly registered securities having similar
F-33
Table of Contents
terms to the senior unsecured notes. The agreements provided that Avaya Inc. use reasonable efforts to have such registration statement effective and the exchange offer completed prior to October 24, 2009 (the “Effectiveness Date”). In connection with the then pending acquisition of NES, SEC regulations required that Avaya Inc. includes in its registration statement certain audited financial statements of NES. The preparation of these financial statements was outside of the control of Avaya Inc. and they were not available prior to the Effectiveness Date. Therefore, the registration statement could not be completed by the Effectiveness Date. Avaya Inc. was required to pay additional interest on the senior unsecured notes at the rate of $0.05 per week per $1,000 principal amount for the first 90-day period immediately following the Effectiveness Date, and such rate was due to increase by an additional $0.05 per week per $1,000 principal amount with respect to each subsequent 90-day period until the exchange offer was completed, up to a maximum additional interest rate of $0.10 per week per $1,000 principal amount. Avaya Inc.’s Registration Statement on Form S-4 was filed with the SEC on December 23, 2009 and declared effective by the SEC on January 14, 2010. Avaya Inc. subsequently completed the exchange offer on February 12, 2010. The additional interest expense associated with this debt of $1 million was expensed through September 30, 2009 when such additional interest became probable in accordance with GAAP.
Substantially all of the Avaya Inc.’s U.S. 100% subsidiaries are guarantors of the senior unsecured notes. For the periods May 1, 2009 through October 31, 2009 and November 1, 2009 through April 30, 2010, the Company elected to pay interest in kind on Avaya Inc.’s senior PIK toggle notes. PIK interest of $41 million and $43 million was added, for these periods, respectively, to the principal amount of the senior unsecured notes effective November 1, 2009 and May 1, 2010, respectively, and will be payable when the senior unsecured notes become due. For the period of May 1, 2010 through October 31, 2010, November 1, 2010 through April 30, 2011, and May 1, 2011 to October 31, 2011 Avaya Inc. has elected to make such payments in cash interest. Under the terms of these notes, after November 1, 2011 Avaya Inc. is required to make all interest payments on the senior secured PIK toggle notes entirely in cash.
Senior Secured Asset-Based Credit Facility
Avaya Inc.’s senior secured multi-currency asset-based revolving credit facility allows for borrowings of up to $335 million, subject to availability under a borrowing base, of which $150 million may be in the form of letters of credit. The borrowing base at any time equals the sum of 85% of eligible accounts receivable plus 85% of the net orderly liquidation value of eligible inventory, subject to certain reserves and other adjustments. Avaya Inc. and substantially all of its U.S. subsidiaries are borrowers under this facility, and borrowings are guaranteed by Avaya Holdings Corp., Avaya Inc. and substantially all of Avaya Inc.’s U.S. subsidiaries. The facility is secured by substantially all assets of Avaya Holdings Corp., Avaya Inc. and the subsidiary guarantors. The senior secured multi-currency asset-based revolving credit facility also provides Avaya Inc. with the right to request up to $100 million of additional commitments under this facility.
On August 8, 2011, the Company amended the terms of its multi-currency asset-based revolving credit facility to extend its final maturity from October 26, 2013 to October 25, 2016. All other terms and conditions of the senior secured multi-currency asset-based revolving credit facility remain unchanged.
At September 30, 2011 and 2010, there were no borrowings under this facility. At September 30, 2011 and 2010 there were $75 million and $53 million of letters of credit issued in the ordinary course of business under the senior secured multi-currency revolver resulting in remaining availability of borrowings under that facility of $252 million and $237 million, respectively.
Senior Secured Notes
On February 11, 2011, Avaya Inc. completed a private placement of $1,009 million of senior secured notes. The senior secured notes were issued at par, bear interest at a rate of 7% per annum and mature on April 1, 2019. The senior secured notes were sold through a private placement to qualified institutional buyers pursuant to
F-34
Table of Contents
Rule 144A (and outside the United States in reliance on Regulation S) under the Securities Act of 1933, as amended (the “Securities Act”) and have not been, and will not be, registered under the Securities Act or applicable state securities laws.
Avaya Inc. may redeem the senior secured notes commencing April 1, 2015 at 103.5% of the principal amount redeemed, which decreases to 101.75% on April 1, 2016 and to 100% on or after April 1, 2017. Avaya Inc. may redeem all or part of the notes at any time prior to April 1, 2015 at 100% of the principal amount redeemed plus a “make-whole” premium. In addition, Avaya Inc. may redeem up to 35% of the original aggregate principal balance of the senior secured notes at any time prior to April 1, 2014 with the net proceeds of certain equity offerings at 107% of the aggregate principal amount of senior secured notes redeemed. Upon the occurrence of specific kinds of changes of control, Avaya Inc. will be required to make an offer to purchase the senior secured notes at 101% of their principal amount. If Avaya Inc. or any of its restricted subsidiaries engages in certain asset sales, under certain circumstances Avaya Inc. will be required to use the net proceeds to make an offer to purchase the senior secured notes at 100% of their principal amount.
Substantially all of Avaya Inc.’s U.S. 100%-owned subsidiaries are guarantors of the senior secured notes. The senior secured notes are secured by substantially all of the assets of Avaya Inc. and the subsidiary guarantors.
The proceeds from the notes were used to repay in full the senior secured incremental term B-2 loans outstanding under the senior secured credit facility (representing $988 million in aggregate principal amount and $12 million in accrued and unpaid interest) and to pay related fees and expenses.
The issuance of the senior secured notes and repayment of the incremental term B-2 loans was accounted for as an extinguishment of the incremental term B-2 loans and issuance of new debt. Accordingly, the difference between the reacquisition price of the incremental term B-2 loans (including consent fees paid by the Company to the holders of the incremental term B-2 loans that consented to the amendment and restatement of the senior secured credit facility of $1 million) and the carrying value of the incremental term B-2 loans (including unamortized debt discount and debt issue costs) of $246 million was recognized as a loss upon debt extinguishment during fiscal 2011. In connection with the issuance of the senior secured notes, the Company capitalized financing costs of $23 million during fiscal 2011 and is amortizing these costs over the term of the senior secured notes.
Avaya Inc.’s senior secured credit facility, senior secured multi-currency asset-based revolving credit facility, and the indentures governing Avaya Inc.’s notes contain a number of covenants, that, among other things and subject to certain exceptions, restrict Avaya Inc.’s ability and the ability of certain of its subsidiaries to: (a) incur or guarantee additional debt and issue or sell certain preferred stock; (b) pay dividends on, redeem or repurchase capital stock; (c) make certain acquisitions or investments; (d) incur or assume certain liens; (e) enter into transactions with affiliates; (f) merge or consolidate with another company; (g) transfer or otherwise dispose of assets; (h) redeem subordinated debt; (i) incur obligations that restrict the ability of its subsidiaries to make dividends or other payments to Avaya Holdings Corp. or Avaya Inc.; and (j) create or designate unrestricted subsidiaries. They also contain customary affirmative covenants and events of default.
As of September 30, 2011 and 2010, Avaya Inc. was not in default under its senior secured credit facility, the indenture governing its senior secured notes, the indenture governing its senior unsecured notes or its senior secured multi-currency asset-based revolving credit facility.
The weighted average interest rates of the Company’s outstanding debt was 6% as of September 30, 2011 and 2010, excluding the impact of the interest rate swaps described in Note 10, “Derivatives and Other Financial Instruments”.
F-35
Table of Contents
Annual maturities of long-term debt for each of the next five years ending September 30 and thereafter consist of:
In millions | ||||
2012 | 38 | |||
2013 | 38 | |||
2014 | 38 | |||
2015 | 1,442 | |||
2016 | 1,542 | |||
2017 and thereafter | 3,068 | |||
|
| |||
Total | $ | 6,166 | ||
|
| |||
Capital Lease Obligations
Included in other liabilities are $23 million and $25 million of capital lease obligations as of September 30, 2011 and 2010, respectively, primarily associated with an office facility assumed in the acquisition of NES.
10. Derivatives and Other Financial Instruments
Interest Rate Swaps
The Company uses interest rate swaps to manage the amount of its floating rate debt in order to reduce its exposure to variable rate interest payments associated with certain borrowings under the senior secured credit facility. The interest rate swaps presented below are designated as cash flow hedges. The fair values of each interest rate swap is reflected as an asset or liability in the Consolidated Balance Sheets, reported as a component of other comprehensive loss and reclassified to earnings in the same period or periods during which the hedged transaction affects earnings. Gains and losses on derivative instruments representing hedge ineffectiveness are recognized in current earnings. The fair value of each interest rate swap is estimated as the net present value of their projected cash flows at the balance sheet date.
The details of these swaps, which are designated as cash flow hedges, are as follows:
In millions | Effective Date | Maturity Date | Notional Amount | Floating Rate Received by Avaya | Fixed Rate Paid by Avaya | |||||||||||||||
4-year swap | November 26, 2007 | November 26, 2011 | $ | 200 | 3-month LIBOR | 4.485 | % | |||||||||||||
5-year swap | November 26, 2007 | November 26, 2012 | 300 | 3-month LIBOR | 4.591 | % | ||||||||||||||
|
| |||||||||||||||||||
Notional amount—2007 swaps |
| 500 | ||||||||||||||||||
|
| |||||||||||||||||||
3-year swap | August 26, 2010 | August 26, 2013 | 750 | 3-month LIBOR | 1.160 | % | ||||||||||||||
3-year swap | August 26, 2010 | August 26, 2013 | 750 | 3-month LIBOR | 1.135 | % | ||||||||||||||
|
| |||||||||||||||||||
Notional amount—2010 swaps |
| 1,500 | ||||||||||||||||||
|
| |||||||||||||||||||
Notional amount—Total |
| $ | 2,000 | |||||||||||||||||
|
| |||||||||||||||||||
Additionally, the Company entered into an interest rate swap during fiscal 2011 in order to reduce exposure to variable rate interest payments associated with certain borrowings under the senior secured credit facility which the Company has elected not to designate as a hedge thereby precluding the use of hedge accounting. The interest rate swap has an effective date of August 26, 2011 and a maturity date of November 26, 2011. Under the terms of the interest rate swap contract, the Company fixed interest payments on a notional amount of $1,500 million at 0.3425% and will receive floating rate interest based on the 3-month LIBOR rate. The fair value of the interest rate swap is classified within other current assets or other current liabilities on the Consolidated Balance Sheet. Gains and losses on the changes in the fair value of the interest rate swap are included in other
F-36
Table of Contents
income (expense), net. During the year ended September 30, 2011 the loss on the interest rate swap contract included in other income, net was less than $1 million.
The following table summarizes the gains and losses of the interest rate contracts qualifying and designated as cash flow hedging instruments under ASC 815:
| Years ended September 30, | ||||||||||||
In millions | 2011 | 2010 | 2009 | |||||||||
Loss (Gain) on interest rate swaps | ||||||||||||
Recognized in other comprehensive loss | $ | (23 | ) | $ | (45 | ) | $ | 56 | ||||
|
|
|
|
|
| |||||||
Reclassified from accumulated other comprehensive loss into interest expense | $ | 42 | $ | 76 | $ | 76 | ||||||
|
|
|
|
|
| |||||||
Recognized in operations (ineffective portion) | $ | — | $ | — | $ | — | ||||||
|
|
|
|
|
| |||||||
The Company expects to reclassify approximately $23 million from accumulated other comprehensive loss into expense in the next twelve months related to the Company’s interest rate swaps based on the projected borrowing rates at September 30, 2011.
Foreign Currency Forward Contracts
The Company utilizes foreign currency forward contracts primarily to manage short-term exchange rate exposures on certain receivables, payables and intercompany loans residing on foreign subsidiaries’ books, which are denominated in currencies other than the subsidiary’s functional currency. When those items are revalued into the subsidiaries’ functional currencies at the month-end exchange rates, the fluctuations in the exchange rates are recognized in the Consolidated Statements of Operations as the other income (expense), net. Changes in the fair value of the Company’s foreign currency forward contracts used to offset these exposed items are also recognized in the Consolidated Statements of Operations as other income (expense), net in the period in which the exchange rates change.
The gains and (losses) of the foreign currency forward contracts included in other income (expense) were ($7) million, $27 million and ($24) million for fiscal years 2011, 2010 and 2009, respectively.
The notional amount of the Company’s financial instruments represents the face amount of the contractual arrangements and the basis on which U.S. dollars are to be exchanged. They are not a measure of market or credit exposure. The following table summarizes these notional amounts that principally represent the equivalent in U.S. dollars for contracts in their respective currencies:
| September 30, | ||||||||
In millions | 2011 | 2010 | ||||||
Euros | $ | — | $ | 429 | ||||
British pound sterling | 45 | 170 | ||||||
Canadian dollars | 28 | 64 | ||||||
Australian dollars | 1 | 53 | ||||||
Singapore dollars | 7 | 11 | ||||||
Mexican peso | 2 | 23 | ||||||
Hungarian forints | 6 | 20 | ||||||
Japanese yen | 24 | 19 | ||||||
Indian rupee | 21 | 2 | ||||||
All other foreign currencies | 62 | 67 | ||||||
|
|
|
| |||||
| $ | 196 | $ | 858 | |||||
|
|
|
| |||||
F-37
Table of Contents
The following table summarizes the estimated fair value of derivatives:
In millions | September 30, 2011 | September 30, 2010 | ||||||||||||||||||||||
Balance Sheet Location | Total | Foreign Currency Forward Contracts | Interest Rate Swaps | Total | Foreign Currency Forward Contracts | Interest Rate Swaps | ||||||||||||||||||
Other current assets | $ | 1 | $ | 1 | $ | — | $ | 5 | $ | 5 | $ | — | ||||||||||||
Other current liabilities | (26 | ) | (2 | ) | (24 | ) | (67 | ) | (23 | ) | (44 | ) | ||||||||||||
Other non-current liabilities | (10 | ) | — | (10 | ) | (18 | ) | — | (18 | ) | ||||||||||||||
|
|
|
|
|
|
|
|
|
|
|
| |||||||||||||
Net Liability | $ | (35 | ) | $ | (1 | ) | $ | (34 | ) | $ | (80 | ) | $ | (18 | ) | $ | (62 | ) | ||||||
|
|
|
|
|
|
|
|
|
|
|
| |||||||||||||
11. Fair Value Measures
Pursuant to the accounting guidance for fair value measurements and its subsequent updates, fair value is defined as the price that would be received from selling an asset or paid to transfer a liability in an orderly transaction between market participants at the measurement date. When determining the fair value measurements for assets and liabilities required or permitted to be recorded at fair value, the Company considers the principal or most advantageous market in which it would transact and it considers assumptions that market participants would use when pricing the asset or liability.
Fair Value Hierarchy
The accounting guidance for fair value measurement also requires an entity to maximize the use of observable inputs and minimize the use of unobservable inputs when measuring fair value. A financial instrument’s categorization within the fair value hierarchy is based upon the lowest level of input that is significant to the fair value measurement. The inputs are prioritized into three levels that may be used to measure fair value:
Level 1: Inputs that reflect quoted prices for identical assets or liabilities in active markets that are observable.
Level 2: Inputs that reflect quoted prices for similar assets or liabilities in active markets; quoted prices for identical or similar assets or liabilities in markets with insufficient volume or infrequent transactions (less active markets); or model-derived valuations in which significant inputs are observable or can be derived principally from, or corroborated by, observable market data.
Level 3: Inputs that are unobservable to the extent that observable inputs are not available for the asset or liability at the measurement date.
F-38
Table of Contents
Asset and Liabilities Measured at Fair Value on a Recurring Basis
Assets and liabilities measured at fair value on a recurring basis as of September 30, 2011 and 2010 were as follows:
| Fair Value Measurement Using | ||||||||||||||||
In millions | Fair Value at September 30, 2011 | Quoted Prices in Active Markets for Identical Instruments (Level 1) | Significant Other Observable Inputs (Level 2) | Significant Unobservable Inputs (Level 3) | ||||||||||||
Other Current Assets: | ||||||||||||||||
Foreign currency forward contracts | $ | 1 | $ | — | $ | 1 | $ | — | ||||||||
|
|
|
|
|
|
|
| |||||||||
Other Non-Current Assets: | ||||||||||||||||
Investments | $ | 11 | $ | 9 | $ | 2 | $ | — | ||||||||
|
|
|
|
|
|
|
| |||||||||
Other Current Liabilities: | ||||||||||||||||
Foreign currency forward contracts | $ | 2 | $ | — | $ | 2 | $ | — | ||||||||
Interest rate swaps | 24 | — | 24 | — | ||||||||||||
|
|
|
|
|
|
|
| |||||||||
| $ | 26 | $ | — | $ | 26 | $ | — | |||||||||
|
|
|
|
|
|
|
| |||||||||
Other Non-Current Liabilities: | ||||||||||||||||
Interest rate swaps | $ | 10 | $ | — | $ | 10 | $ | — | ||||||||
|
|
|
|
|
|
|
| |||||||||
| Fair Value Measurements Using | ||||||||||||||||
In millions | Fair Value at September 30, 2010 | Quoted Prices in Active Markets for Identical Instruments (Level 1) | Significant Other Observable Inputs (Level 2) | Significant Unobservable Inputs (Level 3) | ||||||||||||
Other Current Assets: | ||||||||||||||||
Foreign currency forward contracts | $ | 5 | $ | — | $ | 5 | $ | — | ||||||||
|
|
|
|
|
|
|
| |||||||||
Other Non-Current Assets: | ||||||||||||||||
Investments | $ | 10 | $ | 10 | $ | — | $ | — | ||||||||
|
|
|
|
|
|
|
| |||||||||
Other Current Liabilities: | ||||||||||||||||
Foreign currency forward contracts | $ | 23 | $ | — | $ | 23 | $ | — | ||||||||
Interest rate swaps | 44 | — | 44 | — | ||||||||||||
|
|
|
|
|
|
|
| |||||||||
| $ | 67 | $ | — | $ | 67 | $ | — | |||||||||
|
|
|
|
|
|
|
| |||||||||
Other Non-Current Liabilities: | ||||||||||||||||
Interest rate swaps | $ | 18 | $ | — | $ | 18 | $ | — | ||||||||
|
|
|
|
|
|
|
| |||||||||
Interest Rate Swaps
Interest rate swaps classified as Level 2 assets and liabilities are priced using non-binding market prices that are corroborated by observable market data, or discounted cash flow techniques. Significant inputs to the discounted cash flow model include projected future cash flows based on projected 3-month LIBOR rates, and the average margin for companies with similar credit ratings and similar maturities. These are classified as Level 2 as they are not actively traded and are valued using pricing models that use observable market inputs.
Foreign Currency Forward Contracts
Foreign currency forward contracts classified as Level 2 assets and liabilities are priced using quoted market prices for similar assets or liabilities in active markets.
F-39
Table of Contents
Investments
Investments classified as Level 2 assets and liabilities are priced using quoted market prices in markets with insufficient volume.
Fair Value of Financial Instruments
The fair values of cash and cash equivalents, accounts receivable, accounts payable and accrued expenses, to the extent the underlying liability will be settled in cash, approximate carrying values because of the short-term nature of these instruments.
The fair values of the amounts borrowed under the Company’s financing arrangements at September 30, 2011 and 2010 were estimated based on a Level 2 input using quoted market prices in markets with insufficient volume.
The estimated fair values of the amounts borrowed under the Company’s credit agreements at September 30, 2011 and 2010 are as follows:
| September 30, 2011 | September 30, 2010 | |||||||||||||||
In millions | Carrying Amount | Fair Value | Carrying Amount | Fair Value | ||||||||||||
Senior secured term B-1 loans | $ | 1,449 | $ | 1,298 | $ | 3,662 | $ | 3,250 | ||||||||
Senior secured incremental term B-2 loans | — | — | 732 | 1,018 | ||||||||||||
Senior secured term B-3 loans | 2,165 | 1,833 | — | — | ||||||||||||
Senior secured notes | 1,009 | 854 | — | — | ||||||||||||
9.75% senior unsecured cash pay notes due 2015 | 700 | 511 | 700 | 665 | ||||||||||||
10.125%/10.875% senior unsecured PIK toggle notes due 2015 | 834 | 612 | 834 | 792 | ||||||||||||
|
|
|
|
|
|
|
| |||||||||
Total | $ | 6,157 | $ | 5,108 | $ | 5,928 | $ | 5,725 | ||||||||
|
|
|
|
|
|
|
| |||||||||
12. Income Taxes
The provision for income taxes is comprised of U.S. Federal, state and non-U.S. taxes. A reconciliation of the Company’s loss before income taxes at the U.S. Federal statutory rate to the provision for income taxes is as follows:
| Years ended September 30, | ||||||||||||
In millions | 2011 | 2010 | 2009 | |||||||||
Income tax benefit computed at the U.S. Federal statutory rate of 35% | $ | (278 | ) | $ | (300 | ) | $ | (286 | ) | |||
State and local income taxes (benefit), net of federal income tax effect | 3 | (3 | ) | 17 | ||||||||
Tax differentials on foreign earnings | 106 | 25 | 26 | |||||||||
Non-deductible transaction costs | — | (6 | ) | 6 | ||||||||
Research and experimental credit | — | 4 | (7 | ) | ||||||||
Non-deductible portion of goodwill impairment | — | — | 81 | |||||||||
Other differences—net | 13 | 11 | 10 | |||||||||
Divestiture of AGC | — | 13 | — | |||||||||
Audit settlements | — | (28 | ) | — | ||||||||
In-process research and development charge | — | — | 4 | |||||||||
Valuation allowance | 224 | 302 | 179 | |||||||||
|
|
|
|
|
| |||||||
Provision for income taxes | $ | 68 | $ | 18 | $ | 30 | ||||||
|
|
|
|
|
| |||||||
In fiscal 2011, $197 million of the $224 million increase in the valuation allowance relates to net deferred tax assets generated from pre-tax book losses in the U.S. and $27 million outside the U.S., primarily in Germany.
F-40
Table of Contents
In fiscal 2010, $233 million of the $302 million increase in the valuation allowance relates to net deferred tax assets generated from pre-tax book losses in the U.S. and $69 million outside the U.S., primarily in Germany. In fiscal 2009, $111 million of the $179 million increase in the valuation allowance relates to net deferred tax assets generated from pre-tax book tax losses in the U.S. and $68 million outside of the U.S., primarily in Germany. The reconciliation for fiscal 2009 includes the effects of the non-deductible portion of goodwill impairment and non-deductible IPRD charge.
The following table presents the U.S. and foreign components of loss before income taxes and the provision for income taxes:
| Years ended September 30, | ||||||||||||
In millions | 2011 | 2010 | 2009 | |||||||||
INCOME BEFORE INCOME TAXES: | ||||||||||||
U.S. | $ | (587 | ) | $ | (647 | ) | $ | (704 | ) | |||
Foreign | (208 | ) | (206 | ) | (111 | ) | ||||||
|
|
|
|
|
| |||||||
Loss before income taxes | $ | (795 | ) | $ | (853 | ) | $ | (815 | ) | |||
|
|
|
|
|
| |||||||
(BENEFIT FROM) PROVISION FOR INCOME TAXES: | ||||||||||||
CURRENT | ||||||||||||
Federal | $ | (1 | ) | $ | (12 | ) | $ | — | ||||
State and local | 3 | — | 3 | |||||||||
Foreign | 69 | 23 | 45 | |||||||||
|
|
|
|
|
| |||||||
| 71 | 11 | 48 | ||||||||||
|
|
|
|
|
| |||||||
DEFERRED | ||||||||||||
Federal | 15 | 21 | (47 | ) | ||||||||
State and local | — | (3 | ) | 21 | ||||||||
Foreign | (18 | ) | (11 | ) | 8 | |||||||
|
|
|
|
|
| |||||||
| (3 | ) | 7 | (18 | ) | ||||||||
|
|
|
|
|
| |||||||
Provision for income taxes | $ | 68 | $ | 18 | $ | 30 | ||||||
|
|
|
|
|
| |||||||
The components of deferred tax assets and liabilities as of September 30, 2011 and 2010 are as follows:
| September 30, | ||||||||
In millions | 2011 | 2010 | ||||||
DEFERRED INCOME TAX ASSETS: | ||||||||
Benefit obligations | $ | 822 | $ | 801 | ||||
Accrued liabilities | — | 11 | ||||||
Net operating losses / credit carryforwards | 1,038 | 854 | ||||||
Property, plant and equipment | 26 | 30 | ||||||
Other | 72 | 102 | ||||||
Valuation allowance | (1,410 | ) | (1,094 | ) | ||||
|
|
|
| |||||
Gross deferred income tax assets | 548 | 704 | ||||||
|
|
|
| |||||
DEFERRED INCOME TAX LIABILITIES: | ||||||||
Goodwill and intangible assets | (672 | ) | (829 | ) | ||||
Other | (5 | ) | (4 | ) | ||||
Accrued Liabilities | (3 | ) | — | |||||
|
|
|
| |||||
Gross deferred income tax liabilities | (680 | ) | (833 | ) | ||||
|
|
|
| |||||
Net deferred income tax liabilities | $ | (132 | ) | $ | (129 | ) | ||
|
|
|
| |||||
F-41
Table of Contents
As of September 30, 2011, the Company had tax-effected net operating losses (“NOL’s”) carryforwards of $972 million, comprised of $628 million for U.S. Federal, state and local taxes and $344 million for foreign taxes, including $160 million, $110 million and $24 million in Germany, Luxembourg and France, respectively. U.S. Federal and state NOL carryforwards expire through the year 2031, with the majority expiring in excess of 10 years. The majority of foreign NOL carryforwards have no expiration. Additionally, the Company has various other tax credit carryforwards totaling $66 million. Of this total, $17 million expire within five years, $27 million expire between five and 15 years and $22 million expire in excess of 15 years.
As a result of the Merger, a significant change in the ownership of the Company occurred which, pursuant to The Internal Revenue Code, will limit on an annual basis the Company’s ability to utilize its U.S. Federal NOLs and U.S. Federal tax credits. The Company’s NOLs and credits will continue to be available to offset taxable income and tax liabilities (until such NOLs and credits are either used or expire) subject to the annual limitation. If the annual limitation amount is not fully utilized in a particular tax year, then the unused portion from that particular tax year will be added to the annual limitation in subsequent years. As discussed earlier, on June 9, 2011, the Company filed with the SEC a registration statement on Form S-1 relating to a proposed initial public offering of its common stock. We do not believe that this share issuance will itself, or when aggregated with other prior shareholder ownership changes during the applicable testing period, cause an ownership change that would further limit, on an annual basis, our ability to utilize our current U.S. Federal net operating losses and U.S. Federal tax credits.
In fiscal years 2009 and 2008, impairments to intangible assets and goodwill contributed to a significant book taxable loss in the U.S. The Company also incurred and expects to continue to incur significant interest expense related to its debt and amortization and depreciation expense associated with the Merger and acquisition of NES. As a result of continuing pre-tax losses incurred subsequent to the Merger, as of September 30, 2011, excluding the U.S. deferred tax liabilities on indefinite-lived intangible assets, the Company’s deferred tax assets exceed its deferred tax liabilities in the U.S. and the Company is in a three-year cumulative book taxable loss position in the U.S.
Further, as a result of operational losses and continued business restructuring accruals in Germany and France as well as intercompany interest expense in Luxembourg, the Company’s subsidiaries in Germany, Luxembourg and France are in a three-year cumulative book taxable loss position.
In assessing the realization of deferred tax assets, the Company considers whether it is more likely than not that some portion or all of the deferred tax assets will not be realized. The Company considered the scheduled reversal of deferred tax assets and liabilities, projected future taxable income, and certain tax planning strategies in making this assessment. Based on this assessment in fiscal years 2009, 2010 and 2011, the Company determined that it is more likely than not that the U.S., German, Luxembourg and French deferred tax assets will not be realized to the extent they exceed the scheduled reversal of deferred tax liabilities. Accordingly, the Company has provided a valuation allowance against its net deferred tax assets which has and will continue to adversely affect its effective income tax rate.
At September 30, 2011, the valuation allowance of $1,410 million is comprised of $1,052 million relating to U.S. deferred tax assets and $358 million relating to foreign deferred tax assets for which $193 million, $110 million and $24 million relates to our German, Luxembourg and French subsidiaries, respectively. In fiscal 2011, the Company recorded an increase of $316 million to its valuation allowance. The increase in the valuation allowance is comprised of a $238 million charge included in the provision for income taxes and a $78 million charge to the balance sheet.
The Company has not provided for U.S. deferred income taxes or foreign withholding taxes on $355 million and $286 million of undistributed earnings of its non-U.S. subsidiaries as of September 30, 2011 and 2010, respectively, since the Company intends to reinvest these earnings indefinitely. It is not practical to estimate the unrecognized deferred tax liability on the undistributed earnings.
F-42
Table of Contents
On October 1, 2007, the Company adopted the provisions of ASC 740-10 related to uncertain tax positions. The Company’s policy to include interest and penalties related to income taxes within the provision for income taxes did not change as a result of the adoption. Included in the calculation of provision for income taxes in fiscal 2009, 2010 and 2011 is interest expense of $6 million, interest benefit of $10 million and interest benefit of $1 million, respectively. As of September 30, 2011, the Company had gross unrecognized tax benefits (“UTB”) of $226 million. Also, included in non-current liabilities is $8 million relating to audits by state and local and foreign taxing authorities for the periods prior to the Company’s separation from Alcatel-Lucent pursuant to the Tax Sharing Agreement. Further, an additional $30 million for gross interest and penalties relating to these amounts had been classified as non-current liabilities. At this time, the Company is unable to make a reasonably reliable estimate of the timing of payments in connection with these tax liabilities. The Company files corporate income tax returns with the federal government in the U.S. and with multiple U.S. state and local jurisdictions and non-U.S. tax jurisdictions. In the ordinary course of business these income tax returns will be examined by the tax authorities. The Internal Revenue Service (“IRS”) is currently examining the Company’s U.S. Federal income tax returns for fiscal years ended September 30, 2007 through September 30, 2009, including the period from October 1, 2007 through October 26, 2007. Various state, local, and foreign income tax returns are under examination by taxing authorities for tax years ranging from 2001 through 2008. It is reasonably possible that the total amount of UTB will increase or decrease in the next 12 months as a result of these examinations; however, quantification of an estimated range cannot be made at this time.
The following table summarizes the changes in the gross UTB liability for fiscal years 2011, 2010 and 2009:
In millions | ||||
Gross UTB balance at October 1, 2008 | $ | 224 | ||
Additions based on tax positions relating to the period | 4 | |||
Additions based on tax positions relating to prior periods | 5 | |||
|
| |||
Gross UTB balance at September 30, 2009 | 233 | |||
Additions based on tax positions relating to the period | 15 | |||
Additions based on tax positions relating to prior periods | 12 | |||
Settlements with taxing authorities | (70 | ) | ||
Statute of limitations expirations | (5 | ) | ||
|
| |||
Gross UTB balance at September 30, 2010 | 185 | |||
Additions based on tax positions relating to the period | 36 | |||
Additions based on tax positions relating to prior periods | 17 | |||
Settlements with taxing authorities | (7 | ) | ||
Statute of limitations expirations | (5 | ) | ||
|
| |||
Gross UTB balance at September 30, 2011 | $ | 226 | ||
|
| |||
13. Benefit Obligations
Pension and Postretirement Benefits
The Company sponsors non-contributory defined benefit pension plans covering a portion of its U.S. employees and retirees, and postretirement benefit plans for U.S. retirees that include healthcare benefits and life insurance coverage. The Company froze benefit accruals and additional participation in the pension and postretirement plan for its U.S. management employees effective December 31, 2003. Effective October 12, 2011 and November 18, 2011, the Company entered into a two-year contract extension with the Communications Workers of America (“CWA”) and the International Brotherhood of Electrical Workers (“IBEW”), respectively. With the contract extension, the contract with the CWA and IBEW now terminates on June 7, 2014. The contract extension did not affect the level of pension and postretirement benefits available to U.S. employees of the Company who are represented by the CWA or IBEW (“represented employees”).
F-43
Table of Contents
Certain non-U.S. operations have various retirement benefit programs covering substantially all of their employees. Some of these programs are considered to be defined benefit pension plans for accounting purposes.
The Company’s general funding policy with respect to the qualified pension plans is to contribute amounts at least sufficient to satisfy the minimum amount required by applicable law and regulations, or to directly pay benefits where appropriate. Contributions to the U.S. pension plans were $75 million and $18 million in fiscal 2011 and 2010, respectively. Contributions to the non-U.S. pension plans were $21 million and $20 million in fiscal 2011 and 2010, respectively. The contributions to the U.S. pension plans in fiscal 2011 and 2010 consisted of payments of $6 million and $6 million for certain pension benefits that were not pre-funded, and cash contributions of $69 million and $12 million to satisfy the minimum statutory funding requirements, respectively. In fiscal 2012, the Company estimates that it will make payments totaling $6 million for certain U.S. pension benefits that are not pre-funded, contributions totaling $90 million to satisfy the minimum statutory funding requirements in the U.S. and contributions totaling $26 million for non-U.S. plans.
Most post-retirement medical benefits are not pre-funded. Consequently, the Company makes payments as these retiree medical benefits are disbursed. However, in compliance with the terms of the contract with the CWA and IBEW, at the beginning of each calendar year 2010 through 2012, the Company will contribute $5 million to the represented employees’ post-retirement health trust to fund retirement medical benefits for the U.S. represented employees. The Company also had a contractual obligation to contribute $47 million each calendar year 2007 through 2009 in compliance with the terms of the 2006 collective bargaining agreement between the Company and the CWA and IBEW, which was fulfilled by the Company’s final contribution of $12 million during the first quarter of fiscal 2010. At the end of each calendar year, any unused portion of the contributions will be carried forward to offset the subsequent year’s retiree medical and dental costs, if any, which would otherwise be the obligation of the retirees. As a result, contributions plus payments for retiree medical and dental benefits were $63 million and $70 million in fiscal 2011 and 2010, respectively. In fiscal 2012, we estimate contributions plus payments for retiree medical and dental benefits will total $63 million.
F-44
Table of Contents
A reconciliation of the changes in the benefit obligations and fair value of assets of the defined benefit pension and postretirement plans, the funded status of the plans, and the amounts recognized in the Consolidated Balance Sheets is provided in the table below:
| Pension Benefits U.S. | Pension Benefits Non-U.S. | Postretirement Benefits | ||||||||||||||||||||||
| September 30, | September 30, | September 30, | ||||||||||||||||||||||
In millions | 2011 | 2010 | 2011 | 2010 | 2011 | 2010 | ||||||||||||||||||
CHANGE IN BENEFIT OBLIGATION | ||||||||||||||||||||||||
Benefit obligation as of beginning of period | $ | 3,130 | $ | 2,927 | $ | 522 | $ | 466 | $ | 675 | $ | 707 | ||||||||||||
Liability assumed in the Acquisitions | — | — | — | 3 | — | — | ||||||||||||||||||
Service cost | 6 | 8 | 9 | 9 | 3 | 4 | ||||||||||||||||||
Interest cost | 150 | 160 | 23 | 23 | 31 | 37 | ||||||||||||||||||
Amendments | — | — | — | — | — | (12 | ) | |||||||||||||||||
Actuarial (gain) loss | 260 | 260 | (56 | ) | 72 | 57 | 12 | |||||||||||||||||
Benefits paid | (223 | ) | (225 | ) | (20 | ) | (18 | ) | (64 | ) | (73 | ) | ||||||||||||
Exchange rate movements | — | — | (5 | ) | (32 | ) | — | — | ||||||||||||||||
Curtailments, settlements and other | — | — | 6 | (1 | ) | — | — | |||||||||||||||||
|
|
|
|
|
|
|
|
|
|
|
| |||||||||||||
Benefit obligation as of end of period | $ | 3,323 | $ | 3,130 | $ | 479 | $ | 522 | $ | 702 | $ | 675 | ||||||||||||
|
|
|
|
|
|
|
|
|
|
|
| |||||||||||||
CHANGE IN PLAN ASSETS | ||||||||||||||||||||||||
Fair value of plan assets as of beginning of period | $ | 2,046 | $ | 1,954 | $ | 39 | $ | 33 | $ | 134 | $ | 123 | ||||||||||||
Actual return on plan assets | 201 | 298 | (2 | ) | 7 | 3 | 14 | |||||||||||||||||
Employer contributions | 75 | 18 | 21 | 20 | 63 | 70 | ||||||||||||||||||
Benefits paid | (223 | ) | (225 | ) | (20 | ) | (18 | ) | (64 | ) | (73 | ) | ||||||||||||
Exchange rate movements | — | — | (1 | ) | (2 | ) | — | — | ||||||||||||||||
Settlements and other | — | 1 | — | (1 | ) | 1 | — | |||||||||||||||||
|
|
|
|
|
|
|
|
|
|
|
| |||||||||||||
Fair value of plan assets as of end of period | $ | 2,099 | $ | 2,046 | $ | 37 | $ | 39 | $ | 137 | $ | 134 | ||||||||||||
|
|
|
|
|
|
|
|
|
|
|
| |||||||||||||
AMOUNT RECOGNIZED IN THE CONSOLIDATED BALANCE SHEETS CONSISTS OF: | ||||||||||||||||||||||||
Noncurrent assets | $ | — | $ | — | $ | — | $ | — | $ | — | $ | — | ||||||||||||
Accrued benefit liability, current | (7 | ) | (7 | ) | (23 | ) | (20 | ) | (63 | ) | (63 | ) | ||||||||||||
Accrued benefit liability, noncurrent | (1,217 | ) | (1,077 | ) | (419 | ) | (463 | ) | (502 | ) | (478 | ) | ||||||||||||
|
|
|
|
|
|
|
|
|
|
|
| |||||||||||||
Net amount recognized | $ | (1,224 | ) | $ | (1,084 | ) | $ | (442 | ) | $ | (483 | ) | $ | (565 | ) | $ | (541 | ) | ||||||
|
|
|
|
|
|
|
|
|
|
|
| |||||||||||||
AMOUNT RECOGNIZED IN ACCUMULATED OTHER COMPREHENSIVE LOSS (PRE-TAX) CONSISTS OF: | ||||||||||||||||||||||||
Net prior service cost (credit) | $ | 8 | $ | 9 | $ | — | $ | — | $ | (8 | ) | $ | (5 | ) | ||||||||||
Net actuarial loss (gain) | 1,148 | 979 | 14 | 68 | 164 | 103 | ||||||||||||||||||
|
|
|
|
|
|
|
|
|
|
|
| |||||||||||||
Net amount recognized | $ | 1,156 | $ | 988 | $ | 14 | $ | 68 | $ | 156 | $ | 98 | ||||||||||||
|
|
|
|
|
|
|
|
|
|
|
| |||||||||||||
In fiscal 2011, the weighted average discount rates used to determine the U.S. pension and postretirement benefit obligations as of the balance sheet date declined by 30 basis points and 27 basis points, respectively. This resulted in a $108 million increase to the Company’s U.S. pension obligation and a $19 million increase to the Company’s postretirement benefit obligation. The weighted average discount rate used to determine the non-U.S. pension obligation increased by 65 basis points, resulting in a $50 million decrease to the Company’s non-U.S. pension obligation. Also in fiscal 2011, the mortality assumption for the U.S. pension and postretirement benefit plans was modified to include future expected mortality improvement. The impact of the change in the mortality assumption was an $88 million increase to the Company’s U.S. pension obligation and a $4 million increase to the Company’s postretirement benefit obligation.
F-45
Table of Contents
The following table provides the accumulated benefit obligation for all defined benefit pension plans and information for pension plans with an accumulated benefit obligation in excess of plan assets:
| U.S. Plans | Non - U.S. Plans | |||||||||||||||
| September 30, | September 30, | |||||||||||||||
In millions | 2011 | 2010 | 2011 | 2010 | ||||||||||||
Accumulated Benefit Obligation for all plans | $ | 3,323 | $ | 3,130 | $ | 464 | $ | 504 | ||||||||
Plans with Accumulated Benefit Obligation in excess of plan assets | ||||||||||||||||
Projected Benefit Obligation | $ | 3,323 | $ | 3,130 | $ | 443 | $ | 514 | ||||||||
Accumulated Benefit Obligation | 3,323 | 3,130 | 436 | 500 | ||||||||||||
Fair Value of Plan Assets | 2,099 | 2,046 | 3 | 34 | ||||||||||||
Estimated future benefits expected to be paid in each of the next five fiscal years, and in aggregate for the five fiscal years thereafter, are presented below:
| Pension Benefits | Other Benefits | Federal Prescription Drug Subsidy Receipts | ||||||||||||||
In millions | US | Non-U.S. | ||||||||||||||
2012 | $ | 213 | $ | 24 | $ | 67 | $ | 2 | ||||||||
2013 | 213 | 25 | 58 | 2 | ||||||||||||
2014 | 213 | 26 | 55 | 3 | ||||||||||||
2015 | 213 | 26 | 52 | 4 | ||||||||||||
2016 | 213 | 26 | 50 | 3 | ||||||||||||
2017 - 2021 | 1,060 | 145 | 216 | 23 | ||||||||||||
|
|
|
|
|
|
|
| |||||||||
Total | $ | 2,125 | $ | 272 | $ | 498 | $ | 37 | ||||||||
|
|
|
|
|
|
|
| |||||||||
The components of net periodic benefit cost (credit) for the pension plans are provided in the table below:
| Pension Benefits - U.S. | Pension Benefits - Non-U.S. | |||||||||||||||||||||||
| Year ended September 30, | Year ended September 30, | |||||||||||||||||||||||
In millions | 2011 | 2010 | 2009 | 2011 | 2010 | 2009 | ||||||||||||||||||
Components of net periodic benefit cost (credit) | ||||||||||||||||||||||||
Service cost | $ | 6 | $ | 8 | $ | 7 | $ | 9 | $ | 9 | $ | 7 | ||||||||||||
Interest cost | 150 | 160 | 177 | 23 | 23 | 24 | ||||||||||||||||||
Expected return on plan assets | (174 | ) | (183 | ) | (197 | ) | (2 | ) | (2 | ) | (2 | ) | ||||||||||||
Amortization of unrecognized prior service cost | 1 | 1 | — | — | — | — | ||||||||||||||||||
Amortization of previously unrecognized net actuarial loss | �� | 64 | 33 | — | 1 | — | (2 | ) | ||||||||||||||||
Curtailment, settlement (gain) loss | — | — | — | 7 | 1 | 1 | ||||||||||||||||||
|
|
|
|
|
|
|
|
|
|
|
| |||||||||||||
Net periodic benefit cost (credit) | $ | 47 | $ | 19 | $ | (13 | ) | $ | 38 | $ | 31 | $ | 28 | |||||||||||
|
|
|
|
|
|
|
|
|
|
|
| |||||||||||||
F-46
Table of Contents
The components of net periodic benefit cost for the postretirement plans are provided in the table below:
| Postretirement Benefits - U.S. | ||||||||||||
| Year ended September 30, | ||||||||||||
In millions | 2011 | 2010 | 2009 | |||||||||
Components of net periodic benefit cost (credit) | ||||||||||||
Service cost | $ | 3 | $ | 4 | $ | 3 | ||||||
Interest cost | 31 | 37 | 42 | |||||||||
Expected return on plan assets | (11 | ) | (12 | ) | (10 | ) | ||||||
Amortization of unrecognized prior service cost | 4 | 5 | 1 | |||||||||
Amortization of previously unrecognized net actuarial loss | 2 | 1 | — | |||||||||
|
|
|
|
|
| |||||||
Net periodic benefit cost (credit) | $ | 29 | $ | 35 | $ | 36 | ||||||
|
|
|
|
|
| |||||||
The estimated amounts to be amortized from accumulated other comprehensive loss into net periodic benefit cost during fiscal 2012 are provided in the table below:
In millions | Pension Benefits - US | Pension Benefits - Non-US | Postretirement Benefits | |||||||||
Amortization of prior service cost | $ | 1 | $ | — | $ | 2 | ||||||
Recognized net actuarial loss (gain) | 99 | — | 8 | |||||||||
|
|
|
|
|
| |||||||
| $ | 100 | $ | — | $ | 10 | |||||||
|
|
|
|
|
| |||||||
The weighted average assumptions used to determine the benefit obligation for the pension and postretirement plans are provided in the table below:
| Pension Benefits - U.S. | Pension Benefits - Non-U.S. | Postretirement Benefits | ||||||||||||||||||||||
| September 30, | September 30, | September 30, | ||||||||||||||||||||||
| 2011 | 2010 | 2011 | 2010 | 2011 | 2010 | |||||||||||||||||||
Weighted-average assumptions used to determine benefit obligations | ||||||||||||||||||||||||
Discount rate | 4.65 | % | 4.95 | % | 4.99 | % | 4.34 | % | 4.58 | % | 4.85 | % | ||||||||||||
Rate of compensation increase | 4.00 | % | 4.00 | % | 3.37 | % | 3.28 | % | 4.00 | % | 4.00 | % | ||||||||||||
The weighted average assumptions used to determine the net periodic benefit cost for the pension and postretirement plans are provided in the tables below:
| Pension Benefits - U.S. | Pension Benefits - Non-U.S. | |||||||||||||||||||||||
| Year ended September 30, | Year ended September 30, | |||||||||||||||||||||||
| 2011 | 2010 | 2009 | 2011 | 2010 | 2009 | |||||||||||||||||||
Weighted-average assumptions used to determine net periodic benefit cost | ||||||||||||||||||||||||
Discount rate | 4.95 | % | 5.65 | % | 7.60 | % | 4.34 | % | 5.55 | % | 6.70 | % | ||||||||||||
Expected return on plan assets | 8.50 | % | 8.50 | % | 8.75 | % | 4.12 | % | 5.28 | % | 6.34 | % | ||||||||||||
Rate of compensation increase | 4.00 | % | 4.00 | % | 4.00 | % | 3.28 | % | 3.29 | % | 3.22 | % | ||||||||||||
| Postretirement Benefits | ||||||||||||
| Year ended September 30, | ||||||||||||
| 2011 | 2010 | 2009 | ||||||||||
Weighted-average assumptions used to determine net periodic benefit cost | ||||||||||||
Discount rate | 4.85 | % | 5.50 | % | 7.58 | % | ||||||
Expected return on plan assets | 7.50 | % | 8.00 | % | 6.75 | % | ||||||
Rate of compensation increase | 4.00 | % | 4.00 | % | 4.00 | % | ||||||
F-47
Table of Contents
The discount rate is subject to change each year, consistent with changes in rates of return on high-quality fixed-income investments currently available and expected to be available during the expected benefit payment period. The Company selects the assumed discount rate for its U.S. pension and postretirement plans by applying the published rates of existing yield curves, such as the Citigroup Pension Discount Curve and the Citigroup above Median Pension Discount Curve, to the expected benefit payment streams and develops a rate at which it is believed the benefit obligations could be effectively settled. The Company follows a similar process for its non-U.S. pension plans by applying the published iBoxx indices. Based on the published rates as of September 30, 2011, the Company used a weighted average discount rate of 4.65% for the U.S. pension plans, 4.99% for the non-U.S. pension plans, and 4.58% for the postretirement plans, a decrease of 30 basis points, an increase of 65 basis points and a decrease of 27 basis points, respectively, from the rates used as of September 30, 2010. As of September 30, 2011, this had the effect of increasing the projected U.S. pension benefit obligations by approximately $108 million, decreasing the non-U.S. pension benefit obligation by $50 million, and increasing the accumulated postretirement benefit obligation by approximately $19 million. For fiscal 2012, this has the effect of increasing the U.S. pension and postretirement service cost by less than $1 million.
The expected long-term rate of return on U.S. pension and postretirement plan assets is selected by applying forward-looking capital market assumptions to the strategic asset allocation approved by the governing body for each plan. The forward-looking capital market assumptions are developed by an investment adviser and reviewed by the Company for reasonableness. The return and risk assumptions consider such factors as anticipated long-term performance of individual asset classes, risk premium for active management based on qualitative and quantitative analysis, and correlations of the asset classes that comprise the asset portfolio.
Based on an analysis of the U.S. qualified pension plans completed in fiscal 2011, the expected long-term rate of return for fiscal 2012 will remain unchanged at 8.50%. A 25 basis point change in the expected long-term rate of return will result in approximately a $5 million change in pension expense.
Based on an analysis of the postretirement plans completed in fiscal 2011, the expected long-term rate of return for fiscal 2012 will remain unchanged at 7.5%. A 25 basis point change in the expected long-term rate of return will result in a change in postretirement expense of less than $1 million.
The assumed health care cost trend rates for postretirement benefit plans were as follows:
| September 30, | September 30, | |||||||
| 2011 | 2010 | |||||||
Health care cost trend rate assumed for next year | 8.9 | % | 9.4 | % | ||||
Rate to which the cost trend rate is assumed to decline (ultimate trend rate) | 5.5 | % | 5.5 | % | ||||
Year that the rate reaches the ultimate trend rate | 2019 | 2019 | ||||||
The Company’s cost for postretirement healthcare claims is capped and the projected postretirement healthcare claims exceed the cap. Therefore, postretirement healthcare trend rates have no effect on the amounts reported for the postretirement health care plan. As of September 30, 2011, neither a one-percentage-point increase nor a one-percentage-point decrease in the Company’s healthcare cost trend rates would have any impact on the postretirement benefit obligation and the service and interest cost components of net periodic benefit cost.
F-48
Table of Contents
The weighted-average asset allocation of the pension and postretirement plans by asset category and target allocation is as follows:
| Pension Plan Assets - U.S. | Pension Plan Assets - Non-U.S. | Postretirement Plan Assets | ||||||||||||||||||||||||||||||
| September 30, | Long-term Target | September 30, | September 30, | Long-term Target | ||||||||||||||||||||||||||||
Asset Category | 2011 | 2010 | 2011 | 2010 | 2011 | 2010 | ||||||||||||||||||||||||||
Equity Securities | 24 | % | 33 | % | 30 | % | 8 | % | 17 | % | 52 | % | 54 | % | 55 | % | ||||||||||||||||
Debt Securities | 42 | % | 40 | % | 39 | % | 71 | % | 73 | % | 48 | % | 46 | % | 45 | % | ||||||||||||||||
Hedge Funds | 9 | % | 9 | % | 10 | % | — | — | — | — | — | |||||||||||||||||||||
Private Equity | 7 | % | 7 | % | 7 | % | — | — | — | — | — | |||||||||||||||||||||
Real Estate | 3 | % | 2 | % | 3 | % | — | 1 | % | — | — | — | ||||||||||||||||||||
Commodities | 1 | % | — | 3 | % | — | — | — | — | — | ||||||||||||||||||||||
Other(1) | 14 | % | 9 | % | 8 | % | 21 | % | 9 | % | — | — | — | |||||||||||||||||||
|
|
|
|
|
|
|
|
|
|
|
|
|
|
|
| |||||||||||||||||
Total | 100 | % | 100 | % | 100 | % | 100 | % | 100 | % | 100 | % | 100 | % | 100 | % | ||||||||||||||||
|
|
|
|
|
|
|
|
|
|
|
|
|
|
|
| |||||||||||||||||
| (1) | The Other category for U.S. pension plan assets includes cash/cash equivalents and derivative financial instruments. The Other category for non-U.S. pension assets includes insurance contracts with a guaranteed interest credit. |
The Company’s asset investment strategy focuses on maintaining a diversified portfolio of professionally managed assets designed to optimize returns subject to a prudent level of risk. Risk management practices include diversification across asset classes and investment styles and periodic rebalancing toward asset allocation targets. An asset-liability study is performed on an annual basis for the pension plans, and on an as-necessary basis for the postretirement plans, to determine the optimal asset mix to meet future benefit obligations. The most recent asset-liability studies were completed in fiscal 2011 for the pension plans and fiscal 2010 for the postretirement plans.
As part of the Company’s investment and risk management strategy, the U.S. pension plans enter into both derivatives and long bond portfolios to minimize their sensitivity to interest rate movements. The derivative financial instruments used in support of the interest rate risk management investment strategy include forwards, futures, swaptions and swaps. The use of derivative financial instruments for speculative purposes is prohibited by the Company’s investment policy.
Also, as part of the Company’s investment strategy, the U.S. pension plans invest in hedge funds, real estate funds and private equity to provide additional uncorrelated returns. All funds are broadly diversified to minimize exposure to any one specific investment.
The fair value of plan assets is determined by the trustee, and reviewed by the Company, using unadjusted quoted prices in an active market (classified as Level 1) when available. Assets for which quoted market prices are not available are valued using other observable valuation inputs (classified as Level 2) when available. Level 2 inputs include quoted prices for similar assets in an active market, quoted prices for identical or similar assets in an inactive market, and observable inputs other than quoted prices such as reported trades, unadjusted broker/dealer quotes, etc. Assets for which neither quoted prices nor sufficient observable market data is available are valued using unobservable inputs (classified as Level 3). Typically, an unobservable input is the value provided by a limited partnership, which is reviewed for reasonableness based on benchmark performance and review of audited financial statements when available. Because of the inherent uncertainty of valuation, estimated fair values may differ significantly from the fair values that would have been used had quoted prices in an active market existed.
F-49
Table of Contents
The following tables summarize the fair value of the U.S. pension plans assets by asset class:
| Fair Value Measurements of U.S. Pension Assets as of September 30, 2011 | ||||||||||||||||
Dollars in millions | Level 1 | Level 2 | Level 3 | Total | ||||||||||||
Cash and cash equivalents(a) | $ | — | $ | 50 | $ | — | $ | 50 | ||||||||
U.S. Government debt securities(b) | — | 225 | — | 225 | ||||||||||||
Corporate debt securities(c): | ||||||||||||||||
Investment grade | — | 227 | 4 | 231 | ||||||||||||
Other debt securities | — | 8 | — | 8 | ||||||||||||
Equity securities(d): | ||||||||||||||||
U.S. large/mid-cap | 74 | — | — | 74 | ||||||||||||
U.S. small cap | 39 | — | — | 39 | ||||||||||||
Non-U.S. Equity | 60 | — | — | 60 | ||||||||||||
Real estate(e) | — | 7 | 61 | 68 | ||||||||||||
Private equity(f) | — | — | 148 | 148 | ||||||||||||
Investment funds(g): | ||||||||||||||||
Cash and cash equivalents | — | 207 | — | 207 | ||||||||||||
Investment grade corporate debt | — | 270 | — | 270 | ||||||||||||
High-yield debt | 34 | 35 | — | 69 | ||||||||||||
Emerging market debt | — | 81 | — | 81 | ||||||||||||
U.S. equity | — | 143 | — | 143 | ||||||||||||
Non-U.S. equity | — | 113 | — | 113 | ||||||||||||
Emerging market equity | — | 73 | — | 73 | ||||||||||||
Multi-strategy hedge funds(h) | — | 166 | 13 | 179 | ||||||||||||
Commodities(i) | — | 26 | — | 26 | ||||||||||||
Derivative instruments(j) | 1 | 59 | — | 60 | ||||||||||||
Other plan assets (liabilities) | — | (25 | ) | — | (25 | ) | ||||||||||
|
|
|
|
|
|
|
| |||||||||
Total plan assets at fair value | $ | 208 | $ | 1,665 | $ | 226 | $ | 2,099 | ||||||||
|
|
|
|
|
|
|
| |||||||||
| Fair Value Measurements of U.S. Pension Assets as of September 30, 2010 | ||||||||||||||||
In millions | Level 1 | Level 2 | Level 3 | Total | ||||||||||||
Cash and cash equivalents(a) | $ | 5 | $ | 116 | $ | — | $ | 121 | ||||||||
U.S. Government debt securities(b) | — | 209 | — | 209 | ||||||||||||
Corporate debt securities(c): | ||||||||||||||||
Investment grade | — | 201 | 4 | 205 | ||||||||||||
Other debt securities | — | 4 | — | 4 | ||||||||||||
Equity securities(d): | ||||||||||||||||
U.S. large/mid-cap | 98 | — | — | 98 | ||||||||||||
U.S. small cap | 52 | — | — | 52 | ||||||||||||
Non-U.S. EAFE | 73 | — | — | 73 | ||||||||||||
Real estate(e) | — | — | 42 | 42 | ||||||||||||
Private equity partnerships(f) | — | — | 150 | 150 | ||||||||||||
Investment funds(g): | ||||||||||||||||
Investment grade corporate debt | — | 248 | — | 248 | ||||||||||||
High-yield debt | 34 | 34 | — | 68 | ||||||||||||
Emerging market debt | — | 80 | — | 80 | ||||||||||||
U.S. equity | — | 191 | — | 191 | ||||||||||||
Non-U.S. equity | — | 159 | — | 159 | ||||||||||||
Emerging market equity | — | 103 | — | 103 | ||||||||||||
Multi-strategy hedge funds(h) | — | 142 | 31 | 173 | ||||||||||||
Derivative instruments(j) | 1 | 79 | — | 80 | ||||||||||||
Other plan assets (liabilities) | — | (10 | ) | — | (10 | ) | ||||||||||
|
|
|
|
|
|
|
| |||||||||
Total plan assets at fair value | $ | 263 | $ | 1,556 | $ | 227 | $ | 2,046 | ||||||||
|
|
|
|
|
|
|
| |||||||||
F-50
Table of Contents
| (a) | Includes certificates of deposit, commercial paper, securities issued or guaranteed by the U.S. government or its agencies with less than one year to maturity, and repurchase agreements which are valued at cost plus accrued interest. |
| (b) | Includes U.S. treasury bonds, notes and inflation linked bonds, which are generally valued using institutional bid evaluations from various contracted pricing vendors. Institutional bid evaluations are estimated prices that represent the price a dealer would pay for a security. Pricing inputs to the institutional bid evaluation vary by security and include benchmark yields, reported trades, unadjusted broker/dealer quotes, issuer spreads, bids, offers or other observable market data. |
| (c) | Includes Investment grade corporate bonds diversified across various business sectors, as well as collateralized mortgage obligations and asset backed securities, which are generally valued using institutional bid evaluations from various contracted pricing vendors. Institutional bid evaluations are estimated prices that represent the price a dealer would pay for a security. Pricing inputs to the institutional bid evaluation vary by security and include benchmark yields, reported trades, unadjusted broker/dealer quotes, issuer spreads, bids, offers or other observable market data. |
| (d) | Includes U.S. and non-U.S. corporate stocks, which are generally valued using the composite close price from an active exchange. The composite close price is the last trade of the day and can come from any exchange on which the security trades. Generally, the last trade of the day comes from the primary exchange; therefore, the composite close and the primary close price are generally the same. |
| (e) | Includes open ended real estate commingled funds, close ended real estate limited partnerships, and insurance company separate accounts that invest primarily in U.S. office, lodging, retail and residential real estate. The insurance company separate accounts and the commingled funds account for their portfolio of assets at fair value and calculate the net asset value per share/unit (“NAV”) on either a monthly or quarterly basis. Shares can be redeemed at the NAV on a quarterly basis, provided a written redemption request is received in advance (generally 45—90 days) of the redemption date. Therefore, the undiscounted NAV is used as the fair value measurement. For limited partnerships, the fair value of the underlying assets and the capital account for each investor is determined by the General Partner (“GP”). The valuation techniques used by the GP generally consist of unobservable inputs such as discounted cash flow analysis, analysis of recent comparable sales transactions, actual sale negotiations and bona fide purchase offers received from third parties. The partnerships are typically funded over time as capital is needed to fund asset purchases, and distributions from the partnerships are received as the partnerships liquidate their underlying asset holdings. Therefore, the life cycle for a typical investment in a real estate limited partnership is expected to be approximately 10 years from initial funding. |
| (f) | Includes limited partner interests in various limited partnerships (“LP”s) that invest primarily in U.S. and non-U.S. investments either directly, or through other partnerships or funds with a focus on venture capital, buyouts, expansion capital, or companies undergoing financial distress or significant restructuring. The fair value of the net assets of the LPs and of the capital account of each investor is determined by the GP of each LP. Marketable securities held by the LPs are valued based on the closing price on the valuation date on the exchange where they are principally traded and may be adjusted for legal restrictions, if any. Investments without a public market are valued based on assumptions made and valuation techniques used by the GP, which consist of unobservable inputs. Such valuation techniques may include discounted cash flow analysis, analysis of recent comparable sales transactions, actual sale negotiations and bona fide purchase offers received from third parties. The LPs are typically funded over time as capital is needed to fund purchases, and distributions are received as the partnerships liquidate their underlying asset holdings. There have not been any new commitments to private equity since 2007, and no new commitments are expected under current asset allocation targets. Therefore, full liquidation of all existing LPs is expected to be completed by the year 2019. |
F-51
Table of Contents
| (g) | Includes open-end funds and unit investment trusts that invest in various asset classes including: U.S. corporate debt, emerging market debt, U.S. equity and non-U.S equity. The funds account for their portfolio of assets at fair value and calculate the NAV of the fund on either a daily or monthly basis, and shares can be redeemed at the NAV. Therefore, the undiscounted NAV as reported by the funds is used as the fair value measurement. |
| (h) | Includes hedge fund of funds and hedge funds that pursue multiple strategies to diversify risks and reduce volatility. The funds account for their portfolio of assets at fair value and calculate the NAV of their fund on a monthly basis. The funds limit the frequency of redemptions to manage liquidity and protect the interests of the fund and its shareholders. Two of the funds, with a fair value totaling $8 million as of September 30, 2011 are in the process of liquidation and cannot provide an estimate as to when the liquidation will be completed. However, since trades (purchases and redemptions) are executed using the NAV as calculated on the trade date, the undiscounted NAV as reported by the fund is used as the fair value measurement. |
| (i) | Consists of a partnership interest in a limited liability company (“LLC”) that invests in a long-only, unleveraged portfolio of exchange-traded, U.S. dollar-denominated futures and forward contracts in tangible commodities. The NAV of the LLC is determined at the end of each month. The underlying futures and forward contracts are valued based upon the settlement price on the exchanges where they are traded, and where there is no settlement price, value is based upon the last trade price. An investor can withdraw all or any portion of its capital account effective as of the last day of the calendar month. |
| (j) | Includes futures, options and swap agreements. Futures and options are generally valued using the last trade price at which a specific contract/security was last traded on the primary exchange, which is provided by a contracted vendor. If pricing is not available from the contracted vendor, then pricing is obtained from other sources such as Bloomberg, broker bid, ask/offer quotes or the investment manager. Swaps and swaptions are generally valued by one of several contracted pricing vendors who use inputs such as interdealer broker rates and benchmark yields to create a swap yield curve and determine price based on the terms of the swap. If pricing is not available through one of the contracted vendors, then pricing is obtained from another source such as the investment manager, who obtains the mark-to-market value from the counterparty and applies this value to the current face of the trade to determine price. |
The following tables summarize the changes in fair value of Level 3 U.S. pension plan assets:
| Level 3 U.S. Pension Plan Asset Activity | ||||||||||||||||||||
| Year ended September 30, 2011 | ||||||||||||||||||||
in millions | Corporate Debt Securities | Real Estate | Private Equity | Hedge Funds | Total | |||||||||||||||
Balance at October 1, 2010 | $ | 4 | $ | 42 | $ | 150 | $ | 31 | $ | 227 | ||||||||||
Realized gains/(losses) | 4 | (1 | ) | 10 | — | 13 | ||||||||||||||
Unrealized gains/(losses) relating to investments still held at the end of the period | — | 7 | 25 | 2 | 34 | |||||||||||||||
Purchases, sales and settlements (net) | (4 | ) | 13 | (37 | ) | (20 | ) | (48 | ) | |||||||||||
Transfers in/(out) | — | — | — | — | — | |||||||||||||||
|
|
|
|
|
|
|
|
|
| |||||||||||
Balance at September 30, 2011 | $ | 4 | $ | 61 | $ | 148 | $ | 13 | $ | 226 | ||||||||||
|
|
|
|
|
|
|
|
|
| |||||||||||
F-52
Table of Contents
| Level 3 U.S. Pension Plan Asset Activity | ||||||||||||||||||||||||
In millions | Corporate Debt Securities | Real Estate | Private Equity | Hedge Funds | Derivative Instruments | Total | ||||||||||||||||||
Balance at October 1, 2009 | $ | 7 | $ | 22 | $ | 140 | $ | 71 | $ | — | $ | 240 | ||||||||||||
Realized gains/(losses) | — | 6 | (5 | ) | 3 | 1 | 5 | |||||||||||||||||
Unrealized gains/(losses) relating to investments still held at the end of the period | 3 | (9 | ) | 19 | (3 | ) | — | 10 | ||||||||||||||||
Purchases, sales and settlements (net) | (6 | ) | 23 | (4 | ) | (13 | ) | (1 | ) | (1 | ) | |||||||||||||
Transfers in/(out) | — | — | — | (27 | ) | — | (27 | ) | ||||||||||||||||
|
|
|
|
|
|
|
|
|
|
|
| |||||||||||||
Balance at September 30, 2010 | $ | 4 | $ | 42 | $ | 150 | $ | 31 | $ | — | $ | 227 | ||||||||||||
|
|
|
|
|
|
|
|
|
|
|
| |||||||||||||
The following table summarizes the fair value of the non-U.S. pension plan assets by asset class:
| Fair Value Measurements of Non-U.S. Pension Assets as of September 30, 2011 | ||||||||||||||||
In millions | Level 1 | Level 2 | Level 3 | Total | ||||||||||||
Insurance contracts(a) | $ | — | $ | 37 | $ | — | $ | 37 | ||||||||
|
|
|
|
|
|
|
| |||||||||
| Fair Value Measurements of Non-U.S. Pension Assets as of September 30, 2010 | ||||||||||||||||
In millions | Level 1 | Level 2 | Level 3 | Total | ||||||||||||
Insurance contracts(a) | $ | — | $ | 39 | $ | — | $ | 39 | ||||||||
|
|
|
|
|
|
|
| |||||||||
| (a) | Funded non-U.S. pension plans are funded through insurance contracts, which provide for a guaranteed interest credit, and a profit-sharing adjustment based on the actual performance of the underlying investment assets of the insurer. The fair value of the contract is determined by the insurer based on the premiums paid by the Company plus interest credits plus the profit-sharing adjustment less benefit payments. The underlying assets of the insurer are invested in compliance with local rules or law, which tend to require a high allocation to fixed income securities. For example, in the Netherlands, where the pension plan assets account for 79% of the Company’s total non-U.S. pension assets, the insurer’s underlying asset allocation at September 30, 2011 was 90% bonds/10% equities, which is in line with the typical targeted allocation for Dutch insurance companies. |
The following table summarizes the fair value of the postretirement plans assets by asset class:
| Fair Value Measurements of Postretirement Assets as of September 30, 2011 | ||||||||||||||||
In millions | Level 1 | Level 2 | Level 3 | Total | ||||||||||||
Investment funds: | ||||||||||||||||
Blended asset fund(a) | $ | 11 | $ | — | $ | — | $ | 11 | ||||||||
Group life insurance contracts(b) | — | 126 | — | 126 | ||||||||||||
|
|
|
|
|
|
|
| |||||||||
Total plan assets at fair value | $ | 11 | $ | 126 | $ | — | $ | 137 | ||||||||
|
|
|
|
|
|
|
| |||||||||
| Fair Value Measurements of Postretirement Assets as of September 30, 2010 | ||||||||||||||||
In millions | Level 1 | Level 2 | Level 3 | Total | ||||||||||||
Investment funds: | ||||||||||||||||
Blended asset fund(a) | $ | 8 | $ | — | $ | — | $ | 8 | ||||||||
Group life insurance contracts(b) | — | 126 | — | 126 | ||||||||||||
|
|
|
|
|
|
|
| |||||||||
Total plan assets at fair value | $ | 8 | $ | 126 | $ | — | $ | 134 | ||||||||
|
|
|
|
|
|
|
| |||||||||
F-53
Table of Contents
| (a) | Represents an investment in a broadly diversified registered investment company (mutual fund). As of September 30, 2011, the funds asset allocation was approximately 69% fixed income securities, 22% U.S. equity, and 9% non-U.S. equity. The fund values its security holdings each business day as of the close of regular trading on the New York Stock Exchange and computes a NAV by dividing the total fair value of its assets minus liabilities by the number of fund shares outstanding. The fair value of the Plan’s investment in the fund is calculated by multiplying the NAV by the number of shares held by the Plan. |
| (b) | The group life insurance contracts are held in a reserve of an insurance company that provides for investment of pre-funding amounts in a family of pooled separate accounts. The fair value of each group life insurance contract is primarily determined by the value of the units it owns in the pooled separate accounts that back the policy. Each of the pooled separate accounts provides a unit NAV on a daily basis, which is based on the fair value of the underlying assets owned by the account. The postretirement plans can transact daily at the unit NAV without restriction. As of September 30, 2011, the asset allocation of the pooled separate accounts in which the contracts invest was approximately 31% U.S. government debt securities, 29% U.S. equity securities, 25% non-U.S. equity securities and 15% corporate debt securities. |
Multi-employer Pension Plan
In connection with the Acquisition, the Company retained certain U.S. employees of NES that are covered by a multi-employer pension plan. Company contributions to this plan during fiscal year 2011 and the period from December 19, 2009 through September 30, 2010 were less than $1 million.
Savings Plans
Substantially all of the Company’s U.S. employees are eligible to participate in savings plans sponsored by the Company. The plans allow employees to contribute a portion of their compensation on a pre-tax and after-tax basis in accordance with specified guidelines. Avaya matches a percentage of employee contributions up to certain limits. From March 1, 2009 through March 31, 2010, the Company suspended its contributions to all non-represented employees. Pursuant to a 2009 agreement, the Company has suspended its contributions to all represented employees during the period January 1, 2010 through December 31, 2010. The Company’s expense related to these savings plans was $18 million, $5 million and $17 million in fiscal years 2011, 2010 and 2009, respectively.
14. Share-based Compensation
Post-Merger Equity Incentive Plan
The Avaya Holdings Corp’s Amended and Restated 2007 Equity Incentive Plan (“2007 Plan”) governs the issuance of equity awards, including restricted stock units and stock options, to eligible plan participants. Key employees, directors and consultants of the Company may be eligible to receive awards under the 2007 Plan. Each stock option, when vested and exercised, and each restricted stock unit, when vested, entitles the holder to receive one share of stock, subject to certain restrictions on their transfer and sale as defined in the 2007 Plan and the related award agreements. As of September 30, 2011, the Company had authorized the issuance of up to 49,848,157 shares of its stock under the 2007 Plan, in addition to 2,924,125 shares underlying the continuation awards described below.
Option Awards
Under the 2007 Plan, stock options may not be granted with an exercise price of less than the fair market value of the underlying stock on the date of grant. Share-based compensation expense recognized in the Consolidated Statements of Operations is based on awards ultimately expected to vest. Forfeitures are estimated
F-54
Table of Contents
at the time of grant and revised, if necessary, in subsequent periods if actual forfeitures differ from those estimates in accordance with authoritative guidance. All options awarded under the 2007 Plan expire the earlier of ten years from the date of grant or upon cessation of employment, in which event there are limited exercise provisions allowed for vested options.
During the period from October 27, 2007 through September 30, 2008 and during the year ended September 30, 2009, the Company granted time-based, performance-based “EBITDA,” and market-based “multiple-of-money” options to purchase stock. Options granted during the period October 27, 2007 through September 30, 2008 have an exercise price of $5.00, and options granted during the year ended September 30, 2009 have an exercise price of $3.80, which was the fair market value (as defined under the 2007 Plan) of the underlying shares at the time granted.
Time-based options granted prior to November 17, 2009 vest over their performance periods, generally four years, and are payable in shares of common stock upon vesting and exercise. Compensation expense equal to the fair value of the option measured on the grant date is recognized utilizing graded attribution over the requisite service period.
EBITDA options granted prior to November 17, 2009 vest in equal installments each year over a four-year period assuming annual EBITDA targets are met. In the event that any annual EBITDA target is not met, cumulative targets would permit catch-up vesting in subsequent years should these annual EBITDA targets be achieved on a cumulative basis. The fair value of EBITDA options was measured on the date of grant. Compensation expense is recorded utilizing graded attribution over the requisite service period. Vesting, and therefore compensation expense, is estimated at the time that the achievement of the annual or cumulative EBITDA targets become probable. Compensation expense is adjusted for subsequent changes in the expected outcome of the annual and cumulative EBITDA targets until the vesting date.
Multiple-of-money options granted prior to November 17, 2009 vest upon the achievement of defined returns on the Sponsors’ initial investment in the Company. Because vesting of the multiple-of-money market-based options is outside the control of the Company and the award recipients, compensation expense relative to the multiple-of-money options must be recognized upon the occurrence of a triggering event (e.g., sale or initial public offering of the Company). Achievement of defined returns on the Sponsors’ initial investment may also cause any unvested portion of the EBITDA options to vest.
In November 2009, the Board approved a stock option exchange program through which individuals holding stock options having exercise prices of $5.00 and $3.80 per share could exchange them on a one-option-for-one-option basis, for replacement options with an exercise price of $3.00 per share, the fair market value (as defined under the 2007 Plan) of the underlying shares at the time of exchange, and with new vesting terms. The replacement options issued to participants in the exchange program include time-based and market-based multiple-of-money options. The time-based options vest ratably over four years following the date of exchange. The multiple-of-money options vest upon the achievement of defined returns on the Sponsors’ initial investment in the Company. The exchange offer was closed on November 16, 2009 and 28,595,000 options were tendered for exchange and have an effective exchange date of November 17, 2009. 2,295,000 stock options were not tendered in the exchange offer. The Company has treated the stock option exchange as a modification of the terms of the options tendered for exchange. For financial reporting purposes, the Company will expense the incremental fair value for all unvested and modified options as these options vest. The incremental fair value of the modification was determined as the difference in the fair value of each option immediately before and after the modification using the CRR binomial model (discussed below). The unrecognized incremental compensation related to the time-based options as a result of the modification is $3 million and will be recognized over the four-year vesting period which began November 17, 2009. Because vesting of the multiple-of-money market-based options is outside the control of the Company and the award recipients, compensation expense relative to the multiple-of-money options must be recognized upon the occurrence of a triggering event (e.g., sale or initial public offering of the Company).
F-55
Table of Contents
In conjunction with the acquisition of NES and to provide employee retention during the integration of NES, the Company granted 7,445,750 time-based and 2,574,250 multiple-of-money options to purchase stock to certain key employees of Avaya and to certain key employees of NES who became employees of Avaya upon completion of the Acquisition. In addition, during fiscal 2010, the Company granted 5,138,250 time-based and 2,766,750 multiple-of-money options in the ordinary course of business.
During fiscal 2011, the Company granted 4,465,500 time-based and 2,404,500 multiple-of-money options in the ordinary course of business.
5,850,000 time-based options granted during fiscal 2010 (excluding stock options issued in the exchange offer) vested 20% on December 18, 2009, the date on which the closing of the acquisition of NES was completed, and will vest 20% annually thereafter for the following four years. All other time-based options granted on or subsequent to November 17, 2009 (excluding stock options issued in the exchange offer) vest over their performance periods, generally four years. Compensation expense related to time-based options equal to the fair value of the option measured on the grant date is recognized utilizing graded attribution over the requisite service period.
As is the case with multiple-of-money options issued in the exchange offer, all other multiple-of-money options granted during fiscal 2010 and during fiscal 2011 vest upon the achievement of defined returns on the Sponsors’ initial investment in the Company. Because vesting of the multiple-of-money market-based options is outside the control of the Company and the award recipients, compensation expense relative to the multiple-of-money options must be recognized upon the occurrence of a triggering event (e.g., sale or initial public offering of the Company).
For the fiscal years ended September 30, 2011, 2010, and 2009 (excluding stock options issued in the exchange offer), the weighted-average grant-date fair value of options granted during the year was $1.27, $1.23, and $2.09, respectively. The fair value of option awards is determined at the date of grant utilizing the Cox-Ross-Rubinstein (“CRR”) binomial option pricing model which is affected by the fair value of the Company’s stock as well as a number of complex and subjective assumptions. Expected volatility is based primarily on a combination of the Company’s peer group’s historical volatility and estimates of implied volatility of the Company’s peer group. The risk-free interest rate assumption was derived from reference to the U.S. Treasury Spot rates for the expected term of the stock options. The dividend yield assumption is based on the Company’s current intent not to issue a dividend under its dividend policy. The expected holding period assumption was estimated based on the Company’s historical experience.
Options granted during the six months ended March 31, 2011 have an exercise price of $3.00, which was the estimated fair value of the underlying shares at the time granted. The fair value of each of the time-based options was $1.29 and was determined utilizing the following assumptions: grant and strike price of $3.00; expected term to exercise of 5 years; expected volatility of 47.82%; risk-free interest rate of 1.64%; and no dividend yield.
Options granted during the four months ended September 30, 2011 have an exercise price of $4.40, which was the estimated fair value of the underlying shares at the time granted. The fair value of each of the time-based options was $1.91 and was determined utilizing the following assumptions: grant and strike price of $4.40; expected term to exercise of 5 years; expected volatility of 48.55%; risk-free interest rate of 1.48%; and no dividend yield.
Options granted during the year ended September 30, 2010, including those granted in the exchange offer, have an exercise price of $3.00, which was the estimated fair value of the underlying shares at the time granted. The fair value of each of the time-based options was $1.39 and was determined utilizing the following assumptions: grant and strike price of $3.00; expected term to exercise of 5 years; expected volatility of 51.01%; risk-free interest rate of 2.28%; and no dividend yield.
The fair value of options granted during the year ended September 30, 2009 was $2.09 and was determined utilizing the following assumptions: grant and strike price of $3.80; expected term to exercise of 5 years; expected volatility of 63.94%; risk-free interest rate of 2.24%; and no dividend yield.
F-56
Table of Contents
For the year ended September 30, 2011, 2010 and 2009, the Company recognized share-based compensation associated with these options of $10 million, $16 million, and $9 million, respectively, which is included in costs and operating expenses. At September 30, 2011, there was $11 million of unrecognized share-based compensation that the Company expects to recognize as expense over the next three to four years associated with 2007 Plan options. The expected expense does not include any compensation associated with the multiple-of-money and EBITDA awards. At September 30, 2011 there are 7,149,453 vested and exercisable options outstanding with a weighted average exercise price of $3.08, a fair value at the date of grant of $14 million and an intrinsic value of $10 million. At September 30, 2011, exercisable options and unvested time-based options that are expected to vest aggregate to 27,344,560 and have a weighted average exercise price of $3.10 a fair value at the date of grant of $52 million and an intrinsic value of $35 million.
During the year ended September 30, 2011, 54,609 options were exercised with an intrinsic value of less than $1 million.
The following table summarizes option awards under the 2007 Plan (excluding the continuation options, as discussed below):
Options (in 000s) | Time-based | EBITDA | Multiple-of- Money | Total | Weighted Average Exercise Price | Fair Value at Date of Grant (in 000s) | ||||||||||||||||||
Outstanding—October 1, 2010 | 29,597 | 154 | 14,383 | 44,134 | $ | 3.03 | 70,800 | |||||||||||||||||
Granted | 4,466 | — | 2,404 | 6,870 | $ | 3.58 | 8,705 | |||||||||||||||||
Exercised | (55 | ) | — | — | (55 | ) | $ | 3.00 | (105 | ) | ||||||||||||||
Forfeited | (4,905 | ) | (58 | ) | (2,390 | ) | (7,353 | ) | $ | 3.08 | (11,846 | ) | ||||||||||||
|
|
|
|
|
|
|
|
|
| |||||||||||||||
Outstanding—September 30, 2011 | 29,103 | 96 | 14,397 | 43,596 | $ | 3.11 | $ | 67,554 | ||||||||||||||||
|
|
|
|
|
|
|
|
|
| |||||||||||||||
Restricted Stock Units
The Company has issued restricted stock units (“RSUs”) each of which represents the right to receive one share of the Company’s stock when fully vested. The fair value of the common stock underlying the RSUs was estimated by the Board of Directors at the date of grant.
2011 Awards
During fiscal 2011, the Company awarded 305,000 RSUs in the ordinary course of business. The fair market value of these awards (as defined under the 2007 Plan) at the date of grant was $3.00 per share for RSUs awarded prior to May 2011 and $4.40 per share for RSUs awarded subsequent to May 2011. These awards generally vest 50% on each of the first and second anniversaries of the grant date.
2010 Awards
In November 2009, the Company granted to its Chief Financial Officer, Anthony Massetti, in connection with his offer of employment 150,000 RSUs, which vest 50% on the first anniversary of the grant date and 25% on each of the second and third anniversaries of the grant date. In accordance with the terms of this grant, following Mr. Massetti’s termination of employment, the Company has the right to purchase from him shares issued on the vesting of these RSUs at a purchase price per share equal to the greater of the fair market value or $13.00. Further, (i) if Mr. Massetti’s employment is terminated other than for cause, (ii) if he voluntarily resigns for good reason or (iii) upon his death or disability, Mr. Massetti has the right to require the Company to
F-57
Table of Contents
purchase from him any and all of the shares of common stock subject to his vested RSUs at a purchase price per share equal to the greater of the fair market value or $13.00. If Mr. Massetti exercises this right, then the Company will have the right to defer the payment to a change in control event, as defined in the 2007 Plan. At September 30, 2011, the estimated fair value of each of Mr. Massetti’s RSUs was $13.00.
In addition, during fiscal 2010, the Company awarded 345,000 RSUs in the ordinary course of business. The fair value of these awards (as defined under the 2007 Plan) at the date of grant was $3.00 per share. These awards generally vest 50% on each of the first and second anniversaries of the grant date.
2009 Awards
During fiscal 2009, the Company awarded 330,789 RSUs to several employees, of which 40,000 RSUs vested through January 2009 and the rest of which vest through May 2013. The fair value of these awards (as defined under the 2007 Plan) at the date of grant was $3.80 per share.
In December 2008, the Company granted to its chief executive officer, Kevin Kennedy, 400,000 RSUs, which vest equally on the first, second, third and fourth anniversary dates of the effective date of his employment agreement, December 22, 2008. In accordance with the terms of this RSU grant, after December 22, 2010, and prior to an initial public offering, (i) if Mr. Kennedy’s employment is terminated other than for cause, (ii) if he voluntarily resigns for any reason or (iii) upon his death or disability, Mr. Kennedy has the right to require the Company to purchase from him any or all of the shares of common stock subject to his vested RSUs at $10 per share (the “RSU Price”). Further, in the event that certain “drag-along” or “tag-along” provisions under the management stockholders’ agreement are exercised and Mr. Kennedy sells shares of common stock underlying vested RSUs in certain transactions and receives less than $10 per share, then the Company is obligated to pay to Mr. Kennedy the difference between $10 per share and the amount realized by Mr. Kennedy in such transaction. At September 30, 2011, the estimated fair value of each of Mr. Kennedy’s RSUs was $10.00.
2008 Awards
In November 2007, the Company awarded 60,000 RSUs which vested in three equal installments from December 2007 through February 2008. In January 2008 the Company awarded 50,000 RSUs which fully vested January 2010. The fair market value (as defined under the 2007 Plan) of each RSU at the date of grant was $5.00.
For the year ended September 30, 2011, 2010 and 2009, the Company recognized compensation expense associated with RSUs of $2 million, $3 million and $1 million, respectively.
As of September 30, 2011, there was $3 million of unrecognized share based compensation associated with RSUs that the Company expects to recognize as expense through June 2013. The following table summarizes the RSUs granted under the 2007 Plan:
Nonvested Shares | Shares | |||
Non-vested shares at October 1, 2008 | 50,000 | |||
Granted | 730,789 | |||
Vested | (40,000 | ) | ||
|
| |||
Non-vested shares at September 30, 2009 | 740,789 | |||
Granted | 495,000 | |||
Forfeited | (15,000 | ) | ||
Vested | (295,000 | ) | ||
|
| |||
Non-vested shares at September 30, 2010 | 925,789 | |||
Granted | 305,000 | |||
Forfeited | (65,789 | ) | ||
Vested | (432,500 | ) | ||
|
| |||
Non-vested shares at September 30, 2011 | 732,500 | |||
|
| |||
F-58
Table of Contents
Continuation Awards
Following the closing of the Merger, fully vested options to purchase shares of the Predecessor Company held by certain members of management that were not exercised before the Merger were substituted for fully-vested stock options to purchase 1,592,970 shares of Avaya having the same intrinsic value of $6 million (“continuation options”). The continuation options have an exercise price of $1.25 and have an average remaining life of 1.9 years. As of September 30, 2011, 1,163,209 of these continuation options had been exercised, with the remaining 429,761 continuation options still outstanding.
Additionally, following the closing of the Merger, fully vested performance based RSUs of the Predecessor Company held by certain members of management were substituted for 1,331,155 fully-vested RSUs of Avaya, having the same intrinsic value of $7 million (“continuation units”). During the period October 27, 2007 through September 30, 2008, 358,814 of the continuation units were cancelled. Each continuation unit represents the right to receive one share of Avaya stock. In accordance with the 2007 Plan, the continuation options and continuation units do not detract from the authorized shares under the 2007 Plan.
15. Capital Stock
Capital Stock
Effective December 17, 2009, the Company amended and restated its certificate of incorporation. As amended and restated the certificate of incorporation authorizes the Company to issue up to 750,000,000 shares of Common Stock with a par value of $.001 per share and 250,000 shares of Preferred Stock with a par value of $0.001 per share.
Preferred Stock
On December 19, 2009 the Company issued 125,000 shares of Series A preferred stock (“preferred series A”) with detachable warrants to purchase up to 38.5 million common shares at a price of $3.25 per share which expire December 19, 2019. The aggregate proceeds from the issuance of the preferred series A and associated warrants were $125 million and were used to partially fund the acquisition of NES. The preferred series A shares are non-voting, redeemable at the Company’s election and have a liquidation preference of $1,000 per share plus cumulative, compounded quarterly, accrued unpaid dividends at a rate of 5 percent per annum in cash.
Funds affiliated with Silver Lake and TPG provided an aggregate of $78 million of the cash proceeds from the issuance of the preferred series A shares and the warrants, with each sponsor-affiliated group providing $39 million of the cash proceeds. Based on their contributed cash, the Silver Lake and TPG funds each received 38,864 preferred series A shares and warrants to purchase up to 11,958,192 common shares. Under the terms of the preferred stock agreement, the preferred series A shares are redeemable at the Company’s election only; however, because affiliates of Silver Lake and TPG control the board of directors and hold a substantial portion of the preferred series A shares, they could trigger a demand for redemption at their discretion and therefore, the preferred series A shares have been classified in the mezzanine section between debt and stockholders’ deficiency in the Consolidated Balance Sheets.
In accordance with GAAP, the Company allocated the aggregate proceeds received at closing between the preferred series A shares and warrants issued based on their relative fair values at December 19, 2009. The estimated fair value of the preferred series A shares on December 19, 2009 was $85 million, which was estimated using the discounted cash flow analysis based on the Company’s current borrowing rates for similar types of borrowing arrangements (e.g. Level 2 Input). The warrants have a term of 10-years, have an exercise price of $3.25 per share and an aggregate estimated fair value of $71.5 million. The fair value of each warrant was
F-59
Table of Contents
determined utilizing the CRR binomial option under the following assumptions: estimated fair value of underlying stock of $3.00; expected term to exercise of 10 years; expected volatility of 48.8%; risk-free interest rate of 3.6%; and no dividend yield. The Company allocated the cash proceeds of $125 million received to the preferred series A shares and warrants based on their relative fair values, or $68 million and $57 million, respectively. Contemporaneously, the Company recorded a discount accretion of $57 million to the carrying amount of the preferred series A at the date of issuance, so that the carrying amount will equal the redemption amount.
As of September 30, 2011 and September 30, 2010, total accretion and accrued unpaid dividends were $69 million and $62 million, respectively.
Warrants
In connection with the financing of the acquisition of NES, on December 18, 2009, we issued warrants to purchase 100 million shares of our common stock of which 61.5 million warrants were issued in connection with the incremental B-2 term loans as discussed in Note 9 “Financing Arrangements” and 38.5 million warrants were issued in connection with the issuance of the preferred series A. The warrants have a cashless exercise feature. The warrants contain customary adjustment provisions for stock splits, capital reorganizations and certain other distributions. The warrants have an exercise price of $3.25 per share and are exercisable at any time prior to December 18, 2019. All of these warrants are currently outstanding as of September 30, 2011 and September 30, 2010.
16. Net Loss Per Share
The following table sets forth the computation of basic and diluted net loss per share of common stock as discussed in Note 2, “Summary of Significant Accounting Policies—Net Loss Per Share”:
| Years ended September 30, | ||||||||||||
| 2011 | 2010 | 2009 | ||||||||||
Numerator (in millions): | ||||||||||||
Net loss attributable to Avaya Holdings Corp. | $ | (863 | ) | $ | (874 | ) | $ | (847 | ) | |||
Dividends on Series A preferred stock | (7 | ) | (5 | ) | — | |||||||
Accretion on Series A preferred stock | — | (57 | ) | — | ||||||||
|
|
|
|
|
| |||||||
Net loss attributable to common stockholders | $ | (870 | ) | $ | (936 | ) | $ | (847 | ) | |||
|
|
|
|
|
| |||||||
Denominator (in millions): | ||||||||||||
Weighted average common shares—basic and diluted | 489.0 | 488.6 | 488.1 | |||||||||
|
|
|
|
|
| |||||||
Net loss per share—basic and diluted* | $ | (1.78 | ) | $ | (1.92 | ) | $ | (1.74 | ) | |||
|
|
|
|
|
| |||||||
| * | Basic net loss per share is computed by dividing the net loss attributable to common stockholders by the weighted average number of common shares outstanding during the period. Net loss attributable to common stockholders is increased for preferred stock dividends earned during the period. For the periods with net losses, all potentially dilutive common shares consisting of stock options, restricted stock units and warrants are antidilutive. |
17. Reportable Segments
Avaya conducts its business operations in three segments. Two of those segments, Global Communications Solutions (“GCS”) and Avaya Networking (“Networking” formerly known as Data Networking or “Data”), make up Avaya’s product portfolio. The third segment contains Avaya’s services portfolio and is called Avaya Global Services (“AGS”).
F-60
Table of Contents
The Company acquired its Networking business as part of the acquisition of NES on December 18, 2009 and prior to the fourth quarter of fiscal 2010 included the results of the Networking business within the reported results of the GCS segment. During the fourth quarter of fiscal 2010, the Company changed the manner in which it organizes and reports its segments to present the Networking business as a separate reportable segment and no longer includes its results as a part of the GCS segment. To be consistent with this reporting structure, the revenues and gross margins of the Networking business for the period December 18, 2009 through June 30, 2010 have been reclassified from the GCS segment to the Networking segment.
The GCS segment primarily develops, markets and sells unified communications and contact center solutions by integrating multiple forms of communications, including telephone, e-mail, instant messaging and video. Avaya’s Networking segment’s portfolio of products offers integrated networking solutions which are scalable across customer enterprises. The AGS segment develops, markets and sells comprehensive end-to-end global service offerings that allow customers to evaluate, plan, design, implement, monitor and manage complex enterprise communications networks.
For internal reporting purposes the Company’s chief operating decision maker makes financial decisions and allocates resources based on segment margin information obtained from the Company’s internal management systems. Management does not include in its segment measures of profitability selling, general, and administrative expenses, research and development expenses, amortization of intangible assets, and certain discrete items, such as charges relating to restructuring actions, impairment charges and merger-related costs as these costs are not core to the measurement of segment management’s performance, but rather are controlled at the corporate level.
No single customer accounted for more than 10% of net revenue for fiscal year 2011, 2010, and 2009.
F-61
Table of Contents
Reportable Segments
Summarized financial information relating to the Company’s reportable segments is shown in the following table:
| Years ended September 30, | ||||||||||||
In millions | 2011 | 2010 | 2009 | |||||||||
REVENUE | ||||||||||||
Global Communications Solutions | $ | 2,675 | $ | 2,329 | $ | 1,939 | ||||||
Avaya Networking | 304 | 280 | — | |||||||||
Avaya Global Services | 2,573 | 2,463 | 2,227 | |||||||||
Unallocated Amounts(1) | (5 | ) | (12 | ) | (16 | ) | ||||||
|
|
|
|
|
| |||||||
| $ | 5,547 | $ | 5,060 | $ | 4,150 | |||||||
|
|
|
|
|
| |||||||
GROSS MARGIN | ||||||||||||
Global Communications Solutions | $ | 1,532 | $ | 1,249 | $ | 1,066 | ||||||
Avaya Networking | 131 | 117 | — | |||||||||
Avaya Global Services | 1,222 | 1,119 | 1,065 | |||||||||
Unallocated Amounts(1) | (253 | ) | (313 | ) | (265 | ) | ||||||
|
|
|
|
|
| |||||||
| 2,632 | 2,172 | 1,866 | ||||||||||
OPERATING EXPENSES | ||||||||||||
Selling, general and administrative | 1,845 | 1,721 | 1,272 | |||||||||
Research and development | 461 | 407 | 309 | |||||||||
Amortization of intangible assets | 226 | 218 | 207 | |||||||||
Impairment of long-lived assets | — | 16 | 2 | |||||||||
Impairment of indefinite-lived intangible assets | — | — | 60 | |||||||||
Goodwill impairment | — | — | 235 | |||||||||
Restructuring charges, net | 189 | 171 | 160 | |||||||||
In-process research and development charge | — | — | 12 | |||||||||
Acquisition-related costs | 5 | 20 | 29 | |||||||||
|
|
|
|
|
| |||||||
| 2,726 | 2,553 | 2,286 | ||||||||||
|
|
|
|
|
| |||||||
OPERATING LOSS | (94 | ) | (381 | ) | (420 | ) | ||||||
INTEREST EXPENSE, LOSS ON EXTINGUISHMENT OF DEBT AND OTHER INCOME, NET | (701 | ) | (472 | ) | (395 | ) | ||||||
|
|
|
|
|
| |||||||
LOSS BEFORE INCOME TAXES | $ | (795 | ) | $ | (853 | ) | $ | (815 | ) | |||
|
|
|
|
|
| |||||||
ASSETS: | ||||||||||||
Global Communications Solutions | $ | 1,623 | $ | 1,572 | ||||||||
Data Networking | 29 | 23 | ||||||||||
Avaya Global Services | 2,707 | 2,714 | ||||||||||
Unallocated Assets(2) | 4,202 | 4,967 | ||||||||||
|
|
|
| |||||||||
Total | $ | 8,561 | $ | 9,276 | ||||||||
|
|
|
| |||||||||
| (1) | Unallocated Amounts in Gross Margin include the amortization of technology intangible assets that are not identified with a specific segment. Unallocated Amounts in Revenue and Gross Margin also include the impacts of certain fair value adjustments recorded in purchase accounting in connection with the Merger. |
| (2) | Unallocated Assets consist of cash and cash equivalents, accounts receivable, deferred income tax assets, property, plant and equipment, intangible assets and other assets. Unallocated Assets are managed at the corporate level and are not identified with a specific segment. |
F-62
Table of Contents
Geographic Information
Financial information relating to the Company’s revenue and long-lived assets by geographic area is as follows:
| Revenue (1) | ||||||||||||
| Years ended September 30, | ||||||||||||
In millions | 2011 | 2010 | 2009 | |||||||||
U.S. | $ | 2,998 | $ | 2,764 | $ | 2,276 | ||||||
International: | ||||||||||||
Germany | 505 | 537 | 579 | |||||||||
EMEA (excluding Germany) | 983 | 846 | 613 | |||||||||
|
|
|
|
|
| |||||||
Total EMEA | 1,488 | 1,383 | 1,192 | |||||||||
APAC—Asia Pacific | 515 | 464 | 350 | |||||||||
Americas International—Canada and Central and Latin America | 546 | 449 | 332 | |||||||||
|
|
|
|
|
| |||||||
Total International | 2,549 | 2,296 | 1,874 | |||||||||
|
|
|
|
|
| |||||||
Total revenue | $ | 5,547 | $ | 5,060 | $ | 4,150 | ||||||
|
|
|
|
|
| |||||||
| Long-Lived Assets (2) | ||||||||
| September 30, | ||||||||
In millions | 2011 | 2010 | ||||||
U.S. | $ | 268 | $ | 296 | ||||
International: | ||||||||
Germany | 68 | 75 | ||||||
EMEA (excluding Germany) | 22 | 26 | ||||||
|
|
|
| |||||
Total EMEA | 90 | 101 | ||||||
APAC—Asia Pacific | 24 | 31 | ||||||
Americas International—Canada and Central and Latin America | 15 | 22 | ||||||
|
|
|
| |||||
Total International | 129 | 154 | ||||||
|
|
|
| |||||
Total | $ | 397 | $ | 450 | ||||
|
|
|
| |||||
| (1) | Revenue is attributed to geographic areas based on the location of customers. |
| (2) | Represents property, plant and equipment, net. |
18. Related Party Transactions
Both Avaya Holding Corp. and Avaya Inc. are party to a Management Services Agreement with Silver Lake Management Company III, L.L.C., an affiliate of Silver Lake, and TPG Capital, L.P., an affiliate of TPG, collectively “the Managers,” pursuant to which the Managers provide financial advisory services to the Company. Pursuant to the Management Services Agreement, the Managers receive a monitoring fee of $7 million per annum and reimbursement for out-of-pocket expenses incurred in connection with the provision of such services. In the event of a financing, acquisition, disposition or change of control transaction involving the Company during the term of the Management Services Agreement, the Managers will have the right to require the Company to pay a fee equal to customary fees charged by internationally-recognized investment banks for serving as a financial advisor in similar transactions. The Management Services Agreement may be terminated at any time by the Managers, but will otherwise have an initial term ending on December 31, 2017 that will automatically be extended each December 31st for an additional year unless the Company or the Managers provide written notice of their desire not to extend the agreement. The Management Services Agreement will automatically terminate upon an initial public offering unless otherwise determined by the Managers, and, upon such a termination, the Managers will receive a one-time success fee in an amount equal to the net present values
F-63
Table of Contents
of the monitoring fees that would have been payable during the remaining term of the Management Services Agreement. In accordance with the Management Services Agreement, the Company recorded $7 million of monitoring fees per year during fiscal 2011, 2010 and 2009.
The Sponsors are private equity firms that have investments in companies that do business with Avaya. For the fiscal years 2011, 2010 and 2009, the Company recorded $8 million, $8 million and $11 million, respectively associated with sales of the Company’s products and services to companies in which one or both of the Sponsors have investments. For each of the fiscal years 2011, 2010 and 2009, the Company purchased goods and services of $3 million, $1 million and $1 million, respectively from companies in which one or both of the Sponsors have investments.
Charles Giancarlo, Greg Mondre and David Roux are Directors of each of Avaya Holdings Corp. and Avaya Inc. and they hold the positions of Managing Director, Managing Director and Chairman, respectively, of Silver Lake. Eugene Frantz, Afshin Mohebbi and Kevin Rollins are Directors of each of Avaya Holdings Corp. and Avaya Inc. and they hold the positions of Partner, Senior Advisor and Senior Advisor, respectively, of TPG.
Effective June 30, 2008, Mr. Giancarlo was elected President and Chief Executive Officer of each of Avaya Holdings Corp. and Avaya Inc. Pursuant to an agreement executed in July 2008 and subsequently amended in January 2009 between the Company and Silver Lake Management Company III, L.L.C., the Company was entitled to reduce the portion of the monitoring fee payable to Silver Lake under the Management Services Agreement discussed above by the amount of any compensation (excluding any one-time cash bonus compensation) paid by the Company or any of its affiliates to Mr. Giancarlo (plus any employer taxes paid with respect to such compensation during such period) in return for his service. During fiscal 2009, an aggregate of $1.4 million, was paid to Mr. Giancarlo for services as President and Chief Executive Officer of the Company, of which $1 million was a one-time cash bonus compensation. In addition, on November 24, 2008, Mr. Giancarlo received a grant of 500,000 stock options having an exercise price of $3.80 per share, the fair market value of a share of the Company’s common stock on the date of the grant. The stock options were issued with standard vesting provisions using the standard weightings of time-based, EBITDA-based and MoM-based awards used when making grants to employees generally. Effective December 22, 2008, Kevin J. Kennedy joined the Company as President and Chief Executive Officer. Subsequently, Mr. Giancarlo remained with the Company as the Chairman of the Board of Directors. Mr. Giancarlo participated in the Company’s stock option tender offer (see Note 14, “Share-based Compensation”) and tendered all of his stock options for an identical number of new stock options having a grant date of November 17, 2009, an exercise price of $3.00 per share and new vesting provisions.
Gary B. Smith has been a Director of each of Avaya Holdings Corp. and Avaya Inc. since his appointment on December 6, 2011. Mr. Smith currently serves as President, Chief Executive Officer and Director of Ciena Corporation, or Ciena, a network infrastructure company. During fiscal year 2011, and prior to Mr. Smith’s appointment as a Director of each of Avaya Holdings Corp. and Avaya Inc., the Company recorded approximately $5 million associated with sales of the Company’s products and services to Ciena. The Company also purchased goods and services of less than $1 million from Ciena during fiscal year 2011.
In April 2008, affiliates of TPG acquired $200 million of the Avaya Inc’s senior secured term B-1 loans. Based on the amount of the senior secured term loans that were held during the period, and consistent with the terms of the loan, those affiliates received payments of principal and interest aggregating approximately $6 million, $6 million, and $12 million for fiscal 2011, 2010 and 2009 respectively. In September 2008, an affiliate of Silver Lake acquired $200 million of the Avaya Inc’s senior secured term B-1 loans. Based on the amount of the senior secured term loans held during the period, and consistent with the terms of the loan, that affiliate received payments of principal and interest aggregating approximately $4 million, $8 million and $12 million for fiscal 2011, 2010 and 2009, respectively. In connection with the financing of the Acquisition, affiliates of TPG and Silver Lake each funded approximately $222 million of incremental term B-2 loans. Avaya Inc. paid the incremental term B-2 loans in full on February 11, 2011 (see Note 9, “Financing Arrangements”).
F-64
Table of Contents
Similar to other holders of senior secured incremental term B-2 loans, those senior secured incremental term B-2 loans held by affiliates of TPG and Silver Lake were repaid in connection with the issuance of Avaya Inc.’s senior secured notes. Consistent with the terms of the incremental term B-2 loans, affiliates of TPG and Silver Lake each received payments (consisting of principal and interest, inclusive of amounts paid by Avaya Inc. in connection with the payment in full of all term B-2 loans on February 11, 2011) aggregating approximately $285 million for fiscal 2011 and $25 million for fiscal 2010. In addition, on February 11, 2011, certain of Avaya Inc.’s term B-1 loans were reclassified as term B-3 loans (see Note 9, “Financing Arrangements”). For fiscal 2011, an affiliate of Silver Lake received payments of principal and interest aggregating approximately $4 million with respect to its holdings of Avaya Inc.’s senior secured term B-3 loans.
As of September 30, 2011 affiliates of Silver Lake held $54 million and $123 million in outstanding principal amounts of term B-1 loans and term B-3 loans, respectively. As of September 30, 2010 affiliates of Silver Lake held $194 million and $274 million in outstanding principal amounts of term B-1 loans and incremental term B-2 loans, respectively.
As of September 30, 2011 affiliates of TPG held $119 million in outstanding principal amounts of term B-1 loans. As of September 30, 2010, affiliates of TPG held $145 million and $274 million in outstanding principal amounts of term B-1 loans and incremental term B-2 loans, respectively.
In addition, in connection with the financing of the Acquisition, we issued shares of our Series A preferred stock. As of September 30, 2011, affiliates of TPG owned 38,864.13 shares of our non-voting Series A preferred stock (representing 31.1% of the issued and outstanding shares of Series A preferred stock) and affiliates of Silver Lake owned 38,864.13 shares of our non-voting Series A preferred stock (representing 31.1% of the issued and outstanding shares of Series A preferred stock) (see Note 15, “Capital Stock”).
19. Commitments and Contingencies
Legal Proceedings
In the ordinary course of business, the Company is involved in litigation, claims, government inquiries, investigations and proceedings, including, but not limited to, those identified below, relating to intellectual property, commercial, securities, employment, employee benefits, environmental and regulatory matters.
Other than as described below, the Company believes there is no litigation pending or environmental and regulatory matters against the Company that could have, individually or in the aggregate, a material adverse effect on the Company’s financial position, results of operations or cash flows.
Government Subpoenas
On May 3, 2005, the Company received a subpoena from the Office of Inspector General, U.S. General Services Administration, relating to a federal investigation of the Company’s billing for telecommunications equipment and maintenance services. In January 2011, the Company settled this matter, as well as ancillary state matters, for approximately $16 million, including legal fees for plaintiffs’ lawyers.
Antitrust Litigation
In 2006, the Company instituted an action in the U.S. District Court, District of New Jersey, against defendants Telecom Labs, Inc., TeamTLI.com Corp. and Continuant Technologies, Inc. and subsequently amended its complaint to include certain individual officers of these companies as defendants. Defendants purportedly provide maintenance services to customers who have purchased or leased the Company’s communications equipment. The Company asserts in its amended complaint that, among other things, defendants, or each of them, have engaged in tortious conduct and/or violated federal intellectual property laws
F-65
Table of Contents
by improperly accessing and utilizing the Company’s proprietary software, including passwords, logins and maintenance service permissions, to perform certain maintenance services on the Company’s customers’ equipment. Defendants have filed a counterclaim against the Company, alleging a number of tort claims and alleging that the Company has violated the Sherman Act’s prohibitions against anticompetitive conduct through the manner in which the Company sells its products and services. The parties have engaged in extensive discovery and motion practice to, among other things, amend and dismiss pleadings and compel and oppose discovery requests. A trial date originally set for September 2011 has been adjourned and no new date has been set by the court. In November 2011, defendant’s motion to dismiss Avaya’s Digital Millennium Copyright Act claims was granted in part and denied in part. Other dispositive motions are pending. At this point in the proceeding, expert discovery on the Company’s claims and the defendants’ surviving counter-claims continues. Therefore, at this time an outcome cannot be predicted and, as a result, the Company cannot be assured that this case will not have a material adverse effect on the manner in which it does business, its financial position, results of operations or cash flows.
Intellectual Property
In the ordinary course of business, the Company is involved in litigation alleging it has infringed upon third parties’ intellectual property rights, including patents; some litigation may involve claims for infringement against customers by third parties relating to the use of Avaya’s products, as to which the Company may provide indemnifications of varying scope to certain customers. These matters are on-going and the outcomes are subject to inherent uncertainties. As a result, the Company cannot be assured that any such matter will not have a material adverse effect on its financial position, results of operations or cash flows. However, management does provide for estimated losses if and when it believes the facts and circumstances indicate that a loss is probable and the loss can be reasonably estimated. While it is not possible at this time to determine with certainty the ultimate outcome of these cases, the Company believes there are no such infringement matters that could have, individually or in aggregate, a material adverse effect on the Company’s financial position, results of operations or cash flows.
Other
In August 2007, CIT Communications Finance Corp. (“CIT”), instituted an arbitration proceeding, alleging that the Company breached a number of agreements dating back to 1998, including agreements wherein CIT Corp. purchased a certain number of customer leases from the Company’s predecessor, Lucent. CIT filed amended claims in August 2007 and then in June 2008. CIT alleges that the Company and Lucent breached provisions in the agreements, including representations, warranties and covenants regarding the nature of the assets CIT purchased. The parties have entered into a settlement agreement to resolve this issue for an amount which will not have a material adverse effect on the Company’s financial position, results of operations or cash flows.
Since November 2008, OpenLink Software Inc. (“OpenLink”), a former supplier of software utilized by Avaya in its Call Management System, has alleged that the Company breached the terms of software licenses in an OEM agreement dated June 23, 1997, as amended from time to time. In April 2011, the Company settled this matter without the Company admitting wrongdoing and for an amount that did not have a material adverse effect on the Company’s financial position, results of operations, or cash flows.
In October 2009, a former supplier in France, Combel, made a claim for improper termination of the Company’s relationship under French law seeking damages of at least €10 million and a provisional (interim) indemnity by the Company of €5 million. The Company disputes that Combel is entitled to any such damages and that it has not improperly terminated the relationship. In December 2010, the court rejected all claims of Combel based on the allegedly improper termination of the commercial relationship and only a claim with respect to the buyback of inventory remains open. To assess the value of the remaining inventory, the court appointed an expert. Combel filed an appeal against the Court decision. In November 2011, the Court of Appeals affirmed the lower court decision denying Combel’s improper termination claim and ordered Avaya to pay Combel an amount for the inventory buy back. The amount ordered is not material. At this time it is unclear
F-66
Table of Contents
whether either party will appeal the decision, and an outcome cannot be predicted. Therefore, the Company cannot be assured that this case will not have a material adverse effect on its financial position, results of operations or cash flows.
In October 2009, a group of former employees of Avaya’s former Shreveport, Louisiana manufacturing facility brought suit in Louisiana state court, naming as defendants Alcatel-Lucent USA, Inc., Lucent Technologies Services Company, Inc., and AT&T Technologies, Inc. The former employees allege hearing loss due to hazardous noise exposure from the facility dating back over forty years, and stipulate that the total amount of each individual’s damages does not exceed fifty thousand dollars. In February 2010 plaintiffs amended their complaint to add Avaya Inc. as a named defendant. There are 101 plaintiffs in the case. This matter is in the early phases of discovery. The Company cannot determine if this matter will have an effect on our business or, if it does, whether its outcome will have a material adverse effect on our financial position, results of operations or cash flows.
Product Warranties
The Company recognizes a liability for the estimated costs that may be incurred to remedy certain deficiencies of quality or performance of the Company’s products. These product warranties extend over a specified period of time generally ranging up to two years from the date of sale depending upon the product subject to the warranty. The Company accrues a provision for estimated future warranty costs based upon the historical relationship of warranty claims to sales. The Company periodically reviews the adequacy of its product warranties and adjusts, if necessary, the warranty percentage and accrued warranty reserve, which is included in other current liabilities in the Consolidated Balance Sheets, for actual experience.
In millions | ||||
Balance as of October 1, 2009 | $ | 21 | ||
Reductions for payments and costs to satisfy claims | (41 | ) | ||
Accruals for warranties issued during the period | 36 | |||
Reserves acquired with NES | 34 | |||
Adjustments | (5 | ) | ||
|
| |||
Balance as of September 30, 2010 | 45 | |||
Reductions for payments and costs to satisfy claims | (40 | ) | ||
Accruals for warranties issued during the period | 21 | |||
Adjustments | (2 | ) | ||
|
| |||
Balance as of September 30, 2011 | $ | 24 | ||
|
| |||
Guarantees of Indebtedness and Other Off-Balance Sheet Arrangements
Letters of Credit
The Company has uncommitted credit facilities that vary in term totaling $47 million, of which the Company had entered into letters of credit totaling $43 million, as of September 30, 2011 for the purpose of obtaining third party financial guarantees such as letters of credit which ensure the Company’s performance or payment to third parties. As of September 30, 2011 and 2010, the Company had outstanding an aggregate of $118 million and $104 million, respectively, in irrevocable letters of credit under the committed and uncommitted credit facilities (including $75 million and $53 million, respectively, under its $535 million committed credit facilities).
Surety Bonds
The Company arranges for the issuance of various types of surety bonds, such as license, permit, bid and performance bonds, which are agreements under which the surety company guarantees that the Company will perform in accordance with contractual or legal obligations. These bonds vary in duration although most are
F-67
Table of Contents
issued and outstanding from six months to three years. These bonds are backed by $12 million of the Company’s letters of credit. If the Company fails to perform under its obligations, the maximum potential payment under these surety bonds is $20 million and $34 million, as of September 30, 2011 and 2010, respectively. Historically, no surety bonds have been drawn upon.
Purchase Commitments and Termination Fees
The Company purchases components from a variety of suppliers and uses several contract manufacturers to provide manufacturing services for its products. During the normal course of business, in order to manage manufacturing lead times and to help assure adequate component supply, the Company enters into agreements with contract manufacturers and suppliers that allow them to produce and procure inventory based upon forecasted requirements provided by the Company. If the Company does not meet these specified purchase commitments, it could be required to purchase the inventory, or in the case of certain agreements, pay an early termination fee. Historically, the Company has not been required to pay a charge for not meeting its designated purchase commitments with these suppliers, but has been obligated to purchase certain excess inventory levels from its outsourced manufacturers due to actual sales of product varying from forecast and due to transition of manufacturing from one vendor to another.
The Company’s outsourcing agreement with its most significant contract manufacturer expires in July 2013. After the initial term, the outsourcing agreement is automatically renewed for successive periods of twelve months each, subject to specific termination rights for the Company and the contract manufacturer. All manufacturing of the Company’s products is performed in accordance with either detailed requirements or specifications and product designs furnished by the Company, and is subject to rigorous quality control standards.
Product Financing Arrangements
The Company sells products to various resellers that may obtain financing from certain unaffiliated third-party lending institutions. For the Company’s product financing arrangement with resellers outside the U.S., in the event participating resellers default on their payment obligations to the lending institution, the Company is obligated under certain circumstances to guarantee repayment to the lending institution. The repayment amount fluctuates with the level of product financing activity. The guaranteed repayment amount was approximately $2 million and $4 million as of September 30, 2011 and 2010, respectively. The Company reviews and sets the maximum credit limit for each reseller participating in this financing arrangement. Historically, there have not been any guarantee repayments by the Company. The Company has estimated the fair value of this guarantee as of September 30, 2011 and 2010, and has determined that it is not significant. There can be no assurance that the Company will not be obligated to repurchase inventory under this arrangement in the future.
Long-Term Incentive Bonus Plan
The Company has established a Long-Term Incentive Cash Bonus Plan (“LTIP”). Under the LTIP, the Company will make cash awards available to compensate certain key employees upon the achievement of defined returns on the Sponsors’ initial investment in the Company (a “triggering event”). The Company has authorized LTIP awards covering a total of $60 million, of which $45 million and $41 million in awards were outstanding as of September 30, 2011 and 2010, respectively. The Company will begin recognizing compensation expense relative to the LTIP awards upon the occurrence of a triggering event (e.g., a sale or initial public offering). As of September 30, 2011, no compensation expense associated with the LTIP has been recognized.
Performance Guarantee
In connection with the sales of certain businesses, the Company has assigned its rights and obligations under several real estate leases to the acquiring companies (the “assignees”). The remaining terms of these leases vary from one year to four years. While the Company is no longer the primary obligor under these leases, the lessor
F-68
Table of Contents
has not completely released the Company from its obligation, and holds it secondarily liable in the event that the assignees default on these leases. The maximum potential future payments the Company could be required to make, if all of the assignees were to default as of September 30, 2011 and 2010, would be approximately $2 million and $5 million, respectively. The Company has assessed the probability of default by the assignees and has determined it to be remote.
Credit Facility Indemnification
In connection with its obligations under the credit facility described in Note 9, “Financing Arrangements,” the Company has agreed to indemnify the third-party lending institutions for costs incurred by the institutions related to changes in tax law or other legal requirements. While there have been no amounts paid to the lenders pursuant to this indemnity in the past, there can be no assurance that the Company will not be obligated to indemnify the lenders under this arrangement in the future.
Transactions with Alcatel-Lucent
Pursuant to the Contribution and Distribution Agreement, Lucent Technologies, Inc. (now Alcatel-Lucent) contributed to the Company substantially all of the assets, liabilities and operations associated with its enterprise networking businesses (“Company’s Businesses”). The Contribution and Distribution Agreement, among other things, provides that, in general, the Company will indemnify Lucent for all liabilities including certain pre-distribution tax obligations of Lucent relating to its businesses and all contingent liabilities accruing pre-distribution primarily relating to its businesses or otherwise assigned to it. In addition, the Contribution and Distribution Agreement provides that certain contingent liabilities not directly identifiable with one of the parties accruing pre-distribution will be shared in the proportion of 90% by Lucent and 10% by the Company. The Contribution and Distribution Agreement also provides that contingent liabilities accruing pre-distribution in excess of $50 million that are primarily related to Lucent’s businesses shall be borne 90% by Lucent and 10% by the Company and contingent liabilities accruing pre-distribution in excess of $50 million that are primarily related to our businesses shall be borne equally by the parties.
In addition, if the separation from Alcatel-Lucent fails to qualify as a tax-free distribution under Section 355 of the Internal Revenue Code because of an acquisition of the Company’s stock or assets, or some other actions of the Company, then the Company will be solely liable for any resulting corporate taxes.
The Tax Sharing Agreement governs Alcatel-Lucent’s and the Company’s respective rights, responsibilities and obligations after the distribution with respect to taxes for the periods ending on or before the distribution. Generally, pre-distribution taxes or benefits that are clearly attributable to the business of one party will be borne solely by that party, and other pre-distribution taxes or benefits will be shared by the parties based on a formula set forth in the Tax Sharing Agreement. The Company may be subject to additional taxes or benefits pursuant to the Tax Sharing Agreement related to future settlements of audits by state and local and foreign taxing authorities for the periods prior to the Company’s separation from Alcatel-Lucent.
F-69
Table of Contents
Leases
The Company leases land, buildings and equipment under agreements that expire in various years through 2026. Rental expense under operating leases, excluding any lease termination costs incurred related to the Company’s restructuring programs, was $122 million, $138 million, $115 million, for fiscal year 2011, 2010 and 2009, respectively.
The table below sets forth future minimum lease payments, net of sublease income, due under non-cancelable operating leases, of which $71 million of such payments have been accrued for as of September 30, 2011 in accordance with accounting principles generally accepted in the U.S. pertaining to restructuring and exit activities.
In millions | ||||
2012 | $ | 110 | ||
2013 | 91 | |||
2014 | 74 | |||
2015 | 63 | |||
2016 and thereafter | 241 | |||
|
| |||
Future minimum lease payments | $ | 579 | ||
|
| |||
20. Quarterly information (unaudited)
In millions | First Quarter | Second Quarter | Third Quarter | Fourth Quarter | Total | |||||||||||||||
Year Ended September 30, 2011 | ||||||||||||||||||||
Revenue | $ | 1,366 | $ | 1,390 | $ | 1,372 | $ | 1,419 | $ | 5,547 | ||||||||||
Gross margin | 619 | 642 | 653 | 718 | 2,632 | |||||||||||||||
Operating income (loss) | (39 | ) | (47 | ) | (92 | ) | 84 | (94 | ) | |||||||||||
Provision for (benefit from) income taxes | 22 | 19 | (52 | ) | 79 | 68 | ||||||||||||||
Net loss | (180 | ) | (432 | ) | (152 | ) | (99 | ) | (863 | ) | ||||||||||
Net loss attributable to common stockholders | $ | (181 | ) | $ | (434 | ) | $ | (154 | ) | $ | (101 | ) | (870 | ) | ||||||
Net loss per share—basic and diluted | $ | (0.37 | ) | $ | (0.89 | ) | $ | (0.31 | ) | $ | (0.21 | ) | $ | (1.78 | ) | |||||
Year Ended September 30, 2010 | ||||||||||||||||||||
Revenue | $ | 1,060 | $ | 1,320 | $ | 1,332 | $ | 1,348 | $ | 5,060 | ||||||||||
Gross margin | 510 | 536 | 555 | 571 | 2,172 | |||||||||||||||
Operating loss | (35 | ) | (174 | ) | (105 | ) | (67 | ) | (381 | ) | ||||||||||
Provision for (benefit from) income taxes | 3 | (19 | ) | 9 | 25 | 18 | ||||||||||||||
Net loss | (136 | ) | (281 | ) | (240 | ) | (214 | ) | (871 | ) | ||||||||||
Net loss attributable to common stockholders | $ | (194 | ) | $ | (284 | ) | $ | (241 | ) | $ | (217 | ) | $ | (936 | ) | |||||
Net loss per share—basic and diluted | $ | (0.40 | ) | $ | (0.58 | ) | $ | (0.49 | ) | $ | (0.45 | ) | $ | (1.92 | ) | |||||
21. Condensed Financial Information of Parent Company
Avaya Holdings Corp. has no material assets or standalone operations other than its ownership in Avaya Inc. and its subsidiaries.
There are significant restrictions on the Company’s ability to obtain funds from any of its subsidiaries through dividends, loans or advances. Accordingly, these condensed financial statements have been presented on a “Parent-only” basis. Under a Parent-only presentation, the Company’s investments in its consolidated subsidiaries are presented under the equity method of accounting. These Parent-only financial statements should be read in conjunction with the Company’s consolidated financial statements.
F-70
Table of Contents
The following tables present the financial position of Avaya Holdings Corp. as September 30, 2011 and 2010 and the results of its operations and cash flows for the years ended September 30, 2011, 2010 and 2009.
Avaya Holdings Corp.
Condensed Balance Sheets
| September 30, | ||||||||
In millions | 2011 | 2010 | ||||||
Cash and cash equivalents | $ | 15 | $ | 15 | ||||
Other non-current assets | 2 | — | ||||||
|
|
|
| |||||
TOTAL | $ | 17 | $ | 15 | ||||
|
|
|
| |||||
DEFICIENCY IN EXCESS OF INVESTMENT IN AVAYA INC., PREFERRED STOCK AND STOCKHOLDERS’ DEFICIENCY | ||||||||
Due to Avaya Inc. | $ | 2 | — | |||||
Deficiency in excess of investment in Avaya Inc. | 2,378 | $ | 1,428 | |||||
Commitments and contingencies | ||||||||
Preferred stock Series A | 137 | 130 | ||||||
Stockholders’ deficiency | (2,500 | ) | (1,543 | ) | ||||
|
|
|
| |||||
TOTAL | $ | 17 | $ | 15 | ||||
|
|
|
| |||||
Avaya Holdings Corp.
Condensed Statements of Operations
| Years ended September 30, | ||||||||||||
In millions | 2011 | 2010 | 2009 | |||||||||
Equity in net loss of Avaya Inc. | $ | (863 | ) | $ | (874 | ) | $ | (847 | ) | |||
|
|
|
|
|
| |||||||
LOSS BEFORE INCOME TAXES | (863 | ) | (874 | ) | (847 | ) | ||||||
Provision for income taxes | — | — | — | |||||||||
|
|
|
|
|
| |||||||
NET LOSS | $ | (863 | ) | $ | (874 | ) | $ | (847 | ) | |||
|
|
|
|
|
| |||||||
F-71
Table of Contents
Avaya Holdings Corp.
Condensed Statements of Cash Flows
| Years ended September 30, | ||||||||||||
In millions | 2011 | 2010 | 2009 | |||||||||
Net loss | $ | (863 | ) | (874 | ) | (847 | ) | |||||
Adjustments to reconcile net loss to net cash used by operating activities | ||||||||||||
Equity in net loss of Avaya Inc. | 863 | 874 | 847 | |||||||||
Changes in operating assets and liabilities | — | — | — | |||||||||
|
|
|
|
|
| |||||||
Net cash used for operating activities: | — | — | — | |||||||||
Investing activities: | ||||||||||||
Investment in Avaya Inc. | — | (199 | ) | — | ||||||||
Financing activities: | ||||||||||||
Issuance of common stock | — | — | 1 | |||||||||
Withholding taxes—shared based compensation | — | — | (1 | ) | ||||||||
Issuance of preferred stock and warrants | — | 125 | — | |||||||||
Net proceeds from issuance of warrants | — | 74 | — | |||||||||
|
|
|
|
|
| |||||||
Net cash provided by financing activities | — | 199 | — | |||||||||
Net increase in cash and cash equivalents | — | — | — | |||||||||
Cash and cash equivalents at beginning of period | 15 | 15 | 15 | |||||||||
|
|
|
|
|
| |||||||
Cash and cash equivalents at end of period | $ | 15 | $ | 15 | $ | 15 | ||||||
|
|
|
|
|
| |||||||
23. Subsequent Events
The financial statements of Avaya Holdings Corp. are substantially comprised of the financial statements of Avaya Inc., which issued its annual financial statements on December 9, 2011. Accordingly, the Company has evaluated transactions for consideration as recognized subsequent events in the annual financial statements through the date of December 9, 2011. Additionally, the Company has evaluated transactions that occurred as of the issuance of these financial statements, December 22, 2011, for purposes of disclosure of unrecognized subsequent events.
F-72
Table of Contents
The Owners of
Enterprise and Government Solutions, Businesses of Nortel Networks Corporation:
We have audited the accompanying combined balance sheets of Enterprise and Government Solutions, Businesses of Nortel Networks Corporation (the Businesses) as of September 30, 2009 and December 31, 2008, and the related combined statements of operations, changes in invested equity and comprehensive loss and cash flows for the nine months ended September 30, 2009 and the year ended December 31, 2008. These combined financial statements are the responsibility of the Businesses management. Our responsibility is to express an opinion on these combined financial statements based on our audits.
We conducted our audits in accordance with auditing standards generally accepted in the United States of America. Those standards require that we plan and perform the audit to obtain reasonable assurance about whether the financial statements are free of material misstatement. An audit includes consideration of internal control over financial reporting as a basis for designing audit procedures that are appropriate in the circumstances, but not for the purpose of expressing an opinion on the effectiveness of the Businesses’ internal control over financial reporting. Accordingly, we express no such opinion. An audit also includes examining, on a test basis, evidence supporting the amounts and disclosures in the financial statements, assessing the accounting principles used and significant estimates made by management, as well as evaluating the overall financial statement presentation. We believe that our audits provide a reasonable basis for our opinion.
In our opinion, the combined financial statements referred to above present fairly, in all material respects, the financial position of the Businesses as of September 30, 2009 and December 31, 2008, and the results of their operations and their cash flows for the nine months ended September 30, 2009 and the year ended December 31, 2008 in conformity with U.S. generally accepted accounting principles.
The accompanying combined financial statements have been prepared assuming that the Businesses will continue as a going concern. As discussed in Note 2 to the combined financial statements, the Businesses’ owner, Nortel Networks Corporation, and certain of its Canadian subsidiaries filed for creditor protection pursuant to the provisions of the Companies’ Creditors Arrangement Act; certain of Nortel Networks Corporation’s United States subsidiaries filed voluntary petitions seeking to reorganize under Chapter 11 of the United States Bankruptcy Code; certain of Nortel Networks Corporation’s subsidiaries in Europe, the Middle East and Africa made consequential filings under the Insolvency Act 1986 in the United Kingdom; and Nortel Networks Corporation’s Israeli subsidiaries made consequential filings under the Israeli Companies Law 1999. These conditions raise substantial doubt about Nortel Networks Corporation’s and the Businesses’ ability to continue as a going concern. Management’s plans in regard to these matters are also described in Note 2 to the combined financial statements. The combined financial statements do not include any adjustments that might result from the outcome of this uncertainty.
As discussed in Note 4 to the combined financial statements, effective January 1, 2008, the Company changed its method of accounting for fair value measurements and the date at which it measures the funded status of its defined benefit pension plans and other postretirement plans.
/s/ KPMG LLP
Chartered Accountants, Licensed Public Accountants
Toronto, Canada
December 7, 2009
F-73
Table of Contents
ENTERPRISE AND GOVERNMENT SOLUTIONS, BUSINESSES OF NORTEL NETWORKS CORPORATION
(Under Creditor Protection Proceedings as of January 14, 2009—Note 2)
Combined Statements of Operations
(Millions of U.S. Dollars) | Nine months ended September 30, 2009 | Year Ended December 31, 2008 | ||||||
Revenues: | ||||||||
Products | $ | 1,010 | $ | 2,133 | ||||
Services | 436 | 654 | ||||||
|
|
|
| |||||
Total revenues | 1,446 | 2,787 | ||||||
|
|
|
| |||||
Cost of revenues: | ||||||||
Products | 679 | 1,215 | ||||||
Services | 293 | 417 | ||||||
|
|
|
| |||||
Total cost of revenues | 972 | 1,632 | ||||||
|
|
|
| |||||
Gross profit | 474 | 1,155 | ||||||
Operating expenses: | ||||||||
Selling, general and administrative expense (Note 6) | 670 | 1,187 | ||||||
Research and development expense | 298 | 481 | ||||||
Amortization of intangible assets | 20 | 26 | ||||||
Special charges (Note 8 and 9) | — | 114 | ||||||
Goodwill impairment (Note 7) | 49 | 808 | ||||||
Other operating expense (income)—net (Note 6) | 23 | (23 | ) | |||||
|
|
|
| |||||
Total operating expenses | 1,060 | 2,593 | ||||||
|
|
|
| |||||
Operating loss | (586 | ) | (1,438 | ) | ||||
Other income (expense)—net (Note 6) | (19 | ) | 19 | |||||
Interest income | — | 1 | ||||||
Interest expense | (2 | ) | (2 | ) | ||||
|
|
|
| |||||
Loss from operations before reorganization items and income taxes | (607 | ) | (1,420 | ) | ||||
Reorganization items (Note 5) | (147 | ) | — | |||||
Income tax recovery (expense) (Note 10) | 1 | (6 | ) | |||||
|
|
|
| |||||
Net loss from continuing operations | (753 | ) | (1,426 | ) | ||||
Net income (loss) from discontinued operations—net of tax (Note 16) | 15 | (3 | ) | |||||
|
|
|
| |||||
Net loss | $ | (738 | ) | $ | (1,429 | ) | ||
|
|
|
| |||||
The accompanying notes are an integral part of these combined financial statements
F-74
Table of Contents
ENTERPRISE AND GOVERNMENT SOLUTIONS, BUSINESSES OF NORTEL NETWORKS CORPORATION
(Under Creditor Protection Proceedings as of January 14, 2009—Note 2)
Combined Balance Sheets
(Millions of U.S. Dollars) | September 30, 2009 | December 31, 2008 | ||||||
| ASSETS | ||||||||
Current assets | ||||||||
Cash and cash equivalents | $ | 38 | $ | 44 | ||||
Restricted cash and cash equivalents | 2 | �� | — | |||||
Accounts receivable—net | 305 | 426 | ||||||
Inventories—net | 226 | 284 | ||||||
Deferred income taxes—net | 7 | 6 | ||||||
Other current assets (Note 6) | 63 | 54 | ||||||
Current assets related to discontinued operations (Note 16) | — | 8 | ||||||
|
|
|
| |||||
Total current assets | 641 | 822 | ||||||
Investments | — | 3 | ||||||
Plant and equipment—net | 68 | 97 | ||||||
Goodwill | 122 | 171 | ||||||
Intangible assets—net | 45 | 61 | ||||||
Other assets (Note 6) | 27 | 46 | ||||||
|
|
|
| |||||
Total assets | $ | 903 | $ | 1,200 | ||||
|
|
|
| |||||
| LIABILITIES AND INVESTED EQUITY | ||||||||
Current liabilities | ||||||||
Trade and other accounts payable | $ | 45 | $ | 136 | ||||
Payroll and benefit-related liabilities | 121 | 124 | ||||||
Contractual liabilities | 21 | 36 | ||||||
Restructuring liabilities | 11 | 23 | ||||||
Other accrued liabilities (Note 6) | 361 | 499 | ||||||
Long-term debt due within one year | 2 | 1 | ||||||
Current liabilities related to discontinued operations (Note 16) | — | 9 | ||||||
|
|
|
| |||||
Total current liabilities | 561 | 828 | ||||||
Long-term debt | 26 | 27 | ||||||
Deferred income taxes—net | 7 | 11 | ||||||
Other liabilities (Note 6) | 50 | 116 | ||||||
|
|
|
| |||||
Total long-term liabilities | 83 | 154 | ||||||
|
|
|
| |||||
Liabilities subject to compromise (Note 20) | 198 | — | ||||||
|
|
|
| |||||
Total liabilities | $ | 842 | $ | 982 | ||||
|
|
|
| |||||
Commitments, guarantees and contingencies (Note 19) | ||||||||
Subsequent events (Notes 2 and 21) | ||||||||
| INVESTED EQUITY | ||||||||
Net parent investment | 70 | 218 | ||||||
Accumulated other comprehensive income (loss) | (9 | ) | — | |||||
|
|
|
| |||||
Total invested equity | 61 | 218 | ||||||
|
|
|
| |||||
Total liabilities and invested equity | $ | 903 | $ | 1,200 | ||||
|
|
|
| |||||
The accompanying notes are an integral part of these combined financial statements
F-75
Table of Contents
ENTERPRISE AND GOVERNMENT SOLUTIONS, BUSINESSES OF NORTEL NETWORKS CORPORATION
(Under Creditor Protection Proceedings as of January 14, 2009—Note 2)
Combined Statements of Changes in Invested Equity and Comprehensive Loss
Nine months ended September 30, 2009 and the year ended December 31, 2008
(Millions of U.S. Dollars) | Net Parent Investment | Accumulated Other Comprehensive Income (Loss) | Total Invested Equity | Comprehensive Loss | ||||||||||||
Balance at December 31, 2007 | $ | 929 | $ | (8 | ) | $ | 921 | |||||||||
Net loss | $ | (1,429 | ) | $ | — | $ | (1,429 | ) | $ | (1,429 | ) | |||||
Foreign currency translation adjustment | 8 | 8 | 8 | |||||||||||||
|
| |||||||||||||||
Comprehensive loss: | $ | (1,421 | ) | |||||||||||||
|
| |||||||||||||||
Contributions attributed to: | ||||||||||||||||
Corporate and shared employee overhead costs funded by Nortel | 467 | — | 467 | |||||||||||||
Tax transfers to Nortel | 8 | — | 8 | |||||||||||||
Share-based compensation costs funded by Nortel | 35 | — | 35 | |||||||||||||
Non-cash restructuring charges | 53 | — | 53 | |||||||||||||
Pension costs funded by Nortel | 19 | — | 19 | |||||||||||||
Other transfers—net | 136 | — | 136 | |||||||||||||
|
|
|
|
|
| |||||||||||
Balance at December 31, 2008 | $ | 218 | $ | — | $ | 218 | ||||||||||
|
|
|
|
|
| |||||||||||
Net loss | $ | (738 | ) | $ | — | $ | (738 | ) | $ | (738 | ) | |||||
Foreign currency translation adjustment | (9 | ) | (9 | ) | (9 | ) | ||||||||||
|
| |||||||||||||||
Comprehensive loss: | $ | (747 | ) | |||||||||||||
|
| |||||||||||||||
Contributions attributed to: | ||||||||||||||||
Corporate and shared employee overhead costs funded by Nortel | 333 | — | 333 | |||||||||||||
Tax transfers to Nortel | 4 | — | 4 | |||||||||||||
Share-based compensation costs funded by Nortel | 30 | — | 30 | |||||||||||||
Non-cash restructuring charges | 83 | — | 83 | |||||||||||||
Pension costs funded by Nortel | 45 | — | 45 | |||||||||||||
Reorganization costs funded by Nortel | 40 | — | 40 | |||||||||||||
Other transfers—net | 55 | — | 55 | |||||||||||||
|
|
|
|
|
| |||||||||||
Balance at September 30, 2009 | $ | 70 | $ | (9 | ) | $ | 61 | |||||||||
|
|
|
|
|
| |||||||||||
The accompanying notes are an integral part of these combined financial statements
F-76
Table of Contents
ENTERPRISE AND GOVERNMENT SOLUTIONS, BUSINESSES OF NORTEL NETWORKS CORPORATION
(Under Creditor Protection Proceedings as of January 14, 2009—Note 2)
Combined Statements of Cash Flows
(Millions of U.S. Dollars) | Nine months ended September 30, 2009 | Year ended December 31, 2008 | ||||||
Cash flows from (used in) operating activities | ||||||||
Net loss | ||||||||
Adjustments to reconcile net loss to net cash used in operating activities: | $ | (738 | ) | $ | (1,429 | ) | ||
Amortization and depreciation | 39 | 59 | ||||||
Goodwill impairment | 49 | 808 | ||||||
Deferred income taxes | (5 | ) | (2 | ) | ||||
Corporate and shared employee overhead costs funded by Nortel | 333 | 467 | ||||||
Tax transfers to Nortel | 4 | 8 | ||||||
Share-based compensation costs funded by Nortel | 30 | 35 | ||||||
Non-cash restructuring charges | 83 | 53 | ||||||
Pension costs funded by Nortel | 45 | 19 | ||||||
Reorganization costs funded by Nortel | 40 | — | ||||||
Non-cash portion of special charges and related asset write downs | 3 | — | ||||||
Loss on sales and writedown of investments, businesses and assets, net | 2 | — | ||||||
Other non-cash—net | (4 | ) | 12 | |||||
Change in operating assets and liabilities (Note 6) | 63 | (137 | ) | |||||
|
|
|
| |||||
Net cash used in operating activities | (56 | ) | (107 | ) | ||||
|
|
|
| |||||
Cash flows from (used in) investing activities | ||||||||
Expenditures for plant and equipment | (3 | ) | (33 | ) | ||||
Change in restricted cash and cash equivalents | (2 | ) | — | |||||
Acquisitions of investments and businesses—net of cash acquired | — | (38 | ) | |||||
Proceeds from the sales of investments and businesses and assets—net | 1 | 10 | ||||||
|
|
|
| |||||
Net cash from (used in) investing activities | (4 | ) | (61 | ) | ||||
|
|
|
| |||||
Cash flows from (used in) financing activities | ||||||||
Other transfers—net | 55 | 136 | ||||||
Repayments of capital lease obligations | (1 | ) | (1 | ) | ||||
|
|
|
| |||||
Net cash from financing activities | 54 | 135 | ||||||
|
|
|
| |||||
Net increase (decrease) in cash and cash equivalents | (6 | ) | (33 | ) | ||||
Cash and cash equivalents at beginning of period | 44 | 77 | ||||||
|
|
|
| |||||
Cash and cash equivalents at end of period | $ | 38 | $ | 44 | ||||
|
|
|
| |||||
The accompanying notes are an integral part of these combined financial statements
F-77
Table of Contents
ENTERPRISE AND GOVERNMENT SOLUTIONS, BUSINESSES OF NORTEL NETWORKS CORPORATION
(Under Creditor Protection Proceedings as of January 14, 2009—Note 2)
Notes to Combined Financial Statements
(Millions of U.S. Dollars, unless otherwise stated)
1. Nature of operations and basis of presentation
Nortel Networks Corporation (“Nortel” or “NNC”) is a global supplier of end-to-end networking products and solutions serving both service providers and enterprise customers. Nortel’s technologies span access and core networks and support multimedia and business-critical applications. Nortel’s networking solutions consist of hardware, software and services. Nortel designs, develops, engineers, markets, sells, licenses, installs, services and supports these networking solutions worldwide. Nortel Networks Limited (“NNL”) is Nortel’s principal direct operating subsidiary and its results are consolidated into Nortel’s results.
The Enterprise Solutions business of Nortel (“Enterprise Solutions”) and Nortel Government Solutions Inc. (“NGS”) (collectively “Enterprise and Government Solutions” or the “Businesses”) are businesses of Nortel that operate in Nortel, or certain of its direct and indirect legal subsidiaries throughout the world. The Businesses provide communications services that address the headquarters, branch and home office needs of large and small businesses globally across a variety of industries, including healthcare and financial service providers, retailers, manufacturers, utilities, educational institutions and government agencies. The Businesses provide reliable, secure and scalable products spanning Unified Communications, Ethernet routing and multiservice switching, IP and digital telephony (including phones), wireless LANs, security, IP and SIP contact centers, self-service solutions, messaging, conferencing, SIP-based multimedia solutions and professional services to the U.S. Government. Nortel entered into creditor protection proceedings on January 14, 2009 and restructuring activities had an impact on the operations of the Businesses as discussed in Note 2.
Basis of presentation
The Financial Accounting Standards Board Accounting Standards Codification (“ASC”) 852, “Reorganizations,” which is applicable to companies that have filed petitions under applicable bankruptcy code provisions and as a result of the Creditor Protection Proceedings (as defined in Note 2) is applicable to Nortel, generally does not change the manner in which financial statements are prepared. However, it does require that Nortel’s financial statements for periods subsequent to the filing of an applicable bankruptcy petition distinguish transactions and events that are directly associated with a reorganization from the ongoing operations of the business. Although, as described below, the Businesses do not constitute a legal entity that has filed under bankruptcy laws, certain of the Enterprise Solutions assets, liabilities, revenues and expenses are included in legal entities that are subject to the Creditor Protection Proceedings. NGS has not filed and is not part of the Creditor Protection Proceedings. The Businesses’ revenues, expenses, realized gains and losses, and provisions for losses that can be directly associated with the Creditor Protection Proceedings must be reported separately as reorganization items in the statements of operations. The balance sheets must distinguish pre-petition liabilities subject to compromise from both those pre-petition liabilities that are not subject to compromise and from post-petition liabilities. Liabilities that may be affected by a plan of reorganization must be reported at the amounts expected to be allowed, even if they may be settled for lesser amounts. In addition, reorganization items must be disclosed separately in the statements of cash flows. The Businesses adopted the provisions of ASC 852 effective on January 14, 2009 and have segregated those items outlined above for all reporting periods subsequent to such date, consistent with Nortel’s presentation. ASC 852 requires that the financial statements of a legal entity that has filed for bankruptcy protection include Debtor financial statements as supplementary disclosure. These combined financial statements do not include such debtor financial statements as the Businesses do not constitute a legal entity that has filed under bankruptcy laws.
The accompanying combined financial statements have been prepared in accordance with accounting principles generally accepted in the U.S. (“U.S. GAAP”) from the consolidated financial statements and
F-78
Table of Contents
accounting records of Nortel using the historical results of operations and historical cost basis of the assets and liabilities of Nortel that comprise the Businesses. These combined financial statements have been prepared on a combined basis as the Businesses represent a portion of Nortel’s business and do not constitute a separate legal entity. The historical results of operations, financial position, and cash flows of the Businesses may not be indicative of what they would actually have been had the Businesses been a separate stand-alone entity, nor are they indicative of what the Businesses’ results of operations, financial position and cash flows may be in the future. The combined financial statements have been prepared solely for purposes of Nortel’s proposed sale of the Businesses to demonstrate the historical results of operations, financial position, and cash flows of the Businesses for the indicated periods under Nortel’s management and, accordingly, do not reflect the presentation and classification of the Businesses’ operations in the same manner as Nortel.
The accompanying combined financial statements only include assets and liabilities that are specifically identifiable with the Businesses. Costs directly related to the Businesses have been entirely attributed to the Businesses in the accompanying combined financial statements. The Businesses also receive services and support functions from Nortel. The Businesses’ operations are dependent upon Nortel’s ability to perform these services and support functions. The costs associated with these services and support functions have been allocated to the Businesses using methodologies primarily based on proportionate revenues or proportionate headcount of the Businesses compared to Nortel, which is considered to be most meaningful in the circumstances. These allocated costs are primarily related to corporate administrative expenses and reorganization costs, employee related costs including pensions and other benefits, for corporate and shared employees, and rental and usage fees for shared assets for the following functional groups: information technology, legal services, accounting and finance services, human resources, marketing and product support, product development, customer support, treasury, facility and other corporate and infrastructural services. These allocated costs are recorded primarily in cost of revenues, research and development (“R&D”), and selling, general and administrative (“SG&A”) expenses in the combined statements of operations. Income taxes have been accounted for in these combined financial statements as described in Notes 3(f) and 10.
For each of Nortel’s businesses, except for NGS which historically was managed as a separate business, Nortel used a centralized approach to cash management and financing of its operations. Central treasury activities include the investment of surplus cash, the issuance, repayment and repurchase of short-term and long-term debt and interest rate management. The financial systems of the Businesses were not designed to track certain balances and transactions at a business unit level. Accordingly, none of the cash or cash equivalents, debt or capital leases, including interest thereon, and hedging positions through which derivatives and other financial contracts are used at the Nortel corporate level have been reflected in these combined financial statements with the exception of cash, investment and debt balances that are specifically attributable to NGS. All Nortel funding to the Businesses since inception has been accounted for as a capital contribution from Nortel and all cash remittances from the Businesses to Nortel have been accounted for as distributions to Nortel, including allocation of expenses and settlement of transactions with Nortel. In addition, the net parent investment represents Nortel’s interest in the recorded net assets of the Businesses and represents the cumulative net investment by Nortel in the Businesses through the dates presented and includes cumulative operating results, including other comprehensive loss.
Management believes the assumptions and allocations underlying the combined financial statements are reasonable and appropriate under the circumstances. The expenses and cost allocations have been determined on a basis considered by Nortel and the Businesses to be a reasonable reflection of the utilization of services provided to or the benefit received by the Businesses during the periods presented. However, these assumptions and allocations are not necessarily indicative of the costs the Businesses would have incurred if it had operated on a standalone basis or as an entity independent of Nortel.
Going concern issues
The commencement of the Creditor Protection Proceedings raises substantial doubt as to whether Nortel, and therefore the Businesses, will be able to continue as a going concern. While the Debtors (as defined in Note 2) have filed for and been granted creditor protection, the combined financial statements continue to be
F-79
Table of Contents
prepared using the going concern basis, which assumes that the Businesses will be able to realize their respective assets and discharge their respective liabilities in the normal course of business for the foreseeable future. During the Creditor Protection Proceedings, and until the completion of any proposed divestitures or a decision to cease operations in certain countries is made, the Businesses continue to operate under the jurisdictions and orders of the applicable courts and in accordance with applicable legislation. The Businesses have continued to operate by renewing and seeking to grow business with existing customers, competing for new customers, continuing significant R&D investments, and ensuring the ongoing supply of goods and services through the supply chain in an effort to maintain or improve customer service and loyalty levels. The Businesses have also continued their focus on cost containment and cost reduction initiatives during this time. However, it is not possible to predict the outcome of the Creditor Protection Proceedings and, as such, the realization of assets and discharge of liabilities are each subject to significant uncertainty. If the going concern basis is not appropriate, adjustments will be necessary to the carrying amounts and/or classification of the Businesses’ assets and liabilities. Further, a court approved plan in connection with the Creditor Protection Proceedings could materially change the carrying amounts and classifications reported in the combined financial statements.
The combined financial statements do not purport to reflect or provide for the consequences of the Creditor Protection Proceedings. In particular, such combined financial statements do not purport to show: (a) as to assets, their realizable value on a liquidation basis or their availability to satisfy liabilities; (b) as to pre-petition liabilities, all amounts that may be allowed for claims or contingencies, or the status and priority thereof, or the amounts at which they may ultimately be settled; (c) as to shareholders’ accounts, the effect of any changes that may be made in Nortel’s capitalization; or (d) as to operations, the effect of any changes that may be made in the Businesses.
2. Creditor protection proceedings
On January 14, 2009, after extensive consideration of all other alternatives, with the unanimous decision of the Board of Directors after thorough consultation with advisors, Nortel initiated creditor protection proceedings under the respective restructuring regimes of Canada, the U.S. and the United Kingdom (U.K.). Nortel’s affiliates based in Asia, including LG-Nortel Co. Ltd. (“LGN”), in the CALA region and the NGS business are not currently included in these proceedings. At this point in the Creditor Protection Proceedings, Nortel is focused on maximizing value for its stakeholders. On June 19, 2009 Nortel announced that it was advancing in discussions with external parties to sell its businesses.
On June 19, 2009, Nortel also announced a stalking horse asset sale agreement with Nokia Siemens Networks B.V. for the planned sale of substantially all of its Code Division Multiple Access (“CDMA”) business and Long Term Evolution (“LTE”) Access assets for a purchase price of $650, subject to purchase price adjustments under certain circumstances. On July 24, 2009, in accordance with court approved procedures, Nortel concluded a successful auction for these assets and executed a formal asset sale agreement for the sale of these assets with Telefonaktiebolaget LM Ericsson (“Ericsson”), who emerged as the successful agreeing to pay $1,130, subject to price adjustments under certain circumstances. At a joint hearing on July 28, 2009, Nortel obtained approval from the United States Bankruptcy Court for the District of Delaware (“U.S. Court”) and the Ontario Superior Court of Justice (“Canadian Court”) for the sale to Ericsson. On November 13, 2009, Nortel announced that following satisfaction of all closing conditions, the sale was concluded.
On July 20, 2009 Nortel announced a stalking horse and other sale agreements with Avaya Inc. (“Avaya”) for the planned sale of substantially all of the assets of the Enterprise Solutions business globally, as well as the shares of NGS and DiamondWare, Ltd for a purchase price of $475, subject to purchase price adjustments under certain circumstances. On September 14, 2009, in accordance with court approved procedures, Nortel concluded a successful auction for the sale of these assets to Avaya, who emerged as the successful bidder agreeing to pay $900 in cash to Nortel, with an additional pool of $15 reserved for an employee retention program, subject to purchase price adjustments under certain circumstances. At a joint hearing on September 16, 2009, Nortel obtained U.S. Court and Canadian Court approval of the sale to Avaya. The sale is also subject to court approvals
F-80
Table of Contents
in France and Israel, information and consultation with employee representatives and/or employees in certain EMEA jurisdictions, as well as regulatory approvals and other customary closing conditions. See “Enterprise Solutions Business Divestiture” in this Note 2 for further details.
On September 21, 2009 Nortel announced it plans to sell, by “open auction”, the assets of its Wireless Networks business associated with the development of Next Generation Packet Core network components. On October 25, 2009, in accordance with court approved procedures, certain of Nortel’s subsidiaries entered into an agreement with Hitachi, Ltd. (“Hitachi”) for the sale of these assets for a purchase price of $10 subject to purchase price adjustments under certain circumstances. On October 28, 2009, Nortel obtained U.S. Court and Canadian Court approval of the sale to Hitachi. The sale is also subject to regulatory approvals and other customary closing conditions.
On September 30, 2009 Nortel announced that it planned to sell by “open auction” substantially all of its Global System for Mobile communications (“GSM”)/ GSM for Railways (“GSM-R”) business. On November 24, 2009, in accordance with court approved procedures, Nortel concluded a successful auction for the sale of theses assets to Ericsson and Kapsch CarrierCom AG (“Kapsch”) who emerged as the winning joint bidders with a purchase price of $103 in cash, subject to purchase price adjustments under certain circumstances. At a joint hearing on December 2, 2009, Nortel obtained U.S. Court and Canadian Court approval of the sale to Ericsson and Kapsch. The sale is also subject to court approval in France, information and consultation with employee representatives and/or employees in certain EMEA jurisdictions, as well as regulatory approvals and other customary closing conditions.
On October 7, 2009, Nortel announced a “stalking horse” and other sale agreements with Ciena Corp. (“Ciena”) for the planned sale of substantially all of the assets of its Optical Networking and Carrier Ethernet businesses globally for a purchase price of $390 in cash and 10 million shares of Ciena common stock, subject to purchase price adjustments under certain circumstances. On November 22, 2009, in accordance with court approved procedures Nortel concluded a successful auction for the sale of these assets to Ciena, who emerged as the successful bidder agreeing to pay $530 in cash, plus $239 principal amount of convertible notes due June 2017, subject to purchase price adjustments under certain circumstances. At a joint hearing on December 2, 2009, Nortel obtained U.S. Court and Canadian Court approval of the sale to Ciena. The sale is also subject to court approvals in the France and Israel, information and consultation with employee representatives and/or employees in certain EMEA jurisdictions, as well as regulatory approvals and other customary closing conditions.
Nortel continues to advance in its discussions with external parties to sell its other businesses. To provide maximum flexibility Nortel has also taken appropriate steps to complete the move to organizational standalone businesses. Nortel will assess other restructuring alternatives for these businesses in the event it is unable to maximize value through sales.
On August 10, 2009, Nortel announced that it was at a natural transition point resulting in a number of leadership changes and a new organizational structure designed to work towards the completion of the sales of its businesses and other restructuring activities. Effective August 10, 2009, President and Chief Executive Officer Mike Zafirovski stepped down. Also effective August 10, 2009, the Boards of Directors of Nortel and NNL were reduced from nine to three members: John A. MacNaughton, Jalynn H. Bennett and David I. Richardson, with Mr. Richardson serving as Chair. These individuals also serve as members of Nortel’s and NNL’s audit committees.
In connection with these changes Nortel obtained Canadian Court approval for the Canadian Monitor to take on an enhanced role with respect to the oversight of its business, sales processes, claims processes and other restructuring activities under the CCAA Proceedings (as defined below). Further, Nortel is in the process of confirming the appointment of a principal officer for the U.S. Debtors who will work in conjunction with the U.S. Creditors’ Committee (as defined below), Bondholder Group (as defined below), and the Canadian Monitor, which appointment will be subject to the approval of the U.S. Court.
F-81
Table of Contents
Nortel has also established a streamlined structure that is enabling it to effectively continue to serve its customers, and also facilitate the sales of its businesses and integration processes with acquiring companies as well as continue with its restructuring activities. Nortel’s business units currently report to the Chief Restructuring Officer, Pavi Binning. The mergers and acquisitions teams continue their work under the Chief Strategy Officer, George Riedel. Nortel Business Services continues to be led by Joe Flanagan and continues to serve the transitional operations needs of Nortel’s businesses as they are sold to ensure customer and network service levels are maintained throughout the sale and integration processes. A core Corporate Group has been established that is primarily responsible for the management of ongoing restructuring activities during the sales process as well as post business dispositions. This group is lead by John Doolittle, Senior Vice President Finance and Corporate Services (formerly Nortel’s Treasurer). These leaders report to the Nortel and NNL Boards of Directors and the Canadian Monitor (as defined below) and will also report to the proposed U.S. principal officer.
CCAA Proceedings
On January 14, 2009 (“Petition Date”), Nortel, NNL and certain other Canadian subsidiaries (“Canadian Debtors”) obtained an initial order from the Canadian Court for creditor protection for 30 days, pursuant to the provisions of the Companies’ Creditors Arrangement Act (“CCAA”), which has since been extended to December 18, 2009 and is subject to further extension by the Canadian Court (“CCAA Proceedings”). There is no guarantee that the Canadian Debtors will be able to obtain court orders or approvals with respect to motions the Canadian Debtors may file from time to time to extend further the applicable stays of actions and proceedings against them. Pursuant to the initial order, the Canadian Debtors received approval to continue to undertake various actions in the normal course in order to maintain stable and continuing operations during the CCAA Proceedings.
Under the terms of the initial order, Ernst & Young Inc. was named as the court-appointed monitor under the CCAA Proceedings (“Canadian Monitor”). The Canadian Monitor has reported and will continue to report to the Canadian Court from time to time on the Canadian Debtors’ financial and operational position and any other matters that may be relevant to the CCAA Proceedings. In addition, the Canadian Monitor may advise and, to the extent required, assist the Canadian Debtors on matters relating to the Creditor Protection Proceedings. On August 14, 2009, the Canadian Court approved an order that permits the Canadian Monitor to take on an enhanced role with respect to the oversight of the business, sales processes, claims processes and other restructuring activities under the CCAA Proceedings.
As a consequence of the CCAA Proceedings, generally, all actions to enforce or otherwise effect payment or repayment of liabilities of any Canadian Debtor preceding the Petition Date and substantially all pending claims and litigation against the Canadian Debtors and their officers and directors have been stayed until December 18, 2009, or such further date as may be ordered by the Canadian Court. In addition, the CCAA Proceedings have been recognized by the U.S. Court as “foreign proceedings” pursuant to the provisions of Chapter 15 of the U.S. Bankruptcy Code, giving effect in the U.S. to the stay granted by the Canadian Court. A cross-border court-to-court protocol (as amended) has also been approved by the U.S. Court and the Canadian Court. This protocol provides the U.S. Court and the Canadian Court with a framework for the coordination of the administration of the Chapter 11 Proceedings (as defined below) and the CCAA Proceedings on matters of concern to both courts.
Chapter 11 Proceedings
Also on the Petition Date, Nortel Networks Inc. (“NNI”), Nortel Networks Capital Corporation and certain other of Nortel’s U.S. subsidiaries (“U.S. Debtors”), other than Nortel Networks (CALA) Inc. (“NNCI”), filed voluntary petitions under Chapter 11 with the U.S. Court (“Chapter 11 Proceedings”). The U.S. Debtors received approval from the U.S. Court for a number of motions enabling them to continue to operate their businesses generally in the ordinary course. Among other things, the U.S. Debtors received approval to continue paying
F-82
Table of Contents
employee wages and certain benefits in the ordinary course; to generally continue their cash management system, including approval of a revolving loan agreement between NNI as lender and NNL as borrower with an initial advance to NNL of $75, to support NNL’s ongoing working capital and general corporate funding requirements; and to continue honoring customer obligations and paying suppliers for goods and services received on or after the Petition Date. On July 14, 2009, NNCI, a U.S. based subsidiary that operates in the CALA region, also filed a voluntary petition for relief under Chapter 11 in the U.S. Court and thereby became one of the U.S. Debtors subject to the Chapter 11 Proceedings. On July 17, 2009, the U.S. Court entered an order of joint administration that provided for the joint administration of NNCI’s case with the pre-existing cases of the other U.S. Debtors.
As required under the U.S. Bankruptcy Code, on January 22, 2009, the United States Trustee for the District of Delaware appointed an official committee of unsecured creditors, which currently includes The Bank of New York Mellon, Flextronics Corporation, Airvana, Inc., Pension Benefit Guaranty Corporation and Law Debenture Trust Company of New York (“U.S. Creditors’ Committee”). The U.S. Creditors’ Committee has the right to be heard on all matters that come before the U.S. Court with respect to the U.S. Debtors. There can be no assurance that the U.S. Creditors’ Committee will support the U.S. Debtors’ positions on matters to be presented to the U.S. Court. In addition, a group purporting to hold substantial amounts of Nortel’s publicly traded debt has organized (“Bondholder Group”). Nortel’s management and the Canadian Monitor have met with the Bondholder Group and its advisors to provide status updates and share information with them that has been shared with other major stakeholders. Disagreements between the Debtors and the U.S. Creditors’ Committee and the Bondholder Group could protract and negatively impact the Creditor Protection Proceedings (as defined below), and the Debtors’ ability to operate.
As a consequence of the commencement of the Chapter 11 Proceedings, generally, all actions to enforce or otherwise effect payment or repayment of liabilities of any U.S. Debtor preceding the Petition Date and substantially all pending claims and litigation against the U.S. Debtors have been automatically stayed for the pendency of the Chapter 11 Proceedings (absent any court order lifting the stay). In addition, the U.S. Debtors applied for and obtained an order in the Canadian Court recognizing the Chapter 11 Proceedings in the U.S. as “foreign proceedings” in Canada and giving effect, in Canada, to the automatic stay under the U.S. Bankruptcy Code.
Administration Proceedings
Also on the Petition Date, certain of Nortel’s EMEA subsidiaries (“EMEA Debtors”) made consequential filings and each obtained an administration order from the High Court of England and Wales (“English Court”) under the Insolvency Act 1986 (“U.K. Administration Proceedings”). The filings were made by the EMEA Debtors under the provisions of the European Union’s Council Regulation (EC) No 1346/2000 on Insolvency Proceedings (“EC Regulation”) and on the basis that each EMEA Debtor’s center of main interests was in England. Under the terms of the orders, a representative of Ernst & Young LLP (in the U.K.) and a representative of Ernst & Young Chartered Accountants (in Ireland) were appointed as joint administrators with respect to the EMEA Debtor in Ireland, and representatives of Ernst & Young LLP were appointed as joint administrators for the other EMEA Debtors (collectively, “U.K. Administrators”) to manage each of the EMEA Debtors’ affairs, business and property under the jurisdiction of the English Court and in accordance with the applicable provisions of the Insolvency Act 1986. The Insolvency Act 1986 provides for a moratorium during which creditors may not, without leave of the English Court or consent of the U.K. Administrators, wind up the company, enforce security, or commence or progress legal proceedings. All of Nortel’s operating EMEA subsidiaries except those in the following countries are included in the U.K. Administration Proceedings: Nigeria, Russia, Ukraine, Israel, Norway, Switzerland, South Africa and Turkey. Certain of Nortel’s Israeli subsidiaries (“Israeli Debtors”) have commenced separate creditor protection proceedings in Israel (“Israeli Administration Proceedings”). On January 19, 2009, an Israeli court (“Israeli Court”) appointed administrators over the Israeli Debtors (“Israeli Administrators”). The orders of the Israeli Court provide for a stay in respect of the Israeli Debtors whose creditors are prevented from taking steps against the companies or their assets and which, subject to further orders of the Israeli Court, remains in effect during the Israeli Administration
F-83
Table of Contents
Proceedings. The period for the Israeli Administration Proceedings recently expired on November 24, 2009; however, a request to extend the Israeli Administration Proceedings is pending. Under Israeli law, the Israeli Administration Proceedings are required to end with either a scheme of arrangement, which returns Networks Israel (Sales and Marketing) Limited to solvency, or a liquidation. On November 24, 2009, the Israeli Court approved a scheme of arrangement which returned the company to solvency. A proposed scheme of arrangement for Nortel Communications Holdings (1997) Limited has been submitted to the Israeli Court, and remains subject to the approval of the Israeli Court.
The U.K. Administration Proceedings in relation to NNUK have been recognized by the U.S. Court as “foreign main proceedings” pursuant to the provisions of Chapter 15 of the U.S. Bankruptcy Code, giving effect in the U.S. to the moratorium provided by the Insolvency Act 1986.
On May 28, 2009, at the request of the U.K. Administrators of NNSA, the Commercial Court of Versailles, France (“French Court”) ordered the commencement of secondary proceedings in respect of NNSA (“French Secondary Proceedings”). The secondary proceedings consist of liquidation proceedings during which NNSA continued to operate as a going concern for an initial period of three months. On August 20, 2009, the French Court extended the secondary proceedings until November 28, 2009. In accordance with the EC Regulation, the U.K. Administration Proceedings remain the main proceedings in respect of NNSA although a French administrator (“French Administrator”) and a French liquidator (“French Liquidator”) have been appointed and are in charge of the day-to-day affairs and continuing business of NNSA in France. On October 1, 2009, pursuant to a motion filed by the U.K. Administrators, the French Court approved an order to: (i) suspend the liquidation operations relating to the sale of the assets and/or businesses of NNSA for a renewable period of two months; (ii) authorize the continuation of the business of NNSA so long as the liquidation operations are suspended; and (iii) maintain the powers of the French Administrator and French Liquidator during the suspension period, except with respect to the sale of assets and/or businesses of NNSA.
The Canadian Debtors, U.S. Debtors, EMEA Debtors and Israeli Debtors are together referred to as the Debtors; the CCAA Proceedings, the Chapter 11 Proceedings, the U.K. Administration Proceeding, the Israeli Administration Proceedings and the French Secondary Proceedings are together referred to as the Creditor Protection Proceedings.
Enterprise and Government Solutions Business Divestiture
On July 20, 2009, Nortel announced that it, NNL, and certain of Nortel’s other subsidiaries including NNI and NNUK, had entered into a “stalking horse” asset and share sale agreement with Avaya for its North American, CALA, and Asian ES business, and an asset sale agreement with Avaya for the EMEA portion of its ES business for a purchase price of $475 subject to purchase price adjustments under certain circumstances. These agreements include the planned sale of substantially all of the assets of the ES business globally as well as the shares of NGS and DiamondWare, Ltd. This sale required a court-approved “stalking-horse” sale process under Chapter 11 that allowed other qualified bidders to submit higher or otherwise better offers. Bidding procedures were approved by the U.S. Court and Canadian Court on August 4, 2009. Competing bids were required to be submitted by September 4, 2009 and an auction with the qualified bidders commenced on September 11, 2009. On September 14, 2009, Avaya emerged as the successful bidder for the sale of substantially all of the assets of the ES business globally as well as the shares of NGS and DiamondWare, Ltd. for a purchase price of $900 in cash to Nortel, with an additional pool of $15 reserved for an employee retention program, subject to purchase price adjustments under certain circumstances. Nortel obtained U.S. Court and Canadian Court approvals for the sale to Avaya on September 16, 2009.
Except in relation to NNSA, the U.K. Administrators have the authority, without further court approval, to enter into the EMEA asset sale agreement on behalf of each of the EMEA Debtors. In some EMEA jurisdictions, this transaction is subject to compliance with information and consultation obligations with employee representatives prior to finalization of the terms of the sale.
F-84
Table of Contents
In addition to the processes and approvals outlined above, consummation of the transaction is subject to the satisfaction of regulatory and other conditions and the receipt of various approvals, including governmental approvals in Canada and the United States and the approval of the courts in France and Israel. The sale is expected to close late in the fourth quarter of fiscal 2009, subject to receipt of all required approvals.
Business Operations
During the Creditor Protection Proceedings, and until the completion of any proposed divestitures or a decision to cease operations in certain countries is made, the businesses of the Debtors continue to operate under the jurisdictions and orders of the applicable courts and in accordance with applicable legislation. Nortel has continued to engage with its existing customer base in an effort to maintain delivery of products and services, minimize interruptions as a result of the Creditor Protection Proceedings and Nortel’s divestiture efforts and resolve any interruptions in a timely manner. At the beginning of the proceedings, Nortel established a senior procurement team, along with appropriate advisors, to address supplier issues and concerns as they arose to ensure ongoing supply of goods and services and minimize any disruption in its global supply chain. This procedure continues to function effectively and any supply chain issues are being dealt with on a timely basis.
Contracts
Under the U.S. Bankruptcy Code, the U.S. Debtors may assume, assume and assign, or reject certain executory contracts including unexpired leases, subject to the approval of the U.S. Court and certain other conditions. Pursuant to the initial order of the Canadian Court, the Canadian Debtors are permitted to repudiate any arrangement or agreement, including real property leases. Any reference to any such agreements or instruments and to termination rights or a quantification of Nortel’s obligations under any such agreements or instruments is qualified by any overriding rejection, repudiation or other rights the Debtors may have as a result of or in connection with the Creditor Protection Proceedings. The administration orders granted by the English Court do not give any similar unilateral rights to the U.K. Administrators. The U.K. Administrators and in the case of NNSA, the French Administrator and the French Liquidator, decide in each case whether an EMEA Debtor should continue to perform under an existing contract on the basis of whether it is in the interests of that administration to do so. Claims may arise as a result of a Debtor rejecting, repudiating or no longer continuing to perform under any contract or arrangement, which claims would usually be unsecured. Since the Petition Date, the Debtors have assumed and rejected or repudiated various contracts, including real property leases and commercial agreements. The Debtors will continue to review other contracts throughout the Creditor Protection Proceedings.
Creditor Protection Proceeding Claims
On August 4, 2009, the U.S. Court approved the establishment of a claims process in the U.S. for claims that arose prior to the Petition Date. Under this claims process, proof of claims, except in relation to NNCI, had to be received by the U.S. Claims Agent, Epiq Bankruptcy Solutions, LLC (“Epiq”), by no later than 4:00 p.m. (Eastern Time) on September 30, 2009 (subject to certain exceptions as provided in the order establishing the claims bar date). For claims in relation to NNCI, on December 2, 2009, the U.S. Court approved the establishment of 4:00 p.m. (Eastern Time) on January 25, 2010 as the deadline for receipt by Epiq of proof of claims against NNCI (subject to certain exceptions as provided in the order establishing the claims bar date).
On July 30, 2009, Nortel announced that the Canadian Court approved the establishment of a claims process in Canada in connection with the CCAA Proceedings. Under this claims process, subject to certain exceptions, proof of claims for claims arising prior to the Petition Date, had to be received by the Canadian Monitor, by no later than September 30, 2009. This claims notification deadline does not apply to certain claims, including most inter-company claims as between the Canadian Debtors themselves or as between any of the Canadian Debtors and their direct or indirect subsidiaries and affiliates (other than joint ventures), compensation claims by current or former employees or directors of any of the Canadian Debtors, and claims of current or former directors or
F-85
Table of Contents
officers for indemnification and/or contribution, for which claims notification deadlines have yet to be set by the Canadian Court. Proof of claims for claims arising on or after the Petition Date as a result of the restructuring, termination, repudiation or disclaimer of any lease, contract or other agreement or obligation must be received by the Canadian Monitor by the later of September 30, 2009 and 30 days after a proof of claims package has been sent by the Canadian Monitor to the person in respect of such claim.
In relation to NNSA, claims had to be submitted to the French Administrator and the French Liquidator no later than August 12, 2009 with respect to French creditors and October 12, 2009 with respect to foreign creditors.
In relation to the Israeli Debtors, the Israeli Court determined that claims had to be submitted to the Israeli Administrators by no later than July 26, 2009. Other than as set forth above with respect to NNSA, no outside date for the submission of claims has been established in connection with U.K. Administration Proceedings.
The combined financial statements for the nine months ended September 30, 2009 do not include the effects of any current or future claims relating to the Creditor Protection Proceedings. Certain claims filed may have priority over those of the Debtors’ unsecured creditors. Currently, it is not possible to determine the extent of claims filed and to be filed, whether such claims will be disputed and whether they will be subject to discharge or disallowance in the Creditor Protection Proceedings. It is also not possible at this time to determine whether to establish any additional liabilities in respect of claims. The Debtors are reviewing all claims filed and are beginning the claims reconciliation process. Differences between claim amounts identified by the Debtors and claims filed by creditors will be investigated and resolved in connection with the claims reconciliation process or, if necessary, the relevant court will make the final determination as to the amount, nature and validity of claims. The aggregate amount of claims will likely exceed the amount that ultimately will be allowed by the relevant courts. Certain claims may be duplicative (particularly given the multiple jurisdictions involved in the Creditor Protection Proceedings), based on contingencies that have not occurred, or may be otherwise overstated, and would therefore be invalid. The determination of how liabilities will ultimately be settled and treated cannot be made until each of the relevant courts approve a plan and in light of the number of creditors of the Debtors, the claims resolution process may take considerable time to complete.
Interim Funding and Settlement Agreement
Historically, Nortel has deployed its cash through a variety of intercompany borrowing and transfer pricing arrangements to allow it to operate on a global basis and to allocate profits and losses, and certain costs, among the corporate group. In particular, the Canadian Debtors have continued to allocate profits and losses, and certain costs, among the corporate group through transfer pricing agreement payments (“TPA Payments”). Other than one $30 payment made by NNI to NNL in respect of amounts that Nortel believes are owed in connection with the transfer pricing agreement, TPA Payments had been suspended since the Petition Date. However, the Canadian Debtors and the U.S. Debtors, with the support of the U.S. Creditors’ Committee and the Bondholder Group, as well as the EMEA Debtors (other than NNSA) entered into an Interim Funding and Settlement Agreement (“IFSA”) dated June 9, 2009 under which NNI paid $157 to NNL, in four installments during the period ended September 30, 2009 in full and final settlement of TPA Payments for the period from the Petition Date to September 30, 2009. A portion of this funding may be repayable by NNL to NNI in certain circumstances. The IFSA was approved by the U.S. Court and Canadian Court on June 29, 2009 and on June 23, 2009, the English Court confirmed that the U.K. Administrators were at liberty to enter into the IFSA on behalf of each of the EMEA Debtors (except for NNSA which was authorized to enter into the IFSA by the French Court on July 7, 2009). NNSA acceded to the IFSA on September 11, 2009. Further arrangements will be necessary in order to address TPA Payments, or other funding issues, for periods post-September 30, 2009 and NNL’s future liquidity needs and there can be no assurance that the Canadian Debtors will be able to arrange additional funding sufficient to fund future operations. Negotiations between NNL and the U.S. Debtors for reimbursement of a portion of these costs for the fourth quarter of 2009 are on-going. In addition, the Debtors and other Nortel entities are engaged in discussions in order to address NNL’s liquidity needs for periods subsequent to December 31, 2009.
F-86
Table of Contents
APAC Debt Restructuring Agreement
As a consequence of the Creditor Protection Proceedings, certain amounts of intercompany payables to certain Nortel subsidiaries (“APAC Agreement Subsidiaries”) in the Asia-Pacific (“APAC”) region as of the Petition Date became impaired. To enable the APAC Agreement Subsidiaries to continue their respective business operations and to facilitate any potential divestitures, the Debtors (other than NNSA) entered into an Asia Restructuring Agreement (“APAC Agreement”). Under the APAC Agreement, the APAC Agreement Subsidiaries will pay a portion of certain of the APAC Agreement Subsidiaries’ net intercompany debt outstanding as of the Petition Date (“Pre-Petition Intercompany Debt”) and the Canadian Debtors, the U.S. Debtors and the EMEA Debtors (including NNSA to the extent it elects to participate in the APAC Agreement) will initially receive approximately $15, $18, and $15, respectively, in aggregate. A further portion of the Pre-Petition Intercompany Debt will be repayable in monthly amounts but only to the extent of such APAC Agreement Subsidiary’s net cash balance, and subject to certain reserves and provisions. The remainder of each APAC Agreement Subsidiary’s Pre-Petition Intercompany Debt will be subordinated and postponed to the prior payment in full of such APAC Agreement Subsidiary’s liabilities and obligations. Implementation of the APAC Agreement is subject to receipt of approvals (court and/or administrator) in the U.S., Canada and EMEA, as well as receipt of certain regulatory approvals in certain APAC jurisdictions.
Flextronics
On January 14, 2009, Nortel announced that NNL had entered into an amendment to arrangements (“Amending Agreement”) with a major supplier, Flextronics Telecom Systems, Ltd. (“Flextronics”). Under the terms of the amendment, NNL agreed to commitments to purchase $120 of existing inventory by July 1, 2009 and to make quarterly purchases of other inventory, and to terms relating to payment and pricing. Approximately $28 of this total commitment is related to the Businesses and is subject to finalization. Flextronics had notified Nortel of its intention to terminate certain other arrangements upon 180 days’ notice (in July 2009) pursuant to the exercise by Flextronics of its contractual termination rights, while the other arrangements between the parties will continue in accordance with their terms. Following subsequent negotiations, Nortel has resolved all ongoing disputes and issues relating to the interpretation of the Amending Agreement and has confirmed, among other things, its obligation to purchase inventory in accordance with existing plans of record of $25. In addition, one of the supplier agreements with Flextronics was not terminated on July 12, 2009, as originally referenced in the Amending Agreement, but instead has been extended to December 12, 2009, with a further extension for certain products to July 2010. Flextronics is a significant supplier to the Businesses and is also a supplier to several of Nortel’s other businesses.
Nortel and Flextronics have entered into an agreement dated November 20, 2009, which was approved by the courts on December 2, 2009, that, among other things, provides a mechanism for the transfer of the Nortel supply relationship to interested parties, being the purchasers of Nortel’s other businesses or assets, on terms and conditions described in the agreement. In addition, this latest agreement serves to resolve certain receivable amounts from and payable amounts due to Flextronics. A portion of these receivable and payable amounts are related to the Businesses, the accounting for which will be addressed in the period subsequent to the balance sheet.
Workforce Reductions; Employee Compensation Program Changes
On February 25, 2009, Nortel announced a workforce reduction plan. Under this plan, Nortel intends to reduce its global workforce by approximately 5,000 net positions. Nortel has commenced and will continue to implement these reductions, in accordance with local country legal requirements, including those that impact the Business. During the nine months ended September 30, 2009, Nortel, including the Businesses, undertook additional workforce reduction activities. Given the Creditor Protection Proceedings, Nortel, and therefore the Businesses, has discontinued all remaining activities under its previously announced restructuring plans as of the Petition Date. For further information, refer to Notes 8 and 9. In addition, Nortel has taken and expects to take further, ongoing workforce and other cost reduction actions as it works through the Creditor Protection Proceedings.
F-87
Table of Contents
Nortel also announced on February 25, 2009 several changes to its employee compensation programs. Upon the recommendation of management, its Board of Directors approved no payment of bonuses under the Nortel Networks Limited Annual Incentive Plan (AIP) for 2008. Nortel has continued its AIP in 2009 for all eligible full- and part-time employees. The AIP has been modified to permit quarterly rather than annual award determinations and payouts, if any. This has provided a more immediate incentive for employees upon the achievement of critical shorter-term objectives. Where required, Nortel has obtained court approvals for retention and incentive compensation plans for certain key eligible employees deemed essential to the business during the Creditor Protection Proceedings and Nortel has since implemented such plans.
On February 27, 2009, Nortel obtained Canadian Court approval to terminate its equity-based compensation plans (the Nortel 2005 Stock Incentive Plan, As Amended and Restated (“2005 SIP”), the Nortel Networks Corporation 1986 Stock Option Plan, As Amended and Restated (“1986 Plan”) and the Nortel Networks Corporation 2000 Stock Option Plan (“2000 Plan”)) and certain equity plans assumed in prior acquisitions, including all outstanding equity under these plans (stock options, stock appreciation rights (“SARs”), restricted stock units (“RSUs”) and performance stock units (“PSUs”)), whether vested or unvested. Nortel sought this approval given the decreased value of Nortel’s common shares (“NNC common shares”) and the administrative and associated costs of maintaining the plans to Nortel as well as the plan participants. See Note 14 for additional information about Nortel’s share-based compensation plans.
3. Significant accounting policies
(a) Principles of combination
The combined financial statements include the global historical assets, liabilities and operations of the Businesses. All significant transactions and balances between operations within the Businesses have been eliminated in combination. All significant transactions between the Businesses and other Nortel businesses are included in these combined financial statements and are disclosed as related party transactions in Note 17. All transactions between the Businesses and Nortel are considered to be effectively settled through the net parent investment at the time the transactions are recorded.
In 2005, Nortel entered into a joint venture, LGN, with LG Electronics Inc. (“LGE”) which offers telecommunications and networking solutions to customers in the Republic of Korea and other markets globally. In exchange for a cash contribution paid to LGE, Nortel received 50% plus one share in the equity of LGN. Nortel’s investment in this joint venture and other joint ventures are excluded from the Businesses’ combined financial statements. However, transactions between the Businesses and LGN are reflected in these combined financial statements and disclosed as related party transactions in Note 17.
(b) Use of estimates
The preparation of financial statements in accordance with U.S. GAAP requires management to make estimates and assumptions that affect the amounts reported in the financial statements and accompanying notes. The Businesses make estimates and assumptions that affect the reported amounts of assets and liabilities and disclosure of contingent assets and liabilities as of the date of the combined financial statements, and the reported amounts of revenues and expenses during the reporting period. Actual results may differ from those estimates. Estimates are used when accounting for items and matters such as revenue recognition and accruals for losses on contracts, allowances for uncollectible accounts receivable, inventory provisions and outsourced manufacturing related obligations, product warranties, estimated useful lives of intangible assets and plant and equipment, asset valuations, impairment and recoverability assessments, employee benefits including pensions and share-based compensation, taxes and related valuation allowances and provisions, restructuring and other provisions, contingencies and allocations of various expenses that have historically been incurred by the Businesses.
F-88
Table of Contents
(c) Translation of foreign currencies
The Businesses’ combined financial statements are presented in U.S. Dollars. The financial statements of the Businesses’ operations whose functional currency is not the U.S. Dollar are translated into U.S. Dollars at the exchange rates in effect at the balance sheet dates for assets and liabilities, and at average rates for the period for revenues and expenses. The unrealized translation gains and losses on the net investment in these foreign operations are accumulated as a component of other comprehensive income (loss).
The financial statements of operations where the functional currency is the U.S. Dollar but where the underlying transactions are in a different currency are translated into U.S. Dollars at the exchange rate in effect at the balance sheet date with respect to monetary assets and liabilities. Non-monetary assets and liabilities of these operations, and related amortization and depreciation expenses, are translated at the historical exchange rate. Revenues and expenses, other than amortization and depreciation, are translated at the average rate for the period in which the transaction occurred. The applicable gain/loss from foreign currency remeasurement has been allocated to these combined financial statements proportionate based on revenue (for revenue generating entities) or selling, general, and administrative expense (for non-revenue generating entities). The allocated gain/loss from foreign currency remeasurement is included in other income (expense) in the combined statements of operations.
(d) Revenue recognition
The Businesses’ products and services are generally sold pursuant to a contract and the terms of the contract, taken as a whole, determine the appropriate revenue recognition models to be applied. Product revenue includes revenue from arrangements that include services such as installation, engineering and network planning where the services could not be separated from the arrangement because the services are essential or fair value could not be established. Where services are not bundled with product sales, services revenue is reported separately in the combined statements of operations.
Depending on the terms of the contract and types of products and services sold, the Businesses recognize revenue under American Institute of Certified Public Accountants Statement of Position (“SOP”) 81-1, “Accounting for Performance of Construction-Type and Certain Production-Type Contracts” which is now codified as ASC 605-35 (“ASC 605-35”), SOP 97-2 which is now codified as ASC 985-605, “Software Revenue Recognition” (“ASC 985-605”) and FASB Emerging Issues Task Force (“EITF”) 00-21 which is now codified as ASC 605-25, “Revenue Arrangements with Multiple Deliverables” (“ASC 605-25”). Revenues are reduced for returns, allowances, rebates, discounts and other offerings in accordance with the agreement terms.
The Businesses regularly enter into multiple contractual agreements with the same customer. These agreements are reviewed to determine whether they should be evaluated as one arrangement in accordance with ASC 985-605. For arrangements with multiple deliverables entered into after June 30, 2003, where the deliverables are governed by more than one authoritative accounting standard, the Businesses apply ASC 605-25 and evaluate each deliverable to determine whether it represents a separate unit of accounting based on the following criteria: (a) whether the delivered item has value to the customer on a stand-alone basis, (b) whether there is objective and reliable evidence of the fair value of the undelivered item(s) and (c) if the contract includes a general right of return relative to the delivered item, delivery or performance of the undelivered item(s) is considered probable and substantially in the control of the Businesses.
If objective and reliable evidence of fair value exists for all units of accounting in the arrangement, revenue is allocated to each unit of accounting or element based on relative fair values. In situations where there is objective and reliable evidence of fair value for all undelivered elements, but not for delivered elements, the residual method is used to allocate the arrangement consideration. Under the residual method, the amount of revenue allocated to delivered elements equals the total arrangement consideration less the aggregate fair value of any undelivered elements. Each unit of accounting is then accounted for under the applicable revenue recognition guidance. So long as elements otherwise governed by separate authoritative accounting standards cannot be treated as separate units of accounting under the guidance in ASC 605-25, the elements are combined
F-89
Table of Contents
into a single unit of accounting for revenue recognition purposes. In this case, revenue allocated to the unit of accounting is deferred until all combined elements have been delivered or, once there is only one remaining element to be delivered, based on the revenue recognition guidance applicable to the last delivered element within the unit of accounting.
For arrangements where software is considered more than incidental and essential to the functionality of the hardware, or where the hardware is not considered a separate element from the software deliverables, revenue is recognized for the software and the hardware as a single unit of accounting pursuant to ASC 985-605 for off-the-shelf products and pursuant to ASC 605-35 for customized products.
Software revenue is generally recognized under ASC 985-605. For software arrangements involving multiple elements, the Businesses allocate revenue to each element based on the relative fair value or the residual method, as applicable using vendor specific objective evidence to determine fair value, which is based on prices charged when the element is sold separately. Software revenue accounted for under ASC 985-605 is recognized when persuasive evidence of an arrangement exists, the software is delivered in accordance with all terms and conditions of the customer contracts, the fee is fixed or determinable and collectability is probable. Revenue related to post-contract customer support (“PCS”), including technical support and unspecified when-and-if available software upgrades, is recognized ratably over the PCS term.
Under ASC 985-605, if fair value does not exist for any undelivered element, revenue is not recognized until the earlier of (i) delivery of such element or (ii) when fair value of the undelivered element is established, unless the undelivered element is a service, in which case revenue is recognized as the service is performed once the service is the only undelivered element.
For elements related to customized solutions designed and built to customer specific requirements, revenues are recognized in accordance with ASC 605-35, generally using the percentage-of-completion method. In using the percentage-of-completion method, revenues are recorded based on the percentage of costs incurred to date on a contract relative to the estimated total expected contract costs. Profit estimates on these contracts are revised periodically based on changes in circumstances and any losses on contracts are recognized in the period that such losses become known. In circumstances where reasonably dependable cost estimates cannot be made for a customized solution or build-out, all revenues and related costs are deferred until completion of the solution or element (“completed contract method”). Generally, the terms of ASC 605-35 contracts provide for progress billings based on completion of certain phases of work. Unbilled ASC 605-35 contract revenues recognized are accumulated in the contracts in progress account included in accounts receivable—net. Billings in excess of revenues recognized to date on these contracts are recorded as advance billings in excess of revenues recognized to date on contracts within other accrued liabilities until recognized as revenue. This classification also applies to billings in advance of revenue recognized on combined units of accounting under ASC 605-25 that contain both ASC 605-35 and non ASC 605-35 elements.
For arrangements where the criteria for revenue recognition have not been met because legal title or risk of loss on products does not transfer to the customer until final payment has been received or where delivery has not occurred, revenue is deferred to a later period when the outstanding criteria have been met. For arrangements where the customer agrees to purchase products but the Businesses retain physical possession until the customer requests delivery (“bill and hold arrangements”), revenue is not recognized until delivery to the customer has occurred and all other revenue recognition criteria have been met.
Services revenue is generally recognized according to the proportional performance method. The proportional performance method is used when the provision of services extends beyond an accounting period with more than one performance act, and permits the recognition of revenue ratably over the services period when no other pattern of performance is discernable. The nature of the service contract is reviewed to determine which revenue recognition method best reflects the nature of services performed. Provided all other revenue recognition criteria have been met, the revenue recognition method selected reflects the pattern in which the obligations to the customers have been fulfilled.
F-90
Table of Contents
The Businesses make certain sales through multiple distribution channels, primarily resellers and distributors. These customers are generally given certain rights of return. For products sold through these distribution channels, revenue is recognized from product sale at the time of shipment to the distribution channel when persuasive evidence of an arrangement exists, delivery has occurred, the fee is fixed or determinable and collectability is reasonably assured. Accruals for estimated sales returns and other allowances are recorded at the time of revenue recognition and are based on contract terms and prior claims experience.
Deferred costs are presented as current or long-term in the combined balance sheet, consistent with the classification of the related deferred revenues.
(e) Research and development
Research and development (“R&D”) costs are charged to net earnings (loss) in the periods in which they are incurred. However, costs incurred pursuant to specific contracts with third parties, for which the Businesses are obligated to deliver a product, are charged to cost of revenues in the same period as the related revenue is recognized.
(f) Income taxes
The Businesses do not file separate tax returns, but rather are included in the income tax returns filed by Nortel and its subsidiaries in various domestic and foreign jurisdictions. For the purpose of these combined financial statements, the tax provision of the Businesses was derived from financial information included in the consolidated financial statements of Nortel, including allocations and eliminations deemed necessary by management, as though the Businesses were filing their own separate tax returns.
The Businesses account for income taxes by the asset and liability method. This approach recognizes the amount of taxes payable or refundable in the current year as well as deferred tax assets and liabilities for the future tax consequences, determined on the separate return basis, of events recognized in these combined financial statements. Deferred income taxes are adjusted to reflect changes in enacted tax rates.
Nortel manages its tax position for the benefit of its entire portfolio of businesses, and its tax strategies, including utilization of loss carryforwards, are not necessarily reflective of what the Businesses would have followed as a stand alone entity. Losses generated by the Businesses have been available to, and as appropriate were utilized by, Nortel in its tax strategies with respect to entities or operations not forming part of the Businesses. Due to difficulties inherent in separating the Businesses’ results from Nortel’s consolidated results during periods pre-dating the periods presented in these combined financial statements, any deferred tax assets in respect of loss carryforwards and tax credits are not recognized in these combined financial statements.
In establishing the appropriate income tax valuation allowances, the Businesses assess its net deferred tax assets based on all available evidence, both positive and negative, to determine whether it is more likely than not that the remaining net deferred tax assets or a portion thereof will be realized.
In accordance with ASC 740-10, “Accounting for Uncertainty in Income Taxes—an interpretation of FASB Statement No. 109” (“ASC 740-10”), as applied by the separate return method, the Businesses evaluate tax positions using a two-step process, whereby (1) the Businesses determine whether it is more likely than not that the tax positions will be sustained based on the technical merits of the position and (2) for those tax positions that meet the more likely-than-not recognition threshold, the Businesses recognize the largest amount of tax benefit that has a greater than 50% likelihood of being realized upon ultimate settlement with the related tax authority. In accordance with ASC 740-10, the Businesses classify interest and penalties associated with income tax positions in income tax expense. For additional information, see Note 10.
F-91
Table of Contents
(g) Cash and cash equivalents
Cash and cash equivalents consist of cash and short term investments in bank accounts of NGS. Treasury activities at Nortel are generally centralized such that cash collections by the Enterprise Solutions business are automatically distributed to Nortel and are reflected as a component of net parent investment.
(h) Restricted cash and cash equivalents
Cash and cash equivalents are considered restricted when they are subject to contingent rights of a third party customer in the normal course of business. From time to time, the Businesses may be required to post cash and cash equivalents as collateral to a third party as a result of the general economic and industry environment.
(i) Provision for doubtful accounts
The provision for doubtful accounts for trade receivables due from customers is established based on an assessment of a customer’s credit quality, as well as subjective factors and trends, including the aging of receivable balances. Generally, these credit assessments occur prior to the inception of the credit exposure and at regular reviews during the life of the exposure.
(j) Inventories
Inventories are valued at the lower of cost (calculated generally on a first-in, first-out basis) or market value. The standard cost of finished goods and work in process is comprised of material, labor and manufacturing overhead, which approximates actual cost. Provisions for inventory are based on estimates of future customer demand for existing products, as well as general economic conditions, growth prospects within the customer’s ultimate marketplaces and general market acceptance of current and pending products. Full provisions are generally recorded for surplus inventory in excess of one year’s forecast demand or inventory deemed obsolete. In addition, the Businesses record a liability for firm, non-cancelable and unconditional inventory purchase commitments with contract manufacturers and suppliers for product-related quantities in excess of its future demand forecasts and related claims in accordance with the Businesses’ excess and obsolete inventory policies.
Inventory includes certain direct and incremental deferred costs associated with arrangements where title and risk of loss were transferred to customers but revenue was deferred due to other revenue recognition criteria not being met.
(k) Investments
Investments in equity securities of private companies over which the Businesses do not exert significant influence are accounted for using the cost method. Investments in associated companies and joint ventures are accounted for using the equity method. An impairment loss is recorded when there has been a loss in value of the investment that is other than temporary.
The Businesses monitor its investments for factors indicating other-than-temporary impairment and records a charge to net earnings (loss) when appropriate. Investments are classified as long-term and short-term, based on expected time of maturity.
(l) Plant and equipment
Plant and equipment are stated at cost less accumulated depreciation. Depreciation is generally calculated on a straight-line basis over the expected useful lives of the plant and equipment. The expected useful life of machinery and equipment including related capital leases is three to ten years.
F-92
Table of Contents
(m) Impairment or disposal of long-lived assets
The Businesses test long-lived assets or asset groups held and used for recoverability when events or changes in circumstances indicate that their carrying amount may not be recoverable. Circumstances which could trigger a review include, but are not limited to: significant decreases in the market price of the asset or asset group; significant adverse changes in the business climate or legal factors; the accumulation of costs significantly in excess of the amount originally expected for the acquisition or construction of the asset; current period cash flow or operating losses combined with a history of losses or a forecast of continuing losses associated with the use of the asset; and a current expectation that the asset will more likely than not be sold or disposed of significantly before the end of its previously estimated useful life.
Recoverability is assessed based on the carrying amount of the asset or asset group and the sum of the undiscounted cash flows expected to result from the use and the eventual disposal of the asset or asset group. An impairment loss is recognized when the carrying amount is not recoverable and exceeds the fair value of the asset or asset group. The impairment loss is measured as the amount by which the carrying amount exceeds fair value.
(n) Goodwill
Goodwill represents the excess of the purchase price of an acquired business over the fair value of the identifiable assets acquired and liabilities assumed. The Businesses test for impairment of goodwill on an annual basis as of October 1, and at any other time if events occur or circumstances change that would indicate that it is more likely than not that the fair value of a reporting unit has been reduced below its carrying amount. See Note 7 for further information on the Businesses’ goodwill impairment testing policy.
(o) Warranty costs
As part of the normal sale of product, the Businesses provide its customers with product warranties that extend for periods generally ranging from one to six years from the date of sale. A liability for the expected cost of warranty-related claims is established when the product is delivered and completed. In estimating warranty liability, historical material replacement costs and the associated labor costs to correct the product defect are considered. Revisions are made when actual experience differs materially from historical experience. Warranty-related costs incurred before revenue is recognized are capitalized and recognized as an expense when the related revenue is recognized. Known product defects are specifically accrued for as the Businesses become aware of such defects.
(p) Pension, post-retirement and post-employment benefits
Substantially all employees of the Businesses participate in defined benefit pension plans and post-retirement plans as administered and sponsored by Nortel. The Businesses account for their defined benefit pension plans and post-retirement plans in accordance with SFAS No. 87, “Employers’ Accounting for Pensions” and SFAS No. 106, “Employers’ Accounting for Post-retirement Benefits Other Than Pensions,” as amended by SFAS 158 (see Note 4(b)) which is now codified as ASC 715. No pension assets or liabilities are reflected on the Businesses’ combined balance sheets, and pension and other post-retirement expenses for the Businesses have been determined on a multiemployer plan basis and pension expense is calculated by employee and is reflected in net earnings (loss). Employees of the Businesses participate in Nortel’s defined benefit pension plans and the plans’ assets and liabilities are combined with those related to other Nortel businesses. Similarly, Nortel manages its post-retirement benefit plans on a combined basis with claims data and liability information related to the Businesses aggregated and combined with other Nortel businesses.
The Businesses follows the accounting guidance as specified in SFAS No. 112, “Employers Accounting for Postemployment Benefits,” which is now codified as ASC 712 for the recognition of certain disability benefits. The Businesses recognize an actuarial-based obligation at the onset of disability for certain benefits provided to individuals after employment but before retirement that include medical, dental, vision, life and other benefits.
F-93
Table of Contents
(q) Share-based compensation
Employees of the Businesses participated in equity-based compensation plans sponsored by Nortel, which have since been terminated (see Notes 2 and 14). The accounting for significant share-based compensation plans under the fair value-based method is as follows:
Stock options
The grant date fair value of stock options has been estimated using the Black-Scholes-Merton option-pricing model. Compensation cost has been recognized on a straight-line basis over the stock option vesting period of the entire award based on the estimated number of stock options that have been expected to vest. When exercised, stock options have been settled through the issuance of Nortel common shares and have therefore been treated as equity awards.
Stock appreciation rights (“SARs”)
Prior to its termination, stand-alone SARs or SARs in tandem with options could be granted under the 2005 SIP. SARs that have been settled in cash have been accounted for as liability awards and SARs that have been settled in Nortel common shares have been accounted for as equity awards. Upon the exercise of a vested stand-alone SAR, a holder would have been entitled to receive payment, in cash, of Nortel common shares or any combination thereof of an amount equal to the excess of the market value of a common share on the date of exercise over the subscription or base price under the SAR. Stand-alone SARs awarded under the 2005 SIP generally vested in equal installments on the first four anniversary dates of the grant date of the award. All SARs granted prior to the termination of the equity-based compensation plans, were to be settled in cash at the time of vesting however, for purposes of these combined financial statements such awards have been reflected in net parent investment as such awards were to be settled by Nortel. Such awards have been classified as liability awards based on this cash settlement provision. The measurement of the liability and compensation cost of previously outstanding SARs is based on the fair value of the awards and is remeasured each period through the date of settlement. Compensation cost has been amortized over the requisite service period (generally the vesting period) of the award based on the proportionate amount of the requisite service that had been rendered to date.
Restricted Stock Units (“RSUs”)
Prior to the termination of the equity-based compensation plans, RSUs were settled with common shares and valued on the grant date using the grant date market price of the underlying shares. This valuation of compensation cost has not subsequently been adjusted for changes in the market price of the shares. Each RSU granted under the 2005 SIP represented the right to receive one common share subject to the terms and conditions of the award. Prior to the termination of the equity-based compensation plans, compensation cost has been recognized on a straight-line basis over the vesting period of the entire award based on the estimated number of RSU awards that were expected to vest. RSUs were awarded to executive officers beginning in 2005, (employees from January 1, 2007) and prospectively vested in equal installments on the first three anniversary dates of the grant of the award. With the exception of RSUs granted in China, all RSUs granted prior to the termination of the equity-based compensation plans, have been classified as equity instruments as their terms required that they be settled in common shares. To address country specific rules and regulations RSUs awarded prior to the termination of the equity-based compensation plans to employees working in China were cash settled awards. For purposes of these combined financial statements such awards have been reflected in net parent investment as such awards were to be settled by Nortel and compensation cost has been remeasured each period based on the fair value of the underlying shares at period end.
Performance Stock Units (“PSUs”)
Relative Total Shareholder Return Metric Awards (“PSU-rTSRs”)
Prior to January 1, 2008 all awards of PSU-rTSRs under the 2005 SIP had vesting conditions based on a relative total shareholder return metric and had a 36-month performance period. The extent to which PSU-rTSRs
F-94
Table of Contents
vested and settled at the end of a three year performance period depended upon the level of achievement of certain market performance criteria based on the total shareholder return on the Nortel Networks Corporation common shares compared to the total shareholder return on the common shares of a comparative group of companies included in the Dow Jones Technology Titans Index. Awards of PSU-rTSRs granted after January 1, 2008 had an additional 30-day employment service period in addition to the prior vesting conditions based on the relative total shareholder return metric and a 36-month performance period. The number of Nortel common shares issued for vested PSU-rTSRs could have ranged from 0% to 200% of the number of PSU-rTSR awards granted.
Prior to the termination of the equity-based compensation plans, PSU-rTSRs were generally settled with common shares and were valued using a Monte Carlo simulation model. The number of awards expected to be earned, based on achievement of the PSU-rTSR market condition, was factored into the grant date Monte Carlo valuation for the PSU-rTSR award. The grant date fair value has not subsequently been adjusted regardless of the eventual number of awards that were earned based on the market condition. Compensation cost has been recognized on a straight-line basis over the requisite service period. Compensation cost has been reduced for estimated PSU-rTSR awards that would not vest due to not meeting continued employment vesting conditions. All PSU-rTSRs currently granted prior to the termination of the equity-based compensation plans, have been classified as equity instruments as their terms required settlement in shares.
Management Operating Margin Metric Awards (“PSU-Management OMs”)
In March, 2008, Nortel issued PSU-Management OMs, which vested based on the satisfaction of a one-year performance condition an additional 24-month continued service condition and Nortel’s Management Operating Margin (“Management OM”) exceeding the minimum threshold level of 4.80% or $550 in accordance with Nortel’s payout curve for a one year performance period. The number of Nortel common shares to be issued for vested PSU-Management OMs is determined based on Nortel’s Management OM and could have ranged from 0% to 200% of the number of PSU-Management OM awards granted. Prior to the termination of the equity-based compensation plans PSU-Management OMs were generally settled in shares and compensation cost for these awards has been measured based on the grant date fair value of the underlying common shares that would have been issuable based on the terms of the award. Prior to the termination of the equity-based compensation plans, compensation cost has been recognized over the requisite service period of the award based on the probable number of shares to be issued by achievement of the performance condition, reduced by the expected awards that would not vest due to not meeting the continued service condition. Compensation cost recognized has been adjusted to equal the grant date fair value of the actual shares that vested once known.
For PSU-Management-OMs that may have been settled in cash, such awards has been reflected in net parent investment as the awards were to be settled by Nortel and compensation cost for the award has been remeasured each period based on the fair value of the underlying shares at period end. Compensation cost has then been recognized in the same manner as described above.
Employee stock purchase plans
Nortel maintained the Nortel Global Stock Purchase Plan, as amended and restated, the Nortel U.S. Stock Purchase Plan, As Amended and Restated and the Nortel Stock Purchase Plan for Members of the Nortel Saving and Retirement Program, As Amended (collectively, the “ESPPs”), to facilitate the acquisition of Nortel common shares at a discount. The discount was such that the ESPPs were considered compensatory and the Businesses’ contribution to the ESPPs was recorded as compensation cost on a quarterly basis as the obligation to contribute was incurred. Nortel’s contribution to the ESPPs, as defined in Note 14, has been recorded as compensation expense on a quarterly basis as the obligation to contribute has been incurred.
F-95
Table of Contents
(r) Recent accounting pronouncements
| (i) | In December 2008, the FASB issued FSP FAS 132(R)-1, “Employers’ Disclosures about Postretirement Benefit Plan Assets”, which is now codified as FASB ASC 715-20 “Defined Benefit Plans—General” (“ASC 715-20”). ASC 715-20 requires more information about how investment allocation decisions are made, more information about major categories of plan assets, including concentrations of risk and fair-value measurements, and the fair-value techniques and inputs used to measure plan assets, ASC 715-20 is effective for fiscal years ending after December 15, 2009 and will be applied prospectively. The Businesses plan to adopt the provisions of ASC 715-20 on December 31, 2009 and are currently assessing the impact of adoption on ASC 715-20. |
| (ii) | In June 2009, the FASB issued SFAS No. 166 “Accounting for Transfers of Financial Assets” (“SFAS 166”). SFAS 166 revises FASB ASC 860 “Transfers and Servicing” (“ASC 860”). The revised ASC will require more information about transfers of financial assets, including securitization transactions, and where entities have continuing exposure to the risks related to transferred financial assets. SFAS 166 is effective for interim and annual reporting periods ending after November 15, 2009 and will be applied prospectively. The Businesses plan to adopt the provisions of SFAS 166 on January 1, 2010 and are currently assessing the impact of adoption of SFAS 166. |
| (iii) | In June 2009, the FASB issued SFAS No. 167, “Amendments to FASB Interpretation No.46(R)” (“SFAS 167”). SFAS 167 revises FASB ASC 810-25 “Variable Interest Entities” (“ASC 810-25”), and changes how a reporting entity determines when an entity that is insufficiently capitalized or is not controlled through voting (or similar rights) should be consolidated. The determination of whether a reporting entity’s ability to direct the activities of the other entity that most significantly impacts the other entity’s economic performance. Revised ASC 810-25 is effective for interim and annual periods after November 15, 2009 and will be applied prospectively. The Businesses plan to adopt the provisions of revised ASC 810-25 on January 1, 2010 and are currently assessing the impact of adoption of revised ASC 810-25. |
| (iv) | In October 2009, the FASB issued Accounting Standards Update (“ASU”) No. 2009-13, “Multiple-Deliverable Revenue Arrangements a consensus of the FASB Emerging Issues Task Force,” (“ASU 2009-13”). ASU 2009-13 addresses accounting for multiple-deliverable arrangements and requires that the overall arrangement consideration be allocated to each deliverable in a revenue arrangement based on an estimated selling price when vendor specific objective evidence or third-party evidence of fair value is not available. This guidance also eliminates the residual method of allocation and requires that arrangement consideration be allocated to all deliverables using the relative selling price method. This will result in more revenue arrangements being separated into separate units of accounting. ASU 2009-13 is effective for fiscal years beginning on or after June 15, 2010. Companies can elect to apply this guidance (1) prospectively to new or materially modified arrangements after the effective date or (2) retrospectively for all periods presented. The Businesses are currently assessing the impact of adoption of ASU 2009-13 and do not currently plan to early adopt. |
| (v) | In October 2009, the FASB issued ASU No. 2009-14, “Certain Revenue Arrangements That Include Software Elements,” (“ASU 2009-14”). ASU 2009-14 changes the accounting model for revenue arrangements that include both tangible products and software elements. Tangible products containing both software and non-software components that function together to deliver the product’s essential functionality will no longer be within the scope of ASC 985-605 “Software Revenue Recognition” (“ASC 985-605”). The entire product (including the software and non-software deliverables) will therefore be accounted for under accounting literature found in ASC 605. ASU 2009-14 is effective for fiscal years beginning on or after June 15, 2010. Companies can elect to apply this guidance (1) prospectively to new or materially modified arrangements after the effective date or (2) retrospectively for all periods presented. The Businesses are currently assessing the impact of adoption of ASU 2009-14 and do not currently plan to early adopt. |
F-96
Table of Contents
4. Accounting changes
(a) Fair Value Measurements
In September 2006, the FASB issued ASC 820, which establishes a single definition of fair value and requires expanded disclosures about fair value measurements. ASC 820 is effective for financial statements issued for fiscal years beginning after November 15, 2007. The Businesses partially adopted the provisions of ASC 820 effective January 1, 2008. The effective date for ASC 820 as it relates to fair value measurements for non-financial assets and liabilities that are not measured at fair value on a recurring basis was deferred to fiscal years beginning after December 15, 2008 in accordance with ASC 820. The Businesses adopted the deferred portion of ASC 820 on January 1, 2009. The adoption of the deferred portion of ASC 820 did not have a material impact on the Businesses’ results of operations and financial condition.
(b) Employers’ Accounting for Defined Benefit Pension and Other Post-retirement Plans—An Amendment of FASB Statements No. 87, 88, 106, and 132(R)
In September 2006, the FASB issued SFAS 158, “Employer’s Accounting for Defined Benefit Pension and Other Postretirement Plans—An Amendment of FASB Statements No. 87, 88, 106, and 132(R)”, which is now codified as part of FASB ASC 715 “Compensation-Retirement Benefits” (“ASC 715”). ASC 715 requires the Businesses to measure the funded status of its plans as of the date of its year end statement of financial position, being December 31. Nortel had historically measured the funded status of its significant plans on September 30. ASC 715 provided two approaches for an employer to transition to a fiscal year end measurement date. Nortel adopted the second approach, whereby Nortel continues to use the measurements determined for the December 31, 2007 fiscal year end reporting to estimate the effects of the transition. Under this approach, the net periodic benefit cost (exclusive of any curtailment or settlement gain or loss) for the period between the earlier measurement date, being September 30, 2007, and the end of the fiscal year that the new measurement date provisions are applied, being December 31, 2008, are allocated proportionately between amounts to be recognized as an adjustment to opening accumulated deficit in 2008 and the net periodic benefit cost for the fiscal year ended December 31, 2008. The adoption did not have a material impact on the Businesses as pension costs are reflected within these combined financial statements on a multiemployer basis. See Note 12 for additional information on the Businesses’ involvement in Nortel’s pension and post-retirement plans.
(c) Determination of the Useful life of intangible assets
In April 2008, the FASB issued FSP FAS 142-3, “Determination of the Useful Life of Intangible Assets” which is now codified as part of FASB ASC 350-30 “General Intangibles Other than Goodwill” (“ASC 350-30”). ASC 350-30 provides guidance with respect to estimating the useful lives of recognized intangible assets and requires additional disclosure related to the renewal or extension of the terms of recognized intangible assets. ASC 350-30 is effective for fiscal years and interim periods beginning after December 15, 2008. The Businesses adopted the provisions of ASC 350-30 on January 1, 2009. The adoption of ASC 350-30 did not have a material impact on the Businesses’ results of operations, financial condition and disclosures.
(d) Collaborative Arrangements
In September 2007, the FASB Emerging Issues Task Force (“EITF”) reached a consensus on EITF Issue No. 07-1, “Collaborative Arrangements”, which is now codified as FASB ASC 808 “Collaborative Arrangements” (“ASC 808”). ASC 808 addresses the accounting for arrangements in which two companies work together to achieve a common commercial objective, without forming a separate legal entity. The nature and purpose of a company’s collaborative arrangements are required to be disclosed, along with the accounting policies and the classification and amounts for significant financial activities related to the arrangements. Nortel adopted the provisions of ASC 808 on January 1, 2009. The adoption of ASC 808 did not have a material impact on the Businesses’ results of operations and financial condition.
F-97
Table of Contents
(e) Determining Fair Value when the Volume and Level of Activity for the Asset or Liability have Significantly Decreased and Identifying Transactions that are not Orderly
In April 2009, FASB issued FSP FAS 157-4, “Determining Fair Value when the Volume and Level of Activity for the Asset or Liability have Significantly Decreased and Identifying Transactions that are not Orderly” which is now codified as part of ASC 820. ASC 820 provides additional guidance on determining fair value for a financial asset when the volume or level of activity for that asset or liability has significantly decreased and also assists in identifying circumstances that indicate a transaction is not orderly. An orderly transaction is a transaction that assumes exposure to the market for a period prior to the measurement date to allow for marketing activities that are usual and customary. ASC 820 is effective for interim and annual reporting periods ending after June 15, 2009 and will be applied prospectively. The Businesses adopted the provisions of ASC 820 on June 30, 2009. The adoption of ASC 820 did not have a material impact on the Businesses’ results of operations and financial condition.
(f) Subsequent Events
In June 2009, the FASB issued SFAS No. 165, “Subsequent Events”, which is now codified as FASB ASC 855 “Subsequent Events” (“ASC 855”). ASC 855 requires Management to evaluate subsequent events through the date the financial statements are either issued or available to be issued, depending on the company’s expectation of whether it will widely distribute its financial statements to its shareholders and other financial statement users. Companies are required to disclose the date through which subsequent events have been evaluated. ASC 855 is effective for interim or annual financial periods ending after June 15, 2009. Nortel adopted the provisions of ASC 855 on June 30, 2009. The adoption of ASC 855 did not have a material impact on the Businesses’ results of operations and financial condition.
(g) FASB Accounting Standards Codification and the Hierarchy of Generally Accepted Accounting Principles
In July 2009, the FASB issued SFAS No. 168, “FASB Accounting Standards Codification and the Hierarchy of Generally Accepted Accounting Principles”, which is now codified as FASB ASC 105 “Generally Accepted Accounting Principles” (“ASC 105”). ASC 105 establishes the FASB Accounting Standards Codification as the single source of authoritative U.S. GAAP recognized by the FASB to be applied to nongovernmental entities. Rules and interpretive releases of the SEC under authority of federal securities laws are also sources of authoritative U.S. GAAP for SEC registrants. ASC 105 is effective for financial statements issued for interim and annual periods after September 15, 2009. Nortel adopted the provisions of ASC 105 on September 30, 2009. The adoption of ASC 105 did not have a material impact on the Businesses’ results of operations and financial condition.
F-98
Table of Contents
5. Reorganization items—net
Reorganization items represent the direct and incremental costs incurred by Nortel related to the Creditor Protection Proceedings such as revenues, expenses such as professional fees directly related to the process of reorganizing the Debtors, realized gains and losses, and provisions for losses resulting from the reorganization and restructuring of the business. Reorganization costs, except the pension adjustments below, are comprised of costs that were specifically attributable to the Businesses as well as shared costs that were allocated based on proportionate headcount and proportionate revenues. The pension adjustments were allocated based on the Businesses’ projected benefit obligations relative to the total projected benefit obligation of the related plans. For the nine months ending September 30, 2009, the Businesses’ reorganization items consisted of the following:
Professional fees(a) | $ | (63 | ) | |
Key Executive Incentive Plan / Key Employee Retention Plan(b) | (16 | ) | ||
Pension adjustments(c) | (28 | ) | ||
Penalties(d) | (24 | ) | ||
Other(e) | (16 | ) | ||
|
| |||
Total reorganization items—net | $ | (147 | ) | |
|
|
| (a) | Includes financial, legal, real estate and valuation services directly associated with the Creditor Protection Proceedings. |
| (b) | Relates to retention and incentive plans for certain key eligible employees deemed essential to the business during the Creditor Protection Proceedings. |
| (c) | Includes the net impact of the ($12) gain related to the termination of the U.S. Retirement Income Plan and $40 related to the Pension Benefit Guaranty Corporation (“PBGC”) claim. |
| (d) | Relates to liquidated damages on early termination of contracts, including $24 of directly attributable charges for the nine months ended September 30, 2009. |
| (e) | Includes other miscellaneous items directly related to the Creditor Protection Proceedings, such as loss on disposal of certain assets and revocation of a government grant. |
6. Combined financial statement details
The following tables provide details of selected items presented in the combined statements of operations and cash flows for the nine months ended September 30, 2009 and the year ended December 31, 2008, and the combined balance sheets as of September 30, 2009 and December 31, 2008.
Combined statements of operations
SG&A expense:
SG&A expense includes bad debt expense of $1 and $1 for the nine months ended September 30, 2009 and the year ended December 31, 2008.
Other operating expense (income)—net:
| Nine months ended September 30, 2009 | Year ended December 31, 2008 | |||||||
Royalty license income—net | $ | (10 | ) | $ | (22 | ) | ||
Pension curtailment (Note 12) | 34 | — | ||||||
Other—net | (1 | ) | (1 | ) | ||||
|
|
|
| |||||
Other operating income—net | $ | 23 | $ | (23 | ) | |||
|
|
|
| |||||
F-99
Table of Contents
Other income (expense)—net:
| Nine months ended September 30, 2009 | Year ended December 31, 2008 | |||||||
Currency exchange gains (losses)—net | $ | (15 | ) | $ | 28 | |||
Other—net | (4 | ) | (9 | ) | ||||
|
|
|
| |||||
Other income (expense)—net | $ | (19 | ) | $ | 19 | |||
|
|
|
| |||||
Combined balance sheets
Cash and Cash Equivalents:
| September 30, 2009 | December 31, 2008 | |||||||
Cash on hand and balances with banks | $ | 27 | $ | 34 | ||||
Cash equivalents | 11 | 10 | ||||||
|
|
|
| |||||
Cash and Cash equivalents at end of the period | $ | 38 | $ | 44 | ||||
|
|
|
| |||||
Accounts receivable—net:
| September 30, 2009 | December 31, 2008 | |||||||
Trade Receivables | $ | 302 | $ | 440 | ||||
Accrued receivables | 17 | 19 | ||||||
Contracts in progress | 20 | 25 | ||||||
|
|
|
| |||||
| 339 | 484 | |||||||
Less: provision for doubtful accounts | (25 | ) | (26 | ) | ||||
Less: advance billings | (9 | ) | (32 | ) | ||||
|
|
|
| |||||
Accounts receivable—net | $ | 305 | $ | 426 | ||||
|
|
|
| |||||
Inventories—net:
| September 30, 2009 | December 31, 2008 | |||||||
Raw materials | $ | 5 | $ | 11 | ||||
Work in process | 3 | 1 | ||||||
Finished goods | 163 | 140 | ||||||
Deferred Costs | 130 | 218 | ||||||
|
|
|
| |||||
| 301 | 370 | |||||||
Less: provision for inventories | (59 | ) | (43 | ) | ||||
|
|
|
| |||||
Inventories—net | 242 | 327 | ||||||
Less: long-term deferred costs(a) | (16 | ) | (43 | ) | ||||
|
|
|
| |||||
Current inventories—net | $ | 226 | $ | 284 | ||||
|
|
|
| |||||
| (a) | Long-term portion of deferred costs is included in other assets. |
F-100
Table of Contents
Other current assets:
| September 30, 2009 | December 31, 2008 | |||||||
Prepaid expenses | $ | 13 | $ | 8 | ||||
Current investments | 21 | 17 | ||||||
Contract manufacturing receivables | 16 | 11 | ||||||
Other receivables | 13 | 16 | ||||||
Other | — | 2 | ||||||
|
|
|
| |||||
Other current assets | $ | 63 | $ | 54 | ||||
|
|
|
| |||||
Investments:
In 2008, the Businesses classified its auction rate securities as available-for-sale within current assets. In October 2008, the Businesses entered into an agreement with the investment firm that originally sold the Businesses its auction rate securities. As a result, the Businesses transferred these auction rate securities from available-for-sale to held-for-trading investment securities in consideration of the terms of such agreement. During 2009, the Businesses held $18 in auction rate securities, which after consideration of partial redemptions throughout the year and the execution of the aforementioned agreement, has been classified as trading securities within other current assets as of September 30, 2009. See Note 15 for more information.
Plant and equipment—net:
| September 30, 2009 | December 31, 2008 | |||||||
Cost: | ||||||||
Machinery and equipment | $ | 166 | $ | 204 | ||||
Assets under capital lease | 46 | 28 | ||||||
|
|
|
| |||||
| 212 | 232 | |||||||
|
|
|
| |||||
Less: accumulated depreciation | ||||||||
Machinery and equipment | $ | (124 | ) | $ | (131 | ) | ||
Assets under capital lease | (20 | ) | (4 | ) | ||||
|
|
|
| |||||
| (144 | ) | (135 | ) | |||||
|
|
|
| |||||
Plant and equipment—net | $ | 68 | $ | 97 | ||||
|
|
|
| |||||
Other assets:
| September 30, 2009 | December 31, 2008 | |||||||
Long-term deferred costs | $ | 16 | $ | 43 | ||||
Long-term inventories | 11 | 3 | ||||||
|
|
|
| |||||
Other assets | $ | 27 | $ | 46 | ||||
|
|
|
| |||||
Intangible assets—net:
| Acquired technology | Customer relationships | Other intangibles | Total | |||||||||||||
Cost at September 30, 2009 | $ | 45 | $ | 93 | $ | 5 | $ | 143 | ||||||||
Less: accumulated amortization | (28 | ) | (67 | ) | (3 | ) | (98 | ) | ||||||||
|
|
|
|
|
|
|
| |||||||||
Intangible assets—net at September 30, 2009 | $ | 17 | $ | 26 | $ | 2 | $ | 45 | ||||||||
|
|
|
|
|
|
|
| |||||||||
F-101
Table of Contents
| Acquired technology | Customer relationships | Other intangibles | Total | |||||||||||||
Cost at December 31, 2008 | $ | 44 | $ | 93 | $ | 4 | $ | 141 | ||||||||
Less accumulated amortization | (21 | ) | (58 | ) | (1 | ) | (80 | ) | ||||||||
|
|
|
|
|
|
|
| |||||||||
Intangible assets—net at December 31, 2008 | $ | 23 | $ | 35 | $ | 3 | $ | 61 | ||||||||
|
|
|
|
|
|
|
| |||||||||
Intangible assets are being amortized over a weighted-average period of approximately 5 years ending in 2013. Amortization expense for each of the next five years commencing in 2010 is expected to be $11, $10, $9, $9, and $6 respectively.
Other accrued liabilities:
| September 30, 2009 | December 31, 2008 | |||||||
Deferred revenue | $ | 234 | $ | 335 | ||||
Warranty provisions (Note 13) | 43 | 49 | ||||||
Product-related provisions | 23 | 40 | ||||||
Outsourcing and selling, general and administrative related provisions | 25 | 36 | ||||||
Advance billings in excess of revenue recognized to date on contracts(a) | 17 | 10 | ||||||
Customer deposits | 2 | — | ||||||
Other | 17 | 29 | ||||||
|
|
|
| |||||
Other accrued liabilities | $ | 361 | $ | 499 | ||||
|
|
|
| |||||
| (a) | Includes amounts which may be recognized beyond one year due to the duration of certain contracts. |
Other liabilities:
| September 30, 2009 | December 31, 2008 | |||||||
Deferred revenue | $ | 34 | $ | 92 | ||||
Restructuring liabilities (Notes 8 and 9) | 3 | 2 | ||||||
Other long-term provisions | 13 | 22 | ||||||
|
|
|
| |||||
Other liabilities | $ | 50 | $ | 116 | ||||
|
|
|
| |||||
Combined statements of cash flows
Change in operating assets and liabilities—net:
| Nine months ended September 30, 2009 | Year ended December 31, 2008 | |||||||
Accounts receivable—net | $ | 125 | $ | 58 | ||||
Inventories—net | (6 | ) | 26 | |||||
Deferred costs | 86 | 59 | ||||||
Accounts payable | 26 | (37 | ) | |||||
Payroll and benefit-related, other accrued and contractual liabilities | (143 | ) | (71 | ) | ||||
Deferred revenue | (79 | ) | (156 | ) | ||||
Advance billings in excess of revenues recognized to date on contracts | 7 | (33 | ) | |||||
Restructuring liabilities | 61 | 22 | ||||||
Other | (14 | ) | (5 | ) | ||||
|
|
|
| |||||
Change in operating assets and liabilities—net | $ | 63 | $ | (137 | ) | |||
|
|
|
| |||||
F-102
Table of Contents
Acquisitions of investments and businesses—net of cash acquired:
| Nine months ended September 30, 2009 | Year ended December 31, 2008 | |||||||
Cash acquired | $ | — | $ | — | ||||
Total net assets acquired other than cash | — | (38 | ) | |||||
|
|
|
| |||||
Total purchase price | — | (38 | ) | |||||
Less: | ||||||||
Cash acquired | — | — | ||||||
|
|
|
| |||||
Acquisitions of investments and businesses—net of cash acquired | $ | — | $ | (38 | ) | |||
|
|
|
| |||||
Interest and taxes paid:
| Nine months ended September 30, 2009 | Year ended December 31, 2008 | |||||||
Cash interest paid | $ | 2 | $ | 2 | ||||
Cash taxes paid | $ | — | $ | — | ||||
7. Goodwill
The following table outlines goodwill by reporting unit as such units are defined relative to the Businesses:
| Applications | Data | Voice | NGS | Total | ||||||||||||||||
Balance—as of December 31, 2007 | 114 | 207 | 489 | 171 | 981 | |||||||||||||||
Change: | ||||||||||||||||||||
Additions | — | — | — | — | — | |||||||||||||||
Disposals | — | — | — | — | — | |||||||||||||||
Foreign exchange | — | — | (2 | ) | — | (2 | ) | |||||||||||||
Other | — | — | — | — | — | |||||||||||||||
Impairment | (114 | ) | (207 | ) | (487 | ) | — | (808 | ) | |||||||||||
|
|
|
|
|
|
|
|
|
| |||||||||||
Balance—as of December 31, 2008 | — | — | — | 171 | 171 | |||||||||||||||
Change: | ||||||||||||||||||||
Additions | — | — | — | — | — | |||||||||||||||
Disposals | — | — | — | — | — | |||||||||||||||
Foreign exchange | — | — | — | — | — | |||||||||||||||
Other | — | — | — | — | — | |||||||||||||||
Impairment | — | — | — | (49 | ) | (49 | ) | |||||||||||||
|
|
|
|
|
|
|
|
|
| |||||||||||
Balance—as of September 30, 2009 | $ | — | $ | — | $ | — | $ | 122 | $ | 122 | ||||||||||
|
|
|
|
|
|
|
|
|
| |||||||||||
The application, data and voice reporting units of the Businesses are distinct units within the Enterprise Solutions business and comprise both the product and services aspects of those units.
Goodwill Impairment Testing Policy
The Businesses test goodwill for possible impairment on an annual basis as of October 1 of each year and at any other time if an event occurs or circumstances change that would more likely than not reduce the fair value of a reporting unit below its carrying amount. Circumstances that could trigger an impairment test between annual tests include, but are not limited to:
| • | a significant adverse change in the business climate or legal factors; |
| • | an adverse action or assessment by a regulator; |
F-103
Table of Contents
| • | unanticipated competition; |
| • | loss of key personnel; |
| • | the likelihood that a reporting unit or a significant portion of a reporting unit will be sold or disposed of; |
| • | a change in reportable segments; |
| • | results of testing for recoverability of a significant asset group within a reporting unit; and |
| • | recognition of a goodwill impairment loss in the financial statements of a subsidiary that is a component of a reporting unit. |
The impairment test for goodwill is a two-step process. Step one consists of a comparison of the fair value of a reporting unit with its carrying amount, including the goodwill allocated to the reporting unit. The Businesses determine the fair value of its reporting units using an income approach; specifically, based on a Discounted Cash Flow (“DCF”) Model. A market approach may also be used to evaluate the reasonableness of the fair value determined under the DCF Model, but results of the market approach are not given any specific weighting in the final determination of fair value. Both approaches involve significant management judgment and as a result, estimates of value determined under the approaches are subject to change in relation to evolving market conditions and the Enterprise and Government Solutions’ business environment.
If the carrying amount of a reporting unit exceeds its fair value, step two of the goodwill impairment test requires the fair value of the reporting unit be allocated to the underlying assets and liabilities of that reporting unit, whether or not previously recognized, resulting in the determination of an implied fair value of goodwill. If the carrying amount of the reporting unit goodwill exceeds the implied fair value of that goodwill, an impairment loss equal to the excess is recorded in net earnings (loss).
The fair value of each reporting unit is determined using discounted cash flows or other evidence of fair value as applicable. When circumstances warrant, a multiple of earnings before interest, taxes, depreciation and amortization (“EBITDA”) of each reporting unit is calculated and compared to market participants to corroborate the results of the calculated fair value (“EBITDA Multiple Model”). The following are the significant assumptions involved in the application of each valuation approach:
| • | DCF Model: assumptions regarding revenue growth rates, gross margin percentages, projected working capital needs, SG&A expense, R&D expense, capital expenditures, discount rates, terminal growth rates and estimated selling price of assets expected to be disposed of by sale. To determine fair value, the Businesses discount the expected cash flows of each reporting unit. The discount rate used represents the estimated weighted average cost of capital, which reflects the overall level of inherent risk involved in its reporting unit operations and the rate of return an outside investor would expect to earn. To estimate cash flows beyond the final year of its model, the Businesses use a terminal value approach. Under this approach, the Businesses use the estimated cash flows in the final year of its models and applies a perpetuity growth assumption and discount by a perpetuity discount factor to determine the terminal value. The Businesses incorporate the present value of the resulting terminal value into its estimate of fair value. When strategic plans call for the sale of all or an important part of a reporting unit, the Businesses estimate proceeds from the expected sale using external information, such as third party bids, adjusted to reflect current circumstances, including market conditions. |
| • | EBITDA Multiple Model: assumptions regarding estimates of EBITDA growth and the selection of comparable companies to determine an appropriate multiple. |
2009 Goodwill Assessment
During the first quarter of 2009, in accordance with the provisions of FASB ASC 350 “Intangibles—Goodwill and Other” (“ASC 350”), the Businesses concluded that events had occurred and circumstances had changed that required it to perform an interim period goodwill impairment test for the reporting unit in NGS.
F-104
Table of Contents
Given the nature of the business operations and the decline in the economic outlook, management decided to place significant weighting on the results of the DCF model in establishing the fair value of this reporting unit. The decision was based on a lack of direct comparable companies. The results from step one of the two-step goodwill impairment test indicated that the estimated fair value of NGS was less than the carrying value of its net assets and as such the Businesses performed step two of the impairment test for this reporting unit.
In step two of the impairment test, the Businesses were required to measure the potential impairment loss by allocating the estimated fair value of the reporting unit, as determined in step one, to the reporting unit’s recognized and unrecognized assets and liabilities, with the residual amount representing the implied fair value of goodwill and, to the extent the implied fair value of goodwill was less than the carrying value, an impairment loss was recognized. As such, the step two test required the Businesses to perform a theoretical purchase price allocation for NGS to determine the implied fair value of goodwill as of the evaluation date. In accordance with the guidance in ASC 350, the Businesses completed a preliminary assessment of the expected impact of the step two tests using reasonable estimates for the theoretical purchase price allocation and recorded a preliminary goodwill impairment charge of approximately $49. The Businesses finalized the goodwill assessment during the second quarter of 2009 and as a result recorded no additional goodwill impairment charge.
During the second quarter of 2009, the Businesses tested the long-lived asset groups for recoverability in accordance with ASC 360 “Accounting for the Impairment or Disposal of Long-Lived Assets” (“ASC 360”). Testing a significant asset group within the NGS reporting unit for recoverability constituted a triggering event under ASC 350 requiring an impairment test for goodwill. The Businesses concluded that the existence and evaluation of this triggering event did not result in the recognition of additional goodwill impairment in the period because assumptions in respect of the NGS reporting unit have not changed materially since March 31, 2009.
During the third quarter of 2009, no triggering events occurred that would require the Businesses to test the remaining goodwill for impairment.
2008 Goodwill Assessment
In 2008, in accordance with the provisions of ASC 350, the Businesses concluded that estimated revenues would decline as a result of the economic downturn and the unfavorable impact of foreign exchange fluctuations thereby requiring the Businesses to perform an interim period goodwill impairment test for its application, data and voice reporting units of Enterprise Solutions.
As part of its goodwill impairment test, the Businesses updated its forecasted cash flows for each of its reporting units. This update considered economic conditions and trends, estimated future operating results, the Businesses’ view of growth rates and anticipated future economic conditions. Revenue growth rates inherent in this forecast are based on input from internal and external market intelligence research sources that compare factors such as growth in global economies, regional trends in the telecommunications industry and product evolution from a technological segment basis. Macro economic factors such as changes in economies, product evolutions, industry consolidations and other changes beyond the Businesses’ control could have a positive or negative impact on achieving its targets.
The results from step one of the two-step goodwill impairment test of each reporting unit indicated that the estimated fair values of the application, data and voice reporting units were less than the respective carrying values of their net assets and as such the Businesses performed step two of the impairment test for these reporting units.
In step two of the impairment test, the Businesses estimated the implied fair value of the goodwill of each of these reporting units and compared it to the carrying value of the goodwill for each of the application, data and voice reporting units. Specifically, the Businesses allocated the fair value of the application, data and voice
F-105
Table of Contents
reporting units as determined in the first step to their respective recognized and unrecognized net assets, including allocations to identified intangible assets. The allocations of fair values of the application, data and voice reporting units also require the Businesses to make significant estimates and assumptions, including those in determining the fair values of the identified intangible assets. Such intangible assets had fair values substantially in excess of current book values. The resulting implied goodwill for each of these reporting units was nil; accordingly, the Businesses reduced the goodwill recorded prior to the assessment by $808 to write down the goodwill related to application, data and voice reporting units to the implied goodwill amount.
The NGS reporting unit was tested for impairment on October 1, 2008 and no impairment was recognized.
Related Analyses
In 2008 and 2009, prior to the goodwill analysis discussed above, the Businesses performed a recoverability test of its long-lived assets in accordance with ASC 360-10-35. The Businesses included cash flow projections from operations along with cash flows associated with the eventual disposition of specific asset groupings and compared those aggregate cash flows with the respective carrying values. No impairment charges were recorded as a result of this testing.
8. Pre-Petition Date cost reduction plans
As a result of the Creditor Protection Proceedings, Nortel ceased taking any further actions under the previously announced workforce and cost reduction plans as of January 14, 2009. Any revisions to actions taken up to that date under previously announced workforce and cost reduction plans will continue to be accounted for under such plans, and will be classified in cost of revenues, SG&A and R&D as applicable. Any remaining actions under these plans will be accounted for under the workforce reduction plan announced on February 25, 2009 (see Note 9). Nortel’s contractual obligations are subject to re-evaluation in connection with the Creditor Protection Proceedings and, as a result, expected cash outlays disclosed below relating to contract settlement and lease costs are subject to change. As well, Nortel is not following its pre-Petition Date practices with respect to the payment of severance in jurisdictions under the Creditor Protection Proceedings.
On November 10, 2008, Nortel announced a restructuring plan that included net workforce reductions related to the Businesses and shifting additional positions from higher-cost to lower-cost locations (collectively “November 2008 Restructuring Plan”). As of December 31, 2008 approximately $8 of the total charges incurred related to the net reduction of 93 positions under the November 2008 Restructuring Plan. There were no significant workforce reductions under this plan after December 31, 2008 and prior to its discontinuance on January 14, 2009.
During the first quarter of 2008, Nortel announced a restructuring plan that included net workforce reductions related to the Businesses and shifting additional positions from higher-cost to lower-cost locations. In addition to the workforce reductions, Nortel announced steps to achieve additional cost savings by efficiently managing its various business locations and further consolidating real estate requirements (collectively, “2008 Restructuring Plan”). As of December 31, 2008, approximately $43 of the total charges incurred related to the net reduction of approximately 621 positions and real estate reduction initiatives under the 2008 Restructuring Plan. There were no significant workforce reductions under this plan after December 31, 2008 and prior to its discontinuance on January 14, 2009. The real estate provision of $3 and $2 at September 30, 2009 and December 31, 2008, respectively, relates to discounted cash outlays, net of estimated future sublease revenues, for leases with payment terms through to 2013 related to the Businesses.
During the first quarter of 2007, Nortel announced a restructuring plan that included workforce reductions related to the Businesses. In addition to the workforce reductions, Nortel announced steps to achieve additional cost savings by efficiently managing its various business locations and consolidating real estate requirements (collectively, “2007 Restructuring Plan”). As of December 31, 2008 approximately $11 of the total charges incurred related the net reduction of approximately 140 positions and real estate reduction initiatives under the 2007 Restructuring Plan. There were no significant workforce reductions under this plan after December 31,
F-106
Table of Contents
2008 and prior to its discontinuance on January 14, 2009. The real estate provision of $1 and $1 at September 30, 2009 and December 31, 2009, respectively, relates to discounted cash outlays net of estimated future sublease revenues for leases with payment terms through to 2016.
During 2006, 2004 and 2001, the Businesses implemented work plans impacting the Businesses to streamline operations through workforce reductions and real estate optimization strategies (“2006 Restructuring Plan”, “2004 Restructuring Plan” and “2001 Restructuring Plan”). All of the charges with respect to these workforce reductions have been incurred.
During the nine months ended September 30, 2009 and the year ended December 31, 2008, changes to the Businesses’ provision balances were as follows:
| Workforce reduction | Contract settlement and lease costs | Total | ||||||||||
November 2008 Restructuring Plan | ||||||||||||
Provision balance as of December 31, 2007 | $ | — | $ | — | $ | — | ||||||
Current period charges | 8 | — | 8 | |||||||||
Cash payment funded by Nortel | (2 | ) | — | (2 | ) | |||||||
|
|
|
|
|
| |||||||
Provision balance as of December 31, 2008 | $ | 6 | $ | — | $ | 6 | ||||||
|
|
|
|
|
| |||||||
Current period charges | — | 1 | 1 | |||||||||
Revisions to prior accruals | (1 | ) | — | (1 | ) | |||||||
Cash payment funded by Nortel | 1 | — | 1 | |||||||||
|
|
|
|
|
| |||||||
Provision balance as of September 30, 2009 | $ | 6 | $ | 1 | $ | 7 | ||||||
|
|
|
|
|
| |||||||
2008 Restructuring Plan | ||||||||||||
Provision balance as of December 31, 2007 | $ | — | $ | — | $ | — | ||||||
Current period charges | 39 | 4 | 43 | |||||||||
Revisions to prior accruals | (1 | ) | — | (1 | ) | |||||||
Cash payment funded by Nortel | (23 | ) | (2 | ) | (25 | ) | ||||||
|
|
|
|
|
| |||||||
Provision balance as of December 31, 2008 | $ | 15 | $ | 2 | $ | 17 | ||||||
|
|
|
|
|
| |||||||
Current period charges | — | — | — | |||||||||
Revisions to prior accruals | (3 | ) | — | (3 | ) | |||||||
Cash payment funded by Nortel | (3 | ) | 1 | (2 | ) | |||||||
|
|
|
|
|
| |||||||
Provision balance as of September 30, 2009 | $ | 9 | $ | 3 | $ | 12 | ||||||
|
|
|
|
|
| |||||||
2007 Restructuring Plan | ||||||||||||
Provision balance as of December 31, 2007 | $ | 3 | $ | — | $ | 3 | ||||||
Current period charges | 1 | 1 | 2 | |||||||||
Cash payment funded by Nortel | (3 | ) | — | (3 | ) | |||||||
|
|
|
|
|
| |||||||
Provision balance as of December 31, 2008 | $ | 1 | $ | 1 | $ | 2 | ||||||
|
|
|
|
|
| |||||||
Current period charges | — | — | — | |||||||||
Cash payment funded by Nortel | — | — | — | |||||||||
|
|
|
|
|
| |||||||
Provision balance as of September 30, 2009 | $ | 1 | $ | 1 | $ | 2 | ||||||
|
|
|
|
|
| |||||||
2006 Restructuring Plan | ||||||||||||
Provision balance as of December 31, 2007 | $ | — | $ | — | $ | — | ||||||
Current period charges | — | — | — | |||||||||
Cash payment funded by Nortel | — | — | — | |||||||||
|
|
|
|
|
| |||||||
Provision balance as of December 31, 2008 | $ | — | $ | — | $ | — | ||||||
Current period charges | — | — | — | |||||||||
Cash payment funded by Nortel | — | — | — | |||||||||
|
|
|
|
|
| |||||||
Provision balance as of September 30, 2009 | $ | — | $ | — | $ | — | ||||||
|
|
|
|
|
| |||||||
Total provision balance as of September 30, 2009 (a) | $ | 16 | $ | 5 | $ | 21 | ||||||
|
|
|
|
|
| |||||||
F-107
Table of Contents
| (a) | As of September 30, 2009 and December 31, 2008, the short-term provision balances were $2 and $23, respectively, and the long-term provision balances were $3 and $2, respectively, and $16 was included in liabilities subject to compromise at September 30, 2009. The long-term provision balances are included in Other liabilities on the combined Balance Sheet. |
During the nine months ended September 30, 2009 and the year ended December 31, 2008, total charges specifically related to Enterprise and Government Solutions were ($5) and $53, respectively.
During the nine months ended September 30, 2009 recovery by profit and loss category specifically related to Enterprise and Government Solutions was as follows:
Cost of revenues | $ | (1 | ) | |
SG&A | (1 | ) | ||
R&D | (3 | ) | ||
|
| |||
Total recovery | $ | (5 | ) | |
|
|
In addition, during the nine months ended September 30, 2009 and the year ended December 31, 2008, total charges (recovery) related to contract settlement and lease costs allocated to the Businesses based on headcount of Enterprise and Government Solutions’ employees were ($2) and $32, respectively. Furthermore, these combined financial statements include an allocation of charges pertaining to restructuring activities related to shared employees that provide benefits to multiple Nortel businesses of ($2) and $29 for the nine months ended September 30, 2009 and the year ended December 31, 2008, respectively.
A significant portion of the Businesses’ provisions for workforce reductions and contract settlement and lease costs is associated with shared services. These costs have been allocated to the Businesses based generally on headcount and revenue.
9. Post-Petition Date cost reduction activities
In connection with the Creditor Protection Proceedings, Nortel has commenced certain workforce and other cost reduction activities and will undertake further workforce and cost reduction activities during this process, including related to the Businesses. The actions related to these activities are expected to occur as they are identified. The following current estimated charges are based upon accruals made in accordance with U.S. GAAP. The current estimated total charges and cash outlays are subject to change as a result of Nortel’s ongoing review of applicable law. In addition, the current estimated total charges to earnings and cash outlays do not reflect all potential claims or contingency amounts that may be allowed under the Creditor Protection Proceedings and thus are also subject to change.
Workforce Reduction Activities
On February 25, 2009, Nortel announced a workforce reduction plan to reduce its global workforce by approximately 5,000 net positions which, upon completion, is currently expected to result in total charges to earnings of approximately $270 and total cash outlays of approximately $160.
For the nine months ended September 30, 2009, the Businesses recorded allocated charges of $78 associated with the workforce reduction that included approximately 2,450 employees of the Businesses, all of whom were notified of termination or voluntarily terminated during the period. The workforce reduction was primarily in the U.S. and Canada.
F-108
Table of Contents
During the nine months ended September 30, 2009, changes to the provision balance were as follows:
| Workforce reduction (a) | ||||
Provision balance as of December 31, 2008 | $ | — | ||
Current period charges | 78 | |||
Revisions to prior accruals | — | |||
Cash drawdowns | (14 | ) | ||
Non-cash drawdowns | — | |||
Foreign exchange and other adjustments | — | |||
|
| |||
Provision balance as of September 30, 2009 | $ | 64 | ||
|
| |||
| (a) | As of September 30, 2009 and December 31, 2008, the short-term provision balances were $9 and nil, respectively, and the long-term provision balances were nil and nil, respectively, and $55 was included in liabilities subject to compromise at September 30, 2009. |
During the nine months ended September 30, 2009, workforce reduction charges specifically related to Enterprise and Government Solutions were reclassified as follows:
Cost of revenues | $ | 26 | ||
SG&A | 38 | |||
R&D | 14 | |||
|
| |||
Total charges | $ | 78 | ||
|
|
In addition, during the nine months ended September 30, 2009, total workforce reduction charges related to contract settlement and lease costs allocated to the Businesses based on headcount of Enterprise and Government Solutions’ employees were nil. Furthermore, these combined financial statements include an allocation of charges pertaining to restructuring activities related to shared employees that provide benefits to multiple Nortel businesses of $19 for the nine months ended September 30, 2009.
These costs have been allocated based generally on headcount and revenue.
Other Cost Reduction Activities
During the nine months ended September 30, 2009, included in these combined financial statements are plant and equipment write downs of nil.
During the nine months ended September 30, 2009, in these combined financial statements are pension curtailment and other pension related expenses of $7. Refer to Note 12, “Employee benefit plans,” for further discussion.
10. Income taxes
During the nine months ended September 30, 2009, the Businesses recorded a tax recovery of $1 on loss from operations before income taxes of $754. The tax recovery of $1 was comprised of $1 of income taxes in profitable jurisdictions and $3 of income tax expense resulting from increases in uncertain tax positions and $5 of deferred tax recovery related to NGS.
During the year ended December 31, 2008, the Businesses recorded a tax expense of $6 on loss from operations before income taxes of $1,420.
Under the method of accounting for income taxes described in Note 3, the Businesses assessed its deferred tax assets and the need for a valuation allowance on a separate return basis, and excluded from that assessment
F-109
Table of Contents
the utilization of all or a portion of those losses incurred by Nortel under the separate return method. This assessment requires considerable judgment on the part of management with respect to the benefits that could be realized from future taxable income, as well as other positive and negative factors. For purposes of the valuation allowance assessment, the Enterprise and Government Solutions businesses have incurred losses. During the third and fourth quarters of 2008 the expanding global economic downturn dramatically worsened, and in January 2009, the Debtors commenced the Creditor Protection Proceedings. In assessing the need for valuation allowances against their deferred tax assets for the year ended December 31, 2008, the Businesses considered the negative effect of these events on their revised modeled forecasts and the resulting increased uncertainty inherent in these forecasts. The Businesses determined that there was significant negative evidence against and insufficient positive evidence to support a conclusion that the Businesses’ net deferred tax assets were more likely than not to be realized in future tax years in all tax jurisdictions. Therefore, a full valuation allowance was necessary against the Businesses’ net deferred tax assets in 2008. These factors continue to support the Businesses conclusion that as of September 30, 2009 a full valuation allowance continues to be necessary against the Businesses’ deferred tax assets in all jurisdictions.
In accordance with ASC 740, the Businesses recognized the tax benefit from an uncertain tax position only if it is more likely than not that the tax position will be sustained on examination by the taxing authorities, based on the technical merits of the position. All of the Businesses’ uncertain tax positions remain with Nortel. The Businesses recorded a tax expense of $3 for the nine months ended September 30, 2009, and $3 for the year ended December 31, 2008, associated with the movement in uncertain tax positions.
During 2007 and 2008, Nortel requested new bilateral APAs for tax years 2007 through at least 2010 (“2007-2010 APA”), for Canada, the U.S. and France, with a request for rollback to 2006 in the U.S. and Canada, following methods generally similar to those under negotiation for 2001 through 2005. During the nine months ended September 30, 2009 the Canadian tax authority requested that Nortel rescind its 2007-2010 application as a result of the uncertain commercial environment.
Although Nortel continues to apply the transfer pricing methodology that was requested in the 2007-2010 APA, the ultimate outcome is uncertain and the ultimate reallocation of losses cannot be determined at this time. There could be a further material shift in historical earnings between the above mentioned parties, particularly the U.S. and Canada. If these matters are resolved unfavorably, they could have a material effect on the Businesses’ consolidated financial position, results of operations and/or cashflows.
The following is a reconciliation of income taxes, calculated at the Canadian combined federal and provincial income tax rate, to the income tax recovery (expense) included in the combined statements of operations for the nine months ended September 30, 2009 and the year ended December 31, 2008:
| Nine months ended September 30, 2009 | Year ended December 31, 2008 | |||||||
Income taxes recovery at Canadian rates (2009—31.8%, 2008—31.4%) | $ | 238 | $ | 446 | ||||
Difference between statutory and other tax rates | 8 | 58 | ||||||
Valuation allowances on tax benefits | (226 | ) | (189 | ) | ||||
Non-deductible impairment of goodwill | (13 | ) | (314 | ) | ||||
Adjustments to provisions and reserves | (3 | ) | (3 | ) | ||||
Impact of non-deductible items and other differences | (3 | ) | (4 | ) | ||||
|
|
|
| |||||
Income tax recovery (expense) | $ | 1 | $ | (6 | ) | |||
|
|
|
| |||||
Income tax expense: | ||||||||
Current | $ | (4 | ) | $ | (8 | ) | ||
Deferred | 5 | 2 | ||||||
|
|
|
| |||||
Income tax recovery (expense) | $ | 1 | $ | (6 | ) | |||
|
|
|
| |||||
F-110
Table of Contents
The following table shows the significant components included in deferred income taxes as of September 30, 2009 and December 31, 2008:
| September 30, 2009 | December 31, 2008 | |||||||
Assets: | ||||||||
Deferred revenue | $ | 63 | $ | 87 | ||||
Provisions and reserves | 14 | 22 | ||||||
Plant and equipment | 60 | 54 | ||||||
Other | 17 | 14 | ||||||
Valuation allowance | (137 | ) | (166 | ) | ||||
|
|
|
| |||||
| $ | 17 | $ | 11 | |||||
|
|
|
| |||||
Liabilities: | ||||||||
Intangible assets | (17 | ) | (16 | ) | ||||
|
|
|
| |||||
Net deferred income tax assets/(liabilities) | $ | — | $ | (5 | ) | |||
|
|
|
| |||||
Information regarding net tax loss carryforwards and non-refundable investment tax credits has not been provided in the table above by the Businesses as such information is not considered to be meaningful. As previously indicated, the amounts above have been calculated on the separate return basis of accounting.
The Businesses have not provided for foreign withholding taxes or deferred income tax liabilities for temporary differences related to the undistributed earnings of foreign operations since the Businesses do not currently expect to repatriate earnings that would create any material tax consequences. It is not practical to reasonably estimate the amount of additional deferred income tax liabilities or foreign withholding taxes that may be payable should these earnings be distributed in the future.
During the third quarter of 2009, the U.S. Debtors filed an objection to a claim filed by the Internal Revenue Service (“IRS”) on August 20, 2009. The IRS claim asserts an unsecured priority claim against NNI for the tax years 1998-2007, for income taxes due in the amount of approximately $1,805, and interest to the Petition Date in the amount of approximately $1,163 for an aggregate amount of approximately $2,968 (IRS Claim), and an unsecured non-priority claim for penalties (including interest thereon) to August 20, 2009 in the amount of approximately $49 for a total claim of approximately $3,017. The IRS Claim also includes an unassessed, unliquidated and contingent U.S. federal FICA withholding tax claim. On October 13, 2009, the U.S. Debtors obtained an order approving a stipulation between NNI and the IRS pursuant to which the IRS waived its claims against certain assets of the Enterprise Solutions business in exchange for NNI’s acknowledgement of a claim in favor of the IRS for not less than $9.8 and a lien against certain proceeds of the ES sale for such amount. The stipulation reserved all rights of both NNI and the IRS in respect of all other aspects of the IRS Claim.
11. Acquisitions, divestitures and closures
The following table sets out certain information for the acquisitions completed by Nortel that are relevant to the Businesses in 2008. No acquisitions related to the Businesses occurred during the nine months ended September 30, 2009. All of these acquisitions were accounted for using the purchase method. The combined financial statements include the operating results of each of these Businesses as of their respective dates of acquisition.
Acquisition | Closing Date | Purchase Price | Goodwill | Acquired Technology | Other Intangibles | Net Tangible Assets (Liabilities) | ||||||||||||||||||
Pingtel (a) | 8-Aug-08 | $ | 6 | $ | — | $ | 6 | $ | — | $ | — | |||||||||||||
Diamondware Ltd. (b) | 19-Aug-08 | $ | 5 | $ | — | $ | 3 | $3 | $ | — | ||||||||||||||
| (a) | On August 8, 2008, the Businesses purchased substantially all of the assets and certain liabilities of Pingtel Corp. (“Pingtel”) from Bluesocket Inc. (“Bluesocket”) for $4 in cash, and up to $4 based on |
F-111
Table of Contents
| the achievement of future business milestones plus the return of Nortel’s existing equity interest in Bluesocket which had been acquired for $2. Pingtel, a software-based unified communication solutions designer, was a wholly owned subsidiary of Bluesocket. |
| (b) | On August 19, 2008 the Businesses acquired 100% of the issued and outstanding stock of DiamondWare, Ltd. (“DiamondWare”) for $5 in cash and up to $3 based on achievement of future business milestones. DiamondWare was a privately-held company, specializing in high-definition, proximity-based 3D positional voice technology. |
12. Employee benefit plans
Substantially all employees of the Businesses participate in retirement programs, consisting of defined benefit, defined contribution and investment plans which, other than the Nortel Networks Retirement Income Plan (the “Retirement Income Plan”), are administered and sponsored by Nortel. Nortel has multiple capital accumulation and retirement programs including: defined contribution and investment programs available to substantially all of its North American employees; the flexible benefits plan, which includes a group personal pension plan, available to substantially all of its employees in the U.K.; and traditional defined benefit programs that are closed to new entrants. Although these programs represent Nortel’s major retirement programs and may be available to employees in combination and/or as options within a program, Nortel also has smaller pension plan arrangements in other countries.
Nortel also provides other benefits, including post-retirement benefits and post-employment benefits. Employees previously enrolled in the capital accumulation and retirement programs offering post-retirement benefits are eligible for company sponsored post-retirement health care and/or death benefits, depending on age and/or years of service. Substantially all other employees have access to post-retirement benefits by purchasing a Nortel-sponsored retiree health care plan at their own cost.
As a result of workforce reductions in connection with the Creditor Protection Proceedings, Nortel remeasured the post-retirement benefit obligations for the U.S. and Canada and recorded the impacts of these remeasurements in the second quarter of 2009 in accordance with ASC 715-60 “Defined Benefit Plans—Other Post Retirement” (“ASC 715-60”). Curtailment gains of $5 were recorded to the Businesses.
As a result of workforce reductions in connection with the Creditor Protection Proceedings and the sale agreements for the planned sale of substantially all of the assets of the ES business globally as well as the shares of NGS and DiamondWare, Ltd., Nortel remeasured the post-retirement benefit obligations for the U.S. and Canada and recorded the impacts of these remeasurements in the third quarter of 2009 in accordance with ASC 715-60. Curtailment gains of $1 were recorded to the Businesses.
As a result of workforce reductions in connection with the Creditor Protection Proceedings and the sale agreements for the planned sale of substantially all of the assets of the ES business globally as well as the shares of NGS and DiamondWare, Ltd., Nortel remeasured the pension benefit obligations for certain of its Canadian pension plans in the third quarter and recorded the impacts of these remeasurements in accordance with FASB ASC 715-30 “Defined Benefit Plans—Pension” (“ASC 715-30”). A curtailment loss of $34 and a settlement loss of $11 were recorded to the Businesses.
Currently, as a result of the U.K. Administration Proceedings, all further service cost accruals to its U.K. defined benefit pension plan have ceased. Also, the Ireland defined benefit pension plan is in the process of being wound up and all future service cost accruals have ceased.
As discussed in Note 3, these combined financial statements reflect the plans on a multiemployer basis in accordance with ASC 715-60. As such, Nortel allocated costs associated with the pension plans to the Businesses based upon actual service cost and allocated costs associated with other components of pension expense, such as interest costs, amortization of actuarial gains/losses, etc., based on projected benefit obligations relative to the
F-112
Table of Contents
total projected benefit obligation of the plans. Management of the Businesses believes this methodology is a reasonable basis of allocation. Additionally, Nortel allocated service costs associated with the post-retirement plans based upon actual service cost and allocated costs associated with other components of post-retirement expense based on the Businesses’ accumulated projected benefit obligation relative to the total accumulated projected benefit obligation of the plans. Management of the Businesses believes this methodology is a reasonable basis of allocation.
For the nine months ended September 30, 2009 and the year ended December 31, 2008, the defined benefit pension expense and post-retirement expense allocated to the Businesses from Nortel for specifically identified Enterprise and Government Solutions employees participating in Nortel pension and post-retirement plans was approximately $37 and $19, respectively.
In addition, these combined financial statements reflect a portion of defined benefit pension expense and post-retirement expense related to employees that were not specifically identified to the Businesses but rather provided services to multiple Nortel businesses, including Enterprise and Government Solutions. Total defined benefit pension expense and post-retirement expense recognized associated with these employees was $4 and $7 for the nine months ended September 30, 2009 and the year ended December 31, 2008, respectively. These costs were determined using a consistent methodology as described above and were allocated to the Businesses based on global revenue of the Businesses compared to total Nortel global revenue and management of the Businesses believes that such allocation is reasonable.
On July 17, 2009, the PBGC provided a notice to NNI that the PBGC had determined under the Employee Retirement Income Securities Act of 1974 (“ERISA”) that: (i) the Retirement Income Plan, a defined benefit pension plan sponsored by NNI, will be unable to pay benefits when due; (ii) under Section 4042(c) of ERISA, the Retirement Income Plan must be terminated in order to protect the interests of participants and to avoid any unreasonable increase in the liability of the PBGC insurance fund; and (iii) July 17, 2009 was to be established as the date of termination of the Retirement Income Plan. On the same date, the PBGC filed a complaint in the Middle District of Tennessee against NNI and the Retirement Plan Committee of the Nortel Networks Retirement Income Plan seeking to proceed with termination of the Retirement Income Plan though this was not served against Nortel. NNI worked to voluntarily assign trusteeship of the Retirement Income Plan to the PBGC and avoid further court involvement in the termination process.
On September 8, 2009, pursuant to an agreement between the PBGC and the Retirement Plan Committee, the Retirement Income Plan was terminated with a termination date of July 17, 2009, and the PBGC was appointed trustee of the plan. The PBGC withdrew the complaint it had filed in the Middle District of Tennessee. As a result of the PBCG termination, the Businesses recorded the impacts of the settlement in accordance with FASB ASC 715-30 “Defined Benefit Plans—Pension.” A settlement gain of $12 was recorded to earnings of the Businesses in the third quarter of 2009 in reorganization items. Nortel allocated the settlement gain based on the Businesses’ projected benefit obligation relative to the total projected benefit obligation of the plans.
The PBGC has filed a proof of claim against NNI and each of the Debtors in the Chapter 11 proceedings for the unfunded benefit liabilities of the Pension Plan in the amount of $593. The PBGC has also filed unliquidated claims for contributions necessary to satisfy the minimum funding standards, a claim for insurance premiums, interest and penalties, and a claim for shortfall and amortization charges. Under ERISA, the PBGC may have the ability to impose certain claims and liens on NNI and certain NNI subsidiaries and affiliates (including liens on assets of certain Nortel entities not subject to the Creditor Protection Proceedings). Nortel has recorded a liability of $334 representing Nortel’s current best estimate of the probable claim amount in accordance with ASC 852 in relation to these claims. To the extent that information available in the future indicates a difference from the recognized amounts, the provision will be adjusted. The Businesses recorded expense of $40 representing their portion of the current best estimate of the probable claim amount in accordance with ASC 852 in relation to these claims. Nortel allocated the expense based on the Businesses’ projected benefit obligation relative to the total projected benefit obligation of the plans.
F-113
Table of Contents
Defined Contribution Plans
Certain employees of the Businesses participate in Nortel’s defined contribution plans. Based on the specific program in which the employee is enrolled, Nortel matches a percentage of the employee’s contributions up to a certain limit. In certain other defined contribution plans, Nortel contributes a fixed percentage of employees’ eligible earnings to a defined contribution plan arrangement. The aggregate cost of these investment plans was $27 and $48 for the nine months ended September 30, 2009 and the year ended December 31, 2008, respectively.
13. Warranties
Product warranties
The following summarizes the accrual for product warranties that was recorded as part of other accrued liabilities in the combined balance sheets as of September 30, 2009 and December 31, 2008:
| Nine months ended September 30, 2009 | Year ended December 31, 2008 | |||||||
Balance at the beginning of the period | $ | 49 | $ | 59 | ||||
Payments | (42 | ) | (68 | ) | ||||
Warranties issued | 41 | 75 | ||||||
Revisions | (5 | ) | (17 | ) | ||||
|
|
|
| |||||
Balance at the end of the period | $ | 43 | $ | 49 | ||||
|
|
|
| |||||
14. Share-based compensation plans
Prior to the termination of the equity-based compensation plans as described below, certain employees of the Businesses participated in Nortel’s various share-based compensation plans. For purposes of these combined financial statements, all share-based compensation plans and related costs, whether equity or cash settled, are reflected in net parent investment on the basis that prior to the termination of the equity-based compensation plans, these costs were required to be settled by Nortel.
On February 27, 2009, Nortel obtained Canadian Court approval to terminate its equity-based compensation plans (2005 SIP, 1986 Plan and 2000 Plan) and certain equity-based compensation plans assumed in prior acquisitions, including all outstanding equity under these plans (stock options, SARs, RSUs and PSUs), whether vested or unvested. Nortel sought this approval given the decreased value of NNC common shares and the administrative and associated costs of maintaining the plans to itself as well as the plan participants. As a result of the cancellation of the plans, $36 of the remaining unrecognized compensation cost for unvested awards has been recognized as compensation cost in the nine months ended September 30, 2009, in addition to expense of $4 attributable to share-based compensation cost incurred in the normal course.
Prior to 2006, Nortel granted options to employees to purchase common shares under two existing stock option plans, the 2000 Plan and the 1986 Plan. Under these two plans, options to purchase common shares could be granted to employees and, under the 2000 Plan, options could also be granted to directors of Nortel. The options under both plans entitled the holders to purchase one common share at a subscription price of not less than 100% (as defined under the applicable plan) of the market value on the effective date of the grant. Subscription prices are stated and payable in U.S. Dollars for U.S. options and in Canadian Dollars for Canadian options. Options granted prior to 2003 generally vested 33-1/3% each year over a three-year period on the anniversary date of the grant. Commencing in 2003, options granted generally vested 25% each year over a four-year period on the anniversary of the date of grant. The term of an option could not exceed ten years.
In 2005, Nortel’s shareholders approved the 2005 SIP, a share-based compensation plan, which permitted grants of stock options, including incentive stock options, SARs, RSUs and PSUs to employees of Nortel and its subsidiaries, including Enterprise and Government Solutions. Nortel generally met its obligations under the 2005
F-114
Table of Contents
SIP by issuing its common shares. On November 6, 2006, the 2005 SIP was amended and restated effective as of December 1, 2006, to adjust the number of common shares available for grant thereunder to reflect the 1 for 10 consolidation of issued and outstanding common shares. The subscription price for each share subject to an option could not be less than 100% of the market value (as defined under the 2005 SIP) of common shares on the date of the grant. Subscription prices have been stated and payable in U.S. Dollars for U.S. options and in Canadian Dollars for Canadian options. Options granted under the 2005 SIP generally vested 25% each year over a four-year period on the anniversary of the date of grant. Options granted under the 2005 SIP may not have become exercisable within the first year (except in the event of death), and in no case could the term of an option exceed ten years. All stock options granted have been classified as equity instruments based on the settlement provisions of the share-based compensation plans.
At the annual meeting of Nortel’s shareholders held on May 7, 2008 (“Meeting”), the following amendments to the 2005 SIP were approved by Nortel’s shareholders in accordance with the rules of the Toronto Stock Exchange (“TSX”) and New York Stock Exchange (“NYSE”) and the terms of the 2005 SIP: (i) an increase in the number of Nortel common shares issuable under the 2005 SIP; (ii) the addition of certain additional types of amendments to the 2005 SIP or awards under it requiring shareholder approval; and (iii) amendments to reflect current market practices with respect to blackout periods.
The tables set out below include grants made in prior periods to individual employees of the Businesses who are employed by legal entities that, commencing January 14, 2009, are accounted for by the equity method in Nortel’s consolidated financial statements. These entities are combined in these Enterprise and Government Solutions combined financial statements.
Stock Options
During the nine months ended September 30, 2009, there were no common shares issued pursuant to the exercise of stock options granted to employees of Enterprise and Government Solutions. During the nine months ended September 30, 2009, no stock options were granted to employees of Enterprise and Government Solutions under the 2005 SIP.
The following is a summary of the total number of outstanding options for Enterprise and Government Solutions employees under the 2005 SIP, the 2000 Plan, the 1986 Plan and assumed stock options plans and the maximum number of stock options available for grant under the 2005 SIP as of the following dates:
| Outstanding Options (Thousands) | Weighted- Average Exercise Price | Weighted- Average Remaining Contractual Life (In Years) | Aggregate Intrinsic Value (Thousands) | |||||||||||||
Balance at December 31, 2007 | 8,468 | $ | 69.55 | 5.9 | $ | 5,900 | ||||||||||
Options transferred out | (840 | ) | $ | 72.41 | ||||||||||||
Options transferred in | 86 | $ | 80.49 | |||||||||||||
Granted options under all stock option plans | 995 | $ | 7.97 | |||||||||||||
Options exercised | — | $ | — | — | ||||||||||||
Options forfeited | (86 | ) | $ | 22.95 | ||||||||||||
Options expired | (282 | ) | $ | 118.83 | ||||||||||||
Options cancelled | (2 | ) | $ | 6.99 | ||||||||||||
|
|
|
|
|
|
|
| |||||||||
Balance at December 31, 2008 | 8,339 | $ | 58.39 | 5.6 | $ | — | ||||||||||
Options transferred out | (340 | ) | $ | 59.70 | ||||||||||||
Options transferred in | 525 | $ | 58.13 | |||||||||||||
Granted options under all stock option plans | — | �� | $ | — | ||||||||||||
Options exercised | — | $ | — | |||||||||||||
Options forfeited | (70 | ) | $ | 16.47 | ||||||||||||
Options expired | (54 | ) | $ | 174.18 | ||||||||||||
Options cancelled | (8,400 | ) | $ | 57.49 | ||||||||||||
|
|
|
|
|
|
|
| |||||||||
Balance at September 30, 2009 | — | $ | — | — | $ | — | ||||||||||
|
|
|
|
|
|
|
| |||||||||
F-115
Table of Contents
The following tables summarize information about stock options outstanding and exercisable for Enterprise and Government Solutions’ employees as of December 31, 2008:
| Options Outstanding | ||||||||||||||||
| Number Outstanding (thousands) | Weighted- Average Remaining Contractual Life (in years) | Weighted- Average Exercise Price | Aggregate Intrinsic Value (thousands) | |||||||||||||
Range of exercise prices | ||||||||||||||||
$ 0.00 – $ 20.20 | 1,259 | 8.8 | $ | 10.24 | $ | — | ||||||||||
$ 20.21 – $ 23.90 | 1,885 | 5.5 | $ | 22.50 | $ | — | ||||||||||
$ 23.91 – $ 27.80 | 1,981 | 7.4 | $ | 26.68 | $ | — | ||||||||||
$ 27.81 – $ 36.00 | 400 | 5.2 | $ | 29.93 | $ | — | ||||||||||
$ 36.01 – $ 52.00 | 30 | 3.2 | $ | 48.63 | $ | — | ||||||||||
$ 52.01 – $ 72.00 | 1,027 | 3.0 | $ | 65.78 | $ | — | ||||||||||
$ 72.01 – $ 80.00 | 765 | 4.7 | $ | 76.75 | $ | — | ||||||||||
$ 80.01 – $120.00 | 280 | 3.9 | $ | 88.63 | $ | — | ||||||||||
$120.01 – $180.00 | 91 | 0.2 | $ | 158.28 | $ | — | ||||||||||
$180.01 – $977.65 | 621 | 1.0 | $ | 321.84 | $ | — | ||||||||||
|
|
|
|
|
|
|
| |||||||||
| 8,339 | 5.6 | $ | 58.39 | $ | — | |||||||||||
|
|
|
|
|
|
|
| |||||||||
Fully vested options and options expected to vest as of December 31, 2008 | 8,051 | 5.5 | $ | 59.90 | $ | — | ||||||||||
|
|
|
|
|
|
|
| |||||||||
| Options Exercisable | ||||||||||||||||
| Number Exercisable (thousands) | Weighted- Average Remaining Contractual Life (in years) | Weighted- Average Exercise Price | Aggregate Intrinsic Value (thousands) | |||||||||||||
Range of exercise prices | ||||||||||||||||
$ 0.00 – $ 20.20 | 128 | 7.0 | $ | 18.89 | $ | — | ||||||||||
$ 20.21 – $ 23.90 | 1,482 | 5.0 | $ | 22.85 | $ | — | ||||||||||
$ 23.91 – $ 27.80 | 982 | 6.9 | $ | 27.21 | $ | — | ||||||||||
$ 27.81 – $ 36.00 | 353 | 4.9 | $ | 29.85 | $ | — | ||||||||||
$ 36.01 – $ 52.00 | 30 | 3.2 | $ | 48.63 | $ | — | ||||||||||
$ 52.01 – $ 72.00 | 1,027 | 3.0 | $ | 65.78 | $ | — | ||||||||||
$ 72.01 – $ 80.00 | 765 | 4.7 | $ | 76.75 | $ | — | ||||||||||
$ 80.01 – $120.00 | 280 | 3.9 | $ | 88.63 | $ | — | ||||||||||
$120.01 – $180.00 | 91 | 0.2 | $ | 158.28 | $ | — | ||||||||||
$180.01 – $977.65 | 621 | 1.0 | $ | 321.84 | $ | — | ||||||||||
|
|
|
|
|
|
|
| |||||||||
| 5,759 | (a) | 4.4 | $ | 76.46 | $ | — | ||||||||||
|
|
|
|
|
|
|
| |||||||||
| (a) | Total number of exercisable options for the year ended December 31, 2008 were 5,759. |
The aggregate intrinsic value of outstanding and exercisable stock options provided in the preceding table represents the total pre-tax intrinsic value of outstanding and exercisable stock options based on Nortel’s closing share price of $0.26 as of December 31, 2008, the last trading day for Nortel’s common shares in 2008, which is assumed to be the price that would have been received by the stock option holders had all stock option holders exercised and sold their options on that date. The total number of in-the-money options exercisable as of December 31, 2008 was nil.
F-116
Table of Contents
SARs
During the year ended December 31, 2008, Nortel granted to employees of Enterprise and Government Solutions 14,146 stand-alone SARs under the 2005 SIP. As of December 31, 2008, no tandem SARs had been granted under the 2005 SIP. As of December 31, 2008, 10,483 stand-alone SARs were outstanding under the 2005 SIP. During the period ended September 30, 2009, no stand-alone SARs were granted to employees of Enterprise and Government Solutions under the 2005 SIP. As of September 30, 2009, no tandem SARs had been granted under the 2005 SIP. As of September 30, 2009, no stand-alone SARs are outstanding under the 2005 SIP.
RSUs
During the nine months ended September 30, 2009, no share based RSUs were granted to employees of Enterprise and Government Solutions under the 2005 SIP. During the nine months ended September 30, 2009, there were no Nortel common shares issued to employees of Enterprise and Government Solutions pursuant to the vesting of RSUs granted under the 2005 SIP.
The following is a summary of the total number of outstanding RSU awards granted to employees of Enterprise and Government Solutions at each of the following dates:
| RSU Awards | ||||||||||||
| Outstanding RSU Awards(c) (Thousands) | Weighted- Average Grant Date Fair Value(a) | Weighted Average Remaining Contractual Life (In Years) | ||||||||||
Balance at December 31, 2007 | 708 | $ | 25.04 | 2.1 | ||||||||
Awards transferred out | (83 | ) | $ | 25.79 | ||||||||
Awards transferred in | 4 | $ | 25.53 | |||||||||
Granted RSU awards | 1,047 | $ | 7.94 | |||||||||
Awards settled(b) | (229 | ) | $ | 25.03 | ||||||||
Awards forfeited | (43 | ) | $ | 14.43 | ||||||||
Awards cancelled | (9 | ) | $ | 8.05 | ||||||||
|
|
|
|
|
| |||||||
Balance as of December 31, 2008 | 1,395 | $ | 12.60 | 1.9 | ||||||||
Awards transferred out | (29 | ) | $ | 15.61 | ||||||||
Awards transferred in | 73 | $ | 13.09 | |||||||||
Granted RSU awards | — | $ | — | |||||||||
Awards settled(b) | — | $ | — | |||||||||
Awards forfeited | (40 | ) | $ | 11.91 | ||||||||
Awards cancelled | (1,399 | ) | $ | 12.58 | ||||||||
|
|
|
|
|
| |||||||
Balance as of September 30, 2009 | — | $ | — | — | ||||||||
|
|
|
|
|
| |||||||
| (a) | RSU awards do not have an exercise price; therefore grant date weighted-average fair value has been calculated. The grant date fair value for the RSU awards is the share price on the date of grant. |
| (b) | The total settlement date fair value of RSUs under the 2005 SIP settled during the nine months ended September 30, 2009 and the year ended December 31, 2008 were nil and $1, respectively. |
| (c) | Does not include cash-settled RSU awards granted by Nortel. |
F-117
Table of Contents
PSUs
PSU-rTSRs
During the nine months ended September 30, 2009, no share-based PSU-rTSRs were granted to employees of Enterprise and Government Solutions under the 2005 SIP. During the period ended September 30, 2009, there were no PSU-rTSRs that vested under the 2005 SIP.
The following is a summary of the total number of outstanding PSU-rTSR awards granted to employees of Enterprise and Government Solutions at each of the following dates:
| PSU-rTSR Awards | ||||||||||||
| Outstanding PSU- rTSR Awards(b) (Thousands) | Weighted- Average Grant Date Fair Value(a) | Weighted Average Remaining Contractual Life (In Years) | ||||||||||
Balance at December 31, 2007 | 108 | $ | 21.28 | 1.6 | ||||||||
Awards transferred out | (6 | ) | $ | 22.15 | ||||||||
Granted PSU-rTSR awards | 131 | $ | 6.71 | |||||||||
Awards settled | — | $ | — | |||||||||
Awards forfeited | — | $ | — | |||||||||
Awards expired | — | $ | — | |||||||||
|
|
|
|
|
| |||||||
Balance at December 31, 2008 | 233 | $ | 13.08 | 1.5 | ||||||||
Awards transferred out | — | $ | — | |||||||||
Granted PSU-rTSR awards | — | $ | — | |||||||||
Awards settled | — | $ | — | |||||||||
Awards forfeited | — | $ | — | |||||||||
Awards expired | — | $ | — | |||||||||
Awards cancelled | (233 | ) | $ | (13.08 | ) | |||||||
|
|
|
|
|
| |||||||
Balance at September 30, 2009 | — | $ | — | — | ||||||||
|
|
|
|
|
| |||||||
| (a) | PSU-rTSR awards do not have an exercise price therefore grant date weighted-average fair value has been calculated. The grant date fair value for the PSU-rTSR awards was determined using a Monte Carlo simulation model. The number of PSU-rTSR awards expected to vest is based on the grant date Monte Carlo simulation model until actual vesting results are known. |
| (b) | Does not include cash-settled PSU-rTSR awards granted by Nortel. |
F-118
Table of Contents
PSU-Management OMs
During the nine months ended September 30, 2009, no share-based PSU-Management OMs were granted to employees of Enterprise and Government Solutions under the 2005 SIP.
The following is a summary of the total number of outstanding PSU-Management OMs granted to Enterprise and Government Solutions employees at each of the following dates:
| PSU-Management OM | ||||||||||||
| Outstanding PSU- Management OM Awards (Thousands) | Weighted- Average Grant Date Fair Value | Weighted- Average Contractual Life (In Years) | ||||||||||
Balance as of December 31, 2007 | — | $ | — | — | ||||||||
Granted PSU-Management OMs Awards | 256 | $ | 7.90 | — | ||||||||
Awards settled | — | $ | — | — | ||||||||
Awards forfeited | (5 | ) | $ | 8.05 | — | |||||||
Awards expired | — | $ | — | — | ||||||||
|
|
|
|
|
| |||||||
Balance as of December 31, 2008 | 251 | $ | 7.89 | 2.0 | ||||||||
Awards transferred out | (3 | ) | $ | 8.05 | — | |||||||
Awards transferred in | 9 | $ | 8.05 | — | ||||||||
Awards forfeited | (9 | ) | $ | 8.05 | — | |||||||
Awards cancelled | (248 | ) | $ | 7.89 | — | |||||||
|
|
|
|
|
| |||||||
Balance as of September 30, 2009 | — | $ | — | — | ||||||||
|
|
|
|
|
| |||||||
Employee stock purchase plans
The ESPPs were designed to have four offering periods each year, with each offering period beginning on the first day of each calendar quarter. Eligible employees were permitted to have up to 10% of their eligible compensation deducted from their pay during each offering period to contribute towards the purchase of Nortel common shares. Nortel common shares were purchased on behalf of plan participants in the open market on either the NYSE or TSX for delivery to participating employees. The purchase price per common share to participating employees was effectively equal to 85% of the prices at which common shares were purchased on the TSX for Canadian participants and on the NYSE for all other participants on the purchase date.
The following amendments to the ESPPs were approved by Nortel’s shareholders at the Meeting: (i) an increase in the number of Nortel common shares available for purchase under the ESPPs; (ii) amendments to the ESPPs to permit participation by certain employees of Nortel, its participating subsidiaries and designated affiliate companies who previously were excluded from participating; and (iii) approval of the amended U.S. plan in order to qualify for special tax treatment under Section 423 of the United States Internal Revenue Code.
The ESPPs were terminated effective December 12, 2008. There were no further purchases of Nortel common shares under the ESPPs. Any payment deductions made for the purchase period that began on October 1, 2008 (originally scheduled to end December 31, 2008) were returned to employees, and no additional employee payroll deductions were accepted effective December 12, 2008.
Total expense associated with the ESPPs was allocated to Enterprise and Government Solutions based on active headcount of the Businesses as a percentage of total Nortel headcount. Total ESPP expense recognized in these combined financial statements was nil for the nine months ended September 30, 2009 and was $1 for the year ended December 31, 2008.
F-119
Table of Contents
Share-based compensation
Share-based compensation recorded during the nine months ended September 30, 2009 and the year ended December 31, 2008 was as follows:
| Nine months ended September 30, 2009 | Year ended December 31, 2008 | |||||||
Share-based compensation: | ||||||||
Options | $ | 16 | $ | 24 | ||||
RSUs | 12 | 9 | ||||||
PSU—rTSRs | 2 | 2 | ||||||
PSU—Management OMs | — | — | ||||||
|
|
|
| |||||
Total share-based compensation reported | $ | 30 | $ | 35 | ||||
|
|
|
| |||||
On March 29, 2005, the SEC issued SAB No. 107 (“SAB 107”), which provides the Staff’s views on a variety of matters relating to stock-based payments. SAB 107 requires stock-based compensation to be classified in the same expense line items as cash compensation.
In addition to stock-based compensation set out above, which is attributable to employees of Enterprise and Government Solutions, the Businesses recognized an allocation of stock-based compensation expense related to employees that provide services to multiple Nortel businesses of $10 and $4 for the nine months ended September 30, 2009 and December 31, 2008, respectively.
The Businesses estimate the fair value of stock options and SARs using the Black-Scholes-Merton option-pricing model, consistent with the provisions of SFAS 123R and SAB 107 which are now codified as ASC 718. The key input assumptions used to estimate the fair value of stock options and SARs include the grant price of the award, the expected term of the award, the volatility of Nortel common shares, the risk-free interest rate and Nortel’s dividend yield. The Businesses believe that the Black-Scholes-Merton option-pricing model adequately captures the substantive features of the option and SAR awards and is appropriate to calculate the fair values of the options and SARs.
The following ranges of assumptions were used in computing the fair value of stock options and SARs for accounting purposes, for the nine months ended September 30, 2009 and the year ended December 31, 2008:
| Nine months ended September 30, 2009 | Year ended December 31, 2008 | |||
Black-Scholes-Merton assumptions | ||||
Expected dividend yield | 0.00% | 0.00% | ||
Expected volatility(a) | 44.21% – 61.51% | 44.21% – 74.28% | ||
Risk-free interest rate(b) | 1.96% – 3.33% | 1.55% – 3.33% | ||
Expected term of options in years(c) | 2.64 – 4.5 | 2.64 – 4.5 | ||
Range of fair value per option granted | $2.72 – $3.78 | $0.38 – $3.78 | ||
Range of fair value per SAR granted | $.02 – $3.13 | $.002 – $3.13 |
| (a) | The expected volatility of Nortel common shares is estimated using the daily historical share prices over a period equal to the expected term. |
| (b) | The Businesses used the five-year U.S. government Treasury Note rate to approximate the four-year risk free rate. |
| (c) | The expected term of the stock options is estimated based on historical grants with similar vesting periods. |
F-120
Table of Contents
The fair value of all RSUs and PSU-Management OMs granted after January 1, 2008 was calculated using the closing share price from the NYSE on the date of grant. For RSU awards granted before January 1, 2008, the fair value is calculated using an average of the high and low share prices from the highest trading value of either the NYSE or TSX on the date of the grant. There were no PSU-Management OMs granted before January 1, 2008. The Businesses estimate the fair value of PSU-rTSR awards using a Monte Carlo simulation model. Certain assumptions used in the model include (but are not limited to) the following:
| Nine months ended September 30, 2009 | Year ended December 31, 2008 | |||
Monte Carlo Assumptions | ||||
Beta (range) | N/A | N/A | ||
Risk-free interest rate (range)(a) | 1.64% – 2.50% | 1.64% – 2.50% | ||
Historical volatility(b) | 43.96% – 46.88% | 43.96% – 46.88% |
| (a) | The risk-free interest rate used was the three-year U.S. government treasury bill rate. |
| (b) | In the prior year Beta was used as one of the Monte Carlo assumptions. In 2008, the Businesses switched to 3 year historical volatility which matches the expected term of PSUs-rTSRs. |
The total income tax benefit recognized in the statements of operations for share-based compensation awards was nil for each of the periods ended September 30, 2009 and December 31, 2008.
Cash received from exercises under all share-based payment arrangements was nil for both the nine months ended September 30, 2009 and the year ended December 31, 2008. Tax benefits realized by the Businesses related to these exercises were nil for each of the nine months ended September 30, 2009 and the year ended December 31, 2008.
15. Fair Value
Fair Value Measurements
The Businesses adopted the provisions of ASC 820 applicable to financial assets and liabilities measured at fair value on a recurring basis and to certain non-financial assets and liabilities that are measured at fair value on a recurring basis, effective January 1, 2008. ASC 820 defines fair value, establishes a consistent framework for measuring fair value and expands disclosure requirements about fair value measurements. ASC 820, among other things, requires the Businesses to maximize the use of observable inputs and minimize the use of unobservable inputs when measuring fair value.
Fair value hierarchy
ASC 820 provides a hierarchy of valuation techniques based on whether the inputs to those valuation techniques are observable or unobservable. Observable inputs reflect market data obtained from independent sources, while unobservable inputs reflect the Businesses’ assumptions with respect to how market participants would price an asset or liability. These two inputs used to measure fair value fall into the following three different levels of the fair value hierarchy:
Level 1: Quoted prices for identical instruments in active markets that are observable.
Level 2: Quoted prices for similar instruments in active markets; quoted prices for identical or similar instruments in markets that are non-active; inputs other than quoted prices that are observable and derived from or corroborated by observable market data.
Level 3: Valuations derived from valuation techniques in which one or more significant inputs are unobservable.
This hierarchy requires the use of observable market data when available.
F-121
Table of Contents
Determination of fair value
The following section describes the valuation methodologies used by the Businesses to measure different instruments at fair value, including an indication of the level in the fair value hierarchy in which each instrument is classified. Where applicable, the descriptions include the key inputs and significant assumptions used in the valuation models.
Investments
In October 2008, the Businesses entered into an agreement (“Agreement”) with the investment firm that sold NGS a portion of its auction rate securities, which have a par value of $18 at September 30, 2009. By entering into the Agreement, the Businesses (1) received the right (“Put Option”) to sell these auction rate securities back to the investment firm at par, at its sole discretion, anytime during the period from June 30, 2010 through July 2, 2012, and (2) gave the investment firm the right to purchase these auction rate securities or sell them on the Businesses’ behalf at par anytime after the execution of the Agreement through July 2, 2012. The Businesses elected to measure the Put Option under the fair value option of ASC 825, “Financial Instruments,” and recorded income of approximately $3 pre-tax, and recorded a corresponding long term investment. Simultaneously, the Businesses transferred these auction rate securities from available-for-sale to trading investment securities. As a result of this transfer, the Businesses recognized an impairment loss of approximately $3 pre-tax. The recognition of the Put Option and the impairment loss resulted in no net impact to the results of operations for the nine months ended September 30, 2009 and year ended December 31, 2008. The Businesses anticipate that any future changes in the fair value of the Put Option will be offset by the changes in the fair value of the related auction rate securities with no material net impact to the results of operations. The Put Option will continue to be measured at fair value utilizing Level 3 inputs until the earlier of its maturity or exercise.
Market valuation adjustments
The fair value of financial liabilities must include the effects of Nortel’s and the counterparty’s non-performance risk, including credit risk.
The following table presents, for each of the fair value hierarchy levels, the assets and liabilities that are measured at fair value on a recurring basis as of September 30, 2009:
| Fair Value | Level 1 | Level 2 | Level 3 | |||||||||||||
Assets | ||||||||||||||||
Cash equivalents (money market fund) | $ | 11 | $ | 11 | $ | — | $ | — | ||||||||
Treasury notes | 2 | — | 2 | — | ||||||||||||
Auction rate securities (including Put Option) | 18 | — | 18 | |||||||||||||
|
|
|
|
|
|
|
| |||||||||
Total Assets | $ | 31 | $ | 11 | $ | 2 | $ | 18 | ||||||||
|
|
|
|
|
|
|
| |||||||||
The following table presents the changes in the Level 3 fair value category for the nine months ended September 30, 2009:
| January 1, 2009 | Net Realized/Unrealized Gains (Losses) included in Earnings | Other | Purchases, Sales, Issuances and (Settlements) | Transfers in and/or (out) of Level 3 | September 30, 2009 | |||||||||||||||||||
Assets | ||||||||||||||||||||||||
Auction rate securities | $ | 19 | — | — | (1 | ) | — | $ | 18 | |||||||||||||||
|
|
|
|
|
|
|
|
|
|
|
| |||||||||||||
F-122
Table of Contents
The following table presents the changes in the Level 3 fair value category for the year ended December 31, 2008:
| January 1, 2008 | Net Realized/Unrealized Gains (Losses) included in | Purchases, Sales, Issuances and (Settlements) | Transfers in and/or (out) of Level 3 | December 31, 2008 | ||||||||||||||||||||
| Earnings | Other | |||||||||||||||||||||||
Assets | ||||||||||||||||||||||||
Auction rate securities | $ | — | — | — | 19 | — | $ | 19 | ||||||||||||||||
|
|
|
|
|
|
|
|
|
|
|
| |||||||||||||
16. Discontinued operations
On March 31, 2009, the Businesses completed the sale of certain portions of its application delivery portfolio to Radware, Ltd.,resulting in $18 of net proceeds. The assets and liabilities of the application delivery portfolio were classified as held for sale in accordance with ASC 360, “Accounting for the Impairment or Disposal of Long-Lived Assets.”
The following table summarizes the net assets and liabilities of the application delivery portfolio as of December 31, 2008:
Balance Sheets | ||||
Assets related to discontinued operations: | ||||
Accounts receivable, net | $ | 4 | ||
Inventories, net | 3 | |||
Other current assets | 1 | |||
|
| |||
Total current assets related to discontinued operations | 8 | |||
Plant and equipment, net | — | |||
|
| |||
Total assets related to discontinued operations | $ | 8 | ||
|
| |||
Liabilities related to discontinued operations: | ||||
Trade and other accounts payable | $ | 3 | ||
Other accrued liabilities | 6 | |||
|
| |||
Total liabilities related to discontinued operations | $ | 9 | ||
|
|
The following table summarizes the results of operations of the application delivery portfolio, included in discontinued operations in the combined statement of operations for the nine months ended September 30, 2009 and for the year ended December 31, 2008:
| Nine months ended September 30, 2009 | Year ended December 31, 2008 | |||||||
Statements of Operations | ||||||||
Revenues | $ | 7 | $ | 57 | ||||
Costs, expenses and other expenses, net | (6 | ) | 62 | |||||
|
|
|
| |||||
Gain (loss) from operations of the discontinued operations | 1 | (5 | ) | |||||
Income tax benefit | — | 2 | ||||||
Gain on sale of discontinued operations, net of tax | 14 | — | ||||||
|
|
|
| |||||
Net income (loss) from discontinued operations | $ | 15 | $ | (3 | ) | |||
|
|
|
| |||||
F-123
Table of Contents
17. Related party transactions
In the ordinary course of business, the Businesses engage in transactions with certain related parties. These transactions are sales and purchases of goods and services under usual trade terms and are measured at their exchange amounts.
The Businesses receive services and support functions from Nortel for the following functions among others: information technology, legal services, accounting and finance services, human resources, marketing and product support, product development, customer support, treasury, facility and other corporate and infrastructural services. The costs associated with these services generally include employee related costs, including payroll and benefit costs as well as overhead costs related to the support functions. Functional costs are charged to the Businesses based on utilization measures including, but not limited to, headcount. Where determinations based on utilization are impracticable, Nortel uses other methods and criteria such as global revenue, U.S. revenue, advertising and sales promotion spending, warehousing and delivery spending, and capital spending; that are believed to be reasonable estimates of costs attributable to the Businesses. All such amounts have been deemed to have been paid by the Businesses to Nortel in the period in which the costs were recorded. Total allocated expenses, including the employee benefits and share-based compensation for shared employees as discussed in Notes 12 and 14 and rental expense for shared assets as discussed in Note 19, recorded in these combined financial statements were as follows:
| Nine months ended September 30, 2009 | Year ended December 31, 2008 | |||||||
Cost of revenues | $ | 65 | $ | 111 | ||||
Selling, general and administrative expenses | 120 | 224 | ||||||
Research and development expenses | 39 | 70 | ||||||
Amortization of intangible assets | 1 | 1 | ||||||
Special charges | — | 61 | ||||||
Reorganization items | 108 | — | ||||||
|
|
|
| |||||
Total allocated expenses | $ | 333 | $ | 467 | ||||
|
|
|
| |||||
In addition, as discussed in Note 1, Nortel uses a centralized approach for cash management and to finance its operations. During the periods covered by these combined financial statements, cash deposits were remitted to Nortel on a regular basis and are reflected within net parent investment in invested equity in the combined balance sheets. Similarly, the Businesses’ cash disbursements were funded through Nortel’s cash accounts.
Transactions with other related parties for the nine months ended September 30, 2009 and the year ended December 31, 2008 are summarized as follows:
| Nine months ended September 30, 2009 | Year ended December 31, 2008 | |||||||
Revenues: | ||||||||
LGN(a) | $ | 6 | $ | 27 | ||||
Other | $ | — | $ | 3 | ||||
|
|
|
| |||||
Total | $ | 6 | $ | 30 | ||||
|
|
|
| |||||
| (a) | LGN is a joint venture of LG Electronics and Nortel. LGN provides telecommunications equipment and network solutions to service provider and enterprise customers in Korea and around the world. |
For purposes of these combined financial statements, accounts receivable balances due from LGN have been included in net parent investment. As of September 30, 2009 and December 31, 2008, accounts receivable from other related parties were nil and $1, respectively. As of September 30, 2009 and December 31, 2008, accounts payable to related parties were nil.
F-124
Table of Contents
The Businesses also enter into transactions with third parties jointly with other business units of Nortel. These transactions are not considered to be related party transactions and the Businesses’ share of the revenues and expenses are included in these combined financial statements.
18. Long-term debt
The following table shows the components of long-term debt of NGS as of the periods ended:
| September 30, 2009 | December 31, 2008 | |||||||
Obligations under capital leases and sale leasebacks with a weighted-average interest rate of 7.58% | $ | 28 | $ | 28 | ||||
|
|
|
| |||||
| 28 | 28 | |||||||
Less: Long-term debt within one year | (2 | ) | (1 | ) | ||||
|
|
|
| |||||
| $ | 26 | $ | 27 | |||||
|
|
|
| |||||
As of September 30, 2009, the amounts of long-term debt payable for each of the following years ending December 31 consisted of:
2009 | $ | — | ||
2010 | 2 | |||
2011 | 2 | |||
2012 | 2 | |||
2013 | 3 | |||
Thereafter | 19 | |||
|
| |||
Total long-term debt payable | $ | 28 | ||
|
|
19. Commitments, guarantees and contingencies
Bid, performance-related and other bonds
Nortel has entered into bid, performance-related and other bonds associated with various contracts related to the Businesses. Bid bonds generally have a term of less than twelve months, depending on the length of the bid period for the applicable contract. Other bonds primarily relate to warranty, rental, real estate and customs contracts. Performance-related and other bonds generally have a term consistent with the term of the underlying contract. The various contracts to which these bonds apply generally have terms ranging from one to five years. Any potential payments which might become due under these bonds would be related to the Businesses’ non-performance under the applicable contract. Historically, the Businesses have not made material payments under these types of bonds and do not anticipate that they will be required to make such payments during the pendency of the Creditor Protection Proceedings.
F-125
Table of Contents
The following table sets forth the maximum potential amount of future payments under bid, performance-related and other bonds, as of September 30, 2009 and December 31, 2008:
| September 30, 2009 | December 31, 2008 | |||||||
Bid and performance-related bonds(a) | $ | — | $ | 3 | ||||
Other bonds(b) | 1 | 1 | ||||||
|
|
|
| |||||
Total bid, performance-related and other bonds | $ | 1 | $ | 4 | ||||
|
|
|
| |||||
| (a) | Bid and performance related bonds are net of restricted cash of $2 at September 30, 2009 and nil at December 31, 2008, respectively. |
| (b) | Other bonds are net of restricted cash of nil. |
Purchase commitments
The Businesses have entered into purchase commitments with certain suppliers under which it commits to buy a minimum amount or percentage of designated products or services in exchange for price guarantees or similar concessions. In certain of these agreements, the Businesses may be required to acquire and pay for such products or services up to the prescribed minimum or forecasted purchases. As of September 30, 2009, the Businesses had aggregate purchase commitments of $3, primarily related to commitments expected to be made in 2010. In accordance with the agreements with certain of its inventory suppliers, the Businesses record a liability for firm, non-cancelable, and unconditional purchase commitments for quantities purchased in excess of future demand forecasts.
The following table sets forth the expected purchase commitments as of September 30, 2009 to be made over the next several years:
| 2009 | 2010 | 2011 | Thereafter | Total Obligations | ||||||||||||||||
Purchase commitments | $ | 1 | $ | 1 | $ | 1 | $ | — | $ | 3 | ||||||||||
|
|
|
|
|
|
|
|
|
| |||||||||||
Amounts paid by the Businesses under the above purchase commitments during the nine months ended September 30, 2009 and the year ended December 31, 2008 were $7 and $4, respectively.
Operating leases
As of September 30, 2009, the future minimum payments under direct operating leases that are specifically related to the Businesses consisted of:
2009 | $ | 2 | ||
2010 | 6 | |||
2011 | 4 | |||
2012 | 2 | |||
2013 | 1 | |||
Thereafter | — | |||
|
| |||
Total future minimum payments | $ | 15 | ||
|
|
Rental expense on operating leases that are specifically related to the Businesses for the nine months ended September 30, 2009 and the year ended December 31, 2008, net of applicable sublease income, amounted to $3 and $8, respectively. In addition, these combined financial statements reflect rental charges for the Businesses’ usage of shared Nortel assets in the amount of $92 and $166 for the nine months ended September 30, 2009 and the year ended December 31, 2008.
F-126
Table of Contents
Nortel and Microsoft Corporation Alliance
In the third quarter of 2006, Nortel and Microsoft Corporation (“Microsoft”) entered into a four-year agreement, with provisions for extension, to form a strategic alliance to jointly develop, market and sell communications solutions, which are applicable to the Businesses. This strategic alliance is substantially related to the Enterprise Solutions business product portfolio and is directed and managed by the Enterprise Solutions business. Under the agreement, Nortel and Microsoft agreed to form joint teams to collaborate on product development spanning enterprise, mobile and wireline carrier solutions. The agreement engages the companies at the technology, marketing and business levels and includes joint product development, solutions and systems integration and go-to-market initiatives. Both companies will invest resources in marketing, business development and delivery.
Microsoft will make available to Nortel up to $52 in marketing and telephony systems integration funds to be offset against marketing costs incurred by Nortel, and up to $40 in research and development funds over the initial four year term of the agreement. Payments are received by Nortel upon Nortel achieving certain mutually agreed upon performance metrics. Microsoft will recoup its payment of research and development funds by receiving payments from Nortel of 5% of revenue over a mutually agreed upon enterprise voice and application business base plan. Any research and development funds that have not been recouped must be repaid in full by Nortel to Microsoft by March 31, 2012. As of September 30, 2009, Nortel has not received any of the research and development funds from Microsoft.
Microsoft and Nortel will each retain all revenues from sales or licenses of each party’s respective software, sales or leasing of each party’s respective hardware and delivery of services to customers and partners in accordance with separate agreements with each party’s respective channel partners and/or customers.
Concentrations of risk
The Businesses perform ongoing credit evaluations of their customers and, with the exception of certain financing transactions, does not require collateral from their customers. The Businesses’ global market presence has resulted in a large number of diverse customers which reduces concentrations of credit risk.
The Businesses receive certain of their components from sole suppliers. Additionally, the Businesses rely on a limited number of contract manufacturers and suppliers to provide manufacturing services for their products. The inability of a contract manufacturer or supplier to fulfill supply requirements of the Businesses could materially impact future operating results.
Guarantees
Nortel has entered into guarantees that meet the definition of a guarantee under FASB Interpretation No. 45, “Guarantor’s Accounting and Disclosure Requirements for Guarantees, Including Indirect Guarantees of Indebtedness of Other” (“FIN 45”), which is now codified as ASC 460-10. These arrangements create two types of obligations for Nortel:
| (i) | Nortel has a non-contingent and immediate obligation to stand ready to make payments if certain future triggering events occur. For certain guarantees, a liability is recognized for the stand ready obligation at the inception of the guarantee; and |
| (ii) | Nortel has an obligation to make future payments if those certain future triggering events do occur. A liability is recognized when (a) it becomes probable that one or more future events will occur triggering the requirement to make payments under the guarantee and (b) when the payment can be reasonably estimated. |
These guarantees require it make payments (either in cash, financial instruments, NNC common shares or through the provision of services) to a third party that will be triggered as a result of changes in an underlying economic characteristic (such as interest rates or market value) that is related to an asset, liability or an equity
F-127
Table of Contents
security of the guaranteed party or a third party’s failure to perform under a specific agreement. Included within Nortel’s guarantees are agreements Nortel has periodically entered into with customers and suppliers that include intellectual property indemnification obligations that are customary in the industry. These agreements generally require Nortel to compensate the other party for certain damages and costs incurred as a result of third party intellectual property claims arising from these transactions. These types of guarantees typically have indefinite terms; however, under some agreements, Nortel has provided specific terms extending to February 2011. As of September 30, 2009, Nortel has not made any payments to settle such claims and does not expect to do so in the future. The nature of such guarantees and indemnification agreements generally prevent Nortel from making a reasonable estimate of the maximum potential amount it could be required to pay under such agreements. The carrying value of the Businesses’ liability for their obligations under Nortel’s guarantees at September 30, 2009 and December 31, 2008 is nil and nil, respectively, in these combined financial statements.
Creditor Protection Proceedings
Generally, as a result of the Creditor Protection Proceedings, as outlined in Note 2, all actions to enforce or otherwise effect payment or repayment of liabilities of any Debtor preceding the Petition Date, as well as pending litigation against any Debtor, are stayed as of the Petition Date. Absent further order of the applicable courts and subject to certain exceptions, no party may take any action to recover on pre-petition claims against any Debtor.
20. Liabilities subject to compromise
As described in Note 2, as a result of the Creditor Protection Proceedings, pre-petition liabilities may be subject to compromise or other treatment and generally, actions to enforce or otherwise effect payment of pre-petition liabilities are stayed. Although pre-petition claims are generally stayed, under the Creditor Protection Proceedings, the Debtors are permitted to undertake certain actions designed to stabilize the Debtors’ operations including, among other things, payment of employee wages and benefits, maintenance of Nortel’s cash management system, satisfaction of customer obligations, payments to suppliers for goods and services received after the Petition Date and retention of professionals. The Debtors have been paying and intend to continue to pay undisputed post-petition claims in the ordinary course of business. As further described in Note 2, under the Creditor Protection Proceedings, the Debtors have certain rights, which vary by jurisdiction, to reject, repudiate or no longer continue to perform various types of contracts or arrangements. Damages resulting from rejecting, repudiating or no longer continuing to perform a contract or arrangement are treated as general unsecured claims and will be classified as liabilities subject to compromise.
Pre-Petition Date liabilities of the Debtors that are subject to compromise are reported at the claim amounts expected to be allowed, even if they may be settled for lesser amounts. The amounts currently classified as liabilities subject to compromise may be subject to future adjustments depending on actions of the applicable courts, further developments with respect to disputed claims, determinations of the secured status of certain claims, if any, the values of any collateral securing such claims, or other events.
Liabilities subject to compromise as of September 30, 2009 consist of the following:
Trade and other accounts payable | $ | 120 | ||
Restructuring liabilities | 71 | |||
Contractual liabilities | 1 | |||
Other accrued liabilities | 6 | |||
|
| |||
Total liabilities subject to compromise | $ | 198 | ||
|
|
21. Subsequent events
The Company has evaluated subsequent events up to December 7, 2009 in accordance with ASC 855 and such events are disclosed herein.
F-128
Table of Contents
Table of Contents
PART II
INFORMATION NOT REQUIRED IN PROSPECTUS
| Item 13. | Other Expenses of Issuance and Distribution |
The following table sets forth the fees and expenses, other than the underwriting discounts and commissions, payable by us in connection with the registration of the shares of common stock hereunder. All amounts are estimates except the Securities and Exchange Commission registration fee and the FINRA filing fee.
Securities and Exchange Commission registration fee | $ | 116,100 | ||
FINRA filing fee | 75,500 | |||
Stock exchange listing fee | * | |||
Printing and engraving expenses | * | |||
Legal fees and expenses | * | |||
Accounting fees and expenses | * | |||
Transfer Agent and Registrar fees | * | |||
Miscellaneous expenses | * | |||
Total Expenses | $ | * |
| * | To be filed by amendment. |
| Item 14. | Indemnification of Directors and Officers |
Section 102(b)(7) of the DGCL enables a corporation in its original certificates of incorporation or an amendment thereto to eliminate or limit the personal liability of a director for violations of the director’s fiduciary duty, except (i) for any breach of the director’s duty of loyalty to the corporation or its stockholders, (ii) for acts or omissions not in good faith or which involve intentional misconduct or a knowing violation of law, (iii) for liability of directors for unlawful payment of dividends or unlawful stock purchase or redemptions pursuant to Section 174 of the DGCL or (iv) for any transaction from which a director derived an improper personal benefit. Our certificate of incorporation includes a provision that eliminates the personal liability of directors for monetary damages for actions taken as a director to the fullest extent authorized by the DGCL.
Section 145(a) of the DGCL provides in relevant part that a corporation may indemnify any person who was or is a party or is threatened to be made a party to any threatened, pending or completed action, suit or proceeding (other than an action by or in the right of the corporation) by reason of the fact that such person is or was a director or officer of the corporation, or is or was serving at the request of the corporation as a director or officer of another entity, against expenses (including attorneys’ fees), judgments, fines and amounts paid in settlement actually and reasonably incurred by such person in connection with such action, suit or proceeding if such person acted in good faith and in a manner such person reasonably believed to be in or not opposed to the best interests of the corporation, and, with respect to any criminal action or proceeding, had no reasonable cause to believe such person’s conduct was unlawful. The termination of any action, suit or proceeding by judgment, order, settlement, conviction or upon a plea ofnolo contendere or its equivalent, shall not, of itself, create a presumption that such person did not act in good faith and in a manner which such person reasonably believed to be in or not opposed to the best interests of the corporation, and, with respect to any criminal action or proceeding, had reasonable cause to believe that such person’s conduct was lawful.
Section 145(b) of the DGCL provides in relevant part that a corporation may indemnify any person who was or is a party or is threatened to be made a party to any threatened, pending or completed action or suit by or in the right of the corporation to procure a judgment in its favor by reason of the fact that the person is or was a director or officer of the corporation, or is or was serving at the request of the corporation as a director or officer of another entity, against expenses (including attorneys’ fees) actually and reasonably incurred by such person in connection with the defense or settlement of such action or suit if the person acted in good faith and in a manner the person reasonably believed to be in or not opposed to the best interests of the corporation and except that no
II-1
Table of Contents
indemnification shall be made in respect of any claim, issue or matter as to which such person shall have been adjudged to be liable to the corporation unless and only to the extent that the Court of Chancery or the court in which such action or suit was brought shall determine upon application that, despite the adjudication of liability but in view of all the circumstances of the case, such person is fairly and reasonably entitled to indemnity for such expenses which the Court of Chancery or such other court shall deem proper.
Our certificate of incorporation that will be in effect upon the closing of this offering will provide that we will indemnify our directors and officers to the fullest extent permitted by law. Our certificate of incorporation also will provide that the indemnification and advancement of expenses provided by, or granted pursuant to the certificate of incorporation, are not exclusive of any other rights to which those seeking indemnification or advancement of expenses may be entitled under any bylaw, agreement, vote of stockholders or otherwise. Section 145(f) of the DGCL further provides that a right to indemnification or to advancement of expenses arising under a provision of the certificate of incorporation shall not be eliminated or impaired by an amendment to such provision after the occurrence of the act or omission which is the subject of the civil, criminal, administrative or investigative action, suit or proceeding for which indemnification or advancement of expenses is sought.
We have also entered into indemnification agreements with certain of our directors and officers. Such agreements generally provide for indemnification by reason of being our director or officer, as the case may be. These agreements are in addition to the indemnification provided by our charters and bylaws.
We have also obtained officers’ and directors’ liability insurance that insures against liabilities that officers and directors of the registrant may, in such capacities, incur. Section 145(g) of the DGCL provides that a corporation shall have power to purchase and maintain insurance on behalf of any person who is or was a director or officer of the corporation, or is or was serving at the request of the corporation as a director or officer of another entity, against any liability asserted against such person and incurred by such person in any such capacity, or arising out of such person’s status as such, whether or not the corporation would have the power to indemnify such person against such liability under that section.
| Item 15. | Recent Sales of Unregistered Securities |
Equity Securities
In connection with the closing of the Merger, on October 26, 2007, we issued 1,592,970 Continuation Options with an exercise price of $1.25 per share, and 1,331,155 continuation units resulting from the rollover of certain equity awards. For more information on continuation options and continuation units issued in connection with the Merger, see “Executive Compensation—Elements of Executive Officer Compensation—Long-Term Incentives.” Of the continuation options issued on the closing of the Merger, options representing shares of 1,037,609 and 125,600 shares were exercised in fiscal years 2009 and 2010, respectively, resulting in the issuance of common stock representing 380,347 and 42,026 shares, during each of fiscal years 2009 and 2010, respectively. In fiscal year 2008, continuation units representing 358,814 shares were cancelled. The continuation options, continuation units and net shares were issued without registration in reliance on the exemptions afforded by Section 4(2) of the Securities Act and pursuant to Rule 506 of Regulation D promulgated under the Securities Act.
During the year ended September 30, 2008, we granted to certain eligible participants 110,000 RSUs and options to purchase 39,185,000 shares of common shares under the 2007 Plan. The exercise price for each of these options was $5.00 per share. During the year ended September 30, 2008, options representing 8,570,000 shares were cancelled. The restricted stock units and options were issued without registration in reliance on the exemption afforded by Section 4(2) of the Securities Act, as a transaction by an issuer not involving a public offering, or Rule 701 promulgated under Section 3(b) of the Securities Act, as a transaction pursuant to a compensatory benefit plan.
II-2
Table of Contents
During the year ended September 30, 2009, we granted to certain eligible participants 730,789 restricted stock units and options to purchase 12,555,000 common shares under the 2007 Plan. The exercise price for each of these options was $3.80 per share. During the year ended September 30, 2009 options representing 11,874,469 shares were cancelled. The restricted stock units and options were issued without registration in reliance on the exemption afforded by Section 4(2) of the Securities Act, as a transaction by an issuer not involving a public offering, or Rule 701 promulgated under Section 3(b) of the Securities Act, as a transaction pursuant to a compensatory benefit plan.
Following the completion of fiscal year 2009, we extended an offer to our outstanding stock option holders to exchange their existing stock options having an exercise price equal to or greater than $3.80 per share for new stock options in a one-for-one option exchange. The new “replacement” stock options were awarded on November 17, 2009 (“replacement option date of grant”) following the completion of the exchange offer, have an exercise price of $3.00 per share, which was the fair market value of a share of our common stock on the replacement option date of grant, and have new vesting provisions. In aggregate there were 30,890,000 stock options eligible for exchange, for which 28,595,000 were validly tendered in the offer. No consideration was paid to the registrant by any recipient. The replacement stock options were issued without registration in reliance on the exemptions afforded by Section 3(a)(9) of the Securities Act, as an exchange by the issuer with its existing security holders without commission.
The purchase price for the NES acquisition was funded, in part, with the issuance on December 18, 2009 of (a) warrants to acquire 100,000,000 shares of our common stock at a price of $3.25 per share, which warrants are exercisable at any time prior to December 18, 2019 at an exercise price of $3.25 per share, and (b) 125,000 shares of our Series A Preferred Stock. The issuance of warrants and Series A Preferred Stock was consummated without registration in reliance on the exemption afforded by Section 4(2) of the Securities Act as a transaction by an issuer not involving a public offering. All of the shares of our Series A Preferred Stock will be redeemed with the proceeds of this offering.
During the year ended September 30, 2010, we granted to certain eligible participants 495,000 restricted stock units and options to purchase 17,925,000 common shares under the 2007 Plan, excluding options granted in conjunction with the exchange offer noted above. The exercise price for each of these options was $3.00 per share. During the year ended September 30, 2010 restricted stock units representing 15,000 shares, and options representing 5,086,487 shares were cancelled, exclusive of the options cancelled in the exchange offer. The restricted stock units and options were issued without registration in reliance on the exemption afforded by Section 4(2) of the Securities Act, as a transaction by an issuer not involving a public offering, or Rule 701 promulgated under Section 3(b) of the Securities Act, as a transaction pursuant to a compensatory benefit plan.
During the year ended September 30, 2011, we granted to certain eligible participants 305,000 restricted stock units and options to purchase 6,870,000 common shares under the 2007 Plan. Options granted prior to May 2011 have an exercise price of $3.00 per share and options granted subsequent to May 2011 have an exercise price or $4.40 per share. During the year ended September 30, 2011 restricted stock units representing 65,789 shares, and options representing 7,353,528 shares were cancelled. The restricted stock units and options were issued without registration in reliance on the exemption afforded by Section 4(2) of the Securities Act, as a transaction by an issuer not involving a public offering, or Rule 701 promulgated under Section 3(b) of the Securities Act, as a transaction pursuant to a compensatory benefit plan.
With regard to the foregoing, to the extent an individual acquires shares of our common stock upon exercise of a stock option or vesting of an RSU, those shares are subject to the restrictions on transfer and other provisions contained in a stockholders’ agreement.
Debt Securities
On October 24, 2008, Avaya Inc. issued $700 million of senior unsecured cash-pay notes and $750 million of senior unsecured PIK toggle notes upon conversion of the senior cash-pay loans and the senior PIK toggle
II-3
Table of Contents
loans. The issuance of the senior unsecured cash-pay notes and senior unsecured PIK toggle notes was conducted pursuant to the exemptions afforded by Section 4(2) of the Securities Act, as a transaction by an issuer not involving a public offering. The interest rate for the cash-pay notes is fixed at 9.75% and the interest rates for the cash interest and PIK interest portions of the PIK-toggle notes are fixed at 10.125% and 10.875%, respectively. In connection with the conversion of the senior cash-pay loans and the senior PIK toggle loans, Avaya Inc. and the guarantors of the outstanding notes entered into a registration rights agreement in which they agreed, among other things, to file a registration statement to exchange the notes for similar notes registered under the Securities Act. The registration statement on Form S-4 registering such notes was filed with the Securities and Exchange Commission on December 23, 2009 and declared effective on January 14, 2010.
On February 11, 2011, Avaya Inc. issued $1,009 million aggregate principal amount of its 7.00% Senior Secured Notes due 2019 at an issue price of 100% of the principal amount of the notes, pursuant to the exemptions afforded by Section 4(2) of the Securities Act, as a transaction by an issuer not involving a public offering, to “qualified institutional buyers” in the United States as defined in Rule 144A of the Securities Act, and outside the United States pursuant to Regulation S under the Securities Act. These notes mature on April 1, 2019 and bear interest at a rate of 7.00% per annum, payable semi-annually on April 1 and October 1 of each year, commencing on October 1, 2011. All of the proceeds from the offering were used to repay term B-2 loans outstanding under Avaya Inc.’s senior secured credit facility.
| Item 16. | Exhibits and Financial Statement Schedules |
(a) Exhibits
Exhibit | Exhibit Title | |||
| 1.1 | Form of Underwriting Agreement* | |||
| 3.1 | Amended and Restated Certificate of Incorporation of Avaya Holdings Corp. (to be effective upon completion of this offering)* | |||
| 3.2 | Amended and Restated By-Laws of Avaya Holdings Corp. (to be effective upon completion of this offering)* | |||
| 4.1 | Exchange Note Indenture, dated as of October 24, 2008, by and among Avaya Inc., the Guarantors named therein and The Bank of New York Mellon, as Trustee (Incorporated by reference to Exhibit 4.1 to Avaya Inc.’s Registration Statement on Form S-4 filed with the SEC on December 23, 2009) | |||
| 4.2 | Supplemental Indenture, dated as of February 19, 2010, by and among Avaya Government Solutions Inc., Integrated Information Technology Corporation, AC Technologies, Inc. and The Bank of New York Mellon, as Trustee (Incorporated by reference to Exhibit 4.5 to Avaya Inc.’s Quarterly Report on Form 10-Q filed with the SEC on May 13, 2010) | |||
| 4.3 | Indenture dated February 11, 2011 by and among Avaya Inc., the Guarantors party thereto and The Bank of New York Mellon Trust Company, N.A., as Trustee (Incorporated by reference to Exhibit 4.1 to Avaya Inc.’s Quarterly Report on Form 10-Q filed with the SEC on February 14, 2011) | |||
| 4.4 | Pledge and Security Agreement dated February 11, 2011 by and among Avaya Inc., certain subsidiaries of Avaya Inc. from time to time party thereto and The Bank of New York Mellon Trust Company, N.A., as Collateral Agent (Incorporated by reference to Exhibit 4.3 to Avaya Inc.’s Quarterly Report on Form 10-Q filed with the SEC on February 14, 2011) | |||
| 4.5 | Form of 9.75% Senior Unsecured Notes due 2015 (included in the Exchange Note Indenture filed as Exhibit 4.1) | |||
| 4.6 | Form of 10.125%/10.875% Senior PIK Toggle Unsecured Notes due 2015 (included in the Exchange Note Indenture filed as Exhibit 4.1) | |||
II-4
Table of Contents
Exhibit | Exhibit Title | |||
| 4.7 | Form of 7% Senior Secured Notes due 2019 (Incorporated by reference to Exhibit 4.2 to Avaya Inc.’s Quarterly Report on Form 10-Q filed with the SEC on February 14, 2011) | |||
| 4.8 | Specimen Common Stock Certificate of Avaya Holdings Corp.* | |||
| 4.9 | Certificate of Designations of Series A Preferred Stock of Avaya Holdings Corp.** | |||
| 4.10 | Form of Warrant, dated December 18, 2009** | |||
| 4.11 | Amended and Restated Registration Rights Agreement dated as of December 18, 2009, by and among Sierra Holdings Corp., TPG Partners V, L.P., TPG FOF V-A, L.P., TPG FOF V-B, L.P., Silver Lake Partners II, L.P., Silver Lake Technology Investors II, L.P., Silver Lake Partners III, L.P., Silver Lake Technology Investors III, L.P., Sierra Co-Invest, LLC and Sierra Co-Invest II, LLC** | |||
| 4.12 | Senior Manager Registration and Preemptive Rights Agreement, dated as of October 26, 2007, by and among Sierra Holdings Corp. and the individual members of management listed on Schedule A thereto** | |||
| 5.1 | Opinion of Ropes & Gray LLP* | |||
| 10.1 | Credit Agreement, dated as of October 26, 2007, by and among Avaya Inc., as Borrower, Sierra Holdings Corp., Citibank, N.A., as Administrative Agent, Swing Line Lender and L/C Issuer, the other lenders party thereto, Morgan Stanley Senior Funding, Inc., as Syndication Agent, JPMorgan Chase Bank, N.A., as Documentation Agent, and Citigroup Global Markets Inc., Morgan Stanley Senior Funding, Inc., and J.P. Morgan Securities Inc., as Joint Lead Arrangers and Joint Bookrunners (Incorporated by reference to Exhibit 10.1 to Avaya Inc.’s Registration Statement on Form S-4 filed with the SEC on December 23, 2009) | |||
| 10.2 | Amendment No. 1 to Credit Agreement, dated as of December 18, 2009, among Avaya Inc., the lenders party thereto and Citibank, N.A., as Administrative Agent (Incorporated by reference to Exhibit 10.5 to Avaya Inc.’s Registration Statement on Form S-4 filed with the SEC on December 23, 2009) | |||
| 10.3 | Amendment No. 2 to Credit Agreement dated February 11, 2011, by and among Avaya Inc., Citibank, N.A., as Administrative Agent, and each lender party thereto, amending Credit Agreement, dated as of October 26, 2007, by and among Avaya Inc., Sierra Holdings Corp., Citibank, N.A., as Administrative Agent, Swing Line Lender and L/C Issuer and each lender party thereto (Incorporated by reference to Exhibit 10.2 to Avaya Inc.’s Quarterly Report on Form 10-Q filed with the SEC on February 14, 2011) | |||
| 10.4 | Amended and Restated Credit Agreement dated February 11, 2011, by and among Avaya Inc., Sierra Holdings Corp., Citibank N.A., as Administrative Agent, Swing Line Lender and L/C Issuer, and each lender from time to time party thereto (Incorporated by reference to Exhibit 10.3 to Avaya Inc.’s Quarterly Report on Form 10-Q filed with the SEC on February 14, 2011) | |||
| 10.5 | Pledge and Security Agreement, dated as of October 26, 2007, by and among Avaya Inc., as Borrower, Sierra Holdings Corp., certain subsidiaries of Avaya Inc. identified therein and Citibank, N.A., as Administrative Agent (Incorporated by reference to Exhibit 10.2 to Avaya Inc.’s Registration Statement on Form S-4 filed with the SEC on December 23, 2009) | |||
| 10.6 | Guaranty, dated as of October 26, 2007, by and among Sierra Holdings Corp., certain subsidiaries of Avaya Inc. identified therein and Citibank, N.A., as Administrative Agent (Incorporated by reference to Exhibit 10.3 to Avaya Inc.’s Registration Statement on Form S-4 filed with the SEC on December 23, 2009) | |||
II-5
Table of Contents
Exhibit | Exhibit Title | |||
| 10.7 | Credit Agreement, dated as of October 26, 2007, by and among Avaya Inc., as Parent Borrower, the several subsidiary borrowers party thereto, Sierra Holdings Corp., Citicorp USA, Inc., as Administrative Agent and Swing Line Lender, Citibank, N.A., as L/C Issuer, the other lenders party thereto, Morgan Stanley Senior Funding, Inc., as Syndication Agent, JPMorgan Chase Bank, N.A., as Documentation Agent, and Citigroup Global Markets Inc., Morgan Stanley Senior Funding, Inc. and J.P. Morgan Securities Inc., as Joint Lead Arrangers and Joint Bookrunners (Incorporated by reference to Exhibit 10.4 to Avaya Inc.’s Registration Statement on Form S-4 filed with the SEC on December 23, 2009) | |||
| 10.8 | Pledge and Security Agreement, dated as of October 26, 2007, by and among Avaya Inc., as Parent Borrower, Sierra Holdings Corp., certain subsidiaries of Avaya Inc. identified therein, as Subsidiary Borrowers and Citicorp USA, Inc., as Administrative Agent (Incorporated by reference to Exhibit 10.6 to Avaya Inc.’s Registration Statement on Form S-4 filed with the SEC on December 23, 2009) | |||
| 10.9 | Guaranty, dated as of October 26, 2007, by and among Sierra Holdings Corp., certain subsidiaries of Avaya Inc. from time to time party thereto and Citicorp USA, Inc., as Administrative Agent (Incorporated by reference to Exhibit 10.7 to Avaya Inc.’s Registration Statement on Form S-4 filed with the SEC on December 23, 2009) | |||
| 10.10 | Executive Employment Agreement, dated as of December 22, 2008, by and among Kevin J. Kennedy, Avaya Inc. and Sierra Holdings Corp. (Incorporated by reference to Exhibit 10.8 to Avaya Inc.’s Registration Statement on Form S-4 filed with the SEC on December 23, 2009) | |||
| 10.11 | Amendment to Executive Employment Agreement, dated October 12, 2009 among Kevin J. Kennedy, Avaya Inc. and Sierra Holdings Corp. (Incorporated by reference to Exhibit 10.9 to Avaya Inc.’s Registration Statement on Form S-4 filed with the SEC on December 23, 2009) | |||
| 10.12 | Avaya Inc. Involuntary Separation Plan for Senior Officers, as amended (Incorporated by reference to Exhibit 10.10 to Avaya Inc.’s Registration Statement on Form S-4 filed with the SEC on December 23, 2009) | |||
| 10.13 | Form of Indemnity Agreement between Sierra Holdings Corp., Avaya Inc. and certain directors of the Registrant (Incorporated by reference to Exhibit 10.11 to Avaya Inc.’s Registration Statement on Form S-4 filed with the SEC on December 23, 2009) | |||
| 10.14 | Form of Indemnity Agreement between Sierra Holdings Corp., Avaya Inc. and certain officers of the Registrant (Incorporated by reference to Exhibit 10.12 to Avaya Inc.’s Registration Statement on Form S-4 filed with the SEC on December 23, 2009) | |||
| 10.15 | Avaya Inc. Savings Restoration Plan, as amended (Incorporated by reference to Exhibit 10.13 to Avaya Inc.’s Registration Statement on Form S-4 filed with the SEC on December 23, 2009) | |||
| 10.16 | Avaya Inc. Short Term Incentive Plan (Incorporated by reference to Exhibit 10.14 to Avaya Inc.’s Registration Statement on Form S-4 filed with the SEC on December 23, 2009) | |||
| 10.17 | Management Services Agreement, dated as of October 2, 2007, by and among Sierra Holdings Corp., Avaya Inc. (as successor by merger to Sierra Merger Corp.), TPG Capital, L.P. and Silver Lake Management Company III, L.L.C. (Incorporated by reference to Exhibit 10.15 to Avaya Inc.’s Registration Statement on Form S-4 filed with the SEC on December 23, 2009) | |||
| 10.18 | Retention agreement dated February 3, 2009 between Avaya Inc. and James Chirico (Incorporated by reference to Exhibit 10.16 to Avaya Inc.’s Registration Statement on Form S-4 filed with the SEC on December 23, 2009) | |||
| 10.19 | Separation Agreement and General Release, dated as of July 1, 2010, between Avaya Inc. and Todd Abbott (Incorporated by reference to Exhibit 10.1 to Avaya Inc.’s Current Report on Form 8-K filed with the SEC on July 1, 2010) | |||
II-6
Table of Contents
Exhibit | Exhibit Title | |||
| 10.20 | Sierra Holdings Corp. Amended and Restated 2007 Equity Incentive Plan (Incorporated by reference to Exhibit 10.2 to Avaya Inc.’s Current Report on Form 8-K filed with the SEC on July 1, 2010) | |||
| 10.21 | Form of Sierra Holdings Corp. Amended and Restated 2007 Equity Incentive Plan Restricted Stock Unit Award Agreement (Incorporated by reference to Exhibit 10.3 to Avaya Inc.’s Current Report on Form 8-K filed with the SEC on July 1, 2010) | |||
| 10.22 | Form of Sierra Holdings Corp. Amended and Restated 2007 Equity Incentive Plan Stock Option Award Agreement for Senior Vice Presidents and Vice Presidents (Incorporated by reference to Exhibit 10.4 to Avaya Inc.’s Current Report on Form 8-K filed with the SEC on July 1, 2010) | |||
| 10.23 | Avaya Inc. Executive Committee 2011-2013 Performance Recognition Plan (Incorporated by reference to Exhibit 10.1 to Avaya Inc.’s Quarterly Report on Form 10-Q filed with the SEC on May 12, 2011) | |||
| 10.24 | Form of Award Agreement for the Avaya Inc. Executive Committee 2011-2013 Performance Recognition Plan (Incorporated by reference to Exhibit 10.2 to Avaya Inc.’s Quarterly Report on Form 10-Q filed with the SEC on May 12, 2011) | |||
| 10.25 | Management Stockholders’ Agreement, dated as of October 26, 2007, by and among Sierra Holdings Corp., the Majority Stockholders (as defined therein) and the individuals listed on Schedule A thereto** | |||
| 10.26 | Form of Amended and Restated Stockholders’ Agreement, by and among TPG Partners V, L.P., TPG FOF V-A, L.P., TPG FOF V-B, L.P., Silver Lake Partners II, L.P., Silver Lake Technology Investors II, L.P., Silver Lake Partners III, L.P., Silver Lake Technology Investors III, L.P., Sierra Co-Invest, LLC, Sierra Co-Invest II, LLC and Avaya Holdings Corp.* | |||
| 10.27 | Amendment No. 3 to Credit Agreement dated August 8, 2011, by and among Avaya Inc., Citibank, N.A., as Administrative Agent, and each lender party thereto, amending the Amended and Restated Credit Agreement, dated as of February 11, 2011, by and among Avaya Inc., Avaya Holdings Corp., Citibank, N.A., as Administrative Agent, Swing Line Lender and L/C Issuer and each lender party thereto (Incorporated by reference to Exhibit 10.1 to Avaya Inc.’s Quarterly Report on Form 10-Q filed with the SEC on August 11, 2011) | |||
| 10.28 | Amendment No. 1 to Credit Agreement, dated as of August 8, 2011, by and among Avaya Inc., the several subsidiary borrowers party thereto, Citicorp USA, Inc., as Administrative Agent and the lenders party thereto, amending the Credit Agreement, dated as of October 26, 2007, by and among Avaya Inc., the several subsidiary borrowers party thereto, Avaya Holdings Corp., Citicorp USA, Inc., as Administrative Agent and the lenders party thereto (Incorporated by reference to Exhibit 10.2 to Avaya Inc.’s Quarterly Report on Form 10-Q filed with the SEC on August 11, 2011) | |||
| 10.29 | Avaya Holdings Corp. 2011 Equity Incentive Plan* | |||
| 10.30 | Avaya Holdings Corp. 2011 Employee Stock Purchase Plan* | |||
| 10.31 | Form of Award Agreement for 2012 Sales Incentive Program (Incorporated by reference to Exhibit 10.28 to Avaya Inc.’s Annual Report on Form 10-K filed with the SEC on December 9, 2011) | |||
| 21.1 | List of Subsidiaries | |||
| 23.1 | Consent of PricewaterhouseCoopers LLP | |||
| 23.2 | Consent of KPMG LLP | |||
| 23.3 | Consent of Ropes & Gray LLP (included in the opinion filed as Exhibit 5.1)* | |||
| 24.1 | Powers of Attorney (included in the signature pages of this Registration Statement)** | |||
| * | To be filed by amendment. |
| ** | Previously filed |
(b) Financial Statement Schedules
All schedules are omitted because the required information is presented within consolidated financial statements included in the prospectus that is part of this registration statement.
II-7
Table of Contents
| Item 17. | Undertakings |
(a) The undersigned registrant hereby undertakes to provide to the underwriter at the closing specified in the underwriting agreements certificates in such denominations and registered in such names as required by the underwriter to permit prompt delivery to each purchaser.
(b) Insofar as indemnification for liabilities arising under the Securities Act of 1933 may be permitted to directors, officers and controlling persons of the registrant pursuant to the foregoing provisions, or otherwise, the registrant has been advised that in the opinion of the Securities and Exchange Commission such indemnification is against public policy as expressed in the Act and is, therefore, unenforceable. In the event that a claim for indemnification against such liabilities (other than the payment by the registrant of expenses incurred or paid by a director, officer or controlling person of the registrant in the successful defense of any action, suit or proceeding) is asserted by such director, officer or controlling person in connection with the securities being registered, the registrant will, unless in the opinion of its counsel the matter has been settled by controlling precedent, submit to a court of appropriate jurisdiction the question whether such indemnification by it is against public policy as expressed in the Act and will be governed by the final adjudication of such issue.
(c) The undersigned registrant hereby undertakes that:
1. For purposes of determining any liability under the Securities Act of 1933, the information omitted from the form of prospectus filed as part of this registration statement in reliance upon Rule 430A and contained in a form of prospectus filed by the registrant pursuant to Rule 424(b)(1) or (4) or 497(h) under the Securities Act shall be deemed to be part of this registration statement as of the time it was declared effective.
2. For the purpose of determining any liability under the Securities Act of 1933, each post-effective amendment that contains a form of prospectus shall be deemed to be a new registration statement relating to the securities offered therein, and the offering of such securities at that time shall be deemed to be the initial bona fide offering thereof.
II-8
Table of Contents
SIGNATURES
Pursuant to the requirements of the Securities Act of 1933, the registrant has duly caused this registration statement to be signed on its behalf by the undersigned, thereunto duly authorized in the City of Basking Ridge, State of New Jersey, on the 22nd day of December, 2011.
| Avaya Holdings Corp. | ||||
| By: | /s/ ANTHONY J. MASSETTI | |||
| Name: | Anthony J. Massetti | |||
| Title: | Senior Vice President and Chief Financial Officer | |||
Pursuant to the requirements of the Securities Act of 1933, this registration statement has been signed by the following persons in the capacities and on the dates indicated.
Signature | Title | Date | ||
* Kevin J. Kennedy | Director, President and Chief Executive Officer (Principal Executive Officer) | December 22, 2011 | ||
/s/ ANTHONY J. MASSETTI Anthony J. Massetti | Senior Vice President and Chief Financial Officer (Principal Financial Officer) | December 22, 2011 | ||
* Kevin J. MacKay | Vice President, Controller and Chief Accounting Officer (Principal Accounting Officer) | December 22, 2011 | ||
* Eugene J. Frantz | Director | December 22, 2011 | ||
* Charles H. Giancarlo | Chairman of the Board of Directors | December 22, 2011 | ||
* Afshin Mohebbi | Director | December 22, 2011 | ||
* Greg K. Mondre | Director | December 22, 2011 | ||
* Kevin B. Rollins | Director | December 22, 2011 | ||
* David J. Roux | Director | December 22, 2011 | ||
*By: | /s/ Anthony J. Massetti | |
Anthony J. Massetti Attorney-in-Fact |
II-9
Table of Contents
EXHIBIT INDEX
Exhibit | Exhibit Title | |||
| 1.1 | Form of Underwriting Agreement* | |||
| 3.1 | Amended and Restated Certificate of Incorporation of Avaya Holdings Corp. (to be effective upon completion of this offering)* | |||
| 3.2 | Amended and Restated By-Laws of Avaya Holdings Corp. (to be effective upon completion of this offering)* | |||
| 4.1 | Exchange Note Indenture, dated as of October 24, 2008, by and among Avaya Inc., the Guarantors named therein and The Bank of New York Mellon, as Trustee (Incorporated by reference to Exhibit 4.1 to Avaya Inc.’s Registration Statement on Form S-4 filed with the SEC on December 23, 2009) | |||
| 4.2 | Supplemental Indenture, dated as of February 19, 2010, by and among Avaya Government Solutions Inc., Integrated Information Technology Corporation, AC Technologies, Inc. and The Bank of New York Mellon, as Trustee (Incorporated by reference to Exhibit 4.5 to Avaya Inc.’s Quarterly Report on Form 10-Q filed with the SEC on May 13, 2010) | |||
| 4.3 | Indenture dated February 11, 2011 by and among Avaya Inc., the Guarantors party thereto and The Bank of New York Mellon Trust Company, N.A., as Trustee (Incorporated by reference to Exhibit 4.1 to Avaya Inc.’s Quarterly Report on Form 10-Q filed with the SEC on February 14, 2011) | |||
| 4.4 | Pledge and Security Agreement dated February 11, 2011 by and among Avaya Inc., certain subsidiaries of Avaya Inc. from time to time party thereto and The Bank of New York Mellon Trust Company, N.A., as Collateral Agent (Incorporated by reference to Exhibit 4.3 to Avaya Inc.’s Quarterly Report on Form 10-Q filed with the SEC on February 14, 2011) | |||
| 4.5 | Form of 9.75% Senior Unsecured Notes due 2015 (included in the Exchange Note Indenture filed as Exhibit 4.1) | |||
| 4.6 | Form of 10.125%/10.875% Senior PIK Toggle Unsecured Notes due 2015 (included in the Exchange Note Indenture filed as Exhibit 4.1) | |||
| 4.7 | Form of 7% Senior Secured Note due 2019 (Incorporated by reference to Exhibit 4.2 to Avaya Inc.’s Quarterly Report on Form 10-Q filed with the SEC on February 14, 2011) | |||
| 4.8 | Specimen Common Stock Certificate of Avaya Holdings Corp.* | |||
| 4.9 | Certificate of Designations of Series A Preferred Stock of Avaya Holdings Corp.** | |||
| 4.10 | Form of Warrant, dated December 18, 2009** | |||
| 4.11 | Amended and Restated Registration Rights Agreement dated as of December 18, 2009, by and among Sierra Holdings Corp., TPG Partners V, L.P., TPG FOF V-A, L.P., TPG FOF V-B, L.P., Silver Lake Partners II, L.P., Silver Lake Technology Investors II, L.P., Silver Lake Partners III, L.P., Silver Lake Technology Investors III, L.P., Sierra Co-Invest, LLC and Sierra Co-Invest II, LLC** | |||
| 4.12 | Senior Manager Registration and Preemptive Rights Agreement, dated as of October 26, 2007, by and among Sierra Holdings Corp. and the individual members of management listed on Schedule A thereto** | |||
| 5.1 | Opinion of Ropes & Gray LLP* | |||
II-10
Table of Contents
Exhibit | Exhibit Title | |||
| 10.1 | Credit Agreement, dated as of October 26, 2007, by and among Avaya Inc., as Borrower, Sierra Holdings Corp., Citibank, N.A., as Administrative Agent, Swing Line Lender and L/C Issuer, the other lenders party thereto, Morgan Stanley Senior Funding, Inc., as Syndication Agent, JPMorgan Chase Bank, N.A., as Documentation Agent, and Citigroup Global Markets Inc., Morgan Stanley Senior Funding, Inc., and J.P. Morgan Securities Inc., as Joint Lead Arrangers and Joint Bookrunners (Incorporated by reference to Exhibit 10.1 to Avaya Inc.’s Registration Statement on Form S-4 filed with the SEC on December 23, 2009) | |||
| 10.2 | Amendment No. 1 to Credit Agreement, dated as of December 18, 2009, among Avaya Inc., the lenders party thereto and Citibank, N.A., as Administrative Agent (Incorporated by reference to Exhibit 10.5 to Avaya Inc.’s Registration Statement on Form S-4 filed with the SEC on December 23, 2009) | |||
| 10.3 | Amendment No. 2 to Credit Agreement dated February 11, 2011, by and among Avaya Inc., Citibank, N.A., as Administrative Agent, and each lender party thereto, amending Credit Agreement, dated as of October 26, 2007, by and among Avaya Inc., Sierra Holdings Corp., Citibank, N.A., as Administrative Agent, Swing Line Lender and L/C Issuer and each lender party thereto (Incorporated by reference to Exhibit 10.2 to Avaya Inc.’s Quarterly Report on Form 10-Q filed with the SEC on February 14, 2011) | |||
| 10.4 | Amended and Restated Credit Agreement dated February 11, 2011, by and among Avaya Inc., Sierra Holdings Corp., Citibank N.A., as Administrative Agent, Swing Line Lender and L/C Issuer, and each lender from time to time party thereto (Incorporated by reference to Exhibit 10.3 to Avaya Inc.’s Quarterly Report on Form 10-Q filed with the SEC on February 14, 2011) | |||
| 10.5 | Pledge and Security Agreement, dated as of October 26, 2007, by and among Avaya Inc., as Borrower, Sierra Holdings Corp., certain subsidiaries of Avaya Inc. identified therein and Citibank, N.A., as Administrative Agent (Incorporated by reference to Exhibit 10.2 to Avaya Inc.’s Registration Statement on Form S-4 filed with the SEC on December 23, 2009) | |||
| 10.6 | Guaranty, dated as of October 26, 2007, by and among Sierra Holdings Corp., certain subsidiaries of Avaya Inc. identified therein and Citibank, N.A., as Administrative Agent (Incorporated by reference to Exhibit 10.3 to Avaya Inc.’s Registration Statement on Form S-4 filed with the SEC on December 23, 2009) | |||
| 10.7 | Credit Agreement, dated as of October 26, 2007, by and among Avaya Inc., as Parent Borrower, the several subsidiary borrowers party thereto, Sierra Holdings Corp., Citicorp USA, Inc., as Administrative Agent and Swing Line Lender, Citibank, N.A., as L/C Issuer, the other lenders party thereto, Morgan Stanley Senior Funding, Inc., as Syndication Agent, JPMorgan Chase Bank, N.A., as Documentation Agent, and Citigroup Global Markets Inc., Morgan Stanley Senior Funding, Inc. and J.P. Morgan Securities Inc., as Joint Lead Arrangers and Joint Bookrunners (Incorporated by reference to Exhibit 10.4 to Avaya Inc.’s Registration Statement on Form S-4 filed with the SEC on December 23, 2009) | |||
| 10.8 | Pledge and Security Agreement, dated as of October 26, 2007, by and among Avaya Inc., as Parent Borrower, Sierra Holdings Corp., certain subsidiaries of Avaya Inc. identified therein, as Subsidiary Borrowers and Citicorp USA, Inc., as Administrative Agent (Incorporated by reference to Exhibit 10.6 to Avaya Inc.’s Registration Statement on Form S-4 filed with the SEC on December 23, 2009) | |||
| 10.9 | Guaranty, dated as of October 26, 2007, by and among Sierra Holdings Corp., certain subsidiaries of Avaya Inc. from time to time party thereto and Citicorp USA, Inc., as Administrative Agent (Incorporated by reference to Exhibit 10.7 to Avaya Inc.’s Registration Statement on Form S-4 filed with the SEC on December 23, 2009) | |||
II-11
Table of Contents
Exhibit | Exhibit Title | |||
| 10.10 | Executive Employment Agreement, dated as of December 22, 2008, by and among Kevin J. Kennedy, Avaya Inc. and Sierra Holdings Corp. (Incorporated by reference to Exhibit 10.8 to Avaya Inc.’s Registration Statement on Form S-4 filed with the SEC on December 23, 2009) | |||
| 10.11 | Amendment to Executive Employment Agreement, dated October 12, 2009 among Kevin J. Kennedy, Avaya Inc. and Sierra Holdings Corp. (Incorporated by reference to Exhibit 10.9 to Avaya Inc.’s Registration Statement on Form S-4 filed with the SEC on December 23, 2009) | |||
| 10.12 | Avaya Inc. Involuntary Separation Plan for Senior Officers, as amended (Incorporated by reference to Exhibit 10.10 to Avaya Inc.’s Registration Statement on Form S-4 filed with the SEC on December 23, 2009) | |||
| 10.13 | Form of Indemnity Agreement between Sierra Holdings Corp., Avaya Inc. and certain directors of the Registrant (Incorporated by reference to Exhibit 10.11 to Avaya Inc.’s Registration Statement on Form S-4 filed with the SEC on December 23, 2009) | |||
| 10.14 | Form of Indemnity Agreement between Sierra Holdings Corp., Avaya Inc. and certain officers of the Registrant (Incorporated by reference to Exhibit 10.12 to Avaya Inc.’s Registration Statement on Form S-4 filed with the SEC on December 23, 2009) | |||
| 10.15 | Avaya Inc. Savings Restoration Plan, as amended (Incorporated by reference to Exhibit 10.13 to Avaya Inc.’s Registration Statement on Form S-4 filed with the SEC on December 23, 2009) | |||
| 10.16 | Avaya Inc. Short Term Incentive Plan (Incorporated by reference to Exhibit 10.14 to Avaya Inc.’s Registration Statement on Form S-4 filed with the SEC on December 23, 2009) | |||
| 10.17 | Management Services Agreement, dated as of October 2, 2007, by and among Sierra Holdings Corp., Avaya Inc. (as successor by merger to Sierra Merger Corp.), TPG Capital, L.P. and Silver Lake Management Company III, L.L.C. (Incorporated by reference to Exhibit 10.15 to Avaya Inc.’s Registration Statement on Form S-4 filed with the SEC on December 23, 2009) | |||
| 10.18 | Retention agreement dated February 3, 2009 between Avaya Inc. and James Chirico (Incorporated by reference to Exhibit 10.16 to Avaya Inc.’s Registration Statement on Form S-4 filed with the SEC on December 23, 2009) | |||
| 10.19 | Separation Agreement and General Release, dated as of July 1, 2010, between Avaya Inc. and Todd Abbott (Incorporated by reference to Exhibit 10.1 to Avaya Inc.’s Current Report on Form 8-K filed with the SEC on July 1, 2010) | |||
| 10.20 | Sierra Holdings Corp. Amended and Restated 2007 Equity Incentive Plan (Incorporated by reference to Exhibit 10.2 to Avaya Inc.’s Current Report on Form 8-K filed with the SEC on July 1, 2010) | |||
| 10.21 | Form of Sierra Holdings Corp. Amended and Restated 2007 Equity Incentive Plan Restricted Stock Unit Award Agreement (Incorporated by reference to Exhibit 10.3 to Avaya Inc.’s Current Report on Form 8-K filed with the SEC on July 1, 2010) | |||
| 10.22 | Form of Sierra Holdings Corp. Amended and Restated 2007 Equity Incentive Plan Stock Option Award Agreement for Senior Vice Presidents and Vice Presidents (Incorporated by reference to Exhibit 10.4 to Avaya Inc.’s Current Report on Form 8-K filed with the SEC on July 1, 2010) | |||
| 10.23 | Avaya Inc. Executive Committee 2011-2013 Performance Recognition Plan (Incorporated by reference to Exhibit 10.1 to Avaya Inc.’s Quarterly Report on Form 10-Q filed with the SEC on May 12, 2011) | |||
| 10.24 | Form of Award Agreement for the Avaya Inc. Executive Committee 2011-2013 Performance Recognition Plan (Incorporated by reference to Exhibit 10.2 to Avaya Inc.’s Quarterly Report on Form 10-Q filed with the SEC on May 12, 2011) | |||
| 10.25 | Management Stockholders’ Agreement, dated as of October 26, 2007, by and among Sierra Holdings Corp., the Majority Stockholders (as defined therein) and the individuals listed on Schedule A thereto** | |||
II-12
Table of Contents
| | Exhibit Number | | Exhibit Title | |
| 10.26 | Form of Amended and Restated Stockholders’ Agreement, by and among TPG Partners V, L.P., TPG FOF V-A, L.P., TPG FOF V-B, L.P., Silver Lake Partners II, L.P., Silver Lake Technology Investors II, L.P., Silver Lake Partners III, L.P., Silver Lake Technology Investors III, L.P., Sierra Co-Invest, LLC, Sierra Co-Invest II, LLC and Avaya Holdings Corp.* | |||
| 10.27 | Amendment No. 3 to Credit Agreement dated August 8, 2011, by and among Avaya Inc., Citibank, N.A., as Administrative Agent, and each lender party thereto, amending the Amended and Restated Credit Agreement, dated as of February 11, 2011, by and among Avaya Inc., Avaya Holdings Corp., Citibank, N.A., as Administrative Agent, Swing Line Lender and L/C Issuer and each lender party thereto (Incorporated by reference to Exhibit 10.1 to Avaya Inc.’s Quarterly Report on Form 10-Q filed with the SEC on August 11, 2011) | |||
| 10.28 | Amendment No. 1 to Credit Agreement, dated as of August 8, 2011, by and among Avaya Inc., the several subsidiary borrowers party thereto, Citicorp USA, Inc., as Administrative Agent and the lenders party thereto, amending the Credit Agreement, dated as of October 26, 2007, by and among Avaya Inc., the several subsidiary borrowers party thereto, Avaya Holdings Corp., Citicorp USA, Inc., as Administrative Agent and the lenders party thereto (Incorporated by reference to Exhibit 10.2 to Avaya Inc.’s Quarterly Report on Form 10-Q filed with the SEC on August 11, 2011) | |||
| 10.29 | Avaya Holdings Corp. 2011 Equity Incentive Plan* | |||
| 10.30 | Avaya Holdings Corp. 2011 Employee Stock Purchase Plan* | |||
| 10.31 | Form of Award Agreement for 2012 Sales Incentive Program (Incorporated by reference to Exhibit 10.28 to Avaya Inc.’s Annual Report on Form 10-K filed with the SEC on December 9, 2011) | |||
| 21.1 | List of Subsidiaries | |||
| 23.1 | Consent of PricewaterhouseCoopers LLP | |||
| 23.2 | Consent of KPMG LLP | |||
| 23.3 | Consent of Ropes & Gray LLP (included in the opinion filed as Exhibit 5.1)* | |||
| 24.1 | Powers of Attorney (included in the signature pages of this Registration Statement)** | |||
| * | To be filed by amendment. |
| ** | Previously filed. |
II-13