
Keurig Dr Pepper Barclay’s Global Consumer Staples Conference September 3, 2019

Robert Gamgort – Chairman & CEO Ozan Dokmecioglu – Chief Financial Officer Maria Sceppaguercio – Chief Corporate Affairs Officer Tyson Seely – Vice President Investor Relations Steve Alexander – Senior Director Investor Relations

Forward-looking statements & non-GAAP financial measures Certain statements contained herein are “forward-looking statements” within the meaning of applicable securities laws and regulations. These forward-looking statements can generally be identified by the use of words such as “outlook,” “anticipate,” “expect,” “believe,” “could,” “estimate,” “feel,” “forecast,” “intend,” “may,” “plan,” “potential,” “project,” “should,” “will,” “would,” and similar words, phrases or expressions and variations or negatives of these words, although not all forward-looking statements contain these identifying words. Forward-looking statements by their nature address matters that are, to different degrees, uncertain, such as statements regarding the estimated or anticipated future results of Keurig Dr Pepper Inc. (the “Company”), the anticipated benefits of the transaction between Keurig Green Mountain, Inc. (“KGM”) and Dr Pepper Snapple Group, Inc. (“DPS” and such transaction, the “Transaction”), including estimated synergies and cost savings of the Transaction, and other statements that are not historical facts. These statements are based on the current expectations of our management and are not predictions of actual performance. These forward-looking statements are subject to a number of risks and uncertainties regarding the Company’s business and actual results may differ materially. These risks and uncertainties include, but are not limited to: (i) the impact the significant additional debt incurred in connection with the Transaction may have on our ability to operate the Company, (ii) risks relating to the integration of the KGM and DPS operations, products and employees into the combined company and assumption of certain potential liabilities of KGM and the possibility that the anticipated synergies and other benefits of the combination, including cost savings, will not be realized or will not be realized within the expected timeframe, and (iii) risks relating to the combined businesses and the industries in which our Company operates. These risks and uncertainties, as well as other risks and uncertainties, are more fully discussed in our filings with the SEC. While the list of factors presented here is, and the list of factors to be presented in our filings with the SEC are, considered representative, no such list should be considered to be a complete statement of all potential risks and uncertainties. Any forward-looking statement made herein speaks only as of the date of this document. The Company is under no any obligation to, and it expressly disclaims any obligation to, update or alter any forward-looking statements, whether as a result of new information, subsequent events or otherwise, except as required by applicable laws or regulations. This presentation includes certain non-GAAP financial measures including Adjusted pro forma net sales, Adjusted pro forma operating income, and Adjusted diluted EPS, which differ from results using U.S. Generally Accepted Accounting Principles (GAAP). These non-GAAP financial measures should be considered as supplements to the GAAP reported measures, should not be considered replacements for, or superior to, the GAAP measures and may not be comparable to similarly named measures used by other companies. Non-GAAP financial measures typically exclude certain charges, including one-time costs related to the Transaction and integration activities, which are not expected to occur routinely in future periods. The Company uses non-GAAP financial measures internally to focus management on performance excluding these special charges to gauge our business operating performance, and to provide a meaningful comparison of the Company’s performance to periods prior to the Transaction. Management believes this information is helpful to investors because it increases transparency and assists investors in understanding the underlying performance of the Company and in the analysis of ongoing operating trends. Additionally, management believes that non-GAAP financial measures are frequently used by analysts and investors in their evaluation of companies, and its continued inclusion provides consistency in financial reporting and enables analysts and investors to perform meaningful comparisons of past, present and future operating results. The most directly comparable GAAP financial measures and reconciliations to non-GAAP financial measures are set forth in Appendix to this presentation and in the Company’s filings with the SEC which are available at www.keurigdrpepper.com. 3

Agenda Overview Portfolio Selling & Distribution Financial Update Closing 4

Our vision Portfolio Selling & Distribution “Retail” “Retail” Outlets Behaviors Shopper Consumer Formats/Brands Needs/Occasions A beverage for every need, available everywhere people shop and consume 5
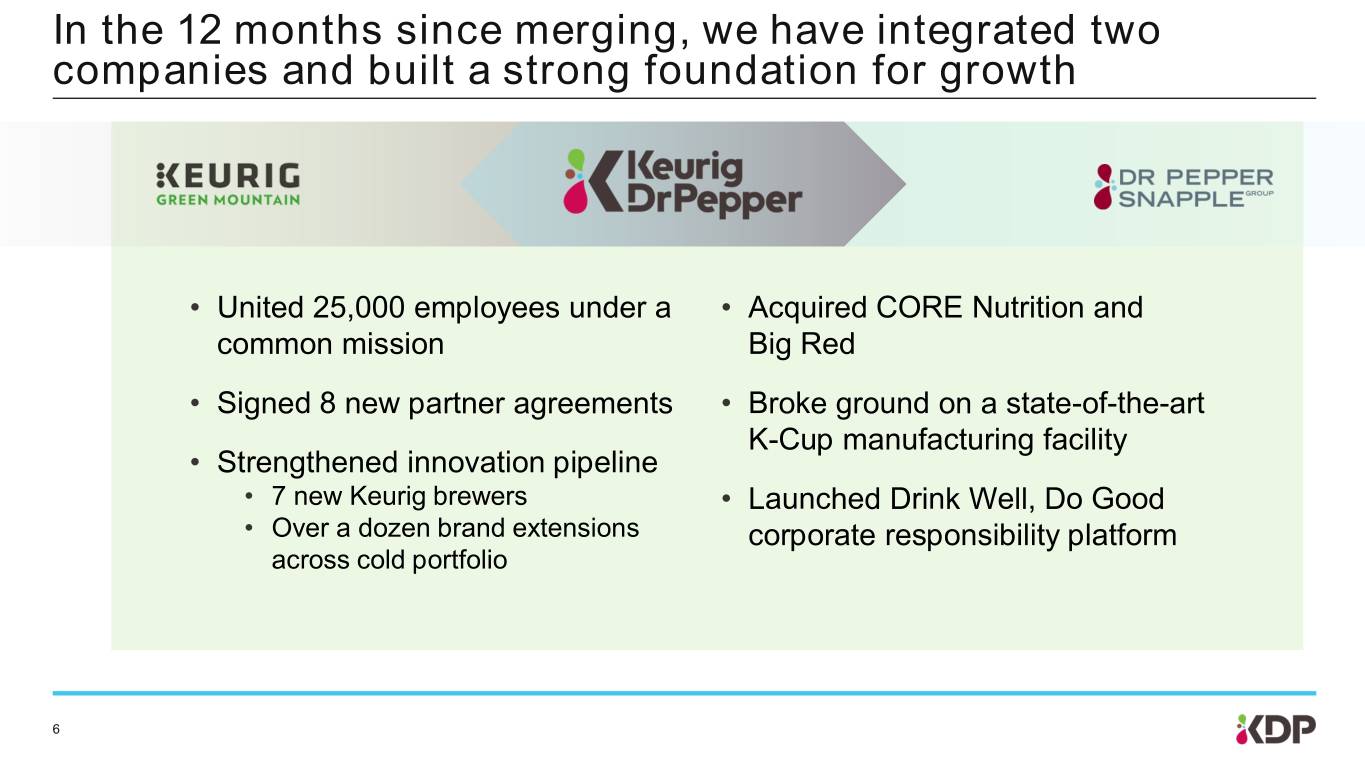
In the 12 months since merging, we have integrated two companies and built a strong foundation for growth • United 25,000 employees under a • Acquired CORE Nutrition and common mission Big Red • Signed 8 new partner agreements • Broke ground on a state-of-the-art K-Cup manufacturing facility • Strengthened innovation pipeline • 7 new Keurig brewers • Launched Drink Well, Do Good • Over a dozen brand extensions corporate responsibility platform across cold portfolio 6

Coffee Systems segment delivered strong results Retail Results – IRi 12 Months 6/30/191 Financial Results – 1st Four Quarters2 Single Serve Category Volume +6% KDP Pod Shipments +8% vs PY vs PY KDP Manufactured Pods Consumption +6% vs PY Segment Operating Margin +300 bps vs PY KDP Manufactured Pods $ Share 82% 1 IRi MULO+C; 52 weeks ended 6/30/19 7 2 KDP Coffee Systems segment Adjusted and Adjusted pro forma results, 4 quarters ended 6/30/19. See appendix for reconciliation.

KDP outperformed the CSD category KDP HOLDS THE #1 MARKET SHARE IN FLAVORED CSDs CSD $ Retail Growth 52 Weeks 6/30/19 3.5% 2.5% Category KDP 8 Source: IRi MULO+C; 52 weeks ended 6/30/19

KDP gained or held share across most other categories $ Market Share Growth 52 Weeks 6/30/19 Premium Unflavored Water +3.0 pts Enhanced Flavored Still Water -0.3 pts Fruit Drinks +0.2 pts RTD Tea -0.2 pts RTD Coffee +0.3 pts Energy -- Apple Juice +0.7 pts Vegetable Juice +0.5 pts Mixers +1.8 pts 9 Source: IRi MULO+C; 52 weeks ended 6/30/19
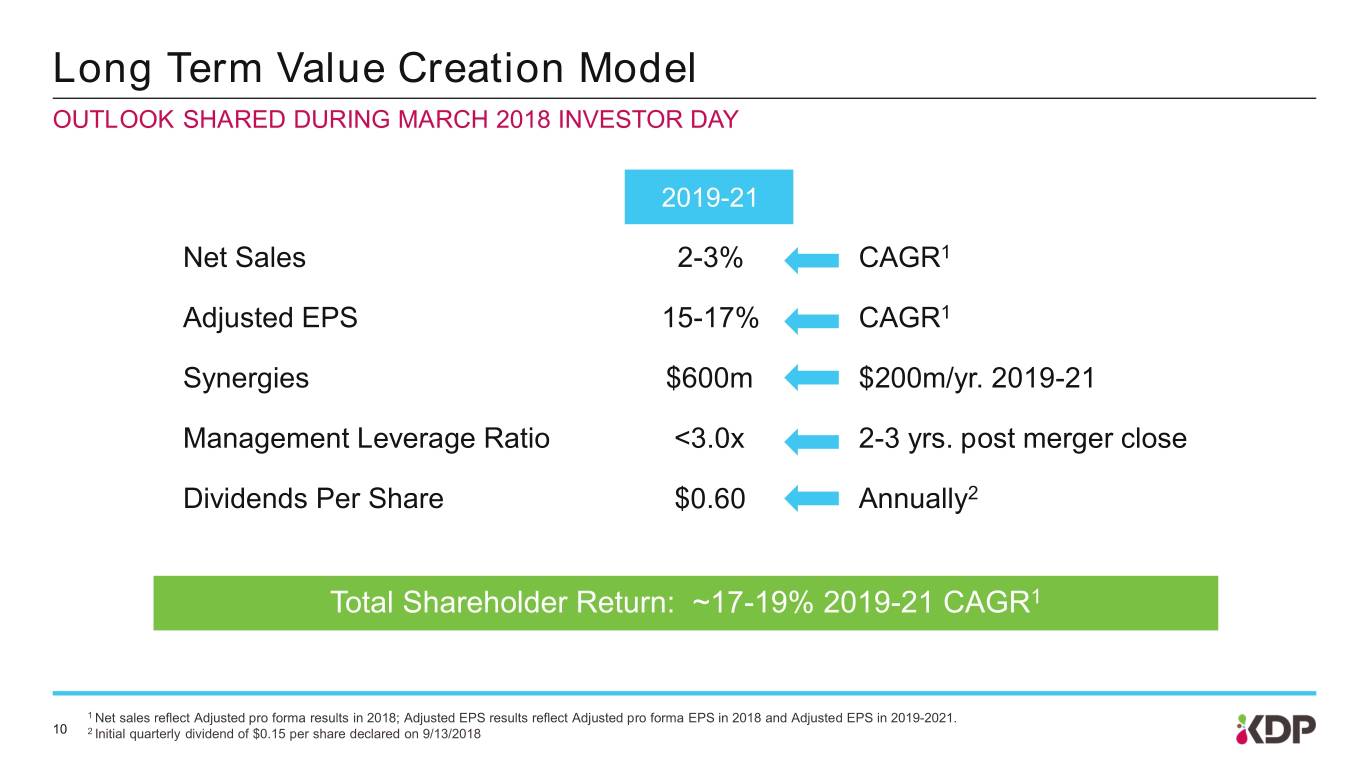
Long Term Value Creation Model OUTLOOK SHARED DURING MARCH 2018 INVESTOR DAY 2019-21 Net Sales 2-3% CAGR1 Adjusted EPS 15-17% CAGR1 Synergies $600m $200m/yr. 2019-21 Management Leverage Ratio <3.0x 2-3 yrs. post merger close Dividends Per Share $0.60 Annually2 Total Shareholder Return: ~17-19% 2019-21 CAGR1 1 Net sales reflect Adjusted pro forma results in 2018; Adjusted EPS results reflect Adjusted pro forma EPS in 2018 and Adjusted EPS in 2019-2021. 10 2 Initial quarterly dividend of $0.15 per share declared on 9/13/2018
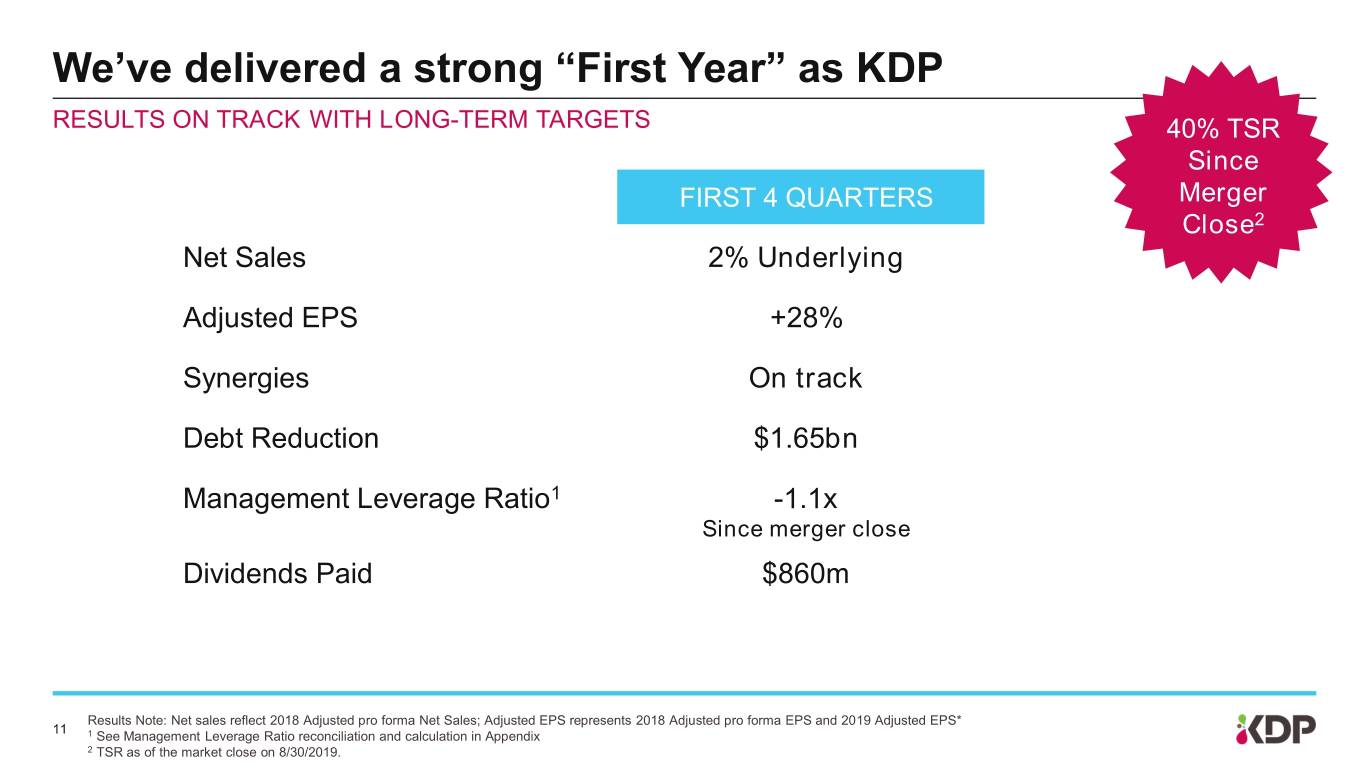
We’ve delivered a strong “First Year” as KDP RESULTS ON TRACK WITH LONG-TERM TARGETS 40% TSR Since FIRST 4 QUARTERS Merger Close2 Net Sales 2% Underlying Adjusted EPS +28% Synergies On track Debt Reduction $1.65bn Management Leverage Ratio1 -1.1x Since merger close Dividends Paid $860m Results Note: Net sales reflect 2018 Adjusted pro forma Net Sales; Adjusted EPS represents 2018 Adjusted pro forma EPS and 2019 Adjusted EPS* 11 1 See Management Leverage Ratio reconciliation and calculation in Appendix 2 TSR as of the market close on 8/30/2019.
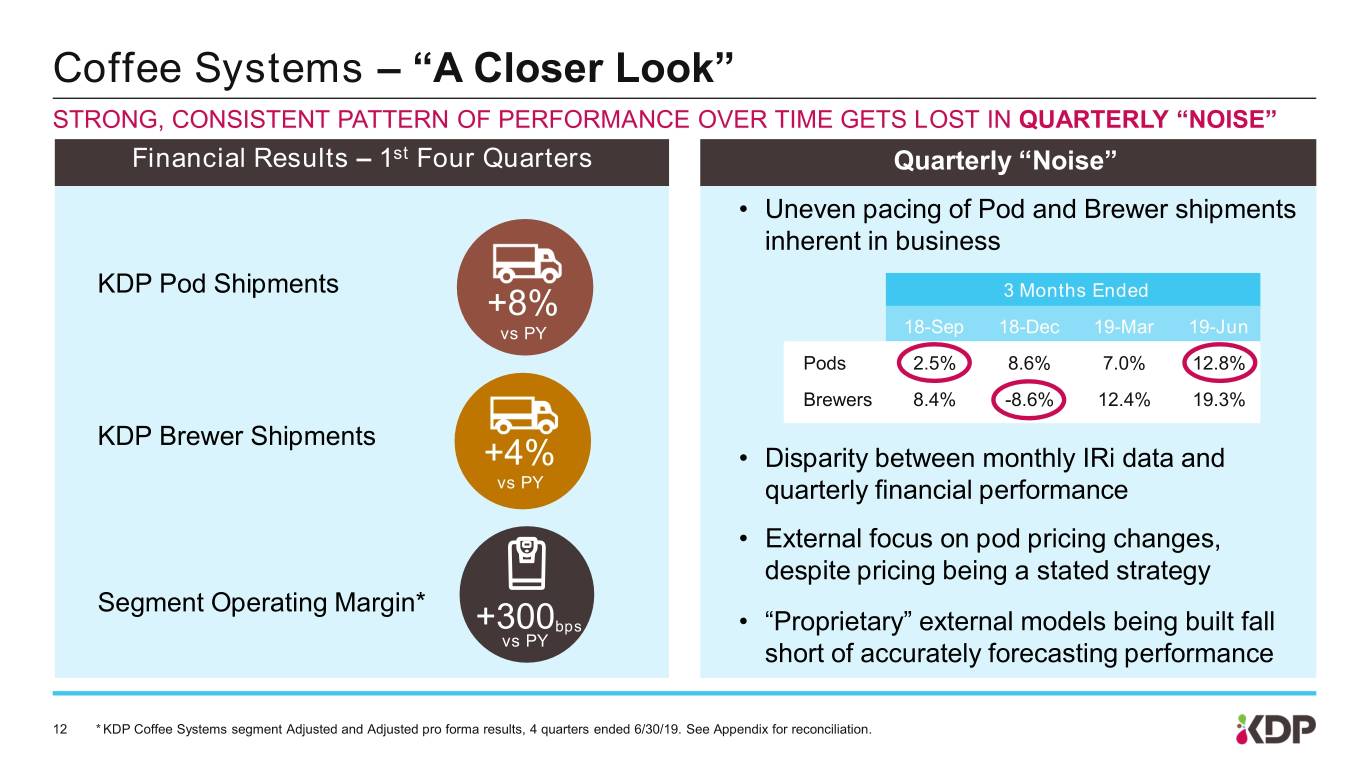
Coffee Systems – “A Closer Look” STRONG, CONSISTENT PATTERN OF PERFORMANCE OVER TIME GETS LOST IN QUARTERLY “NOISE” Financial Results – 1st Four Quarters Quarterly “Noise” • Uneven pacing of Pod and Brewer shipments inherent in business KDP Pod Shipments +8% 3 Months Ended vs PY 18-Sep 18-Dec 19-Mar 19-Jun Pods 2.5% 8.6% 7.0% 12.8% Brewers 8.4% -8.6% 12.4% 19.3% KDP Brewer Shipments +4% • Disparity between monthly IRi data and vs PY quarterly financial performance • External focus on pod pricing changes, despite pricing being a stated strategy Segment Operating Margin* +300bps • “Proprietary” external models being built fall vs PY short of accurately forecasting performance 12 * KDP Coffee Systems segment Adjusted and Adjusted pro forma results, 4 quarters ended 6/30/19. See Appendix for reconciliation.
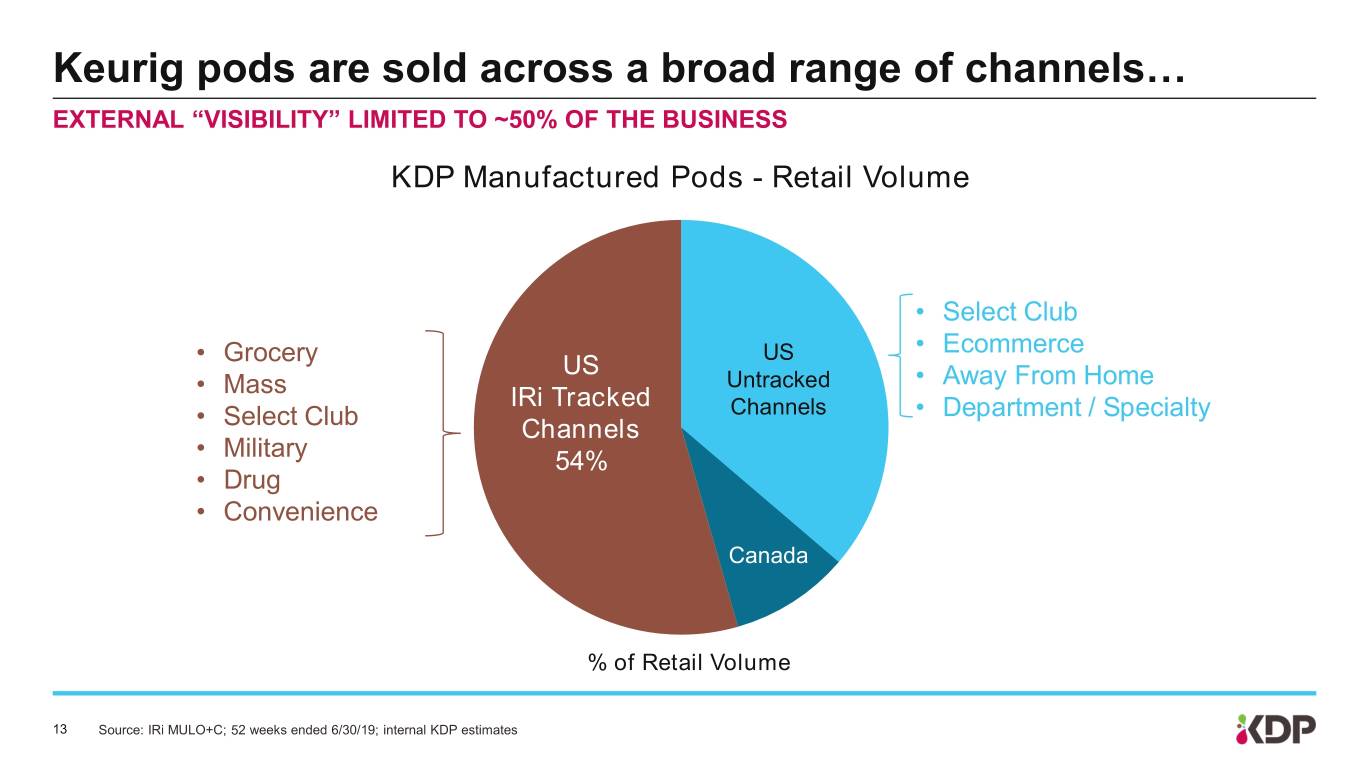
Keurig pods are sold across a broad range of channels… EXTERNAL “VISIBILITY” LIMITED TO ~50% OF THE BUSINESS KDP Manufactured Pods - Retail Volume • Select Club • Ecommerce • Grocery US US • Mass Untracked • Away From Home IRi Tracked Channels • Department / Specialty • Select Club Channels • Military 54% • Drug • Convenience Canada % of Retail Volume 13 Source: IRi MULO+C; 52 weeks ended 6/30/19; internal KDP estimates
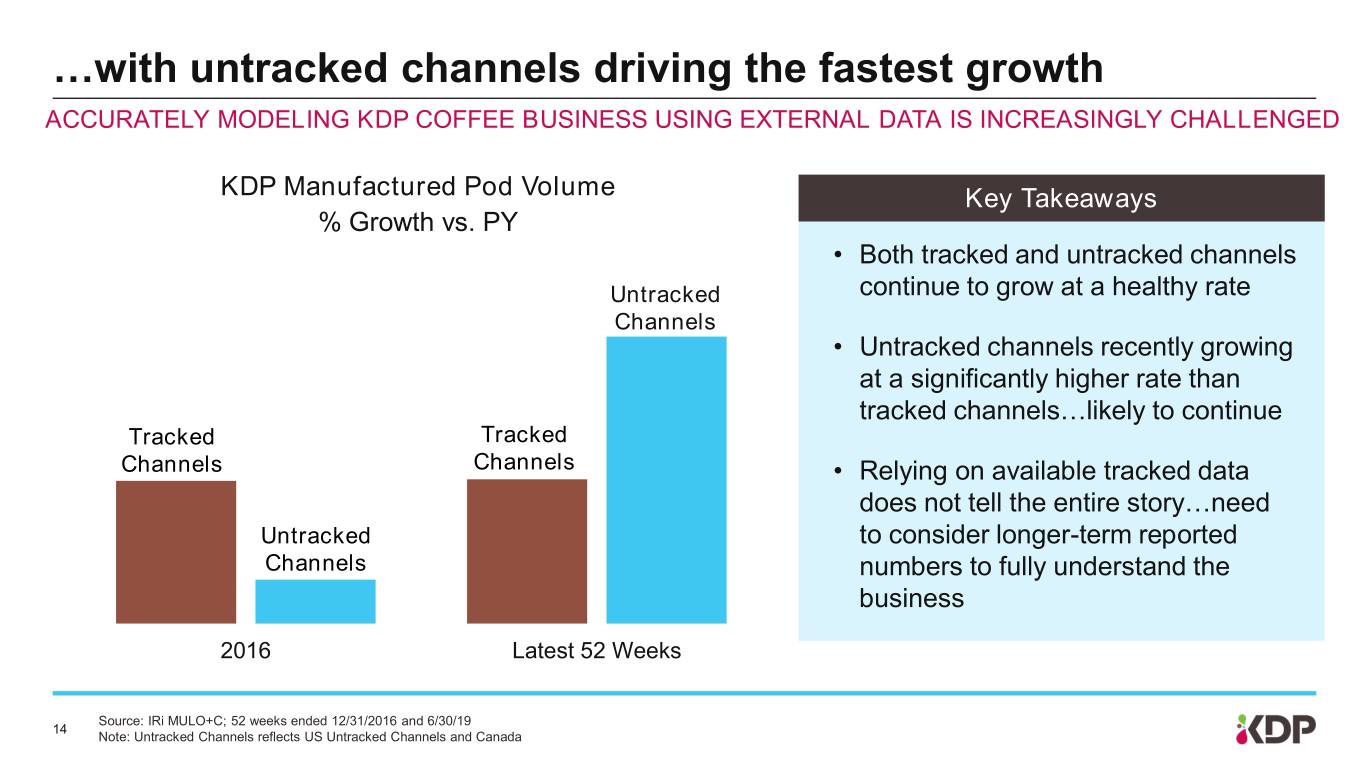
…with untracked channels driving the fastest growth ACCURATELY MODELING KDP COFFEE BUSINESS USING EXTERNAL DATA IS INCREASINGLY CHALLENGED KDP Manufactured Pod Volume Key Takeaways % Growth vs. PY • Both tracked and untracked channels Untracked continue to grow at a healthy rate Channels • Untracked channels recently growing at a significantly higher rate than tracked channels…likely to continue Tracked Tracked Channels Channels • Relying on available tracked data does not tell the entire story…need Untracked to consider longer-term reported Channels numbers to fully understand the business 2016 Latest 52 Weeks Source: IRi MULO+C; 52 weeks ended 12/31/2016 and 6/30/19 14 Note: Untracked Channels reflects US Untracked Channels and Canada
Agenda Overview Portfolio Selling & Distribution Financial Update Closing 15
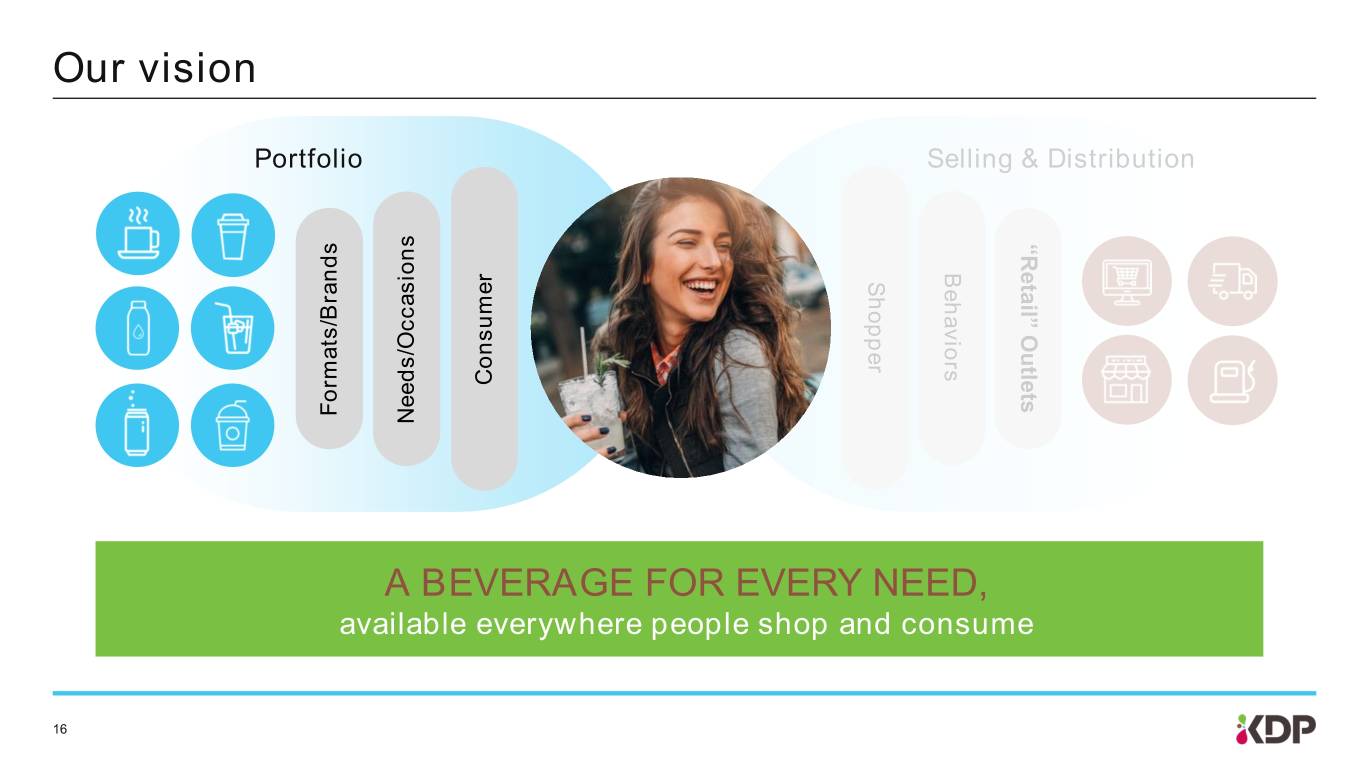
Our vision Portfolio Selling & Distribution “Retail” “Retail” Outlets Behaviors Shopper Consumer Formats/Brands Needs/Occasions A BEVERAGE FOR EVERY NEED, available everywhere people shop and consume 16
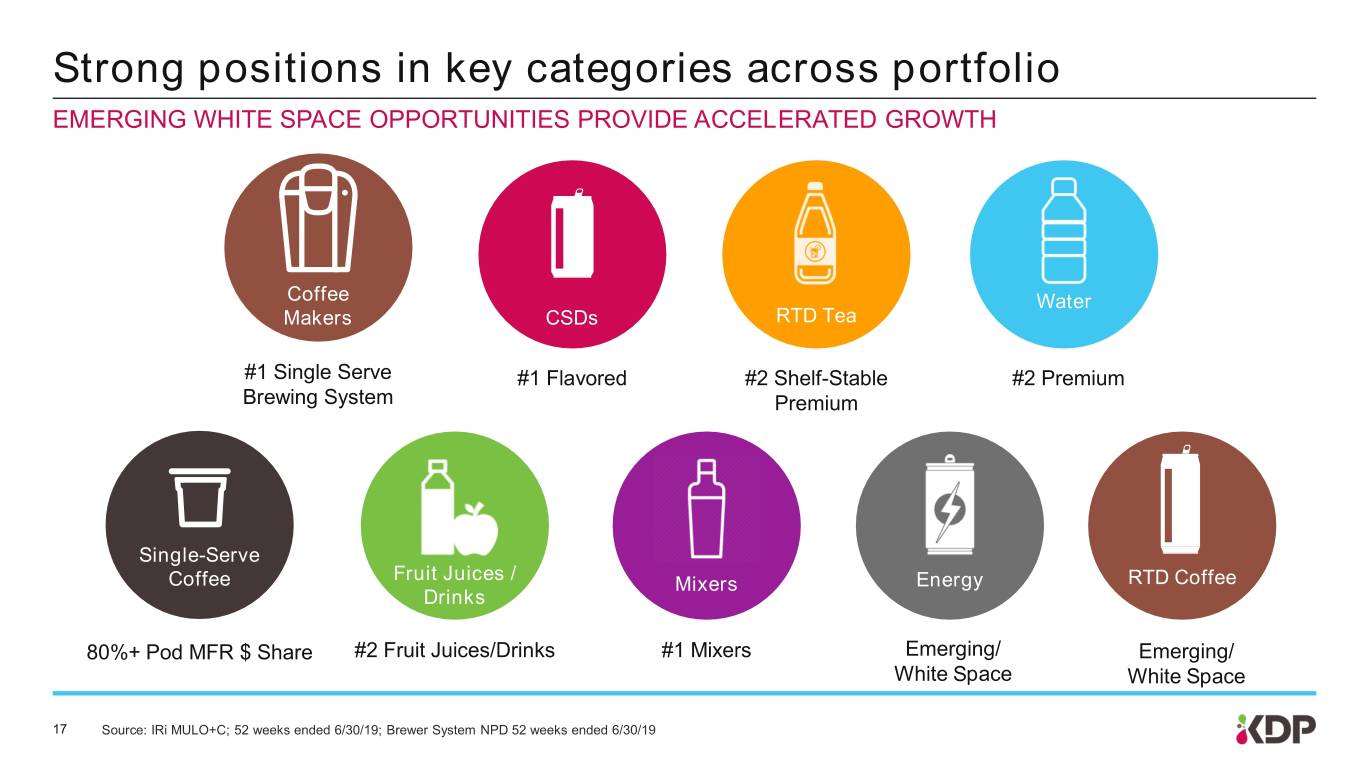
Strong positions in key categories across portfolio EMERGING WHITE SPACE OPPORTUNITIES PROVIDE ACCELERATED GROWTH Coffee Water Makers CSDs RTD Tea #1 Single Serve #1 Flavored #2 Shelf-Stable #2 Premium Brewing System Premium Single-Serve Fruit Juices / Coffee Mixers Energy RTD Coffee Drinks 80%+ Pod MFR $ Share #2 Fruit Juices/Drinks #1 Mixers Emerging/ Emerging/ White Space White Space 17 Source: IRi MULO+C; 52 weeks ended 6/30/19; Brewer System NPD 52 weeks ended 6/30/19
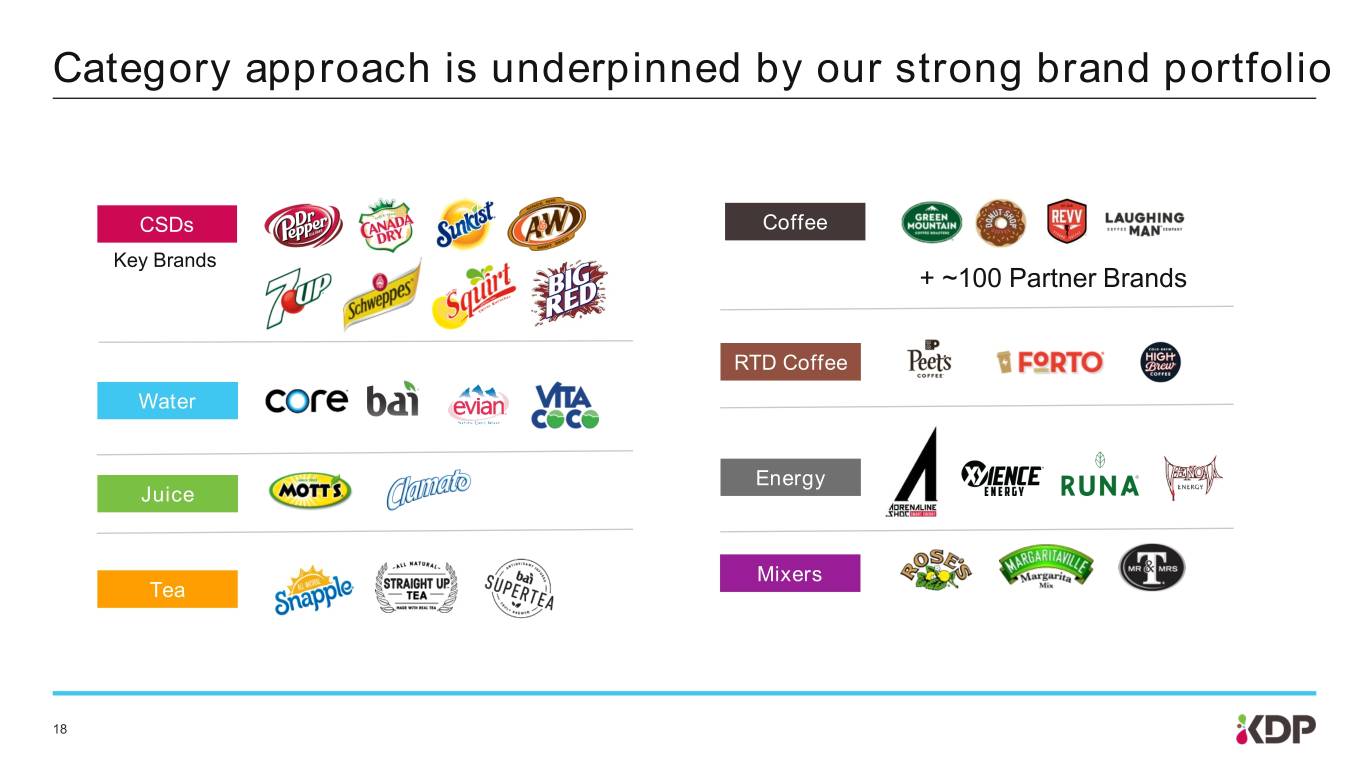
Category approach is underpinned by our strong brand portfolio CSDs Coffee Key Brands + ~100 Partner Brands RTD Coffee Water Energy Juice Mixers Tea 18
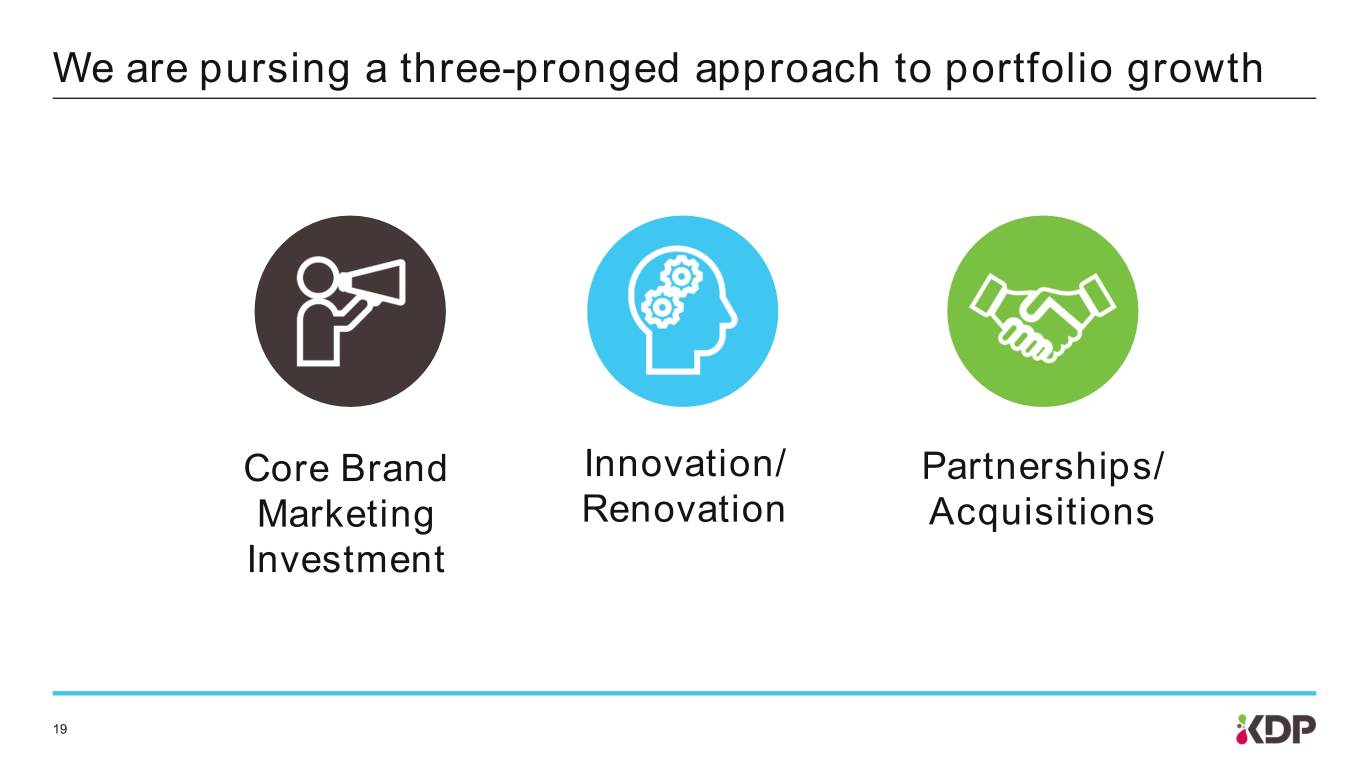
We are pursing a three-pronged approach to portfolio growth Core Brand Innovation/ Partnerships/ Marketing Renovation Acquisitions Investment 19
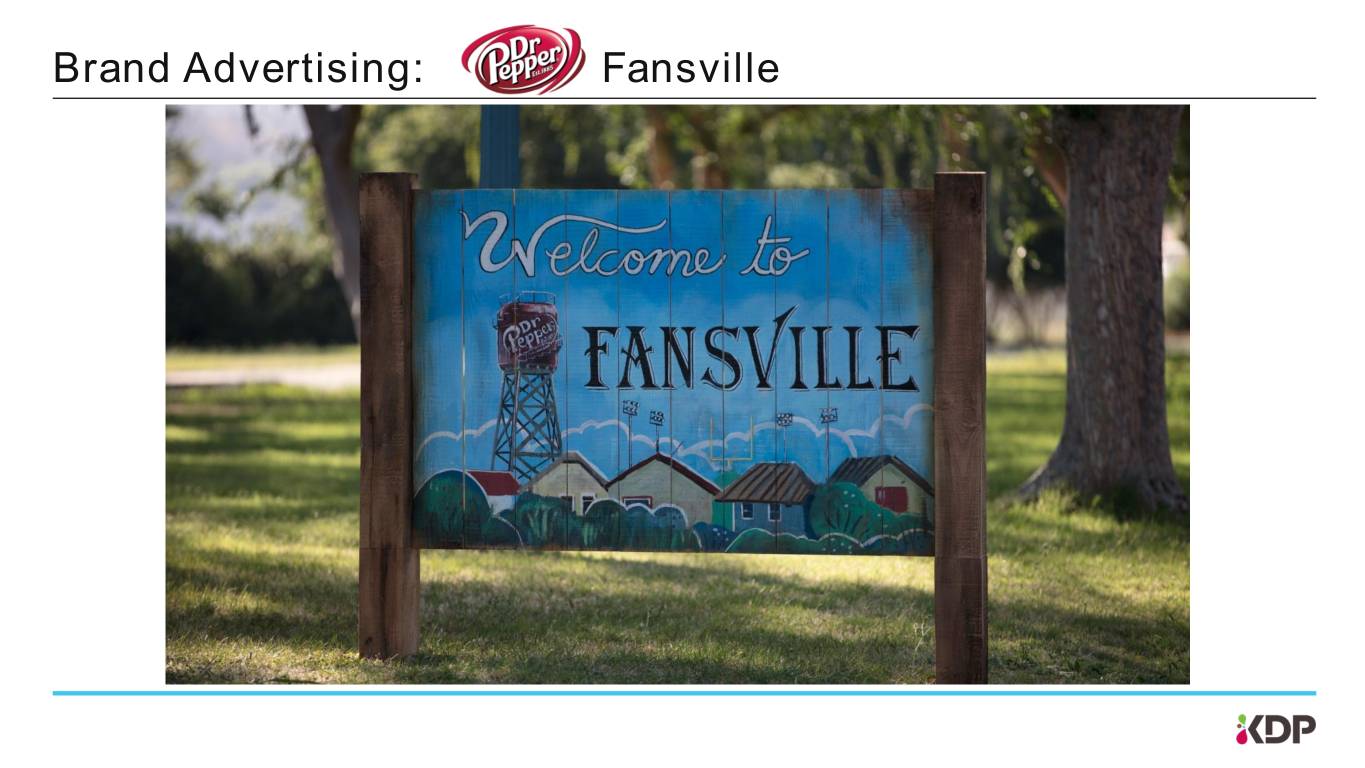
Brand Advertising: Fansville

Fansville campaign was highly successful in 1st Year 2018 Campaign Metrics 1 billion impressions • 99th percentile in awareness index • 69% of 18-to-34-year-olds say Fansville makes them love Dr Pepper more, 2X prior campaign • 66% of Dr Pepper drinkers feel Fansville makes them want to buy more Dr Pepper, >50% more than prior campaign • 25% higher return vs. prior campaign 21 Sources: Millard Brown Link Testing, KDP Custom Research Survey, Market Fusion Analytics
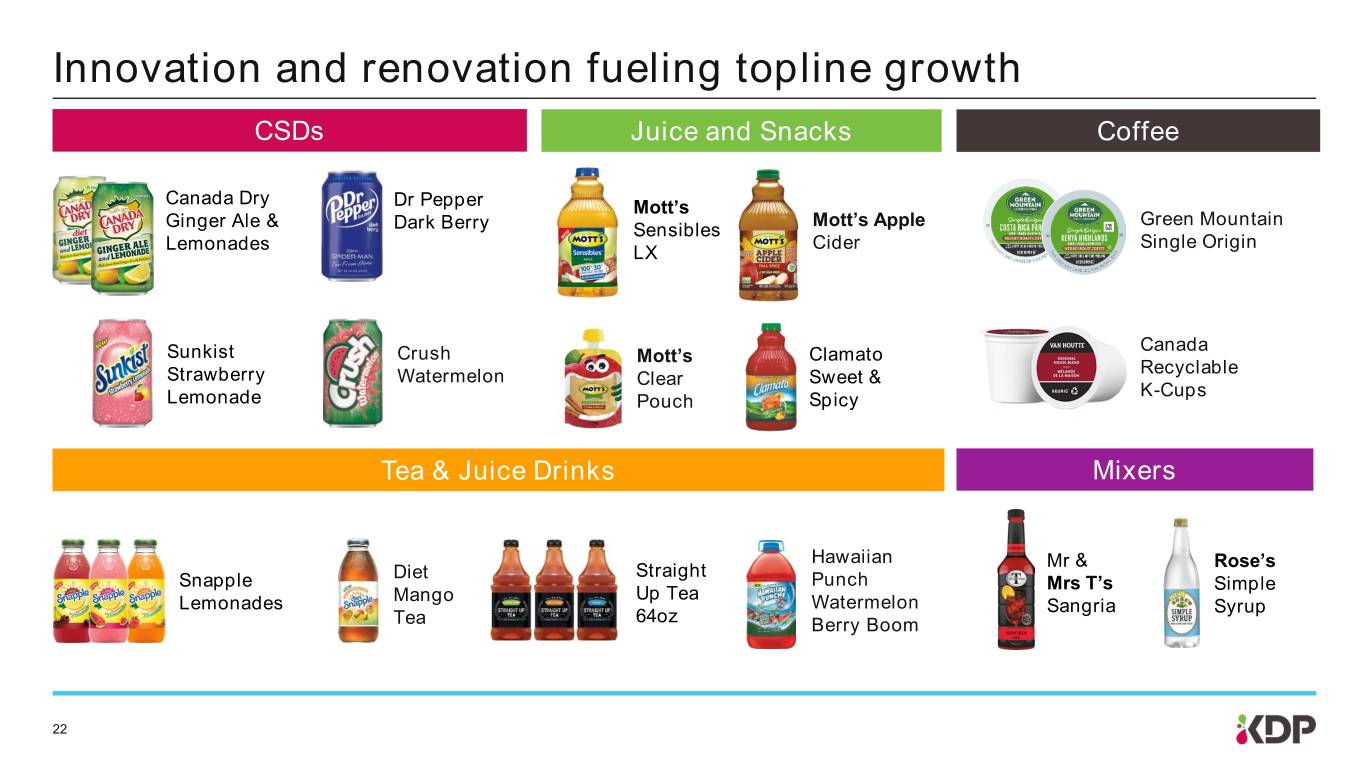
Innovation and renovation fueling topline growth CSDs Juice and Snacks Coffee Canada Dry Dr Pepper Mott’s Mott’s Apple Green Mountain Ginger Ale & Dark Berry Sensibles Cider Single Origin Lemonades LX Canada Sunkist Crush Mott’s Clamato Recyclable Strawberry Watermelon Clear Sweet & K-Cups Lemonade Pouch Spicy Tea & Juice Drinks Mixers Hawaiian Mr & Rose’s Diet Straight Snapple Punch Mrs T’s Simple Mango Up Tea Lemonades Watermelon Sangria Syrup Tea 64oz Berry Boom 22

Brewer line-up completely revamped since 2017 – targeting consumer needs to drive household penetration Need VALUE CONVENIENCE IMAGE IMAGE VARIETY VARIETY State K-Compact™ K-Select™ K-Elite™ K-Mini™ K-Latte™ K-Cafe™ 2017 2017 2018 2018 2018 2018 23

Households using Keurig brewers continue to grow +33% Household growth 28m since 2015 26m 23m 21m 2015 2016 2017 2018 US Households Regularly Using Keurig Brewers 24 Source: Third Party Omnibus Study 2018
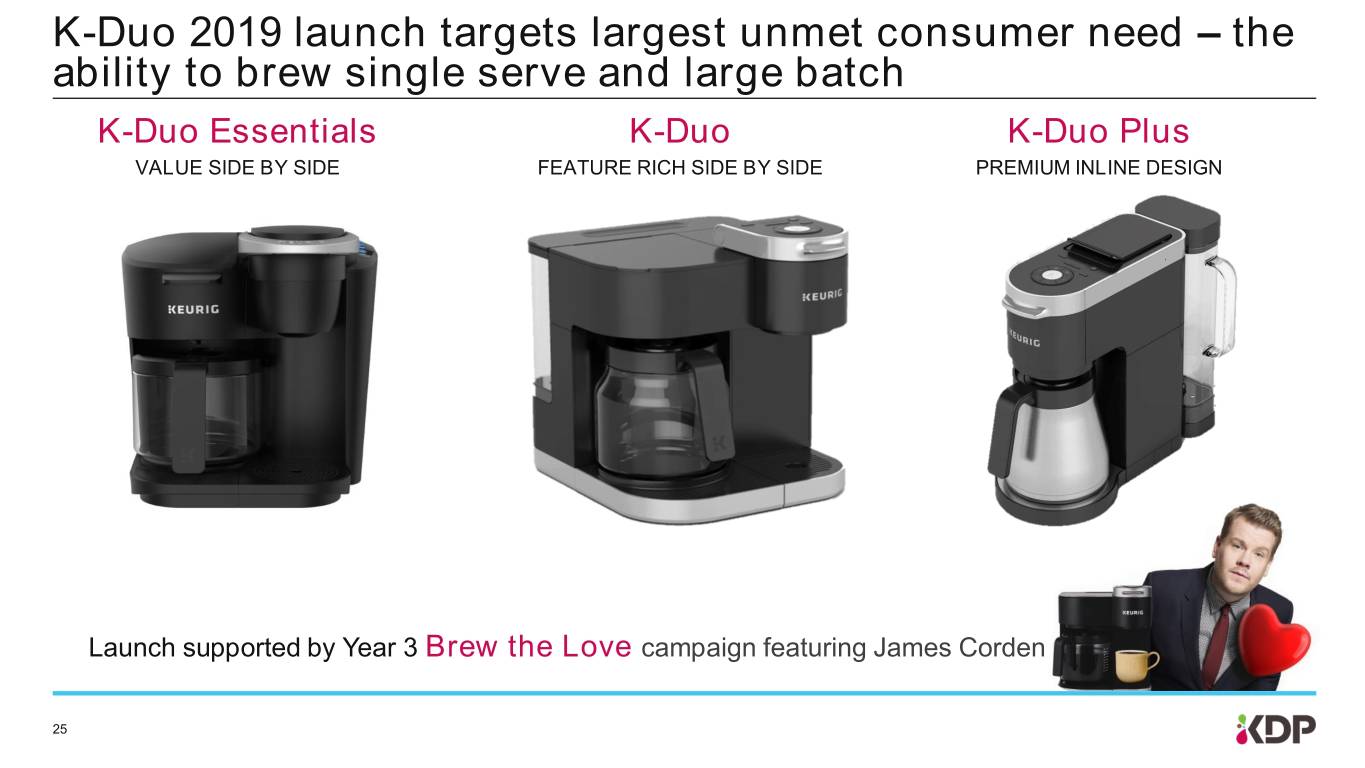
K-Duo 2019 launch targets largest unmet consumer need – the ability to brew single serve and large batch K-Duo Essentials K-Duo K-Duo Plus VALUE SIDE BY SIDE FEATURE RICH SIDE BY SIDE PREMIUM INLINE DESIGN Launch supported by Year 3 Brew the Love campaign featuring James Corden 25
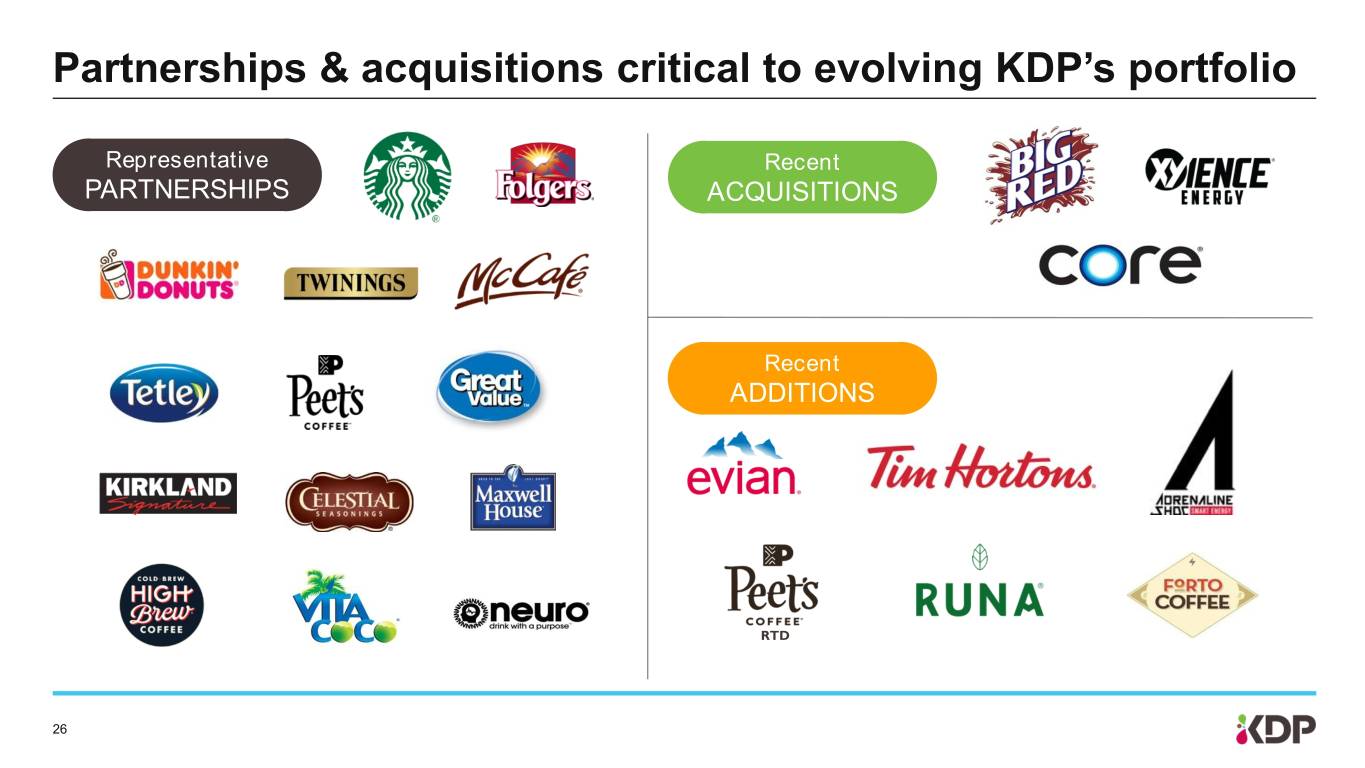
Partnerships & acquisitions critical to evolving KDP’s portfolio Representative Recent PARTNERSHIPS ACQUISITIONS Recent ADDITIONS RTD 26
Agenda Overview Portfolio Selling & Distribution Financial Update Closing 27

Our vision Portfolio Selling & Distribution “Retail” “Retail” Outlets Behaviors Shopper Consumer Formats/Brands Needs/Occasions A beverage for every need, AVAILABLE EVERYWERE PEOPLE SHOP AND CONSUME 28
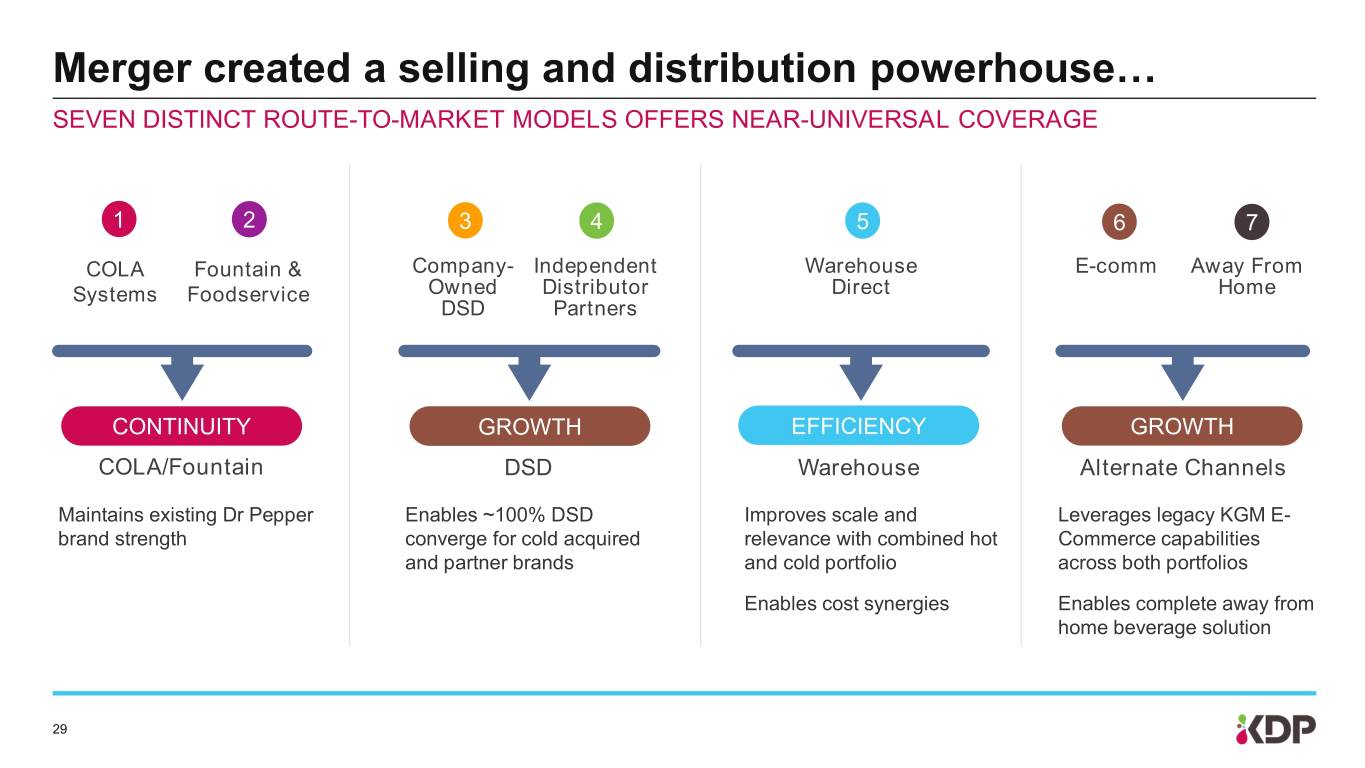
Merger created a selling and distribution powerhouse… SEVEN DISTINCT ROUTE-TO-MARKET MODELS OFFERS NEAR-UNIVERSAL COVERAGE 1 2 3 4 5 6 7 COLA Fountain & Company- Independent Warehouse E-comm Away From Systems Foodservice Owned Distributor Direct Home DSD Partners CONTINUITY GROWTH EFFICIENCY GROWTH COLA/Fountain DSD Warehouse Alternate Channels Maintains existing Dr Pepper Enables ~100% DSD Improves scale and Leverages legacy KGM E- brand strength converge for cold acquired relevance with combined hot Commerce capabilities and partner brands and cold portfolio across both portfolios Enables cost synergies Enables complete away from home beverage solution 29
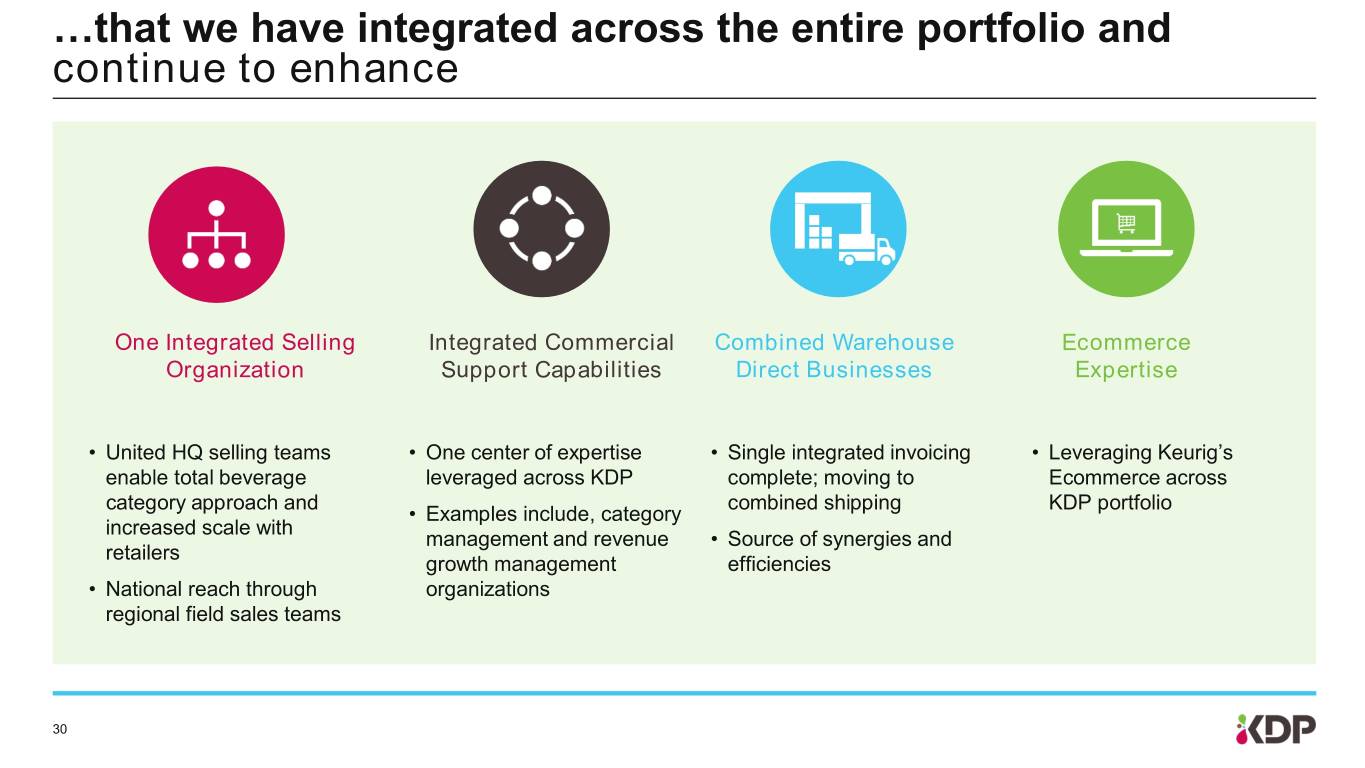
…that we have integrated across the entire portfolio and continue to enhance One Integrated Selling Integrated Commercial Combined Warehouse Ecommerce Organization Support Capabilities Direct Businesses Expertise • United HQ selling teams • One center of expertise • Single integrated invoicing • Leveraging Keurig’s enable total beverage leveraged across KDP complete; moving to Ecommerce across category approach and combined shipping KDP portfolio • Examples include, category increased scale with management and revenue • Source of synergies and retailers growth management efficiencies • National reach through organizations regional field sales teams 30
Agenda Overview Portfolio Selling & Distribution Financial Update Closing 31

2019 First half Adjusted results Vs. Prior Year Net Sales - Reported -0.7% Net Sales – Underlying1 +2.4% Operating Income +10% Operating Margin +244 bps Earnings Per Share +25% Free Cash Flow2 $1.1bn Management Leverage Ratio3 -0.5x Note: Prior year results are Adjusted pro forma 1 32 Excludes impact of changes in Allied Brands portfolio 2 Free Cash Flow defined as Cash Flow from Operations less Capital Expenditures; See Appendix for calculation 3 See Management Leverage Ratio reconciliation and calculation in Appendix
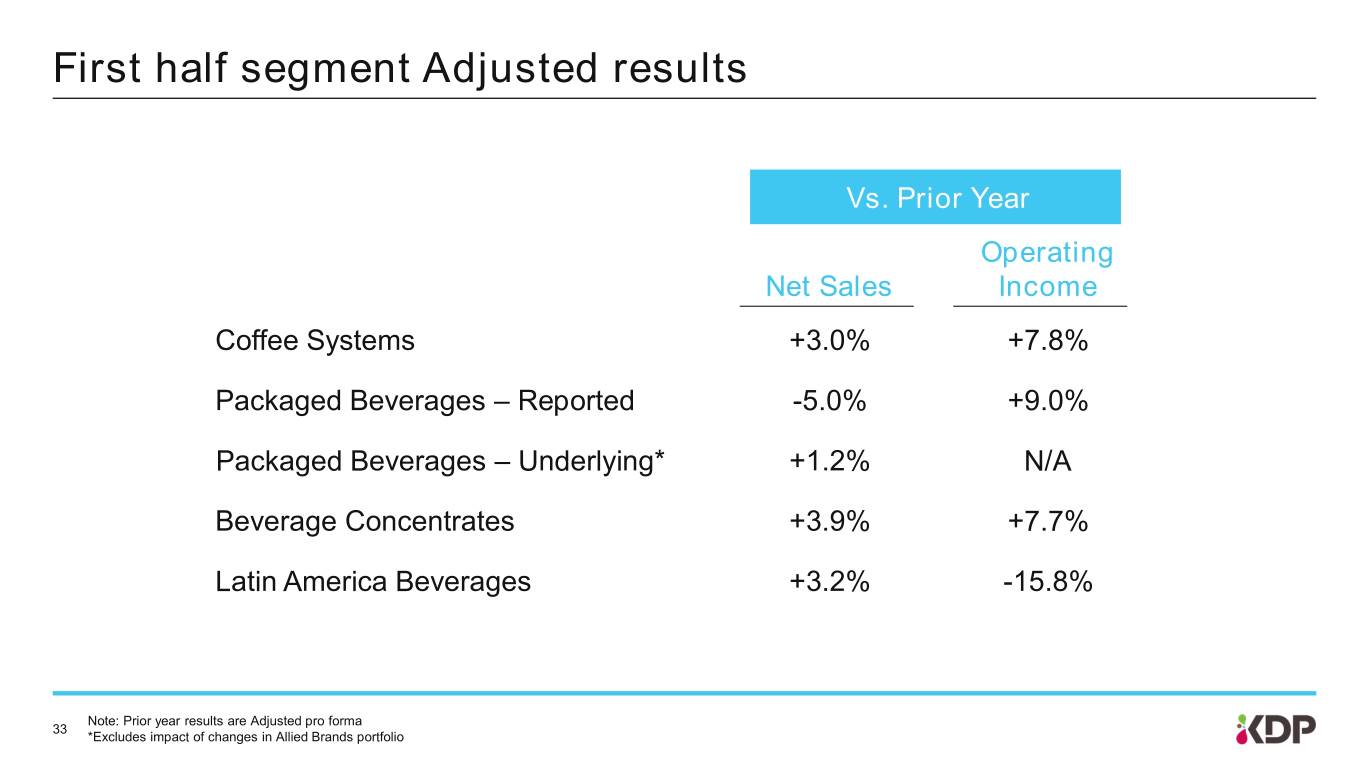
First half segment Adjusted results Vs. Prior Year Operating Net Sales Income Coffee Systems +3.0% +7.8% Packaged Beverages – Reported -5.0% +9.0% Packaged Beverages – Underlying* +1.2% N/A Beverage Concentrates +3.9% +7.7% Latin America Beverages +3.2% -15.8% Note: Prior year results are Adjusted pro forma 33 *Excludes impact of changes in Allied Brands portfolio
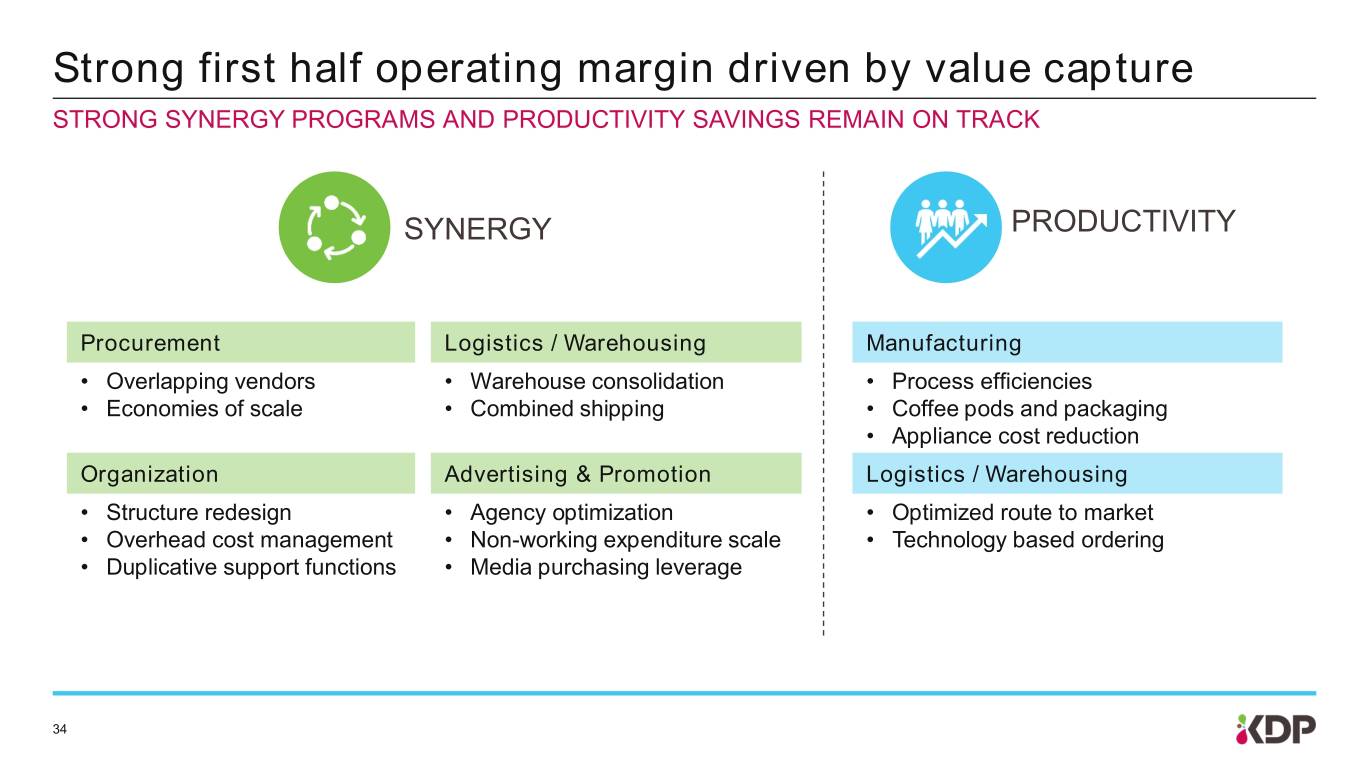
Strong first half operating margin driven by value capture STRONG SYNERGY PROGRAMS AND PRODUCTIVITY SAVINGS REMAIN ON TRACK SYNERGY PRODUCTIVITY Procurement Logistics / Warehousing Manufacturing • Overlapping vendors • Warehouse consolidation • Process efficiencies • Economies of scale • Combined shipping • Coffee pods and packaging • Appliance cost reduction Organization Advertising & Promotion Logistics / Warehousing • Structure redesign • Agency optimization • Optimized route to market • Overhead cost management • Non-working expenditure scale • Technology based ordering • Duplicative support functions • Media purchasing leverage 34
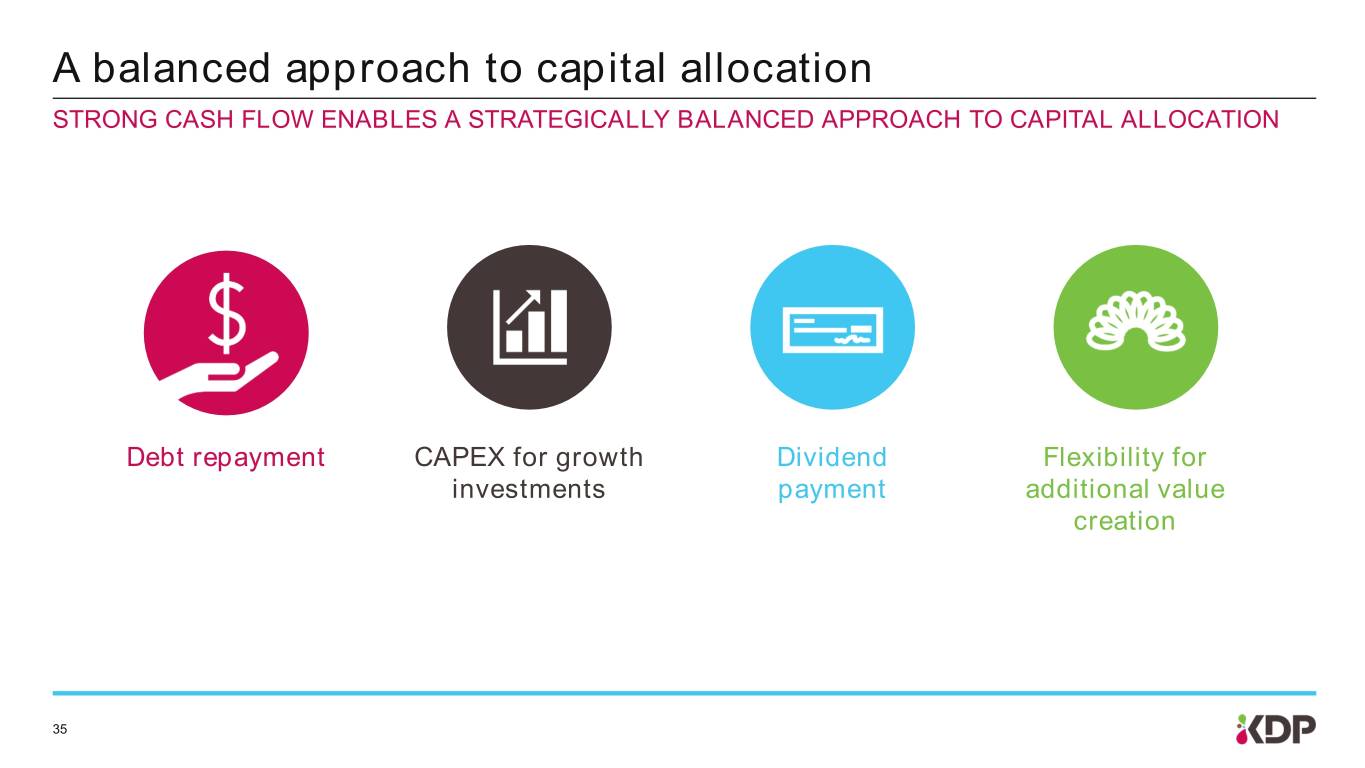
A balanced approach to capital allocation STRONG CASH FLOW ENABLES A STRATEGICALLY BALANCED APPROACH TO CAPITAL ALLOCATION Debt repayment CAPEX for growth Dividend Flexibility for investments payment additional value creation 35

Significant debt reduction one year after acquisition Net Debt KDP Management Leverage Ratio* -$1.6bn -1.1x $16.8bn 6.0x 5.4x 4.9x $15.8bn $15.1bn 7/9/2018 12/31/2018 6/30/2019 7/9/18 12/31/18 6/30/19 Note: Net debt defined as debt less unrestricted cash and cash equivalents and excluding capital leases and structured payables. Minor differences due to rounding. 36 *See Management Leverage Ratio reconciliation and calculation in Appendix.

2019 Outlook on an Adjusted basis IN LINE WITH MERGER TARGETS 2019 FY Net Sales Growth – Reported +1% - +2% Net Sales Growth – Underlying1 +2% - +3% Earnings Per Share $1.20 - $1.22 % vs. Prior Year +15 - 17% Free Cash Flow2 $2.3 - $2.5bn Management Leverage Ratio 4.4x - 4.5x Note: Prior year results are Adjusted pro forma 37 1Excludes impact of changes in Allied Brands portfolio 2Cash Flow from operations plus proceeds from sales of property, plant and equipment less Capital Expenditures

Agenda Overview Portfolio Selling & Distribution Financial Update Closing 38
Closing Thoughts • Successful integration into one company, with continued strength in business momentum • Delivered/exceeded financial goals in first year, with significant debt reduction and value capture • Well-positioned to capitalize on further growth and white space opportunities • On track to deliver long-term targets
APPENDIX
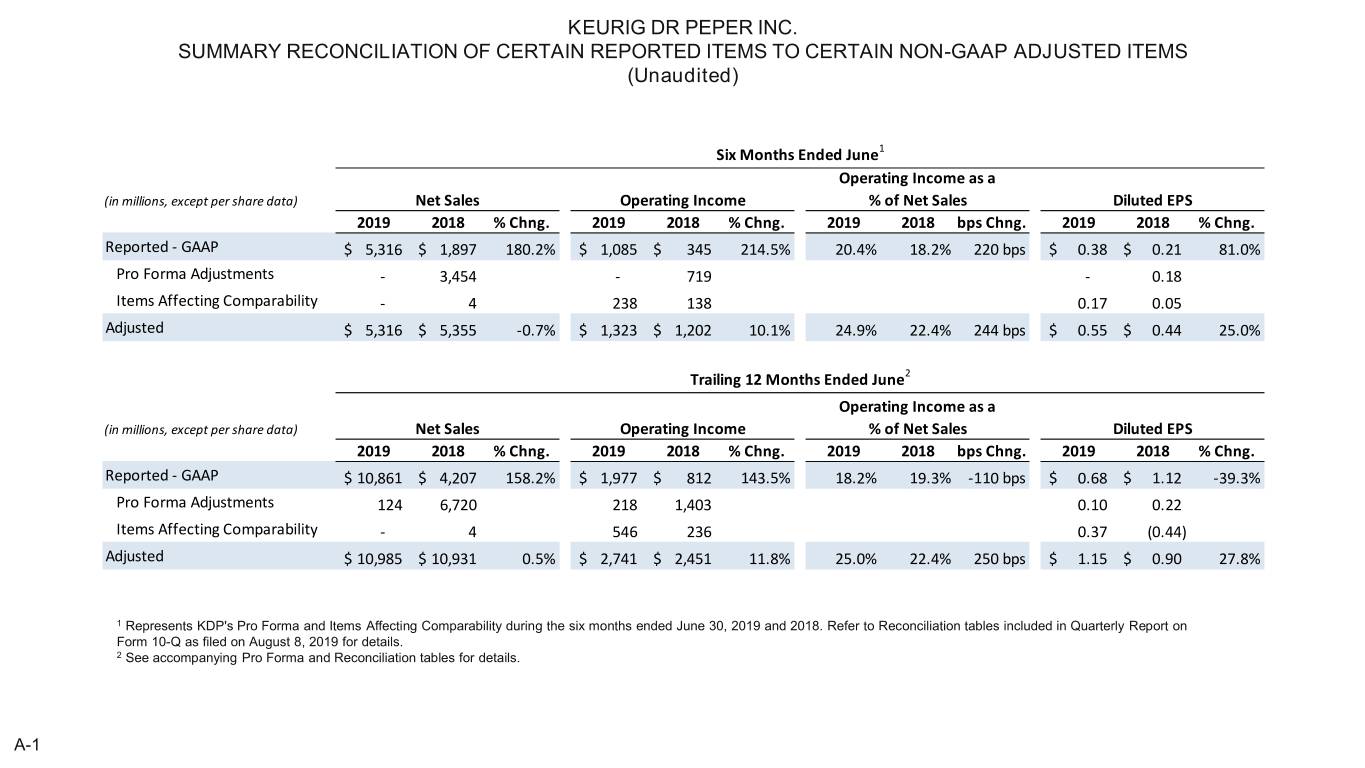
KEURIG DR PEPER INC. SUMMARY RECONCILIATION OF CERTAIN REPORTED ITEMS TO CERTAIN NON-GAAP ADJUSTED ITEMS (Unaudited) Six Months Ended June1 Operating Income as a (in millions, except per share data) Net Sales Operating Income % of Net Sales Diluted EPS 2019 2018 % Chng. 2019 2018 % Chng. 2019 2018 bps Chng. 2019 2018 % Chng. Reported - GAAP $ 5,316 $ 1,897 180.2% $ 1,085 $ 345 214.5% 20.4% 18.2% 220 bps $ 0.38 $ 0.21 81.0% Pro Forma Adjustments - 3,454 - 719 - 0.18 Items Affecting Comparability - 4 238 138 0.17 0.05 Adjusted $ 5,316 $ 5,355 -0.7% $ 1,323 $ 1,202 10.1% 24.9% 22.4% 244 bps $ 0.55 $ 0.44 25.0% Trailing 12 Months Ended June2 Operating Income as a (in millions, except per share data) Net Sales Operating Income % of Net Sales Diluted EPS 2019 2018 % Chng. 2019 2018 % Chng. 2019 2018 bps Chng. 2019 2018 % Chng. Reported - GAAP $ 10,861 $ 4,207 158.2% $ 1,977 $ 812 143.5% 18.2% 19.3% -110 bps $ 0.68 $ 1.12 -39.3% Pro Forma Adjustments 124 6,720 218 1,403 0.10 0.22 Items Affecting Comparability - 4 546 236 0.37 (0.44) Adjusted $ 10,985 $ 10,931 0.5% $ 2,741 $ 2,451 11.8% 25.0% 22.4% 250 bps $ 1.15 $ 0.90 27.8% 1 Represents KDP's Pro Forma and Items Affecting Comparability during the six months ended June 30, 2019 and 2018. Refer to Reconciliation tables included in Quarterly Report on Form 10-Q as filed on August 8, 2019 for details. 2 See accompanying Pro Forma and Reconciliation tables for details. A-1
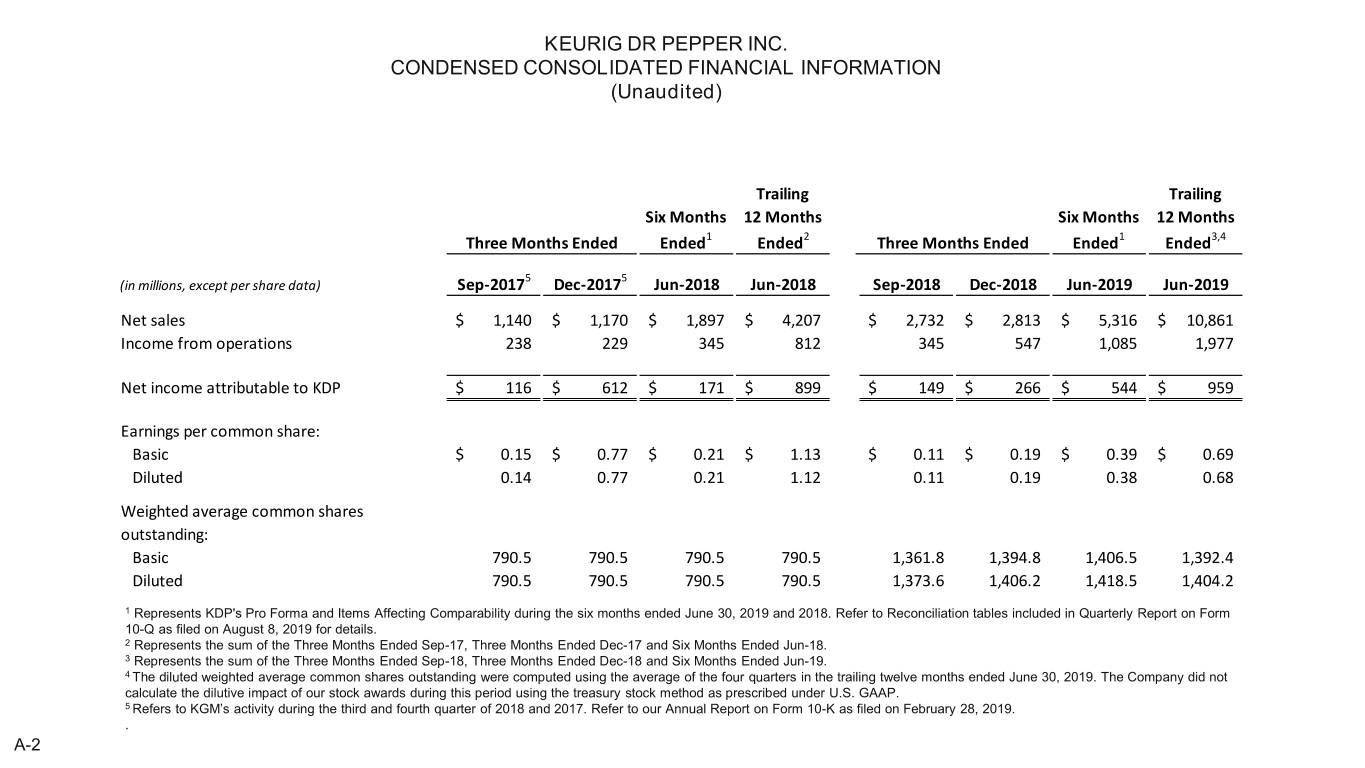
KEURIG DR PEPPER INC. CONDENSED CONSOLIDATED FINANCIAL INFORMATION (Unaudited) Trailing Trailing Six Months 12 Months Six Months 12 Months Three Months Ended Ended1 Ended2 Three Months Ended Ended1 Ended3,4 5 5 (in millions, except per share data) Sep-2017 Dec-2017 Jun-2018 Jun-2018 Sep-2018 Dec-2018 Jun-2019 Jun-2019 Net sales $ 1,140 $ 1,170 $ 1,897 $ 4,207 $ 2,732 $ 2,813 $ 5,316 $ 10,861 Income from operations 238 229 345 812 345 547 1,085 1,977 Net income attributable to KDP $ 116 $ 612 $ 171 $ 899 $ 149 $ 266 $ 544 $ 959 Earnings per common share: Basic $ 0.15 $ 0.77 $ 0.21 $ 1.13 $ 0.11 $ 0.19 $ 0.39 $ 0.69 Diluted 0.14 0.77 0.21 1.12 0.11 0.19 0.38 0.68 Weighted average common shares outstanding: Basic 790.5 790.5 790.5 790.5 1,361.8 1,394.8 1,406.5 1,392.4 Diluted 790.5 790.5 790.5 790.5 1,373.6 1,406.2 1,418.5 1,404.2 1 Represents KDP's Pro Forma and Items Affecting Comparability during the six months ended June 30, 2019 and 2018. Refer to Reconciliation tables included in Quarterly Report on Form 10-Q as filed on August 8, 2019 for details. 2 Represents the sum of the Three Months Ended Sep-17, Three Months Ended Dec-17 and Six Months Ended Jun-18. 3 Represents the sum of the Three Months Ended Sep-18, Three Months Ended Dec-18 and Six Months Ended Jun-19. 4 The diluted weighted average common shares outstanding were computed using the average of the four quarters in the trailing twelve months ended June 30, 2019. The Company did not calculate the dilutive impact of our stock awards during this period using the treasury stock method as prescribed under U.S. GAAP. 5 Refers to KGM’s activity during the third and fourth quarter of 2018 and 2017. Refer to our Annual Report on Form 10-K as filed on February 28, 2019. . A-2

Summary of Pro Forma Adjustments Pro forma adjustments included in the Pro Forma Combined Statements of Income are as follows: a. A decrease in Net sales to remove the historical deferred revenue associated with DPS' arrangements with PepsiCo, Inc. and The Coca-Cola Company, which were eliminated in the fair value adjustments for DPS as part of purchase price accounting. b. An increase in Net sales to remove the historical amortization of certain capitalized upfront customer incentive program payments. These were eliminated in the fair value adjustments for DPS as these upfront payments were revalued within the customer relationship intangible assets recorded in purchase price accounting. c. Adjustments to Selling, general and administrative ("SG&A") expenses due to changes in amortization as a result of the fair value adjustments for DPS' intangible assets with definite lives as part of purchase price accounting. d. Adjustments to SG&A expenses due to changes in depreciation as a result of the fair value adjustments for DPS' property, plant and equipment as part of purchase price accounting. e. A decrease to SG&A expenses for both DPS and KDP (Maple) to remove non-recurring transaction costs as a result of the Transaction. f. Removal of the Interest expense - related party caption for KDP (Maple), as the related party debt was capitalized into Additional paid-in capital immediately prior to the Transaction. g. Adjustments to Interest expense to remove the historical amortization of deferred debt issuance costs, discounts and premiums and to record incremental amortization as a result of the fair value adjustments for DPS' senior unsecured notes as part of purchase price accounting. h. Adjustments to Interest expense to record incremental interest expense and amortization of deferred debt issuance costs for borrowings related to the Transaction. i. Removal of the Net income attributable to employee redeemable non-controlling interest and mezzanine equity awards caption as the Maple non-controlling interest was eliminated to reflect the capital structure of the combined company. Summary of Reclassifications Reclassifications included in the Pro Forma Combined Statements of Income are as follows: a. Foreign currency transaction gains and losses were reclassified from Cost of sales and SG&A expenses in the historical DPS Statements of Income to Other (income) expense, net. b. Depreciation and amortization expenses were reclassified from Depreciation and amortization in the historical DPS Statements of Income to SG&A expenses. c. Interest income was reclassified from Interest income in the historical DPS Statements of Income to Other (income) expense, net. A-3

KEURIG DR PEPPER INC. PRO FORMA CONDENSED FINANCIAL INFORMATION (Unaudited) Trailing 12 Six Months Months Ended Ended Jun-18 Three Months Ended Sep-17 Three Months Ended Dec-17 Jun-18 DPS DPS Third Reported Pro Forma Pro Forma Reported Fourth Pro Forma Pro Forma Pro Forma Pro Forma Quarter of KDP1 Adjustments3 Combined KDP1 Quarter of Adjustments3 Combined Combined5 Combined6 20172 20174 (in millions, except per share data) Net sales $ 1,140 $ 1,740 $ (104) $ 2,776 $ 1,170 $ 1,643 $ (13) $ 2,800 $ 5,351 $ 10,927 Income from operations 238 367 (37) 568 229 363 (9) 583 1,064 2,215 Net Income attributable to KDP 116 203 (66) 253 612 508 (46) 1,074 534 1,861 Earnings per common share: Basic $ 0.15 $ 1.12 $ 0.18 $ 0.77 $ 2.82 $ 0.77 $ 0.39 $ 1.34 Diluted $ 0.14 $ 1.11 $ 0.18 $ 0.77 $ 2.81 $ 0.77 $ 0.39 $ 1.34 Weighted average common shares outstanding: Basic 790.5 181.4 1,205.1 1,386.5 790.5 180.1 1,206.4 1,386.5 1,386.5 1,386.5 Diluted 790.5 182.1 1,204.4 1,386.5 790.5 180.8 1,205.7 1,386.5 1,386.5 1,386.5 1 Refer to Condensed Consolidated Financial Information on A-2. 2 Refers to DPS’s activity during the third quarter of 2017. Refer to Quarterly Report on Form 10-Q as filed on October 25, 2017. 3 Refer to the Summary of Pro Forma Adjustments on A-3. 4 Refers to DPS’s activity during the fourth quarter of 2017. Refer to Exhibit 99.1 to the Form 8-K on November 6, 2018. 5 Represents KDP's Pro Forma during the six months ended June 30, 2019 and 2018. Refer to Reconciliation tables included in Quarterly Report on Form 10-Q as filed on August 8, 2019 for details. 6 Represents the sum of the Three Months Ended Sep-17 Pro Forma Combined, Three Months Ended Dec-17 Pro Forma Combined and Six Months Ended Jun-18 Pro Forma Combined. A-4

KEURIG DR PEPPER INC. PRO FORMA CONDENSED FINANCIAL INFORMATION (Unaudited) Trailing Six Months 12 Months Three Months Ended Sep-18 Three Months Ended Dec-18 Ended Jun-19 Ended Jun-19 DPS July 1- Reported Pro Forma Pro Forma Reported Pro Forma Pro Forma Pro Forma July 8 Reported4 KDP1 Adjustments3 Combined KDP1 Adjustments3 Combined Combined5,6 20182 (in millions, except per share data) Net sales $ 2,732 $ 125 $ (1) $ 2,856 $ 2,813 $ - $ 2,813 $ 5,316 $ 10,985 Income from operations 345 (170) 391 566 547 (3) 544 1,085 2,195 Net Income attributable to KDP 149 (118) 269 300 266 (3) 263 544 1,107 Earnings per common share: Basic $ 0.11 $ 0.22 $ 0.19 $ 0.19 $ 0.39 $ 0.79 Diluted $ 0.11 $ 0.21 $ 0.19 $ 0.19 $ 0.38 $ 0.78 Weighted average common shares outstanding: Basic 1,361.8 27.2 1,389.0 1,394.8 1,394.8 1,406.5 1,399.2 Diluted 1,373.6 27.1 1,400.7 1,406.2 1,406.2 1,418.5 1,411.0 1 Refer to Condensed Consolidated Financial Ion A-2. 2 Refers to DPS’s activity during the first eight days of the third quarter of 2018. 3 Refer to the Summary of Pro Forma Adjustments on A-3. 4 Represents KDP's Pro Forma during the six months ended June 30, 2019 and 2018. Refer to Reconciliation tables included in Quarterly Report on Form 10-Q as filed on August 8, 2018 for details. 5 Represents the sum of the Three Months Ended Sep-18 Pro Forma Combined, Three Months Ended Dec-18 Pro Forma Combined and Six Months Ended Jun-19 Pro Forma Combined Reported. 6 The diluted weighted average common shares outstanding were computed using the average of the four quarters in the trailing twelve months ended June 30, 2019. The Company did not calculate the dilutive impact of our stock awards during this period using the treasury stock method as prescribed under U.S. GAAP. A-5
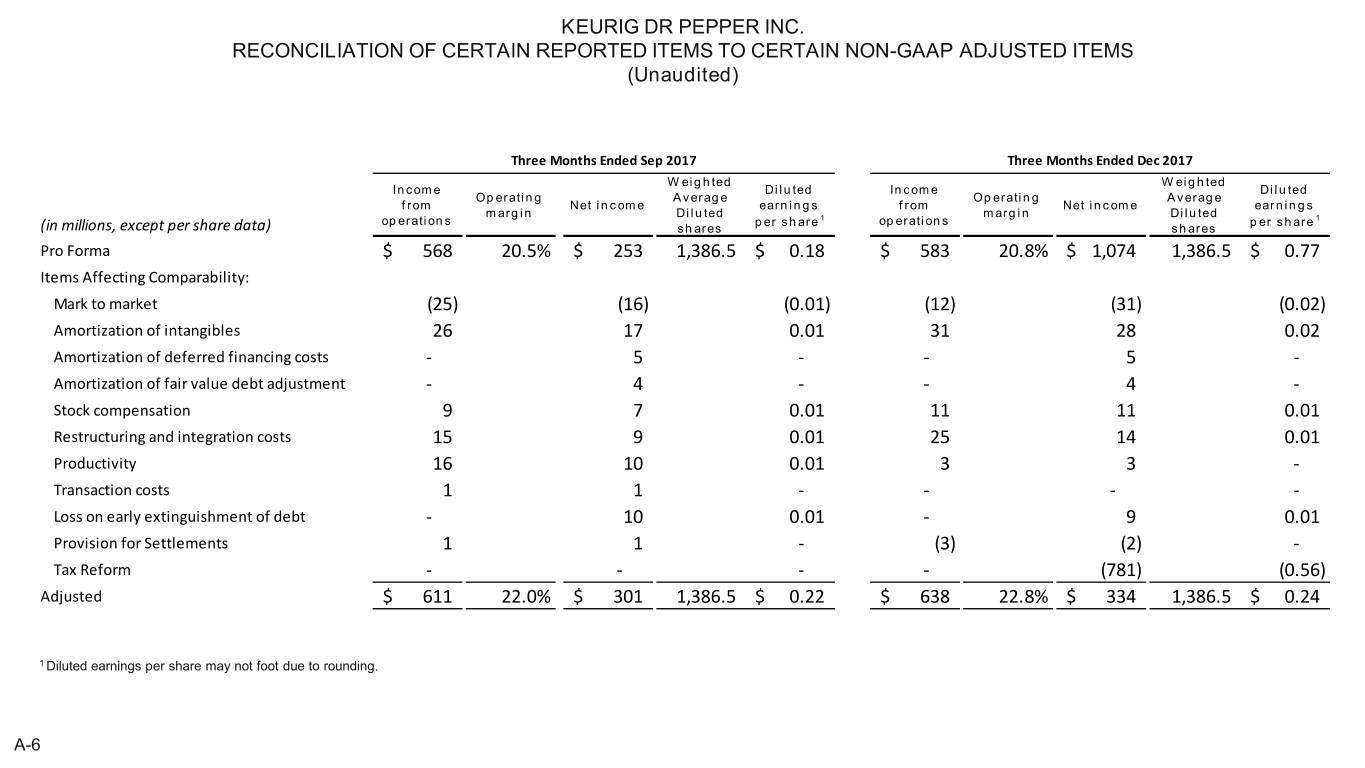
KEURIG DR PEPPER INC. RECONCILIATION OF CERTAIN REPORTED ITEMS TO CERTAIN NON-GAAP ADJUSTED ITEMS (Unaudited) Three Months Ended Sep 2017 Three Months Ended Dec 2017 W eighted W eighted Income Diluted Income Diluted Operating Average Operating Average from Net income earnings from Net income earnings margin Diluted margin Diluted operations per share 1 operations per share 1 (in millions, except per share data) shares shares Pro Forma $ 568 20.5% $ 253 1,386.5 $ 0.18 $ 583 20.8% $ 1,074 1,386.5 $ 0.77 Items Affecting Comparability: Mark to market (25) (16) (0.01) (12) (31) (0.02) Amortization of intangibles 26 17 0.01 31 28 0.02 Amortization of deferred financing costs - 5 - - 5 - Amortization of fair value debt adjustment - 4 - - 4 - Stock compensation 9 7 0.01 11 11 0.01 Restructuring and integration costs 15 9 0.01 25 14 0.01 Productivity 16 10 0.01 3 3 - Transaction costs 1 1 - - - - Loss on early extinguishment of debt - 10 0.01 - 9 0.01 Provision for Settlements 1 1 - (3) (2) - Tax Reform - - - - (781) (0.56) Adjusted $ 611 22.0% $ 301 1,386.5 $ 0.22 $ 638 22.8% $ 334 1,386.5 $ 0.24 1 Diluted earnings per share may not foot due to rounding. A-6
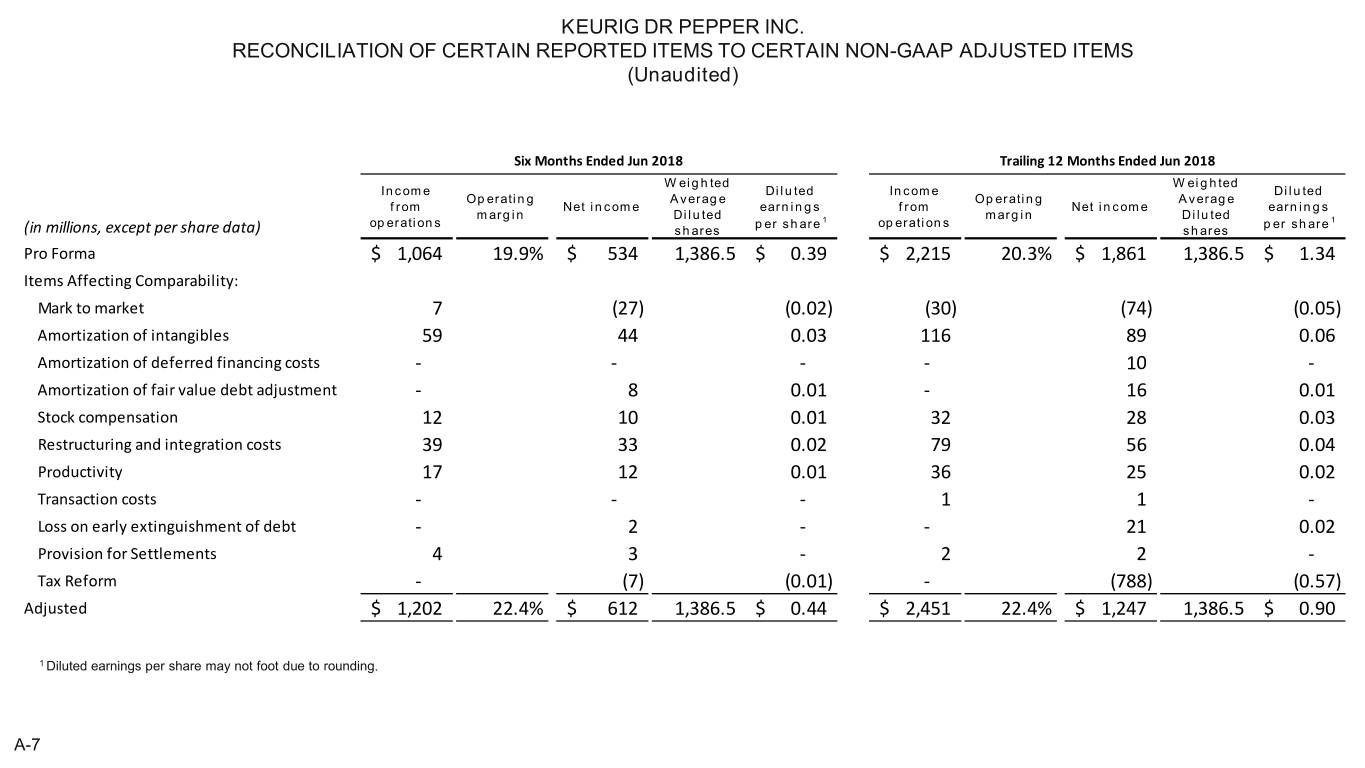
KEURIG DR PEPPER INC. RECONCILIATION OF CERTAIN REPORTED ITEMS TO CERTAIN NON-GAAP ADJUSTED ITEMS (Unaudited) Six Months Ended Jun 2018 Trailing 12 Months Ended Jun 2018 W eighted W eighted Income Diluted Income Diluted Operating Average Operating Average from Net income earnings from Net income earnings margin Diluted margin Diluted operations per share 1 operations per share 1 (in millions, except per share data) shares shares Pro Forma $ 1,064 19.9% $ 534 1,386.5 $ 0.39 $ 2,215 20.3% $ 1,861 1,386.5 $ 1.34 Items Affecting Comparability: Mark to market 7 (27) (0.02) (30) (74) (0.05) Amortization of intangibles 59 44 0.03 116 89 0.06 Amortization of deferred financing costs - - - - 10 - Amortization of fair value debt adjustment - 8 0.01 - 16 0.01 Stock compensation 12 10 0.01 32 28 0.03 Restructuring and integration costs 39 33 0.02 79 56 0.04 Productivity 17 12 0.01 36 25 0.02 Transaction costs - - - 1 1 - Loss on early extinguishment of debt - 2 - - 21 0.02 Provision for Settlements 4 3 - 2 2 - Tax Reform - (7) (0.01) - (788) (0.57) Adjusted $ 1,202 22.4% $ 612 1,386.5 $ 0.44 $ 2,451 22.4% $ 1,247 1,386.5 $ 0.90 1 Diluted earnings per share may not foot due to rounding. A-7
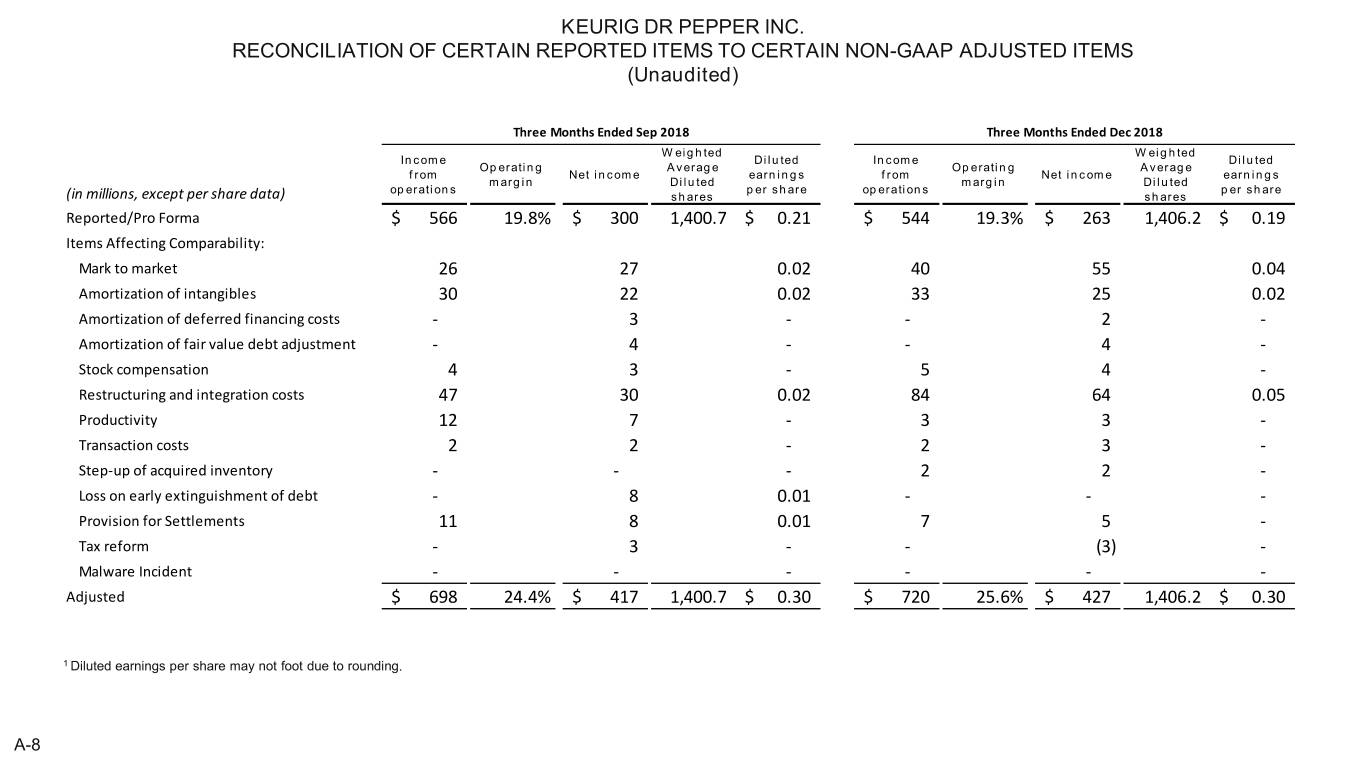
KEURIG DR PEPPER INC. RECONCILIATION OF CERTAIN REPORTED ITEMS TO CERTAIN NON-GAAP ADJUSTED ITEMS (Unaudited) Three Months Ended Sep 2018 Three Months Ended Dec 2018 W eighted W eighted Income Diluted Income Diluted Operating Average Operating Average from Net income earnings from Net income earnings margin Diluted margin Diluted operations per share operations per share (in millions, except per share data) shares shares Reported/Pro Forma $ 566 19.8% $ 300 1,400.7 $ 0.21 $ 544 19.3% $ 263 1,406.2 $ 0.19 Items Affecting Comparability: Mark to market 26 27 0.02 40 55 0.04 Amortization of intangibles 30 22 0.02 33 25 0.02 Amortization of deferred financing costs - 3 - - 2 - Amortization of fair value debt adjustment - 4 - - 4 - Stock compensation 4 3 - 5 4 - Restructuring and integration costs 47 30 0.02 84 64 0.05 Productivity 12 7 - 3 3 - Transaction costs 2 2 - 2 3 - Step-up of acquired inventory - - - 2 2 - Loss on early extinguishment of debt - 8 0.01 - - - Provision for Settlements 11 8 0.01 7 5 - Tax reform - 3 - - (3) - Malware Incident - - - - - - Adjusted $ 698 24.4% $ 417 1,400.7 $ 0.30 $ 720 25.6% $ 427 1,406.2 $ 0.30 1 Diluted earnings per share may not foot due to rounding. A-8

KEURIG DR PEPPER INC. RECONCILIATION OF CERTAIN REPORTED ITEMS TO CERTAIN NON-GAAP ADJUSTED ITEMS (Unaudited) Six Months Ended Jun 2019 Trailing 12 Months Ended Jun 2019 W eighted W eighted Income Diluted Income Diluted Operating Average Operating Average from Net income earnings from Net income earnings margin Diluted margin Diluted operations per share operations per share (in millions, except per share data) shares shares Reported/Pro Forma $ 1,085 20.4% $ 544 1,418.5 $ 0.38 $ 2,195 20.0% $ 1,107 1,411.0 $ 0.78 Items Affecting Comparability: Mark to market (8) 26 0.02 58 108 0.08 Amortization of intangibles 63 46 0.03 126 93 0.07 Amortization of deferred financing costs - 5 - - 10 - Amortization of fair value debt adjustment - 11 0.01 - 19 0.01 Stock compensation 15 11 0.01 24 18 0.01 Restructuring and integration costs 99 73 0.05 230 167 0.12 Productivity 42 33 0.02 57 43 0.02 Transaction costs 1 10 0.01 5 15 0.01 Step-up of acquired inventory 3 2 - 5 4 - Loss on early extinguishment of debt - 7 - - 15 0.01 Provision for Settlements 15 11 0.01 33 24 0.02 Tax reform - - - - - - Malware Incident 8 6 - 8 6 - Adjusted $ 1,323 24.9% $ 785 1,418.5 $ 0.55 $ 2,741 25.0% $ 1,629 1,411.0 $ 1.15 1 Diluted earnings per share may not foot due to rounding. A-9
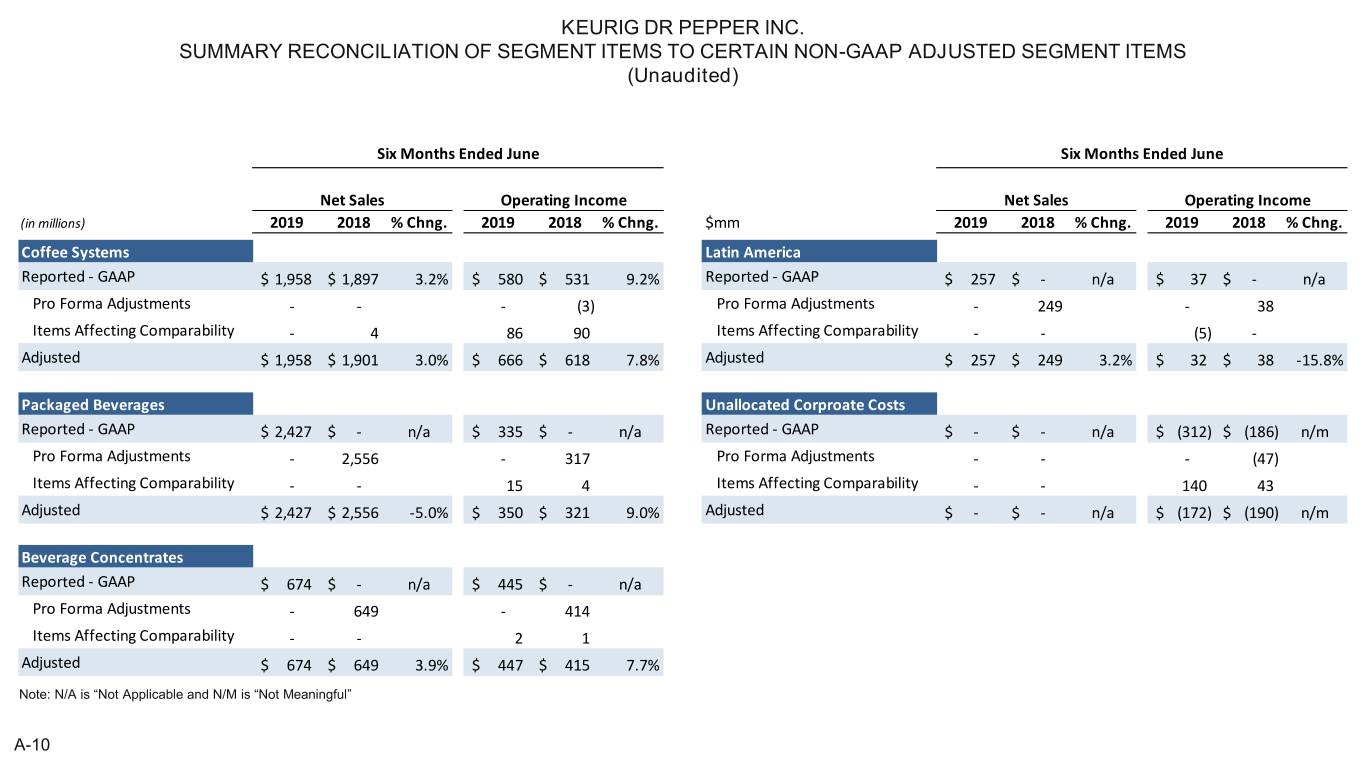
KEURIG DR PEPPER INC. SUMMARY RECONCILIATION OF SEGMENT ITEMS TO CERTAIN NON-GAAP ADJUSTED SEGMENT ITEMS (Unaudited) Six Months Ended June Six Months Ended June Net Sales Operating Income Net Sales Operating Income (in millions) 2019 2018 % Chng. 2019 2018 % Chng. $mm 2019 2018 % Chng. 2019 2018 % Chng. Coffee Systems Latin America Reported - GAAP $ 1,958 $ 1,897 3.2% $ 580 $ 531 9.2% Reported - GAAP $ 257 $ - n/a $ 37 $ - n/a Pro Forma Adjustments - - - (3) Pro Forma Adjustments - 249 - 38 Items Affecting Comparability - 4 86 90 Items Affecting Comparability - - (5) - Adjusted $ 1,958 $ 1,901 3.0% $ 666 $ 618 7.8% Adjusted $ 257 $ 249 3.2% $ 32 $ 38 -15.8% Packaged Beverages Unallocated Corproate Costs Reported - GAAP $ 2,427 $ - n/a $ 335 $ - n/a Reported - GAAP $ - $ - n/a $ (312) $ (186) n/m Pro Forma Adjustments - 2,556 - 317 Pro Forma Adjustments - - - (47) Items Affecting Comparability - - 15 4 Items Affecting Comparability - - 140 43 Adjusted $ 2,427 $ 2,556 -5.0% $ 350 $ 321 9.0% Adjusted $ - $ - n/a $ (172) $ (190) n/m Beverage Concentrates Reported - GAAP $ 674 $ - n/a $ 445 $ - n/a Pro Forma Adjustments - 649 - 414 Items Affecting Comparability - - 2 1 Adjusted $ 674 $ 649 3.9% $ 447 $ 415 7.7% Note: N/A is “Not Applicable and N/M is “Not Meaningful” A-10
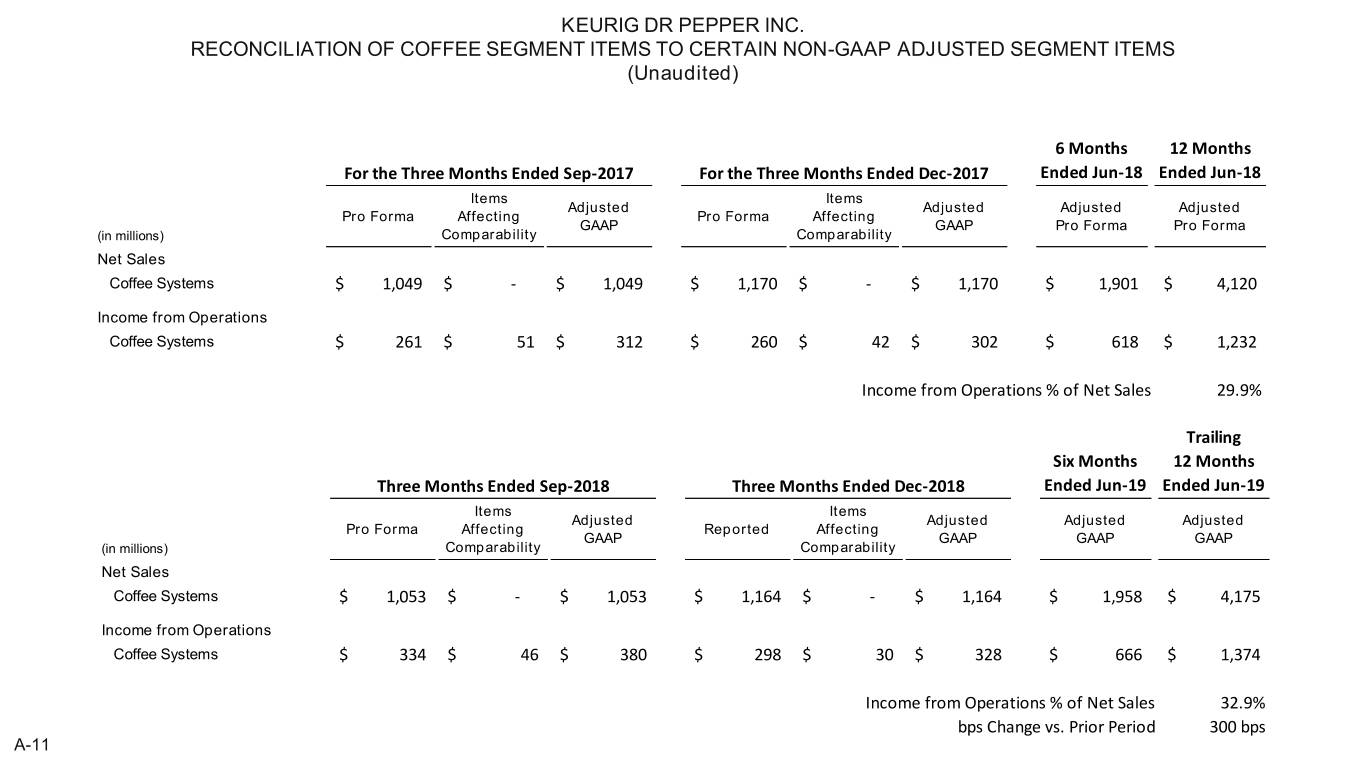
KEURIG DR PEPPER INC. RECONCILIATION OF COFFEE SEGMENT ITEMS TO CERTAIN NON-GAAP ADJUSTED SEGMENT ITEMS (Unaudited) 6 Months 12 Months For the Three Months Ended Sep-2017 For the Three Months Ended Dec-2017 Ended Jun-18 Ended Jun-18 Items Items Adjusted Adjusted Adjusted Adjusted Pro Forma Affecting Pro Forma Affecting GAAP GAAP Pro Forma Pro Forma (in millions) Comparability Comparability Net Sales Coffee Systems $ 1,049 $ - $ 1,049 $ 1,170 $ - $ 1,170 $ 1,901 $ 4,120 Income from Operations Coffee Systems $ 261 $ 51 $ 312 $ 260 $ 42 $ 302 $ 618 $ 1,232 Income from Operations % of Net Sales 29.9% Trailing Six Months 12 Months Three Months Ended Sep-2018 Three Months Ended Dec-2018 Ended Jun-19 Ended Jun-19 Items Items Adjusted Adjusted Adjusted Adjusted Pro Forma Affecting Reported Affecting GAAP GAAP GAAP GAAP (in millions) Comparability Comparability Net Sales Coffee Systems $ 1,053 $ - $ 1,053 $ 1,164 $ - $ 1,164 $ 1,958 $ 4,175 Income from Operations Coffee Systems $ 334 $ 46 $ 380 $ 298 $ 30 $ 328 $ 666 $ 1,374 Income from Operations % of Net Sales 32.9% bps Change vs. Prior Period 300 bps A-11
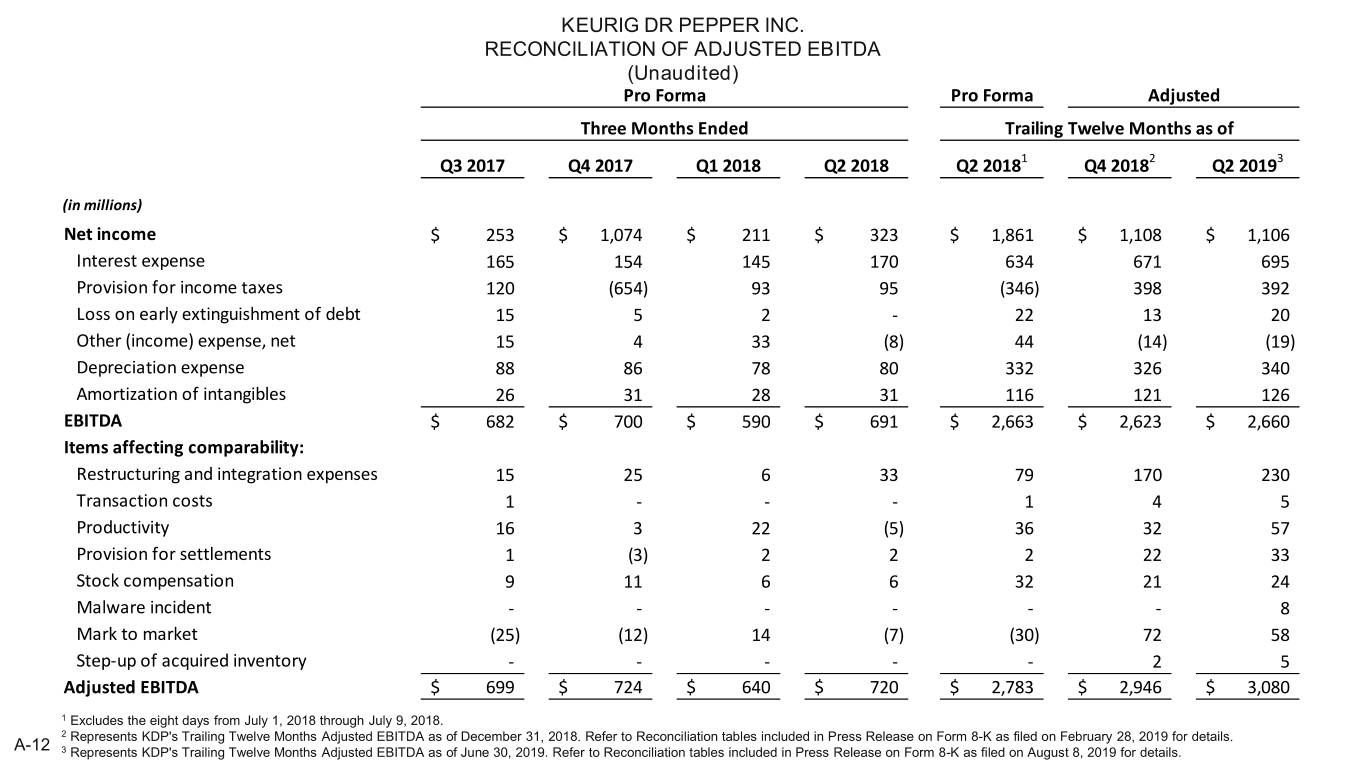
KEURIG DR PEPPER INC. RECONCILIATION OF ADJUSTED EBITDA (Unaudited) Pro Forma Pro Forma Adjusted Three Months Ended Trailing Twelve Months as of Q3 2017 Q4 2017 Q1 2018 Q2 2018 Q2 20181 Q4 20182 Q2 20193 (in millions) Net income $ 253 $ 1,074 $ 211 $ 323 $ 1,861 $ 1,108 $ 1,106 Interest expense 165 154 145 170 634 671 695 Provision for income taxes 120 (654) 93 95 (346) 398 392 Loss on early extinguishment of debt 15 5 2 - 22 13 20 Other (income) expense, net 15 4 33 (8) 44 (14) (19) Depreciation expense 88 86 78 80 332 326 340 Amortization of intangibles 26 31 28 31 116 121 126 EBITDA $ 682 $ 700 $ 590 $ 691 $ 2,663 $ 2,623 $ 2,660 Items affecting comparability: Restructuring and integration expenses 15 25 6 33 79 170 230 Transaction costs 1 - - - 1 4 5 Productivity 16 3 22 (5) 36 32 57 Provision for settlements 1 (3) 2 2 2 22 33 Stock compensation 9 11 6 6 32 21 24 Malware incident - - - - - - 8 Mark to market (25) (12) 14 (7) (30) 72 58 Step-up of acquired inventory - - - - - 2 5 Adjusted EBITDA $ 699 $ 724 $ 640 $ 720 $ 2,783 $ 2,946 $ 3,080 1 Excludes the eight days from July 1, 2018 through July 9, 2018. 2 Represents KDP's Trailing Twelve Months Adjusted EBITDA as of December 31, 2018. Refer to Reconciliation tables included in Press Release on Form 8-K as filed on February 28, 2019 for details. A-12 3 Represents KDP's Trailing Twelve Months Adjusted EBITDA as of June 30, 2019. Refer to Reconciliation tables included in Press Release on Form 8-K as filed on August 8, 2019 for details.
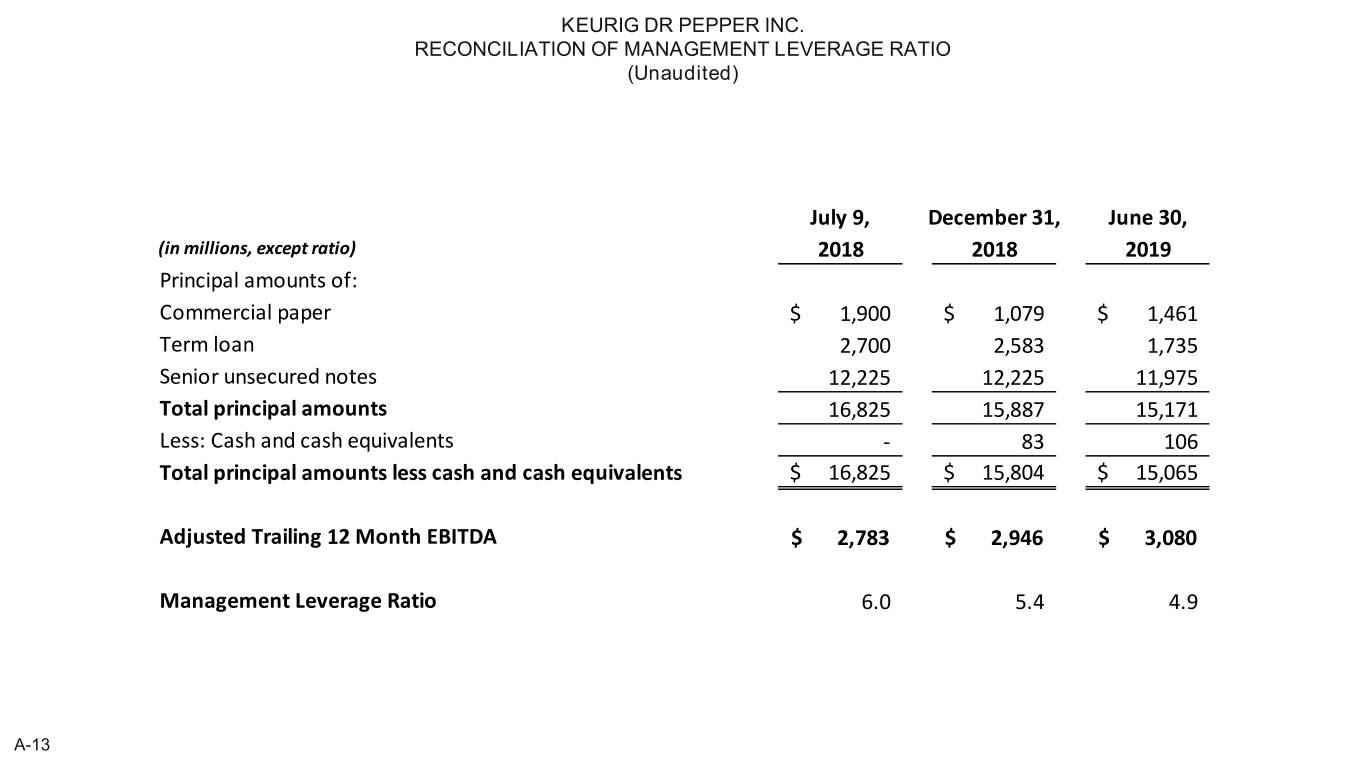
KEURIG DR PEPPER INC. RECONCILIATION OF MANAGEMENT LEVERAGE RATIO (Unaudited) July 9, December 31, June 30, (in millions, except ratio) 2018 2018 2019 Principal amounts of: Commercial paper $ 1,900 $ 1,079 $ 1,461 Term loan 2,700 2,583 1,735 Senior unsecured notes 12,225 12,225 11,975 Total principal amounts 16,825 15,887 15,171 Less: Cash and cash equivalents - 83 106 Total principal amounts less cash and cash equivalents $ 16,825 $ 15,804 $ 15,065 Adjusted Trailing 12 Month EBITDA $ 2,783 $ 2,946 $ 3,080 Management Leverage Ratio 6.0 5.4 4.9 A-13

KEURIG DR PEPPER INC. RECONCILIATION OF NET CASH PROVIDED BY OPERATING ACTIVITIES TO FREE CASH FLOW (Unaudited) Free cash flow is defined as net cash provided by operating activities adjusted for purchases of property, plant and equipment, proceeds from sales of property, plant and equipment, and certain items excluded for comparison to prior year periods. For the first six m onths of 2019 and 2018, there were no certain items excluded for comparison to prior year periods. First Six Months (in millions) 2019 2018 Net cash provided by operating activities $ 1,203 $ 578 Purchases of property, plant and equipment (118) (44) Proceeds from sales of property, plant and equipment 19 - Free Cash Flow $ 1,104 $ 534 A-14


