UNITED STATES
SECURITIES AND EXCHANGE COMMISSION
Washington, D.C. 20549
FORM N-CSR
CERTIFIED SHAREHOLDER REPORT OF REGISTERED MANAGEMENT INVESTMENT COMPANIES
Investment Company Act file number 811-22148
PowerShares Actively Managed Exchange-Traded Fund Trust
(Exact name of registrant as specified in charter)
3500 Lacey Road
Downers Grove, IL 60515
(Address of principal executive offices) (Zip code)
Andrew Schlossberg
President
3500 Lacey Road
Downers Grove, IL 60515
(Name and address of agent for service)
Registrant’s telephone number, including area code: 800-983-0903
Date of fiscal year end: October 31
Date of reporting period: October 31, 2014
Item 1. Reports to Stockholders.
The Registrant’s annual report transmitted to shareholders pursuant to Rule 30e-1 under the Investment Company Act of 1940 is as follows:

| October 31, 2014 |
2014 Annual Report to Shareholders
| PSR | PowerShares Active U.S. Real Estate Fund | |
| CHNA | PowerShares China A-Share Portfolio | |
| LALT | PowerShares Multi-Strategy Alternative Portfolio | |
| PHDG | PowerShares S&P 500® Downside Hedged Portfolio | |

| 2 |
|
Fixed Income
The fiscal year began with uncertainty over future policies of the US Federal Reserve (the Fed), especially its quantitative easing program, which was the primary driver of bond market volatility that lasted through the fourth quarter of 2013. The yield of the benchmark 10-year Treasury note crossed the 3% threshold for the first time in more than two years by the end of December.
During the first half of 2014, bond market returns generally were positive, as they were strengthened by a general decline in yields due to renewed concerns over US economic growth following unexpectedly disruptive winter weather in the first quarter of 2014. Yields also were pushed lower due to demand driven by rising tensions in Eastern Europe and the Middle East, which prompted investors to seek safety. The yield on the 10-year Treasury note fell to 2.5% by the end of June. This happened despite the Fed’s tapering of its quantitative easing via bond purchases from $85 billion per month in January to $35 billion per month at the end of June.
Meanwhile, improved economic data, central bank stimulus and investors’ demand for yield drove rallies in credit-related markets, such as emerging market debt and high yield corporate bonds. The returns for these two market sectors provided nearly double the return of the global investment-grade market for the same period, as measured by their respective Barclays indexes. A favorable supply/demand dynamic and solid credit fundamentals supported the “risk-on” environment throughout most of the year, although these markets endured notable volatility near the end of the reporting period. As the period drew to a close, investors once again favored credit risk assets despite slower economic activity and escalating geopolitical concerns.
Domestic Equity
The US economy remained “good but not great” during the fiscal year ended October 31, 2014. Slow but steady growth, helped by historically low interest rates, generally drove US equity markets higher during the reporting period. The fiscal year began with renewed optimism after it became apparent that a two-week federal government shutdown in 2013 had not derailed the economy. Evidence of economic improvement caused the US equity market to rally in late 2013, despite the announcement by the Fed in December that it would begin reducing the scope of its asset purchase program in early 2014. The US stock market turned volatile in the first months of 2014, as investors began to worry that stocks may have risen too far, too fast. Unusually cold winter weather negatively affected consumers, and the US economy contracted in the first quarter before rebounding strongly in the second quarter. While corporate earnings generally were resilient throughout the fiscal year, driven by strong profitability across many sectors, investors worried about political developments in Ukraine and signs of economic sluggishness in China. Toward the end of the reporting period, a sharp drop in
global oil prices, evidence of economic stagnation in Europe and concern about the first cases of Ebola in the US increased US equity market volatility.
International Equity
Global equity markets generally rose during the fiscal year ended October 31, 2014, on signs that economic growth was accelerating as a result of the loose monetary policies of many developed countries’ central banks. While 2014 began on an optimistic note, global equity markets pulled back at various points in reaction to economic and geopolitical concerns. These concerns included worries about potentially negative effects of the Fed reducing the scope of its asset purchase program beginning in early 2014, an Argentine sovereign bond default and eurozone banking concerns. Global equity markets also fell as geopolitical tensions in Ukraine and the Middle East weakened the outlook for global growth.
Advanced economies such as the UK and US saw a modest but stronger rebound than Europe, where a nascent recovery has stalled. A more supportive monetary policy in the eurozone may be positive for equity markets there, and we have seen evidence of earnings recovery coming through. Meanwhile, the Bank of Japan remained committed to extraordinary monetary stimulus. Consumer spending in Japan has been weak for some time, and retail sales and household spending increased only gradually during the reporting period—although improved corporate earnings were an encouraging sign.
Equity market performance in emerging markets was mixed. China continued to face headwinds and struggled to balance structural reforms with its desire to maintain satisfactory growth, while many countries in Asia, including India, Indonesia and the Philippines, experienced strong positive gains.
| 3 |
|
| PSR | Manager’s Analysis | |
| PowerShares Active U.S. Real Estate Fund (PSR) |
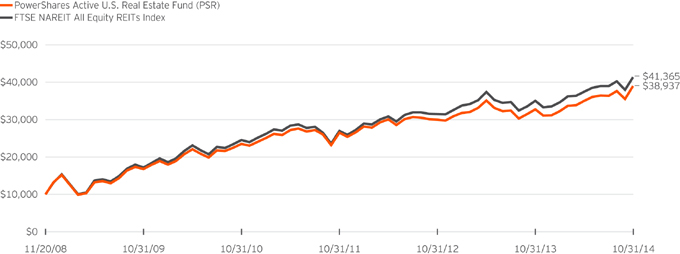
The PowerShares Active U.S. Real Estate Fund (the “Fund”) is an actively managed exchange-traded fund (“ETF”) whose investment objective is to achieve high total return through growth of capital and current income. The Fund seeks to achieve its investment objective by investing, under normal market conditions, at least 80% of its assets in securities of companies that are principally engaged in the U.S. real estate industry and included within the FTSE NAREIT All Equity REITs Index (the “Benchmark Index”). The Fund considers a company to be principally engaged in the U.S. real estate industry if it: (i) derives 50% of its revenues or profit from ownership, leasing, construction, financing or sale of U.S. real estate; or (ii) has at least 50% of the value of its assets invested in U.S. real estate. The Fund invests principally in equity real estate investment trusts (“REITs”). In constructing the portfolio, Invesco Advisers, Inc., the Fund’s sub-adviser, analyzes quantitative and statistical metrics to identify attractively priced securities.
For the fiscal year ended October 31, 2014, on a market price basis, the Fund returned 18.86%. On a net asset value (“NAV”) basis, the Fund returned 18.95%. During the same time period, the Benchmark Index returned 18.22%.
The majority of the Fund’s outperformance relative to the Benchmark Index during the period can be attributed to sub-industry allocation, including the Fund holding an underweight position in Crown Castle, a diversified REIT, an overweight position in Host Hotels, a hotel & resort, in addition to the Fund not holding American Realty Capital Properties, an office REIT.
For the fiscal year ended October 31, 2014, the retail REIT sub-industry contributed most significantly to the Fund’s return, followed by residential REIT and specialized REIT sub-industries, respectively. There were no detracting REIT sub-industries in the period.
Positions that contributed most significantly to the Fund’s return included Simon Property Group, Inc., a retail focused company (portfolio average weight of 7.53%) and American Tower Corp., a company which owns cellular towers (portfolio average weight of 6.30%). Positions that detracted most significantly from the Fund’s return included retail focused Washington Prime Group, Inc. (portfolio average weight of 0.41%) and Tanger Factory Outlet Centers, Inc. (portfolio average weight of 0.45%).
Property Type and Sub-Industry Breakdown as of October 31, 2014 | ||||
| Retail | 23.9 | |||
| Specialized | 19.8 | |||
| Residential | 14.1 | |||
| Office | 10.8 | |||
| Health Care | 10.5 | |||
| Hotel & Resort | 9.2 | |||
| Diversified | 7.3 | |||
| Industrial | 4.4 | |||
| Other Assets Less Liabilities | �� | (0.0) | ||
| Top Ten Fund Holdings (% of the Fund’s Net Assets) as of October 31, 2014 | ||||
| Security | ||||
| Simon Property Group, Inc. | 8.3 | |||
| American Tower Corp. | 6.6 | |||
| Essex Property Trust, Inc. | 3.9 | |||
| Weyerhaeuser Co. | 3.8 | |||
| Public Storage | 3.8 | |||
| AvalonBay Communities, Inc. | 3.7 | |||
| HCP, Inc. | 3.7 | |||
| Ventas, Inc. | 3.4 | |||
| Health Care REIT, Inc. | 3.4 | |||
| National Retail Properties, Inc. | 3.2 | |||
| Total | 43.8 | |||
| 4 |
|
PowerShares Active U.S. Real Estate Fund (PSR) (continued)
Growth of a $10,000 Investment Since Inception†
Fund Performance History as of October 31, 2014
| 1 Year | 3 Years Average Annualized | 3 Years Cumulative | 5 Years Average Annualized | 5 Years Cumulative | Fund Inception† | |||||||||||||||||||||||||
| Index | Average Annualized | Cumulative | ||||||||||||||||||||||||||||
| FTSE NAREIT All Equity REITs Index | 18.22 | % | 15.33 | % | 53.42 | % | 19.28 | % | 141.42 | % | 26.98 | % | 313.65 | % | ||||||||||||||||
| Fund | ||||||||||||||||||||||||||||||
| NAV Return | 18.95 | 13.73 | 47.11 | 18.38 | 132.49 | 25.69 | 289.37 | |||||||||||||||||||||||
| Market Price Return | 18.86 | 13.68 | 46.92 | 18.34 | 132.12 | 25.81 | 291.65 | |||||||||||||||||||||||
Fund Inception: November 20, 2008
Performance quoted above represents past performance. Past performance is not a guarantee of future results, and current performance may be higher or lower than performance quoted. Investment returns and principal value will fluctuate, and shares of the Fund (“Fund Shares”), when redeemed or sold, may be worth more or less than their original cost. According to the Fund’s current prospectus, the Fund’s expense ratio of 0.80% is expressed as a unitary management fee to cover operating expenses and expenses incurred in connection with managing the portfolio. NAV and Market Price returns assume that dividends and capital gain distributions have been reinvested in the Fund at NAV and Market Price, respectively. The returns shown in the table above do not reflect the deduction of taxes that a shareholder would pay on Fund distributions or the redemption or
sale of Fund Shares. See invescopowershares.com to find the most recent month-end performance numbers.
Benchmark Index performance results are based upon a hypothetical investment in its constituent securities. Benchmark Index returns do not represent Fund returns. An investor cannot invest directly in an index. The Benchmark Index does not charge management fees or brokerage expenses, and no such fees or expenses were deducted from the hypothetical performance shown. In addition, the results actual investors might have achieved would have differed from those shown because of differences in the timing, amounts of their investments, and fees and expenses associated with an investment in the Fund.
| † | Fund and Benchmark Index returns are based on the inception date of the Fund. |
| 5 |
|
| CHNA | Manager’s Analysis | |
| PowerShares China A-Share Portfolio (CHNA) |
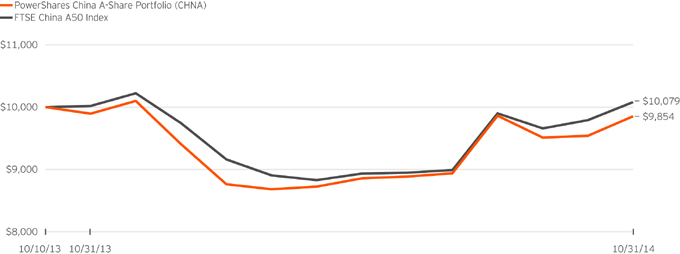
The PowerShares China A-Share Portfolio (the “Fund”) is an actively managed exchange-traded fund (“ETF”) whose investment objective is to seek to provide long-term capital appreciation. The Fund seeks to achieve its investment objective by providing exposure to the China “A-Shares” market using a quantitative, rules-based investment strategy. Under normal circumstances, the Fund will invest in a combination of (i) futures contracts (the “Futures”) on the FTSE China A50 Index (the “Benchmark Index”) listed on the Singapore stock exchange; (ii) ETFs that provide exposure to the largest companies within the China A-Shares market, including ETFs organized outside of the U.S.; and (iii) A-Shares, to the extent permissible under Chinese law. The Fund invests its remaining assets in U.S. government securities, money market instruments, cash and cash equivalent securities (e.g., corporate commercial paper) to collateralize its investments in the Futures or for other purposes.
The Benchmark Index is comprised of China’s domestic market A-Shares, which are securities issued by companies that are incorporated in mainland China and that trade in Renminbi on the Shanghai Stock Exchange or the Shenzhen Stock Exchange. The Benchmark Index includes the A-Share securities of the largest 50 A-Share companies (as determined by market capitalization) listed on those two exchanges. By investing in Futures, the Fund has no direct ownership of the companies included in the Benchmark Index, but the Fund gains exposure to the performance of those companies.
For the fiscal year ended October 31, 2014, on a market price basis, the Fund returned (0.72)%. On a net asset value (“NAV”) basis, the Fund returned (0.40)%. During the same time period, the Benchmark Index returned 0.62%. The Fund’s performance (NAV basis) differed from the return of the Benchmark Index primarily due to fees and operating expenses that the Fund incurred during the period, and as well as the fact that the Fund did not hold the A-Shares in the Benchmark Index directly, but rather only held Futures providing exposure to them.
| Risk Allocation* | ||||||||
| Asset Class | Risk Contribution | % of Net Assets as of October 31, 2014 | ||||||
| Equities | 100 | % | 100 | % | ||||
| * | Based on futures contracts exposure. |
| 6 |
|
PowerShares China A-Share Portfolio (CHNA) (continued)
Growth of a $10,000 Investment Since Inception†
Fund Performance History as of October 31, 2014
| 1 Year | Fund Inception† | |||||||||||||
| Index | Average Annualized | Cumulative | ||||||||||||
| FTSE China A50 Index (USD) | 0.62 | % | 0.74 | % | 0.79 | % | ||||||||
| Fund | ||||||||||||||
| NAV Return | (0.40 | ) | (1.38 | ) | (1.46 | ) | ||||||||
| Market Price Return | (0.72 | ) | (1.45 | ) | (1.54 | ) | ||||||||
Fund Inception: October 10, 2013
Performance quoted above represents past performance. Past performance is not a guarantee of future results, and current performance may be higher or lower than performance quoted. Investment returns and principal value will fluctuate, and shares of the Fund (“Fund Shares”), when redeemed or sold, may be worth more or less than their original cost. According to the Fund’s current prospectus, the Fund’s expense ratio of 0.60% (0.51% after fee waiver) includes the unitary management fee of 0.50% and acquired fund fees and expenses of 0.10%. NAV and Market Price returns assume that dividends and capital gain distributions have been reinvested in the Fund at NAV and Market Price, respectively. The returns shown in the table above do not reflect the deduction of taxes that a shareholder would pay on Fund distributions or the redemption or sale of Fund Shares. See
invescopowershares.com to find the most recent month-end performance numbers.
Benchmark Index performance results are based upon a hypothetical investment in its constituent securities. Benchmark Index returns do not represent Fund returns. An investor cannot invest directly in an index. The Benchmark Index does not charge management fees or brokerage expenses, and no such fees or expenses were deducted from the hypothetical performance shown. In addition, the results actual investors might have achieved would have differed from those shown because of differences in the timing, amounts of their investments, and fees and expenses associated with an investment in the Fund.
| † | Fund and Benchmark Index returns are based on the inception date of the Fund. |
| 7 |
|
| LALT | Manager’s Analysis | |
| PowerShares Multi-Strategy Alternative Portfolio (LALT) |
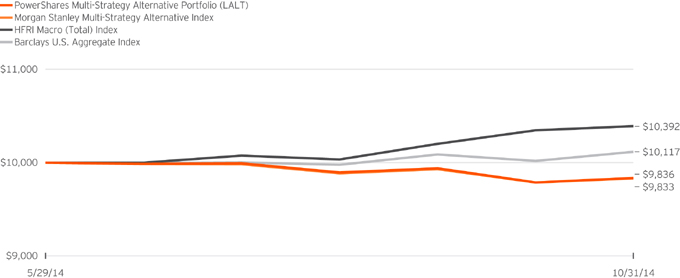
The PowerShares Multi-Strategy Alternative Portfolio (the “Fund”) is an actively managed exchange-traded fund (“ETF”) that has an investment objective of seeking a positive total return that has a low correlation to the broader securities markets. The Fund seeks to achieve its investment objective by investing in a combination of equity securities, financial futures contracts, forward currency contracts and other instruments.
Invesco Advisers, Inc., the sub-adviser to the Fund, selects investments for inclusion in the Fund’s portfolio with reference to the components of the Morgan Stanley Multi-Strategy Alternative Index (the “Benchmark Index”) through a quantitative process that seeks to exceed the Benchmark Index performance.
The Fund is comprised of five distinct strategies: futures on the Chicago Board Options Exchange Volatility Index, long/short currency carry strategy, market neutral equity strategy focused on high conviction hedge fund holdings, market neutral equity strategy focused on identifying undervalued firms with strong balance sheets and favorable cash flows, and forward rate bias investing in Eurodollar futures.
The Fund commenced investment operations on May 27, 2014, and began trading on May 29, 2014. During the approximately 5 months from inception to October 31, 2014, on a market price basis, the Fund returned (1.92)%. On a net asset value (“NAV”) basis, the Fund returned (1.64)%. During the same time period, the Benchmark Index returned (1.67)%. The Fund performed essentially in line with the Benchmark Index for the period.
During this same time period, the HFRI Macro (Total) Index returned 3.92% and the Barclays U.S. Aggregate Index returned 1.17% (these indexes, collectively with the Benchmark Index, are referred to as the “Indexes”). The index components are weighted equally in the HFRI Macro (Total) Index and by market capitalization in Barclays U.S. Aggregate Index.
The HFRI Macro (Total) Index was selected for its recognition in the marketplace, and its performance comparison is a useful measure for investors as a broad representation of the alternative investment market. The Barclays U.S. Aggregate Index was selected because its performance is a useful measure of the broad U.S. fixed-income market.
The largest contributor to the Fund’s negative performance was the volatility harvesting strategy, which is down over 20% since inception. This is also the primary reason for the Fund’s underperformance versus both the HFRI Macro (Total) Index and the Barclays U.S. Aggregate Index. Even though the Fund had an average weight of approximately 8% in the strategy, the strategy’s underperformance contributed to a significant proportion of the Fund’s overall performance.
| Sector Breakdown (% of the Fund’s Net Assets) as of October 31, 2014 | ||||
| Energy | 8.7 | |||
| Industrials | 7.1 | |||
| Consumer Discretionary | 6.8 | |||
| Information Technology | 5.3 | |||
| Health Care | 4.0 | |||
| Materials | 4.0 | |||
| Utilities | 3.1 | |||
| Financials | 3.1 | |||
| Telecommunication Services | 1.4 | |||
| Consumer Staples | 1.1 | |||
| Money Market Funds Plus Other Assets Less Liabilities | 55.4 | |||
| Top Ten Fund Holdings (% of the Fund’s Net Assets) as of October 31, 2014 | ||||
| Security | ||||
| General Dynamics Corp. | 2.3 | |||
| Humana, Inc. | 1.3 | |||
| Moody’s Corp. | 1.1 | |||
| MeadWestvaco Corp. | 1.0 | |||
| Motorola Solutions, Inc. | 0.9 | |||
| DaVita HealthCare Partners, Inc. | 0.8 | |||
| Cameron International Corp. | 0.8 | |||
| Rockwell Collins, Inc. | 0.7 | |||
| Coca-Cola Enterprises, Inc. | 0.6 | |||
| Cimarex Energy Co. | 0.6 | |||
| Total | 10.1 | |||
| 8 |
|
PowerShares Multi-Strategy Alternative Portfolio (LALT) (continued)
Growth of a $10,000 Investment Since Inception†
Fund Performance History as of October 31, 2014
| Fund Inception† | ||||
| Index | Cumulative | |||
| Morgan Stanley Multi-Strategy Alternative Index | (1.67 | )% | ||
| HFRI Macro (Total) Index | 3.92 | |||
| Barclays U.S. Aggregate Index | 1.17 | |||
| Fund | ||||
| NAV Return | (1.64 | ) | ||
| Market Price Return | (1.92 | ) | ||
Fund Inception: May 29, 2014
Performance quoted above represents past performance. Past performance is not a guarantee of future results, and current performance may be higher or lower than performance quoted. Investment returns and principal value will fluctuate, and shares of the Fund (“Fund Shares”), when redeemed or sold, may be worth more or less than their original cost. According to the Fund’s current prospectus, the Fund’s expense ratio of 1.00% includes the unitary management fee of 0.95% and acquired fund fees and expenses of 0.05%. NAV and Market Price returns assume that dividends and capital gain distributions have been reinvested in the Fund at NAV and Market Price, respectively. The returns shown in the table above do not reflect the deduction of taxes that a shareholder would pay on Fund distributions or the redemption or sale of Fund Shares. See invescopowershares.com to find the most recent month-end performance numbers.
Indexes performance results are based upon a hypothetical investment in their respective constituent securities. Indexes returns do not represent Fund returns. An investor cannot invest directly in an index. Indexes do not charge management fees or brokerage expenses, and no such fees or expenses were deducted from the hypothetical performance shown. In addition, the results actual investors might have achieved would have differed from those shown because of differences in the timing, amounts of their investments, and fees and expenses associated with an investment in the Fund.
| † | Fund and Indexes returns are based on the inception date of the Fund. |
| 9 |
|
| PHDG | Manager’s Analysis | |
| PowerShares S&P 500® Downside Hedged Portfolio (PHDG) |
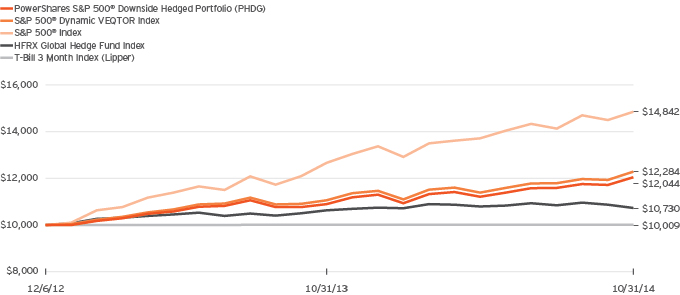
The PowerShares S&P 500® Downside Hedged Portfolio (the “Fund”) is an actively managed exchange-traded fund (“ETF”) that seeks to achieve positive total returns in rising or falling markets that are not directly correlated to broad equity or fixed-income market returns.
The Fund seeks to achieve its investment objective by using a quantitative, rules based strategy designed to provide returns that correspond to the performance of the S&P 500® Dynamic VEQTOR Index (the “Benchmark Index”). The Fund, in accordance with strategy allocation rules provided by Standard & Poor’s (“S&P”), invests in a combination of (i) equity securities contained in the S&P 500® Index and that are listed on a U.S. securities exchange, (ii) Chicago Board Options Exchange Volatility Index (the “VIX Index”) related instruments, such as listed VIX Index futures contracts that reflect exposure to the S&P 500® VIX Short Term Futures Index, and (iii) money market instruments, cash and cash equivalents.
Although the Fund seeks returns that correspond to the performance of the Benchmark Index, the Fund can have a higher or lower exposure to any component within the Benchmark Index at any time. In addition to its investments in the components of the Benchmark Index, the Fund also may invest in other VIX Index-related instruments, including ETFs and exchange-traded notes that are listed on a U.S. securities exchange and that provide exposure to the VIX Index and U.S. listed futures contracts that track the S&P 500® Index and are listed on the Chicago Mercantile Exchange.
For the fiscal year ended October 31, 2014, on a market price basis, the Fund returned 10.14%. On a net asset value (“NAV”) basis, the Fund returned 10.50%. During the same time period, the Benchmark Index returned 11.05%. The Fund’s performance (NAV basis) differed from the return of the Benchmark Index primarily due to fees and operating expenses that the Fund incurred during the period.
During this same time period, the S&P 500® Index returned 17.27%, the HFRX Global Hedge Fund Index returned 0.96%, and the T-Bill 3 Month Index returned 0.04% (these indexes, collectively with the Benchmark Index, are referred to as the “Indexes”). The S&P 500® Index was selected for its recognition in the marketplace, and its performance comparison is a useful measure for investors as a broad representation of the equity market. The main reason for the Fund’s underperformance compared to the S&P 500® Index was the underperformance of the VIX Index futures. The HFRX Gobal Hedge Fund Index was selected for its recognition in the marketplace, and its performance comparison is a useful measure for investors as a broad representation of the alternative investment market. The main reason for the Fund’s outperformance compared to the HFRX Global Hedge Fund Index was the Fund’s higher relative allocation to equity securities. The T-Bill 3 Month Index was
selected for its recognition in the marketplace, and its performance comparison is a useful measure for investors as a broad representation of the short-term U.S. fixed income market. The main reason for the Fund’s outperformance compared to the T-Bill 3 Month Index was the outperformance of equity securities during the reporting period compared to short-term fixed income securities.
| Sector Breakdown (% of the Fund’s Net Assets) as of October 31, 2014 | ||||
| Information Technology | 14.7 | |||
| Financials | 12.3 | |||
| Health Care | 10.7 | |||
| Consumer Discretionary | 8.7 | |||
| Industrials | 7.8 | |||
| Consumer Staples | 7.2 | |||
| Energy | 6.9 | |||
| Materials | 2.5 | |||
| Utilities | 2.4 | |||
| Telecommunication Services | 1.8 | |||
| Money Market Fund Plus Other Assets Less Liabilities | 25.0 | |||
| Top Ten Fund Holdings (% of the Fund’s Net Assets) as of October 31, 2014 | ||||
| Security | ||||
| Apple, Inc. | 2.7 | |||
| Exxon Mobil Corp. | 1.7 | |||
| Microsoft Corp. | 1.6 | |||
| Johnson & Johnson | 1.3 | |||
| General Electric Co. | 1.1 | |||
| Berkshire Hathaway, Inc., Class B | 1.1 | |||
| Wells Fargo & Co. | 1.1 | |||
| Procter & Gamble Co. (The) | 1.0 | |||
| Chevron Corp. | 1.0 | |||
| JPMorgan Chase & Co. | 1.0 | |||
| Total | 13.6 | |||
| 10 |
|
PowerShares S&P 500® Downside Hedged Portfolio (PHDG) (continued)
Growth of a $10,000 Investment Since Inception†
Fund Performance History as of October 31, 2014
| 1 Year | Fund Inception† | |||||||||||||
| Index | Average Annualized | Cumulative | ||||||||||||
| S&P 500® Dynamic VEQTOR Index | 11.05 | % | 11.43 | % | 22.84 | % | ||||||||
| S&P 500® Index | 17.27 | 23.09 | 48.42 | |||||||||||
| HFRX Global Hedge Fund Index | 0.96 | 3.78 | 7.30 | |||||||||||
| T-Bill 3 Month Index (Lipper) | 0.04 | 0.05 | 0.09 | |||||||||||
| Fund | ||||||||||||||
| NAV Return | 10.50 | 10.28 | 20.44 | |||||||||||
| Market Price Return | 10.14 | 10.23 | 20.35 | |||||||||||
Fund Inception: December 6, 2012
Performance quoted above represents past performance. Past performance is not a guarantee of future results, and current performance may be higher or lower than performance quoted. Investment returns and principal value will fluctuate, and shares of the Fund (“Fund Shares”), when redeemed or sold, may be worth more or less than their original cost. According to the Fund’s current prospectus, the Fund’s expense ratio of 0.41% (0.40% after fee waiver) includes the unitary management fee of 0.39% and acquired fund fees and expenses of 0.02%. NAV and Market Price returns assume that dividends and capital gain distributions have been reinvested in the Fund at NAV and Market Price, respectively. The returns shown in the table above do not reflect the deduction of taxes that a shareholder would pay on Fund
distributions or the redemption or sale of Fund Shares. See invescopowershares.com to find the most recent month-end performance numbers.
Indexes performance results are based upon a hypothetical investments in their respective constituent securities. Indexes returns do not represent Fund returns. An investor cannot invest directly in an index. Indexes do not charge management fees or brokerage expenses, and no such fees or expenses were deducted from the hypothetical performance shown. In addition, the results actual investors might have achieved would have differed from those shown because of differences in the timing, amounts of their investments, and fees and expenses associated with an investment in the Fund.
| † | Fund and Indexes returns are based on the inception date of the Fund. |
| 11 |
|
Schedule of Investments(a)
PowerShares Active U.S. Real Estate Fund (PSR)
October 31, 2014
| Number of Shares | Value | |||||||
| Real Estate Investment Trusts—100.0% | ||||||||
| Diversified—7.3% | ||||||||
| 4,129 | American Assets Trust, Inc. | $ | 158,306 | |||||
| 57,718 | Cousins Properties, Inc. | 750,911 | ||||||
| 8,747 | Empire State Realty Trust, Inc., Class A | 139,602 | ||||||
| 20,242 | Liberty Property Trust | 703,814 | ||||||
| 1,489 | PS Business Parks, Inc. | 125,404 | ||||||
| 11,152 | Vornado Realty Trust | 1,220,921 | ||||||
|
| |||||||
| 3,098,958 | ||||||||
|
| |||||||
| Health Care—10.5% | ||||||||
| 35,453 | HCP, Inc. | 1,558,868 | ||||||
| 20,141 | Health Care REIT, Inc. | 1,432,227 | ||||||
| 21,172 | Ventas, Inc. | 1,450,494 | ||||||
|
| |||||||
| 4,441,589 | ||||||||
|
| |||||||
| Hotel & Resort—9.2% | ||||||||
| 6,183 | Chesapeake Lodging Trust | 204,286 | ||||||
| 42,234 | DiamondRock Hospitality Co. | 606,058 | ||||||
| 14,025 | FelCor Lodging Trust, Inc. | 150,488 | ||||||
| 80,586 | Hersha Hospitality Trust | 587,472 | ||||||
| 51,100 | Host Hotels & Resorts, Inc. | 1,191,141 | ||||||
| 20,504 | LaSalle Hotel Properties | 803,962 | ||||||
| 23,145 | Sunstone Hotel Investors, Inc. | 354,350 | ||||||
|
| |||||||
| 3,897,757 | ||||||||
|
| |||||||
| Industrial—4.4% | ||||||||
| 37,568 | DCT Industrial Trust, Inc. | 321,958 | ||||||
| 12,389 | First Industrial Realty Trust, Inc. | 241,957 | ||||||
| 30,689 | Prologis, Inc. | 1,278,197 | ||||||
|
| |||||||
| 1,842,112 | ||||||||
|
| |||||||
| Office—10.8% | ||||||||
| 8,047 | Alexandria Real Estate Equities, Inc. | 667,901 | ||||||
| 5,560 | Boston Properties, Inc. | 704,730 | ||||||
| 33,891 | Brandywine Realty Trust | 522,938 | ||||||
| 22,670 | Douglas Emmett, Inc. | 637,707 | ||||||
| 15,078 | Highwoods Properties, Inc. | 646,394 | ||||||
| 15,858 | Kilroy Realty Corp. | 1,074,221 | ||||||
| 17,383 | Piedmont Office Realty Trust, Inc., Class A | 338,099 | ||||||
|
| |||||||
| 4,591,990 | ||||||||
|
| |||||||
| Residential—14.1% | ||||||||
| 11,788 | American Campus Communities, Inc. | 462,915 | ||||||
| 16,398 | Apartment Investment & Management Co., Class A | 586,884 | ||||||
| 10,097 | AvalonBay Communities, Inc. | 1,573,517 | ||||||
| 13,067 | Equity Residential | 908,941 | ||||||
| 8,225 | Essex Property Trust, Inc. | 1,659,476 | ||||||
| 11,343 | Mid-America Apartment Communities, Inc. | 801,496 | ||||||
|
| |||||||
| 5,993,229 | ||||||||
|
| |||||||
| Retail—23.9% | ||||||||
| 41,831 | Brixmor Property Group, Inc. | 1,019,003 | ||||||
| 45,903 | DDR Corp. | 832,680 | ||||||
| 7,630 | Federal Realty Investment Trust | 1,005,634 | ||||||
| 31,746 | General Growth Properties, Inc. | 822,539 | ||||||
| 6,825 | Macerich Co. (The) | 481,163 | ||||||
| 35,941 | National Retail Properties, Inc. | 1,370,071 | ||||||
| 23,433 | Retail Opportunity Investments Corp. | 382,895 | ||||||
| 19,681 | Simon Property Group, Inc. | 3,527,032 | ||||||
| Number of Shares | Value | |||||||
| Real Estate Investment Trusts (continued) | ||||||||
| Retail (continued) | ||||||||
| 10,798 | Tanger Factory Outlet Centers, Inc. | $ | 386,245 | |||||
| 17,481 | Washington Prime Group, Inc. | 308,190 | ||||||
|
| |||||||
| 10,135,452 | ||||||||
|
| |||||||
| Specialized—19.8% | ||||||||
| 28,627 | American Tower Corp. | 2,791,132 | ||||||
| 12,249 | Crown Castle International Corp. | 956,892 | ||||||
| 32,271 | CubeSmart | 679,305 | ||||||
| 5,948 | Plum Creek Timber Co., Inc. | 243,927 | ||||||
| 4,253 | Potlatch Corp. | 187,089 | ||||||
| 8,729 | Public Storage | 1,609,104 | ||||||
| 3,750 | Sovran Self Storage, Inc. | 319,088 | ||||||
| 47,799 | Weyerhaeuser Co. | 1,618,474 | ||||||
|
| |||||||
| 8,405,011 | ||||||||
|
| |||||||
| Total Investments (Cost $38,693,265)—100.0% | 42,406,098 | |||||||
| Other assets less liabilities—(0.0)% | (10,281 | ) | ||||||
|
| |||||||
| Net Assets—100.0% | $ | 42,395,817 | ||||||
|
| |||||||
Investment Abbreviations:
REIT—Real Estate Investment Trust
Notes to Schedule of Investments:
| (a) | Industry and/or sector classifications used in this report are generally according to the Global Industry Classification Standard, which was developed by and is the exclusive property and a service mark of MSCI Inc. and Standard & Poor’s. |
See accompanying Notes to Financial Statements which are an integral part of the financial statements.
| 12 |
|
Schedule of Investments
PowerShares China A-Share Portfolio (CHNA)
October 31, 2014
| Number of Shares | Value | |||||||
| Money Market Funds(a)—72.1% | ||||||||
| 400,000 | Invesco Premier Portfolio—Institutional Class | $ | 400,000 | |||||
| 400,000 | Invesco Premier Tax-Exempt Portfolio—Institutional Class | 400,000 | ||||||
| 200,000 | Invesco Short-Term Investment Trust—Government & Agency Portfolio—Institutional Class | 200,000 | ||||||
| 400,000 | Invesco Short-Term Investment Trust—STIC Prime Portfolio—Institutional Class | 400,000 | ||||||
| 400,000 | Invesco Short-Term Investment Trust—Treasury Portfolio | 400,000 | ||||||
|
| |||||||
| Total Investments (Cost $1,800,000)—72.1% | 1,800,000 | |||||||
| Other assets less liabilities—27.9% | 695,691 | |||||||
|
| |||||||
| Net Assets—100.0% | $ | 2,495,691 | ||||||
|
| |||||||
Notes to Schedule of Investments:
| (a) | The security and the Fund are advised by wholly-owned subsidiaries of Invesco Ltd. and are therefore considered to be affiliated. |
See accompanying Notes to Financial Statements which are an integral part of the financial statements.
| 13 |
|
Schedule of Investments(a)
PowerShares Multi-Strategy Alternative Portfolio (LALT)
October 31, 2014
| Number of Shares | Value | |||||||
| Common Stocks and Other Equity Interests—44.6% | ||||||||
| Consumer Discretionary—6.8% | ||||||||
| 841 | AutoNation, Inc.(b) | $ | 48,156 | |||||
| 3,193 | Best Buy Co., Inc. | 109,009 | ||||||
| 2,801 | Cablevision Systems Corp., Class A | 52,155 | ||||||
| 2,880 | Discovery Communications, Inc., Class A(b) | 101,808 | ||||||
| 7,174 | Ford Motor Co. | 101,082 | ||||||
| 611 | Fossil Group, Inc.(b) | 62,114 | ||||||
| 1,424 | GameStop Corp., Class A | 60,890 | ||||||
| 3,148 | General Motors Co. | 98,847 | ||||||
| 58 | Graham Holdings Co., Class B | 45,449 | ||||||
| 5,521 | Interpublic Group of Cos., Inc. (The) | 107,052 | ||||||
| 2,329 | Lennar Corp., Class A | 100,333 | ||||||
| 3,358 | Mattel, Inc. | 104,333 | ||||||
| 5,875 | PulteGroup, Inc. | 112,741 | ||||||
| 8,763 | Staples, Inc. | 111,115 | ||||||
| 1,324 | Urban Outfitters, Inc.(b) | 40,197 | ||||||
| 729 | Whirlpool Corp. | 125,424 | ||||||
| 1,653 | Wyndham Worldwide Corp. | 128,389 | ||||||
|
| |||||||
| 1,509,094 | ||||||||
|
| |||||||
| Consumer Staples—1.1% | ||||||||
| 3,154 | Coca-Cola Enterprises, Inc. | 136,726 | ||||||
| 3,053 | Safeway, Inc. | 106,427 | ||||||
|
| |||||||
| 243,153 | ||||||||
|
| |||||||
| Energy—8.7% | ||||||||
| 1,177 | Apache Corp. | 90,864 | ||||||
| 2,790 | Cameron International Corp.(b) | 166,145 | ||||||
| 892 | Chevron Corp. | 106,995 | ||||||
| 1,192 | Cimarex Energy Co. | 135,495 | ||||||
| 2,999 | Diamond Offshore Drilling, Inc. | 113,092 | ||||||
| 2,656 | Ensco PLC, Class A | 107,807 | ||||||
| 1,119 | Exxon Mobil Corp. | 108,219 | ||||||
| 1,148 | Helmerich & Payne, Inc. | 99,669 | ||||||
| 1,143 | Hess Corp. | 96,938 | ||||||
| 1,290 | Marathon Petroleum Corp. | 117,261 | ||||||
| 1,873 | Murphy Oil Corp. | 99,999 | ||||||
| 3,628 | Nabors Industries Ltd. | 64,760 | ||||||
| 1,407 | National Oilwell Varco, Inc. | 102,205 | ||||||
| 1,917 | Newfield Exploration Co.(b) | 62,513 | ||||||
| 3,509 | Noble Corp. PLC | 73,408 | ||||||
| 1,098 | Occidental Petroleum Corp. | 97,645 | ||||||
| 2,488 | QEP Resources, Inc. | 62,374 | ||||||
| 3,307 | Transocean Ltd. | 98,648 | ||||||
| 2,312 | Valero Energy Corp. | 115,808 | ||||||
|
| |||||||
| 1,919,845 | ||||||||
|
| |||||||
| Financials—3.1% | ||||||||
| 3,730 | CBRE Group, Inc., Class A(b) | 119,360 | ||||||
| 6,191 | Hudson City Bancorp, Inc. | 59,743 | ||||||
| 2,219 | Iron Mountain, Inc. REIT | 80,039 | ||||||
| 1,352 | Legg Mason, Inc. | 70,304 | ||||||
| 2,448 | Moody’s Corp. | 242,915 | ||||||
| 5,528 | Navient Corp. | 109,344 | ||||||
|
| |||||||
| 681,705 | ||||||||
|
| |||||||
| Health Care—4.0% | ||||||||
| 2,345 | DaVita HealthCare Partners, Inc.(b) | 183,074 | ||||||
| 1,610 | Eli Lilly & Co. | 106,791 | ||||||
| Number of Shares | Value | |||||||
| Common Stocks and Other Equity Interests (continued) | ||||||||
| Health Care (continued) | ||||||||
| 2,056 | Humana, Inc. | $ | 285,476 | |||||
| 1,433 | Mallinckrodt PLC(b) | 132,094 | ||||||
| 3,595 | Pfizer, Inc. | 107,670 | ||||||
| 1,372 | Tenet Healthcare Corp.(b) | 76,901 | ||||||
|
| |||||||
| 892,006 | ||||||||
|
| |||||||
| Industrials—7.1% | ||||||||
| 3,041 | ADT Corp. (The) | 108,989 | ||||||
| 1,155 | Allegion PLC | 61,319 | ||||||
| 785 | Cummins, Inc. | 114,751 | ||||||
| 1,590 | Fluor Corp. | 105,481 | ||||||
| 3,628 | General Dynamics Corp. | 507,049 | ||||||
| 1,921 | Joy Global, Inc. | 101,102 | ||||||
| 824 | Northrop Grumman Corp. | 113,679 | ||||||
| 2,651 | Pitney Bowes, Inc. | 65,586 | ||||||
| 2,807 | Quanta Services, Inc.(b) | 95,662 | ||||||
| 1,784 | Rockwell Collins, Inc. | 150,124 | ||||||
| 680 | Ryder System, Inc. | 60,160 | ||||||
| 755 | Snap-on, Inc. | 99,766 | ||||||
|
| |||||||
| 1,583,668 | ||||||||
|
| |||||||
| Information Technology—5.3% | ||||||||
| 3,842 | CA, Inc. | 111,649 | ||||||
| 4,167 | Cisco Systems, Inc. | 101,966 | ||||||
| 1,891 | Computer Sciences Corp. | 114,216 | ||||||
| 5,586 | Corning, Inc. | 114,122 | ||||||
| 3,116 | Intel Corp. | 105,975 | ||||||
| 2,983 | Motorola Solutions, Inc. | 192,403 | ||||||
| 5,742 | NVIDIA Corp. | 112,199 | ||||||
| 4,473 | Symantec Corp. | 111,020 | ||||||
| 1,618 | VeriSign, Inc.(b) | 96,692 | ||||||
| 1,099 | Western Digital Corp. | 108,109 | ||||||
|
| |||||||
| 1,168,351 | ||||||||
|
| |||||||
| Materials—4.0% | ||||||||
| 2,386 | Avery Dennison Corp. | 111,784 | ||||||
| 378 | CF Industries Holdings, Inc. | 98,280 | ||||||
| 2,071 | Dow Chemical Co. (The) | 102,308 | ||||||
| 2,235 | International Paper Co. | 113,136 | ||||||
| 796 | Martin Marietta Materials, Inc. | 93,068 | ||||||
| 4,794 | MeadWestvaco Corp. | 211,751 | ||||||
| 2,105 | Owens-Illinois, Inc.(b) | 54,246 | ||||||
| 2,505 | Sealed Air Corp. | 90,806 | ||||||
|
| |||||||
| 875,379 | ||||||||
|
| |||||||
| Telecommunication Services—1.4% | ||||||||
| 2,987 | AT&T, Inc. | 104,067 | ||||||
| 16,402 | Frontier Communications Corp. | 107,269 | ||||||
| 2,119 | Verizon Communications, Inc. | 106,480 | ||||||
|
| |||||||
| 317,816 | ||||||||
|
| |||||||
| Utilities—3.1% | ||||||||
| 2,716 | Ameren Corp. | 114,995 | ||||||
| 1,393 | Duke Energy Corp. | 114,435 | ||||||
| 3,008 | Exelon Corp. | 110,063 | ||||||
| 1,602 | Integrys Energy Group, Inc. | 116,433 | ||||||
| 1,901 | Pinnacle West Capital Corp. | 116,855 | ||||||
See accompanying Notes to Financial Statements which are an integral part of the financial statements.
| 14 |
|
PowerShares Multi-Strategy Alternative Portfolio (LALT) (continued)
October 31, 2014
| Number of Shares | Value | |||||||
| Common Stocks and Other Equity Interests (continued) | ||||||||
| Utilities (continued) | ||||||||
| 5,898 | TECO Energy, Inc. | $ | 115,660 | |||||
|
| |||||||
| 688,441 | ||||||||
|
| |||||||
| Total Common Stocks and Other Equity Interests (Cost $9,780,145) | 9,879,458 | |||||||
|
| |||||||
| Money Market Funds(c)—51.1% | ||||||||
| 2,263,240 | Invesco Premier Portfolio—Institutional Class | 2,263,240 | ||||||
| 2,263,240 | Invesco Premier Tax-Exempt Portfolio—Institutional Class | 2,263,240 | ||||||
| 2,263,240 | Invesco Short-Term Investment Trust—Government & Agency Portfolio—Institutional Class | 2,263,240 | ||||||
| 2,263,240 | Invesco Short-Term Investment Trust—STIC Prime Portfolio—Institutional Class | 2,263,240 | ||||||
| 2,263,240 | Invesco Short-Term Investment Trust—Treasury Portfolio—Institutional Class | 2,263,240 | ||||||
|
| |||||||
| Total Money Market Funds (Cost 11,316,200) | 11,316,200 | |||||||
|
| |||||||
| Total Investments (Cost $21,096,345)—95.7% | 21,195,658 | |||||||
| Other assets less liabilities—4.3% | 944,271 | |||||||
|
| |||||||
| Net Assets—100.0% | $ | 22,139,929 | ||||||
|
| |||||||
Investment Abbreviations:
REIT—Real Estate Investment Trust
Notes to Schedule of Investments:
| (a) | Industry and/or sector classifications used in this report are generally according to the Global Industry Classification Standard, which was developed by and is the exclusive property and a service mark of MSCI Inc. and Standard & Poor’s. |
| (b) | Non-income producing security. |
| (c) | The security and the Fund are advised by wholly-owned subsidiaries of Invesco Ltd. and are therefore considered to be affiliated. |
See accompanying Notes to Financial Statements which are an integral part of the financial statements.
| 15 |
|
Schedule of Investments(a)
PowerShares S&P 500® Downside Hedged Portfolio (PHDG)
October 31, 2014
| Number of Shares | Value | |||||||
| Common Stocks and Other Equity Interests—75.0% | ||||||||
| Consumer Discretionary—8.7% | ||||||||
| 8,374 | Amazon.com, Inc.(b) | $ | 2,557,922 | |||||
| 1,743 | AutoNation, Inc.(b) | 99,804 | ||||||
| 721 | AutoZone, Inc.(b) | 399,088 | ||||||
| 4,089 | Bed Bath & Beyond, Inc.(b) | 275,353 | ||||||
| 6,433 | Best Buy Co., Inc. | 219,623 | ||||||
| 5,049 | BorgWarner, Inc. | 287,894 | ||||||
| 4,693 | Cablevision Systems Corp., Class A | 87,384 | ||||||
| 4,887 | CarMax, Inc.(b) | 273,232 | ||||||
| 9,991 | Carnival Corp. | 401,139 | ||||||
| 10,741 | CBS Corp., Class B | 582,377 | ||||||
| 689 | Chipotle Mexican Grill, Inc.(b) | 439,582 | ||||||
| 6,113 | Coach, Inc. | 210,165 | ||||||
| 57,294 | Comcast Corp., Class A | 3,171,223 | ||||||
| 7,314 | D.R. Horton, Inc. | 166,686 | ||||||
| 2,883 | Darden Restaurants, Inc. | 149,282 | ||||||
| 6,604 | Delphi Automotive PLC (United Kingdom) | 455,544 | ||||||
| 11,124 | DIRECTV(b) | 965,452 | ||||||
| 3,268 | Discovery Communications, Inc., Class A(b) | 115,524 | ||||||
| 6,061 | Discovery Communications, Inc., Class C(b) | 212,074 | ||||||
| 6,724 | Dollar General Corp.(b) | 421,393 | ||||||
| 4,574 | Dollar Tree, Inc.(b) | 277,047 | ||||||
| 2,189 | Expedia, Inc. | 185,999 | ||||||
| 2,135 | Family Dollar Stores, Inc. | 167,149 | ||||||
| 85,881 | Ford Motor Co. | 1,210,063 | ||||||
| 1,039 | Fossil Group, Inc.(b) | 105,625 | ||||||
| 2,532 | GameStop Corp., Class A | 108,268 | ||||||
| 5,023 | Gannett Co., Inc. | 158,224 | ||||||
| 6,074 | Gap, Inc. (The) | 230,144 | ||||||
| 2,654 | Garmin Ltd. | 147,244 | ||||||
| 29,843 | General Motors Co. | 937,070 | ||||||
| 3,367 | Genuine Parts Co. | 326,868 | ||||||
| 6,094 | Goodyear Tire & Rubber Co. (The) | 147,658 | ||||||
| 6,080 | H&R Block, Inc. | 196,445 | ||||||
| 4,800 | Harley-Davidson, Inc. | 315,360 | ||||||
| 1,501 | Harman International Industries, Inc. | 161,117 | ||||||
| 2,539 | Hasbro, Inc. | 146,069 | ||||||
| 29,807 | Home Depot, Inc. (The) | 2,906,779 | ||||||
| 9,346 | Interpublic Group of Cos., Inc. (The) | 181,219 | ||||||
| 14,717 | Johnson Controls, Inc. | 695,378 | ||||||
| 4,557 | Kohl’s Corp. | 247,081 | ||||||
| 5,413 | L Brands, Inc. | 390,386 | ||||||
| 3,009 | Leggett & Platt, Inc. | 118,494 | ||||||
| 3,918 | Lennar Corp., Class A | 168,787 | ||||||
| 21,869 | Lowe’s Cos., Inc. | 1,250,907 | ||||||
| 7,836 | Macy’s, Inc. | 453,078 | ||||||
| 4,796 | Marriott International, Inc., Class A | 363,297 | ||||||
| 7,527 | Mattel, Inc. | 233,864 | ||||||
| 21,746 | McDonald’s Corp. | 2,038,253 | ||||||
| 4,549 | Michael Kors Holdings Ltd.(b) | 357,506 | ||||||
| 1,370 | Mohawk Industries, Inc.(b) | 194,595 | ||||||
| 1,339 | Netflix, Inc.(b) | 525,919 | ||||||
| 6,063 | Newell Rubbermaid, Inc. | 202,080 | ||||||
| 11,067 | News Corp., Class A(b) | 171,317 | ||||||
| 15,551 | NIKE, Inc., Class B | 1,445,776 | ||||||
| 3,163 | Nordstrom, Inc. | 229,665 | ||||||
| 5,530 | Omnicom Group, Inc. | 397,386 | ||||||
| 2,285 | O’Reilly Automotive, Inc.(b) | 401,886 | ||||||
| Number of Shares | Value | |||||||
| Common Stocks and Other Equity Interests (continued) | ||||||||
| Consumer Discretionary (continued) | ||||||||
| 2,180 | PetSmart, Inc. | $ | 157,723 | |||||
| 1,153 | Priceline Group, Inc. (The)(b) | 1,390,760 | ||||||
| 7,555 | PulteGroup, Inc. | 144,980 | ||||||
| 1,812 | PVH Corp. | 207,202 | ||||||
| 1,361 | Ralph Lauren Corp. | 224,347 | ||||||
| 4,652 | Ross Stores, Inc. | 375,509 | ||||||
| 2,269 | Scripps Networks Interactive, Inc., Class A | 175,258 | ||||||
| 14,360 | Staples, Inc. | 182,085 | ||||||
| 16,612 | Starbucks Corp. | 1,255,203 | ||||||
| 4,236 | Starwood Hotels & Resorts Worldwide, Inc. | 324,732 | ||||||
| 14,020 | Target Corp. | 866,716 | ||||||
| 2,477 | Tiffany & Co. | 238,089 | ||||||
| 6,157 | Time Warner Cable, Inc. | 906,372 | ||||||
| 18,951 | Time Warner, Inc. | 1,506,036 | ||||||
| 15,365 | TJX Cos., Inc. (The) | 972,912 | ||||||
| 3,034 | Tractor Supply Co. | 222,149 | ||||||
| 2,485 | TripAdvisor, Inc.(b) | 220,320 | ||||||
| 41,702 | Twenty-First Century Fox, Inc., Class A | 1,437,885 | ||||||
| 3,668 | Under Armour, Inc., Class A(b) | 240,547 | ||||||
| 2,200 | Urban Outfitters, Inc.(b) | 66,792 | ||||||
| 7,625 | VF Corp. | 516,060 | ||||||
| 8,400 | Viacom, Inc., Class B | 610,512 | ||||||
| 34,949 | Walt Disney Co. (The) | 3,193,640 | ||||||
| 1,735 | Whirlpool Corp. | 298,507 | ||||||
| 2,791 | Wyndham Worldwide Corp. | 216,777 | ||||||
| 1,792 | Wynn Resorts Ltd. | 340,498 | ||||||
| 9,744 | Yum! Brands, Inc. | 699,912 | ||||||
|
| |||||||
| 46,276,267 | ||||||||
|
| |||||||
| Consumer Staples—7.2% | ||||||||
| 43,923 | Altria Group, Inc. | 2,123,238 | ||||||
| 14,308 | Archer-Daniels-Midland Co. | 672,476 | ||||||
| 9,641 | Avon Products, Inc. | 100,266 | ||||||
| 3,516 | Brown-Forman Corp., Class B | 325,828 | ||||||
| 3,947 | Campbell Soup Co. | 174,339 | ||||||
| 2,858 | Clorox Co. (The) | 284,371 | ||||||
| 87,354 | Coca-Cola Co. (The) | 3,658,385 | ||||||
| 5,008 | Coca-Cola Enterprises, Inc. | 217,097 | ||||||
| 19,017 | Colgate-Palmolive Co. | 1,271,857 | ||||||
| 9,308 | ConAgra Foods, Inc. | 319,730 | ||||||
| 3,707 | Constellation Brands, Inc., Class A(b) | 339,339 | ||||||
| 9,699 | Costco Wholesale Corp. | 1,293,556 | ||||||
| 25,620 | CVS Health Corp. | 2,198,452 | ||||||
| 4,329 | Dr Pepper Snapple Group, Inc. | 299,783 | ||||||
| 4,991 | Estee Lauder Cos., Inc. (The), Class A | 375,223 | ||||||
| 13,580 | General Mills, Inc. | 705,617 | ||||||
| 3,288 | Hershey Co. (The) | 315,352 | ||||||
| 2,937 | Hormel Foods Corp. | 158,334 | ||||||
| 2,236 | J.M. Smucker Co. (The) | 232,544 | ||||||
| 5,688 | Kellogg Co. | 363,804 | ||||||
| 2,711 | Keurig Green Mountain, Inc. | 411,394 | ||||||
| 8,277 | Kimberly-Clark Corp. when-issued | 906,856 | ||||||
| 13,180 | Kraft Foods Group, Inc. | 742,693 | ||||||
| 10,817 | Kroger Co. (The) | 602,615 | ||||||
| 7,976 | Lorillard, Inc. | 490,524 | ||||||
| 2,882 | McCormick & Co., Inc. | 203,815 | ||||||
| 4,440 | Mead Johnson Nutrition Co. | 440,936 | ||||||
See accompanying Notes to Financial Statements which are an integral part of the financial statements.
| 16 |
|
PowerShares S&P 500® Downside Hedged Portfolio (PHDG) (continued)
October 31, 2014
| Number of Shares | Value | |||||||
| Common Stocks and Other Equity Interests (continued) | ||||||||
| Consumer Staples (continued) | ||||||||
| 3,547 | Molson Coors Brewing Co., Class B | $ | 263,826 | |||||
| 37,339 | Mondelez International, Inc., Class A | 1,316,573 | ||||||
| 3,193 | Monster Beverage Corp.(b) | 322,110 | ||||||
| 33,352 | PepsiCo, Inc. | 3,207,462 | ||||||
| 34,572 | Philip Morris International, Inc. | 3,077,254 | ||||||
| 59,928 | Procter & Gamble Co. (The) | 5,229,916 | ||||||
| 6,825 | Reynolds American, Inc. | 429,361 | ||||||
| 5,051 | Safeway, Inc. | 176,078 | ||||||
| 12,982 | Sysco Corp. | 500,326 | ||||||
| 6,499 | Tyson Foods, Inc., Class A | 262,235 | ||||||
| 19,472 | Walgreen Co. | 1,250,492 | ||||||
| 34,946 | Wal-Mart Stores, Inc. | 2,665,331 | ||||||
| 7,981 | Whole Foods Market, Inc. | 313,893 | ||||||
|
| |||||||
| 38,243,281 | ||||||||
|
| |||||||
| Energy—6.9% | ||||||||
| 11,191 | Anadarko Petroleum Corp. | 1,027,110 | ||||||
| 8,499 | Apache Corp. | 656,123 | ||||||
| 9,634 | Baker Hughes, Inc. | 510,216 | ||||||
| 9,281 | Cabot Oil & Gas Corp. | 288,639 | ||||||
| 4,505 | Cameron International Corp.(b) | 268,273 | ||||||
| 11,498 | Chesapeake Energy Corp. | 255,026 | ||||||
| 42,025 | Chevron Corp. | 5,040,899 | ||||||
| 1,915 | Cimarex Energy Co. | 217,678 | ||||||
| 27,242 | ConocoPhillips | 1,965,510 | ||||||
| 5,066 | CONSOL Energy, Inc. | 186,429 | ||||||
| 7,880 | Denbury Resources, Inc. | 97,712 | ||||||
| 8,515 | Devon Energy Corp. | 510,900 | ||||||
| 1,480 | Diamond Offshore Drilling, Inc. | 55,811 | ||||||
| 5,115 | Ensco PLC, Class A | 207,618 | ||||||
| 12,140 | EOG Resources, Inc. | 1,153,907 | ||||||
| 3,334 | EQT Corp. | 313,529 | ||||||
| 94,389 | Exxon Mobil Corp. | 9,128,360 | ||||||
| 5,169 | FMC Technologies, Inc.(b) | 289,671 | ||||||
| 18,807 | Halliburton Co. | 1,037,018 | ||||||
| 2,405 | Helmerich & Payne, Inc. | 208,802 | ||||||
| 5,783 | Hess Corp. | 490,456 | ||||||
| 14,598 | Kinder Morgan, Inc. | 564,942 | ||||||
| 14,964 | Marathon Oil Corp. | 529,725 | ||||||
| 6,243 | Marathon Petroleum Corp. | 567,489 | ||||||
| 3,677 | Murphy Oil Corp. | 196,315 | ||||||
| 6,418 | Nabors Industries Ltd. | 114,561 | ||||||
| 9,559 | National Oilwell Varco, Inc. | 694,366 | ||||||
| 2,959 | Newfield Exploration Co.(b) | 96,493 | ||||||
| 5,678 | Noble Corp. PLC | 118,784 | ||||||
| 7,963 | Noble Energy, Inc. | 458,908 | ||||||
| 17,262 | Occidental Petroleum Corp. | 1,535,110 | ||||||
| 4,632 | ONEOK, Inc. | 273,010 | ||||||
| 12,346 | Phillips 66 | 969,161 | ||||||
| 3,180 | Pioneer Natural Resources Co. | 601,211 | ||||||
| 3,656 | QEP Resources, Inc. | 91,656 | ||||||
| 3,705 | Range Resources Corp. | 253,422 | ||||||
| 28,715 | Schlumberger Ltd. | 2,833,022 | ||||||
| 7,850 | Southwestern Energy Co.(b) | 255,203 | ||||||
| 14,802 | Spectra Energy Corp. | 579,202 | ||||||
| 2,868 | Tesoro Corp. | 204,804 | ||||||
| 7,518 | Transocean Ltd. | 224,262 | ||||||
| Number of Shares | Value | |||||||
| Common Stocks and Other Equity Interests (continued) | ||||||||
| Energy (continued) | ||||||||
| 11,722 | Valero Energy Corp. | $ | 587,155 | |||||
| 14,863 | Williams Cos., Inc. (The) | 825,045 | ||||||
|
| |||||||
| 36,483,533 | ||||||||
|
| |||||||
| Financials—12.3% | ||||||||
| 7,455 | ACE Ltd. | 814,832 | ||||||
| 1,217 | Affiliated Managers Group, Inc.(b) | 243,144 | ||||||
| 10,056 | Aflac, Inc. | 600,645 | ||||||
| 9,601 | Allstate Corp. (The) | 622,625 | ||||||
| 19,958 | American Express Co. | 1,795,222 | ||||||
| 31,601 | American International Group, Inc. | 1,692,866 | ||||||
| 8,755 | American Tower Corp. REIT | 853,612 | ||||||
| 4,157 | Ameriprise Financial, Inc. | 524,489 | ||||||
| 6,438 | Aon PLC | 553,668 | ||||||
| 3,228 | Apartment Investment & Management Co., Class A REIT | 115,530 | ||||||
| 1,556 | Assurant, Inc. | 106,150 | ||||||
| 2,899 | AvalonBay Communities, Inc. REIT | 451,780 | ||||||
| 232,850 | Bank of America Corp. | 3,995,706 | ||||||
| 25,075 | Bank of New York Mellon Corp. (The) | 970,904 | ||||||
| 15,868 | BB&T Corp. | 601,080 | ||||||
| 40,346 | Berkshire Hathaway, Inc., Class B(b) | 5,654,895 | ||||||
| 2,799 | BlackRock, Inc | 954,767 | ||||||
| 3,362 | Boston Properties, Inc. REIT | 426,133 | ||||||
| 12,456 | Capital One Financial Corp. | 1,030,983 | ||||||
| 6,125 | CBRE Group, Inc., Class A(b) | 196,000 | ||||||
| 25,418 | Charles Schwab Corp. (The) | 728,734 | ||||||
| 5,338 | Chubb Corp. (The) | 530,384 | ||||||
| 3,238 | Cincinnati Financial Corp. | 163,422 | ||||||
| 67,102 | Citigroup, Inc. | 3,591,970 | ||||||
| 6,954 | CME Group, Inc. | 582,815 | ||||||
| 3,980 | Comerica, Inc. | 190,005 | ||||||
| 7,402 | Crown Castle International Corp. REIT | 578,244 | ||||||
| 10,196 | Discover Financial Services | 650,301 | ||||||
| 6,417 | E*TRADE Financial Corp.(b) | 143,099 | ||||||
| 7,990 | Equity Residential REIT | 555,784 | ||||||
| 1,411 | Essex Property Trust, Inc. REIT | 284,683 | ||||||
| 18,445 | Fifth Third Bancorp | 368,716 | ||||||
| 8,705 | Franklin Resources, Inc. | 484,085 | ||||||
| 13,843 | General Growth Properties, Inc. REIT | 358,672 | ||||||
| 11,050 | Genworth Financial, Inc., Class A(b) | 154,589 | ||||||
| 9,057 | Goldman Sachs Group, Inc. (The) | 1,720,739 | ||||||
| 9,942 | Hartford Financial Services Group, Inc. (The) | 393,504 | ||||||
| 10,111 | HCP, Inc. REIT | 444,581 | ||||||
| 7,178 | Health Care REIT, Inc. REIT | 510,428 | ||||||
| 16,812 | Host Hotels & Resorts, Inc. REIT | 391,888 | ||||||
| 10,448 | Hudson City Bancorp, Inc. | 100,823 | ||||||
| 18,073 | Huntington Bancshares, Inc. | 179,103 | ||||||
| 2,513 | IntercontinentalExchange, Inc. | 523,433 | ||||||
| 9,198 | Invesco Ltd.(c) | 372,243 | ||||||
| 3,852 | Iron Mountain, Inc. REIT | 138,942 | ||||||
| 83,249 | JPMorgan Chase & Co. | 5,034,900 | ||||||
| 19,413 | KeyCorp | 256,252 | ||||||
| 9,004 | Kimco Realty Corp. REIT | 224,650 | ||||||
| 2,224 | Legg Mason, Inc. | 115,648 | ||||||
| 7,087 | Leucadia National Corp. | 168,529 | ||||||
See accompanying Notes to Financial Statements which are an integral part of the financial statements.
| 17 |
|
PowerShares S&P 500® Downside Hedged Portfolio (PHDG) (continued)
October 31, 2014
| Number of Shares | Value | |||||||
| Common Stocks and Other Equity Interests (continued) | ||||||||
| Financials (continued) | ||||||||
| 5,802 | Lincoln National Corp. | $ | 317,718 | |||||
| 6,791 | Loews Corp. | 296,088 | ||||||
| 2,913 | M&T Bank Corp. | 355,910 | ||||||
| 3,139 | Macerich Co. (The) REIT | 221,299 | ||||||
| 12,083 | Marsh & McLennan Cos., Inc. | 656,953 | ||||||
| 6,019 | McGraw Hill Financial, Inc. | 544,599 | ||||||
| 24,870 | MetLife, Inc. | 1,348,949 | ||||||
| 4,085 | Moody’s Corp. | 405,355 | ||||||
| 33,885 | Morgan Stanley | 1,184,281 | ||||||
| 2,596 | NASDAQ OMX Group, Inc. (The) | 112,303 | ||||||
| 9,391 | Navient Corp. | 185,754 | ||||||
| 4,912 | Northern Trust Corp. | 325,666 | ||||||
| 6,833 | People’s United Financial, Inc. | 99,898 | ||||||
| 3,930 | Plum Creek Timber Co., Inc. REIT | 161,169 | ||||||
| 11,949 | PNC Financial Services Group, Inc. (The) | 1,032,274 | ||||||
| 6,086 | Principal Financial Group, Inc. | 318,724 | ||||||
| 11,908 | Progressive Corp. (The) | 314,490 | ||||||
| 11,084 | Prologis, Inc. REIT | 461,649 | ||||||
| 10,162 | Prudential Financial, Inc. | 899,743 | ||||||
| 3,219 | Public Storage REIT | 593,390 | ||||||
| 30,538 | Regions Financial Corp. | 303,242 | ||||||
| 6,872 | Simon Property Group, Inc. REIT | 1,231,531 | ||||||
| 9,372 | State Street Corp. | 707,211 | ||||||
| 11,775 | SunTrust Banks, Inc. | 460,874 | ||||||
| 5,789 | T. Rowe Price Group, Inc. | 475,219 | ||||||
| 2,898 | Torchmark Corp. | 153,478 | ||||||
| 7,515 | Travelers Cos., Inc. (The) | 757,512 | ||||||
| 39,898 | U.S. Bancorp | 1,699,655 | ||||||
| 5,662 | Unum Group | 189,451 | ||||||
| 6,498 | Ventas, Inc. REIT | 445,178 | ||||||
| 3,877 | Vornado Realty Trust REIT | 424,454 | ||||||
| 105,144 | Wells Fargo & Co. | 5,582,095 | ||||||
| 11,728 | Weyerhaeuser Co. REIT | 397,110 | ||||||
| 5,856 | XL Group PLC | 198,401 | ||||||
| 4,437 | Zions Bancorporation | 128,540 | ||||||
|
| |||||||
| 65,136,360 | ||||||||
|
| |||||||
| Health Care—10.7% | ||||||||
| 33,321 | Abbott Laboratories | 1,452,462 | ||||||
| 35,209 | AbbVie, Inc. | 2,234,363 | ||||||
| 5,833 | Actavis PLC(b) | 1,415,903 | ||||||
| 7,862 | Aetna, Inc. | 648,694 | ||||||
| 7,410 | Agilent Technologies, Inc. when-issued | 293,925 | ||||||
| 4,365 | Alexion Pharmaceuticals, Inc.(b) | 835,286 | ||||||
| 6,568 | Allergan, Inc. | 1,248,314 | ||||||
| 4,711 | AmerisourceBergen Corp. | 402,367 | ||||||
| 16,817 | Amgen, Inc. | 2,727,381 | ||||||
| 11,979 | Baxter International, Inc. | 840,207 | ||||||
| 4,259 | Becton, Dickinson and Co. | 548,133 | ||||||
| 5,240 | Biogen Idec, Inc.(b) | 1,682,459 | ||||||
| 29,376 | Boston Scientific Corp.(b) | 390,113 | ||||||
| 36,675 | Bristol-Myers Squibb Co. | 2,134,118 | ||||||
| 1,664 | C.R. Bard, Inc. | 272,846 | ||||||
| 7,473 | Cardinal Health, Inc. | 586,481 | ||||||
| 4,525 | CareFusion Corp.(b) | 259,599 | ||||||
| 17,684 | Celgene Corp.(b) | 1,893,780 | ||||||
| 6,741 | Cerner Corp.(b) | 426,975 | ||||||
| Number of Shares | Value | |||||||
| Common Stocks and Other Equity Interests (continued) | ||||||||
| Health Care (continued) | ||||||||
| 5,824 | Cigna Corp. | $ | 579,896 | |||||
| 10,007 | Covidien PLC | 925,047 | ||||||
| 3,832 | DaVita HealthCare Partners, Inc.(b) | 299,164 | ||||||
| 3,186 | DENTSPLY International, Inc. | 161,753 | ||||||
| 2,371 | Edwards Lifesciences Corp.(b) | 286,701 | ||||||
| 21,800 | Eli Lilly & Co. | 1,445,994 | ||||||
| 16,511 | Express Scripts Holding Co.(b) | 1,268,375 | ||||||
| 33,463 | Gilead Sciences, Inc.(b) | 3,747,856 | ||||||
| 3,710 | Hospira, Inc.(b) | 199,227 | ||||||
| 3,429 | Humana, Inc. | 476,117 | ||||||
| 789 | Intuitive Surgical, Inc.(b) | 391,186 | ||||||
| 62,423 | Johnson & Johnson | 6,727,951 | ||||||
| 1,865 | Laboratory Corp. of America Holdings(b) | 203,826 | ||||||
| 2,507 | Mallinckrodt PLC(b) | 231,095 | ||||||
| 5,110 | McKesson Corp. | 1,039,425 | ||||||
| 21,666 | Medtronic, Inc. | 1,476,755 | ||||||
| 63,848 | Merck & Co., Inc. | 3,699,353 | ||||||
| 8,270 | Mylan, Inc.(b) | 442,859 | ||||||
| 1,894 | Patterson Cos., Inc. | 81,650 | ||||||
| 2,503 | PerkinElmer, Inc. | 108,680 | ||||||
| 2,943 | Perrigo Co. PLC | 475,147 | ||||||
| 140,340 | Pfizer, Inc. | 4,203,183 | ||||||
| 3,210 | Quest Diagnostics, Inc. | 203,707 | ||||||
| 1,646 | Regeneron Pharmaceuticals, Inc.(b) | 648,063 | ||||||
| 6,327 | St. Jude Medical, Inc. | 406,004 | ||||||
| 6,594 | Stryker Corp. | 577,173 | ||||||
| 2,148 | Tenet Healthcare Corp.(b) | 120,395 | ||||||
| 8,842 | Thermo Fisher Scientific, Inc. | 1,039,554 | ||||||
| 21,523 | UnitedHealth Group, Inc. | 2,044,900 | ||||||
| 2,045 | Universal Health Services, Inc., Class B | 212,087 | ||||||
| 2,271 | Varian Medical Systems, Inc.(b) | 191,037 | ||||||
| 5,295 | Vertex Pharmaceuticals, Inc.(b) | 596,429 | ||||||
| 1,844 | Waters Corp.(b) | 204,315 | ||||||
| 6,079 | WellPoint, Inc. | 770,149 | ||||||
| 3,713 | Zimmer Holdings, Inc. | 413,034 | ||||||
| 11,087 | Zoetis, Inc. | 411,993 | ||||||
|
| |||||||
| 56,603,486 | ||||||||
|
| |||||||
| Industrials—7.8% | ||||||||
| 14,352 | 3M Co. | 2,206,907 | ||||||
| 3,896 | ADT Corp. (The) | 139,633 | ||||||
| 2,133 | Allegion PLC | 113,241 | ||||||
| 5,414 | AMETEK, Inc. | 282,340 | ||||||
| 14,826 | Boeing Co. (The) | 1,851,916 | ||||||
| 3,251 | C.H. Robinson Worldwide, Inc. | 225,002 | ||||||
| 13,924 | Caterpillar, Inc. | 1,412,033 | ||||||
| 2,143 | Cintas Corp. | 156,953 | ||||||
| 22,161 | CSX Corp. | 789,596 | ||||||
| 3,799 | Cummins, Inc. | 555,338 | ||||||
| 13,528 | Danaher Corp. | 1,087,651 | ||||||
| 7,931 | Deere & Co. | 678,418 | ||||||
| 18,670 | Delta Air Lines, Inc. | 751,094 | ||||||
| 3,678 | Dover Corp. | 292,180 | ||||||
| 800 | Dun & Bradstreet Corp. (The) | 98,248 | ||||||
| 10,499 | Eaton Corp. PLC | 718,027 | ||||||
| 15,454 | Emerson Electric Co. | 989,983 | ||||||
| 2,737 | Equifax, Inc. | 207,300 | ||||||
See accompanying Notes to Financial Statements which are an integral part of the financial statements.
| 18 |
|
PowerShares S&P 500® Downside Hedged Portfolio (PHDG) (continued)
October 31, 2014
| Number of Shares | Value | |||||||
| Common Stocks and Other Equity Interests (continued) | ||||||||
| Industrials (continued) | ||||||||
| 4,347 | Expeditors International of Washington, Inc. | $ | 185,443 | |||||
| 6,068 | Fastenal Co. | 267,235 | ||||||
| 5,855 | FedEx Corp. | 980,127 | ||||||
| 3,007 | Flowserve Corp. | 204,446 | ||||||
| 3,507 | Fluor Corp. | 232,654 | ||||||
| 7,042 | General Dynamics Corp. | 984,190 | ||||||
| 222,085 | General Electric Co. | 5,732,014 | ||||||
| 17,302 | Honeywell International, Inc. | 1,663,068 | ||||||
| 8,047 | Illinois Tool Works, Inc. | 732,679 | ||||||
| 5,892 | Ingersoll-Rand PLC | 368,957 | ||||||
| 2,932 | Jacobs Engineering Group, Inc.(b) | 139,123 | ||||||
| 2,179 | Joy Global, Inc. | 114,681 | ||||||
| 2,457 | Kansas City Southern | 301,695 | ||||||
| 1,886 | L-3 Communications Holdings, Inc. | 229,074 | ||||||
| 5,982 | Lockheed Martin Corp. | 1,139,990 | ||||||
| 7,884 | Masco Corp. | 174,000 | ||||||
| 6,758 | Nielsen Holdings NV | 287,147 | ||||||
| 6,845 | Norfolk Southern Corp. | 757,331 | ||||||
| 4,618 | Northrop Grumman Corp. | 637,099 | ||||||
| 7,863 | PACCAR, Inc. | 513,611 | ||||||
| 2,392 | Pall Corp. | 218,677 | ||||||
| 3,271 | Parker Hannifin Corp. | 415,515 | ||||||
| 4,272 | Pentair PLC (United Kingdom) | 286,438 | ||||||
| 4,502 | Pitney Bowes, Inc. | 111,379 | ||||||
| 3,188 | Precision Castparts Corp. | 703,592 | ||||||
| 4,761 | Quanta Services, Inc.(b) | 162,255 | ||||||
| 6,886 | Raytheon Co. | 715,318 | ||||||
| 5,622 | Republic Services, Inc. | 215,885 | ||||||
| 3,029 | Robert Half International, Inc. | 165,929 | ||||||
| 3,020 | Rockwell Automation, Inc. | 339,297 | ||||||
| 2,980 | Rockwell Collins, Inc. | 250,767 | ||||||
| 2,204 | Roper Industries, Inc. | 348,893 | ||||||
| 1,166 | Ryder System, Inc. | 103,156 | ||||||
| 1,315 | Snap-on, Inc. | 173,764 | ||||||
| 15,157 | Southwest Airlines Co. | 522,613 | ||||||
| 3,470 | Stanley Black & Decker, Inc. | 324,931 | ||||||
| 1,863 | Stericycle, Inc.(b) | 234,738 | ||||||
| 6,162 | Textron, Inc. | 255,908 | ||||||
| 9,799 | Tyco International Ltd. | 420,671 | ||||||
| 19,852 | Union Pacific Corp. | 2,311,765 | ||||||
| 15,570 | United Parcel Service, Inc., Class B | 1,633,449 | ||||||
| 2,130 | United Rentals, Inc.(b) | 234,428 | ||||||
| 18,811 | United Technologies Corp. | 2,012,777 | ||||||
| 1,355 | W.W. Grainger, Inc. | 334,414 | ||||||
| 9,625 | Waste Management, Inc. | 470,566 | ||||||
| 4,006 | Xylem, Inc. | 145,658 | ||||||
|
| |||||||
| 41,313,207 | ||||||||
|
| |||||||
| Information Technology—14.7% | ||||||||
| 13,984 | Accenture PLC, Class A | 1,134,382 | ||||||
| 10,455 | Adobe Systems, Inc.(b) | 733,105 | ||||||
| 3,944 | Akamai Technologies, Inc.(b) | 237,823 | ||||||
| 1,216 | Alliance Data Systems Corp.(b) | 344,554 | ||||||
| 6,840 | Altera Corp. | 235,091 | ||||||
| 6,954 | Amphenol Corp., Class A | 351,733 | ||||||
| 6,903 | Analog Devices, Inc. | 342,527 | ||||||
| Number of Shares | Value | |||||||
| Common Stocks and Other Equity Interests (continued) | ||||||||
| Information Technology (continued) | ||||||||
| 132,520 | Apple, Inc. | $ | 14,312,160 | |||||
| 26,952 | Applied Materials, Inc. | 595,370 | ||||||
| 5,039 | Autodesk, Inc.(b) | 289,944 | ||||||
| 10,674 | Automatic Data Processing, Inc. | 872,920 | ||||||
| 5,608 | Avago Technologies Ltd. (Singapore) | 483,690 | ||||||
| 11,900 | Broadcom Corp., Class A | 498,372 | ||||||
| 7,112 | CA, Inc. | 206,675 | ||||||
| 112,957 | Cisco Systems, Inc. | 2,764,058 | ||||||
| 3,634 | Citrix Systems, Inc.(b) | 233,412 | ||||||
| 13,431 | Cognizant Technology Solutions Corp., Class A(b) | 656,104 | ||||||
| 3,224 | Computer Sciences Corp. | 194,730 | ||||||
| 28,617 | Corning, Inc. | 584,645 | ||||||
| 25,037 | eBay, Inc.(b) | 1,314,442 | ||||||
| 6,908 | Electronic Arts, Inc.(b) | 283,021 | ||||||
| 44,920 | EMC Corp. | 1,290,552 | ||||||
| 1,669 | F5 Networks, Inc.(b) | 205,254 | ||||||
| 46,080 | Facebook, Inc., Class A(b) | 3,455,539 | ||||||
| 6,348 | Fidelity National Information Services, Inc. | 370,660 | ||||||
| 1,688 | First Solar, Inc.(b) | 99,423 | ||||||
| 5,505 | Fiserv, Inc.(b) | 382,487 | ||||||
| 3,177 | FLIR Systems, Inc. | 106,525 | ||||||
| 6,302 | Google, Inc., Class A(b) | 3,578,717 | ||||||
| 6,302 | Google, Inc., Class C(b) | 3,523,322 | ||||||
| 2,289 | Harris Corp. | 159,314 | ||||||
| 41,326 | Hewlett-Packard Co. | 1,482,777 | ||||||
| 109,626 | Intel Corp. | 3,728,380 | ||||||
| 20,532 | International Business Machines Corp. | 3,375,461 | ||||||
| 6,248 | Intuit, Inc. | 549,886 | ||||||
| 4,404 | Jabil Circuit, Inc. | 92,264 | ||||||
| 8,909 | Juniper Networks, Inc. | 187,713 | ||||||
| 3,656 | KLA-Tencor Corp. | 289,372 | ||||||
| 3,586 | Lam Research Corp. | 279,206 | ||||||
| 5,301 | Linear Technology Corp. | 227,095 | ||||||
| 21,819 | MasterCard, Inc., Class A | 1,827,341 | ||||||
| 4,384 | Microchip Technology, Inc. | 188,994 | ||||||
| 23,706 | Micron Technology, Inc.(b) | 784,431 | ||||||
| 182,366 | Microsoft Corp. | 8,562,084 | ||||||
| 4,914 | Motorola Solutions, Inc. | 316,953 | ||||||
| 7,091 | NetApp, Inc. | 303,495 | ||||||
| 11,418 | NVIDIA Corp. | 223,108 | ||||||
| 72,044 | Oracle Corp. | 2,813,318 | ||||||
| 7,227 | Paychex, Inc. | 339,235 | ||||||
| 37,093 | QUALCOMM, Inc. | 2,912,171 | ||||||
| 4,215 | Red Hat, Inc.(b) | 248,348 | ||||||
| 12,774 | Salesforce.com, Inc.(b) | 817,408 | ||||||
| 4,978 | SanDisk Corp. | 468,629 | ||||||
| 7,214 | Seagate Technology PLC | 453,256 | ||||||
| 15,372 | Symantec Corp. | 381,533 | ||||||
| 9,048 | TE Connectivity Ltd. (Switzerland) | 553,104 | ||||||
| 3,463 | Teradata Corp.(b) | 146,554 | ||||||
| 23,654 | Texas Instruments, Inc. | 1,174,658 | ||||||
| 3,615 | Total System Services, Inc. | 122,151 | ||||||
| 2,496 | VeriSign, Inc.(b) | 149,161 | ||||||
| 10,877 | Visa, Inc., Class A | 2,626,034 | ||||||
| 4,900 | Western Digital Corp. | 482,013 | ||||||
See accompanying Notes to Financial Statements which are an integral part of the financial statements.
| 19 |
|
PowerShares S&P 500® Downside Hedged Portfolio (PHDG) (continued)
October 31, 2014
| Number of Shares | Value | |||||||
| Common Stocks and Other Equity Interests (continued) | ||||||||
| Information Technology (continued) | ||||||||
| 11,754 | Western Union Co. (The) | $ | 199,348 | |||||
| 24,140 | Xerox Corp. | 320,579 | ||||||
| 5,956 | Xilinx, Inc. | 264,923 | ||||||
| 20,483 | Yahoo!, Inc.(b) | 943,242 | ||||||
|
| |||||||
| 77,674,776 | ||||||||
|
| |||||||
| Materials—2.5% | ||||||||
| 4,257 | Air Products & Chemicals, Inc. | 573,248 | ||||||
| 1,463 | Airgas, Inc. | 163,183 | ||||||
| 25,921 | Alcoa, Inc. | 434,436 | ||||||
| 2,456 | Allegheny Technologies, Inc. | 80,680 | ||||||
| 2,091 | Avery Dennison Corp. | 97,963 | ||||||
| 3,098 | Ball Corp. | 199,604 | ||||||
| 2,194 | Bemis Co., Inc. | 84,403 | ||||||
| 1,095 | CF Industries Holdings, Inc. | 284,700 | ||||||
| 24,844 | Dow Chemical Co. (The) | 1,227,294 | ||||||
| 20,240 | E.I. du Pont de Nemours & Co. | 1,399,596 | ||||||
| 3,289 | Eastman Chemical Co. | 265,685 | ||||||
| 5,980 | Ecolab, Inc. | 665,155 | ||||||
| 2,918 | FMC Corp. | 167,347 | ||||||
| 22,998 | Freeport-McMoRan, Inc. | 655,443 | ||||||
| 1,795 | International Flavors & Fragrances, Inc. | 177,974 | ||||||
| 9,435 | International Paper Co. | 477,600 | ||||||
| 9,403 | LyondellBasell Industries NV, Class A | 861,597 | ||||||
| 1,363 | Martin Marietta Materials, Inc. | 159,362 | ||||||
| 3,667 | MeadWestvaco Corp. | 161,971 | ||||||
| 11,600 | Monsanto Co. | 1,334,464 | ||||||
| 7,076 | Mosaic Co. (The) | 313,538 | ||||||
| 11,067 | Newmont Mining Corp. | 207,617 | ||||||
| 7,067 | Nucor Corp. | 382,042 | ||||||
| 3,610 | Owens-Illinois, Inc.(b) | 93,030 | ||||||
| 3,066 | PPG Industries, Inc. | 624,514 | ||||||
| 6,473 | Praxair, Inc. | 815,533 | ||||||
| 4,691 | Sealed Air Corp. | 170,049 | ||||||
| 1,833 | Sherwin-Williams Co. (The) | 420,783 | ||||||
| 2,623 | Sigma-Aldrich Corp. | 356,492 | ||||||
| 2,876 | Vulcan Materials Co. | 177,478 | ||||||
|
| |||||||
| 13,032,781 | ||||||||
|
| |||||||
| Telecommunication Services—1.8% | ||||||||
| 114,786 | AT&T, Inc. | 3,999,144 | ||||||
| 12,650 | CenturyLink, Inc. | 524,722 | ||||||
| 21,970 | Frontier Communications Corp. | 143,684 | ||||||
| 91,756 | Verizon Communications, Inc. | 4,610,739 | ||||||
| 13,226 | Windstream Holdings, Inc. | 138,608 | ||||||
|
| |||||||
| 9,416,897 | ||||||||
|
| |||||||
| Utilities—2.4% | ||||||||
| 14,662 | AES Corp. (The) | 206,294 | ||||||
| 2,633 | AGL Resources, Inc. | 141,945 | ||||||
| 5,372 | Ameren Corp. | 227,450 | ||||||
| 10,795 | American Electric Power Co., Inc. | 629,780 | ||||||
| 9,444 | CenterPoint Energy, Inc. | 231,850 | ||||||
| 6,025 | CMS Energy Corp. | 196,837 | ||||||
| 6,462 | Consolidated Edison, Inc. | 409,432 | ||||||
| 12,902 | Dominion Resources, Inc. | 919,913 | ||||||
| 3,930 | DTE Energy Co. | 322,889 | ||||||
| 15,687 | Duke Energy Corp. | 1,288,687 | ||||||
| Number of Shares | Value | |||||||
| Common Stocks and Other Equity Interests (continued) | ||||||||
| Utilities (continued) | ||||||||
| 7,203 | Edison International | $ | 450,764 | |||||
| 3,965 | Entergy Corp. | 333,139 | ||||||
| 19,026 | Exelon Corp. | 696,161 | ||||||
| 9,292 | FirstEnergy Corp. | 346,963 | ||||||
| 1,782 | Integrys Energy Group, Inc. | 129,516 | ||||||
| 9,676 | NextEra Energy, Inc. | 969,729 | ||||||
| 6,965 | NiSource, Inc. | 292,948 | ||||||
| 6,979 | Northeast Utilities | 344,414 | ||||||
| 7,500 | NRG Energy, Inc. | 224,850 | ||||||
| 5,488 | Pepco Holdings, Inc. | 150,042 | ||||||
| 10,435 | PG&E Corp. | 525,089 | ||||||
| 2,478 | Pinnacle West Capital Corp. | 152,323 | ||||||
| 14,707 | PPL Corp. | 514,598 | ||||||
| 11,175 | Public Service Enterprise Group, Inc. | 461,639 | ||||||
| 3,180 | SCANA Corp. | 174,550 | ||||||
| 5,102 | Sempra Energy | 561,220 | ||||||
| 19,821 | Southern Co. (The) | 918,902 | ||||||
| 5,109 | TECO Energy, Inc. | 100,188 | ||||||
| 5,009 | Wisconsin Energy Corp. | 248,747 | ||||||
| 11,124 | Xcel Energy, Inc. | 372,320 | ||||||
|
| |||||||
| 12,543,179 | ||||||||
|
| |||||||
| Total Common Stocks and Other Equity Interests (Cost $367,947,015) | 396,723,767 | |||||||
|
| |||||||
| Money Market Fund—20.2% | ||||||||
| 107,325,136 | Invesco Premier Portfolio—Institutional Class(d) (Cost $107,325,136) | 107,325,136 | ||||||
|
| |||||||
| Total Investments (Cost $475,272,151)—95.2% | 504,048,903 | |||||||
| Other assets less liabilities—4.8% | 25,416,417 | |||||||
|
| |||||||
| Net Assets—100.0% | $ | 529,465,320 | ||||||
|
| |||||||
Investment Abbreviations:
REIT—Real Estate Investment Trust
Notes to Schedule of Investments:
| (a) | Industry and/or sector classifications used in this report are generally according to the Global Industry Classification Standard, which was developed by and is the exclusive property and a service mark of MSCI Inc. and Standard & Poor’s. |
| (b) | Non-income producing security. |
| (c) | Affiliated company. The Fund’s Adviser is a wholly-owned subsidiary of Invesco Ltd. and therefore, Invesco Ltd. is considered to be affiliated. See Note 4. |
| (d) | The security and the Fund are advised by wholly-owned subsidiaries of Invesco Ltd. and are therefore considered to be affiliated. |
See accompanying Notes to Financial Statements which are an integral part of the financial statements.
| 20 |
|
Statements of Assets and Liabilities
October 31, 2014
| PowerShares Active U.S. Real Estate Fund (PSR) | PowerShares China A-Share Portfolio (CHNA) | PowerShares Multi-Strategy Alternative Portfolio (LALT) | PowerShares S&P 500® Downside Hedged Portfolio (PHDG) | |||||||||||||
| Assets: | ||||||||||||||||
Unaffiliated investments, at value | $ | 42,406,098 | $ | — | $ | 9,879,458 | $ | 396,351,524 | ||||||||
Affiliated investments, at value | — | 1,800,000 | 11,316,200 | 107,697,379 | ||||||||||||
|
|
|
|
|
|
|
| |||||||||
Total investments, at value | 42,406,098 | 1,800,000 | 21,195,658 | 504,048,903 | ||||||||||||
Cash | — | 30,192 | 24,438 | 3,290,899 | ||||||||||||
Cash collateral for futures contracts | — | 580,225 | 871,596 | 23,438,791 | ||||||||||||
Receivables: | ||||||||||||||||
Dividends | 31,548 | 20 | 16,974 | 352,944 | ||||||||||||
Shares sold | — | — | — | 4,424,429 | ||||||||||||
Investments sold | — | — | — | 154,653 | ||||||||||||
Forward foreign currency contracts outstanding | — | — | 14,360 | — | ||||||||||||
Unrealized appreciation on futures contracts | — | 86,138 | 33,920 | — | ||||||||||||
|
|
|
|
|
|
|
| |||||||||
Total Assets | 42,437,646 | 2,496,575 | 22,156,946 | 535,710,619 | ||||||||||||
|
|
|
|
|
|
|
| |||||||||
| Liabilities: | ||||||||||||||||
Due to custodian | 14,636 | — | — | — | ||||||||||||
Payables: | ||||||||||||||||
Investments purchased | — | — | — | 3,312,631 | ||||||||||||
Unrealized depreciation on futures contracts | — | — | — | 2,794,914 | ||||||||||||
Accrued unitary management fees | 27,193 | 884 | 17,017 | 137,754 | ||||||||||||
|
|
|
|
|
|
|
| |||||||||
Total Liabilities | 41,829 | 884 | 17,017 | 6,245,299 | ||||||||||||
|
|
|
|
|
|
|
| |||||||||
| Net Assets | $ | 42,395,817 | $ | 2,495,691 | $ | 22,139,929 | $ | 529,465,320 | ||||||||
|
|
|
|
|
|
|
| |||||||||
| Net Assets Consist of: | ||||||||||||||||
Shares of beneficial interest | $ | 39,714,727 | $ | 2,537,243 | $ | 22,373,860 | $ | 501,656,341 | ||||||||
Undistributed net investment income (loss) | 174,760 | (7,914 | ) | (14,360 | ) | 782,566 | ||||||||||
Undistributed net realized gain (loss) | (1,206,503 | ) | (119,776 | ) | (367,164 | ) | 1,044,575 | |||||||||
Net unrealized appreciation | 3,712,833 | 86,138 | 147,593 | 25,981,838 | ||||||||||||
|
|
|
|
|
|
|
| |||||||||
| Net Assets | $ | 42,395,817 | $ | 2,495,691 | $ | 22,139,929 | $ | 529,465,320 | ||||||||
|
|
|
|
|
|
|
| |||||||||
Shares outstanding (unlimited amount authorized, $0.01 par value) | 600,000 | 100,001 | 900,000 | 17,950,000 | ||||||||||||
Net asset value | $ | 70.66 | $ | 24.96 | $ | 24.60 | $ | 29.50 | ||||||||
|
|
|
|
|
|
|
| |||||||||
Market price | $ | 70.63 | $ | 25.00 | $ | 24.55 | $ | 29.49 | ||||||||
|
|
|
|
|
|
|
| |||||||||
Unaffiliated investments, at cost | $ | 38,693,265 | $ | — | $ | 9,780,145 | $ | 367,616,080 | ||||||||
|
|
|
|
|
|
|
| |||||||||
Affiliated investments, at cost | $ | — | $ | 1,800,000 | $ | 11,316,200 | $ | 107,656,071 | ||||||||
|
|
|
|
|
|
|
| |||||||||
Total investments, at cost | $ | 38,693,265 | $ | 1,800,000 | $ | 21,096,345 | $ | 475,272,151 | ||||||||
|
|
|
|
|
|
|
| |||||||||
See accompanying Notes to Financial Statements which are an integral part of the financial statements.
| 21 |
|
For the year ended October 31, 2014
| PowerShares Active U.S. Real Estate Fund (PSR) | PowerShares China A-Share Portfolio (CHNA) | PowerShares Multi-Strategy Alternative Portfolio (LALT)(a) | PowerShares S&P 500® Downside Hedged Portfolio (PHDG) | |||||||||||||
| Investment Income: | ||||||||||||||||
Unaffiliated dividend income | $ | 799,321 | $ | — | $ | 78,833 | $ | 3,775,581 | ||||||||
Affiliated dividend income | 3 | 99 | 265 | 13,141 | ||||||||||||
Foreign withholding tax | — | — | (50 | ) | (410 | ) | ||||||||||
|
|
|
|
|
|
|
| |||||||||
Total Income | 799,324 | 99 | 79,048 | 3,788,312 | ||||||||||||
|
|
|
|
|
|
|
| |||||||||
| Expenses: | ||||||||||||||||
Unitary management fees | 283,478 | 11,696 | 76,375 | 974,729 | ||||||||||||
|
|
|
|
|
|
|
| |||||||||
Less: Waivers | (22 | ) | (1,539 | ) | (3,602 | ) | (86,708 | ) | ||||||||
|
|
|
|
|
|
|
| |||||||||
Net Expenses | 283,456 | 10,157 | 72,773 | 888,021 | ||||||||||||
|
|
|
|
|
|
|
| |||||||||
Net Investment Income (Loss) | 515,868 | (10,058 | ) | 6,275 | 2,900,291 | |||||||||||
|
|
|
|
|
|
|
| |||||||||
| Realized and Unrealized Gain (Loss): | ||||||||||||||||
Net realized gain (loss) from: | ||||||||||||||||
Investment securities | (260,631 | ) | — | 61,236 | (2,248,108 | ) | ||||||||||
In-kind redemptions | 3,332,731 | — | — | 7,334,181 | ||||||||||||
Futures contracts | — | (53,874 | ) | (428,400 | ) | 2,851,226 | ||||||||||
Forward foreign currency contracts | — | — | (101,833 | ) | — | |||||||||||
|
|
|
|
|
|
|
| |||||||||
Net realized gain (loss) | 3,072,100 | (53,874 | ) | (468,997 | ) | 7,937,299 | ||||||||||
|
|
|
|
|
|
|
| |||||||||
Change in net unrealized appreciation (depreciation) on: | ||||||||||||||||
Investment securities | 2,825,687 | — | 99,313 | 21,828,184 | ||||||||||||
Futures contracts | — | 54,037 | 33,920 | (2,733,227 | ) | |||||||||||
Forward foreign currency contracts | — | — | 14,360 | — | ||||||||||||
|
|
|
|
|
|
|
| |||||||||
Net change in unrealized appreciation | 2,825,687 | 54,037 | 147,593 | 19,094,957 | ||||||||||||
|
|
|
|
|
|
|
| |||||||||
Net realized and unrealized gain (loss) | 5,897,787 | 163 | (321,404 | ) | 27,032,256 | |||||||||||
|
|
|
|
|
|
|
| |||||||||
Net increase (decrease) in net assets resulting from operations | $ | 6,413,655 | $ | (9,895 | ) | $ | (315,129 | ) | $ | 29,932,547 | ||||||
|
|
|
|
|
|
|
| |||||||||
| (a) | For the period May 27, 2014 (commencement of investment operations) through October 31, 2014. |
See accompanying Notes to Financial Statements which are an integral part of the financial statements.
| 22 |
|
(This Page Intentionally Left Blank)
Statements of Changes in Net Assets
For the years ended October 31, 2014 and 2013
| PowerShares Active U.S. Real Estate Fund (PSR) | PowerShares China A-Share Portfolio (CHNA) | |||||||||||||||
| 2014 | 2013 | 2014 | 2013(a) | |||||||||||||
| Operations: | ||||||||||||||||
Net investment income (loss) | $ | 515,868 | $ | 400,012 | $ | (10,058 | ) | $ | (190 | ) | ||||||
Net realized gain (loss) | 3,072,100 | 430,139 | (53,874 | ) | (65,902 | ) | ||||||||||
Net change in unrealized appreciation (depreciation) | 2,825,687 | (106,800 | ) | 54,037 | 32,101 | |||||||||||
|
|
|
|
|
|
|
| |||||||||
Net increase (decrease) in net assets resulting from operations | 6,413,655 | 723,351 | (9,895 | ) | (33,991 | ) | ||||||||||
|
|
|
|
|
|
|
| |||||||||
| Distributions to Shareholders from: | ||||||||||||||||
Net investment income | (504,520 | ) | (299,128 | ) | — | — | ||||||||||
|
|
|
|
|
|
|
| |||||||||
Total distributions to shareholders | (504,520 | ) | (299,128 | ) | — | — | ||||||||||
|
|
|
|
|
|
|
| |||||||||
| Shareholder Transactions: | ||||||||||||||||
Proceeds from shares sold | 45,857,016 | 27,795,852 | — | 2,539,577 | ||||||||||||
Value of shares repurchased | (42,550,001 | ) | (17,434,445 | ) | — | — | ||||||||||
|
|
|
|
|
|
|
| |||||||||
Net increase in net assets resulting from shares transactions | 3,307,015 | 10,361,407 | — | 2,539,577 | ||||||||||||
|
|
|
|
|
|
|
| |||||||||
Increase (Decrease) in Net Assets | 9,216,150 | 10,785,630 | (9,895 | ) | 2,505,586 | |||||||||||
| Net Assets: | ||||||||||||||||
Beginning of period | 33,179,667 | 22,394,037 | 2,505,586 | — | ||||||||||||
|
|
|
|
|
|
|
| |||||||||
End of year | $ | 42,395,817 | $ | 33,179,667 | $ | 2,495,691 | $ | 2,505,586 | ||||||||
|
|
|
|
|
|
|
| |||||||||
Undistributed net investment income (loss) at end of period | $ | 174,760 | $ | 163,412 | $ | (7,914 | ) | $ | (190 | ) | ||||||
|
|
|
|
|
|
|
| |||||||||
| Changes in Shares Outstanding: | ||||||||||||||||
Shares sold | 700,000 | 450,000 | — | 100,001 | ||||||||||||
Shares repurchased | (650,000 | ) | (300,000 | ) | — | — | ||||||||||
Shares outstanding, beginning of period | 550,000 | 400,000 | 100,001 | — | ||||||||||||
|
|
|
|
|
|
|
| |||||||||
Shares outstanding, end of period | 600,000 | 550,000 | 100,001 | 100,001 | ||||||||||||
|
|
|
|
|
|
|
| |||||||||
| (a) | For the period October 8, 2013 (commencement of investment operations) through October 31, 2013. |
| (b) | For the period May 27, 2014 (commencement of investment operations) through October 31, 2014. |
| (c) | For the period December 4, 2012 (commencement of investment operations) through October 31, 2013. |
See accompanying Notes to Financial Statements which are an integral part of the financial statements.
| 24 |
|
| PowerShares Multi-Strategy Alternative Portfolio (LALT) | PowerShares S&P 500® Downside Hedged Portfolio (PHDG) | |||||||||
| 2014(b) | 2014 | 2013(c) | ||||||||
| $ | 6,275 | $ | 2,900,291 | $ | 457,287 | |||||
| (468,997 | ) | 7,937,299 | (6,177,961 | ) | ||||||
| 147,593 | 19,094,957 | 6,886,881 | ||||||||
|
|
|
|
|
| |||||
| (315,129 | ) | 29,932,547 | 1,166,207 | |||||||
|
|
|
|
|
| |||||
| — | (2,996,245 | ) | (293,585 | ) | ||||||
|
|
|
|
|
| |||||
| — | (2,996,245 | ) | (293,585 | ) | ||||||
|
|
|
|
|
| |||||
| 22,455,058 | 462,383,150 | 88,709,552 | ||||||||
| — | (49,436,306 | ) | — | |||||||
|
|
|
|
|
| |||||
| 22,455,058 | 412,946,844 | 88,709,552 | ||||||||
|
|
|
|
|
| |||||
| 22,139,929 | 439,883,146 | 89,582,174 | ||||||||
| — | 89,582,174 | — | ||||||||
|
|
|
|
|
| |||||
| $ | 22,139,929 | $ | 529,465,320 | $ | 89,582,174 | |||||
|
|
|
|
|
| |||||
| $ | (14,360 | ) | $ | 782,566 | $ | 163,757 | ||||
|
|
|
|
|
| |||||
| �� | ||||||||||
| 900,000 | 16,450,000 | 3,300,001 | ||||||||
| — | (1,800,001 | ) | — | |||||||
| — | 3,300,001 | — | ||||||||
|
|
|
|
|
| |||||
| 900,000 | 17,950,000 | 3,300,001 | ||||||||
|
|
|
|
|
| |||||
| 25 |
|
PowerShares Active U.S. Real Estate Fund (PSR)
| Year Ended October 31, | ||||||||||||||||||||
| 2014 | 2013 | 2012 | 2011 | 2010 | ||||||||||||||||
| Per Share Operating Performance: | ||||||||||||||||||||
Net asset value at beginning of period | $ | 60.33 | $ | 55.99 | $ | 50.32 | $ | 45.42 | $ | 33.01 | ||||||||||
Net investment income(a) | 0.92 | 0.93 | 0.77 | 0.54 | 1.07 | |||||||||||||||
Net realized and unrealized gain on investments | 10.33 | 4.20 | 5.82 | 5.15 | 12.06 | |||||||||||||||
Total from investment operations | 11.25 | 5.13 | 6.59 | 5.69 | 13.13 | |||||||||||||||
Distribution to shareholders from: | ||||||||||||||||||||
Net investment income | (0.92 | ) | (0.79 | ) | (0.84 | ) | (0.79 | ) | (0.72 | ) | ||||||||||
Capital gains | — | — | (0.08 | ) | — | — | ||||||||||||||
Total distributions | (0.92 | ) | (0.79 | ) | (0.92 | ) | (0.79 | ) | (0.72 | ) | ||||||||||
Net asset value at end of period | $ | 70.66 | $ | 60.33 | $ | 55.99 | $ | 50.32 | $ | 45.42 | ||||||||||
Market price at end of period(b) | $ | 70.63 | $ | 60.35 | $ | 55.94 | $ | 50.36 | $ | 45.42 | ||||||||||
| Net Asset Value Total Return(c) | 18.95 | % | 9.23 | % | 13.22 | % | 12.77 | % | 40.16 | % | ||||||||||
| Market Price Total Return(c) | 18.86 | % | 9.37 | % | 13.03 | % | 12.86 | % | 39.98 | % | ||||||||||
| Ratios/Supplemental Data: | ||||||||||||||||||||
Net assets at end of period (000’s omitted) | $ | 42,396 | $ | 33,180 | $ | 22,394 | $ | 17,612 | $ | 20,438 | ||||||||||
Ratio to average net assets of: | ||||||||||||||||||||
Expenses, after Waivers | 0.80 | % | 0.80 | % | 0.80 | % | 0.80 | % | 0.80 | % | ||||||||||
Expenses, prior to Waivers | 0.80 | % | 0.80 | % | 0.80 | % | 0.80 | % | 0.80 | % | ||||||||||
Net investment income | 1.46 | % | 1.56 | % | 1.42 | % | 1.10 | % | 2.65 | % | ||||||||||
Portfolio turnover rate(d) | 169 | % | 131 | % | 33 | % | 37 | % | 20 | % | ||||||||||
| (a) | Based on average shares outstanding. |
| (b) | The mean between the last bid and ask price. |
| (c) | Net asset value total return is calculated assuming an initial investment made at the net asset value at the beginning of the period, reinvestment of all dividends and distributions at net asset value during the period, and the redemption on the last day of the period. Net asset value total return includes adjustments in accordance with accounting principles generally accepted in the United States of America and as such, the net asset value for financial reporting purposes and the returns based upon those net asset values may differ from the net asset value and returns for shareholder transactions. Market price total return is calculated assuming an initial investment made at the market price at the beginning of the period, reinvestment of all dividends and distributions at market price during the period, and sale at the market price on the last day of the period. Total investment returns calculated for a period of less than one year are not annualized. |
| (d) | Portfolio turnover rate is not annualized and does not include securities received or delivered from processing creations or redemptions. |
PowerShares China A-Share Portfolio (CHNA)
| Year Ended October 31, 2014 | For the Period October 8, 2013(a) Through October 31, 2013 | |||||||
| Per Share Operating Performance: | ||||||||
Net asset value at beginning of period | $ | 25.06 | $ | 25.40 | ||||
Net investment income(b) | (0.10 | ) | 0.00 | (c) | ||||
Net realized and unrealized gain on investments | 0.00 | (c) | (0.34 | ) | ||||
Total from investment operations | (0.10 | ) | (0.34 | ) | ||||
Net asset value at end of period | $ | 24.96 | $ | 25.06 | ||||
Market price at end of period(d) | $ | 25.00 | $ | 25.18 | ||||
| Net Asset Value Total Return(e) | (0.40 | )% | (1.34 | )%(f) | ||||
| Market Price Total Return(e) | (0.72 | )% | (0.87 | )%(f) | ||||
| Ratios/Supplemental Data: | ||||||||
Net assets at end of period (000’s omitted) | $ | 2,496 | $ | 2,506 | ||||
Ratio to average net assets of: | ||||||||
Expenses, after Waivers | 0.43 | %(g) | 0.45 | %(h) | ||||
Expenses, prior to Waivers | 0.50 | %(g) | 0.50 | %(h) | ||||
Net investment income (loss), after Waivers | (0.43 | )% | (0.13 | )%(h) | ||||
| (a) | Commencement of Investment Operations. |
| (b) | Based on average shares outstanding. |
| (c) | Amount represents less than $0.005. |
| (d) | The mean between the last bid and ask price. |
| (e) | Net asset value total return is calculated assuming an initial investment made at the net asset value at the beginning of the period, reinvestment of all dividends and distributions at net asset value during the period, and the redemption on the last day of the period. Net asset value total return includes adjustments in accordance with accounting principles generally accepted in the United States of America and as such, the net asset value for financial reporting purposes and the returns based upon those net asset values may differ from the net asset value and returns for shareholder transactions. Market price total return is calculated assuming an initial investment made at the market price at the beginning of the period, reinvestment of all dividends and distributions at market price during the period, and sale at the market price on the last day of the period. Total investment returns calculated for a period of less than one year are not annualized. |
| (f) | The net asset value total return from Fund Inception (October 10, 2013, the first day of trading on the Exchange) to October 31, 2013 was (1.07)%. The market price total return from Fund Inception to October 31, 2013 was (0.83)%. |
| (g) | In addition to the fees and expenses which the Fund bears directly, the Fund indirectly bears a pro rata share of the fees and expenses of the investment companies in which the Fund invests. Estimated investment company expenses are not expenses that are incurred directly by the Fund. They are expenses that are incurred directly by the investment companies and are deducted from the value of the funds that the Fund invests in. The effect of the estimated investment company expenses that the Fund bears indirectly is included in the Fund’s total return |
| (h) | Annualized. |
See accompanying Notes to Financial Statements which are an integral part of the financial statements.
| 26 |
|
Financial Highlights (continued)
PowerShares Multi-Strategy Alternative Portfolio (LALT)
| For the Period May 27, 2014(a) Through October 31, 2014 | ||||
| Per Share Operating Performance: | ||||
Net asset value at beginning of period | $ | 25.00 | ||
Net investment income(b) | 0.01 | |||
Net realized and unrealized gain on investments | (0.41 | ) | ||
Total from investment operations | (0.40 | ) | ||
Net asset value at end of period | $ | 24.60 | ||
Market price at end of period(c) | $ | 24.55 | ||
| Net Asset Value Total Return(d) | (1.60 | )%(e) | ||
| Market Price Total Return(d) | (1.80 | )%(e) | ||
| Ratios/Supplemental Data: | ||||
Net assets at end of period (000’s omitted) | $ | 22,140 | ||
Ratio to average net assets of: | ||||
Expenses, after Waivers | 0.90 | %(f)(g) | ||
Expenses, prior to Waivers | 0.95 | %(f)(g) | ||
Net investment income | 0.08 | %(f) | ||
Portfolio turnover rate(h) | 63 | % | ||
| (a) | Commencement of Investment Operations. |
| (b) | Based on average shares outstanding. |
| (c) | The mean between the last bid and ask price. |
| (d) | Net asset value total return is calculated assuming an initial investment made at the net asset value at the beginning of the period, reinvestment of all dividends and distributions at net asset value during the period, and the redemption on the last day of the period. Net asset value total return includes adjustments in accordance with accounting principles generally accepted in the United States of America and as such, the net asset value for financial reporting purposes and the returns based upon those net asset values may differ from the net asset value and returns for shareholder transactions. Market price total return is calculated assuming an initial investment made at the market price at the beginning of the period, reinvestment of all dividends and distributions at market price during the period, and sale at the market price on the last day of the period. Total investment returns calculated for a period of less than one year are not annualized. |
| (e) | The net asset value total return from Fund Inception (May 29, 2014, the first day of trading on the Exchange) to October 31, 2014 was (1.64)%. The market price total return from Fund Inception to October 31, 2014 was (1.92)%. |
| (f) | Annualized. |
| (g) | In addition to the fees and expenses which the Fund bears directly, the Fund indirectly bears a pro rata share of the fees and expenses of the investment companies in which the Fund invests. Estimated investment company expenses are not expenses that are incurred directly by the Fund. They are expenses that are incurred directly by the investment companies and are deducted from the value of the funds that the Fund invests in. The effect of the estimated investment company expenses that the Fund bears indirectly is included in the Fund’s total return. |
| (h) | Portfolio turnover rate is not annualized and does not include securities received or delivered from processing creations or redemptions. |
See accompanying Notes to Financial Statements which are an integral part of the financial statements.
| 27 |
|
Financial Highlights (continued)
PowerShares S&P 500® Downside Hedged Portfolio (PHDG)
| Year Ended October 31, 2014 | For the Period December 4, 2012(a) Through October 31, 2013 | |||||||
| Per Share Operating Performance: | ||||||||
Net asset value at beginning of period | $ | 27.15 | $ | 25.00 | ||||
Net investment income(b) | 0.33 | 0.33 | ||||||
Net realized and unrealized gain on investments | 2.49 | 2.04 | ||||||
Total from investment operations | 2.82 | 2.37 | ||||||
Distribution to shareholders from: | ||||||||
Net investment income | (0.47 | ) | (0.22 | ) | ||||
Net asset value at end of period | $ | 29.50 | $ | 27.15 | ||||
Market price at end of period(c) | $ | 29.49 | $ | 27.23 | ||||
| Net Asset Value Total Return(d) | 10.50 | % | 9.51 | %(e) | ||||
| Market Price Total Return(d) | 10.14 | % | 9.83 | %(e) | ||||
| Ratios/Supplemental Data: | ||||||||
Net assets at end of period (000’s omitted) | $ | 529,465 | $ | 89,582 | ||||
Ratio to average net assets of: | ||||||||
Expenses, after Waivers | 0.36 | %(f) | 0.38 | %(g) | ||||
Expenses, prior to Waivers | 0.39 | %(f) | 0.39 | %(g) | ||||
Net investment income, after Waivers | 1.16 | % | 1.37 | %(g) | ||||
Portfolio turnover rate(h) | 58 | % | 99 | % | ||||
| (a) | Commencement of Investment Operations. |
| (b) | Based on average shares outstanding. |
| (c) | The mean between the last bid and ask price. |
| (d) | Net asset value total return is calculated assuming an initial investment made at the net asset value at the beginning of the period, reinvestment of all dividends and distributions at net asset value during the period, and the redemption on the last day of the period. Net asset value total return includes adjustments in accordance with accounting principles generally accepted in the United States of America and as such, the net asset value for financial reporting purposes and the returns based upon those net asset values may differ from the net asset value and returns for shareholder transactions. Market price total return is calculated assuming an initial investment made at the market price at the beginning of the period, reinvestment of all dividends and distributions at market price during the period, and sale at the market price on the last day of the period. Total investment returns calculated for a period of less than one year are not annualized. |
| (e) | The net asset value total return from Fund Inception (December 6, 2012, the first day of trading on the Exchange) to October 31, 2013 was 8.99%. The market price total return from Fund Inception to October 31, 2013 was 9.26%. |
| (f) | In addition to the fees and expenses which the Fund bears directly, the Fund indirectly bears a pro rata share of the fees and expenses of the investment companies in which the Fund invests. Estimated investment company expenses are not expenses that are incurred directly by the Fund. They are expenses that are incurred directly by the investment companies and are deducted from the value of the funds that the Fund invests in. The effect of the estimated investment company expenses that the Fund bears indirectly is included in the Fund’s total return. |
| (g) | Annualized. |
| (h) | Portfolio turnover rate is not annualized and does not include securities received or delivered from processing creations or redemptions. |
See accompanying Notes to Financial Statements which are an integral part of the financial statements.
| 28 |
|
PowerShares Actively Managed Exchange-Traded Fund Trust
October 31, 2014
Note 1. Organization
PowerShares Actively Managed Exchange-Traded Fund Trust (the “Trust”) was organized as a Delaware statutory trust on November 6, 2007 and is authorized to have multiple series of portfolios. The Trust is an open-end management investment company registered under the Investment Company Act of 1940, as amended (the “1940 Act”). As of October 31, 2014, the Trust offered four portfolios:
Full Name | Short Name | |
| PowerShares Active U.S. Real Estate Fund (PSR) | “Active U.S. Real Estate Fund” | |
| PowerShares China A-Share Portfolio (CHNA) | “China A-Share Portfolio” | |
| PowerShares Multi-Strategy Alternative Portfolio (LALT)* | “Multi-Strategy Alternative Portfolio” | |
| PowerShares S&P 500® Downside Hedged Portfolio (PHDG) | “S&P 500® Downside Hedged Portfolio” |
| * | Commenced operations on May 27, 2014. |
Each portfolio (each, a “Fund”, and collectively, the “Funds”) represents a separate series of the Trust. The shares of the Funds are referred to herein as “Shares” or “Fund’s Shares.” Each Fund’s Shares are listed and traded on NYSE Arca, Inc., except for Multi-Strategy Alternative Portfolio, Shares of which are listed and traded on the NASDAQ Stock Market LLC.
The market prices of each Fund’s Shares may differ to some degree from the Fund’s net asset value (“NAV”). Unlike conventional mutual funds, each Fund issues and redeems Shares on a continuous basis, at NAV, only in a large specified number of Shares, each called a “Creation Unit.” Creation Units for Active U.S. Real Estate Fund generally are issued and redeemed principally, in exchange for the deposit or delivery of a basket of securities (“Deposit Securities”). Creation Units for China A-Share Portfolio and Multi-Strategy Alternative Portfolio are issued and redeemed principally in exchange for the deposit or delivery of cash. Creation Units for S&P 500® Downside Hedged Portfolio are issued and redeemed partially in exchange for the deposit or delivery of cash and partially in exchange for Deposit Securities. Except when aggregated in Creation Units by Authorized Participants, the Shares are not individually redeemable securities of the Funds.
The investment objective for Active U.S. Real Estate Fund is high total return through growth of capital and current income. The investment objective for China A-Share Portfolio is to provide long-term capital appreciation. The investment objective for Multi-Strategy Alternative Portfolio is to seek a positive total return that has a low correlation to the broader securities markets. The investment objective for S&P 500® Downside Hedged Portfolio is to achieve positive total returns in rising or falling markets that are not directly correlated to broad equity or fixed income market returns.
Note 2. Significant Accounting Policies
The preparation of the financial statements in accordance with accounting principles generally accepted in the United States of America (“GAAP”) requires management to make estimates and assumptions that affect the reported amounts and disclosures in the financial statements, including estimates and assumptions related to taxation. Actual results could differ from these estimates. In addition, the Funds monitor for material events or transactions that may occur or become known after the period-end date and before the date the financial statements are released to print.
A. Security Valuation
Securities, including restricted securities, are valued according to the following policies:
A security listed or traded on an exchange (except convertible securities) is valued at its last sales price or official closing price as of the close of the customary trading session on the exchange where the security is principally traded, or lacking any sales or official closing price on a particular day, the security may be valued at the closing bid price on that day. Securities traded in the over-the-counter market are valued based on prices furnished by independent pricing services or market makers. When such securities are valued by an independent pricing service they may be considered fair valued. Futures contracts are valued at the final settlement price set by an exchange on which they are principally traded. Listed options are valued at the mean between the last bid and ask prices from the exchange on which they are principally traded. Options not listed on an exchange are valued by an independent source at the mean between the last bid and ask prices. For purposes of determining NAV per Share, futures and option contracts generally are valued 15 minutes after the close of the customary trading session of the New York Stock Exchange (“NYSE”).
Investments in open-end and closed-end registered investment companies that do not trade on an exchange are valued at the end of day NAV per Share. Investments in open-end and closed-end registered investment companies that trade on an exchange are valued at the last sales price or official closing price as of the close of the customary trading session on the exchange where the security is principally traded.
| 29 |
|
Debt obligations (including convertible securities) and unlisted equities are fair valued using an evaluated quote provided by an independent pricing service. Evaluated quotes provided by the pricing service may be determined without exclusive reliance on quoted prices, and may reflect appropriate factors such as institution-size trading in similar groups of securities, developments related to specific securities, dividend rate (for unlisted equities), yield (for debt obligations), quality, type of issue, coupon rate (for debt obligations), maturity (for debt obligations), individual trading characteristics and other market data. Securities with a demand feature exercisable within one to seven days are valued at par. Debt obligations are subject to interest rate and credit risks. In addition, all debt obligations involve some risk of default with respect to interest and/or principal payments.
Foreign securities’ (including foreign exchange contracts’) prices are converted into U.S. dollar amounts using the applicable exchange rates as of the close of the London world markets. If market quotations are available and reliable for foreign exchange-traded equity securities, the securities will be valued at the market quotations. Because trading hours for certain foreign securities end before the close of the NYSE, closing market quotations may become unreliable. If between the time trading ends on a particular security and the close of the customary trading session on the NYSE, events occur that Invesco PowerShares Capital Management LLC (the “Adviser”) determines are significant and make the closing price unreliable, the Fund may fair value the security. If the event is likely to have affected the closing price of the security, the security will be valued at fair value in good faith using procedures approved by the Board of Trustees. Adjustments to closing prices to reflect fair value may also be based on a screening process of an independent pricing service to indicate the degree of certainty, based on historical data, that the closing price in the principal market where a foreign security trades is not the current value as of the close of the NYSE. Foreign securities’ prices meeting the approved degree of certainty that the price is not reflective of current value will be priced at the indication of fair value from the independent pricing service. Multiple factors may be considered by the independent pricing service in determining adjustments to reflect fair value and may include information relating to sector indices, American Depositary Receipts and domestic and foreign index futures. Foreign securities may have additional risks including exchange rate changes, potential for sharply devalued currencies and high inflation, political and economic upheaval, the relative lack of issuer information, relatively low market liquidity and the potential lack of strict financial and accounting controls and standards.
Securities for which market prices are not provided by any of the above methods may be valued based upon quotes furnished by independent sources. The last bid price may be used to value equity securities. The mean between the last bid and ask prices is used to value debt obligations, including corporate loans.
Securities for which market quotations are not readily available or became unreliable are valued at fair value as determined in good faith following procedures approved by the Board of Trustees. Issuer-specific events, market trends, bid/ask quotes of brokers and information providers and other market data may be reviewed in the course of making a good faith determination of a security’s fair value.
Each Fund may invest in securities that are subject to interest rate risk, meaning the risk that the prices will generally fall as interest rates rise and, conversely, the prices will generally rise as interest rates fall. Specific securities differ in their sensitivity to changes in interest rates depending on their individual characteristics. Changes in interest rates may result in increased market volatility, which may affect the value and/or liquidity of certain of each Fund’s investments.
Valuations change in response to many factors, including the historical and prospective earnings of the issuer, the value of the issuer’s assets, general economic conditions, interest rates, investor perceptions and market liquidity. Because of the inherent uncertainties of valuation, the values reflected in the financial statements may materially differ from the value received upon actual sale of those investments.
B. Other Risks
Equity Risk. Equity risk is the risk that the value of the securities that each Fund holds will fall due to general market and economic conditions, perceptions regarding the industries in which the issuers of securities that a Fund holds participate or factors relating to specific companies in which the Funds invest. For example, an adverse event, such as an unfavorable earnings report, may depress the value of securities a Fund holds; the price of securities may be particularly sensitive to general movements in the stock market; or a drop in the stock market may depress the price of most or all of the securities a Fund holds. In addition, securities of an issuer in the Fund’s portfolio may decline in price if the issuer fails to make anticipated dividend payments because, among other reasons, the issuer of the security experiences a decline in its financial condition.
China Investment Risk. For China A-Share Portfolio there are significant legal requirements that must be resolved before the Fund can invest directly in A-Shares. Currently, the Fund, invests in futures. Investing in futures based on the performance of Chinese companies included in the FTSE China A50 Index involves several risks: The economy of China differs, sometimes unfavorably, from the U.S. economy in such respects as structure, general development, government involvement, wealth distribution, rate of inflation, growth rate, allocation of resources and capital reinvestment, among others; the central government has historically exercised substantial control over virtually every sector of the Chinese economy through administrative regulation and/or state ownership; and actions of the Chinese central and local government authorities continue to have a substantial effect on economic conditions in China. In addition, from time to time the Chinese government has taken actions that influence the prices at which certain goods may be sold,
| 30 |
|
encouraged companies to invest or concentrate in particular industries, induced mergers between companies in certain industries and induced private companies to publicly offer their securities to increase or continue the rate of economic growth, control the rate of inflation or otherwise regulated economic expansion. The regulatory oversight of Chinese companies differs from that in the United States and may not otherwise deter or uncover fraudulent actions by the issuers.
REIT Risk. For Active U.S. Real Estate Fund, although the Fund will not invest in real estate directly, the REITs in which the Fund invests are subject to risks inherent in the direct ownership of real estate. These risks include, but are not limited to, a possible lack of mortgage funds and associated interest rate risks, overbuilding, property vacancies, increases in property taxes and operating expenses, changes in zoning laws, losses due to environmental damages and changes in neighborhood values and appeal to purchasers.
Non-Diversified Fund Risk. Each Fund is non-diversified and can invest a greater portion of its assets in securities of individual issuers than diversified funds. As a result, changes in the market value of a single investment could cause greater fluctuations in Share price than would occur in a diversified fund. This may increase a Fund’s volatility and cause the performance of a relatively small number of issuers to have a greater impact on a Fund’s performance.
Management Risk. The Funds are subject to management risk because they are actively managed portfolios. In managing Active U.S. Real Estate Fund’s portfolio securities, the Fund’s sub-adviser, Invesco Advisers, Inc., and in managing China A-Share Portfolio’s, Multi- Strategy Alternative Portfolio’s and S&P 500® Downside Hedged Portfolio’s securities, the Adviser applies investment techniques and risk analyses in making investment decisions, but there can be no guarantee that these will produce the desired results.
Cash Transaction Risk. Unlike most exchange-traded funds (“ETFs”), China A-Share Portfolio and Multi-Strategy Alternative Portfolio currently effect creations and redemptions principally for cash and S&P 500® Downside Hedged Portfolio currently effects creations and redemptions partially for cash and partially in-kind, rather than primarily in-kind because of the nature of each of these Funds’ investments. As such, investments in each Fund’s Shares may be less tax efficient than investments in shares of conventional ETFs that utilize an entirely in-kind redemption process.
VIX Index Risk. For Multi-Strategy Alternative Portfolio and S&P 500® Downside Hedged Portfolio, the Chicago Board Options Exchange (“CBOE”) can make methodological changes to the calculation of the Chicago Board Options Exchange Volatility Index (“VIX Index”) that could affect the value of the futures contracts on the VIX Index. There can be no assurance that the CBOE will not change the VIX Index calculation methodology in a way that may affect the value of your investment. Additionally, the CBOE may alter, discontinue or suspend calculation or dissemination of the VIX Index and/or the exercise settlement value. Any of these actions could adversely affect the value of each Fund’s Shares.
Tax Risk. China A-Share Portfolio may invest in stock index futures contracts that provide exposure to the China A-Shares market. Multi-Strategy Alternative Portfolio may purchase and sell interest rate futures, including Eurodollar interest rate futures or Euro Euribor interest rate futures, and VIX Index futures contracts. S&P 500® Downside Hedged Portfolio will gain most of its exposure to the futures markets by entering into VIX Index futures (and, to a lesser extent, S&P 500® Index futures (“E-Mini S&P 500 Futures”)). To qualify as a regulated investment company (“RIC”) under Subchapter M of the Internal Revenue Code of 1986, as amended, the Funds must meet a qualifying income test each taxable year. The S&P 500® Downside Hedged Portfolio has received a private letter ruling from the Internal Revenue Service (“IRS”) that income it derives from VIX Index futures contracts will constitute qualifying income for purposes of that test. China A-Share Portfolio and Multi-Strategy Alternative Portfolio received an opinion of its counsel which is not binding on the IRS or courts, stating that such income should be qualifying. Failure to comply with the qualifying income test in any taxable year would have significant negative tax consequences to shareholders of the Funds. If the IRS were to determine that the income that the Funds derive from futures did not constitute qualifying income, the Funds likely would be required to reduce their exposure to such investments in order to maintain qualification as a RIC, which may result in difficulty in implementing their investment strategies.
Commodity Pool Risk. China A-Share Portfolio, Multi-Strategy Alternative Portfolio and S&P 500® Downside Hedged Portfolio invest in futures contracts, which cause each to be deemed to be a commodity pool, thereby subjecting each Fund to regulation under the Commodity Exchange Act and rules of the Commodity Futures Trading Commission (“CFTC”). The Adviser is registered as a Commodity Pool Operator (“CPO”), and the Funds will be operated in accordance with CFTC rules. Registration as a CPO subjects the Adviser to additional laws, regulations and enforcement policies, all of which could increase compliance costs and may affect the operations and financial performance of these Funds. Registration as a commodity pool may have negative effects on the ability of each of these Funds to engage in their respective planned investment program.
C. Federal Income Taxes
Each Fund intends to comply with the provisions of the Internal Revenue Code of 1986, as amended (the “Internal Revenue Code”), applicable to regulated investment companies and to distribute substantially all of the Fund’s taxable earnings to its shareholders. As such, the Funds will not be subject to federal income taxes on otherwise taxable income (including net realized gains) that is distributed to the shareholders. Therefore, no provision for federal income taxes is recorded in the financial statements.
Each Fund recognizes the tax benefits of uncertain tax positions only when the position is more likely than not to be sustained. Management has analyzed each Fund’s uncertain tax positions and concluded that no liability for unrecognized tax benefits should be
| 31 |
|
recorded related to uncertain tax positions. Management is not aware of any tax positions for which it is reasonably possible that the total amounts of unrecognized tax benefits will change materially in the next 12 months.
Income and capital gain distributions are determined in accordance with federal income tax regulations, which may differ from GAAP. These timing differences are primarily due to differing book and tax treatments for in-kind transactions, losses deferred due to wash sales, and passive foreign investment company adjustments, if any.
The Funds file U.S. federal tax returns and tax returns in certain other jurisdictions. Generally, a Fund is subject to examinations by such taxing authorities for up to three years after the filing of the return for the tax period.
D. Investment Transactions and Investment Income
Investment transactions are accounted for on a trade date basis. Realized gains and losses from the sale or disposition of securities are computed on the specific identified cost basis. Interest income is recorded on the accrual basis. Dividend income (net of withholding tax, if any) is recorded on the ex-dividend date. Realized gains, dividends and interest received by a Fund may give rise to withholding and other taxes imposed by foreign countries. Tax conventions between certain countries and the United States may reduce or eliminate such taxes.
Corporate actions (including cash dividends) are recorded net of non-reclaimable foreign tax withholdings on the ex-date.
E. Expenses
Each Fund has agreed to pay an annual unitary management fee to the Adviser. Out of the unitary management fee, the Adviser has agreed to pay for substantially all expenses of the Funds, including payments to the Sub-Advisers (as defined below) for Active U.S. Real Estate Fund and Multi-Strategy Alternative Portfolio, and the cost of transfer agency, custody, fund administration, legal, audit and other services, except for advisory fees, distribution fees, if any, brokerage expenses, taxes, interest, litigation expenses and other extraordinary expenses (including acquired fund fees and expenses, if any).
To the extent a Fund invests in other investment companies, the expenses shown in the accompanying financial statements reflect the expenses of the Fund and do not include any expenses of the investment companies in which it invests. The effects of such investment companies’ expenses are included in the realized and unrealized gain or loss on the investments in the investment companies.
F. Dividends and Distributions to Shareholders
Active U.S. Real Estate Fund and S&P 500® Downside Hedged Portfolio declare and pay dividends from net investment income, if any, to their shareholders quarterly and record such dividends on ex-dividend date. China A-Share Portfolio and Multi-Strategy Alternative Portfolio declare and pay dividends from net investment income, if any, to their shareholders annually and record such dividends on ex-dividend date. Generally, each Fund distributes net realized taxable capital gains, if any, annually in cash and records them on ex-dividend date. Such distributions on a tax basis are determined in conformity with federal income tax regulations which may differ from GAAP. Distributions in excess of tax basis earnings and profits, if any, are reported in such Fund’s financial statements as a tax return of capital at fiscal year-end.
G. Foreign Currency Translations
Foreign currency is valued at the close of the NYSE based on quotations posted by banks and major currency dealers. Portfolio securities and other assets and liabilities denominated in foreign currencies are translated into U.S. dollar amounts at date of valuation. Purchases and sales of portfolio securities (net of foreign taxes withheld on disposition) and income items denominated in foreign currencies are translated into U.S. dollar amounts on the respective dates of such transactions. The Funds do not separately account for the portion of the results of operations resulting from changes in foreign exchange rates on investments and the fluctuations arising from changes in market prices of securities held. The combined results of changes in foreign exchange rates and the fluctuation of market prices on investments (net of estimated foreign tax withholding) are included with the net realized and unrealized gain or loss from investments in the Statements of Operations. Reported net realized foreign currency gains or losses arise from (1) sales of foreign currencies, (2) currency gains or losses realized between the trade and settlement dates on securities transactions, and (3) the difference between the amounts of dividends, interest, and foreign withholding taxes recorded on each Fund’s books and the U.S. dollar equivalent of the amounts actually received or paid. Net unrealized foreign currency gains and losses arise from changes in the fair values of assets and liabilities, other than investments in securities at fiscal period end, resulting from changes in exchange rates.
The Funds may invest in foreign securities, which may be subject to foreign taxes on income, gains on investments or currency repatriation, a portion of which may be recoverable. Foreign taxes, if any, are recorded based on the tax regulations and rates that exist in the foreign markets in which each Fund invests.
H. Forward Foreign Currency Contracts
Multi-Strategy Alternative Portfolio engaged in foreign currency transactions either on a spot (i.e. for prompt delivery and settlement) basis at the rate prevailing in the currency exchange market at the time or through forward foreign currency contracts to manage or minimize currency or exchange rate risk.
| 32 |
|
The Fund also enters into forward foreign currency contracts for the purchase or sale of a security denominated in a foreign currency in order to “lock in” the U.S. dollar price of that security, or the Fund also enters into forward foreign currency contracts that do not provide for physical settlement of the two currencies, but instead are settled by a single cash payment calculated as the difference between the agreed upon exchange rate and the spot rate at settlement based upon an agreed upon notional amount (non-deliverable forwards). The Fund sets aside liquid assets in an amount equal to daily mark-to-market obligation for forward foreign currency contracts.
A forward foreign currency contract is an obligation between two parties (“Counterparties”) to purchase or sell a specific currency for an agreed-upon price at a future date. The use of forward foreign currency contracts does not eliminate fluctuations in the price of the underlying securities the Fund owns or intends to acquire but establishes a rate of exchange in advance. Fluctuations in the value of these contracts are measured by the difference in the contract date and reporting date exchange rates and are recorded as unrealized appreciation (depreciation) until the contracts are closed. When the contracts are closed, realized gains (losses) are recorded. Realized and unrealized gains (losses) on the contracts are included in the Statements of Operations. The primary risks associated with forward foreign currency contracts include failure of the Counterparty to meet the terms of the contract and the value of the foreign currency changing unfavorably. These risks may be in excess of the amounts reflected in the Statements of Assets and Liabilities.
I. Futures Contracts
China A-Share Portfolio, Multi-Strategy Alternative Portfolio and S&P 500® Downside Hedged Portfolio entered into futures contracts to simulate full investment in securities or manage exposure to equity and market price movements and/or currency risks and provide exposure to markets and indexes. China A-Share Portfolio entered into FTSE China A50 Index futures contracts to simulate full investment in the China A-Shares securities. Multi-Strategy Alternative Portfolio entered into currency futures and interest rate futures including Eurodollar interest rate futures or Euro Euribor interest rate futures, and VIX Index futures contracts. S&P 500® Downside Hedged Portfolio entered into U.S. listed futures contracts on the VIX Index and on E-Mini S&P 500 Futures to simulate full investment in the S&P 500® Dynamic VEQTOR Index, to facilitate trading or to reduce transaction costs.
A futures contract is an agreement between two parties to purchase or sell a specified underlying security or index for a specified price at a future date. China A-Share Portfolio will only enter into futures contracts that are traded on the Singapore Exchange; Multi-Strategy Alternative Portfolio and S&P 500® Downside Hedged Portfolio will only enter into futures contracts that are traded on a U.S. exchange and that are standardized as to maturity date and underlying financial instrument. Initial margin deposits required upon entering into futures contracts are satisfied by the segregation of specific securities or cash as collateral at the futures commission merchant broker. During the period the futures contracts are open, changes in the value of the contracts are recognized as unrealized gains or losses by recalculating the value of the contracts on a daily basis. Subsequent or variation margin payments are received or made depending upon whether unrealized gains or losses are incurred. These amounts are reflected as a receivable or payable on the Statements of Assets and Liabilities. When the contracts are closed or expire, each Fund recognizes a realized gain or loss equal to the difference between the proceeds from, or cost of, the closing transaction and the Fund’s basis in the contract. The net realized gain (loss) and the change in unrealized gain (loss) on futures contracts held during the period is included on the Statements of Operations.
The primary risks associated with futures contracts are market risk, leverage risk and the absence of a liquid secondary market. If a Fund were unable to liquidate a futures contract and/or enter into an offsetting closing transaction, the Fund would continue to be subject to market risk with respect to the value of the contracts and may be required to continue to maintain the margin deposits on the futures contracts until the position expired or matured. As futures contracts approach expiration, they may be replaced by similar contracts that have a later expiration. This process is referred to as “rolling.” If the market for these contracts is in “contango,” meaning that the prices of futures contracts in the nearer months are lower than the price of contracts in the distant months, the sale of the near-term month contract would be at a lower price than the longer-term contract, resulting in a cost to “roll” the futures contract. The actual realization of a potential roll cost will depend on the difference in price of the near and distant contracts. The contracts included in the VIX Index historically have traded in “contango” markets, resulting in a roll cost, which could adversely affect the value of Shares of the S&P 500® Downside Hedged Portfolio. China A-Share Portfolio may invest in ETFs that provide exposure to the China A-Share market. Futures have minimal Counterparty Risk since the exchange’s clearinghouse, as Counterparty to all exchange-traded futures contracts guarantees the futures against default. Risks may exceed amounts recognized in the Statements of Assets and Liabilities.
Note 3. Investment Advisory Agreement and Other Agreements
The Trust has entered into an Investment Advisory Agreement with the Adviser pursuant to which the Adviser has overall responsibility for the selection and ongoing monitoring of the Funds’ investments, managing the Funds’ business affairs, providing certain clerical, bookkeeping and other administrative services, and for Active U.S. Real Estate Fund and Multi-Strategy Alternative Portfolio, oversight of Invesco Advisers, Inc., Invesco Asset Management Deutschland GmbH, Invesco Asset Management Limited, Invesco Asset Management (Japan) Limited, Invesco Australia Limited, Invesco Hong Kong Limited, Invesco Senior Secured Management, Inc. and Invesco Canada Ltd. (collectively, the “Sub-Advisers”), all of which are affiliates of the Adviser.
As compensation for its services, each Fund has agreed to pay the Adviser an annual unitary management fee. Out of the unitary management fee, the Adviser has agreed to pay for substantially all expenses of the Funds, including for Active U.S. Real Estate Fund
| 33 |
|
and Multi-Strategy Alternative Portfolio, payments to the Sub-Advisers, and for each Fund, the cost of transfer agency, custody, fund administration, legal, audit and other services, except for advisory fees, distribution fees, if any, brokerage expenses, taxes, interest, litigation expenses and other extraordinary expenses (including acquired fund fees and expenses, if any). The unitary management fee is paid by each Fund to the Adviser at the following annual rates:
| % of Average Daily Net Assets | ||||
| Active U.S. Real Estate Fund | 0.80 | % | ||
| China A-Share Portfolio | 0.50 | % | ||
| Multi-Strategy Alternative Portfolio | 0.95 | % | ||
| S&P 500® Downside Hedged Portfolio | 0.39 | % | ||
The Adviser has entered into an Investment Sub-Advisory Agreement with the Sub-Advisers for Active U.S. Real Estate Fund. The sub-advisory fee for these Funds is paid by the Adviser to the Sub-Advisers at 40% of the Adviser’s compensation of the sub-advised assets of each Fund.
Further, through August 31, 2015, the Adviser has contractually agreed to waive a portion of each Fund’s management fee in an amount equal to 100% of the net advisory fees an affiliate of the Adviser receives that are attributable to certain of the Fund’s investments in money market funds managed by that affiliate. The Adviser cannot discontinue this waiver prior to its expiration.
For the fiscal year ended October 31, 2014, the Adviser waived fees for each Fund in the following amounts:
| Active U.S. Real Estate Fund | $ | 22 | ||
| China A-Share Portfolio | 1,539 | |||
| Multi-Strategy Alternative Portfolio | 3,602 | |||
| S&P 500® Downside Hedged Portfolio | 86,708 |
The Trust has entered into a Distribution Agreement with Invesco Distributors, Inc. (the “Distributor”), which serves as the distributor of Creation Units for each Fund. The Distributor does not maintain a secondary market in the Shares. The Funds are not charged any fees pursuant to the Distribution Agreement. The Distributor is an affiliate of the Adviser.
The Trust has entered into service agreements whereby The Bank of New York Mellon, a wholly-owned subsidiary of The Bank of New York Mellon Corporation, serves as the administrator, custodian, fund accountant and transfer agent for each Fund.
Note 4. Investments in Affiliates
Each Fund’s Adviser is a wholly-owned subsidiary of Invesco Ltd., and therefore Invesco Ltd. is considered to be affiliated with the Funds. The table below shows each Fund’s transactions in, and earnings from, its investment in Invesco Ltd. for the fiscal year ended October 31, 2014.
S&P 500® Downside Hedged Portfolio
| Value October 31, 2013 | Purchases at Cost | Proceeds from Sales | Change in Unrealized Appreciation | Realized Gain | Value October 1, 2014 | Dividend Income | ||||||||||||||||||||||
| Invesco Ltd. | $ | 72,596 | $ | 401,681 | $ | (141,743 | ) | $ | 34,208 | $ | 5,501 | $ | 372,243 | $ | 4,246 | |||||||||||||
Note 5. Additional Valuation Information
GAAP defines fair value as the price that would be received to sell an asset or paid to transfer a liability in an orderly transaction between market participants at the measurement date, under current market conditions. GAAP establishes a hierarchy that prioritizes the inputs to valuation methods, giving the highest priority to readily available unadjusted quoted prices in an active market for identical assets (Level 1) and the lowest priority to significant unobservable inputs (Level 3), generally when market prices are not readily available or are unreliable. Based on the valuation inputs, the securities or other investments are tiered into one of three levels. Changes in valuation methods may result in transfers in or out of an investment’s assigned level:
| Level 1 — | Prices are determined using quoted prices in an active market for identical assets. |
| Level 2 — | Prices are determined using other significant observable inputs. Observable inputs are inputs that other market participants may use in pricing a security. These may include quoted prices for similar securities, interest rates, prepayment speeds, credit risk, yield curves, loss severities, default rates, discount rates, volatilities and others. |
| Level 3 — | Prices are determined using significant unobservable inputs. In situations where quoted prices or observable inputs are unavailable (for example, when there is little or no market activity for an investment at the end of the period), |
| 34 |
|
| unobservable inputs may be used. Unobservable inputs reflect a Fund’s own assumptions about the factors market participants would use in determining fair value of the securities or instruments and would be based on the best available information. |
Except for the Fund listed below, as of October 31, 2014, all of the securities in each Fund were valued based on Level 1 inputs (see the Schedules of Investments for security categories). The appreciation (depreciation) on futures contracts held in China-A Share Portfolio and S&P 500® Downside Hedged Portfolio were based on Level 1 inputs. The level assigned to the securities valuations may not be an indication of the risk or liquidity associated with investing in those securities. Because of the inherent uncertainties of valuation, the values reflected in the financial statements may materially differ from the value received upon actual sale of those investments.
| Investments in Securities | ||||||||||||||||
| Level 1 | Level 2 | Level 3 | Total | |||||||||||||
| Multi-Strategy Alternative Portfolio | ||||||||||||||||
Equity Securities | $ | 21,195,658 | $ | — | $ | — | $ | 21,195,658 | ||||||||
Forward Foreign Currency Contracts(a) | — | 14,360 | — | 14,360 | ||||||||||||
Futures(a) | 33,920 | — | — | 33,920 | ||||||||||||
|
|
|
|
|
|
|
| |||||||||
Total Investments | $ | 21,229,578 | $ | 14,360 | $ | — | $ | 21,243,938 | ||||||||
|
|
|
|
|
|
|
| |||||||||
| (a) | Unrealized appreciation. |
Note 6. Derivative Investments
China A-Share Portfolio, Multi-Strategy Alternative Portfolio and S&P 500® Downside Hedged Portfolio have implemented required disclosures about derivative instruments and hedging activities in accordance with GAAP. These disclosures are intended to improve financial reporting about the effects of derivative instruments and hedging activities by enabling investors to better understand an entity’s financial position and financial performance. The enhanced disclosure has no impact on the results of operations reported in the financial statements.
Value of Derivative Instruments at Year-End
The table below summarizes the value of each Fund’s derivative instruments, detailed by primary risk exposure, held as of October 31, 2014:
| Value | ||||||||||||||||||||||||
| China A-Share Portfolio | Multi-Strategy Alternative Portfolio | S&P 500® Downside Hedged Portfolio | ||||||||||||||||||||||
Risk Exposure/Derivative Type | Assets | Liabilities | Assets | Liabilities | Assets | Liabilities | ||||||||||||||||||
| Currency risk: | ||||||||||||||||||||||||
Forward foreign currency contracts(b) | $ | — | $ | — | $ | 185,048 | $ | (170,688 | ) | $ | — | $ | — | |||||||||||
| Equity risk: | ||||||||||||||||||||||||
Futures contracts(c) | 86,138 | — | 58,142 | (193,960 | ) | 3,121,711 | (5,916,625 | ) | ||||||||||||||||
| Interest rate risk: | ||||||||||||||||||||||||
Futures contracts(c) | — | — | 169,738 | — | — | — | ||||||||||||||||||
|
|
|
|
|
|
|
|
|
|
|
| |||||||||||||
Total | $ | 86,138 | — | $ | 412,928 | $ | (364,648 | ) | $ | 3,121,711 | $ | (5,916,625 | ) | |||||||||||
|
|
|
|
|
|
|
|
|
|
|
| |||||||||||||
| (b) | Values are disclosed on the Statements of Assets and Liabilities under the caption Forward foreign currency contracts outstanding. |
| (c) | Values are disclosed on the Statements of Assets and Liabilities under the caption Unrealized appreciation on futures contracts or Unrealized depreciation on futures contracts. |
| 35 |
|
Effect of Derivative Instruments for the fiscal year ended October 31, 2014
The table below summarizes each Fund’s gains (losses) on derivative instruments, detailed by primary risk exposure, recognized in earnings during the period:
| Location of Gain (Loss) on Statement of Operations | ||||||||||||||||
| China A-Share Portfolio | Multi-Strategy Alternative Portfolio | S&P 500® Downside Hedged Portfolio | ||||||||||||||
| Futures | Futures | Forward Foreign Currency Contracts | Futures | |||||||||||||
| Realized Gain (Loss): | ||||||||||||||||
Currency risk | $ | — | $ | — | $ | (101,833 | ) | $ | — | |||||||
Equity risk | (53,874 | ) | (381,178 | ) | — | 2,851,226 | ||||||||||
Interest rate risk | — | (47,222 | ) | — | — | |||||||||||
| Change in Unrealized Appreciation (Depreciation): | ||||||||||||||||
Currency risk | — | — | 14,360 | — | ||||||||||||
Equity risk | 54,037 | (135,818 | ) | — | (2,733,227 | ) | ||||||||||
Interest rate risk | — | 169,738 | — | — | ||||||||||||
|
|
|
|
|
|
|
| |||||||||
Total | $ | 163 | $ | (394,480 | ) | $ | (87,473 | ) | $ | 117,999 | ||||||
|
|
|
|
|
|
|
| |||||||||
The table below summarizes the average notional value of futures contracts and forward foreign currency contracts outstanding during the period.
| Average Notional Value | ||||||||||||
| China A-Share Portfolio | Multi-Strategy Alternative Portfolio | S&P 500® Downside Hedged Portfolio | ||||||||||
| Futures contracts | $ | 2,342,239 | $ | 68,688,448 | $ | 64,452,591 | ||||||
| Forward foreign currency contracts | — | 15,000,983 | — | |||||||||
Multi-Strategy Alternative Portfolio
| Open Forward Foreign Currency Contracts | ||||||||||||||||||||||||||
| Settlement Date | Counterparty | Contract to | Notional Value | Unrealized Appreciation (Depreciation) | ||||||||||||||||||||||
| Deliver | Receive | |||||||||||||||||||||||||
| 11/20/2014 | Morgan Stanley | CHF | 45,294 | USD | 47,800 | $ | 47,068 | $ | 732 | |||||||||||||||||
| 11/20/2014 | Morgan Stanley | CHF | 2,314,560 | USD | 2,452,600 | 2,405,212 | 47,388 | |||||||||||||||||||
| 11/20/2014 | Morgan Stanley | GBP | 773,236 | USD | 1,247,000 | 1,236,860 | 10,140 | |||||||||||||||||||
| 11/20/2014 | Morgan Stanley | GBP | 15,128 | USD | 24,400 | 24,199 | 201 | |||||||||||||||||||
| 11/20/2014 | Morgan Stanley | JPY | 1,077,469 | USD | 10,100 | 9,613 | 487 | |||||||||||||||||||
| 11/20/2014 | Morgan Stanley | JPY | 55,241,573 | USD | 516,900 | 492,840 | 24,060 | |||||||||||||||||||
| 11/20/2014 | Morgan Stanley | SEK | 26,097,211 | USD | 3,626,500 | 3,526,683 | 99,817 | |||||||||||||||||||
| 11/20/2014 | Morgan Stanley | SEK | 511,030 | USD | 70,700 | 69,059 | 1,641 | |||||||||||||||||||
| 11/20/2014 | Morgan Stanley | USD | 8,200 | AUD | 9,328 | 8,188 | (12 | ) | ||||||||||||||||||
| 11/20/2014 | Morgan Stanley | USD | 418,000 | AUD | 476,860 | 418,582 | 582 | |||||||||||||||||||
| 11/20/2014 | Morgan Stanley | USD | 60,400 | EUR | 47,441 | 59,446 | (954 | ) | ||||||||||||||||||
| 11/20/2014 | Morgan Stanley | USD | 3,098,600 | EUR | 2,424,000 | 3,037,418 | (61,182 | ) | ||||||||||||||||||
| 11/20/2014 | Morgan Stanley | USD | 2,420,600 | NOK | 15,929,322 | 2,357,928 | (62,672 | ) | ||||||||||||||||||
| 11/20/2014 | Morgan Stanley | USD | 47,200 | NOK | 310,116 | 45,905 | (1,295 | ) | ||||||||||||||||||
| 11/20/2014 | Morgan Stanley | USD | 1,905,800 | NZD | 2,398,433 | 1,862,144 | (43,656 | ) | ||||||||||||||||||
| 11/20/2014 | Morgan Stanley | USD | 37,200 | NZD | 46,732 | 36,283 | (917 | ) | ||||||||||||||||||
|
| |||||||||||||||||||||||||
| Total open forward foreign currency contracts | $ | 14,360 | ||||||||||||||||||||||||
|
| |||||||||||||||||||||||||
| 36 |
|
Currency Abbreviations:
AUD—Australian Dollar
CHF—Swiss Franc
EUR—Euro
GBP—Pound Sterling
JPY—Japanese Yen
NOK—Norwegian Krone
NZD—New Zealand Dollar
SEK—Swedish Krona
USD—U.S. Dollar
Open Futures Contracts | ||||||||||||||||
China A-Share Portfolio | Number of Contracts | Expiration Date/Commitment | Value | Unrealized Appreciation | ||||||||||||
| SGX FTSE China A50 Index Futures | 334 | November-2014/Long | $ | 2,493,310 | $ | 86,138 | ||||||||||
Multi-Strategy Alternative Portfolio | Number of Contracts | Expiration Date/Commitment | Value | Unrealized Appreciation/ (Depreciation) | ||||||||||
| CBOE Volatility Index (VIX) Futures | (26 | ) | December-2014/Short | $ | (417,300 | ) | $ | 58,142 | ||||||
| CBOE Volatility Index (VIX) Futures | 41 | January-2015/Long | 688,800 | (75,142 | ) | |||||||||
| CBOE Volatility Index (VIX) Futures | 38 | February-2015/Long | 661,200 | (16,506 | ) | |||||||||
| Eurodollar Futures | 296 | September-2015/Long | 73,559,700 | 169,738 | ||||||||||
| S&P 500 E-Mini Futures | (98 | ) | December-2014/Short | (9,855,860 | ) | (102,312 | ) | |||||||
|
|
|
| |||||||||||
| $ | 64,636,540 | $ | 33,920 | |||||||||||
|
|
|
| |||||||||||
S&P 500® Downside Hedged Portfolio | Number of Contracts | Expiration Date/Commitment | Value | Unrealized Appreciation/ (Depreciation) | ||||||||||
| CBOE Volatility Index (VIX) Futures | 2,193 | November-2014/Long | $ | 34,649,400 | $ | (5,402,494 | ) | |||||||
| CBOE Volatility Index (VIX) Futures | 1,165 | December-2014/Long | 18,698,250 | (514,131 | ) | |||||||||
| S&P 500 E-Mini Futures | 788 | December-2014/Long | 79,249,160 | 3,121,711 | ||||||||||
|
|
|
| |||||||||||
| $ | 132,596,810 | $ | (2,794,914 | ) | ||||||||||
|
|
|
| |||||||||||
Offsetting Assets and Liabilities
Accounting Standards Update (“ASU”) No. 2011-11, Disclosures about Offsetting Assets and Liabilities, which was subsequently clarified in Financial Accounting Standards Board ASU 2013-01 “Clarifying the Scope of Disclosures about Offsetting Assets and Liabilities” is intended to enhance disclosures about financial instruments and derivative instruments that are subject to offsetting arrangements on the Statements of Assets and Liabilities and to enable investors to better understand the effect of those arrangements on its financial position. In order for an arrangement to be eligible for netting, the Funds must have a basis to conclude that such netting arrangements are legally enforceable. The Funds enter into netting agreements and collateral agreements in an attempt to reduce the Funds’ counterparty credit risk by providing for a single net settlement with a counterparty of all financial transactions covered by the agreement in an event of default as defined under such agreement.
There were no derivative instruments subject to a netting agreement for which the Funds are not currently netting. The following tables present derivative instruments that are either subject to an enforceable netting agreement or offset by collateral arrangements as of October 31, 2014.
Multi-Strategy Alternative Portfolio
Assets: | ||||||||||||||||||||||||
| Gross amounts presented in Statements of Assets & Liabilities | Gross amounts offset in Statements of Assets & Liabilities | Net amounts of assets presented in the Statements of Assets and Liabilities | Collateral Received | |||||||||||||||||||||
Counterparty | Financial Instruments | Cash | Net Amount | |||||||||||||||||||||
| Morgan Stanley | 185,048 | (170,688 | ) | 14,360 | — | — | 14,360 | |||||||||||||||||
| 37 |
|
Liabilities: | ||||||||||||||||||||||||
| Gross amounts presented in Statements of Assets & Liabilities | Gross amounts offset in Statements of Assets & Liabilities | Net amounts of liabilities presented in the Statements of Assets and Liabilities | Collateral Pledged | |||||||||||||||||||||
Counterparty | Financial Instruments | Cash | Net Amount | |||||||||||||||||||||
| Morgan Stanley | 170,688 | (170,688 | ) | — | — | — | — | |||||||||||||||||
Note 7. Distributions to Shareholders and Tax Components of Net Assets
Tax Character of Distributions to Shareholders Paid During the Fiscal Years Ended October 31, 2014 and 2013:
| 2014 | 2013 | |||||||
| Ordinary Income | Ordinary Income | |||||||
| Active U.S. Real Estate Fund | $ | 504,520 | $ | 299,128 | ||||
| China A-Share Portfolio | — | — | ||||||
| Multi-Strategy Alternative Portfolio | — | — | ||||||
| S&P 500® Downside Hedged Portfolio | 2,996,245 | 293,585 | ||||||
Tax Components of Net Assets at Fiscal Year-End:
| Undistributed Ordinary Income | Undistributed Long-Term Capital Gains | Net Unrealized Appreciation— Investment Securities | Net Unrealized Appreciation— Other Investments | Capital Loss Carryforward | Late-Year Ordinary Loss Deferral | Shares of Beneficial Interest | Total Net Assets | |||||||||||||||||||||||||
| Active U.S. Real Estate Fund | $ | 174,760 | $ | — | $ | 3,481,430 | $ | — | $ | (975,100 | ) | $ | — | $ | 39,714,727 | $ | 42,395,817 | |||||||||||||||
| China A-Share Portfolio | — | — | — | 86,138 | (119,776 | ) | (7,914 | ) | 2,537,243 | 2,495,691 | ||||||||||||||||||||||
| Multi-Strategy Alternative Portfolio | — | — | 92,398 | — | (326,329 | ) | — | 22,373,860 | 22,139,929 | |||||||||||||||||||||||
| S&P 500® Downside Hedged Portfolio | 25,446,914 | 2,362,065 | — | — | — | — | 501,656,341 | 529,465,320 | ||||||||||||||||||||||||
Capital loss carryforward is calculated and reported as of a specific date. Results of transactions and other activity after that date may affect the amount of capital loss carryforward actually available for the Funds to utilize. Capital losses generated in years beginning after December 22, 2010 can be carried forward for an unlimited period, whereas previous losses expire in eight tax years. Capital losses with an expiration period may not be used to offset capital gains until all net capital losses without an expiration date have been utilized. Capital loss carryforwards with no expiration date will retain their character as either short-term or long-term capital losses instead of as short-term capital losses as under prior law. The ability to utilize capital loss carryforwards in the future may be limited under the Internal Revenue Code and related regulations based on the results of future transactions.
The following Funds have capital loss carryforward as of October 31, 2014:
| Post-effective—no expiration | ||||||||||||
| Short-term | Long-term | Total* | ||||||||||
| Active U.S. Real Estate Fund | $ | 975,100 | $ | — | $ | 975,100 | ||||||
| China A-Share Portfolio | 119,776 | — | 119,776 | |||||||||
| Multi-Strategy Alternative Portfolio | 89,641 | 236,688 | 326,329 | |||||||||
| S&P 500® Downside Hedged Portfolio | — | — | — | |||||||||
| * | Capital loss carryforwards as of the date listed above are reduced for limitations, if any, to the extent required by the Internal Revenue Code. |
Note 8. Investment Transactions
For the fiscal year ended October 31, 2014, the cost of securities purchased and proceeds from sales of securities, excluding short-term securities, U.S. Treasury obligations, money market funds and in-kind transactions, were as follows:
| Purchases | Sales | |||||||
| Active U.S. Real Estate Fund | $ | 60,008,278 | $ | 59,890,396 | ||||
| China A-Share Portfolio | — | — | ||||||
| Multi-Strategy Alternative Portfolio | 11,594,458 | 5,163,799 | ||||||
| S&P 500® Downside Hedged Portfolio | 118,733,863 | 112,422,588 | ||||||
| 38 |
|
For the fiscal year ended October 31, 2014, in-kind transactions associated with creations and redemptions were as follows:
| Cost of Securities Received | Value of Securities Delivered | |||||||
| Active U.S. Real Estate Fund | $ | 45,429,474 | $ | 41,755,408 | ||||
| China A-Share Portfolio | — | — | ||||||
| Multi-Strategy Alternative Portfolio | 3,288,275 | — | ||||||
| S&P 500® Downside Hedged Portfolio | 334,003,196 | 46,900,122 | ||||||
Gains (losses) on in-kind transactions are generally not considered taxable gains (losses) for federal income tax purposes.
At October 31, 2014, the aggregate cost and the net unrealized appreciation (depreciation) of investments for tax purposes were as follows:
| Cost | Net Unrealized Appreciation (Depreciation) | Gross Unrealized Appreciation | Gross Unrealized (Depreciation) | |||||||||||||
| Active U.S. Real Estate Fund | $ | 38,924,668 | $ | 3,481,430 | $ | 3,568,895 | $ | (87,465 | ) | |||||||
| China A-Share Portfolio | 1,800,000 | — | — | — | ||||||||||||
| Multi-Strategy Alternative Portfolio | 21,103,260 | 92,398 | 501,166 | (408,768 | ) | |||||||||||
| S&P 500® Downside Hedged Portfolio | 504,048,903 | — | — | — | ||||||||||||
Note 9. Reclassification of Permanent Differences
Primarily as a result of differing book/tax treatment of in-kind transactions on October 31, 2014, amounts were reclassified between undistributed net investment income (loss), undistributed net realized gain (loss) and Shares of beneficial interest. These reclassifications had no effect on the net assets of each Fund. For the fiscal year ended October 31, 2014, the reclassifications were as follows:
| Undistributed Net Investment Income (Loss) | Undistributed Net Realized Gain (Loss) | Shares of Beneficial Interest | ||||||||||
| Active U.S. Real Estate Fund | $ | — | $ | (3,176,570 | ) | $ | 3,176,570 | |||||
| China A-Share Portfolio | 2,334 | — | (2,334 | ) | ||||||||
| Multi-Strategy Alternative Portfolio | (20,635 | ) | 101,833 | (81,198 | ) | |||||||
| S&P 500® Downside Hedged Portfolio | 714,763 | (714,763 | ) | — | ||||||||
Note 10. Trustees’ and Officer’s Fees
Trustees’ and Officer’s Fees include amounts accrued by the Funds to pay remuneration to each Trustee who is not an “interested person” as defined in the 1940 Act (an “Independent Trustee”) and Officer of the Funds. The Adviser, as a result of each Fund’s the unitary management fee, pays for such compensation. The Trustee who is an “interested person” (the “Non-Independent Trustee”) of the Trust does not receive any Trustees’ fees.
The Trust has adopted a deferred compensation plan (the “Plan”). Under the Plan, an Independent Trustee who has executed a Deferred Fee Agreement (a “Participating Trustee”) may defer receipt of all or a portion of his compensation (“Deferral Fees”). Such Deferral Fees are deemed to be invested in select PowerShares Funds. The Deferral Fees payable to the Participating Trustee are valued as of the date such Deferral Fees would have been paid to the Participating Trustee. The value increases with contributions or with increases in the value of the Shares selected, and the value decreases with distributions or with declines in the value of the Shares selected. Obligations under the Plan represent unsecured claims against the general assets of the Funds.
Note 11. Capital
Shares are created and redeemed by each Fund only in Creation Units of 50,000 Shares (100,000 Shares for Multi-Strategy Alternative Portfolio). Only Authorized Participants are permitted to purchase or redeem Creation Units from the Funds. For Active U.S. Real Estate Fund, such transactions are generally permitted in exchange for Deposit Securities, with a balancing cash component to equate the transaction to the NAV per Share of the Fund of the Trust on the transaction date. For China A-Share Portfolio and Multi-Strategy Alternative Portfolio, Creation Units are issued and redeemed principally in exchange for the deposit or delivery of cash, and for S&P 500® Downside Hedged Portfolio, Creation Units are issued and redeemed partially in exchange for the deposit or delivery of cash and partially in exchange for Deposit Securities. Cash equivalent to the value of certain securities may be substituted, generally when the securities are not available in sufficient quantity for delivery, not eligible for trading by the Authorized Participant or as a result of other market circumstances.
| 39 |
|
To the extent that the Funds permit transactions in exchange for Deposit Securities, each Fund may issue Shares in advance of receipt of Deposit Securities subject to various conditions, including a requirement to maintain on deposit with the Trust cash at least equal to 105% of the market value of the missing Deposit Securities. In accordance with the Trust’s Participant Agreement, Creation Units will be issued to an Authorized Participant, notwithstanding the fact that the corresponding Deposit Securities have not been received in part or in whole, in reliance on the undertaking of the Authorized Participant to deliver the missing Deposit Securities as soon as possible, which undertaking shall be secured by the Authorized Participant’s delivery and maintenance of collateral consisting of cash in the form of U.S. dollars in immediately available funds having a value (marked-to-market daily) at least equal to 105%, which the Adviser may change from time to time, of the value of the missing Deposit Securities.
Transactions in each Fund’s Shares are disclosed in detail in the Statements of Changes in Net Assets.
Note 12. Indemnifications
Under the Trust’s organizational documents, its officers and Trustees are indemnified against certain liabilities arising out of the performance of their duties to the Trust. Each Independent Trustee is also indemnified against certain liabilities arising out of the performance of his duties to the Trust pursuant to an Indemnification Agreement between the Independent Trustee and the Trust. Additionally, in the normal course of business, the Trust enters into contracts with service providers that contain general indemnification clauses. The Trust’s maximum exposure under these arrangements is unknown, as this would involve future claims that may be made against the Trust that have not yet occurred. However, based on experience, the Trust believes the risk of loss to be remote.
| 40 |
|
Report of Independent Registered Public Accounting Firm
To the Board of Trustees and Shareholders of PowerShares Actively Managed Exchange-Traded Fund Trust:
In our opinion, the accompanying statements of assets and liabilities, including the schedules of investments, and the related statements of operations and of changes in net assets and the financial highlights present fairly, in all material respects, the financial position of PowerShares Active U.S. Real Estate Fund, PowerShares China A-Share Portfolio, PowerShares Multi-Strategy Alternative Portfolio and PowerShares S&P 500® Downside Hedged Portfolio (each an individual portfolio of PowerShares Actively Managed Exchange-Traded Fund Trust, hereafter referred to as the “Funds”) at October 31, 2014, the results of each of their operations, the changes in each of their net assets and the financial highlights for each of the periods presented, in conformity with accounting principles generally accepted in the United States of America. These financial statements and financial highlights (hereafter referred to as “financial statements”) are the responsibility of the Funds’ management. Our responsibility is to express an opinion on these financial statements based on our audits. We conducted our audits of these financial statements in accordance with the standards of the Public Company Accounting Oversight Board (United States). Those standards require that we plan and perform the audit to obtain reasonable assurance about whether the financial statements are free of material misstatement. An audit includes examining, on a test basis, evidence supporting the amounts and disclosures in the financial statements, assessing the accounting principles used and significant estimates made by management, and evaluating the overall financial statement presentation. We believe that our audits, which included confirmation of securities at October 31, 2014 by correspondence with the custodian and brokers, and the application of alternative auditing procedures where confirmations of security purchases have not been received, provide a reasonable basis for our opinion.
PricewaterhouseCoopers LLP
Chicago, IL
December 23, 2014
| 41 |
|
As a shareholder of a Fund of the PowerShares Actively Managed Exchange-Traded Fund Trust, you incur a unitary management fee. In addition to the unitary management fee, a shareholder may pay distribution fees, if any, brokerage expenses, taxes, interest, litigation expenses and other extraordinary expenses (including acquired fund fees and expenses, if any). The expense examples below are intended to help you understand your ongoing costs (in dollars) of investing in the Funds and to compare these costs with the ongoing costs of investing in other funds.
The example is based on an investment of $1,000 invested at the beginning of the period and held through the six-month period ended October 31, 2014.
In addition to the fees and expenses which the PowerShares China A-Share Portfolio, PowerShares Multi-Strategy Portfolio and the PowerShares S&P 500® Downside Hedged Portfolio (the “Portfolios”) each bear directly, the Portfolios indirectly bear a pro rata share of the fees and expenses of the investment companies in which each Portfolio invests. The amount of fees and expenses incurred indirectly by the Portfolios will vary because the investment companies have varied expenses and fee levels and the Portfolios may own different proportions of the investment companies at different times. Estimated investment companies’ expenses are not expenses that are incurred directly by the Portfolios. They are expenses that are incurred directly by the investment companies and are deducted from the value of the investment companies the Portfolios invest in. The effect of the estimated investment companies’ expenses that you bear indirectly are included in each Portfolio’s total returns.
Actual Expenses
The first line in the following table provides information about actual account values and actual expenses. You may use the information in this line, together with the amount you invested, to estimate the expenses that you paid over the period. Simply divide your account value by $1,000 (for example, an $8,600 account value divided by $1,000 = 8.6), then multiply the result by the number in the first line under the heading “Expenses Paid During the Six-Month Period” to estimate the expenses you paid on your account during this period.
Hypothetical Example for Comparison Purposes
The second line in the following table provides information about hypothetical account values and hypothetical expenses based on each Fund’s actual expense ratio and an assumed annualized rate of return of 5% per year before expenses, which is not the Fund’s actual return. The hypothetical account values and expenses may not be used to estimate the actual ending account balance or expenses you paid for the period. You may use this information to compare the ongoing costs of investing in the Funds and other funds. To do so, compare this 5% hypothetical example with the 5% hypothetical examples that appear in the shareholder reports of the other funds.
Please note that the expenses shown in the table are meant to highlight your ongoing costs only and do not reflect any transactional costs, such as sales charges and brokerage commissions. Therefore, the second line in the table is useful in comparing ongoing costs only, and will not help you determine the relative total costs of owning different funds. In addition, expenses shown in the table do not include the expenses of the underlying funds, which are borne indirectly by a Fund. If transaction costs and indirect expenses were included, your costs would have been higher.
| Beginning Account Value May 1, 2014 | Ending Account Value October 31, 2014 | Annualized Expense Ratio Based on the Six-Month Period | Expenses Paid During the Six-Month Period(1) | |||||||||||||
| PowerShares Active U.S. Real Estate Fund (PSR) | ||||||||||||||||
Actual | $ | 1,000.00 | $ | 1,113.04 | 0.80 | % | $ | 4.26 | ||||||||
Hypothetical (5% return before expenses) | 1,000.00 | 1,021.17 | 0.80 | 4.08 | ||||||||||||
| PowerShares China A-Share Portfolio (CHNA) | ||||||||||||||||
Actual | 1,000.00 | 1,112.29 | 0.43 | 2.29 | ||||||||||||
Hypothetical (5% return before expenses) | 1,000.00 | 1,023.04 | 0.43 | 2.19 | ||||||||||||
| PowerShares Multi-Strategy Alternative Portfolio (LALT)(2) | ||||||||||||||||
Actual | 1,000.00 | 984.00 | 0.90 | 3.86 | ||||||||||||
Hypothetical (5% return before expenses) | 1,000.00 | 1,020.67 | 0.90 | 4.58 | ||||||||||||
| 42 |
|
Fees and Expenses (continued)
| Beginning Account Value May 1, 2014 | Ending Account Value October 31, 2014 | Annualized Expense Ratio Based on the Six-Month Period | Expenses Paid During the Six-Month Period(1) | |||||||||||||
| PowerShares S&P 500® Downside Hedged Portfolio (PHDG) | ||||||||||||||||
Actual | $ | 1,000.00 | $ | 1,076.25 | 0.35 | % | $ | 1.83 | ||||||||
Hypothetical (5% return before expenses) | 1,000.00 | 1,023.44 | 0.35 | 1.79 | ||||||||||||
| (1) | Expenses are calculated using the annualized expense ratio, which represents the ongoing expenses as a percentage of net assets for the six-month period ended October 31, 2014. Expenses are calculated by multiplying the Fund’s annualized expense ratio by the average account value for the period, then multiplying the result by 184/365 (to reflect the six month period). Expense ratios for the most recent six-month period may differ from expense ratios based on the annualized data in the Financial Highlights. |
| (2) | Expenses are calculated using the annualized expense ratio, which represents the ongoing expenses as a percentage of net assets for the period May 27, 2014 (Commencement of Investment Operations) to October 31, 2014. Expenses are calculated by multiplying the Fund’s annualized expense ratio by the average account value for the period, then multiplying the result by 158/365 (to reflect the period since the Fund’s commencement of operations). Hypothetical expenses are calculated by multiplying the Fund’s annualized expense ratio by the average account value for the period, then multiplying the result by 184/365 (to reflect the six month period). |
| 43 |
|
Form 1099-DIV, Form 1042-S and other year-end tax information provide shareholders with actual calendar year amounts that should be included in their tax returns. Shareholders should consult their tax advisers.
The following distribution information is being provided as required by the Internal Revenue Code or to meet a specific state’s requirement.
Each Fund designates the following amounts or, if subsequently determined to be different, the maximum amount allowable for its fiscal year ended October 31, 2014:
| Qualified Dividend Income* | Corporate Dividends-Received Deduction* | |||||||||
| Active U.S. Real Estate Fund | 3 | % | 3 | % | ||||||
| China A-Share Portfolio | 0 | % | 0 | % | ||||||
| Multi-Strategy Alternative Portfolio | 0 | % | 0 | % | ||||||
| S&P 500® Downside Hedged Portfolio | 0 | % | 0 | % | ||||||
| * | The above percentages are based on ordinary income dividends paid to shareholders during the Fund’s fiscal year. |
| 44 |
|
The Trustees and officers information is current as of October 31, 2014.
The Independent Trustees of the Trust, their term of office and length of time served, their principal business occupations during at least the past five years, the number of portfolios in the Fund Complex overseen by each Independent Trustee and the other directorships, if any, held by each Independent Trustee are shown below.
| Name, Address and Year of Birth of Independent Trustees | Position(s) Held | Term of Served* | Principal Occupation(s) During Past 5 Years | Number of Portfolios in Fund Complex** Overseen by Independent Trustees | Other Directorships Held by Independent Trustees During the Past 5 Years | |||||
| Ronn R. Bagge (1958) c/o Invesco PowerShares Capital Management LLC 3500 Lacey Road, Suite 700 Downers Grove, IL 60515 | Trustee | Since 2008 | Founder and Principal, YQA Capital Management LLC (1998-Present); formerly Owner/CEO of Electronic Dynamic Balancing Co., Inc. (high-speed rotating equipment service provider). | 116 | None | |||||
| Todd J. Barre (1957) c/o Invesco PowerShares Capital Management LLC 3500 Lacey Road, Suite 700 Downers Grove, IL 60515 | Trustee | Since 2010 | Assistant Professor of Business, Trinity Christian College (2010-Present); formerly Vice President and Senior Investment Strategist (2001-2008), Director of Open Architecture and Trading (2007-2008), Head of Fundamental Research (2004-2007) and Vice President and Senior Fixed Income Strategist (1994-2001), BMO Financial Group/Harris Private Bank. | 116 | None | |||||
| Marc M. Kole (1960) c/o Invesco PowerShares Capital Management LLC 3500 Lacey Road, Suite 700 Downers Grove, IL 60515 | Trustee | Since 2008 | Retired. Formerly: Chief Financial Officer, Hope Network (social services) (2008-2012); formerly, Assistant Vice President and Controller, Priority Health (health insurance) (2005-2008); Senior Vice President of Finance, United Healthcare (2004-2005); Senior Vice President of Finance and Chief Accounting Officer, Oxford Health Plans (2000-2004); Audit Partner, Arthur Andersen LLP (1996-2000). | 116 | None | |||||
| Yung Bong Lim (1964) c/o Invesco PowerShares Capital Management LLC 3500 Lacey Road, Suite 700 Downers Grove, IL 60515 | Trustee | Since 2013 | Managing Partner, Residential Dynamics Group LLC (2008-Present); formerly, Managing Director, Citadel Investment Group, L.L.C. (1999-2007). | 116 | None | |||||
Philip M. Nussbaum (1961) c/o Invesco PowerShares | Trustee | Since 2008 | Chairman, Performance Trust Capital Partners (2004-Present). | 116 | None | |||||
| * | This is the date the Independent Trustee began serving the Trust. Each Trustee serves an indefinite term, until his successor is elected. |
| ** | Fund Complex includes all open-end funds and closed-end funds (including all of their portfolios) advised by the Adviser and any funds that have an investment adviser that is an affiliated person of the Adviser. At October 31, 2014, the “Fund Family” consisted of the Trust’s four portfolios and three other exchange-traded fund trusts with 112 portfolios advised by the Adviser. |
| 45 |
|
Trustees and Officers (continued)
| Name, Address and Year of Birth of Independent Trustees | Position(s) Held | Term of Time | Principal Occupation(s) During Past 5 Years | Number of Portfolios in Fund Complex** Overseen by Independent Trustees | Other Directorships Held by Independent Trustees During the Past 5 Years | |||||
| Gary R. Wicker (1961) c/o Invesco PowerShares Capital Management LLC 3500 Lacey Road, Suite 700 Downers Grove, IL 60515 | Trustee | Since 2013 | Senior Vice President of Global Finance and Chief Financial Officer of RBC Ministries (publishing company) (2013-Present); formerly, Executive Vice President and Chief Financial Officer, Zondervan Publishing (a division of Harper Collins/NewsCorp) (2007-2012); Senior Vice President and Group Controller (2005-2006), Senior Vice President and Chief Financial Officer (2003-2004), Chief Financial Officer (2001-2003), Vice President, Finance and Controller (1999-2001) and Assistant Controller (1997-1999), divisions of The Thomson Corporation (information services provider). | 116 | None | |||||
| Donald H. Wilson (1959) c/o Invesco PowerShares Capital Management LLC 3500 Lacey Road, Suite 700 Downers Grove, IL 60515 | Chairman of the Board and Trustee | Chairman Since 2012; Trustee Since 2008 | Chairman, President and Chief Executive Officer, Community Financial Shares, Inc. and Community Bank—Wheaton/Glen Ellyn (subsidiary) (2013-Present); Chairman and Chief Executive Officer, Stone Pillar Advisors, Ltd. (2010-Present); formerly, Chief Operating Officer, AMCORE Financial, Inc. (bank holding company) (2007-2009); Executive Vice President and Chief Financial Officer, AMCORE Financial, Inc. (2006-2007); Senior Vice President and Treasurer, Marshall & Ilsley Corp. (bank holding company) (1995-2006). | 116 | None | |||||
| * | This is the date the Independent Trustee began serving the Trust. Each Trustee serves an indefinite term, until his successor is elected. |
| ** | Fund Complex includes all open-end funds and closed-end funds (including all of their portfolios) advised by the Adviser and any funds that have an investment adviser that is an affiliated person of the Adviser. At October 31, 2014, the “Fund Family” consisted of the Trust’s four portfolios and three other exchange-traded fund trusts with 112 portfolios advised by the Adviser. |
| 46 |
|
Trustees and Officers (continued)
The Non-Independent Trustee and the executive officers of the Trust, their term of office and length of time served, their principal business occupations during at least the past five years, the number of portfolios in the Fund Complex overseen by the Non-Independent Trustee and the other directorships, if any, held by the Non-Independent Trustee are shown below.
| Name, Address and Year of Birth of Non-Independent Trustee | Position(s) Held with Trust | Term of Served* | Principal Occupation(s) During Past 5 Years | Number of Portfolios in Fund Complex** Overseen by Non-Independent Trustee | Other Directorships Held by Non-Independent Trustee During the Past 5 Years | |||||
| Kevin M. Carome (1956) Invesco Ltd. Two Peachtree Pointe 1555 Peachtree St., N.E., Suite 1800 Atlanta, GA 30309 | Trustee | Since 2010 | Senior Managing Director, Secretary and General Counsel, Invesco Ltd. (2006-Present); Director, Invesco Advisers, Inc. (2009-Present); Director, Invesco Finance PLC, INVESCO Funds Group, Inc., and Invesco Holding Company Limited; Director and Executive Vice President, Invesco Finance, Inc., Invesco Group Services, Inc., Invesco Investments (Bermuda) Ltd., Invesco North American Holdings, Inc., and IVZ, Inc.; Director and Secretary, IVZ Bahamas Private Limited; formerly, Senior Vice President, Secretary and General Counsel, Invesco Advisers, Inc. (2003-2005); Senior Vice President and General Counsel, Liberty Financial Companies, Inc. (2000-2001); General Counsel of certain investment management subsidiaries of Liberty Financial Companies, Inc. (1998-2000); Associate General Counsel, Liberty Financial Companies, Inc. (1993-1998); Associate, Ropes & Gray LLP. | 116 | None |
| * | This is the date the Non-Independent Trustee began serving the Trust. Each Trustee serves an indefinite term, until his successor is elected. |
| ** | Fund Complex includes all open-end funds and closed-end funds (including all of their portfolios) advised by the Adviser and any funds that have an investment adviser that is an affiliated person of the Adviser. At October 31, 2014, the “Fund Family” consisted of the Trust’s four portfolios and three other exchange-traded fund trusts with 112 portfolios advised by the Adviser. |
| 47 |
|
Trustees and Officers (continued)
| Name, Address and Year of Birth of Executive Officers | Position(s) Held | Length of Served* | Principal Occupation(s) During Past 5 Years | |||
Andrew Schlossberg (1974) Invesco Management Group, Inc. 11 Greenway Plaza, Suite 1000 | President | Since 2009 | President, PowerShares Exchange-Traded Fund Trust, PowerShares Exchange-Traded Fund Trust II, PowerShares India Exchange-Traded Fund Trust and PowerShares Actively Managed Exchange-Traded Fund Trust (2009-Present); Director, Invesco Distributors, Inc. (2012-Present); Managing Director—U.S. Strategy and Marketing, Invesco PowerShares Capital Management LLC (2010-Present); Managing Director, U.S. head of business strategy and chief marketing officer for Invesco Ltd. in the United States (2008-Present); and Senior Vice President, Invesco Advisers, Inc. (formerly known as Invesco Institutional (N.A.), Inc.) (registered investment adviser) (2009-Present); formerly, Mr. Schlossberg served in multiple roles within Invesco, including head of corporate development, as well as global leadership roles in strategy and product development in the company’s North American Institutional and Retirement divisions (2002-2007). | |||
Peter Hubbard (1981) Invesco PowerShares Capital Management LLC Downers Grove, IL 60515 | Vice President | Since 2009 | Vice President, PowerShares Exchange-Traded Fund Trust, PowerShares Exchange-Traded Fund Trust II, PowerShares India Exchange-Traded Fund Trust and PowerShares Actively Managed Exchange-Traded Fund Trust (2009-Present); Vice President and Director of Portfolio Management-Invesco PowerShares Capital Management LLC (2008-Present); formerly, Portfolio Manager, Invesco PowerShares Capital Management LLC (2007-2008); Research Analyst, Invesco PowerShares Capital Management LLC (2005-2007); Research Analyst and Trader, Ritchie Capital, a hedge fund operator (2003-2005). | |||
David Warren (1957) Invesco Canada Ltd. 5140 Yonge Street, Suite 800 | Vice President | Since 2009 | Vice President, PowerShares Exchange-Traded Fund Trust, PowerShares Exchange-Traded Fund Trust II, PowerShares India Exchange-Traded Fund Trust and PowerShares Actively Managed Exchange-Traded Fund Trust (2009-Present); Managing Director—Chief Administrative Officer, Americas, Invesco PowerShares Capital Management LLC; Senior Vice President, Invesco Advisers, Inc. (2009-Present); Director, Executive Vice President and Chief Financial Officer, Invesco Inc. (2009-Present); Senior Vice President, Invesco Management Group, Inc. (2007-Present); Director, Executive Vice President and Chief Financial Officer, Invesco Canada Ltd. (formerly, Invesco Trimark Ltd.) and Chief Administrative Officer, North American Retail, Invesco Ltd. (2007-Present); Senior Vice President, Invesco Management Group, Inc. (2007-Present); Director, Invesco Canada Holdings Inc. (2002–Present), Invesco Corporate Class Inc., and Invesco Canada Fund Inc.; Director, Executive Vice President and Chief Financial Officer, Invesco, Inc.; formerly, Director, Executive Vice President and Chief Financial Officer, Invesco Canada Ltd. (formerly, Invesco Trimark Ltd.) (2000-2006). | |||
Sheri Morris (1964) Invesco Management Group, Inc. 11 Greenway Plaza, Suite 1000 Houston, TX 77046 | Vice President | Since 2012 | Vice President, Treasurer and Principal Financial Officer, The Invesco Funds; Vice President, Invesco Advisers, Inc. (formerly known as Invesco Institutional (N.A.), Inc.) (registered investment adviser) (2009-Present) and Vice President, PowerShares Exchange-Traded Fund Trust, PowerShares Exchange-Traded Fund Trust II, PowerShares India Exchange-Traded Fund Trust and PowerShares Actively Managed Exchange-Traded Fund Trust; formerly, Treasurer, PowerShares Exchange-Traded Fund Trust, PowerShares Exchange-Traded Fund Trust II, PowerShares India Exchange-Traded Fund Trust and PowerShares Actively Managed Exchange-Traded Fund Trust; Vice President, Invesco Aim Advisers, Inc., Invesco Aim Capital Management, Inc. and Invesco Aim Private Asset Management, Inc.; Assistant Vice President and Assistant Treasurer, The Invesco Funds and Assistant Vice President, Invesco Advisers, Inc., Invesco Aim Capital Management, Inc. and Invesco Aim Private Asset Management, Inc. | |||
| * | This is the date the officers began serving the Trust. Each officer serves an indefinite term, until his or her successor is elected. |
| 48 |
|
Trustees and Officers (continued)
| Name, Address and Year of Birth of Executive Officers | Position(s) Held | Length of Served* | Principal Occupation(s) During Past 5 Years | |||
Rudolf E. Reitmann (1971) Invesco PowerShares Capital Management LLC 3500 Lacey Road, Suite 700 | Vice President | Since 2013 | Vice President, PowerShares Exchange-Traded Fund Trust, PowerShares Exchange-Traded Fund Trust II, PowerShares India Exchange-Traded Fund Trust and PowerShares Actively Managed Exchange-Traded Fund Trust (since 2013); Head of Global Exchange Traded Funds Operations, Invesco PowerShares Capital Management LLC (since 2013). | |||
Daniel E. Draper (1968) Invesco PowerShares Capital Management LLC 3500 Lacey Road, Suite 700 | Vice President | Since 2013 | Senior Vice President, Invesco Distributors, Inc. (since 2014); Vice President, PowerShares Exchange-Traded Fund Trust, PowerShares Exchange-Traded Fund Trust II, PowerShares India Exchange-Traded Fund Trust and PowerShares Actively Managed Exchange-Traded Fund Trust (since 2013); Managing Director, Invesco PowerShares Global ETFs (since 2013); formerly, Managing Director, Credit Suisse Asset Management (2010-2013) and Lyxor Asset Management/Societe Generale (2007-2010). | |||
Steven M. Hill (1964) Invesco PowerShares Capital Management LLC 3500 Lacey Road, Suite 700 | Vice President and Treasurer | Since 2013 | Vice President and Treasurer of PowerShares Exchange-Traded Fund Trust, PowerShares Exchange-Traded Fund Trust II, PowerShares India Exchange-Traded Fund Trust and PowerShares Actively Managed Exchange-Traded Fund Trust (since 2013); Head of Global ETF Administration, Invesco PowerShares Capital Management LLC (since 2011); formerly, Senior Managing Director and Chief Financial Officer, Destra Capital Management LLC and its subsidiaries (2010-2011); Chief Financial Officer, Destra Investment Trust and Destra Investment Trust II (2010-2011); Senior Managing Director, Claymore Securities, Inc. (2003-2010); and Chief Financial Officer, Claymore sponsored mutual funds (2003-2010). | |||
Christopher Joe (1969) Invesco Management Group, Inc. 11 Greenway Plaza, Suite 1000 Houston, TX 77046 | Chief Compliance Officer | Since 2012 | Deputy Chief Compliance Officer of Invesco Advisers, Inc. (since 2014); Chief Compliance Officer of PowerShares Exchange-Traded Fund Trust, PowerShares Exchange-Traded Fund Trust II, PowerShares India Exchange-Traded Fund Trust and PowerShares Actively Managed Exchange-Traded Fund Trust (since 2012); U.S. Compliance Director, Invesco, Ltd. (since 2006); formerly, Chief Compliance Officer, Invesco Investment Advisers, LLC (registered investment adviser) (2010-2013); formerly, Assistant Fund Accounting Manager, Invesco, Ltd. (1998-1999). | |||
Anna Paglia (1974) Invesco PowerShares Capital Management LLC 3500 Lacey Road, Suite 700 | Secretary | Since 2011 | Secretary, PowerShares Exchange-Traded Fund Trust, PowerShares Exchange-Traded Fund Trust II, PowerShares India Exchange-Traded Fund Trust and PowerShares Actively Managed Exchange-Traded Fund Trust (2011-present); Head of Legal, Invesco PowerShares Capital Management LLC (2010-Present); formerly, Partner, K&L Gates LLP (formerly, Bell Boyd & Lloyd LLP) (2007-2010); Associate Counsel at Barclays Global Investors Ltd. (2004-2006). | |||
Availability of Additional Information About the Trustees
The Statement of Additional Information includes additional information about the Trustees and is available, without charge, upon request at (800) 983-0903.
| * | This is the date the officers began serving the Trust. Each officer serves an indefinite term, until his or her successor is elected. |
| 49 |
|
Board Considerations Regarding Approval of Investment Advisory Agreement and Sub-Advisory Agreement for PowerShares Multi-Strategy Alternative Portfolio
At a meeting held on April 17, 2014, the Board of Trustees of the PowerShares Actively Managed Exchange-Traded Fund Trust (the “Trust”), including the Independent Trustees, approved the Investment Advisory Agreement between Invesco PowerShares Capital Management LLC (the “Adviser”) and the Trust for PowerShares Multi-Strategy Alternative Portfolio (the “Fund”), and the Investment Sub-Advisory Agreement between the Adviser and the following eight affiliated sub-advisers (the “Sub-Advisory Agreement”): Invesco Advisers, Inc.; Invesco Asset Management Deutschland, GmbH; Invesco Asset Management Limited; Invesco Asset Management (Japan) Limited; Invesco Australia Limited; Invesco Hong Kong Limited; Invesco Senior Secured Management, Inc.; and Invesco Canada Ltd. (each, a “Sub-Adviser” and collectively, the “Sub-Advisers”).
The Trustees reviewed information from the Adviser describing: (i) the nature, extent and quality of services to be provided, (ii) the costs of services to be provided and estimated profits to be realized by the Adviser, (iii) the extent to which economies of scale may be realized as the Fund grows, (iv) whether the fee levels reflect any possible economies of scale for the benefit of Fund shareholders, (v) comparisons of services rendered and amounts paid to other registered investment companies and (vi) any benefits to be realized by the Adviser from its relationship with the Fund. Based on all of the information considered and the conclusions reached, the Board, including the Independent Trustees, determined to approve the Investment Advisory Agreement for the Fund. No single factor was determinative in the Board’s analysis.
Nature, Extent and Quality of Services. In evaluating the nature, extent and quality of the Adviser’s services, the Trustees reviewed information concerning the functions to be performed by the Adviser for the Fund, information describing the Adviser’s current organization and staffing, including operations assistance provided by the Adviser’s parent organization, Invesco Ltd., and the background and experience of the persons who will be responsible for the day-to-day management of the Fund, and considered the quality of services provided by the Adviser to other exchange-traded funds (“ETFs”). The Trustees also reviewed information related to the Adviser’s portfolio transaction policies and procedures.
The Trustees also considered the services to be provided by the Adviser in its oversight of the Fund’s administrator, custodian and transfer agent. They noted the significant amount of time and effort that had been devoted to this oversight function for the other ETFs and that was expected to be provided for the Fund.
Based on their review, the Trustees concluded that the nature, extent and quality of services to be provided by the Adviser to the Fund under the Investment Advisory Agreement were expected to be appropriate and reasonable.
Fees, Expenses and Profitability. The Trustees reviewed and discussed the information provided by the Adviser on the Fund’s proposed advisory fee, as compared to information compiled from Lipper Inc. databases on the average and median net expense ratios of comparable ETF peers, as well as the average and median net expense ratios of the Fund’s Lipper peer group, which includes ETFs and non-ETF funds. The Trustees also noted the information compiled by the Adviser from Lipper Inc. databases on the advisory fees and net expense ratios of various types of ETFs and open-end actively managed funds that they had received in connection with the 2014 contract renewal process for other ETFs for which the Adviser serves as investment adviser. The Trustees noted that the annual advisory fee to be charged to the Fund was a unitary fee, and that the Adviser has agreed to pay all other expenses of the Fund except brokerage commissions and other trading expenses, taxes, interest and extraordinary expenses. The Trustees noted that the Fund’s unitary advisory fee generally was lower than or within an acceptable range of the average and median net expense ratios of the ETFs in its ETF universe and of the Fund’s Lipper peer group. The Trustees considered the Fund’s proposed advisory fee in light of the higher administrative, operational and management oversight costs. The Trustees also noted that the Fund’s licensing fee was payable out of the unitary fee to be charged to the Fund. The Board concluded that the unitary advisory fee to be charged to the Fund is reasonable and appropriate in light of the services expected to be provided.
In conjunction with their review of the unitary advisory fee, the Trustees also considered information provided by the Adviser on the costs of services for the Fund and the fees to be paid by the Adviser. The Trustees considered information provided by the Adviser on its profitability, as well as any profits or losses realized by the Adviser from its relationship with other ETFs for which it serves as investment adviser. The Trustees concluded that the estimated profits to be realized by the Adviser with respect to the Fund appeared to be reasonable in comparison with the cost of providing investment advisory services to the Fund.
Economies of Scale and Whether Fee Levels Reflect These Economies of Scale. The Trustees reviewed the information provided by the Adviser as to the extent to which economies of scale may be realized as the Fund grows and whether fee levels reflect economies of scale for the benefit of shareholders. The Trustees noted that any reduction in fixed costs associated with the management of the Fund would be enjoyed by the Adviser, but that a unitary fee provides a level of certainty in expenses for the Fund. The Trustees considered whether the advisory fee rate for the Fund is reasonable in relation to the projected asset size of the Fund, and concluded that the flat advisory fee was reasonable and appropriate.
| 50 |
|
Board Considerations Regarding Approval of Investment Advisory Agreement and Sub-Advisory Agreement for PowerShares Multi-Strategy Alternative Portfolio (continued)
The Trustees noted that the Adviser had not identified any further benefits that it would derive from its relationships with the Fund, and had noted that it does not have any soft-dollar arrangements.
Based on all of the information considered and the conclusions reached, the Board, including the Independent Trustees, determined to approve the Investment Advisory Agreement for the Fund. No single factor was determinative in the Board’s analysis.
Investment Sub-Advisory Agreement
As noted above, the Board of Trustees of the Trust, including the Independent Trustees, approved the Sub-Advisory Agreement for the Fund at a meeting held on April 17, 2014. The review process followed by the Board is described in detail above. In connection with the review of the Sub-Advisory Agreement, the Board considered the factors described below, among others.
Nature, Extent and Quality of Services. The Trustees considered the nature, extent and quality of services to be provided under the Sub-Advisory Agreement. The Board also considered the benefits described by the Adviser in having multiple affiliated Sub-Advisers. The Board reviewed the qualifications and background of each Sub-Adviser, the investment approach of the Sub-Adviser whose investment personnel are to manage the Fund’s assets, the experience and skills of the investment personnel responsible for the day-to-day management of the Fund, and the resources made available to such personnel.
Based on their review, the Trustees concluded that the nature, extent and quality of services to be provided by the Sub-Advisers to the Fund under the Sub-Advisory Agreement were expected to be appropriate and reasonable.
Fees, Expenses and Profitability. The Trustees reviewed and discussed the information provided by the Adviser and the Sub-Advisers on the sub-advisory fee rate under the Sub-Advisory Agreement. The Trustees noted that the sub-advisory fee charged by the Sub-Advisers under the Sub-Advisory Agreement is consistent with the compensation structure used throughout Invesco when Invesco’s affiliates provide sub-advisory services for funds managed by other Invesco affiliates. The Board considered how the sub-advisory fees relate to the overall advisory fee for the Fund and noted that the Adviser compensates the Sub-Advisers from its fee.
The Trustees concluded that the estimated profits to be realized by the Sub-Adviser for the sub-advisory services provided to the Fund appeared to be reasonable.
Economies of Scale and Whether Fee Levels Reflect These Economies of Scale. As part of their review of the Investment Advisory Agreement for the Fund, the Trustees considered the extent to which economies of scale may be realized as the Fund grows and whether fee levels reflect economies of scale for the benefit of shareholders. The Trustees considered whether the sub-advisory fee rate for the Fund was reasonable in relation to the projected asset size of the Fund, and concluded that the flat sub-advisory fee was reasonable and appropriate.
The Trustees noted that the Sub-Advisers had not identified any further benefits that they would derive from their relationships with the Fund.
Based on all of the information considered and the conclusions reached, the Board, including the Independent Trustees, determined to approve the Sub-Advisory Agreement for the Fund. No single factor was determinative in the Board’s analysis.
| 51 |
|
(This Page Intentionally Left Blank)
(This Page Intentionally Left Blank)
(This Page Intentionally Left Blank)
Proxy Voting Policies and Procedures
A description of the Trust’s proxy voting policies and procedures that the Funds use to determine how to vote proxies relating to portfolio securities is available, without charge and upon request, by calling (800) 983-0903. This information is also available on the Securities and Exchange Commission’s (the “Commission”) website at www.sec.gov.
Information regarding how each Fund voted proxies for portfolio securities, if applicable, during the most recent 12-month period ended June 30, is available, without charge and upon request, by (i) calling (800) 983-0903; or (ii) accessing the Trust’s Form N-PX on the Commission’s website at www.sec.gov.
Quarterly Portfolios
The Fund files its complete schedule of portfolio holdings with the Commission for the first and third quarters of each fiscal year on Form N-Q. The Form N-Qs will be available on the Commission’s website at www.sec.gov. The Trust’s Form N-Qs may also be reviewed and copied at the Commission’s Public Reference Room in Washington, D.C. Information on the operation of the Public Reference Room may be obtained by calling (800) SEC-0330.
Frequency Distribution of Discounts and Premiums
A table showing the number of days the market price of each Fund’s shares was greater than the Fund’s net asset value, and the number of days it was less than the Fund’s net asset value (i.e., premium or discount) for the most recently completed calendar year, and the calendar quarters since that year end (or the life of the Fund, if shorter) may be found at the Fund’s website: www.invescopowershares.com.

| ©2014 Invesco PowerShares Capital Management LLC | P-PS-AR-10 | |||||
| 3500 Lacey Road, Suite 700 Downers Grove, IL 60515 | ||||||
| invescopowershares.com 800.983.0903 | @PowerShares | |||||
Item 2. Code of Ethics.
The Registrant has adopted a Code of Ethics that applies to the Registrant’s principal executive officer and principal financial officer. This Code is filed as an exhibit to this report on Form N-CSR under Item 12(a)(1). No substantive amendments to this Code were made during the reporting period. There were no waivers for the fiscal year ended October 31, 2014.
Item 3. Audit Committee Financial Expert.
The Registrant’s Board of Trustees (the “Board”) has determined that the Registrant has three “audit committee financial experts” serving on its audit committee: Mr. Marc M. Kole, Mr. Gary R. Wicker, and Mr. Donald H. Wilson. Each of these audit committee members is “independent,” meaning that he is not an “interested person” of the Registrant (as that term is defined in Section 2(a)(19) of the Investment Company Act of 1940, as amended) and he does not accept any consulting, advisory, or other compensatory fee from the Registrant (except in his capacity as a Board or committee member).
An “audit committee financial expert” is not an “expert” for any purpose, including for purposes of Section 11 of the Securities Act of 1933, as a result of being designated as an “audit committee financial expert.” Further, the designation of a person as an “audit committee financial expert” does not mean that person has any greater duties, obligations, or liability than those imposed on a person without the “audit committee financial expert” designation. Similarly, the designation of a person as an “audit committee financial expert” does not affect the duties, obligations, or liability of any other member of the audit committee or Board of trustees.
Item 4. Principal Accountant Fees and Services.
(a) to (d)
PricewaterhouseCoopers LLP (“PwC”) billed the Registrant aggregate fees for services rendered to the Registrant for the last two fiscal years as follows:
| Fees Billed by PwC for Services Rendered to the Registrant for fiscal year end 2014 | (e)(2) Percentage of Services Approved for fiscal year end 2014 Pursuant to Waiver of Pre- Approval Requirement(1) | Fees Billed by PwC for Services Rendered to the Registrant for fiscal year end 2013 | (e)(2) Percentage of Services Approved for fiscal year end 2013 Pursuant to Waiver of Pre- Approval Requirement(1) | |||||
Audit Fees | $ 54,368 | N/A | $ 37,030 | N/A | ||||
Audit-Related Fees | $ 0 | 0% | $ 0 | 0% | ||||
Tax Fees(2) | $ 43,842 | 0% | $ 27,150 | 0% | ||||
All Other Fees | $ 0 | 0% | $ 0 | 0% | ||||
Total Fees | $ 98,210 | 0% | $ 64,180 | 0% |
(1) For the provision of non-audit services, the pre-approval requirement is waived pursuant to a de minimis exception if (i) such services were not recognized as non-audit services by the Registrant at the time of engagement,
(ii) the aggregate amount of all such services provided is no more than 5% of the aggregate audit and non-audit fees paid by the Registrant during the fiscal year in which the services are provided; and (iii) such services are promptly
brought to the attention of the Registrant’s Audit Committee and approved by the Registrant’s Audit Committee prior to the completion of the audit.
(2) Tax fees for the fiscal year ended October 31, 2014 include fees billed for reviewing tax returns, 2014 excise tax returns and excise tax distributions calculations, and international tax research in addition to preparing the final tax returns for the two liquidated portfolios of the Registrant. Tax fees for the fiscal year ended October 31, 2013 included fees billed for reviewing tax returns, 2013 excise tax returns and excise tax distribution calculations.
(e) (1) Audit Committee Pre Approval Policies and Procedures
PRE-APPROVAL OF AUDIT AND NON-AUDIT SERVICES
POLICIES AND PROCEDURES
As Adopted by the Audit Committee of
the PowerShares Funds (the “Funds”)
June 26, 2009
Statement of Principles
Under the Sarbanes-Oxley Act of 2002 and rules adopted by the Securities and Exchange Commission (“SEC”) (“Rules”), the Audit Committee of the Funds’ (the “Audit Committee”) Board of Trustees (the “Board”) is responsible for the appointment, compensation and oversight of the work of independent accountants (an “Auditor”). As part of this responsibility and to assure that the Auditor’s independence is not impaired, the Audit Committee pre-approves the audit and non-audit services provided to the Funds by each Auditor, as well as all non-audit services provided by the Auditor to the Funds’ investment adviser and to affiliates of the adviser that provide ongoing services to the Funds (“Service Affiliates”) if the services directly impact the Funds’ operations or financial reporting. The SEC Rules also specify the types of services that an Auditor may not provide to its audit client. The following policies and procedures comply with the requirements for pre-approval and provide a mechanism by which management of the Funds may request and secure pre-approval of audit and non-audit services in an orderly manner with minimal disruption to normal business operations.
Proposed services either may be pre-approved without consideration of specific case-by-case services by the Audit Committee (“general pre-approval”) or require the specific pre-approval of the Audit Committee (“specific pre-approval”). As set forth in these policies and procedures, unless a type of service has received general pre-approval, it will require specific pre-approval by the Audit Committee. Additionally, any fees exceeding 110% of estimated pre-approved fee levels provided at the time the service was pre-approved will also require specific approval by the Audit Committee before payment is made. The Audit Committee will also consider the impact of additional fees on the Auditor’s independence when determining whether to approve any additional fees for previously pre-approved services.
The Audit Committee will annually review and generally pre-approve the services that may be provided by each Auditor without obtaining specific pre-approval from the Audit Committee. The term of any general pre-approval runs from the date of such pre-approval through June 30th of the following year, unless the Audit Committee considers a different period and states otherwise. The Audit Committee will add to or subtract from the list of general pre-approved services from time to time, based on subsequent determinations.
The purpose of these policies and procedures is to set forth the guidelines to assist the Audit Committee in fulfilling its responsibilities.
Delegation
The Chairman of the Audit Committee (or, in his or her absence, any member of the Audit Committee) may grant specific pre-approval for non-prohibited services for engagements of less than $20,000. All such delegated pre-approvals shall be presented to the Audit Committee no later than the next Audit Committee meeting.
Audit Services
The annual Audit services engagement terms will be subject to specific pre-approval of the Audit Committee. Audit services include the annual financial statement audit and other procedures such as tax provision work that is required to be performed by the independent auditor to be able to form an opinion on the Funds’ financial statements. The Audit
Committee will obtain, review and consider sufficient information concerning the proposed Auditor to make a reasonable evaluation of the Auditor’s qualifications and independence.
In addition to the annual Audit services engagement, the Audit Committee may grant either general or specific pre-approval of other Audit services, which are those services that only the independent auditor reasonably can provide. Other Audit services may include services such as issuing consents for the inclusion of audited financial statements with SEC registration statements, periodic reports and other documents filed with the SEC or other documents issued in connection with securities offerings.
Non-Audit Services
The Audit Committee may provide either general or specific pre-approval of any non-audit services to the Funds and its Service Affiliates if the Audit Committee believes that the provision of the service will not impair the independence of the Auditor, is consistent with the SEC’s Rules on auditor independence, and otherwise conforms to the Audit Committee’s general principles and policies as set forth herein.
Audit-Related Services
“Audit-related services” are assurance and related services that are reasonably related to the performance of the audit or review of the Funds’ financial statements or that are traditionally performed by the independent auditor. Audit-related services include, among others, accounting consultations related to accounting, financial reporting or disclosure matters not classified as “Audit services”; and assistance with understanding and implementing new accounting and financial reporting guidance from rulemaking authorities.
Tax Services
“Tax services” include, but are not limited to, the review and signing of the Funds’ federal tax returns, the review of required distributions by the Funds and consultations regarding tax matters such as the tax treatment of new investments or the impact of new regulations. The Audit Committee will scrutinize carefully the retention of the Auditor in connection with a transaction initially recommended by the Auditor, the major business purpose of which may be tax avoidance or the tax treatment of which may not be supported in the Internal Revenue Code and related regulations. The Audit Committee will consult with the Funds’ Treasurer (or his or her designee) and may consult with outside counsel or advisors as necessary to ensure the consistency of Tax services rendered by the Auditor with the foregoing policy.
No Auditor shall represent any Fund or any Service Affiliate before a tax court, district court or federal court of claims.
Under rules adopted by the Public Company Accounting Oversight Board and approved by the SEC, in connection with seeking Audit Committee pre-approval of permissible Tax services, the Auditor shall:
| 1. | Describe in writing to the Audit Committee, which writing may be in the form of the proposed engagement letter: |
| a. | The scope of the service, the fee structure for the engagement, and any side letter or amendment to the engagement letter, or any other agreement between the Auditor and the Fund, relating to the service; and |
| b. | Any compensation arrangement or other agreement, such as a referral agreement, a referral fee or fee-sharing arrangement, between the Auditor and any person (other than the Fund) with respect to the promoting, marketing, or recommending of a transaction covered by the service; |
| 2. | Discuss with the Audit Committee the potential effects of the services on the independence of the Auditor; and |
| 3. | Document the substance of its discussion with the Audit Committee. |
All Other Auditor Services
The Audit Committee may pre-approve non-audit services classified as “All other services” that are not categorically prohibited by the SEC, as listed in Exhibit 1 to this policy.
Pre-Approval Fee Levels or Established Amounts
Pre-approval of estimated fees or established amounts for services to be provided by the Auditor under general or specific pre-approval policies will be set periodically by the Audit Committee. Any proposed fees exceeding 110% of the maximum estimated pre-approved fees or established amounts for pre-approved audit and non-audit services will be reported to the Audit Committee at the quarterly Audit Committee meeting and will require specific approval by the Audit Committee before payment is made. The Audit Committee will always factor in the overall relationship of fees for audit and non-audit services in determining whether to pre-approve any such services and in determining whether to approve any additional fees exceeding 110% of the maximum pre-approved fees or established amounts for previously pre-approved services.
Procedures
On an annual basis, the Auditor will submit to the Audit Committee for general pre-approval, a list of non-audit services that the Funds or Service Affiliates of the Funds may request from the Auditor. The list will describe the non-audit services in reasonable detail and will include an estimated range of fees and such other information as the Audit Committee may request.
Each request for services to be provided by the Auditor under the general pre-approval of the Audit Committee will be submitted to the Funds’ Treasurer (or his or her designee) and must include a detailed description of the services to be rendered. The Treasurer or his or her designee will ensure that such services are included within the list of services that have received the general pre-approval of the Audit Committee. The Audit Committee will be informed at the next quarterly scheduled Audit Committee meeting of any such services for which the Auditor rendered an invoice and whether such services and fees had been pre-approved and if so, by what means.
Each request to provide services that require specific approval by the Audit Committee shall be submitted to the Audit Committee jointly by the Funds’ Treasurer or his or her designee and the Auditor, and must include a joint statement that, in their view, such request is consistent with the pre-approval policies and procedures and the SEC Rules.
Each request to provide Tax services under either the general or specific pre-approval of the Audit Committee will describe in writing: (i) the scope of the service, the fee structure for the engagement, and any side letter or amendment to the engagement letter, or any other agreement between the Auditor and the audit client, relating to the service; and (ii) any compensation arrangement or other agreement between the Auditor and any person (other than the audit client) with respect to the promoting, marketing, or recommending of a transaction covered by the service. The Auditor will discuss with the Audit Committee the potential effects of the services on the Auditor’s independence and will document the substance of the discussion.
Non-audit services pursuant to the de minimis exception provided by the SEC Rules will be promptly brought to the attention of the Audit Committee for approval, including documentation that each of the conditions for this exception, as set forth in the SEC Rules, has been satisfied.
On at least an annual basis, the Auditor will prepare a summary of all the services provided to any entity in the investment company complex as defined in section 2-01(f)(14) of Regulation S-X in sufficient detail as to the nature of the engagement and the fees associated with those services.
The Audit Committee has designated the Funds’ Treasurer to monitor the performance of all services provided by the Auditor and to ensure such services are in compliance with these policies and procedures. The Funds’ Treasurer will report to the Audit Committee on a periodic basis as to the results of such monitoring. Both the Funds’ Treasurer and management will immediately report to the Chairman of the Audit Committee any breach of these policies and procedures that comes to the attention of the Funds’ Treasurer or senior management.
Exhibit 1 to Pre-Approval of Audit and Non-Audit Services Policies and Procedures
Conditionally Prohibited Non-Audit Services (not prohibited if the Fund can reasonably conclude that the results of the service would not be subject to audit procedures in connection with the audit of the Fund’s financial statements)
| — | Bookkeeping or other services related to the accounting records or financial statements of the audit client |
| — | Financial information systems design and implementation |
| — | Appraisal or valuation services, fairness opinions, or contribution-in-kind reports |
| — | Actuarial services |
| — | Internal audit outsourcing services |
Categorically Prohibited Non-Audit Services
| — | Management functions |
| — | Human resources |
| — | Broker-dealer, investment adviser, or investment banking services |
| — | Legal services |
| — | Expert services unrelated to the audit |
| — | Any service or product provided for a contingent fee or a commission |
| — | Services related to marketing, planning, or opining in favor of the tax treatment of confidential transactions or aggressive tax position transactions, a significant purpose of which is tax avoidance |
| — | Tax services for persons in financial reporting oversight roles at the Fund |
| — | Any other service that the Public Company Oversight Board determines by regulation is impermissible. |
| (f) | Not applicable. |
| (g) | PwC billed the Registrant aggregate fees of $ 43,842 for the fiscal year ended October 31, 2014 and $27,150 for the fiscal year ended October 31, 2013 for non-audit services rendered to the Registrant. |
PwC did not bill any fees for non-audit services rendered to the Registrant’s investment adviser (not including any Sub-adviser whose role is primarily portfolio management and is subcontracted with or overseen by another investment adviser) or any entity controlling, controlled by or under common control with the Registrant’s investment adviser that provides ongoing services to the Registrant for the fiscal years ended October 31, 2014 and October 31, 2013.
| (h) | Not applicable. |
Item 5. Audit Committee of Listed Registrants.
| (a) | The Registrant has a separately designated Audit Committee established in accordance with Section 3(a)(58)(A) of the Securities Exchange Act of 1934, as amended, which consists solely of independent trustees. The Audit Committee members are, Marc M. Kole, Gary R. Wicker, and Donald H. Wilson. |
| (b) | Not applicable |
Item 6. Schedule of Investments.
| (a) | The Schedules of Investments are included as a part of the report to shareholders filed under Item 1 of this Form N-CSR. |
| (b) | Not applicable |
Item 7. Disclosure of Proxy Voting Policies and Procedures for Closed-End Management Investment Companies.
Not applicable.
Item 8. Portfolio Managers of Closed-End Management Investment Companies.
Not applicable.
Item 9. Purchases of Equity Securities by Closed-End Management Investment Company and Affiliated Purchasers.
Not applicable.
Item 10. Submission of Matters to a Vote of Security Holders.
There have been no material changes to the procedures by which shareholders may recommend nominees to the Registrant’s Board of Trustees that would require disclosure herein.
Item 11. Controls and Procedures.
| (a) | Based on their evaluation of the Registrant’s disclosure controls and procedures (as defined in Rule 30a-3(c) under the Investment Company Act of 1940) as of a date within 90 days of the filing date of this report, the Registrant’s President (principal executive officer) and Treasurer (principal financial officer) have concluded that such disclosure controls and procedures are effective. |
| (b) | There were no changes in the Registrant’s internal control over financial reporting (as defined in Rule 30a-3(d) under the Investment Company Act of 1940) that occurred during the second fiscal quarter of the period covered by this report that have materially affected, or are reasonably likely to materially affect, the Registrant’s internal control over financial reporting. |
Item 12. Exhibits.
| (a)(1) | Code of Ethics is attached as Exhibit 99.CODEETH. | |
| (a)(2) | Certifications of the Registrant’s President and Treasurer pursuant to Section 302 of the Sarbanes-Oxley Act of 2002 are attached as Exhibit 99.CERT. | |
| (a)(3) | Not applicable. | |
| (b) | Certifications of the Registrant’s President and Treasurer pursuant to Section 906 of the Sarbanes-Oxley Act of 2002 are attached as Exhibit 99.906CERT. | |
SIGNATURES
Pursuant to the requirements of the Securities Exchange Act of 1934 and the Investment Company Act of 1940, the Registrant has duly caused this report to be signed on its behalf by the undersigned, thereunto duly authorized.
(Registrant) PowerShares Actively Managed Exchange-Traded Fund Trust
| By: /s/ Andrew Schlossberg |
| Name: Andrew Schlossberg |
| Title: President |
| Date: January 5, 2015 |
Pursuant to the requirements of the Securities Exchange Act of 1934 and the Investment Company Act of 1940, this report has been signed below by the following persons on behalf of the Registrant and in the capacities and on the dates indicated.
By: /s/ Andrew Schlossberg |
Name: Andrew Schlossberg |
Title: President |
Date: January 5, 2015 |
By: /s/ Steven Hill |
Name: Steven Hill |
Title: Treasurer |
Date: December 31, 2014 |