Exhibit (c)-(4)
| Update Discussion Materials for the Special Committee of WSP Holdings Ltd. February 27, 2012 Preliminary and for Discussion Purposes Only w w w . H L . c o m U . S . 8 0 0 . 7 8 8 . 5 3 0 0 E u r o p e + 4 4 . 2 0 . 7 8 3 9 . 3 3 5 5 H o n g K o n g + 8 5 2 . 3 5 5 1 . 2 3 0 0 J a p a n + 8 1 . 3 . 4 5 7 7 . 6 0 0 0 Los Angeles • New York • Chicago • San Francisco • Minneapolis • Washington, D.C. • Dallas • Atlanta • London • Paris • Frankfurt • Hong Kong • Tokyo • Beijing |
| Table of Contents Update Discussion Materials for the Special Committee of WSP Holdings Ltd. Page Meeting Agenda 2 HDS Proposal Overview 4 p Preliminary Financial Considerations 9 Appendix 15 Privileged and Confidential - Preliminary and for Discussion Purposes Only 1 |
| Meeting Agenda Privileged and Confidential - Preliminary and for Discussion Purposes Only |
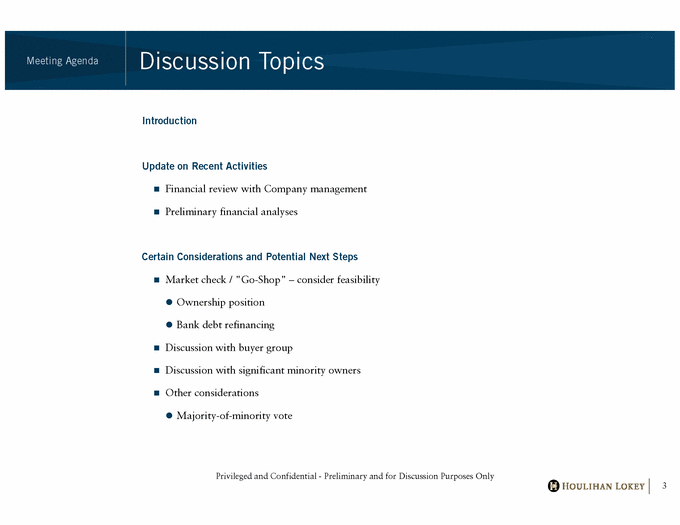
| Discussion Topics Meeting Agenda Introduction Update on Recent Activities Financial review with Company management Preliminary financial analyses Certain Considerations and Potential Next Steps Market check / "Go-Shop" – consider feasibility Ownership position Bank debt refinancing Discussion with buyer group Discussion with significant minority owners Other considerations Majority-of-minority vote Privileged and Confidential - Preliminary and for Discussion Purposes Only 3 |
| HDS Proposal Overview Privileged and Confidential - Preliminary and for Discussion Purposes Only |
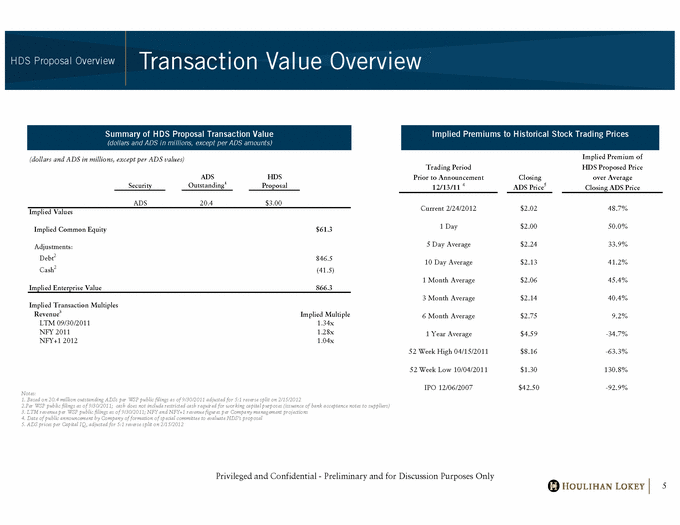
| Transaction Value Overview HDS Proposal Overview Summary of HDS Proposal Transaction Value (dollars and ADS in millions, except per ADS amounts) Implied Premiums to Historical Stock Trading Prices (dollars and ADS in millions, except per ADS values) Implied Premium of ADS HDS Security Outstanding1 Proposal ADS 20.4 $3.00 Implied Values Implied Common Equity $61. 3 Trading Period HDS Proposed Price Prior to Announcement Closing over Average 12/13/11 4 ADS Price5 Closing ADS Price Current 2/24/2012 $2.02 48.7% 1 Day $2.00 50.0% Adjustments: Debt2 846.5 Cash2 (41.5) Implied Enterprise Value 866.3 5 Day Average $2.24 33.9% 10 Day Average $2.13 41.2% 1 Month Average $2.06 45.4% Implied Transaction Multiples Revenue3 Implied Multiple LTM 09/30/2011 1.34x NFY 2011 1.28x NFY+1 2012 1.04x3 Month Average $2.14 40.4% 6 Month Average $2.75 9.2% 1 Year Average $4.59 -34.7% 52 Week High 04/15/2011 $8.16 -63.3% Notes: 1. Based on 20.4 million outstanding ADSs per WSP public filings as of 9/30/2011 adjusted for 5:1 reverse split on 2/15/2012 2.Per WSP public filings as of 9/30/2011; cash does not include restricted cash required for working capital purposes (issuance of bank acceptance notes to suppliers) 3. LTM revenue per WSP public filings as of 9/30/2011; NFY and NFY+1 revenue figures per Company management projections 4. Date of public announcement by Company of formation of special committee to evaluate HDS’s proposal 5. ADS prices per Capital IQ, adjusted for 5:1 reverse split on 2/15/2012 52 Week Low 10/04/2011 $1.30 130.8% IPO 12/06/2007 $42.50 -92.9% Privileged and Confidential - Preliminary and for Discussion Purposes Only 5 |
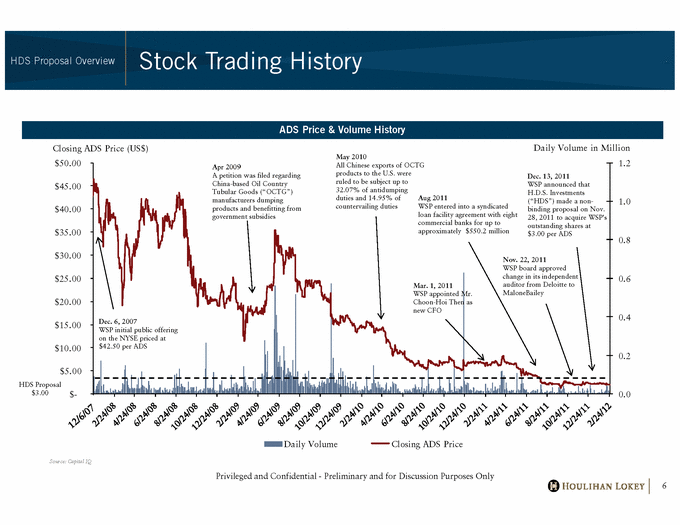
| Stock Trading History HDS Proposal Overview $50. 00 Daily Volume in Million Closing ADS Price (US$) ADS Price & Volume History May 2010 All 1.0 1.2 $35. 00 $40.00 $45.00 Apr 2009 A petition was filed regarding China-based Oil Country Tubular Goods (“OCTG”) manufacturers dumping products and benefitting from government subsidies Chinese exports of OCTG products to the U.S. were ruled to be subject up to 32.07% of antidumping duties and 14.95% of countervailing duties Aug 2011 WSP entered into a syndicated loan facility agreement with eight commercial banks for up to approximately $550. 2 million Dec. 13, 2011 WSP announced that H.D.S. Investments (“HDS”) made a nonbinding proposal on Nov. 28, 2011 to acquire WSP's outstanding shares at 0.6 0.8 $25.00 $30.00 Nov. 22, 2011 WSP board approved change in its independent auditor from Deloitte to MaloneBailey $3.00 per ADS Mar. 1, 2011 WSP appointed Mr. 0.2 0.4 $10.00 $15.00 $20.00 Dec. 6, 2007 WSP initial public offering on the NYSE priced at $42.50 per ADS Choon-Hoi Then as new CFO 0.0 $- $5.00 HDS Proposal $3.00 Privileged and Confidential - Preliminary and for Discussion Purposes Only Daily Volume Closing ADS Price 6 Source: Capital IQ |
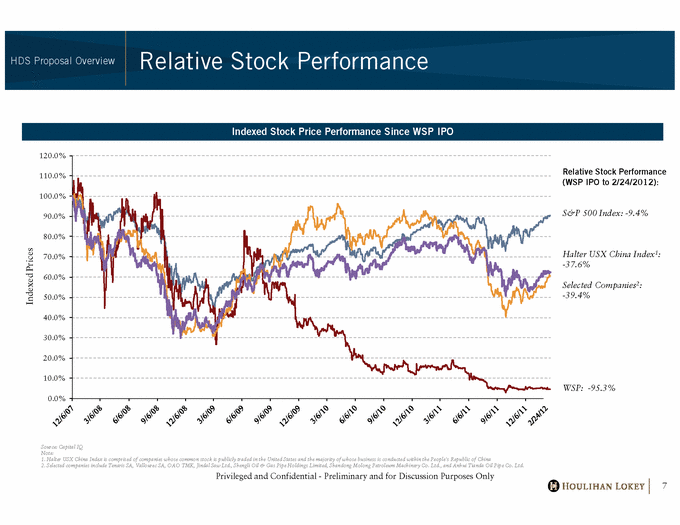
| Relative Stock Performance HDS Proposal Overview Indexed Stock Price Performance Since WSP IPO 120.0% Relative Stock Performance (WSP IPO to 2/24/2012): S&P 500 Index: -9.4% 90.0% 100.0% 110.0% Halter USX China Index1: -37.6% Selected Companies2: 60.0% 70.0% 80.0% Indexed Prices -39.4% 20.0% 30.0% 40.0% 50.0% WSP: -95.3% 0.0% 10.0% Privileged and Confidential - Preliminary and for Discussion Purposes Only 7 Source: Capital IQ Note: 1. Halter USX China Index is comprised of companies whose common stock is publicly traded in the United States and the majority of whose business is conducted within the People's Republic of China 2. Selected companies include Tenaris SA, Vallourec SA, OAO TMK, Jindal Saw Ltd., Shengli Oil & Gas Pipe Holdings Limited, Shandong Molong Petroleum Machinery Co. Ltd., and Anhui Tianda Oil Pipe Co. Ltd. |
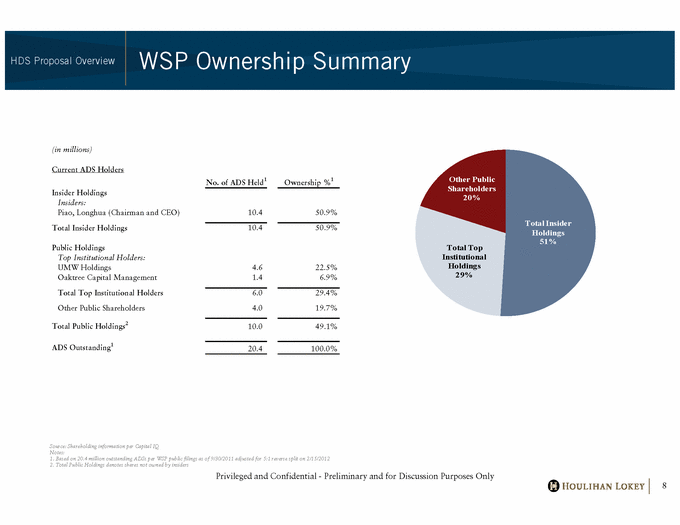
| WSP Ownership Summary HDS Proposal Overview (in millions) Total Insider Other Public Shareholders 20% Current ADS Holders No. of ADS Held1 Ownership %1 Insider Holdings Insiders: Piao, Longhua (Chairman and CEO) 10.4 50.9% Total Insider Holdings 10.4 50.9% Holdings 51% Total Top Institutional Holdings 29% Public Holdings Top Institutional Holders: UMW Holdings 4.6 22.5% Oaktree Capital Management 1.4 6.9% Total Top Institutional Holders 6.0 29.4% Other Public Shareholders 4.0 19.7% Total Public Holdings2 10.0 49.1% ADS Outstanding1 20.4 100.0% Privileged and Confidential - Preliminary and for Discussion Purposes Only 8 Source: Shareholding information per Capital IQ Notes: 1. Based on 20.4 million outstanding ADSs per WSP public filings as of 9/30/2011 adjusted for 5:1 reverse split on 2/15/2012 2. Total Public Holdings denotes shares not owned by insiders |
| Preliminary Financial Considerations Privileged and Confidential - Preliminary and for Discussion Purposes Only |
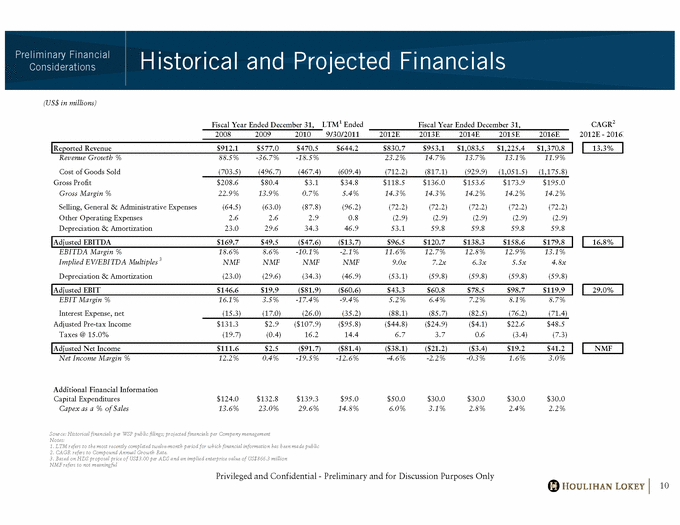
| Historical and Projected Financials Preliminary Financial Considerations (US$ in millions) Fiscal Year Ended December 31, LTM1 Ended Fiscal Year Ended December 31, CAGR2 2008 2009 2010 9/30/2011 2012E 2013E 2014E 2015E 2016E 2012E - 2016 Reported Revenue $912.1 $577.0 $470.5 $644.2 $830.7 $953.1 $1,083.5 $1,225.4 $1,370.8 13.3% Revenue Growth % 88.5% -36.7% -18.5% 23.2% 14.7% 13.7% 13.1% 11.9% Cost of Goods Sold (703.5) (496.7) (467.4) (609.4) (712.2) (817.1) (929.9) (1,051.5) (1,175.8) Gross Profit $208.6 $80.4 $3.1 $34.8 $118.5 $136.0 $153.6 $173.9 $195.0 Gross Margin % 22.9% 13.9% 0.7% 5.4% 14.3% 14.3% 14.2% 14.2% 14.2% Selling, General & Administrative Expenses (64.5) (63.0) (87.8) (96.2) (72.2) (72.2) (72.2) (72.2) (72.2) Other Operating Expenses 2.6 2.6 2.9 0.8 (2.9) (2.9) (2.9) (2.9) (2.9) Depreciation & Amortization 23.0 29.6 34.3 46.9 53.1 59.8 59.8 59.8 59.8 Adjusted EBITDA $169.7 $49.5 ($47.6) ($13.7) $96.5 $120.7 $138.3 $158.6 $179.8 16.8% EBITDA Margin % 18.6% 8.6% -10.1% -2.1% 11.6% 12.7% 12.8% 12.9% 13.1% Implied EV/EBITDA Multiples 3 NMF NMF NMF NMF 9.0x 7.2x 6.3x 5.5x 4.8x Depreciation & Amortization (23.0) (29.6) (34.3) (46.9) (53.1) (59.8) (59.8) (59.8) (59.8) Adjusted EBIT $146.6 $19.9 ($81.9) ($60.6) $43.3 $60.8 $78.5 $98.7 $119.9 29.0% EBIT Margin % 16.1% 3.5% -17.4% -9.4% 5.2% 6.4% 7.2% 8.1% 8.7% Interest Expense, net (15.3) (17.0) (26.0) (35.2) (88.1) (85.7) (82.5) (76.2) (71.4) Adjusted Pre-tax Income $131.3 $2.9 ($107.9) ($95.8) ($44.8) ($24.9) ($4.1) $22.6 $48.5 Taxes @ 15.0% (19.7) (0.4) 16.2 14.4 6.7 3.7 0.6 (3.4) (7.3) Adjusted Net Income $111.6 $2.5 ($91.7) ($81.4) ($38.1) ($21.2) ($3.4) $19.2 $41.2 NMF Net Income Margin % 12.2% 0.4% -19.5% -12.6% -4.6% -2.2% -0.3% 1.6% 3.0% Additional Financial Information Capital Expenditures $124.0 $132.8 $139.3 $95.0 $50.0 $30.0 $30.0 $30.0 $30.0 Capex as a % of Sales 13.6% 23.0% 29.6% 14.8% 6.0% 3.1% 2.8% 2.4% 2.2% Privileged and Confidential - Preliminary and for Discussion Purposes Only 10 Source: Historical financials per WSP public filings; projected financials per Company management Notes: 1. LTM refers to the most recently completed twelve-month period for which financial information has been made public 2. CAGR refers to Compound Annual Growth Rate. 3. Based on HDS proposal price of US$3.00 per ADS and an implied enterprise value of US$866.3 million NMF refers to not meaningful |
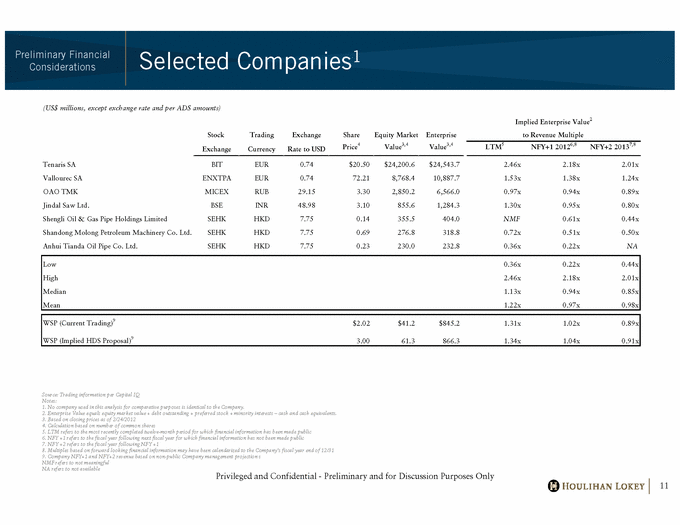
| Selected Companies1 Preliminary Financial Considerations (US$ millions, except exchange rate and per ADS amounts) Implied Enterprise Value2 Stock Trading Exchange Share Equity Market Enterprise to Revenue Multiple Exchange Currency Rate to USD Price4 Value3,4 Value3,4 LTM5 NFY+1 20126,8 NFY+2 20137,8 T i BIT EUR 0 74 $20 50 $24 200 6 $24 543 7 2 46 2 18 2 01 Tenaris SA 0.74 20.50 24,200.6 24,543.7 2.46x 2.18x 2.01x Vallourec SA ENXTPA EUR 0.74 72.21 8,768.4 10,887.7 1.53x 1.38x 1.24x OAO TMK MICEX RUB 29.15 3.30 2,850.2 6,566.0 0.97x 0.94x 0.89x Jindal Saw Ltd. BSE INR 48.98 3.10 855.6 1,284.3 1.30x 0.95x 0.80x Shengli Oil & Gas Pipe Holdings Limited SEHK HKD 7.75 0.14 355.5 404.0 NMFF 0.61x 0.44x Shandong Molong Petroleum Machinery Co. Ltd. SEHK HKD 7.75 0.69 276.8 318.8 0.72x 0.51x 0.50x Anhui Tianda Oil Pipe Co. Ltd. SEHK HKD 7.75 0.23 230.0 232.8 0.36x 0.22x NA Low 0.36x 0.22x 0.44x High 2.46x 2.18x 2.01x Median 1.13x 0.94x 0.85x Mean 1.22x 0.97x 0.98x WSP (Current Trading)9 $2.02 $41.2 $845.2 1.31x 1.02x 0.89x WSP (Implied HDS Proposal)9 3.00 61.3 866.3 1.34x 1.04x 0.91x Source: Trading information per Capital IQ Notes: 1. No company used in this analysis for comparative purposes is identical to the Company. 2. Enterprise Value equals equity market value + debt outstanding + preferred stock + minority interests – cash and cash equivalents. 3. Based on closing prices as of 2/24/2012 4. Calculation based on number of common shares Privileged and Confidential - Preliminary and for Discussion Purposes Only 11 f 5. LTM refers to the most recently completed twelve-month period for which financial information has been made public 6. NFY +1 refers to the fiscal year following next fiscal year for which financial information has not been made public 7. NFY +2 refers to the fiscal year following NFY +1 8. Multiples based on forward looking financial information may have been calendarized to the Company’s fiscal year end of 12/31 9. Company NFY+1 and NFY+2 revenue based on non-public Company management projection s NMF refers to not meaningful NA refers to not available |
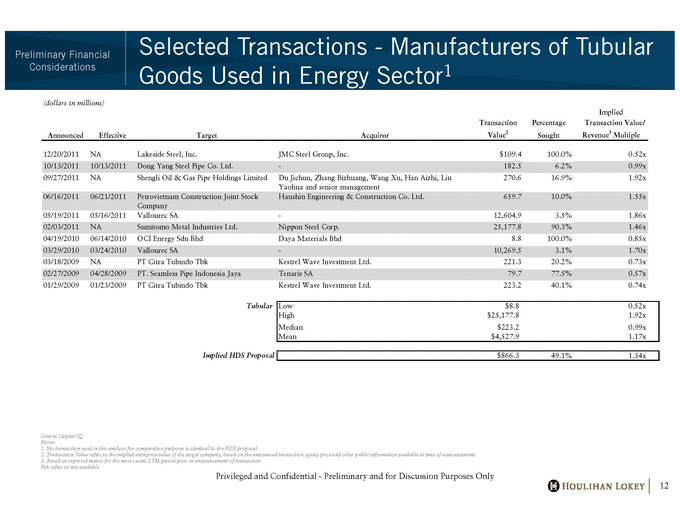
| Selected Transactions - Manufacturers of Tubular Goods Used in Energy Sector1 Preliminary Financial Considerations (dollars in millions) Implied Transaction Percentage Transaction Value/ Announced Effective Target Acquiror Value2 Sought Revenue3 Multiple 12/20/2011 NA Lakeside Steel, Inc. JMC Steel Group, Inc. $109.4 100.0% 0.52x 10/13/2011 10/13/2011 Dong Yang Steel Pipe Co. Ltd. - 182.5 6.2% 0.99x 09/27/2011 NA Shengli Oil & Gas Pipe Holdings Limited Du Jichun, Zhang Bizhuang, Wang Xu, Han Aizhi, Liu Yaohua and senior management 270.6 16.9% 1.92x 06/16/2011 06/21/2011 Petrovietnam Construction Joint Stock Company Hanshin Engineering & Construction Co. Ltd. 659.7 10.0% 1.55x 05/19/2011 05/16/2011 Vallourec SA - 12,604.9 3.5% 1.86x 02/03/ 2011 NA Sumitomo Metal Industries Ltd. Nippon Steel Corp. 25,177.8 90.3% 1.46x 04/19/2010 06/14/2010 OCI Energy Sdn Bhd Daya Materials Bhd 8.8 100.0% 0.85x 03/29/2010 03/24/2010 Vallourec SA - 10,269.5 3.1% 1.70x 03/18/2009 NA PT Citra Tubindo Tbk Kestrel Wave Investment Ltd. 221.3 20.2% 0.73x 02/27/2009 04/28/2009 PT. Seamless Pipe Indonesia Jaya Tenaris SA 79.7 77.5% 0.57x 01/29/2009 01/23/2009 PT Citra Tubindo Tbk Kestrel Wave Investment Ltd. 223.2 40.1% 0.74x Tubular Low $8.8 0.52x High $25,177.8 1.92x Median $223.2 0.99x Mean $4,527.9 1.17x Implied HDS Proposal $866.3 49.1% 1.34x Privileged and Confidential - Preliminary and for Discussion Purposes Only 12 Source: Capital IQ Notes: 1. No transaction used in this analysis for comparative purposes is identical to the HDS proposal 2. Transaction Value refers to the implied enterprise value of the target company, based on the announced transaction equity price and other public information available at time of announcement 3. Based on reported metric for the most recent LTM period prior to announcement of transaction NA refers to not available |
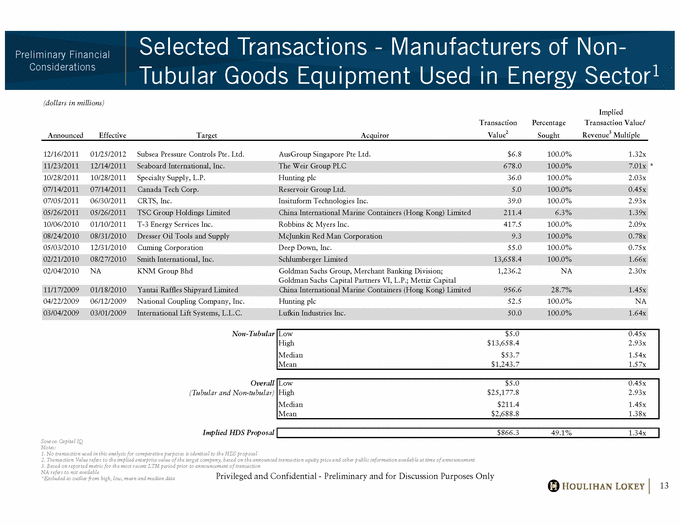
| Selected Transactions - Manufacturers of Non- Tubular Goods Equipment Used in Energy Sector1 Preliminary Financial Considerations (dollars in millions) Implied Transaction Percentage Transaction Value/ Announced Effective Target Acquiror Value2 Sought Revenue3 Multiple 12/16/2011 01/25/2012 Subsea Pressure Controls Pte. Ltd. AusGroup Singapore Pte Ltd. $6.8 100.0% 1.32x 11/23/2011 12/14/2011 Seaboard International, Inc. The Weir Group PLC 678.0 100.0% 7.01x *10/28/2011 10/28/2011 Specialty Supply, L.P. Hunting plc 36.0 100.0% 2.03x 07/14/2011 07/14/2011 Canada Tech Corp. Reservoir Group Ltd. 5.0 100.0% 0.45x # 07/05/2011 06/30/2011 CRTS, Inc. Insituform Technologies Inc. 39.0 100.0% 2.93x 05/26/2011 05/26/2011 TSC Group Holdings Limited China International Marine Containers (Hong Kong) Limited 211.4 6.3% 1.39x 10/06/2010 01/10/2011 T-3 Energy Services Inc. Robbins & Myers Inc. 417.5 100.0% 2.09x 08/24/2010 08/31/2010 Dresser Oil Tools and Supply McJunkin Red Man Corporation 9.3 100.0% 0.78x 05/03/2010 12/31/2010 Cuming Corporation Deep Down, Inc. 55.0 100.0% 0.75x 02/21/2010 08/27/2010 Smith International, Inc. Schlumberger Limited 13,658.4 100.0% 1.66x 02/04/2010 NA KNM Group Bhd Goldman Sachs Group, Merchant Banking Division; Goldman Sachs Capital Partners VI, L.P.; Mettiz Capital 1,236.2 NA 2.30x 11/17/2009 01/18/2010 Yantai Raffles Shipyard Limited China International Marine Containers (Hong Kong) Limited 956.6 28.7% 1.45x 04/22/2009 06/12/2009 National Coupling Company, Inc. Hunting plc 52.5 100.0% NANAA 03/04/2009 03/01/2009 International Lift Systems, L.L.C. Lufkin Industries Inc. 50.0 100.0% 1.64x Non-Tubular Low $5.0 0.45x High $13,658.4 2.93x Median $53.7 1.54x M $1 243 1 Mean 1,243.7 1.57x Overall Low $5.0 0.45x (Tubular and Non-tubular) High $25,177.8 2.93x Median $211.4 1.45x Mean $2,688.8 1.38x Privileged and Confidential - Preliminary and for Discussion Purposes Only 13 Source: Capital IQ Notes: 1. No transaction used in this analysis for comparative purposes is identical to the HDS proposal 2. Transaction Value refers to the implied enterprise value of the target company, based on the announced transaction equity price and other public information available at time of announcement 3. Based on reported metric for the most recent LTM period prior to announcement of transaction NA refers to not available *Excluded as outlier from high, low, mean and median data Implied HDS Proposal $866.3 49.1% 1.34x |
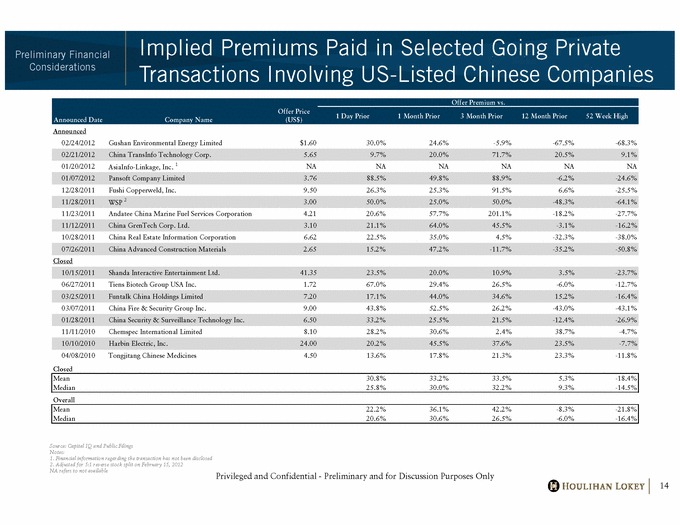
| Implied Premiums Paid in Selected Going Private Transactions Involving US-Listed Chinese Companies Preliminary Financial Considerations Offer Premium vs. Announced Date Company Name Offer Price (US$) 1 Day Prior 1 Month Prior 3 Month Prior 12 Month Prior 52 Week High Announced 02/24/2012 Gushan Environmental Energy Limited $1.60 30.0% 24.6% -5.9% -67.5% -68.3% 02/21/2012 China TransInfo Technology Corp. 5.65 9.7% 20.0% 71.7% 20.5% 9.1% 1 01/20/2012 AsiaInfo-Linkage, Inc. NA NA NA NA NA NA 01/07/2012 Pansoft Company Limited 3.76 88.5% 49.8% 88.9% -6.2% -24.6% 12/28/2011 Fushi Copperweld, Inc. 9.50 26.3% 25.3% 91.5% 6.6% -25.5% 11/28/2011 WSP 2 3.00 50.0% 25.0% 50.0% -48.3% -64.1% 11/23/2011 Andatee China Marine Fuel Services Corporation 4.21 20.6% 57.7% 201.1% -18.2% -27.7% 11/12/2011 China GrenTech Corp. Ltd. 3.10 21.1% 64.0% 45.5% -3.1% -16.2% 10/28/2011 China Real Estate Information Corporation 6.62 22.5% 35.0% 4.5% -32.3% -38.0% 07/26/2011 China Advanced Construction Materials 2.65 15.2% 47.2% -11.7% -35.2% -50.8% Closed 10/15/2011 Shanda Interactive Entertainment Ltd. 41.35 23.5% 20.0% 10.9% 3.5% -23.7% 06/27/2011 Tiens Biotech Group USA Inc. 1.72 67.0% 29.4% 26.5% -6.0% -12.7% 03/25/2011 Funtalk China Holdings Limited 7.20 17.1% 44.0% 34.6% 15.2% -16.4% 03/07/2011 China Fire & Security Group Inc. 9.00 43.8% 52.5% 26.2% -43.0% -43.1% 01/28/2011 China Security & Surveillance Technology Inc. 6.50 33.2% 25.5% 21.5% -12.4% -26.9% 11/11/2010 Chemspec International Limited 8.10 28.2% 30.6% 2.4% 38.7% -4.7% 10/10/2010 Harbin Electric, Inc. 24.00 20.2% 45.5% 37.6% 23.5% -7.7% 04/08/2010 Tongjitang Chinese Medicines 4.50 13.6% 17.8% 21.3% 23.3% -11.8% Closed Mean 30.8% 33.2% 33.5% 5.3% -18.4% Median 25.8% 30.0% 32.2% 9.3% -14.5% Overall Mean 22.2% 36.1% 42.2% -8.3% -21.8% Median 20.6% 30.6% 26.5% -6.0% -16.4% Privileged and Confidential - Preliminary and for Discussion Purposes Only 14 Source: Capital IQ and Public Filings Notes: 1. Financial information regarding the transaction has not been disclosed 2. Adjusted for 5:1 reverse stock split on February 15, 2012 NA refers to not available |
| Appendix Privileged and Confidential - Preliminary and for Discussion Purposes Only |
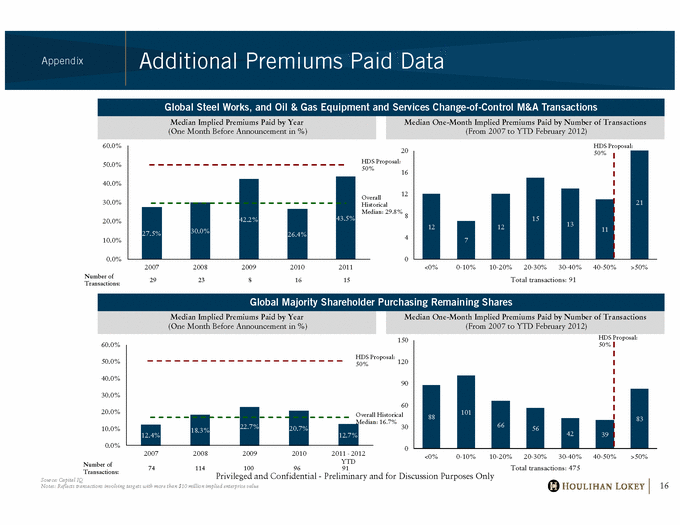
| Additional Premiums Paid Data Appendix Median One-Month Implied Premiums Paid by Number of Transactions (From 2007 to YTD February 2012) Median Implied Premiums Paid by Year (One Month Before Announcement in %) Global Steel Works, and Oil & Gas Equipment and Services Change-of-Control M&A Transactions 60.0% HDS Proposal: 20 HDS Proposal: 50% 30. 0% 42.2% 43.5% 20.0% 30.0% 40.0% 50.0% 50% Overall Historical Median: 29.8% 12 12 15 13 11 21 8 12 16 Total transactions: 91 27.5% 30.0% 26.4% 0.0% 10.0% 2007 2008 2009 2010 2011 Number of Transactions: 29 23 8 16 15 7 0 4 <0% 0-10% 10-20% 20-30% 30-40% 40-50% >50% Median One-Month Implied Premiums Paid by Number of Transactions (From 2007 to YTD February 2012) Median Implied Premiums Paid by Year (One Month Before Announcement in %) Global Majority Shareholder Purchasing Remaining Shares 50 0% 60.0% 120 150 HDS Proposal: HDS Proposal: 20.0% 30.0% 40.0% 50.0% 88 101 66 56 83 30 60 90 50% Overall Historical Median: 16.7% Privileged and Confidential - Preliminary and for Discussion Purposes Only 16 Total transactions: 475 12.4% 18.3% 22.7% 20.7% 12.7% 0.0% 10.0% 2007 2008 2009 2010 2011 - 2012 YTD Number of Transactions: 74 114 100 96 91 42 39 0 <0% 0-10% 10-20% 20-30% 30-40% 40-50% >50% Source: Capital IQ Notes: Reflects transactions involving targets with more than $10 million implied enterprise value |
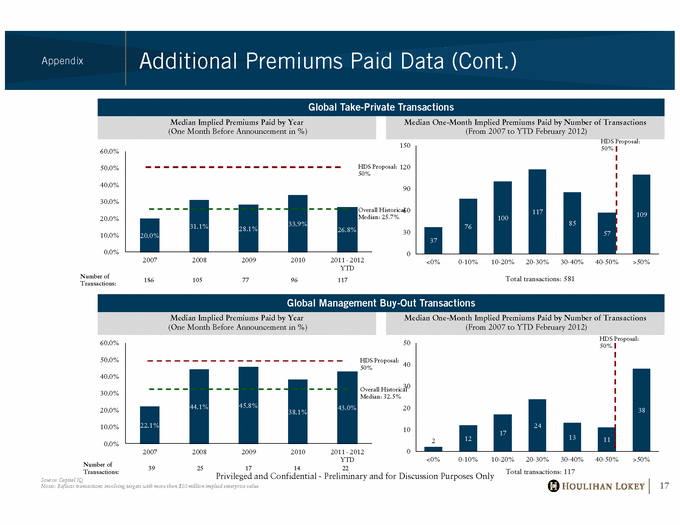
| Additional Premiums Paid Data (Cont.) Appendix Median One-Month Implied Premiums Paid by Number of Transactions (From 2007 to YTD February 2012) Median Implied Premiums Paid by Year (One Month Before Announcement in %) Global Take-Private Transactions 60.0% 150 HDS Proposal: 50% 31.1% 28 1% 33.9% 26 8% 20.0% 30.0% 40.0% 50.0% 76 100 117 85 109 60 90 120 HDS Proposal: 50% Overall Historical Median: 25.7% Total transactions: 581 20.0% 28.1% 26.8% 0.0% 10.0% 2007 2008 2009 2010 2011 - 2012 YTD 37 57 0 30 <0% 0-10% 10-20% 20-30% 30-40% 40-50% >50% Number of Transactions: 186 105 77 96 117 Median One-Month Implied Premiums Paid by Number of Transactions (From 2007 to YTD February 2012) Median Implied Premiums Paid by Year (One Month Before Announcement in %) Global Management Buy-Out Transactions 50.0% 60.0% 50 HDS Proposal: 50% 22.1% 44.1% 45.8% 38.1% 43.0% 10 0% 20.0% 30.0% 40.0% 24 38 10 20 30 40 HDS Proposal: 50% Overall Historical Median: 32.5% Privileged and Confidential - Preliminary and for Discussion Purposes Only 17 Total transactions: 117 0.0% 10.0% 2007 2008 2009 2010 2011 - 2012 YTD 2 12 17 13 11 0 <0% 0-10% 10-20% 20-30% 30-40% 40-50% >50% Number of Transactions: 39 25 17 14 22 Source: Capital IQ Notes: Reflects transactions involving targets with more than $10 million implied enterprise value |
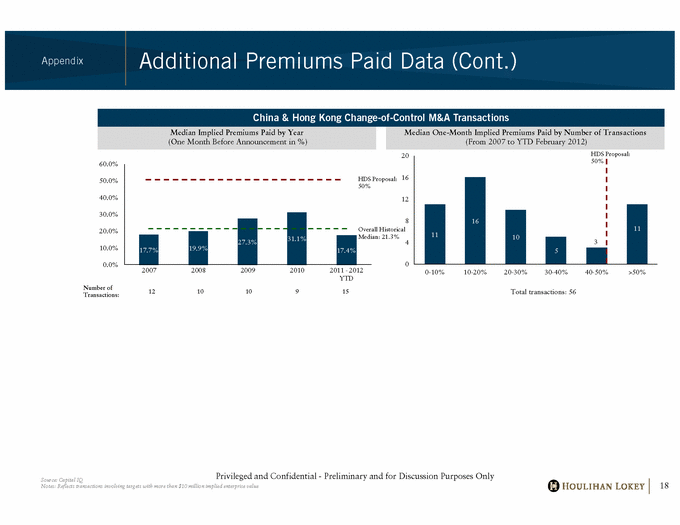
| Additional Premiums Paid Data (Cont.) Appendix Median One-Month Implied Premiums Paid by Number of Transactions (From 2007 to YTD February 2012) Median Implied Premiums Paid by Year (One Month Before Announcement in %) China & Hong Kong Change-of-Control M&A Transactions 20 HDS Proposal: 50% 20 0% 30.0% 40.0% 50.0% 60.0% 16 11 8 12 16 HDS Proposal: 50% Overall Total transactions: 56 17.7% 19.9% 27.3% 31.1% 17.4% 0.0% 10.0% 20.0% 2007 2008 2009 2010 2011 - 2012 YTD 11 10 5 3 0 4 0-10% 10-20% 20-30% 30-40% 40-50% >50% Number of Transactions: 12 10 10 9 15 Historical Median: 21.3% Privileged and Confidential - Preliminary and for Discussion Purposes Only 18 Source: Capital IQ Notes: Reflects transactions involving targets with more than $10 million implied enterprise value |
| Illustrative Implied Multiples Matrix Appendix (US$ millions except for per ADS amounts) Implied Enterprise Value / Illustrative Implied Implied Revenue Multiple Purchase Price plied Shar Equity Enterprise LTM NFY + 1 Per ADS Price Value Value 9/30/2011 12/31/2012 Total Implied Investment Required1 Pre-announcement Price (12/12/11) $2.00 $40.9 $845.9 1.31x 1.02x $20.1 Current Trading Price (02/24/12) $2.02 41.2 846.2 1.31x 1.02x 20.2 $2.25 46.0 851.0 1.32x 1.02x 22.6 2.50 51.1 856.1 1.33x 1.03x 25.1 2.75 56.2 861.2 1.34x 1.04x 27.6 3.00 61.3 866.3 1.34x 1.04x 30.1 3.25 66.4 871.4 1.35x 1.05x 32.6 3.50 71.5 876.5 1.36x 1.06x 35.1 3.75 76.6 881.6 1.37x 1.06x 37.6 4.00 81.8 886.7 1.38x 1.07x 40.1 4.25 86.9 891.9 1.38x 1.07x 42.6 4.50 92.0 897.0 1.39x 1.08x 45.1 4.75 97.1 902.1 1.40x 1.09x 47.6 Additional Investment Required per Selected Price Movements Per ADS Additional Investment Price Movement (US$ millions) Based on HDS proposed $3.00 purchase price per ADS, the total implied investment required is $ 30.1 million1 $0.05 $0.5 0.10 1.0 0.25 2.5 0.50 5.0 1.00 10.0 p q . A $0.10 increase in the per ADS purchase price increases the investment required by $1.0 million and a $1.00 increase in the per ADS purchase price increases the investment required by $10.0 million Privileged and Confidential - Preliminary and for Discussion Purposes Only 19 Note: 1. Assumes all public shareholders participate in the proposed transaction. Public shareholders own 10.0 million ADSs representing 49.1% of total outstanding ADSs. |
| connection therewith (collectively, the “materials”), are provided solely for the information of the Special Committee of the Board of Directors (the “Committee”) of WSP Holdings Ltd. (“WSP” or the “Company”) by Houlihan Lokey in connection with the Committee’s consideration of a potential transaction (the “Transaction”) involving the Company. This presentation is incomplete without reference to, and should be considered in conjunction with, any supplemental information provided by and discussions with Houlihan Lokey in connection therewith. Any defined terms used herein shall have the meanings set forth herein, even if such defined terms have been given different meanings elsewhere in the materials. The materials are for discussion purposes only and may not be relied upon by any person or entity for any purpose except as expressly permitted by Houlihan Lokey’s engagement letter. The materials were prepared for specific persons familiar with the business and affairs of the Company for use in a specific context and were not prepared with a view to public disclosure or to conform with any disclosure standards under any state, federal or international securities laws or other laws, rules or regulations, and neither the Committee, the Company nor Houlihan Lokey takes any responsibility for the use of the materials by persons other than the Committee. The materials are provided on a confidential basis solely for the information of the Committee and may not be disclosed, summarized, reproduced, disseminated or quoted or otherwise referred to, in whole or in part, without Houlihan Lokey’s express prior written consent. Notwithstanding any other provision herein, the Company (and each employee, representative or other agent of the Company) may disclose to any and all persons without limitation of any kind, the tax treatment and tax structure of any transaction and all materials of any kind (including opinions or other tax analyses, if any) that are provided to the Company relating to such tax treatment and structure. However, any information relating to the tax treatment and tax structure shall remain confidential (and the foregoing sentence shall not apply) to the extent necessary to enable any person to comply with securities laws. For this purpose, the tax treatment of a transaction is the purported or claimed U.S. income or franchise tax treatment of the transaction and the tax structure of a transaction is any fact that may be relevant to understanding the purported or claimed U.S. income or franchise tax treatment of the transaction. If the Company plans to disclose information pursuant to the first sentence of this paragraph, the Company shall inform those to whom it discloses any such information that they may not rely upon such information for any purpose without Houlihan Lokey’s prior written consent. Houlihan Lokey is not an expert on, and nothing contained in the materials should be construed as advice with regard to, legal, accounting, regulatory, insurance, tax or other specialist matters. Houlihan Lokey’s role in reviewing any information is limited solely to performing such a review as it shall deem necessary to support its own advice and analysis and shall not be on behalf of the Committee. Any statement contained in the materials as to tax matters was neither written nor intended by Houlihan Lokey or any of its affiliates to be used, and cannot be used by any taxpayer, for the purpose of avoiding tax penalties that may be imposed on such taxpayer. If any person uses or refers to any such tax statement in promoting, marketing or recommending a partnership or other entity, investment plan or arrangement to any taxpayer, then such statement is being delivered to support the promotion or marketing of the transaction or matter addressed and such person should seek advice based on its particular circumstances from an independent tax advisor. The materials necessarily are based on financial, economic, market and other conditions as in effect on, and the information available to Houlihan Lokey as of, the date of the materials. Although subsequent developments may affect the contents of the materials, Houlihan Lokey has not undertaken, and is under no obligation, to update, revise or reaffirm the materials, except as expressly contemplated by Houlihan Lokey’s engagement letter. The materials are not intended to provide the sole basis for evaluation of the Transaction and do not purport to contain all information that may be required. The materials do not address the underlying business decision of the Company or any other party to proceed with or effect the Transaction. The materials do not constitute any opinion, nor do the materials constitute a recommendation to the Committee, any security holder of the Company or any other party as to how to vote or act with respect to any matter relating to the Transaction or otherwise or whether to buy or sell any assets or securities of any company. Houlihan Lokey’s only opinion is the opinion, if any, that is actually delivered to the Committee. The materials may not reflect information known to other professionals in other business areas of Houlihan Lokey and its affiliates. The analyses contained in the materials must be considered as a whole. Selecting portions of the analyses, analytic methods and factors without considering all analyses and factors could create a misleading or incomplete view. The materials reflect judgments and assumptions with regard to industry performance, general business, economic, regulatory, market and financial conditions and other matters, many of which are beyond the control of the participants in the Transaction. Any estimates of value contained in the materials are not necessarily indicative of actual value or predictive of future results or values, which may be significantly more or less favorable. Any analyses relating to the value of assets businesses or securities do not purport to be appraisals or to reflect the prices at which any assets businesses or securities may actually be sold The materials do not constitute a valuation opinion or assets, assets, sold. credit rating. In preparing the materials, Houlihan Lokey has not conducted any physical inspection or independent appraisal or evaluation of any of the assets, properties or liabilities (contingent or otherwise) of the Company or any other party and has no obligation to evaluate the solvency of the Company or any other party under any law. All budgets, projections, estimates, financial analyses, reports and other information with respect to operations (including estimates of potential cost savings and expenses) reflected in the materials have been prepared by management of the relevant party or are derived from such budgets, projections, estimates, financial analyses, reports and other information or from other sources, which involve numerous and significant subjective determinations made by management of the relevant party and/or which such management has reviewed and found reasonable. The budgets, projections and estimates contained in the materials may or may not be achieved and differences between projected results and those actually achieved may be material. Houlihan Lokey has relied upon representations made by management of the Company that such budgets, projections and estimates have been reasonably prepared in good faith on bases reflecting the best currently available estimates and judgments of such management (or, with respect to information obtained from public sources, represent reasonable estimates), and Houlihan Lokey expresses no opinion with respect to such budgets, projections or estimates or the assumptions on which they are based. The scope of the financial analysis contained herein is based on discussions with the Company (including, without limitation, regarding the methodologies to be utilized), and Houlihan Lokey does not make any representation, express or implied, as to the sufficiency or adequacy of such financial analysis or the scope thereof for any particular purpose. Houlihan Lokey has assumed and relied upon the accuracy and completeness of the financial and other information provided to, discussed with or reviewed by it without (and without assuming responsibility for) independent verification of such information, makes no representation or warranty (express or implied) in respect of the accuracy or completeness of such information and has further relied upon the assurances of the Company and other participants in the Transaction that they are not aware of any facts or circumstances that would make such information inaccurate or misleading. In addition, Houlihan Lokey has relied upon and assumed, without independent verification, that there has been no change in the business, assets, liabilities, financial condition, results of operations, cash flows or prospects of the Company or any other participant in the Transaction since the respective dates of the most recent financial statements and other information, financial or otherwise, provided to Houlihan Lokey that would be material to its analyses. The materials are not an offer to sell or a solicitation of an indication of interest to purchase any security, option, commodity, future, loan or currency. The materials do not constitute a commitment by Houlihan Lokey or any of its affiliates to underwrite, subscribe for or place any securities, to extend or arrange credit, or to provide any other services. In the ordinary course of business, certain of Houlihan Lokey’s affiliates, as well as investment funds in which they may have financial interests, may acquire, hold or sell, long or short positions, or trade or otherwise effect transactions, in debt, equity, and other securities and financial instruments (including loans and other obligations) of, or investments in, one or more parties that may be involved in the Transaction and their respective affiliates or any currency or commodity that may be involved in the Transaction. Houlihan Lokey provides mergers Privileged and Confidential - Preliminary and for Discussion Purposes Only 20 and acquisitions, restructuring and other advisory services to clients. Houlihan Lokey’s personnel may make statements or provide advice that is contrary to information contained in the materials. Houlihan Lokey’s or its affiliates’ proprietary interests may conflict with the Company’s interests. Houlihan Lokey may have advised, may seek to advise and may in the future advise companies mentioned in the materials. |
