Iridium Communications Inc. Business Update & Iridium NEXT Financing Strategy February 9, 2010 Includes selected financial data through Q3 2009 Exhibit 99.1 |
Disclaimer Safe Harbor Statement This presentation contains statements about future events and expectations known as “forward-looking statements” within the meaning of Section 27A of the Securities Act of 1933, as amended (the “Securities Act”), and Section 21E of the Securities Exchange Act of 1934, as amended (the “Exchange Act”). We have based these statements on our current expectations and the information currently available to us. The words “anticipates,” “may,” “can,” “believes,” “expects,” “projects,” “intends,” “likely,” “will,” “to be” and other expressions that are predictions of or indicate future events, trends or prospects and which do not relate to historical matters identify forward-looking statements. Forward-looking statements in this presentation include statements about expected Operational EBITDA, Operational EBITDA margins and the expected availability and potential sources of financing for Iridium NEXT. All statements other than statements of historical fact are statements that could be deemed forward-looking statements. These forward-looking statements involve known and unknown risks, uncertainties and other factors that may cause our actual results, performance or achievements to differ materially from any future results, performance or achievements expressed or implied by such forward-looking statements. These risks and uncertainties include, but are not limited to, uncertainties regarding levels of demand for mobile satellite services, expected Operational EBITDA, Operational EBITDA margins, growth in subscribers and revenue, the development of future products, and the development and availability of financing for Iridium NEXT, as well as industry and economic conditions, competitive, legal, governmental and technological factors, as well as those factors listed under the caption “Risk Factors” of our Form 10-Q for the quarter ended September 30, 2009, as filed with the SEC on November 16, 2009. There is no assurance that our expectations will be realized. If one or more of these risks or uncertainties materialize, or if our underlying assumptions prove incorrect, actual results may vary materially from those expected, estimated or projected. Readers are cautioned not to place undue reliance on these forward-looking statements, which speak only as of the date hereof. We undertake no obligation to release publicly any revisions to any forward-looking statements after the date they are made, whether as a result of new information, future events or otherwise. 2 |
Basis of Presentation • Reporting Entity The financial / operating results (other than those included in the Appendix on page 20) are the consolidated results for Iridium Holdings LLC only and do not include the separate operating results of GHL Acquisition Corp. (now called Iridium Communications Inc.) The Iridium Holdings LLC results discussed in this presentation are for the period from July 1 through September 29, 2009 (Q309) and for the period January 1 through September 29, 2009 (YTD09), the day on which GHL Acquisition Corp. acquired Iridium Holdings LLC (the “Acquisition”) and effectively ended Iridium Holdings LLC’s third quarter. However, the Iridium Communications Inc. results discussed in the Appendix to this presentation are for the three and nine months ended September 30, 2009 and 2008. • Non-GAAP Measures In addition to disclosing financial results that are determined in accordance with U.S. generally accepted accounting principles, or GAAP, the Company discloses Operational EBITDA, which is a non-GAAP financial measure, as a supplemental measure to help investors evaluate its fundamental operational performance. Operational EBITDA represents earnings before interest; income taxes; depreciation and amortization; Iridium NEXT revenue and expenses (for periods prior to the deployment of Iridium NEXT only); expenses associated with the transaction with GHL Acquisition Corp.; and stock-based compensation expenses. In future periods, Operational EBITDA will also exclude the impact of purchase accounting adjustments and the change in the fair value of the warrants. Operational EBITDA does not represent and should not be considered an alternative to GAAP measurements, such as net income, and Iridium’s calculations thereof may not be comparable to similarly entitled measures reported by other companies. A reconciliation of Operational EBITDA to net income (loss), its most comparable GAAP financial measure is included in the Appendix to this presentation. By eliminating interest, income taxes, depreciation and amortization, transaction expenses associated with the Acquisition, stock-based compensation expenses, Iridium NEXT revenue and expenses (for periods prior to the deployment of Iridium NEXT only) and purchase accounting adjustments, the Company believes the result is a useful measure across time in evaluating the Company’s fundamental core operating performance. Management also uses Operational EBITDA to manage the Company’s business, including in preparing its annual operating budget, financial projections and compensation plans. The Company believes that Operational EBITDA is also useful to investors because similar measures are frequently used by securities analysts, investors and other interested parties in their evaluation of companies in similar industries. As indicated, Operational EBITDA does not include interest expense on borrowed money or depreciation expense on its capital assets or the payment of income taxes, which are necessary elements of the company’s operations. It also excludes expenses in connection with the development, deployment and financing of Iridium NEXT. Because Operational EBITDA does not account for these and other expenses, its utility as a measure of the Company’s operating performance has material limitations. Because of these limitations, the Company’s management does not view Operational EBITDA in isolation and also uses other measurements, such as net income, revenues and operating profit, to measure operating performance. 3 |
Business Update |
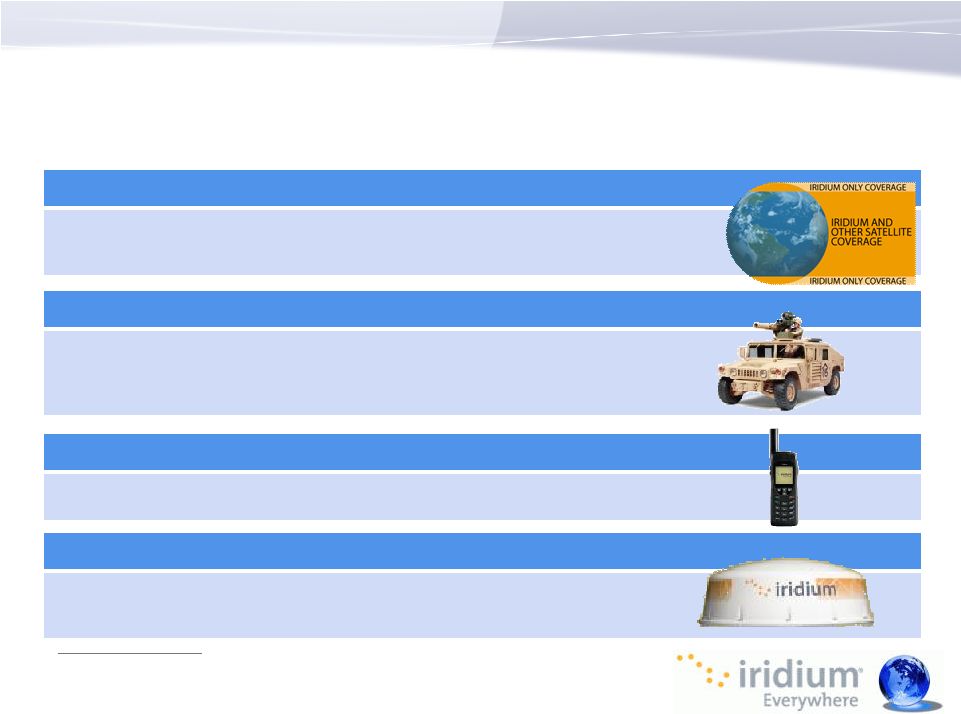
Our Company • Satellite voice and data solutions for enterprise & government • The only provider offering 100% worldwide coverage • Unique, resilient mesh satellite architecture • 66 satellite Low Earth Orbit (LEO) constellation • ~359,000 subscribers (1) • Anchor U.S. DoD customer – 23% of revenue for YTD09 (2) • Complements terrestrial wireless solutions • Less than 10% of the earth’s surface is served by terrestrial wireless systems • Expanding portfolio of products & services sold via a broad distribution network • Data services growing rapidly 5 1) Of our 359,000 subscribers at September 29, 2009, 5.6% maintained a suspended account on such date. 2) Includes direct and indirect DoD revenues and revenues from certain other governmental entities through the DoD gateway. |
Our Unique Attributes - How we compete Iridium is a unique company with exciting growth opportunities Only Mobile Communications Provider Capable of 100% Global Coverage • Geostationary Earth Orbit (GEOs) are limited in serving users above 70° latitude • Other LEOs have limitations, e.g. serving maritime customers • Most of the earth’s surface is not served by terrestrial wireless Mission Critical to the DoD • Dedicated proprietary gateway • Significant investment in our equipment • Only handhelds offering Type 1 encryption • Long-term relationship / up to 5-year contract (1) A High Quality Voice and Data Solution • LEO mesh design provides no unnatural delays • Fully mobile; well proven, modern and rugged design We Deliver Cost-effective Satellite Communications • Inherent cost advantages versus GEOs • Cost-effective Machine to Machine (M2M) – rapid growth opportunity • Iridium OpenPort – raises the bar in maritime communications 6 1) As is customary for government contracts, Iridium’s DoD contract is structured as a one-year contract with four one-year options to extend. The contract currently is in the first one-year option period and three option periods remain. |
Q3 Summary (Iridium Holdings LLC) • Commercial and Gov’t Revenue up 23.0% and 2.1%, respectively, over Q3 2008 • Subscriber Base up 16.1% from Q3 2008 (2) • Equipment Revenue down 37.0%, or $12.4M, from Q3 2008 • Operational EBITDA up 28.4% (3) • Strong Liquidity as of end of Q3 2009 • Unrestricted cash and equivalents of $136M 7 Total Revenue Service Revenue Equipment Revenue Operational EBITDA Net Income ($M’s) (1) Total Revenue, Op EBITDA & Net Income 1) Iridium Holdings LLC results are presented as the predecessor company. Iridium Communications Inc.’s results of operations for the three and nine months ended September 30, 2008 and 2009 are set forth in the Appendix on page 20. 2) Subscriber figures include suspended subscribers 3) Operational EBITDA represents earnings before interest, income taxes, depreciation and amortization, Iridium NEXT revenue and expenses, expenses associated with the recently completed transaction with GHL Acquisition Corp. and stock based compensation expenses. See page 19 for a reconciliation of Operational EBITDA to Net Income. Cumulative Subscribers (2): Q3 08 – 309,000; Q3 09 – 359,000 |
Strong Subscriber and Service Revenue Growth • Growing subscriber base driving recurring service revenue • Enterprise and government end-users • Service revenue is predictable and growing ($M's) (000's) Robust Subscriber Growth 1) Of our 359,000 subscribers at September 29, 2009, 5.6% maintained a suspended account on such date. $177 $147 $201 $159 $129 Q1 03 Q3 09 8 (1) Service Revenue |
2010 Management Guidance & Valuation • Previously announced 2009 Operational EBITDA guidance of between $126-130M • Currently expect 2010 Operational EBITDA between $145-155M • Played critical role in recent Haiti rescue and recovery efforts • Positive partner sentiment moving into new year • New 9602 M2M device • OpenPort adoption 9 Current Iridium Trading Valuation Management Guidance ($ in millions, except per-share data) Share Price as of 2/5/2010 $6.75 x Shares Outstanding 70.2 Market Capitalization $474.2 Less: Net Cash (3) ($126.7) Enterprise Value $347.5 Divided by: 2010E Operational EBITDA $150.0 Ent. Value / 2010E Operational EBITDA 2.3x Comparison to Inmarsat ~10.0x (Primary Competitor) (5) (2) (4) Note: Balance sheet data as of 9/30/09. 1) Iridium provided this guidance on November 13, 2009 and it speaks only as of that date. We have not yet completed our audit of 2009 financial results and therefore can make no statement about our actual 2009 results. We do not intend our inclusion of this guidance to be a reaffirmation or update. 2) Includes shares outstanding at 9/30/09 of 68.3M, plus 1.9M shares issued upon the conversion of a subordinated promissory note in October 2009. 3) Includes cash and restricted cash, less deferred acquisition consideration. 4) Represents midpoint of management guidance. 5) Source: Bloomberg as of 2/5/10. (1) |
Iridium NEXT Financing Strategy |
Iridium NEXT Constellation • Iridium NEXT will upgrade & replace current satellite fleet • Current fleet expected to provide commercially acceptable service through transition to Iridium NEXT • Initial launches expected in 2014 • 66 satellite LEO constellation • Compatibility with current fleet eases network transition • Iridium NEXT advantages: • Will expand capacity to 3M subscribers • Higher data speeds • Capable of supporting future product enhancements • Designed to host secondary payloads • Will maintain Iridium’s unique architecture 11 • Iridium NEXT prime vendor selection process provides opportunity to obtain favorable government-backed financing through export credit agencies (ECAs) |
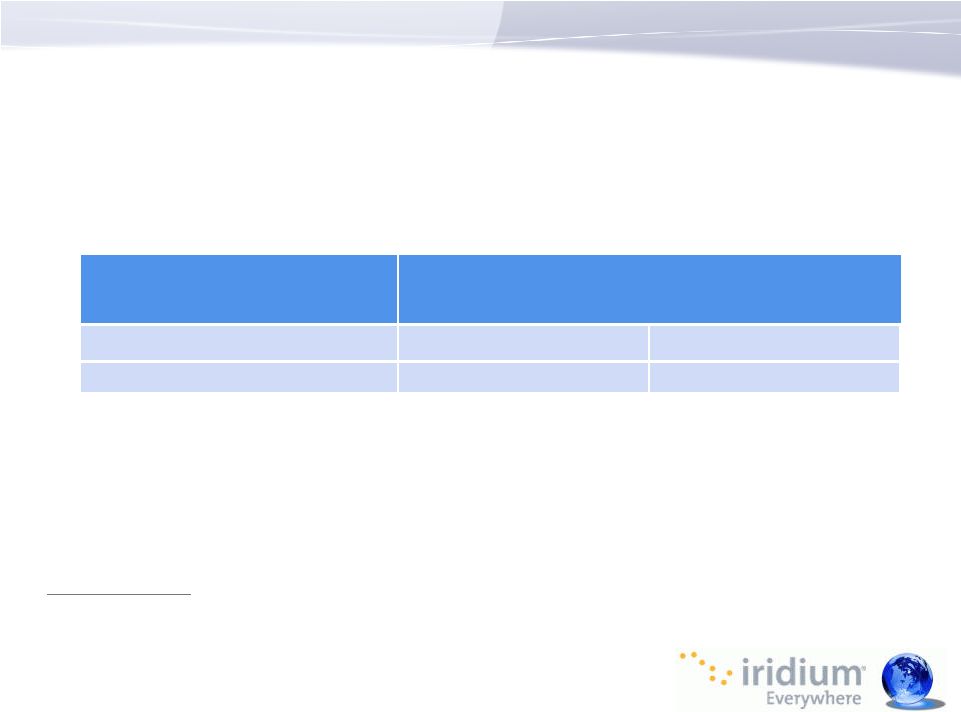
Putting Cost of Iridium NEXT in Perspective • $2.7B constellation (current estimated total cost) • Assumes constellation provides commercially acceptable service through 2025-2030 (1) • Large cash flow potential over constellation life justifies the investment: • Iridium expects to fund a substantial portion of Iridium NEXT costs through internally generated funds, secondary payloads and net cash • Starting net cash position of $127M (4) as of September 30, 2009 • Iridium NEXT expenditures peak in 2014, allowing advance funding through operational cash flow 12 1) Design life is expected to be 7-10 years. Historically, actual constellation life has significantly exceeded design life. 2) The Operational EBITDA CAGRs are for illustrative purposes only and are not intended to be and should not be relied upon as management guidance or projections. 3) Cumulative Operational EBITDA based on midpoint of 2010 Operational EBITDA guidance previously provided by management ($150M) and assuming Operational EBITDA grows at 10% and 15% per year, respectively. 4) Represents cash and restricted cash, net of deferred acquisition consideration relating to GHQ transaction. 5) Does not include any proceeds from potential exercise of warrants. 6) For periods after the deployment of Iridium NEXT, Operational EBITDA will not exclude revenues and expenses associated with Iridium NEXT. See page 3 - Basis of Presentation. Illustrative Example Operational EBITDA CAGR (2) : 10% 15% 2010 - 2030: $9.6 BB $17.8 BB Cumulative Operational EBITDA Generation (3,6) (5) |
Iridium NEXT Financing Strategy Target Sources of Debt Financing • ECA-Backed Debt Financing • Senior debt backed by a government export-financing agency • Would likely be issued in conjunction with signing with a prime contractor to build Iridium NEXT constellation • Unsecured Debt • Additional unsecured/subordinated corporate debt to the extent ECA financing not sufficient Potential Iridium NEXT Funding Sources (~$2.7B) (1) Internally- Generated Operational Cash Flow 50% External Capital 35% Cash On Hand 5% Warrant Proceeds 10% + < • Substantial portion of capex for Iridium NEXT is expected to be financed from internal sources • For remainder of financing, Iridium is in active discussions with two large ECAs to secure a financing package, including backing/guarantees • Seeking support for a facility of up to $1.5B with repayment anticipated to begin in 2017 with a term of up to 10 years on favorable financing terms 13 (2) 1) Based on $2.7B total estimated cost; potential warrant proceeds of $261M; and cash / restricted cash on hand as of 9/30/09 (net of deferred acquisition consideration relating to GHQ transaction). 2) There are currently outstanding 13.7M warrants with a $7.00 exercise price and 14.4M warrants with an $11.50 exercise price. |
What is ECA-Backed Financing? • Export credit agencies (“ECAs”) are private or quasi-governmental institutions that act as intermediaries between national governments and exporters to issue export financing • Financing can take the form of credits (financial support) or credit insurance and guarantees (pure cover) or both, depending on the mandate the ECA has been given by its government • ECA-backed financing is used extensively for large capital purchases in the aerospace industry (i.e., satellites, aviation, etc.) • Aerospace ECA-backed financing tends to be longer-term • Recent precedents have included flexible, delayed draw-down mechanisms • Nature of Iridium NEXT program creates opportunities for job creation in line with ECA’s mission 14 |
Case Study: Globalstar ECA-Backed Financing • In June 2009, Globalstar executed a $738M financing plan, consisting of the following components: • $586M ECA senior secured financing backed by Coface (~79% of total need) • $60M contingent equity (converted) • $46M debt service reserve • $45M new sub debt or equity • Fully funds construction of Globalstar’s second generation constellation and four launches • Low interest rate of approximately LIBOR + 207bps through 2012 (rate cap limits LIBOR exposure to 4% through 2012) • Drawdown period permitted through late 2011, followed by 8.5 year repayment schedule Summary of ECA-Backed Senior Loan Amount: $586M (79% of total need) Coface Cover: 95% loan guaranty supported by French Ministry of Finance (Coface) Interest Rate: LIBOR + 207bps; rate cap limiting LIBOR exposure to 4% through 2012 Tenor: ~10.5 year term Repayment: Mortgage-style with low-high structure; interest-only payments until 2011 Upfront Fee: 2.8% flat structuring fee Coface Cover Costs: (Premium for Guarantee) 6.68% of loan amount (1) Covenants: Maximum capex; minimum liquidity; other customary covenants Source: Globalstar investor presentation dated 1/27/10. 1) Included in the financing amount of $586M. 15 |
Status/ Potential Timetable of Iridium-ECA Discussions • Separate applications have been made to two large ECAs and significant discussions held • Goldman Sachs, Societe Generale and Hawkpoint are advising Iridium in these discussions • Iridium NEXT prime contractor candidates (Lockheed Martin & Thales Alenia Space) are engaged and supporting the process • An important component in the contractor selection process will be level of ECA support • Anticipated closing in Summer 2010 in conjunction with selection of Iridium NEXT prime contractor 16 |
Appendix |
Iridium Holdings LLC Summary Q3 Highlights ($M; except subscriber data) Q3 09 Q3 08 % Change YTD 09 YTD 08 % Change Subscribers (at end of period ) (1) 359,000 309,000 16.1% Revenue Commercial service Voice 39.5 32.6 21.2% 108.2 89.3 21.2% M2M Data 4.3 2.9 48.3% 12.1 7.6 59.2% Other Revenue 0.1 0.2 -50.0% 0.4 0.7 -42.9% Total Commercial Service 43.9 35.7 23.0% 120.7 97.6 23.7% Government service Voice 13.3 13.2 0.8% 39.6 39.1 1.3% M2M Data 0.2 0.1 100.0% 0.5 0.2 150.0% Other Revenue 5.9 5.7 3.5% 15.9 9.5 67.4% Total Government Service 19.4 19.0 2.1% 56.0 48.8 14.8% Equipment 21.1 33.5 -37.0% 66.2 97.8 -32.3% Total Revenue 84.4 88.2 -4.3% 242.9 244.2 -0.5% Operational EBITDA 38.4 29.9 28.4% 103.7 85.4 21.4% Net Income 15.0 16.9 -11.2% 53.3 52.3 1.9% 18 1) Of our 359,000 and 309,000 subscribers at September 29, 2009 and September 29, 2008, respectively, 5.6% and 3.2% maintained a suspended account. |
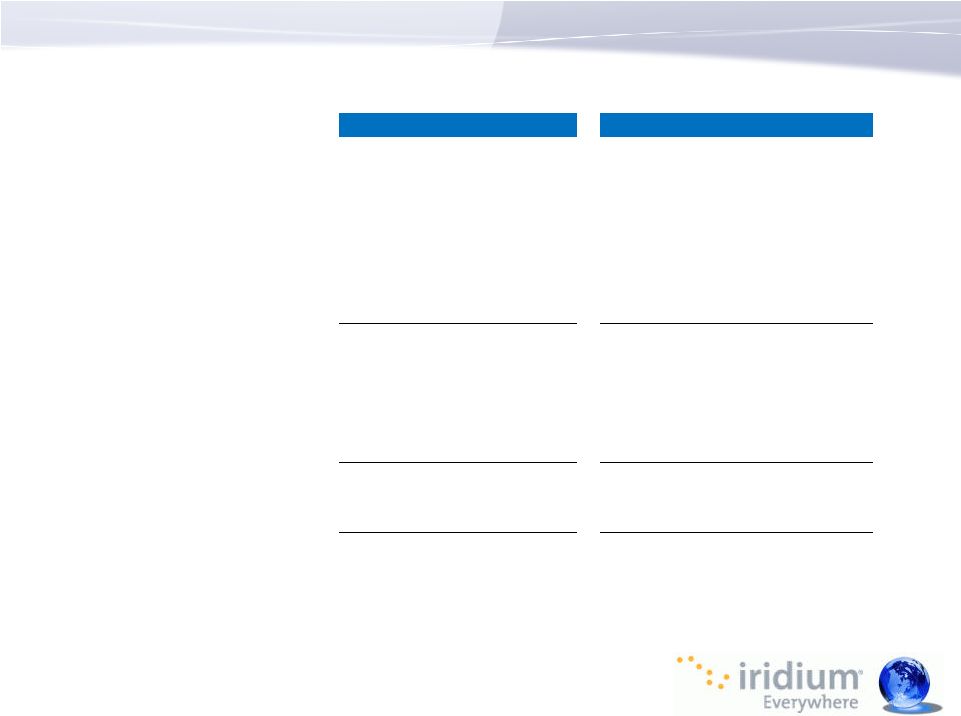
Iridium Holdings LLC Operational EBITDA Non-GAAP reconciliation 19 Q309 Q308 YTD09 YTD08 ($ in Millions) Net income $ 15.0 $ 16.9 $ 53.3 $ 52.3 Interest expense 3.6 4.6 12.8 14.3 Interest income (0.2) (0.3) (0.3) (1.0) Depreciation and amortization 3.6 3.1 10.8 9.0 Stock-based compensation expenses 4.4 0.9 5.4 2.1 Non-recurring transaction expenses 10.6 1.8 12.5 2.4 Iridium NEXT expenses, net 1.4 2.9 9.2 6.3 Operational EBITDA $ 38.4 $ 29.9 $ 103.7 $ 85.4 |
Iridium Communications Inc. Unaudited Condensed Consolidated Statements of Operations 20 2009 2008 2009 2008 Operating expenses: Professional fees $ 5,725 $ 28 $ 6,244 $ 104 Other operating expenses 372 78 645 196 Total operating expenses 6,097 106 6,889 300 Change in fair value of warrants (34,117) — (34,117) — Other income - interest 157 1,943 979 4,936 (Loss) earnings before provision (benefit) for (40,057) 1,837 (40,027) 4,636 Income tax (benefit) provision (629) 740 (616) 2,088 Net (loss) income $(39,428) $ 1,097 $(39,411) $ 2,548 Weighted average shares outstanding - basic 48,929 48,500 48,645 41,512 Weighted average shares outstanding - diluted 48,929 48,500 48,645 41,512 (Loss) earnings per share - basic $ (0.81) $ 0.02 $ (0.81) $ 0.06 (Loss) earnings per share - diluted $ (0.81) $ 0.02 $ (0.81) $ 0.06 Nine Months Ended September 30, Three Months Ended September 30, |