UNITED STATES
SECURITIES AND EXCHANGE COMMISSION
Washington, D.C. 20549
FORM N-CSR
CERTIFIED SHAREHOLDER REPORT OF REGISTERED
MANAGEMENT INVESTMENT COMPANIES
Investment Company Act file number | 811-22147 |
|
PowerShares India Exchange-Traded Fund Trust |
(Exact name of registrant as specified in charter) |
|
301 West Roosevelt Road Wheaton, IL | | 60187 |
(Address of principal executive offices) | | (Zip code) |
|
Andrew Schlossberg President 301 West Roosevelt Road Wheaton, IL 60187 |
(Name and address of agent for service) |
|
Registrant’s telephone number, including area code: | (800) 983-0903 | |
|
Date of fiscal year end: | October 31 | |
|
Date of reporting period: | October 31, 2012 | |
| | | | | | | | |
ITEM 1. REPORTS TO STOCKHOLDERS.
The Registrant’s annual report transmitted to shareholders pursuant to Rule 30e-1 under the Investment Company Act of 1940 is as follows:


PowerShares India Exchange-Traded Fund Trust
2012 Annual Report to Shareholders
October 31, 2012
PowerShares India Portfolio (PIN)

| The Market Environment | | | 3 | | |
| Manager's Analysis | | | 4 | | |
| Frequency Distribution of Discounts & Premiums | | | 7 | | |
| Fees and Expenses | | | 8 | | |
| Consolidated Schedule of Investments | | | 9 | | |
| Consolidated Statement of Assets and Liabilities | | | 10 | | |
| Consolidated Statement of Operations | | | 11 | | |
| Consolidated Statement of Changes in Net Assets | | | 12 | | |
| Financial Highlights | | | 13 | | |
| Notes to Consolidated Financial Statements | | | 14 | | |
| Report of Independent Registered Public Accounting Firm | | | 23 | | |
| Tax Information | | | 24 | | |
| Trustees and Officers | | | 25 | | |
This page intentionally left blank
During the reporting period ended October 31, 2012, global equity markets remained volatile. At the beginning of the reporting period, macro events – ranging from continuing political instability in the Middle East, lingering economic effects of the March 2011 earthquake and tsunami in Japan, the ongoing Eurozone sovereign debt crisis, effects of Standard & Poor's first-ever downgrade of U.S. debt in August 2011, a slowing Chinese property market and generally higher inflation across the developing world – weighed on global economic growth and equity markets. While the markets rebounded modestly in December 2011, macroeconomic concerns continued, stemming largely from the unstable economic conditions of Greece and Spain.
Toward the end of the reporting period, global central banks announced a series of stimulative policies. The European Central Bank ("ECB") announced new measures to support Eurozone economies through potentially unlimited purchases of sovereign debt, with ECB President Mario Draghi pledging to "do whatever it takes" to save the euro (although key details of the plan remain unresolved). The U.S. Federal Reserve announced a third round of quantitative easing by promising to remain accommodative until the U.S. labor market outlook improved materially. Also, the Bank of Japan took steps to increase its asset purchase program. These easing measures were well-received by investors and helped drive international equity markets higher in the final months of the reporting period, despite signs of a continued slowdown in global economic growth.
3
Manager's Analysis
PowerShares India Portfolio (ticker: PIN)
As an index fund, the PowerShares India Portfolio (the "Fund") is passively managed and attempts to track the returns of an underlying index. The Fund seeks investment results that generally correspond (before fees and expenses) to the price and yield of the Indus India Index (the "Index"). The Fund seeks to achieve its investment objective by investing substantially all of its assets in a wholly-owned subsidiary located in the Republic of Mauritius (the "Subsidiary"), which in turn invests at least 90% of its total assets in securities of Indian companies that comprise the Index, as well as American depositary receipts and global depositary receipts based on the securities in the Index.
Indus Advisors LLC compiles the Index, which is designed to represent the large-cap segment of the Indian equity markets. The Fund, through its investment in the Subsidiary, generally invests in all of the securities comprising the Index in proportion to their weightings in the Index.
For the fiscal year ended October 31, 2012, on a share price basis, the Fund returned (9.39)%, and on a net asset value ("NAV") basis, the Fund returned (9.84)%. During the same reporting period, the Index returned (7.67)%, while the MSCI India Index returned (4.73)%, the BSE SENSEX 30 Index returned (4.01)%, and the S&P 500® Index returned 15.21%. The Fund mistracked the Index by (2.17)% primarily due to fair value pricing portfolio securities (a process in which the Index does not engage), in addition to the Fund's expense ratio of 0.81% (to which the Index is not subject).
For the fiscal year ended October 31, 2012, the Consumer Staples sector contributed most significantly to the Fund's return, followed by the Financial Services and Health Care sectors, respectively. The Energy sector detracted most from the Fund's return, followed by Information Technology and Telecommunication Services sectors, respectively.
4
Manager's Analysis (Continued)
PowerShares India Portfolio (ticker: PIN)
Positions that contributed most significantly to the Fund's return included Hindustan Unilever, Ltd., a consumer staples company (portfolio average weight of 5.43%) and HDFC Bank, Ltd., a financials company (portfolio average weight of 4.28%). Positions that detracted most significantly from the Fund's return included Infosys, Ltd., an information technology company (portfolio average weight of 9.98%) and Bharti Airtel, Ltd., a telecommunication services company (portfolio average weight of 3.51%).
Sector Breakdown (% of the Fund's
Net Assets) as of October 31, 2012
Energy | | | 25.0 | | |
Financial Services | | | 18.2 | | |
Information Technology | | | 16.8 | | |
Consumer Staples | | | 8.7 | | |
Materials | | | 8.4 | | |
Utilities | | | 5.8 | | |
Health Care | | | 5.6 | | |
Industrials | | | 4.4 | | |
Consumer Discretionary | | | 4.3 | | |
Telecommunication Services | | | 3.3 | | |
Time Deposit | | | 0.5 | | |
Other | | | (1.0 | ) | |
Style Allocation (% of the Fund's
Net Assets) as of October 31, 2012
Large-Cap Growth | | | 62.2 | | |
Large-Cap Value | | | 36.6 | | |
Mid-Cap Growth | | | 0.7 | | |
Mid-Cap Value | | | 0.5 | | |
Top Ten Fund Holdings (% of the Fund's
Net Assets) as of October 31, 2012
Security | |
Reliance Industries, Ltd. | | | 10.3 | | |
Infosys, Ltd. | | | 10.2 | | |
Oil & Natural Gas Corp., Ltd. | | | 7.2 | | |
Housing Development Finance Corp. | | | 6.5 | | |
Hindustan Unilever, Ltd. | | | 6.0 | | |
HDFC Bank, Ltd. | | | 4.4 | | |
Tata Consultancy Services, Ltd. | | | 3.5 | | |
NTPC, Ltd. | | | 2.9 | | |
Bharti Airtel, Ltd. | | | 2.8 | | |
ICICI Bank, Ltd. | | | 2.7 | | |
Total | | | 56.5 | | |
5
Manager's Analysis (Continued)
PowerShares India Portfolio (ticker: PIN)
Growth of a $10,000 Investment Since Inception†
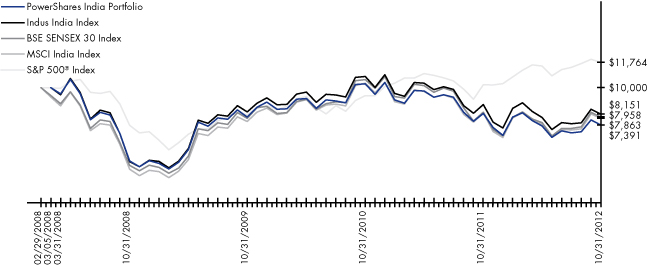
Fund Performance History (%) As of October 31, 2012
| | | | | Avg. Ann.†† | | Fund Inception† | |
Name | | 1 Year | | 3 Years | | Avg. Ann.†† | | Cumulative | |
| Index Indus India Index | | | (7.67 | )% | | | (0.63 | )% | | | (4.30 | )% | | | (18.49 | )% | |
BSE SENSEX 30 Index | | | (4.01 | )% | | | 0.38 | % | | | (4.78 | )% | | | (20.42 | )% | |
MSCI India Index | | | (4.73 | )% | | | 0.94 | % | | | (5.02 | )% | | | (21.37 | )% | |
S&P 500® Index | | | 15.21 | % | | | 13.21 | % | | | 3.54 | % | | | 17.64 | % | |
| Fund NAV Return | | | (9.84 | )% | | | (2.45 | )% | | | (6.28 | )% | | | (26.09 | )% | |
Share Price Return | | | (9.39 | )% | | | (1.89 | )% | | | (6.81 | )% | | | (28.01 | )% | |
Fund Inception: March 5, 2008
Performance quoted above represents past performance. Past performance is not a guarantee of future results and current performance may be higher or lower than performance quoted. Investment returns and principal value will fluctuate, and Shares, when redeemed, may be worth more or less than their original cost. According to the Fund's current prospectus, the expense ratio of 0.79% includes the unitary management fee of 0.78% and other expenses of 0.01%. NAV and Share Price returns assume that dividends and capital gain distributions have been reinvested in the Fund at NAV and Share Price, respectively. The returns shown in the table above do not reflect the deduction of taxes that a shareholder would pay on Fund distributions or the cash redemption or sale of Fund Shares. See invescopowershares.com to find the most recent month-end performance numbers.
Index performance results are based upon a hypothetical investment in its constituent securities. Index returns do not represent Fund returns. An investor cannot invest directly in an index. The Index does not charge management fees or brokerage expenses, and no such fees or expenses were deducted from the hypothetical performance shown. In addition, the results actual investors might have achieved would have differed from those shown because of differences in the timing, amounts of their investments, and fees and expenses associated with an investment in the Fund.
The MSCI India Index, BSE SENSEX 30 Index and S&P 500® Index (the "Benchmark Indices") are unmanaged indices used as a measurement of change in stock market conditions based on the average performance of approximately 73, 30 and 500 securities, respectively.
† Fund and Index returns are based on the inception date of the Fund. Returns for the Benchmark Indices are based on the closest month-end to the Fund's inception date.
†† Average annualized.
6
Frequency Distribution of Discounts & Premiums
For the Year Ended October 31, 2012
| | | | | | | | | Closing Price Above NAV (bps) | |
Ticker | | Fund Name | | Inception | | Days | | 0-24 | | 25-49 | | 50-99 | | 100-149 | | 150-199 | | 200+ | |
PIN | | PowerShares India Portfolio | | 03/05/08 | | | 1,175 | | | | 140 | | | | 156 | | | | 216 | | | | 86 | | | | 37 | | | | 27 | | |
| | | | | | | | | Closing Price Below Above NAV (bps) | |
| | | | | | | | | -0-24 | | -25-49 | | -50-99 | | -100-149 | | -150-199 | | -200+ | |
| | | | | | | | | | | | | | | | | | 147 | | | | 105 | | | | 157 | | | | 62 | | | | 23 | | | | 19 | | |
7
As a shareholder of the PowerShares India Portfolio (the "Fund"), a series of the PowerShares India Exchange-Traded Fund Trust (the "Trust"), you incur a unitary management fee, plus brokerage expenses, taxes, interest and extraordinary expense, if any. The expense example below is intended to help you understand your ongoing costs (in dollars) of investing in the Fund and to compare these costs with the ongoing costs of investing in other funds.
The example is based on an investment of $1,000 invested at the beginning of the period and held through the six-month period ended October 31, 2012.
Actual Expenses
The first line in the following table provides information about actual account values and actual expenses. You may use the information in this line, together with the amount you invested, to estimate the expenses that you paid over the period. Simply divide your account value by $1,000 (for example, an $8,600 account value divided by $1,000 = 8.6), then multiply the result by the number in the first line under the heading "Expenses Paid During the Six-Month Period" to estimate the expenses you paid on your account during this period.
Hypothetical Example for Comparison Purposes
The second line in the following table provides information about hypothetical account values and hypothetical expenses based on the Fund's actual expense ratio and an assumed annualized rate of return of 5% per year before expenses, which is not the Fund's actual return. The hypothetical account values and expenses may not be used to estimate the actual ending account balance or expenses you paid for the period. You may use this information to compare ongoing costs of investing in the Fund and other funds. To do so, compare this 5% hypothetical example with the 5% hypothetical examples that appear in the shareholder reports of the other funds.
Please note that the expenses shown in the table are meant to highlight your ongoing costs only, and do not reflect any transactional costs, such as sales charges (loads). Therefore, the second line in the table is useful in comparing ongoing costs only, and will not help you determine the relative total costs of owning different funds. In addition, if these transactional costs were included, your costs would have been higher.
| | | Beginning
Account
Value
May 1, 2012 | | Ending
Account
Value
October 31, 2012 | | Annualized
Expense Ratio
Based on
the Six-Month
Period | | Expenses Paid
During the
Six-Month Period (1) | |
Actual | | $ | 1,000.00 | | | $ | 1,008.50 | | | | 0.81 | % | | $ | 4.09 | | |
Hypothetical
(5% return before expenses) | | $ | 1,000.00 | | | $ | 1,021.06 | | | | 0.81 | % | | $ | 4.12 | | |
(1) Expenses are calculated using the annualized expense ratio, which represents the ongoing expenses as a percentage of net assets for the six-month period ended October 31, 2012. Expenses are calculated by multiplying the Fund's annualized expense ratio by the average account value for the period; then multiplying the result by 184/366 (to reflect the one-half year period).
8
Consolidated Schedule of Investments
PowerShares India Portfolio (PIN)
October 31, 2012
Number
of Shares | | | |
Value | |
| | | Common Stocks—100.5% | |
| | | India—100.5% | |
| | | Consumer Discretionary—4.3% | |
| | 76,232 | | | Bajaj Auto, Ltd. | | $ | 2,560,063 | | |
| | 18,725 | | | Bosch, Ltd. | | | 3,085,435 | | |
| | 441,634 | | | Mahindra & Mahindra, Ltd. | | | 7,233,920 | | |
| | 624,949 | | | Tata Motors, Ltd. | | | 2,988,662 | | |
| | | | 15,868,080 | | |
| | | Consumer Staples—8.7% | |
| | 2,190,977 | | | Hindustan Unilever, Ltd. | | | 22,269,459 | | |
| | 1,231,190 | | | ITC, Ltd. | | | 6,445,661 | | |
| | 39,892 | | | Nestlé India, Ltd. | | | 3,485,327 | | |
| | | | 32,200,447 | | |
| | | Energy—25.0% | |
| | 350,800 | | | Bharat Petroleum Corp., Ltd. | | | 2,202,479 | | |
| | 936,821 | | | Cairn India, Ltd.(a) | | | 5,861,870 | | |
| | 1,068,289 | | | Coal India, Ltd. | | | 6,876,238 | | |
| | 1,817,939 | | | Indian Oil Corp., Ltd. | | | 8,825,893 | | |
| | 5,391,072 | | | Oil & Natural Gas Corp., Ltd. | | | 26,791,699 | | |
| | 444,012 | | | Oil India, Ltd. | | | 3,979,089 | | |
| | 2,567,854 | | | Reliance Industries, Ltd. | | | 38,254,504 | | |
| | | | 92,791,772 | | |
| | | Financial Services—18.2% | |
| | 301,458 | | | Axis Bank, Ltd. | | | 6,579,798 | | |
| | 1,385,007 | | | HDFC Bank, Ltd. | | | 16,236,430 | | |
| | 1,714,796 | | | Housing Development Finance Corp. | | | 24,087,050 | | |
| | 519,249 | | | ICICI Bank, Ltd. | | | 10,156,187 | | |
| | 1,271,391 | | | Infrastructure Development
Finance Co., Ltd. | | | 3,801,079 | | |
| | 171,341 | | | State Bank of India | | | 6,664,409 | | |
| | | | 67,524,953 | | |
| | | Health Care—5.6% | |
| | 129,805 | | | Cadila Healthcare, Ltd. | | | 2,090,722 | | |
| | 565,086 | | | Cipla, Ltd. | | | 3,833,095 | | |
| | 130,829 | | | Dr. Reddy's Laboratories, Ltd. | | | 4,254,589 | | |
| | 285,430 | | | Ranbaxy Laboratories, Ltd.(a) | | | 2,775,719 | | |
| | 600,577 | | | Sun Pharmaceutical Industries, Ltd. | | | 7,740,583 | | |
| | | | 20,694,708 | | |
| | | Industrials—4.4% | |
| | 146,416 | | | ABB, Ltd. | | | 2,008,131 | | |
| | 802,354 | | | Bharat Heavy Electricals, Ltd. | | | 3,331,423 | | |
| | 1,762,649 | | | Jaiprakash Associates, Ltd. | | | 2,831,213 | | |
| | 178,143 | | | Larsen & Toubro, Ltd. | | | 5,363,683 | | |
| | 237,697 | | | Seimens, Ltd. | | | 3,021,316 | | |
| | | | 16,555,766 | | |
| | | Information Technology—16.8% | |
| | 864,323 | | | Infosys, Ltd. | | | 37,849,256 | | |
| | 49,575 | | | Oracle Financial Sevices Software, Ltd.(a) | | | 2,666,896 | | |
| | 540,356 | | | Tata Consultancy Services, Ltd. | | | 13,210,823 | | |
| | 1,369,266 | | | Wipro, Ltd. | | | 8,873,071 | | |
| | | | 62,600,046 | | |
Number
of Shares | | | |
Value | |
| | | Common Stocks (Continued) | |
| | | India (Continued) | |
| | | Materials—8.4% | |
| | 648,779 | | | Ambuja Cements, Ltd. | | $ | 2,434,123 | | |
| | 35,297 | | | Asian Paints, Ltd. | | | 2,522,551 | | |
| | 3,246,506 | | | Hindustan Zinc, Ltd. | | | 8,095,954 | | |
| | 587,441 | | | Jindal Steel & Power, Ltd. | | | 4,212,945 | | |
| | 214,403 | | | JSW Steel, Ltd. | | | 2,919,121 | | |
| | 1,349,498 | | | NMDC, Ltd. | | | 4,420,743 | | |
| | 1,681,933 | | | Steel Authority of India, Ltd. | | | 2,499,384 | | |
| | 1,128,148 | | | Sterlite Industries India, Ltd. | | | 2,076,007 | | |
| | 288,257 | | | Tata Steel, Ltd. | | | 2,083,203 | | |
| | | | 31,264,031 | | |
| | | Telecommunication Services—3.3% | |
| | 2,069,815 | | | Bharti Airtel, Ltd. | | | 10,371,985 | | |
| | 1,906,355 | | | Reliance Communications, Ltd. | | | 1,902,930 | | |
| | | | 12,274,915 | | |
| | | Utilities—5.8% | |
| | 392,628 | | | GAIL India, Ltd. | | | 2,535,845 | | |
| | 3,500,610 | | | NTPC, Ltd. | | | 10,737,825 | | |
| | 1,528,239 | | | Power Grid Corp. of India, Ltd. | | | 3,233,913 | | |
| | 297,946 | | | Reliance Infrastructure, Ltd. | | | 2,572,822 | | |
| | 1,447,638 | | | Reliance Power, Ltd.(a) | | | 2,468,161 | | |
| | | | 21,548,566 | | |
| | | | | Total Common Stocks
(Cost $301,465,531) | | | 373,323,284 | | |
Principal | | | | | |
| | | Short-Term Instruments—0.5% | |
| | | Time Deposit—0.5% | |
$ | 1,818,574
| | | The Bank of New York
Mellon Corp.—Grand Cayman
0.03%, 11/01/12 (Cost $1,818,574) | | | 1,818,574 | | |
| | | | | Total Investments—101.0%
(Cost $303,284,105) | | | 375,141,858 | | |
| | | | | Liabilities, less cash and
other assets—(1.0)% | | | (3,744,293 | ) | |
| | | | | Net Assets—100.0% | | $ | 371,397,565 | | |
Footnotes to the Consolidated Schedule of Investments:
(a) Non-income producing security.
See Notes to Consolidated Financial Statements.
9
Consolidated Statement of Assets and Liabilities
PowerShares India Portfolio (PIN)
October 31, 2012
ASSETS: | |
Investments, at value | | $ | 375,141,858 | | |
Foreign currencies, at value | | | 3,645,882 | | |
Receivables: | |
Dividends | | | 158,541 | | |
Total Assets | | | 378,946,281 | | |
LIABILITIES: | |
Payables: | |
Shares repurchased | | | 7,221,994 | | |
Accrued unitary management fee | | | 264,009 | | |
Accrued tax expense | | | 62,713 | | |
Total Liabilities | | | 7,548,716 | | |
NET ASSETS | | $ | 371,397,565 | | |
NET ASSETS CONSIST OF: | |
Shares of beneficial interest | | $ | 422,098,426 | | |
| Accumulated net investment income (loss) | | | (390,854 | ) | |
| Undistributed net realized gain (loss) | | | (122,167,911 | ) | |
Net unrealized appreciation | | | 71,857,904 | | |
Net Assets | | $ | 371,397,565 | | |
Shares of beneficial interest outstanding (unlimited shares of $0.01 par value authorized) | | | 20,700,000 | | |
Net asset value | | $ | 17.94 | | |
Share price | | $ | 17.85 | | |
Investments, at cost | | $ | 303,284,105 | | |
Foreign currencies, at cost | | $ | 3,645,859 | | |
See Notes to Consolidated Financial Statements.
10
Consolidated Statement of Operations
PowerShares India Portfolio (PIN)
For the Year Ended October 31, 2012
INVESTMENT INCOME: | |
Dividend income | | $ | 5,772,313 | | |
Interest income | | | 742 | | |
Total Income | | | 5,773,055 | | |
EXPENSES: | |
Unitary management fee | | | 2,841,673 | | |
Tax expense | | | 103,719 | | |
Total Expenses | | | 2,945,392 | | |
Net Investment Income | | | 2,827,663 | | |
REALIZED AND UNREALIZED GAIN (LOSS) ON INVESTMENTS: | |
Net realized gain (loss) from: | |
Investment securities | | | (54,752,779 | ) | |
Foreign currencies | | | (1,726,901 | ) | |
Net realized gain (loss) | | | (56,479,680 | ) | |
Net change in unrealized appreciation (depreciation) from: | |
Investment securities | | | 8,382,710 | | |
Foreign currencies | | | (452 | ) | |
Net change in unrealized appreciation (depreciation) | | | 8,382,258 | | |
Net realized and unrealized gain (loss) | | | (48,097,422 | ) | |
Net increase (decrease) in net assets resulting from operations | | $ | (45,269,759 | ) | |
See Notes to Consolidated Financial Statements.
11
Consolidated Statement of Changes in Net Assets
PowerShares India Portfolio (PIN)
| | | For the Year Ended October 31 | |
| | | 2012 | | 2011 | |
OPERATIONS: | |
Net investments income | | $ | 2,827,663 | | | $ | 3,065,132 | | |
Net realized gain (loss) | | | (56,479,680 | ) | | | (35,469,777 | ) | |
Net change in unrealized appreciation (depreciation) | | | 8,382,258 | | | | (79,691,106 | ) | |
Net increase (decrease) in net assets resulting from operations | | | (45,269,759 | ) | | | (112,095,751 | ) | |
DISTRIBUTIONS TO SHAREHOLDERS FROM: | |
Net investment income | | | (2,668,366 | ) | | | (3,453,100 | ) | |
Return of capital | | | — | | | | (776,861 | ) | |
Total distributions to shareholders | | | (2,668,366 | ) | | | (4,229,961 | ) | |
SHAREHOLDER TRANSACTIONS: | |
Proceeds from shares sold | | | 356,708,668 | | | | 211,790,056 | | |
Value of shares repurchased | | | (340,855,319 | ) | | | (243,639,656 | ) | |
Transaction fees | | | 1,766,704 | | | | 1,737,244 | | |
Net increase (decrease) in net assets resulting from shares transactions | | | 17,620,053 | | | | (30,112,356 | ) | |
Increase (Decrease) in Net Assets | | | (30,318,072 | ) | | | (146,438,068 | ) | |
NET ASSETS: | |
Beginning of year | | | 401,715,637 | | | | 548,153,705 | | |
End of year | | $ | 371,397,565 | | | $ | 401,715,637 | | |
Accumulated net investment income (loss) at end of year | | $ | (390,854 | ) | | $ | (942,398 | ) | |
CHANGES IN SHARES OUTSTANDING: | |
Shares sold | | | 20,200,000 | | | | 9,800,000 | | |
Shares repurchased | | | (19,550,000 | ) | | | (11,400,000 | ) | |
Shares outstanding, beginning of year | | | 20,050,000 | | | | 21,650,000 | | |
Shares outstanding, end of year | | | 20,700,000 | | | | 20,050,000 | | |
See Notes to Consolidated Financial Statements.
12
PowerShares India Portfolio (PIN)
| | | For the Year Ended October 31, | | For the Period
March 4, 2008 (a)
through | |
| | | 2012 | | 2011 | | 2010 | | 2009 | | October 31, 2008 | |
PER SHARE OPERATING PERFORMANCE: | |
Net asset value at beginning period | | $ | 20.04 | | | $ | 25.32 | | | $ | 19.72 | | | $ | 12.18 | | | $ | 25.00 | | |
| Net investment income(b) | | | 0.14 | | | | 0.14 | | | | 0.13 | | | | 0.12 | | | | 0.12 | | |
| Net realized and unrealized gain (loss) | | | (2.20 | ) | | | (5.31 | ) | | | 5.51 | | | | 7.39 | | | | (13.01 | ) | |
Total from investment operations | | | (2.06 | ) | | | (5.17 | ) | | | 5.64 | | | | 7.51 | | | | (12.89 | ) | |
Distributions to shareholders from: | |
Net investment income | | | (0.13 | ) | | | (0.15 | ) | | | (0.12 | ) | | | (0.07 | ) | | | (0.09 | ) | |
Return of capital | | | — | | | | (0.04 | ) | | | — | | | | — | | | | 0.00 | (c) | |
Total distributions | | | (0.13 | ) | | | (0.19 | ) | | | (0.12 | ) | | | (0.07 | ) | | | (0.09 | ) | |
Transaction fees(b) | | | 0.09 | | | | 0.08 | | | | 0.08 | | | | 0.10 | | | | 0.16 | | |
Net asset value at end of period | | $ | 17.94 | | | $ | 20.04 | | | $ | 25.32 | | | $ | 19.72 | | | $ | 12.18 | | |
Share price at end of period(d) | | | 17.85 | | | $ | 19.86 | | | $ | 25.40 | | | $ | 19.31 | | | $ | 12.24 | | |
| NET ASSET VALUE, TOTAL RETURN(e) | | | (9.84 | )% | | | (20.24 | )% | | | 29.09 | % | | | 62.56 | % | | | (51.04 | )% | |
| SHARE PRICE, TOTAL RETURN(e) | | | (9.39 | )% | | | (21.21 | )% | | | 32.25 | % | | | 58.40 | % | | | (50.81 | )% | |
RATIOS/SUPPLEMENTAL DATA: | |
Net assets at end of period (000's omitted) | | $ | 371,398 | | | $ | 401,716 | | | $ | 548,154 | | | $ | 257,327 | | | $ | 48,765 | | |
Ratio to average net assets of: | |
Expenses | | | 0.81 | % | | | 0.79 | % | | | 0.78 | % | | | 0.78 | % | | | 0.78 | %(f) | |
Net investment income | | | 0.78 | % | | | 0.62 | % | | | 0.60 | % | | | 0.69 | % | | | 0.98 | %(f) | |
Portfolio turnover rate(g) | | | 134 | % | | | 82 | % | | | 40 | % | | | 32 | % | | | 22 | % | |
(a) Commencement of investment operations.
(b) Based on average shares outstanding.
(c) Amount represents less than $0.005.
(d) The mean between the last bid and ask prices.
(e) Net asset value total return is calculated assuming an initial investment made at the net asset value at the beginning of the period, reinvestment of all dividends and distributions at net asset value during the period, and redemption on the last day of the period. Share price total return is calculated assuming an initial investment made at the share price at the beginning of the period, reinvestment of all dividends and distributions at share price during the period and sale at the share price on the last day of the period. Total investment return calculated for a period of less than one year is not annualized. The net asset value total return from Fund inception on March 5, 2008 (first day of exchange trading) to October 31, 2008 was (51.02)%. The share price total return from Fund inception to October 31, 2008 was (51.87)%.
(f) Annualized.
(g) Portfolio turnover rate is not annualized for periods less than one year and does not include securities received or delivered from processing creations or redemptions.
See Notes to Consolidated Financial Statements.
13
Notes to Consolidated Financial Statements
PowerShares India Exchange-Traded Fund Trust
October 31, 2012
Note 1. Organization
PowerShares India Exchange-Traded Fund Trust (the "Trust") was organized as a Massachusetts business trust on August 3, 2007 and is authorized to have multiple series of portfolios. The Trust is an open-end management investment company registered under the Investment Company Act of 1940, as amended (the "1940 Act"). The Trust currently consists of one portfolio, the PowerShares India Portfolio (PIN), an exchange-traded index fund (the "Portfolio"). The Portfolio carries out its investment strategy by investing substantially all of its assets in PowerShares Mauritius, a wholly-owned subsidiary organized in Mauritius (the "Subsidiary"). The Subsidiary invests at least 90% of its total assets in securities that comprise the Indus India Index (or "Underlying Index"), American depositary receipts ("ADRs") and global depositary receipts ("GDRs") based on securities in the Underlying Index. Invesco PowerShares Capital Management LLC (the "Adviser") serves as the investment adviser to both the Portfolio and the Subsidiary (collectively the "Fund"). Through such investment structure, the Fund expects to obtain benefits from a tax treaty between Mauritius and India. To obtain benefits under the treaty, the Subsidiary must meet certain tests and conditions, including the establishment of Mauritius tax residence.
The Portfolio's shares ("Shares") are listed on NYSE Arca, Inc. The market price of the Fund's shares may differ to some degree from the Fund's net asset value ("NAV"). Unlike conventional mutual funds, the Fund issues and redeems Shares on a continuous basis, at NAV, only in a large specified number of Shares, each called a "Creation Unit." Creation Units are issued and redeemed generally for cash. Except when aggregated in Creation Units by Authorized Participants, Shares are not individually redeemable securities of the Fund.
The investment objective of the Fund is to seek investment results that generally correspond (before fees and expenses) to the price and yield of the Underlying Index.
Note 2. Significant Accounting Policies
The financial statements are prepared on a consolidated basis in conformity with Generally Accepted Accounting Principles ("GAAP") in the United States of America, which requires management to make estimates and assumptions that affect the reported amounts and disclosures in the financial statements, including estimates and assumptions related to taxation. Actual results could differ from those estimates. In addition, the Fund monitors for material events or transactions that may occur or become known after the period end date and before the date the financial statements are released to print. All inter-company accounts and transactions have been eliminated in consolidation. The following is a summary of the significant accounting policies followed by the Fund in preparation of its consolidated financial statements.
A. Security Valuations
Securities, including restricted securities, are valued according to the following policies.
A security listed or traded on an exchange (except convertible bonds) is valued at its last sales price or official closing price as of the close of the customary trading session on the exchange where the security is principally traded, or lacking any sales or official closing price on a particular day, the security may be valued at the closing bid price on that day. Securities traded in the over-the-counter market are valued based on prices furnished by independent pricing services or market makers. Listed options, if no closing price is available, are valued at the mean between the last bid and ask prices from the exchange on which
14
Notes to Consolidated Financial Statements (Continued)
PowerShares India Exchange-Traded Fund Trust
October 31, 2012
they are principally traded. Options not listed on an exchange are valued by an independent source at the mean between the last bid and ask prices.
Investments in open-end registered investment companies not traded on an exchange are valued at the end-of-day NAV per share.
Debt obligations (including convertible bonds) and unlisted equities are fair valued using an evaluated quote provided by an independent pricing service. Evaluated quotes provided by the pricing service may be determined without exclusive reliance on quoted prices, and may reflect appropriate factors such as institution-size trading in similar groups of securities, developments related to specific securities, dividend rate (for unlisted equities), yield (for debt obligations), quality, type of issue, coupon rate, maturity, individual trading characteristics and other market data. Debt obligations are subject to interest rate and credit risks. In addition, all debt obligations involve some risk of default with respect to interest and/or principal payments.
Foreign securities' (including foreign exchange contracts) prices are converted into U.S. dollar amounts using the applicable exchange rates as of the close of the London world markets. If market quotations are available and reliable for foreign exchange-traded equity securities, the securities will be valued at the market quotations. Because trading hours for certain foreign securities end before the close of the New York Stock Exchange ("NYSE"), closing market quotations may become unreliable. If between the time trading ends on a particular security and the close of the customary trading session on the NYSE, events occur that the Adviser determines are significant and make the closing price unreliable, the Fund may fair value the security. If the event is likely to have affected the closing price of the security, the security will be valued at fair value in good faith using procedures approved by the Board of Trustees. Adjustments to closing prices to reflect fair value may also be based on a screening process of an independent pricing service to indicate the degree of certainty, based on historical data, that the closing price in the principal market where a foreign security trades is not the current value as of the close of the NYSE. Foreign securities' prices meeting the approved degree of certainty that the price is not reflective of current value will be priced at the indication of fair value from the independent pricing service. Multiple factors may be considered by the independent pricing service in determining adjustments to reflect fair value and may include information relating to sector indices, ADRs and domestic and foreign index futures. Foreign securities may have additional risks including exchange rate changes, potential for sharply devalued currencies and high inflation, political and economical upheaval, the relative lack of issuer information, relatively low market liquidity and the potential lack of strict financial and accounting controls and standards.
Securities for which market prices are not provided by any of the above methods may be valued based upon quotes furnished by independent sources.
Securities for which market quotations are not readily available or became unreliable are valued at fair value as determined in good faith following procedures approved by the Board of Trustees. Issuer specific events, market trends, bid/ask quotes of brokers and information providers and other market data may be reviewed in the course of making a good faith determination of a security's fair value.
Valuations change in response to many factors, including the historical and prospective earnings of the issuer, the value of the issuer's assets, general economic conditions, interest rates, investor perceptions and
15
Notes to Consolidated Financial Statements (Continued)
PowerShares India Exchange-Traded Fund Trust
October 31, 2012
market liquidity. Because of the inherent uncertainties of valuation, the values reflected in the consolidated financial statements may materially differ from the value received upon actual sale of those investments.
B. Other Risks
Non-Diversified Fund Risk. Because the Fund is non-diversified and can invest, through the Subsidiary, a greater portion of its assets in securities of individual issuers than can a diversified fund, changes in the market value of a single investment could cause greater fluctuations in Share price than would occur in a diversified fund. This may increase the Fund's volatility and cause the performance of a relatively small number of issuers to have a greater impact on the Fund's performance.
Equity Risk. Equity risk is the risk that the value of the securities the Subsidiary holds will fall due to general market and economic conditions, perceptions regarding the industries in which the issuers of securities the Subsidiary holds participate or factors relating to specific companies in which the Subsidiary invests. For example, an adverse event, such as an unfavorable earnings report, may depress the value of securities the Subsidiary holds; the price of securities may be particularly sensitive to general movements in the stock market; or a drop in the stock market may depress the price of most or all of the securities the Subsidiary holds. In addition, securities in the Subsidiary's portfolio may decline in price if the issuer fails to make anticipated dividend payments because, among other reasons, the issuer of the security experiences a decline in its financial condition.
Currency Risk. The Fund, through the Subsidiary, invests in Indian rupee denominated equity securities of Indian issuers. Because the Fund's NAV is determined in U.S. dollars, the Fund's NAV could decline if the rupee depreciates against the U.S. dollar, even if the value of the Subdidiary's holdings, measured in rupees, increases.
Indian Securities Risk. Investment in Indian securities involves risks in addition to those associated with investments in securities of issuers in more developed countries, which may adversely affect the value of the Fund's assets. Such heightened risks include, among others, political and legal uncertainty, greater government control over the economy, currency fluctuations or blockage and the risk of nationalization or expropriation of assets. In addition, religious and border disputes persist in India. Certain restrictions on foreign investment may decrease the liquidity of the Fund's portfolio or inhibit the Fund's ability to track the Underlying Index. The Fund's investment in securities of issuers located or operating in India as well as its ability to track the Underlying Index may be limited or prevented at times, due to the limits on foreign ownership imposed by the Reserve Bank of India.
Regulatory Risk. The Adviser is a qualified foreign institutional investor ("FII") with the Securities and Exchange Board of India ("SEBI"), and the Subsidiary is registered as a sub-account with the SEBI in order to obtain certain benefits relating to the Fund's ability to make and dispose of investments. There can be no assurances that the Indian regulatory authorities will continue to grant such qualifications, and the loss of such qualifications could adversely impact the ability of the Fund to make investments in India.
The Subsidiary's investments will be made in accordance with investment restrictions prescribed under the FII regulation. If new policy announcements or regulations in India are made which require retrospective changes in the structure or operations of the Fund, these may adversely impact the performance of the Fund.
16
Notes to Consolidated Financial Statements (Continued)
PowerShares India Exchange-Traded Fund Trust
October 31, 2012
C. Foreign Currency
Investment securities and other assets and liabilities denominated in foreign currencies are translated into U.S. dollar amounts based upon the prevailing exchange rates as of the close of the London world markets on the date of valuation. Purchases and sales of investment securities and income and expense items denominated in foreign currencies are translated into U.S. dollar amounts based upon prevailing exchange rates on the respective dates of such transactions. Unrealized gains and losses on investments which result from changes in foreign currency exchange rates have been included in the unrealized appreciation (depreciation) of investments. Net realized foreign currency gains and losses resulting from changes in exchange rates include foreign currency gains and losses between trade date and settlement date of investment securities transactions, foreign currency transactions and the difference between the amounts of interest and dividends recorded on the books of the Fund and the amount actually received. The portion of foreign currency gains and losses related to fluctuation in exchange rates between the initial purchase trade date and subsequent sale date are not segregated in the Consolidated Statement of Operations from the effects of changes in market prices of those securities but are included in realized gains and losses on investment securities sold.
D. Federal Income Taxes
The Fund intends to continue to comply with the provisions of the Internal Revenue Code of 1986, as amended (the "Internal Revenue Code") applicable to regulated investment companies and to distribute substantially all of the Fund's taxable earnings to its shareholders. As such, the Fund will not be subject to federal income taxes on otherwise taxable income (including net realized gains) that is distributed to the shareholders. Therefore, no provision for federal income taxes is recorded in the financial statements.
Income and capital gain distributions are determined in accordance with federal income tax regulations, which may differ from GAAP. These differences are primarily due to differing book and tax treatments for in-kind transactions, losses deferred due to wash sales and passive foreign investment company adjustments, if any.
The Fund files U.S federal tax returns and tax returns in certain other jurisdictions. Generally, the Fund is subject to examinations by such taxing authorities for up to three years after the filing of the return for the tax period.
The Subsidiary shall endeavor: (i) comply with the requirements of the tax treaty; (ii) be a tax resident of Mauritius; and (iii) maintain its central management and control in Mauritius, and therefore the Fund's management believes that the subsidiary shall be eligible to obtain the benefits of the treaty. As a result, after considering the benefit of the tax treaty, with respect to Indian taxes, the Fund is not expected to be subject to capital gains tax in India on the sale of Indian securities but is expected to be subject to Indian withholding tax on interest earned on Indian debt securities at rates that may vary from 10% to 42%, depending on the nature of the underlying debt security. Dividends from Indian companies are paid to the Fund free of Indian tax. With respect to Mauritian taxes, the Fund is expected to be subject to an effective rate of tax of 3% of its net dividend and interest income and is not expected to be subject to taxes on capital gains. This amount is included in Tax Expense of the Consolidated Statement of Operations. There is no assurance that the terms of the treaty will not be subject to re-negotiation or a different interpretation of the treaty in the future or that the Subsidiary will continue to be deemed a tax resident by Mauritius, allowing favorable tax treatment. Any change in the provisions of this treaty or in its
17
Notes to Consolidated Financial Statements (Continued)
PowerShares India Exchange-Traded Fund Trust
October 31, 2012
applicability to the Subsidiary could result in the imposition of withholding and other taxes on the Subsidiary by India, which would reduce the return to the Fund on its investment.
On May 28, 2012, the Government of India enacted certain legislative amendments to its existing income tax laws effective April 1, 2012. The implementation of a general anti-avoidance rule, which empowers the Indian Revenue Authorities to disregard structures that lack commercial substance, has been deferred until the tax year 2013-2014. These new rules, if applied by the Indian Revenue Authorities to the Fund, could affect benefits received under the treaty. Additionally, the rule includes provisions that impose Indian tax on certain transfers of shares of an Indian company. However, until more definitive guidance on the legislative changes is available, the impact to the Fund, if any, cannot be determined at this time.
E. Investment Income and Investment Transactions
Dividend income is recorded on the ex-dividend date net of foreign taxes withheld, if any. Interest income is recorded on the accrual basis. Investment transactions are recorded on the trade date. Realized gains and losses from the sale or disposition of securities are computed on the specified identified cost basis. Corporate actions (including cash dividends) are recorded net of non-reclaimable foreign tax withholdings on the ex-dividend date.
F. Expenses
The Fund has agreed to pay the Adviser an annual unitary management fee. The Adviser has agreed to pay for substantially all expenses of the Fund, including the cost of transfer agency, custody, fund administration, legal, audit and other services, except for distribution fees, if any, brokerage expenses, taxes, interest and other extraordinary expenses.
G. Dividends and Distributions to Shareholders
The Fund declares and pays dividends from net investment income, if any, to its shareholders quarterly and records on ex-dividend date. The Fund distributes net realized taxable capital gains, if any, generally annually in cash and records on ex-dividend date. Such distributions on a tax basis are determined in conformity with federal income tax regulations, which may differ from GAAP. Distributions in excess of tax basis earnings and profits, if any, are reported in the Fund's consolidated financial statements as return of capital.
Note 3. Investment Advisory Agreement and Other Agreements
The Trust has entered into an Investment Advisory Agreement with the Adviser, pursuant to which the Adviser has overall responsibility for the selection and ongoing monitoring of the Fund's investments, managing the Fund's business affairs and providing certain clerical, bookkeeping and other administrative services.
The Fund has agreed to pay the Adviser an annual unitary management fee equal to 0.78% of its average daily net assets, and the Adviser has agreed to pay for substantially all expenses of the Fund, including the cost of transfer agency, custody, fund administration, legal, audit and other services, except for distribution fees, if any, brokerage expenses, taxes, interest and other extraordinary expenses.
The Trust has entered into a Distribution Agreement with Invesco Distributors, Inc. (the "Distributor"), which serves as the distributor of Creation Units of the Fund on an agency basis. The Distributor does not maintain a secondary market in Shares. The Fund is not charged any fees pursuant to the Distribution Agreement. The Distributor is an affiliate of the Adviser.
18
Notes to Consolidated Financial Statements (Continued)
PowerShares India Exchange-Traded Fund Trust
October 31, 2012
The Adviser has entered into a licensing agreement for the Fund with Indus Advisors LLC (the "Licensor"). The Underlying Index name trademark is owned by the Licensor. The trademark has been licensed to the Adviser for use with the Fund. The Fund is entitled to use the Underlying Index pursuant to the Trust's sub-licensing agreement with the Adviser. The Fund is not sponsored, endorsed, sold or promoted by the Licensor and the Licensor makes no representation regarding the advisability of investing in the Fund. The Fund is not a party to the licensing agreement.
The Trust has entered into service agreements whereby Brown Brothers Harriman & Co. serves as administrator, custodian, fund accounting and transfer agent for the Fund.
Note 4. Additional Valuation Information
GAAP defines fair value as the price that would be received to sell an asset or paid to transfer a liability in an orderly transaction between market participants at the measurement date, under current market conditions. GAAP establishes a hierarchy that prioritizes the inputs to valuation methods giving the highest priority to readily available unadjusted quoted prices in an active market for identical assets (Level 1) and the lowest priority to significant unobservable inputs (Level 3) generally when the market prices are not readily available or are unreliable. Based on the valuation inputs, the securities or other investments are tiered into one of three levels. Changes in valuation methods may result in transfers in or out of an investment's assigned level:
Level 1 – Prices are determined using quoted prices in an active market for identical assets.
Level 2 – Prices are determined using other significant observable inputs. Observable inputs are inputs that other market participants may use in pricing a security. These may include quoted prices for similar securities, interest rates, prepayment speeds, credit risk, yield curves, loss severities, default rates, discount rates, volatilities and others.
Level 3 – Prices are determined using significant unobservable inputs. In situations where quoted prices or observable inputs are unavailable (for example, when there is little or no market activity for an investment at the end of the period), unobservable inputs may be used. Unobservable inputs reflect the Fund's own assumptions about the factors market participants would use in determining fair value of the securities or instruments and would be based on the best available information.
The following is a summary of the tiered valuation input levels, as of October 31, 2012. The level assigned to the securities valuations may not be an indication of risk of liquidity associated with investing in those
19
Notes to Consolidated Financial Statements (Continued)
PowerShares India Exchange-Traded Fund Trust
October 31, 2012
securities. Because of the inherent uncertainties of valuation, the values reflected in the financial statements may materially differ from the value received upon actual sale of those investments.
During the year ended October 31, 2012, there were transfers from Level 1 to Level 2 of $375,141,858, primarily due to foreign fair value triggers.
Category | | Level 1 | | Level 2 | | Level 3 | | Total | |
Common Stock: | |
Consumer Discretionary | | $ | — | | | $ | 15,868,080 | | | $ | — | | | $ | 15,868,080 | | |
Consumer Staples | | | — | | | | 32,200,447 | | | | — | | | | 32,200,447 | | |
Energy | | | — | | | | 92,791,772 | | | | — | | | | 92,791,772 | | |
Financial Services | | | — | | | | 67,524,953 | | | | — | | | | 67,524,953 | | |
Health Care | | | — | | | | 20,694,708 | | | | — | | | | 20,694,708 | | |
Industrials | | | — | | | | 16,555,766 | | | | — | | | | 16,555,766 | | |
Information Technology | | | — | | | | 62,600,046 | | | | — | | | | 62,600,046 | | |
Materials | | | — | | | | 31,264,031 | | | | — | | | | 31,264,031 | | |
Telecommunication Services | | | — | | | | 12,274,915 | | | | — | | | | 12,274,915 | | |
Utilities | | | — | | | | 21,548,566 | | | | — | | | | 21,548,566 | | |
Time Deposit | | | — | | | | 1,818,574 | | | | — | | | | 1,818,574 | | |
Total Investments | | $ | — | | | $ | 375,141,858 | | | $ | — | | | $ | 375,141,858 | | |
Note 5. Distributions to Shareholders and Tax Components of Net Assets
Tax Character of Distributions to Shareholders Paid During the Years Ended October 31, 2012 and 2011:
| | 2012 | | 2011 | |
| Ordinary income | | $ | 2,668,366 | | | $ | 3,453,100 | | |
| Return of Capital | | | — | | | | 776,861 | | |
| Total distributions | | $ | 2,668,366 | | | $ | 4,229,961 | | |
Tax Components of Net Assets at Period-End:
| | 2012 | |
Undistributed ordinary income | | $ | 1,167,146 | | |
Net unrealized appreciation — investments | | | (13,648,352 | ) | |
Capital loss carryforward | | | (38,219,655 | ) | |
Shares of beneficial interest | | | 422,098,426 | | |
Total net assets | | $ | 371,397,565 | | |
The difference between book-basis and tax-basis unrealized appreciation (depreciation) is due to differences in the timing of recognition of gains and losses on investments for tax and book purposes. The Fund's net unrealized appreciation (depreciation) difference is attributable primarily to wash sales.
Capital loss carryforward is calculated and reported as of a specific date. Results of transactions and other activity after that date may affect the amount of capital loss carryforward actually available for the Fund to utilize. The Regulated Investment Company Modernization Act of 2010 (the "Act") eliminated the
20
Notes to Consolidated Financial Statements (Continued)
PowerShares India Exchange-Traded Fund Trust
October 31, 2012
eight-year carryover period for capital losses that arise in taxable years beginning after its enactment date of December 22, 2010. Consequently, these capital losses can be carried forward for an unlimited period. However, capital losses with an expiration period may not be used to offset capital gains until all net capital losses without an expiration date have been utilized. Additionally, post-enactment capital loss carryovers will retain their character as either short-term or long-term capital losses instead of as short-term capital losses as under prior law. The ability to utilize capital loss carryforward in the future may be limited under the Internal Revenue Code and related regulations based on the results of future transactions.
The Fund has a capital loss carryforward as of October 31, 2012, which expires as follows:
| | Capital Loss Carryforward | |
Expiration | | Short-Term | | Long-Term | | Total | |
October 31, 2016 | | $ | 477,398 | | | | | | | $ | 477,398 | | |
October 31, 2017 | | | 2,620,805 | | | | | | | | 2,620,805 | | |
October 31, 2018 | | | 2,587,911 | | | | | | | | 2,587,911 | | |
October 31, 2019 | | | 15,322,005 | | | | | | | | 15,322,005 | | |
Not subject to expiration | | | 10,239,789 | | | | 6,971,747 | | | | 17,211,536 | | |
Total capital loss carryforward | | $ | 31,247,908 | | | $ | 6,971,747 | | | $ | 38,219,655 | | |
* Capital loss carryforward as of the date listed above is reduced for limitations, if any, to the extent required by the Internal Revenue Code.
Note 6. Reclassification of Permanent Differences
Primarily as a result of differing book/tax treatment of investment activity, on October 31, 2012, undistributed net investment income (loss) was increased by $392,247, undistributed net realized gain (loss) was decreased by $392,246 and shares of beneficial interest was decreased by $1. These reclassifications had no effect on the net assets of the Fund.
Note 7. Investment Transactions
For the fiscal year ended October 31, 2012, the cost of securities purchased and proceeds from sales of securities, excluding short-term securities, were $512,894,672 and $492,965,853, respectively.
At October 31, 2012, the aggregate cost and the net unrealized appreciation (depreciation) of investments for tax purposes were as follows:
| Cost | | Net Unrealized
Appreciation
(Depreciation) | | Gross Unrealized
Appreciation | | Gross Unrealized
(Depreciation) | |
| $ | 388,820,361 | | | $ | (13,678,503 | ) | | $ | 83,866,024 | | | $ | (97,544,527 | ) | |
Note 8. Trustees' Fees
The Fund compensates each Trustee who is not an "interested person" as defined in the 1940 Act (an "Independent Trustee"). The Adviser, as a result of the unitary management fee, pays for such compensation. Each Trustee who is an "interested person" (the "Non-Independent Trustee") of the Trust does not receive any Trustees' fees.
21
Notes to Consolidated Financial Statements (Continued)
PowerShares India Exchange-Traded Fund Trust
October 31, 2012
The Trust has adopted a deferred compensation plan (the "Plan"). Under the Plan, an Independent Trustee who has executed a Deferred Fee Agreement (a "Participating Trustee") may defer receipt of all or a portion of his compensation ("Deferral Fees"). Such Deferral Fees are deemed to be invested in select PowerShares Funds. The Deferral Fees payable to the Participating Trustee are valued as of the date such Fees would have been paid to the Participating Trustee. The value increases with contributions or with increases in the value of the Shares selected, and the value decreases with distributions or with declines in the value of the Shares selected.
Note 9. Capital
Shares are created and redeemed by the Trust only in Creation Units of 50,000 shares. Only Authorized Participants are permitted to purchase or redeem Creation Units from the Fund. Such transactions are generally for cash only. If an in-kind transaction is permitted, there will be a balancing cash component to equate the transaction to the NAV per Share of the Fund on the transaction date. Cash may be substituted equivalent to the value of certain securities, generally when they are not available in sufficient quantity for delivery, not eligible for trading by the Authorized Participant or as a result of other market circumstances. Transactions in the Fund's shares is disclosed in detail on the Statement of Changes in Net Assets.
The Fund charges fixed and variable transaction fees for creations and redemptions which are treated as increases in capital.
Note 10. Indemnifications
Under the Trust's organizational documents, its officers and Trustees are indemnified against certain liabilities arising out of the performance of their duties to the Fund. Each Independent Trustee is also indemnified against certain liabilities arising out of the performance of his duties to the Trust pursuant to an Indemnification Agreement between the Independent Trustee and the Trust. Additionally, in the normal course of business, the Trust enters into contracts with service providers that contain general indemnification clauses. The Trust's maximum exposure under these agreements is unknown, as this would involve, future claims that may be made against the Trust that have not yet occurred. However, based on experience, the Trust believes the risk of loss to be remote.
22
Report of Independent Registered Public Accounting Firm
To the Board of Trustees and Shareholders of PowerShares India Exchange-Traded Fund Trust:
In our opinion, the accompanying statement of assets and liabilities, including the schedule of investments, and the related statements of operations and of changes in net assets and the financial highlights present fairly, in all material respects, the financial position of PowerShares India Portfolio (a portfolio of PowerShares India Exchange-Traded Fund Trust), and its subsidiary (the "Fund") at October 31, 2012, the results of its operations for the year then ended, the changes in its net assets for each of the two years in the period then ended and the financial highlights of the periods presented, in conformity with accounting principles generally accepted in the United States of America. These financial statements and financial highlights (hereafter referred to as "financial statements") are the responsibility of the Fund's management; our responsibility is to express an opinion on these financial statements based on our audits. We conducted our audits of these financial statements in accordance with the standards of the Public Company Accounting Oversight Board (United States). Those standards require that we plan and perform the audit to obtain reasonable assurance about whether the financial statements are free of material misstatement. An audit includes examining, on a test basis, evidence supporting the amounts and disclosures in the financial statements, assessing the accounting principles used and significant estimates made by management, and evaluating the overall financial statement presentation. We believe that our audits, which included confirmation of securities at October 31, 2012 by correspondence with the custodian and brokers, provide a reasonable basis for our opinion.
/s/ PricewaterhouseCoopers LLP
Chicago, IL
December 21, 2012
23
Form 1099-DIV, Form 1042-S and other year-end tax information provide shareholders with actual calendar year amounts that should be included in their tax returns. Shareholders should consult their tax advisors.
The following distribution information is being provided as required by the Internal Revenue Code or to meet a specific state's requirement.
Each Fund designates the following amounts or, if subsequently determined to be different, the maximum amount allowable for its fiscal year ended October 31, 2012:
| | Qualified Dividend
Income* | | Corporate
Dividends-Received
Deduction* | |
PowerShares India Exchange-Traded Fund Trust | | | 100.00 | % | | | 0.00 | % | |
The Funds intend to elect to pass through to shareholders the credit for taxes paid to foreign countries. The gross foreign source income and foreign taxes paid are as follows:
| | Gross Foreign
Income | | Foreign Taxes
Paid | |
PowerShares India Exchange-Traded Fund Trust | | $ | 5,772,313 | | | $ | 103,719 | | |
* The above percentages are based on ordinary income dividends paid to shareholders during the Fund's fiscal year.
24
The Independent Trustees, Non-Independent Trustees and the executive officers of the Trust, their term of office and length of time served, their principal business occupations during the past five years, the number of portfolios in the Fund Complex overseen by each Trustee and the other directorships, if any, held by a Trustee are shown below.
The Trustees and Officers information is current as of October 31, 2012.
Name, Address and Age of
Independent Trustees | | Position(s)
Held
with Trust | | Term of
Office
and
Length of
Time
Served* | | Principal
Occupation(s) During
Past 5 Years | | Number of
Portfolios
in Fund
Complex**
Overseen
by
Independent
Trustees | | Other Directorships
Held by Independent
Trustees During
the Past 5 Years | |
Ronn R. Bagge
(54)
c/o Invesco PowerShares
Capital Management LLC
301 West Roosevelt Road
Wheaton, IL 60187 | | Trustee | | Since 2008 | | Founder and Principal, YQA Capital Management LLC (1998-Present); formerly Owner/CEO of Electronic Dynamic Balancing Co., Inc. (high-speed rotating equipment service provider). | | | 122 | | | | None | | |
* This is the date the Independent Trustee began serving the Trust. Each Trustee serves an indefinite term, until his successor is elected.
** Fund Complex includes all open-end funds (including all of their portfolios) advised by the Adviser. At October 31, 2012, the Fund Complex consisted of the Trust's one portfolio and three other exchange-traded fund trusts with 121 portfolios advised by the Adviser.
25
Trustees and Officers (Continued)
Name, Address and Age of
Independent Trustees | | Position(s)
Held
with Trust | | Term of
Office
and
Length of
Time
Served* | | Principal
Occupation(s) During
Past 5 Years | | Number of
Portfolios
in Fund
Complex**
Overseen
by
Independent
Trustees | | Other Directorships
Held by Independent
Trustees During
the Past 5 Years | |
Todd J. Barre
(54)
c/o Invesco PowerShares Capital Management LLC
301 West Roosevelt Road
Wheaton, IL 60187 | | Trustee | | Since 2010 | | Assistant Professor of Business, Trinity Christian College (2010-Present); formerly Vice President and Senior Investment Strategist (2001-2008), Director of Open Architecture and Trading (2007-2008), Head of Fundamental Research (2004-2007), and Vice President and Senior Fixed Income Strategist (1994-2001), BMO Financial Group/Harris Private Bank. | | | 122 | | | | None | | |
* This is the date the Independent Trustee began serving the Trust. Each Trustee serves an indefinite term, until his successor is elected.
** Fund Complex includes all open-end funds (including all of their portfolios) advised by the Adviser. At October 31, 2012, the Fund Complex consisted of the Trust's one portfolio and three other exchange-traded fund trusts with 121 portfolios advised by the Adviser.
26
Trustees and Officers (Continued)
Name, Address and Age of
Independent Trustees | | Position(s)
Held
with Trust | | Term of
Office
and
Length of
Time
Served* | | Principal
Occupation(s) During
Past 5 Years | | Number of
Portfolios
in Fund
Complex**
Overseen
by
Independent
Trustees | | Other Directorships
Held by Independent
Trustees During
the Past 5 Years | |
Marc M. Kole
(52)
c/o Invesco PowerShares Capital Management LLC
301 West Roosevelt Road
Wheaton, IL 60187 | | Trustee | | Since 2008 | | Chief Financial Officer, Hope Network (social services) (2008-2012); formerly Assistant Vice President and Controller, Priority Health (health insurance) (2005-2008); Senior Vice President of Finance, United Healthcare (2004-2005); Senior Vice President of Finance, Oxford Health Plans (2000-2004). | | | 122 | | | | None | | |
Philip M. Nussbaum
(50)
c/o Invesco PowerShares Capital Management LLC
301 West Roosevelt Road
Wheaton, IL 60187 | | Trustee | | Since 2008 | | Chairman, Performance Trust Capital Partners (2004-Present). | | | 122 | | | | None | | |
* This is the date the Independent Trustee began serving the Trust. Each Trustee serves an indefinite term, until his successor is elected.
** Fund Complex includes all open-end funds (including all of their portfolios) advised by the Adviser. At October 31, 2012, the Fund Complex consisted of the Trust's one portfolio and three other exchange-traded fund trusts with 121 portfolios advised by the Adviser.
27
Trustees and Officers (Continued)
Name, Address and Age of
Independent Trustees | | Position(s)
Held
with Trust | | Term of
Office
and
Length of
Time
Served* | | Principal
Occupation(s) During
Past 5 Years | | Number of
Portfolios
in Fund
Complex**
Overseen
by
Independent
Trustees | | Other Directorships
Held by Independent
Trustees During
the Past 5 Years | |
Donald H. Wilson
(52)
c/o Invesco PowerShares Capital Management LLC
301 West Roosevelt Road
Wheaton, IL 60187 | | Trustee | | Trustee since 2008; Chairman of the Board since 2012 | | Chairman and Chief Executive Officer, Stone Pillar Advisors, Ltd. (2010-Present); formerly President and Chief Operating Officer, AMCORE Financial, Inc. (bank holding company) (2007-2009); Executive Vice President and Chief Financial Officer, AMCORE Financial, Inc. (2006-2007); Senior Vice President and Treasurer, Marshall & Ilsley Corp. (bank holding company) (1995-2006). | | | 122 | | | | None | | |
* This is the date the Independent Trustee began serving the Trust. Each Trustee serves an indefinite term, until his successor is elected.
** Fund Complex includes all open-end funds (including all of their portfolios) advised by the Adviser. At October 31, 2012, the Fund Complex consisted of the Trust's one portfolio and three other exchange-traded fund trusts with 121 portfolios advised by the Adviser.
28
Trustees and Officers (Continued)
The Non-Independent Trustees and the executive officers of the Trust, their term of office and length of time served, their principal business occupations during the past five years, the number of portfolios in the Fund Complex overseen by the Non-Independent Trustees and the other directorships, if any, held by the Trustees are shown below.
Name, Address and Age of
Non-Independent Trustees | | Position(s)
Held
with Trust | | Term of
Office
and
Length of
Time
Served* | | Principal
Occupation(s) During
Past 5 Years | | Number of
Portfolios
in Fund
Complex**
Overseen
by
Non-
Independent
Trustees | | Other Directorships
Held by Non-Independent
Trustees During
the Past 5 Years | |
H. Bruce Bond
(49)
Invesco PowerShares Capital Management LLC
301 West Roosevelt Road
Wheaton, IL 60187 | | Trustee | | Since 2007 | | Chairman, Invesco PowerShares Capital Management LLC (2009-Present); formerly Managing Director, Invesco PowerShares Capital Management LLC (2002-2009); Manager, Nuveen Investments (1998-2002). | | | 122 | | | | None | | |
* This is the date the Non-Independent Trustee began serving the Trust. Each Trustee serves an indefinite term, until his successor is elected.
** Fund Complex includes all open-end funds (including all of their portfolios) advised by the Adviser. At October 31, 2012, the Fund Complex consisted of the Trust's one portfolio and three other exchange-traded fund trusts with 121 portfolios advised by the Adviser.
29
Trustees and Officers (Continued)
Name, Address and Age of
Non-Independent Trustees | | Position(s)
Held
with Trust | | Term of
Office
and
Length of
Time
Served* | | Principal
Occupation(s) During
Past 5 Years | | Number of
Portfolios
in Fund
Complex**
Overseen
by
Non-
Independent
Trustees | | Other Directorships
Held by Non-Independent
Trustees During
the Past 5 Years | |
Kevin M. Carome
(56)
Invesco Ltd.
Two Peachtree Pointe
1555 Peachtree St., N.E.
Suite 1800
Atlanta, GA 30309 | | Trustee | | Since 2010 | | Senior Managing Director and General Counsel, Invesco Ltd. (2006-Present); formerly Senior Vice President and General Counsel, Invesco Advisors, Inc. (2003-2005); Senior Vice President and General Counsel, Liberty Financial Companies, Inc. (2000-2001); General Counsel of certain investment management subsidiaries of Liberty Financial Companies, Inc. (1998-2000); Associate General Counsel, Liberty Financial Companies, Inc. (1993-1998); Associate, Ropes & Gray LLP. | | | 122 | | | | None | | |
* This is the date the Non-Independent Trustee began serving the Trust. Each Trustee serves an indefinite term, until his successor is elected.
** Fund Complex includes all open-end funds (including all of their portfolios) advised by the Adviser. At October 31, 2012, the Fund Complex consisted of the Trust's one portfolio and three other exchange-traded fund trusts with 121 portfolios advised by the Adviser.
30
Trustees and Officers (Continued)
Name, Address and Age of
Non-Independent Trustees | | Position(s)
Held
with Trust | | Term of
Office
and
Length of
Time
Served* | | Principal
Occupation(s) During
Past 5 Years | | Number of
Portfolios
in Fund
Complex**
Overseen
by
Non-
Independent
Trustees | | Other Directorships
Held by Non-Independent
Trustees During
the Past 5 Years | |
Kapil Dev Joory
(60)
c/o Invesco PowerShares Capital Management LLC
301 West Roosevelt Road
Wheaton, IL 60187 | | Trustee | | Since 2009 | | Director, International Financial Services Limited (international tax and business advisory services) (1993-Present). | | | 1 | | | Director of various global business companies | |
Graeme J. Proudfoot
(48)
c/o London Office Invesco Ltd.
30 Finsbury Square
London, EC2A 1AG,
United Kingdom | | Trustee | | Since 2008 | | Head of Specialist Funds Division, Invesco Ltd. (1999-Present); Head of London Office, Invesco Ltd. (2007-Present). | | | 1 | | | Director, Invesco UK Limited, Invesco Asset Management Limited and various other group companies (1999-Present) | |
* This is the date the Non-Independent Trustee began serving the Trust. Each Trustee serves an indefinite term, until his successor is elected.
** Fund Complex includes all open-end funds (including all of their portfolios) advised by the Adviser. At October 31, 2012, the Fund Complex consisted of the Trust's one portfolio and three other exchange-traded fund trusts with 121 portfolios advised by the Adviser.
31
Trustees and Officers (Continued)
Name, Address and
Age of Executive Officer | | Position(s)
Held with
Trust | | Length of
Time
Served* | | Principal Occupation(s) During Past 5 Years | |
Andrew Schlossberg
(38)
Invesco Management Group, Inc.
11 Greenway Plaza Suite 1000
Houston, TX 77046 | | President | | Since 2009 | | Managing Director, U.S. head of business strategy and chief marketing officer for Invesco Ltd. in the United States (2008-Present); formerly, Mr. Schlossberg served in multiple roles within Invesco, including head of corporate development, as well as global leadership roles in strategy and product development in the company's North American Institutional and Retirement divisions (2002-2007). | |
Benjamin Fulton
(51)
Invesco PowerShares Capital Management LLC
301 West Roosevelt Road
Wheaton, IL 60187 | | Vice President | | Since 2009 | | Executive Vice President – Global Product Development, Invesco PowerShares Capital Management LLC (2005-Present); formerly, principal of Clermont Consulting, a consulting firm focused on the creation and development of retail investment products (2003-2005); President and a founding partner of Claymore Securities, a financial services firm in the Chicagoland area (2001-2003); Managing Director of Structured Investments at Nuveen Investments (1998-2001). | |
Peter Hubbard
(31)
Invesco PowerShares Capital Management LLC
301 West Roosevelt Road
Wheaton, IL 60187 | | Vice President | | Since 2009 | | Vice President and Director of Portfolio Management – Invesco PowerShares Capital Management LLC (2008-Present); formerly, Portfolio Manager, Invesco PowerShares Capital Management LLC (2007-2008); Research Analyst, Invesco PowerShares Capital Management LLC (2005-2007); Research Analyst and Trader, Ritchie Capital, a hedge fund operator (2003-2005). | |
David Warren
(55)
Invesco Canada Ltd.
5140 Yonge Street
Suite 900
Toronto, Ontario
M2N 6X7 | | Vice President | | Since 2009 | | Director, Executive Vice President and Chief Financial Officer, Invesco Canada Ltd. (formerly, Invesco Trimark Ltd.) and Chief Administrative Officer, North American Retail, Invesco Ltd. (2007-Present); formerly, Director, Executive Vice President and Chief Financial Officer, Invesco Canada Ltd. (formerly, Invesco Trimark Ltd.) (2000-2006). | |
* This is the period for which the Officers began serving the Trust. Each Officer serves an indefinite term, until his or her successor is elected.
32
Trustees and Officers (Continued)
Name, Address and
Age of Executive Officer | | Position(s)
Held with
Trust | | Length of
Time
Served* | | Principal Occupation(s) During Past 5 Years | |
Christopher Joe
(42)
Invesco Management Group, Inc.
11 Greenway Plaza
Suite 1000
Houston, TX 77046-1173 | | Chief Compliance Officer | | Since 2012 | | U.S. Compliance Director, Invesco, Ltd.; Chief Compliance Officer, Invesco Investment Advisers, LLC (registered investment adviser); formerly, Assistant Fund Accounting Manager, Invesco, Ltd. | |
Sheri Morris
(48)
Invesco PowerShares
Capital Management LLC
301 West Roosevelt Road
Wheaton, IL 60187 | | Treasurer | | Since 2012 | | Vice President, Treasurer and Principal Financial Officer, The Invesco Funds; Vice President, Invesco Advisers, Inc. (formerly known as Invesco Institutional (N.A.), Inc.) (registered investment adviser) and Treasurer, PowerShares Exchange-Traded Fund Trust, PowerShares Exchange-Traded Fund Trust II, PowerShares India Exchange-Traded Fund Trust and PowerShares Actively Managed Exchange-Traded Fund Trust; formerly, Vice President, Invesco Advisers, Inc., Invesco Aim Capital Management, Inc. and Invesco Aim Private Asset Management, Inc.; Assistant Vice President and Assistant Treasurer, The Invesco Funds and Assistant Vice President, Invesco Advisers, Inc., Invesco Aim Capital Management, Inc. and Invesco Aim Private Asset Management, Inc. | |
* This is the period for which the Officers began serving the Trust. Each Officer serves an indefinite term, until his or her successor is elected.
33
Trustees and Officers (Continued)
Name, Address and
Age of Executive Officer | | Position(s)
Held with
Trust | | Length of
Time
Served* | | Principal Occupation(s) During Past 5 Years | |
Anna Paglia
(38)
Invesco PowerShares Capital Management LLC
301 West Roosevelt Road
Wheaton, IL 60187 | | Secretary | | Since 2011 | | Secretary, PowerShares Exchange-Traded Fund Trust, PowerShares Exchange-Traded Fund Trust II, PowerShares India Exchange-Traded Fund Trust, and PowerShares Actively Managed Exchange-Traded Fund Trust; Head of Legal, Invesco PowerShares Capital Management LLC (2010-Present); formerly, Partner, K&L Gates LLP (formerly, Bell Boyd & Lloyd LLP) (2007-2010); Associate Counsel at Barclays Global Investors Ltd. (2004-2006). | |
Availability of Additional Information About the Trustees
The Statement of Additional Information includes additional information about the Trustees and is available, without charge, upon request at (800) 983-0903.
* This is the period for which the Officers began serving the Trust. Each Officer serves an indefinite term, until his or her successor is elected.
34
This page intentionally left blank
This page intentionally left blank
PROXY VOTING POLICIES AND PROCEDURES
A description of the Trust's proxy voting policies and procedures that the Fund uses to determine how to vote proxies relating to portfolio securities is available, without charge and upon request, by calling (800) 983-0903. This information is also available on the Securities and Exchange Commission's (the "Commission") website at www.sec.gov.
Information regarding how the Fund voted proxies for portfolio securities, if applicable, during the most recent 12-month period ended June 30, is available, without charge and upon request, by (i) calling (800) 983-0903; or (ii) accessing the Trust's Form N-PX on the Commission's website at www.sec.gov.
QUARTERLY PORTFOLIOS
The Trust files its complete schedule of portfolio holdings with the Commission for the first and third quarters of each fiscal year on Form N-Q. The Forms N-Qs are available on the Commission's website at www.sec.gov. The Trust's Forms N-Qs may also be reviewed and copied at the Commission's Public Reference Room in Washington, D.C. Information on the operation of the Public Reference Room may be obtained by calling (800) SEC-0330.

This report must be preceded or accompanied by the most recent fund prospectus.
301 West Roosevelt Road
Wheaton, IL 60187
800.983.0903
www.invescopowershares.com
© Invesco PowerShares Capital Management LLC P-PIN-AR-1
ITEM 2. CODE OF ETHICS.
The Registrant has adopted a Code of Ethics that applies to the Registrant’s principal executive officer and principal financial officer. This Code is filed as an exhibit to this report on Form N-CSR under Item 12(a)(1). No substantive amendments to this Code were made during the reporting period. There were no waivers for the fiscal year ended October 31, 2012.
ITEM 3. AUDIT COMMITTEE FINANCIAL EXPERT.
The Registrant’s Board of Trustees has determined that the Registrant has three “audit committee financial experts” serving on its Audit Committee: Mr. Marc M. Kole, Mr. Philip M. Nussbaum and Mr. Donald H. Wilson. Each of these Audit Committee members is “independent,” meaning that he is not an “interested person” of the Registrant (as that term is defined in Section 2(a)(19) of the Investment Company Act of 1940) and he does not accept any consulting, advisory, or other compensatory fee from the Registrant (except in his capacity as a Board or committee member).
An “audit committee financial expert” is not an “expert” for any purpose, including for purposes of Section 11 of the Securities Act of 1933, as a result of being designated as an “audit committee financial expert.” Further, the designation of a person as an “audit committee financial expert” does not mean that person has any greater duties, obligations, or liability than those imposed on a person without the “audit committee financial expert” designation. Similarly, the designation of a person as an “audit committee financial expert” does not affect the duties, obligations, or liability of any other member of the Audit Committee or board of trustees.
ITEM 4. PRINCIPAL ACCOUNTANT FEES AND SERVICES.
PricewaterhouseCoopers LLP (“PwC”) billed the Registrant aggregate fees for services rendered to the Registrant for the last two fiscal years as follows:
| | Fees Billed by
PwC for Services
Rendered to the
Registrant for
Fiscal
Year End 2012 | | Percentage of
Services Approved
for Fiscal Year End
2012 Pursuant to
Waiver of Pre-
Approval
Requirement(1) | | Fees Billed by
PwC for Services
Rendered to the
Registrant for
Fiscal
Year End 2011 | | Percentage of
Services Approved
for Fiscal Year End
2011 Pursuant to
Waiver of Pre-
Approval
Requirement(1) | |
| | | | | | | | | |
Audit Fees | | $ | 55,620 | | N/A | | $ | 54,800 | | N/A | |
Audit-Related Fees | | $ | 0 | | 0 | % | $ | 0 | | 0 | % |
Tax Fees(2) | | $ | 7,210 | | 0 | % | $ | 7,085 | | 0 | % |
All Other Fees | | $ | 0 | | 0 | % | $ | 0 | | 0 | % |
Total Fees | | $ | 62,830 | | 0 | % | $ | 61,885 | | 0 | % |
PwC billed the Registrant aggregate fees of $7,210 for the fiscal year ended October 31, 2012 and $7,085 for the fiscal year ended October 31, 2011 for non-audit services rendered to the Registrant.
(1) For the provision of non-audit services, the pre-approval requirement is waived pursuant to a de minimis exception if (i) such services were not recognized as non-audit services by the Registrant
at the time of engagement, (ii) the aggregate amount of all such services provided is no more than 5% of the aggregate audit and non-audit fees paid by the Registrant during the fiscal year in which services are provided; and (iii) such services are promptly brought to the attention of the Registrant’s Audit Committee and approved by the Registrant’s Audit Committee prior to the completion of the audit.
(2) Tax fees for the fiscal year ended October 31, 2012 includes fees billed for reviewing tax returns, 2011 excise tax returns and excise tax distribution calculations. Tax fees for the fiscal year ended October 31, 2011 included fees billed for reviewing tax returns, 2010 excise tax returns and excise tax distribution calculations.
PwC did not bill any fees for non-audit services rendered to the Registrant’s investment adviser or any entity controlling, controlled by or under common control with the Registrant’s investment adviser that provides ongoing services to the Registrant for the fiscal years ended October 31, 2012 and October 31, 2011.
Audit Committee Pre Approval Policies and Procedures
PRE-APPROVAL OF AUDIT AND NON-AUDIT SERVICES
POLICIES AND PROCEDURES
As adopted by the Audit Committee of
the PowerShares Funds (the “Funds”)
June 26, 2009
Statement of Principles
Under the Sarbanes-Oxley Act of 2002 and rules adopted by the Securities and Exchange Commission (“SEC”) (“Rules”), the Audit Committee of the Funds’ (the “Audit Committee”) Board of Trustees (the “Board”) is responsible for the appointment, compensation and oversight of the work of independent accountants (an “Auditor”). As part of this responsibility and to assure that the Auditor’s independence is not impaired, the Audit Committee pre-approves the audit and non-audit services provided to the Funds by each Auditor, as well as all non-audit services provided by the Auditor to the Funds’ investment adviser and to affiliates of the adviser that provide ongoing services to the Funds (“Service Affiliates”) if the services directly impact the Funds’ operations or financial reporting. The SEC Rules also specify the types of services that an Auditor may not provide to its audit client. The following policies and procedures comply with the requirements for pre-approval and provide a mechanism by which management of the Funds may request and secure pre-approval of audit and non-audit services in an orderly manner with minimal disruption to normal business operations.
Proposed services either may be pre-approved without consideration of specific case-by-case services by the Audit Committee (“general pre-approval”) or require the specific pre-approval of the Audit Committee (“specific pre-approval”). As set forth in these policies and procedures, unless a type of service has received general pre-approval, it will require specific pre-approval by the Audit Committee. Additionally, any fees exceeding 110% of estimated pre-approved fee levels provided at the time the service was pre-approved will also require specific approval by the Audit Committee before payment is made. The Audit Committee will also consider the impact of additional fees on the Auditor’s independence when determining whether to approve any additional fees for previously pre-approved services.
The Audit Committee will annually review and generally pre-approve the services that may be provided by each Auditor without obtaining specific pre-approval from the Audit Committee. The term of any general pre-approval runs from the date of such pre-approval through June 30th of the following year, unless the Audit Committee considers a different period and states otherwise. The Audit Committee will add to or subtract from the list of general pre-approved services from time to time, based on subsequent determinations.
The purpose of these policies and procedures is to set forth the guidelines to assist the Audit Committee in fulfilling its responsibilities.
Delegation
The Chairman of the Audit Committee (or, in his or her absence, any member of the Audit Committee) may grant specific pre-approval for non-prohibited services for engagements of less than $20,000. All such delegated pre-approvals shall be presented to the Audit Committee no later than the next Audit Committee meeting.
Audit Services
The annual audit services engagement terms will be subject to specific pre-approval of the Audit Committee. Audit services include the annual financial statement audit and other procedures such as tax provision work that is required to be performed by the independent auditor to be able to form an opinion on the Funds’ financial statements. The Audit Committee will obtain, review and consider sufficient information concerning the proposed Auditor to make a reasonable evaluation of the Auditor’s qualifications and independence.
In addition to the annual Audit services engagement, the Audit Committee may grant either general or specific pre-approval of other Audit services, which are those services that only the independent auditor reasonably can provide. Other Audit services may include services such as issuing consents for the inclusion of audited financial statements with SEC registration statements, periodic reports and other documents filed with the SEC or other documents issued in connection with securities offerings.
Non-Audit Services
The Audit Committee may provide either general or specific pre-approval of any non-audit services to the Funds and its Service Affiliates if the Audit Committee believes that the provision of the service will not impair the independence of the Auditor, is consistent with the SEC’s Rules on auditor independence, and otherwise conforms to the Audit Committee’s general principles and policies as set forth herein.
Audit-Related Services
“Audit-related services” are assurance and related services that are reasonably related to the performance of the audit or review of the Funds’ financial statements or that are traditionally performed by the independent auditor. Audit-related services include, among others, accounting consultations related to accounting, financial reporting or disclosure matters not classified as “Audit services”; and assistance with understanding and implementing new accounting and financial reporting guidance from rulemaking authorities.
Tax Services
“Tax services” include, but are not limited to, the review and signing of the Funds’ federal tax returns, the review of required distributions by the Funds and consultations regarding tax matters such as the tax treatment of new investments or the impact of new regulations. The Audit Committee will scrutinize carefully the retention of the Auditor in connection with a transaction initially recommended by the Auditor, the major business purpose of which may be tax avoidance or the tax treatment of which may not be supported in the Internal Revenue Code and related regulations. The Audit Committee will consult with the Funds’ Treasurer (or his or her designee) and may consult with outside counsel or advisors as necessary to ensure the consistency of Tax services rendered by the Auditor with the foregoing policy.
No Auditor shall represent any Fund or any Service Affiliate before a tax court, district court or federal court of claims.
Under rules adopted by the Public Company Accounting Oversight Board and approved by the SEC, in connection with seeking Audit Committee pre-approval of permissible Tax services, the Auditor shall:
1. Describe in writing to the Audit Committee, which writing may be in the form of the proposed engagement letter:
a. The scope of the service, the fee structure for the engagement, and any side letter or amendment to the engagement letter, or any other agreement between the Auditor and the Fund, relating to the service; and
b. Any compensation arrangement or other agreement, such as a referral agreement, a referral fee or fee-sharing arrangement, between the Auditor and any person (other than the Fund) with respect to the promoting, marketing, or recommending of a transaction covered by the service;
2. Discuss with the Audit Committee the potential effects of the services on the independence of the Auditor; and
3. Document the substance of its discussion with the Audit Committee.
All Other Auditor Services
The Audit Committee may pre-approve non-audit services classified as “All other services” that are not categorically prohibited by the SEC, as listed in Exhibit 1 to this policy.
Pre-Approval Fee Levels or Established Amounts
Pre-approval of estimated fees or established amounts for services to be provided by the Auditor under general or specific pre-approval policies will be set periodically by the Audit Committee. Any proposed fees exceeding 110% of the maximum estimated pre-approved fees or established amounts for pre-approved audit and non-audit services will be reported to the Audit Committee at the quarterly Audit Committee meeting and will require specific approval by the Audit Committee before payment is made. The Audit Committee will always factor in the overall relationship of fees for audit and non-audit services in determining whether to pre-approve any such services and in determining whether to approve any additional fees exceeding 110% of the maximum pre-approved fees or established amounts for previously pre-approved services.
Procedures
On an annual basis, the Auditor will submit to the Audit Committee for general pre-approval, a list of non-audit services that the Funds or Service Affiliates of the Funds may request from the Auditor. The list will describe the non-audit services in reasonable detail and will include an estimated range of fees and such other information as the Audit Committee may request.
Each request for services to be provided by the Auditor under the general pre-approval of the Audit Committee will be submitted to the Funds’ Treasurer (or his or her designee) and must include a detailed description of the services to be rendered. The Treasurer or his or her designee will ensure that such services are included within the list of services that have received the general pre-approval of the Audit Committee. The Audit Committee will be informed at the next quarterly scheduled Audit Committee meeting of any such services for which the Auditor rendered an invoice and whether such services and fees had been pre-approved and if so, by what means.
Each request to provide services that require specific approval by the Audit Committee shall be submitted to the Audit Committee jointly by the Funds’ Treasurer or his or her designee and the Auditor, and must include a joint statement that, in their view, such request is consistent with the policies and pre-approval procedures and the SEC Rules.
Each request to provide Tax services under either the general or specific pre-approval of the Audit Committee will describe in writing: (i) the scope of the service, the fee structure for the engagement, and any side letter or amendment to the engagement letter, or any other agreement between the Auditor and the audit client, relating to the service; and (ii) any compensation arrangement or other agreement between the Auditor and any person (other than the audit client) with respect to the promoting, marketing, or recommending of a transaction covered by the service. The Auditor will discuss with the Audit Committee
the potential effects of the services on the Auditor’s independence and will document the substance of the discussion.
Non-audit services pursuant to the de minimis exception provided by the SEC Rules will be promptly brought to the attention of the Audit Committee for approval, including documentation that each of the conditions for this exception, as set forth in the SEC Rules, has been satisfied.
On at least an annual basis, the Auditor will prepare a summary of all the services provided to any entity in the investment company complex as defined in section 2-01(f)(14) of Regulation S-X in sufficient detail as to the nature of the engagement and the fees associated with those services.
The Audit Committee has designated the Funds’ Treasurer to monitor the performance of all services provided by the Auditor and to ensure such services are in compliance with these policies and procedures. The Funds’ Treasurer will report to the Audit Committee on a periodic basis as to the results of such monitoring. Both the Funds’ Treasurer and management will immediately report to the Chairman of the Audit Committee any breach of these policies and procedures that comes to the attention of the Funds’ Treasurer or senior management.
Exhibit 1 to Pre-Approval of Audit and Non-Audit Services Policies and Procedures
Conditionally Prohibited Non-Audit Services (not prohibited if the Fund can reasonably conclude that the results of the service would not be subject to audit procedures in connection with the audit of the Fund’s financial statements)
· Bookkeeping or other services related to the accounting records or financial statements of the audit client
· Financial information systems design and implementation
· Appraisal or valuation services, fairness opinions, or contribution-in-kind reports
· Actuarial services
· Internal audit outsourcing services
Categorically Prohibited Non-Audit Services
· Management functions
· Human resources
· Broker-dealer, investment adviser, or investment banking services
· Legal services
· Expert services unrelated to the audit
· Any service or product provided for a contingent fee or a commission
· Services related to marketing, planning, or opining in favor of the tax treatment of confidential transactions or aggressive tax position transactions, a significant purpose of which is tax avoidance
· Tax services for persons in financial reporting oversight roles at the Fund
· Any other service that the Public Company Oversight Board determines by regulation is impermissible.
ITEM 5. AUDIT COMMITTEE OF LISTED REGISTRANTS.
The Registrant has a separately designated Audit Committee established in accordance with Section 3(a)(58)(A) of the Securities Exchange Act of 1934, as amended, which consists of the independent trustees. The Audit Committee members are Ronn R. Bagge, Todd J. Barre, Marc M. Kole, Philip M. Nussbaum and Donald H. Wilson
ITEM 6. SCHEDULE OF INVESTMENTS.
The Schedule of Investments is included as part of the report to shareholders filed under Item 1 of this Form N-CSR.
ITEM 7. DISCLOSURE OF PROXY VOTING POLICIES AND PROCEDURES FOR CLOSED-END MANAGEMENT INVESTMENT COMPANIES.
Not Applicable.
ITEM 8. PORTFOLIO MANAGERS OF CLOSED-END MANAGEMENT INVESTMENT COMPANIES.
Not Applicable.
ITEM 9. PURCHASES OF EQUITY SECURITIES BY CLOSED-END MANAGEMENT INVESTMENT COMPANIES AND AFFILIATED PURCHASERS.
Not Applicable.
ITEM 10. SUBMISSION OF MATTERS TO A VOTE OF SECURITY HOLDERS.
There have been no changes to the procedures by which shareholders may recommend nominees to the Registrant’s Board of Trustees that would require disclosure herein.
ITEM 11. CONTROLS AND PROCEDURES.
(a) Based on their evaluation of the Registrant’s disclosure controls and procedures (as defined in Rule 30a-3(c) under the Investment Company Act of 1940) as of a date within 90 days of the filing date of this report, the Registrant’s President (principal executive officer) and Treasurer (principal financial officer) have concluded that such disclosure controls and procedures are effective.
(b) There were no significant changes in the Registrant’s internal control over financial reporting (as defined in Rule 30a-3(d) under the Investment Company Act of 1940 ) that occurred during the second fiscal quarter of the period covered by this report that have materially affected, or are reasonably likely to materially affect, the Registrant’s internal control over financial reporting.
ITEM 12. EXHIBITS.
(a)(1) Code of Ethics.
(a)(2) Certifications pursuant to Rule 30a-2(a) under the Investment Company Act of 1940 and Section 302 of the Sarbanes-Oxley Act of 2002 are attached hereto.
(a)(3) Not Applicable.
(b) Certifications pursuant to Rule 30a-2(b) under the Investment Company Act of 1940 and Section 906 of the Sarbanes-Oxley Act of 2002 are attached hereto.
SIGNATURES
Pursuant to the requirements of the Securities Exchange Act of 1934 and the Investment Company Act of 1940, the Registrant has duly caused this report to be signed on its behalf by the undersigned, thereunto duly authorized.
PowerShares India Exchange-Traded Fund Trust
By: | /s/ Andrew Schlossberg | |
Name: | Andrew Schlossberg | |
Title: | President | |
Date: | January 3, 2013 | |
Pursuant to the requirements of the Securities Exchange Act of 1934 and the Investment Company Act of 1940, this report has been signed below by the following persons on behalf of the Registrant and in the capacities and on the dates indicated.
By: | /s/ Andrew Schlossberg | |
Name: | Andrew Schlossberg | |
Title: | President | |
Date: | January 3, 2013 | |
| | |
By: | /s/ Sheri L. Morris | |
Name: | Sheri L. Morris | |
Title: | Treasurer | |
Date: | January 3, 2013 | |