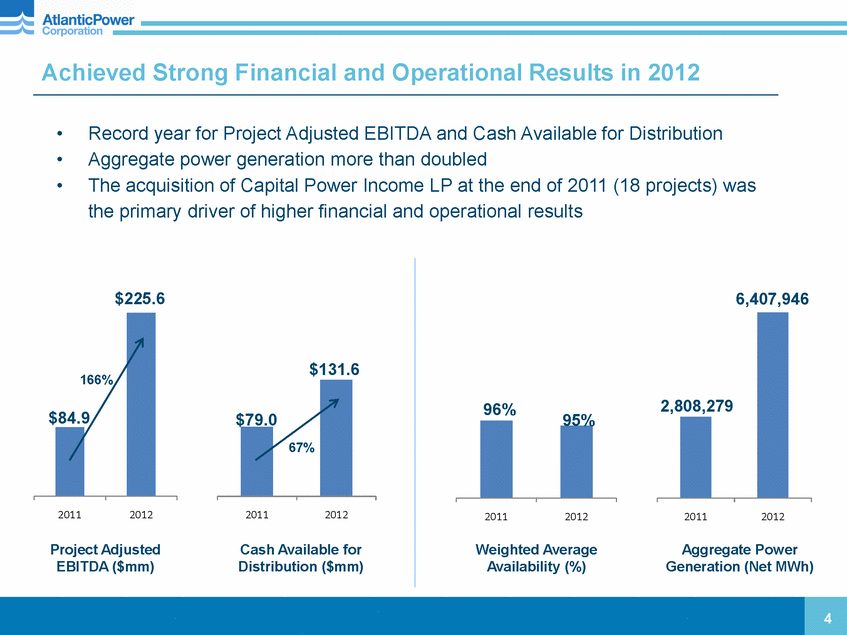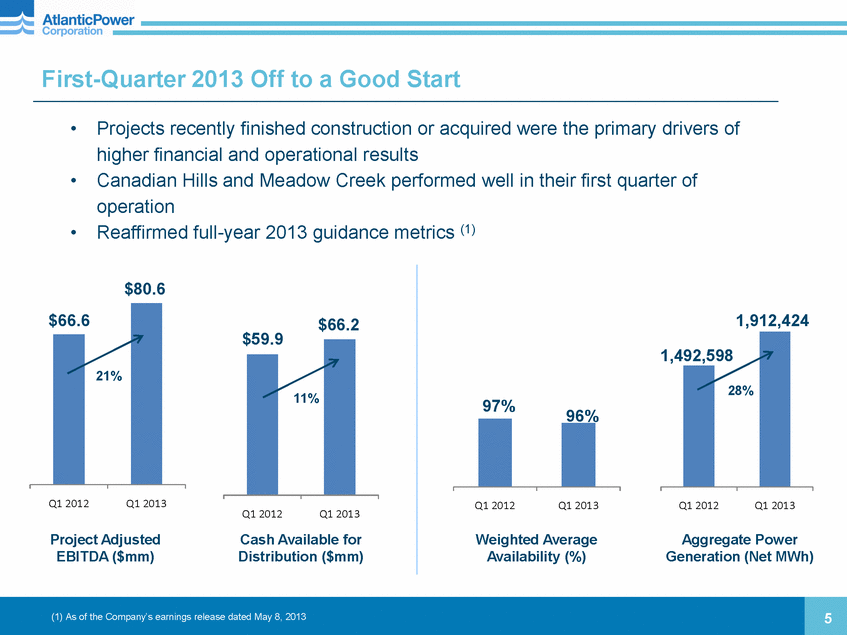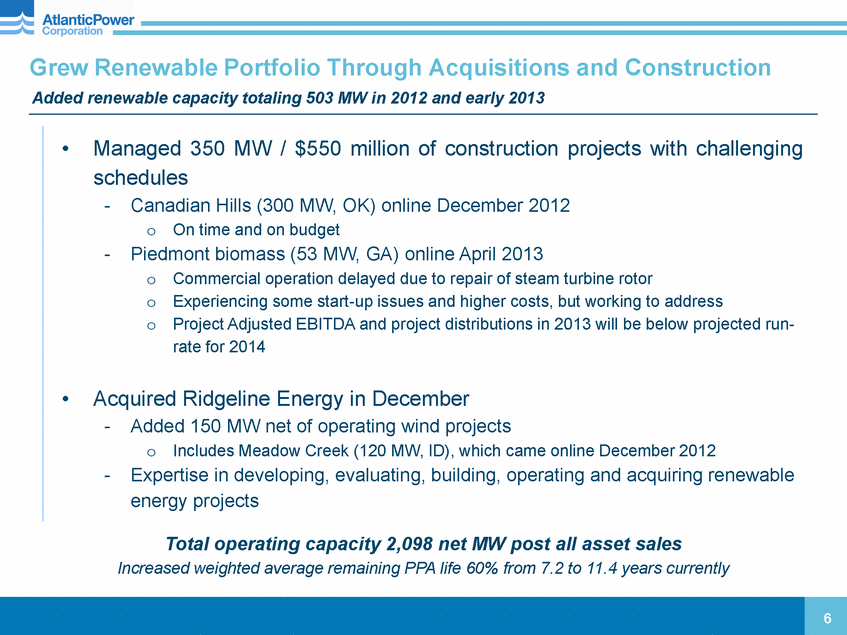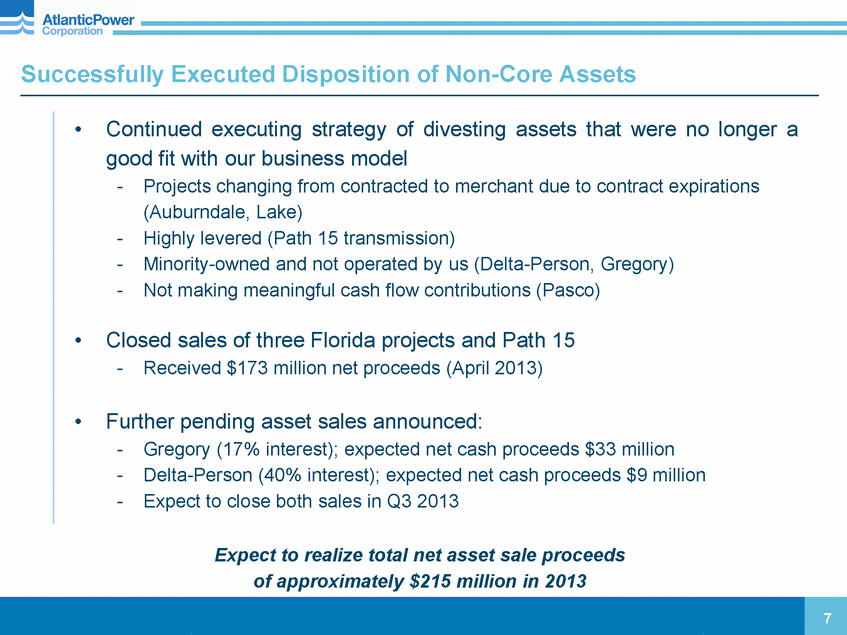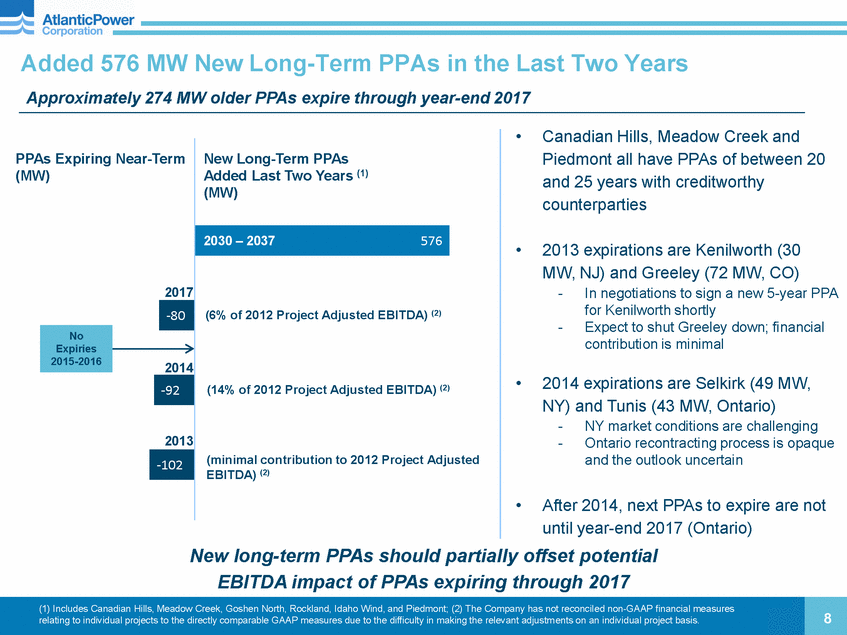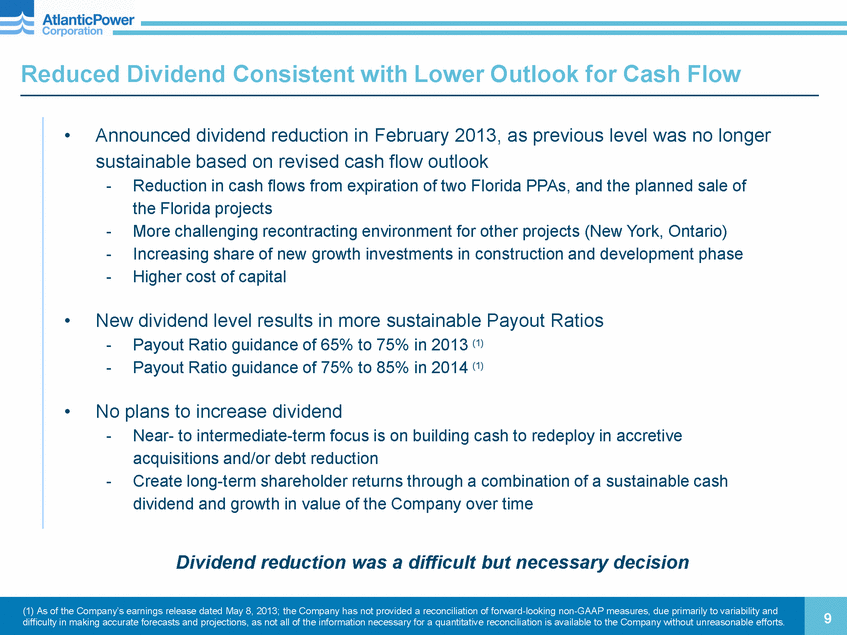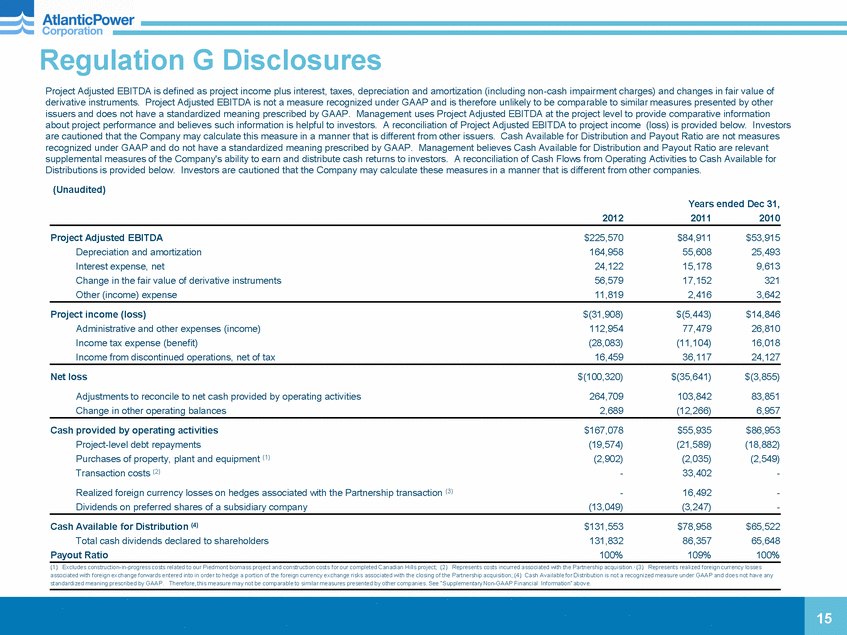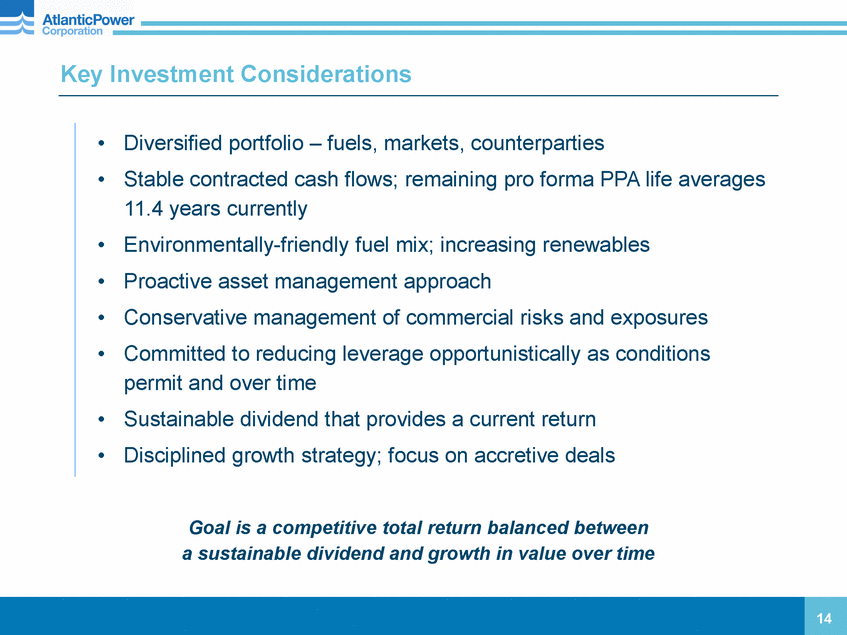
| APC BEST logo.tifKey Investment Considerations 14 •Diversified portfolio –fuels, markets, counterparties •Stable contracted cash flows; remaining pro forma PPA life averages 11.4 years currently •Environmentally-friendly fuel mix; increasing renewables •Proactive asset management approach •Conservative management of commercial risks and exposures •Committed to reducing leverage opportunistically as conditions permit and over time •Sustainable dividend that provides a current return •Disciplined growth strategy; focus on accretive deals Goal is a competitive total return balanced between a sustainable dividend and growth in value over time APC BEST logo.tifRegulation G Disclosures Project Adjusted EBITDA is defined as project income plus interest, taxes, depreciation and amortization (including non-cash impairment charges) and changes in fair value of derivative instruments. Project Adjusted EBITDA is not a measure recognized under GAAP and is therefore unlikely to be comparable to similar measures presented by other issuers and does not have a standardized meaning prescribed by GAAP. Management uses Project Adjusted EBITDA at the project level to provide comparative information about project performance and believes such information is helpful to investors. A reconciliation of Project Adjusted EBITDA to project income (loss) is provided below. Investors are cautioned that the Company may calculate this measure in a manner that is different from other issuers. Cash Available for Distribution and Payout Ratio are not measures recognized under GAAP and do not have a standardized meaning prescribed by GAAP. Management believes Cash Available for Distribution and Payout Ratio are relevant supplemental measures of the Company's ability to earn and distribute cash returns to investors. A reconciliation of Cash Flows from Operating Activities to Cash Available for Distributions is provided below. Investors are cautioned that the Company may calculate these measures in a manner that is different from other companies. 15 (Unaudited) Years ended Dec 31, 2012 2011 2010 Project Adjusted EBITDA $225,570 $84,911 $53,915 Depreciation and amortization 164,958 55,608 25,493 Interest expense, net 24,122 15,178 9,613 Change in the fair value of derivative instruments 56,579 17,152 321 Other(income)expense 11,819 2,416 3,642 Project income(loss) $(31,908) $(5,443) $14,846 Administrative and other expenses(income) 112,954 77,479 26,810 Income tax expense(benefit) (28,083) (11,104) 16,018 Income from discontinued operations, net of tax 16,459 36,117 24,127 Netloss $(100,320) $(35,641) $(3,855) Adjustments to reconcile to net cash provided by operating activities 264,709 103,842 83,851 Change in other operating balances 2,689 (12,266) 6,957 Cash provided by operating activities $167,078 $55,935 $86,953 Project-level debt repayments (19,574) (21,589) (18,882) Purchases of property, plant and equipment (1) (2,902) (2,035) (2,549) Transaction costs (2) - 33,402 - Realized foreign currency losses on hedges associated with the Partnership transaction (3) - 16,492 - Dividends on preferred shares of a subsidiary company (13,049) (3,247) - Cash Available for Distribution(4) $131,553 $78,958 $65,522 Total cash dividends declared to shareholders 131,832 86,357 65,648 Payout Ratio 100% 109% 100% (1) Excludes construction-in-progress costs related to our Piedmont biomass project and construction costs for our completed Canadian Hills project; (2) Represents costs incurred associated with the Partnership acquisition.;(3) Represents realized foreign currency losses associated with foreign exchange forwards entered into in order to hedge a portion of the foreign currency exchange risks associated with the closing of the Partnership acquisition; (4) Cash Available for Distribution is not a recognized measure under GAAP and does not have any standardized meaning prescribed by GAAP. Therefore, this measure may not be comparable to similar measures presented by other companies. See “Supplementary Non-GAAP Financial Information” above. APC BEST logo.tifRegulation G Disclosures 16 (Unaudited) Three months ended March 31, 2013 2012 Project Adjusted EBITDA $80.6 $66.6 Depreciation and amortization 52.4 39.9 Interest expense, net 9.5 6.0 Change in the fair value of derivative instruments (11.5) 57.5 Other(income)expense (0.9) 0.2 Project income(loss) $31.1 $(37.0) Administrative and other expenses 26.7 30.7 Income tax benefit (2.5) (16.9) Income from discontinued operations, net of tax 0.9 11.6 Netincome (loss) $7.8 $(39.2) Adjustments to reconcile to net cash provided by operating activities 48.4 88.3 Change in other operating balances 18.0 17.5 Cash provided by operating activities $74.2 $66.6 Project-level debt repayments (2.6) (2.7) Purchases of property, plant and equipment (2.2) (0.8) Dividends on preferred shares of a subsidiary company (3.2) (3.2) Cash Available for Distribution(1) $66.2 $59.9 Total cash dividends declared to shareholders 25.2 32.8 Payout Ratio 38% 55% (1)Cash Available for Distribution is not a recognized measure under GAAP and does not have any standardized meaning prescribed by GAAP. Therefore, this measure may not be comparable to similar measures presented by other companies. Project Adjusted EBITDA is defined as project income plus interest, taxes, depreciation and amortization (including non-cash impairment charges) and changes in fair value of derivative instruments. Project Adjusted EBITDA is not a measure recognized under GAAP and is therefore unlikely to be comparable to similar measures presented by other issuers and does not have a standardized meaning prescribed by GAAP. Management uses Project Adjusted EBITDA at the project level to provide comparative information about project performance and believes such information is helpful to investors. A reconciliation of Project Adjusted EBITDA to the most comparable GAAP measure, project income (loss), is provided below. Investors are cautioned that the Company may calculate this measure in a manner that is different from other issuers. Cash Available for Distribution and Payout Ratio are not measures recognized under GAAP and do not have a standardized meaning prescribed by GAAP. Management believes Cash Available for Distribution and Payout Ratio are relevant supplemental measures of the Company's ability to earn and distribute cash returns to investors. A reconciliation of cash provided by operating activities to Cash Available for Distributions and to Payout Ratio is provided below. Investors are cautioned that the Company may calculate these measures in a manner that is different from other companies. |
