Exhibit 99.1

2017 ANNUAL REPORT STRONG TO THE CORE
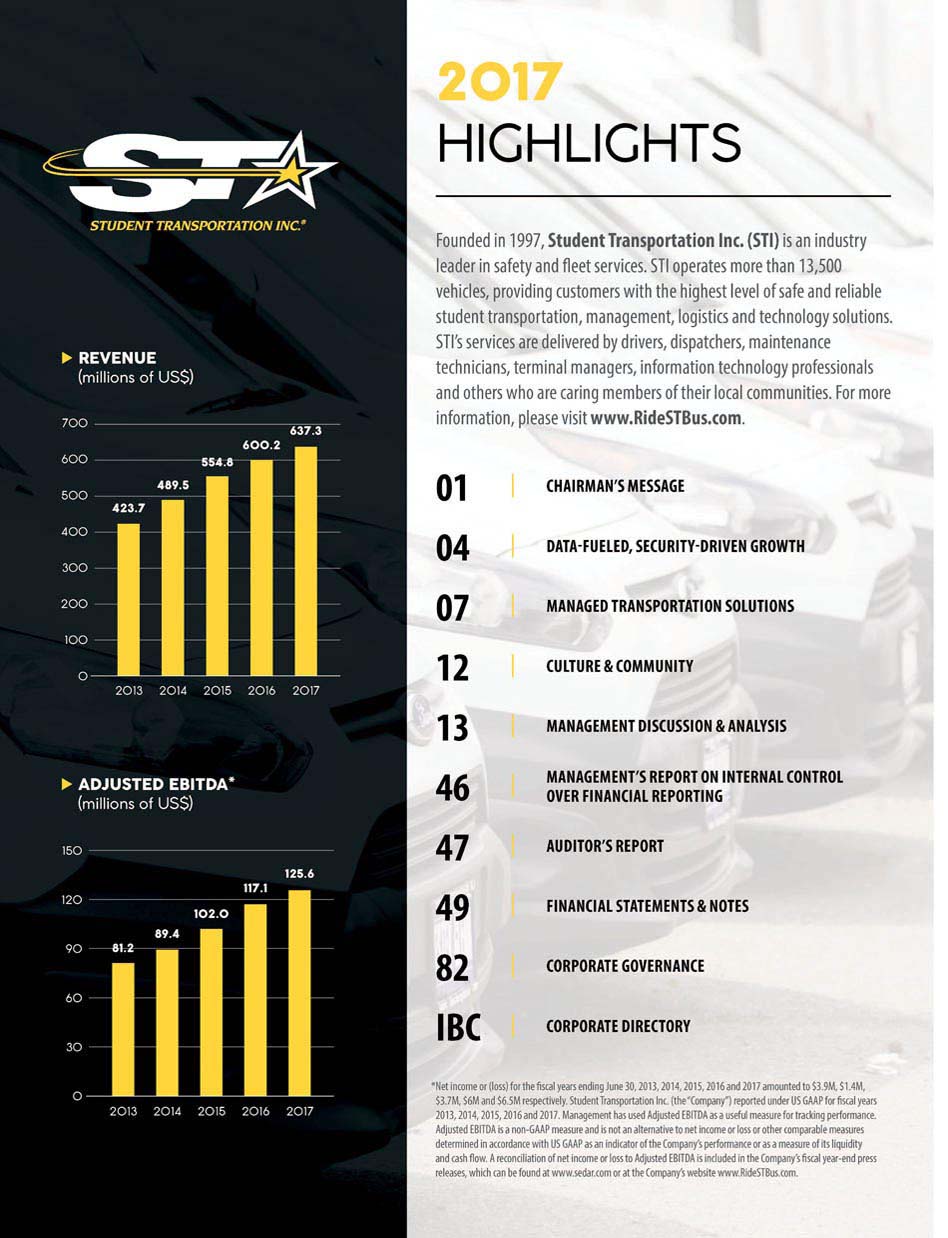
REVENUE (millions of US$) 700 600 500 400 300 200 100 0 2013 2014 2015 2016 2017 423.7 489.5 554.8 600.2 637.3 2017 HIGHLIGHTS *Net income or (loss) for the fiscal years ending June 30, 2013, 2014, 2015, 2016 and 2017 amounted to $3.9M, $1.4M, $3.7M, $6M and $6.5M respectively. Student Transportation Inc. (the“Company”) reported under US GAAP for fiscal years 2013, 2014, 2015, 2016 and 2017. Management has used Adjusted EBITDA as a useful measure for tracking performance. Adjusted EBITDA is a non - GAAP measure and is not an alternative to net income or loss or other comparable measures determined in accordance with US GAAP as an indicator of the Company’s performance or as a measure of its liquidity and cash flow. A reconciliation of net income or loss to Adjusted EBITDA is included in the Company’s fiscal year - end press releases, which can be found at www.sedar.com or at the Company’s website www.RideSTBus.com. Founded in 1997, Student Transportation Inc. (STI) is an industry leader in safety and fleet services. STI operates more than 13,500 vehicles, providing customers with the highest level of safe and reliable student transportation, management, logistics and technology solutions. STI’s services are delivered by drivers, dispatchers, maintenance technicians, terminal managers, information technology professionals and others who are caring members of their local communities. For more information, please visit www.RideSTBus.com . CHAIRMAN’S MESSAGE DATA - FUELED, SECURITY - DRIVEN GROWTH MANAGED TRANSPORTATION SOLUTIONS CULTURE & COMMUNITY MANAGEMENT DISCUSSION & ANALYSIS MANAGEMENT’S REPORT ON INTERNAL CONTROL OVER FINANCIAL REPORTING AUDITOR’S REPORT FINANCIAL STATEMENTS & NOTES CORPORATE GOVERNANCE CORPORATE DIRECTORY 01 04 07 12 13 46 47 49 82 IBC 30 60 90 0 2013 2014 2015 2016 2017 81.2 ADJUSTED EBITDA * (millions of US$) 150 125.6 117.1 120 102.0 89.4
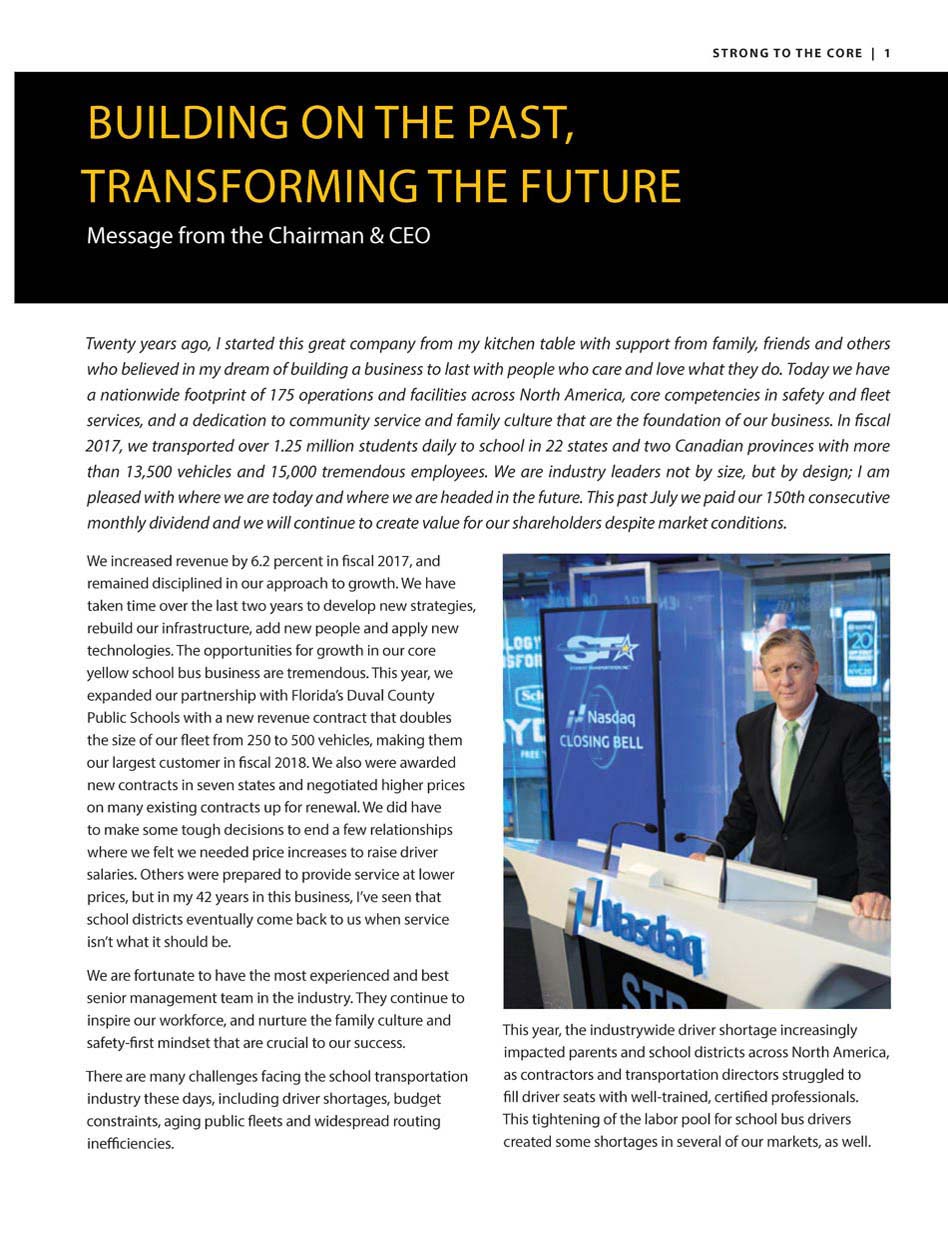
STRONG TO THE CORE | 1 Message from the Chairman & CEO BUILDING ON THE PAST, TRANSFORMING THE FUTURE safety - first mindset that are crucial to our success. There are many challenges facing the school transportation industry these days, including driver shortages, budget constraints, aging public fleets and widespread routing nefficiencies. This year, the industrywide driver shortage increasingly impacted parents and school districts across North America, as contractors and transportation directors struggled to fill driver seats with well - trained, certified professionals. This tightening of the labor pool for school bus drivers created some shortages in several of our markets, as well. Twenty years ago, I started this great company from my kitchen table with support from family, friends and others who believed in my dream of building a business to last with people who care and love what they do . Today we have a nationwide footprint of 175 operations and facilities across North America, core competencies in safety and fleet services, and a dedication to community service and family culture that are the foundation of our business . In fiscal 2017 , we transported over 1 . 25 million students daily to school in 22 states and two Canadian provinces with more than 13 , 500 vehicles and 15 , 000 tremendous employees . We are industry leaders not by size, but by design ; I am pleased with where we are today and where we are headed in the future . This past July we paid our 150 th consecutive monthly dividend and we will continue to create value for our shareholders despite market conditions . We increased revenue by 6.2 percent in fiscal 2017, and remained disciplined in our approach to growth. We have taken time over the last two years to develop new strategies, rebuild our infrastructure, add new people and apply new technologies. The opportunities for growth in our core yellow school bus business are tremendous. This year, we expanded our partnership with Florida’s Duval County Public Schools with a new revenue contract that doubles the size of our fleet from 250 to 500 vehicles, making them our largest customer in fiscal 2018. We also were awarded new contracts in seven states and negotiated higher prices on many existing contracts up for renewal. We did have to make some tough decisions to end a few relationships where we felt we needed price increases to raise driver salaries. Others were prepared to provide service at lower prices, but in my 42 years in this business, I’ve seen that school districts eventually come back to us when service sn’t what it should be. We are fortunate to have the most experienced and best senior management team in the industry. They continue to inspire our workforce, and nurture the family culture and
2 | STRONG TO THE CORE “By using technology to better manage our operations, we will maximize the benefits and mitigate risks to position us for sustained growth in the years to come. The focus of our new School Transportation Group will help pave the way for stronger organic growth, while creating new opportunities to expand our footprint through strategic acquisitions. “ – Denis J. Gallagher By using technology to better manage our operations, we will maximize the benefits and mitigate risks to position us for sustained growth in the years to come. The focus of our new School Transportation Group will help pave the way for stronger organic growth, while creating new opportunities to expand our footprint through strategic acquisitions. In addition to cost reduction and efficiencies, operational tailwinds in fiscal 2017 included low fuel prices and more “customer paid fuel” agreements in our contracts, which makes fuel “risk off.” I am most proud of our contract renewal rate, which remains at approximately 95 percent over our 20 - year history. It’s a tribute to our frontline operations teams – drivers, monitors, mechanics, managers and others – who are directly responsible for our stellar reputation for service and safety. Leveraging Core Competencies In our new Managed Services Group (MSG) we’re leveraging our strong record for effective fleet management to open new consulting and management opportunities. We’re applying new technologies for school district customers in operational analysis, routing and scheduling, and deploying our industry - leading SafeStop app, which lets parents know where the bus is and when it is coming. SafeStop is now a key offering in new contracts and we continue to launch new SafeStop partnerships inside and outside the school transportation industry. Recently, we signed an agreement that makes SafeStop the official School Bus Tracking App for one of the industry’s leading providers of GPS services. In addition, we’re providing SafeStop to nearly a dozen other GPS companies, as well as many schools and contractors, solidifying its position as the most complete and universal school bus tracking app on the market. After several failed attempts by others to replicate what we built, school officials and parents appreciate the expertise needed to successfully operate a service like this, and we expect to Our corporate, regional and local operating teams worked together to improve driver retention and address recruiting in new and innovative ways. We’re also leveraging our advanced technology to create more efficient routing to reduce the number of vehicles a school district needs to transport students and thus, the number of drivers needed. Our newly formed School Transportation Group (STG) was created to focus on our core contracted school bus operations, and will build and improve upon our current efforts to develop and recruit new drivers and maintenance technicians, while maintaining our high retention rate of those already here. We will continue to develop new technologies to reduce costs and improve safety. Severe weather created a headwind for us in fiscal 2017, hitting a few of our markets hard. Some schools were off as many as 12 days, well above the norm. Floods, tornados and ice storms across the U.S. and Canada resulted in lost revenue when several state and local governments opted not to have students make up lost days at the end of the school year. Since the added costs for wages, fuel and snow removal had already been incurred and expensed, those revenues were not recovered. Lowering Maintenance and Operating Costs It costs less to run a good operation than a bad one, and our fleet management team has done a great job in lowering our maintenance and operating costs. They now gather data on everything from mileage to driver behavior and engine diagnostics, and have implemented an innovative purchasing system to further drive down costs. This process took more than a year to perfect, but the systems are in place and the results are beginning to show. Our fleet management team is working closely with our local operators who use real - time data to streamline routes, reduce the number of vehicles needed and help drivers operate their buses more efficiently.
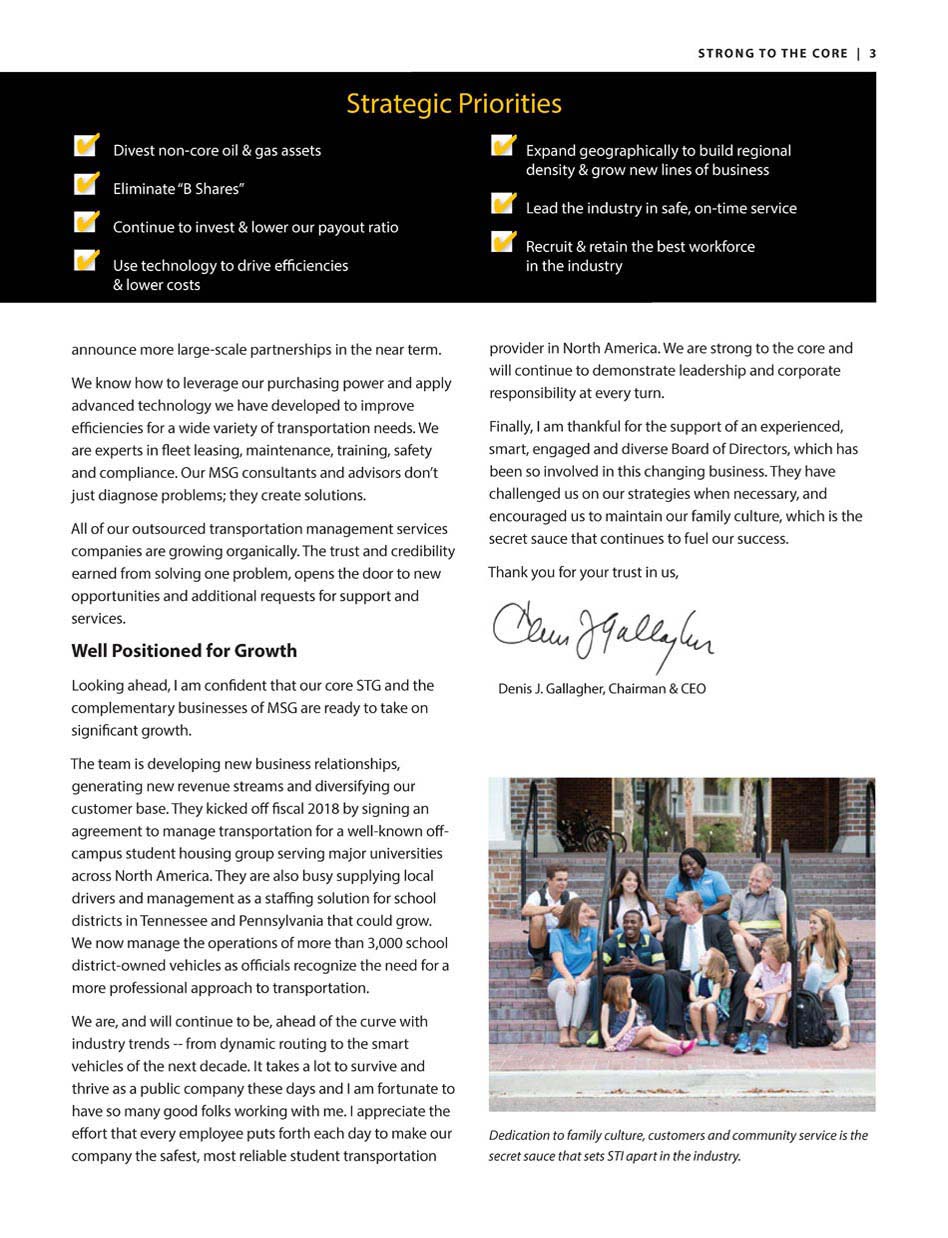
STRONG TO THE CORE | 3 Strategic Priorities Expand geographically to build regional density & grow new lines of business Lead the industry in safe, on - time service Recruit & retain the best workforce in the industry announce more large - scale partnerships in the near term. We know how to leverage our purchasing power and apply advanced technology we have developed to improve efficiencies for a wide variety of transportation needs. We are experts in fleet leasing, maintenance, training, safety and compliance. Our MSG consultants and advisors don’t just diagnose problems; they create solutions. All of our outsourced transportation management services companies are growing organically. The trust and credibility earned from solving one problem, opens the door to new opportunities and additional requests for support and services Well Positioned for Growth Looking ahead, I am confident that our core STG and the complementary businesses of MSG are ready to take on significant growth. The team is developing new business relationships, generating new revenue streams and diversifying our customer base. They kicked off fiscal 2018 by signing an agreement to manage transportation for a well - known off - campus student housing group serving major universities across North America. They are also busy supplying local drivers and management as a staffing solution for school districts in Tennessee and Pennsylvania that could grow. We now manage the operations of more than 3 , 000 school district - owned vehicles as officials recognize the need for a more professional approach to transportation . We are, and will continue to be, ahead of the curve with industry trends -- from dynamic routing to the smart vehicles of the next decade. It takes a lot to survive and thrive as a public company these days and I am fortunate to have so many good folks working with me. I appreciate the effort that every employee puts forth each day to make our company the safest, most reliable student transportation provider in North America. We are strong to the core and will continue to demonstrate leadership and corporate responsibility at every turn. Finally, I am thankful for the support of an experienced, smart, engaged and diverse Board of Directors, which has been so involved in this changing business. They have challenged us on our strategies when necessary, and encouraged us to maintain our family culture, which is the secret sauce that continues to fuel our success. Thank you for your trust in us, Denis J. Gallagher, Chairman & CEO Divest non - core oil & gas assets Eliminate “B Shares” Continue to invest & lower our payout ratio Use technology to drive efficiencies & lower costs Dedication to family culture, customers and community service is the secret sauce that sets STI apart in the industry.
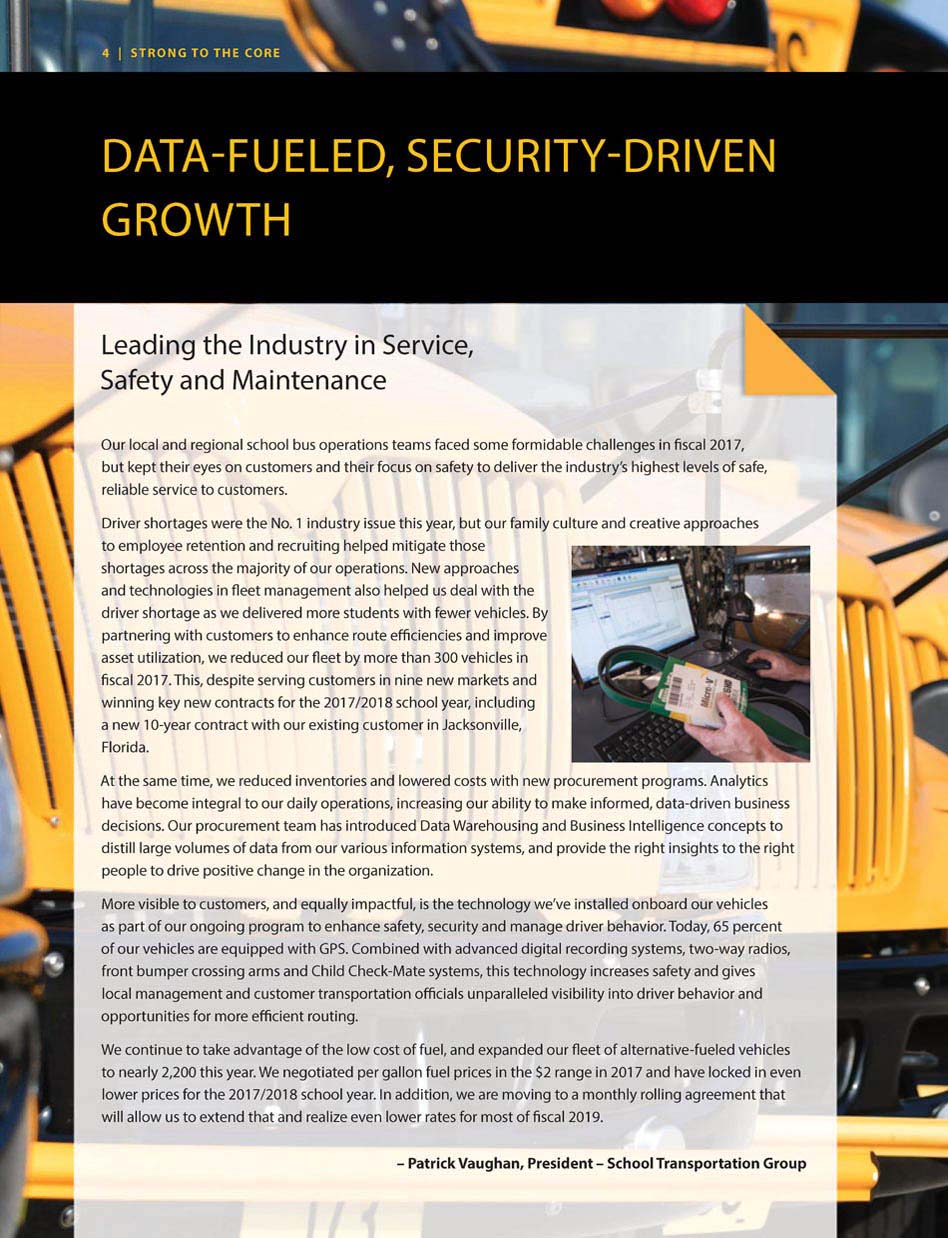
4 | STRONG TO THE CORE L e a d In dustry v i t y an d M n t a al school bus operations tea ms faced some formid ab ge s in fisc al 2 01 7, e t r the indus ry’s high e s a f e, bu ke pt the ir ye s o customers and th e i o c i b le r v t s r mi c l tu re and c ea p r a ch s ar , u e t o se Dr iv s ho r t ag e w er th No n d ry i ue hi t o e m l o y e r e t n t i o an d e cr u i n g el p d ti g s h or ta g e s a o s he aj or t y of ur o e on N d te ch no lo gi s i n fle et m ag e en al s hel e d dr v er s ho rt a as w e de li ve e d re s u de ts i th pa rt neri ng w it h cu st r s to e nh a ce as util z at io , we re d ced r fle t b t e ffi ie e t s i in n 17 01 s o ol e de it e rv in g cu co t ra s fo th e nt ct w t h o r exi i n g us t m in a p o he d l w th t e v e ic le . B y ie d i m p 0 hi c i rk t s a d , i c di g k n i ll e, fis c 20 1 Th i i n i n g k e y ne 10 - y r l id a At t he m ti w e e d e d nven r i e n ha e b c in t gra t o r da il y o r at n l er e c ts it h e pr cur em en t pro ra ms An a yt i s n c ea s g r bi i y t ke inf orme d, d t dr v n b u in e s de c i si o s. O r p ocur ment t a m ha in t od ed Dat W a e u i n g a d Busi ne ss Intelli e e o nc e p s t o distill large volumes of dat fro o r var o s nfor tion s ystems, an d provide the righ in s gh t o th ri gh t people to drive positive change in the organization. t , o og y we’ve in c e sa fety, security and man ag le d d o icles b eh a y , 6 5 p e nt More v is ib le t o st om s, qu ly p ar of our ng oi g ro gr a t o e of o ur v ehicles e equipp ed with G i n d w h adv n ed d gital re co rding sy st ems, two - r ad io s, s d front bumper crossing arms and Child Check - Mate systems, this technology i c eas es safety and gi local mana gement and custo mer transp orta tion officia ls u nparalle led visibi lity i nt o driver behav o oppo rt unities fo r more e fficient rou ti ng . We continue to take advantage of the low c ost of f el, and expanded ou r fleet f a ternative - fueled e icles to nearly 2,200 th is y ea r. W e nego ti at ed p e gallo fuel prices in t lo w pric f the 201 7/20 18 ch ool y a In ad it ion, we are will xt d th t nd li lo tes for most $ 2 r a ng e i n 201 7 an d h a v e l c ke d e v e n ing to a monthly ro ll in agree e th f fis cal 20 1 . – Patrick Vaugha n, President – School Transportation Gro up DATA - FUELED, SECURITY - DRIVEN GROWTH
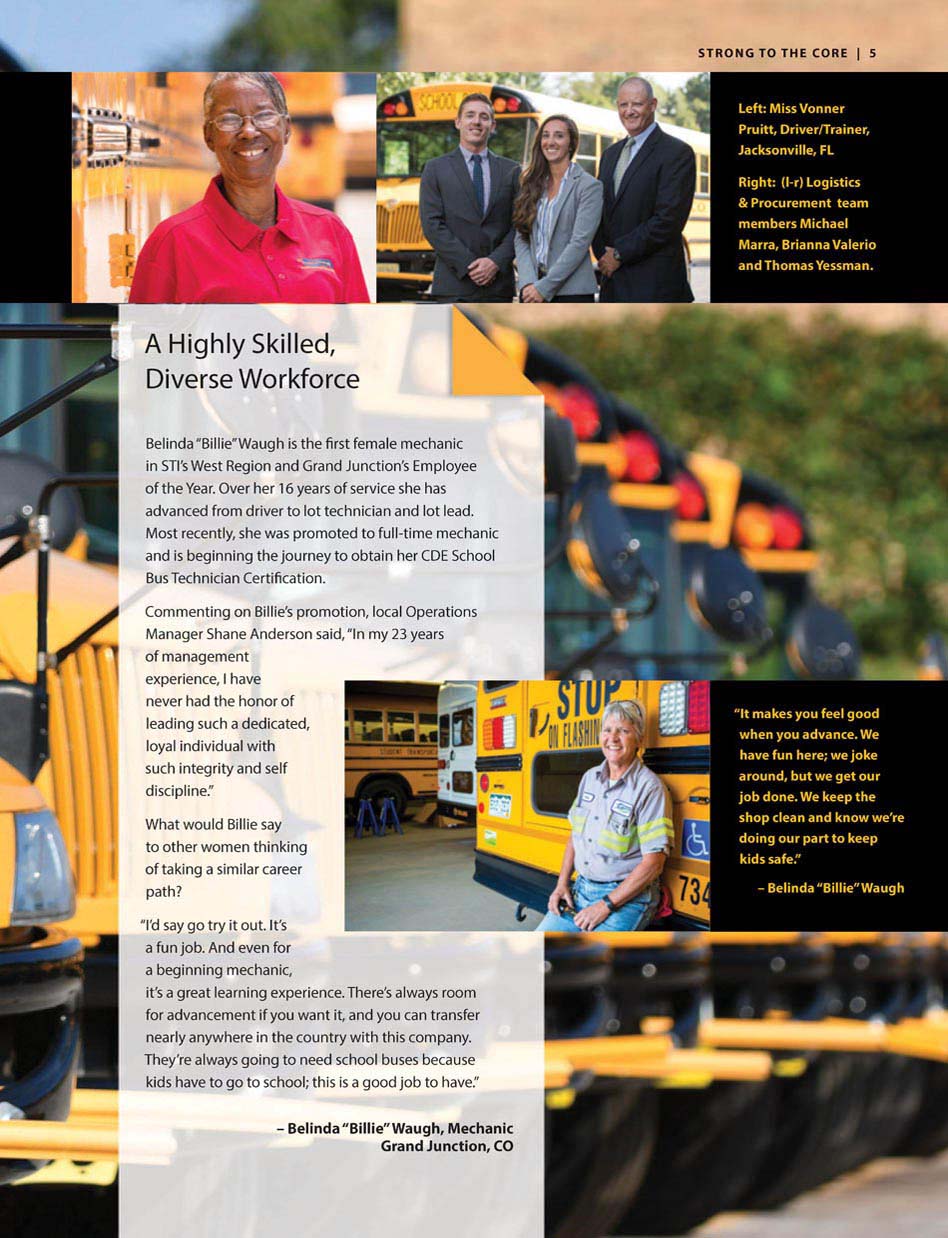
ST T C O E 5 Left: Miss Vonner Pruitt, Driver/Trainer, Jacksonville, FL Right: (l - r) Logistics & Procurement team members Michael Marra, Brianna Valerio and Thomas Yessman. “It makes you feel good when you advance . We have fun here ; we joke around, but we get our job done . We keep the shop clean and know we’re doing our part to keep kids safe.” – Belinda “Billie” Waugh Hi hly Sk , D i W f rc B e in d a “B il li e” W au gh i th e fir st f male m chan c S I ’s W e t Regio a nd G and J n ction’s Employee o t e Y ea r. O ver h 16 ye rs of s e rvice sh e ha s a ed f m driv t o st recen tl y, she w s pr o is beg nni g t he jo t n ci an and lot l ea d. o te d to ful l - time m ec h a i c y t o ob t a in h r CDE Sc h o l u e ch ni ci an C tifi o e ti B tion lo al Oper at i o Mana ge r Sh a n derson sai d, y 23 f a g e ent p ri ce , I ha ad th h o e d g ch d ed c at d o al n iv du al wit h h nt g i ty s e l f i i li ” at d B il lie sa o t h w om en t h i n g er f a in g a si mi lar c path ? “I’d say g tr it u a fun jo b A nd v a be gi nn in g echanic, it’s a gre at l earning ex peri n ce . There’s always roo m for advancement if you w an t it, and you ca n transfer ne a ly any w er e i t he c nt ry w i h th is c om pan y Th ey re always g oin to e d ch e ki ds have to g o to choo l; hi s is a g ood jo b to h av e. ” – Be linda “B illi e” W g h, Mechan ic Junction , CO

6 | STRONG TO THE CORE “STA’s culture is about taking care of the client and taking care of staff, which means they do a better job taking care of the process.” – Phil Onofrio, Chief Operations Officer, School District 51, Mesa County Valley, Grand Junction, CO When a freezin g drizzle crea ted hazardous ro ad condi tions that cause d road closures, accidents an traffic gridlock in Columbia, Missouri last wi nter, STA dr iver s, mechani cs and staff worked through t he night to get stu dents and fac lty h om saf l In an ope n le tt er to the co mmunity, the Superintende of Columbia P c S h o ols raise STA: At 1 a.m. th s morning, Student Tra sp rtati of Am c a gav s t e all clea r to s i gn fy tha t a l of o r child r en w e r e ho m e sa f el y . I a m wr i t in g t h s e t e r t o t h nk y u r y pa ti e c e a n d t o e n i z e th a t a n y people made yes erday go s well s it possi ly coul d have one. T he re a re o ma ny exa m p le s to b e sh r ed. The stories are in pi ing nd a rem nder hat s man y p eop l c on tr ib ut ed to last nig ht’s cce se . Thank you to the STA bus drivers and the mec hanics w r ki n g beh i d th sc nes who a e being hailed a s heroes. Stude t T sportation of America show ed us a ll t at ou r ch e n tt and t he ir saf ety is a p ior i y. Yesterday c uld ha ended e y di eren y. E ver yo as caugh t off gua rd with how qu ick y ro ad co d tio changed – i ty nty and s ate. Th tim ng f the w ather and the size of our dist r ct ould no hav e allowe d u be gin dismissal proce ses any ea l ier. W w re adv is e to wait for r eg u r ism ss a r de r to all o w tim e f d s t o b e t r e a t e d , f or th e g r u n d t empe r a u r e t i e a d f o r bu s driv er s t o ake i t a f e ly to dri ve aft r o r tes. We sho ul d be proud f wh t we accomplishe d last ni ght for ou r kids. Over the next few weeks, our tea will c ome tog er to ev ew proce e . Ev er y ev ent provides an opportunity to be e r. – Peter St ieplem u per nt en umbi a (Missouri) Public School Gene Kowalczewski, Sr. Vice President of STI’s Eastern Business Group, and Denis Gallagher, Jr., Vice President of Operations for the Southeast Region, (l - r) led the STA team that doubled the size of its operations in Jacksonville, FL, with a new 10 - year contract with Duval County Public Schools.
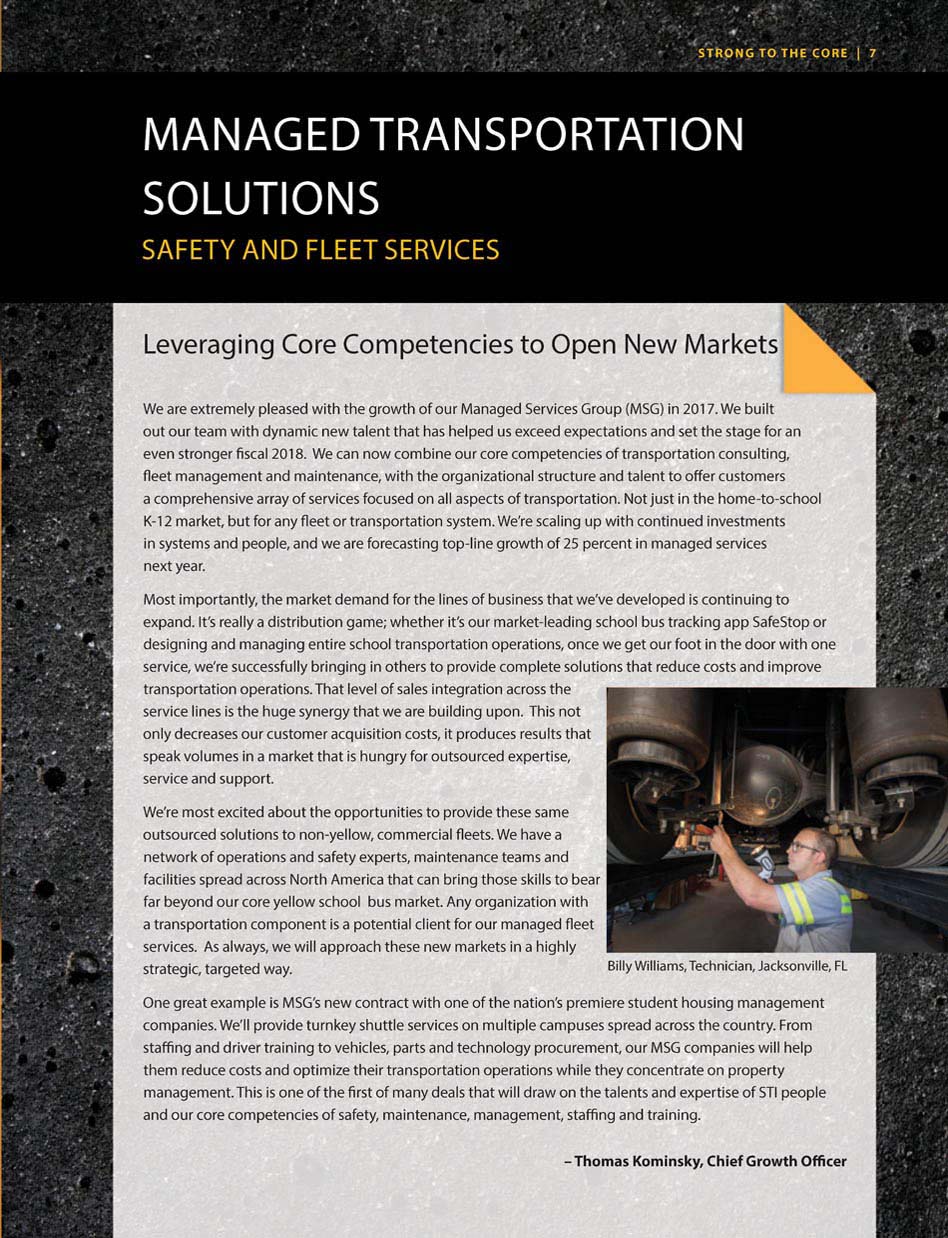
SAFETY & FLEET MAINTENANCE CONSULTING STRONG TO THE CORE | 7 Billy Williams Tech ni cia Jack onvil le FL MANAGED TRANSPORTATION SOLUTIONS SAFETY AND FLEET SERVICES L verag ng Co e Co m p ete es t o O p e n N e w Ma r ke t s We are e xt re me ly p le as ed w th th e gr ow th of our Manage d Se rv ice G o up (MS G) in 2017 We b ui t ou t ou r te am w th dy na mi c new tale nt t ha t ha s he lp ed u s ex ceed e xp ectatio s a d set the st ag e fo r an v en stron ge fis cal 2018 We ca n no w co mbin e ou co e c ompe te cie of tr n por ation c ns u ting fle et m n agem ent an d mainte n nc e, with th e or ganizational struc tu e and talen t to o ffer cu stom er s compre he ns ive ar ay of s e vi ce s focu se d on a ll a spects o f tra sp o tati on No t just n the home - to - school K - 12 m arke t, b ut f or any flee t o t ra ns port ation sy st em We’re sc al in g up wit h co nt in ue d invest me nt n s ys tems and p eo pl e, nd we a e fo eca st ing top - li ne g o wt h of 25 perce t in m a ag ed serv ces next y ear. Mo st i mpor ta nt ly th e ma rk et d em a d fo r the li ne s of b u ines s th at w e’ ve d evel pe s continui ng to x pand It s reall y a di st ibu ti on g ame; w he th er t’ s ou r ma rket - l ea ding sc o bu s tr ac king app SafeSto p or de s gn g a d m a ging e nt r e sc ho ol t a nspo rtat io op er at ns on ce we ge t our fo ot in the do or w ith one se rvice, we’ re succe ss full y br ingi ng i n others t o provid e comp le te solutions that e du ce c ts a nd mp ove tr an sp orta tio o pe ra tion s. That level of al es ntegra tion a cr os s th e servic e line s s the huge synerg y th at w e ar e bu i d ng pon Th is not only d e e ases our c usto me r a qu is it io costs, it pr od uc es ul ts tha t sp ea k vo lu me n a m ar ke t that is hu ng ry f out so urced e pe t is e, se rv ic e an d s pp r t. We ’re most e xcited about the o pp or tu ni ti es t o pr ov id e these same ou ts ou rc ed ol utio ns t o non - yellow c mmer ci a flee ts We h av e a netw or k of pe a ti on and safe ty e xp erts ma in te na c e te ams nd faci lities pr ea d acros N or th A me r ca t ha t ca n br ing th os e skills t o e ar far beyond o ur c or e yell ow school b us m ar ket. A ny organizatio with tran sp ortati on com po ne nt s a pote nt ial c ient f or ou man ag ed fl ee t s rvices . As alwa ys , we w ill ap proach t he se n ew m rke ts i n a highly st a te gic, tar ge te d wa y. On gr ea t example is M SG s n ew contract w th o ne of the na ti on ’s prem er e st uden t ho using ma na ge me nt companie s. We’ll p ro v de tu nk ey shuttle s er vi ce s on m ulti ple ca mp us es prea d acro s t he country . Fr om staffing a nd dri ve r tr a ning t o ve hi cles parts and te ch no logy p ro cu reme nt ou MSG mp an ie s w l he p them reduce cost s an d opti mi ze t heir t a nspo rt at io n op r atio ns w hile t hey conce tr ate p ope rt y a nagement Th is s one of the firs t of many de a s th at w i l dr aw on the ta le nts and ex pertis e of STI people an d our co e com pete ncie s of s af et y, a nt en an c manage me nt staffing a nd t r n in g. Thomas Kominsky, Chief G o wth Offi ce

STR D e Sa f e ty, Se c u r i t y & I mpr ove d Pe r for m a SafeStop is on a roll, m ore t h a n d o lin o the th ir d year in a ro w. By th e en d of fiscal 2 0 7, over 20,000 parents an d guar d ha d re gi 3, 500 ve hicles and adding to that us u f r t e p p, w hi ch i s no w tr acki m ore th an n a ddit io o b e g prime c nica t n s an d sa fe ty t ool f or pa r ent s , Sa f eS t o p i s p r o v ing it s w o r t a n p o r i n r o f es a d m in creasi ngly rely on its data and analytics to b uild m o e co st - ff v r an sp i on st m o s w ho Sa fe St op nd o d a p s nt cti on able insights t o Analytics platform is help in g transportation sta ffs turn th im prove routing, s afety and perf ormance. By the start of fiscal 2018 , more than 97 percent o f our custom ers ha d re tu the prior scho ol ye ar, an d we ’d launched new SafeStop service s fo r school dis tricts, contra ctor s an d shuttle systems in Ma in e, C onne cticut , New Jersey, South Carolina, Alab am a, Tex as, Co lo ra do , Il li no is, Indiana, W is co ns in , Missouri, Oregon and Manit ob a, Canada . High sales vity at the sta rt of the school year should broa en ou ba n furthe SafeStop continues to deepen our relationships with current customers, and open doors for other lines of MSG we i w scho o d t cts contracts with transpor t d bey ond o u r current o e As children he a b k to sch o , and paren s a d rid s ac ss th e n t i n t s k , “ Wh e r e ’ t h s? ” t s o s t ro id thh t an Pa ric k Ga la her Di rect r f S e Saf e S top Our industry - leading SafeStop app is making life easier for parents and opening doors to new customers for all STI business units. · K - 12 municipal & private fleets · Fleets owned & operated by school districts · Commercia l fl eets · Enterprise fleets · Muni, state & federal fleets MSG M · K - 12 municipal & private fleets · College & univ. shuttle · Local, county & state gov’t S T G Training Management & Sta ffi ng Consulting Fleet Operations & Maintenance S a f e ty Core Competencies · College & univ. shuttle · Direct - to - parent transport
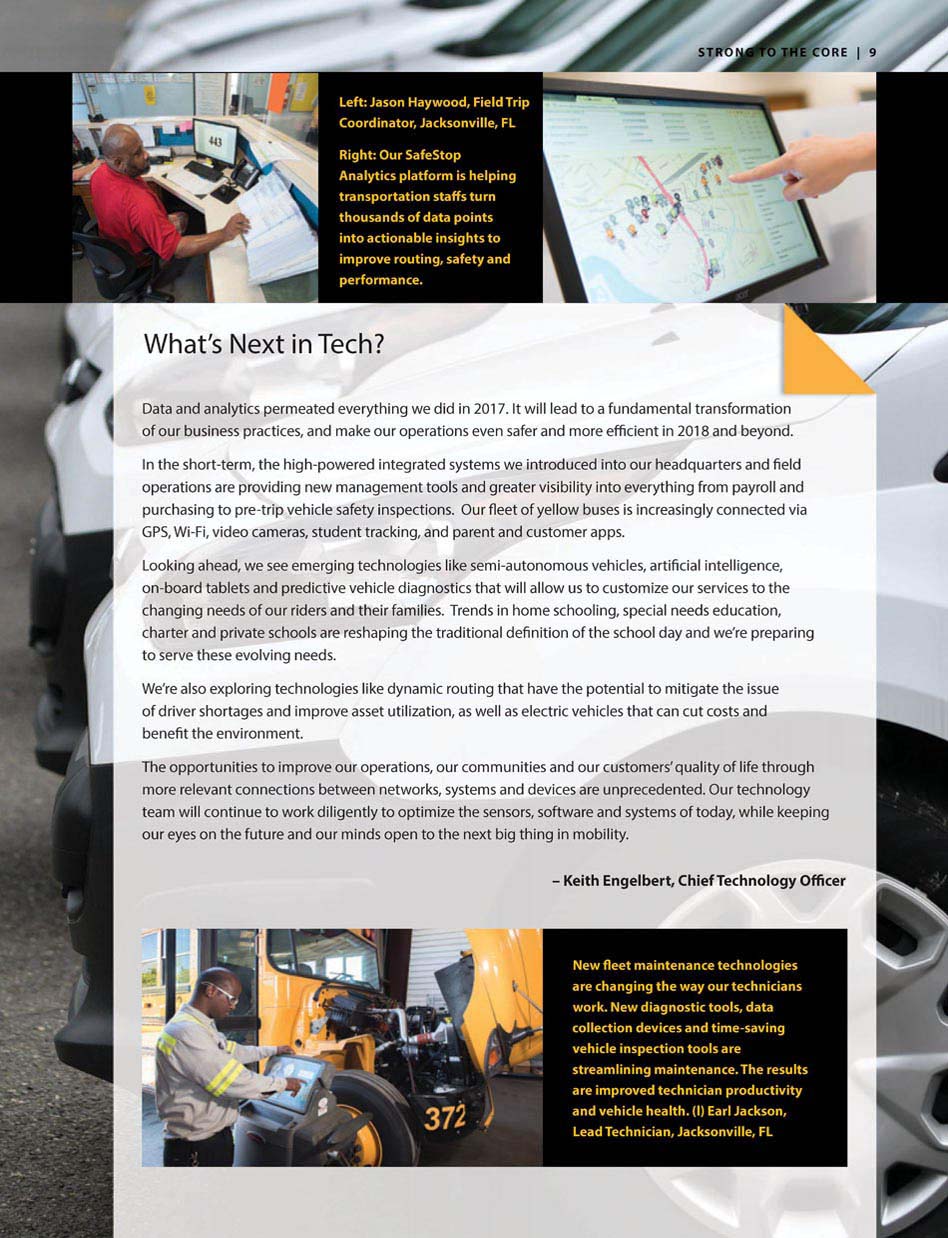
OR New fleet maintenance technologies are changing the way our technicians work. New diagnostic tools, data collection devices and time - saving vehicle inspection tools are streamlining maintenance. The results are improved technician productivity and vehicle health. (l) Earl Jackson, Lead Technician, Jacksonville, FL Left: Jason Haywood, Field Trip Coordinator, Jacksonville, FL Right: Our SafeStop Analytics platform is helping transportation staffs turn thousands of data points into actionable insights to improve routing, safety and performance. W h Da ta a nd analy ti e at ed eve ry th in g we did i n 20 17 . It wil l lead t o a fu ndam enta l tr an sfor mation o f o ur b si n p r c ti c e s , an d m ak e ou r op eratio ns e v e n sa f e r an d mo r e effic ient i n 20 1 8 n d b e y d. In the short - t r m, the high - po we red inte grat ed syste s operatio ns are p viding n ew m an age s and gre d ibili ty i n r h ad quar te rs and field er yt hi ng from payr oll an d w e i s increasingly c on nect ed via afety nsp t . O fl e o f ude nt c in g, a nd p t d tom er a pp s. pu rc ha si ng t o pr e - tr ip v eh GP S, W i - Fi, vi de a m Lo ok n a ead, e e n - boa ch ngi ng ablets and pre dict iv e ds of our ride rs o ke s i - autono mo us vehicles, artificial i nt el ligence, ehicl e di agn os ics that will al lo w us to customiz e ou r services to the th e s. Trends in ho me schooling, sp ecial needs educatio n, ap ng th e tradit ional defin ition of the schoo l day and we’re prepar in g c ha te r a n d priv at e schoo to the se evolving need . We ’r e al so e xploring technologies li ke d ynam ic routing tha t ha ve the potential to mi ti ga te the issue of driver shortages and improv as se t utilizat ion, as we ll as electric vehicles that can cut costs benefit t he environment. The op po rtunitie s to i mprove o ur perations, our c om munities a nd our ustomers’ quality of life through more relevant co nn ec tions be tw ee n etwor ks, systems and de vi e re unprecedented. Our technology team will continue to work diligentl y to o ptimiz e the se ns ors, software and systems of today, while keeping our eyes on the future a nd our m in ds open to the next big thing in mobility. – Keith Engelbert, Chief Tec hn o og y Offi ce
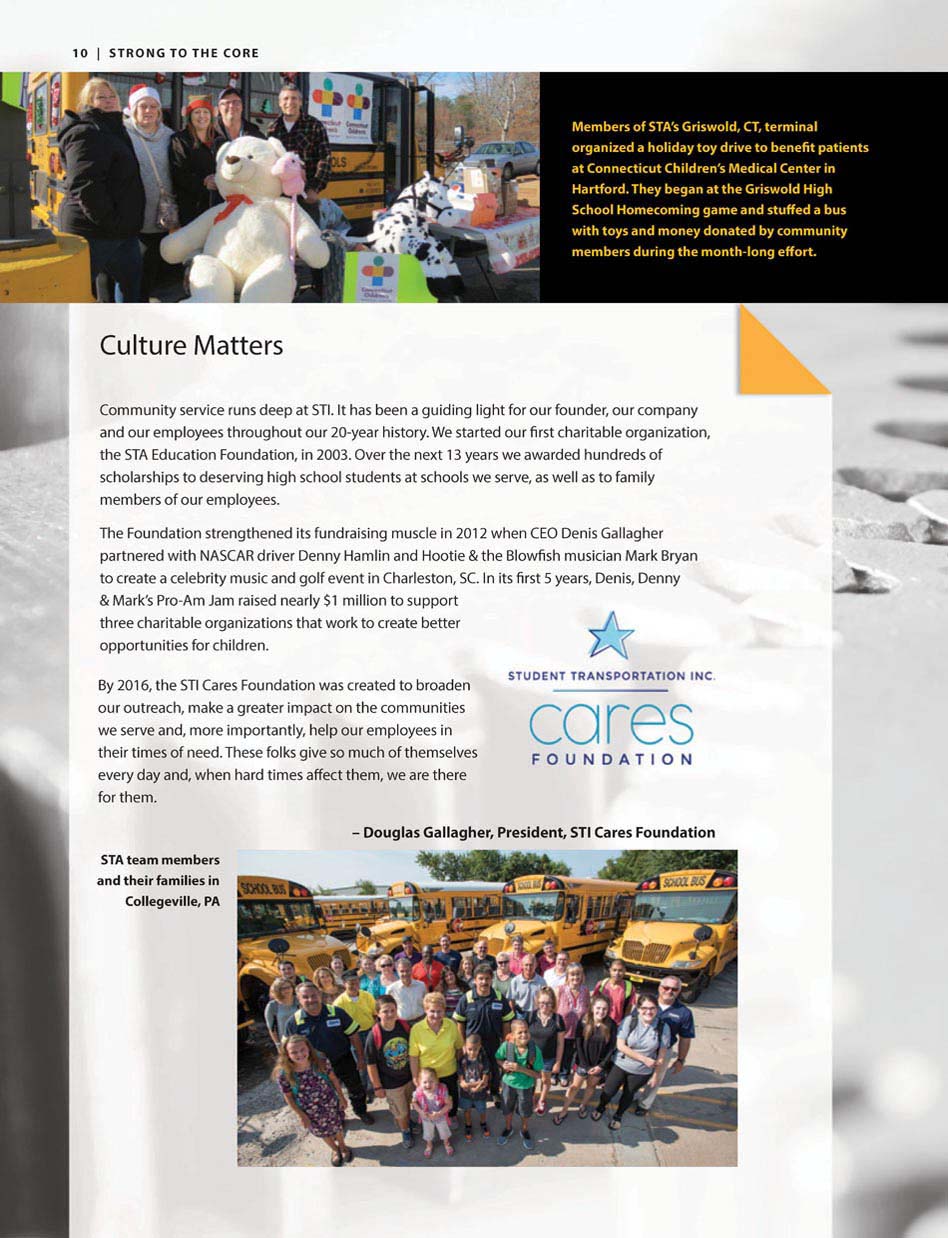
10 | STRON G T O THE CORE S T A t e mem be rs and th r families in Co egeville, PA Members of STA’s Griswold, CT, terminal organized a holiday toy drive to benefit patients at Connecticut Children’s Medical Center in Hartford. They began at the Griswold High School Homecoming game and stuffed a bus with toys and money donated by community members during the month - long effort. Cu t ure M a tters Comm unit y service ru ns deep at STI. It has bee n a gu id in g li gh t for our founder, our company an d our employ ee s throughout our 20 - year h istory. We started our first charitable org anizatio n, the STA Education Foundation, in 2003. O ve r the next 13 years we a wa rded hundreds of sc holarships t o de serv in g high s ch ool st udents at schools we s er ve, as well as to fami ly me mbers of our emp loye es. The Foundation strengthene d its fu nd rais ing muscle in 2012 when CEO Denis Ga ll ag her partne re d with NAS CA R driv er Denny Hamlin and Hootie & the Blowfish m usician Mark B ryan to create a celebrity music an d go lf event in Charleston, SC. In its first 5 years, Denis, Denny & Mark’s Pro - Am Jam ra is ed nea rl y $ 1 million to support three charitable organizat io ns tha t work to cr eate bet ter opportun ities for chil dren . By 2016, the STI Car es Foundation wa s crea ted to broaden our outreach , ma ke a greater i mp a t on the commu niti we ser ve a nd , more i mp ortant ly , h elp r e mp lo ye es i n thei r ti ee d. T he se fol ks g iv so h of thems el ve s ever y ay and, he n ha rd t im es a ect them, are th e e fo th – Dougla a ll a g e , President, Ca re s Fo undation
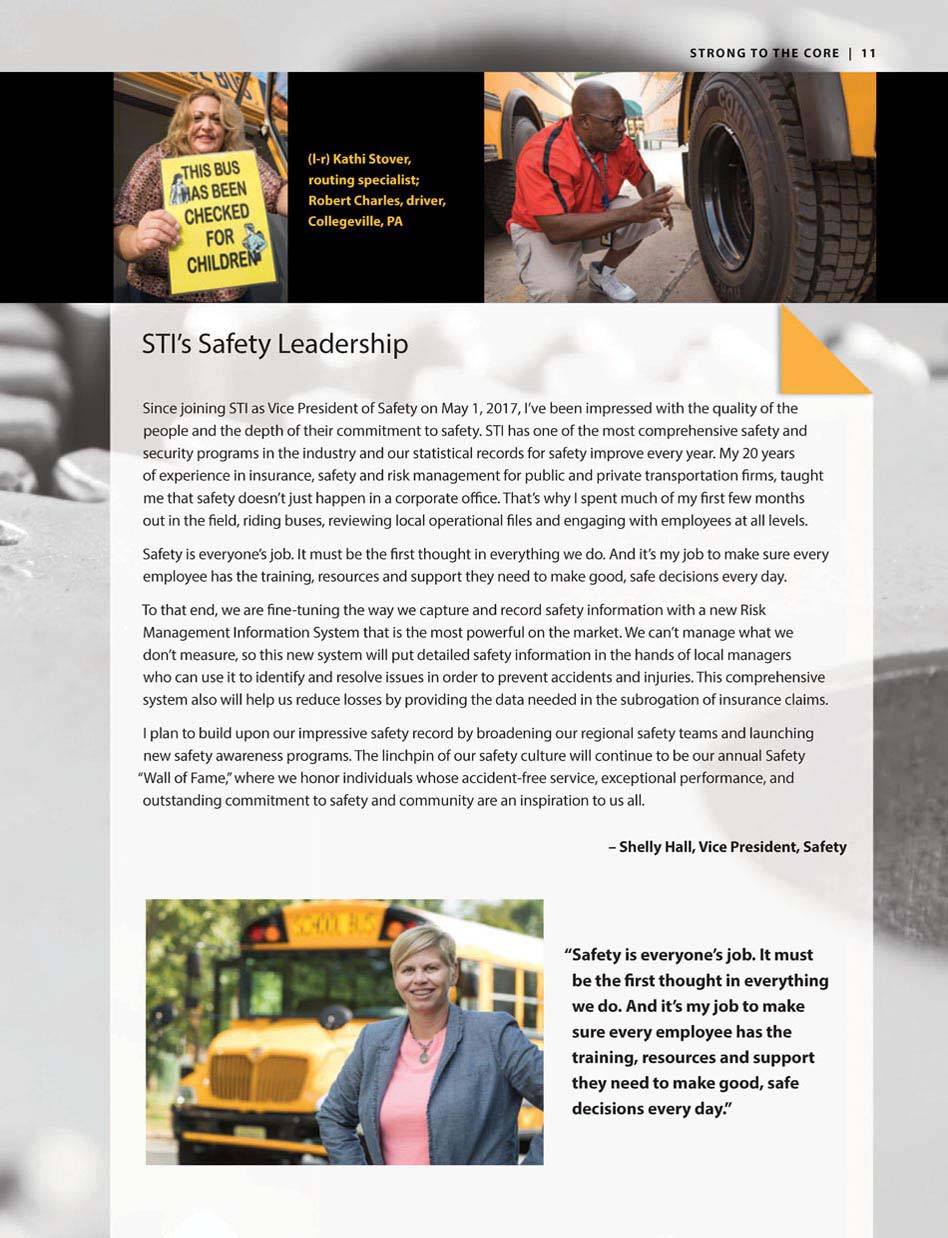
E (l - r) Kathi Stover, routing specialist; Robert Charles, driver, Collegeville, PA Safety is everyone’s job. It must be the first thought in everything we do. And it’s my job to make sure every employee has the training, resources and support th ey need to make good, safe decisions every day.” STI S a f y Le d e rs h Since i in STI as Vi e Pr esident of Sa y on M ay 1, 2017, I’ve been impresse d with the quality of the pe p le and the d ep o f th ei r commitment t o safety. STI has one of t he mos t co mprehe ns iv e safety and ri ty p ro grams in the industry and our statistical records fo r safe ty imp rove e very yea r. M y 20 years of experience in insurance, safety and risk management for public and pr iv ate tran sp ortation firms, tau gh t me that safety doesn’t just happen in a corporate office. That’s why I spent much of my first few months out in the field, riding buses, reviewing local operational files and engaging with employees at all levels. Safety is everyone’s job. It must be the first thought in everything we do. A nd i t’ s my job to ma ke s ur e every employee has the training, resources and support they need t o make good, safe decisions ever y da y. To that end, we are fine - tuning the way we capture and record safet y in form at ion with a n ew R is k Management Information System that is the most powerful on the marke t. We ca n’ t ma na ge w hat we don’t me asure, so this new system wi ll put detailed safety information in th e hands of l oc al managers who can use it to identify and resolve issues in order to prevent accidents and injuries. This comprehensi ve system also will help us reduce losses by providing the data needed in the subrogation of insura nc e clai m . I plan to build upon our impressive safety record by broadening our regional safety team s n d aun hing new safety awareness programs. The linchpin of our safety culture will continue to be ou r nnual Saf t “Wall of Fame,” where we honor individuals whose accident - free service, exceptional pe rf rmance, and outstanding commitment to safety and community are an inspiration to us all. – Shelly Hall, Vic e Pr e ide t, Saf ty

O R E “STI’s drivers, dispatchers, mechanics and others wore blue shirts on October 3rd and throughout the month in a show of solidarity against bullying, on and off the school bus. Blue Shirt Day is a simple way for STI and our employees to show our communities that we will not tolerate bullying, and that driving bully - free buses is of the utmost importance to our drivers. When 15,000 people stand together for something like the safety, protection and happiness of our school children, that sends a powerful message.” – Nick Pizzo, Director of Organizational Development S fety W f a EO D is Ga lag he nd S I’s le ad er ship t ea m honored 5 company plo ye t nnua l Safe ty W all of Fame awards dinner in la 2016 Th n t Wal of Fa me nductees w re ho or ed for their e xt r o din ry t n w ver ng c om mi tm ent o af ty. Ca o W d ol lo - R dge , PA Cr in Peredo: V s a CA Da v d M ar t i n I: Washingt n, VT De bor h D eV llez : Griswold C Edw rd L am : Girard, PA Jame s Nic kelberr : O n o C A Jose or res: Sa n J ose, CA Kermit Belz : La o ista, T X Lilyan DeV ito Spr ngfield, PA M e odie itzpat ick: Dan bu ry, CT P atr a Ko ate rfor d, CT Regina Fr nteras : Me ridian , ID Ro b n Reeves : Burl eson TX ance: Orillia Ca na da Veronica Cantarero: Los An geles, C A o n r , o l g e i ll , P A
STRONG TO THE CORE 13 STUDENT TRANSPORTATION INC. MANAGEMENT’S DISCUSSION AND ANALYSIS OF FINANCIAL CONDITION AND RESULTS OF OPERATIONS The following Management’s Discussion and Analysis of the Financial Condition and Results of Operations of Student Transportation Inc., is supplemental to, and should be read in conjunction with, the financial statements and footnotes for the period ended June 30, 2017. These financial statements can be found on SEDAR at www.sedar.com . As an SEC issuer (as defined under applicable Canadian securities laws), Student Transportation Inc.’s financial statements are prepared in accordance with United States generally accepted accounting principles (“US GAAP”). The information in this Management’s Discussion and Analysis of the Financial Condition and Results of Operations is effective September 20, 2017. Additional information about, and the Annual Information Form filed by, Student Transportation Inc., is also available on SEDAR at www.sedar.com. All references to “ $ ” or “US $ ” are to U . S . dollars and all references to “Cdn $ ” are to Canadian dollars . All references to the Company are to either Student Transportation Inc . or to STI and its subsidiaries, as the context requires . Unless the context requires otherwise, references to years are to the Company’s fiscal year ended June 30 . Forward - Looking Statements Certain statements in this Management’s Discussion and Analysis (“MD&A”), including without limitation in the sections of this MD&A entitled “Results of Operations”, “Liquidity and Capital Resources”, “Commitments and Contractual Obligations” and “Quantitative and Qualitative Disclosures About Market Risk” are “forward - looking statements” within the meaning of applicable securities laws, which reflect the expectations of management regarding the Company’s revenues, expense levels, seasonality, liquidity, profitability of new business acquired or secured through bids, borrowing availability, ability to renew or refinance various loan facilities as they become due, ability to execute the Company’s growth strategy and cash distributions, as well as their future growth, results of operations, performance and business prospects and opportunities. Forward - looking statements generally can be identified by the use of forward - looking terminology such as “may”, “will”, “expect”, “intend”, “estimate”, “anticipate”, “believe”, “should”, “plans” or “continue” or similar expressions, and negative forms thereof, suggesting future outcomes or events. These forward - looking statements reflect the Company’s current expectations regarding future events and operating performance and speak only as of the date of this Management Discussion and Analysis. Actual results may vary from the forward - looking statements. Specifically, forward - looking statements involve significant risks and uncertainties, should not be read as guarantees of future performance or results, and will not necessarily be accurate indications of whether or not or the times at or by which such performance or results will be achieved. A number of factors could cause actual results to differ materially from the results discussed in the forward - looking statements, including, but not limited to, the factors referred to and incorporated by reference under the heading “Risk Factors” such as an inability to control the Company’s operating expenses, significant capital expenditures, the Company’s ability to retain or renew its customer contracts, find suitable business for acquisition and identify conversion opportunities and win bid contracts on profitable terms, the Company’s consolidated indebtedness and restrictive covenants related thereto, the Company’s ability to make payments on its convertible debentures, the Company’s acquisition strategy, increased industry competition and consolidation, reliance on certain key personnel, the possibility that a greater number of employees will join unions, rising insurance costs, a lack of insurance coverage for certain losses, new governmental laws and regulations, environmental requirements, seasonality of the industry in which the Company operates, any inability to maintain letters of credit and performance bonds, the termination of certain of the Company’s contracts for reasons beyond management’s control, the Company’s status as a public company and foreign private issuer for U.S Federal Securities Law purposes, increased disclosure requirements now that we are no longer an emerging growth company status for U.S. federal securities law purposes, reduced spending by school districts and governmental agencies, terrorism attacks, man - made or natural disasters, cyber terrorism and data security breeches and risks related to the Company’s capital structure. Material factors and assumptions that were relied upon in making the forward - looking statements include contract and customer retention, current and future expense levels, availability of quality acquisition, bid and conversion opportunities, current borrowing availability and financial ratios, as well as current and historical results of operations and performance. Although the forward - looking statements contained in this Management Discussion and Analysis are based upon what the Company believes to be
14 STRONG TO THE CORE reasonable assumptions, investors cannot be assured that actual results will be consistent with these forward - looking statements, and the differences may be material. These forward - looking statements are made as of the date of this Management Discussion and Analysis and the Company assumes no obligation to update or revise them to reflect new events or circumstances, except as specifically required by applicable law. General Student Transportation Inc. (“STI” or the “Company”) is a corporation established under the laws of the Province of Ontario. Following the completion of the Share Exchange (see Equity Incentive Plan - Class B Shares), STI owns 100% of the outstanding common shares of Student Transportation of America Holdings, Inc. (“STA Holdings”) and 100% of the outstanding shares of Parkview Transit. No other classes or series of shares of STA Holdings are currently outstanding. STA Holdings, through its wholly owned subsidiary, Student Transportation of America, Inc. (“STA, Inc.”), combined with Parkview Transit, is the third largest provider of school bus transportation services in North America. STI’s common stock and convertible debentures are listed and trade on the Toronto Stock Exchange. Since September 2011, STI’s common stock has also listed and traded on the NASDAQ Global Select Market. Upon the approval of the Company’s Form 40 - F registration statement by the U.S. Security and Exchange Commission in September 2011, the Company became a “foreign private issuers’ under applicable U.S. federal securities laws. Convertible Debentures On June 7, 2011, the Company issued US$ 6.25% convertible subordinated unsecured debentures (the “US$ 6.25% Convertible Debentures”) due June 30, 2018, at a price of US $1,000 per debenture, for total gross proceeds of $60.0 million. On September 19, 2016, the Company redeemed the US$ 6.25% Convertible Debentures in their entirety, (see “Liquidity and Capital Resources - Convertible Debentures”). On November 12, 2013, the Company closed its offering of Cdn$ 6.25% convertible subordinated unsecured debentures due June 30, 2019 (the “Cdn$ 6.25% Convertible Debentures”), at a price of Cdn $1,000 per debenture, for total gross proceeds of $71.4 million (Cdn $75.0 million). On August 16, 2016, the Company closed its offering of Cdn$ 5.25% convertible subordinated unsecured debentures due September 30, 2021 (the “Cdn$ 5.25% Convertible Debentures”), at a price of Cdn $1,000 per debenture, for total gross proceeds of $65.8 million (Cdn $85.0 million). The US$ 6.25% Convertible Debentures, the Cdn$ 6.25% Convertible Debentures and the Cdn$ 5.25% Convertible Debentures are collectively referred to as the “Convertible Debentures”. The net proceeds from the issuances of the Convertible Debentures were used to repay indebtedness under the senior credit facilities, which provided additional borrowing capacity, and for general corporate purposes. During the first quarter of fiscal year 2017, approximately $0.1 million of the Company’s US$ 6.25% Convertible Debentures were converted into 6,736 shares of common stock. The remaining US$ 6.25% Convertible Debentures were repaid on September 19, 2016, (see “Liquidity and Capital Resource - Convertible Debentures”). Each outstanding Convertible Debenture is convertible into common shares of the Company at the option of the holder at any time prior to the close of business on the earlier of the business day immediately preceding the maturity date or, if called for redemption, on the business day immediately preceding the date fixed for redemption, at a conversion price of US $9.50 per common share (the “US$ 6.25% Convertible Debenture Conversion Price”) which was equivalent to 105.2632 common shares for each US $1,000 principal amount of US$ 6.25% Convertible Debentures, at a conversion price of Cdn $9.05 per common share (the “Cdn$ 6.25% Convertible Debenture Conversion Price”) which is equivalent to 110.4972 common shares for each Cdn $1,000 principal amount of Cdn$ 6.25% Convertible Debentures and at a conversion price of Cdn $9.35 per common share (the “Cdn$ 5.25% Convertible Debenture Conversion Price”) which is equivalent to 106.9519 common shares for each Cdn $1,000 principal amount of Cdn$ 5.25% Convertible Debentures.
STRONG TO THE CORE 15 The US$ 6.25% Convertible Debentures were not redeemable prior to June 30, 2014. The Company had the right, at its option, to redeem the US$ 6.25% Convertible Debentures in whole or in part, from time to time, after July 1, 2014, but prior to June 30, 2016, on at least 30 days’ prior notice at a redemption price equal to par plus accrued and unpaid interest, provided that the weighted average trading price of the common shares on a recognized exchange for the 20 consecutive trading days ending five trading days prior to the date on which the redemption notice is given is at least 125% of the US$ 6.25% Convertible Debenture Conversion Price. After June 30, 2016 and prior to maturity, the Company had the right, at its option, to redeem the US$ 6.25% Convertible Debentures in whole or in part, from time to time, on at least 30 days prior notice at a redemption price equal to par plus accrued and unpaid interest. On September 19, 2016 the Company redeemed the remaining US$ 6.25% Convertible Debentures in their entirety, (see “Liquidity and Capital Resource - Convertible Debentures”). The Cdn$ 6.25% Convertible Debentures are not redeemable prior to June 30, 2017. The Company will have the right, at its option, to redeem the Cdn$ 6.25% Convertible Debentures in whole or in part, from time to time, on or after June 30, 2017 but prior to June 30, 2018, on at least 30 days prior notice at a redemption price equal to par plus accrued and unpaid interest, provided that the weighted average trading price of the common shares on a recognized exchange for the 20 consecutive trading days ending five trading days prior to the date on which the redemption notice is given is at least 125% of the Cdn$ 6.25% Convertible Debenture Conversion Price. After June 30, 2018 and prior to maturity the Company will have the right, at its option to redeem the Cdn$ 6.25% Convertible Debentures in whole or in part, from time to time, on at least 30 days prior notice at a redemption price equal to par plus accrued and unpaid interest. The Cdn$ 5.25% Convertible Debentures are not redeemable prior to September 30, 2019. The Company will have the right, at its option, to redeem the Cdn$ 5.25% Convertible Debentures in whole or in part, from time to time, on or after September 30, 2019 but prior to September 30, 2020, on at least 30 days prior notice at a redemption price equal to par plus accrued and unpaid interest, provided that the weighted average trading price of the common shares on a recognized exchange for the 20 consecutive trading days ending five trading days prior to the date on which the redemption notice is given is at least 125% of the Cdn$ 5.25% Convertible Debenture Conversion Price. After September 30, 2019 and prior to maturity the Company will have the right, at its option to redeem the Cdn$ 5.25% Convertible Debentures in whole or in part, from time to time, on at least 30 days prior notice at a redemption price equal to par plus accrued and unpaid interest. The Company may at its option, subject to applicable regulatory approval, elect to satisfy its obligation to pay the outstanding principal amount of the Convertible Debentures in whole by issuing and delivering common shares for each Cdn $1,000 principal amount of the Cdn$ 6.25% Convertible Debentures and the Cdn$ 5.25% Convertible Debentures. The amount of common shares delivered is obtained by dividing each principal amount of Convertible Debentures by 95% of the current market price of the common shares on the date set for redemption or the maturity date. The Company may elect, subject to applicable regulatory approval, to issue and deliver common stock of the Company to the indenture trustee under the Convertible Debenture indentures, to sell in the open market, to satisfy the Company’s obligation to pay interest on the Convertible Debentures on each interest payment date. The Convertible Debenture holders will receive a cash payment in satisfaction of the interest obligation equal to the interest payable from the sale of such common shares. The Company must commence, within 30 days of a Change of Control (as defined in the Convertible Debentures indentures), an offer to purchase all of the Convertible Debentures then outstanding at a purchase price equal to 101% of the principal amount of the Convertible Debentures, plus accrued and unpaid interest thereon. STI Common Shares The Company renewed its normal course issuer bid (“NCIB”) on May 19, 2017. Pursuant to the notice, the Company is permitted to acquire up to a maximum amount of Common Shares equal to 9,225,542 Common Shares in the twelve month period commencing May 24, 2017 and ending on May 23, 2018, subject to the Company’s senior debt agreement requirements. The Company did not repurchase any shares during the fiscal year ended June 30, 2017. During the 2016 fiscal year, the Company purchased and cancelled 575,226 common shares having a value of $2.3 million, pursuant to the NCIB that was in effect at the time.
16 STRONG TO THE CORE On April 11, 2016, pursuant to a block trade, the Company acquired and cancelled the remaining 5.0 million shares held by SNCF - Participations (“SNCF - P”), formerly the Company’s largest shareholder, for approximately $23.5 million. SNCF - P had originally invested in the Company in 2008, and had sold 4.0 million shares in August 2015. In April 2016, SNCF - P also sold an additional 6.4 million shares through a combination of a private transaction and a separate sale to a bank syndicate. The disposal of shares by SNCF - P was part of their previously announced strategy to divest a group of transportation and logistics companies considered as “non - core assets” in their investment portfolio. In September 2016, the Company issued 6,736 shares of stock having an approximate value of $0.1 million in connection with conversions of the Company’s US$ 6.25% Convertible Debentures, which were recorded as a non - cash financing activity. The remaining outstanding US$ 6.25% Convertible Debentures were redeemed on September 19, 2016 (see “Liquidity and Capital Resources - Convertible Debentures”). During the 2016 fiscal year, the Company issued a total of 309 , 161 shares having an approximate value of $ 1 . 0 million in connection with the acquisition of the two transportation consulting and management services firms (see “Liquidity and Capital Resources”) . On February 23 , 2017 , the Company issued 2 , 282 , 104 shares of stock having an approximate value of $ 12 . 8 million (net of fees of $ 0 . 1 million) in connection with the redemption of the Class B Series Three common shares, which have been recorded as a non - cash financing activity (see “Equity Incentive Plan - Class B Shares”) . Dividend Reinvestment Plan The Company established a dividend reinvestment plan (the “Plan”) in May 2009 to enable eligible shareholders of the Company to reinvest dividends on their common shares to acquire additional common shares of the Company. The common shares issued under the Plan are issued directly from the treasury of STI at a price based on the volume weighted average of the Canadian dollar closing price of the common shares for the 5 trading days immediately preceding the relevant dividend date, less a 3% discount and converted into U.S. dollars at the daily Bank of Canada noon exchange rate posted on the last trading day of such 5 trading day period. Pursuant to the Plan, the Company issued 439,388 common shares during the twelve months ended June 30, 2017 which represent non - cash dividends having a value of $2.4 million. The Plan can be amended, suspended or terminated at any time, but such action would have no retroactive effect that would prejudice the interests of any participants. Equity Incentive Plan – Class B Shares The shareholders of the Company approved the adoption of the STA Holdings Equity Incentive Plan (“EIP”) by STA Holdings in December 2005. The shareholders also approved the initial allotment of Class B common shares available for issuance under the EIP in December 2005, with subsequent approvals of additional allotments in November 2008 and November 2012. Following the Share Exchange described below, the EIP was terminated. On November 8, 2016, the Company’s shareholders approved two special business items at the Company’s 2016 Annual and Special Meeting of shareholders. The first item related to the approval of a new performance share grant plan of the Company (the “New PSG Plan”). The New PSG Plan will replace the EIP originally set up at the STA Holdings level. Under the New PSG Plan, participants will be eligible to receive performance share grant units from the Company (“PSG Units”) that are redeemable for common shares of the Company. The vesting of PSG Units will be based entirely upon the achievement of multiple pre - defined performance measures and, except in certain prescribed circumstances the PSG Units will vest over a three - year period. The first grant of PSG Units is expected to occur in the 2018 fiscal year. The second item related to the approval for the issuance of up to 2.7 million common shares by the Company to the holders of Class B Series Three common shares of STA Holdings in exchange for all issued and outstanding Class B Series Three common shares (the “Share Exchange”). The Share Exchange was expected to happen on or before February 28, 2017. On February 23, 2017, the Company issued 2,282,104 STI common shares in exchange for all of the outstanding Class B Series Three common shares. Following the Share Exchange, all of the outstanding Class B Series Three common shares were cancelled, and the Company owns 100% of the equity securities of STA Holdings.

STRONG TO THE CORE 17 The holders of the Class B Series Three common shares were entitled to receive dividends, as and when declared by the board of directors of STA Holdings, approximately equivalent to the dividends received by the holders of STI common shares. Pursuant to the liquidity provisions of the EIP, the holders of Class B Series Three common shares had an option to “put” up to one third of the shares awarded each year back to the Company, starting one year immediately following the grant. The Class B common shares granted were fully vested at the grant date. These shares were classified as a liability and re - measured at fair value at the end of each reporting period. Changes in fair value and dividends on the Class B common shares were recorded as a component of other expense (income), net in the consolidated statement of operations. Before the shares were exchanged on February 23, 2017, the Company recorded an expense of $1.1 million and $1.4 million for the twelve months ended June 30, 2017 and 2016, respectively, associated with the change in fair value on the Class B common shares. The Company recorded $0.6 million and $0.9 million in dividend payments on the Class B common shares for the twelve months ended June 30, 2017 and 2016, which were recorded as a component of other income, net in the consolidated statement of operations. The Company entered into an equity hedge in April 2016 with a major Canadian bank to partially mitigate changes in the liability associated with the Class B shares outstanding pursuant to the Company’s EIP plan. The Company is in the process of unwinding the equity hedge as the Class B shares are no longer outstanding. Approximately 8% of the shares initiated in connection with the hedge remain outstanding as at June 30, 2017. The equity hedge was not designated as a hedge for accounting purposes, therefore the changes in fair value of the equity hedge are recorded in the consolidated statement of operations., The Company recorded a gain of $2.0 million for the twelve months ended June 30, 2017 which consisted of both realized gains on the partial liquidation of the hedge as well as changes in the fair market value of the remaining hedge, which is included in the consolidated statement of operations as a component of other income. The value of the equity hedge at June 30, 2017 represents an asset of $0.5 million all of which is recorded in other current assets. During the twelve months ended June 30, 2017, STA Holdings granted 1,018,114 Class B Series Three common shares pursuant to the EIP. The Company recognized $5.8 million in non - cash stock - based compensation expense related to these grants during the twelve months ended June 30, 2017. In connection with these grants, 362,468 shares were withheld at the election of the participants to satisfy income tax withholdings. Pursuant to the liquidity provision of the EIP plan, 430,313 Class B Series Three common shares were “put” back to the Company, having a fair value of $2.4 million during the twelve months ended June 30, 2017. On February 23, 2017 the Company exchanged all of the remaining Class B Series Three common shares, having an approximate value of $12.8 million (of which $9.3 million was recorded in other current liabilities immediately prior to the exchange) into STI common shares. This exchange was recorded as a non - cash financing activity. During the twelve months ended June 30, 2016, STA Holdings granted 1,023,008 Class B Series Three common shares pursuant to the EIP. The Company recognized $4.0 million in non - cash stock - based compensation expense related to these grants during the twelve months ended June 30, 2016. In connection with these grants, 417,536 shares were withheld at the election of the participants to satisfy income tax withholdings. Pursuant to the liquidity provision of the EIP plan, 139,912 Class B Series Three common shares were “put” back to the Company, having a fair value of $0.7 million during the twelve months ended June 30, 2016. The total number of Class B Series Three common shares outstanding as at June 30, 2016 was 2,056,771. The fair value of the Class B Series Three common shares outstanding at June 30, 2016 represented a liability of $10.5 million, of which $7.7 million was recorded in other current liabilities and represents the current value of those shares eligible to be put in the next twelve months pursuant to the EIP plan. The remaining balance was recorded in Class B Series Three common share liability.

18 STRONG TO THE CORE Results of Operations ($ in 000’s, except per share data) As noted in the cautionary language concerning forward - looking disclosures under the heading “Forward - Looking Statements” in this management discussion and analysis, this section contains forward - looking statements, including with respect to the Company’s seasonality, fuel prices, currency and leasing alternatives. Such statements involve known and unknown risks, uncertainties and other factors outside of management’s control, including the risk factors set forth in this management discussion and analysis that could cause results to differ materially from those described or anticipated in the forward - looking statements. Three Months Ended June 30 Twelve Months Ended June 30 2017 2016 2017 2016 Revenues ............................................. $172,778 $166,190 $637,317 $600,194 Costs and expenses Cost of operations ................................. 128,443 122,971 485,091 457,743 General and administrative .......................... 17,508 15,772 68,037 61,897 Non - cash stock compensation ....................... – – 5,802 3,967 Acquisition expense ................................ – – – 192 Depreciation and depletion expense .................. 14,092 14,281 47,256 48,008 Amortization expense .............................. 782 793 3,142 3,153 Impairment of oil and gas assets ...................... – 438 224 1,638 Total operating expenses ................................ 160,825 154,255 609,552 576,598 Income from operations ................................ 11,953 11,935 27,765 23,596 Interest expense ....................................... 4,145 3,692 17,745 14,513 Foreign currency loss (gain) .............................. 121 (140) 30 1,147 Non - cash (gain) loss on US$ 6.25% Convertible Debentures conversion feature ................................... – (109) (190) 177 Other expense (income) net ............................. 18 (797) (946) (1,127) Income before income taxes and equity in net loss of unconsolidated investment ............................ 7,669 9,289 11,126 8,886 Equity in net loss of unconsolidated investment ............. – – – (11) Income tax expense .................................... 3,406 3,011 4,666 2,838 Net income ........................................... $ 4,263 $ 6,278 $ 6,460 $ 6,037 Basic and diluted net income per common share ............ $ 0.05 $ 0.07 $ 0.07 $ 0.06 Seasonality The Company’s operations are seasonal and follow the school calendars of the public and private schools it serves. During the summer school break, revenue is derived primarily from summer camps and private charter services. Since schools are not in session, there is minimal school bus transportation revenue. Thus, the Company incurs operating losses during the first three months of the fiscal year, which encompass the summer school break. Depreciation of fixed assets occurs in the months during which schools are in session, which is generally September through June. A full year’s worth of depreciation is recorded in these ten months to correspond with the vehicles’ usage. In addition, the Company purchases a majority of its replacement capital expenditures, along with investment capital spending for new bids and contracts awarded for the upcoming school year in the same time period. These purchases have historically been funded by borrowings on the Company’s senior credit facility and through operating lease financings. Market Fuel Price Exposure The Company is exposed to changes in the market price of fuel on our school transportation contracts in the ordinary course of business. The Company continues to have fuel mitigation features in approximately 60% of its school transportation revenue contracts that provide some measure of protection against market fuel price increases, ranging from the outright purchase of fuel by school districts to fuel reimbursements associated with fuel price caps / collars and

STRONG TO THE CORE 19 fuel escalators. So while the Company is still exposed to some price risk under some of these fuel mitigation features when market fuel prices increase, it also benefits to some extent with a decline in market fuel prices as well. In addition to the contract mitigation features related to fuel in the revenue contracts, over the last several years the Company has also endeavored to lock in an approximate 20% of its fuel exposure by entering into fixed price contracts with its fuel vendors on an annual basis, with the final approximate 20% of fuel exposure at risk and fully subject to market price fluctuations. The Company locked in the 20% of fuel exposure for fiscal 2016 in the October through December 2014 timeframe, when the price of fuel was approximately $60 per barrel. In the August and November 2015 timeframe the Company locked in approximately 15% of fuel exposure for the 2017 fiscal year when the price of fuel was approximately $45 per barrel. To date, the Company has locked in about 85% of the approximate 20% of its fuel exposure for the 2018 fiscal year and about 15% of the same 20% exposure for the 2019 fiscal year. Foreign Currency Translation Impacts on Financial Reporting The Company’s financial statements are reported in U.S. dollars, as the principal operations and cash flows of its subsidiaries are conducted in U.S. dollars. The results of the Company’s Canadian operations (revenues and expenses) are translated into U.S. dollars using the average exchange rate during the period. The average Canadian dollar / U.S. dollar exchange rates for the twelvemonths ended June 30, 2017 and 2016 were 1.3267 and 1.3258, respectively. Managed and Leased Fleet Business The Company’s school transportation services have historically included managed services contracts. These transportation services are structured as management services contracts under which the Company manages the transportation for the school district and the school district continues to own the school bus fleet. In addition, since the fiscal year 2007 the Company has financed a portion of its growth and replacement school vehicles through operating leases. Such managed services contracts and leased vehicles require lower up front capital investment (as the school district maintains ownership of the managed fleet and the lessor maintains ownership of the leased fleet) and thus results in lower annual depreciation expense on an ongoing basis. Currently, leased and managed buses account for approximately 33% and 5%, respectively, of the Company’s fleet. The Company intends to review leasing alternatives on an annual basis based on the economics of the lease financing. During the fiscal year ended June 30, 2016, the Company entered into additional operating leases with ten major financial institutions to lease approximately $58.3 million in replacement school vehicles and $22.0 million in growth school vehicles for the 2015 - 2016 school year. The term of these leases is six years at effective fixed rates in the range of 2.6% to 4.2%. Annual lease payments on these additional leases will approximate $11.3 million per year for the term of the leases. During the fiscal year ended June 30, 2017, the Company entered into additional operating leases with nine major financial institutions to lease approximately $39.8 million in replacement school vehicles and $10.5 million in growth school vehicles for the 2016 - 2017 school year. The term of these leases is six years at effective fixed rates in the range of 1.9% to 4.4%. Annual lease payments on these additional leases will approximate $6.9 million per year for the term of the leases. Oil and Gas Interests In January 2008, the Company closed the acquisition (the “Canadex Acquisition”) of all of the outstanding stock of Canadex Resources Limited (“Canadex”). Canadex was a transportation and energy company consisting of two separate business segments. The transportation segment represented school bus operations in Ontario, while the energy division held non - operating positions in oil and gas investments in the United States. The interests in oil and gas properties were held through Canadex’s wholly owned subsidiary, Canadex Resources Inc. (“CRI”). CRI invested as a non - operator in properties for the exploration and upstream production of crude oil, natural gas and condensates. It held junior participations in approximately 500 wells primarily in Texas and Oklahoma, with a few located in Louisiana and Kansas in the United States. CRI’s co - invested with a range of operators to provide flexibility to exploit a variety of exploration and development opportunities. The financial statements reflected the Company’s proportionate interest in the oil and gas activities as a non - operator. Canadex, through a series of amalgamations subsequent to the Canadex Acquisition, was
20 STRONG TO THE CORE renamed Parkview Transit Inc., which is a direct subsidiary of the Company. The Company completed the sale of its oil and gas interest in June 2017. The Company’s oil and gas revenues, on an annual basis, were approximately one quarter of one percent of consolidated Company revenues. Three months ended June 30, 2017 Compared to Three months ended June 30, 2016 The Company’s core business is school bus transportation. As a result of the Canadex Acquisition, the Company had two reportable segments, school bus transportation and an oil and gas portfolio. The oil and gas portfolio represented approximately one - quarter of one percent of the Company’s revenue on an annual basis. In June 2017, the Company sold its interests in the oil and gas properties. The consolidated results for the fourth quarter of fiscal year 2017 include $0.4 million in oil and gas revenue, $0.3 million in related cost of operations, $0.2 million in depletion expense and a loss on the sale of the oil and gas interests of $1.4 million. The consolidated results for the fourth quarter of fiscal year 2016 include $0.3 million in oil and gas revenue, $0.5 million in related cost of operations, $0.1 million in depletion expense, $0.1 million gain on sale of wells and a $0.4 million non - cash impairment charge. The remaining discussion of the Company’s operating results through “Income from Operations” is related to the Company’s core school bus transportation segment . Discussion of items below “Income from Operations” reflects the consolidated results of the Company as these items are unallocated between the two reporting segments . Revenues: Revenues for school bus transportation for the fourth quarter of fiscal year 2017 were $172.4 million compared to $165.9 million for the fourth quarter of fiscal year 2016, representing an increase of $6.5 million, or 3.9%. Revenue for the fourth quarter of fiscal year 2017 was negatively impacted by approximately $0.9 million related to the change in exchange rates between the Canadian dollar and the U.S. dollar from the fourth quarter of fiscal year 2016 to the fourth quarter of fiscal year 2017 in connection with the translation of the Company’s Canadian operations into U.S. dollars. In the first quarter of fiscal year 2017, the Company started operations on nine new bid contracts (two of which were tuck - ins to existing locations) and one conversion contract. The Company did not renew five contracts for the fiscal year 2017. The new conversion and bid - in contracts for fiscal year 2017 accounted for $5.9 million in new business growth in the fourth quarter of fiscal year 2017, which was partially offset by a $2.7 million revenue reduction resulting from the five contracts not renewed. The remaining $4.2 million increase in revenues resulted primarily from net increases in service requirements of existing contracts and contract rate increases, partially offset by the timing of the spring break holiday which occurred in the fourth quarter of fiscal 2017 compared to the third quarter of fiscal 2016. Cost of Operations: Cost of operations for school bus transportation for the fourth quarter of fiscal year 2017 was $128.1 million as compared to $122.5 million for the fourth quarter of fiscal year 2016, representing an increase of $5.6 million or 4.6%. The new conversion and bid - in contracts for fiscal year 2017, accounted for $4.4 million of the total increase in cost of operations which was partially offset by a $2.6 million reduction resulting from the five contracts not renewed. The remaining $3.8 million increase in cost of operations, net of new business and contracts not renewed for the fourth quarter of fiscal year 2017, resulted primarily from an increase in salaries and wages, operating costs, maintenance expense, insurance expense and fuel expense, partially offset by a decrease in fringe benefits. Salaries and wages, net of new business for the fourth quarter of fiscal year 2017, increased by $2.2 million primarily related to higher driver wages. As a percentage of revenue, driver wages increased to 34.3% in the fourth quarter of fiscal year 2017 from 33.9% in the fourth quarter of fiscal year 2016. Operating expenses, net of new business for the fourth quarter of fiscal year 2017, increased $1.0 million due to an additional year of vehicle leasing costs and an increase in business taxes. Maintenance expense, net of new business for the fourth quarter of fiscal year 2017, increased $0.6 million due primarily to higher net parts expense and increased as a percentage of revenue to 4.0% from 3.7% in the fourth quarter of fiscal year 2017 compared to the fourth quarter of fiscal year 2016. Insurance expense, net of new business for the fourth quarter of fiscal year 2017, increased $0.4 million due primarily to unfavorable liability claims development and increased as a percentage of revenue to 3.2%

STRONG TO THE CORE 21 from 3.1% in the fourth quarter of fiscal year 2017 compared to the fourth quarter of fiscal year 2016. Fuel expense, net of new business for the fourth quarter of fiscal year 2017, increased $0.1 million, primarily related to the expiration of the alternative fuel tax credit on December 31, 2016. As a percentage of revenue, fuel decreased to 5.1% in the fourth quarter of fiscal year 2017 from 5.2% in the fourth quarter of fiscal 2016. Fringe benefits net of new business for the fourth quarter of fiscal year 2017 decreased $0.5 million due primarily to favorable claims experience in workers compensation, partially offset by higher employment taxes associated with higher rates and the wage increases noted above. As a percentage of revenue, fringe benefits decreased to 8.6% in the fourth quarter of fiscal year 2017 from 9.0% in the fourth quarter of fiscal year 2016. General and Administrative Expense: General and administrative expense for school bus transportation for the fourth quarter of fiscal year 2017 was $17.5 million compared to $15.7 million for the fourth quarter of fiscal year 2016, an increase of $1.8 million or 11.5%. As a percentage of revenue, total general and administrative expense increased to 10.2% of revenue in the fourth quarter of fiscal year 2017 from 9.5% in the fourth quarter of fiscal year 2016. The increase in general and administrative expenses is due to higher professional fees related to human resource systems implementation, additional accounting and consulting fees associated with the Company’s first year 404 SOX compliance and higher administrative compensation. Depreciation Expense: Depreciation expense for school bus transportation was $13.9 million for the fourth quarter of fiscal year 2017 as compared to $14.2 million for the fourth quarter of fiscal year 2016. As a percentage of revenue, depreciation expense decreased to 8.1% for the fourth quarter of fiscal year 2017 from 8.6% for the fourth quarter of fiscal year 2016. Amortization Expense: Amortization expense for school bus transportation was $0.8 million for both the fourth quarter of fiscal year 2017 and the fourth quarter of fiscal year 2016. As a percentage of revenue, amortization expense was 0.5% for both the fourth quarter of fiscal year 2017 and the fourth quarter of fiscal year 2016. Income from Operations: Income from operations for school bus transportation was $12.1 million for the fourth quarter of fiscal year 2017 compared to $12.7 million for the fourth quarter of fiscal year 2016. The decrease in income from operations of $0.6 million resulted from the operating line items discussed above and reflects a negative impact of $0.1 million in exchange rates between the Canadian dollar and the US dollar from the fourth quarter of fiscal 2016 compares to the fourth quarter of fiscal 2017 in connection with the translation of the Company’s Canadian operations into US dollars. Interest Expense: Interest expense for the fourth quarter of fiscal year 2017 was $4.1 million compared to $3.7 million for the fourth quarter of fiscal year 2016. The increase in interest expense of $0.4 million was due to the increase in the average debt outstanding, for the fourth quarter of fiscal year 2017, compared to the fourth quarter of fiscal year 2016. Foreign Currency Loss (Gain): Foreign currency loss for the fourth quarter of fiscal year 2017 totaled $0.1 million compared to a foreign currency gain $0.2 million for the fourth quarter of fiscal year 2016. The increase in the foreign currency loss of $0.3 million results primarily from the losses realized upon the translation of the Company’s dividends into US dollars for the fourth quarter of fiscal year 2017, compared to the fourth quarter of fiscal year 2016. Non - cash Gain on US$ 6.25% Convertible Debentures Conversion Feature: Non - cash gain on the US$ 6.25% Convertible Debentures conversion feature was $0.1 million for the fourth quarter of fiscal year 2016. The gain of $0.1 million was related to the change in fair value of the embedded conversion feature derivative associated with STI’s issuance of the U.S. dollar denominated US$ 6.25% Convertible Debentures. The US$ 6.25% Convertible Debentures were extinguished in the first quarter of fiscal year 2017. Other Income, Net: Other income totaled $1.3 million in the fourth quarter of fiscal year 2017 compared to other income of $0.7 million in the fourth quarter of fiscal year 2016. The increase in other income of $0.6 million consists primarily of a $1.6 million increase in unrealized foreign gain and higher gain on asset sales partially offset by $1.0 million decrease in the combined fair value of the Class B share liability and corresponding equity hedge in fourth quarter of fiscal year 2017 compared to the fourth quarter of fiscal year 2016.
22 STRONG TO THE CORE Income before Income Taxes and Equity in Net Loss of Unconsolidated Investment : Income before income taxes and Equity in Net Loss of Unconsolidated Investment was $7.7 million for the fourth quarter of fiscal year 2017 compared to $9.3 million for the fourth quarter of fiscal year 2016. The decrease in income of $1.6 million resulted primarily from an increase in the loss from the oil and gas operation of $0.8 million, a decrease in the income from operation of the school bus transportation segment of $0.6 million, an increase in interest expense of $0.4 million, an increase in the foreign currency loss of $0.3 million and a decrease in the gain on the US$ 6.25% Convertible Debenture conversion feature of $0.1 million, partially offset by an increase in other income of $0.6 million. Net Income: Net income for the Company for the fourth quarter of fiscal year 2017 totaled $4.3 million, which included income tax expense of $3.4 million. Net income for the fourth quarter of fiscal year 2016 amounted to $6.3 million, which included income tax expense of $3.0 million. The effective tax rates for the fourth quarter of fiscal year 2017 and the fourth quarter of fiscal year 2016 were 44.4% and 32.4%, respectively. The increase in the effective tax rate year over year was due primarily to the mix of the statutory Canadian and U.S. tax rates, the apportionment of the Company’s income before income taxes resulting from the operations in each country and the tax impact of the oil and gas asset sale. Basic and diluted net income per common share was $0.05 for the fourth quarter of fiscal year 2017 compared to basic and diluted net income per common share of $0.07 for the fourth quarter of fiscal year 2016. Twelve months ended June 30, 2017 Compared to Twelve months ended June 30, 2016 The Company’s core business is school bus transportation. As a result of the Canadex Acquisition, the Company had two reportable segments, school bus transportation and an oil and gas portfolio. The oil and gas portfolio represented approximately one - quarter of one percent of the Company’s revenue on an annual basis. In June 2017, the Company sold its interests in the oil and gas properties. The consolidated results for the fiscal year 2017 include $1.3 million in oil and gas revenue, $1.0 million in related cost of operations, $0.7 million in depletion expense, $0.2 million in general and administrative expenses, $1.3 million in net loss on sale of the oil and gas properties and a $0.2 million non - cash impairment charge on the oil and gas assets as a result of the continued decline in fuel market prices. The consolidated results for the fiscal year 2016 include $1.4 million in oil and gas revenue, $1.7 million in related cost of operations, $0.2 million in general and administrative expense, $1.0 million in depletion expense and a $1.6 million non - cash impairment charge on the oil and gas assets as a result of the continued decline in fuel market prices. The remaining discussion of the Company’s operating results through “Income from Operations” is related to the Company’s core school bus transportation segment . Discussion of items below “Income from Operations” reflects the consolidated results of the Company as these items are unallocated between the two reporting segments . Revenues: Revenues for school bus transportation for the fiscal year 2017 were $636.0 million compared to $598.8 million for the fiscal year 2016, representing an increase of $37.2 million, or 6.2%. Revenue for the fiscal year 2017 was negatively impacted by approximately $0.2 million related to the change in exchange rates between the Canadian dollar and the U.S. dollar from the fiscal year 2016 to the fiscal year 2017 in connection with the translation of the Company’s Canadian operations into U.S. dollars. In the first quarter of fiscal year 2017, the Company started operations on nine new bid contracts (two of which were tuck - ins to existing locations), one conversion contract and continued operations on the acquisition of the two transportation consulting and management services firms completed in the third quarter of fiscal year 2016. The Company did not renew five contracts for the fiscal year 2017. The new conversion and bid - in contracts for fiscal year 2017 and the two acquisitions completed in third quarter of fiscal year 2016, accounted for $29.2 million in new business growth in fiscal year 2017, which was partially offset by a $11.1 million revenue reduction resulting from the five contracts not renewed. The remaining $19.3 million increase in revenues resulted primarily from net increases in service requirements of existing contracts and contract rate increases. Cost of Operations: Cost of operations for school bus transportation for the fiscal year 2017 was $484.1 million as compared to $456.0 million for the fiscal year 2016, representing an increase of $28.1 million or 6.2%. The new conversion and bid - in contracts for fiscal year 2017 along with the two acquisitions completed in the third quarter of fiscal year 2016,
STRONG TO THE CORE 23 accounted for $20.8 million of the total increase in cost of operations which was partially offset by a $10.2 million reduction resulting from the five contracts not renewed. The remaining $17.5 million increase in cost of operations, net of new business and contracts not renewed for the fiscal year 2017, resulted primarily from an increase in salaries and wages, operating costs, fuel and fringe benefits , partially offset by a decrease in insurance costs and maintenance costs. Salaries and wages, net of new business for the fiscal year 2017, increased by $12.7 million primarily related to higher driver wages and operations wages. As a percentage of revenue, driver wages increased to 35.3% in the fiscal year 2017 from 34.7% in the fiscal year 2016. As a percentage of revenue, operations wages increased to 4.8% from 4.7%, for the fiscal year 2017 compared to the fiscal year 2016. Operating expenses, net of new business for the fiscal year 2017, increased $5.3 million due to an additional year of vehicle leasing costs, an increase in business taxes and additional costs associated with the driver shortages. Fuel expense, net of new business for the fiscal year 2017, increased $0.6 million, primarily related to the expiration of the alternative fuel tax credit which expired in December 2016. Fuel prices remained relatively flat year over year. As a percentage of revenue, fuel remained the same at 5.1% in both the fiscal year 2017 and fiscal year 2016. Fringe benefits, net of new business for the fiscal year 2017 increased $0.3 million primarily due to unfavorable claims experience in workers compensation. Insurance costs, net of new business for the fiscal year 2017, decreased $1.1 million primarily due to favorable liability insurance claims development. As a percentage of revenue, insurance costs decreased to 3.5% in the fiscal year 2017 compared to 3.8% in the fiscal year 2016. Maintenance expense, net of new business for the fiscal year 2017, decreased $0.4 million due primarily to lower net parts expense. As a percentage of revenue, maintenance costs decreased to 4.0% in the fiscal year 2017 from 4.2% in the fiscal year 2016. General and Administrative Expense: General and administrative expense for school bus transportation for the fiscal year 2017 was $67.9 million compared to $61.7 million for the fiscal year 2016, an increase of $6.2 million or 10.0%. As a percentage of revenue, total general and administrative expense increased to 10.7% of revenue in the fiscal year 2017 from 10.3% in the fiscal year 2016. The increase in general and administrative expenses is due to the net new business for the fiscal year 2017, combined with higher professional fees related to human resource systems implementation, additional accounting and consulting fees associated with the Company’s first year 404 SOX compliance and higher administrative compensation. Non - cash Stock Compensation: Non - cash stock compensation expense for the fiscal year 2017 was $5.8 million as compared to $4.0 million for the fiscal year 2016. The increase in non - cash stock compensation of $1.8 million resulted primarily from the increase in the per share value of share grants for the fiscal year 2017 compared to the fiscal year 2016. The non - cash compensation expense of $5.8 million for the fiscal year 2017 was related to the issuance of 1,018,114 Class B Series Three common shares of STA Holdings in the fiscal year 2017. The non - cash compensation expense of $4.0 million for the fiscal year 2016 was related to the issuance of 1,023,008 Class B Series Three common shares of STA Holdings in the fiscal year 2016. Acquisition Expense : The Company did not incur any acquisition expense for school bus transportation for the fiscal year 2017, as there were no acquisitions completed. Acquisition expense for the fiscal year 2016 was $0.2 million in connection with the acquisition of the two transportation consulting and management services firms. Acquisition expenses related to transaction costs associated with acquisitions are expensed as incurred under US GAAP. Depreciation Expense: Depreciation expense for school bus transportation was $46.6 million for the fiscal year 2017 compared to $47.0 million for the fiscal year 2016. As a percentage of revenue, depreciation expense decreased to 7.3% for the fiscal year 2017 from 7.8% for the fiscal year 2016. Amortization Expense : Amortization expense for school bus transportation was $ 3 . 1 million for the fiscal year 2017 compared to $ 3 . 2 million for the fiscal year 2016 , a decrease of $ 0 . 1 million . As a percentage of revenue, amortization expense remained the same at 0 . 5 % for both the fiscal year 2017 and the fiscal year 2016 . Income from Operations: Income from operations for school bus transportation was $28.5 million for the fiscal year 2017 compared to $26.7 million for the fiscal year 2016. The increase in the income from operations of $1.8 million resulted from the operating line items discussed above and reflects a negative impact of $0.1 million in exchange rates between the Canadian dollar and the US dollar from fiscal 2016 compared to fiscal 2017 in connection with the translation of the Company’s Canadian operations into US dollars.
24 STRONG TO THE CORE Interest Expense: Interest expense for the fiscal year 2017 was $17.7 million compared to $14.5 million for the fiscal year 2016. The increase in interest expense of $3.2 million was due to the write - off of the unamortized financing costs associated with the early redemption of the US$ 6.25% Convertible Debentures of $1.0 million and an additional $2.2 million in interest expense as a result of the increase in the average debt outstanding, for the fiscal year 2017, compared to the fiscal year 2016. Foreign Currency Loss: Foreign currency loss for the fiscal year 2017 totaled thirty thousand dollars compared to a foreign currency loss $1.1 million for the fiscal year 2016. The decrease in the foreign currency loss of $1.1 million results primarily from the losses realized upon the translation of the Company’s dividends into US dollars for the fiscal year 2017, compared to the fiscal year 2016. Non - cash (Gain) Loss on US$ 6.25% Convertible Debentures Conversion Feature: Non - cash gain on the US$ 6.25% Convertible Debentures conversion feature was $0.2 million for the fiscal year 2017 compared to a non - cash loss of $0.2 million for the fiscal year 2016. The increase in the gain of $0.4 million was related to the extinguishment of the embedded conversion feature derivative that was associated with STI’s U.S. dollar denominated US$ 6.25% Convertible Debentures. The conversion feature on STI’s US$ 6.25% Convertible Debentures provided that the U.S. dollar denominated debentures could be converted at a U.S. dollar denominated strike price into common shares of the Issuer, a Canadian functional currency entity. Therefore, the conversion feature represented an embedded derivative that had to be bifurcated and accounted for separately. The embedded conversion feature was recorded at fair value in other liabilities at each reporting period end with changes in fair value included in the consolidated statement of operations. The US$ 6.25% Convertible Debentures were extinguished in the first quarter of fiscal year 2017. Other Income, Net: Other income totaled $2.2 million in the fiscal year 2017 compared to other income of $1.0 million in the fiscal year 2016. The increase in other income of $1.2 million consists primarily of the $1.3 million decrease in the combined fair value of the Class B share liability and corresponding equity hedge in the fiscal year 2017 compared to the fiscal year 2016. This was partially offset by a combined $0.1 million decrease in gain of sale of assets and other non cash items. Income before Income Taxes and Equity in Net Loss of Unconsolidated Investment : Income before income taxes and Equity in Net Loss of Unconsolidated Investment was $ 11 . 1 million for the fiscal year 2017 compared to a income before income taxes of $ 8 . 9 million for the fiscal year 2016 . The increase in income of $ 2 . 2 million resulted primarily from, an increase in the income from operations of the school bus transportation segment of $ 1 . 8 million, an increase in other income of $1.2 million, a decrease in the foreign currency loss of $1.1 million, a decrease in the loss from the oil and gas operations of $0.9 million and increase in the gain on the US$ 6.25% Convertible Debenture conversion feature of $0.4 million, partially offset by an increase in interest expense of $3.2 million. Equity in Net Loss of Unconsolidated Investment : The Equity in Net Loss of unconsolidated investment of eleven thousand dollars, in the fiscal year 2016, represents the Company’s share of the earnings of a consulting and management services firm, an investment which the Company completed during fiscal year 2015 (see “Liquidity and Capital Resource - Acquisitions and Investments”). The Company purchased the remaining portion of the transportation consulting and management service firm during the third quarter of fiscal year 2016. Net Income: Net income for the Company for the fiscal year 2017 totaled $6.5 million, which included income tax expense of $4.7 million. Net income for the fiscal year 2016 amounted to $6.0 million, which included an income tax expense of $2.8 million. The effective tax rates for the fiscal year 2017 and the fiscal year 2016 were 41.9% and 31.9%, respectively. The increase in the effective tax rate year over year was due primarily to the mix of the statutory Canadian and U.S. tax rates and the apportionment of the Company’s income before income taxes resulting from the operations in each country Basic and diluted net income per common share was $0.07 for the fiscal year 2017 compared to basic and diluted net income per common share of $0.06 for the fiscal year 2016. Liquidity and Capital Resources As noted in the cautionary language concerning forward - looking disclosures under the heading “Forward - Looking Statements” in this management discussion and analysis, this section contains forward - looking statements, including with respect to the Company’s ability
STRONG TO THE CORE 25 to renew or refinance its various loan facilities as they become due. Such statements involve known and unknown risks, uncertainties and other factors outside of management’s control, including the risk factors set forth in this management discussion and analysis that could cause results to differ materially from those described or anticipated in the forward - looking statements. Genera l School bus transportation revenue has historically been seasonal, based on the school calendar and holiday schedule. During the summer school break, revenue is derived primarily from summer camps and private charter services. As schools are not in session, there is no school bus transportation revenue during this period. The operations of the Company historically generate negative cash flow in the first quarter of the fiscal year reflecting the seasonality of the school bus transportation industry during the school summer break combined with a majority of replacement capital expenditures along with investment capital spending for new bids and contracts awarded for the upcoming school year occurring in the same time period. Replacement capital expenditures have historically been funded by a combination of borrowings on the Company’s senior credit facility and through operating lease financings. Investment capital spending for new bid and contract awards has historically been funded with proceeds from debt and equity financings along with operating lease financing and cash flow from operations. As the Company incurs operating losses during the first three months of the fiscal year, distributions are funded with non - operating cash flows for the first interim quarter of the fiscal year. The subsequent quarters of the fiscal year typically generate excess cash, as schools are in session and the majority of replacement capital expenditures and investment capital spending having occurred in the first quarter. Due to this seasonality, the Company views available cash flow on an annualized basis. The Company has historically funded its distributions with cash from operations on an annual basis. During the twelve months ended June 30, 2017, cash from operations totaled $64.3 million, prior to an investment in net working capital of $8.4 million. Cash taxes paid during the twelve months ended June 30, 2017 amounted to $2.6 million. The Company’s investing activities for the twelve months ended June 30, 2017 resulted in a use of cash of $29.1 million. Included in these investing activities were, (i) capital expenditures related to the new conversion and bid contracts for fiscal year 2017 of $22.1 million (which includes $0.2 million for oil & gas investments in new wells), (ii) $12.4 million in capital expenditures related to replacement capital spending and, (iii) $2.7 million in proceeds from sale of equipment and $2.7 million in proceeds from the sale of the oil and gas assets. The Company’s financing activities for the twelve months ended June 30, 2017 represented a use of cash of $22.8 million. Included in these financing activities were (i) $271.5 million in credit agreement borrowings and $219.3 million in credit agreement repayments, (ii) $65.7 million in proceeds from the issuance of the Cdn$ 5.25% Convertible Debentures, (iii) $35.0 million in payments for the redemption of the Senior Secured Notes, (iv) $59.9 million in payments for the early redemption of the US$ 6.25% Convertible Debentures, (v) $38.5 million in dividend payments made, (vi) $4.7 million in financing fees (vii) $2.5 million in payments for the repurchase of Class B common shares and (viii) $0.1 million in fees associated with the Class B share exchange. Loan Facilities On July 27, 2016 the Company entered into a Fourth Amended and Restated Credit Agreement (the “Credit Agreement”). The new amended credit facility increased the commitments to $340.0 million (US $290.0 million and Canadian $50.0 million), from the previous commitments of $225.0 million and extended the maturity date to July 27, 2021. The increase in the size of the facility resulted from the addition of two new lenders to the bank group and certain existing lenders increasing their commitments. The new amended facility also provides for a US $100 million “accordion feature”, which provides access to a larger facility should it be needed in the future. The loan facility is used to fund capital requirements and to fund acquisitions and investment requirements for new revenue and bid - in contracts. The Company used drawings under the Credit Agreement in part to repurchase the US $35.0 million Senior Secured Notes due November 10, 2016. Borrowings under the Credit Agreement may be Base Rate Loans or Eurodollar Loans, as defined in the Credit Agreement. Base Rate Loans bear interest at the base rate, as defined in the Credit Agreement (4.25% at June 30, 2017), plus the applicable margin, which ranges from 0.50% to 1.25% depending on STA Holdings’ senior leverage ratio on the pricing date. Eurodollar Loans bear interest at the adjusted LIBOR rate, as defined in the Credit Agreement, (1.422940% at June 30, 2017) plus the applicable margin, which ranges from 1.75% to 2.50% depending on STA Holdings’ senior leverage ratio on the pricing date.
26 STRONG TO THE CORE The Company’s Senior Secured Notes (as defined below) consisted of $35.0 million of five year, fixed rate senior secured notes at a coupon of 4.246% and with a maturity date of November 10, 2016. The senior secured notes (“Senior Secured Notes”) were issued under a note purchase agreement with two Canadian insurance companies. The Senior Secured Notes ranked pari passu with borrowings under the Credit Agreement. On September 1, 2016, in accordance with the Note Purchase Agreement dated December 14, 2006, between the Company, Sun Life Assurance Company of Canada, London Life Insurance Company and Computershare Trust Company, N . A . , the Company redeemed its Senior Secured Notes for $ 35 . 5 million in cash . The redemption amount was comprised of the principal amount of $ 35 . 0 million, plus interest and a make - whole payment totaling approximately $ 0 . 5 million in the aggregate . Borrowings under the Credit Agreement are collateralized by the unencumbered assets of Parkview Transit, STA Holdings and its subsidiaries, and certain shares of the capital stock of STA Holdings and the capital stock of each of its subsidiaries. In addition, payment and performance of the obligations under the Credit Agreement are guaranteed by each of STA Holdings’ subsidiaries and by Parkview Transit. At June 30, 2017, debt outstanding under the Credit Agreement totaled $172.1 million while outstanding letters of credit totaled $2.3 million, thus the Company had approximately $165.6 million in borrowing availability under the loan facilities of the Credit Agreement, subject to continued covenant requirements (excluding the $100.0 million accordion feature in additional commitments the Company may request under the Credit Agreement). In addition, at June 30, 2017, outstanding debt included approximately $123.3 million in Convertible Debentures. Convertible Debentures During the fiscal years ended June 30, 2011 and 2014, and during the second quarter of fiscal year 2017 STI closed the Convertible Debentures offerings as discussed above under the heading “General”. The US$ 6.25% Convertible Debentures had a seven year term, were denominated in U.S. dollars, were due and payable on June 30, 2018, and were callable by the Company beginning in July 2014 if certain conditions noted above, were met. On August 23, 2016, the Company announced that it called for the early redemption and settlement of the US$ 6.25% Convertible Debentures. Subsequent to announcement, approximately $0.1 million of the US$ 6.25% Convertible Debentures were converted into 6,736 shares of common stock. On September 19, 2016 the Company redeemed the remaining $59.9 million principal amount of US$ 6.25% US Convertible Debentures for cash in accordance with the Trust Indenture dated June 7, 2011, between STI and Computershare Trust Company of Canada governing the 6.25% US convertible unsecured debentures. In connection with the redemption, approximately $1.0 million in unamortized deferred financing costs were expensed in the twelve months ended June 30, 2017. The Cdn$ 6.25% Convertible Debentures have a five and a half year term, are denominated in Canadian dollars, are due and payable on June 30, 2019, and are callable by the Company beginning in July 2017, if certain conditions noted above, are met. None of the holders have converted any of the Cdn$ 6.25% Convertible Debentures as of June 30, 2017. The Cdn$ 5.25% Convertible Debentures have a seven year term, are denominated in Canadian dollars, are due and payable on September 30, 2021, and are callable by the Company beginning in September 2019, if certain conditions noted above, are met. None of the holders have converted any of the Cdn$ 5.25% Convertible Debentures as of June 30, 2017. The functional currency of STI is the Canadian dollar. The Cdn$ 6.25% Convertible Debentures and the Cdn$ 5.25% Convertible Debentures of STI are denominated in Canadian dollars. As the functional currency of STI is the Canadian dollar, exchange gains or losses related to the Cdn$ 6.25% Convertible Debentures and the Cdn$ 5.25% Convertible Debentures on the translation of the STI financial statements into U.S. dollars, the reporting currency, are deferred as a separate component of shareholders’ equity. The US$ 6.25% Convertible Debentures of STI were denominated in U.S. dollars. As the functional currency of STI is the Canadian dollar, unrealized gains or losses on re - measurement of the US$ 6.25% Convertible Debentures into Canadian dollars were considered transaction gains and losses, at the STI level, and were included in the consolidated statement of operations. On April 1, 2013, the Company put in place an intercompany loan associated with the payments of proceeds on the US$ 6.25% Convertible Debentures by STI to STA Holdings. This intercompany loan was denominated in U.S. dollars, reflected an interest rate of 6.25% per annum and had a set maturity date of June 30, 2018. As such, this intercompany loan was considered a short - term intercompany loan (as the loan is for a
STRONG TO THE CORE 27 definite term), and unrealized gains or losses on re - measurement of the STI intercompany loan receivable were considered transaction gains or losses as STI’s functional currency is the Canadian dollar and were included in the consolidated statement of operations. The re - measurement gains and losses resulting from this intercompany loan offset re - measurement gains and losses resulting from the US$ 6.25% Convertible Debentures in the consolidated statement of operations. This intercompany loan was extinguished in September 2016, in connection with the redemption of the US$ 6.5% Convertible Debentures. The Company expects to be able to repay, renew or refinance its various loan facilities and Convertible Debentures as they become due with other long term financing options (see “Forward - Looking Statements”). Leasing Arrangements During the fiscal year ended June 30, 2016, the Company entered into additional operating leases with ten major financial institutions to lease approximately $58.3 million in replacement school vehicles and $22.0 million in growth school vehicles for the 2015 - 2016 school year. The term of these leases is six years at effective fixed rates in the range of 2.6% to 4.2%. Annual lease payments on these additional leases will approximate $11.3 million per year for the term of the leases. During the fiscal year ended June 30, 2017, the Company entered into additional operating leases with nine major financial institutions to lease approximately $39.8 million in replacement school vehicles and $10.5 million in growth school vehicles for the 2016 - 2017 school year. The term of these leases is six years at effective fixed rates in the range of 1.9% to 4.4%. Annual lease payments on these additional leases will approximate $6.9 million per year for the term of the leases. Acquisitions and Investments On March 11, 2015 a wholly - owned subsidiary of the Company made a non - controlling investment in a consulting and management services firm for cash consideration of $1.7 million. The Company accounted for this investment under the equity method, in accordance with ASC - 323, Investments - Equity Method and Joint Ventures . During January and February 2016, a wholly - owned subsidiary of the Company purchased the remaining interest in the transportation consulting and management services firm and acquired a second consulting services firm. Combined, total consideration paid in January and February 2016 for both firms approximated $7.2 million, consisting of $6.2 million in cash and $1.0 million in common stock. The Company had previously invested $1.7 million in March 2015, to acquire a non - controlling interest in the first transportation consulting and management service firm as discussed above. Earnings of the acquired companies were included in the Company’s results of operations from the acquisition dates. The Company intends to selectively acquire contracts through new bids and conversions and to pursue additional acquisitions to the extent that it is able to finance these from operating cash flows, available financing under our Credit Facility and the potential additional issuance of common shares and debt securities (see “Forward - Looking Statements”) . Fuel Prices The Company operates a fleet of approximately 13,100 vehicles as at June 30, 2017 and consumes substantial amounts of fuel for its operations. While the Company currently has fuel mitigation features in approximately 60% of its contracts that provide some measure of fuel protection against price increases, ranging from reimbursement by the school district to outright purchase of fuel by school districts, there is no assurance that it will be able to adequately protect itself from increases in such costs other than those contractually obligated. The Company is still exposed to market price fluctuations under some of these fuel mitigation features. As noted above, the Company also endeavors to lock in an additional 20% of its fuel exposure with fixed rate contracts, while the final 20% of fuel exposure is fully subject to market price variations. For fiscal year 2016, the Company entered into fixed price contracts with fuel vendors starting in October 2014 (the period of fiscal 2015 when market prices started to decline), for the approximately 20% of its fuel exposure locked in for fiscal year 2016. In August and November 2015, the Company locked in approximately 15% of its fuel exposure for fiscal year 2017. To date, the Company has locked in about 85% of the approximately 20% of its fuel exposure for the 2018 fiscal year and about 15% of the same 20% exposure for the 2019 fiscal year.
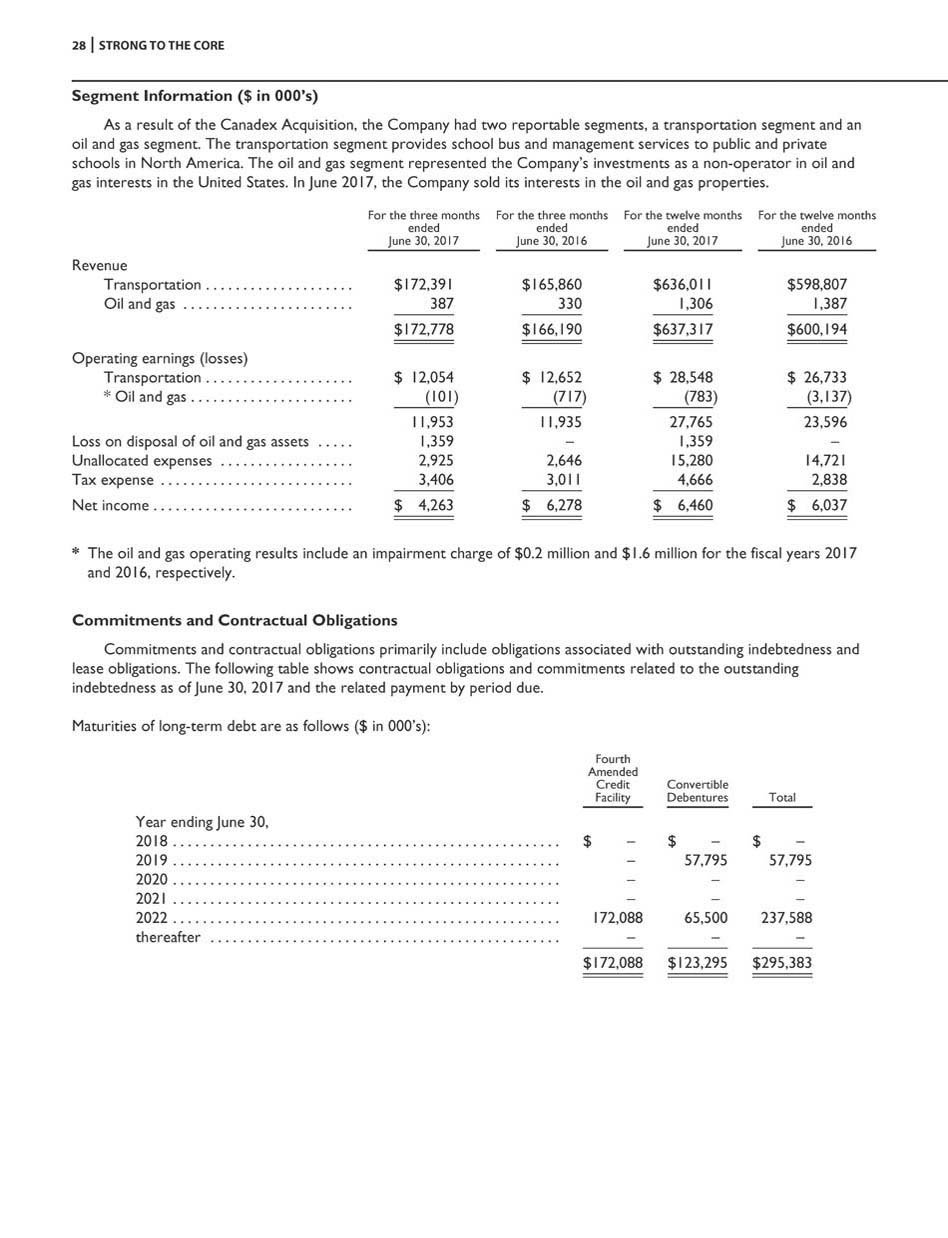
28 STRONG TO THE CORE Segment Information ($ in 000’s) As a result of the Canadex Acquisition, the Company had two reportable segments, a transportation segment and an oil and gas segment. The transportation segment provides school bus and management services to public and private schools in North America. The oil and gas segment represented the Company’s investments as a non - operator in oil and gas interests in the United States. In June 2017, the Company sold its interests in the oil and gas properties. For the three months ended For the three months ended For the twelve months ended For the twelve months ended June 30, 2017 June 30, 2016 June 30, 2017 June 30, 2016 Revenue Transportation .................... $172,391 $165,860 $636,011 $598,807 Oil and gas ....................... 387 330 1,306 1,387 $172,778 $166,190 $637,317 $600,194 Operating earnings (losses) Transportation .................... $ 12,054 $ 12,652 $ 28,548 $ 26,733 * Oil and gas ...................... (101) (717) (783) (3,137) 11,953 11,935 27,765 23,596 Loss on disposal of oil and gas assets ..... 1,359 – 1,359 – Unallocated expenses .................. 2,925 2,646 15,280 14,721 Tax expense .......................... 3,406 3,011 4,666 2,838 Net income ........................... $ 4,263 $ 6,278 $ 6,460 $ 6,037 * The oil and gas operating results include an impairment charge of $0.2 million and $1.6 million for the fiscal years 2017 and 2016, respectively. Commitments and Contractual Obligations Commitments and contractual obligations primarily include obligations associated with outstanding indebtedness and lease obligations. The following table shows contractual obligations and commitments related to the outstanding indebtedness as of June 30, 2017 and the related payment by period due. Maturities of long - term debt are as follows ($ in 000’s): Fourth Amended Credit Facility Convertible Debentures Total – $ – – – – 57,795 – – Year ending June 30, 2018 .................................................... $ 2019 .................................................... 2020 .................................................... 2021 .................................................... 2022 ................................................... . 172,088 thereafter ............................................... – – $ 57,795 – – 65,500 237,588 – – $172,088 $123,295 $295,383

STRONG TO THE CORE 29 The following table represents future minimum rental payments and operating lease payments under non - cancelable operating leases as at June 30, 2017 ($ in 000’s): Facility Leases Vehicle Leases Total Year ending June 30, 2018 ..................................................... $16,07 0 $ 39,902 $ 55,972 2019 ..................................................... 10,619 35,626 46,245 2020 ..................................................... 6,771 29,436 36,207 2021 ..................................................... 4,680 18,384 23,064 2022 ..................................................... 2,763 8,093 10,856 2023 and thereafter ........................................ 2,080 71 2,151 Total minimum payments ................................... $42,98 3 $131,51 2 $174,49 5 Outstanding Share Data As at June 30, 2017, the Company had 94,631,743 issued and outstanding common shares, Cdn $75.0 million principal amount of Cdn$ 6.25% Convertible Debentures convertible into approximately 8.3 million common shares and Cdn $85.0 million principal amount of Cdn$ 5.25% Convertible Debentures convertible into approximately 9.1 million common shares. There are no preferred shares issued and outstanding. (see - “Liquidity and Capital Resource - Convertible Debentures”). Quantitative and Qualitative Disclosures About Market Risk As noted in the cautionary language concerning forward - looking disclosures under the heading “Forward - Looking Statements” in this management discussion and analysis, this section contains forward - looking statements, including with respect to the Company’s anticipated dividends. Such statements involve known and unknown risks, uncertainties and other factors outside of management’s control, including the risk factors set forth in this management discussion and analysis that could cause results to differ materially from those described or anticipated in the forward - looking statements. In the normal course of business, the Company is exposed to market risks arising from adverse changes in interest rates and the Cdn$/US$ foreign currency exchange rate. Market risk is defined for these purposes as the potential change in the fair market value of financial assets and liabilities resulting from an adverse movement in these rates. Except for the changes in the Cdn$/US$ foreign currency exchange rate during the fiscal year 2017, there have been no other material changes to the Company’s exposure to the above - mentioned market risks during the fiscal year 2017. As at June 30, 2017, the Company’s material variable rate borrowings included the outstanding borrowings under the Credit Agreement. As at June 30, 2017, the Company had $174.4 million in outstanding indebtedness under the Credit Agreement. A 100 basis point change in interest rates, applied to these borrowings as at June 30, 2017 would result in approximately a $1.7 million annual change in interest expense and a corresponding change in cash flow. The Cdn$ 6.25% Convertible Debentures due June 30, 2019 and the Cdn$ 5.25% Convertible Debentures due September 30, 2021 (collectively the “Convertible Debentures”) are denominated and payable, upon maturity, in Canadian dollars. The Company has not entered into any hedge arrangement with respect to the principal payment of the Convertible Debentures upon maturity. The Company uses it cash flows from its Canadian operations to partially mitigate the exchange risk on the Convertible Debenture interest payments. The Company is also exposed to changes in the market price of fuel in the ordinary course of business. As a partial mitigation of the impact of fuel price volatility on the Company’s results, approximately 60% of the Company’s revenue contracts have some form of mitigation against fuel price increase, ranging from reimbursement by the school district to outright purchase of fuel by school districts. The Company is still exposed to some market price fluctuations under some of these fuel mitigation features. For fiscal year 2016, the Company entered into fixed price contracts with fuel vendors
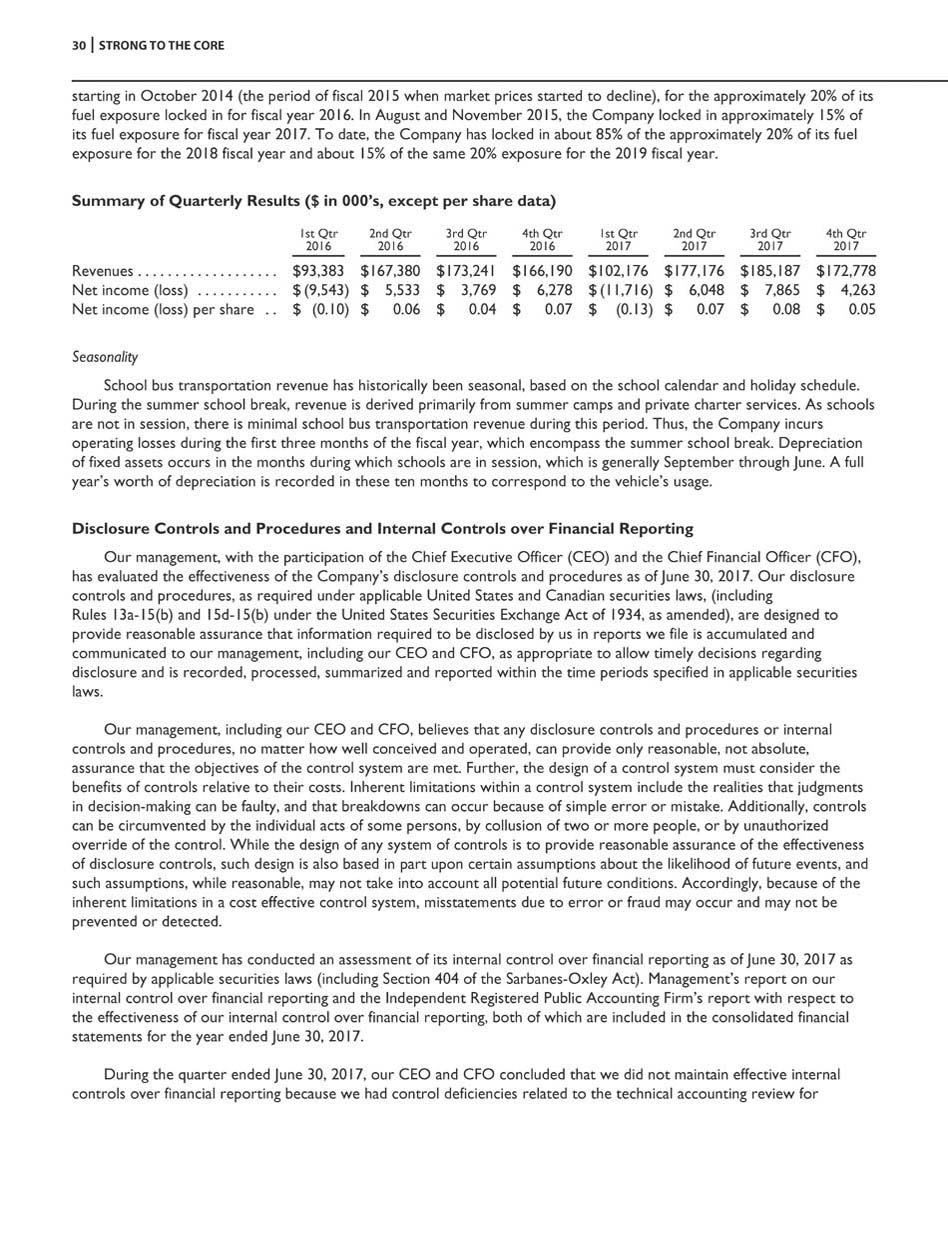
30 STRONG TO THE CORE starting in October 2014 (the period of fiscal 2015 when market prices started to decline), for the approximately 20% of its fuel exposure locked in for fiscal year 2016. In August and November 2015, the Company locked in approximately 15% of its fuel exposure for fiscal year 2017. To date, the Company has locked in about 85% of the approximately 20% of its fuel exposure for the 2018 fiscal year and about 15% of the same 20% exposure for the 2019 fiscal year. Summary of Quarterly Results ($ in 000’s, except per share data) 1st Qtr 2nd Qtr 3rd Qtr 4th Qtr 1st Qtr 2nd Qtr 3rd Qtr 4th Qtr 2016 2016 2016 2016 2017 2017 2017 2017 Revenues ................... $93,383 $167,38 0 $173,24 1 $166,19 0 $102,176 $177,17 6 $185,18 7 $172,77 8 Net income (loss) ........... $ (9,543) $ 5,533 $ 3,769 $ 6,278 $ (11,716) $ 6,048 $ 7,865 $ 4,263 Net income (loss) per share . . $ (0.10) $ 0.0 6 $ 0.0 4 $ 0.0 7 $ (0.13) $ 0.0 7 $ 0.0 8 $ 0.0 5 Seasonality School bus transportation revenue has historically been seasonal, based on the school calendar and holiday schedule. During the summer school break, revenue is derived primarily from summer camps and private charter services. As schools are not in session, there is minimal school bus transportation revenue during this period. Thus, the Company incurs operating losses during the first three months of the fiscal year, which encompass the summer school break. Depreciation of fixed assets occurs in the months during which schools are in session, which is generally September through June. A full year’s worth of depreciation is recorded in these ten months to correspond to the vehicle’s usage. Disclosure Controls and Procedures and Internal Controls over Financial Reporting Our management, with the participation of the Chief Executive Officer (CEO) and the Chief Financial Officer (CFO), has evaluated the effectiveness of the Company’s disclosure controls and procedures as of June 30, 2017. Our disclosure controls and procedures, as required under applicable United States and Canadian securities laws, (including Rules 13a - 15(b) and 15d - 15(b) under the United States Securities Exchange Act of 1934, as amended), are designed to provide reasonable assurance that information required to be disclosed by us in reports we file is accumulated and communicated to our management, including our CEO and CFO, as appropriate to allow timely decisions regarding disclosure and is recorded, processed, summarized and reported within the time periods specified in applicable securities laws. Our management, including our CEO and CFO, believes that any disclosure controls and procedures or internal controls and procedures, no matter how well conceived and operated, can provide only reasonable, not absolute, assurance that the objectives of the control system are met. Further, the design of a control system must consider the benefits of controls relative to their costs. Inherent limitations within a control system include the realities that judgments in decision - making can be faulty, and that breakdowns can occur because of simple error or mistake. Additionally, controls can be circumvented by the individual acts of some persons, by collusion of two or more people, or by unauthorized override of the control. While the design of any system of controls is to provide reasonable assurance of the effectiveness of disclosure controls, such design is also based in part upon certain assumptions about the likelihood of future events, and such assumptions, while reasonable, may not take into account all potential future conditions. Accordingly, because of the inherent limitations in a cost effective control system, misstatements due to error or fraud may occur and may not be prevented or detected. Our management has conducted an assessment of its internal control over financial reporting as of June 30, 2017 as required by applicable securities laws (including Section 404 of the Sarbanes - Oxley Act). Management’s report on our internal control over financial reporting and the Independent Registered Public Accounting Firm’s report with respect to the effectiveness of our internal control over financial reporting, both of which are included in the consolidated financial statements for the year ended June 30, 2017. During the quarter ended June 30, 2017, our CEO and CFO concluded that we did not maintain effective internal controls over financial reporting because we had control deficiencies related to the technical accounting review for
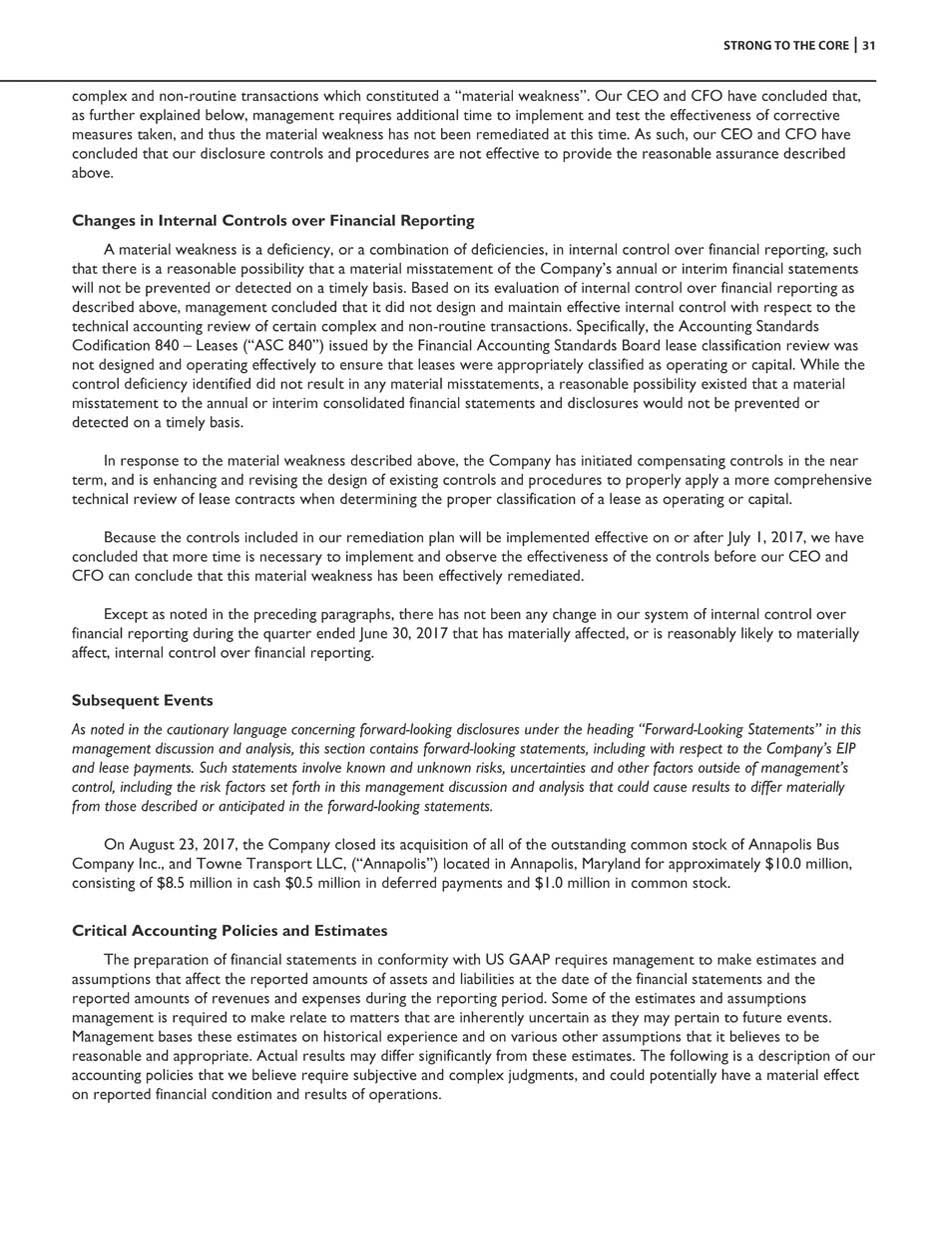
STRONG TO THE CORE 31 complex and non - routine transactions which constituted a “material weakness”. Our CEO and CFO have concluded that, as further explained below, management requires additional time to implement and test the effectiveness of corrective measures taken, and thus the material weakness has not been remediated at this time. As such, our CEO and CFO have concluded that our disclosure controls and procedures are not effective to provide the reasonable assurance described above. Changes in Internal Controls over Financial Reporting A material weakness is a deficiency, or a combination of deficiencies, in internal control over financial reporting, such that there is a reasonable possibility that a material misstatement of the Company’s annual or interim financial statements will not be prevented or detected on a timely basis. Based on its evaluation of internal control over financial reporting as described above, management concluded that it did not design and maintain effective internal control with respect to the technical accounting review of certain complex and non - routine transactions. Specifically, the Accounting Standards Codification 840 – Leases (“ASC 840”) issued by the Financial Accounting Standards Board lease classification review was not designed and operating effectively to ensure that leases were appropriately classified as operating or capital. While the control deficiency identified did not result in any material misstatements, a reasonable possibility existed that a material misstatement to the annual or interim consolidated financial statements and disclosures would not be prevented or detected on a timely basis. In response to the material weakness described above, the Company has initiated compensating controls in the near term, and is enhancing and revising the design of existing controls and procedures to properly apply a more comprehensive technical review of lease contracts when determining the proper classification of a lease as operating or capital. Because the controls included in our remediation plan will be implemented effective on or after July 1, 2017, we have concluded that more time is necessary to implement and observe the effectiveness of the controls before our CEO and CFO can conclude that this material weakness has been effectively remediated. Except as noted in the preceding paragraphs, there has not been any change in our system of internal control over financial reporting during the quarter ended June 30, 2017 that has materially affected, or is reasonably likely to materially affect, internal control over financial reporting. Subsequent Events As noted in the cautionary language concerning forward - looking disclosures under the heading “Forward - Looking Statements” in this management discussion and analysis, this section contains forward - looking statements, including with respect to the Company’s EIP and lease payments. Such statements involve known and unknown risks, uncertainties and other factors outside of management’s control, including the risk factors set forth in this management discussion and analysis that could cause results to differ materially from those described or anticipated in the forward - looking statements. On August 23, 2017, the Company closed its acquisition of all of the outstanding common stock of Annapolis Bus Company Inc., and Towne Transport LLC, (“Annapolis”) located in Annapolis, Maryland for approximately $10.0 million, consisting of $8.5 million in cash $0.5 million in deferred payments and $1.0 million in common stock. Critical Accounting Policies and Estimates The preparation of financial statements in conformity with US GAAP requires management to make estimates and assumptions that affect the reported amounts of assets and liabilities at the date of the financial statements and the reported amounts of revenues and expenses during the reporting period. Some of the estimates and assumptions management is required to make relate to matters that are inherently uncertain as they may pertain to future events. Management bases these estimates on historical experience and on various other assumptions that it believes to be reasonable and appropriate. Actual results may differ significantly from these estimates. The following is a description of our accounting policies that we believe require subjective and complex judgments, and could potentially have a material effect on reported financial condition and results of operations.

32 STRONG TO THE CORE Goodwill and Indefinite Lived - Intangibles . Goodwill represents the excess of cost over fair value of net assets acquired in business combinations accounted for under the purchase method . Goodwill and trade names are not amortized but rather assessed for impairment annually or more frequently if circumstances change and indicators of impairment are present . The annual impairment testing is performed in the fourth quarter . When assessing goodwill impairment, the Company may at its option perform a qualitative assessment to first assess whether the fair value of a reporting unit is less than its carrying value. If the Company does not choose to perform a qualitative assessment, a quantitative impairment test is required. The quantitative assessment requires the Company to compare the fair value of the reporting unit with its carrying value, including goodwill. If the carrying value exceeds the fair value, impairment loss will be recognized in the statement of earnings in an amount equal to the difference and the fair value of goodwill becomes the new carrying value of goodwill for that reporting unit which is then used in future impairment tests. When assessing the impairment for trade names, if the carrying value exceeds the fair value, an impairment loss will be recognized in the statement of earnings in an amount equal to the excess. Fair values are derived by using discounted cash flow analyses which requires, among other factors, estimates of the amount and timing of projected cash flows and the appropriate discount rate. Other identifiable intangible assets consist of contract rights and covenants not to compete. Contract rights, which include customer relationships, are amortized on a straight - line basis over an estimated useful life of 20 to 23 years. The useful life for contract rights was determined based on third party valuation reports prepared for the Company. The valuations took into account the average length of the contracts, the expected renewal periods and assumptions regarding future renewals based upon historical customers lives. Covenants not to compete are amortized on a straight - line basis over an estimated useful life of two to five years. Impairment of Long - Lived Assets. Management continually evaluates whether events or circumstances have occurred that indicate that the remaining estimated useful lives of property and equipment, contract rights and covenants not to compete may warrant revision or that the remaining balances may not be recoverable. Events or circumstances that would trigger testing for impairment include, but are not limited to, the loss of a significant school district customer contract, a significant increase in the Company’s expense levels absent a corresponding increase in revenue that causes operating or cash flow losses or projected operating or cash flow losses, significant adverse changes in legal factors or the business climate in which the Company operates that could affect the value of long - lived assets, or the expectation that a long - lived asset will be sold or otherwise disposed of at a loss before the end of its previously estimated useful life. If this review indicates that the assets will not be recoverable, as determined based on the undiscounted future cash flows from the use of the assets, the carrying value of the assets will be reduced to their estimated fair value. Insurance Reserves. The Company’s insurance reserves reflect the estimated deductible amounts the Company is responsible for under the workers’ compensation and vehicle liability insurance programs. Our insurance expense for these items is largely dependent on our claims experience and our ability to control such claims, the actuarial development of claims to their select ultimate, in addition to third party premiums/expenses associated with this coverage. We have recorded estimated insurance reserves for the anticipated losses on open claims under the workers’ compensation and vehicle liability programs based upon actuarial analysis prepared by an independent third party actuary. Although the estimates of these accrued liabilities are based on the factors mentioned above, it is possible that future cash flows and results of operations could be materially affected by changes in our assumptions or changes in claims experience and development. Stock Based Compensation. The Company accounted for stock - based compensation and other stock - based payments using the fair value method. Under the fair value method, the fair value of the stock based compensation and other stock - based payments were estimated at the grant date and the total fair value was amortized over the vesting schedule of the awards as compensation expense. The Class B common shares issued by STA Holdings under the EIP were fully vested on the grant date, and, as such, the Company recognized compensation expense when the shares were issued. These shares were accounted for as a liability upon issuance and re - measured at fair value on a quarterly basis. Changes in fair value were recorded in the Consolidated Statement of Operations.

STRONG TO THE CORE 33 The Class B common shares were not traded in an active market and had certain restrictions on their transferability. These shares were accounted for as a liability upon issuance, as a result of a put option they contained. The put option provided for a fair market value of Class B Series Three common shares put at an amount equal to the weighted average trading price of the STI common shares for the ten consecutive trading days immediately prior to the date of put. Stock based compensation expense associated with the issuance of Class B Series Three common shares was based on the trading value of the STI common shares at the date of grant, similar to the fair value of such common shares in connection with the put option values described above. On November 8, 2016, the Company’s shareholders approved a new performance share grant plan of the Company (the “New PSG Plan”). The New PSG Plan will replace the EIP originally set up at the STA Holdings level. Under the New PSG Plan, participants will be eligible to receive performance share grant units from the Company (“PSG Units”) that are redeemable for common shares of the Company. The vesting of PSG Units will be based entirely upon the achievement of multiple pre - defined performance measures and, except in certain prescribed circumstances the PSG Units will vest over a three - year period. The first grant of PSG Units is expected to occur in the 2018 fiscal year. Income Taxes. Income taxes have been computed utilizing the asset and liability approach, under which deferred tax assets and liabilities are recognized for the expected future tax consequences of temporary differences between the financial reporting and tax bases of assets and liabilities. Deferred tax assets and liabilities are measured using the currently enacted tax rates expected to be in effect for the years in which those taxes are expected to be realized or settled. A valuation allowance is recorded to reduce deferred tax assets to the amount that is believed to be more - likely - than - not to be realized. The recorded deferred income tax liability results from a difference between the book and tax basis of certain transportation equipment, other equipment and intangible assets. The Company uses judgment in determining income tax provisions and in evaluating its tax positions under the accounting guidance for income taxes. Additional provisions for income taxes are established when, despite the belief that tax positions are fully supportable, there remain certain positions that do not meet the minimum probability threshold, which is a tax position that is more - likely - than - not to be sustained upon examination by the applicable taxing authority. The Company and its subsidiaries are examined by various federal and state tax authorities. The Company regularly assesses the potential outcomes of these examinations and any future examinations for the current or prior years in determining the adequacy of its provision for income taxes. The Company continually assesses the likelihood and amount of potential adjustments and adjusts the income tax provision, the current tax liability and deferred taxes in the period in which the facts that give rise to a revision become known. Accounting for Derivatives and Hedging Activities. The Company records its derivatives at fair value on the balance sheet, which requires that a company take into account its own credit risk and the credit risk of the counterparty when determining the fair value of financial assets and financial liabilities, including derivative instruments. Changes in fair value will be recorded in the consolidated statement of operations or through other comprehensive income depending on the nature of the derivative instrument. The Company did not elect hedge accounting for any of its derivative financial instruments and therefore records all changes in fair value in the consolidated statement of operations. Foreign Currency Translation: Monetary assets and liabilities denominated in a currency other than the functional currency are translated at the rate of exchange prevailing at the balance sheet date. Transactions denominated in a currency other than the functional currency are translated at the rate of exchange prevailing on the transaction date. Gains and losses on translation of these items are considered transaction gain and losses and are included in the consolidated statements of operations in foreign currency (gain) loss. The functional currency of STI and the Company’s Canadian operations is the Canadian dollar. The functional currency of the Company’s operations in the United States is the U.S. dollar. The Company’s consolidated financial statements are reported in U.S. dollars, as the principal operations and cash flows of its subsidiaries are conducted in U.S. dollars. As a result, the assets and liabilities of the Company, and the Company’s Canadian operations are translated into U.S. dollars using the exchange rate in effect at the period end and revenues and expenses are translated at the average rate during the period. Exchange gains or losses on translation are deferred as a separate component of shareholders’ equity. The Cdn$ 6.25% Convertible Debentures and the Cdn$ 5.25% Convertible Debentures of STI are denominated in Canadian dollars.

34 STRONG TO THE CORE As the functional currency of STI is the Canadian dollar, exchange gains or losses related to the Cdn$ 6.25% Convertible Debentures and the Cdn$ 5.25% Convertible Debentures on the translation of the STI financial statements into U.S. dollars, the reporting currency, are deferred as a separate component of shareholders’ equity. The US$ 6.25% Convertible Debentures of STI were denominated in U.S. dollars. As the functional currency of STI is the Canadian dollar, unrealized gains or losses on re - measurement of the US$ 6.25% Convertible Debentures into Canadian dollars were considered transaction gains and losses, at the STI level, and were included in the consolidated statement of operations. Foreign currency transactions gains and losses, related to short - term related intercompany loans are recorded in the Consolidated Statement of Operations as incurred. Foreign currency transaction gains and losses for intercompany loans that are considered long - term in nature are recorded in Accumulated Other Comprehensive Income as incurred. Oil and Gas Reserve Estimates . Estimates of oil and gas reserves in the consolidated financial statements were prepared through reserve engineering, which is a subjective process of estimating underground accumulations of oil and natural gas that cannot be measured in an exact manner. The process relied on interpretations of available geographical, geophysical, engineering and production data. The accuracy of a reserve estimate is a function of the quality and quantity of available data, the interpretation of that data, the accuracy of various mandated economic assumptions and the judgment of the persons preparing the estimate. The Company’s reserve information was based on estimates prepared by independent oil and gas industry consultants. Estimates prepared by others may be different than these estimates. Because these estimates depended on many assumptions such as projected future rates of production, estimated commodity price forecasts and the timing of future expenditures, all of which may differ from actual results, reserve estimates may be different from the quantities of oil and gas that were ultimately recovered. In addition, the results of drilling, testing and production after the date of an estimate may justify revisions to the estimate. The present value of future net oil and gas revenues should not be assumed to have been the current market value of the Company’s estimated oil and gas reserves. Actual future prices, costs and reserves may have been materially higher or lower than the prices, costs and reserves used for the future net revenue calculations. Reserve estimates can have a significant impact on earnings, as they were a key component in the calculation of oil and gas depreciation and depletion. A downward revision in the reserve estimate could result in a higher depreciation and depletion charge to earnings. In addition, if the net capitalized costs are determined to be in excess of the calculated ceiling, which is based largely on reserve estimates, the excess must be written off as an expense charged against earnings. Asset Retirement Obligations . The asset retirement obligation provision that was recorded in the consolidated financial statements was based on estimates of total costs for future restoration and abandonment of oil and natural gas wells and facilities, as well as estimates of when these costs will occur. The estimates were based on the Company’s net ownership interest in the wells. Estimating these future costs required management to make estimates and judgments that were subject to future revisions based on numerous factors, including changing technology and political and regulatory environments. Risk Factors The following section describes both general and specific risks that could affect our financial performance. The risks described below are not the only risks facing the Company. Additional risks and uncertainties that are not currently known or that are currently considered to be immaterial may also materially and adversely affect the Company and our business operations. If any of these risks actually occur, the Company’s business, financial conditions, results of operations and cas h flow could be adversely affected, in which case the trading prices of the Common Shares and the Convertible Debentures would decline. Risks Related to our Business We cannot control certain of our operating expenses The price of fuel, insurance costs and maintenance costs are operating expenses over which we have little or no control. Although certain of our customer contracts provide for automatic price increases or other forms of protection

STRONG TO THE CORE 35 against fuel price and/or insurance cost increases, significant increases in the price of fuel, insurance or maintenance could affect our costs as well as the affordability of our services to our customers of our services. Similarly, depending on the availability of qualified drivers and the level of competition with other businesses for their services, we may have little control over the labour costs for our drivers. Any difficulties in attracting and retaining qualified drivers could affect our costs and, ultimately, result in the loss of customer contracts due to the inability to service the contract. Accordingly, a significant escalation in our operating expenses or in the inability to attract and retain qualified drivers could have a material adverse effect on us, our financial condition, results of operations and cash flows. We have significant capital expenditure requirements In order to maintain our school bus fleet, and to expand our business pursuant to our business strategy, we are required to make significant capital expenditures. There can be no assurance that cash flow from operations will enable us to acquire a sufficient number of new vehicles or make capital expenditures necessary to implement any expansion of service. If we are required to obtain additional financing, there can be no assurance that we can obtain financing on terms acceptable to us. Our inability to have sufficient cash flows or procure the financing necessary to acquire additional school buses or make needed capital improvements could delay or prevent us from implementing our business strategy and would have a material adverse effect on us. Future maintenance capital expenditures are dependent on a number of future events. The future replacement of school vehicles will be dependent on contract retention and renewal and will also be dependent on the number of new contracts secured through acquisitions, new bids and conversions and the renewal of current contracts. If current contracts are not renewed, or only a portion are renewed, i.e. the number of net new contracts is higher or lower than expected, the assumed level of maintenance capital expenditures will be significantly different from the level currently anticipated. In addition, future expenditures will also depend on future vehicle pricing, negotiating ability with regard to future vehicles pricing, and future vehicle specifications. The Company’s consolidated indebtedness could negatively impact the business On June 30, 2017, the Company had total indebtedness of $295.4 million (including $123.3 million indebtedness to holders of Debentures). The degree to which the Company is leveraged on a consolidated basis could have important consequences to the holders of Common Shares and Debentures, including: • the Company’s ability in the future to obtain additional financing for working capital, capital expenditures or other purposes may be limited; • the Company may be unable to refinance indebtedness on terms acceptable to it or at all; • a significant portion of the Issuer’s cash flow (on a consolidated basis) is likely to be dedicated to the payment of the principal of and interest on the Company’s indebtedness, including the Convertible Debentures, thereby reducing funds available for future operations, capital expenditures and/or dividends on the Common Shares; • the Company may be more vulnerable to economic downturns and be limited in our ability to withstand competitive pressures; • the Company may be limited in its ability to plan for or react to changes in its business or the industry in which it operates; and • the Company may be at a competitive disadvantage to its competitors that have less indebtedness. The restrictive covenants in the Credit Agreement could impact the Company’s business and affect its ability to pursue its business strategies The Credit Agreement features restrictive covenants that limit the Company’s ability, among other things, to: • incur additional indebtedness;
36 STRONG TO THE CORE • pay dividends and make distributions in respect of the Company’s equity or to make certain other restrictive payments or investments; • sell assets; • consolidate, merge, sell or otherwise dispose of all or substantially all of the Company’s assets; • enter into transactions with the Company’s and/or the Issuer’s affiliates; • create liens; and • enter into new lines of businesses. The Credit Agreement also includes other and more restrictive covenants and prohibits the Company and certain of its affiliates from prepaying its other indebtedness, while debt under the Credit Agreement is outstanding. The Credit Agreement also requires the Company to achieve specified financial and operating results and maintain compliance with specified financial ratios. The Company’s ability to comply with these ratios may be affected by events beyond its control. A breach of any of the restrictive covenants in the Credit Agreement or in the Company’s ability to comply with the required financial ratios could result in a default under the Credit Agreement. If a default occurs, the lenders under the Credit Agreement may elect to declare all borrowings outstanding under the facility, together with accrued interest and other fees, to be immediately due and payable. We may not be able to make all principal payments on the Convertible Debentures The Cdn$ 6.25% Convertible Debentures will mature on June 30, 2019 and the Cdn$ 5.25% Convertible Debentures will mature on September 30, 2021. STI may not be able to refinance the principal amount of the Convertible Debentures in order to repay the principal outstanding or may not have generated enough cash from operations to meet this obligation. There is no guarantee that STI will be able to repay the outstanding principal amount upon maturity of the Convertible Debentures. As a result of the subordinated nature of the guarantees of the Debentures, upon any distribution to creditors of the Company in a bankruptcy, liquidation or reorganization or similar proceeding relating to the Company or its property or assets, the holders of the Company’s senior indebtedness will be entitled to be paid in full in cash before any payment may be made with respect to the Debentures. Our business objectives and growth strategy may be affected by factors outside of our control Some of the factors that may affect our ability to successfully achieve our business objectives are the following: • notwithstanding our high retention rate of renewable contracts, we may be unable to retain certain of our existing customer contracts, or we may only be able to renew them at minimal or no price increase, or price reductions, reducing profitability. Specifically, the decision to renew contracts is not made solely by us and may be based upon factors beyond our control. Accordingly, there can be no assurance that any of our current or future contracts will be extended, or if extended, that the rates of compensation for such extensions will be acceptable to us. Moreover, there can be no assurance that the school districts that currently employ our services will not seek to satisfy their transportation needs in the future by alternative means, including reducing or eliminating transportation services. We had 110 contracts that were up for renewal for fiscal year 2017. The approximate percentages of fiscal year 2017 revenue that are up for renewal (including annual contract renewals in New Jersey) for fiscal years 2018 and 2019 are 34% and 38%, respectively; • we may be unable to find suitable businesses to acquire or to successfully complete acquisitions on profitable terms or to successfully integrate acquired businesses; and • we may be unable to identify conversion opportunities or win bid contracts on profitable terms or to find adequate facilities to operate conversion or bid contracts won.
STRONG TO THE CORE 37 Please see “ We face a number of risks in connection with our acquisition strategy ” and “ Some of our customer contracts may be terminated due to factors beyond our control ” in these Risk Factors for a fuller discussion of these matters. We face a number of risks in connection with our acquisition strategy As part of our business strategy, we have expanded through acquisitions and will likely acquire additional businesses in the future. The acquisition and development of existing businesses to be operated by us will be dependent on our ability to identify, acquire and develop suitable acquisition targets in both new and existing markets. While we are careful in selecting the businesses that we acquire, and while the sellers of these businesses routinely execute indemnities in our favour relating to pre - closing liabilities, acquisitions involve a number of risks, including (i) the possibility that we, as successor owner, may be legally and financially responsible for liabilities of prior owners if the indemnities are inapplicable or the former owner has limited assets; (ii) the possibility that we pay more than the acquired company or assets are worth; (iii) the additional expense associated with completing an acquisition and amortizing any acquired intangible assets; (iv) the difficulty of assimilating the operations and personnel of the acquired business; (v) the challenge of implementing uniform standards, controls, procedures and policies throughout the acquired business; (vi) the inability to integrate, train, retain and motivate key personnel of the acquired business; (vii) the potential disruption of our ongoing business and the distraction of management from its day - to - day operations; and (viii) the inability to incorporate the acquired business successfully into our operations. Such risks, if they materialize, could have a material adverse effect on us, our financial condition, results of operations and cash flows. In addition, we may not be able to maintain the levels of operating efficiency that any of the acquired businesses had achieved or might have achieved separately. Successful integration of each of their operations would depend upon our ability to manage those operations and to eliminate redundant and excess costs. As a result of difficulties associated with combining operations, we may not be able to achieve the cost savings and other benefits that we would hope to achieve with these acquisitions. Any difficulties in this process could disrupt our ongoing business, distract management, result in the loss of key personnel, increase our expenses and otherwise have a material adverse effect on our business, financial condition, results of operations and cash flows. There can be no assurance that the acquired businesses will achieve anticipated levels of profitability. We may be adversely affected by substantial competition in the school bus transportation industry and increased consolidation within the industry The school bus transportation industry is highly competitive and we expect that there will continue to be substantial competition for contract bidding and for prospective acquisitions. Such competition may decrease the profitability associated with any contract and increase the cost of acquisitions. Contracts are generally awarded pursuant to public bidding, where price is the primary criteria for a contract award. We have many competitors in the school bus transportation business, including transportation companies with resources and facilities substantially greater than ours and school districts that operate their own buses. There can be no assurance that we will be able to identify, acquire or profitably manage additional contracts or that the assumptions underlying the contract price and / or expense levels included in the bid process will be realized. Although we have historically been competitive in the market for new contracts as well as for acquisitions of other companies, there can be no assurance that we will be able to compete effectively in the future. In particular, the school bus transportation industry is undergoing significant consolidation, which has intensified the competition for contracts and acquisitions. From time to time, we make unsolicited inquiries with respect to possible acquisitions. Whether such inquiries will result in further communications or, ultimately, an acquisition, has depended, and will continue to depend upon the facts and circumstances in each case, including whether our competitors make bids for such contracts and acquisitions. Any failure to compete effectively could have a material adverse effect on the Company, our financial condition, results of operations and cash flows. Our business depends on certain key personnel We believe that our success depends, in part, on the retention of senior executive and regional management. There can be no assurance that we would be able to find qualified replacements for the individuals who make up our senior
38 STRONG TO THE CORE management team if their services were no longer available. The loss of services of one or more members of the senior management team could adversely affect our business, results of operations and our ability to effectively pursue our business strategy. We do not maintain key - man life insurance for any of our employees. A greater number of our employees may join unions Although some of our employees are subject to collective bargaining agreements, there are no assurances that the number of our employees who are members of unions will not increase in the future. A significant increase in the number of our employees becoming members of unions could result in increased labour costs and have a material adverse effect on us, our financial condition, results of operations and cash flows. We may be adversely affected by rising insurance costs Our cost of maintaining vehicle liability, personal injury, property damage and workers’ compensation insurance is significant. We could experience higher insurance premiums as a result of adverse claims experience or because of general increases in premiums by insurance carriers for reasons unrelated to our own claims experience. As an operator of school buses, we are exposed to claims for personal injury or death and property damage as a result of accidents. Generally, our insurance policies must be renewed annually. Our ability to continue to obtain insurance at affordable premiums also depends upon our ability to continue to operate with an acceptable safety record. A significant increase in the number of claims against us, the assertion of one or more claims in excess of our policy limits or the inability to obtain adequate insurance coverage at acceptable rates, or at all, could have a material adverse effect on us. In addition, the running of statutes of limitations for personal injuries to minor children typically is suspended during the children’s legal minority. Therefore, it is possible that accidents causing injuries to minors on school buses may not give rise to lawsuits until a number of years later, which could also have a material adverse effect on us. We may not be insured for certain losses We may become subject to liabilities for claims for which insurance is not normally obtained, hazards that we cannot or may not elect to insure because of high premium costs or other reasons or for occurrences that exceed maximum coverage under our policies. For example, we do not have insurance to guard against claims for breach of contract. The occurrence of any liability for which we are not insured, any liability for a claim that exceeds our maximum coverage under our policies, or a multiplicity of otherwise insured claims for amounts within the deductible levels in our policies, could have a material adverse effect on us, our financial condition, results of operations and cash flows. We may be adversely affected by current and new governmental laws and regulations We are required to comply with laws and regulations relating to safety, driver qualifications, insurance, worker overtime and other matters promulgated by various federal, state, provincial and local regulatory agencies including, among others, state motor vehicle agencies, state departments of education, the Federal Highway and Safety Administration, the National Highway Traffic Safety Administration and the Occupational Safety and Health Administration. We are also required to comply with certain statutes, such as the Americans with Disabilities Act. We have incurred, and expect to incur, costs for our operations to comply with these legal requirements, and these costs could increase in the future. Many of these legal requirements provide for substantial fines, orders, including orders to cease operations, and criminal sanctions for violations. Although we believe that we are in material compliance with applicable safety laws and regulations, it is difficult to predict the future development of such laws and regulations or their impact on our business or results of operations. We anticipate that standards under these types of laws and regulations will continue to tighten and that compliance will require increased capital and other expenditures. Furthermore, we cannot predict whether new laws or regulations will be adopted and, if adopted, no assurance can be given that the implementation of such laws or regulations and any additional compliance costs associated therewith will not have a material adverse effect on us. Also, a significant order or judgment against us, the loss of a significant permit or license or the imposition of a significant fine or any other liability in excess of, or not covered by, our reserves or our insurance could adversely affect our business, financial condition and results of operations.
STRONG TO THE CORE 39 We may be adversely affected by environmental requirements Our facilities and operations are subject to extensive and constantly evolving federal, state, provincial and local environmental and occupational health and safety laws and regulations, including laws and regulations governing air emissions, wastewater discharges, the storage and handling of chemicals and hazardous substances and cleanup of contaminated soil and groundwater. Additional expenditures, beyond those currently included in capital and operating budgets, may be incurred in order to comply with either new environmental legislation and regulations, new interpretations of existing laws and regulations or more rigorous enforcement of such laws and regulations, most of which are difficult to pass on to the customer. It is not possible to predict whether these new expenditures will be material. We are also subject to liability for the investigation and remediation of environmental contamination (including contamination caused by other parties) at properties that we own or operate and at other properties where we or our predecessors liabilities or environmental compliance or cleanup obligations will have a material adverse effect on our business or operations, there can be no assurance that such liabilities or compliance or cleanup obligations will not increase in the future or will not have a material adverse effect on us. The school bus transportation industry is highly seasonal The school bus transportation industry is subject to seasonal variations in operations. As a result, school bus contractors, including us, historically experience a significant decline in operating income during the summer months. Specifically, because customers often pay for the annual amount due under a contract in 10 installments ending in June, our revenues and cash flows sharply decrease in July and August. Additionally, many school districts have dramatically cut back on summer programs in recent years, including summer camps and charter programs, compounding this effect. Our quarterly operating results have also fluctuated due to a variety of factors, including variation in the number of school days in each quarter (which is affected by the timing of the first and last days of the school year, holidays, the month in which spring break occurs and adverse weather conditions, which can close schools). Consequently, interim results are not necessarily indicative of the full fiscal year and quarterly results may vary substantially, both within a fiscal year and between comparable fiscal years. We may not be able to maintain letters of credit or performance bonds required by our transportation contracts Our school bus transportation contracts generally provide for performance security in one or more of the following forms: performance bonds, letters of credit or cash retainages. The contracts also require the maintenance of minimum amounts of insurance coverage, the maintenance of appropriate facilities and transportation equipment, and the implementation of various operating rules and regulations. There can be no assurance that either letters of credit or performance bonds will continue to be available to us as security for our contracts or, if available, at a cost that does not adversely affect our margins or cash flow. If adequate performance security is not available or if the terms of such security are too onerous, the Company, our financial condition, results of operations and cash flows could be materially adversely affected. Some of our customer contracts may be terminated due to factors beyond our control Some of our school bus transportation contracts may be terminated due to factors beyond our control, such as decreases in funding for our customers. All school bus contracts can also be terminated by school districts for not meeting certain performance criteria. Although we believe we have established strong relationships with our customers, there can be no assurance that our contracts will not be affected by circumstances beyond our control. The number of school buses to be provided under our contracts generally may decrease, and hence the revenues generated under such contracts may decrease based on the requirements of our customers. As a foreign private issuer, we are subject to different U.S. securities laws and rules than a domestic U.S. issuer, which may limit the information publicly available to our shareholders STI is a “foreign private issuer” under applicable U.S. federal securities laws and, therefore, we are not required to comply with all the periodic disclosure and current reporting requirements of the Exchange Act and related rules and
40 STRONG TO THE CORE regulations. As a result, we do not file the same reports that a U.S. domestic issuer would file with the SEC, although we are required to file or furnish to the SEC the continuous disclosure documents that we are required to file in Canada under Canadian securities laws. In addition, our officers, directors, and principal shareholders are exempt from the reporting and “short swing” profit recovery provisions of Section 16 of the Exchange Act. Therefore, our shareholders may not know on as timely a basis when our officers, directors and principal shareholders purchase or sell their Common Shares, as the reporting deadlines under the corresponding Canadian insider reporting requirements are longer and filing thresholds differ. In addition, as a foreign private issuer, we are exempt from the proxy rules under the Exchange Act. We may lose our foreign private issuer status in the future, which could result in significant additional costs and expenses to us We may in the future lose our foreign private issuer status if a majority of our Common Shares are held in the U.S. and we fail to meet the additional requirements necessary to avoid loss of foreign private issuer status. If we are not a foreign private issuer, we would not be eligible to use the Multi - Jurisdictional Disclosure System (“MJDS”) adopted by the United States and Canada or other foreign issuer forms and would be required to file periodic and current reports and registration statements on U.S. domestic issuer forms with the SEC, which are generally more detailed and extensive than the forms available to a foreign private issuer. The regulatory and compliance costs to us under U.S. securities law as a U.S. domestic issuer would likely be significantly more than the costs we currently incur as a Canadian foreign private issuer eligible to use the MJDA. We are no longer an “emerging growth company” under the JOBS Act, and we cannot be certain if the increased disclosure requirements now applicable to us will make our Common Shares less attractive to investors Until recently, we qualified as an “emerging growth company,” under the Jumpstart Our Business Start - ups Act of 2012 (“JOBS Act”), and for this reason, we were able to take advantage of certain exemptions from various reporting requirements applicable to public companies that are not “emerging growth companies” including, but not limited to, not being required to comply with the auditor attestation requirements of Section 404 of the Sarbanes - Oxley Act. On June 30, 2017 (the last day of our fiscal year following the fifth anniversary of the first registered US public sale of our Common Stock) our qualification as emerging growth company expired. Thus, beginning with this report, we are no longer able to use the exemptions form reporting requirements available to emerging growth companies. We cannot predict if investors will find our Common Shares less attractive because of our more thorough disclosures. The financial reporting obligations of being a public company in the U.S. are expensive and time consuming, and place significant additional demands on our management With the listing of our Common Shares on the NASDAQ Global Select Market in September 2011, we became subject to public company reporting obligations in the United States. The additional obligations of being a public company in the United States require significant additional expenditures and place additional demands on our management. In particular, under the JOBS Act, Section 404 of the Sarbanes - Oxley Act of 2002 and the SEC rules and regulations implementing Section 404 currently will require an annual evaluation of our internal controls over financial reporting to be attested to by an independent auditing firm, beginning with this report. If, for any current or future fiscal year, an independent auditing firm is unable to provide us with an attestation and an unqualified report as to the effectiveness of our internal controls, investors could lose confidence in the reliability of our financial statements, which could result in a decrease in the value of our Common Shares. In addition, future acquisitions of companies by us may create challenges in implementing the required processes, procedures and controls in the acquired operations, as acquired companies (in particular, privately held companies) may not have disclosure controls and procedures or internal control over financial reporting that are as thorough or effective as those required under the securities law applicable to STI. Economic and financial market conditions have resulted in reduced spending by school districts and other governmental agencies Reductions in payments to school systems following the 2008 global economic crisis and continuing economic instability resulted in a reduction in revenues to various state and local governmental entities, including school districts and other purchasers of our services. This reduction in revenues to our customers may negatively affect the revenues received by the Company in connection with annual rate increases on its school district customer contracts and non contracted

STRONG TO THE CORE 41 ancillary revenues due to potential cutbacks by customers in these spending areas. If the Company’s financial condition is materially impacted, then impairment charges with respect to the Company’s goodwill and other long - lived assets could be necessary. We may be adversely affected by terrorism attacks and, man - made or natural disasters The potential for terrorism exists in the countries in which we operate. Public transportation has previously been subject to terrorist attacks and may be the target of future attacks, which could have a negative impact on our operations. Man - made and natural disasters, including adverse weather conditions, from which we are experiencing greater and more frequent disruptions, could negatively impact our operations through, among other things, increased costs, business disruptions and increased accidents. The occurrence of any of these events could have a material adverse effect on us, our financial condition, results of operations and cash flows. We may be adversely affected by cyber terrorism or other data security breaches and are subject to data privacy risks In the normal course of our business we rely on information technology systems. These systems, among other things, collect and safeguard confidential information regarding our employees, customers and the users of our services, including information collected through our SafeStop TM application. Cyber terrorists, hackers and data thieves have become increasingly sophisticated and have the ability to operate large - scale and complex data attacks that could lead to breaches of our systems and the security of our data and information. These attacks could also lead to other significant disruptions. Such breaches and disruptions may result in service interruptions or the loss of confidential information and could give rise to unwanted media attention, material damage to our customer relationships and reputation and fines or lawsuits. The occurrence of any of these events could have a material adverse effect on us, our financial condition, results of operations and cash flows. Risks Related to the Capital Structure The Company is dependent on STA Holdings and Parkview Transit for all cash available for dividends and interest STI is dependent on the operations and assets of STA Holdings and Parkview Transit the ownership of common shares. Cash distributions to the holders of Common Shares and the Convertible Debentures will be dependent on the ability of STA Holdings and Parkview Transit to make dividend payments on its Common Shares held by STI. The actual amount of cash available for payments to holders of Common Shares and the Convertible Debentures will depend upon numerous factors relating to the business of STA Holdings and Parkview Transit, including profitability, changes in revenue, fluctuations in working capital, capital expenditure levels, applicable laws, compliance with contracts and contractual restrictions contained in the instruments governing any indebtedness. Any reduction in the amount of cash available for distribution, or actually distributed, by the Company will reduce the amount of cash available to STI for dividends to holders of Common Shares. Cash dividends by STI on the Common Shares are not guaranteed and will fluctuate with the performance of the business of STA Holdings and Parkview Transit. Cash available for distribution is not intended to be representative of cash flow or results of operations determined in accordance with generally accepted accounting principles in the United States and does not have a standardized meaning prescribed by US GAAP. A significant amount of our cash is distributed, which may restrict potential growth The payout of substantially all of our operating cash flow will make additional capital and operating expenditures dependent on increased cash flow or additional financing in the future. Lack of these funds could limit the Company’s future growth and its cash flow. In addition, the Company may be precluded from pursuing otherwise attractive acquisitions or investments because they may not be accretive on a short - term basis. STI may not receive dividends from STA Holdings and Parkview Transit provided for in the dividend policy adopted by the board of directors of the Company, or any dividends at all STI’s only source of cash flow for payment of dividends on the Common Shares and interest payments on the Convertible Debentures is distributions on its equity ownership of STA Holdings and Parkview Transit. The board of
42 STRONG TO THE CORE directors of STI may, in its discretion, amend or repeal the dividend policy. STI’s board of directors may decrease the level of dividends provided for in this dividend policy or entirely discontinue the payment of dividends. Future dividends with respect to the common shares of STI, if any, will depend on, among other things, the results of operations, cash requirements, financial condition, contractual restrictions, business opportunities, provisions of applicable law and other factors that the board of directors of STI may deem relevant. The Credit Agreement contains significant restrictions on the Company’s ability to make dividend payments. Fluctuations in the exchange rate may impact the amount of cash available to the Company for distribution and the Company’s results of operations The Cdn$ 6.25% Convertible Debentures and the Cdn$ 5.25% Convertible Debentures are denominated in Canadian dollars, and payment of these Debentures upon maturity will be payable in Canadian dollars. The Company has not entered into any hedge arrangement with respect to the payment of these Debentures upon maturity in 2019 and 2021, respectively. Interest payments on the Cdn$ 6.25% Convertible Debentures and the Cdn$ 5.25% Convertible Debentures are denominated in Canadian dollars. Conversely, approximately 87.2% of the Company’s revenue and expenses for fiscal year 2017, together with distributions received from the Company’s subsidiaries are denominated in U.S. dollars. As a result, the Company is exposed to currency exchange rate risks. Although the Company intends to fund the interest payment on the Cdn$ 6.25% Convertible Debentures and Cdn$ 5.25% Convertible Debentures with cash flows from the Company’s Canadian operations to mitigate the exchange rate risk with respect to the total amount of currently anticipated interest payments on those Convertible Debentures, there can be no assurance that these arrangements will be sufficient to fully protect against this risk. If the Canadian dollar cash flow do not fully protect against this risk, changes in the currency exchange rate between U.S. and Canadian dollars could have a material adverse effect on the Company’s financial condition, results of operations and cash flow, and may adversely affect the Company’s cash distributions. In addition, the Company prepares its financial statements in U.S. dollars. In connection with the Company’s Canadian operations, approximately 12.8% of the Company’s consolidated income before taxes for fiscal year 2017 is incurred in Canadian dollars. The results of the Canadian operations are translated into U.S. dollars for financial statement reporting purposes. Changes in the Canadian dollar / U.S. dollar currency exchange rate from period to period will impact the translated U.S. dollar equivalent results of the Canadian operations. A weakening Canadian dollar will have a negative impact on the translation of the results of the Canadian operations in U.S. dollars for financial reporting purposes. Conversely, a strengthening Canadian dollar will have a positive impact on the translation of the results of the Canadian operations in U.S. dollars for financial reporting purposes. Changes in the Company’s creditworthiness may affect the value of the Common Shares and Convertible Debentures The perceived creditworthiness of the Issuer, the Company and their respective subsidiaries may affect the market price or value and the liquidity of the Common Shares and the Convertible Debentures. Future sales or the possibility of future sales of a substantial amount of Common Shares may impact the price of the Common Shares and could result in dilution Future sales or the possibility of future sales of a substantial amount of Common Shares in the public market by the Company or an existing shareholder could adversely affect the prevailing market price of the Company’s Common Shares, and could impair the Issuer’s ability to raise capital through future sales of those securities. For example, SNCF Participations S.A. (“SNCF - P”), which held approximately 15.0 million of the Company’s Common Shares on June 30, 2015, sold 4.0 million of those shares on August 6, 2015 in market transactions at a discount to the market trading price at that time. On April 11, 2016, the Company announced that SNCF - P had sold approximately 6.4 million of its remaining Common Shares, and following those sales, the Company acquired SNCF - p’s remaining Common Shares, which were subsequently cancelled. We believe SNCF - p’s sale transactions had an adverse impact on the price of the Common Shares, at that time.

STRONG TO THE CORE 43 Additionally, the issuance of additional Common Shares may dilute an investor’s investment in the Issuer and reduce distributable cash per Common Share. The Company may issue Common Shares or other securities from time to time, in order to raise capital or as consideration for future acquisitions and investments. If an acquisition or investment is significant, the number of Common Shares or the number or aggregate principal amount, as the case may be, of other securities that may be issued may in turn be significant. In addition, the Issuer may also grant registration rights covering those Common Shares or other securities in connection with any acquisitions or investments. Further, the Company may determine to redeem outstanding Debentures for Common Shares or to repay outstanding principal amounts thereunder at maturity of the Convertible Debentures by issuing additional Common Shares. The issuance of additional Common Shares may have a dilutive effect on shareholders and an adverse impact on the price of Common Shares. Investment eligibility There can be no assurance that the Common Shares will continue to be qualified investments for trusts governed by registered retirement savings plans, registered retirement income funds, registered disability savings plans, deferred profit sharing plans and registered education savings plans and for arrangements that are tax - free savings accounts . The Company may not be able to make all interest payments on the Convertible Debentures The likelihood that holders of the Convertible Debentures will receive the payments owing to them in connection with the Convertible Debentures will be dependent upon the financial health and creditworthiness of the Company and the ability of the Company to earn revenues. The Company may not be able to purchase the Convertible Debentures on a change of control The Company will be required to offer to purchase all outstanding Convertible Debentures upon the occurrence of a change of control. However, it is possible that following a change of control, the Company will not have sufficient funds at that time to make the required purchase of outstanding Convertible Debentures or that restrictions contained in other indebtedness will restrict those purchases. Redemption prior to maturity The Convertible Debentures may be redeemed in accordance with their respective terms, upon payment of the principal, together with any accrued and unpaid interest. Holders of Convertible Debentures should assume that this redemption option will be exercised if the Company is able to refinance at a lower interest rate or it is otherwise in the interest of the Company to redeem the Convertible Debentures. Conversion following certain transactions In the case of certain transactions, each Convertible Debenture will become convertible into securities, cash or property receivable by a holder of Convertible Debentures in the kind and amount of securities, cash or property into which the Convertible Debenture was convertible immediately prior to the transaction. This change could substantially lessen or eliminate the value of the conversion privilege associated with the Convertible Debentures in the future. Prevailing yields on similar securities Prevailing yield on similar securities will affect the market value of the Convertible Debentures. Assuming all other factors remain unchanged, the market value of the Convertible Debentures will decline as prevailing yields for similar securities rise, and will increase as prevailing yields for similar securities decline.
44 STRONG TO THE CORE There is a limited active public market for the Common Shares and Convertible Debentures and holders may have limited liquidity Although the Common Shares and Convertible Debentures are listed and posted for trading on the TSX and the Common Shares also trade on the NASDAQ Global Select Market, they trade in markets with modest trading volumes. Although the Issuer has taken a number of steps to increase the liquidity of the Common Shares through additional common share offerings and debt to equity exchanges, there is no guarantee that an active trading market will further emerge and/or continue. The market price for the Common Shares or Convertible Debentures may be volatile Factors such as variations in the Company’s financial results, announcements by the Company or others, developments affecting the Company’s business or the North America school bus transportation industry, general interest rate levels, general fuel price levels, the market price of the Common Shares and general market volatility could cause the market price of the Common Shares or the Convertible Debentures to fluctuate significantly. STA Holdings’ interest deductions on the 14% subordinated notes originally issued by STA ULC in connection with the IPS Offering were likely “dual consolidated losses” for U.S. federal income tax purposes and may result in disallowance of interest deductions under U.S. tax law if certain “triggering events” occur Pursuant to Section 1503(d) of the Code and the Treasury Regulations thereunder, the interest deductions generated on the 14% subordinated notes (the last of which were redeemed in December 2009) likely generated a “dual consolidated loss” (“DCL”) for U.S. federal income tax purposes and therefore were deductible by STA Holdings only if STA Holdings and STA ULC made the appropriate election and complied with all applicable requirements, including annual reporting and certification requirements. STA Holdings and STA ULC made, and intend to continue to make, such election and have complied with all applicable requirements to date. Even though such an election was made, however, if any of several “triggering events” occurs (e.g., the use of such losses to offset the income of any other non - U.S. person, or, in certain circumstances, a disposition of STA ULC stock or assets), STA Holdings will generally be required to report the amount of any prior interest deductions on the Notes (plus interest thereon) as gross income in the year of the triggering event. STA Holdings and STA ULC intend to comply with all of the DCL reporting and certification requirements and to conduct their affairs such that no DCL triggering event occurs. However, if STA Holdings and STA ULC fail to satisfy such reporting and certification requirements, or if a DCL triggering event occurs and no exception applies, STA Holdings’ taxable income may be increased and if so, it’s U.S. federal income tax liability would be increased, perhaps materially. This would adversely affect the Company’s financial position, cash flow, and liquidity, and could affect the Issuer’s ability to make interest or dividend payments on the Debentures and the Common Shares and the Company’s ability to continue as a going concern. Application of U.S. federal income tax corporate “inversion” rules is uncertain U.S. federal income tax legislation enacted in October 2004 dealing with corporate “inversions” (e.g., certain transactions in which a non - U.S. corporation acquires substantially all of the equity interests in, or the assets of, a U.S. corporation or partnership, if, after the transaction, former equity owners of the U.S. corporation or partnership own a specified level of stock in the non - U.S. corporation) provides in certain cases that a non - U.S. corporation may be treated as a U.S. corporation for U.S. federal income tax purposes. As enacted, this legislation does not appear to apply to STI, because the Existing Investors did not own any stock in STI as a result of the original offering and related transactions or subsequent IPS or Common Share offerings. The legislation grants authority to the U.S. Treasury, however, to write implementing regulations, which could, if exercised broadly and retroactively, cause the inversion provisions to apply to STI and result in, among other things, U.S. withholding taxes being imposed on dividends paid on the Common Shares to non - U.S. Holders, and the potential inability of U.S. holders to claim a foreign tax credit for Canadian withholding tax on dividends paid on the Common Shares to them. The Internal Revenue Service subsequently issued regulations to provide further guidance on when a non - U.S. corporation may be treated as a U.S. corporation for U.S. federal income tax. Those regulations would not cause STI to be treated as a U.S. corporation for U.S. federal income tax purposes, but there can be no assurance such regulation may not be modified in the future.

STRONG TO THE CORE 45 Application of possible new related party debt rules is uncertain The Internal Revenue Service recently issued final and temporary regulations regarding intercompany cross - border debt held by related parties. The regulations primarily affect: (i) issuances of debt for cash between related parties, (ii) distributions of debt instruments by corporations to their related corporate shareholders, (iii) certain issuances of debt instruments as consideration in an exchange involving an intragroup asset reorganization and (iv) issuances of debt instruments by corporations to related parties in exchange for stock of an affiliated corporation. The regulations would permit the Internal Revenue Service to treat an instrument as part debt and part equity, in any of the foregoing situations, which could have an adverse tax effect on both the creditor and the debtor. However, in the case of issuances of debt for cash between related parties, as the regulations currently read, it is unlikely there would be a recharacterization of the debt if it is properly documented and the parties can demonstrate the financial ability of the debtor to repay the creditor. In this connection, as a result of a delay in the effective date, the documentation portion of the regulations will only affect debt issued or deemed issued on or after January 1, 2019. At this point, it is not possible to determine whether the regulations, in their current form, will have any adverse U.S. (or foreign) tax effect on STI or STA Holdings or any of their related U.S. and non - U.S. affiliates. Changes to U.S. federal income tax rules could adversely affect the Company The President of the United States has indicated that U.S. corporate tax reform is a priority for his administration, and his administration and members of Congress have proposed changes to corporate tax rates, the taxation of income earned outside the U.S. (including the taxation of previously unrepatriated foreign earnings) and a “destination - based” tax system that would tax imported goods and services while exempting exported goods and services. If these changes are implemented, the Company could face a larger U.S. federal income tax liability.
46 STRONG TO THE CORE MANAGEMENT’S REPORT ON INTERNAL CONTROL OVER FINANCIAL REPORTING The management of Student Transportation Inc . (the Company) is responsible for establishing and maintaining adequate internal control over financial reporting, as such term is defined under applicable United States and Canadian securities laws, (including Rules 13 a - 15 (b) and 15 d - 15 (b) under the United States Securities Exchange Act of 1934 , as amended) . All internal control systems, no matter how well designed, have inherent limitations including the possibility of human error and the circumvention or overriding of controls. Further, because of changes in conditions, the effectiveness of internal controls may vary over time. Projections of any evaluation of effectiveness to future periods are subject to the risk that controls may become inadequate because of changes in conditions, or that the degree of compliance with the policies or procedures may deteriorate. Accordingly, even those systems determined to be effective can provide us only with reasonable assurance with respect to financial statement preparation and presentation. The Company’s management has assessed the effectiveness of internal control over financial reporting as of June 30, 2017, following the criteria set forth by the Committee of Sponsoring Organizations of the Treadway Commission in Internal Control — Integrated Framework (2013 Framework). Based on our assessment under the framework in Internal Control — Integrated Framework (2013 Framework), the Company’s management has concluded that our internal control over financial reporting was not effective as of June 30, 2017. Based on our evaluation of internal control over financial reporting as described above, management concluded that it did not design and maintain effective internal controls with respect to certain complex and non - routine transactions. Specifically, the Accounting Standards Codification 840 – Leases (“ASC 840”) lease classification review was not designed and operating effectively to ensure that lease classification was appropriately classified as operating or capital. While the control deficiency identified did not result in any material misstatements, a reasonable possibility exists that a material misstatement to the annual or interim consolidated financial statements and disclosures will not be prevented or detected on a timely basis. Our Independent Registered Public Accounting Firm, Ernst & Young LLP, have issued an attestation report on our internal control over financial reporting. This report appears in our consolidated financial statements as of and for the year ended June 30, 2017. Denis J. Gallagher Chief Executive Officer Patrick J. Walker Chief Financial Officer Toronto, Ontario September 20, 2017
STRONG TO THE CORE 47 Report of Independent Registered Public Accounting Firm To the Board of Directors and Shareholders of Student Transportation Inc.: We have audited Student Transportation Inc.’s internal control over financial reporting as of June 30, 2017, based on criteria established in Internal Control - Integrated Framework issued by the Committee of Sponsoring Organizations of the Treadway Commission (2013 framework) (the COSO criteria). Student Transportation Inc.’s management is responsible for maintaining effective internal control over financial reporting, and for its assessment of the effectiveness of internal control over financial reporting included in the accompanying Management’s Report on Internal Control over Financial Reporting. Our responsibility is to express an opinion on the company’s internal control over financial reporting based on our audit. We conducted our audit in accordance with the standards of the Public Company Accounting Oversight Board (United States). Those standards require that we plan and perform the audit to obtain reasonable assurance about whether effective internal control over financial reporting was maintained in all material respects. Our audit included obtaining an understanding of internal control over financial reporting, assessing the risk that a material weakness exists, testing and evaluating the design and operating effectiveness of internal control based on the assessed risk, and performing such other procedures as we considered necessary in the circumstances. We believe that our audit provides a reasonable basis for our opinion. A company’s internal control over financial reporting is a process designed to provide reasonable assurance regarding the reliability of financial reporting and the preparation of financial statements for external purposes in accordance with generally accepted accounting principles. A company’s internal control over financial reporting includes those policies and procedures that (1) pertain to the maintenance of records that, in reasonable detail, accurately and fairly reflect the transactions and dispositions of the assets of the company; (2) provide reasonable assurance that transactions are recorded as necessary to permit preparation of financial statements in accordance with generally accepted accounting principles, and that receipts and expenditures of the company are being made only in accordance with authorizations of management and directors of the company; and (3) provide reasonable assurance regarding prevention or timely detection of unauthorized acquisition, use, or disposition of the company’s assets that could have a material effect on the financial statements. Because of its inherent limitations, internal control over financial reporting may not prevent or detect misstatements . Also, projections of any evaluation of effectiveness to future periods are subject to the risk that controls may become inadequate because of changes in conditions, or that the degree of compliance with the policies or procedures may deteriorate . A material weakness is a deficiency, or combination of deficiencies, in internal control over financial reporting, such that there is a reasonable possibility that a material misstatement of the company’s annual or interim financial statements will not be prevented or detected on a timely basis. The following material weakness has been identified and included in management’s assessment. Management has identified a material weakness in controls related to certain complex and non - routine transactions. Specifically, the lease classification technical review was not designed and operating effectively to ensure that leases were appropriately classified as operating or capital leases. We also have audited, in accordance with the standards of the Public Company Accounting Oversight Board (United States), the consolidated balance sheets of Student Transportation Inc. as of June 30, 2017 and 2016, and the related consolidated statements of operations, comprehensive income, shareholders’ equity and cash flows for the years then ended. This material weakness was considered in determining the nature, timing and extent of audit tests applied in our audit of the 2017 financial statements, and this report does not affect our report dated September 20, 2017, which expressed an unqualified opinion on those financial statements. In our opinion, because of the effect of the material weakness described above on the achievement of the objectives of the control criteria, Student Transportation Inc. has not maintained effective internal control over financial reporting as of June 30, 2017, based on the COSO criteria. /s/ Ernst & Young LLP Iselin, New Jersey USA September 20, 2017
48 STRONG TO THE CORE Report of Independent Registered Public Accounting Firm To the Board of Directors and Shareholders of Student Transportation Inc.: We have audited the accompanying consolidated balance sheets of Student Transportation Inc. as of June 30, 2017 and 2016, and the related consolidated statements of operations, comprehensive income, shareholders’ equity and cash flows for the years then ended. These financial statements are the responsibility of the Company’s management. Our responsibility is to express an opinion on these financial statements based on our audits. We conducted our audits in accordance with the standards of the Public Company Accounting Oversight Board (United States). Those standards require that we plan and perform the audit to obtain reasonable assurance about whether the financial statements are free of material misstatement. An audit includes examining, on a test basis, evidence supporting the amounts and disclosures in the financial statements. An audit also includes assessing the accounting principles used and significant estimates made by management, as well as evaluating the overall financial statement presentation. We believe that our audits provide a reasonable basis for our opinion. As discussed in Note 2 to the consolidated financial statements, Student Transportation Inc. changed its presentation of debt issuance costs as a result of the adoption of the amendments to the Financial Accounting Standards Board Accounting Standards Codification resulting from Accounting Standards Update No. 2015 - 3, Simplifying the Presentation of Debt Issuance Costs , effective July 1, 2016. Our opinion is not modified with respect to this matter. In our opinion, the financial statements referred to above present fairly, in all material respects, the consolidated financial position of Student Transportation Inc. at June 30, 2017 and 2016, and the consolidated results of its operations and its cash flows for each of the years then ended, in conformity with U.S. generally accepted accounting principles. We also have audited, in accordance with the standards of the Public Company Accounting Oversight Board (United States), Student Transportation Inc.’s internal control over financial reporting as of June 30, 2017, based on criteria established in Internal Control - Integrated Framework issued by the Committee of Sponsoring Organizations of the Treadway Commission (2013 framework) and our report dated September 20, 2017 expressed an adverse opinion thereon. /s/ Ernst & Young LLP Iselin, New Jersey USA September 20, 2017
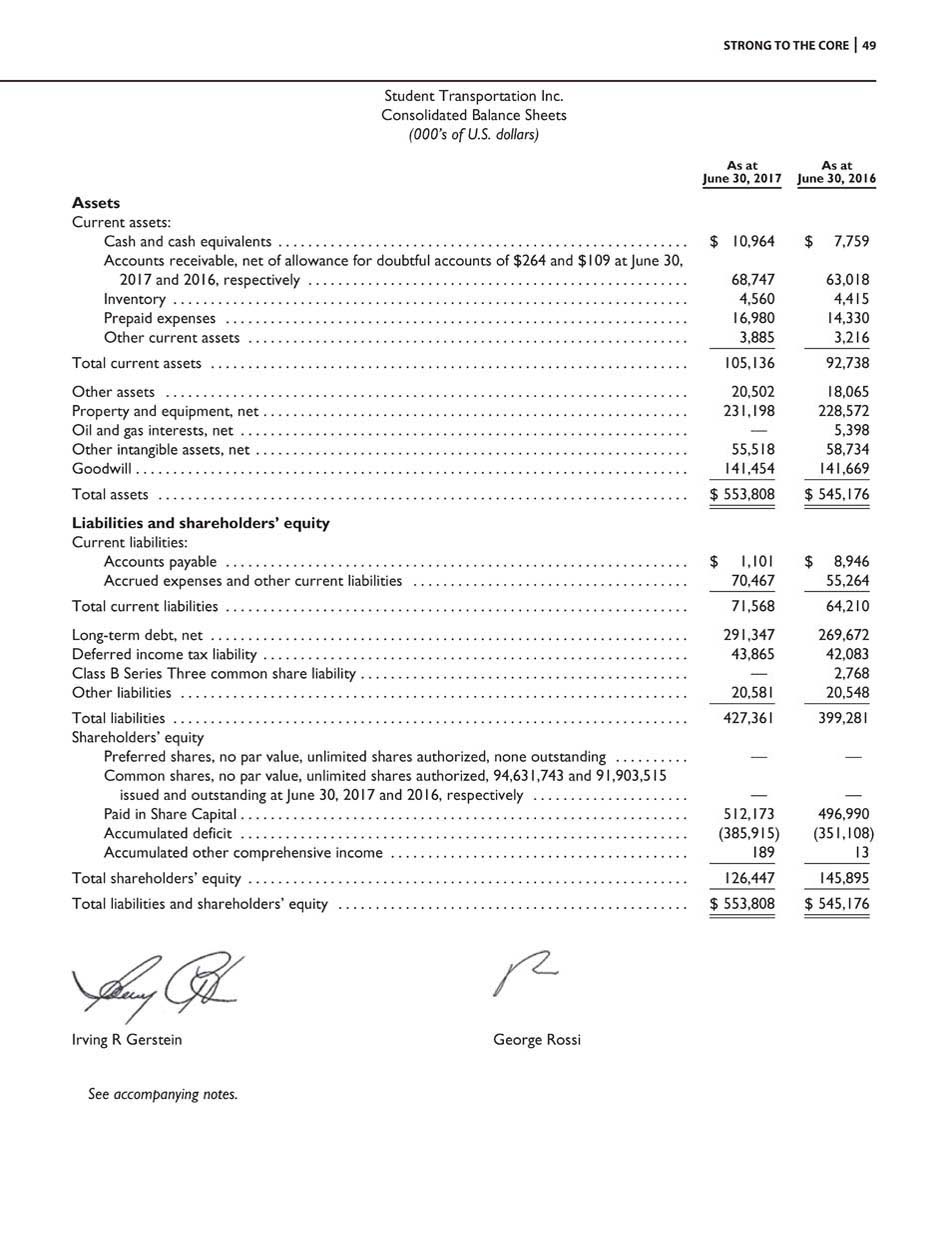
STRONG TO THE CORE 49 Student Transportation Inc. Consolidated Balance Sheets (000’s of U.S. dollars) As at June 30, 2017 As at June 30, 2016 Assets Current assets: Cash and cash equivalents ....................................................... $ 10,964 $ 7,759 Accounts receivable, net of allowance for doubtful accounts of $264 and $109 at June 30, 2017 and 2016, respectively ................................................... 68,747 63,018 Inventory ..................................................................... 4,560 4,415 Prepaid expenses .............................................................. 16,980 14,330 Other current assets ........................................................... 3,885 3,216 Total current assets ................................................................ 105,136 92,738 Other assets ...................................................................... 20,502 18,065 Property and equipment, net ......................................................... 231,198 228,572 Oil and gas interests, net ............................................................ — 5,398 Other intangible assets, net .......................................................... 55,518 58,734 Goodwill .......................................................................... 141,454 141,669 Total assets ....................................................................... $ 553,808 $ 545,176 Liabilities and shareholders’ equity Current liabilities: Accounts payable .............................................................. $ 1,101 $ 8,946 Accrued expenses and other current liabilities ..................................... 70,467 55,264 Total current liabilities .............................................................. 71,568 64,210 Long - term debt, net ................................................................ 291,347 269,672 Deferred income tax liability ......................................................... 43,865 42,083 Class B Series Three common share liability ............................................ — 2,768 Other liabilities .................................................................... 20,581 20,548 Total liabilities ..................................................................... 427,361 399,281 Shareholders’ equity Preferred shares, no par value, unlimited shares authorized, none outstanding .......... — — Common shares, no par value, unlimited shares authorized, 94,631,743 and 91,903,515 issued and outstanding at June 30, 2017 and 2016, respectively ..................... — — Paid in Share Capital ............................................................ 512,173 496,990 Accumulated deficit ............................................................ (385,915) (351,108) Accumulated other comprehensive income ........................................ 189 13 Total shareholders’ equity ........................................................... 126,447 145,895 Total liabilities and shareholders’ equity ............................................... $ 553,808 $ 545,176 Irving R Gerstein George Rossi See accompanying notes.
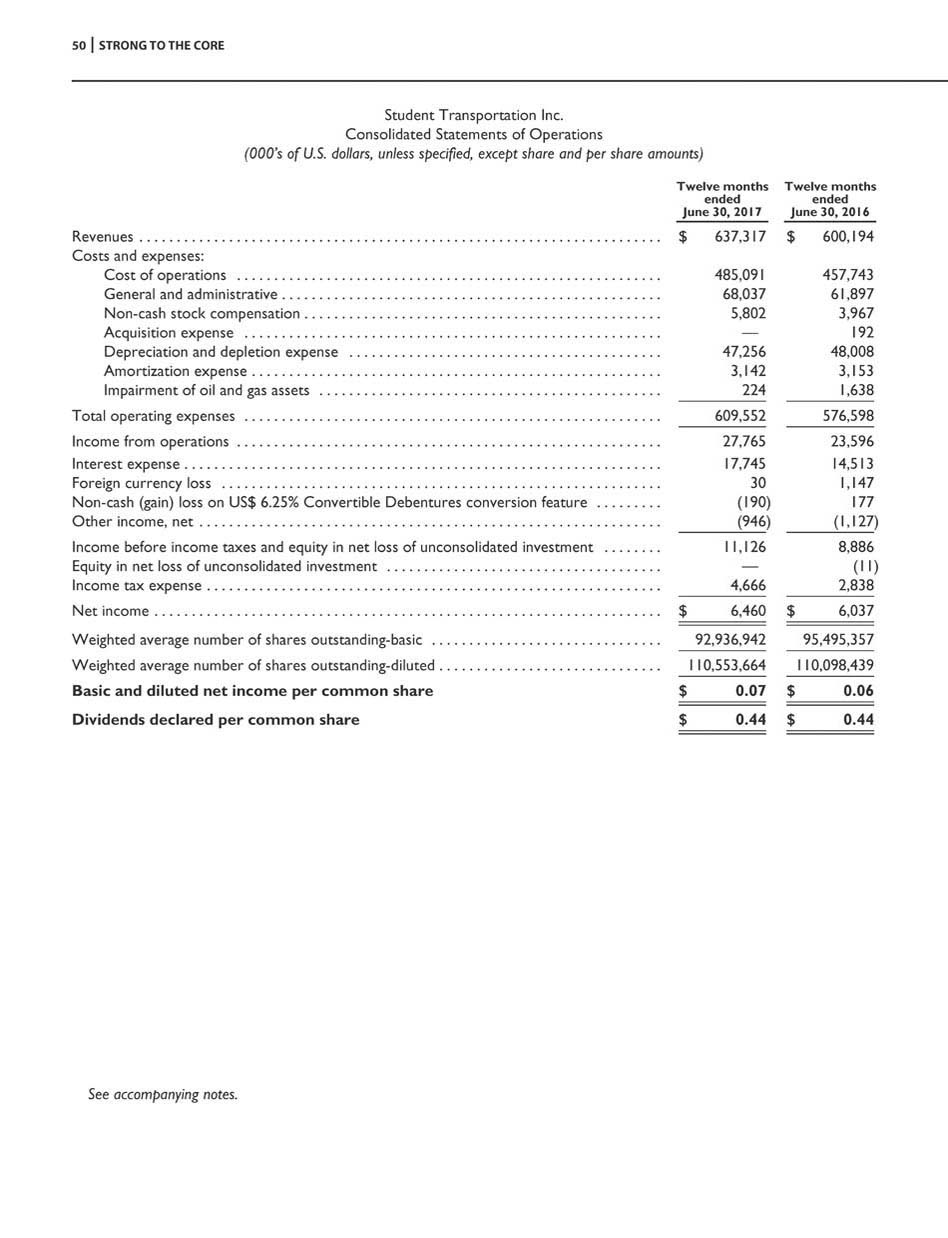
50 STRONG TO THE CORE Student Transportation Inc. Consolidated Statements of Operations (000’s of U.S. dollars, unless specified, except share and per share amounts) Twelve months ended June 30, 2017 $ 637,317 Twelve months ended June 30, 2016 $ 600,194 485,091 68,037 5,802 — 47,256 3,142 224 457,743 61,897 3,967 192 48,008 3,153 1,638 609,552 576,598 27,765 17,745 30 (190) (946) 23,596 14,513 1,147 177 (1,127) 11,126 — 4,666 8,886 (11) 2,838 6,460 $ 6,037 92,936,942 95,495,357 110,553,664 110,098,439 $ 0.07 $ 0.06 Revenues ...................................................................... Costs and expenses : Cost of operations ......................................................... General and administrative ................................................... Non - cash stock compensation ................................................ Acquisition expense ........................................................ Depreciation and depletion expense .......................................... Amortization expense ....................................................... Impairment of oil and gas assets .............................................. Total operating expenses ........................................................ Income from operations ......................................................... Interest expense ................................................................ Foreign currency loss ........................................................... Non - cash (gain) loss on US$ 6.25% Convertible Debentures conversion feature ......... Other income, net .............................................................. Income before income taxes and equity in net loss of unconsolidated investment ........ Equity in net loss of unconsolidated investment ..................................... Income tax expense ............................................................. Net income .................................................................... $ Weighted average number of shares outstanding - basic ............................... Weighted average number of shares outstanding - diluted .............................. Basic and diluted net income per common share Dividends declared per common share $ 0.44 $ 0.44 See accompanying notes.

STRONG TO THE CORE 51 Student Transportation Inc. Consolidated Statements of Comprehensive Income (000’s of U.S. Dollars) Twelve months ended June 30, 2017 Twelve months ended June 30, 2016 $6,460 $6,037 176 2,133 176 2,133 Net income : ........................................................ Other comprehensive income: Unrealized gain on currency translation adjustments .................. Other comprehensive income : ........................................ Comprehensive income ............................................... $6,636 $8,170 See accompanying notes.

52 STRONG TO THE CORE Student Transportation Inc. Consolidated Statements of Shareholders’ Equity (000’s of U.S. Dollars) Share Capital Accumulated Other Comprehensive (Loss) income Accumulated Deficit Shareholders’ Equity Shares Amount 96,141,516 $517,560 $(2,120) $(315,633) $199,807 — — — 6,037 6,037 — — — (41,512) (41,512) 1,337,22 5 5,227 — — 5,227 (5,575,226) (25,797) — — (25,797) — — 2,13 3 — 2,133 Balance at June 30, 2015 ......................... Net income ................................ Dividends .................................. Common stock issuance ..................... Repurchase of common stock ................ Other comprehensive income ................ Balance at June 30, 2016 ......................... 91,903,515 $496,990 $ 13 $(351,108) $145,895 Net income ................................ — — — 6,460 6,460 Dividends .................................. — — — (41,267) (41,267) Common stock issuance ..................... 439,388 2,412 — — 2,412 Class B Share Exchange ...................... 2,282,104 12,707 — — 12,707 Conversion of debt to common stock ......... 6,736 64 — — 64 — — 176 — 176 Other comprehensive income ................ Balance at June 30, 2017 ......................... 94,631,743 $512,173 $ 189 $(385,915) $126,447 See accompanying notes.
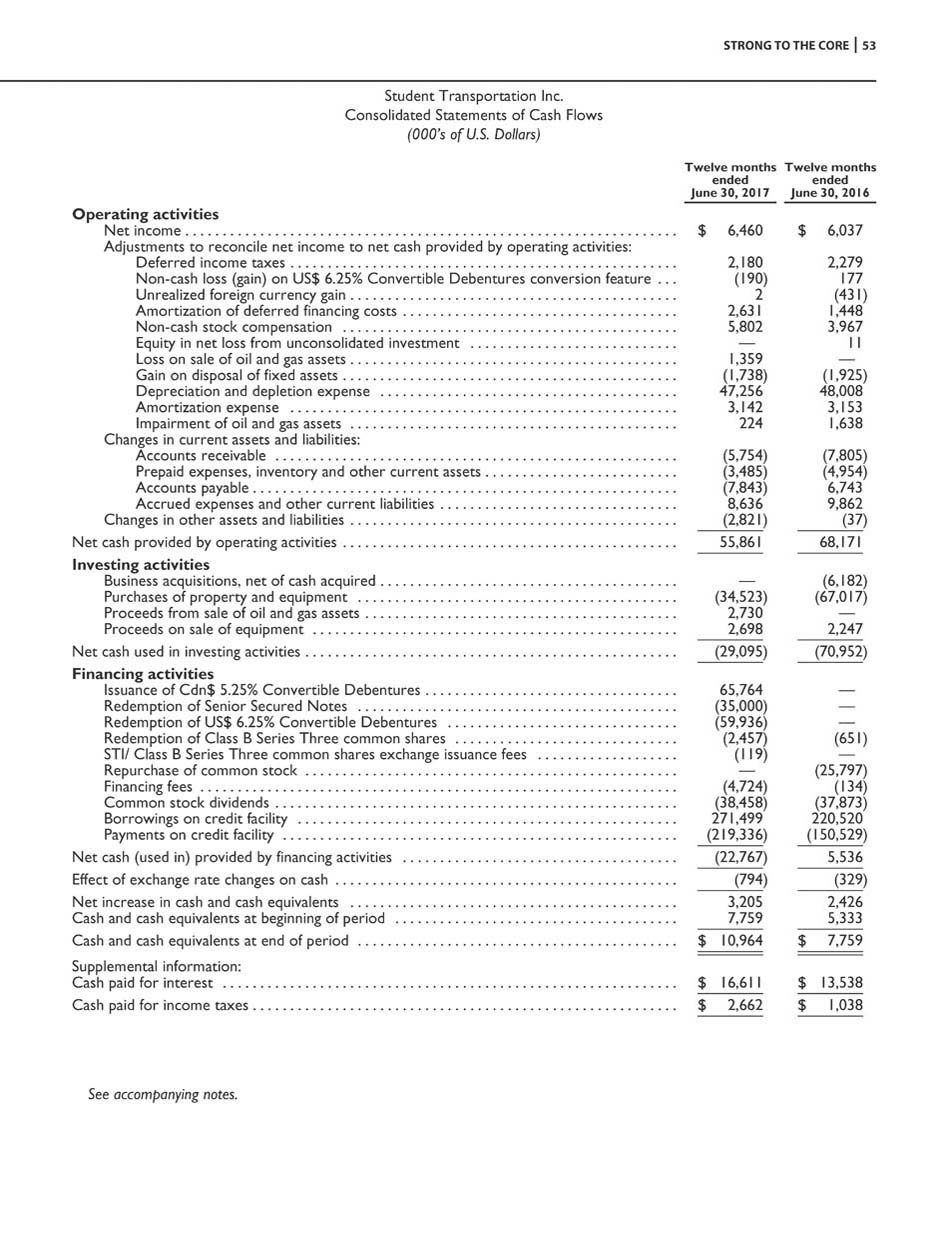
STRONG TO THE CORE 53 Student Transportation Inc. Consolidated Statements of Cash Flows (000’s of U.S. Dollars) ended June 30, 2017 Twelve months Twelve months ended June 30, 2016 $ 6,460 $ 6,037 Operating activities Net income .................................................................. Adjustments to reconcile net income to net cash provided by operating activities: Deferred income taxes .................................................... 2,180 2,279 Non - cash loss (gain) on US$ 6.25% Convertible Debentures conversion feature . . . (190) 177 Unrealized foreign currency gain ............................................ 2 (431) Amortization of deferred financing costs ..................................... 2,631 1,448 Non - cash stock compensation ............................................. 5,802 3,967 Equity in net loss from unconsolidated investment ............................ — 11 Loss on sale of oil and gas assets ............................................ 1,359 — Gain on disposal of fixed assets ............................................. (1,738) (1,925) Depreciation and depletion expense ........................................ 47,256 48,008 Amortization expense .................................................... 3,142 3,153 Impairment of oil and gas assets ............................................ 224 1,638 Changes in current assets and liabilities: Accounts receivable ...................................................... (5,754) (7,805) Prepaid expenses, inventory and other current assets .......................... (3,485) (4,954) Accounts payable ......................................................... (7,843) 6,743 Accrued expenses and other current liabilities ................................ 8,636 9,862 Changes in other assets and liabilities ............................................ (2,821) (37) Net cash provided by operating activities ............................................. 55,861 68,171 Investing activities Business acquisitions, net of cash acquired ........................................ — (6,182) Purchases of property and equipment ........................................... (34,523) (67,017) Proceeds from sale of oil and gas assets .......................................... 2,730 — Proceeds on sale of equipment ................................................. 2,698 2,247 Net cash used in investing activities .................................................. (29,095) (70,952) Financing activities Issuance of Cdn$ 5.25% Convertible Debentures .................................. 65,764 — Redemption of Senior Secured Notes ........................................... (35,000) — Redemption of US$ 6.25% Convertible Debentures ............................... (59,936) — Redemption of Class B Series Three common shares .............................. (2,457) (651) STI/ Class B Series Three common shares exchange issuance fees ................... (119) — Repurchase of common stock .................................................. — (25,797) Financing fees ................................................................ (4,724) (134) Common stock dividends ...................................................... (38,458) (37,873) Borrowings on credit facility ................................................... 271,499 220,520 Payments on credit facility ..................................................... (219,336) (150,529) Net cash (used in) provided by financing activities ..................................... (22,767) 5,536 Effect of exchange rate changes on cash .............................................. (794) (329) Net increase in cash and cash equivalents ............................................ 3,205 2,426 Cash and cash equivalents at beginning of period ...................................... 7,759 5,333 Cash and cash equivalents at end of period ........................................... $ 10,964 $ 7,759 Supplemental information: Cash paid for interest ............................................................. $ 16,611 $ 13,538 Cash paid for income taxes ......................................................... $ 2,66 2 $ 1,038 See accompanying notes.
54 STRONG TO THE CORE Student Transportation Inc. Notes to Consolidated Financial Statements For the years ended June 30, 2017 and 2016 (000’s of U.S. Dollars, unless specified, except share and per share amounts) 1. General Student Transportation Inc. (“STI” or the “Company”) is a corporation established under the laws of the Province of Ontario. STI together with its indirect subsidiary Student Transportation of America ULC (“STA ULC” and together with STI the “Issuer”), completed an Initial Public Offering (the “IPS Offering”) on December 21, 2004 through the issuance of income participating securities (“IPSs”). Each IPS consisted of one common share of STI and Cdn $3.847 principal amount of 14% subordinated notes of STA ULC (the “Subordinated Notes”). On December 21, 2009, the Company redeemed the remaining Subordinated Notes, originally issued as a component of the IPSs, as the final step in the process of converting from the IPS structure to a traditional common share structure. Following the redemption of the Subordinated Notes, STA ULC has been inactive. STI owns 100% of the common shares of both Student Transportation of America Holdings, Inc. (“STA Holdings”) and Parkview Transit. No other classes or series of shares of STA Holdings are currently outstanding. STA Holdings, through its wholly owned subsidiary, Student Transportation of America, Inc. (“STA, Inc.”), combined with Parkview Transit, is the third largest provider of school bus transportation services in North America. Historically the Company had two reportable segments, a transportation segment and an oil and gas segment . The oil and gas segment represented the Company’s investments as a non - operator in oil and gas interests . The Company completed the sale of its oil and gas interests in June 2017 . 2. Basis of Presentation These consolidated financial statements have been prepared by management in accordance with accounting principles generally accepted in the United States (“US GAAP”). The accompanying consolidated financial statements include the accounts of the Company and all of its subsidiaries. All significant intercompany accounts and transactions have been eliminated in consolidation. The significant accounting policies used to prepare the financial statements are described below: Foreign Currency Translation Monetary assets and liabilities denominated in a currency other than the functional currency are translated at the rate of exchange prevailing at the balance sheet date. Transactions denominated in a currency other than the functional currency are translated at the rate of exchange prevailing on the transaction date. Gains and losses on translation of these items are considered transaction gain and losses and are included in the consolidated statements of operations in foreign currency (gain) loss. The functional currency of STI, the parent, and the Company’s Canadian operations, is the Canadian dollar. The functional currency of STA Holdings and the Company’s operations in the United States is the U.S. dollar. The Company’s financial statements are reported in U.S. dollars, as the principal operations and cash flows of its subsidiaries are conducted in U.S. dollars. As a result, the assets and liabilities of STI and the Company’s Canadian operations are translated into U.S. dollars using the exchange rate in effect at the period end and revenues and expenses are translated at the average rate during the period. Exchange gains and losses on translation are deferred as a separate component of shareholders’ equity. The Company’s Cdn$ 5.25% convertible subordinated unsecured debentures (the “Cdn$ 5.25% Convertible Debentures”) and the Cdn$ 6.25% convertible subordinated unsecured debentures (the “Cdn$ 6.25% Convertible Debentures”), of STI are, as described in Note 8, denominated in Canadian dollars. As the functional currency of STI is the Canadian dollar, exchange
STRONG TO THE CORE 55 Student Transportation Inc. Notes to Consolidated Financial Statements For the years ended June 30, 2017 and 2016 (000’s of U.S. Dollars, unless specified, except share and per share amounts) 2. Basis of Presentation (continued) gains or losses related to the Cdn$ 5.25% Convertible Debentures and the Cdn$ 6.25% Convertible Debentures on the translation of the STI financial statements into U.S. dollars, the reporting currency, are deferred as a separate component of shareholders’ equity. The US$ 6.25% convertible subordinated unsecured debentures (the “6.25% Convertible Debentures”) of STI, as described in Note 8, were denominated in U.S. dollars. As the functional currency of STI is the Canadian dollar, unrealized gains or losses on re - measurement of the US$ 6.25% Convertible Debentures into Canadian dollars were considered transaction gains and losses, at the STI level, and were included in the consolidated statement of operations. Foreign currency transaction gains and losses, related to short - term related intercompany loans are recorded in the Consolidated Statement of Operations as incurred. Foreign currency transaction gains and losses for intercompany loans that are considered long - term in nature are recorded in Accumulated Other Comprehensive Income as incurred. Cash and Cash Equivalents Cash and cash equivalents include all cash balances and highly liquid investments with maturities of three months or less from the date of purchase. At June 30, 2017 and June 30, 2016 there were no cash equivalents. Use of Estimates The preparation of financial statements in conformity with US GAAP requires management to make estimates and assumptions that affect the reported amounts of assets and liabilities, the disclosure of contingent assets and liabilities at the date of the financial statements and the reported amounts of revenues and expenses during the reporting period. Actual results could differ from those estimates. The Company bases its estimates on historical experience, actuarial evaluations and on various other assumptions that it believes are reasonable under the circumstances. Amounts reported based upon these estimates include, but are not limited to, insurance reserves, income taxes, goodwill and intangible assets, derivatives, certain components of long term debt and impairment testing of long - lived assets. Allowance for Doubtful Accounts The Company establishes provisions for losses on accounts receivable if it is determined that all or part of the outstanding balance is not collectable. Collectability is reviewed regularly and an allowance is established or adjusted, as necessary, using the specific identification method. Concentration of Credit Risk Credit is extended based on an evaluation of the customer’s financial condition and, generally, advance payment is not required. The Company has no individual customers which account for more than 10% of its revenues. Anticipated credit losses are provided for in the financial statements. Management monitors the financial condition of its customers to reduce the risk of loss. Inventories Inventories, consisting primarily of repair parts and vehicle accessories, are valued at the lower of cost or market determined on a first - in, first - out (FIFO) method.
56 STRONG TO THE CORE Student Transportation Inc. Notes to Consolidated Financial Statements For the years ended June 30, 2017 and 2016 (000’s of U.S. Dollars, unless specified, except share and per share amounts) 2. Basis of Presentation (continued) Property and Equipment Property and equipment is recorded at cost or at fair value if obtained as part of a business acquisition, less accumulated depreciation. Ordinary maintenance and repairs are expensed as costs are incurred. Depreciation on transportation equipment is computed on a usage basis over the estimated useful lives of the assets, which approximate a range from seven to eleven years. Annually, management assesses the useful lives of these assets and any changes in estimated useful lives are accounted for prospectively. Leasehold improvements are amortized over the shorter of the lease term or the estimated useful lives of the assets. Buildings are depreciated on a straight line basis over 40 years. Other property and equipment is depreciated on a straight line basis over three to five years. The Company recorded depreciation expense of $46.6 million and $47.0 million for the years ended June 30, 2017 and 2016, respectively. Goodwill and Indefinite Lived Intangibles Goodwill represents the excess of cost over fair value of net assets acquired in business combinations accounted for under the purchase method. Goodwill and trade names are not amortized but rather assessed for impairment annually or more frequently if circumstances change and indicators of impairment are present. The annual impairment testing is performed in the fourth quarter. The annual assessment of goodwill impairment, may be performed either on a quantitative or qualitative basis. In January 2017, FASB issued ASU 2017 - 04 which eliminated the requirement, under the quantitative assessment, to calculate the implied fair value of goodwill to measure a goodwill impairment charge (Step 2). The quantitative assessment requires the Company to compare the fair value of the reporting unit with its carrying value, including goodwill. If the carrying value exceeds the fair value, impairment loss will be recognized in the statement of earnings in an amount equal to the difference and the fair value of goodwill becomes the new carrying value of goodwill for that reporting unit which is then used in future impairment tests. The Company also has the option to perform a qualitative assessment for goodwill impairment. Under the qualitative assessment, consideration is given to both external factors (including the macroeconomic and industry conditions) and the Company’s own internal factors (including internal costs, recent financial performance, management, business strategy, customers, and stock price). Facts and circumstances are evaluated each year to determine whether to use the qualitative or quantitative assessment. We performed a qualitative assessment during the fourth quarters of 2017 and 2016, and there was no indication of impairment for goodwill. Other Identifiable Intangible Assets When assessing the impairment for indefinite - lived trade names, the Company performs the assessment to determine if the carrying value exceeds the fair value at which time an impairment loss would be recognized in the statement of earnings in an amount equal to the excess. Fair values are derived by using discounted cash flow analyses which requires, among other factors, estimates of the amount and timing of projected cash flows and the appropriate discount rate. The Company also has the option to first assess qualitative factors to determine if a quantitative impairment test of the indefinite - live intangible asset is necessary. If the qualitative assessment reveals that it’s more likely than not that the asset is impaired, a calculation of the assets’ fair value is required. Otherwise, no quantitative calculation is necessary. The Company performed the quantitative assessment of trade names in the fourth quarters of 2017 and 2016 and there was no impairment.

STRONG TO THE CORE 57 Student Transportation Inc. Notes to Consolidated Financial Statements For the years ended June 30, 2017 and 2016 (000’s of U.S. Dollars, unless specified, except share and per share amounts) 2. Basis of Presentation (continued) Definite - lived intangible assets consist of contract rights and covenants not to compete. Contract rights, which include customer relationships, are amortized on a straight - line basis over an estimated useful life of 20 to 23 years. The useful life for contract rights was determined based on third party valuation reports prepared for the Company. The valuations took into account the average length of the contracts, the expected renewal periods and assumptions regarding future renewals based upon historical customers lives. Covenants not - to - compete are amortized on a straight - line basis over an estimated useful life of two to five years. The Company recorded amortization expense associated with its intangible assets of $3.1 million and $3.2 million for the years ended June 30, 2017 and 2016, respectively. Convertible Debentures The principal amount of the Cdn$ 6.25% Convertible Debentures and the Cdn$ 5.25% Convertible Debentures are convertible into common shares of the Company at the option of the holders and the Company under certain conditions. The Company has determined that the debentures are not required to be bifurcated into separate debt and equity components. In accordance with ASC 470 - 20, Debt with Conversion and Other Options, if the conversion feature of the debenture is non - beneficial (i.e. “out of the money”) upon issuance and the Company cannot settle conversions in cash, the full proceeds from these debentures should be recorded as a liability with no value attributed to the conversion feature. As such, the Company has recorded the full amount of the debentures as a liability. In accordance with ASC 815, Derivatives and Hedging , as the conversion feature on STI’s US$ 6.25% Convertible Debentures provided that the US dollar denominated notes could have been converted at a US dollar denominated strike price into common shares of STI, a Canadian dollar functional currency entity, the conversion feature represented an embedded derivative that was required to be bifurcated and accounted for separately. The embedded conversion feature was recorded at fair value in other liabilities at each reporting period end with the non - cash changes in fair value included in the consolidated statement of operations. In September 2016, the Company redeemed the US$ 6.25% Convertible Debentures and wrote off the remaining conversion feature resulting in a non - cash gain of $0.2 million. The Company recorded a non - cash loss of $0.2 million in connection with the change in fair value of the embedded conversion feature for the year ended June 30, 2016. Deferred Financing Costs The Company incurred costs related to obtaining debt financing. The Company capitalized costs associated with its Credit Agreement, Senior Secured Notes and costs related to the issuances of the Convertible Debentures. These costs have been capitalized and are being amortized to interest expense over the term of the related debt using the effective interest rate method. The carrying value of the deferred financing costs was $6.1 million and $4.3 million as of June 30, 2017 and 2016 respectively. Amortization expense totaled $2.6 million and $1.4 million for the years ended June 30, 2017 and 2016, respectively. Deferred financing costs associated with the Company’s Credit Agreement are included in other assets while the deferred financing costs associated with the Convertible Debentures are included in long term debt as a contra liability in the consolidated balance sheet. Impairment of Long - Lived Assets Management continually evaluates whether events or circumstances have occurred that indicate that the remaining estimated useful lives of property and equipment, contract rights and covenants not to compete may warrant revision or that the remaining balances may not be recoverable. Events or circumstances that would trigger testing for impairment include, but are not limited to, the loss of a significant school district customer contract, a significant increase in the Company’s expense levels absent a corresponding increase in
58 STRONG TO THE CORE Student Transportation Inc. Notes to Consolidated Financial Statements For the years ended June 30, 2017 and 2016 (000’s of U.S. Dollars, unless specified, except share and per share amounts) 2. Basis of Presentation (continued) revenue that causes operating or cash flow losses or projected operating or cash flow losses, significant adverse changes in legal factors or the business climate in which the Company operates that could affect the value of long - lived assets, or the expectation that a long - lived asset will be sold or otherwise disposed of at a loss before the end of its previously estimated useful life. If this review indicates that the assets will not be recoverable, as determined based on the undiscounted future cash flows from the use of the assets, the carrying value of the assets will be reduced to their estimated fair value. There were no indicators of impairment during the years ended June 30, 2017 and 2016. Business Combinations The Company accounts for business combinations under the principles codified in ASC 805, Business Combinations . The principles set forth how an acquirer recognizes and measures assets acquired, liabilities assumed, non - controlling interest and goodwill in a business combination. Key components include: (i) recognition of transaction costs in current period earnings and included in the consolidated statement of operations in acquisition expense; (ii) recognition of the estimated fair value of all contingent consideration at the acquisition date and an adjustment to fair value at each reporting date with an offset to current period earnings included in the consolidated statement of operations in other (income) expense; (iii) adjustments to deferred tax asset valuation allowances and income tax uncertainties recorded at the acquisition date to be recognized in current period earnings; (iv) acquisition method accounting is applied on the date that control is obtained in step acquisitions; (v) re - measurement of previously acquired non - controlling equity investments at fair value as at the acquisition date with an offset to current period earnings; and (vi) any excess of fair value of acquired net assets over the acquisition consideration results in a bargain purchase which is recognized in the statement of operations. Income Taxes Income taxes have been computed utilizing the asset and liability approach, under which deferred tax assets and liabilities are recognized for the expected future tax consequences of temporary differences between the financial reporting and tax bases of assets and liabilities. Deferred tax assets and liabilities are measured using the currently enacted tax rates expected to be in effect for the years in which those taxes are expected to be realized or settled. A valuation allowance is recorded to reduce deferred tax assets to the amount that is believed to be more likely than not to be realized. The recorded deferred income tax liability results from a difference between the book and tax basis of certain transportation equipment, other equipment and intangible assets. The Company uses judgment in determining income tax provisions and in evaluating its tax positions under the accounting guidance for income taxes. Additional provisions for income taxes are established when, despite the belief that tax positions are fully supportable, there remain certain positions that do not meet the minimum probability threshold, which is a tax position that is more - likely - than - not to be sustained upon examination by the applicable taxing authority. The Company and its subsidiaries are examined by various federal, state and provincial tax authorities. The Company regularly assesses the potential outcomes of these examinations and any future examinations for the current or prior years in determining the adequacy of its provision for income taxes. The Company continually assesses the likelihood and amount of potential adjustments and adjusts the income tax provision, the current tax liability and deferred taxes in the period in which the facts that give rise to a revision become known. The Company recognizes interest and penalties related to underpayment of income taxes in income tax provision (see Note 7). Revenue Recognition Revenue from the Company’s school bus operations is recognized when the following criteria are met: persuasive evidence of an arrangement exists, services have been rendered, the price to the buyer is fixed and determinable, and collectability is
STRONG TO THE CORE 59 Student Transportation Inc. Notes to Consolidated Financial Statements For the years ended June 30, 2017 and 2016 (000’s of U.S. Dollars, unless specified, except share and per share amounts) 2. Basis of Presentation (continued) reasonably assured. The Company bills customers on a monthly basis upon the completion of school bus routes, which are based on contracts or extension agreements with customers. Revenue from oil and gas interests was derived from the Company’s partial ownership in various oil and gas wells. As a non - operator, the Company recorded revenue from its oil and gas interests based on its share of the sales value of production from producing wells. Revenue was received from the well operators and was recognized when the commodities were delivered to customers, the price was fixed or determinable and collectability was assured. Insurance Reserves The Company had approximately $32.5 million and $30.1 million in recorded insurance reserves at June 30, 2017 and 2016, respectively. These reserves reflect the estimated deductible amounts the Company is responsible for under its workers’ compensation and vehicle liability insurance programs. Insurance expense for these items is largely dependent on the Company’s claims experience and the Company’s ability to control such claims, in addition to third party premiums/ expenses associated with this coverage. The Company has recorded estimated insurance reserves for the anticipated losses on open claims and estimated reserves for incurred but not recorded claims under the workers’ compensation and vehicle liability programs based upon actuarial analysis prepared by an independent third party actuary. Although the estimates of these accrued liabilities are based on the factors mentioned above, it is possible that future cash flows and results of operations could be materially affected by changes in our assumptions or changes in claims experience. Insurance reserves are included in accrued expenses and other current liabilities and other liabilities on the consolidated balance sheet. Stock - Based Compensation The Company accounts for stock - based compensation and other stock - based payments using the fair value method. Under the fair value method, the fair value of stock - based compensation and other stock - based payments are estimated at the grant date and the total fair value is amortized over the vesting schedule of the awards as compensation expense. The Class B Series Three common shares issued by STA Holdings were fully vested on the grant date, and, as such, the Company recognized compensation expense when the shares were issued. In February 2017 the Company redeemed all of the remaining Class B Series Three common shares by exchanging them for STI common shares, based on the fair market value of each class of shares (See Note 9). The Company recognized $5.8 million and $4.0 million in non - cash stock - based compensation expense based on the estimated fair value on the date of grant of the Class B Series Three common shares issued, for the years ended June 30, 2017 and 2016, respectively. On November 8, 2016, the Company’s shareholders approved a new performance share grant plan of the Company (the “New PSG Plan”). The New PSG Plan will replace the EIP originally set up at the STA Holdings level. Under the New PSG Plan, participants will be eligible to receive performance share grant units from the Company (“PSG Units”) that are redeemable for common shares of the Company. The vesting of PSG Units will be based entirely upon the achievement of multiple pre - defined performance measures and, except in certain prescribed circumstances the PSG Units will vest over a three - year period. The first grant of PSG Units is expected to occur in the 2018 fiscal year. Accounting for Derivatives and Hedging Activities Derivatives are recorded at fair value on the balance sheet, which, in accordance with ASC 820, Fair Value Measurements and Disclosure, requires that a company take into account its own credit risk and the credit risk of the counterparty when determining the fair value of financial assets and financial liabilities, including derivative instruments. Changes in fair value will be recorded in the income statement or through other comprehensive income depending on the nature of the derivative

60 STRONG TO THE CORE Student Transportation Inc. Notes to Consolidated Financial Statements For the years ended June 30, 2017 and 2016 (000’s of U.S. Dollars, unless specified, except share and per share amounts) 2. Basis of Presentation (continued) instrument. The Company did not elect hedge accounting for any of its derivative financial instruments and therefore records all changes in fair value in the income statement. The Company has offset the fair value amounts recorded on its forward foreign currency contracts executed with the same counterparty under an executed master netting arrangement. Segment Reporting The Company had two reportable segments, a transportation segment and an oil and gas segment. The transportation segment provides school bus and management services to public and private schools in North America. The oil and gas segment represented the Company’s investments as a non - operator in oil and gas interests. The Company completed the sale of its oil and gas interests in June 2017. Oil and Gas Interests The Company held non - operating interests in oil and gas properties, which were jointly owned with others. The financial statements reflected the Company’s proportionate interest in the oil and gas activities as a non - operator. The Company completed the sale of its oil and gas interests in June 2017. The Company used the full - cost method of accounting for oil and gas interests to determine the capitalized cost, whereby certain expenditures related to the acquisition, exploration and development of oil and gas properties were capitalized. Capitalized costs included the cost of land acquired or leased, intangible drilling costs such as those for equipment, casing and attachments on both productive and non - productive wells. These costs, net of salvage values, were accumulated in a single cost center and were depleted and amortized using the units - of production method. Natural gas reserves and production were converted, at a ratio of six thousand cubic feet of natural gas to one barrel of oil, for depletion and depreciation purposes. In connection with the oil and gas interests, the Company had an asset retirement obligation (“ARO”) which represented the liability associated with the retirement of long - lived assets that arose from the acquisition, construction, development or normal operation of such assets. In connection with the sale of the oil and gas interests, the Company wrote off its ARO, as it no longer has any liability associated with the oil and gas assets. At June 30, 2016, the present value of the Company’s asset retirement obligation was $0.5 million. Under US GAAP, the impairment test for oil and gas assets (the “ceiling test”) required the Company to use tax effected discounted cash flow using a present value technique. Under ASC 932, Extractive Industries – Oil and Gas, the pricing assumption used in the ceiling test calculation was defined as the twelve month average of realized prices. Earnings per Share Basic and diluted earnings per share are calculated by dividing the net income for the period by the weighted number of shares outstanding during each period. The shares used in the calculation of basic earnings per share are based on the weighted average number of shares outstanding. Shares used in the calculation of diluted earnings per share are based on the weighted average number of shares outstanding plus an adjustment for the incremental shares that would be outstanding assuming the exercise of the Company’s Convertible Debentures. The net income for basic earnings per share is net earnings available to common stockholders. The net income for diluted earnings per share is net earnings available to common stockholders with interest expense associated with the Convertible Debentures added back (net of tax) for the assumed conversion of the Convertible Debentures into common stock.

STRONG TO THE CORE 61 Student Transportation Inc. Notes to Consolidated Financial Statements For the years ended June 30, 2017 and 2016 (000’s of U.S. Dollars, unless specified, except share and per share amounts) 2. Basis of Presentation (continued) Seasonality The Company’s operations are seasonal and follow the school calendars of the public and private schools it serves. During the summer school break, revenue is derived primarily from summer camps and private charter services. Since schools are not in session, there is no school bus transportation revenue. Depreciation of fixed assets occurs in the months during which schools are in session, which is generally September through June. A full year’s worth of depreciation is recorded in these ten months to match the vehicles’ usage. Recently Adopted Accounting Standards In August 2014, the FASB issued ASU 2014 - 15, Presentation of Financial Statements — Going Concern (Subtopic 205 - 40): Disclosure of Uncertainties about an Entity’s Ability to Continue as a Going Concern, which defines management’s responsibility to assess an entity’s ability to continue as a going concern, and to provide related footnote disclosures if there is substantial doubt about its ability to continue as a going concern. The pronouncement is effective for annual and interim reporting periods ending after December 15, 2016 with early adoption permitted. The Company has adopted ASU 2014 - 15 effective December 31, 2016. The adoption of this guidance did not have any impact on the Company’s financial statements. In April 2015, the FASB issued ASU 2015 - 03, Interest - Imputation of Interest (Subtopic 835 - 30): Simplifying the Presentation of Debt Issuance Costs, which simplifies the presentation of debt issuance costs by requiring debt issuance costs to be presented as a deduction from the corresponding debt liability. The Company adopted this standard effective July 1, 2016. The Company adopted this guidance retrospectively, which resulted in a reduction of the June 30, 2016 non current asset balance by $3.2 million along with a corresponding reduction in the long term debt balance (see Note 4). In September 2015, FASB issued ASU 2015 - 16 Business Combinations - Simplifying the Accounting for Measurement - Period Adjustment. This ASU eliminates the requirement to retrospectively account for measurement - period adjustments resulting from business combinations. Instead, these adjustments will be recognized in the period the adjustment amount is determined. The Company adopted this standard for the first quarter of fiscal 2017 and the adoption had no impact on its consolidated financial statements. In January 2017, FASB issued ASU 2017 - 04 Intangibles - Goodwill and Other (Topic 350) simplifying the Test for Goodwill Impairment. This guidance eliminates the requirement to calculate the implied fair value of goodwill to measure a goodwill impairment charge (Step 2). As a result, entities will record an impairment charge based on the excess of a reporting units carrying amount over its fair value (Step 1). An entity still has the option to perform the qualitative assessment for a reporting unit to determine if the quantitative impairment test is necessary. This guidance should be applied on a prospective basis. The guidance is effective for goodwill impairment tests in fiscal years beginning after December 15, 2019. Early adoption is permitted for goodwill impairment tests performed after January 1, 2017. The Company adopted this new guidance for its goodwill impairment test for the year ended June 30, 2017. Recently Issued Accounting Standards In May 2014, the FASB issued ASU 2014 - 09, Revenue from Contracts with Customers. This new revenue recognition standard will supersede most existing revenue recognition guidance and is intended to improve revenue recognition and related financial reporting requirements. The standard will require companies to review contract arrangements with customers and ensure that all separate performance obligations are properly recognized in compliance with the new guidance. The standard allows for either “full retrospective” or “modified retrospective” adoption. In July 2015, the FASB delayed the effective date of this standard. The Company is now required to adopt this standard effective July 1, 2018. Early
62 STRONG TO THE CORE Student Transportation Inc. Notes to Consolidated Financial Statements For the years ended June 30, 2017 and 2016 (000’s of U.S. Dollars, unless specified, except share and per share amounts) 2. Basis of Presentation (continued) adoption is permitted beginning with the original effective date of July 1, 2017. The Company is currently evaluating both the methods of adoption as well as the impact that ASU 2014 - 09 will have on its consolidated financial statements and related disclosures. The Company’s implementation approach includes performing a detailed review of key contracts and assessing the conformance of historical accounting policies and practices with the standard. The Company is also evaluating how the standard may impact business processes, systems and controls. In January 2016, FASB issued ASU 2016 - 01 Financial Instruments - Recognition and Measurement of Financial Assets and Financial Liabilities. This guidance requires all equity investments to be measured at fair value with changes in the fair value recognized through net income (except those accounted for under the equity method of accounting or those that result in consolidation of the investee). The guidance also requires an entity to present separately, in other comprehensive income, the portion of the total change in the fair value of a liability resulting from a change in the instrument specific credit risk when the entity has elected to measure the liability at fair value in accordance with the fair value option for financial instruments. In addition, the guidance eliminates the need for the entity to disclose the method and significant assumptions used to estimate the fair value that is required to be disclosed for financial instruments measured at amortized cost on the balance sheet and requires separate presentation of financial assets and financial liabilities by measurement category and form of financial asset. The Company is required to adopt this standard for the first quarter of fiscal 2018. The Company is currently evaluating the requirements of this ASU to determine the impact on its consolidated financial statements, but currently does not anticipate this standard having a material impact on its consolidated financial statements. In February 2016, FASB issued ASU 2016 - 02 Leases (Topic 842). This guidance requires lessees to reflect most leases on their balance sheets. All entities will classify leases to determine how to recognize lease - related revenue and expenses. The Company is required to adopt this standard for the first quarter of fiscal 2020, with early adoption permitted. This standard must be adopted using a modified retrospective approach for leases that existed or are entered into after the beginning of the earliest comparative period presented. The Company is currently evaluating the requirements of this ASU to determine the impact on its consolidated financial statements. In August 2016, FASB issued ASU No. 2016 - 15, Statement of Cash Flows (Topic 230): Classification of Certain Cash Receipts and Cash Payments, provides guidance on eight specific cash flow issues with regard to how cash receipts and cash payments are presented and classified in the statement of cash flows in order to clarify existing guidance and reduce diversity in practice. The guidance is required to be adopted in the first quarter of 2018 on a retrospective basis, unless it is impracticable to apply, in which case it should be applied prospectively as of the earliest date practicable. Early adoption is permitted. The Company is currently evaluating the impact this guidance will have on its consolidated statement of cash flows. In January 2017, FASB issued ASU 2017 - 01 Business Combinations (Topic 805): Clarifying the Definition of a Business. The guidance clarifies the definition of a business to assist entities with evaluating whether a set of transferred assets and liabilities is a business. When substantially all the fair value of the assets acquired is concentrated in a single identifiable asset or a group of similar identifiable assets, the set of transferred assets is not a business. The guidance is effective for fiscal years beginning after December 15, 2017, including interim periods within those fiscal years. The Company currently does not anticipate this standard having a material impact on its consolidated financial statements. In May 2017, FASB issued ASU 2017 - 09, “Compensation — Stock Compensation (Topic 718): Scope of Modification Accounting,” This standard clarifies when changes to the terms or conditions of a share - based payment award must be accounted for as modifications under Topic 718. The guidance is effective for fiscal years beginning after December 15, 2017, including interim periods within those fiscal years. Early adoption is permitted. The Company currently does not anticipate this standard having a material impact on its consolidated financial statements.
STRONG TO THE CORE 63 Student Transportation Inc. Notes to Consolidated Financial Statements For the years ended June 30, 2017 and 2016 (000’s of U.S. Dollars, unless specified, except share and per share amounts) 2. Basis of Presentation (continued) Certain prior period amounts have been reclassified to conform to current year presentation and such amounts were not material to prior periods. 3. Business Combinations 2016 Acquisitions During January and February 2016, a wholly - owned subsidiary of the Company purchased the remaining interest in a transportation consulting and management services firm and acquired a second transportation consulting services firm. Earnings of the acquired companies were included in the Company’s results of operations from the acquisition dates. Total consideration paid in January and February 2016 approximated $7.2 million consisting of $6.2 million in cash and $1.0 million in common stock. The Company had previously invested $1.7 million in March 2015, to acquire a non - controlling interest in the first transportation consulting and management service firm. The purchase price allocation consists of net working capital of $0.6 million, equipment of $0.2 million and goodwill of $8.1 million. Approximately $0.1 million of acquisition related costs have been recognized as an expense in the statement of operations during fiscal year 2016. The goodwill attributable to these acquisitions includes the opportunity to expand within the market place and other key competitive advantages. None of the goodwill related to these acquisitions is deductible for tax purposes. The proforma impact of these acquisitions was immaterial to the Company’s consolidated financial statements. 4. Property and Equipment Property and equipment consist of the following: June 30, 2017 Cost Accumulated Depreciation Net Book Value Useful Life in years Land ........................... $ 5,537 $ — $ 5,537 Buildings ........................ 6,332 (1,902) 4,430 40 Transportation equipment ......... 450,436 (242,109) 208,327 7 to 11 Leasehold improvements .......... 10,138 (5,846) 4,292 The shorter of the life of lease or the useful life of the asset Other machinery and equipment . . . 35,368 (26,756) 8,612 3 to 5 $507,81 1 $(276,613) $231,19 8 Accumulated Net Book Useful Life June 30, 2016 Cost Depreciation Value in years Land ........................... $ 5,471 $ — $ 5,471 Buildings ........................ 5,978 (1,469) 4,509 40 Transportation equipment ......... 435,339 (231,392) 203,947 7 to 11 Leasehold improvements .......... 8,886 (4,809) 4,077 The shorter of the life of lease or the useful life of the asset Other machinery and equipment . . . 33,535 (22,967) 10,568 3 to 5 $489,20 9 $(260,637) $228,57 2
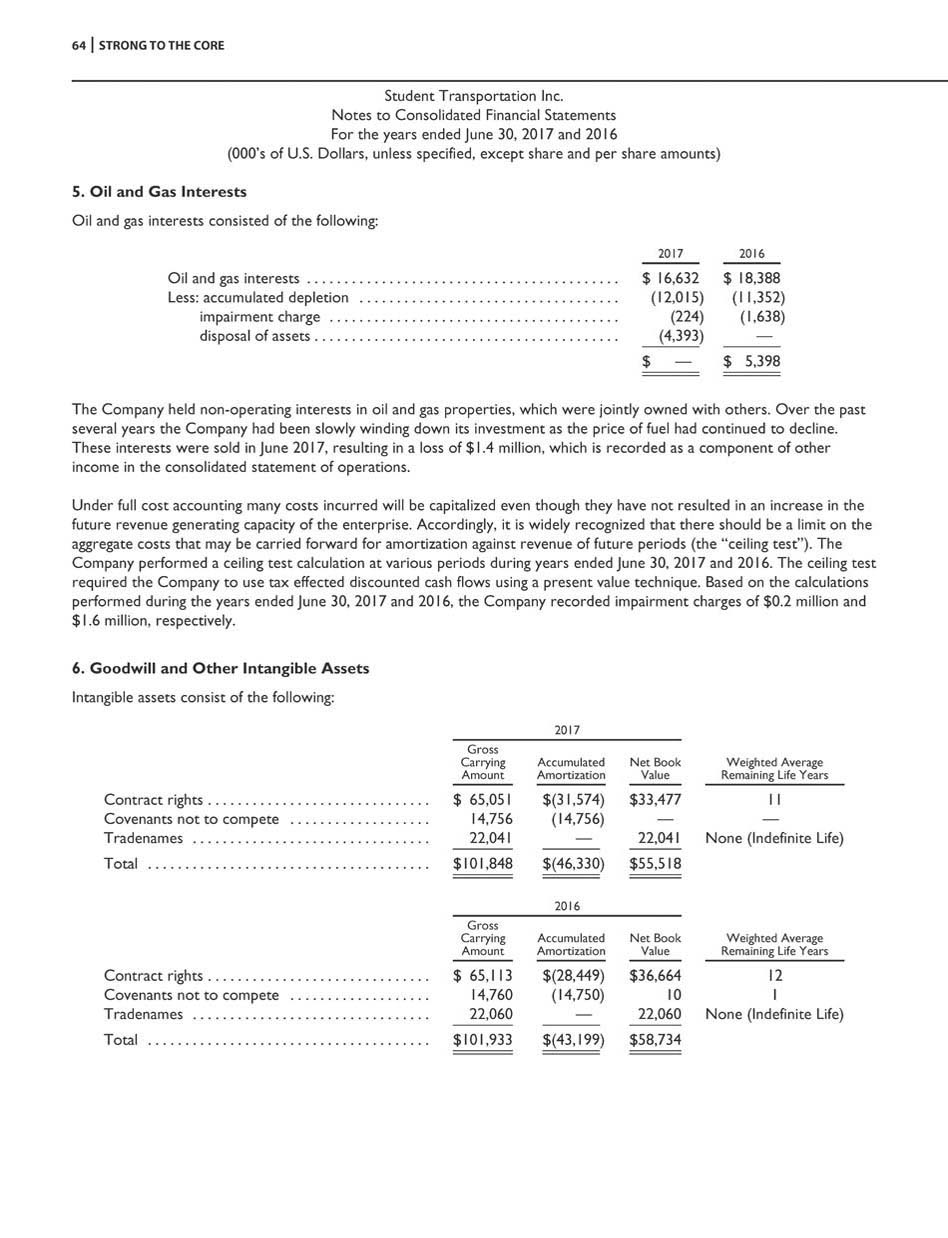
64 STRONG TO THE CORE Student Transportation Inc. Notes to Consolidated Financial Statements For the years ended June 30, 2017 and 2016 (000’s of U.S. Dollars, unless specified, except share and per share amounts) 5. Oil and Gas Interests Oil and gas interests consisted of the following: 2017 2016 Oil and gas interests .......................................... $ 16,632 $ 18,388 Less: accumulated depletion ................................... (12,015) (11,352) impairment charge ....................................... (224) (1,638) disposal of assets ......................................... (4,393) — $ — $ 5,398 The Company held non - operating interests in oil and gas properties, which were jointly owned with others. Over the past several years the Company had been slowly winding down its investment as the price of fuel had continued to decline. These interests were sold in June 2017, resulting in a loss of $1.4 million, which is recorded as a component of other income in the consolidated statement of operations. Under full cost accounting many costs incurred will be capitalized even though they have not resulted in an increase in the future revenue generating capacity of the enterprise. Accordingly, it is widely recognized that there should be a limit on the aggregate costs that may be carried forward for amortization against revenue of future periods (the “ceiling test”). The Company performed a ceiling test calculation at various periods during years ended June 30, 2017 and 2016. The ceiling test required the Company to use tax effected discounted cash flows using a present value technique. Based on the calculations performed during the years ended June 30, 2017 and 2016, the Company recorded impairment charges of $0.2 million and $1.6 million, respectively. 6. Goodwill and Other Intangible Assets Intangible assets consist of the following: 2017 Gross Carrying Amount Accumulated Amortization Net Book Value Weighted Average Remaining Life Years $ 65,051 14,756 22,041 $(31,574) (14,756) — $33,477 — 22,041 11 — None (Indefinite Life) Contract rights .............................. Covenants not to compete ................... Tradenames ................................ Total ...................................... $101,848 $(46,330) $55,518 2016 Gross Carrying Amount Accumulated Amortization Net Book Value Weighted Average Remaining Life Years $ 65,113 14,760 22,060 $(28,449) (14,750) — $36,664 10 22,060 12 1 None (Indefinite Life) Contract rights .............................. Covenants not to compete ................... Tradenames ................................ Total ...................................... $101,933 $(43,199) $58,734
STRONG TO THE CORE 65 Student Transportation Inc. Notes to Consolidated Financial Statements For the years ended June 30, 2017 and 2016 (000’s of U.S. Dollars, unless specified, except share and per share amounts) 6. Goodwill and Other Intangible Assets (continued) Estimated annual amortization expense for intangible assets is as follows: Year ending June 30, 2018 .......................................................... 3,153 2019 .......................................................... 3,152 2020 .......................................................... 3,152 2021 .......................................................... 3,152 2022 .......................................................... 3,152 $15,76 1 The following table represents the changes in the carrying amount of goodwill for the years ended June 30, 2017 and 2016: Balance as of June 30, 2015 ...................................... $134,939 Goodwill related to acquisitions .................................. 7,902 Foreign currency effects on Goodwill ............................. (1,172) Balance as of June 30, 2016 ...................................... $141,669 Goodwill additions related to prior acquisitions ..................... (58) Foreign currency effects on Goodwill ............................. (157) Balance as of June 30, 2017 ...................................... $141,454 7. Income Taxes The components of the expense for income taxes are as follows: 2017 2016 Federal: Canada Current ................................................... $ 951 $ 203 Deferred .................................................. (1,185) (57) (234) 146 Provincial: Canada Current ................................................... 478 156 Deferred .................................................. (908) (44) (430) 112 Foreign: Current ................................................... 1,057 200 Deferred .................................................. 4,273 2,380 5,330 2,580 Total provision ................................................. $ 4,666 $2,83 8
66 STRONG TO THE CORE Student Transportation Inc. Notes to Consolidated Financial Statements For the years ended June 30, 2017 and 2016 (000’s of U.S. Dollars, unless specified, except share and per share amounts) 7. Income Taxes (continued) The components of income before income tax expense for income taxes are as follows: 2017 2016 Domestic ......................................... $ 1 1 $3,11 1 Foreign ........................................... 11,11 5 5,76 4 Total ................................................. $11,12 6 $8,87 5 The difference between the effective rate reflected in the income tax expense for income taxes and the amount determined by applying the Canadian statutory rate to income before income taxes for the fiscal years ended June 30, 2017 and June 30, 2016 is analyzed below: 2017 2016 Provision for income taxes at statutory rate ......................... $1,669 $1,331 Provincial taxes .................................................. 1,280 1,020 Foreign rate differential ........................................... 1,690 574 Canadian rate difference .......................................... — (324) Release of Valuation Allowance .................................... (337) — Impact of Sale of Oil & Gas Assets ................................. (538) — Permanent items ................................................ 366 572 Prior Year adjustments ........................................... 583 (453) Uncertain tax position ............................................ (85) 143 Other .......................................................... 38 (25) $4,666 $2,838 Deferred taxes arise because of the differences in the book and tax basis of certain assets and liabilities. Significant components of deferred tax assets and (liabilities) are as follows: 2017 2016 Deferred tax liabilities Intangibles .............................................. $(23,490) $(24,340) Property and equipment .................................. (54,031) (56,517) Total deferred tax liabilities .................................... (77,521) (80,857) Deferred tax assets: Net operating loss carry forward ........................... 14,432 22,053 Other .................................................. 19,224 17,058 Total deferred tax assets .................................. 33,656 39,111 Valuation allowance ...................................... — (337) Net deferred tax assets ................................... 33,656 38,774 Net deferred tax liabilities ..................................... $(43,865) $(42,083) It is the Company’s intention to reinvest the undistributed earning of its foreign subsidiaries and thereby indefinitely postpone their remittance. As a result, deferred income taxes have not been provided on undistributed earnings of foreign subsidiaries of the Company. It is not practical to compute the deferred tax liability and as such is not recorded.

STRONG TO THE CORE 67 Student Transportation Inc. Notes to Consolidated Financial Statements For the years ended June 30, 2017 and 2016 (000’s of U.S. Dollars, unless specified, except share and per share amounts) 7. Income Taxes (continued) The following table summarizes the gross amounts of unrecognized tax benefits without regard to reduction in tax liabilities if such unrecognized tax benefits were settled. 2017 2016 Balance at July 1, ................................................... $528 $ 455 Additions for tax position related to prior year ..................... — 253 Lapse of Statute of Limitation .................................... (85) (180) Balance at June 30, ................................................. $443 $ 528 The total amount of the unrecognized tax benefits, if recognized would favorably impact the effective tax rate by $0.4 million. Not reflected in the amounts above are approximately seventy thousand dollars of interest and penalties for the fiscal years ended June 30, 2017 and 2016, respectively, which are included as a component of the income tax expense on the consolidated statement of operations. The Company’s income taxes are subject to review by taxing authorities in both the United States and Canada. The Company’s U. S taxes have been examined through the tax year ended June 30, 2014 and the Company’s Canadian taxes have been examined through the tax year ended June 30, 2012. At June 30, 2017, the Company has available U.S. net operating loss carry forwards of approximately $36.6 million expiring in the years 2026 through 2034, state net operating loss carryforwards of approximately $3.5 million expiring in the years 2023 through and 2037 and no Canadian non - capital loss carry forwards. 8. Debt Indebtedness of the Company includes the following: Amounts Outstanding at June 30, 2017 June 30, 2016 Current Long Term Current Long Term $172,088 $ — 123,295 — — — $120,129 117,696 35,000 Fourth Amended and Restated Credit Agreement Revolving credit facility .................................................. . $ — Convertible Debentures .................................... . — Senior Secured Notes ...................................... . — Less: unamortized debt issuance costs on the Convertible Debentures and Senior Secured Notes ....................... — (4,036) — (3,153) $ — $291,347 $ — $269,672
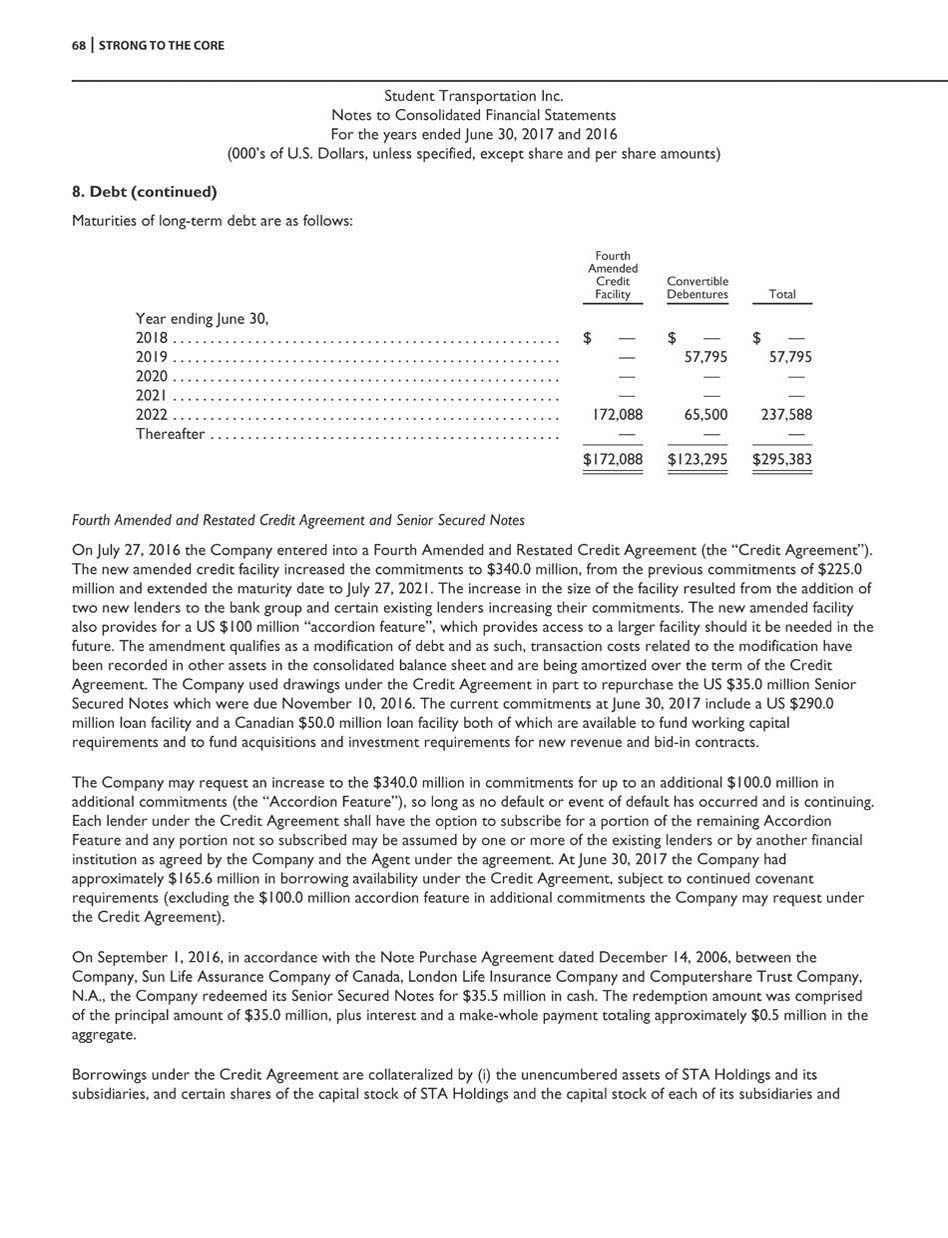
68 STRONG TO THE CORE Student Transportation Inc. Notes to Consolidated Financial Statements For the years ended June 30, 2017 and 2016 (000’s of U.S. Dollars, unless specified, except share and per share amounts) 8. Debt (continued) Maturities of long - term debt are as follows: Fourth Amended Credit Convertible Facility Debentures Total Year ending June 30, 2018 .................................................... $ — $ — $ — 2019 .................................................... — 57,795 57,795 2020 .................................................... — — — 2021 .................................................... — — — 2022 .................................................... 172,088 65,500 237,588 Thereafter ............................................... — — — $172,088 $123,295 $295,38 3 Fourth Amended and Restated Credit Agreement and Senior Secured Notes On July 27, 2016 the Company entered into a Fourth Amended and Restated Credit Agreement (the “Credit Agreement”). The new amended credit facility increased the commitments to $340.0 million, from the previous commitments of $225.0 million and extended the maturity date to July 27, 2021. The increase in the size of the facility resulted from the addition of two new lenders to the bank group and certain existing lenders increasing their commitments. The new amended facility also provides for a US $100 million “accordion feature”, which provides access to a larger facility should it be needed in the future. The amendment qualifies as a modification of debt and as such, transaction costs related to the modification have been recorded in other assets in the consolidated balance sheet and are being amortized over the term of the Credit Agreement. The Company used drawings under the Credit Agreement in part to repurchase the US $35.0 million Senior Secured Notes which were due November 10, 2016. The current commitments at June 30, 2017 include a US $290.0 million loan facility and a Canadian $50.0 million loan facility both of which are available to fund working capital requirements and to fund acquisitions and investment requirements for new revenue and bid - in contracts. The Company may request an increase to the $340.0 million in commitments for up to an additional $100.0 million in additional commitments (the “Accordion Feature”), so long as no default or event of default has occurred and is continuing. Each lender under the Credit Agreement shall have the option to subscribe for a portion of the remaining Accordion Feature and any portion not so subscribed may be assumed by one or more of the existing lenders or by another financial institution as agreed by the Company and the Agent under the agreement. At June 30, 2017 the Company had approximately $165.6 million in borrowing availability under the Credit Agreement, subject to continued covenant requirements (excluding the $100.0 million accordion feature in additional commitments the Company may request under the Credit Agreement). On September 1, 2016, in accordance with the Note Purchase Agreement dated December 14, 2006, between the Company, Sun Life Assurance Company of Canada, London Life Insurance Company and Computershare Trust Company, N.A., the Company redeemed its Senior Secured Notes for $35.5 million in cash. The redemption amount was comprised of the principal amount of $35.0 million, plus interest and a make - whole payment totaling approximately $0.5 million in the aggregate. Borrowings under the Credit Agreement are collateralized by (i) the unencumbered assets of STA Holdings and its subsidiaries, and certain shares of the capital stock of STA Holdings and the capital stock of each of its subsidiaries and
STRONG TO THE CORE 69 Student Transportation Inc. Notes to Consolidated Financial Statements For the years ended June 30, 2017 and 2016 (000’s of U.S. Dollars, unless specified, except share and per share amounts) 8. Debt (continued) (ii) by the unencumbered assets of Parkview Transit and its subsidiaries and the capital stock of Parkview Transit and the capital stock of each of its subsidiaries. In addition, payment and performance of the obligations under the Credit Agreement are guaranteed by each of STA Holdings’ subsidiaries. Borrowings under the Credit Agreement may be Base Rate Loans or Eurodollar Loans, as defined in the Credit Agreement. Base Rate Loans bear interest at the base rate, as defined in the Credit Agreement (4.25% at June 30, 2017), plus the applicable margin, which ranges from 0.50% to 1.25% depending on STA Holdings’ senior leverage ratio on the pricing date. Eurodollar Loans bear interest at the adjusted LIBOR rate, as defined in the Credit Agreement (1.422940% at June 30, 2017), plus the applicable margin, which ranges from 1.75% to 2.50% depending on STA Holdings’ senior leverage ratio on the pricing date. The effective interest rate on the Credit Agreement was 3.82% for the year ended June 30, 2017. The Company was in compliance with all debt covenants related to the Fourth Amended and Restated Credit Agreement at June 30, 2017. Convertible Debentures On August 16, 2016, the Company issued the Cdn$ 5.25% convertible unsecured subordinated debentures due September 30, 2021 at a price of $1,000 per debenture, for total gross proceeds of $65.8 million (Cdn $85.0 million). The issue costs of approximately $3.2 million (Cdn $4.2 million) have been recorded as a component of debt on the balance sheet and are being amortized over the term of the debentures using the effective interest method. Interest on the Cdn$ 5.25% Convertible Debentures due September 30, 2021 is payable semi - annually, in arrears, on March 31 and September 30 of each year. Each Cdn$ 5.25% Convertible Debenture is convertible into common shares of the Company at the option of the holder at any time prior to the close of business on the earlier of the business day immediately preceding the maturity date or, if called for redemption, on the business day immediately preceding the date fixed for redemption, at a conversion price of Cdn $9.35 per common share (the “Cdn$ 5.25% Convertible Debenture Conversion Price”) which is equivalent to 106.9519 common shares for each Cdn $1,000 principal amount of the Cdn$ 5.25% Convertible Debentures. The Cdn$ 5.25% Convertible Debenture is not redeemable prior to September 30, 2019. The Company has the right, at its option, to redeem the Cdn$ 5.25% Convertible Debentures in whole or in part, from time to time, on or after September 30, 2019 but prior to September 30, 2020, on at least 30 days prior notice at a redemption price equal to par plus accrued and unpaid interest, provided that the weighted average trading price of the common shares on a recognized exchange for the 20 consecutive trading days ending five trading days prior to the date on which the redemption notice is given is at least 125% of the Cdn$ 5.25% Convertible Debenture Conversion Price. After September 30, 2019 and prior to maturity the Company has the right, at its option to redeem the Cdn$ 5.25% Convertible Debentures in whole or in part, from time to time, on at least 30 days prior notice at a redemption price equal to par plus accrued and unpaid interest. On August 23, 2016, the Company announced that it called for the early redemption and settlement of the 6.25% US$ convertible unsecured subordinated debentures (the “US$ 6.25% Convertible Debentures”). Subsequent to announcement, approximately $0.1 million of the US$ 6.25% Convertible Debentures were converted into 6,736 shares of common stock. On September 19, 2016 the Company redeemed the remaining $59.9 million principal amount of US$ 6.25% Convertible Debentures for cash in accordance with the Trust Indenture dated June 7, 2011, between STI and Computershare Trust Company of Canada governing the US$ 6.25% Convertible Debentures. In connection with the redemption, approximately $1.0 million in unamortized deferred financing costs were expensed in the year ended June 30, 2017.
70 STRONG TO THE CORE Student Transportation Inc. Notes to Consolidated Financial Statements For the years ended June 30, 2017 and 2016 (000’s of U.S. Dollars, unless specified, except share and per share amounts) 8. Debt (continued) On November 12, 2013, the Company issued the Cdn$ 6.25% Convertible Debentures due June 30, 2019 at a price of $1,000 per debenture, for total gross proceeds of $71.4 million (Cdn $75.0 million). The issue costs of approximately $3.5 million (Cdn $3.6 million) have been recorded as a component of debt on the consolidated balance sheet and are being amortized over the term of the Cdn$ 6.25% Convertible Debentures due June 30, 2019, using the effective interest method. Interest on the Cdn$ 6.25% Convertible Debentures due June 30, 2019 is payable semi - annually, in arrears, on June 30 and December 31 of each year. Each Cdn$ 6.25% Convertible Debenture due June 30, 2019 is convertible into common shares of the Company at the option of the holder at any time prior to the close of business on the earlier of the business day immediately preceding the maturity date or, if called for redemption, on the business day immediately preceding the date fixed for redemption, at a conversion price of Cdn $9.05 per common share (the “Cdn$ 6.25% Convertible Debenture Conversion Price”) which is equivalent to 110.4972 common shares for each Cdn $1,000 principal amount of the Cdn$ 6.25% Convertible Debentures due June 30, 2019. The Cdn$ 6.25% Convertible Debentures due June 30, 2019 were not redeemable prior to June 30, 2017. The Company will have the right, at its option, to redeem the Cdn$ 6.25% Convertible Debentures due June 30, 2019 in whole or in part, from time to time, on or after June 30, 2017 but prior to June 30, 2018, on at least 30 days prior notice at a redemption price equal to par plus accrued and unpaid interest, provided that the weighted average trading price of the common shares on a recognized exchange for the 20 consecutive trading days ending five trading days prior to the date on which the redemption notice is given is at least 125% of the Cdn$ 6.25% Convertible Debenture Conversion Price. After June 30, 2018 and prior to maturity the Company will have the right, at its option to redeem the Cdn$ 6.25% Convertible Debentures due June 30, 2019 in whole or in part, from time to time, on at least 30 days prior notice at a redemption price equal to par plus accrued and unpaid interest. On June 7, 2011, the Company issued the US$ 6.25% Convertible Debentures due June 30, 2018 at a price of $1,000 per debenture, for total gross proceeds of $60.0 million. The issue costs of approximately $3.0 million were recorded as a component of debt on the consolidated balance sheet and were being amortized over the term of the US$ 6.25% Convertible Debentures due June 30, 2018, using the effective interest method. The conversion feature of this debenture provides that these US dollar denominated notes could be converted into Canadian dollar denominated common shares of the Company. As such, the conversion feature represented an embedded derivative that was required to be bifurcated and accounted for separately. The conversion feature of this debenture provided that the US dollar denominated notes could be converted into Canadian dollar denominated common shares of the Company. The conversion feature represented an embedded derivative that was required to be bifurcated and accounted for separately. The embedded derivative liability, which was included as a component of other liabilities in the consolidated balance sheet, was reduced to nil in connection with the early redemption. In addition, as the functional currency of STI is the Canadian dollar, unrealized gains or losses on re - measurement of the US $ 6 . 25 % Convertible Debentures into Canadian dollars were considered transaction gains and losses, at the STI level, and were also included in the consolidated statement of operations . Interest on the US$ 6.25% Convertible Debentures was payable semi - annually, in arrears, on June 30 and December 31 of each year.
STRONG TO THE CORE 71 Student Transportation Inc. Notes to Consolidated Financial Statements For the years ended June 30, 2017 and 2016 (000’s of U.S. Dollars, unless specified, except share and per share amounts) 8. Debt (continued) Each US $ 6 . 25 % Convertible Debenture was convertible into common shares of the Company at the option of the holder at any time prior to the close of business on the earlier of the business day immediately preceding the maturity date or, if called for redemption, on the business day immediately preceding the date fixed for redemption, at a conversion price of $9.50 per common share (the “US$ 6.25% Convertible Debenture Conversion Price”) which is equivalent to 105.2632 common shares for each $1,000 principal amount of the US$ 6.25% Convertible Debenture. The US$ 6.25% Convertible Debentures were not redeemable prior to June 30, 2014. The Company had the right, at its option, to redeem the US$ 6.25% Convertible Debentures in whole or in part, from time to time, on or after July 1, 2014 but prior to June 30, 2016, on at least 30 days prior notice at a redemption price equal to par plus accrued and unpaid interest, provided that the weighted average trading price of the common shares on a recognized exchange for the 20 consecutive trading days ending five trading days prior to the date on which the redemption notice is given is at least 125% of the US$ 6.25% Convertible Debenture Conversion Price. After June 30, 2016 and prior to maturity the Company had the right, at its option to redeem the US$ 6.25% Convertible Debentures in whole or in part, from time to time, on at least 30 days prior notice at a redemption price equal to par plus accrued and unpaid interest. The Cdn$ 6.25% Convertible Debentures, the US$ 6.25% Convertible Debentures and the Cdn$ 5.25% Convertible Debentures are collectively referred to as the “Convertible Debentures”. The Convertible Debentures are subordinate to the Fourth Amended and Restated Credit Agreement. The Company may at its option, subject to applicable regulatory approval, elect to satisfy its obligation to pay the outstanding principal amount of the Convertible Debentures in whole, by issuing and delivering common shares for each Cdn $1,000 principal amount of the Cdn$ 6.25% Convertible Debentures and of the Cdn$ 5.25% Convertible Debentures. The amount of common shares delivered is obtained by dividing each principal amount of Convertible Debentures by 95% of the current market price of the common shares on the date set for redemption or the maturity date. The Company may elect, subject to applicable regulatory approval, to issue and deliver common stock of the Company to the indenture trustee under the Convertible Debentures indentures, to sell in the open market, to satisfy the Company’s obligation to pay interest on the Convertible Debentures on each interest payment date. The Convertible Debenture holders will receive a cash payment in satisfaction of the interest obligation equal to the interest payable from the sale of such common shares. The Company must commence, within 30 days of a Change in Control (as defined in the Convertible Debenture indentures), an offer to purchase all of the Convertible Debentures then outstanding at a purchase price equal to 101% of the principal amount of the Convertible Debentures, plus accrued and unpaid interest thereon. The Company expects to be able to repay, renew or refinance its various loan facilitates and Convertible Debentures as they become due with other long term financing options. 9. Common Shares The authorized share capital of the Company consists of an unlimited number of no par value common and preferred shares. At June 30, 2017 there are no preferred shares issued and outstanding. Pursuant to its Dividend Reinvestment Plan (the “Plan”), the Company issued 439,388 and 1,028,064 common shares during the fiscal years ended June 30, 2017 and 2016, respectively. The shares issued pursuant to the plan represent non - cash dividends with values of $2.4 million and $4.2 million, for the fiscal years ended June 30, 2017 and 2016, respectively, which

72 STRONG TO THE CORE Student Transportation Inc. Notes to Consolidated Financial Statements For the years ended June 30, 2017 and 2016 (000’s of U.S. Dollars, unless specified, except share and per share amounts) 9. Common Shares (continued) have been recorded as a non - cash financing activity in each year. The Plan was established to enable eligible shareholders of the Company to reinvest dividends paid on their common shares to acquire additional common shares of the Company. The common shares issued under the Plan are issued at a price based on the volume weighted average of the closing price of the common shares for the five trading days immediately preceding the relevant dividend date, less a 3% discount. The Company renewed its normal course issuer bid (“NCIB”) on May 19, 2017. Pursuant to the notice, the Company is permitted to acquire up to a maximum amount of Common Shares equal to 9,225,542 Common Shares in the twelve month period commencing May 24, 2017 and ending on May 23, 2018, subject to the Company’s senior debt agreement requirements. The Company did not repurchase any shares during the fiscal year ended June 30, 2017. During the 2016 fiscal year, the Company purchased and cancelled 575,226 common shares having a value of $2.3 million, pursuant to the NCIB that was in effect at the time. On February 23, 2017, the Company issued 2,282,104 shares of stock having an approximate value of $12.8 million in connection with the Share Exchange and redemption of the Class B Series Three common shares, which have been recorded as a non - cash financing activity (see Note 11). During September 2016, the Company issued 6,736 shares of stock having an approximate value of $0.1 million in connection with conversions of the Company’s US$ 6.25% Convertible Debentures, which were recorded as a non - cash financing activity. The remaining principal of these debentures were redeemed on September 19, 2016 (see Note 8). On April 11, 2016, pursuant to a block trade, the Company acquired and cancelled the remaining 5.0 million shares held by SNCF - Participations (“SNCF - P”), formerly the Company’s largest shareholder, for approximately $23.5 million. SNCF - P had originally invested in the Company in 2008, and had sold four million shares in August 2015. In April 2016, SNCF - P sold an additional 6.4 million shares through a combination of a private transaction and a separate sale to a bank syndicate. The disposal of shares by SNCF - P was part of their previously announced strategy to divest a group of transportation and logistics companies considered as “non - core assets” in their investment portfolio. During the 2016 fiscal year, the Company issued a total of 309,161 shares having an approximate value of $1.0 million in connection with the acquisition of the two transportation consulting and management services firms, which were recorded as a non - cash investing activity (see Note 3). On May 8, 2015, the Board of Directors of the Company approved a change in the currency of the monthly dividend to U.S dollars, effective July 1, 2015, with the first U.S. dollar dividend payable August 17, 2015 to shareholders of record on July 31, 2015. Common shares issued and outstanding are 94,631,743 and 91,903,515 million at June 30, 2017 and 2016, respectively. The changes in accumulated other comprehensive income for foreign currency translation is as follows: 2017 2016 $ 13 $(2,120) 176 2,133 2,133 Balance at June 30, ................................................ Foreign currency translation ................................... Current period comprehensive income ............................. . 176 Balance at June 30, ................................................ $189 $ 13
STRONG TO THE CORE 73 Student Transportation Inc. Notes to Consolidated Financial Statements For the years ended June 30, 2017 and 2016 (000’s of U.S. Dollars, unless specified, except share and per share amounts) 9. Common Shares (continued) There were no reclassifications out of accumulated other comprehensive income. 10. Earnings Per Share The following table sets forth the basic and diluted weighted average share amounts: Twelve months ended June 30, 2017 Twelve months ended June 30, 2016 92,936,942 95,495,357 17,616,722 14,603,082 Weighted - average shares outstanding - basic ....... Potential dilutive effect of shares to be issued to settle the debentures ........................ Weighted - average shares outstanding - diluted ..... 110,553,664 110,098,439 The computations for basic and diluted income per common share are as follows: Twelve months ended Twelve months ended June 30, 2017 June 30, 2016 Net income – basic ................................ $ 6,460 $ 6,037 Add back: Interest expense on debentures (net of tax) . . 4,613 4,472 Net income used for diluted earnings per share ....... 11,073 10,509 Basic income per share ............................ $ 0.07 $ 0.06 Diluted income per share .......................... $ 0.07 $ 0.06 The conversion of the convertible debentures is anti - dilutive for both years ended June 30, 2017 and 2016. 11. Stock - Based Compensation The shareholders of the Company approved the adoption of the STA Holdings Equity Incentive Plan (“EIP”) by STA Holdings in December 2005. The shareholders also approved the initial allotment of Class B common shares available for issuance under the EIP in December 2005, with subsequent approvals of additional allotments in November 2008 and November 2012. Following the Share Exchange described below, the EIP was terminated. On November 8, 2016, the Company’s shareholders approved two special business items at the Company’s 2016 Annual and Special Meeting of shareholders. The first item related to the approval of a new performance share grant plan of the Company (the “New PSG Plan”). The New PSG Plan will replace the EIP originally set up at the STA Holdings level. Under the New PSG Plan, participants will be eligible to receive performance share grant units from the Company (“PSG Units”) that are redeemable for common shares of the Company. The vesting of PSG Units will be based entirely upon the achievement of multiple pre - defined performance measures and, except in certain prescribed circumstances the PSG Units will vest over a three - year period. The first grant of PSG Units is expected to occur in the 2018 fiscal year. The second item related to the approval for the issuance of up to 2.7 million common shares by the Company to the holders of Class B Series Three common shares of STA Holdings in exchange for all issued and outstanding Class B Series Three common shares (the “Share Exchange”). The Share Exchange was expected to happen on or before February 28, 2017. On February 23, 2017, the Company issued 2,282,104 STI common shares in exchange for all of the outstanding Class B Series Three common shares. Following the Share Exchange, all of the outstanding Class B Series Three common shares were cancelled, and the Company owns 100% of the equity securities of STA Holdings.

74 STRONG TO THE CORE Student Transportation Inc. Notes to Consolidated Financial Statements For the years ended June 30, 2017 and 2016 (000’s of U.S. Dollars, unless specified, except share and per share amounts) 11. Stock - Based Compensation (continued) The Class B Series Three shares which had been granted to management under the STA Holdings EIP were accounted for as a liability upon issuance, as a result of a “put” option they contained. The holders of the Class B Series Three common shares were entitled to receive dividends, as and when declared by the board of directors of STA Holdings, approximately equivalent to the dividends received by the holders of STI common shares. Pursuant to the liquidity provisions of the EIP, the holders of Class B Series Three common shares had an option to “put” up to one third of the shares awarded each year back to the Company, starting one year immediately following the grant. The Class B Series Three common shares granted were fully vested on the grant date. These shares were classified as a liability and re - measured at fair value at the end of each reporting period. Changes in fair value and dividends on the Class B Series Three common shares were recorded as a component of other (income) expense, in the consolidated statement of operations. Before the shares were redeemed in connection with the Share Exchange on February 23, 2017, the Company recorded an expense of $1.1 million and $1.4 million for the years ended June 30, 2017 and 2016, respectively, associated with the change in fair value on the Class B Series Three common shares, which are recorded as a component of other income, in the consolidated statement of operations, (see Note 12 Equity Risk ). The Company recorded $0.6 million and $0.9 million in dividend payments for the years ended June 30, 2017 and 2016, respectively, which are recorded as a component of other (income) expense, in the consolidated statement of operations. The following tables summarize the Class B Series Three common shares granted, (net of shares withheld for income tax withholding at the election of participants), shares redeemed and shares outstanding pursuant to the EIP: For the year ended June 30, 2017 Shares Taxes Total outstanding Shares outstanding at June 30, 2016 ................... 3,376,699 (1,319,928) 2,056,771 Grants ............................................ 1,018,114 (362,468) 655,646 Redemptions ....................................... (430,313) — (430,313) STI/B3 Share Exchange .............................. (3,964,500) 1,682,396 (2,282,104) Shares outstanding at June 30, 2017 ................... — — — The Company recognized $5.8 million in non - cash stock based compensation expense related to the above grants during the year ended June 30, 2017, based on the estimated fair value of these shares on the grant date. Pursuant to the liquidity provision of the EIP plan, 430,313 shares were “put” back to the Company during the year ended June 30, 2017. The Company paid $2.4 million associated with these puts during the year ended June 30, 2017. On February 23, 2017 the Company exchanged all of the remaining Class B Series Three common shares, having an approximate value of $12.8 million (of which $9.3 million was recorded in other current liabilities immediately prior to the exchange) into STI common shares. This exchange was recorded as a non - cash financing activity (see Note 9). The following tables summarize the Class B Series Three common shares granted, shares withheld for income tax withholdings at the election of the participants, shares redeemed and shares outstanding pursuant to the EIP: For the year ended June 30, 2016 Shares Taxes Total outstanding Shares outstanding at June 30, 2015 .................... 2,493,603 (902,392) 1,591,211 Grants ............................................. 1,023,008 (417,536) 605,472 Redemptions ....................................... (139,912) — (139,912) Shares outstanding at June 30, 2016 .................... 3,376,699 (1,319,928) 2,056,771

STRONG TO THE CORE 75 Student Transportation Inc. Notes to Consolidated Financial Statements For the years ended June 30, 2017 and 2016 (000’s of U.S. Dollars, unless specified, except share and per share amounts) 11. Stock - Based Compensation (continued) The Company recognized $4.0 million in non - cash stock based compensation expense related to the above grants during the year ended June 30, 2016, based on the estimated fair value of these shares on the grant date. Pursuant to the liquidity provision of the EIP plan, 139,912 shares were “put” back to the Company during the year ended June 30, 2016 for which the Company paid $0.7 million. The fair value of the Class B Series Three common shares outstanding at June 30, 2016 represents a liability of $10.5 million, of which $7.7 million is recorded in other current liabilities and represents the current value of those shares eligible to be put in the next twelve months pursuant to the EIP plan. The remaining balance was recorded in Class B Series Three common share liability. 12. Financial Instruments The Company’s financial assets and liabilities are as follows: As at As at June 30, 2017 June 30, 2016 Cash .................................................... $ 10,964 $ 7,759 Accounts receivable, net ................................... 68,747 63,018 Equity hedge ............................................. 485 1,114 $ 80,196 $ 71,891 Accounts payable ......................................... $ 1,101 $ 8,946 Other accrued liabilities ................................... 70,467 47,583 Class B Series Three share liability .......................... — 10,449 Long - term debt ........................................... 291,347 269,672 Conversion right on 6.25% Convertible Debentures ........... — 190 Other long term liabilities .................................. 20,581 19,831 $383,496 $356,671 The carrying amounts of cash, accounts receivable, accounts payable, and other accrued liabilities approximate fair value because of the short - term maturity of these items . The carrying amount of long - term debt, which bears interest at both fixed and floating rates, also approximates fair value . The equity hedge was measured at fair value using appropriate valuation methodologies which includes using the forward price on the Company’s stock. The fair value of the Class B Series Three common share liability was based upon an amount equal to the weighted average trading price of the STI common shares for the 10 consecutive trading days immediately prior to the date of valuation. Other long term liabilities consist primarily of insurance reserves which are valued upon actuarial analysis. The fair value of a financial instrument is the amount of consideration that could be agreed upon in an arm’s length transaction between knowledgeable willing parties who are under no compulsion to act. In certain circumstances, however, the initial fair value may be based upon other observable current market transactions in the same instrument, without modification or on a valuation technique using market - based inputs. Fair value measurements are categorized using a fair value hierarchy that reflects the significance of inputs used in determining the fair values: Level 1: Quoted prices in active markets for identical assets or liabilities.
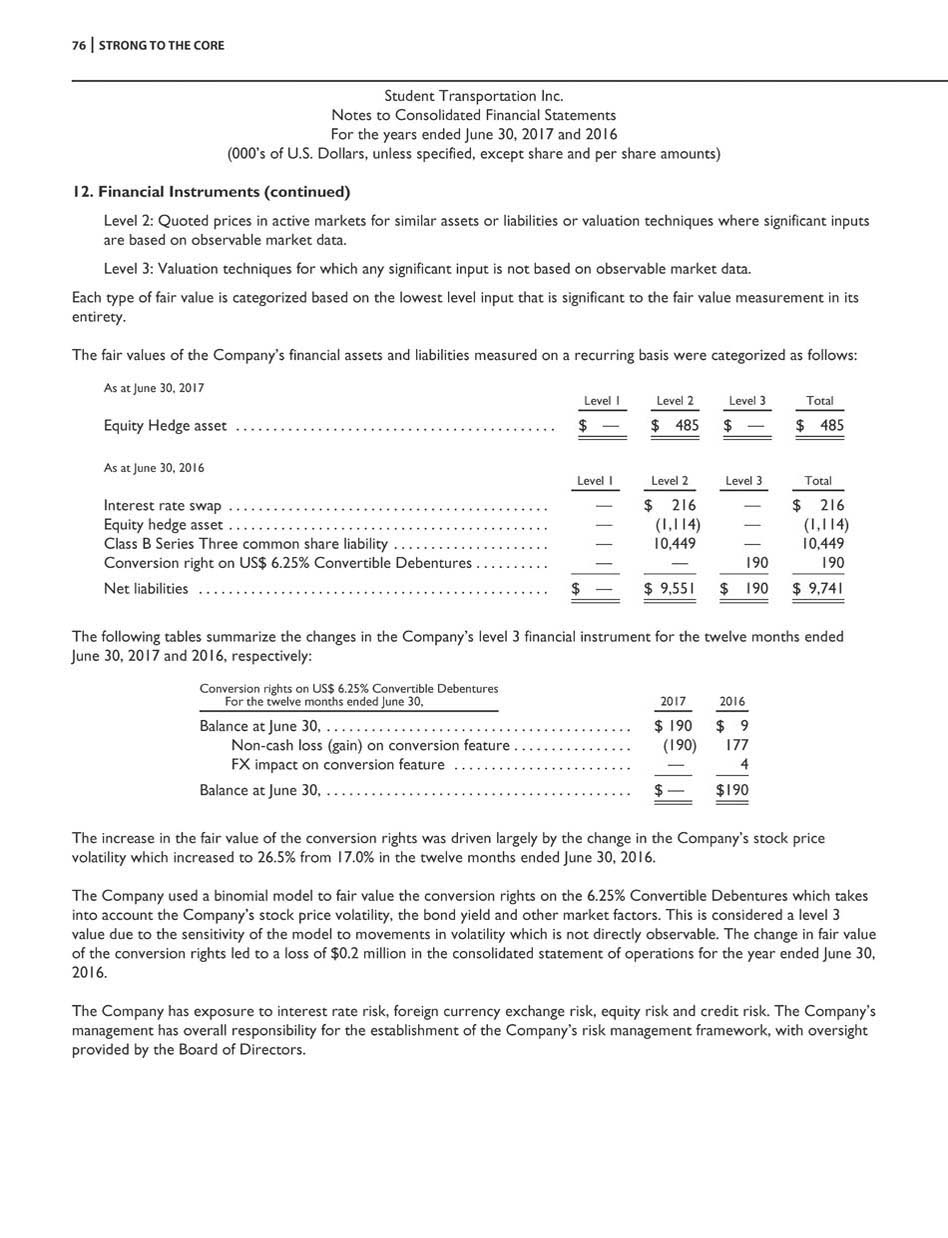
76 STRONG TO THE CORE Student Transportation Inc. Notes to Consolidated Financial Statements For the years ended June 30, 2017 and 2016 (000’s of U.S. Dollars, unless specified, except share and per share amounts) 12. Financial Instruments (continued) Level 2: Quoted prices in active markets for similar assets or liabilities or valuation techniques where significant inputs are based on observable market data. Level 3: Valuation techniques for which any significant input is not based on observable market data. Each type of fair value is categorized based on the lowest level input that is significant to the fair value measurement in its entirety. The fair values of the Company’s financial assets and liabilities measured on a recurring basis were categorized as follows: As at June 30, 2017 Level 1 Level 2 Level 3 Total Equity Hedge asset ........................................... $ — $ 485 $ — $ 485 As at June 30, 2016 Level 1 Level 2 Level 3 Total Interest rate swap ........................................... — $ 216 — $ 216 Equity hedge asset ........................................... — (1,114) — (1,114) Class B Series Three common share liability ..................... — 10,449 — 10,449 Conversion right on US$ 6.25% Convertible Debentures .......... — — 190 190 Net liabilities ............................................... $ — $ 9,551 $ 190 $ 9,741 The following tables summarize the changes in the Company’s level 3 financial instrument for the twelve months ended June 30, 2017 and 2016, respectively: Conversion rights on US$ 6.25% Convertible Debentures For the twelve months ended June 30, 2017 2016 Balance at June 30, ......................................... $ 190 $ 9 Non - cash loss (gain) on conversion feature ................ (190) 177 FX impact on conversion feature ........................ — 4 Balance at June 30, ......................................... $ — $190 The increase in the fair value of the conversion rights was driven largely by the change in the Company’s stock price volatility which increased to 26.5% from 17.0% in the twelve months ended June 30, 2016. The Company used a binomial model to fair value the conversion rights on the 6.25% Convertible Debentures which takes into account the Company’s stock price volatility, the bond yield and other market factors. This is considered a level 3 value due to the sensitivity of the model to movements in volatility which is not directly observable. The change in fair value of the conversion rights led to a loss of $0.2 million in the consolidated statement of operations for the year ended June 30, 2016. The Company has exposure to interest rate risk, foreign currency exchange risk, equity risk and credit risk. The Company’s management has overall responsibility for the establishment of the Company’s risk management framework, with oversight provided by the Board of Directors.
STRONG TO THE CORE 77 Student Transportation Inc. Notes to Consolidated Financial Statements For the years ended June 30, 2017 and 2016 (000’s of U.S. Dollars, unless specified, except share and per share amounts) 12. Financial Instruments (continued) Interest Rate Risk The Company’s interest rate risk primarily arises from its variable rate borrowings under the senior credit facility, which bears a floating rate of interest. The Company manages its interest rate exposure by using a combination of fixed and variable rate debt. The Company also had in place an interest rate swap for a notional amount of $50.0 million of credit facility borrowings, which matured in February 2017. The swap was not designated as a hedge for accounting purposes therefore the changes in fair value of the interest rate swap were recorded in the condensed consolidated statement of operations as a component of interest expense. The Company recorded a non cash gain of $0.2 million and $0.1 million for the year ended June 30, 2017 and 2016, respectively, in connection with the changes in fair value of the swap. These amounts are included in the consolidated statement of operations as a component of interest expense. The Company has secured fixed rate financing in the form of its Convertible Debentures. At June 30, 2017, the Company had $172.1 million in outstanding senior indebtedness (comprised of revolving credit facility borrowings) and $123.3 million in fixed rate Convertible Debentures. A 100 basis point change in interest rates, with all other variables held constant, applied to the outstanding credit facility borrowings as at June 30 , 2017 , would result in an annual change in interest expense and a corresponding change in cash flows of approximately $ 1 . 7 million . Foreign Currency Exchange Risk The Company has not entered into any hedge arrangement with respect to the principal payments of the Convertible Debentures upon maturity. Company uses cash flows from its Canadian operations to partially mitigate the exchange rate risk on the Convertible Debentures interest payments. The Company prepares its financial statements in U.S. dollars. In connection with the Company’s Canadian operations, approximately 12.8% of the Company’s consolidated income before taxes are incurred in Canadian dollars. The results of the Canadian operations are translated into U.S. dollars for financial statement reporting purposes. Changes in the Canadian dollar / U.S. dollar currency exchange rate from period to period will impact the translated U.S. dollar equivalent results of the Canadian operations. The Company recorded a gain of $0.1 million on the translation of the Canadian operations into U.S dollars for the year ended June 30, 2017. The Company recorded a loss of $0.1 million for the year ended June 30, 2017 on the translation of its monthly dividends into U.S. dollars. Both of these transactions are recorded in foreign currency loss in the consolidated statements of operations. Equity Risk In April 2016, the Company entered into an equity hedge with a major Canadian bank to partially mitigate changes in the liability associated with the Class B shares which were outstanding pursuant to the Company’s EIP plan. The Company is in the process of unwinding the equity hedge as the Class B shares are no longer outstanding. Approximately 8% of the shares initiated in connection with the hedge remain outstanding as at June 30, 2017. The equity hedge has not been designated as a hedge for accounting purposes, therefore the changes in fair value of the equity hedge are recorded in the consolidated statement of operations as a component of other income. For the year ended June 30, 2017, the Company recorded a gain of $2.0 million which consisted of both realized gains on the partial liquidation of the hedge as well as changes in the fair market value of the remaining hedge. The Company recorded a non cash gain of $1.1 million for the year ended June 30,
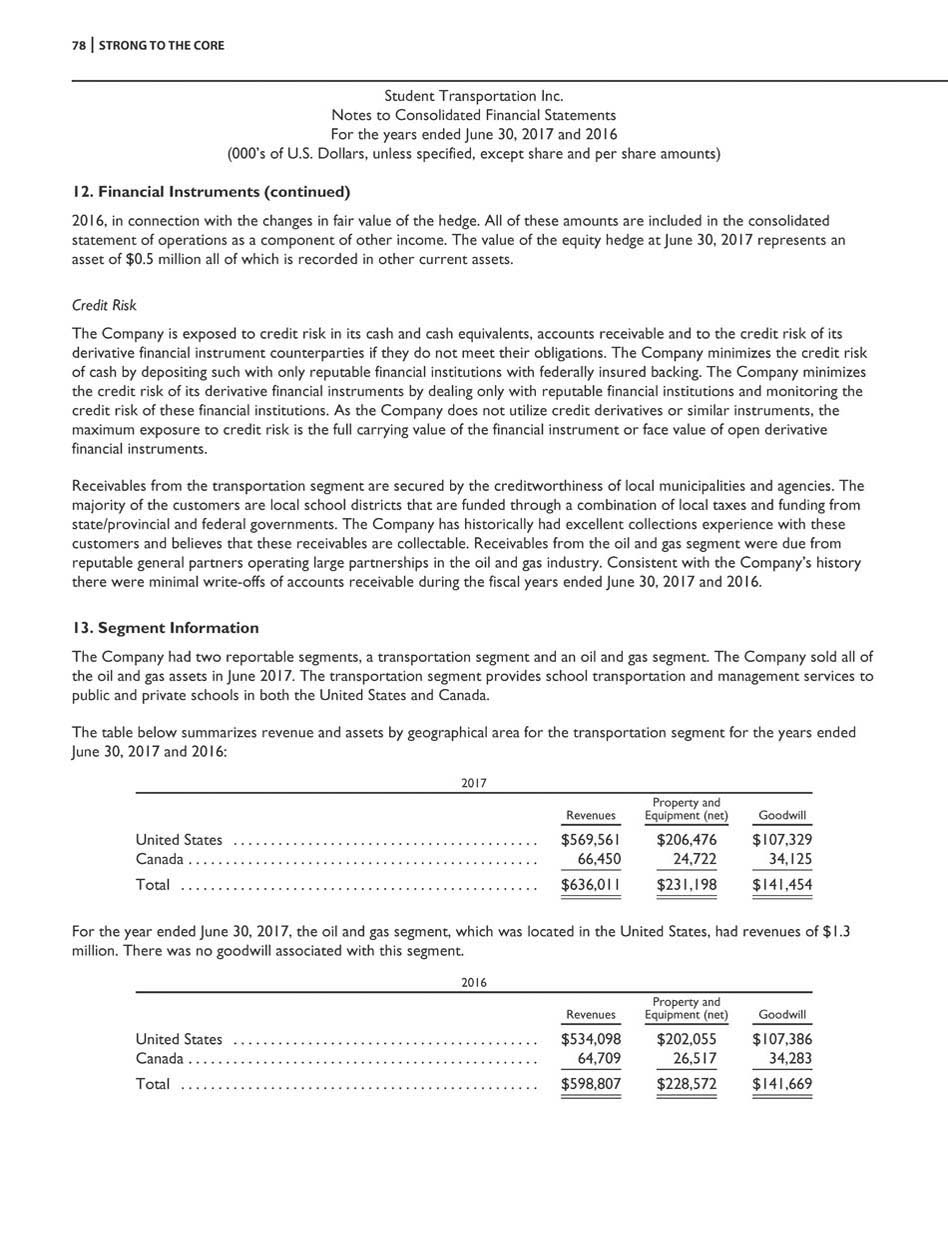
78 STRONG TO THE CORE Student Transportation Inc. Notes to Consolidated Financial Statements For the years ended June 30, 2017 and 2016 (000’s of U.S. Dollars, unless specified, except share and per share amounts) 12. Financial Instruments (continued) 2016, in connection with the changes in fair value of the hedge. All of these amounts are included in the consolidated statement of operations as a component of other income. The value of the equity hedge at June 30, 2017 represents an asset of $0.5 million all of which is recorded in other current assets. Credit Risk The Company is exposed to credit risk in its cash and cash equivalents, accounts receivable and to the credit risk of its derivative financial instrument counterparties if they do not meet their obligations. The Company minimizes the credit risk of cash by depositing such with only reputable financial institutions with federally insured backing. The Company minimizes the credit risk of its derivative financial instruments by dealing only with reputable financial institutions and monitoring the credit risk of these financial institutions. As the Company does not utilize credit derivatives or similar instruments, the maximum exposure to credit risk is the full carrying value of the financial instrument or face value of open derivative financial instruments. Receivables from the transportation segment are secured by the creditworthiness of local municipalities and agencies. The majority of the customers are local school districts that are funded through a combination of local taxes and funding from state/provincial and federal governments. The Company has historically had excellent collections experience with these customers and believes that these receivables are collectable. Receivables from the oil and gas segment were due from reputable general partners operating large partnerships in the oil and gas industry. Consistent with the Company’s history there were minimal write - offs of accounts receivable during the fiscal years ended June 30, 2017 and 2016. 13. Segment Information The Company had two reportable segments, a transportation segment and an oil and gas segment . The Company sold all of the oil and gas assets in June 2017 . The transportation segment provides school transportation and management services to public and private schools in both the United States and Canada . The table below summarizes revenue and assets by geographical area for the transportation segment for the years ended June 30, 2017 and 2016: 2017 Revenues Property and Equipment (net) Goodwill United States ......................................... $569,56 1 $206,476 $107,32 9 Canada ............................................... 66,450 24,722 34,125 Total ................................................ $636,01 1 $231,198 $141,45 4 For the year ended June 30, 2017, the oil and gas segment, which was located in the United States, had revenues of $1.3 million. There was no goodwill associated with this segment. 2016 Revenues Property and Equipment (net) Goodwill United States ......................................... $534,09 8 $202,055 $107,38 6 Canada ............................................... 64,709 26,517 34,283 Total ................................................ $598,80 7 $228,572 $141,66 9

STRONG TO THE CORE 79 Student Transportation Inc. Notes to Consolidated Financial Statements For the years ended June 30, 2017 and 2016 (000’s of U.S. Dollars, unless specified, except share and per share amounts) 13. Segment Information (continued) For the year ended June 30, 2016, the oil and gas segment, which was located in the United States, had revenues of $1.4 million and net oil and gas interests of $5.4 million. There was no goodwill associated with this segment. The accounting policies of the segments are the same as those described in the basis of presentation. There are no inter - segment sales. Reportable operating segments: 2017 2016 Revenue Transportation ................................. $636,011 $598,807 Oil and gas .................................... 1,306 1,387 $637,317 $600,194 Operating earnings (losses) Transportation ................................. $ 28,548 $ 26,733 Oil and gas .................................... (783) (3,137) 27,765 23,596 Loss on disposal of oil and gas assets ................... 1,359 — Unallocated expenses ................................ 15,280 14,721 Tax expense ....................................... 4,666 2,838 Net Income ........................................ $ 6,460 $ 6,037 Capital Expenditures Transportation ................................. $ 34,326 $ 66,642 Oil and gas .................................... 197 375 $ 34,523 $ 67,017 Depreciation, depletion and amortization Transportation ................................. $ 49,726 $ 50,194 Oil and gas .................................... 672 967 $ 50,398 $ 51,161 * The oil and gas operating results include impairment charges of $0.2 million and $1.6 million for fiscal years 2017 and 2016, respectively. 14. Lease Commitments The Company leases certain facilities under non - cancelable operating leases. Rent expense associated with the leases facilities totaled $15.4 million and $14.8 million for the years ended June 30, 2017 and 2016, respectively. The Company also leases certain school vehicles under non - cancelable operating leases. Operating lease expense associated with these leased school vehicles totaled $41.4 million and $36.8 million for the years ended June 30, 2017 and 2016, respectively. The terms of these and other leases expire at various times through 2023.

80 STRONG TO THE CORE Student Transportation Inc. Notes to Consolidated Financial Statements For the years ended June 30, 2017 and 2016 (000’s of U.S. Dollars, unless specified, except share and per share amounts) 14. Lease Commitments (continued) The following represent future minimum rental payments and operating lease payments under non cancelable operating leases: Facility Leases Vehicle Leases Total Year ending June 30, 2018 ..................................................... $16,07 0 $ 39,902 $ 55,972 2019 ..................................................... 10,619 35,626 46,245 2020 ..................................................... 6,771 29,436 36,207 2021 ..................................................... 4,680 18,384 23,064 2022 ..................................................... 2,763 8,093 10,856 2023 and thereafter ........................................ 2,080 71 2,151 Total minimum payments ................................... $42,98 3 $131,51 2 $174,49 5 15. Employee Benefit Plans The Company has a qualified defined contribution benefit plan, which allows for voluntary pre - tax contributions by the employees. The Company makes a matching contribution on behalf of the employees. The Company incurred $0.7 million and $0.6 million in expenses related to the plan for the year ended June 30, 2017 and 2016, respectively. 16. Commitments and Contingencies The Company is subject to certain claims and lawsuits arising in the normal course of business, most of which involve claims for personal injury and property damage incurred in connection with its operations. The Company maintains automobile, workers’ compensation and general liability insurance coverage with deductible amounts for each incident that is the financial responsibility of the Company. The Company accrues for estimated deductible amounts when the incident occurs. The Company’s insurance program is designed to minimize the financial risk associated with claims. The primary risks in the Company’s operations are bodily injury and property damage to third parties. In the opinion of management, uninsured losses related to deductible amounts resulting from the ultimate resolution of these matters will not have a material effect on the Company’s financial position, results of operations or cash flows. As part of collateral agreements supporting its insurance programs, the Company had $1.2 million and $1.0 million of letters of credit outstanding at June 30, 2017 and 2016, respectively and $0.9 million of cash deposits at both June 30, 2017 and 2016, respectively which are included in other assets in the consolidated balance sheet. Certain of the Company’s contracts contain performance or surety bond requirements. These bonds are written by certified surety underwriters. For the most recent fiscal year, outstanding performance bonds aggregated $72.7 million. There are no collateral requirements for these surety bonds.

STRONG TO THE CORE 81 Student Transportation Inc. Notes to Consolidated Financial Statements For the years ended June 30, 2017 and 2016 (000’s of U.S. Dollars, unless specified, except share and per share amounts) 17. Additional Financial Information Select additional financial information consists of the following: At June 30 2017 2016 Prepaid Expenses Prepaid Insurance ......................................... $12,62 5 $10,069 Other ................................................... 4,355 4,261 $16,98 0 $14,330 Other Current Assets Fuel Tax Receivable ........................................ $ 1,482 $ 2,152 Equity Hedge ............................................. 485 — Other ................................................... 1,918 1,064 $ 3,885 $ 3,216 Accrued Expenses and Accounts Payable Accrued Accounts Payable .................................. $12,30 2 $ 8,914 Dividends Payable ......................................... 13,877 13,480 Insurance ................................................ 13,525 11,630 Wages and Benefits ........................................ 6,664 8,729 Class B Shares ............................................ — 7,681 Taxes Payable ............................................. 1,315 1,586 Deferred Revenue ......................................... 577 621 Accrued Fixed Assets ...................................... 17,194 306 Other ................................................... 5,013 2,317 $70,46 7 $55,264 Other Liabilities Insurance ................................................ $19,02 5 $18,522 Other ................................................... 1,556 2,026 $20,58 1 $20,548 18. Subsequent Events On August 23, 2017, the Company closed its acquisition of all of the outstanding common stock of Annapolis Bus Company, Inc. and Towne Transport LLC, (“Annapolis”) located in Annapolis, Maryland for approximately $10.0 million, consisting of $8.5 million in cash $0.5 million in deferred payments and $1.0 million in common stock.
to proactively reviewing and updating all policies and practices to stay ahead of regulatory demands and investor expectations. STI’s Board consists of eight directors; seven are independent of management. The Board follows a mandate that clearly DEÚNES ITS ROLES AND RESPONSIBILITIES IN OVERSEEING THE #OMPANY'S STRATEGY, MANAGEMENT TEAM, ÚNANCIAL REPORTING AND GOVERNANCE. 4HE REMAINING INFORMATION ABOUT OUR #ORPORATE 'OVERNANCE 0OLICIES AND "OARD MEMBERS CAN BE FOUND ON OUR WEBSITE AT HTTP://WWW.RIDESTBUS.COM/GOVERNANCE.CFM. CORPORATE GOVERNANCE Student Transportation Inc.’s (STI) Board of Directors is dedicated to the highest standards of corporate governance. Our Board believes that sound corporate governance practices are in the interest of shareholders and contribute to prudent and effective decision - making. The Board understands that earning the trust of investors comes from demonstrated honesty and transparency. As such, the Board is fully committed to a comprehensive corporate governance strategy that promotes the Company’s LONG - TERM WELL - BEING AND SUSTAINABILITY FOR THE BENEÚT OF THE shareholders. The corporate governance policies and practices are SUBSTANTIALLY COMPLIANT WITH .ATIONAL 0OLICY 58k201, THE guidelines of the Canadian Securities Administrators. The Board has monitored ongoing developments in the area OF CORPORATE GOVERNANCE BEST PRACTICES AND IS COMMITTED 82 | STRONG TO THE CORE
C ORPOR A TE DIRECTORY BOARD OF DIRECTORS Denis J. Gallagher, Chairman Irving R. Gerstein, Lead Director, CNCG Chair Barbara Basney Kenneth B. Needler David Scopelliti Wendi Sturgis, ITC Committee Chair George Rossi, Audit Committee Chair Victor Wells CORPORATE OFFICE Student Transportation Inc. Student Transportation of Canada 160 Saunders Road, Unit 6 Barrie, Ontario L4N 9A4 Canada EXECUTIVE OFFICE Student Transportation of America 3349 Highway 138 Building A, Suite C Wall, New Jersey 07719 1 - 888 - 942 - 2250 INNOVATION & TECHNOLOGY OFFICE 885 Island Park Drive Suite 210 Charleston, SC 29492 1 - 855 - 884 - 2720 TIG@ridesta.com SENIOR MANAGEMENT TEAM Denis J. Gallagher Chairman of the Board and Chief Executive Officer Patrick J. Walker Executive Vice President and Chief Financial Officer Patrick Vaughan President, School Transportation Group Thomas Kominsky Chief Growth Officer John DiMaiolo Chief Accounting Officer Paula Altieri Vice President and Corporate Controller Keith Engelbert Chief Technology Officer INDEPENDENT REGISTERED PUBLIC ACCOUNTING FIRM Ernst & Young LLP Iselin, New Jersey TRANSFER AGENT & REGISTRAR Computershare Trust Company 100 University Ave., 8th Floor Toronto, Ontario M5J 2Y1 1 - 800 - 564 - 6253 LEGAL COUNSEL Goodmans LLP Toronto, Ontario Thompson Coburn LLP Chicago, Illinois INVESTOR RELATIONS OFFICE 885 Island Park Drive Suite 210 Charleston, SC 29492 Doug Coupe 1 - 843 - 884 - 2720 invest@rideSTBus.com www.rideSTBus.com ANNUAL MEETING Thursday, November 9, 2017 2:00 p.m. ET TSX Broadcast & Conference Centre 130 King Street West Toronto, Ontario
STRONG TO THE CORE 2017 ANNUAL REPORT Ride STB us.com