UNITED STATES SECURITIES AND EXCHANGE COMMISSION
Washington, D.C. 20549
______________________________________________________
FORM 10-K
(Mark One)
|
| |
| x | ANNUAL REPORT PURSUANT TO SECTION 13 OR 15(d) OF THE SECURITIES EXCHANGE ACT OF 1934 |
For the fiscal year ended June 30, 2019
OR
|
| |
| ¨ | TRANSITION REPORT PURSUANT TO SECTION 13 OR 15(d) OF THE SECURITIES EXCHANGE ACT OF 1934 |
For the transition period from __________ to __________
Commission file number 1-1370
BRIGGS & STRATTON CORPORATION
(Exact name of registrant as specified in its charter)
|
| | |
| Wisconsin | | 39-0182330 |
| (State or other jurisdiction of incorporation or organization) | | (I.R.S. Employer Identification No.) |
12301 West Wirth Street, Wauwatosa, Wisconsin 53222
(Address of Principal Executive Offices) (Zip Code)
Registrant’s telephone number, including area code: 414-259-5333
Securities registered pursuant to Section 12(b) of the Act:
|
| | |
| Title of Each Class | Trading Symbol(s) | Name of Each Exchange on Which Registered |
| Common Stock (par value $0.01 per share) | BGG | New York Stock Exchange |
| | | |
Securities registered pursuant to Section 12(g) of the Act: None
Indicate by check mark if the registrant is a well-known seasoned issuer, as defined in Rule 405 of the Securities Act. Yes o No x
Indicate by check mark if the registrant is not required to file reports pursuant to Section 13 or Section 15(d) of the Act. Yes o No x
Indicate by check mark whether the registrant (1) has filed all reports required to be filed by Section 13 or 15(d) of the Securities Exchange Act of 1934 during the preceding 12 months (or for such shorter period that the registrant was required to file such reports), and (2) has been subject to such filing requirements for the past 90 days. Yes x No o
Indicate by check mark whether the registrant has submitted electronically every Interactive Data File required to be submitted pursuant to Rule 405 of Regulation S-T during the preceding 12 months (or for such shorter period that the registrant was required to submit and post such files). Yes x No o
Indicate by check mark whether the registrant is a large accelerated filer, an accelerated filer, a non-accelerated filer, a smaller reporting company, or an emerging growth company. See the definitions of “large accelerated filer,” “accelerated filer,” “smaller reporting company” and "emerging growth company" in Rule 12b-2 of the Exchange Act. (Check one):
|
| | | |
| Large accelerated filer | x | Accelerated filer | ¨ |
| Non-accelerated filer | ¨ | Smaller reporting company | ¨ |
| | | Emerging growth company | ¨ |
If an emerging growth company, indicate by check mark if the registrant has elected not to use the extended transition period for complying with any new or revised financial accounting standards provided pursuant to Section 13(a) of the Exchange Act. o
Indicate by check mark whether the registrant is a shell company (as defined in Rule 12b-2 of the Exchange Act). Yes o No x
The aggregate market value of Common Stock held by nonaffiliates of the registrant was approximately $561.6 million based on the last reported sale price of such securities as of December 30, 2018, the last business day of the most recently completed second fiscal quarter.
Number of Shares of Common Stock Outstanding at August 16, 2019: 42,055,973.
DOCUMENTS INCORPORATED BY REFERENCE
Part III incorporates information by reference from the definitive proxy statement for the Annual Meeting to be held on October 31, 2019.
BRIGGS & STRATTON CORPORATION
FISCAL 2019 FORM 10-K
TABLE OF CONTENTS |
| | |
| PART I | Page |
| Item 1. | | |
| Item 1A. | | |
| Item 1B. | | |
| Item 2. | | |
| Item 3. | | |
| Item 4. | | |
| | | |
| PART II | |
| Item 5. | | |
| Item 6. | | |
| Item 7. | | |
| Item 7A. | | |
| Item 8. | | |
| Item 9. | | |
| Item 9A. | | |
| Item 9B. | | |
| PART III | |
| Item 10. | | |
| Item 11. | | |
| Item 12. | | |
| Item 13. | | |
| Item 14. | | |
| PART IV | |
| Item 15. | | |
| Item 16. | | |
| | | |
Cautionary Statement on Forward-Looking Statements
This report contains certain forward-looking statements that involve risks and uncertainties that could cause actual results to differ materially from those projected in the forward-looking statements. The words "anticipate", “believe”, “estimate”, “expect”, “forecast”, “intend”, “plan”, “project”, and similar expressions are intended to identify forward-looking statements. The forward-looking statements are based on the Company’s current views and assumptions and involve risks and uncertainties that include, among other things, the ability to successfully forecast demand for its products; changes in interest rates and foreign exchange rates; the effects of weather on the purchasing patterns of consumers and original equipment manufacturers (OEMs); actions of engine manufacturers and OEMs with whom the Company competes; changes in laws and regulations; changes in customer and OEM demand; changes in prices of raw materials and parts that the Company purchases; changes in domestic and foreign economic conditions (including effects from the U.K.’s decision to exit the European Union); the ability to bring new productive capacity on line efficiently and with good quality; outcomes of legal proceedings and claims; the ability to realize anticipated savings from restructuring actions; and other factors disclosed from time to time in its SEC filings or otherwise, including the factors discussed in Item 1A, Risk Factors, of this Annual Report on Form 10-K and in the Company's periodic reports on Form 10-Q. The Company is not undertaking any obligation to update forward-looking statements or other statements it may make even though these statements may be affected by events or circumstances occurring after the forward-looking statements or other statements were made.
PART I
Briggs & Stratton Corporation ("Briggs & Stratton" or the “Company”) is focused on providing power to get work done and make people's lives better. Briggs & Stratton is the world’s largest producer of gasoline engines for outdoor power equipment, and is a leading designer, manufacturer and marketer of power generation, pressure washer, lawn and garden, turf care and job site products through its Briggs & Stratton®, Simplicity®, Snapper®, Ferris®, Vanguard®, Allmand®, Billy Goat®, Hurricane®, Murray®, Branco® and Victa® brands. Briggs & Stratton products are designed, manufactured, marketed and serviced in over 100 countries on six continents.
The Company conducts its operations in two reportable segments: Engines and Products. Further information about Briggs & Stratton’s business segments is contained in Note 9 of the Notes to Consolidated Financial Statements.
The Company’s internet address is www.basco.com. The Company makes available free of charge (other than an investor’s own internet access charges) through its internet website the Company’s Annual Report on Form 10-K, quarterly reports on Form 10-Q, current reports on Form 8-K, and amendments to those reports filed or furnished pursuant to Section 13(a) or 15(d) of the Securities Exchange Act of 1934, as soon as reasonably practicable after it electronically files such material with, or furnishes such material to, the Securities and Exchange Commission. Charters of the Audit, Compensation, Finance, and Nominating and Governance Committees, Corporate Governance Guidelines, Stock Ownership Guidelines and code of business conduct and ethics contained in the Briggs & Stratton Integrity Manual are available on the Company’s website and are available in print to any shareholder upon request to the Corporate Secretary. The information contained on and linked from the Company's website is not incorporated by reference into this Annual Report on Form 10-K.
Engines Segment
General
Briggs & Stratton manufactures four-cycle aluminum alloy gasoline engines with gross horsepower ranging from 2.5hp up to 40hp and torque ranging from 4.50 ft-lbs gross torque to 21.00 ft-lbs gross torque. The Company’s engines are used primarily by the lawn and garden equipment industry, which accounted for 89% of the Engines segment's fiscal 2019 engine sales to OEMs. Major lawn and garden equipment applications include walk-behind lawn mowers, riding lawn mowers, garden tillers and snow throwers. The remaining 11% of engine sales to OEMs in fiscal 2019 was for use on products for industrial, construction, agricultural and other commercial and consumer applications that include portable and standby generators, pumps and pressure washers. Many retailers specify the Company's engines on the power equipment they sell and the Briggs & Stratton logo is often featured prominently on a product because of the appeal and reputation of the brand. The Company mainly sells commercial engines under the Vanguard® name.
In fiscal 2019, approximately 30% of the Engines segment net sales was derived from sales in international markets, primarily to customers in Europe. The Company serves its key international markets through its European regional office in Switzerland, its distribution center in the Netherlands and sales and service subsidiaries in Australia, Austria, Brazil, Canada, China, the Czech Republic, England, France, Germany, India, Italy, Japan, Malaysia, Mexico, New Zealand, Russia, South Africa, Spain, and Sweden. Briggs & Stratton is a leading supplier of gasoline engines in developed countries where there is an established lawn and garden equipment market. Briggs & Stratton also exports engines to developing nations where its engines are used in agricultural, marine, construction and other applications. More information about its foreign operations is in Note 9 of the Notes to Consolidated Financial Statements.
The Company's engines are sold primarily by its worldwide sales force through direct interaction with customers. The Company’s marketing staff and engineers provide support and technical assistance to its sales force.
The Engines segment also manufactures replacement engines and service parts and sells them to sales and service distributors. The Company owns 38% of Power Distributors LLC, a joint venture with a national
distribution network of service parts in the United States. The Company's remaining domestic distributors are independently owned and operated.
The Company owns its principal international distribution centers, but also uses independently owned and operated distributors. These distributors supply service parts and replacement engines directly to independently owned, authorized service dealers throughout the world. These distributors and service dealers incorporate the Company’s commitment to reliability and service.
Customers
The Company's engine sales are primarily to OEMs. The Company's major external engine customers in fiscal years 2019, 2018 and 2017 were MTD Products Inc. (MTD), Husqvarna Outdoor Products Group (HOP), Deere & Company, and Power Distributors, LLC. Engines segment sales to the top three customers combined were 44%, 42% and 47% of Engines segment sales in fiscal 2019, 2018 and 2017, respectively. Under purchasing plans available to all of its gasoline engine customers, Briggs & Stratton typically enters into annual engine supply arrangements. In certain cases, the Company has entered into longer supply arrangements of two to three years.
The Company believes that in fiscal 2019 approximately 71% of all residential lawn and garden powered equipment sold in the United States was sold through mass merchandisers such as The Home Depot, Inc. (The Home Depot), Lowe’s Companies, Inc. (Lowe’s), Sears Holdings Corporation (Sears) and Wal-Mart Stores, Inc. (Wal-Mart). Given the buying power of the mass merchandisers, Briggs & Stratton, through its customers, has continued to experience pricing pressure; however, the development of new and innovative products may assist the Company and its customers in realizing higher margins. The Company believes commercial engines are mainly sold through independent dealer networks.
Competition
The Company’s major competitors in engine manufacturing are Honda Motor Co., Ltd. (Honda), Kawasaki Heavy Industries, Ltd. (Kawasaki) and Kohler Co. (Kohler). Several Japanese and Chinese small engine manufacturers, of which Honda and Kawasaki are the largest, compete directly with the Company in world markets in the sale of engines to other OEMs and indirectly through their sale of end products.
The Company believes it has a significant share of the worldwide market for engines that power residential outdoor equipment.
The Company believes the major areas of competition from all engine manufacturers include product quality, brand, price, delivery and service. Other factors affecting competition are short-term market share objectives, short-term profit objectives, exchange rate fluctuations, technology, new product innovation, product support, distribution strength, and advertising. The Company believes its technology, product value, distribution, marketing, and service reputation have given it strong brand name recognition and enhanced its competitive position.
Seasonality of Demand
Sales of engines to lawn and garden OEMs are highly seasonal because of consumer buying patterns. The majority of lawn and garden equipment is sold during the spring and summer months when most lawn care and gardening activities are performed. Sales of lawn and garden equipment are also influenced by consumer sentiment, employment levels, new and existing home sales and weather conditions. Engine sales in the Company’s third fiscal quarter have historically been the highest, while sales in the first fiscal quarter have historically been the lowest.
In order to efficiently use its capital investments and meet seasonal demand for engines, the Company pursues a relatively balanced production schedule throughout the year. The schedule is adjusted to reflect changes in estimated demand, customer inventory levels and other matters outside the control of the Company. Accordingly, inventory levels generally increase during the first and second fiscal quarters in anticipation of customer demand. Inventory levels begin to decrease as sales increase in the third fiscal quarter. This seasonal pattern results in high inventories and low cash flow for the Company in the first, second and the beginning of the third fiscal quarters. The pattern generally results in higher cash flow in the
latter portion of the third fiscal quarter and in the fourth fiscal quarter as inventories are liquidated and receivables are collected.
Manufacturing
The Company manufactures engines and parts at the following locations: Auburn, Alabama; Statesboro, Georgia; Murray, Kentucky; Poplar Bluff, Missouri; Wauwatosa, Wisconsin; and Chongqing, China. Briggs & Stratton has a parts distribution center in Menomonee Falls, Wisconsin and Wijchen, Netherlands. The Engines segment also purchases certain products under contract manufacturing agreements.
The Company manufactures a majority of the structural components used in its engines, including aluminum die castings, carburetors and ignition systems. The Company purchases certain parts such as piston rings, spark plugs, valves, ductile and grey iron castings, plastic components, some stampings and screw machine parts and smaller quantities of other components. Raw material purchases consist primarily of aluminum and steel. The Company believes its sources of supply are adequate.
The Company has joint ventures with Daihatsu Motor Company for the manufacture of engines in Japan, and with Starting Industrial of Japan for the production of rewind starters and punch pressed components in the United States. During fiscal 2018, the Company announced its business optimization program. The program included, among other things, moving production of larger commercial engines, which were sourced from the joint venture with Daihatsu Motor Company, to two of its existing U.S. plants. Production of Vanguard engines in the Company’s U.S. plants began in the fourth quarter of fiscal 2018 and additional lines were phased in by the end of the fiscal 2019.
On August 15, 2019, the Company announced a plan to consolidate the Company’s production of small vertical shaft engines into its Poplar Bluff, Missouri facility. This decision was made after a comprehensive evaluation of the Company’s manufacturing operations. The Company’s Murray, Kentucky facility currently manufactures small vertical shaft engines and will be closed as a result of this consolidation.
Products Segment
General
The Products segment’s principal product lines include lawn and garden power equipment, turf care products, portable and standby generators, pressure washers, snow throwers, and job site products. The Products segment sells its products primarily through multiple channels of retail distribution, including consumer home centers, warehouse clubs, mass merchants, independent dealers and distributors, and on-line merchants. The Company sells its lawn and garden products, turf care products, snow throwers, and standby generators primarily through an independent dealer network and sells its pressure washers and portable generators primarily through the U.S. mass retail channel. To support its international business, the Products segment has leveraged the existing Briggs & Stratton worldwide distribution network and regional sales offices. The Company sells its job site products primarily into the rental channel to the construction and infrastructure, mining and oil & gas industries.
Beginning in fiscal 2014, the Company joined with one of its independent distributors to form Power Distributors, LLC to distribute certain service parts in the United States. During fiscal years 2014 through 2016, the venture acquired other independent distributors. In fiscal 2016, the venture achieved a national distribution network.
The Products segment product lines are marketed under its own brands such as Briggs & Stratton®, Simplicity®, Snapper®, Snapper Pro®, Ferris®, Allmand®, Billy Goat®, Hurricane®, Murray®, Branco® and Victa®, as well as other brands such as Craftsman and Troy-Bilt.
Customers
Historically, the Products’ segment major customers have included Lowe’s, Sears, PACE Inc., The Home Depot, Bunnings Warehouse, as well as numerous other distributors and dealers. Sales to the top three customers combined were 29%, 24% and 25% of Products segment net sales in fiscal 2019, 2018 and 2017, respectively. Commercial mowers are primarily sold through independent dealers.
Competition
The principal competitive factors in the outdoor power products industry include price, service, product performance, brand, innovation and delivery. The Products segment has various competitors, depending on the type of equipment. Primary competitors include: Honda (portable generators, pressure washers and lawn and garden equipment), Generac Power Systems, Inc. (portable and standby generators and job site products), Alfred Karcher GmbH & Co. (pressure washers), Techtronic Industries (pressure washers and portable generators), Deere & Company (commercial and consumer lawn mowers), MTD (consumer lawn mowers), The Toro Company (commercial and consumer lawn mowers), Scag Power Equipment, a Division of Metalcraft of Mayville, Inc. (commercial lawn mowers), and HOP (commercial and consumer lawn mowers).
Seasonality of Demand
A significant portion of Products’ sales are subject to seasonal patterns. Due to seasonal and regional weather factors, sales of pressure washers and lawn and garden powered equipment are typically higher during the third and fourth fiscal quarters than at other times of the year. Sales of portable generators and snow throwers are typically higher during the first and second fiscal quarters and can spike during weather related power outage events.
Manufacturing
The Products segment's manufacturing facilities are located in Sherrill, New York; Munnsville, New York; Wauwatosa, Wisconsin; Holdrege, Nebraska; Lee's Summit, Missouri; and Kemps Creek, Australia. The Products segment also purchases certain powered equipment under contract manufacturing agreements.
The Products segment manufactures core components for its products, where such integration improves operating profitability by providing lower costs.
The Products segment purchases engines from the Engines segment, as well as from Honda, Kawasaki and Kohler. The Products segment has not typically experienced any difficulty obtaining necessary engines or other purchased components.
The Products segment assembles products for the international markets at its U.S. and Australian locations and through contract manufacturing agreements with other OEMs and suppliers.
During fiscal 2018, the Company announced its business optimization program. The program included, among other things, expanding capacity and moving the commercial turf equipment operation into a larger, more efficient facility in Sherrill, New York close to the facility in Munnsville, New York. Production of Ferris commercial mowers began in the new facility in the fourth quarter of fiscal 2018 and all remaining production was transitioned in the third quarter of fiscal 2019.
Consolidated
General Information
The Company holds patents on features incorporated in its products; however, the success of the Company’s business is not considered to be primarily dependent upon patent protection. The Company owns several trademarks which it believes significantly affect a consumer’s choice of outdoor powered equipment and job site products, and therefore create value. Licenses, franchises and concessions are not a material factor in the Company’s business.
For the fiscal years ended June 30, 2019, July 1, 2018 and July 2, 2017, the Company spent approximately $22.8 million, $23.6 million and $23.0 million, respectively, on research activities relating to the development of new products or the improvement of existing products.
The average number of persons employed by the Company during fiscal 2019 and fiscal 2018 was 5,251 and 5,258, respectively. Employment in fiscal 2019 ranged from a high of 5,341 in December 2019 to a low of 5,152 in August 2018.
Export Sales
Export sales for fiscal 2019, 2018 and 2017 were $316.1 million (17% of net sales), $324.4 million (17% of net sales), and $337.1 million (19% of net sales), respectively. These sales were principally to customers in Europe, Asia, Australia, and Canada.
Refer to Note 9 of the Notes to Consolidated Financial Statements for financial information about geographic areas. Also, refer to Item 7A of this Form 10-K and Note 15 of the Notes to Consolidated Financial Statements for information about Briggs & Stratton’s foreign exchange risk management.
In addition to the risks referred to elsewhere in this Annual Report on Form 10-K, the following risks, among others, may have affected, and in the future could materially affect, the Company and its subsidiaries’ business, financial condition or results of operations.
Demand for products fluctuates significantly due to seasonality. In addition, changes in the weather and consumer confidence impact demand.
Sales of our products are subject to seasonal and consumer buying patterns. Consumer demand in our markets can be reduced by unfavorable weather and weak consumer confidence. Although we manufacture throughout the year, our sales are concentrated in the second half of our fiscal year. This operating method requires us to anticipate demand of our customers many months in advance. If we overestimate or underestimate demand during a given year, we may not be able to adjust our production quickly enough to avoid excess or insufficient inventories, and that may in turn limit our ability to maximize our potential sales or maintain optimum working capital levels.
We have only a limited ability to pass through cost increases in our raw materials to our customers during the year.
We generally enter into annual purchasing plans with our largest customers, so our ability to raise our prices during a particular year to reflect increased raw materials costs is limited.
A significant portion of our net sales comes from major customers and the loss of any of these customers would negatively impact our financial results.
In fiscal 2019, our three largest customers accounted for 27% of our consolidated net sales. The loss of any of these customers or a significant portion of the business from one or more of our key customers would significantly impact our net sales and profitability.
A significant change or disruption in the U.S. retail market for lawn and garden products could have an adverse impact on our business.
The retail market in the U.S. for lawn and garden products is concentrated with a few large traditional retailers. A disruption or significant change at any of these large traditional retailers could have an adverse impact on our customers and on our business.
Changes in environmental, tax, health care or other laws and regulations could require extensive changes in our operations or to our products.
Our operations and products are subject to a variety of foreign, federal, state and local laws and regulations governing, among other things, emissions to air, discharges to water, noise, the generation, handling, storage, transportation, treatment and disposal of waste and other materials and health and safety matters as well as taxes, health care and data privacy. We do not expect these laws and regulations to have an adverse effect on us, but we cannot be certain that these or proposed changes in other applicable laws or regulations, or their enforcement, will not adversely affect our business or financial condition in the future.
Our international operations are subject to risks and uncertainties, which could adversely affect our business or financial results.
In fiscal 2019, we derived approximately 26% of our consolidated net sales from international markets, primarily Europe. Our international operations are subject to various economic, political, and other risks and uncertainties that could adversely affect our business and operating results, including, but not limited to, regional or country specific economic downturns, fluctuations in currency exchange rates, trade protection measures, tariffs, and other border taxes, labor practices, complications in complying with, or exposure to liability under, a variety of laws and regulations, including anti-corruption and export control laws and regulations, political instability and significant natural disasters and other events or factors impacting local infrastructure.
Actions of our competitors could reduce our sales or profits.
Our markets are highly competitive and we have a number of significant competitors in each market. Competitors may reduce their costs, lower their prices or introduce innovative products that could adversely affect our sales or profits. In addition, our competitors may focus on reducing our market share to improve their results.
We are restricted by the terms of the outstanding Senior Notes and our other debt, which could adversely affect us.
The indenture relating to the Senior Notes and our multicurrency credit agreement include a number of financial and operating restrictions, which may prevent us from capitalizing on business opportunities and taking some corporate actions. These covenants could adversely affect us by limiting our ability to plan for or react to market conditions or to meet our capital needs. These covenants include, among other things, restrictions on our ability to:
| |
| • | pay dividends, redeem stock or make other distributions; |
| |
| • | make certain investments; |
| |
| • | transfer or sell assets; |
| |
| • | merge or consolidate; and |
| |
| • | enter into transactions with our affiliates. |
In addition, our multicurrency credit agreement contains financial covenants that, among other things, require us to maintain a minimum interest coverage ratio and impose a maximum average leverage ratio.
Our failure to comply with the restrictive covenants described above could result in an event of default, which, if not cured or waived, could result in us being required to repay these borrowings before their due date. If we are forced to refinance these borrowings on less favorable terms, our results of operations and financial condition could be adversely affected by increased costs and rates.
On August 13, 2019, we entered into a consent memorandum pursuant to our revolving multicurrency credit agreement. Pursuant to the consent memorandum, the average leverage ratio covenant will not be tested for the computation period ended June 30, 2019 and no failure (or anticipated failure) by us to comply with associated restrictions for the specified computation period will constitute (or be deemed to have constituted) a default or an event of default under the credit agreement. Additionally, no default shall be deemed to exist under the credit agreement for any anticipated failure by us to comply with such restrictions for the computation period ending on or about September 30, 2019. The Company was in compliance with all other financial covenants of the credit agreement as of June 30, 2019, and the failure or anticipated failure to comply with the average leverage ratio under the Credit Agreement is not considered to be a cross default for purposes of the Company’s Senior Notes.
Although we are in the process of refinancing our revolving credit agreement which, among other things, reduces the risk of potential violations of the covenant in the future, we cannot be sure we will not breach this or any other covenant in the future and we cannot guarantee that we will be able to refinance the revolving credit agreement with terms acceptable to us. In addition, if we borrow additional funds under the credit agreement, we may be required to increase the borrowing limit under the credit agreement or seek additional sources of borrowing. Given current credit and debt markets, there is no assurance that if we were to seek additional credit or debt, it would be available when needed or if it is available, the cost or terms and conditions would be acceptable.
Our level of debt and our ability to obtain debt financing could adversely affect our operating flexibility and put us at a competitive disadvantage.
Our level of debt and the limitations imposed on us by the indenture relating to the Senior Notes (as defined below) and our other credit agreements could have important consequences, including the following:
| |
| • | we will have to use a portion of our cash flow from operations for debt service rather than for our operations; |
| |
| • | we may not be able to obtain additional debt financing for future working capital, capital expenditures or other corporate purposes or may have to pay more for such financing; |
| |
| • | some or all of the debt under our current or future revolving credit facilities will be at a variable interest rate, making us more vulnerable to increases in interest rates; |
| |
| • | we could be less able to take advantage of significant business opportunities, such as acquisition opportunities, and to react to changes in market or industry conditions; |
| |
| • | we may be more vulnerable to general adverse economic and industry conditions; and |
| |
| • | we may be disadvantaged compared to competitors with less leverage. |
The terms of the indenture for the 6.875% Senior Notes due December 2020 (the "Senior Notes") do not fully prohibit us from incurring substantial additional debt in the future and our revolving credit facilities permit additional borrowings, subject to certain conditions. If incremental debt is added to our current debt levels, the related risks we now face could intensify.
We expect to obtain the money to pay our expenses and to pay the principal and interest on the outstanding Senior Notes, the credit facilities and other debt primarily from our operations or by refinancing some or all of our existing debt. Our ability to meet our expenses thus depends on our future performance, which will be affected by financial, business, economic and other factors. We will not be able to control many of these factors, such as economic conditions in the markets where we operate and pressure from competitors. We cannot be certain that the money we earn will be sufficient to allow us to pay principal and interest on our debt and meet our other obligations. If we do not have enough money, we may be required to refinance all or part of our existing debt, sell assets or borrow more money. We cannot guarantee that we will be able to do so on terms acceptable to us. In addition, the terms of existing or future debt agreements, including the revolving credit facilities and our indentures, may restrict us from adopting certain of these alternatives.
Disruptions caused by labor disputes or organized labor activities or an inability to acquire and retain skill sets needed could harm our business and reputation.
The Company has collective bargaining agreements with its unions. These collective bargaining agreements cover approximately 10% of the total employees as of June 30, 2019. The Labor Agreement with United Steelworkers Local 2-232 expired on July 31, 2017. The Company and the union have met and the Company implemented its final offer to the Union on June 14, 2018, but remains hopeful that the parties will continue to work together to reach a new agreement. This agreement covers 557 hourly employees in the Wauwatosa, Germantown and Menomonee Falls, Wisconsin facilities. The Company has another collective bargaining agreement with its remaining union workforce in Georgia, which expires during calendar 2020, however, it is anticipated that location will be closing in December 2019. At the present time the Company does not anticipate a work stoppage.
Worldwide economic conditions may adversely affect our industry, business and results of operations.
General worldwide economic conditions have experienced volatility in recent years due to the sequential effects of the subprime lending crisis, general credit market crisis, sovereign debt crisis, collateral effects on
the finance and banking industries, changes in energy costs, concerns about inflation, slower economic activity, decreased consumer confidence, reduced corporate profits and capital spending, adverse business conditions and liquidity concerns. These conditions make it difficult for our customers, our vendors and us to accurately forecast and plan future business activities, and they may cause U.S. and foreign OEMs and consumers to slow spending on our products. We cannot predict the timing or duration of any future economic slowdown or the timing or strength of a subsequent economic recovery, worldwide or in the specific end markets we serve. If the consumer and commercial lawn and garden markets significantly deteriorate due to these economic effects, our business, financial condition and results of operations will likely be adversely affected. Additionally, our stock price could decrease if investors have concerns that our business, financial condition and results of operations will be negatively impacted by a worldwide economic downturn.
In addition, in June 2016, the United Kingdom (the "U.K.") held a referendum in which voters approved an exit from the European Union (the "E.U."), commonly referred to as "Brexit". Negotiations between the U.K. and E.U are underway to determine the terms of Brexit. Given the lack of comparable precedent and the status of the negotiations, it is unclear what financial, trade and legal implications Brexit will have and how such withdrawal would affect us. Brexit could disrupt the free movement of goods, services and people between the U.K. and the E.U., undermine bilateral cooperation in key policy areas and significantly disrupt trade between the U.K. and the E.U. In addition, Brexit could lead to legal uncertainty and potentially divergent national laws and regulations as the U.K. determines which E.U. laws to replace or replicate. Moreover, Brexit could lead to changes in the regulatory environment for engines, and new or heightened regulatory and approval requirements may increase our expenses or limit or delay our ability to sell our engines or other products in those markets. The withdrawal of the U.K. from the E.U. may also create global economic uncertainty, which may cause our customers to closely monitor their costs and reduce their spending budgets. Any of these effects of Brexit, among others, could adversely affect our business, financial condition, operating results and cash flows.
We have goodwill and intangible assets, which were written down in fiscal 2016 and in prior years. If we determine that goodwill and other intangible assets have become further impaired in the future, net income in such years would be adversely affected.
At June 30, 2019, goodwill and other intangible assets represented approximately 17.2% of our total assets. Goodwill represents the excess of cost over the fair market value of net assets acquired in business combinations. We are required to evaluate whether our goodwill and indefinite-lived intangible assets have been impaired on an annual basis, or more frequently if indicators of impairment exist. In fiscal 2019, 2018 and fiscal 2017, there was no impairment of goodwill or other intangible assets. Estimating the fair value of individual reporting units and indefinite-lived intangible assets requires us to make assumptions and estimates regarding our future plans, as well as industry and economic conditions. These assumptions and estimates include projected net sales, operating income margin, working capital, market-based discount rates, and other market factors.
At June 30, 2019, the Job Site reporting unit had $12.0 million of goodwill, the Turf & Consumer reporting unit had $20.1 million of goodwill, and the Engines reporting unit had $137.1 million of goodwill. The Jobsite reporting unit fair value exceeded the carrying value by less than 10% as of the latest 2019 impairment testing date. The discount rate the Company used to determine the fair value was 14.3%. The Turf & Consumer reporting unit fair value exceeded the carrying value by more than 10% but less than 20% as of the latest 2019 impairment testing date. The discount rate the Company used to determine the fair value was 14.2%.The Engines reporting unit fair value exceeded the carrying value by more than 20% as of the latest 2019 impairment testing date. The discount rate the Company used to determine the fair value was 14.9%. If current expectations of future growth rates are not met or market factors outside of our control, such as discount rates, change significantly, then one or more reporting units or intangible assets might become impaired in the future. Any additional write-down of our goodwill or intangible assets could adversely affect our results of operations.
We are subject to litigation, including product liability, patent infringement, and warranty claims, that may adversely affect our business and results of operations.
We are a party to litigation that arises in the normal course of our business operations, including product warranty and liability (strict liability and negligence) claims, patent and trademark matters, contract disputes and environmental, asbestos, employment and other litigation matters. See Note 13, “Commitments and Contingencies,” to the Consolidated Financial Statements for a description of unresolved legal actions. We face an inherent business risk of exposure to product liability and warranty claims in the event that the use of our products is alleged to have resulted in injury or other damage or our products are alleged to be defective. In addition, we face an inherent risk that our competitors will allege that aspects of our product designs infringe their protected intellectual property. While we currently maintain general liability and product liability insurance coverage in amounts that we believe are adequate, we cannot be sure that we will be able to maintain this insurance on acceptable terms or that this insurance will provide sufficient coverage against potential liabilities that may arise. Any claims brought against us, with or without merit, may have an adverse effect on our business and results of operations as a result of potential adverse outcomes, the expenses associated with defending such claims, the diversion of our management’s resources and time and the potential adverse effect to our business reputation.
Our pension and postretirement benefit plan obligations are currently underfunded, and we may have to make significant cash payments to some or all of these plans, which would reduce the cash available for our businesses.
We have unfunded obligations under our domestic and foreign pension and postretirement benefit plans. As of June 30, 2019, our pension plans were underfunded by approximately $225 million. The funded status of our pension plans is dependent upon many factors, including returns on invested assets, the level of certain market interest rates, the mortality tables used, and the discount rate used to determine pension obligations. Unfavorable returns on the plan assets or unfavorable changes in applicable laws or regulations could materially change the timing and amount of required plan funding, which would reduce the cash available for our businesses. In addition, a decrease in the discount rate used to determine pension obligations could result in an increase in the valuation of pension obligations, which could affect the reported funding status of our pension plans and future contributions, as well as the periodic pension cost in subsequent fiscal years.
Our dependence on, and the price of, raw materials may adversely affect our profits.
The principal raw materials used to produce our products are aluminum and steel. We source raw materials on a global or regional basis, and the prices of those raw materials are susceptible to significant price fluctuations due to supply/demand trends, transportation costs, government regulations and tariffs, changes in currency exchange rates, price controls, the economic climate and other unforeseen circumstances. If we are unable to pass on raw material price increases to our customers, our future profitability may be adversely affected.
We may be adversely affected by health and safety laws and regulations.
We are subject to various laws and regulations relating to the protection of human health and safety and have incurred and will continue to incur capital and other expenditures to comply with these regulations. Failure to comply with regulations could subject us to future liabilities, fines or penalties or the suspension of production, as well as damage our reputation.
The operations and success of our Company can be impacted by natural disasters, terrorism, acts of war, international conflict and political and governmental actions, which could harm our business.
Natural disasters, acts or threats of war or terrorism, international conflicts and the actions taken by the United States and other governments in response to such events could cause damage or disrupt our business operations, our suppliers or our customers, and could create political or economic instability, any of which could have an adverse effect on our business. Although it is not possible to predict such events or their consequences, these events could decrease demand for our products, could make it difficult or impossible for us to deliver products or could disrupt our supply chain. We may also be impacted by actions by foreign governments, including currency devaluation, tariffs and nationalization, where our facilities, customers and/or suppliers are located. Furthermore, as a result of changes to U.S. administrative policy, there may be changes to existing trade agreements, like the North American Free Trade Agreement, greater restrictions on free trade generally, or the enactment of or increases in tariffs, which could have an adverse impact on our
operating results and financial position. Such changes to foreign or U.S. policies could also disrupt manufacturing and commercial operations. In addition, our foreign operations make us subject to certain U.S. and foreign laws and regulations, including the Export Administration Regulations administered by the U.S. Department of Commerce, the trade sanctions laws and regulations administered by the U.S. Department of the Treasury’s Office of Foreign Assets Control, the Foreign Corrupt Practices Act, and the U.K. Bribery Act. A violation of these laws and regulations could adversely affect our business, financial condition, and results of operations and reputation.
We are subject to tax laws and regulations in many jurisdictions, and the inability to successfully defend claims from taxing authorities could adversely affect our operating results and financial position.
We conduct business in many countries, which requires us to interpret the tax laws and rulings in each of those taxing jurisdictions. Due to the subjectivity of tax laws between those jurisdictions as well as the subjectivity of factual interpretations, our estimates of tax liabilities may differ from actual payments or assessments. Claims from taxing authorities related to these differences could have an adverse impact on our operating results and financial position.
If we fail to remain current with changes in gasoline engine technology or if the technology becomes less important to customers in our markets due to the impact of alternative fuels or power sources, our results may be negatively affected. In addition, if we are unable to continue to enhance existing products, as well as develop and market new products, that respond to customer needs and preferences and achieve market acceptance, our results may be negatively impacted.
Our ability to remain current with changes in gasoline engine technology may significantly affect our business. Any advances in gasoline engine technology, including the impact of alternative fuels or power sources, may inhibit our ability to compete with other manufacturers. Our competitors may also be more effective and efficient at integrating new technologies.
Through our Products segment, we compete with certain customers of our Engines segment, thereby creating inherent channel conflict that may impact the actions of engine manufacturers and OEMs with whom we compete.
Through our Products segment, we compete with certain customers of our Engines segment. Any further forward integration of our products may strain relationships with OEMs that are significant customers of our Engines segment and have an adverse impact on operating results.
The financial stability of our suppliers and the ability of our suppliers to produce quality materials could adversely affect our ability to obtain timely and cost-effective raw materials.
The loss of certain of our suppliers or interruption of production at certain suppliers from adverse financial conditions, work stoppages, equipment failures or other unfavorable events could adversely affect our ability to obtain raw materials and other inputs used in the manufacturing process. Our cost of purchasing raw materials and other inputs used in the manufacturing process could be higher and could temporarily affect our ability to produce sufficient quantities of our products, which could harm our financial condition, results of operations and competitive position.
An inability to successfully manage information systems, or to adequately maintain these systems and their security, as well as to protect data and other confidential information, could adversely affect our business and reputation.
In the ordinary course of business, we collect and store sensitive data and information, including our proprietary and regulated business information and that of our customers, suppliers and business partners, as well as personally identifiable information about our employees. We depend on our information systems to successfully manage our business. We have taken steps to maintain adequate data security by implementing security technologies, internal controls, and network and data center resiliency and recovery processes. However, any inability to successfully manage these systems, including matters related to system and data security, privacy, reliability, compliance, performance and access, as well as any inability of these systems to fulfill their intended purpose within our business, could have an adverse effect on our business.
Despite our efforts, our information systems, like those of other companies, are susceptible to damage or interruption due to natural disasters, power loss, telecommunications failures, viruses, breaches of security, system upgrades or new system implementations. Furthermore, our security measures may not detect or prevent all security threats, whether from intentional or inadvertent breaches by our employees or attacks designed to gain unauthorized access to our systems, networks and data, such as denial-of-service attacks, viruses, malicious software, break-ins, phishing attacks, social engineering, security breaches or other attacks and similar disruptions. Any operational failure or breach of security from increasingly sophisticated cyber threats could lead to the loss or disclosure of both our and our customers’ financial, product and other confidential information, result in regulatory actions and legal proceedings, or have an adverse effect on our business and reputation.
The Company experienced a malware attack on its computer systems at its Milwaukee, Wisconsin and Munnsville, New York locations that potentially compromised information from approximately July 25, 2017 to July 28, 2017. Immediate steps were taken to both contain and thoroughly investigate the attack. The investigation revealed no evidence of actual misuse of any information. The Company provided notice of the attack to the media, various state and federal agencies and potentially affected individuals in accordance with applicable legal requirements and also offered credit monitoring and identity theft services free of charge to such individuals. In addition, the Company implemented process and technology improvements to enhance its protections. However, attackers may outpace currently available malware preventative technologies and as a result, there can be no assurance that the Company will not experience another malware attack in the future.
We have implemented, and Wisconsin law contains, anti-takeover provisions that may adversely affect the rights of holders of our common stock.
Our articles of incorporation contain provisions that could have the effect of discouraging or making it more difficult for someone to acquire us through a tender offer, a proxy contest or otherwise, even though such an acquisition might be economically beneficial to our shareholders. These provisions include a board of directors divided into three classes of directors serving staggered terms of three years each and the removal of directors only for cause and only with the affirmative vote of a majority of the votes entitled to be cast in an election of directors.
We are subject to the Wisconsin Business Corporation Law, which contains several provisions that could have the effect of discouraging non-negotiated takeover proposals or impeding a business combination.
These provisions include:
| |
| • | requiring a supermajority vote of shareholders, in addition to any vote otherwise required, to approve business combinations not meeting adequacy of price standards; |
| |
| • | prohibiting some business combinations between an interested shareholder and us for a period of three years, unless the combination was approved by our board of directors prior to the time the shareholder became a 10% or greater beneficial owner of our shares or under some other circumstances; |
| |
| • | limiting actions that we can take while a takeover offer for us is being made or after a takeover offer has been publicly announced; and |
| |
| • | limiting the voting power of shareholders who own more than 20% of our stock. |
An inability to identify, complete and integrate acquisitions may adversely impact our sales, results of operations, cash flow and liquidity.
Our historical growth has included acquisitions, and our future growth strategy includes acquisition opportunities. For example, in fiscal 2015, the Company acquired Allmand, a leading designer and manufacturer of high quality towable light towers, industrial heaters and solar LED arrow boards, for approximately $59.9 million in cash. Also, in fiscal 2015, the Company acquired Billy Goat, a leading manufacturer of specialty turf equipment, which includes aerators, sod cutters, overseeders, power rakes, brush cutters, walk behind blowers, lawn vacuums, and debris loaders, for total cash consideration of $28.3 million. We may not be able to identify acquisition targets or successfully complete acquisitions in the future due to the absence of quality companies in our target markets, economic conditions, competition from other bidders, or price expectations from sellers. If we are unable to complete additional acquisitions, our growth may be limited.
Additionally, as we grow through acquisitions, we will continue to place significant demands on management, operational, and financial resources. Recent and future acquisitions will require integration of operations, sales and marketing, information technology, finance and administrative operations, which could decrease the time available to serve and attract customers. We cannot assure that we will be able to successfully integrate acquisitions, that these acquisitions will operate profitably, or that we will be able to achieve the desired financial or operational success. Our financial condition, cash flows, liquidity and results of operations could be adversely affected if we do not successfully integrate the newly acquired businesses, or if our other businesses suffer due to the increased focus on the newly acquired businesses.
An inability to successfully manage our global enterprise resource planning ("ERP") system could adversely affect our operations and operating results.
We went live with an upgrade to our global ERP system on July 9, 2018. This upgrade affected many of our existing operating and financial systems. This is a major undertaking both financially and from a management and personnel perspective. Should the organization not achieve the expected operational efficiencies and value realization associated with the ERP implementation it could adversely affect our operations and results of operations.
Our common stock is subject to substantial price and volume fluctuations.
The market price of shares of our common stock may be volatile. Among the factors that could affect our common stock price are those previously discussed, as well as:
| |
| • | quarterly fluctuation in our operating income and earnings per share results; |
| |
| • | decline in demand for our products; |
| |
| • | significant strategic actions by our competitors, including new product introductions or technological advances; |
| |
| • | fluctuations in interest rates or foreign currency exchange; |
| |
| • | cost increases in energy, raw materials or labor; |
| |
| • | changes in revenue or earnings estimates or publication of research reports by analysts; and |
| |
| • | domestic and international economic and political factors unrelated to our performance. |
In addition, the stock markets have experienced extreme volatility that has often been unrelated to the operating performance of particular companies. These broad market fluctuations may adversely affect the trading price of our common stock.
|
| |
| ITEM 1B. | UNRESOLVED STAFF COMMENTS |
None.
The Company maintains leased and owned manufacturing, office, warehouse, distribution and testing facilities throughout the world. The Company believes that its owned and leased facilities are adequate to perform its operations in a reasonable manner. As the Company’s business is seasonal, additional warehouse space may be leased when inventory levels are at their peak. Facilities in the United States occupy approximately 5.6 million square feet, of which 55% is owned. Facilities outside of the United States occupy approximately 1.0 million square feet, of which 27% is owned. Certain of the Company’s facilities are leased through operating lease agreements. See Note 10 to the Consolidated Financial Statements for information on the Company’s operating leases.
The following table provides information about each of the Company’s facilities (exceeding 25,000 square feet) as of June 30, 2019:
|
| | | | | | |
| | | | | | | |
| Location | | Type of Property | | Owned/Leased | | Segment |
| U.S. Locations: | | | | | | |
| Auburn, Alabama | | Manufacturing, office and warehouse | | Owned and Leased | | Engines |
| McDonough, Georgia | | Warehouse | | Leased | | Products |
| Statesboro, Georgia | | Manufacturing, office and warehouse | | Owned and Leased | | Engines |
| Murray, Kentucky | | Manufacturing, office and warehouse | | Owned and Leased | | Engines |
| Lee's Summit, Missouri | | Manufacturing, office and warehouse | | Leased | | Products |
| Poplar Bluff, Missouri | | Manufacturing, office and warehouse | | Owned and Leased | | Engines |
| Holdrege, Nebraska | | Manufacturing, office and warehouse | | Owned | | Products |
| Munnsville, New York | | Manufacturing and office | | Owned | | Products |
| Sherrill, New York | | Manufacturing, office and warehouse | | Leased | | Products |
| Orangeburg, South Carolina | | Distribution | | Leased | | Engines |
| Menomonee Falls, Wisconsin | | Distribution and office | | Leased | | Engines, Products |
| Milwaukee, Wisconsin | | Distribution | | Leased | | Engines, Products |
| Wauwatosa, Wisconsin | | Manufacturing, office and warehouse | | Owned | | Engines, Products, Corporate |
| Germantown, Wisconsin | | Distribution | | Leased | | Engines, Products |
| | | | |
| Non-U.S. Locations: | | | | | | |
| Melbourne, Australia | | Office and warehouse | | Leased | | Engines, Products |
| Sydney, Australia | | Manufacturing, office and warehouse | | Leased | | Products |
| Curitiba, Brazil | | Office and warehouse | | Leased | | Engines, Products |
| Chongqing, China | | Manufacturing, office and warehouse | | Owned | | Engines |
| Shanghai, China | | Office and warehouse | | Leased | | Engines, Products |
| Queretaro, Mexico | | Office and warehouse | | Leased | | Engines, Products |
| Wijchen, Netherlands | | Distribution and office | | Leased | | Engines, Products |
On August 15, 2019, the Company announced a plan to consolidate the Company’s production of small vertical shaft engines into its Poplar Bluff, Missouri facility. This decision was made after a comprehensive evaluation of the Company’s manufacturing operations. The Company’s Murray, Kentucky facility currently manufactures small vertical shaft engines and will be closed as a result of this consolidation.
The Company is subject to various unresolved legal actions that arise in the normal course of its business. These actions typically relate to product liability (including asbestos-related liability), patent and trademark matters, and
disputes with customers, suppliers, distributors and dealers, competitors and employees.
On May 12, 2010, Exmark Manufacturing Company, Inc. filed suit against Briggs & Stratton Power Products Group, LLC (“BSPPG”), a wholly owned subsidiary of the Company that was subsequently merged with and into the Company on January 1, 2017 (Case No. 8:10CV187, U.S. District Court for the District of Nebraska), alleging that certain Ferris® and Snapper Pro® mower decks infringed an Exmark mower deck patent. Exmark sought damages relating to sales since May 2004, attorneys’ fees, and enhanced damages. As a result of a reexamination proceeding in 2012, the United States Patent and Trademark Office (“USPTO”) initially rejected the asserted Exmark claims as invalid. However, in 2014, that decision was reversed by the USPTO on appeal by Exmark. Following discovery, each of BSPPG and Exmark filed several motions for summary judgment in the Nebraska district court, which were decided on July 28, 2015. The court concluded that older mower deck designs infringed Exmark’s patent, leaving for trial the issues of whether current designs infringed, the amount of damages, and whether any infringement was willful.
The trial began on September 8, 2015, and on September 18, 2015, the jury returned its verdict, finding that BSPPG’s current mower deck designs do not infringe the Exmark patent. As to the older designs, the jury awarded Exmark $24.3 million in damages and found that the infringement was willful, allowing the judge to enhance the jury’s damages award post-trial by up to three times. Also on September 18, 2015, the U.S. Court of Appeals for the Federal Circuit issued its decision in an unrelated case, SCA Hygiene Products Aktiebolag SCA Personal Care, Inc. v. First Quality Baby Products, LLC, et al. (Case No. 2013-1564) (“SCA”), confirming the availability of laches as a defense to patent infringement claims. Laches is an equitable doctrine that may bar a patent owner from obtaining damages prior to commencing suit, in circumstances in which the owner knows or should have known its patent was being infringed for more than six years. Although the court in the Exmark case ruled before trial that BSPPG could not rely on the defense of laches, as a result of the subsequent SCA decision, the court held a bench trial on that defense on October 21 and 22, 2015. On May 2, 2016, the United States Supreme Court agreed to review the SCA decision.
The parties submitted post-trial motions and briefing related to: damages; willfulness; laches; attorney fees; enhanced damages; and prejudgment/post-judgment interest and costs. All post-trial motions and briefing were completed on December 18, 2015. On May 11, 2016, the court ruled on those post-trial motions and entered judgment against BSPPG and in favor of Exmark in the amount of $24.3 million in compensatory damages, an additional $24.3 million in enhanced damages, and $1.5 million in pre-judgment interest along with post-judgment interest and costs to be determined. The Company strongly disagreed with the jury verdict, certain rulings made before and during trial, and the May 11, 2016 post-trial rulings. BSPPG appealed to the U.S. Court of Appeals for the Federal Circuit on several bases, including the issues of obviousness and invalidity of Exmark’s patent, the damages calculation, willfulness and laches.
Following briefing of the appeal and prior to oral argument, the United States Supreme Court overturned the SCA decision, ruling that laches is not available in a patent infringement case for damages. That ruling eliminated laches as one basis for BSPPG’s appeal of the Exmark case. The appellate court held a hearing on the remainder of BSPPG’s appeal on April 5, 2017 and issued its decision on January 12, 2018. The appellate court found that the district court erred in granting summary judgment concerning the patent’s validity and remanded that issue to the district court for reconsideration. The appellate court also vacated the jury’s damages award and the district court’s award of enhanced damages, remanding the case to the district court for a new trial on damages and reconsideration on willfulness. The appellate court affirmed the district court rulings in all other respects. In subsequent rulings, the district court reaffirmed the validity of Exmark’s patent and its original ruling on willfulness. A new trial on the issue of damages commenced on December 10, 2018, resulting in a damages assessment by the jury of $14.4 million.
On December 20, 2018, the district court entered judgment against the Company and in favor of Exmark in the amount of $14.4 million in compensatory damages, an additional $14.4 million in enhanced damages, as well as pre-judgment interest, post-judgment interest and costs to be determined. On April 15, 2019, the district court entered an order denying the Company’s post-trial motions related to modification of the jury’s damages award, as well as seeking a new trial in light of certain evidentiary rulings. The district court awarded $6.0 million in pre-judgment interest, as well as post-judgment interest after December 19, 2018 and costs to be determined.
The Company strongly disagrees with the verdict and certain rulings made before, during and after the new trial and intends to vigorously pursue its rights on appeal. The Company filed its notice of appeal on May 14, 2019, and has appealed errors made by the district court in construing certain claims of Exmark’s patent, granting summary judgment motions filed by Exmark, and altering the prejudgment interest rate following the second trial. The parties are in the process of briefing the issues raised on appeal.
In assessing whether the Company should accrue a liability in its financial statements as a result of this lawsuit, the Company considered various factors, including the legal and factual circumstances of the case, the trial records and post-trial rulings of the district court, the decision of the appellate court, the current status of the proceedings, applicable law and the views of legal counsel. As a result of this review, the Company has concluded that a loss from this case is not probable and reasonably estimable at this time and, therefore, a liability has not been recorded with respect to this case as of June 30, 2019.
Although it is not possible to predict with certainty the outcome of this and other unresolved legal actions or the range of possible loss, the Company believes the unresolved legal actions will not have a material adverse effect on its results of operations, financial position or cash flows.
|
| |
| ITEM 4. | MINE SAFETY DISCLOSURES |
Not applicable.
Executive Officers of the Registrant
|
| | |
| Name, Age, Position | | Business Experience for At Least Past Five Years |
TODD J. TESKE, 54 Chairman, President & Chief Executive Officer (1)(2) | | Mr. Teske was elected to his current position effective October 2010. He previously was President & Chief Executive Officer from January 2010 to October 2010. He served as President and Chief Operating Officer from 2008 to 2010; as Executive Vice President & Chief Operating Officer from 2005 to 2008; and as Senior Vice President and President - Briggs & Stratton Power Products Group, LLC from 2003 to 2005. Mr. Teske also serves as a director of Badger Meter, Inc. and Lennox International, Inc.
|
| | |
KATHRYN M. BUONO, 57 Vice President, General Counsel & Corporate Secretary (3) | | Ms. Buono was elected to her position effective April 2015 (initially with the title Vice President, General Counsel & Secretary). Prior to joining Briggs & Stratton, she held the position of Managing Partner of the Milwaukee, Wisconsin office of the Quarles & Brady LLP law firm from March 2014 through December 2014 and was a partner practicing in its Business Law Group from 1996 through 2014.
|
| |
| |
| |
| | | |
RANDALL R. CARPENTER, 62 Vice President Corporate Marketing | | Mr. Carpenter was elected to his current position effective September 2016. Previously he served as Vice President - Marketing (an elected officer position) from 2009 through August 2016. He served as Vice President - Marketing (an appointed position) from 2007 to 2009. Prior to joining Briggs & Stratton, he held the position of Vice President Marketing and Product Development for Royal Appliance Manufacturing, a vacuum cleaner manufacturer. |
| |
| |
| |
| |
| |
| | |
ANDREA L. GOLVACH, 48 Vice President & Treasurer | | Ms. Golvach was elected to her current position effective November 2011 after serving as Vice President of Treasury from May 2011 to November 2011. Prior to joining Briggs & Stratton, she held the position of Director of Finance & Cash Management at Harley-Davidson, Inc., a global motorcycle manufacturer, from 2007 to 2011. |
| |
| |
| |
| |
| |
| |
| |
| | |
RACHELE M. LEHR, 42 Vice President Human Resources
| | Ms. Lehr was elected to her current position effective September 2018. She previously served as Vice President Human Resources (an appointed position) from July 2015 through August 2018. Prior to then, she served as Human Resources Senior Director from March 2015 through June 2015, as Human Resources Director from June 2013 through February 2015, and as Controller from April 2010 through May 2013. |
| |
| |
| |
| |
| |
| |
| | | |
HAROLD L. REDMAN, 54 Senior Vice President & President – Turf & Consumer Products | | Mr. Redman was elected to his current position effective September 2014. He previously served as Senior Vice President and President - Products Group from 2010 to 2014; as Senior Vice President and President - Home Power Products Group from 2009 to 2010; and as Vice President and President - Home Power Products Group from 2006 to 2009. Prior to joining Briggs & Stratton, he served as Senior Vice President - Sales & Marketing of Simplicity Manufacturing, Inc., the predecessor owner of the Company's Simplicity® business.
|
| |
| |
| |
| |
| |
| |
| | |
|
| | |
| Name, Age, Position | | Business Experience for At Least Past Five Years |
WILLIAM H. REITMAN, 63 Senior Vice President & President – Support | | Mr. Reitman was elected to his current position effective September 2016 (initially with the title Senior Vice President & President - Global Support). Previously he served as Senior Vice President & President - Global Service from 2015 to 2016; as Senior Vice President - Managing Director Europe & Global Service from 2013 to 2015; as Senior Vice President - Business Development & Customer Service from 2010 to 2013; as Senior Vice President - Sales & Customer Support from 2007 to 2010; as Senior Vice President - Sales & Marketing from 2006 to 2007; as Vice President - Sales & Marketing from 2004 to 2006; and as Vice President - Marketing from 1995 to 2004.
|
| |
| |
| |
| |
| |
| |
DAVID J. RODGERS, 48 Senior Vice President & President – Engines & Power | | Mr. Rodgers was elected to his current position effective August 2015 (initially with the title Senior Vice President & President - Engines Group). He previously served as Senior Vice President & Chief Financial Officer from 2010 to 2015 and as Vice President - Finance during 2010. He served as Controller from 2006 to 2010 and was elected an executive officer in 2007. Prior to joining Briggs & Stratton, he was employed by Roundy’s Supermarkets, Inc., a Midwest grocer, as Vice President - Corporate Controller from 2005 to 2006 and Vice President - Retail Controller from 2003 to 2005.
|
| |
| |
| |
| |
| |
| |
| |
| | |
MARK A. SCHWERTFEGER, 42 Senior Vice President & Chief Financial Officer (4) | | Mr. Schwertfeger was elected to his current position effective August 2015. He previously served as Vice President & Controller (an executive officer position) from 2014 to 2015; as Corporate Controller from 2010 to 2014; and as International Controller from 2008 to 2010. Prior to joining Briggs & Stratton, he held the position of Director with KPMG LLP., a public accounting firm. |
| |
| |
| | | |
JEFFREY M. ZEILER, 50 Vice President Product Innovation
| | Mr. Zeiler was elected to his current position effective September 2018. He previously served as Vice President Product Innovation (an appointed position) from January 2013 through August 2018. Prior to joining Briggs & Stratton, he held the position of Senior Vice President of Business Development at Milwaukee Electric Tool Corp., a manufacturer of heavy-duty power tools, accessories and hand tools for professional users. |
(1) Officer is also the Company's principal executive officer and a Director of Briggs & Stratton.
(2) Member of the Board of Directors Executive Committee.
(3) Officer also serves as the Company's principal compliance officer.
(4) Officer also serves as the Company's principal financial officer.
Officers are elected annually and serve until they resign, die, are removed, or a different person is appointed to the office.
PART II
|
| |
| ITEM 5. | MARKET FOR THE REGISTRANT’S COMMON EQUITY, RELATED STOCKHOLDER MATTERS AND ISSUER PURCHASES OF EQUITY SECURITIES |
Briggs & Stratton common stock is traded on the NYSE under the symbol “BGG”. Information required by this Item is incorporated by reference from the “Quarterly Financial Data, Dividend and Market Information" (unaudited), included in Item 8 of this report.
Changes in Securities, Use of Proceeds and Issuer Purchases of Equity Securities
The table below sets forth the information with respect to purchases made by or on behalf of the Company of its common stock during the quarterly period ended June 30, 2019.
|
| | | | | | | | | | | | | | |
| 2019 Fiscal Month | | Total Number of Shares Purchased | | Average Price Paid per Share | | Total Number of Shares Purchased as Part of a Publicly Announced Program (1) | | Approximate Dollar Value of Shares that May Yet Be Purchased Under the Program (1) |
| April 1, 2019 to April 28, 2019 | | — |
| | $ | — |
| | — |
| | $ | 38,062,939 |
|
| April 29, 2019 to May 26, 2019 | | — |
| | — |
| | — |
| | 38,062,939 |
|
| May 27, 2019 to June 30, 2019 | | — |
| | — |
| | — |
| | 38,062,939 |
|
| Total Fourth Quarter | | — |
| | $ | — |
| | — |
| | $ | 38,062,939 |
|
(1) On April 21, 2016, the Board of Directors authorized up to $50 million in funds for use in the common share repurchase program with an expiration date of June 29, 2018. The common share repurchase program authorizes the purchase of shares of the Company's common stock on the open market or in private transactions from time to time, depending on market conditions and certain governing debt covenants. On April 25, 2018 the Board of Directors authorized an additional $50 million under the share repurchase program with an expiration date of June 30, 2020.
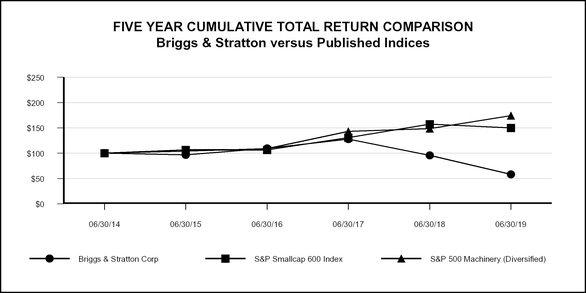
Five-year Stock Performance Graph
The graph below shows the cumulative total stockholder return of an investment of $100 (and the reinvestment of any dividends thereafter) at the close of business on June 30, 2014 in each of Briggs & Stratton common stock, the Standard & Poor’s (S&P) Smallcap 600 Index and the S&P Machinery Index.
|
| |
| ITEM 6. | SELECTED FINANCIAL DATA |
|
| | | | | | | | | | | | | | | | | | | | |
| Fiscal Year | | 2019(1) | | 2018(2) | | 2017 | | 2016(3) | | 2015(4) |
| (dollars in thousands, except per share data) | | | | | | | | | | |
SUMMARY OF OPERATIONS | | | | | | | | | | |
| NET SALES | | $ | 1,836,605 |
| | $ | 1,881,294 |
| | $ | 1,786,103 |
| | $ | 1,808,778 |
| | $ | 1,894,750 |
|
| GROSS PROFIT | | 301,051 |
| | 398,082 |
| | 383,829 |
| | 362,455 |
| | 359,099 |
|
| PROVISION (BENEFIT) FOR INCOME TAXES | | (14,015 | ) | | 22,421 |
| | 23,011 |
| | 8,795 |
| | 11,271 |
|
| NET INCOME (LOSS) | | (54,083 | ) | | (11,320 | ) | | 56,650 |
| | 26,561 |
| | 45,687 |
|
| EARNINGS (LOSS) PER SHARE OF COMMON STOCK: | | | | | | | | | | |
| Basic | | (1.31 | ) | | (0.28 | ) | | 1.31 |
| | 0.61 |
| | 1.00 |
|
| Diluted | | (1.31 | ) | | (0.28 | ) | | 1.31 |
| | 0.60 |
| | 1.00 |
|
| PER SHARE OF COMMON STOCK: | | | | | | | | | | |
| Cash Dividends | | 0.42 |
| | 0.56 |
| | 0.56 |
| | 0.54 |
| | 0.50 |
|
| Shareholders’ Investment | | $ | 10.73 |
| | $ | 13.56 |
| | $ | 13.26 |
| | $ | 11.47 |
| | $ | 12.94 |
|
| WEIGHTED AVERAGE NUMBER OF SHARES OF COMMON STOCK OUTSTANDING (in 000’s) | | 41,647 |
| | 42,068 |
| | 42,178 |
| | 43,019 |
| | 44,392 |
|
| DILUTED NUMBER OF SHARES OF COMMON STOCK OUTSTANDING (in 000’s) | | 41,647 |
| | 42,068 |
| | 42,263 |
| | 43,200 |
| | 44,442 |
|
OTHER DATA | | | | | | | | | | |
| SHAREHOLDERS’ INVESTMENT | | $ | 446,720 |
| | $ | 570,424 |
| | $ | 559,334 |
| | $ | 493,626 |
| | $ | 574,250 |
|
| LONG-TERM DEBT | | 194,969 |
| | 199,954 |
| | 221,793 |
| | 221,339 |
| | 222,685 |
|
| TOTAL ASSETS (5) | | 1,551,431 |
| | 1,443,966 |
| | 1,450,979 |
| | 1,456,667 |
| | 1,456,424 |
|
| PLANT AND EQUIPMENT | | 1,220,339 |
| | 1,175,165 |
| | 1,104,583 |
| | 1,056,893 |
| | 1,035,326 |
|
| PLANT AND EQUIPMENT, NET OF ACCUMULATED DEPRECIATION | | 411,045 |
| | 422,080 |
| | 364,880 |
| | 326,273 |
| | 314,838 |
|
| PROVISION FOR DEPRECIATION | | 59,820 |
| | 53,783 |
| | 51,855 |
| | 49,973 |
| | 48,496 |
|
| EXPENDITURES FOR PLANT AND EQUIPMENT | | 52,454 |
| | 103,203 |
| | 83,141 |
| | 64,161 |
| | 71,710 |
|
| WORKING CAPITAL (5) | | $ | 184,732 |
| | $ | 295,100 |
| | $ | 359,063 |
| | $ | 377,700 |
| | $ | 414,256 |
|
| Current Ratio (5) | | 1.3 to 1 |
| | 1.8 to 1 |
| | 2.1 to 1 |
| | 2.2 to 1 |
| | 2.2 to 1 |
|
| NUMBER OF EMPLOYEES AT YEAR-END | | 5,200 |
| | 5,185 |
| | 5,300 |
| | 5,445 |
| | 5,480 |
|
| NUMBER OF SHAREHOLDERS AT YEAR-END | | 2,190 |
| | 2,306 |
| | 2,431 |
| | 2,558 |
| | 2,681 |
|
| QUOTED MARKET PRICE: | | | | | | | | | | |
| High | | $ | 21.40 |
| | $ | 27.34 |
| | $ | 25.92 |
| | $ | 24.48 |
| | $ | 21.09 |
|
| Low | | $ | 9.35 |
| | $ | 17.11 |
| | $ | 17.90 |
| | $ | 15.47 |
| | $ | 17.14 |
|
| |
| (1) | In fical 2019, business optimization expenses include $2.5 million after tax or $0.04 per diluted share of non-cash charges related to accelerated depreciation, and $32.1 million after tax or $0.77 per diluted share of cash charges related primarily to activities associated with the upgrade to the Company's ERP system, professional services, employee termination benefits, and plant rearrangement activities. The Company recognized bad debt expense of $3.1 million after tax or $0.08 per diluted share after a major retailer announced that it had filed for bankruptcy protection. The Company recognized $1.5 million after tax or $0.04 per diluted share for amounts accrued related to a litigation settlement and $0.4 million after tax or $0.01 per diluted share related to acquisition integration activities. Interest expense includes $0.2 million after tax or $0.01 per diluted share for premiums paid to repurchase senior notes. Other income includes a $0.3 million after tax or $0.01 per diluted share pension settlement charge. Tax expense includes a $1.0 million charge or $0.03 per diluted share associated with the Tax Cuts and Jobs Act of 2017 to record the impact of the inclusion of foreign earnings. |
| |
| (2) | In fiscal 2018, the Company had business optimization expenses of $3.4 million after-tax or $0.08 per diluted share of non-cash charges related primarily to plant & equipment impairment and accelerated depreciation, and $11.4 million after-tax or $0.26 per diluted share of cash charges related primarily to employee termination benefits, lease terminations, professional services and plant rearrangement activities, non-cash charges of $29.6 after-tax or $0.70 per diluted share related to the pension settlement. The Company recognized in interest expense $1.6 million after-tax or $0.04 per diluted share for |
premiums paid to repurchase senior notes after receiving unsolicited offers from bondholders. Tax expense also includes a $21.1 million or $0.49 per diluted share charge associated with the Tax Cuts and Jobs Act of 2017
| |
| (3) | In fiscal 2016, the Company had restructuring charges of $6.7 million after-tax or $0.15 per diluted share, acquisition-related charges of $0.2 million after-tax or less than $0.01 per diluted share, litigation charges of $1.8 million after-tax or $0.04 per diluted share, goodwill and tradename impairment charges of $9.4 million after-tax or $0.22 per share, pension settlement charges of $13.2 million after-tax or $0.30 per diluted share, and a gain on sale of investment in marketable securities of $2.8 million after-tax or ($0.07) per diluted share. |
| |
| (4) | In fiscal 2015, the Company had restructuring charges of $17.7 million after-tax or $0.40 per diluted share and acquisition-related charges of $1.4 million after-tax or $0.03 per diluted share. |
| |
| (5) | The Company adopted Accounting Standards Update No. 2015-17, and retrospectively reclassified current “Deferred Income Tax Assets" to "Long-term Deferred Income Tax Assets” in the Selected Financial Data table. |
|
| |
| ITEM 7. | MANAGEMENT’S DISCUSSION AND ANALYSIS OF FINANCIAL CONDITION AND RESULTS OF OPERATIONS |
Results of Operations
FISCAL 2019 COMPARED TO FISCAL 2018
The following table is a reconciliation of financial results by segment, as reported, to adjusted financial results by segment, excluding business optimization charges, pension settlement charges, product liability litigation charges, major retailer bankruptcy bad debt expense, charges as a result of the implementation of the Tax Cuts and Jobs Act of 2017 (the “Tax Act”), and senior note repurchase premiums (in thousands, except per share data):
|
| | | | | | | | | | | | | | | | | | | | | | | | |
| | | For the fiscal year ended June |
| | | 2019 Reported | | Adjustments(1) | | 2019 Adjusted(3) | | 2018 Reported | | Adjustments(2) | | 2018 Adjusted(3) |
| Gross Profit: | | | | | | | | | | | | |
| Engines | | $ | 193,069 |
| | $ | 2,662 |
| | $ | 195,731 |
| | $ | 252,645 |
| | $ | 2,854 |
| | $ | 255,499 |
|
| Products | | 108,984 |
| | 9,207 |
| | 118,191 |
| | 144,933 |
| | 3,775 |
| | 148,708 |
|
| Inter-Segment Eliminations | | (1,002 | ) | | — |
| | (1,002 | ) | | 504 |
| | — |
| | 504 |
|
| Total | | $ | 301,051 |
| | $ | 11,869 |
| | $ | 312,920 |
| | $ | 398,082 |
| | $ | 6,628 |
| | $ | 404,710 |
|
| | | | | | | | | | | | | |
| Engineering, Selling, General and Administrative Expenses: | | | | | | | | | | | | |
| Engines | | $ | 213,589 |
| | $ | 23,374 |
| | $ | 190,215 |
| | $ | 248,286 |
| | $ | 48,096 |
| | $ | 200,190 |
|
| Products | | 135,687 |
| | 13,441 |
| | 122,246 |
| | 126,944 |
| | 4,339 |
| | 122,605 |
|
| Total | | $ | 349,276 |
| | $ | 36,815 |
| | $ | 312,461 |
| | $ | 375,230 |
| | $ | 52,435 |
| | $ | 322,796 |
|
| | | | | | | | | | | | | |
| Equity in Earnings of Unconsolidated Affiliates | | | | | | | | | | | | |
| Engines | | $ | 5,001 |
| | $ | 3,113 |
| | $ | 8,114 |
| | $ | 5,234 |
| | $ | 2,964 |
| | $ | 8,198 |
|
| Products | | 4,028 |
| | — |
| | 4,028 |
| | 4,023 |
| | — |
| | 4,023 |
|
| Total | | $ | 9,029 |
| | $ | 3,113 |
| | $ | 12,142 |
| | $ | 9,257 |
| | $ | 2,964 |
| | $ | 12,221 |
|
| | | | | | | | | | | | | |
| Segment Income (Loss) (4): | | | | | | | | | | | | |
| Engines | | $ | (15,519 | ) | | $ | 29,149 |
| | $ | 13,630 |
| | $ | 9,593 |
| | $ | 53,913 |
| | $ | 63,506 |
|
| Products | | (22,675 | ) | | 22,648 |
| | (27 | ) | | 22,012 |
| | 8,113 |
| | 30,125 |
|
| Inter-Segment Eliminations | | (1,002 | ) | | — |
| | (1,002 | ) | | 504 |
| | — |
| | 504 |
|
| Total | | $ | (39,196 | ) | | $ | 51,797 |
| | $ | 12,601 |
| | $ | 32,109 |
| | $ | 62,026 |
| | $ | 94,135 |
|
| | | | | | | | | | | | | |
| Interest Expense | | $ | (29,242 | ) | | $ | 263 |
| | $ | (28,979 | ) | | $ | (25,320 | ) | | $ | 2,228 |
| | $ | (23,092 | ) |
| Other Income | | $ | 340 |
| | $ | 521 |
| | $ | 861 |
| | $ | 4,312 |
| | $ | — |
| | $ | 4,312 |
|
| | | | | | | | | | | | | |
| Income (Loss) Before Income Taxes | | (68,098 | ) | | 52,581 |
| | (15,517 | ) | | 11,101 |
| | 64,254 |
| | 75,355 |
|
| Provision (Credit) for Income Taxes | | (14,015 | ) | | 11,362 |
| | (2,653 | ) | | 22,421 |
| | (2,836 | ) | | 19,585 |
|
| Net Income (Loss) | | $ | (54,083 | ) | | $ | 41,219 |
| | $ | (12,864 | ) | | $ | (11,320 | ) | | $ | 67,090 |
| | $ | 55,770 |
|
| | | | | | | | | | | | | |
| Earnings (Loss) Per Share | | | | | | | | | | | | |
| Basic | | $ | (1.31 | ) | | $ | 0.99 |
| | $ | (0.32 | ) | | $ | (0.28 | ) | | $ | 1.57 |
| | $ | 1.29 |
|
| Diluted | | (1.31 | ) | | 0.99 |
| | (0.32 | ) | | (0.28 | ) | | 1.57 |
| | 1.29 |
|
(1) For the twelve months of fiscal 2019, business optimization expenses include $3.2 million ($2.5 million after tax) of non-cash charges related to accelerated depreciation, and $41.9 million ($32.1 million after tax) of cash charges related primarily to activities associated with the upgrade to the Company's ERP system, professional services, employee termination benefits, and plant rearrangement activities. The Company recognized bad debt expense of $4.1 million ($3.1 million after tax) after a major retailer announced that it had filed for bankruptcy protection. The Company recognized $2.0 million ($1.5 million after tax) for amounts accrued related to a litigation settlement and $0.6 million ($0.4 million after tax) related to acquisition integration activities. Interest expense includes $0.2 million ($0.2 million after tax) for premiums paid to repurchase senior notes. Other income includes a $0.5 million ($0.3 million after tax) pension settlement charge. Tax expense includes a $1.0 million charge associated with the Tax Cuts and Jobs Act of 2017 to record the impact of the inclusion of foreign earnings.
(2) For the twelve months of fiscal 2018, business optimization expenses include $4.8 million ($3.4 million after tax) of non-cash charges related primarily to plant & equipment impairment and accelerated depreciation, and $16.1 million ($11.4 million after tax) of cash charges related primarily to employee termination benefits, lease terminations, professional services and plant rearrangement activities. ESG&A includes $41.2 million ($29.6 million after tax) of non-cash charges related to the pension settlement. Tax expense also includes a $21.1 million charge associated with the Tax Cuts and Jobs Act of 2017 comprised of $13.8 million to revalue deferred tax assets and liabilities and $7.3 million to record the impact of the inclusion of foreign earnings. The company recognized in interest expense $2.2 million ($1.6 million after tax) for premiums paid to repurchase senior notes after receiving unsolicited offers from bondholders.
(3) Adjusted financial results are non-GAAP financial measures. The Company believes this information is meaningful to investors as it isolates the impact that restructuring charges, acquisition-related charges, certain litigation charges, pension settlement charges, gains on sale of marketable securities, and goodwill and tradename impairment charges have on reported financial results and facilitates comparisons between peer companies. The Company may utilize non-GAAP financial measures as a guide in the forecasting, budgeting, and long-term planning process. While the Company believes that adjusted financial results are useful supplemental information, such adjusted financial results are not intended to replace its GAAP financial results and should be read in conjunction with those GAAP results.
(4) The Company defines segment income (loss) as income from operations plus equity in earnings of unconsolidated affiliates. For all periods presented, equity in earnings of unconsolidated affiliates is included in segment income (loss).
Net Sales
Fiscal 2019 net sales were $1.84 billion, down $44.7 million or 2.4% from $1.88 billion for fiscal 2018 primarily due to unusually dry weather conditions in Australia and Europe, lower storm generator sales and lower service parts sales, and near-term disruption caused by channel partner transitions, including the bankruptcy of a major North American retailer. Sales of commercial engines and products increased approximately 13% for the fiscal year.
Engines segment net sales for fiscal 2019 were $988.7 million, which was $77.6 million or 7.3% lower than the prior year. Sales in fiscal 2019 were lower than in the prior year primarily due to lower shipments of consumer engines in Europe and Australia due to unfavorable weather conditions. Service parts sales declined year over year, both in North America and Europe, largely due to throughput inefficiencies. Partially offsetting the decrease were higher sales of Vanguard commercial engines.
Products segment net sales for fiscal 2019 were $932.1 million, an increase of $28.1 million or 3.1% from the prior year. Net sales increased primarily due to higher sales of commercial lawn and garden and job site equipment, as well as increased sales of pressure washers. Partially offsetting the increase was a decrease in shipments related to less hurricane activity in fiscal 2019 compared to fiscal 2018.
Gross Profit Percentage
The consolidated gross profit percentage was 16.4% in fiscal 2019, a decrease of 480 basis points from fiscal 2018.
Included in consolidated gross profit for fiscal 2019 were pre-tax charges of $9.9 million related to the business optimization program and $2.0 million related to a product liability ligation settlement. Of these charges, $9.2 million was recorded in the Products segment, and $2.7 million was recorded in the Engines segment.
The Engines segment gross profit percentage for fiscal 2019 was 19.5%, which was lower than the 23.7% in
fiscal 2018. Adjusted gross profit percentage decreased 420 basis points compared to last year due to inefficiencies, a reduction in manufacturing volume, and unfavorable sales mix. Inefficiencies from start-up activities related to the Company’s ERP upgrade and the on-shoring of Vanguard engines which led to elevated supply chain and labor costs to ensure timely delivery of Vanguard engines and to improve the throughput of service parts.
The Products segment gross profit percentage for fiscal 2019 was 14.6%, which was lower than the 16.0% in fiscal 2018. Adjusted gross profit percentage decreased 380 basis points year over year due to unfavorable sales mix, manufacturing inefficiencies and increased material and tariff costs net of price increases. Sales mix was predominantly driven by lower sales of storm generators and shifts within the pressure washer and lawn tractor categories towards more entry level models. Improvements to inefficiencies from start-up activities related to the business optimization program were hampered by labor availability challenges.
Engineering, Selling, General and Administrative Expenses
Engineering, selling, general and administrative expenses were $349.3 million in fiscal 2019, a decrease of $25.9 million or 6.9% from fiscal 2018.
Included in engineering, selling, general and administrative expenses for fiscal 2019 were pre-tax charges of $36.8 million related to the business optimization program, bad debt expense due to a major retailer bankruptcy, and pension settlement charges. Of these charges, $13.4 million was recorded in the Products segment, and $23.4 million was recorded in the Engines segment.
Included in engineering, selling, general and administrative expenses for fiscal 2018 were pre-tax charges of $52.4 million related to the business optimization program and pension settlement charges. Of these charges, $4.3 million was recorded in the Products segment for the business optimization program, and $48.1 million was recorded in the Engines segment for the business optimization program and pension settlement.
The Engines segment engineering, selling, general and administrative expenses were $213.6 million in fiscal 2019, or $34.7 million lower compared to fiscal 2018, primarily due to a $41.2 million pension settlement charge in the prior year. Adjusted engineering, selling, general and administrative expenses were $10.0 million lower than fiscal 2018, primarily due to reduced employee compensation costs.
The Products segment engineering, selling, general and administrative expenses were $135.7 million in fiscal 2019, an increase of $8.7 million from fiscal 2018. Adjusted engineering, selling, general and administrative expenses were $0.4 million lower than fiscal 2018.
Interest Expense
Interest expense for fiscal 2018 was $29.2 million, which was $3.9 million higher than fiscal 2018 due to increased average net borrowings and higher interest rates.
Provision for Income Taxes
On December 22, 2017, the U.S. government enacted significant tax legislation commonly referred to as the Tax Cuts and Jobs Act (the “Tax Act”). As a result of the Tax Act, the Company was subject to a U.S. federal statutory corporate income tax rate of 28% for the fiscal year ending July 1, 2018 and is subject to a U.S. federal statutory corporate income tax rate of 21% in the fiscal year ending June 30, 2019 and future fiscal years. Overall, the Company anticipates the decrease in the U.S. federal statutory rate resulting from the enactment of the Tax Act will have favorable impact on its future consolidated tax expense and operating cash flows.
Within the calculation of the Company’s tax rate, various assumptions and estimates have been used that may change as a result of future guidance, interpretation, and legislation from the Internal Revenue Service, the SEC, the Financial Accounting Standards Board (“FASB”) and/or various other taxing jurisdictions. For example, the Company anticipates that U.S. state jurisdictions will continue to determine and announce their conformity to the Tax Act which could have an impact on the Company’s tax rate. The Tax Act contains many significant changes to U.S. tax laws, the consequences of which have not yet been fully determined.
As of June 30, 2019, the Company has analyzed its global working capital and cash requirements and the potential tax liabilities attributable to repatriation in regards to its permanent reinvestment assertion. During fiscal 2018, the Company removed its permanent reinvestment assertion on approximately $33 million of its foreign earnings and made distributions from its foreign earnings related to the assertion removal of approximately $18 million. The Company repatriated the additional $15 million of foreign earnings in the second quarter of fiscal 2019. During the second quarter of fiscal 2019, the Company has also removed its permanent reinvestment assertion on an additional approximately $21.6 million of its accumulated offshore earnings. This resulted in an estimated tax expense of $1.0 million. The Company has recorded the tax effects of the distributions and planned repatriations in its financial statements, including withholding taxes and currency gain and loss. For the remainder of its foreign earnings, the Company has not changed its prior assertion. Accordingly, deferred taxes attributable to its investments in its foreign subsidiaries have not yet been recorded.
The Tax Act also established new tax laws that came into effect for the Company in fiscal year 2019, including the creation of a new provision designed to tax global intangible low-taxed income (GILTI), which allows for the possibility of using foreign tax credits (FTCs), a deduction of up to 50 percent to offset the income tax liability, and a deduction for foreign derived intangible income (FDII) subject to certain limitations, along with the base erosion anti-abuse tax (BEAT) and the limitation on deductibility of interest expense in the US. For fiscal year 2019, the Company is estimating no current income tax impact from the new GILTI, FDII, or BEAT provisions. The Company incurred approximately $40 million in nondeductible interest expense during fiscal year 2019, resulting in a deferred tax asset of approximately $9.8 million with an unlimited carryforward period. Realization of the deferred tax asset is contingent upon generating sufficient taxable income.
Business Optimization Program
The Company made significant progress on implementing its previously announced business optimization program in fiscal 2019. The program is designed to drive efficiencies and expand capacity in commercial engines and cutting equipment. The program entails expanding production of Vanguard commercial engines into the Company’s existing large engine plants, which are located in Georgia and Alabama, expanding Ferris commercial mower production capacity into a new, modern facility which is located close to the current manufacturing facility in New York, and the implementation of an ERP upgrade. The Company went live with the ERP upgrade at the beginning of the first quarter of fiscal 2019.
Production of Vanguard engines in the Company’s U.S. plants began in the fourth quarter of fiscal 2018 and additional lines were phased in by the end of the fourth quarter of fiscal 2019. Previously, the majority of Vanguard engines were sourced from overseas. Production of Ferris commercial mowers began in the new facility in the fourth quarter of fiscal 2018 and all remaining production was transitioned in the third quarter of fiscal 2019.
During fiscal 2019, the Company recorded business optimization charges of $45.0 million ($34.5 million after tax or $0.81 per diluted share). Remaining program costs to be incurred in fiscal 2020 are expected to be $5 million. The business optimization program is expected to generate pre-tax savings of $35 million to $40 million of ongoing future annual pre-tax savings, in addition to supporting profitable commercial growth. The Company estimates the future annual savings will be achieved by fiscal 2022.
FISCAL 2018 COMPARED TO FISCAL 2017
The following table is a reconciliation of financial results by segment, as reported, to adjusted financial results by segment, excluding business optimization charges, pension settlement charges, charges as a result of the implementation of the Tax Cuts and Jobs Act of 2017 (the “Tax Act”), and senior note repurchase premiums (in thousands, except per share data):
|
| | | | | | | | | | | | | | | | | | | | | | | | |
| | | For the fiscal year ended June |
| | | 2018 Reported | | Adjustments(1) | | 2018 Adjusted(2) | | 2017 Reported | | Adjustments(1) | | 2017 Adjusted(2) |
| Gross Profit: | | | | | | | | | | | | |
| Engines | | $ | 252,645 |
| | $ | 2,854 |
| | $ | 255,499 |
| | $ | 262,036 |
| | $ | — |
| | $ | 262,036 |
|
| Products | | 144,933 |
| | 3,775 |
| | 148,708 |
| | 121,141 |
| | — |
| | 121,141 |
|
| Inter-Segment Eliminations | | 504 |
| | — |
| | 504 |
| | 652 |
| | — |
| | 652 |
|
| Total | | $ | 398,082 |
| | $ | 6,628 |
| | $ | 404,710 |
| | $ | 383,829 |
| | $ | — |
| | $ | 383,829 |
|
| | | | | | | | | | | | | |
| Engineering, Selling, General and Administrative Expenses: | | | | | | | | | | | | |
| Engines | | $ | 248,286 |
| | $ | 48,096 |
| | $ | 200,190 |
| | $ | 187,020 |
| | $ | — |
| | $ | 187,020 |
|
| Products | | 126,944 |
| | 4,339 |
| | 122,605 |
| | 113,042 |
| | — |
| | 113,042 |
|
| Total | | $ | 375,230 |
| | $ | 52,435 |
| | $ | 322,796 |
| | $ | 300,062 |
| | $ | — |
| | $ | 300,062 |
|
| | | | | | | | | | | | | |
| Equity in Earnings of Unconsolidated Affiliates | | | | | | | | | | | | |
| Engines | | $ | 5,234 |
| | $ | 2,964 |
| | $ | 8,198 |
| | $ | 6,625 |
| | $ | — |
| | $ | 6,625 |
|
| Products | | 4,023 |
| | — |
| | 4,023 |
| | 4,431 |
| | — |
| | 4,431 |
|
| Total | | $ | 9,257 |
| | $ | 2,964 |
| | $ | 12,221 |
| | $ | 11,056 |
| | $ | — |
| | $ | 11,056 |
|
| | |
| |
| |
| |
| |
| |
|
| Segment Income (3): | | | | | | | | | | | | |
| Engines | | $ | 9,593 |
| | $ | 53,913 |
| | $ | 63,506 |
| | $ | 81,641 |
| | $ | — |
| | $ | 81,641 |
|
| Products | | 22,012 |
| | 8,113 |
| | 30,125 |
| | 12,530 |
| | — |
| | 12,530 |
|
| Inter-Segment Eliminations | | 504 |
| | — |
| | 504 |
| | 652 |
| | — |
| | 652 |
|
| Total | | $ | 32,109 |
| | $ | 62,026 |
| | $ | 94,135 |
| | $ | 94,823 |
| | $ | — |
| | $ | 94,823 |
|
| | | | | | |
|
| | | | | |
|
|
| Interest Expense | | $ | (25,320 | ) | | $ | 2,228 |
| | $ | (23,092 | ) | | $ | (20,293 | ) | | $ | — |
| | $ | (20,293 | ) |
| | |
|
| |
|
| |
|
| |
|
| |
|
| |
|
|
| Income Before Income Taxes | | 11,101 |
| | 64,254 |
| | 75,355 |
| | 79,661 |
| | — |
| | 79,661 |
|
| Provision (Credit) for Income Taxes | | 22,421 |
| | (2,836 | ) | | 19,585 |
| | 23,011 |
| | — |
| | 23,011 |
|
| Net Income (Loss) | | $ | (11,320 | ) | | $ | 67,090 |
| | $ | 55,770 |
| | $ | 56,650 |
| | $ | — |
| | $ | 56,650 |
|
| | | | | | |
|
| | | | | |
|
|
| Earnings (Loss) Per Share | | | | | | | | | | | | |
| Basic | | $ | (0.28 | ) | | $ | 1.57 |
| | $ | 1.29 |
| | $ | 1.31 |
| | $ | — |
| | $ | 1.31 |
|
| Diluted | | (0.28 | ) | | 1.57 |
| | 1.29 |
| | 1.31 |
| | — |
| | 1.31 |
|
(1) For the twelve months of fiscal 2018, business optimization expenses include $4.8 million ($3.4 million after tax) of non-cash charges related primarily to plant & equipment impairment and accelerated depreciation, and $16.1 million ($11.4 million after tax) of cash charges related primarily to employee termination benefits, lease terminations, professional services and plant rearrangement activities. ESG&A includes $41.2 million ($29.6 million after tax) of non-cash charges related to the pension settlement. Tax expense also includes a $21.1 million charge associated with the Tax Cuts and Jobs Act of 2017 comprised of $13.8 million to revalue deferred tax assets and liabilities and $7.3 million to record the impact of the inclusion of foreign earnings. The company recognized in interest expense $2.2 million ($1.6 million after tax) for premiums paid to repurchase senior notes after receiving unsolicited offers from bondholders. For the twelve months of fiscal 2017, there were no adjustments.
(2) Adjusted financial results are non-GAAP financial measures. The Company believes this information is meaningful to investors as it isolates the impact that restructuring charges, acquisition-related charges, certain litigation charges, pension settlement charges, gains on sale of marketable securities, and goodwill and tradename impairment charges have on reported financial results and facilitates comparisons between peer companies. The Company may utilize non-GAAP financial measures as a guide in the forecasting, budgeting, and long-term planning process. While the Company believes that adjusted financial results are useful supplemental information, such adjusted financial results are not intended to replace its GAAP financial results and should be read in conjunction with those GAAP results.
(3) The Company defines segment income (loss) as income from operations plus equity in earnings of unconsolidated affiliates. For all periods presented, equity in earnings of unconsolidated affiliates is included in segment income (loss).
Net Sales
Consolidated net sales for fiscal 2018 were $1.88 billion. Consolidated net sales increased $95.2 million or 5.3% from fiscal 2017. Fiscal 2018 net sales of commercial products increased by approximately 16% to $505 million.
Engines segment net sales for fiscal 2018 were $1.06 billion, which was $32.5 million or 3.0% lower than the prior year. Sales were lower in North America due to certain channel partners taking a cautious approach to ordering inventory due to a delayed start of spring weather and a desire to further reduce channel inventory in advance of anticipated brand transitions next season. Sales into Europe were lower due to customers taking a cautious approach to ordering due to a delayed start of spring weather and the desire of certain channel partners to reduce their inventory levels in advance of new emissions requirements on engines that begin in calendar 2019. Partially offsetting the decrease were higher sales of Vanguard commercial engines.
Products segment net sales for fiscal 2018 were $904.0 million, an increase of $125.6 million or 16.1% from the prior year. Net sales increased primarily due to higher sales of commercial lawn and garden and job site equipment and generators, which included approximately $55 million in shipments related to hurricane activity in fiscal 2018.
Gross Profit Percentage
The consolidated gross profit percentage was 21.2% in fiscal 2018, a decrease of 30 basis points from fiscal 2017.
Included in consolidated gross profit for fiscal 2018 were pre-tax charges of $6.6 million related to the business optimization program. Of these charges, $3.8 million was recorded in the Products segment, and $2.8 million was recorded in the Engines segment.
The Engines segment gross profit percentage for fiscal 2018 was 23.7%, which was lower than the 23.8% in fiscal 2017. Adjusted gross profit percentage (which only included adjustments in the current year) increased 20 basis points compared to last year due to manufacturing efficiency improvements. The improvement in gross margins was offset by 8% lower production volumes. Higher pricing offset material and freight cost increases.
The Products segment gross profit percentage for fiscal 2018 was 16.0%, which was higher than the 15.6% in fiscal 2017. Adjusted gross profit percentage (which only included adjustments in the current year) increased 80 basis points year over year due to the contribution margin from hurricane-related sales, favorable sales mix from proportionately higher sales of commercial products and higher pricing. The margin improvement was partially offset by a reduction in manufacturing throughput of approximately 3.5% and higher freight costs.
Engineering, Selling, General and Administrative Expenses
Engineering, selling, general and administrative expenses were $375.2 million in fiscal 2018, an increase of $75.2 million or 25.1% from fiscal 2017.
Included in engineering, selling, general and administrative expenses for fiscal 2018 were pre-tax charges of $52.4 million related to the business optimization program and pension settlement charges. Of these charges, $4.3 million was recorded in the Products segment for the business optimization program, and $48.1 million was recorded in the Engines segment for the business optimization program and pension settlement.
The Engines segment engineering, selling, general and administrative expenses were $248.3 million in fiscal 2018, or $61.3 million higher compared to fiscal 2017, primarily due to a $41.2 million pension settlement charge and $6.9 million of business optimization program charges in fiscal 2018. Adjusted engineering, selling, general and administrative expenses (which only included adjustments in the current year) were $14.6 million higher than fiscal 2017, primarily due to $2.9 million of higher spending related to the ERP upgrade, higher marketing costs, and funding growth initiatives.
The Products segment engineering, selling, general and administrative expenses were $126.9 million in fiscal 2018, an increase of $13.9 million from fiscal 2017. Adjusted engineering, selling, general and administrative expenses (which only included adjustments in the current year) were $9.6 million higher than fiscal 2017, primarily due to increased sales commissions, increased spend related to the ERP upgrade, higher marketing costs, and funding growth initiatives.
Interest Expense
Interest expense for fiscal 2018 was $25.3 million, which was $5.0 million higher than fiscal 2017 due to premiums paid to repurchase senior notes after receiving unsolicited offers. Adjusted interest expense (which only included adjustments in the current year) was $2.8 million higher than fiscal 2017 primarily due to increased average net borrowings and higher interest rates.
Provision for Income Taxes
On December 22, 2017, the U.S. government enacted significant tax legislation commonly referred to as the Tax Act. As a result of the Tax Act, the Company was subject to a U.S. federal statutory corporate income tax rate of 28% for the fiscal year ending July 1, 2018 and a U.S. federal statutory corporate income tax rate of 21% in future fiscal years. Overall, the Company anticipates the decrease in the U.S. federal statutory rate resulting from the enactment of the Tax Act will have favorable impact on its future consolidated tax expense and operating cash flows.
Within the calculation of the Company’s tax rate, various assumptions and estimates have been used that may change as a result of future guidance, interpretation, and legislation from the Internal Revenue Service, the SEC, the Financial Accounting Standards Board (“FASB”) and/or various other taxing jurisdictions. For example, the Company anticipates that U.S. state jurisdictions will continue to determine and announce their conformity to the Tax Act which could have an impact on the Company’s tax rate. The Tax Act contains many significant changes to U.S. tax laws, the consequences of which have not yet been fully determined.
The Company was also in the process of evaluating its permanent reinvestment assertions since the Tax Act may provide opportunity to repatriate overseas cash to the U.S. at a lower tax cost. There is a dividends received deduction available for certain foreign distributions under the Tax Act, but certain foreign earnings remain subject to withholding taxes upon repatriation. As of July 1, 2018, the Company had analyzed its global working capital and cash requirements and the potential tax liabilities attributable to repatriation of its foreign earnings. In the second quarter of fiscal 2018, the Company removed its permanent reinvestment assertion on approximately $25 million of its foreign earnings. During the third quarter of fiscal 2018, the Company made distributions from its foreign earnings related to the assertion removal in the second quarter of approximately $18 million. The Company recorded the estimated tax impact in its financial statements and continues to evaluate its cash needs and strategic opportunities to repatriate cash.
Business Optimization Program
For fiscal 2018, the Company recorded business optimization charges of $20.9 million ($14.8 million after tax or $0.34 per diluted share).
Liquidity and Capital Resources
FISCAL YEARS 2019, 2018 AND 2017
Cash flows provided by (used in) operating activities for fiscal 2019 were ($35) million compared to $93 million in fiscal 2018. The decrease in cash provided by operating activities was primarily related to elevated inventory balances and the increased net loss as compared to prior year. Partially offsetting the decrease is elevated accounts payable balances and lower pension plan contributions.
Cash flows provided by operating activities for fiscal 2018 were $93 million compared to $90 million in fiscal 2017. The increase in cash provided by operating activities was primarily related to changes in working capital, including more rapid collections of accounts receivable partially offset by higher inventory levels due to timing of shipments. The improvement in operating cash flows was partially offset by a $30 million voluntary contribution made to the pension plan in the third quarter of fiscal 2018.
Net cash used in investing activities was $61 million, $104 million, and $79 million in fiscal 2019, 2018 and 2017, respectively. These cash flows include capital expenditures of $53 million, $103 million, and $83 million in fiscal 2019, 2018 and 2017, respectively. The capital expenditures in fiscal 2018 related primarily to investment in the business optimization program, and the decrease in fiscal 2019 represents a return to normalized levels.
Net cash provided by (used in) financing activities was $78 million, $0.4 million, and ($39) million, in fiscal 2019, 2018 and 2017, respectively. In fiscal 2019, the Company repurchased treasury stock at a total cost of $12 million compared to $10 million and $20 million of stock repurchases in fiscal 2018 and 2017, respectively. The Company paid cash dividends on its common stock of $18 million in fiscal 2019, and $24 million in each of fiscal 2018 and 2017. In fiscal 2019, cash used for financing activities was offset by cash provided by net revolver borrowings of $160 million, compared to $48 million in 2018 and $0 million in 2017.
As of June 30, 2019, approximately $27 million of the Company's $30 million of cash and cash equivalents was held in non-U.S. subsidiaries.
Future Liquidity and Capital Resources
On December 20, 2010, the Company issued $225 million of 6.875% Senior Notes ("Senior Notes") due December 15, 2020. During fiscal 2019 and 2018, the Company repurchased $5 million and $22 million, respectively, of the Senior Notes after receiving unsolicited offers from bondholders. There were no repurchases in fiscal 2017.
On March 25, 2016, the Company entered into a $500 million amended and restated multicurrency credit agreement (the “Revolver”) that matures on March 25, 2021. The Revolver amended and restated the Company's $500 million multicurrency credit agreement dated as of October 13, 2011 (as previously amended), which would have matured on October 21, 2018. The initial maximum availability under the Revolver is $500 million. Availability under the Revolver is reduced by outstanding letters of credit. The Company may from time to time increase the maximum availability under the revolving credit facility by up to $250 million if certain conditions are satisfied. There were $160 million of borrowings under the Revolver as of June, 30 2019 and $48 million of borrowings as of July 1, 2018.
The Senior Notes and the Revolver contain restrictive covenants. These covenants include restrictions on the ability of the Company and/or certain subsidiaries to pay dividends, repurchase equity interests of the Company and certain subsidiaries, incur indebtedness, create liens, consolidate, merge and dispose of assets, and enter into transactions with affiliates. The Revolver contains financial covenants that require the Company to maintain a minimum interest coverage ratio of 3.0 to 1.0 and impose on the Company a maximum average leverage ratio of 3.5 to 1.0. The Senior Notes contain a financial covenant that requires the Company to maintain a minimum fixed charge coverage ratio of 2.0 to 1.0, as defined by the indenture. As of June 30, 2019, the Company's interest coverage ratio, average leverage ratio, and fixed charge coverage ratio were 3.57, 4.10, and 2.19, respectively.
On August 13, 2019, the Company entered into a consent memorandum pursuant to its revolving multicurrency credit agreement. Pursuant to the consent memorandum, the average leverage ratio covenant will not be tested for the computation period ended June 30, 2019 (the “Specified Computation Period”) and no failure (or anticipated failure) by the Company to comply with associated restrictions for the specified computation period will constitute (or be deemed to have constituted) a default or an event of default under the credit agreement. Additionally, no default shall be deemed to exist under the Credit Agreement for any anticipated failure by the Company to comply with such restrictions for the computation period ending on or about September 30, 2019. The Company was in compliance with all other financial covenants of the credit agreement as of June 30, 2019, and the failure or anticipated failure to comply with the average leverage ratio under the Credit Agreement is not considered to be a cross default for purposes of the Company’s Senior Notes.
The Company is in the process of refinancing its revolving credit agreement. The new revolving credit facility, which would be secured by certain of the Company's working capital and other assets, is planned to have a larger borrowing capacity that would allow the Company to retire the outstanding Senior Notes.
Although the Company is in the process of refinancing the revolving credit agreement which, among other things, reduces the risk of potential violations of the covenant in the future, the Company cannot guarantee that it will be able to refinance the revolving credit agreement with acceptable terms.
On April 21, 2016, the Board of Directors authorized $50 million in funds for use in the common share repurchase program which expired on June 29, 2018. On April 25, 2018, the Board of Directors authorized an additional $50 million in funds for use in the common share repurchase program expiring June 30, 2020. As of June 30, 2019, the total remaining authorization was $38 million. Share repurchases, among other things, allow the Company to offset any potentially dilutive impacts of share-based compensation. The common share repurchase program authorizes the purchase of shares of the Company's common stock on the open market or in private transactions from time to time, depending on market conditions and certain governing debt covenants. In fiscal 2019, the Company repurchased 725,321 shares on the open market at a total cost of $11.9 million, or $16.46 per share. There were 467,183 shares repurchased in fiscal 2018 at a total cost of $10.3 million, or $22.07 per share.
On August 15, 2019, the first quarter fiscal 2020 dividend of $0.05 per share was announced, which is reduced compared to $0.14 per share paid in the past several quarters.
The Company expects capital expenditures to be approximately $55 million in fiscal 2020. These anticipated expenditures reflect the continued reinvestment in efficient equipment and innovative new products.
During fiscal 2018, the Company made $30 million in voluntary cash contributions to the qualified pension plan. The Company made no contributions in fiscal 2019 to the qualified pension plan. Based upon current regulations and actuarial studies the Company is required to make no minimum contributions to the qualified pension plan in fiscal 2020, but the Company may choose to make discretionary contributions. The Company may be required to make further required contributions in future years or the future expected funding requirements may change depending on a variety of factors including the actual return on plan assets, the funded status of the plan in future periods, and changes in actuarial assumptions or regulations.
Management believes that available cash, cash generated from operations, existing lines of credit and access to debt markets will be adequate to fund the Company’s capital requirements and operational needs for the foreseeable future.
Financial Strategy
Management believes that the value of the Company is enhanced if the capital invested in operations yields a cash return that is greater than the cost of capital. Management maintains a balanced approach to capital allocation. The balance is amongst the following areas: reinvesting capital into physical assets and products that maintain or grow the global cost leadership and market positions that the Company has achieved and drive the economic value of the Company, identifying strategic acquisitions or alliances that may enhance revenues and provide a higher economic return, and returning capital to shareholders through dividends and/or share repurchases.
Off-Balance Sheet Arrangements
The Company has no off-balance sheet arrangements or significant guarantees to third parties not fully recorded in its Consolidated Balance Sheets or fully disclosed in its Notes to Consolidated Financial Statements. The Company’s significant contractual obligations include debt agreements and certain employee benefit plans.
Contractual Obligations
A summary of the Company’s expected payments for significant contractual obligations as of June 30, 2019 is as follows (in thousands):
|
| | | | | | | | | | | | | | | | | | | | |
| | | Total | | Fiscal 2020 | | Fiscal 2021-2022 | | Fiscal 2023-2024 | | Thereafter |
| Long-Term Debt | | $ | 195,464 |
| | $ | — |
| | $ | 195,464 |
| | $ | — |
| | $ | — |
|
| Interest on Long-Term Debt | | 20,157 |
| | 13,438 |
| | 6,719 |
| | — |
| | — |
|
| Revolving Credit Facility | | 160,540 |
| | — |
| | 160,540 |
| | — |
| | — |
|
| Operating Leases | | 146,915 |
| | 20,453 |
| | 32,963 |
| | 19,860 |
| | 73,639 |
|
| Purchase Obligations | | 57,869 |
| | 57,869 |
| |
|
| | — |
| | — |
|
| Other Liabilities (a) | | 128,000 |
| | — |
| | 34,000 |
| | 53,000 |
| | 41,000 |
|
| | | $ | 708,945 |
| | $ | 91,760 |
| | $ | 429,686 |
| | $ | 72,860 |
| | $ | 114,639 |
|
(a) Includes an estimate of future expected funding requirements related to the Company's pension plans. Funding requirements related to pension plans are based upon current regulations and actuarial studies. The amounts included may change in the future depending on a variety of factors including the actual return on plan assets, the funded status of the plan in future periods, and changes in actuarial assumptions or regulations. Any further funding requirements for pension plans beyond fiscal 2027 cannot be estimated at this time. Because their future cash outflows are uncertain, liabilities for unrecognized tax benefits and other sundry items are excluded from the table above.
Critical Accounting Policies
The Company’s accounting policies are described in Note 2 of the Notes to Consolidated Financial Statements. As discussed in Note 2, the preparation of financial statements in conformity with accounting principles generally accepted in the U.S. (“GAAP”) requires management to make estimates and assumptions about future events that affect the amounts reported in the financial statements and accompanying notes. Future events and their effects cannot be determined with absolute certainty. Therefore, the determination of estimates requires the exercise of judgment. Actual results inevitably will differ from those estimates, and such differences may be material to the financial statements.
The Company believes the following critical accounting policies represent the more significant judgments and estimates used in preparing the consolidated financial statements.
Goodwill and Other Intangible Assets
Goodwill represents the excess of purchase price over tangible and intangible assets acquired less liabilities assumed arising from business combinations. Goodwill is not amortized. The Company evaluates goodwill and other indefinite-lived intangible assets for impairment annually as of the end of the fourth fiscal quarter, and more frequently if events or circumstances indicate that the assets may be impaired.
The Company tests goodwill using a two-step process. The first step of the goodwill impairment test is to identify a potential impairment by comparing the carrying values of each of the Company's reporting units to their estimated fair values as of the test dates. The estimates of fair value of the reporting units are computed using either an income approach, a market approach, or a combination of both. The income approach utilizes a multi-year forecast of estimated cash flows and a terminal value at the end of the cash flow period. The forecast period assumptions consist of internal projections that are based on the Company's budget and long-range strategic plan. The discount rate used at the test date is the weighted-average cost of capital which reflects the overall level of inherent risk of the reporting unit and the rate of return an outside investor would expect to earn. Valuations using the market approach are derived from metrics of publicly traded companies or historically completed transactions of comparable businesses. The selection of comparable businesses is
based on the markets in which the reporting units operate giving consideration to risk profiles, size, geography, and diversity of products and services.
If the fair value of a reporting unit exceeds its book value, goodwill of the reporting unit is not deemed impaired and the second step of the impairment test is not performed. If the book value of a reporting unit exceeds its fair value, the second step of the goodwill impairment test is performed to measure the amount of impairment loss, if any. The second step of the goodwill impairment test compares the implied fair value of the reporting unit’s goodwill with the carrying amount of that goodwill. The implied fair value of goodwill is determined by allocating the estimated fair value of the reporting unit to the estimated fair value of its existing tangible assets and liabilities as well as existing identified intangible assets and previously unrecognized intangible assets in a manner similar to a purchase price allocation. The unallocated portion of the estimated fair value of the reporting unit is the implied fair value of goodwill. If the carrying amount of the reporting unit’s goodwill exceeds the implied fair value of that goodwill, an impairment loss is recognized in an amount equal to that excess.
The Company performed the annual impairment test on all of its reporting units as of June 30, 2019. A quantitative test indicated that the estimated fair value of the Engines reporting unit exceeded its corresponding carrying amount, including recorded goodwill, and as such, no impairment existed. At June 30, 2019, the Engines reporting unit had $137.1 million of goodwill. The Company also performed a quantitative impairment test over its Products reportable segment, which consists of three reporting units, specifically Turf & Consumer, Standby Generators, and Job Site reporting units. The Standby Generators reporting unit does not have goodwill. The impairment testing performed by the Company at June 30, 2019 indicated that the estimated fair value of the Turf & Consumer reporting unit exceeded its corresponding carrying amount, including recorded goodwill, and as such, no impairment existed. At June 30, 2019, the Turf & Consumer reporting unit had $20.1 million of goodwill. The impairment testing performed by the Company at June 30, 2019 indicated that the estimated fair value of the Job Site reporting unit exceeded its corresponding carrying amount, including recorded goodwill, and as such, no impairment existed. At June 30, 2019, the Job Site reporting unit had $12.0 million of goodwill.
The Company utilizes the discounted cash flow method under the income approach to estimate the fair value of our reporting units. Some of the significant assumptions inherent in estimating the fair values include the estimated future annual net cash flows for each reporting unit (including net sales, operating income margin, and working capital) and a discount rate that appropriately reflects the risks inherent in each future cash flow stream. The Company selected assumptions used in the financial forecasts using historical data, supplemented by current and anticipated market conditions, estimated growth rates, management’s plans, and guideline companies. The assumptions included in the impairment test require judgment, and changes to these inputs could impact the results of the calculation.
The Jobsite reporting unit fair value exceeded the carrying value by less than 10% as of the latest 2019 impairment testing date. The discount rate the Company used to determine the fair value was 14.3%. The Turf & Consumer reporting unit fair value exceeded the carrying value by more than 10% but less than 20% as of the latest 2019 impairment testing date. The discount rate the Company used to determine the fair value was 14.2%.The Engines reporting unit fair value exceeded the carrying value by more than 20% as of the latest 2019 impairment testing date. The discount rate the Company used to determine the fair value was 14.9%.
Quantitative assessments of goodwill and tradenames involve significant judgments by management. Although the Company’s cash flow forecasts are based on assumptions that are considered reasonable by management and consistent with the plans and estimates management is using to operate the underlying businesses, there is significant judgment in determining the expected future cash flows attributable to these businesses. Changes in such estimates or the application of alternative assumptions could produce significantly different results.
Tradenames are not amortized. If impairment occurs, the impaired amount of the tradename is written off immediately. For purposes of the tradename impairment analysis, the Company performs its assessment of fair value based on an income approach using the relief-from-royalty method. This methodology assumes that, in lieu of ownership, a third party would be willing to pay a royalty in order to exploit the related benefits
of these types of assets. The Company determines the fair value of each tradename by applying a royalty rate to a projection of net sales discounted using a risk adjusted cost of capital. The Company believes the relief-from-royalty method to be an acceptable methodology due to its common use by valuation specialists in determining the fair value of intangible assets. Sales growth rates are determined after considering current and future economic conditions, recent sales trends, discussions with customers, planned timing of new product launches and many other variables. Each royalty rate is based on profitability of the business to which it relates and observed market royalty rates.
As discussed in Note 7 to the consolidated financial statements, the Company performed the annual impairment test on its indefinite-lived intangible assets as of June 30, 2019 and determined that no indefinite-lived intangible asset impairment existed. The assumptions included in the impairment test require judgment, and changes to these inputs could impact the results of the calculation.
Definite-lived intangible assets consist primarily of customer relationships and patents. These definite-lived intangible assets are amortized over their estimated useful lives and are subject to impairment testing if events or changes in circumstances indicate that an asset may be impaired.
Pension and Other Postretirement Plans
The pension benefit obligation and related pension expense or income are impacted by certain actuarial assumptions, including the discount rate, mortality tables, and the expected rate of return on plan assets. These rates are evaluated on an annual basis considering such factors as market interest rates and historical asset performance. Actuarial valuations at June 30, 2019 used a discount rate of 3.60% and the determination of fiscal 2019 expense used an expected rate of return on plan assets of 7.05%. The discount rate was selected using a methodology that matches plan cash flows with a selection of Standard and Poor’s AA or higher rated bonds, resulting in a discount rate that better matches a bond yield curve with comparable cash flows. A 0.25% decrease in the discount rate would decrease annual pension service and interest costs by approximately $1.6 million. A 0.25% decrease in the expected return on plan assets would increase annual pension service and interest costs by approximately $2.2 million. In estimating the expected return on plan assets, the Company considers the historical returns on plan assets, adjusted for forward looking considerations, including inflation assumptions and active management of the plan’s invested assets, knowing that investment performance has been in the top decile compared to other plans. Changes in the discount rate, mortality tables, and return on assets can have a significant effect on the funded status of the pension plans, shareholders' investment and related expense. The Company cannot predict these changes in discount rates or investment returns and, therefore, cannot reasonably estimate whether the impact in subsequent years will be significant.
The funded status of the Company’s pension plan is the difference between the projected benefit obligation and the fair value of its plan assets. The projected benefit obligation is the actuarial present value of all benefits expected to be earned by the employees’ service adjusted for future potential wage increases. At June 30, 2019 and July 1, 2018, the fair value of plan assets was less than the projected benefit obligation by approximately $225 million and $193 million, respectively.
During fiscal 2019, the Company made no voluntary cash contributions to the qualified pension plan. Based upon current regulations and actuarial studies the Company is required to make no minimum contributions to the qualified pension plan in fiscal 2020, but the Company may choose to make discretionary contributions. The Company may be required to make further required contributions in future years or the future expected funding requirements may change depending on a variety of factors including the actual return on plan assets, the funded status of the plan in future periods, and changes in actuarial assumptions or regulations.
During the fourth quarter of fiscal 2018, the Company annuitized a portion of the qualified pension plan obligation which removed approximately $100 million of pension benefit obligation and offsetting assets. This transaction resulted in a non-cash pre-tax charge of $41.2 million ($29.6 million after tax) during 2018.
In 2012, the Board of Directors of the Company authorized an amendment to the Company's defined benefit retirement plans for U.S. non-bargaining employees. The amendment froze accruals for all non-bargaining employees effective December 31, 2013.
The other postretirement benefits obligation and related expense or income are impacted by certain actuarial assumptions, including the health care trend rate. An increase of one percentage point in health care costs would increase the accumulated postretirement benefit obligation by $0.8 million and would increase the service and interest cost by $41 thousand. A corresponding decrease of one percentage point would decrease the accumulated postretirement benefit by $0.8 million and decrease the service and interest cost by $46 thousand.
For pension and postretirement benefits, actuarial gains and losses are accounted for in accordance with U.S. GAAP. Refer to Note 16 of the Notes to the Consolidated Financial Statements for additional discussion.
Contingent Liabilities
The Company has contingent liabilities related to litigation and claims that arise in the normal course of business. The Company accrues for contingent liabilities when management determines it is probable that a liability has been incurred and the amount can be reasonably estimated. Liabilities are recorded based on management’s current judgments as to the probable and reasonably estimable outcome of the contingencies. To the extent that management’s future judgments related to the outcome of the contingencies differ from current expectations or as additional information becomes available, earnings could be impacted in the period such changes occur. See Note 13, “Commitments and Contingencies,” to the Consolidated Financial Statements for a description of these matters.
New Accounting Pronouncements
Refer to Note 3 of the Notes to the Consolidated Financial Statements.
Other Matters
Labor Agreements
The Company has collective bargaining agreements with its unions. These collective bargaining agreements cover approximately 10% of the total employees as of June 30, 2019. The Labor Agreement with United Steelworkers Local 2-232 expired on July 31, 2017. The Company and the union have met and the Company implemented its final offer to the Union on June 14, 2018, but remains hopeful that the parties will continue to work together to reach a new agreement. This agreement covers 557 hourly employees in the Wauwatosa, Germantown and Menomonee Falls, Wisconsin facilities. The Company has another collective bargaining agreement with its remaining union workforce in Georgia, which expires during calendar 2020, however, it is anticipated that location will be closing in December 2019. At the present time the Company does not anticipate a work stoppage.
Emissions
The United States Environmental Protection Agency (EPA) has adopted multiple stages of emission regulations for small air cooled engines. The Company currently has a full product offering that complies with the standards in those regulations.
Canada has adopted updated regulations aligning its requirements to US EPA Phase 3, fully taking effect January 1, 2019 for Briggs & Stratton. The Company does not anticipate that compliance with these revisions will have a material adverse effect on its financial position or operations, as they are substantially similar to the existing EPA standards.
The California Air Resources Board (CARB) made revisions to its existing evaporative emission regulations for small off road engines. The Company does not anticipate that compliance with these revisions will have a material adverse effect on its financial position or operations. CARB has also announced that it will develop a Tier IV plan which contemplates changing the emission regulations for all mobile sources, however no date of implementation or expectation of emission reductions has been formally announced.
The European Union has adopted multiple stages of emission standards for small air cooled engines and will be implementing regulations in 2019 that align with the EPA's Phase 3 standards. The Company does not anticipate that compliance with these revisions will have a material adverse effect on its financial position or operations as they are substantially similar to the EPA's existing standards.
Australia adopted emission regulations aligning requirements with EU Stage II, EU Stage V and EPA Phase 3 requirements beginning July 1, 2018.The Company does not anticipate that compliance with these regulations will have a material adverse effect on its financial position or operations as they are substantially similar to EPA standards.
China announced that it will be adopting exhaust and evaporative emission regulations for small air cooled engines that align with the EPA's Phase 3 standards to be effective in 2020. The Company does not anticipate that compliance with these standards will have a material adverse effect on its financial position or operations as they are expected to be substantially similar to the EU Stage V standards.
|
| |
| ITEM 7A. | QUANTITATIVE AND QUALITATIVE DISCLOSURES ABOUT MARKET RISK |
The Company is exposed to market risk stemming from changes in foreign exchange rates, commodity prices and interest rates. The Company uses financial instruments to minimize earnings and cash flow volatility associated with changes in certain foreign exchange rates, commodity prices and interest rates. The Company does not hold or issue financial instruments for trading purposes. The Company is also exposed to equity market risk pertaining to the trading price of the common stock.
Foreign Currency
In the normal course of business, the Company actively manages the exposure of foreign currency exchange rate market risk by entering into financial instruments with highly rated counterparties. The Company’s earnings are affected by fluctuations in the value of the U.S. Dollar against various currencies. The Company receives Euros for certain products sold to European customers and receives Canadian dollars for certain products sold to Canadian customers. The Yen and Renminbi are used to purchase engines from the Company's joint venture in Japan and the Company's subsidiary in China, respectively. The Company's foreign subsidiaries’ earnings are also influenced by fluctuations of local currencies, including the Australian dollar and Brazilian Real, against the U.S. dollar as these subsidiaries purchase components and inventory from vendors and the parent in U.S. dollars. Forward foreign exchange contracts are used to partially hedge against the earnings effects of such fluctuations.
At June 30, 2019, the Company had the following forward foreign exchange contracts outstanding with the notional value shown in local currency and the fair value and fair value (gains) losses shown in U.S. dollars (in thousands): |
| | | | | | | | | | | | | |
Hedge Currency | | Notional Value | | Fair Value | | Conversion Currency | | (Gain) Loss at Fair Value |
| Australian Dollar | | 17,611 |
| | $ | 12,329 |
| | U.S. | | $ | (331 | ) |
| Brazilian Real | | 13,436 |
| | $ | 3,461 |
| | U.S. | | $ | 30 |
|
| Canadian Dollar | | 14,610 |
| | $ | 11,171 |
| | U.S. | | $ | 88 |
|
| Chinese Renminbi | | 70,555 |
| | $ | 10,267 |
| | U.S. | | $ | (113 | ) |
| Euro | | 2,750 |
| | $ | 3,161 |
| | U.S. | | $ | (151 | ) |
Amounts invested in the Company's non-U.S. subsidiaries and joint ventures are translated into U.S. dollars at the exchange rates in effect at fiscal year-end. The resulting cumulative translation adjustments are recorded in Shareholders’ Investment as Accumulated Other Comprehensive Income (Loss). The cumulative translation adjustments component of Shareholders’ Investment increased by $2.8 million during fiscal 2019. Using the year-end exchange rates, the total amount invested in non-U.S. subsidiaries on June 30, 2019 was approximately $261.3 million.
Commodity Prices
The Company is exposed to fluctuating market prices for commodities, including steel, natural gas, and
aluminum. The Company has established programs to manage commodity price fluctuations through financial and physical contracts. The maturities of these contracts coincide with the expected usage of the commodities for periods up to the next thirty-six months.
At June 30, 2019 the Company had the following outstanding commodity derivative contracts with the fair value (gains) losses shown (in thousands):
|
| | | | | | | | | | | |
Hedge Commodity | | Notional Value | | Fair Value | | (Gain) Loss at Fair Value |
| Natural Gas (Therms) | | 7,627 |
| | $ | 2,121 |
| | $ | 191 |
|
Interest Rates
The Company is exposed to interest rate fluctuations on its borrowings, depending on general economic conditions. On June 30, 2019, long-term loans consisted of the following (in thousands):
|
| | | | | | | | |
| Description | | Amount | | Maturity | | Interest Rate |
| 6.875% Senior Notes | | $ | 195,464 |
| | December 2020 | | 6.875% |
The Senior Notes carry a fixed rate of interest and are therefore not subject to market fluctuation.
The Company enters into interest rate swaps to manage a portion of its interest rate risk from financing certain dealer and distributor inventories through third party financing sources. The swaps are designated as cash flow hedges and are used to effectively fix the interest payments to a third party financing source, exclusive of lender spreads, ranging from 0.98% to 2.83% for a notional principal amount of $110 million with expiration dates ranging from July 2021 to June 2024.
In the second quarter of fiscal 2019, the Company began entering into interest rate swaps to manage a portion of its interest rate risk from anticipated floating rate, LIBOR based indebtedness, exclusive of lender spreads, ranging from 2.47% to 3.13%. The swaps are designated as cash flow hedges, in an aggregate amount of $120 million, with termination dates between June 2023 and December 2029.
|
| |
| ITEM 8. | FINANCIAL STATEMENTS AND SUPPLEMENTARY DATA |
|
| |
| INDEX TO CONSOLIDATED FINANCIAL STATEMENTS | Page |
| | |
| Consolidated Balance Sheets, June 30, 2019 and July 1, 2018 | |
| | |
| For the Fiscal Years Ended June 30, 2019, July 1, 2018, and July 2, 2017: | |
| Consolidated Statements of Operations | |
| Consolidated Statements of Comprehensive Income (Loss) | |
| Consolidated Statements of Shareholders' Investment | |
| Consolidated Statements of Cash Flows | |
| Notes to Consolidated Financial Statements | |
| | |
| Reports of Independent Registered Public Accounting Firm | |
| | |
| FINANCIAL STATEMENT SCHEDULES | |
| Schedule II – Valuation and Qualifying Accounts | |
|
| | |
| Consolidated Balance Sheets | | |
| | | |
AS OF JUNE 30, 2019 AND JULY 1, 2018
(in thousands)
|
| | | | | | | | |
| ASSETS | | 2019 | | 2018 |
| CURRENT ASSETS: | | | | |
| Cash and Cash Equivalents | | $ | 29,569 |
| | $ | 44,923 |
|
| Receivables, Less Reserves of $7,043 and $2,608, Respectively | | 198,498 |
| | 182,801 |
|
| Inventories: | | | | |
| Finished Products | | 344,277 |
| | 290,108 |
|
| Work in Process | | 145,182 |
| | 111,409 |
|
| Raw Materials | | 12,547 |
| | 10,314 |
|
| Total Inventories | | 502,006 |
| | 411,831 |
|
| Prepaid Expenses and Other Current Assets | | 32,404 |
| | 39,651 |
|
| Total Current Assets | | 762,477 |
| | 679,206 |
|
| GOODWILL | | 169,682 |
| | 163,200 |
|
| INVESTMENTS | | 49,641 |
| | 50,960 |
|
| OTHER INTANGIBLE ASSETS, Net | | 96,738 |
| | 95,864 |
|
| LONG-TERM DEFERRED INCOME TAX ASSET | | 43,172 |
| | 12,149 |
|
| OTHER LONG-TERM ASSETS, Net | | 18,676 |
| | 20,507 |
|
| PLANT AND EQUIPMENT: | | | | |
| Land and Land Improvements | | 15,210 |
| | 15,188 |
|
| Buildings | | 137,704 |
| | 134,896 |
|
| Machinery and Equipment | | 1,031,523 |
| | 879,535 |
|
| Construction in Progress | | 35,902 |
| | 145,546 |
|
| | | 1,220,339 |
| | 1,175,165 |
|
| Less - Accumulated Depreciation | | 809,294 |
| | 753,085 |
|
| Total Plant and Equipment, Net | | 411,045 |
| | 422,080 |
|
| | | $ | 1,551,431 |
| | $ | 1,443,966 |
|
The accompanying Notes to Consolidated Financial Statements are an integral part of these statements.
36
AS OF JUNE 30, 2019 AND JULY 1, 2018
(in thousands, except per share data)
|
| | | | | | | | |
| LIABILITIES AND SHAREHOLDERS’ INVESTMENT | | 2019 | | 2018 |
| CURRENT LIABILITIES: | | | | |
| Accounts Payable | | $ | 287,620 |
| | $ | 204,173 |
|
| Short-Term Debt | | 160,540 |
| | 48,036 |
|
| Accrued Liabilities: | | | | |
| Wages and Salaries | | 24,781 |
| | 41,136 |
|
| Warranty | | 28,030 |
| | 29,546 |
|
| Accrued Postretirement Health Care Obligation | | 6,760 |
| | 8,418 |
|
| Other | | 70,014 |
| | 52,797 |
|
| Total Accrued Liabilities | | 129,585 |
| | 131,897 |
|
| Total Current Liabilities | | 577,745 |
| | 384,106 |
|
| ACCRUED PENSION COST | | 221,033 |
| | 189,872 |
|
| ACCRUED EMPLOYEE BENEFITS | | 21,311 |
| | 20,196 |
|
| ACCRUED POSTRETIREMENT HEALTH CARE OBLIGATION | | 25,929 |
| | 30,186 |
|
| ACCRUED WARRANTY | | 19,572 |
| | 15,781 |
|
| OTHER LONG-TERM LIABILITIES | | 44,152 |
| | 33,447 |
|
| LONG-TERM DEBT | | 194,969 |
| | 199,954 |
|
| COMMITMENTS AND CONTINGENCIES (Note 13) | | | | |
| SHAREHOLDERS’ INVESTMENT: | | | | |
Common Stock - Authorized 120,000 Shares $.01 Par Value, Issued 57,854 Shares | | 579 |
| | 579 |
|
| Additional Paid-In Capital | | 78,902 |
| | 76,408 |
|
| Retained Earnings | | 993,873 |
| | 1,071,480 |
|
| Accumulated Other Comprehensive Loss | | (292,550 | ) | | (252,272 | ) |
| Treasury Stock at Cost, 15,796 and 15,237 Shares, Respectively | | (334,084 | ) | | (325,771 | ) |
| Total Shareholders’ Investment | | 446,720 |
| | 570,424 |
|
| | | $ | 1,551,431 |
| | $ | 1,443,966 |
|
The accompanying Notes to Consolidated Financial Statements are an integral part of these statements.
37
|
| | |
| Consolidated Statements of Operations | |
| | | |
FOR THE FISCAL YEARS ENDED JUNE 30, 2019, JULY 1, 2018 AND JULY 2, 2017
(in thousands, except per share data)
|
| | | | | | | | | | | | |
| | | 2019 | | 2018 | | 2017 |
| NET SALES | | $ | 1,836,605 |
| | $ | 1,881,294 |
| | $ | 1,786,103 |
|
| COST OF GOODS SOLD | | 1,535,554 |
| | 1,483,212 |
| | 1,402,274 |
|
| Gross Profit | | 301,051 |
| | 398,082 |
| | 383,829 |
|
| ENGINEERING, SELLING, GENERAL AND ADMINISTRATIVE EXPENSES | | 349,276 |
| | 375,230 |
| | 300,062 |
|
| EQUITY IN EARNINGS OF UNCONSOLIDATED AFFILIATES | | 9,029 |
| | 9,257 |
| | 11,056 |
|
| Income (Loss) from Operations | | (39,196 | ) | | 32,109 |
| | 94,823 |
|
| INTEREST EXPENSE | | (29,242 | ) | | (25,320 | ) | | (20,293 | ) |
| OTHER INCOME, Net | | 340 |
| | 4,312 |
| | 5,131 |
|
| Income (Loss) Before Income Taxes | | (68,098 | ) | | 11,101 |
| | 79,661 |
|
| PROVISION (CREDIT) FOR INCOME TAXES | | (14,015 | ) | | 22,421 |
| | 23,011 |
|
| NET INCOME (LOSS) | | $ | (54,083 | ) | | $ | (11,320 | ) | | $ | 56,650 |
|
| | | | | | | |
| EARNINGS (LOSS) PER SHARE | | | | | | |
| Basic | | $ | (1.31 | ) | | $ | (0.28 | ) | | $ | 1.31 |
|
| Diluted | | $ | (1.31 | ) | | $ | (0.28 | ) | | $ | 1.31 |
|
| | | | | | | |
| WEIGHTED AVERAGE SHARES OUTSTANDING | | | | | | |
| Basic | | 41,647 |
| | 42,068 |
| | 42,178 |
|
| Diluted | | 41,647 |
| | 42,068 |
| | 42,263 |
|
The accompanying Notes to Consolidated Financial Statements are an integral part of these statements.
38
|
| | |
| Consolidated Statements of Comprehensive Income (Loss) |
| | | |
FOR THE FISCAL YEARS ENDED JUNE 30, 2019, JULY 1, 2018 AND JULY 2, 2017
(in thousands)
|
| | | | | | | | | | | | |
| | | 2019 | | 2018 | | 2017 |
| Net Income (Loss) | | $ | (54,083 | ) | | $ | (11,320 | ) | | $ | 56,650 |
|
| Other Comprehensive Income (Loss): | | | | | | |
| Cumulative Translation Adjustments | | (2,839 | ) | | (4,184 | ) | | (881 | ) |
| Unrealized Gain (Loss) on Derivative Instruments, Net of Tax Provision (Benefit) of ($4,279), $2,552, and $886, respectively | | (13,552 | ) | | 6,562 |
| | 1,476 |
|
| Unrecognized Pension & Postretirement Obligation, Net of Tax Provision (Benefit) of ($7,543), $17,646, and $22,697, respectively | | (23,887 | ) | | 45,376 |
| | 37,829 |
|
| Other Comprehensive Income (Loss) | | (40,278 | ) | | 47,754 |
| | 38,424 |
|
| Total Comprehensive Income (Loss) | | $ | (94,361 | ) | | $ | 36,434 |
| | $ | 95,074 |
|
The accompanying Notes to Consolidated Financial Statements are an integral part of these statements.
39
|
| | |
| Consolidated Statements of Shareholders’ Investment | |
| | | |
FOR THE FISCAL YEARS ENDED JUNE 30, 2019, JULY 1, 2018 AND JULY 2, 2017
(in thousands, except per share data) |
| | | | | | | | | | | | | | | | | | | | | | | | |
| | | Common Stock | | Additional Paid-In Capital | | Retained Earnings | | Accumulated Other Com- prehensive Income (Loss) | | Treasury Stock | | Total Shareholders' Investment |
| BALANCES, JULY 3, 2016 | | $ | 579 |
| | $ | 72,020 |
| | $ | 1,074,437 |
| | $ | (338,450 | ) | | $ | (314,960 | ) | | 493,626 |
|
| Net Income | | — |
| | — |
| | 56,650 |
| | — |
| | — |
| | 56,650 |
|
| Total Other Comprehensive Income, Net of Tax | | — |
| | — |
| | — |
| | 38,424 |
| | — |
| | 38,424 |
|
| Cash Dividends Paid ($0.54 per share) | | — |
| | — |
| | (24,054 | ) | | — |
| | — |
| | (24,054 | ) |
| Stock Option Activity, Net of Tax | | — |
| | (1,628 | ) | | — |
| | — |
| | 8,551 |
| | 6,923 |
|
| Restricted Stock | | — |
| | (3,439 | ) | | — |
| | — |
| | 2,506 |
| | (933 | ) |
| Amortization of Unearned Compensation | | — |
| | 3,336 |
| | — |
| | — |
| | — |
| | 3,336 |
|
| Deferred Stock | | — |
| | (655 | ) | | — |
| | — |
| | 1,675 |
| | 1,020 |
|
| Deferred Stock - Directors (1) | | — |
| | 3,928 |
| | — |
| | — |
| | 94 |
| | 4,022 |
|
| Treasury Stock Purchases | | — |
| | — |
| | — |
| | — |
| | (19,680 | ) | | (19,680 | ) |
| BALANCES, JULY 2, 2017 | | $ | 579 |
| | $ | 73,562 |
| | $ | 1,107,033 |
| | $ | (300,026 | ) | | $ | (321,814 | ) | | $ | 559,334 |
|
| Net Loss | | — |
| | — |
| | (11,320 | ) | | — |
| | — |
| | (11,320 | ) |
| Total Other Comprehensive Income, Net of Tax | | — |
| | — |
| |
|
| | 47,754 |
| | — |
| | 47,754 |
|
| Cash Dividends Paid ($0.56 per share) | | — |
| | — |
| | (23,951 | ) | | — |
| | — |
| | (23,951 | ) |
| Stock Option Activity, Net of Tax | | — |
| | 1,889 |
| | — |
| | — |
| | 3,943 |
| | 5,832 |
|
| Restricted Stock | | — |
| | (3,119 | ) | | — |
| | — |
| | 1,763 |
| | (1,356 | ) |
| Amortization of Unearned Compensation | | — |
| | 3,770 |
| | — |
| | — |
| | — |
| | 3,770 |
|
| Deferred Stock | | — |
| | (489 | ) | | — |
| | — |
| | 649 |
| | 160 |
|
| Deferred Stock - Directors | | — |
| | 795 |
| | (282 | ) | | — |
| | — |
| | 513 |
|
| Treasury Stock Purchases | | — |
| | — |
| |
|
| | — |
| | (10,312 | ) | | (10,312 | ) |
| BALANCES, JULY 1, 2018 | | $ | 579 |
| | $ | 76,408 |
| | $ | 1,071,480 |
| | $ | (252,272 | ) | | $ | (325,771 | ) | | $ | 570,424 |
|
| Net Loss | | — |
| | — |
| | (54,083 | ) | |
|
| | — |
| | (54,083 | ) |
| Total Other Comprehensive Loss, Net of Tax | | — |
| | — |
| |
|
| | (40,278 | ) | | — |
| | (40,278 | ) |
| Cash Dividends Declared ($0.56 per share) | | — |
| | — |
| | (23,304 | ) | | — |
| | — |
| | (23,304 | ) |
| Stock Option Activity, Net of Tax | | — |
| | 1,932 |
| | — |
| | — |
| | 1,862 |
| | 3,794 |
|
| Restricted Stock | | — |
| | (2,871 | ) | | — |
| | — |
| | 389 |
| | (2,482 | ) |
| Amortization of Unearned Compensation | | — |
| | 3,029 |
| | — |
| | — |
| | — |
| | 3,029 |
|
| Deferred Stock | | — |
| | (403 | ) | | — |
| | — |
| | 520 |
| | 117 |
|
| Deferred Stock - Directors | | — |
| | 807 |
| | (220 | ) | | — |
| | 853 |
| | 1,440 |
|
| Treasury Stock Purchases | | — |
| | — |
| |
|
| | — |
| | (11,937 | ) | | (11,937 | ) |
| BALANCES, JUNE 30, 2019 | | $ | 579 |
| | $ | 78,902 |
| | $ | 993,873 |
| | $ | (292,550 | ) | | $ | (334,084 | ) | | $ | 446,720 |
|
(1) See Note 14 for additional discussion.
The accompanying Notes to Consolidated Financial Statements are an integral part of these statements.
40
|
| | |
| Consolidated Statements of Cash Flows | |
| | | |
FOR THE FISCAL YEARS ENDED JUNE 30, 2019, JULY 1, 2018 AND JULY 2, 2017
(in thousands) |
| | | | | | | | | | | | |
| | | 2019 | | 2018 | | 2017 |
| CASH FLOWS FROM OPERATING ACTIVITIES: | | | | | | |
| Net Income (Loss) | | $ | (54,083 | ) | | $ | (11,320 | ) | | $ | 56,650 |
|
| Adjustments to Reconcile Net Income (Loss) to Net Cash Provided by (Used in) Operating Activities: | | | | | | |
| Depreciation and Amortization | | 64,200 |
| | 58,258 |
| | 56,183 |
|
| Stock Compensation Expense | | 7,180 |
| | 6,675 |
| | 4,923 |
|
| Pension Settlement Expense | | 521 |
| | 41,157 |
| | — |
|
| Equity in Earnings of Unconsolidated Affiliates | | (12,142 | ) | | (12,230 | ) | | (11,056 | ) |
| Dividends Received from Unconsolidated Affiliates | | 11,359 |
| | 10,911 |
| | 9,067 |
|
| Loss on Disposition of Plant and Equipment | | 551 |
| | 1,915 |
| | 857 |
|
| Provision for Deferred Income Taxes | | (17,949 | ) | | 35,351 |
| | 10,316 |
|
| Cash Contributions to Qualified Pension Plans | | — |
| | (30,000 | ) | | — |
|
| Change in Operating Assets and Liabilities: | | | | | | |
| Accounts Receivable | | (15,910 | ) | | 47,180 |
| | (41,655 | ) |
| Inventories | | (91,171 | ) | | (37,446 | ) | | 11,204 |
|
| Other Current Assets | | (1,304 | ) | | (4,759 | ) | | (1,759 | ) |
| Accounts Payable, Accrued Liabilities and Income Taxes | | 80,717 |
| | (10,345 | ) | | 8,152 |
|
| Other, Net | | (7,304 | ) | | (2,624 | ) | | (12,538 | ) |
| Net Cash Provided by (Used in) Operating Activities | | (35,335 | ) | | 92,723 |
| | 90,344 |
|
| CASH FLOWS FROM INVESTING ACTIVITIES: | | | | | | |
| Capital Expenditures | | (52,454 | ) | | (103,203 | ) | | (83,141 | ) |
| Cash Paid for Acquisitions, Net of Cash Acquired | | (8,866 | ) | | (1,800 | ) | | — |
|
| Proceeds Received on Disposition of Plant and Equipment | | 69 |
| | 339 |
| | 1,027 |
|
| Proceeds on Sale of Investment in Marketable Securities | | — |
| | — |
| | 3,343 |
|
| Net Cash Used in Investing Activities | | (61,251 | ) | | (104,664 | ) | | (78,771 | ) |
| CASH FLOWS FROM FINANCING ACTIVITIES: | | | | | | |
| Net Borrowings on Revolver | | 112,504 |
| | 48,036 |
| | — |
|
| Long Term Note Payable | | — |
| | 7,685 |
| | — |
|
| Repayments on Long-Term Debt | | (5,424 | ) | | (22,261 | ) | | — |
|
| Debt Issuance Costs | | — |
| | (1,154 | ) | | — |
|
| Cash Dividends Paid | | (17,781 | ) | | (23,951 | ) | | (24,054 | ) |
| Stock Option Exercise Proceeds | | 1,823 |
| | 3,772 |
| | 7,770 |
|
| Payment of Acquisition Contingent Liability | | (925 | ) | | — |
| | (1,625 | ) |
| Payments Related to Shares Withheld for Taxes for Stock Compensation | | (257 | ) | | (1,396 | ) | | (1,750 | ) |
| Treasury Stock Purchases | | (11,937 | ) | | (10,312 | ) | | (19,680 | ) |
| Net Cash Provided by (Used in) Financing Activities | | 78,003 |
| | 419 |
| | (39,339 | ) |
| EFFECT OF FOREIGN CURRENCY EXCHANGE RATE CHANGES ON CASH AND CASH EQUIVALENTS | | (293 | ) | | (967 | ) | | (366 | ) |
| NET DECREASE IN CASH AND CASH EQUIVALENTS | | (18,876 | ) | | (12,489 | ) | | (28,132 | ) |
| CASH AND CASH EQUIVALENTS BEGINNING OF YEAR (1) | | 49,218 |
| | 61,707 |
| | 89,839 |
|
| CASH AND CASH EQUIVALENTS END OF YEAR (2) | | $ | 30,342 |
| | $ | 49,218 |
| | $ | 61,707 |
|
| SUPPLEMENTAL DISCLOSURE OF CASH FLOW INFORMATION: | | | | | | |
| Interest Paid | | $ | 27,161 |
| | $ | 24,075 |
| | $ | 19,422 |
|
| Income Taxes Paid | | $ | 3,309 |
| | $ | 606 |
| | $ | 4,683 |
|
(2) Included within Ending Cash, Cash Equivalents, and Restricted Cash is approximately $0.8 million and $4.3 million of restricted cash as of June 30, 2019 and July 1, 2018, respectively.
The accompanying Notes to Consolidated Financial Statements are an integral part of these statements.
41
|
| | |
| Notes to Consolidated Financial Statements | |
| | | |
FOR THE FISCAL YEARS ENDED JUNE 30, 2019, JULY 1, 2018 AND JULY 2, 2017
(1) Nature of Operations:
Briggs & Stratton Corporation (the “Company”) is a U.S. based producer of gasoline engines and outdoor power equipment. The Company’s Engines segment sells engines worldwide, primarily to original equipment manufacturers of lawn & garden equipment and other gasoline engine powered equipment. The Company’s Products segment designs, manufactures and markets a wide range of outdoor power equipment, job site products, and related accessories.
(2) Summary of Significant Accounting Policies:
Fiscal Year: The Company’s fiscal year consists of 52 or 53 weeks, ending on the Sunday nearest the last day of June in each year. The 2019, 2018 and 2017 fiscal years were each 52 weeks long. All references to years relate to fiscal years rather than calendar years.
Principles of Consolidation: The consolidated financial statements include the accounts of the Company and its majority owned domestic and foreign subsidiaries after elimination of intercompany accounts and transactions. Investments in companies for which the Company has significant influence are accounted for by the equity method.
Accounting Estimates: The preparation of financial statements in conformity with accounting principles generally accepted in the United States requires management to make estimates and assumptions that affect the reported amounts of assets and liabilities and disclosure of contingent assets and liabilities at the date of the financial statements and the reported amounts of revenues and expenses during the reporting period. Actual results may differ from those estimates.
Cash and Cash Equivalents: This caption includes cash, commercial paper and certificates of deposit. The Company considers all highly liquid investments purchased with an original maturity of three months or less to be cash equivalents.
Receivables: Receivables are recorded at their original carrying value less reserves for estimated uncollectible accounts. The Company estimates and records an allowance for doubtful accounts based on specific identification and historical experience. The Company writes off uncollectible accounts against the allowance for doubtful accounts after all collection efforts have been exhausted.
Inventories: Inventories are stated at cost, which does not exceed market. The last-in, first-out (LIFO) method was used for determining the cost of approximately 50% of total inventories at June 30, 2019 and 50% at July 1, 2018. The cost for the remaining inventories was determined using the first-in, first-out (FIFO) method. If the FIFO inventory valuation method had been used exclusively, inventories would have been $70.1 million and $65.4 million higher at the end of fiscal 2019 and 2018, respectively. The LIFO inventory adjustment was determined on an overall basis, and accordingly, each class of inventory reflects an allocation based on the FIFO amounts.
Goodwill and Other Intangible Assets: Goodwill reflects the cost of acquisitions in excess of the fair values assigned to identifiable net assets acquired. Goodwill is assigned to reporting units based upon the expected benefit of the synergies of the acquisition.
Other Intangible Assets reflect identifiable intangible assets that arose from purchase acquisitions. Other Intangible Assets are primarily comprised of tradenames, patents and customer relationships. Goodwill and tradenames, which are considered to have indefinite lives, are not amortized; however, both must be tested for impairment at least annually. Amortization is recorded on a straight-line basis for other intangible assets with finite lives. Patents have been assigned an estimated useful life of 15 years. Customer relationships have been assigned an estimated useful life of 14 to 25 years.
The Company performed the required impairment tests in fiscal 2019, 2018 and 2017. There were no goodwill impairment charges or other intangible asset impairment charges recorded in fiscal 2019, fiscal 2018 or fiscal 2017.
Investments: Investments represent the Company’s investments in unconsolidated affiliated companies.
Financial information of the unconsolidated affiliated companies are accounted for by the equity method, generally on a lag of one month or less. Combined results of operations of unconsolidated affiliated companies for the fiscal year (in thousands):
|
| | | | | | | | | | | | |
| | | 2019 | | 2018 | | 2017 |
| Results of Operations: | | | | | | |
| Sales | | $ | 311,373 |
| | $ | 324,931 |
| | $ | 321,938 |
|
| Cost of Goods Sold | | 243,374 |
| | 248,585 |
| | 244,346 |
|
| Gross Profit | | $ | 67,999 |
| | $ | 76,346 |
| | $ | 77,592 |
|
| Net Income | | $ | 17,782 |
| | $ | 22,158 |
| | $ | 22,217 |
|
Combined balance sheets of unconsolidated affiliated companies as of fiscal year-end (in thousands):
|
| | | | | | | | |
| | | 2019 | | 2018 |
| Financial Position: | | | | |
| Assets: | | | | |
| Current Assets | | $ | 147,702 |
| | $ | 150,382 |
|
| Noncurrent Assets | | 38,496 |
| | 45,186 |
|
| | | 186,198 |
| | 195,568 |
|
| Liabilities: | | | | |
| Current Liabilities | | $ | 55,533 |
| | $ | 54,007 |
|
| Noncurrent Liabilities | | 14,599 |
| | 20,027 |
|
| | | 70,132 |
| | 74,034 |
|
| Equity | | $ | 116,066 |
| | $ | 121,534 |
|
Net sales to equity method investees were approximately $87.7 million, $107.2 million and $113.6 million in 2019, 2018 and 2017, respectively. Purchases of finished products from equity method investees were approximately $122.5 million, $115.5 million and $94.9 million in 2019, 2018 and 2017, respectively.
The Company uses the equity method to account for this investment, and the earnings of the unconsolidated affiliate are allocated between the Engines and Products segments. As of June 30, 2019 and July 1, 2018, the Company's total investment in the venture was $25.7 million and $25.2 million, respectively, and its ownership percentage was 38.0%. The Company's equity method investments also include entities that are suppliers for the Engines segment.
The Company concluded that its equity method investments are integral to its business. The equity method investments provide manufacturing and distribution functions, which are important parts of its operations.
During fiscal 2016, the Company had an investment in marketable securities, which related to its ownership of common stock of a publicly-traded company. The Company classified its investment as available-for-sale securities, and it was reported at fair value. Unrealized gains and losses, net of the related tax effects, were reported as a separate component of Accumulated Other Comprehensive Income (Loss). During the fourth quarter of fiscal 2016, the Company sold its investment in marketable securities and recognized a gain of $3.3 million, which is recorded in Other Income, Net in the Consolidated Statements of Operations. The Company received proceeds related to the sale in the first quarter of fiscal 2017.
Debt Issuance Costs: Direct and incremental costs incurred in obtaining loans or in connection with the issuance of long-term debt are capitalized and amortized to interest expense over the terms of the related credit agreements. The debt issuance costs are recorded as a direct deduction from the carrying value of the debt liability; however, the Company classifies debt issuance costs related to the revolving credit facility as an asset, regardless of whether it has any outstanding borrowings on the line of credit arrangements.
Approximately $0.8 million, $0.9 million, and $0.9 million of debt issuance costs and original issue discounts were amortized to interest expense in each of fiscal years 2019, 2018 and 2017, respectively.
Plant and Equipment and Depreciation: Plant and equipment are stated at historical cost. For financial reporting purposes, plant and equipment are depreciated primarily by the straight line method over the estimated useful lives of the assets which generally range from 3 to 15 years for software, from 20 to 40 years for land improvements, from 20 to 50 years for buildings, and 3 to 20 years for machinery and equipment. Expenditures for repairs and maintenance are charged to expense as incurred. Expenditures for major renewals and betterments, which significantly extend the useful lives of existing plant and equipment, are capitalized and depreciated. Upon retirement or disposition of plant and equipment, the cost and related accumulated depreciation are removed from the accounts, and any resulting gain or loss is recognized in cost of goods sold or engineering, selling, general and administrative expenses.
Depreciation expense was approximately $59.8 million, $53.8 million and $51.9 million during fiscal years 2019, 2018 and 2017, respectively.
Impairment of Property, Plant and Equipment: Property, plant and equipment are reviewed for impairment whenever events or changes in circumstances indicate that the carrying amount may not be recoverable. If the sum of the expected undiscounted cash flows is less than the carrying value of the related asset or group of assets, a loss is recognized for the difference between the fair value and carrying value of the asset or group of assets.
Warranty: The Company recognizes the cost associated with its standard warranty on engines and products at the time of sale. The general warranty period begins at the time of sale and typically covers two years, but may vary due to product type and geographic location. The amount recognized is based on historical failure rates and current claim cost experience. The following is a reconciliation of the changes in accrued warranty costs for the reporting period (in thousands):
|
| | | | | | | | |
| | | 2019 | | 2018 |
| Balance, Beginning of Period | | $ | 45,327 |
| | $ | 43,108 |
|
| Payments | | (23,939 | ) | | (23,704 | ) |
| Provision for Current Year Warranties | | 24,454 |
| | 24,436 |
|
| Changes in Estimates | | 1,760 |
| | 1,487 |
|
| Balance, End of Period | | $ | 47,602 |
| | $ | 45,327 |
|
Income Taxes: The provision for income taxes includes federal, state and foreign income taxes currently payable and those deferred because of temporary differences between the financial statement and tax bases of assets and liabilities. The deferred income tax asset and liability represent temporary differences relating to assets and liabilities. A valuation allowance is recorded to reduce deferred tax assets when it is more likely than not that a tax benefit will not be realized.
Retirement Plans: The Company has noncontributory, defined benefit retirement plans and postretirement benefit plans covering certain employees. Retirement benefits represent a form of deferred compensation, which are subject to change due to changes in assumptions. Management reviews underlying assumptions on an annual basis. Refer to Note 16.
Research and Development Costs: Expenditures relating to the development of new products and processes, including significant improvements and refinements to existing products, are expensed as incurred and recorded in engineering, selling, general and administrative expenses within the Consolidated Statements of Operations. The amounts charged against income were $22.8 million, $23.6 million and $23.0 million in fiscal 2019, 2018 and 2017, respectively.
Advertising Costs: Advertising costs, included in engineering, selling, general and administrative expenses within the Consolidated Statements of Operations, are expensed as incurred. These expenses totaled $21.6 million in fiscal 2019, $19.8 million in fiscal 2018 and $19.0 million in fiscal 2017.
Shipping and Handling Fees: Revenue received from shipping and handling fees is reflected in net sales and related shipping costs are recorded in cost of goods sold. Shipping fee revenue for fiscal 2019, 2018 and 2017 was $5.6 million, $5.6 million and $5.0 million, respectively.
Foreign Currency Translation: Foreign currency balance sheet accounts are translated into dollars at the rates of exchange in effect at fiscal year-end. Income and expenses incurred in a foreign currency are translated at the average rates of exchange in effect during the year. The related translation adjustments are made directly to a separate component of Shareholders’ Investment. Foreign currency transaction gains and losses are included in the results of operations in the period incurred. The Company recorded pre-tax foreign currency transaction gains of $0.9 million, $0.6 million, and $0.8 million during fiscal 2019, 2018, and 2017, respectively.
Earnings (Loss) Per Share: The Company computes earnings (loss) per share using the two-class method, an earnings allocation formula that determines earnings per share for each class of common stock and participating security according to dividends declared and participation rights in undistributed earnings. The Company’s unvested grants of restricted stock, restricted stock units, and deferred stock awards contain non-forfeitable rights to dividends (whether paid or unpaid), which are required to be treated as participating securities and included in the computation of basic (loss) earnings per share.
Information on earnings (loss) per share is as follows (in thousands except per share data):
|
| | | | | | | | | | | | |
| | | Fiscal Year Ended |
| | | June 30, 2019 | | July 1, 2018 | | July 2, 2017 |
| Net Income (Loss) | | $ | (54,083 | ) | | $ | (11,320 | ) | | $ | 56,650 |
|
| Less: Earnings Allocated to Participating Securities | | (576 | ) | | (301 | ) | | (1,274 | ) |
| Net Income (Loss) available to Common Shareholders | | $ | (54,659 | ) | | $ | (11,621 | ) | | $ | 55,376 |
|
| Average Shares of Common Stock Outstanding | | 41,647 |
| | 42,068 |
| | 42,178 |
|
| Incremental Common Shares Applicable to Common Stock Options and Performance Shares Based on the Common Stock Average Market Price During the Period | | — |
| | — |
| | 85 |
|
| Shares Used in Calculating Diluted Earnings Per Share | | 41,647 |
| | 42,068 |
| | 42,263 |
|
| Adjustment for Participating Securities | | — |
| | — |
| | 792 |
|
| Diluted Average Shares, Including Participating Securities | | 41,647 |
| | 42,068 |
| | 43,055 |
|
| Basic Earnings (Loss) Per Share | | $ | (1.31 | ) | | $ | (0.28 | ) | | $ | 1.31 |
|
| Diluted Earnings (Loss) Per Share | | $ | (1.31 | ) | | $ | (0.28 | ) | | $ | 1.31 |
|
The dilutive effect of the potential exercise of outstanding stock-based awards to acquire common shares is calculated using the treasury stock method. No options to purchase shares of common stock were excluded from the calculation of diluted earnings (loss) per share as the exercise prices were greater than the average market price of the common shares.
Derivative Instruments & Hedging Activity: The Company enters into derivative contracts designated as cash flow hedges to manage certain interest rate, foreign currency and commodity exposures. Company policy allows derivatives to be used only for identifiable exposures and, therefore, the Company does not enter into derivative instruments for trading purposes where the sole objective is to generate profits.
The Company formally designates the financial instrument as a hedge of a specific underlying exposure and documents both the risk management objectives and strategies for undertaking the hedge. The Company formally assesses, both at the inception and at least quarterly thereafter, whether the financial instruments that are used in hedging transactions are effective at offsetting changes in the forecasted cash flows of the related underlying exposure. Because of the high degree of effectiveness between the hedging instrument and the underlying exposure being hedged, fluctuations in the value of the derivative instruments are generally offset by changes in the forecasted cash flows of the underlying exposures being hedged.
Derivative financial instruments are recorded on the Consolidated Balance Sheets as assets or liabilities, measured at fair value. The effective portion of gains or losses on derivatives designated as cash flow hedges are reported as a component of Accumulated Other Comprehensive Income (Loss) (AOCI) and reclassified into earnings in the same periods during which the hedged transaction affects earnings. Any ineffective portion of a financial instrument’s change in fair value is immediately recognized in earnings.
The Company discontinues hedge accounting prospectively when it determines that the derivative is no longer effective in offsetting cash flows attributable to the hedged risk, the derivative expires or is sold, terminated, or exercised, the cash flow hedge is dedesignated because a forecasted transaction is not probable of occurring, or management determines to remove the designation of the cash flow hedge.
In all situations in which hedge accounting is discontinued and the derivative remains outstanding, the Company continues to carry the derivative at its fair value on the balance sheet and recognizes any subsequent changes in its fair value in earnings. When it is probable that a forecasted transaction will not occur, the Company discontinues hedge accounting and recognizes immediately in earnings gains and losses that were accumulated in other comprehensive income related to the hedging relationship.
(3) New Accounting Pronouncements:
In February 2018, the Financial Accounting Standards Board ("FASB") issued Accounting Standards Update ("ASU") No. 2018-02, Reporting Comprehensive Income (Topic 220): Reclassification of Certain Tax Effects from Accumulated Other Comprehensive Income. ASU No. 2018-02 allows a reclassification from accumulated other comprehensive income to retained earnings for stranded tax effects resulting from the Tax Cuts and Jobs Act. The guidance is effective beginning fiscal year 2020. The Company has assessed the ASU and has determined that the Company will not make the permitted reclassification.
In August 2017, the FASB issued ASU No. 2017-12, Derivatives and Hedging (Topic 815): Targeted Improvements to Accounting and Hedging Activities. ASU No. 2017-12 better aligns a Company's risk management activities and financial reporting for hedging relationships, in addition to simplifying certain aspects of ASC Topic 815. The guidance is effective beginning fiscal year 2020, with early adoption permitted. The Company adopted this ASU prospectively effective July 1, 2019 and this standard will not have a material impact on the Company's Condensed Consolidated Financial Statements.
In March 2017, the FASB issued ASU No. 2017-07, Compensation – Retirement Benefits (Topic 715): Improving the Presentation of Net Periodic Pension Cost and Net Periodic Postretirement Benefit Cost, which requires an employer to disaggregate the service cost component from the other components of net periodic pension costs within the statement of income. The guidance is applied on a retrospective basis, and became effective for the Company in fiscal 2019. Accordingly, the Company adopted this ASU effective July 2, 2018. Non-service cost components of net periodic pension costs in the amount of $2.0 million have been included in Other Income in the Statement of Operations for the twelve months ended June 30, 2019. Non-service cost components of net periodic pension costs in the amount of $1.1 million have been included in Other Income in the Statement of Operations for the twelve months ended July 1, 2018.
In January 2017, the FASB issued ASU 2017-04, Simplifying the Test for Goodwill Impairment, which simplifies how an entity is required to test goodwill for impairment by eliminating Step 2 from the goodwill impairment test. Step 2 measures a goodwill impairment loss by comparing the implied fair value of a reporting unit’s goodwill with the carrying amount of that goodwill. Under the amendments in ASU 2017-04, an entity should recognize an impairment charge for the amount by which the carrying amount of a reporting unit exceeds its fair value; however, the loss recognized should not exceed the total amount of goodwill allocated to that reporting unit. The updated guidance requires a prospective adoption. The guidance is effective beginning fiscal year 2021. Early adoption is permitted. The Company adopted this ASU prospectively effective July 1, 2019 and this standard will not have a material impact on the Company's Condensed Consolidated Financial Statements.
In February 2016, the FASB issued ASU No. 2016-02, Leases (Topic 842), which is intended to increase transparency and comparability among organizations by recognizing lease assets and lease liabilities on the balance sheet and disclosing key information about leasing arrangements. Certain qualitative and quantitative disclosures are required, as well as a modified retrospective recognition and measurement of impacted leases. The guidance is effective beginning fiscal year 2020, with early adoption permitted. The Company's project plan involves identifying and implementing appropriate changes to its business processes, systems and controls as well as compiling and evaluating lease arrangements to support lease accounting and disclosures under Topic 842. As of June 30, 2019, and subject to the company’s ongoing evaluation of new lease contracts, the Company anticipates the adoption of this new standard will result in recognizing approximately $70 million to $85 million of right of use assets and lease obligation liabilities on the consolidated balance sheet. The standard will not have a significant impact on the Company's consolidated statements of income or the consolidated statements of cash flows. There will also be no impact on existing debt covenants.
In May 2014, the FASB issued ASU No. 2014-09, Revenue from Contracts with Customers (Topic 606). The core principle of the guidance is that an entity should recognize revenue to depict the transfer of promised goods or services to customers in an amount that reflects the consideration to which the entity expects to be entitled in exchange for those goods or services. Topic 606 also requires additional disclosure about the nature, amount, timing and uncertainty of revenue and cash flows arising from customer contracts, including significant judgments and changes in judgments and assets recognized from costs incurred to fulfill a contract. This guidance was effective beginning fiscal year 2019. The Company has adopted this ASU effective July 2, 2018 using the modified retrospective approach and this standard did not have a material impact on the Company's Condensed Consolidated Financial Statements. Additional disclosures related to adoption of this ASU have been included at Note 4.
(4) Accumulated Other Comprehensive Income (Loss):
The following tables set forth the changes in accumulated other comprehensive income (loss) (in thousands): |
| | | | | | | | | | | | | | | | |
| | | Fiscal Year Ended June 30, 2019 |
| | | Cumulative Translation Adjustments | | Derivative Financial Instruments | | Pension and Postretirement Benefit Plans | | Total |
| Beginning Balance | | $ | (28,928 | ) | | $ | 6,486 |
| | $ | (229,830 | ) | | $ | (252,272 | ) |
| Other Comprehensive Loss Before Reclassification | | (2,839 | ) | | (14,842 | ) | | (45,678 | ) | | (63,359 | ) |
| Income Tax Benefit | | — |
| | 3,562 |
| | 10,963 |
| | 14,525 |
|
| Net Other Comprehensive Loss Before Reclassifications | | (2,839 | ) | | (11,280 | ) | | (34,715 | ) | | (48,834 | ) |
| Reclassifications: | | | | | | | | |
| Realized (Gains) Losses - Foreign Currency Contracts (1) | | — |
| | (1,713 | ) | | — |
| | (1,713 | ) |
| Realized (Gains) Losses - Commodity Contracts (1) | | — |
| | (149 | ) | | — |
| | (149 | ) |
| Realized (Gains) Losses - Interest Rate Swaps (1) | | — |
| | (1,127 | ) | | — |
| | (1,127 | ) |
| Amortization of Prior Service Costs (Credits) (2) | | — |
| | — |
| | (550 | ) | | (550 | ) |
| Amortization of Actuarial Losses (2) | | — |
| | — |
| | 14,797 |
| | 14,797 |
|
| Total Reclassifications Before Tax | | — |
| | (2,989 | ) | | 14,247 |
| | 11,258 |
|
| Income Tax Expense (Benefit) | | — |
| | 717 |
| | (3,419 | ) | | (2,702 | ) |
| Net Reclassifications | | — |
| | (2,272 | ) | | 10,828 |
| | 8,556 |
|
| Other Comprehensive Loss | | (2,839 | ) | | (13,552 | ) | | (23,887 | ) | | (40,278 | ) |
| Ending Balance | | $ | (31,767 | ) | | $ | (7,066 | ) | | $ | (253,717 | ) | | $ | (292,550 | ) |
(1) Amounts reclassified to net income are included in net sales or cost of goods sold. See Note 15 for information related to derivative financial instruments.
(2) Amounts reclassified to net income are included in the computation of net periodic expense, which is presented in cost of goods sold or engineering, selling, general and administrative expenses. See Note 16 for information related to pension and postretirement benefit plans.
|
| | | | | | | | | | | | | | | | |
| | | Fiscal Year Ended July 1, 2018 |
| | | Cumulative Translation Adjustments | | Derivative Financial Instruments | | Pension and Postretirement Benefit Plans | | Total |
| Beginning Balance | | $ | (24,744 | ) | | $ | (76 | ) | | $ | (275,206 | ) | | $ | (300,026 | ) |
| Other Comprehensive Income (Loss) Before Reclassification | | (4,184 | ) | | 4,303 |
| | 43,802 |
| | 43,921 |
|
| Income Tax Benefit (Expense) | | — |
| | (936 | ) | | (10,556 | ) | | (11,492 | ) |
| Net Other Comprehensive Income (Loss) Before Reclassifications | | (4,184 | ) | | 3,367 |
| | 33,246 |
| | 32,429 |
|
| Reclassifications: | | | | | | | | |
| Realized (Gains) Losses - Foreign Currency Contracts (1) | | — |
| | 4,795 |
| | — |
| | 4,795 |
|
| Realized (Gains) Losses - Commodity Contracts (1) | | — |
| | 96 |
| | — |
| | 96 |
|
| Realized (Gains) Losses - Interest Rate Swaps (1) | | — |
| | (251 | ) | | — |
| | (251 | ) |
| Amortization of Prior Service Costs (Credits) (2) | | — |
| | — |
| | (1,255 | ) | | (1,255 | ) |
| Amortization of Actuarial Losses (2) | | — |
| | — |
| | 18,785 |
| | 18,785 |
|
| Total Reclassifications Before Tax | | — |
| | 4,640 |
| | 17,530 |
| | 22,170 |
|
| Income Tax Expense (Benefit) | | — |
| | (1,445 | ) | | (5,400 | ) | | (6,845 | ) |
| Net Reclassifications | | — |
| | 3,195 |
| | 12,130 |
| | 15,325 |
|
| Other Comprehensive Income (Loss) | | (4,184 | ) | | 6,562 |
| | 45,376 |
| | 47,754 |
|
| Ending Balance | | $ | (28,928 | ) | | $ | 6,486 |
| | $ | (229,830 | ) | | $ | (252,272 | ) |
(1) Amounts reclassified to net income are included in net sales or cost of goods sold. See Note 15 for information related to derivative financial instruments.
(2) Amounts reclassified to net income are included in the computation of net periodic expense, which is presented in cost of goods sold or engineering, selling, general and administrative expenses. See Note 16 for information related to pension and postretirement benefit plans.
|
| | | | | | | | | | | | | | | | |
| | | Fiscal Year Ended July 2, 2017 |
| | | Cumulative Translation Adjustments | | Derivative Financial Instruments | | Pension and Postretirement Benefit Plans | | Total |
| Beginning Balance | | $ | (23,863 | ) | | $ | (1,552 | ) | | $ | (313,035 | ) | | $ | (338,450 | ) |
| Other Comprehensive Income (Loss) Before Reclassification | | (881 | ) | | 1,003 |
| | 43,947 |
| | 44,069 |
|
| Income Tax Benefit (Expense) | | — |
| | (376 | ) | | (16,480 | ) | | (16,856 | ) |
| Net Other Comprehensive Income (Loss) Before Reclassifications | | (881 | ) | | 627 |
| | 27,467 |
| | 27,213 |
|
| Reclassifications: | | | | | | | | |
| Realized (Gains) Losses - Foreign Currency Contracts (1) | | — |
| | 357 |
| | — |
| | 357 |
|
| Realized (Gains) Losses - Commodity Contracts (1) | | — |
| | 258 |
| | — |
| | 258 |
|
| Realized (Gains) Losses - Interest Rate Swaps (1) | | — |
| | 743 |
| | — |
| | 743 |
|
| Amortization of Prior Service Costs (Credits) (2) | | — |
| | — |
| | (2,474 | ) | | (2,474 | ) |
| Amortization of Actuarial Losses (2) | | — |
| | — |
| | 19,053 |
| | 19,053 |
|
| Plan Settlement (2) | | — |
| | — |
| | — |
| | — |
|
| Total Reclassifications Before Tax | | — |
| | 1,358 |
| | 16,579 |
| | 17,937 |
|
| Income Tax Expense (Benefit) | | — |
| | (509 | ) | | (6,217 | ) | | (6,726 | ) |
| Net Reclassifications | | — |
| | 849 |
| | 10,362 |
| | 11,211 |
|
| Other Comprehensive Income (Loss) | | (881 | ) | | 1,476 |
| | 37,829 |
| | 38,424 |
|
| Ending Balance | | $ | (24,744 | ) | | $ | (76 | ) | | $ | (275,206 | ) | | $ | (300,026 | ) |
(1) Amounts reclassified to net income are included in net sales or cost of goods sold. See Note 15 for information related to derivative financial instruments.
(2) Amounts reclassified to net income are included in the computation of net periodic expense, which is presented in cost of goods sold or engineering, selling, general and administrative expenses. See Note 16 for information related to pension and postretirement benefit plans.
(5) Revenue
The Company has adopted ASC 606 using the modified retrospective approach. Revenue is measured based on consideration expected to be received from a customer, and excludes any cash discounts, volume rebates and discounts, floor plan interest, advertising allowances, and amounts collected on behalf of third parties. The Company recognizes revenue when it satisfies a performance obligation by transferring control of a product to a customer, which is generally upon shipment.
Nature of Revenue
The Company’s revenues primarily consist of sales of engines and products to its customers. The Company considers the purchase orders, which may also be governed by purchasing agreements, to be the contracts with customers. For each contract, the Company considers delivery of the engines and products to be the identified performance obligations. The following is a description of principal activities, separated by reportable segments, from which the Company generates its revenue. For more detailed information about reportable segments, see Note 9.
The Engines segment principally generates revenue by providing gasoline engines and power solutions to OEMs which serve commercial and residential markets primarily for lawn and garden equipment applications. The Company typically enters into annual purchasing plans with its engine customers. In certain cases, the Company has entered into longer supply arrangements of two to three years; however, these longer term supply agreements do not generally create unfulfilled performance obligations. The sale of products to OEMs represents a single performance obligation. Revenue is recognized at a point in time when the product is shipped as substantially all engines are not customized for each customer and there is an alternative use for such inventory. The amount of
revenue recognized is adjusted for variable consideration such as tiered volume discounts and rebates. Revenue recognized is also adjusted based on an estimate of future returns.
The Products segment generates revenue through the sale of end user products through retail distribution, independent distributor and dealer networks, the mass retail channel, and the rental channel. These channels primarily serve commercial and residential end users. The sale of products to the various distribution networks represents a single performance obligation. Revenue is recognized at a point in time when the product is shipped as the products are not typically customized for each customer; therefore, there is an alternative use for such inventory. The amount of revenue recognized is adjusted for variable consideration such as tiered volume discounts, rebates, and floor plan interest. Revenue recognized is also adjusted based on an estimate of future returns.
Both the Engines and Products segments account for variable consideration and estimated returns according to the same accounting policies. The Company offers a variable discount if certain customers reach established volume goals in the form of tiered volume discounts. The Company applies the expected value approach to estimate the value of the discount which is then applied as a reduction to the transaction price. Included in net sales for the year ended June 30, 2019 were reductions for tiered volume discounts of $12.8 million. The Company offers rebates in the form of promotional allowances to incentivize certain customers to make purchases. The expected value approach is used to estimate the rebate value relative to these allowances which is then applied as a reduction of the transaction price. Included in net sales for the year ended June 30, 2019 were reductions for rebates of $7.7 million.
Included in net sales are costs associated with programs under which the Company shares the expense of financing certain dealer and distributor inventories, referred to as floor plan expense. This represents interest for a pre-established length of time based on a variable rate (LIBOR) plus a fixed percentage from a contract with a third party financing source for dealer and distributor inventory purchases. Sharing the cost of these financing arrangements is used by the Company as a marketing incentive for customers to purchase the Company's products to have floor stock for end users to purchase. The Company enters into interest rate swaps to hedge cash flows for a portion of its interest rate risk. The financing costs, net of the related gain or loss on interest rate swaps, are recorded at the time of sale as a reduction of net sales. Included in net sales for the year ended June 30, 2019 were financing costs, net of the related gain or loss on interest rate swaps, of $11.0 million.
The Company estimates the expected number of returns based on historical return rates and reduces revenue by the amount of expected returns.
The Company requires prepayment on sales in limited circumstances, but the contract liability related to prepayments is immaterial as of June 30, 2019 and represents less than 1% of total sales.
The Company offers a standard warranty that is not sold separately on substantially all products that the Company sells which is accounted for as an assurance warranty. Accordingly, no component of the transaction price is allocated to the standard warranty. The Company records a liability for product warranty obligations at the time of sale to a customer based upon historical warranty experience.
During year ended June 30, 2019, the Company recorded $4.1 million of bad debt expense related to a trade customer declaring bankruptcy.
Disaggregation of Revenue
In the following table, revenue is disaggregated by primary product application. The table also includes a reconciliation of the disaggregated revenue with the reportable segments for the year ended June 30, 2019, as follows (in thousands):
|
| | | | | | | | | | | | | | | | |
| �� | | Year Ended June 30, 2019 |
| | | Engines | | Products | | Eliminations | | Total |
| Commercial | | $ | 206,992 |
| | $ | 388,445 |
| | $ | (23,908 | ) | | $ | 571,529 |
|
| Residential | | 781,715 |
| | 543,692 |
| | (60,331 | ) | | 1,265,076 |
|
| Total | | $ | 988,707 |
| | $ | 932,137 |
| | $ | (84,239 | ) | | $ | 1,836,605 |
|
(6) Fair Value:
Assets and Liabilities Measured at Fair Value:
The following guidance establishes a fair value hierarchy that prioritizes the inputs to valuation techniques used to measure fair value into three broad levels:
Level 1: Quoted prices for identical instruments in active markets.
Level 2: Quoted prices for similar instruments in active markets; quoted prices for identical or similar instruments in markets that are not active; and model-driven valuations whose inputs are observable or whose significant value drivers are observable.
Level 3: Significant inputs to the valuation model are unobservable.
The following table presents information about the Company’s financial assets and liabilities measured at fair value on a recurring basis as of June 30, 2019 and July 1, 2018 (in thousands):
|
| | | | | | | | | | | | | | | | |
| | | | | Fair Value Measurement Using |
| | | June 30, 2019 | | Level 1 | | Level 2 | | Level 3 |
| Assets: | | | | | | | | |
| Derivatives | | $ | 1,564 |
| | $ | — |
| | $ | 1,564 |
| | $ | — |
|
| Liabilities: | | | | | | | | |
| Derivatives | | $ | 12,014 |
| | $ | — |
| | $ | 12,014 |
| | $ | — |
|
|
| | | | | | | | | | | | | | | | |
| | | | | Fair Value Measurement Using |
| | | July 1, 2018 | | Level 1 | | Level 2 | | Level 3 |
| Assets: | | | | | | | | |
| Derivatives | | $ | 7,938 |
| | $ | — |
| | $ | 7,938 |
| | $ | — |
|
| Liabilities: | | | | | | | | |
| Derivatives | | $ | 231 |
| | $ | — |
| | $ | 231 |
| | $ | — |
|
The fair value for Level 2 measurements are based upon the respective quoted market prices for comparable instruments in active markets, which include current market pricing for forward purchases of commodities, foreign currency forwards, and current interest rates.
The Company has currently chosen not to elect the fair value option for any items that are not already required to be measured at fair value in accordance with accounting principles generally accepted in the United States.
Fair Value of Financial Instruments:
The Company believes that the carrying values of cash and cash equivalents, trade receivables and accounts payable are reasonable estimates of their fair values at June 30, 2019 and July 1, 2018 due to the short-term nature of these instruments. The estimated fair value of the 6.875% Senior Notes due December 2020 is based on quoted market prices for similar instruments and is, therefore, classified as Level 2 within the valuation hierarchy.
The estimated fair market values of the Company’s indebtedness is (in thousands):
|
| | | | | | | | | | | | | | | | |
| | | 2019 | | 2018 |
| | | Carrying Amount | | Fair Value | | Carrying Amount | | Fair Value |
| 6.875% Senior Notes | | $ | 195,464 |
| | $ | 203,593 |
| | $ | 200,888 |
| | $ | 214,000 |
|
| Borrowings on Revolver | | $ | 160,540 |
| | $ | 160,540 |
| | $ | 48,036 |
| | $ | 48,036 |
|
(7) Goodwill and Other Intangible Assets:
The changes in the carrying amount of goodwill by reportable segment for the fiscal years ended June 30, 2019 and July 1, 2018 are as follows (in thousands): |
| | | | | | | | | | | | |
| | | Engines | | Products | | Total |
| Goodwill Balance at July 2, 2017 | | $ | 138,074 |
| | $ | 23,575 |
| | $ | 161,649 |
|
| Acquisitions | | — |
| | 2,573 |
| | 2,573 |
|
| Effect of Translation | | (682 | ) | | (340 | ) | | (1,022 | ) |
| Goodwill Balance at July 1, 2018 | | $ | 137,392 |
| | $ | 25,808 |
| | $ | 163,200 |
|
| Acquisitions | | — |
| | 6,786 |
| | 6,786 |
|
| Effect of Translation | | (297 | ) | | (7 | ) | | (304 | ) |
| Goodwill Balance at June 30, 2019 | | $ | 137,095 |
| | $ | 32,587 |
| | $ | 169,682 |
|
At June 30, 2019, July 1, 2018 and July 2, 2017, accumulated goodwill impairment losses, as recorded in the Products segment, were $131.4 million respectively.
The Company evaluates goodwill for impairment at least annually as of the fiscal year-end and more frequently if events or circumstances indicate that the assets may be impaired. The Company will test goodwill using a two-step process. The first step of the goodwill impairment test is to identify a potential impairment by comparing the carrying values of each of the Company's reporting units to their estimated fair values as of the test dates. The estimates of fair value of the reporting units are computed using either an income approach, a market approach, or a combination of both. The income approach utilizes a multi-year forecast of estimated cash flows and a terminal value at the end of the cash flow period. The forecast period assumptions consist of internal projections that are based on the Company's budget and long-range strategic plan. The discount rate used at the test date is the weighted-average cost of capital which reflects the overall level of inherent risk of the reporting unit and the rate of return an outside investor would expect to earn. Valuations using the market approach are derived from metrics of publicly traded companies or historically completed transactions of comparable businesses. The selection of comparable businesses is based on the markets in which the reporting units operate giving consideration to risk profiles, size, geography, and diversity of products and services.
Some of the significant assumptions inherent in estimating the fair values include the estimated future annual net cash flows for each reporting unit (including net sales, operating income margin, and working capital) and a discount rate that appropriately reflects the risks inherent in each future cash flow stream. The Company selected assumptions used in the financial forecasts using historical data, supplemented by current and anticipated market conditions, estimated growth rates, management’s plans, and guideline companies. The assumptions included in the impairment test require judgment, and changes to these inputs could impact the results of the calculation.
If the fair value of a reporting unit exceeds its book value, goodwill of the reporting unit is not deemed impaired and the second step of the impairment test is not performed. If the book value of a reporting unit exceeds its fair value, the second step of the goodwill impairment test is performed to measure the amount of impairment loss, if any. The second step of the goodwill impairment test compares the implied fair value of the reporting unit’s goodwill with the carrying amount of that goodwill. The implied fair value of goodwill is determined by allocating the estimated fair value of the reporting unit to the estimated fair value of its existing tangible assets and liabilities as well as existing identified intangible assets and previously unrecognized intangible assets in a manner similar to a purchase price allocation. The unallocated portion of the estimated fair value of the reporting unit is the implied fair value of goodwill. If the carrying amount of the reporting unit’s goodwill exceeds the implied fair value of that goodwill, an impairment loss is recognized in an amount equal to that excess.
The Jobsite reporting unit fair value exceeded the carrying value by less than 10% as of the latest 2019 impairment testing date. The discount rate the Company used to determine the fair value was 14.3%. The Turf & Consumer reporting unit fair value exceeded the carrying value by more than 10% but less than 20% as of the latest 2019 impairment testing date. The discount rate the Company used to determine the fair value was 14.2%.The Engines reporting unit fair value exceeded the carrying value by more than 20% as of the latest 2019 impairment testing date. The discount rate the Company used to determine the fair value was 14.9%.
The Company’s other intangible assets as of June 30, 2019 and July 1, 2018 are as follows (in thousands) in the table below. After an intangible asset has been fully amortized, it is removed from the table in the subsequent year.
|
| | | | | | | | | | | | | | | | | | | | | | | | |
| | | 2019 | | 2018 |
| | | Gross Carrying Amount | | Accumulated Amortization | | Net | | Gross Carrying Amount | | Accumulated Amortization | | Net |
| Amortized Intangible Assets: | | | | | | | | | | | | |
| Patents | | $ | 9,600 |
| | $ | (7,410 | ) | | $ | 2,190 |
| | $ | 7,300 |
| | $ | (6,813 | ) | | $ | 487 |
|
| Customer Relationships | | 61,381 |
| | (21,634 | ) | | 39,747 |
| | 60,182 |
| | (18,995 | ) | | 41,187 |
|
| Other Intangible Assets | | 854 |
| | (513 | ) | | 341 |
| | 839 |
| | (774 | ) | | 65 |
|
| Effect of Translation | | (6,862 | ) | | 790 |
| | (6,072 | ) | | (6,887 | ) | | 1,065 |
| | (5,822 | ) |
| Total Amortized Intangible Assets | | 64,973 |
| | (28,767 | ) | | 36,206 |
| | 61,434 |
| | (25,517 | ) | | 35,917 |
|
| Unamortized Intangible Assets: | | | | | | | | | | | | |
| Tradenames | | 64,667 |
| | — |
| | 64,667 |
| | 63,967 |
| | — |
| | 63,967 |
|
| Effect of Translation | | (4,135 | ) | | — |
| | (4,135 | ) | | (4,020 | ) | | — |
| | (4,020 | ) |
| Total Unamortized Intangible Assets | | 60,532 |
| | — |
| | 60,532 |
| | 59,947 |
| | — |
| | 59,947 |
|
| Total Intangible Assets | | $ | 125,505 |
| | $ | (28,767 | ) | | $ | 96,738 |
| | $ | 121,381 |
| | $ | (25,517 | ) | | $ | 95,864 |
|
The Company also performs an impairment test of its indefinite-lived intangible assets as of the fiscal year-end and more frequently if events or circumstances indicate that the assets may be impaired. For purposes of the indefinite-lived intangible asset impairment analysis, the Company performs its assessment of fair value based on an income approach using the relief-from-royalty method. The Company determines the fair value of each tradename by applying a royalty rate to a projection of net sales discounted using a risk adjusted cost of capital. Sales growth rates are determined after considering current and future economic conditions, recent sales trends, discussions with customers, planned timing of new product launches and many other variables. Each royalty rate is based on profitability of the business to which it relates and observed market royalty rates.
Amortization expense of other intangible assets amounted to approximately $3.3 million in 2019, $3.4 million in 2018, and $3.5 million in 2017.
The estimated amortization expense of other intangible assets for the next five years is (in thousands):
|
| | | |
| | |
| 2020 | $ | 2,790 |
|
| 2021 | 2,790 |
|
| 2022 | 2,790 |
|
| 2023 | 2,790 |
|
| 2024 | 2,790 |
|
| | |
| | $ | 13,950 |
|
| | |
(8) Income Taxes and Tax Reform:
Components of income (loss) before income taxes consists of the following (in thousands): |
| | | | | | | | | | | | |
| | | 2019 | | 2018 | | 2017 |
| U.S. | | $ | (73,878 | ) | | $ | (5,350 | ) | | $ | 66,555 |
|
| Foreign | | 5,780 |
| | 16,451 |
| | 13,106 |
|
| Total | | $ | (68,098 | ) | | $ | 11,101 |
| | $ | 79,661 |
|
The provision (credit) for income taxes consists of the following (in thousands):
|
| | | | | | | | | | | | |
| | | 2019 | | 2018 | | 2017 |
| Current | | | | | | |
| Federal | | $ | (1,488 | ) | | $ | (12,072 | ) | | $ | 7,333 |
|
| State | | 1,473 |
| | (4,413 | ) | | 933 |
|
| Foreign | | 4,469 |
| | 3,556 |
| | 4,429 |
|
| | | 4,454 |
| | (12,929 | ) | | 12,695 |
|
| Deferred | | | | | | |
| Federal | | $ | (16,855 | ) | | $ | 31,235 |
| | $ | 8,156 |
|
| State | | (2,653 | ) | | 4,462 |
| | 583 |
|
| Foreign | | 1,039 |
| | (347 | ) | | 1,577 |
|
| | | (18,469 | ) | | 35,350 |
| | 10,316 |
|
| Total | | $ | (14,015 | ) | | $ | 22,421 |
| | $ | 23,011 |
|
A reconciliation of the U.S. statutory tax rates to the effective tax rates on income follows:
|
| | | | | | | | | |
| | | 2019 | | 2018 | | 2017 |
| U.S. Statutory Rate | | 21.0 | % | | 28.0 | % | | 35.0 | % |
| State Taxes, Net of Federal Tax Benefit | | 4.0 | % | | 3.7 | % | | 1.5 | % |
| Impact of Foreign Operations and Tax Rates | | 0.2 | % | | (2.5 | )% | | (2.1 | )% |
| Valuation Allowance | | (8.6 | )% | | 6.7 | % | | 5.3 | % |
| Changes to Unrecognized Tax Benefits | | (2.8 | )% | | 1.3 | % | | (4.5 | )% |
| U.S. Manufacturers Deduction | | — | % | | — | % | | (2.4 | )% |
| Research & Development Credit (1) | | 9.9 | % | | (25.2 | )% | | (3.1 | )% |
| Return to Provision Adjustment | | (0.3 | )% | | 15.6 | % | | (0.4 | )% |
| U.S. Tax Reform (2) | | (1.4 | )% | | 189.9 | % | | — | % |
| Impact of Joint Venture Business Optimization | | (0.6 | )% | | 4.5 | % | | — | % |
| Worthless Stock Loss | | — | % | | (10.8 | )% | | — | % |
| Warehouse Charitable Contribution | | — | % | | (9.5 | )% | | — | % |
| Other, Net | | (0.8 | )% | | 0.2 | % | | (0.4 | )% |
| Effective Tax Rate | | 20.6 | % | | 201.9 | % | | 28.9 | % |
(1) "Research & Development Credit” in fiscal 2019 includes incremental credit of $4.0 million for qualified costs associated with the Company's business optimization projects.
(2) This amount consists of impacts from the Tax Act including an expense in 2018 resulting from the re-measurement of deferred tax assets and liabilities for the US corporate tax rate reduction of approximately $13.8 million and an expense related to the inclusion of foreign earnings of approximately $7.3 million in 2018 and $1.0 million in 2019.
The components of deferred income taxes were as follows (in thousands):
|
| | | | | | | | |
| Long-Term Asset (Liability): | | 2019 | | 2018 |
| Difference Between Book and Tax Related to: | | | | |
| Pension Cost | | $ | 22,425 |
| | $ | 14,570 |
|
| Accumulated Depreciation | | (57,073 | ) | | (53,103 | ) |
| Intangibles | | (34,883 | ) | | (34,166 | ) |
| Accrued Employee Benefits | | 34,982 |
| | 34,108 |
|
| Postretirement Health Care Obligation | | 6,300 |
| | 7,275 |
|
| Inventory | | 11,396 |
| | 10,710 |
|
| Warranty | | 11,351 |
| | 10,842 |
|
| Payroll & Workers Compensation Accruals | | 4,828 |
| | 6,474 |
|
| Valuation Allowance | | (35,271 | ) | | (28,537 | ) |
| Net Operating Loss/Credit Carryforwards | | 70,953 |
| | 39,849 |
|
| Other Accrued Liabilities | | 7,414 |
| | 6,205 |
|
| Miscellaneous | | 548 |
| | (2,359 | ) |
| Deferred Income Tax Asset (Liability) | | $ | 42,970 |
| | $ | 11,868 |
|
Total deferred tax assets were $170.2 million and $130.1 million as of June 30, 2019 and July 1, 2018, respectively. Total deferred tax liabilities were $127.2 million and $118.0 million as of June 30, 2019 and July 1, 2018, respectively. During fiscal 2019, the total valuation allowance increased by $6.7 million.
Deferred tax assets were generated during the current year as a result of foreign income tax loss carryforwards in the amount of $4.6 million. At June 30, 2019, there are $11.4 million of foreign income tax loss carryforwards, consisting of $9.1 million that have no expiration date, and $2.3 million that will expire within the next 5 to 10 years. A deferred tax asset of $59.5 million exists at June 30, 2019 related to federal and state income tax losses and federal and state tax credit carryforwards, consisting of $19.2 million that have no expiration date, and $40.3 million that will expire between 2019 and 2039. Realization of the deferred tax assets are contingent upon generating sufficient taxable income prior to expiration of these carryforwards. At June 30, 2019, a valuation allowance of $12.4 million is recorded for the foreign deferred tax assets which the Company believes are unlikely to be realized in the future. In addition, a valuation allowance of $22.8 million is recorded related to state tax credits that are unlikely to be realized.
The change to the gross unrecognized tax benefits of the Company during the fiscal years ended June 30, 2019, July 1, 2018, and July 3, 2016 is reconciled as follows:
Unrecognized Tax Benefits (in thousands):
|
| | | | | | | | | | | |
| | 2019 | | 2018 | | 2017 |
| Beginning Balance | $ | 5,899 |
| | $ | 5,986 |
| | $ | 10,922 |
|
| Changes based on tax positions related to prior year | — |
| | — |
| | (861 | ) |
| Additions based on tax positions related to current year | 2,382 |
| | 981 |
| | 461 |
|
| Settlements with taxing authorities | — |
| | — |
| | (4,437 | ) |
| Lapse of statute of limitations | (1,306 | ) | | (1,068 | ) | | (99 | ) |
| Ending Balance | $ | 6,975 |
| | $ | 5,899 |
| | $ | 5,986 |
|
As of June 30, 2019, gross unrecognized tax benefits that, if recognized, would impact the effective tax rate were $6.7 million. There is a reasonable possibility that approximately $0.4 million of the liability for uncertain tax positions may be settled within the next twelve months due to the resolution of audits or expiration of statutes of limitations.
The Company recognizes interest and penalties related to unrecognized tax benefits in income tax expense. The total expense (income) recognized for fiscal years 2019, 2018 and 2017 was $0.1 million, $(0.2) million, and $(0.2) million, respectively.
As of June 30, 2019 and July 1, 2018, the Company had $0.9 million and $0.8 million, respectively, accrued for the payment of interest and penalties.
At June 30, 2019 and July 1, 2018, the liability for uncertain tax positions, inclusive of interest and penalties, was $7.8 million and $6.7 million, respectively, which is recorded as an other long-term liability within the Consolidated Balance Sheets.
Income tax returns are filed in the U.S., state, and foreign jurisdictions and related audits occur on a regular basis. In the U.S., the Company is no longer subject to U.S. federal income tax examinations before fiscal 2015. The Company is also currently under audit by the IRS, and various state and foreign jurisdictions. The Company is no longer subject to tax examinations before fiscal 2009 in its major foreign jurisdictions.
(9) Segment and Geographic Information and Significant Customers:
The Company aggregates operating segments that have similar economic characteristics, products, production processes, types or classes of customers and distribution methods into reportable segments. The Company concluded that it operates two reportable segments: Engines and Products. The Company uses “segment income (loss)” as the primary measure to evaluate operating performance and allocate capital resources for the Engines and Products segments. The Company defines segment income (loss) as income from operations plus equity in earnings of unconsolidated affiliates. Summarized segment data is as follows (in thousands):
|
| | | | | | | | | | | | |
| | | 2019 | | 2018 | | 2017 |
| NET SALES: | | | | | | |
| Engines | | $ | 988,707 |
| | $ | 1,066,318 |
| | $ | 1,098,809 |
|
| Products | | 932,137 |
| | 904,007 |
| | 778,378 |
|
| Eliminations | | (84,239 | ) | | (89,031 | ) | | (91,084 | ) |
| | | $ | 1,836,605 |
| | $ | 1,881,294 |
| | $ | 1,786,103 |
|
| GROSS PROFIT: | | | | | | |
| Engines | | $ | 193,069 |
| | $ | 252,645 |
| | $ | 262,036 |
|
| Products | | 108,984 |
| | 144,933 |
| | 121,141 |
|
| Eliminations | | (1,002 | ) | | 504 |
| | 652 |
|
| | | $ | 301,051 |
| | $ | 398,082 |
| | $ | 383,829 |
|
| SEGMENT INCOME (LOSS) (1) | | | | | | |
| Engines | | $ | (15,519 | ) | | $ | 9,593 |
| | $ | 81,641 |
|
| Products | | (22,675 | ) | | 22,012 |
| | 12,530 |
|
| Eliminations | | (1,002 | ) | | 504 |
| | 652 |
|
| | | $ | (39,196 | ) | | $ | 32,109 |
| | $ | 94,823 |
|
| | | | | | | |
| INTEREST EXPENSE | | (29,242 | ) | | (25,320 | ) | | (20,293 | ) |
| OTHER INCOME, Net | | 340 |
| | 4,312 |
| | 5,131 |
|
| Income (Loss) Before Income Taxes | | (68,098 | ) | | 11,101 |
| | 79,661 |
|
| PROVISION (CREDIT) FOR INCOME TAXES | | (14,015 | ) | | 22,421 |
| | 23,011 |
|
| Net Income (Loss) | | $ | (54,083 | ) | | $ | (11,320 | ) | | $ | 56,650 |
|
| | | | | | | |
| ASSETS: | | | | | | |
| Engines | | $ | 952,820 |
| | $ | 965,677 |
| | $ | 987,943 |
|
| Products | | 646,417 |
| | 547,540 |
| | 551,207 |
|
| Eliminations | | (47,806 | ) | | (69,251 | ) | | (88,171 | ) |
| | | $ | 1,551,431 |
| | $ | 1,443,966 |
| | $ | 1,450,979 |
|
| CAPITAL EXPENDITURES: | | | | | | |
| Engines | | $ | 31,680 |
| | $ | 79,724 |
| | $ | 67,218 |
|
| Products | | 20,774 |
| | 23,479 |
| | 15,923 |
|
| | | $ | 52,454 |
| | $ | 103,203 |
| | $ | 83,141 |
|
| DEPRECIATION & AMORTIZATION: | | | | | | |
| Engines | | $ | 48,932 |
| | $ | 44,361 |
| | $ | 44,384 |
|
| Products | | 15,268 |
| | 13,897 |
| | 11,799 |
|
| | | $ | 64,200 |
| | $ | 58,258 |
| | $ | 56,183 |
|
Pre-tax business optimization and litigation settlement charges impact on gross profit (in thousands):
|
| | | | | | | | | | | | |
| | | 2019 | | 2018 | | 2017 |
| Engines | | $ | 2,662 |
| | $ | 2,854 |
| | $ | — |
|
| Products | | 9,207 |
| | 3,775 |
| | — |
|
| Total | | $ | 11,869 |
| | $ | 6,629 |
| | $ | — |
|
Pre-tax business optimization charges, acquisition-related charges, bad debt charges related to major retailer bankruptcy, pension settlement charges, and litigation charges impact on segment income (loss) is as follows (in thousands):
|
| | | | | | | | | | | | |
| | | 2019 | | 2018 | | 2017 |
| Engines | | $ | 29,149 |
| | $ | 53,913 |
| | $ | — |
|
| Products | | 22,648 |
| | 8,113 |
| | — |
|
| Total | | $ | 51,797 |
| | $ | 62,026 |
| | $ | — |
|
Information regarding the Company’s geographic sales based on product shipment destination (in thousands):
|
| | | | | | | | | | | | |
| | | 2019 | | 2018 | | 2017 |
| United States | | $ | 1,354,635 |
| | $ | 1,346,687 |
| | $ | 1,246,015 |
|
| All Other Countries | | 481,970 |
| | 534,607 |
| | 540,088 |
|
| Total | | $ | 1,836,605 |
| | $ | 1,881,294 |
| | $ | 1,786,103 |
|
Information regarding the Company’s net plant and equipment based on geographic location (in thousands):
|
| | | | | | | | | | | | |
| | | 2019 | | 2018 | | 2017 |
| United States | | $ | 392,146 |
| | $ | 405,808 |
| | $ | 347,664 |
|
| All Other Countries | | 18,899 |
| | 16,272 |
| | 17,216 |
|
| Total | | $ | 411,045 |
| | $ | 422,080 |
| | $ | 364,880 |
|
Sales to the following customers in the Company’s Engines segment amount to greater than or equal to 10% of consolidated net sales (in thousands):
|
| | | | | | | | | | | | | | | | | | | | | |
| | | 2019 | | 2018 | | 2017 |
| Customer: | | Net Sales | | % | | Net Sales | | % | | Net Sales | | % |
| MTD | | $ | 220,714 |
| | 12 | % | | $ | 192,402 |
| | 10 | % | | $ | 205,339 |
| | 11 | % |
| HOP | | 139,920 |
| | 8 | % | | 184,008 |
| | 10 | % | | 207,882 |
| | 12 | % |
| | | $ | 360,634 |
| | 20 | % | | $ | 376,410 |
| | 20 | % | | $ | 413,221 |
| | 23 | % |
(10) Leases:
The Company leases certain facilities, vehicles, and equipment under operating leases. Operating leases are not capitalized and lease payments are expensed over the life of the lease. Terms of the leases, including purchase options, renewals, and maintenance costs, vary by lease. Rental expense for fiscal 2019, 2018 and 2017 was $20.1 million, $20.0 million and $19.3 million, respectively.
Future minimum lease commitments for all non-cancelable operating leases as of June 30, 2019 are as follows (in thousands):
|
| | | | |
| Fiscal Year | | Commitments |
| 2020 | | $ | 20,453 |
|
| 2021 | | 18,179 |
|
| 2022 | | 14,784 |
|
| 2023 | | 10,345 |
|
| 2024 | | 9,515 |
|
| Thereafter | | 73,639 |
|
| Total future minimum lease commitments | | $ | 146,915 |
|
(11) Indebtedness:
The following is a summary of the Company’s indebtedness (in thousands):
|
| | | | | | | | |
| | | 2019 | | 2018 |
| Multicurrency Credit Agreement | | $ | 160,540 |
| | $ | 48,025 |
|
| Total Short-Term Debt | | $ | 160,540 |
| | $ | 48,025 |
|
| | | | | |
| Note Payable (NMTC transaction) | | 7,685 |
| | 7,685 |
|
| Unamortized Debt Issuance Costs associated with Note Payable | | 820 |
| | 1,009 |
|
| | | 8,505 |
| | 8,694 |
|
| | | | | |
| 6.875% Senior Notes | | $ | 195,464 |
| | $ | 200,888 |
|
| Unamortized Debt Issuance Costs associated with 6.875% Senior Notes | | 495 |
| | 934 |
|
| Total Long-Term Debt | | $ | 194,969 |
| | $ | 199,954 |
|
6.875% Senior Notes
On December 20, 2010, the Company issued $225 million of 6.875% Senior Notes ("Senior Notes") due December 15, 2020. During fiscal 2019 and 2018, the Company repurchased $5 million and $22 million, respectively, of the Senior Notes. There were no repurchases in fiscal 2017.
Multicurrency Credit Agreement
On March 25, 2016, the Company entered into a $500 million amended and restated multicurrency credit agreement (the “Revolver”) that matures on March 25, 2021. The Revolver amended and restated the Company's $500 million multicurrency credit agreement dated as of October 13, 2011 (as previously amended), which would have matured on October 21, 2018. The initial maximum availability under the Revolver is $500 million. Availability under the Revolver is reduced by outstanding letters of credit. The Company may from time to time increase the maximum availability under the revolving credit facility by up to $250 million if certain conditions are satisfied. In connection with the amendment to the Revolver in fiscal 2016, the Company incurred approximately $0.9 million in new debt issuance costs, which are being amortized over the life of the Revolver using the straight-line method. The Company classifies debt issuance costs related to the Revolver as an asset, regardless of whether it has any outstanding borrowings on the line of credit arrangements. There were $161 million of borrowings under the Revolver as of June 30, 2019. There were $48 million borrowings under the Revolver as of July 1, 2018.
Borrowings under the Revolver by the Company bear interest at a rate per annum equal to, at its option, either:
(1) a 1, 2, 3 or 6 month LIBOR rate plus a margin varying from 1.25% to 2.25%, depending on the Company’s average net leverage ratio; or
(2) the higher of (a) the federal funds rate plus 0.50%; (b) the bank's prime rate; or (c) the adjusted LIBOR rate for a one-month interest period plus 1.00% plus a margin varying from 0.25% to 1.25%. In addition, the Company is subject to a 0.18% to 0.35% commitment fee and a 1.25% to 2.25% letter of credit fee, depending on the Company’s average net leverage ratio.
The Revolver contains covenants that the Company considers usual and customary for an agreement of this type, including a maximum average leverage ratio and minimum interest coverage ratio.
The Senior Notes and the Revolver contain restrictive covenants. These covenants include restrictions on the ability of the Company and/or certain subsidiaries to pay dividends, repurchase equity interests of the Company and certain subsidiaries, incur indebtedness, create liens, consolidate and merge and dispose of assets, and enter into transactions with affiliates. The Revolver contains financial covenants that require the Company to maintain a minimum interest coverage ratio and impose on the Company a maximum average leverage ratio.
On August 13, 2019, the Company entered into a consent memorandum pursuant to our revolving multicurrency credit agreement. Pursuant to the consent memorandum, the Average Leverage Ratio covenant will not be tested for the computation period ended June 30, 2019 (the “Specified Computation Period”) and no failure (or anticipated failure) by the Company to comply with associated restrictions for the specified computation period will constitute (or be deemed to have constituted) a default or an event of default under the credit agreement. Additionally, no default shall be deemed to exist under the Credit Agreement for any anticipated failure by the Company to comply with such restrictions for the computation period ending on or about September 30, 2019. The Company was in compliance with all other financial covenants of the credit agreement as of June 30, 2019 and the failure or anticipated failure to comply with the Average Leverage Ratio under the Credit Agreement is not considered to be a cross default for purposes of the Company’s Senior Notes.
The Company is in the process of refinancing the revolving credit agreement. The new revolving credit facility, which would be secured by certain of the Company's working capital and other assets, is planned to have a larger borrowing capacity that would allow the Company to retire the outstanding Senior Notes.
New Market Tax Credit
On August 16, 2017, the Company entered into a financing transaction with SunTrust Community Capital, LLC (“SunTrust”) related to the Company's business optimization program under the New Markets Tax Credit (“NMTC”) program. The NMTC program was provided for in the Community Renewal Tax Relief Act of 2000 (the “Act”) and is intended to induce capital investment in qualified low-income communities. The Act permits taxpayers to claim credits against their Federal income taxes for qualified investments in the equity of community development entities (“CDEs”). CDEs are privately managed investment institutions that are certified to make qualified low-income community investments (“QLICIs”).
In connection with the financing, one of the Company’s subsidiaries loaned approximately $16 million to an investment fund, and simultaneously, SunTrust contributed approximately $8 million to the investment fund. SunTrust is entitled to substantially all of the benefits derived from the NMTCs. SunTrust’s contribution, net of syndication fees, is included in Other Long-Term Liabilities on the consolidated balance sheets. The Company incurred approximately $1.2 million in new debt issuance costs, which are being amortized over the life of the note payable. The investment fund contributed the proceeds to certain CDEs, which, in turn, loaned the funds to the Company, as partial financing for the business optimization program. The proceeds of the loans from the CDEs (including loans representing the capital contribution made by SunTrust, net of syndication fees) are restricted for use on the project. Restricted cash of $0.8 million held by the Company at June 30, 2019 is included in Prepaid Expenses and Other Current Assets in the accompanying consolidated balance sheet.
This financing also includes a put/call provision that can be exercised beginning in August 2024 whereby the Company may be obligated or entitled to repurchase SunTrust’s interest in the investment fund for a de minimis amount.
The Company has determined that the financing arrangement is a variable interest entity (“VIE”) and has consolidated the VIE in accordance with the accounting standard for consolidation.
(12) Other Income, Net:
The components of Other Income, Net are as follows (in thousands):
|
| | | | | | | | | | | | |
| | | 2019 | | 2018 | | 2017 |
| Interest Income | | $ | 520 |
| | $ | 1,526 |
| | $ | 1,203 |
|
| Other Items | | (180 | ) | | 2,786 |
| | 3,928 |
|
| Total | | $ | 340 |
| | $ | 4,312 |
| | $ | 5,131 |
|
(13) Commitments and Contingencies:
The Company is subject to various unresolved legal actions that arise in the normal course of its business. These actions typically relate to product liability (including asbestos-related liability), patent and trademark matters, and disputes with customers, suppliers, distributors and dealers, competitors and employees.
On May 12, 2010, Exmark Manufacturing Company, Inc. filed suit against Briggs & Stratton Power Products Group, LLC (“BSPPG”), a wholly owned subsidiary of the Company that was subsequently merged with and into the Company on January 1, 2017 (Case No. 8:10CV187, U.S. District Court for the District of Nebraska), alleging that certain Ferris® and Snapper Pro® mower decks infringed an Exmark mower deck patent. Exmark sought damages relating to sales since May 2004, attorneys’ fees, and enhanced damages. As a result of a reexamination proceeding in 2012, the United States Patent and Trademark Office (“USPTO”) initially rejected the asserted Exmark claims as invalid. However, in 2014, that decision was reversed by the USPTO on appeal by Exmark. Following discovery, each of BSPPG and Exmark filed several motions for summary judgment in the Nebraska district court, which were decided on July 28, 2015. The court concluded that older mower deck designs infringed Exmark’s patent, leaving for trial the issues of whether current designs infringed, the amount of damages, and whether any infringement was willful.
The trial began on September 8, 2015, and on September 18, 2015, the jury returned its verdict, finding that BSPPG’s current mower deck designs do not infringe the Exmark patent. As to the older designs, the jury awarded Exmark $24.3 million in damages and found that the infringement was willful, allowing the judge to enhance the jury’s damages award post-trial by up to three times. Also on September 18, 2015, the U.S. Court of Appeals for the Federal Circuit issued its decision in an unrelated case, SCA Hygiene Products Aktiebolag SCA Personal Care, Inc. v. First Quality Baby Products, LLC, et al. (Case No. 2013-1564) (“SCA”), confirming the availability of laches as a defense to patent infringement claims. Laches is an equitable doctrine that may bar a patent owner from obtaining damages prior to commencing suit, in circumstances in which the owner knows or should have known its patent was being infringed for more than six years. Although the court in the Exmark case ruled before trial that BSPPG could not rely on the defense of laches, as a result of the subsequent SCA decision, the court held a bench trial on that defense on October 21 and 22, 2015. On May 2, 2016, the United States Supreme Court agreed to review the SCA decision.
The parties submitted post-trial motions and briefing related to: damages; willfulness; laches; attorney fees; enhanced damages; and prejudgment/post-judgment interest and costs. All post-trial motions and briefing were completed on December 18, 2015. On May 11, 2016, the court ruled on those post-trial motions and entered judgment against BSPPG and in favor of Exmark in the amount of $24.3 million in compensatory damages, an additional $24.3 million in enhanced damages, and $1.5 million in pre-judgment interest along with post-judgment interest and costs to be determined. The Company strongly disagreed with the jury verdict, certain rulings made before and during trial, and the May 11, 2016 post-trial rulings. BSPPG appealed to the U.S. Court of Appeals for the Federal Circuit on several bases, including the issues of obviousness and invalidity of Exmark’s patent, the damages calculation, willfulness and laches.
Following briefing of the appeal and prior to oral argument, the United States Supreme Court overturned the SCA decision, ruling that laches is not available in a patent infringement case for damages. That ruling eliminated laches as one basis for BSPPG’s appeal of the Exmark case. The appellate court held a hearing on the remainder of BSPPG’s appeal on April 5, 2017 and issued its decision on January 12, 2018. The appellate court found that the district court erred in granting summary judgment concerning the patent’s validity and remanded that issue to the district court for reconsideration. The appellate court also vacated the jury’s damages award and the district court’s award of enhanced damages, remanding the case to the district court for a new trial on damages and reconsideration on willfulness. The appellate court affirmed the district court rulings in all other respects. In subsequent rulings, the district court reaffirmed the validity of Exmark’s patent and its original ruling on willfulness. A new trial on the issue of damages commenced on December 10, 2018, resulting in a damages assessment by the jury of $14.4 million.
On December 20, 2018, the district court entered judgment against the Company and in favor of Exmark in the amount of $14.4 million in compensatory damages, an additional $14.4 million in enhanced damages, as well as pre-judgment interest, post-judgment interest and costs to be determined. On April 15, 2019, the district court entered an order denying the Company’s post-trial motions related to modification of the jury’s damages award, as well as seeking a new trial in light of certain evidentiary rulings. The district court awarded $6.0 million in pre-judgment interest, as well as post-judgment interest after December 19, 2018 and costs to be determined.
The Company strongly disagrees with the verdict and certain rulings made before, during and after the new trial and intends to vigorously pursue its rights on appeal. The Company filed its notice of appeal on May 14, 2019, and has appealed errors made by the district court in construing certain claims of Exmark’s patent, granting summary judgment motions filed by Exmark, and altering the prejudgment interest rate following the second trial. The parties are in the process of briefing the issues raised on appeal.
In assessing whether the Company should accrue a liability in its financial statements as a result of this lawsuit, the Company considered various factors, including the legal and factual circumstances of the case, the trial records and post-trial rulings of the district court, the decision of the appellate court, the current status of the proceedings, applicable law and the views of legal counsel. As a result of this review, the Company has concluded that a loss from this case is not probable and reasonably estimable at this time and, therefore, a liability has not been recorded with respect to this case as of June 30, 2019.
Although it is not possible to predict with certainty the outcome of this and other unresolved legal actions or the range of possible loss, the Company believes the unresolved legal actions will not have a material adverse effect on its results of operations, financial position or cash flows.
(14) Stock Incentives:
Effective October 20, 2004, a total of 8,000,000 shares of common stock (as adjusted for the fiscal 2005 2-for-1 stock split) was reserved for future issuance pursuant to the Company's Incentive Compensation Plan, and as a result of an amendment approved by shareholders on October 21, 2009 an additional 2,481,494 shares were reserved. On October 15, 2014, the Company's shareholders approved the 2014 Omnibus Incentive Plan, which constituted a complete amendment and restatement of the Company's Incentive Compensation Plan and under which 3,760,000 shares of common stock were reserved for future issuance (plus any shares remaining available for issuance under the Incentive Compensation Plan as of that date). On October 25, 2017 the Company's shareholders approved the 2017 Omnibus Incentive Plan which constituted a complete amendment and restatement of the Company's 2014 Omnibus Incentive Plan and under which 4,700,000 shares of common stock were reserved for future issuance (plus 494,315 shares remaining available for future issuance under the 2014 Omnibus Incentive Plan as of August 22, 2017, along with any other shares under the 2014 Omnibus Incentive Plan that become available for future issuance). Similar to the Incentive Compensation Plan and the 2014 Omnibus Incentive Plan, in accordance with the 2017 Omnibus Incentive Plan, the Company can issue to eligible participants stock options, stock appreciation rights, restricted stock, restricted stock units, performance shares, performance units and other stock-based and cash bonus awards subject to certain annual limitations. The plan also allows participants to defer the payment of awards and the Company to issue directors’ fees in stock. Stock-based compensation vests in accordance with the applicable plan and award agreements but can be accelerated under certain
circumstances by the Compensation Committee in the case of death, disability, retirement or a change in control.
Stock-based compensation expense is calculated by estimating the fair value of incentive stock awards granted and amortizing the estimated value over the awards’ vesting periods. During fiscal 2019, 2018 and 2017, the Company recognized stock-based compensation expense of approximately $7.2 million, $6.7 million and $4.9 million, respectively.
The fair value of each option is estimated using the Black-Scholes option pricing model, and the assumptions are based on historical data and industry valuation practices and methodology. The exercise price of each stock option is equal to the market value of the stock on the grant date. The assumptions used to determine fair value are as follows:
|
| | | | | | | | | | | | |
| Options Granted During | | 2019 | | 2018 | | 2017 |
| Grant Date Fair Value | | $ | 5.46 |
| | $ | 4.64 |
| | $ | 3.84 |
|
| (Since options are only granted once per year, the grant date fair value equals the weighted average grant date fair value.) | | | | | | |
| Assumptions: | | | | | | |
| Risk-free Interest Rate | | 2.7 | % | | 1.8 | % | | 1.2 | % |
| Expected Volatility | | 32.9 | % | | 30.7 | % | | 29.3 | % |
| Expected Dividend Yield | | 2.7 | % | | 2.7 | % | | 2.9 | % |
| Expected Term (in Years) | | 5.5 |
| | 5.5 |
| | 5.5 |
|
Information on the options outstanding is as follows:
|
| | | | | | | | | | | | | |
| | | Options | | Wtd. Avg. Exercise Price | | Wtd. Avg. Remaining Contractual Term (in years) | | Aggregate Intrinsic Value (in thousands) |
| Balance, July 3, 2016 | | 1,844,543 |
| | $ | 19.48 |
| | | | |
| Granted During the Year | | 496,880 |
| | 19.15 |
| | | | |
| Exercised During the Year | | (414,176 | ) | | 18.76 |
| | | | |
| Balance, July 2, 2017 | | 1,927,247 |
| | $ | 19.55 |
| | | | |
| Granted During the Year | | 416,210 |
| | 20.47 |
| | | | |
| Exercised During the Year | | (184,530 | ) | | 20.44 |
| | | | |
| Balance, July 1, 2018 | | 2,158,927 |
| | $ | 19.64 |
| | | | |
| Granted During the Year | | 367,870 |
| | 20.96 |
| | | | |
| Exercised During the Year | | (87,398 | ) | | 20.82 |
| | | | |
| Forfeited During the Year | | (58,390 | ) | | 18.93 |
| | | | |
| Expired During the Year | | (112,929 | ) | | 20.82 |
| | | | |
| Balance, June 30, 2019 | | 2,268,080 |
| | $ | 19.78 |
| | 7.03 | | $ | — |
|
| Exercisable, June 30, 2019 | | 1,005,090 |
| | $ | 19.36 |
| | 5.73 | | $ | — |
|
The total intrinsic value of options exercised during fiscal year 2019 was $0.1 million. The exercise of options resulted in cash receipts of $1.8 million in fiscal 2019. The total intrinsic value of options exercised during fiscal 2018 was $0.5 million. The exercise of options resulted in cash receipts of $3.8 million in fiscal 2018. The total intrinsic value of options exercised during fiscal 2017 was $1.5 million. The exercise of options resulted in cash receipts of $7.8 million in fiscal 2017.
|
| | | | | | | | | | | | | |
| Options Outstanding (as of June 30, 2019) |
Fiscal Year | | Grant Date | | Date Exercisable | | Expiration Date | | Exercise Price | | Options Outstanding |
| 2015 | | 10/21/2014 | | 10/21/2017 | | 10/21/2024 | | $ | 18.83 |
| | 543,520 |
|
| 2016 | | 8/18/2015 | | 8/18/2018 | | 8/18/2025 | | $ | 19.90 |
| | 501,990 |
|
| 2017 | | 8/22/2016 | | 8/22/2019 | | 8/22/2026 | | $ | 19.15 |
| | 496,880 |
|
| 2018 | | 8/21/2017 | | 8/21/2020 | | 8/21/2027 | | $ | 20.47 |
| | 416,210 |
|
| 2019 | | 8/20/2018 | | 8/20/2021 | | 2/20/2028 | | $ | 20.96 |
| | 367,870 |
|
Below is a summary of the status of the Company’s nonvested shares as of June 30, 2019, and changes during the year then ended:
|
| | | | | | | | | | | | | | | | | | | | | | | | | | | | |
| | | Deferred Stock / RSU | | Restricted Stock | | Stock Options | | Performance Shares |
| | | Shares | | Wtd. Avg. Grant Date Fair Value | | Shares | | Wtd. Avg. Grant Date Fair Value | | Shares | | Wtd. Avg. Grant Date Fair Value | | Shares | | Wtd. Avg. Grant Date Fair Value |
Nonvested shares/units, July 1, 2018 | | 78,821 |
| | $ | 19.52 |
| | 695,255 |
| | $ | 19.87 |
| | 1,415,080 |
| | $ | 4.03 |
| | 106,440 |
| | $ | 19.90 |
|
| Granted | | 10,902 |
| | 20.03 |
| | 138,550 |
| | 20.73 |
| | 367,870 |
| | 5.46 |
| | — |
| | — |
|
| Cancelled | | — |
| | — |
| | (26,940 | ) | | 20.77 |
| | (17,970 | ) | | 3.84 |
| | — |
| | — |
|
| Vested | | (36,442 | ) | | 19.13 |
| | (265,255 | ) | | 19.54 |
| | (501,990 | ) | | 3.72 |
| | (106,440 | ) | | 19.90 |
|
Nonvested shares/units, June 30, 2019 | | 53,281 |
| | $ | 19.89 |
| | 541,610 |
| | $ | 20.20 |
| | 1,262,990 |
| | $ | 4.58 |
| | — |
| | $ | — |
|
As of June 30, 2019, there was $5.1 million of total unrecognized compensation cost related to nonvested stock-based compensation. That cost is expected to be recognized over a weighted average period of 1.4 years. The total fair value of shares vested during fiscal 2019 and 2018 was $9.9 million and $7.7 million, respectively.
During fiscal years 2019, 2018 and 2017, the Company issued 138,550, 148,930 and 160,130 shares of restricted stock, respectively. For restricted stock issued prior to October 15, 2014, the restricted stock vests on the fifth anniversary date of the grant provided the recipient is still employed by the Company. For restricted stock issued after October 15, 2014, the restricted stock vests on the third anniversary date of the grant provided the recipient is still employed by the Company. The aggregate market value on the date of issue was approximately $2.9 million, $3.1 million and $3.1 million in fiscal 2019, 2018 and 2017, respectively, and has been recorded within the Shareholders’ Investment section of the Consolidated Balance Sheets, and is being amortized over the five-year vesting period (issuances prior to October 15, 2014) or the three-year vesting period (issuances after October 15, 2014).
The Company issued 55,877, 46,120 and 45,307 deferred shares to its directors in lieu of directors' fees in fiscal 2019, 2018 and 2017, respectively, under this provision of the plans. Prior to January 1, 2017, the Company accounted for certain deferred shares issued to directors as liability classified awards, rather than equity classified awards. At January 1, 2017, the liability balance was $4.8 million. During the third quarter of fiscal 2017, the Company determined that equity classification is appropriate and recorded correcting entries to adjust the deferred shares balance and reclassify it from Accrued Liabilities to Additional Paid-In Capital. The correcting entries did not have a material impact on the Consolidated Financial Statements.
The Company issued 10,902, 13,476 and 15,131 shares of deferred shares / RSU's to its officers and key employees in fiscal 2019, 2018 and 2017, respectively. The aggregate market value on the date of grant was approximately $0.2 million, $0.3 million and $0.3 million, respectively. For deferred stock issued prior to October 15, 2014, the deferred stock vests on the fifth anniversary date of the grant provided the recipient is still employed by the Company. For restricted stock units (RSU) issued after October 15, 2014, the restricted stock units vest on the third anniversary date of the grant provided the recipient is still employed by the Company.
The Company granted no performance share units in 2019, 2018 and 2017.
The following table summarizes the components of the Company’s stock-based compensation programs recorded as expense:
|
| | | | | | | | | | | | |
| | | 2019 | | 2018 | | 2017 |
| Stock Options: | | | | | | |
| Pretax compensation expense | | $ | 2,275 |
| | $ | 2,060 |
| | $ | 1,862 |
|
| Tax benefit | | (553 | ) | | (576 | ) | | (698 | ) |
| Stock option expense, net of tax | | $ | 1,722 |
| | $ | 1,484 |
| | $ | 1,164 |
|
| Restricted Stock: | | | | | | |
| Pretax compensation expense | | $ | 3,697 |
| | $ | 3,302 |
| | $ | 3,291 |
|
| Tax benefit | | (848 | ) | | (924 | ) | | (1,234 | ) |
| Restricted stock expense, net of tax | | $ | 2,849 |
| | $ | 2,378 |
| | $ | 2,057 |
|
| Deferred Stock: | | | | | | |
| Pretax compensation expense | | $ | 1,208 |
| | $ | 1,046 |
| | $ | 585 |
|
| Tax benefit | | (338 | ) | | (292 | ) | | (220 | ) |
| Deferred stock expense, net of tax | | $ | 870 |
| | $ | 754 |
| | $ | 365 |
|
| Performance Shares: | | | | | | |
| Pretax compensation expense | | $ | — |
| | $ | 267 |
| | $ | (815 | ) |
| Tax expense (benefit) | | — |
| | (75 | ) | | 306 |
|
| Performance Share expense, net of tax | | $ | — |
| | $ | 192 |
| | $ | (509 | ) |
| Total Stock-Based Compensation: | | | | | | |
| Pretax compensation expense | | $ | 7,180 |
| | $ | 6,675 |
| | $ | 4,923 |
|
| Tax benefit | | (1,739 | ) | | (1,867 | ) | | (1,846 | ) |
| Total stock-based compensation, net of tax | | $ | 5,441 |
| | $ | 4,808 |
| | $ | 3,077 |
|
(15) Derivative Instruments & Hedging Activities:
The Company enters into interest rate swaps to manage a portion of its interest rate risk from financing certain dealer and distributor inventories through third party financing sources. The swaps are designated as cash flow hedges and are used to effectively fix the interest payments to a third party financing source, exclusive of lender spreads, ranging from 0.98% to 2.83% for a notional principal amount of $110 million with expiration dates ranging from July 2021 to June 2024.
In the second quarter of fiscal 2019, the Company began entering into interest rate swaps to manage a portion of its interest rate risk from anticipated floating rate, LIBOR based indebtedness, exclusive of lender spreads, ranging from 2.47% to 3.13%. The swaps are designated as cash flow hedges, in an aggregate amount of $120 million, with termination dates between June 2023 and December 2029.
The Company periodically enters into forward foreign currency contracts to hedge the risk from forecasted third party and intercompany sales or payments denominated in foreign currencies. The Company's primary foreign currency exchange rate exposures are with the Australian Dollar, the Brazilian Real, the Canadian Dollar, the Chinese Renminbi, the Euro, and the Japanese Yen against the U.S. Dollar. These contracts generally do not have a maturity of more than twenty-four months.
The Company uses raw materials that are subject to price volatility. The Company hedges a portion of its exposure to the variability of cash flows associated with commodities used in the manufacturing process by entering into forward purchase contracts or commodity swaps. Derivative contracts designated as cash flow hedges are used by the Company to reduce exposure to variability in cash flows associated with future purchases of natural gas. These contracts generally do not have a maturity of more than thirty-six months.
The Company has considered the counterparty credit risk related to all its interest rate, foreign currency, and commodity derivative contracts and does not deem any counterparty credit risk material at this time.
The notional amount of derivative contracts outstanding at the end of the period is indicative of the level of the Company’s derivative activity during the period. As of June 30, 2019 and July 1, 2018, the Company had the following outstanding derivative contracts (in thousands):
|
| | | | | | | |
| Contract | | Notional Amount |
| | | | | June 30, 2019 | | July 1, 2018 |
| Interest Rate: | | | | | | |
| LIBOR Interest Rate (U.S. Dollars) | | Fixed | | 230,000 | | 110,000 |
| Foreign Currency: | | | | | | |
| Australian Dollar | | Sell | | 17,611 | | 35,833 |
|
| Brazilian Real | | Sell | | 13,436 | | 28,822 |
|
| Canadian Dollar | | Sell | 14,610 | | 14,430 |
|
| Chinese Renminbi | | Buy | | 70,555 | | 62,209 |
|
| Euro | | Sell | | 2,750 | | 32,592 |
|
| Japanese Yen | | Buy | | 0 | | 587,500 |
|
| Commodity: | | | | | | |
| Natural Gas (Therms) | | Buy | | 7,627 | | 10,553 |
|
The location and fair value of derivative instruments reported in the Consolidated Balance Sheets are as follows (in thousands):
|
| | | | | | | | |
| Balance Sheet Location | | Asset (Liability) Fair Value |
| | June 30, 2019 | | July 1, 2018 |
| Interest rate contracts: | | | | |
| Other Current Assets | | $ | — |
| | $ | 161 |
|
| Other Long-Term Assets, Net | | 876 |
| | 3,844 |
|
| Other Long-Term Liabilities | | (11,634 | ) | | — |
|
| Foreign currency contracts: | | | | |
| Other Current Assets | | 672 |
| | 3,881 |
|
| Other Long-Term Assets, Net | | 16 |
| | 31 |
|
| Accrued Liabilities | | (179 | ) | | (195 | ) |
| Other Long-Term Liabilities | | (11 | ) | | — |
|
| Commodity contracts: | | | | |
| Other Current Assets | | — |
| | 16 |
|
| Other Long-Term Assets, Net | | — |
| | 5 |
|
| Accrued Liabilities | | (176 | ) | | (7 | ) |
| Other Long-Term Liabilities | | (15 | ) | | (29 | ) |
| | | $ | (10,451 | ) | | $ | 7,707 |
|
The effect of derivatives designated as hedging instruments on the Consolidated Statements of Operations and Comprehensive Income (Loss) is as follows (in thousands):
|
| | | | | | | | | | | | | | |
| | | Twelve months ended June 30, 2019 |
| | | Amount of Gain (Loss) Recognized in Other Comprehensive Income (Loss) on Derivatives, Net of Taxes (Effective Portion) | | Classification of Gain (Loss) | | Amount of Gain (Loss) Reclassified from AOCI into Income (Effective Portion) | | Recognized in Earnings (Ineffective Portion) |
| Interest rate contracts | | $ | (3,307 | ) | | Net Sales | | $ | 1,127 |
| | $ | — |
|
| Foreign currency contracts – sell | | (1,604 | ) | | Net Sales | | 1,139 |
| | — |
|
| Foreign currency contracts – buy | | (1,039 | ) | | Cost of Goods Sold | | 574 |
| | — |
|
| Commodity contracts | | (133 | ) | | Cost of Goods Sold | | 149 |
| | — |
|
| Interest rate contracts | | $ | (7,469 | ) | | Interest Expense | | $ | — |
| | $ | — |
|
| | | $ | (13,552 | ) | | | | $ | 2,989 |
| | $ | — |
|
|
| | | | | | | | | | | | | | |
| | | Twelve months ended July 1, 2018 |
| | | Amount of Gain (Loss) Recognized in Other Comprehensive Income (Loss) on Derivatives, Net of Taxes (Effective Portion) | | Classification of Gain (Loss) | | Amount of Gain (Loss) Reclassified from AOCI into Income (Effective Portion) | | Recognized in Earnings (Ineffective Portion) |
| Interest rate contracts | | $ | 1,921 |
| | Net Sales | | $ | 251 |
| | $ | — |
|
| Foreign currency contracts – sell | | 2,925 |
| | Net Sales | | (4,116 | ) | | — |
|
| Foreign currency contracts – buy | | 1,731 |
| | Cost of Goods Sold | | (679 | ) | | — |
|
| Commodity contracts | | (17 | ) | | Cost of Goods Sold | | (96 | ) | | — |
|
| | | $ | 6,560 |
| | | | $ | (4,640 | ) | | $ | — |
|
|
| | | | | | | | | | | | | | |
| | | Twelve months ended July 2, 2017 |
| | | Amount of Gain (Loss) Recognized in Other Comprehensive Income (Loss) on Derivatives, Net of Taxes (Effective Portion) | | Classification of Gain (Loss) | | Amount of Gain (Loss) Reclassified from AOCI into Income (Effective Portion) | | Recognized in Earnings (Ineffective Portion) |
| Interest rate contracts | | $ | 1,973 |
| | Net Sales | | $ | (743 | ) | | $ | — |
|
| Foreign currency contracts – sell | | (887 | ) | | Net Sales | | 1,785 |
| | — |
|
| Foreign currency contracts – buy | | 297 |
| | Cost of Goods Sold | | (2,142 | ) | | — |
|
| Commodity contracts | | 93 |
| | Cost of Goods Sold | | (258 | ) | | — |
|
| | | $ | 1,476 |
| | | | $ | (1,358 | ) | | $ | — |
|
During the next twelve months, the amount of the June 30, 2019 Accumulated Other Comprehensive Income (Loss) balance that is expected to be reclassified into gains is $0.8 million.
The Company enters into forward exchange contracts to hedge purchases and sales that are denominated in foreign currencies. The terms of these currency derivatives generally do not exceed twenty-four months, and the purpose is to protect the Company from the risk that the eventual dollars being transferred will be adversely affected by changes in exchange rates.
The Company has forward foreign exchange contracts to sell foreign currency, with the Euro as the most significant. These contracts are used to hedge foreign currency collections on sales of inventory. The Company also has forward contracts to purchase foreign currencies. The Company’s foreign currency forward contracts are carried at fair value based on current exchange rates.
The Company had the following forward currency contracts outstanding at the end of fiscal 2019 with the notional value shown in local currency and the contract value, fair value, and (gain) loss at fair value shown in U.S. dollars:
|
| | | | | | | | | | | | | | | | | | |
| Hedge | | In Thousands | | | | |
| | | Notional Value | | Contract Value | | Fair Value | | (Gain) Loss at Fair Value | | Conversion Currency | | Latest Expiration Date |
| Currency | | Contract | |
| Australian Dollar | | Sell | | 17,611 |
| | 12,660 |
| | 12,329 |
| | (331 | ) | | U.S. | | February 2020 |
| Brazilian Real | | Sell | | 13,436 |
| | 3,455 |
| | 3,461 |
| | 30 |
| | U.S. | | December 2019 |
| Canadian Dollar | | Sell | | 14,610 |
| | 9,968 |
| | 11,171 |
| | 88 |
| | U.S. | | August 2020 |
| Chinese Renminbi | | Buy | | 70,555 |
| | 10,154 |
| | 10,267 |
| | (113 | ) | | U.S. | | October 2020 |
| Euro | | Sell | | 2,750 |
| | 3,313 |
| | 3,161 |
| | (151 | ) | | U.S. | | March 2020 |
The Company had the following forward currency contracts outstanding at the end of fiscal 2018 with the notional value shown in local currency and the contract value, fair value, and (gain) loss at fair value shown in U.S. dollars:
|
| | | | | | | | | | | | | | | | | | |
| Hedge | | In Thousands | | | | |
| | | Notional Value | | Contract Value | | Fair Value | | (Gain) Loss at Fair Value | | Conversion Currency | | Latest Expiration Date |
| Currency | | Contract | |
| Australian Dollar | | Sell | | 35,833 |
| | 27,880 |
| | 26,558 |
| | (1,322 | ) | | U.S. | | May 2019 |
| Brazilian Real | | Buy | | 28,822 |
| | 6,682 |
| | 7,571 |
| | (889 | ) | | U.S. | | March 2019 |
| Canadian Dollar | | Sell | | 14,430 |
| | 11,393 |
| | 11,020 |
| | (373 | ) | | U.S. | | August 2019 |
| Chinese Renminbi | | Buy | | 62,209 |
| | 9,234 |
| | 9,324 |
| | (90 | ) | | U.S. | | June 2019 |
| Euro | | Sell | | 32,592 |
| | 39,648 |
| | 38,603 |
| | (1,045 | ) | | U.S. | | July 2019 |
| Japanese Yen | | Buy | | 587,500 |
| | 5,316 |
| | 5,324 |
| | — |
| | U.S. | | November 2018 |
The Company continuously evaluates the effectiveness of its hedging program by evaluating its foreign exchange contracts compared to the anticipated underlying transactions. The Company did not have any ineffective currency hedges in fiscal 2019, 2018, or 2017.
(16) Employee Benefit Costs:
Retirement Plan and Other Postretirement Benefits
The Company has noncontributory, defined benefit retirement plans and other postretirement benefit plans covering certain employees. In October 2012, the Board of Directors of the Company authorized an amendment to the Company's defined benefit retirement plans for U.S. non-bargaining employees. The amendment freezes accruals for all non-bargaining employees within the pension plan effective December 31, 2013. The Company uses a June 30 measurement date for all of its plans. The following provides a reconciliation of obligations, plan assets and funded status of the plans for the two years indicated (in thousands): |
| | | | | | | | | | | | | | | | |
| | | Pension Benefits | | Other Postretirement Benefits |
| Actuarial Assumptions: | | 2019 | | 2018 | | 2019 | | 2018 |
| Discounted Rate Used to Determine Present Value of Projected Benefit Obligation | | 3.60 | % | | 4.30 | % | | 3.55 | % | | 4.25 | % |
| Weighted Average Expected Long-Term Rate of Return on Plan Assets | | 6.90 | % | | 7.00 | % | | n/a |
| | n/a |
|
| Change in Benefit Obligations: | | | | | | | | |
| Projected Benefit Obligation at Beginning of Year | | $ | 959,010 |
| | $ | 1,116,705 |
| | $ | 58,801 |
| | $ | 66,693 |
|
| Service Cost | | 4,541 |
| | 2,402 |
| | 106 |
| | 135 |
|
| Interest Cost | | 39,720 |
| | 43,068 |
| | 2,332 |
| | 2,372 |
|
| Plan Settlements | | (1,720 | ) | | (101,553 | ) | | — |
| | — |
|
| Plan Participant Contributions | | — |
| | — |
| | 2,212 |
| | 2,346 |
|
| Actuarial (Gain) Loss | | 59,362 |
| | (27,541 | ) | | 1,364 |
| | (146 | ) |
| Benefits Paid | | (63,228 | ) | | (74,071 | ) | | (10,815 | ) | | (12,599 | ) |
| Projected Benefit Obligation at End of Year | | $ | 997,685 |
| | $ | 959,010 |
| | $ | 54,000 |
| | $ | 58,801 |
|
| Change in Plan Assets: | | | | | | | | |
| Fair Value of Plan Assets at Beginning of Year | | $ | 765,644 |
| | $ | 870,606 |
| | $ | — |
| | $ | — |
|
| Actual Return on Plan Assets | | 68,745 |
| | 36,914 |
| | — |
| | — |
|
| Plan Participant Contributions | | — |
| | — |
| | 2,212 |
| | 2,346 |
|
| Employer Contributions | | 3,734 |
| | 33,748 |
| | 8,603 |
| | 10,253 |
|
| Benefits Paid | | (63,228 | ) | | (74,071 | ) | | (10,815 | ) | | (12,599 | ) |
| Plan Settlements | | (1,720 | ) | | (101,553 | ) | | — |
| | — |
|
| Fair Value of Plan Assets at End of Year | | $ | 773,175 |
| | $ | 765,644 |
| | $ | — |
| | $ | — |
|
| Funded Status: | | | | | | | | |
| Plan Assets (Less Than) in Excess of Projected Benefit Obligation | | $ | (224,510 | ) | | $ | (193,366 | ) | | $ | (54,000 | ) | | $ | (58,801 | ) |
| Amounts Recognized on the Balance Sheets: | | | | | | | | |
| Accrued Pension Cost | | $ | (221,033 | ) | | $ | (189,872 | ) | | $ | — |
| | $ | — |
|
| Accrued Wages and Salaries | | (3,477 | ) | | (3,494 | ) | | — |
| | — |
|
| Accrued Postretirement Health Care Obligation | | — |
| | — |
| | (25,929 | ) | | (30,186 | ) |
| Accrued Liabilities | | — |
| | — |
| | (6,760 | ) | | (8,418 | ) |
| Accrued Employee Benefits | | — |
| | — |
| | (21,311 | ) | | (20,197 | ) |
| Net Amount Recognized at End of Year | | $ | (224,510 | ) | | $ | (193,366 | ) | | $ | (54,000 | ) | | $ | (58,801 | ) |
| Amounts Recognized in Accumulated Other Comprehensive Income (Loss), Net of Tax: | | | | | | | | |
| Net Actuarial Loss | | $ | (242,565 | ) | | $ | (218,066 | ) | | $ | (10,571 | ) | | $ | (11,815 | ) |
| Prior Service Credit (Cost) | | (3 | ) | | (125 | ) | | — |
| | 433 |
|
| Net Amount Recognized at End of Year | | $ | (242,568 | ) | | $ | (218,191 | ) | | $ | (10,571 | ) | | $ | (11,382 | ) |
The accumulated benefit obligation for all defined benefit pension plans was $998 million and $959 million at June 30, 2019 and July 1, 2018, respectively.
The Company recognizes the funded status of its pension plan in the Consolidated Balance Sheets. The funded status is the difference between the projected benefit obligation and the fair value of its plan assets. The projected benefit obligation is the actuarial present value of all benefits expected to be earned by the employees’ service adjusted for future potential wage increases. Pension plan liabilities are revalued annually, or when an event occurs that requires remeasurement, based on updated assumptions and information about the individuals covered by the plan.
The pension benefit obligation and related pension expense or income are impacted by certain actuarial assumptions, including the discount rate, mortality tables, and the expected rate of return on plan assets. The discount rate is selected using a methodology that matches plan cash flows with a selection of Standard and Poor’s AA or higher rated bonds, resulting in a discount rate that is consistent with a bond yield curve with comparable cash flows. In estimating the expected return on plan assets, the Company considers the historical returns on plan assets, adjusted for forward looking considerations, including inflation assumptions and active management of the plan’s invested assets. These rates are evaluated on an annual basis considering such factors as market interest rates and historical asset performance.
For pension and other postretirement plans, accumulated actuarial gains and losses in excess of a 10 percent corridor are amortized on a straight-line basis from the date recognized over the average remaining life expectancy of all participants. Any prior service costs are amortized on a straight-line basis over the average remaining service of impacted employees at the time the unrecognized prior service cost was established. Approximately half of the costs related to defined pension benefit and other postretirement plans are included in cost of sales; the remainder is included in selling, general and administrative expenses.
The following table summarizes the plans’ income and expense for the three years indicated (in thousands):
|
| | | | | | | | | | | | | | | | | | | | | | | | |
| | | Pension Benefits | | Other Postretirement Benefits |
| | | 2019 | | 2018 | | 2017 | | 2019 | | 2018 | | 2017 |
| Components of Net Periodic (Income) Expense: | | | | | | | | | | | | |
| Service Cost-Benefits Earned During the Year | | $ | 4,541 |
| | $ | 2,402 |
| | $ | 6,757 |
| | $ | 106 |
| | $ | 135 |
| | $ | 191 |
|
| Interest Cost on Projected Benefit Obligation | | 39,720 |
| | 43,068 |
| | 43,357 |
| | 2,332 |
| | 2,372 |
| | 2,382 |
|
| Expected Return on Plan Assets | | (54,327 | ) | | (61,912 | ) | | (64,427 | ) | | — |
| | — |
| | — |
|
| Amortization of: | | | | | | | | | | | | |
| Prior Service Cost (Credit) | | 179 |
| | 179 |
| | 180 |
| | (729 | ) | | (1,434 | ) | | (2,654 | ) |
| Actuarial Loss | | 11,638 |
| | 15,332 |
| | 16,957 |
| | 3,159 |
| | 3,453 |
| | 2,796 |
|
| Plan Settlements | | 521 |
| | 41,157 |
| | — |
| | — |
| | — |
| | — |
|
| Net Periodic Expense | | $ | 2,272 |
| | $ | 40,226 |
| | $ | 2,824 |
| | $ | 4,868 |
| | $ | 4,526 |
| | $ | 2,715 |
|
Significant assumptions used in determining net periodic expense for the fiscal years indicated are as follows:
|
| | | | | | | | | | | | |
| | | Pension Benefits | | Other Postretirement Benefits |
| | | 2019 | | 2018 | | 2017 | | 2019 | | 2018 | | 2017 |
| Discount Rate | | 4.30% | | 4.00% | | 3.75% | | 4.25% | | 3.85% | | 3.60% |
| Expected Return on Plan Assets | | 7.05% | | 7.10% | | 7.25% | | n/a | | n/a | | n/a |
| Compensation Increase Rate | | n/a | | n/a | | n/a | | n/a | | n/a | | n/a |
The amounts in Accumulated Other Comprehensive Income (Loss) that are expected to be recognized as components of net periodic (income) expense during the next fiscal year are as follows (in thousands):
|
| | | | | | | | |
| | | Pension Plans | | Other Postretirement Plans |
| Prior Service Cost (Credit) | | $ | (78 | ) | | $ | — |
|
| Net Actuarial Loss | | (15,904 | ) | | (2,998 | ) |
The “Other Postretirement Benefit” plans are unfunded.
For measurement purposes a 5.8% annual rate of increase in the per capita cost of covered health care claims was assumed for the Company for fiscal year 2019 decreasing gradually to 4.5% for the fiscal year 2038. The health care cost trend rate assumptions have a significant effect on the amounts reported. An increase of one percentage point would increase the accumulated postretirement benefit by $0.8 million and would increase the service and interest cost by $41 thousand for fiscal 2019. A corresponding decrease of one percentage point would decrease the accumulated postretirement benefit by $0.8 million and decrease the service and interest cost by $46 thousand for the fiscal year 2019.
During the fourth quarter of fiscal 2018, the Company annuitized a portion of the qualified pension plan obligation which removed approximately $100 million of pension benefit obligation and offsetting assets. This transaction resulted in a non-cash pre-tax charge of $41.2 million ($29.6 million after tax) during 2018.
Plan Assets
A Board of Directors appointed Investment Committee (“Committee”) manages the investment of the pension plan assets. The Committee has established and operates under an Investment Policy. It determines the asset allocation and target ranges based upon periodic asset/liability studies and capital market projections. The Committee retains external investment managers to invest the assets. The Investment Policy prohibits certain investment transactions, such as lettered stock, commodity contracts, margin transactions and short selling, unless the Committee gives prior approval.
The Company’s pension plan’s current target and asset allocations at June 30, 2019 and July 1, 2018, by asset category are as follows:
|
| | | | | | |
| | | | | Plan Assets at Year-end |
Asset Category | | Target % | | 2019 | | 2018 |
| Domestic Equities | | 14%-25% | | 19% | | 24% |
| International Equities | | 14%-26% | | 19% | | 16% |
| Global Equities | | 2%-8% | | 5% | | —% |
| Hedge Funds | | 2%-8% | | 4% | | —% |
| Alternatives | | 3%-9% | | 6% | | 7% |
| Fixed Income | | 37%-53% | | 45% | | 51% |
| Cash Equivalents | | 0%-3% | | 2% | | 2% |
| | | | | 100% | | 100% |
The plan’s investment strategy is based on an expectation that, over time, equity securities will provide higher total returns than debt securities, but with greater risk. The plan primarily minimizes the risk of large losses through diversification of investments by asset class, by investing in different types of styles within the classes, using a number of different managers, and by structuring a dedicated fixed income allocation to better match future cash flows from plan assets with the future cash flows of the projected benefit obligation. The Committee monitors the asset allocation and investment performance monthly, with a more comprehensive quarterly review with its investment advisor.
The plan’s expected return on assets is based on management’s and the Committee’s expectations of long-term average rates of return to be achieved by the plan’s investments. These expectations are based on the plan’s historical returns and expected returns for the asset classes in which the plan is invested.
The Company has adopted the fair value provisions for the plan assets of its pension plans. The Company categorizes plan assets within a three level fair value hierarchy, as described in Note 6.
Investments stated at fair value as determined by quoted market prices (Level 1) include:
Short-Term Investments: Short-Term Investments include cash and money market mutual funds that invest in short-term securities and are valued based on cost, which approximates fair value.
Equity Securities: U.S. Common Stocks and International Mutual Funds are valued at the last reported sales price on the last business day of the fiscal year.
Investments stated at estimated fair value using significant observable inputs (Level 2) include:
Fixed Income Securities: Fixed Income Securities include investments in domestic bond collective trusts that are not traded publicly, but the underlying assets held in these funds are traded on active markets and the prices are readily observable. The investment in the trusts is valued at the last quoted price on the last business day of the fiscal year. Fixed Income Securities also include corporate and government bonds that are valued using a bid evaluation process with data provided by independent pricing sources.
Investments stated at estimated fair value using net asset value per share as the practical expedient include:
Other Investments: Other Investments include investments in limited partnerships and are valued at estimated fair value, as determined with the assistance of each respective limited partnership, based on the net asset value of the investment as of the balance sheet date, which is subject to judgment.
The fair value of the major categories of the pension plans’ investments are presented below (in thousands):
|
| | | | | | | | | | | | | | | | | | |
| | | | | June 30, 2019 |
Category | | | | Total | | Level 1 | | Level 2 | | NAV |
| Short-Term Investments: | | | | $ | 11,982 |
| | $ | 11,982 |
| | $ | — |
| | $ | — |
|
| Fixed Income Securities: | | | | 351,029 |
| | — |
| | 283,392 |
| | 67,637 |
|
| Equity Securities: | | | | | | | | | | |
| U.S. common stocks | | | | 148,967 |
| | 50,919 |
| | — |
| | 98,048 |
|
| International mutual funds | | | | 149,899 |
| | — |
| | — |
| | 149,899 |
|
| Global equities | | | | 36,491 |
| | — |
| | — |
| | 36,491 |
|
| Other Investments: | | | | | | | | | | |
| Venture capital funds | | (A) | | 20,633 |
| | — |
| | — |
| | 20,633 |
|
| Hedge funds | | | | 32,698 |
| | — |
| | — |
| | 32,698 |
|
| Debt funds | | (B) | | 1,777 |
| | — |
| | — |
| | 1,777 |
|
| Real estate funds | | (C) | | 770 |
| | — |
| | — |
| | 770 |
|
| Private equity funds | | (D) | | 18,929 |
| | — |
| | — |
| | 18,929 |
|
| Fair Value of Plan Assets at End of Year | | | | $ | 773,175 |
| | $ | 62,901 |
| | $ | 283,392 |
| | $ | 426,882 |
|
|
| | | | | | | | | | | | | | | | | | |
| | | | | July 1, 2018 |
Category | | | | Total | | Level 1 | | Level 2 | | NAV |
| Short-Term Investments: | | | | $ | 17,061 |
| | $ | 17,061 |
| | $ | — |
| | $ | — |
|
| Fixed Income Securities: | | | | 394,188 |
| | — |
| | 394,188 |
| | — |
|
| Equity Securities: | | | | | | | | | | |
| U.S. common stocks | | | | 183,030 |
| | 183,030 |
| | — |
| | — |
|
| International mutual funds | | | | 118,674 |
| | 118,674 |
| | — |
| | — |
|
| Other Investments: | | | | | | | | | | |
| Venture capital funds | | (A) | | 26,078 |
| | — |
| | — |
| | 26,078 |
|
| Debt funds | | (B) | | 2,778 |
| | — |
| | — |
| | 2,778 |
|
| Real estate funds | | (C) | | 1,166 |
| | — |
| | — |
| | 1,166 |
|
| Private equity funds | | (D) | | 22,656 |
| | — |
| | — |
| | 22,656 |
|
| Fair Value of Plan Assets at End of Year | | | | $ | 765,631 |
| | $ | 318,765 |
| | $ | 394,188 |
| | $ | 52,678 |
|
| |
| (A) | This category invests in a combination of public and private securities of companies in financial distress, spin-offs, or new projects focused on technology and manufacturing. |
| |
| (B) | This fund primarily invests in the debt of various entities including corporations and governments in emerging markets, mezzanine financing, or entities that are undergoing, are considered likely to undergo or have undergone a reorganization. |
| |
| (C) | This category invests primarily in real estate related investments, including real estate properties, securities of real estate companies and other companies with significant real estate assets as well as real estate related debt and equity securities. |
| |
| (D) | Primarily represents investments in all sizes of mostly privately held operating companies in the following core industry sectors: healthcare, energy, financial services, technology-media-telecommunications and industrial and consumer. |
Contributions
During fiscal 2019, the Company made no voluntary cash contributions to the qualified pension plan. Based upon current regulations and actuarial studies the Company is required to make no minimum contributions to the qualified pension plan in fiscal 2020, but the Company may choose to make discretionary contributions. The Company may be required to make further required contributions in future years or the future expected funding requirements may change depending on a variety of factors including the actual return on plan assets, the funded status of the plan in future periods, and changes in actuarial assumptions or regulations.
Estimated Future Benefit Payments
Projected benefit payments from the plans as of June 30, 2019 are estimated as follows (in thousands):
|
| | | | | | | | | | | | | | | | |
| | | Pension Benefits | | Other Postretirement Benefits |
| Year Ending | | Qualified | | Non-Qualified | | Retiree Medical | | Retiree Life |
| 2020 | | $ | 63,368 |
| | $ | 3,477 |
| | $ | 5,335 |
| | $ | 1,425 |
|
| 2021 | | 63,435 |
| | 3,512 |
| | 4,236 |
| | 1,432 |
|
| 2022 | | 63,128 |
| | 3,586 |
| | 3,632 |
| | 1,437 |
|
| 2023 | | 62,664 |
| | 3,619 |
| | 3,130 |
| | 1,437 |
|
| 2024 | | 62,042 |
| | 3,653 |
| | 2,605 |
| | 1,435 |
|
| 2024-2028 | | 293,444 |
| | 18,316 |
| | 7,897 |
| | 7,004 |
|
Defined Contribution Plans
Employees of the Company may participate in a defined contribution savings plan that allows participants to contribute a portion of their earnings in accordance with plan specifications. A maximum of 1.5% to 4.0% of each participant’s salary, depending upon the participant’s group, is matched by the Company. Additionally, all domestic non-bargaining employees receive a Company non-elective contribution of 3.0% of the employee’s pay.
The Company contributions totaled $14.9 million in fiscal year 2019 and $14.5 million in 2018 and 2017, respectively.
Postemployment Benefits
The Company accrues the expected cost of postemployment benefits over the years that the employees render service. These benefits apply only to employees who become disabled while actively employed, or who terminate with at least thirty years of service and retire prior to age sixty-five. The items include disability payments, life insurance and medical benefits. These amounts were discounted using a 3.55% interest rate for fiscal 2019 and 4.25% interest rate for fiscal 2018. Amounts are included in Accrued Employee Benefits in the Consolidated Balance Sheets.
(17) Acquisitions:
On July 31, 2018 the Company completed a cash acquisition of certain assets of Hurricane Inc., a designer and manufacturer of commercial stand-on leaf and debris blowers. The purchase price is comprised of $8.7 million of cash consideration and $2.0 million of contingent cash consideration. The Company has accounted for the acquisition in accordance with ASC 805 and it has been included in the Products segment. At June 30, 2019, the Company's final purchase accounting resulted in the recognition of $6.7 million of goodwill and $4.4 million of intangible assets.
(18) Equity:
Share Repurchases
On April 21, 2016, the Board of Directors authorized $50 million in funds for use in the common share repurchase program which expired on June 29, 2018. On April 25, 2018, the Board of Directors authorized an additional $50 million in funds for use in the common share repurchase program expiring June 30, 2020. As of June 30, 2019, the total remaining authorization was $38 million. Share repurchases, among other things, allow the Company to offset any potentially dilutive impacts of share-based compensation. The common share repurchase program authorizes the purchase of shares of the Company's common stock on the open market or in private transactions from time to time, depending on market conditions and certain governing debt covenants. In fiscal 2019, the Company repurchased 725,321 shares on the open market at a total cost of $11.9 million, or $16.46 per share. There were 467,183 shares repurchased in fiscal 2018 at a total cost of $10.3 million, or $22.07 per share.
(19) Subsequent Events:
In accordance with ASC 855 - Subsequent Events, the Company has evaluated events that occurred after the balance sheet date through the issuance date of the Company's financial statements to determine whether adjustments to or additional disclosures in the financial statements are necessary.
On August 15, 2019, the Company announced a plan to consolidate the Company’s production of small vertical shaft engines into its Poplar Bluff, Missouri facility. This decision was made after a comprehensive evaluation of the Company’s manufacturing operations. The Company’s Murray, Kentucky facility currently manufactures small vertical shaft engines and will be closed as a result of this consolidation. The pre-tax expense related to the restructuring activities is estimated to be $30 million to $35 million, of which $15 million to $20 million is expected to be realized in fiscal 2020. The Company anticipates annualized pre-tax savings of $12 million to $14 million due to the restructuring actions, with approximately $10 million recognized by fiscal year 2021.
On August 15, 2019, the first quarter fiscal 2020 dividend of $0.05 per share was announced, which is reduced compared to $0.14 per share paid in the past several quarters.
|
| | |
| Report of Independent Registered Public Accounting Firm | |
| | | |
To the Shareholders and the Board of Directors of Briggs & Stratton Corporation
Opinion on the Financial Statements
We have audited the accompanying consolidated balance sheets of Briggs & Stratton Corporation and subsidiaries (the "Company") as of June 30, 2019 and July 1, 2018, the related consolidated statements of operations, comprehensive income (loss), shareholders' investment, and cash flows, for each of the three years in the period ended June 30, 2019, and the related notes and the schedules listed in the Index at Item 15(a)(2) (collectively referred to as the "financial statements"). In our opinion, the financial statements present fairly, in all material respects, the financial position of the Company as of June 30, 2019 and July 1, 2018, and the results of its operations and its cash flows for each of the three years in the period ended June 30, 2019, in conformity with accounting principles generally accepted in the United States of America.
We have also audited, in accordance with the standards of the Public Company Accounting Oversight Board (United States) (PCAOB), the Company's internal control over financial reporting as of June 30, 2019, based on criteria established in Internal Control - Integrated Framework (2013) issued by the Committee of Sponsoring Organizations of the Treadway Commission and our report dated August 27, 2019, expressed an unqualified opinion on the Company's internal control over financial reporting.
Basis for Opinion
These financial statements are the responsibility of the Company's management. Our responsibility is to express an opinion on the Company's financial statements based on our audits. We are a public accounting firm registered with the PCAOB and are required to be independent with respect to the Company in accordance with the U.S. federal securities laws and the applicable rules and regulations of the Securities and Exchange Commission and the PCAOB.
We conducted our audits in accordance with the standards of the PCAOB. Those standards require that we plan and perform the audit to obtain reasonable assurance about whether the financial statements are free of material misstatement, whether due to error or fraud. Our audits included performing procedures to assess the risks of material misstatement of the financial statements, whether due to error or fraud, and performing procedures that respond to those risks. Such procedures included examining, on a test basis, evidence regarding the amounts and disclosures in the financial statements. Our audits also included evaluating the accounting principles used and significant estimates made by management, as well as evaluating the overall presentation of the financial statements. We believe that our audits provide a reasonable basis for our opinion.
Critical Audit Matters
The critical audit matters communicated below are matters arising from the current-period audit of the financial statements that were communicated or required to be communicated to the audit committee and that (1) relate to accounts or disclosures that are material to the financial statements and (2) involved our especially challenging, subjective, or complex judgments. The communication of critical audit matters does not alter in any way our opinion on the financial statements, taken as a whole, and we are not, by communicating the critical audit matters below, providing separate opinions on the critical audit matters or on the accounts or disclosures to which they relate.
|
| | | | |
| Goodwill - Engines, Turf & Consumer and Jobsite Reporting Units -Refer to Notes 2 and 7 to the financial statements |
| Critical Audit Matter Description |
The Company evaluates goodwill for impairment annually as of the end of the fourth fiscal quarter by comparing the carrying values of each of the Company’s reporting units to their estimated fair values as of the test dates. The estimates of fair value of the reporting units are computed using either an income approach, a market approach, or a combination of both.
Under the income approach, the Company utilizes the discounted cash flow method to estimate the fair value of the reporting units. Some of the significant assumptions inherent in estimating the fair values include the estimated future annual net cash flows for each reporting unit (including net sales, operating income margin, and working capital) and a discount rate that appropriately reflects the risks inherent in each future cash flow stream. The Company selected assumptions used in the financial forecasts using historical data, supplemented by current and anticipated market conditions, estimated growth rates, management’s plans, and guideline companies.
|
| | |
| Report of Independent Registered Public Accounting Firm | |
| | | |
Under the market approach, fair value is derived from metrics of publicly traded companies or historically completed transactions of comparable businesses. The selection of comparable businesses is based on the markets in which the reporting units operate giving consideration to risk profiles, size, geography, and diversity of products and services.
The goodwill balance was $169.7 million as of June 30, 2019, of which $137.1 million is allocated to the Engines reporting unit, $20.6 million to the Turf and Consumer reporting unit and $12 million to the Jobsite reporting unit. The fair values of the reporting units exceeded their carrying values as of the measurement date and, therefore, no impairment was recognized.
We identified goodwill impairment as a critical audit matter because of the significant estimates and assumptions made by management to estimate fair value given the sensitivity of operations to changes in demand for all reporting units and historical results and long-range strategic plan of the Jobsite reporting unit. This required a high degree of auditor judgment and an increased extent of effort, including the need to involve our fair value specialists, when performing audit procedures to evaluate the reasonableness of management’s estimates and assumptions related to the selection of the discount rates and forecasts of future net sales for all reporting units, and the future operating income margins for the Jobsite reporting unit.
|
| | | | |
| How the Critical Audit Matter Was Addressed in the Audit |
Our audit procedures related to the selection of the discount rates and forecasts of future net sales for all reporting units and the future operating margins for the Jobsite reporting unit included the following, among others:
| |
| • | We tested the effectiveness of controls over management’s goodwill impairment evaluation, including those over management’s forecasts of future net sales and operating income margins and the selection of the discount rates. |
| |
| • | We evaluated management’s ability to accurately forecast future net sales and operating income margins by comparing actual results to management’s historical forecasts. |
| |
| • | We evaluated the reasonableness of management’s forecasts of future net sales and operating income margins by comparing the forecasts to (1) historical growth of net sales and historical operating income margins, (2) management’s long-range strategic plan which was communicated to the Board of Directors, and (3) forecasted information included in Company press releases, as well as, in analyst and industry reports for the Company and companies in its peer group. |
| |
| • | With the assistance of our fair value specialists, we evaluated the reasonableness of the (1) valuation methodology and (2) discount rates by: |
| |
| ◦ | Testing the source information underlying the determination of the discount rates and the mathematical accuracy of the calculation. |
| |
| ◦ | Developing a range of independent estimates and comparing those to the discount rates selected by management. |
|
| | | | |
| Commitments and Contingencies - Refer to Note 13 to the financial statements |
| Critical Audit Matter Description |
The Company has contingent liabilities related to litigation and claims that arise in the normal course of business. The Company accrues for contingent liabilities when management determines it is probable that a liability has been incurred and the amount can be reasonably estimated. This determination requires significant judgment by management.
In 2010, Exmark Manufacturing Company Inc. (“Exmark”) filed suit against the Company alleging that the Company infringed an Exmark patent. On December 20, 2018, the district court entered judgment against the Company in favor of Exmark in the amount of $14.4 million in compensatory damages, an additional $14.4 million in enhanced damages, as well as pre-judgment interest, post-judgment interest and costs to be determined. On April 15, 2019, the district court entered an order denying the Company’s post-trial motions related to modification of the jury’s damages award, as well as seeking a new trial in light of certain evidentiary rulings. The district court awarded
|
| | |
| Report of Independent Registered Public Accounting Firm | |
| | | |
$6.0 million in pre-judgment interest, as well as post judgment interest after December 19, 2018 and costs to be determined. The Company filed its notice of appeal on May 14, 2019 and has appealed errors made by the district court in construing certain claims of Exmark’s patent, granting summary judgment motions filed by Exmark, and altering the prejudgment interest rate.
In assessing whether the Company should accrue a liability in its financial statements as a result of the lawsuit, the Company considered various factors, including the legal and factual circumstances of the case, the trial records and post-trial rulings of the district court, the decision of the appellate court, the current status of the proceedings, applicable law and the views of legal counsel. The Company has concluded that a loss from this case is not probable and reasonably estimable and, therefore, a liability has not been recorded with respect to this case as of June 30, 2019. While the Company believes that the ultimate resolution of this matter will not have a material impact on the Company's financial statements, the outcome of litigation is inherently uncertain and the final resolution of this matter may result in expense to the Company in excess of management's expectations.
We identified this potential contingent liability and disclosure related to the Exmark litigation as a critical audit matter because evaluating the likelihood of potential outcomes of the Exmark litigation involves significant judgment by management. This required a high degree of auditor judgment and an increased extent of effort when performing audit procedures to evaluate the Company’s assertion that a loss from this litigation is not probable and reasonably estimable as of June 30, 2019.
|
| | | | |
| How the Critical Audit Matter Was Addressed in the Audit |
Our audit procedures related to the potential contingent liability and disclosure of the Exmark litigation included the following, among others:
| |
| • | We tested the effectiveness of control related to management’s review of the legal case and approval of the accounting treatment based on the most recent facts and circumstances related to the case. |
| |
| • | We held discussions with the Company’s General Counsel to determine the status of the case and to understand the basis for the Company’s conclusion that the loss from the case is not probable and reasonably estimable as of June 30, 2019. |
| |
| • | We held discussions with the Company’s external counsel regarding the facts of the case to understand the basis for the appeal and to evaluate if contradictory evidence existed. |
| |
| • | We evaluated the detailed exposure analysis of the case, which was prepared by senior personnel within the office of the Company’s General Counsel and reviewed by the Company’s external counsel. This analysis included considerations regarding the legal defenses available to the Company and the likelihood of the final resolution of the case. |
| |
| • | We obtained and evaluated a legal confirmation from the Company’s external counsel involved in the case confirming the facts and circumstances of the case. |
| |
| • | We evaluated the accuracy and completeness of the Company’s disclosures in the June 30, 2019 financial statements by comparing the disclosures to the Company’s internal analysis of the case and known facts of the case based on the various court rulings. |
/s/ Deloitte & Touche LLP
Milwaukee, Wisconsin
August 27, 2019
We have served as the Company's auditor since 2012.
|
| | |
| Report of Independent Registered Public Accounting Firm | |
| | | |
To the Shareholders and the Board of Directors of Briggs & Stratton Corporation
Opinion on Internal Control over Financial Reporting
We have audited the internal control over financial reporting of Briggs & Stratton Corporation and subsidiaries (the “Company”) as of June 30, 2019, based on criteria established in Internal Control - Integrated Framework (2013) issued by the Committee of Sponsoring Organizations of the Treadway Commission (COSO).
In our opinion, the Company maintained, in all material respects, effective internal control over financial reporting as of June 30, 2019, based on criteria established in Internal Control - Integrated Framework (2013) issued by COSO.
We have also audited, in accordance with the standards of the Public Company Accounting Oversight Board (United States) (PCAOB), the consolidated financial statements as of and for the year ended June 30, 2019, of the Company and our report dated August 27, 2019, expressed an unqualified opinion on those financial statements.
Basis for Opinion
The Company’s management is responsible for maintaining effective internal control over financial reporting and for its assessment of the effectiveness of internal control over financial reporting, included in the accompanying Management’s Report on Internal Control Over Financial Reporting. Our responsibility is to express an opinion on the Company’s internal control over financial reporting based on our audit. We are a public accounting firm registered with the PCAOB and are required to be independent with respect to the Company in accordance with the U.S. federal securities laws and the applicable rules and regulations of the Securities and Exchange Commission and the PCAOB.
We conducted our audit in accordance with the standards of the PCAOB. Those standards require that we plan and perform the audit to obtain reasonable assurance about whether effective internal control over financial reporting was maintained in all material respects. Our audit included obtaining an understanding of internal control over financial reporting, assessing the risk that a material weakness exists, testing and evaluating the design and operating effectiveness of internal control based on the assessed risk, and performing such other procedures as we considered necessary in the circumstances. We believe that our audit provides a reasonable basis for our opinion.
Definition and Limitations of Internal Control over Financial Reporting
A company’s internal control over financial reporting is a process designed to provide reasonable assurance regarding the reliability of financial reporting and the preparation of financial statements for external purposes in accordance with generally accepted accounting principles. A company’s internal control over financial reporting includes those policies and procedures that (1) pertain to the maintenance of records that, in reasonable detail, accurately and fairly reflect the transactions and dispositions of the assets of the company; (2) provide reasonable assurance that transactions are recorded as necessary to permit preparation of financial statements in accordance with generally accepted accounting principles, and that receipts and expenditures of the company are being made only in accordance with authorizations of management and directors of the company; and (3) provide reasonable assurance regarding prevention or timely detection of unauthorized acquisition, use, or disposition of the company’s assets that could have a material effect on the financial statements.
Because of its inherent limitations, internal control over financial reporting may not prevent or detect misstatements. Also, projections of any evaluation of effectiveness to future periods are subject to the risk that controls may become inadequate because of changes in conditions, or that the degree of compliance with the policies or procedures may deteriorate.
/s/ Deloitte & Touche LLP
Milwaukee, Wisconsin
August 27, 2019
|
| | |
| Report of Independent Registered Public Accounting Firm | |
| | | |
|
| | |
| Quarterly Financial Data, Dividend and Market Information (Unaudited) |
| | | |
|
| | | | | | | | | | | | |
| | | In Thousands |
| Quarter Ended | | Net Sales | | Gross Profit | | Net Income (Loss) |
| Fiscal 2019 | | | | | | |
| September (1) | | $ | 278,997 |
| | $ | 43,787 |
| | $ | (40,943 | ) |
| December (2) | | 505,461 |
| | 92,457 |
| | (2,604 | ) |
| March (3) | | 580,195 |
| | 96,987 |
| | 8,005 |
|
| June (4) | | 471,951 |
| | 67,819 |
| | (18,540 | ) |
| Total (5) | | $ | 1,836,605 |
| | $ | 301,051 |
| | $ | (54,083 | ) |
| Fiscal 2018 | | | | | | |
| September | | $ | 329,094 |
| | $ | 66,265 |
| | $ | (15,038 | ) |
| December | | 446,436 |
| | 92,866 |
| | (16,344 | ) |
| March | | 604,069 |
| | 130,273 |
| | 31,888 |
|
| June | | 501,694 |
| | 108,677 |
| | (11,825 | ) |
| Total (5) | | $ | 1,881,293 |
| | $ | 398,081 |
| | $ | (11,319 | ) |
|
| | | | | | | | | | | | | | | | |
| | | Per Share of Common Stock |
| | | | | | | Market Price Range on New York Stock Exchange |
| Quarter Ended | | Net Income (Loss) | | Dividends Declared (6) | | High | | Low |
| Fiscal 2019 | | | | | | | | |
| September (1) | | $ | (0.98 | ) | | $ | 0.14 |
| | $ | 21.31 |
| | $ | 15.65 |
|
| December (2) | | (0.07 | ) | | 0.14 |
| | 19.30 |
| | 12.52 |
|
| March (3) | | 0.19 |
| | 0.14 |
| | 14.41 |
| | 11.26 |
|
| June (4) | | (0.45 | ) | | 0.14 |
| | 14.28 |
| | 9.40 |
|
| Total (5) | | $ | (1.31 | ) | | $ | 0.56 |
| | | | |
| Fiscal 2018 | | | | | | | | |
| September | | $ | (0.36 | ) | | $ | 0.14 |
| | $ | 24.36 |
| | $ | 20.12 |
|
| December | | (0.39 | ) | | 0.14 |
| | 25.72 |
| | 22.98 |
|
| March | | 0.74 |
| | 0.14 |
| | 27.19 |
| | 20.97 |
|
| June | | (0.29 | ) | | 0.14 |
| | 21.15 |
| | 17.38 |
|
| Total (5) | | $ | (0.28 | ) | | $ | 0.56 |
| | | | |
The number of shareholders of record of Briggs & Stratton Corporation Common Stock on June 30, 2019 was 2,190.
(1) For the first quarter of fiscal 2019, results includes business optimization expenses of $19.9 million ($15.0 million after tax or $0.36 per diluted share), bad debt expense after a major retailer filed for bankruptcy protection of $4.1 million ($3.1 million after tax or $0.07 per diluted share), charges for a litigation settlement of $2.0 million ($1.5 million or $0.04 per diluted share), and acquisition integration charges of $0.1 million ($0.1 million of $0.00 per diluted share).
(2) For the second quarter of fiscal 2019, results includes business optimization expenses of $10.7 million ($9.6 million after tax or $0.23 per diluted share), interest charges of $0.2 million ($0.2 million or $0.01 per diluted share) for premiums paid to repurchase senior notes, and acquisition integration charges of $0.2 million ($0.1 million of $0.01 per diluted share).
(3) For the third quarter of fiscal 2019, results includes business optimization expenses of $9.6 million ($6.4 million after tax or $0.14 per diluted share) and acquisition integration charges of $0.3 million ($0.2 million of $0.01 per diluted share).
(4) For the fourth quarter of fiscal 2019, results includes business optimization expenses of $4.7 million ($3.2 million after tax or $0.08 per diluted share), pension settlement charge of $0.5 ($0.3 million or $0.02 per diluted share) and acquisition integration charges of $0.2 million ($0.1 million of $0.01 per diluted share).
(5) Amounts may not total due to rounding.
(6) On August 15, 2019, the first quarter fiscal 2020 dividend of $0.05 per share was announced, which is reduced compared to $0.14 per share paid in the past several quarters.
|
| |
| ITEM 9. | CHANGES IN AND DISAGREEMENTS WITH ACCOUNTANTS ON ACCOUNTING AND FINANCIAL DISCLOSURE |
None.
|
| |
| ITEM 9A. | CONTROLS AND PROCEDURES |
Disclosure Controls and Procedures
The Company’s management, with the participation of the Company’s Chief Executive Officer and Chief Financial Officer, have evaluated the effectiveness of the Company’s disclosure controls and procedures (as such term is defined in Rules 13a-15(e) and 15d-15(e) under the Securities Exchange Act of 1934, as amended (“the Exchange Act”)) as of the end of the period covered by this report. Based on such evaluation, the Company’s Chief Executive Officer and Chief Financial Officer have concluded that, as of the end of such period, the Company’s disclosure controls and procedures are effective in recording, processing, summarizing, and reporting, on a timely basis, information required to be disclosed by the Company in the reports that it files or submits under the Exchange Act.
Management’s Report on Internal Control Over Financial Reporting
The Company’s management is responsible for establishing and maintaining adequate internal control over financial reporting, as such term is defined in Exchange Act Rule 13a-15(f). The Company’s management, with the participation of the Company’s Chief Executive Officer and Chief Financial Officer, has evaluated the effectiveness of the Company’s internal control over financial reporting based on the framework in Internal Control-Integrated Framework (2013) issued by the Committee of Sponsoring Organizations of the Treadway Commission. Based on this evaluation, the Company’s management has concluded that, as of the end of the period covered by this report, the Company’s internal control over financial reporting was effective.
Because of its inherent limitations, internal control over financial reporting may not prevent or detect misstatements. Also, projections of any evaluation of the effectiveness to future periods are subject to the risk that the controls may become inadequate because of changes in conditions, or that the degree of compliance with the policies or procedures may deteriorate.
Deloitte & Touche LLP, an independent registered public accounting firm, has audited the Company’s consolidated financial statements and the effectiveness of internal control over financial reporting as of June 30, 2019, as stated in their report which is included herein.
Changes in Internal Control Over Financial Reporting
There has not been any change in the Company’s internal control over financial reporting during the fourth fiscal quarter that has materially affected, or is reasonably likely to materially affect, the Company’s internal control over financial reporting.
|
| |
| ITEM 9B. | OTHER INFORMATION |
None.
PART III
|
| |
| ITEM 10. | DIRECTORS, EXECUTIVE OFFICERS AND CORPORATE GOVERNANCE |
| |
| (a) | Executive Officers. Reference is made to “Information About our Executive Officers” in Part I after Item 4. |
| |
| (b) | Directors. The information required by this Item is in Briggs & Stratton’s definitive Proxy Statement, prepared for the 2019 Annual Meeting of Shareholders, in Section I. Shareholder Votes under the caption “Item 1: Election of Directors” and in Section II. Corporate Governance under the caption “General Information About Incumbent Directors”, and is incorporated herein by reference. |
| |
| (c) | Section 16 Compliance. The information required by this Item is in Briggs & Stratton’s definitive Proxy Statement, prepared for the 2019 Annual Meeting of Shareholders, in Section IV. Other Matters under the caption “Delinquent Section 16(a) Reports”, and is incorporated herein by reference. |
| |
| (d) | Audit Committee Financial Expert. The information required by this Item is in Briggs & Stratton’s definitive Proxy Statement, prepared for the 2019 Annual Meeting of Shareholders, in Section II. Corporate Governance under the caption “Other Corporate Governance Matters – Board Committees – Audit Committee”, and is incorporated herein by reference. |
| |
| (e) | Identification of Audit Committee. The information required by this Item is in Briggs & Stratton’s definitive Proxy Statement, prepared for the 2019 Annual Meeting of Shareholders, in Section II. Corporate Governance under the caption “Other Corporate Governance Matters – Board Committees – Audit Committee”, and is incorporated herein by reference. |
| |
| (f) | Code of Ethics. Briggs & Stratton has adopted a written code of ethics, referred to as the Briggs & Stratton Integrity Manual, which is applicable to all directors, officers and employees and includes provisions related to accounting and financial matters applicable to the Principal Executive Officer, Principal Financial Officer, Principal Accounting Officer and Controller. The Briggs & Stratton Integrity Manual is available on the Company’s corporate website at www.basco.com. If the Company makes any substantive amendment to, or grants any waiver of, the code of ethics for any director or officer, Briggs & Stratton will disclose the nature of such amendment or waiver on its corporate website or in a Current Report on Form 8-K. |
|
| |
| ITEM 11. | EXECUTIVE COMPENSATION |
The information required by this Item is in Briggs & Stratton’s definitive Proxy Statement, prepared for the 2019 Annual Meeting of Shareholders, in Section III. Executive Compensation under the captions “Compensation Committee Report”, “Compensation Discussion and Analysis”, “Compensation Tables”, “Agreements with Executives”, “Change in Control Payments”, and "CEO Pay Ratio" and in Section II. Corporate Governance under the caption “Director Compensation”, and is incorporated herein by reference.
|
| |
| ITEM 12. | SECURITY OWNERSHIP OF CERTAIN BENEFICIAL OWNERS AND MANAGEMENT AND RELATED STOCKHOLDER MATTERS |
The information required by this Item is in Briggs & Stratton’s definitive Proxy Statement, prepared for the 2019 Annual Meeting of Shareholders, in Section IV. Other Matters under the captions “Security Ownership of Certain Beneficial Owners”, “Security Ownership of Directors and Executive Officers” and “Equity Compensation Plan Information”, and is incorporated herein by reference.
|
| |
| ITEM 13. | CERTAIN RELATIONSHIPS AND RELATED TRANSACTIONS, AND DIRECTOR INDEPENDENCE |
The information required by this Item is in Briggs & Stratton’s definitive Proxy Statement, prepared for the 2019 Annual Meeting of Shareholders, in Section II. Corporate Governance under the captions “Other
Corporate Governance Matters - Director Independence”, “Other Corporate Governance Matters - Board Oversight of Risk” and “Other Corporate Governance Matters - Board Committees - Audit Committee”, and is incorporated herein by reference.
|
| |
| ITEM 14. | PRINCIPAL ACCOUNTANT FEES AND SERVICES |
The information required by this Item is in Briggs & Stratton’s definitive Proxy Statement, prepared for the 2019 Annual Meeting of Shareholders, in Section IV. Other Matters under the caption “Independent Auditors’ Fees” and in Section II. Corporate Governance under the caption “Other Corporate Governance Matters - Board Committees - Audit Committee”, and is incorporated herein by reference.
PART IV
|
| |
| ITEM 15. | EXHIBITS AND FINANCIAL STATEMENT SCHEDULES |
(a) The following documents are filed as part of this report:
The following financial statements are included under the caption “Financial Statements and Supplementary Data" in Part II, Item 8 and are incorporated herein by reference:
Consolidated Balance Sheets, June 30, 2019 and July 1, 2018
For the Fiscal Years Ended June 30, 2019, July 1, 2018 and July 2, 2017:
Consolidated Statements of Operations
Consolidated Statements of Comprehensive Income (Loss)
Consolidated Statements of Shareholders’ Investment
Consolidated Statements of Cash Flows
Notes to Consolidated Financial Statements
Reports of Independent Registered Public Accounting Firm
|
| |
| 2. | Financial Statement Schedules |
Schedule II – Valuation and Qualifying Accounts
All other financial statement schedules provided for in the applicable accounting regulations of the Securities and Exchange Commission are not required under the related instructions.
BRIGGS & STRATTON CORPORATION AND SUBSIDIARIES
SCHEDULE II – VALUATION AND QUALIFYING ACCOUNTS
FOR FISCAL YEARS ENDED JUNE 30, 2019, JULY 1, 2018 AND JULY 2, 2017
|
| | | | | | | | |
Reserve for Doubtful Accounts Receivable | | Balance Beginning of Year | | Additions Charged to Earnings | | Charges to Reserve, Net | | Balance End of Year |
| 2019 | | $2,608,000 | | $5,155,000 | | $(720,000) | | $7,043,000 |
| 2018 | | 2,645,000 | | 800,000 | | (837,000) | | 2,608,000 |
| 2017 | | 2,806,000 | | 509,000 | | (670,000) | | 2,645,000 |
Deferred Tax Assets Valuation Allowance | | Balance Beginning of Year | | Allowance Established for Net Operating and Other Loss Carryforwards | | Allowance Reversed for Loss Carryforwards Utilized and Other Adjustments | | Balance End of Year |
| 2019 | | $28,537,000 | | $6,495,000 | | $239,000 | | $35,271,000 |
| 2018 | | 23,461,000 | | 5,678,000 | | (602,000) | | 28,537,000 |
| 2017 | | 19,371,000 | | 4,450,000 | | (360,000) | | 23,461,000 |
Each management contract or compensatory plan or arrangement required to be filed as an exhibit to this report is identified in the Exhibit Index by an asterisk following the Exhibit Number.
BRIGGS & STRATTON CORPORATION
(Commission File No. 1-1370)
EXHIBIT INDEX
2019 ANNUAL REPORT ON FORM 10-K
|
| | |
| No. | | Document Description |
| 3.1 | | |
| | | (Filed as Exhibit 3.2 to the Company’s Report on Form 10-Q for the quarter ended October 2, 1994 and incorporated by reference herein.) |
| | |
| 3.1(a) | | |
| | | (Filed as Exhibit 3.1 to the Company’s Report on Form 10-Q for the quarter ended September 26, 2004 and incorporated by reference herein.) |
| | |
| 3.2 | | |
| | | (Filed as Exhibit 3.2 to the Company’s Report on Form 10-K for fiscal year ended July 3, 2016 and incorporated by reference herein.) |
| | |
| 4.1 | | |
| | | (Filed as Exhibit 4.1 to the Company’s Report on Form 8-K/A, dated December 15, 2010 and incorporated by reference herein.) |
| | |
| 4.2 | | |
| | | (Filed as Exhibit 4.2 to the Company’s Report on Form 8-K/A, dated December 15, 2010 and incorporated by reference herein.) |
| | | |
| 4.3 | | |
| | | (Filed herewith) |
| | |
| 10.1* | | |
| | | (Filed as Exhibit 10.2 to the Company’s Report on Form 10-Q for the quarter ended April 1, 2012 and incorporated by reference herein.) |
| | | |
| 10.1(a)* | | |
| | | (Filed as Exhibit 10.2 to the Company's Report on Form 8-K dated December 14, 2012 and incorporated by reference herein.) |
| | | |
| 10.1(b)* | | |
| | | (Filed as Exhibit 10.1 to the Company’s Report on Form 10-Q for the quarter ended March 31, 2019 and incorporated by reference herein.) |
| | |
| 10.2* | | |
| | | (Filed herewith) |
| | |
| 10.3* | | |
| | | (Filed as Exhibit 10.2 to the Company’s Report on Form 8-K dated December 8, 2008 and incorporated by reference herein.) |
| | | |
| 10.3(a)* | | |
|
| | |
| | | (Filed as Exhibit 10.3 to the Company’s Report on Form 10-K for fiscal year ended June 28, 2009 and incorporated by reference herein.) |
| | |
| 10.3(b)* | | |
| | | (Filed as Exhibit 10.1 to the Company’s Report on Form 8-K dated October 14, 2009 and incorporated by reference herein.) |
| | | |
| 10.4* | | |
| | | (Filed as Exhibit 10.5(a) to the Company’s Report on Form 10-K for fiscal year ended July 2, 1995 and incorporated by reference herein.) |
| | | |
| 10.4(a)* | | |
| | | (Filed as Exhibit 10.5(b) to the Company’s Report on Form 10-K for fiscal year ended July 2, 1995 and incorporated by reference herein.) |
| | |
| 10.4(b)* | | |
| | | (Filed as Exhibit 10.4(b) to the Company’s Report on Form 10-K for fiscal year ended July 3, 2011 and incorporated by reference herein.) |
| | |
| 10.5* | | |
| | | (Filed as Exhibit B to the Company’s 2014 Annual Meeting Proxy Statement and incorporated by reference herein.) |
| | |
| 10.5(a)* | | |
| | | (Filed as Exhibit 10.5(a) to the Company’s Report on Form 10-K for fiscal year ended July 3, 2016 and incorporated by reference herein.) |
| | | |
| 10.5(a)(1)* | | |
| | | (Filed Exhibit 10.5(a)(1) to the Company’s Report on Form 10-K for fiscal year ended July 2, 2017 and incorporated by reference herein.) |
| | | |
| 10.5(b)* | | |
| | | (Filed as Exhibit 10.3 to the Company’s Report on Form 10-Q for the quarter ended September 28, 2014 and incorporated by reference herein.) |
| | |
| 10.5(c)* | | |
| | | (Filed as Exhibit 10.4 to the Company’s Report on Form 10-Q for the quarter ended September 28, 2014 and incorporated by reference herein.) |
| | |
| 10.5(d)* | | |
| | | (Filed as Exhibit 10.2 to the Company’s Report on Form 10-Q for the quarter ended September 28, 2014 and incorporated by reference herein.) |
| | | |
| 10.5(e)* | | |
| | | (Filed as Exhibit 10.5(e) to the Company’s Report on Form 10-K for the fiscal year ended July 1, 2018 and incorporated by reference herein.) |
| | | |
| 10.5(f)* | | |
| | | (Filed as Exhibit 10.5(f) to the Company’s Report on Form 10-K for fiscal year ended July 3, 2016 and incorporated by reference herein.) |
| | | |
| 10.5(g)* | | |
|
| | |
| | | (Filed as Exhibit 10.5(g) to the Company’s Report on Form 10-K for fiscal year ended July 3, 2016 and incorporated by reference herein.) |
| | | |
| 10.5(h)* | | |
| | | (Filed as Exhibit 10.5(h) to the Company’s Report on Form 10-K for fiscal year ended July 3, 2016 and incorporated by reference herein.) |
| | | |
| 10.5(i)* | | |
| | | (Filed as Exhibit 10.5(i) to the Company’s Report on Form 10-K for fiscal year ended July 3, 2016 and incorporated by reference herein.) |
| | | |
| 10.5(j)* | | |
| | | (Filed as Exhibit 10.5(j) to the Company’s Report on Form 10-K for fiscal year ended July 3, 2016 and incorporated by reference herein.) |
| | | |
| 10.7* | | |
| | | (Filed as Exhibit 10.1 to the Company’s Report on Form 8-K dated December 8, 2008, and incorporated by reference herein.) |
| | | |
| 10.7(a)* | | |
| | | (Filed as Exhibit 10.1 to the Company’s Report on Form 10-Q dated November 6, 2018, and incorporated by reference herein.) |
| | |
| 10.8* | | |
| | | (Filed as Exhibit 10.1 to the Company’s Report on Form 10-Q for the quarter ended January 1, 2017 and incorporated by reference herein.) |
| | |
| 10.9* | | |
| | | (Filed as Exhibit 10.9 to the Company’s Report on Form 10-K for fiscal year ended July 3, 2016 and incorporated by reference herein.) |
| | | |
| 10.10* | | |
| | | (Filed as Exhibit 10.10 to the Company’s Report on Form 10-K for the fiscal year ended July 1, 2018 and incorporated by reference herein.)
|
| | |
| 10.11* | | |
| | | (Filed as Exhibit 10.17 to the Company’s Report on Form 10-K for fiscal year ended June 27, 1999 and incorporated by reference herein.) |
| | |
| 10.11(a)* | | |
| | | (Filed as Exhibit 10.14(a) to the Company’s Report on Form 10-K for fiscal year ended June 29, 2003 and incorporated by reference herein.) |
| | |
| 10.11(b)* | | |
| | | (Filed as Exhibit 10.14(b) to the Company’s Report on Form 10-K for fiscal year ended June 27, 2004 and incorporated by reference herein.) |
| | |
| 10.12* | | |
| | | (Filed as Exhibit 10.15 to the Company’s Report on Form 10-K for fiscal year ended June 30, 2013 and incorporated by reference herein.) |
| | | |
| 10.13* | | |
| | | (Filed as Exhibit 10.19 to the Company’s Report on Form 10-K for fiscal year ended June 27, 1999 and incorporated by reference herein.) |
| | |
| 10.14* | | |
| | | (Filed as Exhibit 10.18 to the Company’s Report on Form 10-K for fiscal year ended June 30, 2002 and incorporated by reference herein.) |
|
| | |
| | |
| 10.14(a)* | | |
| | | (Filed as Exhibit 10.17(a) to the Company’s Report on Form 10-K for fiscal year ended June 27, 2010 and incorporated by reference herein.) |
| | |
| 10.15 | | |
| | | (Filed as Exhibit 10.1 to the Company’s Report on Form 8-K dated February 24, 2010 and incorporated by reference herein.) |
| | | |
| 10.16* | |
|
| | | (Filed as Exhibit 10.10 to the Company’s Report on Form 8-K, dated October 25, 2017 and incorporated by reference herein.) |
| | | |
| 10.17 | | Amended and Restated Multicurrency Credit Agreement, dated as of March 25, 2016, among Briggs & Stratton Corporation, Briggs & Stratton AG, the other subsidiary borrowers from time to time party thereto, the lenders from time to time party thereto, JPMorgan Chase Bank, N.A., as administrative agent, U.S. Bank National Association, as syndication agent and BMO Harris Bank, N.A., Bank of America, N.A., Wells Fargo Bank, National Association and PNC Bank, National Association, as documentation agents. |
| | | (Filed as Exhibit 10.1 to the Company’s Report on Form 10-Q for the quarter ended March 27, 2016 and incorporated by reference herein.) |
| | | |
| 10.17(a) | | |
| | | (Filed as Exhibit 10.17(a) to the Company’s Report on Form 8-K dated August 13, 2019 and incorporated by reference herein.) |
| | | |
| 10.18* | | |
| | | (Filed as Exhibit B to the Company’s 2017 Annual Meeting Proxy Statement and incorporated by reference herein.) |
| | | |
| 10.19* | | |
| | | (Filed as Exhibit 10.2 to the Company’s Report on Form 8-K, dated October 25, 2017 and incorporated by reference herein.) |
| | | |
| 10.20* | | |
| | | (Filed as Exhibit 10.3 to the Company’s Report on Form 8-K, dated October 25, 2017 and incorporated by reference herein.) |
| | | |
| 10.21(a)* | | |
| | | (Filed as Exhibit 10.2 to the Company’s Report on Form 10-Q, for the quarter ended September 30, 2018 and incorporated by reference herein.) |
| | | |
| 10.21* | | |
| | | (Filed as Exhibit 10.4 to the Company’s Report on Form 8-K, dated October 25, 2017 and incorporated by reference herein.) |
| | | |
| 10.22* | | |
| | | (Filed as Exhibit 10.5 to the Company’s Report on Form 8-K, dated October 25, 2017 and incorporated by reference herein.) |
| | | |
| 10.23* | | |
| | | (Filed as Exhibit 10.6 to the Company’s Report on Form 8-K, dated October 25, 2017 and incorporated by reference herein.) |
| | | |
| 10.24* | | |
|
| | |
| | | (Filed as Exhibit 10.7 to the Company’s Report on Form 8-K, dated October 25, 2017 and incorporated by reference herein.) |
| | | |
| 10.25* | | |
| | | (Filed as Exhibit 10.8 to the Company’s Report on Form 8-K, dated October 25, 2017 and incorporated by reference herein.) |
| | | |
| 10.25(a)* | | |
| | | (Filed as Exhibit 10.3 to the Company’s Report on Form 10-Q for the quarter ended September 30, 2018 and incorporated by reference herein.) |
| | | |
| 10.26* | | |
| | | (Filed as Exhibit 10.9 to the Company’s Report on Form 8-K, dated October 25, 2017 and incorporated by reference herein.) |
| | | |
| 10.27* | | |
| | | (Filed as Exhibit 10.1 to the Company’s Current Report on Form 8-K dated September 6, 2013 and incorporated herein by reference.) |
| | | |
| 10.27(a)* | | |
| | | (Filed as Exhibit 10.16(a) to the Company’s Report on Form 10-K for fiscal year ended June 28, 2015 and incorporated herein by reference) |
| | | |
| 10.27(b)* | | |
| | | (Filed as Exhibit 10.3 to the Company’s Report on Form 10-Q for the quarter ended March 27, 2016 and incorporated herein by reference.) |
| | | |
| 10.27(c)* | | |
| | | (Filed as Exhibit 10.16(c) to the Company’s Report on Form 10-K for fiscal year ended July 3, 2016 and incorporated by reference herein.) |
| | | |
| 12 | | |
| | | (Filed herewith.) |
| | | |
| 21 | | |
| | | (Filed herewith.) |
| | |
| 23.1 | | |
| | | (Filed herewith.) |
| | | |
| 31.1 | | |
| | | (Filed herewith.) |
| | |
| 31.2 | | |
| | | (Filed herewith.) |
| | |
| 32.1 | | |
| | | (Furnished herewith.) |
| | |
| 32.2 | | |
| | | (Furnished herewith.) |
| | | |
|
| | |
| 101 | | The following financial information from the Company’s Annual Report on Form 10-K for the fiscal year ended July 1, 2018, formatted in eXtensible Business Reporting Language (XBRL): (i) Consolidated Balance Sheets at June 30, 2019 and July 1, 2018; (ii) Consolidated Statements of Operations for the Fiscal Years Ended June 30, 2019, July 1, 2018, and July 2, 2017; (iii) the Consolidated Condensed Statements of Comprehensive Income (Loss) for the Fiscal Years Ended June 30, 2019, July 1, 2018, and July 2, 2017; (iv) Consolidated Statements of Shareholders’ Investment for the Fiscal Years Ended June 30, 2019, July 1, 2018, and July 2, 2017; (v) Consolidated Statements of Cash Flows for the Fiscal Years Ended June 30, 2019, July 1, 2018, and July 2, 2017; (vi) Notes to Consolidated Financial Statements; and (vii) Schedule II-Valuation and Qualifying Accounts. |
| | | |
| * | | Management contracts and executive compensation plans and arrangements required to be filed as exhibits pursuant to Item 15(a)(3) of Form 10-K. |
|
| |
| ITEM 16. | FORM 10-K SUMMARY |
None.
SIGNATURES
Pursuant to the requirements of Section 13 or 15(d) of the Securities Exchange Act of 1934, the registrant has duly caused this report to be signed on its behalf by the undersigned, thereunto duly authorized.
|
| | | | |
| | | | | |
| | | BRIGGS & STRATTON CORPORATION |
| | | |
| | | By | | /s/ Mark A. Schwertfeger |
| | | | | Mark A. Schwertfeger |
| August 27, 2019 | | | | Senior Vice President and |
| | | | | Chief Financial Officer |
Pursuant to the requirements of the Securities Exchange Act of 1934, this report has been signed below by the following persons on behalf of the registrant and in the capacities and on the dates indicated.*
|
| | | | |
| | | | | |
| /s/ Todd J. Teske | | | | /s/ Patricia L. Kampling |
| Todd J. Teske | | | | Patricia L. Kampling |
| Chairman, President and Chief Executive | | | | Director |
| Officer and Director (Principal Executive Officer) | | | | |
| | | |
| /s/ Mark A. Schwertfeger | | | | /s/ Keith R. McLoughlin |
| Mark A. Schwertfeger | | | | Keith R. McLoughlin |
| Senior Vice President and Chief Financial | | | | Director |
| Officer (Principal Financial Officer and | | | | |
| Principal Accounting Officer) | | | | |
| | | |
| /s/ Brian C. Walker | | | | /s/ Frank M. Jaehnert |
| Brian C. Walker | | | | Frank M. Jaehnert |
| Director | | | | Director |
| | | |
| /s/ Henrik C. Slipsager | | | | /s/ Charles I. Story |
| Henrik C. Slipsager | | | | Charles I. Story |
| Director | | | | Director |
| | | |
| /s/ Sara A. Greenstein | | | | /s/ Jeffrey R. Hennion |
| Sara A. Greenstein | | | | Jeffrey R. Hennion |
| Director | | | | Director |
| | | | | |
| | | | | *Each signature affixed as of |
| | | | | August 27, 2019 |
| | | | | |
| | | | | |
| | | | | |
|
| | |
SARA A. GREENSTEIN (4)(5) | | Senior Vice President - Consumer Solutions at United States Steel Corporation, an integrated steel producer |
| | | |
JEFFREY R. HENNION (1)(2) | | Co-Founder and Managing Partner of Woodside Ventures, Inc., a technology company focused on e-commerce and digital marketing
|
| | | |
FRANK M. JAEHNERT (1)(5) | | Retired President and Chief Executive Officer of Brady Corporation, a provider of identification solutions |
| | | |
PATRICIA L. KAMPLING (1)(2)(3) | | Retired Chairman and Chief Executive Officer of Alliant Energy Corporation, a regulated investor-owned public utility holding company
|
| | | |
KEITH R. McLOUGHLIN (4)(5) | | Retired President and Chief Executive Officer of AB Electrolux, a manufacturer of home appliances, and former Interim Chief Executive Officer of Campbell Soup Company, a global food company
|
| | |
HENRIK C. SLIPSAGER (1)(3)(5) | | Retired President and Chief Executive Officer of ABM Industries, Inc., a provider of integrated facility solutions |
| | |
CHARLES I. STORY (2)(3)(4) | | President of ECS Group, Inc., an executive development company |
| | |
TODD J. TESKE (3) | | Chairman, President and Chief Executive Officer of Briggs & Stratton Corporation |
| | |
BRIAN C. WALKER (2)(3)(4) | | Partner, Strategic Leadership of Huron Capital, a middle market investment firm, and retired President and Chief Executive Officer, Herman Miller, Inc., a global provider of office furniture and services
|
Committees: (1) Audit, (2) Compensation, (3) Executive, (4) Finance, (5) Nominating and Governance.
Elected Officers
|
| | |
| TODD J. TESKE | | Chairman, President & Chief Executive Officer |
| | |
| HAROLD L. REDMAN | | Senior Vice President & President – Turf & Consumer Products |
| | |
| WILLIAM H. REITMAN | | Senior Vice President & President – Support |
| | |
| DAVID J. RODGERS | | Senior Vice President & President – Engines & Power |
| | | |
| MARK A. SCHWERTFEGER | | Senior Vice President & Chief Financial Officer |
| | |
| KATHRYN M. BUONO | | Vice President, General Counsel & Corporate Secretary |
| | | |
| RANDALL R. CARPENTER | | Vice President Corporate Marketing |
| | |
| ANDREA L. GOLVACH | | Vice President & Treasurer |
| | | |
| RACHELE M. LEHR | | Vice President Human Resources |
| | | |
| JEFFREY M. ZEILER | | Vice President Product Innovation |
Note: For additional discussion related to elected officers and their titles, see Executive Officers of the Registrant section.
|
| | |
| Appointed Vice Presidents & Subsidiary/Group Officers | |
| | | |
|
| | |
| Corporate | | |
| | |
| JOHN R. GUY III | | Vice President Support Operations |
| | | |
| TODD H. MACKAY | | Vice President Chief Information Officer |
| | | |
| BRIAN R. OLSSON | | Vice President Business Transformation |
| | | |
| TIMOTHY G. WILD | | Vice President Supply Chain |
| | |
| Engines Group | | |
| | | |
| JEREMY L. ALBY | | Vice President Engineering – Engines & Power |
| | | |
| RANDALL E. BALLARD | | Vice President Sales – Consumer and Commercial Turf Engines & Power |
| | |
| ERIC T. CHACK | | Vice President Operations – Engines & Power |
| | | |
| JEFFREY W. COAD | | Vice President Marketing & Product Management - Engines & Power |
| | | |
| DAVID A. FRANK | | Vice President Sales – Commercial Engines & Power |
|
| | |
| Products Group | | |
| | |
| THOMAS M. BURKARD | | Vice President Product Management - Commercial Turf & Lawn Care |
| | | |
| DONALD W. KLENK | | Vice President Operations – Turf & Consumer Products |
| | |
| ROBERT D. PJEVACH | | Vice President Product Management – Turf & Consumer Products |
| | | |
| THOMAS H. RUGG | | Vice President & President – Job Site and Standby |
| | | |
| JEREMY D. SANDERS | | Vice President Sales - Turf & Consumer Products |
SHAREHOLDER COMMUNICATIONS
Information is provided to shareholders on a regular basis to keep them informed of Briggs & Stratton’s activities and financial status. This information is available to any person interested in Briggs & Stratton. Address requests to Shareholder Relations at the Mailing Address listed for the Corporate Offices. A Shareholder Relations Hotline provides a no cost opportunity for shareholders to contact Briggs & Stratton other than for routine product inquiries. The Hotline number is 1-800-365-2759. For routine product inquiries, please contact Briggs & Stratton Customer Support at 1-800-743-4115.
Briggs & Stratton has an ongoing commitment to provide investors with real time access to financial disclosures, the latest corporate and financial news, and other shareholder information. Visit Briggs & Stratton’s home page on the internet at www.basco.com. Information includes: corporate press releases, web casts of conference calls, dividend information, stock prices, filings with the Securities and Exchange Commission, including Form 10-K Reports, Form 10-Q Reports, Proxy Statements and Section 16 filings, code of ethics for principal executive, financial and accounting officers, and additional financial information.
INVESTOR, BROKER, SECURITY ANALYST CONTACT
Stockbrokers, financial analysts and others desiring technical/financial information about Briggs & Stratton should contact Mark A. Schwertfeger, Senior Vice President and Chief Financial Officer, at 414-259-5333.
DIVIDEND REINVESTMENT PLAN
The Dividend Reinvestment Plan is a convenient way for shareholders of record to increase their investment in Briggs & Stratton. It enables shareholders to apply quarterly dividends and any cash deposits toward the purchase of additional shares of Briggs & Stratton stock. There is no brokerage fee or administrative charge for this service. For a brochure describing the plan, please call the Shareholder Relations Hotline.
PUBLIC INFORMATION
Persons desiring general information about Briggs & Stratton should contact Rick Carpenter, Vice President Corporate Marketing, at 414-259-5916.
General Information
|
| | |
EXCHANGE LISTING Briggs & Stratton Corporation common stock is listed on the New York Stock Exchange (symbol:BGG). | | AUDITORS Deloitte & Touche LLP 555 E. Wells St. Suite 1400 Milwaukee, Wisconsin 53202 |
| | | |
TRANSFER AGENT, REGISTRAR AND DIVIDEND DISBURSER EQ Shareowner Services 1110 Centre Pointe Curve, Suite 101 Mendota Heights, MN 55120 | | CORPORATE OFFICES 12301 West Wirth Street Wauwatosa, Wisconsin 53222 Telephone 414-259-5333 |
| | |
Inquiries concerning transfer requirements, lost certificates, dividend payments, changes of address and account status should be directed to EQ Shareowner Services at 1-800-468-9716.
| | MAILING ADDRESS Briggs & Stratton Corporation Post Office Box 702 Milwaukee, Wisconsin 53201 |