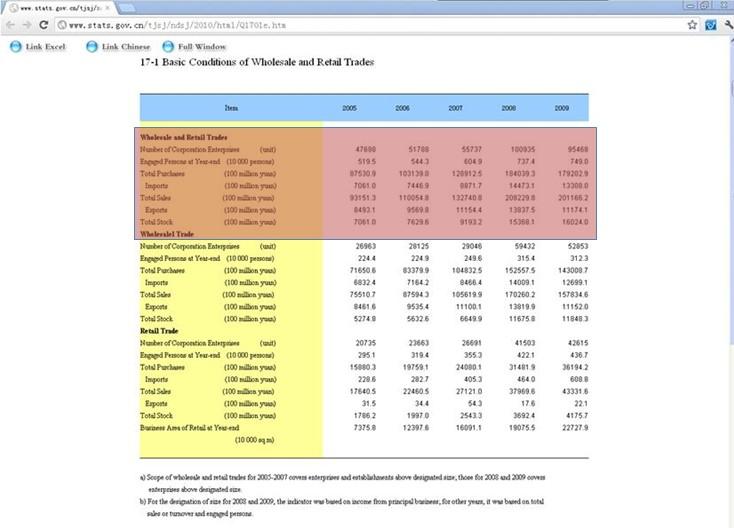
1.Overview of the PRC wholesale and Retail Industry
Table:China - Page 11
| Wholesale and Retail Industry in China |
| | 2005 | 2006 | 2007 | 2008 | 2009 |
| Indicators | USD | USD | USD | USD | USD |
| Number of Legal Entities | 47698 | 51788 | 55737 | 100935 | 95468 |
| People working in this industry (in million) | 5.2 | 5.4 | 6.0 | 7.4 | 7.5 |
| Merchandise Purchase volume (in billion) | 1367.7 | 1611.5 | 2014.3 | 2875.6 | 2800.0 |
| Import volume (in billion) | 110.3 | 116.4 | 138.6 | 226.1 | 207.9 |
| Merchandise Sales volume (in billion) | 1455.5 | 1719.6 | 2074.1 | 3253.6 | 3143.2 |
| Export volume (in billion) | 132.7 | 149.5 | 174.3 | 216.2 | 174.6 |
| Merchandise inventory level (in billion) | 110.3 | 119.2 | 143.6 | 240.1 | 250.4 |
Reference:
*exchange rate: USD 1 : RMB 6.4
Link: http://www.stats.gov.cn/tjsj/ndsj/2010/html/Q1701e.htm
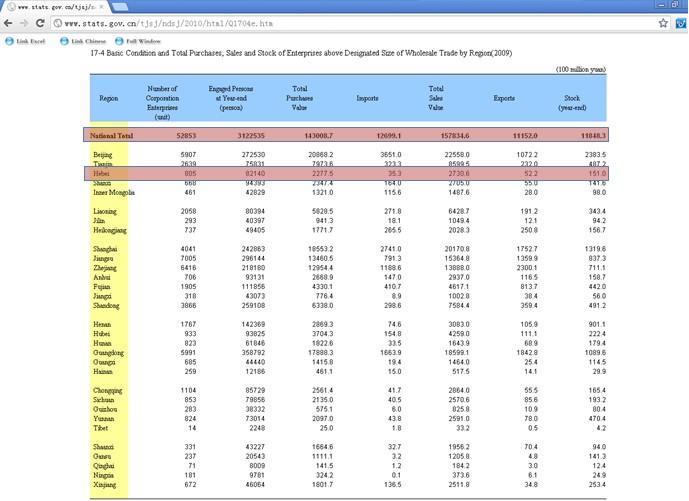
2.Table:Hebei Province (Column 1 & Column 3) - Page 11&page12
| 2009 Breakdown of the Wholesale and Retail Industry in Hebei Province and China |
| | 2009 | | 2009 | | |
| | Wholesale | | Wholesale | | |
| | Hebei | | China | | |
| Indicators | USD | | USD | | |
| Number of Legal Entities | 805 | | 52853 | | |
| People working in this industry (in million) | 0.08 | | 3.1 | | |
| Merchandise Purchase volume (in billion) | 35.59 | | 2234.5 | | |
| Import volume (in billion) | 0.55 | | 198.4 | | |
| Merchandise Sales volume (in billion) | 42.67 | | 2466.2 | | |
| Export volume (in billion) | 0.82 | | 174.3 | | |
| Merchandise inventory level (in billion) | 2.36 | | 185.1 | | |
Reference:
*exchange rate: USD 1 : RMB 6.4
Link:http://www.stats.gov.cn/tjsj/ndsj/2010/html/Q1704e.htm
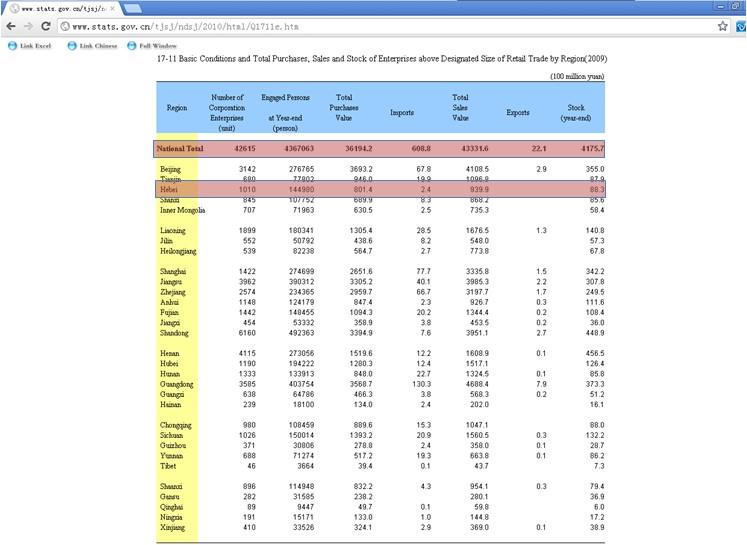
2.2Table:Hebei Province (Column 2 & Column 4) - Page 11&page12
| 2009 Breakdown of the Wholesale and Retail Industry in Hebei Province and China |
| | | 2009 | | 2009 | |
| | | Retail | | Retail | |
| | | Hebei | | China | |
| Indicators | | USD | | USD | |
| Number of Legal Entities | | 1010 | | 42615 | |
| People working in this industry (in million) | | 0.14 | | 4.4 | |
| Merchandise Purchase volume (in billion) | | 12.52 | | 565.5 | |
| Import volume (in billion) | | 0.04 | | 9.5 | |
| Merchandise Sales volume (in billion) | | 14.69 | | 677.1 | |
| Export volume (in billion) | | 0.00 | | 0.3 | |
| Merchandise inventory level (in billion) | | 1.38 | | 65.2 | |
Reference:
*exchange rate: USD 1 : RMB 6.4
Link:http://www.stats.gov.cn/tjsj/ndsj/2010/html/Q1711e.htm
2.3 Table:Hebei Province (Column 5) - Page 11&page12
| 2009 Breakdown of the Wholesale and Retail Industry in Hebei Province and China |
| | | | | | 2009 |
| | | | | | Total |
| | | | | | China |
| Indicators | | | | | USD |
| Number of Legal Entities | | | | | 95468 |
| People working in this industry (in million) | | | | | 7.5 |
| Merchandise Purchase volume (in billion) | | | | | 2800.0 |
| Import volume (in billion) | | | | | 207.9 |
| Merchandise Sales volume (in billion) | | | | | 3143.2 |
| Export volume (in billion) | | | | | 174.6 |
| Merchandise inventory level (in billion) | | | | | 250.4 |
Reference:


*exchange rate: USD 1 : RMB 6.4
Link:http://www.stats.gov.cn/tjsj/ndsj/2010/html/Q1701e.htm
3. Target Market and Target Audiences Page 12
China
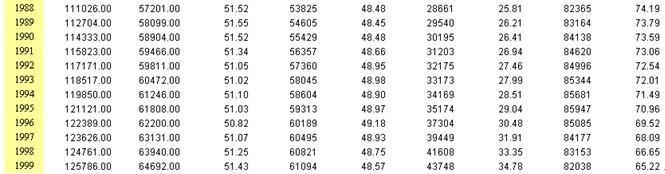
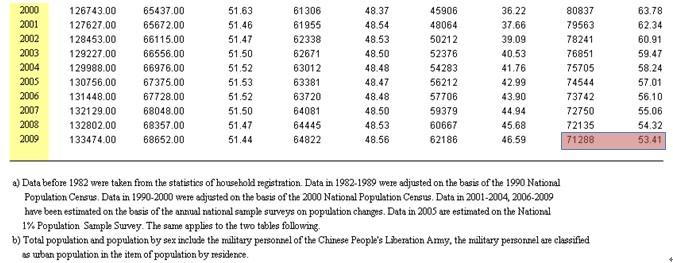
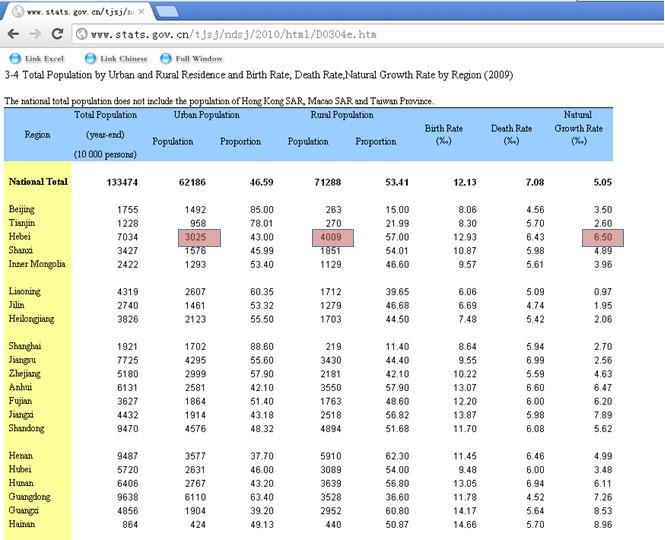
According to the National Bureau Statistics of China, there were712.8 million people (53.4% of total population) living in rural areas in China and the population increased at a natural birth rate of5.05% per year. The Government recently released a series of policies regarding the renovation of the rural market and the improvement of living standards for the rural population. We believe that the growth in China will be driven by the rural market in the future.
Reference a:
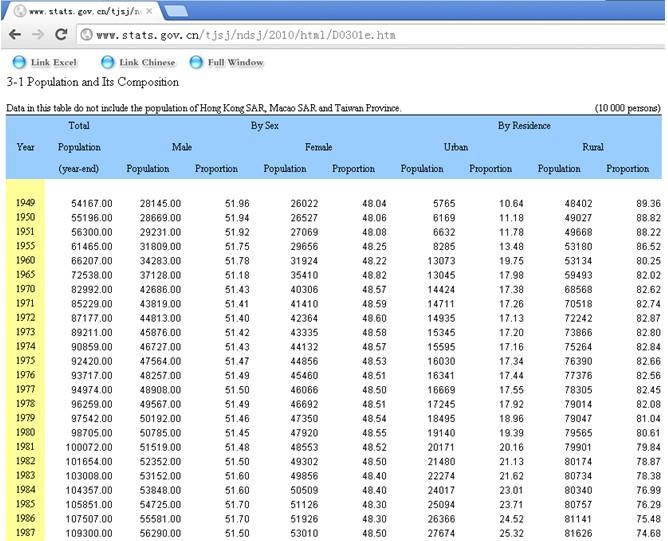
Link:http://www.stats.gov.cn/tjsj/ndsj/2010/html/D0301e.htm
Reference b:

Link:http://www.stats.gov.cn/tjsj/ndsj/2010/html/D0302e.htm
4. Page 12
Hebei Province
In the first stage, CAMGwill focus on developing our business in the Hebei Network. Hebei province is an agriculturally dominant provinceand an ideal location for developing the Chinese rural market. The following lists some key attributes ofHebei province:
l40.09 million rural population; total population of 70.34 million; ranked 6th in China.
lNatural birth rate is 6.5%.
Reference:

Link:http://www.stats.gov.cn/tjsj/ndsj/2010/html/D0304e.htm
Page 12
lGross GDP of RMB1,338.7billion; ranked 6th in China
Revised:
lGross GDP of RMB1,723.5billion; ranked 6th in China
Reference:

Link:http://www.stats.gov.cn/tjsj/ndsj/2010/html/C0214e.htm
Page 12
lGDP per capita of RMB 19,363; ranked 11th in China.
Page 12
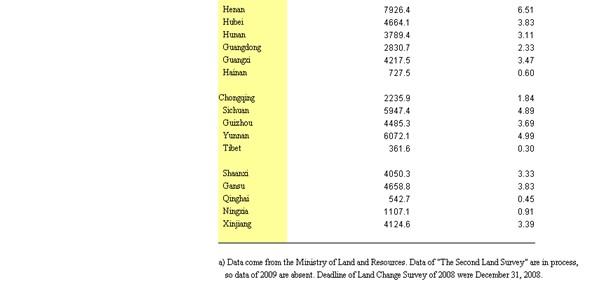
lGross production of grains in Hebei reached 29.012 billion kg which is 5.5% of the nation; ranked 7th in China
Reference:
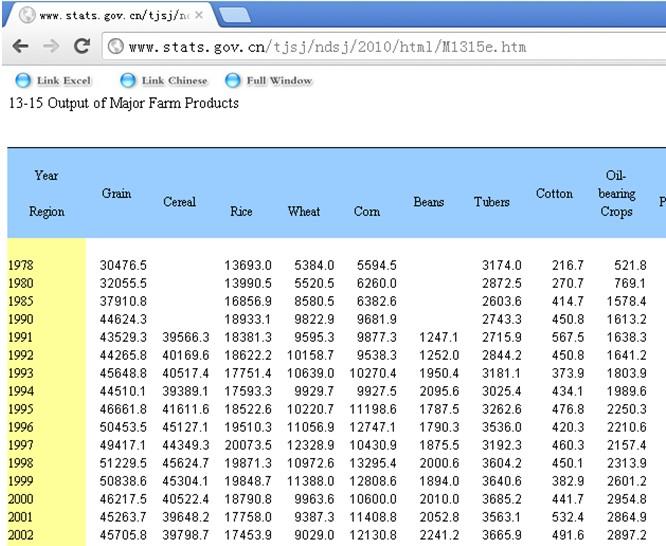

Link:http://www.stats.gov.cn/tjsj/ndsj/2010/html/M1315e.htm
Page 12
lOne of the 13 grain production provinces in China; Hebei uses area of9.237 millionmu(approx. 1.5 million acres) as farmland for grains.
Revised: 6,317 million
lOne of the 13 grain production provinces in China; Hebei uses area of6.317 millionhectares as farmland for grains.
Reference:


Link:http://www.stats.gov.cn/tjsj/ndsj/2010/html/M1303e.htm
5. Page 12
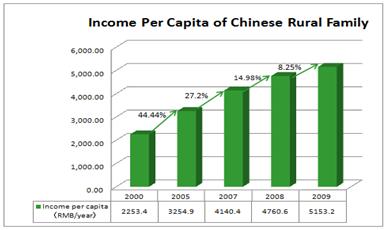
The income per capita of rural population increased from RMB 2,253 in 2000 to RMB 5,153.2 in 2009, and it is expected to keep increasing under a series of supportive governmental policies.
Reference:
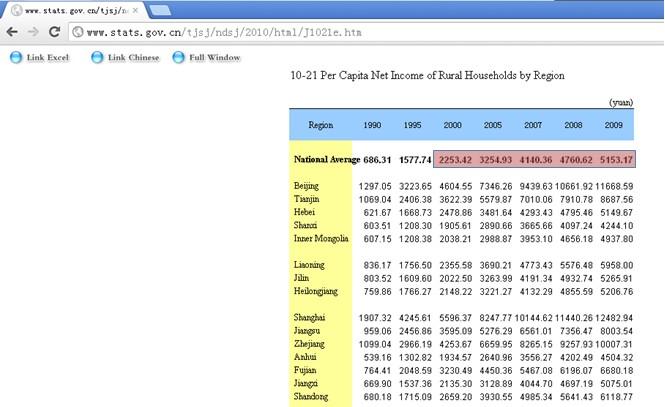

Link:http://www.stats.gov.cn/tjsj/ndsj/2010/html/J1021e.htm
6. Paragraph “Focus Media Holding Limited (‘Focus Media’)” (Page 13)
Reference:http://ir.focusmedia.cn/phoenix.zhtml?c=190067&p=irol-reportsAnnual
NASDAQ: FMCN
Focus Media Holding Limited (“Focus Media”):
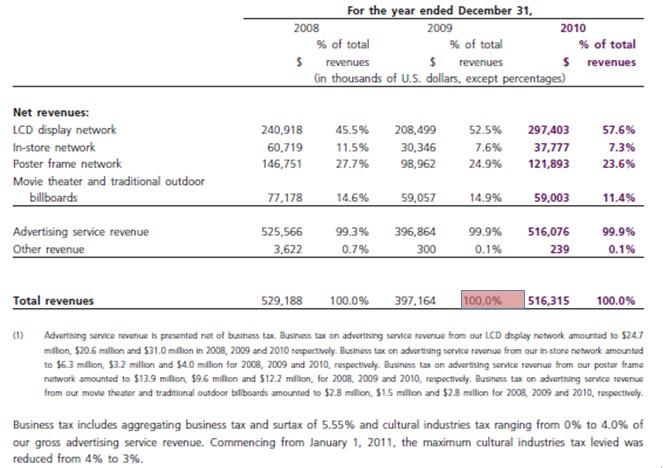
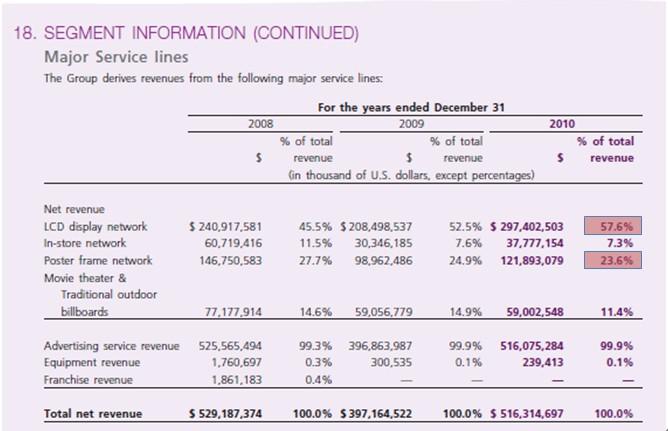
lIn 2010, Focus Media generated revenues mainly from 5 different types of advertising networks: LCD display network, poster frame network, in-store network, traditional outdoor billboard network, and movie theater network.
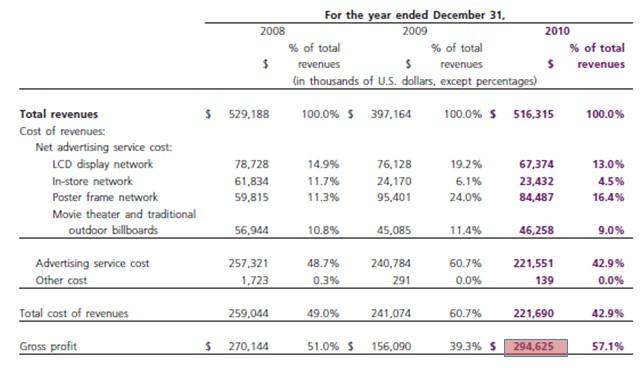
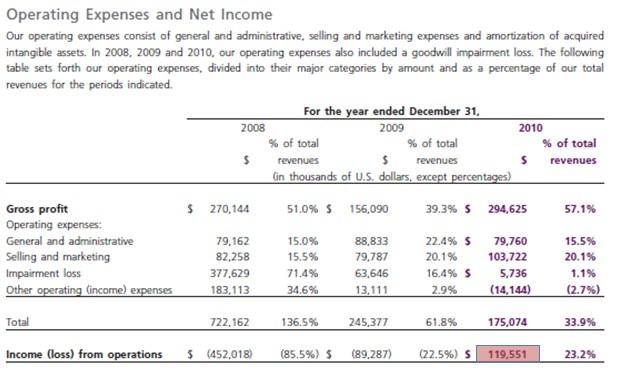
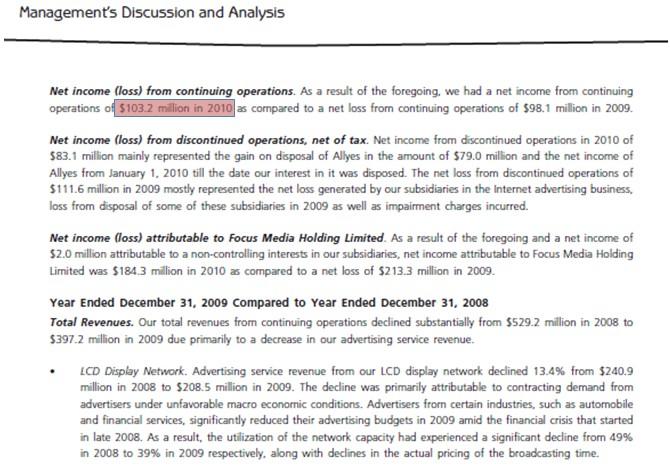
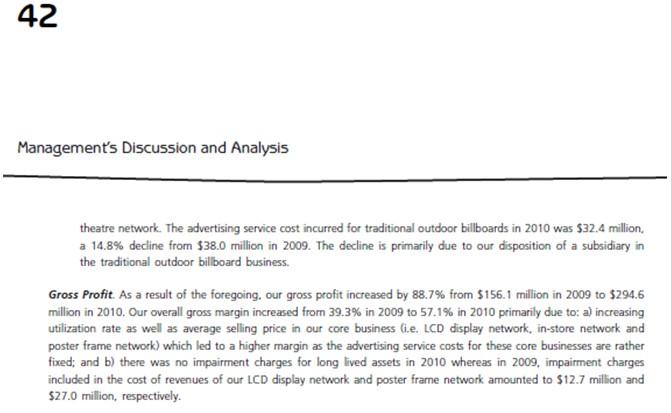
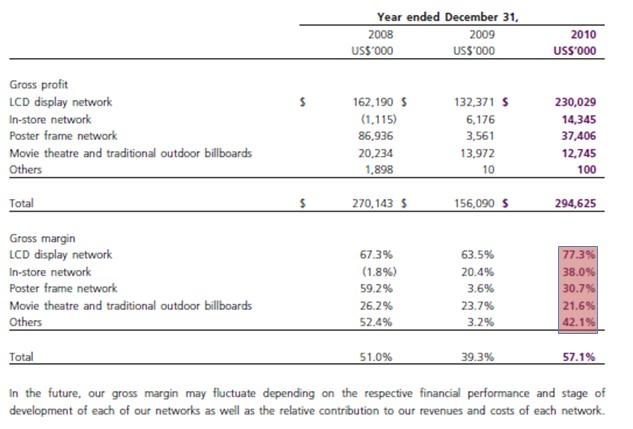
lIn 2010, Focus Media had revenue of $516 million, gross profit of $294 million (57%), operating income of $119 million (23%), and net income from continuing operations of $103 million (20%).
Reference:
l
Source: FMCN 2010 annual report (Page 12)

Source: FMCN 2010 annual report (Page 17)
Source: FMCN 2010 annual report (Page 19)

Source: FMCN 2010 annual report (Page 44)
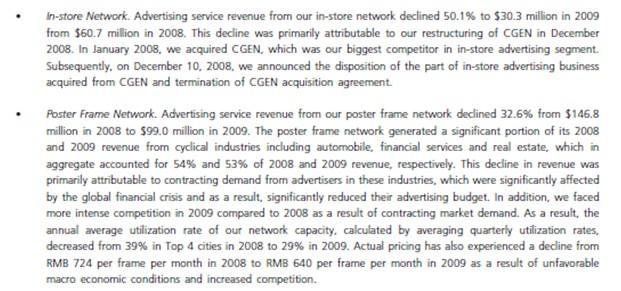
l More than 80% of total revenue is attributed to the LCD display network (57.6%) and poster frame network (23.6%) in 2010.
Reference:

Source: FMCN 2010 annual report (Page 100)
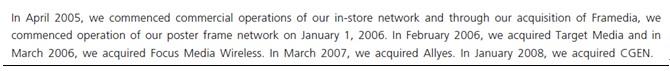
l In October 2005, Focus Media acquired Framedia, which operated the largest in-elevator poster frame advertising network in China and provides brand advertisers and community service providers a direct channel to target urban residential communities. As of March 31, 2011, the poster frame network had 378,000 in-elevator poster and digital picture frames in residential buildings that covered more than 30 cities all over China.
Reference:

Source: FMCN 2010 annual report (Page 3)
l In 2010, only the gross margin of LCD displays network was higher than 50%.
n LCD display network (77.3%)
n poster frame network (38.0%)
n in-store network (30.7%)
n traditional outdoor billboard network (21.6%)
n movie theater network. (42.1%)
Reference:
Source: FMCN 2010 annual report (Page 42)
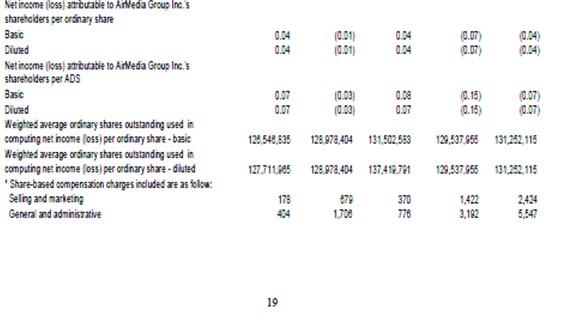
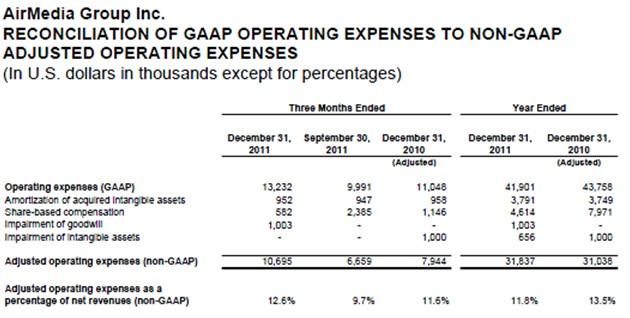
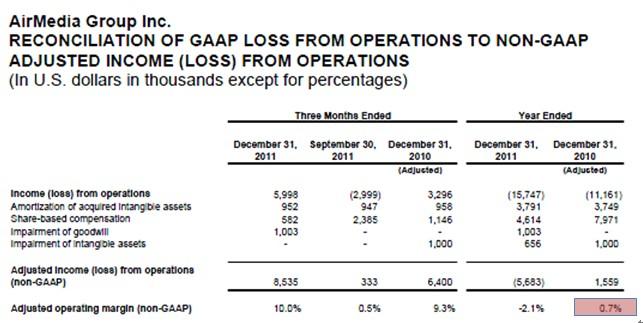
7. Paragraph “AirMedia Group Inc. (‘AirMedia’)” (Page 13)
Reference:http://ir.airmedia.net.cn/phoenix.zhtml?c=214947&p=irol-reportsOther
NASDAQ: AMCN
lAirMedia Group Inc. operates the largest digital media network in China dedicated to air travel advertising.
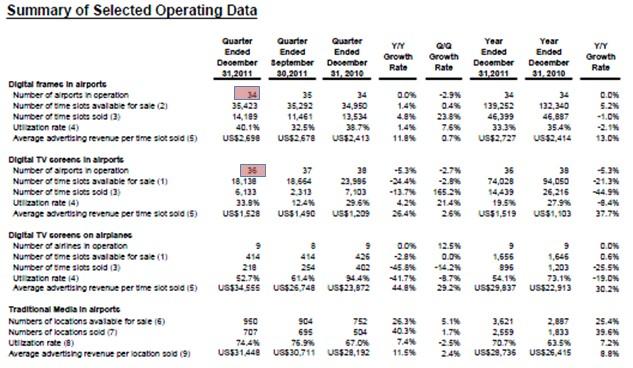
lAirMedia operates digital TV screens in37 major airports, including 25 out of 30largest airports in China. It also operates digital frames in32major airports, including the 15 largest airports in China.
Revised:
lAirMedia operates digital TV screens in36 major airports, including 25 out of 30largest airports in China. It also operates digital frames in34 major airports, including the 15 largest airports in China.
lAirMedia sells advertisements on the routes operated by eight airlines, including the three largest airlines in China.
lIn selected major airports, AirMedia also operates traditional media platforms, such as billboards and light boxes, and other digital media, such as mega LED screens.

Source:Fourth Quarter and Fiscal Year 2011 Unaudited Financial Results (page 14)
lIn 2010, AirMedia had a revenue of $254 million, a gross profit of $32.6 million (12.8%), an operating margin of-6.6%, and a net income of -$9.11 million (-3.58%)
Revised:
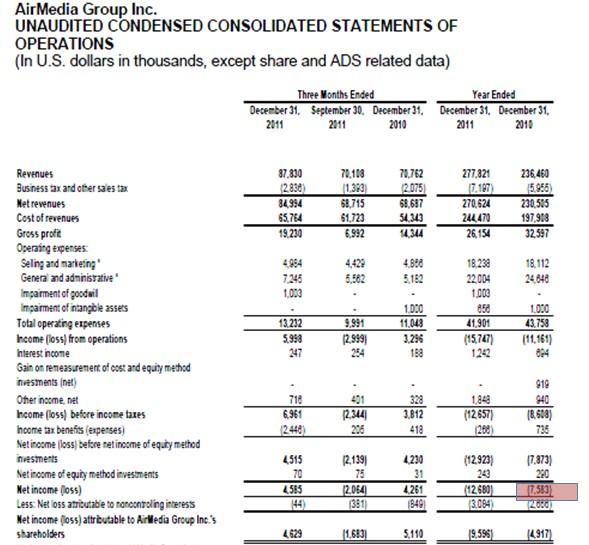
lIn 2010, AirMedia had a revenue of $236 million, a gross profit of $32.6 million (12.8%), an operating margin of0.7%, and a net income of -$7.58 million (-3.58%)
l
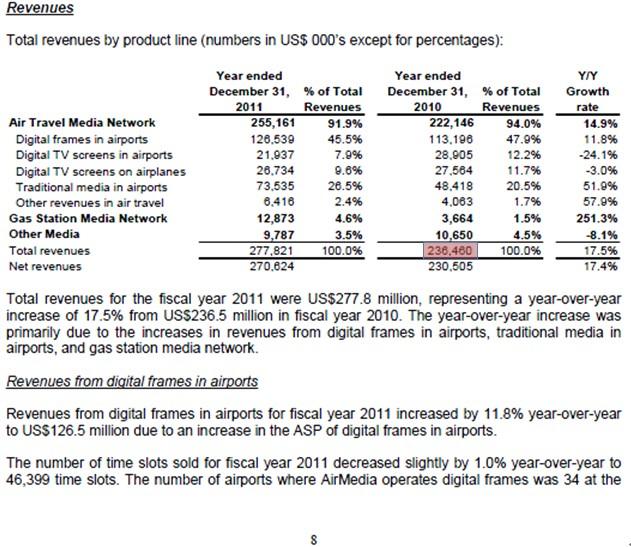
Source:Fourth Quarter and Fiscal Year 2011 Unaudited Financial Results (page 8)


Source:Fourth Quarter and Fiscal Year 2011 Unaudited Financial Results (page 10)
Source:Fourth Quarter and Fiscal Year 2011 Unaudited Financial Results (page 19)
Source:Fourth Quarter and Fiscal Year 2011 Unaudited Financial Results (page 21)
8. Paragraph “VisionChina Media, Inc.(‘VisionChina’)” (Page 13)
Reference: http://www.visionchina.cn/phoenix.zhtml?c=215970&p=irol-ReportsAnnual
NASDAQ:VISN
VisionChina Media, Inc.(“VisionChina”):
l VisionChina Media, Inc. using is digital mobile television broadcasts to deliver content and advertising to displays on mass transportation systems such as bus and subway networks.
l As of December 31, 2010, its network and supplemental subway advertising platform covered 23 cities in China and consisted of approximately137,395 digital displays.
Revised:
l As of December 31, 2010, its network and supplemental subway advertising platform covered 23 cities in China and consisted of approximately14,023 digital displays.
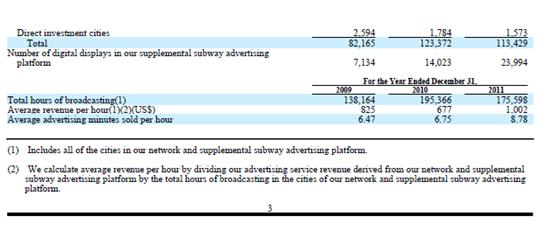
Source: VISIONCHINA MEDIA INC. (VISN) 20-F Annual and transition report of foreign private issuers pursuant tosections 13 or 15(d) (Page 3)
l VisionChina sells its advertising time through direct sales force and third party advertising agencies.
l VisionChina’s revenue increased by 14.3%, from $120 million in 2009 to $138 million in 2010. However the cost of revenue increased from $61.1 million in 2009 to $121 million in 2010.

Source: VISIONCHINA MEDIA INC. (VISN) 20-F Annual and transition report of foreign private issuers pursuant tosections 13 or 15(d) (Page 2)