Hahn Engineering, Inc.
Petroleum Consultants
P. O. Box 190251
St. Louis, MO 63119
(314) 968-3656
hahnengrinc@yahoo.com
February 15, 2016
Eos Petro, Inc.
Attn: Mr. Nikolas Konstant
1999 Avenue of the Stars, Ste. 2520
Los Angeles, CA 90067
Re: Works Unit Reserve Evaluation
Gentlemen:
At your request, Hahn Engineering, Inc. has prepared an estimate of the reserves, future production and income attributable to a certain working interest in the Works Unit owned and operated by Eos Petro, Inc. in the Albion Consolidated Field, Edwards County, Illinois, as of December 31, 2015. The purpose of this evaluation was to provide estimates of reserve information in support of the year-end reserves reporting requirements under U. S. Securities Regulation S-K and for other internal business and financial needs. A supplementary third party report is attached hereto as Exhibit A, and incorporated by this reference to this report.
It should be noted that due to a combination of economic and political forces, there is significant uncertainty regarding the forecasting of future hydrocarbon prices. Crude oil prices were based on an average of the posted crude oil price on the 1st day of the each month for the twelve months in 2015, and held constant thereafter as required by the SEC regulations. The recoverable reserves and the income attributable thereto have a direct relationship to the hydrocarbon prices actually received; therefore, volumes of reserves actually recovered and amounts of income actually received may differ significantly for the estimated quantities presented in this report. A summary of the results, as of December 31, 2015, is shown below.
Estimated Reserves and Income of Certain Leasehold Interests
Eos Petro, Inc. as of December 31, 2015
| | ------ Proved ------ | |
| | | --Proved Developed-- | | | Undeveloped | | | Total | |
Gross Reserves | | Producing | | | Non-Producing | | | Undrilled | | | Proved | |
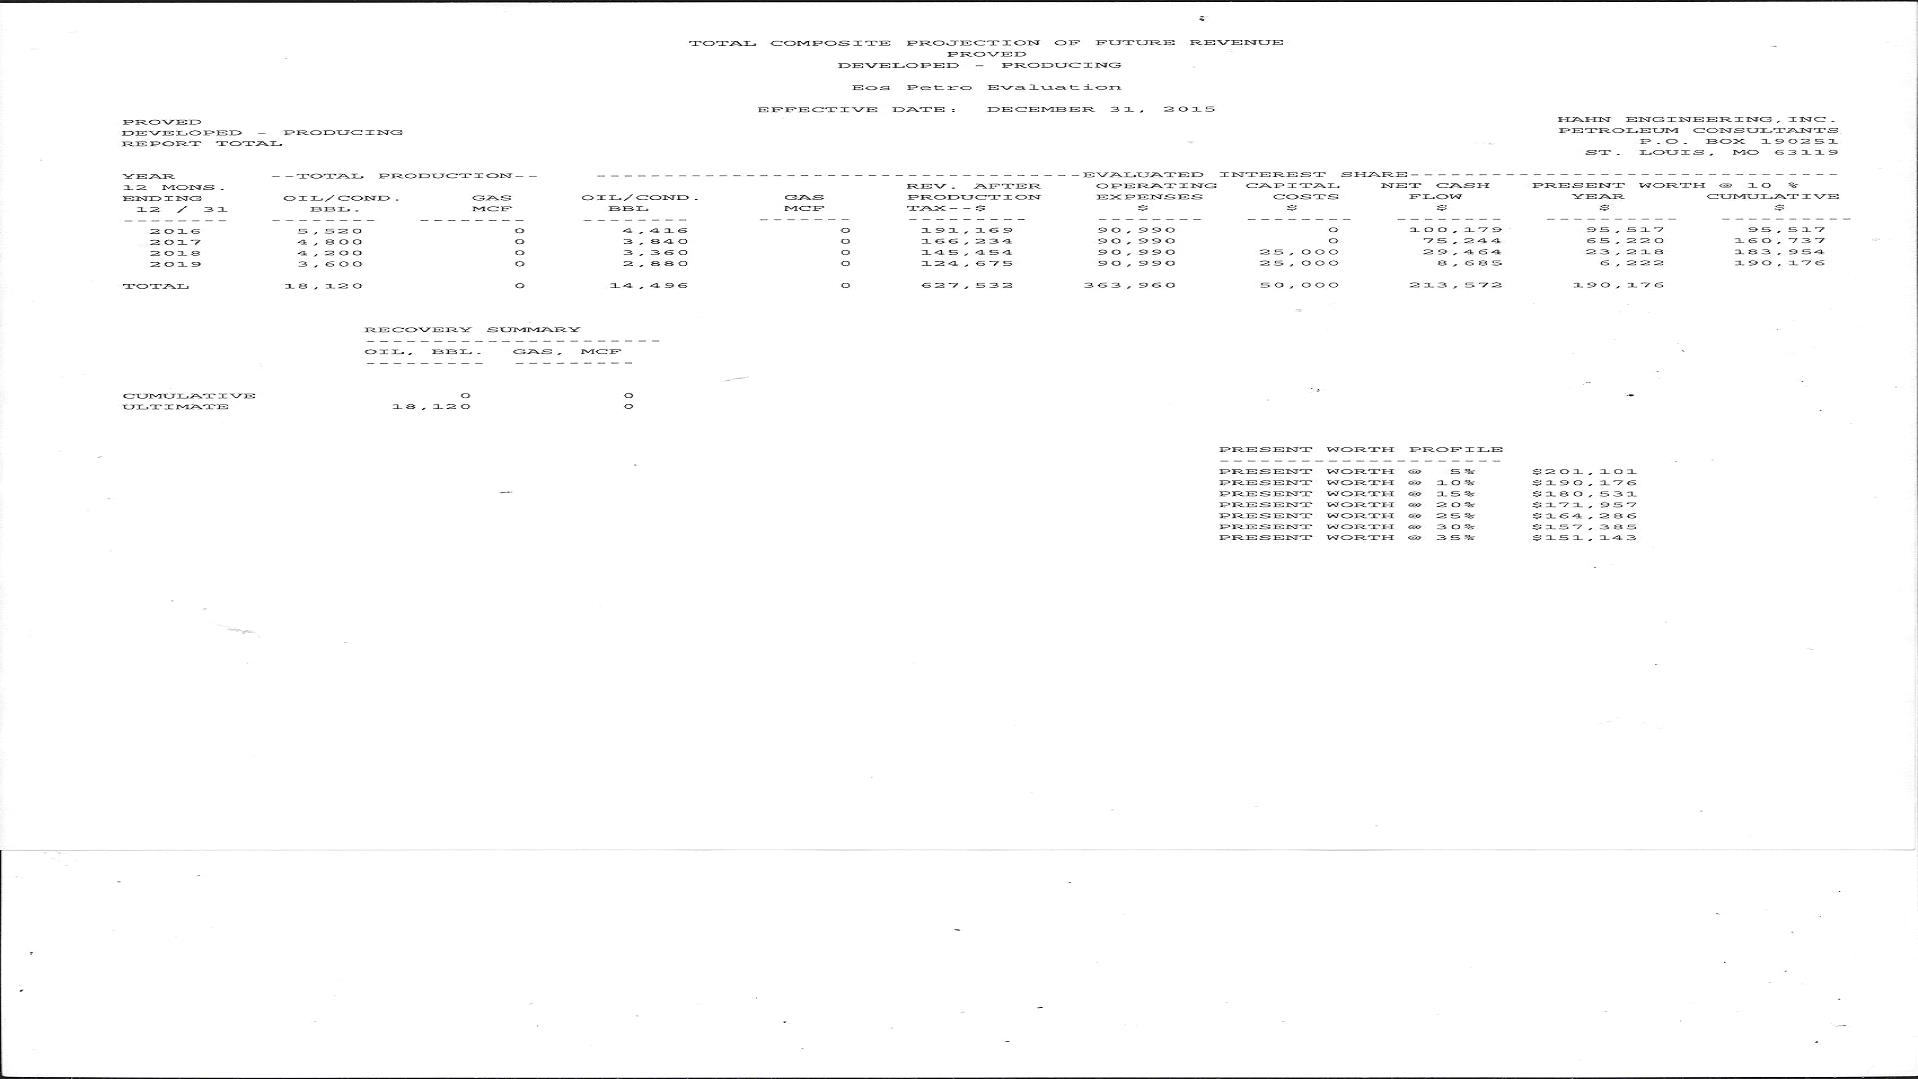
Oil – Barrels | | | 18,120 | | | | 28,032 | | | | 215,740 | | | | 261,882 | |
Net Reserves | | | | | | | | | | | | | | | | |
| Oil – Barrels | | | 14,496 | | | | 22,418 | | | | 172,592 | | | | 209,506 | |
Income Data | | | | | | | | | | | | | | | | |
| Future Gross Revenue | | $ | 627,532 | | | $ | 970,458 | | | $ | 7,471,508 | | | $ | 9,069,498 | |
Deductions 3,608,652 | | $ | 413,960 | | | $ | 426,772 | | | $ | 2,767,920 | | | $ | | |
Future Net Income (FNI) | | $ | 213,572 | | | $ | 543,686 | | | $ | 4,703,588 | | | $ | 5,460,846 | |
Discounted FNI @ 10% 2,772,670 | | $ | 190,176 | | | $ | 374,460 | | | $ | 2,208,034 | | | $ | | |
Liquid hydrocarbons are expressed in standard 42 gallon barrels. All gas volumes, if any, is sales gas expressed in millions of cubic feet (MMCF) at the official temperature and pressure bases of the areas in which the gas reserves are located.
The deductions are comprised of the normal direct and indirect costs of operating the wells, i.e. pumper's expense, electricity, propane, chemical inhibitor, supplies, insurance and normal well repair expense. There is no severance tax in the State of Illinois. The future net income is before the deduction of state and federal income taxes and general administrative overhead, and has not been adjusted for outstanding loans that may exist nor does it include any adjustment for cash on hand or gas production imbalances that may exist. Liquid hydrocarbon reserves account for approximately 100% of the total future gross revenue from the proved developed producing reserves.
The discounted future net income shown above was calculated using a discount rate of 10 percent per annum compounded semi-annually. Future net income was calculated at six other discount rates. These results are shown on each estimated projection of future production and income presented for all reserve categories in this report and in summary form below.
Discounted Future Net Income
as of December 31, 2015
| | | | | | | Proved | | | | |
| Discount | | | --- Proved Developed --- | | | Undeveloped | | | Total | |
| Factor | | | Producing | | | Non-Producing | | | Undrilled | | | Proved | |
| | | | | | | | | | | | | | |
| 5 | | | $ | 201,101 | | | $ | 448,492 | | | $ | 3,202,483 | | | $ | 3,852,075 | |
| 15 | | | $ | 180,531 | | | $ | 315,980 | | | $ | 1,535,286 | | | $ | 2,031,797 | |
| 20 | | | $ | 171,957 | | | $ | 269,133 | | | $ | 1,071,903 | | | $ | 1,512,993 | |
| 25 | | | $ | 164,286 | | | $ | 231,126 | | | $ | 747,778 | | | $ | 1,143,189 | |
| 30 | | | $ | 157,385 | | | $ | 199,937 | | | $ | 518,079 | | | $ | 875,400 | |
| 35 | | | $ | 151,143 | | | $ | 174,076 | | | $ | 353,514 | | | $ | 678,733 | |
The results shown above are presented for your information and should not be construed as our estimate of fair market value.
Reserves Included in this Report
The proved reserves included herein conform to the definition as set forth in the SEC regulation Part 210.4-10(a).
Estimates of Reserves
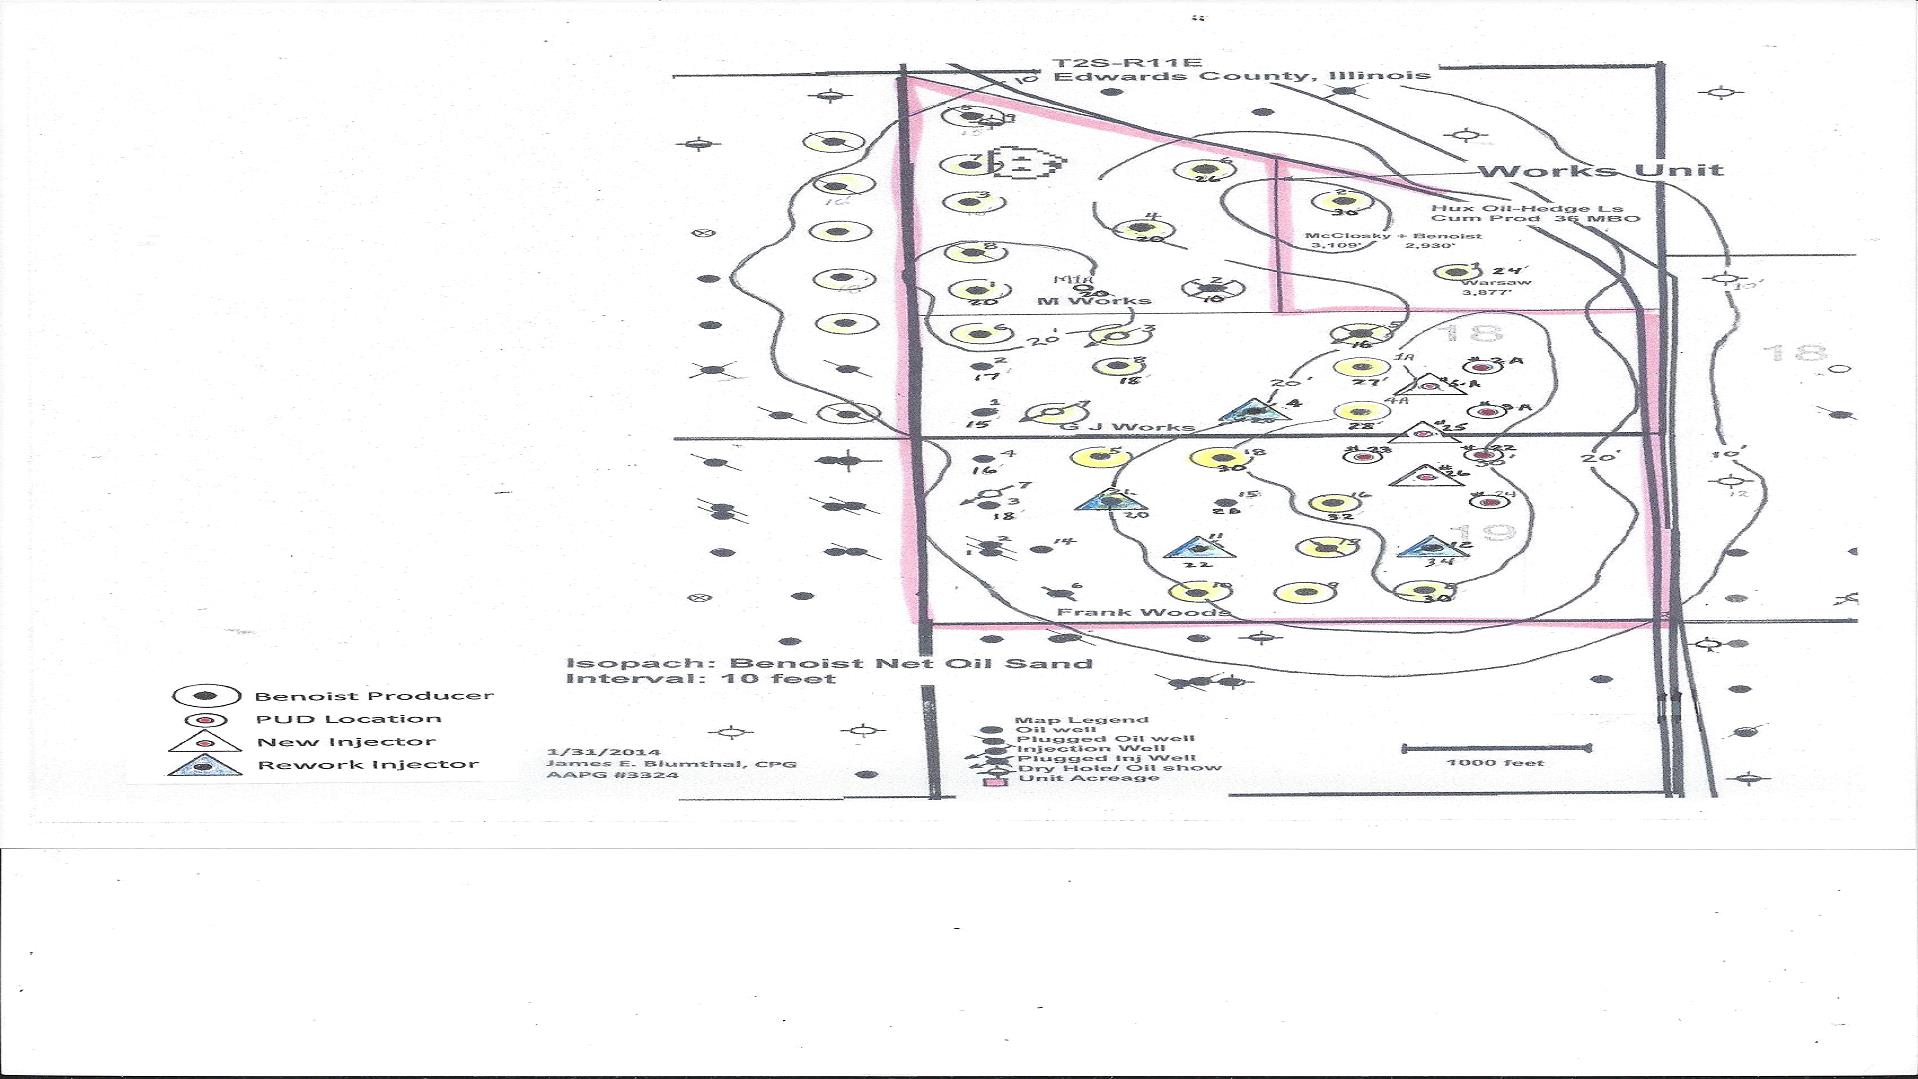
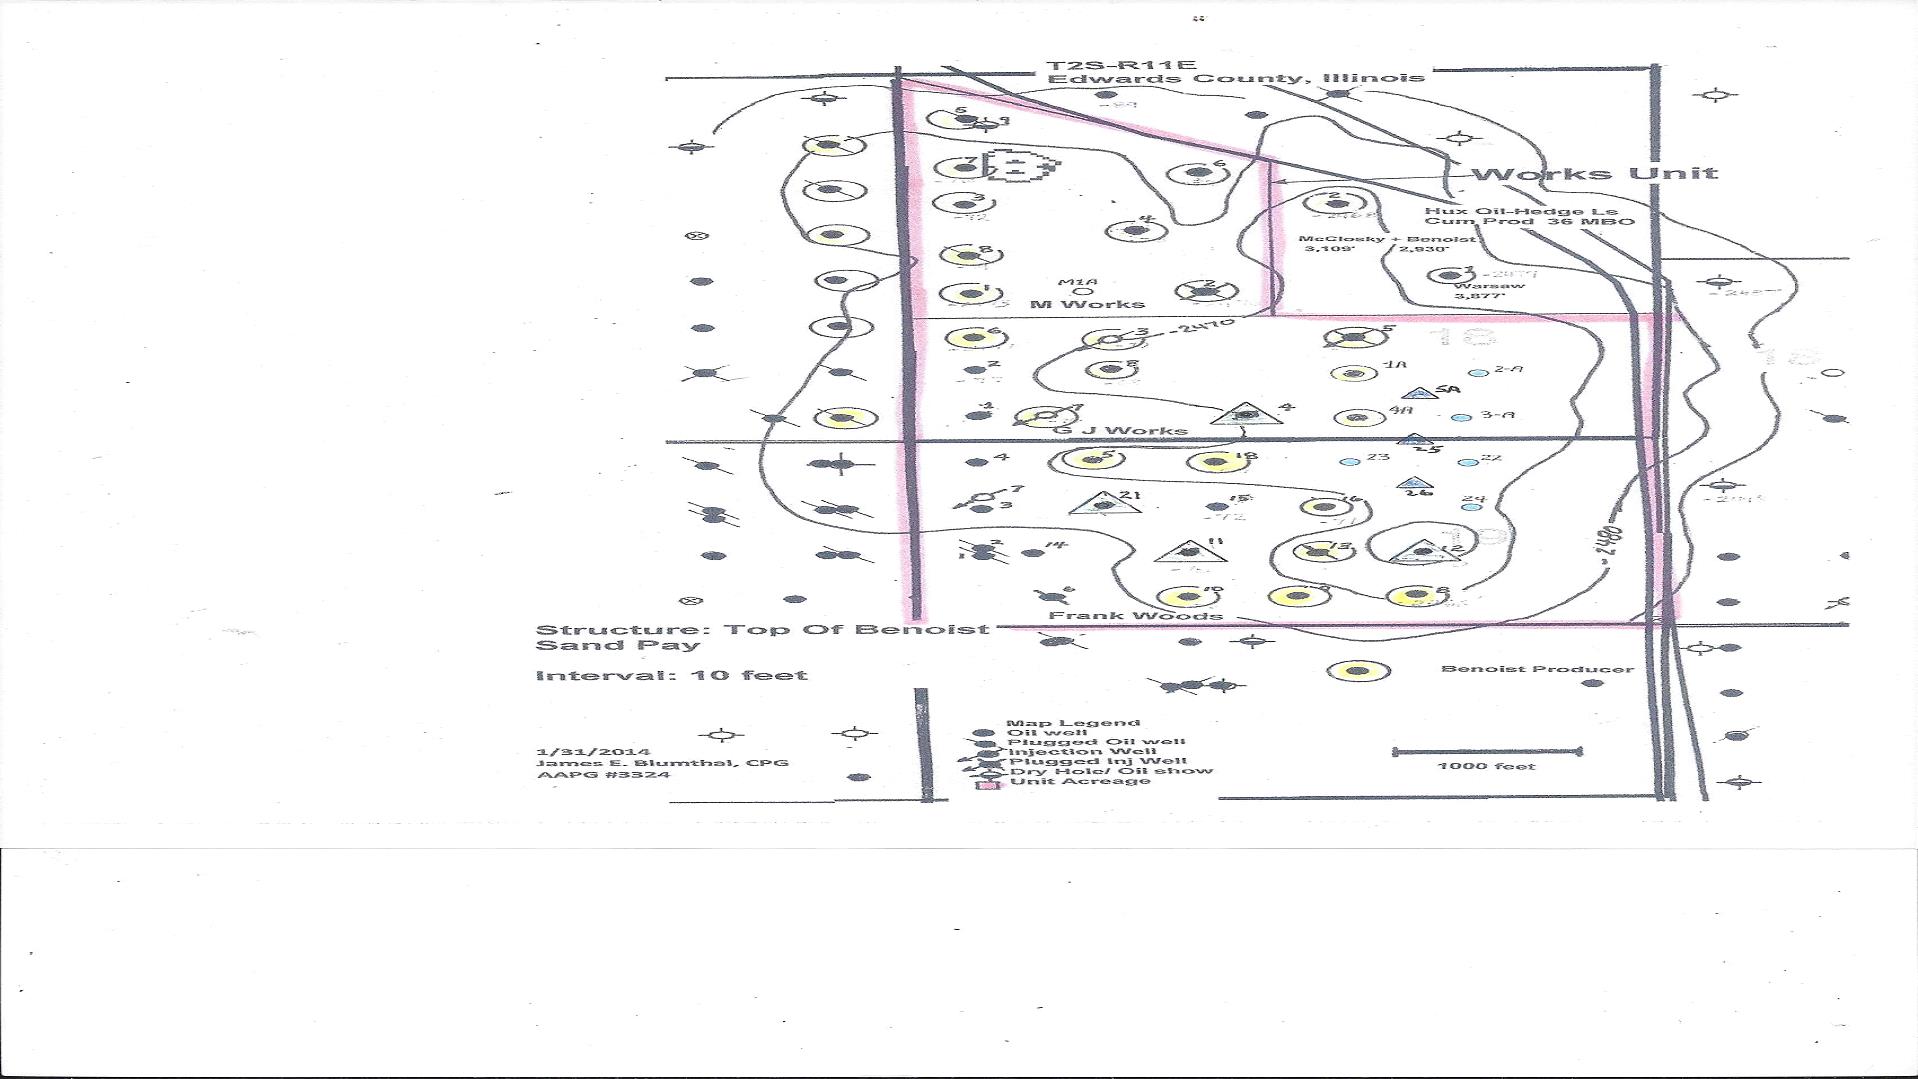
In general, the proved developed producing reserves included herein were estimated by the performance method. The reserves estimated by the performance method utilized extrapolations of various historical oil sales data in those cases where such data were definitive. The proved developed non-producing shut-in reserves were based on well test data taken prior to 2008 when the Works Unit was shut-in due to the death of the owner/operator at that time. The proved undeveloped undrilled reserves were based on Benoist Sand recoveries by both primary and secondary recovery with a reasonable certainty that they will be recovered. Structure and isopach maps of the Benoist Sand with marked proved locations and recommended injection wells are attached.
The reserves included in this report are estimates only and should not be construed as being exact quantities. They may or may not be actually recovered, and if recovered, the revenues therefrom and the actual costs related thereto could be more or less than the estimated amounts. Moreover, estimates of reserves may increase or decrease as a result of future operations.
Future Production Rates
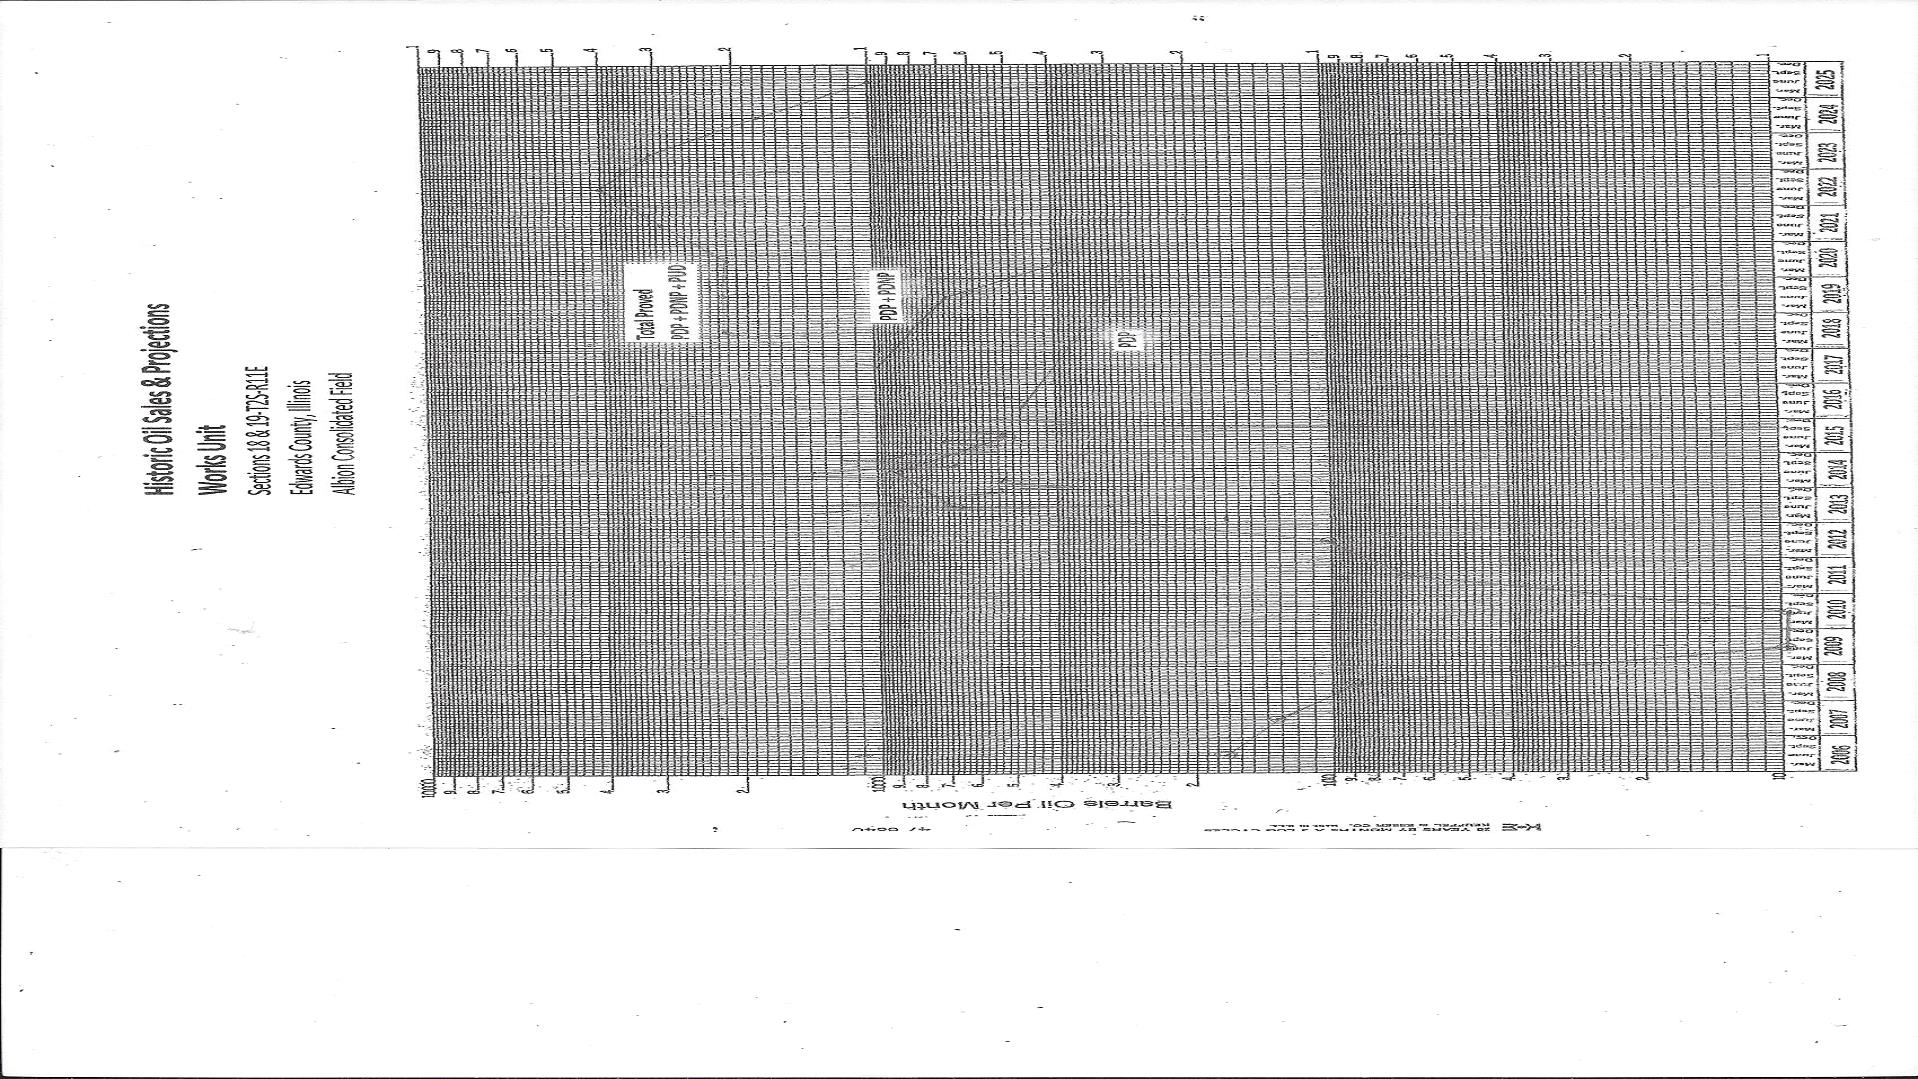
Initial production rates are based on the current producing rates for those wells now on production. The historical oil sales graph plotted monthly since 2006 is attached. Projections of estimated future oil production, as marked, are also shown on the graph. Historical oil production data was available from 1980 through December 2015.
Hydrocarbon Prices
Oil prices were based on the average posted crude oil price for the 1st day of each of the twelve months for the calendar year 2015, or $43.29 per barrel and held constant thereafter per SEC guidelines. See Illinois Basin Posted Crude Oil Price attachment. There is no severance tax in the State of Illinois.
Operating Expenses
Operating expenses for the Works Unit in this report were based on actual well operating expenses incurred by Eos Petro, operator of these wells. These actual expenses would include pumper's expense, electricity, propane, chemical inhibitor, supplies, insurance and normal well repair expense. The operating expenses were held constant for the economic life of each lease. No deduction was made for indirect costs such as loan repayments, interest expense and exploration and development prepayments that are not charged directly to the leases or wells.
General
The estimates of reserves presented herein are based upon a detailed study of the properties in which Eos Petro, Inc. operates and owns a working interest. For the purposes of this report, we did not perform any field inspection of the property, nor did we examine the mechanical operation or condition of the wells and facilities. We have not investigated possible environmental liability, therefore our estimates do not include any costs due to such possible liability.
Future revenue estimates include estimates of the costs to plug and abandon the existing wells and facilities, net of any salvage value. Estimated plugging and restoration liability for the existing wells and tank battery facility exceed the estimated salvage value for the well equipment and facility equipment. The estimated net liability, $110,000, is included as capital expenditures over the last years of production split between the proved reserve categories.
Eos Petro, Inc. has supplied to Hahn Engineering, Inc. their pertinent accounts, records and other data for this investigation. Historical information and data from a prior operator, Superior Oil Company, was also utilized. The ownership interests, expenses and other factual data furnished were accepted as presented. The historical oil sales data was obtained from IHS Energy/Petroleum Information and generally available through December 2015.
Hahn Engineering, Inc. does not have any interest in the subject properties and neither the employment to perform this study nor the compensation is contingent on our estimates of reserves and future income for the subject properties.
Hahn Engineering, Inc. does not guarantee the reserve estimates or the net cash flow projections. Thank you for this opportunity to be of service.
Yours truly,
HAHN ENGINEERING, INC.
/s/ Joseph K. Hahn
Joseph K. Hahn, P.E.
Exhibit A
THIRD PARTY REPORT OF RESERVES
By: Hahn Engineering, Inc.
This report is provided to satisfy the requirements contained in Item 1202(a)(8) of U. S. Securities and Exchange Commission Regulation S-K.
The numbering of items below corresponds to the requirements set out in Item 1202(a)(8) of Regulation S-K. Terms to which a meaning is ascribed in Regulation S-K and Regulation S-X have the same meaning in this report.
| i. | We have prepared an independent evaluation of the reserves of Eos Petro, Inc. (the "Company") for the management and the board of directors of the Company. The primary purpose of our evaluation report was to provide estimates of reserve information in support of the Company's year-end reserves reporting requirements under U. S. Securities Regulation S-K and for other internal business and financial needs of the Company. |
| ii. | We have evaluated the reserves of the Company as of December 31, 2015. The completion date of our report is February 15, 2016. |
| iii. | The following table set forth the geographic area covered by our report, proved reserves estimated using constant prices and costs, and the proportion of the total company that we have evaluated. |
Our report covers 100% of the Company's proved oil and natural gas reserves.
| Company Net Reserves | |
| | | | | | Natural | | | Natural | | | Oil | |
| | | Crude Oil | | | Gas | | | Gas Liquids | | | Equivalent | |
| Category | | Mbbl | | | MMcf | | | Mbbl | | | Mbbl | |
| Proved | | | | | | | | | | | | |
| Developed | | | 36.91 | | | | 0 | | | | 0 | | | | 36.91 | |
| U.S.A | | | | | | | | | | | | | | | | |
| Undeveloped | | | 172.59 | | | | 0 | | | | 0 | | | | 172.59 | |
| U.S.A. | | | | | | | | | | | | | | | | |
| Total Proved | | | 209.50 | | | | 0 | | | | 0 | | | | 209.50 | |