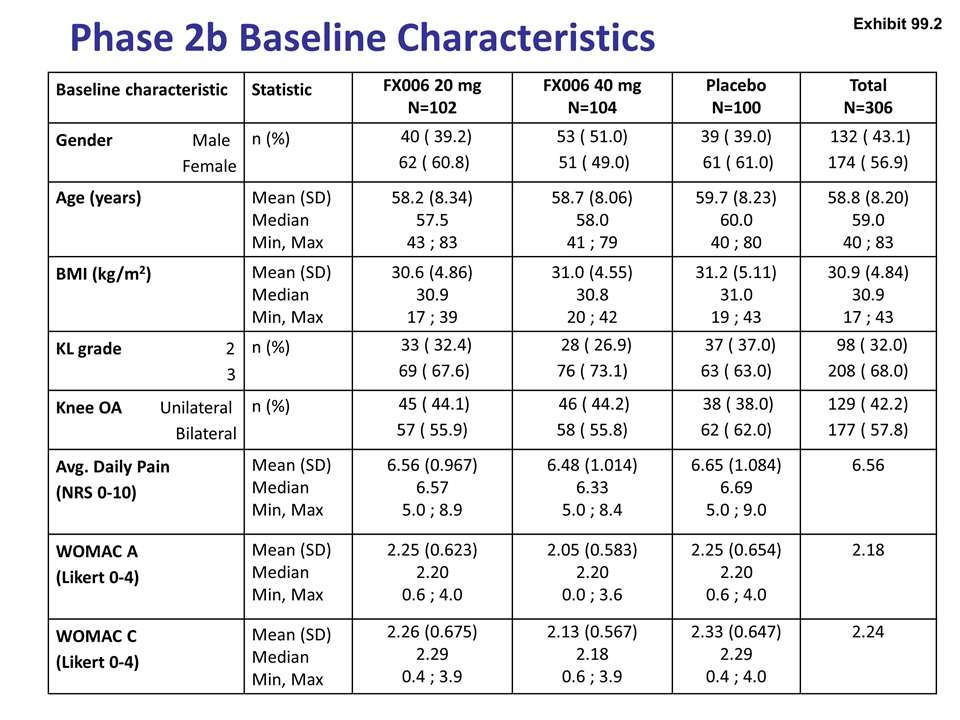
Phase 2b Baseline Characteristics Baseline characteristic Statistic FX006 20 mg N=102 FX006 40 mg N=104 Placebo N=100 Total N=306 Gender Male Female n (%) 40 ( 39.2) 62 ( 60.8) 53 ( 51.0) 51 ( 49.0) 39 ( 39.0) 61 ( 61.0) 132 ( 43.1) 174 ( 56.9) Age (years) Mean (SD) Median Min, Max 58.2 (8.34) 57.5 43 ; 83 58.7 (8.06) 58.0 41 ; 79 59.7 (8.23) 60.0 40 ; 80 58.8 (8.20) 59.0 40 ; 83 BMI (kg/m2) Mean (SD) Median Min, Max 30.6 (4.86) 30.9 17 ; 39 31.0 (4.55) 30.8 20 ; 42 31.2 (5.11) 31.0 19 ; 43 30.9 (4.84) 30.9 17 ; 43 KL grade 2 3 n (%) 33 ( 32.4) 69 ( 67.6) 28 ( 26.9) 76 ( 73.1) 37 ( 37.0) 63 ( 63.0) 98 ( 32.0) 208 ( 68.0) Knee OA Unilateral Bilateral n (%) 45 ( 44.1) 57 ( 55.9) 46 ( 44.2) 58 ( 55.8) 38 ( 38.0) 62 ( 62.0) 129 ( 42.2) 177 ( 57.8) Avg. Daily Pain (NRS 0-10) Mean (SD) Median Min, Max 6.56 (0.967) 6.57 5.0 ; 8.9 6.48 (1.014) 6.33 5.0 ; 8.4 6.65 (1.084) 6.69 5.0 ; 9.0 6.56 WOMAC A (Likert 0-4) Mean (SD) Median Min, Max 2.25 (0.623) 2.20 0.6 ; 4.0 2.05 (0.583) 2.20 0.0 ; 3.6 2.25 (0.654) 2.20 0.6 ; 4.0 2.18 WOMAC C (Likert 0-4) Mean (SD) Median Min, Max 2.26 (0.675) 2.29 0.4 ; 3.9 2.13 (0.567) 2.18 0.6 ; 3.9 2.33 (0.647) 2.29 0.4 ; 4.0 2.24 Exhibit 99.2
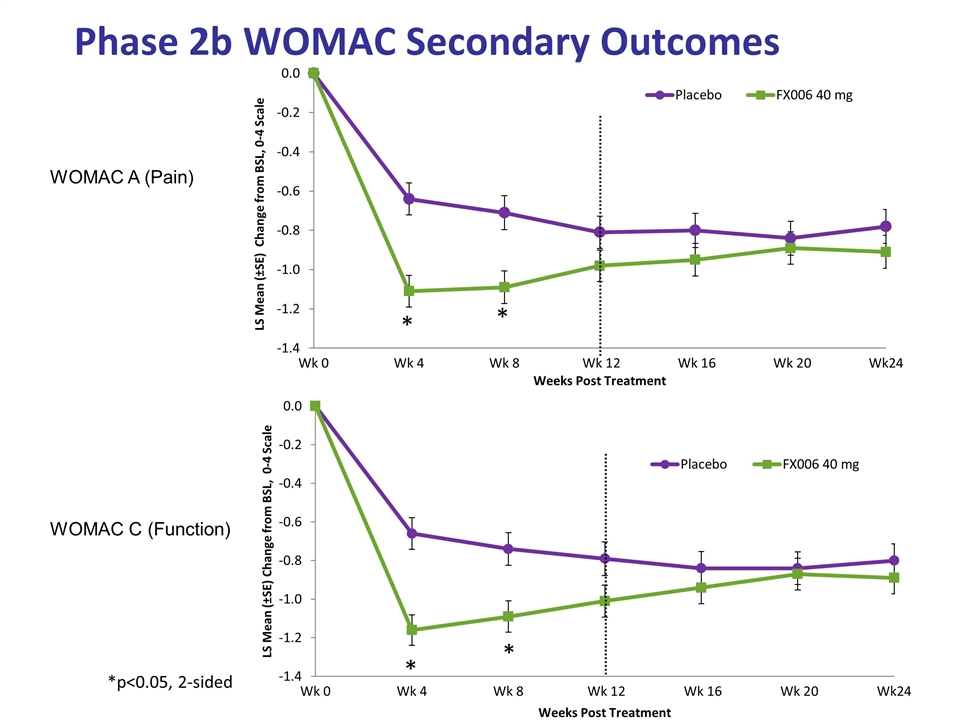
Phase 2b WOMAC Secondary Outcomes WOMAC A (Pain) WOMAC C (Function) *p<0.05, 2-sided
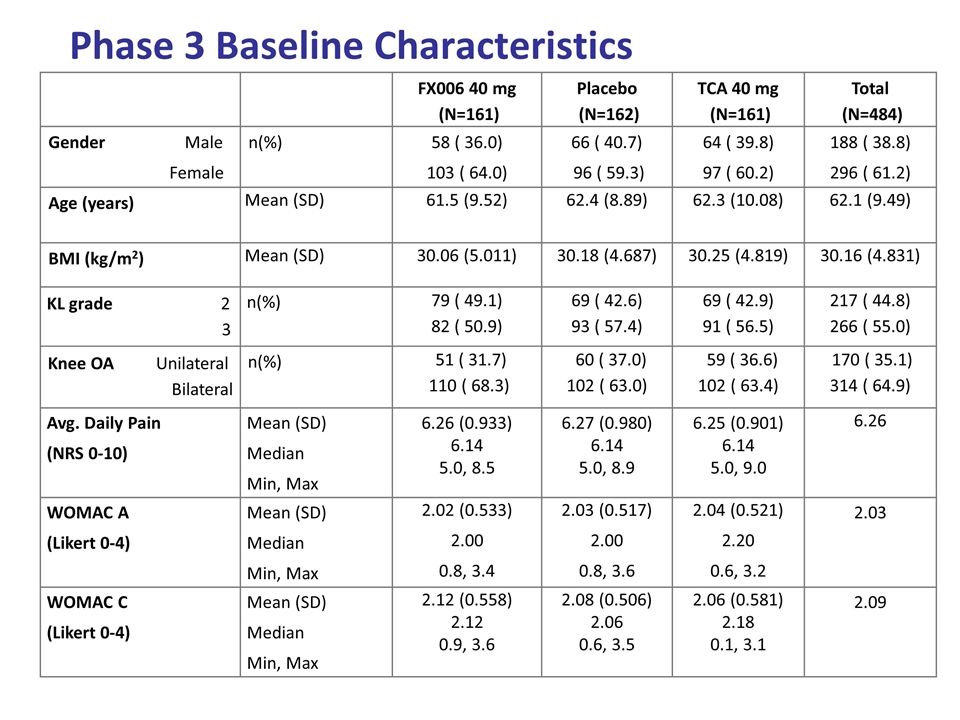
Phase 3 Baseline Characteristics FX006 40 mg (N=161) Placebo (N=162) TCA 40 mg (N=161) Total (N=484) Gender Male Female n(%) 58 ( 36.0) 103 ( 64.0) 66 ( 40.7) 96 ( 59.3) 64 ( 39.8) 97 ( 60.2) 188 ( 38.8) 296 ( 61.2) Age (years) Mean (SD) 61.5 (9.52) 62.4 (8.89) 62.3 (10.08) 62.1 (9.49) BMI (kg/m2) Mean (SD) 30.06 (5.011) 30.18 (4.687) 30.25 (4.819) 30.16 (4.831) KL grade 2 3 n(%) 79 ( 49.1) 82 ( 50.9) 69 ( 42.6) 93 ( 57.4) 69 ( 42.9) 91 ( 56.5) 217 ( 44.8) 266 ( 55.0) Knee OA Unilateral Bilateral n(%) 51 ( 31.7) 110 ( 68.3) 60 ( 37.0) 102 ( 63.0) 59 ( 36.6) 102 ( 63.4) 170 ( 35.1) 314 ( 64.9) Avg. Daily Pain (NRS 0-10) Mean (SD) Median Min, Max 6.26 (0.933) 6.14 5.0, 8.5 6.27 (0.980) 6.14 5.0, 8.9 6.25 (0.901) 6.14 5.0, 9.0 6.26 WOMAC A (Likert 0-4) Mean (SD) Median Min, Max 2.02 (0.533) 2.00 0.8, 3.4 2.03 (0.517) 2.00 0.8, 3.6 2.04 (0.521) 2.20 0.6, 3.2 2.03 WOMAC C (Likert 0-4) Mean (SD) Median Min, Max 2.12 (0.558) 2.12 0.9, 3.6 2.08 (0.506) 2.06 0.6, 3.5 2.06 (0.581) 2.18 0.1, 3.1 2.09
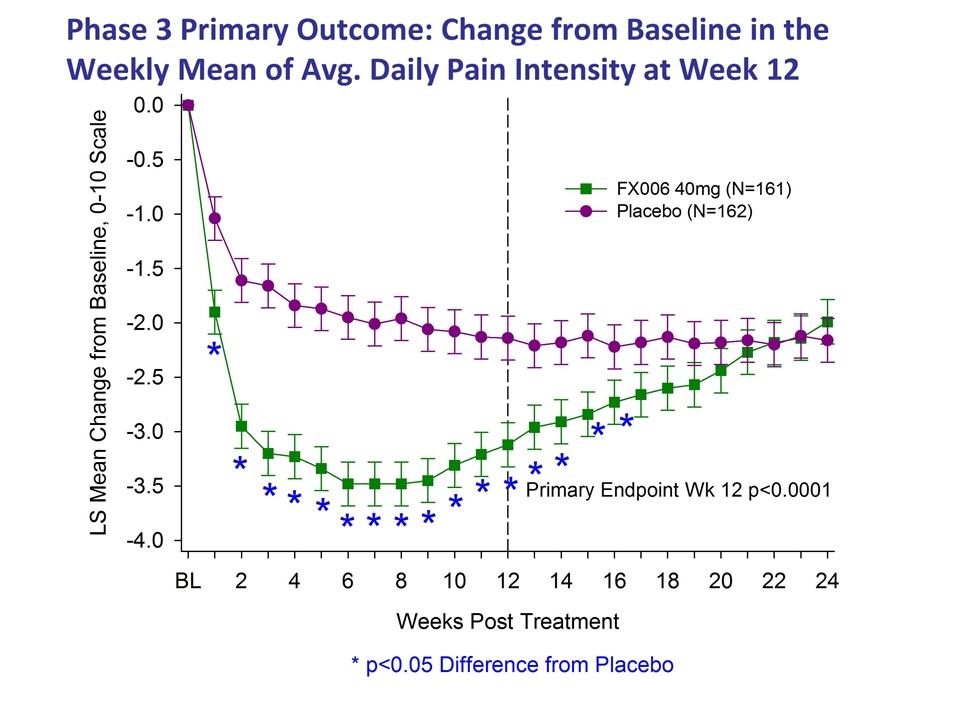
Phase 3 Primary Outcome: Change from Baseline in the Weekly Mean of Avg. Daily Pain Intensity at Week 12
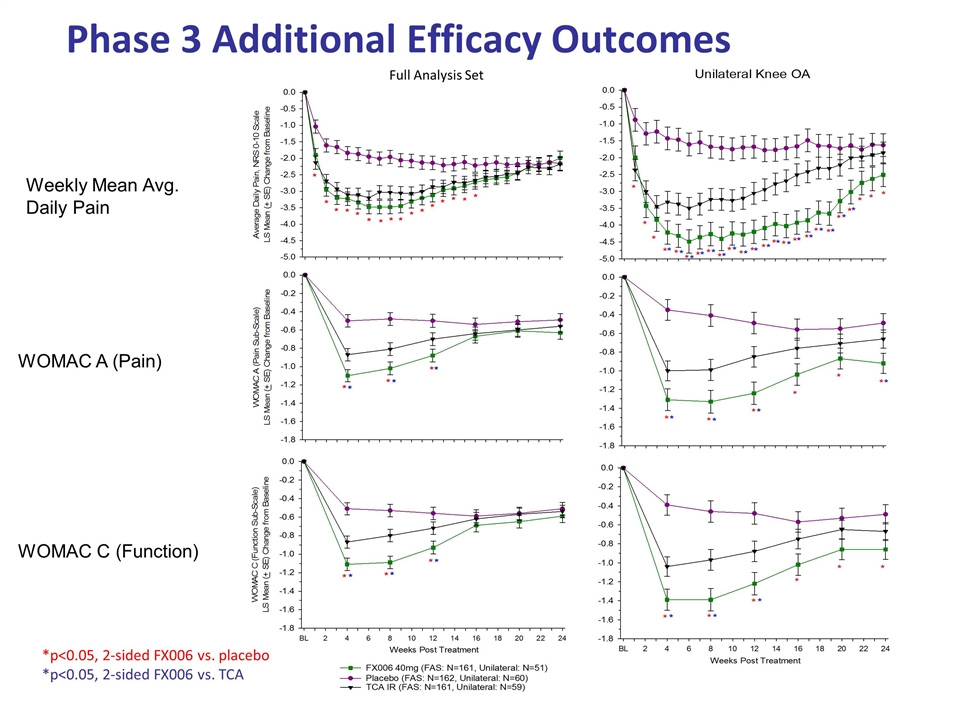
Phase 3 Additional Efficacy Outcomes WOMAC A (Pain) WOMAC C (Function) Weekly Mean Avg. Daily Pain Full Analysis Set *p<0.05, 2-sided FX006 vs. placebo *p<0.05, 2-sided FX006 vs. TCA
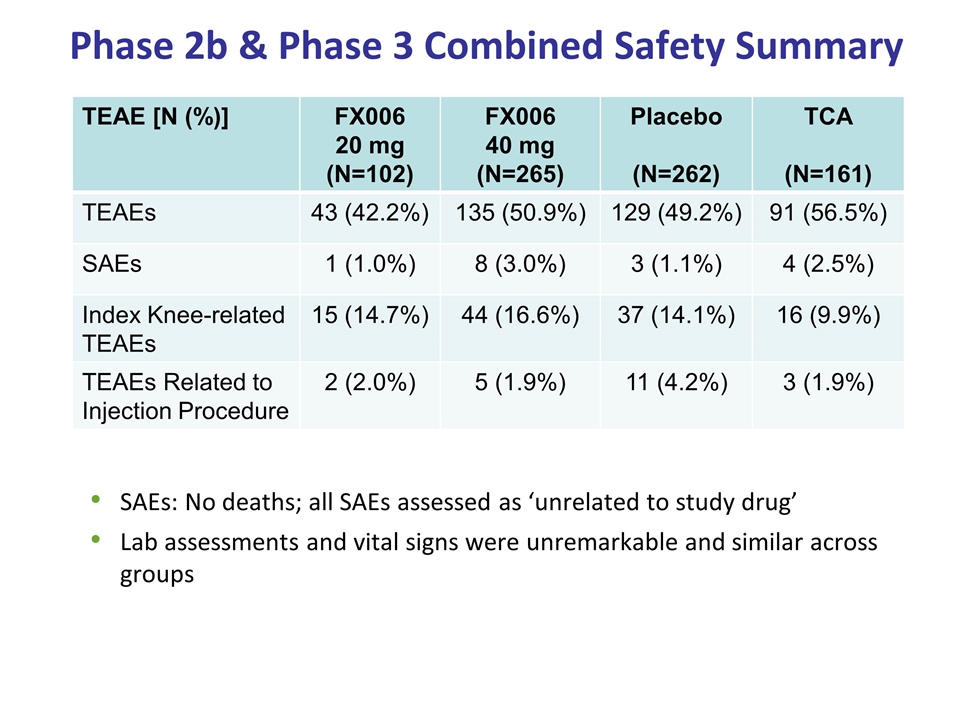
Phase 2b & Phase 3 Combined Safety Summary SAEs: No deaths; all SAEs assessed as ‘unrelated to study drug’ Lab assessments and vital signs were unremarkable and similar across groups TEAE [N (%)] FX006 20 mg (N=102) FX006 40 mg (N=265) Placebo (N=262) TCA (N=161) TEAEs 43 (42.2%) 135 (50.9%) 129 (49.2%) 91 (56.5%) SAEs 1 (1.0%) 8 (3.0%) 3 (1.1%) 4 (2.5%) Index Knee-related TEAEs 15 (14.7%) 44 (16.6%) 37 (14.1%) 16 (9.9%) TEAEs Related to Injection Procedure 2 (2.0%) 5 (1.9%) 11 (4.2%) 3 (1.9%)
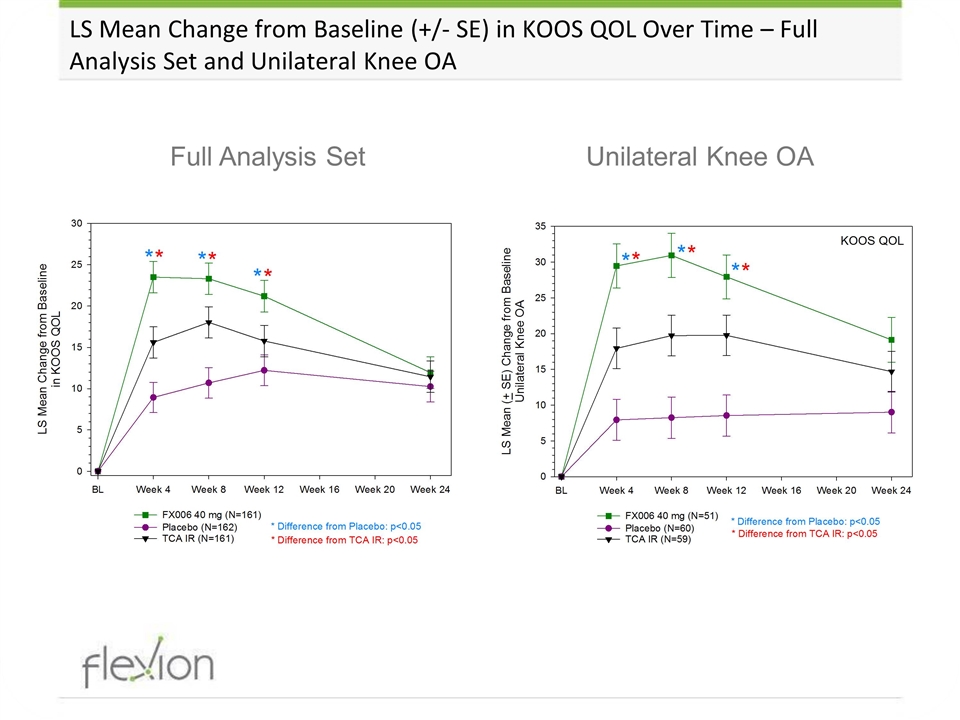
LS Mean Change from Baseline (+/- SE) in KOOS QOL Over Time – Full Analysis Set and Unilateral Knee OA Unilateral Knee OA Full Analysis Set
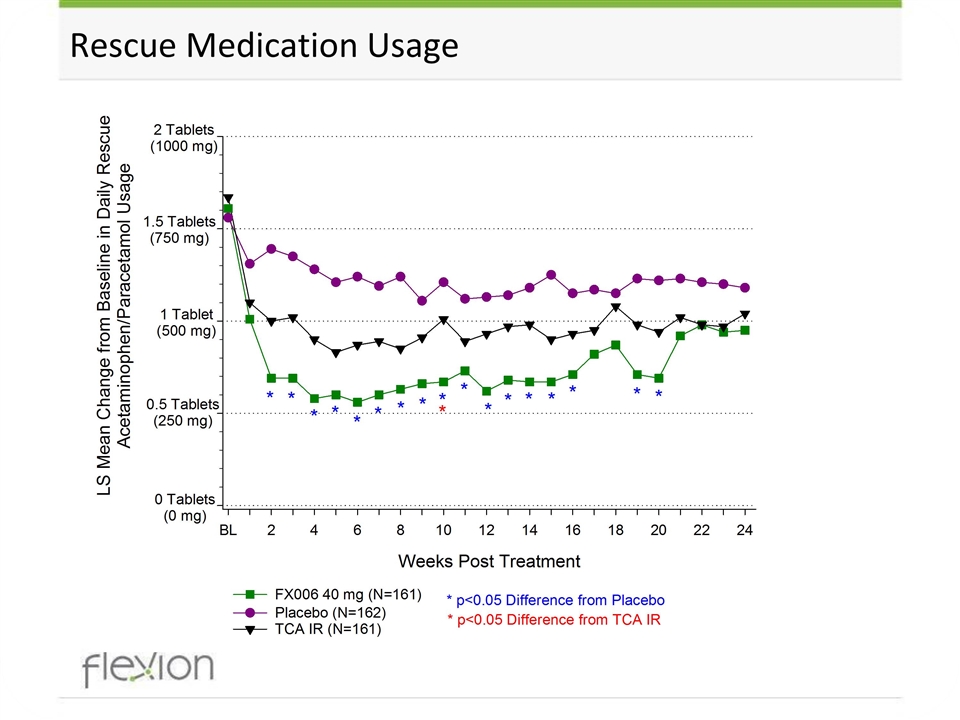
Rescue Medication Usage
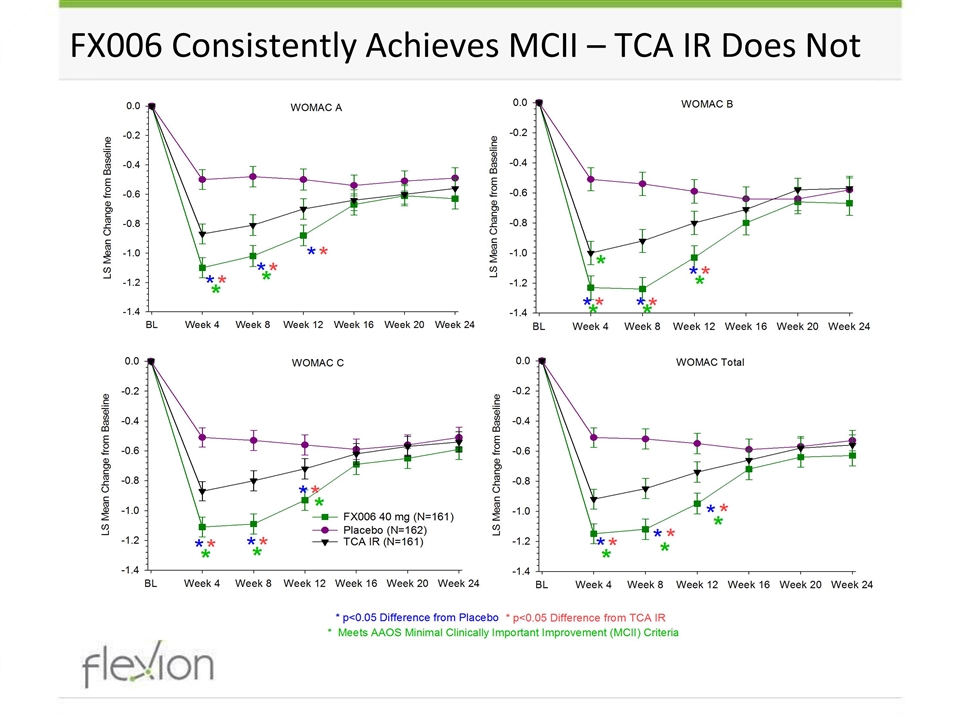
FX006 Consistently Achieves MCII – TCA IR Does Not
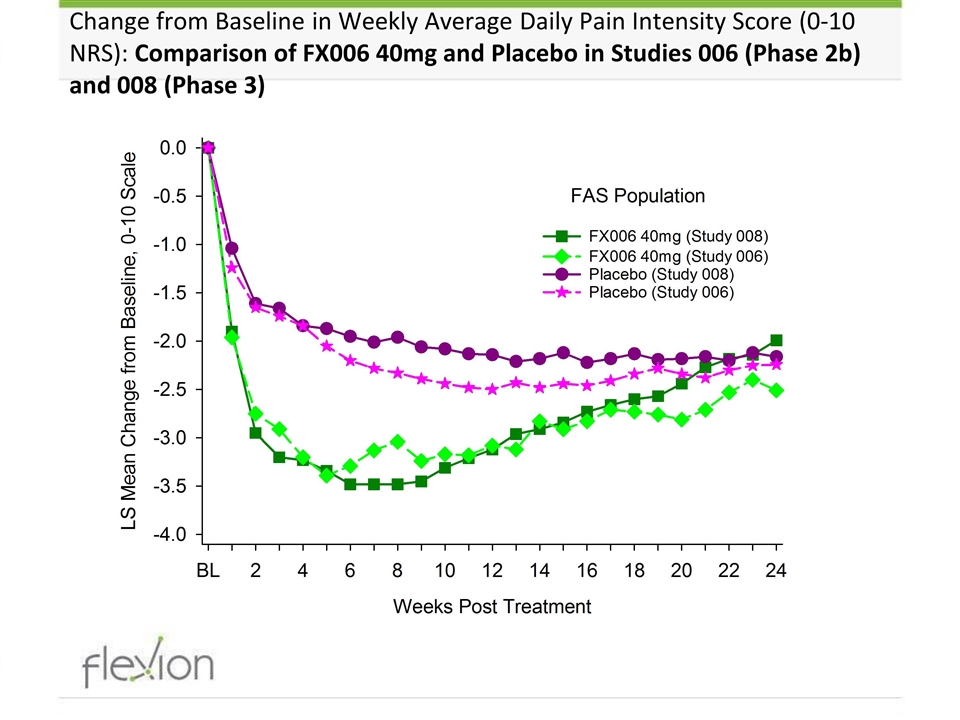
Change from Baseline in Weekly Average Daily Pain Intensity Score (0-10 NRS): Comparison of FX006 40mg and Placebo in Studies 006 (Phase 2b) and 008 (Phase 3)


