Use these links to rapidly review the document
TABLE OF CONTENTS
INDEX TO CONSOLIDATED FINANCIAL STATEMENTS
Table of Contents
UNITED STATES
SECURITIES AND EXCHANGE COMMISSION
WASHINGTON, D.C. 20549
FORM 10-K
| | |
| (Mark One) | | |
ý |
|
ANNUAL REPORT PURSUANT TO SECTION 13 OR 15(d) OF THE SECURITIES EXCHANGE ACT OF 1934 |
For the fiscal year ended January 29, 2013 |
OR |
o |
|
TRANSITION REPORT PURSUANT TO SECTION 13 OR 15(d) SECURITIES EXCHANGE ACT OF 1934 |
For the Transition Period from to
|
Commission file number 001-35354
MATTRESS FIRM HOLDING CORP.
(Exact Name of Registrant as Specified in Its Charter)
| | |
Delaware
(State or other jurisdiction of
incorporation or organization) | | 20-8185960
(I.R.S. Employer
Identification No.) |
5815 Gulf Freeway
Houston, Texas 77023
(Address of Principal Executive Offices)(Zip Code)
Registrant's telephone number, including area code(713) 923-1090
Securities registered pursuant to Section 12(b) of the Act:
| | |
| Title of Each Class | | Name of Each Exchange on which Registered |
|---|
| Common Stock, par value $0.01 per share | | NASDAQ Global Select Market |
Securities registered pursuant to Section 12(g) of the Act:None
Indicate by check mark if the registrant is a well-known seasoned issuer as defined in Rule 405 of the Securities Act Yes o No ý
Indicate by check mark if the registrant is not required to file reports pursuant to Section 13 or Section 15(d) of the Act. Yes o No ý
Indicate by check mark whether the registrant (1) has filed all reports required to be filed by Section 13 or 15(d) of the Securities Exchange Act of 1934 during the preceding 12 months (or for such shorter period that the registrant was required to file such reports), and (2) has been subject to such filing requirements for the past 90 days. Yes ý No o
Indicate by check mark whether the registrant has submitted electronically and posted on its corporate Website, if any, every Interactive Data File required to be submitted and posted pursuant to Rule 405 of Regulation S-T during the preceding 12 months (or for such shorter period that the registrant was required to submit and post such files). Yes ý No o
Indicate by check mark if disclosure of delinquent filers pursuant to Item 405 of Regulation S-K is not contained herein, and will not be contained, to the best of registrant's knowledge, in definitive proxy or information statements incorporated by reference in Part III of this Form 10-K or any amendment to this Form 10-K. o
Indicate by check mark whether the registrant is a large accelerated filer, an accelerated filer, a non-accelerated filer, or a smaller reporting company. See definitions of "large accelerated filer," "accelerated filer," and "smaller reporting company" in Rule 12b-2 of the Exchange Act.
| | | | | | |
| Large accelerated filer o | | Accelerated filer ý | | Non-accelerated filer o
(Do not check if a
smaller reporting company) | | Smaller reporting company o |
Indicate by check mark whether registrant is a shell company (as defined in Rule 12b-2 of the Act). Yes o No ý
On July 31, 2012, the last business day of the registrant's most recently completed second fiscal quarter, the aggregate market value of the shares of common stock beneficially held by non-affiliates of the registrant was approximately $204.6 million. (For purposes hereof, directors, executive officers and 10% or greater stockholders have been deemed affiliates).
As of March 28, 2013, 33,798,756 shares of common stock, par value $0.01 per share, of the registrant were outstanding.
DOCUMENTS INCORPORATED BY REFERENCE:
Items 10 through 14 of Part III of this Annual Report on Form 10-K incorporate by reference certain information from the registrant's definitive proxy statement for the 2013 annual meeting of stockholders, which the registrant intends to file with the Securities and Exchange Commission no later than 120 days after January 29, 2013, the end of the registrant's 2012 fiscal year. With the exception of the sections of the definitive proxy statement specifically incorporated herein by reference, the definitive proxy statement is not deemed to be filed as part of this Annual Report on Form 10-K.
Table of Contents
CAUTIONARY NOTE REGARDING FORWARD-LOOKING STATEMENTS
This Annual Report on Form 10-K contains forward-looking statements within the meaning of federal securities laws that relate to future events or our future financial performance. In many cases, you can identify forward-looking statements by terminology such as "may," "would," "should," "expect," "plan," "anticipate," "believe," "estimate," "predict," "intend," "potential" or "continue" or the negative of these terms or other comparable terminology. These forward-looking statements are made based on our management's expectations and beliefs concerning future events affecting us and are subject to uncertainties and factors relating to our operations and business environment, all of which are difficult to predict and many of which are beyond our control. These uncertainties and other factors could cause our actual results to differ materially from those matters expressed or implied by these forward-looking statements.
Although we believe that the expectations reflected in the forward-looking statements are reasonable, we cannot guarantee future results, levels of activity, performance or achievements. Important factors that may cause actual results to differ materially from the results expressed or implied by these forward-looking statements are set forth under "Risk Factors" in Item 1A. of Part I of this Annual Report on Form 10-K. All forward-looking statements in this Annual Report on Form 10-K are based on information available to us on the date of this report. We undertake no obligation to publicly update or revise any of the forward-looking statements, whether as a result of new information, future events or otherwise.
Some of the important factors that could cause our actual results, performance or financial condition to differ materially from expectations are:
- •
- a reduction in discretionary spending by consumers;
- •
- our ability to profitably open and operate new stores;
- •
- our intent to aggressively open additional stores in our existing markets;
- •
- our relationship with certain mattress manufacturers as our primary suppliers;
- •
- our dependence on a few key employees;
- •
- the possible impairment of our goodwill or other acquired intangible assets;
- •
- the effect of our planned growth and the integration of our acquisitions on our business infrastructure;
- •
- the impact of seasonality on our financial results and comparable-store sales;
- •
- fluctuations in our comparable-store sales from quarter to quarter;
- •
- our ability to raise adequate capital to support our expansion strategy;
- •
- our future expansion into new, unfamiliar markets;
- •
- our success in pursuing strategic acquisitions;
- •
- the effectiveness and efficiency of our advertising expenditures;
- •
- our success in keeping warranty claims and comfort exchange return rates within acceptable levels;
- •
- our ability to deliver our products in a timely manner;
- •
- our status as a holding company with no business operations;
- •
- our ability to anticipate consumer trends;
1
Table of Contents
- •
- heightened competition;
- •
- changes in applicable regulations;
- •
- risks related to our franchises, including our lack of control over their operations, their ability to finance and open new stores and our liabilities if they default on note or lease obligations;
- •
- risks related to our stock; and
- •
- other factors discussed in "Item 1A. Risk Factors" of Part I of this Annual Report on Form 10-K and elsewhere in this report and in our other filings with the Securities and Exchange Commission (the "SEC").
NOTE REGARDING TRADEMARKS AND SERVICE MARKS
We own or have rights to use the trademarks, service marks and trade names that we use in conjunction with the operation of our business. Some of the more important trademarks that we own or have rights to use that appear in this Annual Report on Form 10-K include "Mattress Firm®," "Comfort By Color®," "Mattress Firm Red Carpet Delivery Service®," "Hampton & Rhodes®," "YuMe™," "Mattress Firm SuperCenter®," "Happiness Guarantee®," "Replace Every 8®," "Save Money. Sleep Happy®," "Sleep Happy™," "Dream It's Possible® ," "Side by side before you decide™," "Nobody Sells for Less, Nobody!™" and "All the best brands...All the best prices!®." Trademarks, trade names or service marks of other companies appearing in this Annual Report on Form 10-K are, to our knowledge, the property of their respective owners.
NOTE REGARDING MARKET AND INDUSTRY DATA
Industry and market data included in this Annual Report on Form 10-K were obtained from our own internal data, data from industry trade publications and groups (primarilyFurniture Today and the International Sleep Products Association, or "ISPA"), consumer research and marketing studies and, in some cases, are management estimates based on industry and other knowledge and experience in the markets in which we operate. Our estimates have been based on information obtained from our suppliers, customers, trade and business organizations and other contacts in the markets in which we operate. We believe these estimates and the third party information mentioned above to be accurate as of the date of this Annual Report on Form 10-K.
2
Table of Contents
MATTRESS FIRM HOLDING CORP.
Table of Contents
| | | | | | |
| |
| | Page | |
|---|
| | Part I. | | | | |
Item 1. | | Business | | | 4 | |
Item 1A. | | Risk Factors | | | 15 | |
Item 1B. | | Unresolved Staff Comments | | | 27 | |
Item 2. | | Properties | | | 28 | |
Item 3. | | Legal Proceedings | | | 28 | |
Item 4. | | Mine Safety Disclosures | | | 28 | |
| | Part II. | | | | |
Item 5. | | Market for Registrant's Common Equity, Related Stockholder Matters and Issuer Purchases of Equity Securities | | | 28 | |
Item 6. | | Selected Financial Data | | | 31 | |
Item 7. | | Management's Discussion and Analysis of Financial Condition and Results of Operations | | | 36 | |
Item 7A. | | Quantitative and Qualitative Disclosures About Market Risk | | | 61 | |
Item 8. | | Financial Statements and Supplementary Data | | | 62 | |
Item 9. | | Changes in and Disagreements with Accountants on Accounting and Financial Disclosure | | | 107 | |
Item 9A. | | Controls and Procedures | | | 107 | |
Item 9B. | | Other Information | | | 107 | |
| | Part III. | | | | |
Item 10. | | Directors, Executive Officers and Corporate Governance | | | 108 | |
Item 11. | | Executive Compensation | | | 108 | |
Item 12. | | Security Ownership of Certain Beneficial Owners and Management and Related Stockholder Matters | | | 108 | |
Item 13. | | Certain Relationships and Related Transactions, and Director Independence | | | 108 | |
Item 14. | | Principal Accountant Fees and Services | | | 108 | |
| | Part IV. | | | | |
Item 15. | | Exhibits and Financial Statement Schedules | | | 108 | |
| | Signatures | | | 118 | |
3
Table of Contents
Part I
Item 1. Business
Unless the context otherwise requires, the terms "Mattress Firm®," "our company," "the Company," "we," "us," "our" and the like refer to Mattress Firm Holding Corp. and its consolidated subsidiaries. Unless otherwise indicated, (i) the term "our stores" refers to our company-operated stores and our franchised stores and (ii) when used in relation to our company, the terms "market" and "markets" refer to the metropolitan statistical area or an aggregation of the metropolitan statistical areas in which we or our franchisees operate.
In this report, we refer to earnings before interest, taxes, depreciation and amortization and other adjustments (such as goodwill impairment charges, loss on store closings and acquisition expenses), or "Adjusted EBITDA." Adjusted EBITDA is not a performance measure under accounting principles generally accepted in the United States, or "U.S. GAAP." See "Item 6. Selected Financial Data" below for a definition of Adjusted EBITDA and a reconciliation of Adjusted EBITDA to net income.
We report on the basis of a 52- or 53-week fiscal year, which ends on the Tuesday closest to January 31. Each fiscal year is described by the period of the calendar year that comprises the majority of the fiscal year period. For example, the fiscal year ended January 29, 2013 is described as "fiscal 2012."Fiscal 2012 contained 52 weeks.
Our Company
We are a leading specialty retailer of mattresses and related products and accessories in the United States. As of January 29, 2013, we and our franchisees operated 1,057 and 158 stores, respectively, primarily under theMattress Firm® name, in 79 markets across 29 states. In 2011, we ranked first among the top 100 U.S. furniture stores for both growth in store count and percentage increase in sales and second in total sales among specialty retailers according toFurniture Today. Based on our analysis of information published to date inFurniture Today and Company data, which gives effect to our recent acquisitions, we believe that, among multi-brand mattress specialty retailers in the United States, we have the largest geographic footprint, the greatest number of stores nationwide and the highest levels of net sales on an aggregate basis. We believe that, in our markets,Mattress Firm® is a highly recognized brand known for its broad selection, superior service and compelling value proposition. Based on our analysis of public store information for our competitors and our Company data, we believe more than 90% of our company-operated stores are located in markets in which we had the number one market share position as of January 29, 2013. Since our founding in 1986 in Houston, Texas, we have expanded our operations across four time zones, with the goal of becoming the premier national mattress specialty retailer. Mattress Firm Holding Corp. is a Delaware corporation incorporated in January 2007 under the name Mattress Interco, Inc. Through a reorganization that occurred in January 2007, Mattress Firm Holding Corp. acquired its consolidated subsidiaries including Mattress Firm, Inc., the primary operating subsidiary.
We believe our destination retail format provides our customers with a convenient, distinctive and enjoyable shopping experience. Key highlights that make us a preferred destination and that differentiate our brand and services include:
- •
- extensive product selection from top name brands;
- •
- contemporary, easy-to-navigate store design utilizing our uniqueComfort By Color® merchandising approach that organizes mattresses by comfort style;
- •
- price, comfort and service guarantees;
- •
- superior customer service by our educated, extensively-trained and commissioned sales associates of whom over 97% are full-time employees;
4
Table of Contents
- •
- Mattress Firm Red Carpet Delivery Service®, which includes a three-hour delivery window; and
- •
- highly visible and convenient store locations in major retail trade areas.
Our stores effectively provide our customers with a convenient "one stop shop" buying experience. We carry a broad assortment of leading national mattress brands and our exclusive brands, both containing a wide range of styles, sizes, price points and unique features. We provide our customers with their choice of traditional mattresses, including Sealy, Stearns & Foster and Simmons, as well as specialty mattresses, such as Tempur-Pedic for which we are the largest retailer in the United States, Serta's iComfort line and Sealy's Optimum line. We also offer a variety of bedding-related products and accessories.
We drive profitability in the markets in which we operate by penetrating a market with stores and leveraging fixed and discretionary costs, such as occupancy and advertising, as we gain sales volume, grow our brand presence and advance our operational scale. We have a proven track record of growing our store base through organic new store openings and acquisitions that typically include rebranding of the acquired stores toMattress Firm®. In fiscal 2012, we generated net sales, Adjusted EBITDA and net income of $1,007.3 million, $121.0 million and $39.9 million, respectively. (See "Item 6. Selected Financial Data" for a definition of Adjusted EBITDA and a reconciliation of Adjusted EBITDA to net income.) From February 3, 2010 to January 29, 2013, we added 640 stores, which included 330 stores added through opportunistic, strategic acquisitions. The majority of these additional stores were located in markets where we had an existing presence, allowing us to increase our advertising spend per person and grow our net sales as well as Adjusted EBITDA at compound annual rates of 26.8% and 28.4%, respectively.
During fiscal 2012, we completed the acquisition of the equity interests in MGHC Holding Corporation (which operated Mattress Giant stores), substantially all of the operations and assets of Mattress XPress, Inc. and Mattress XPress of Georgia, Inc. (which entities operated Mattress X-Press stores), and substantially all of the operations and assets of Factory Mattress & Water Bed Outlet of Charlotte, Inc. (which operated Mattress Source stores). These acquisitions increased our penetration levels in markets in Texas, Florida, Georgia, North Carolina and South Carolina.
We believe we have a compelling opportunity to further penetrate the fragmented specialty retail mattress industry through opportunistic, strategic acquisitions and continue profitable growth into the future.
Business Segments
For financial information about our reportable segments, see Note 1 to Consolidated Financial Statements.
Our Industry
Overall Market
We operate in the U.S. mattress retail market, in which net sales amounted to $11.4 billion in calendar year 2011, the most recent year for which industry retail sales data has been published. The market is highly fragmented, with no single retailer holding more than an 8% market share and the top ten participants accounting for less than 30% of the total market. According toFurniture Today, in 2010, mattress specialty retailers had a market share in excess of 43%, which represented the largest share of the market, having more than doubled their share over the past 15 years.
5
Table of Contents
According to the information released in October 2012 by ISPA, the industry is expected to grow wholesale dollar sales by 6.3% in 2013. We believe that several trends support the positive outlook for long-term growth of the U.S. mattress retail market:
- •
- First, with increased advertising that focuses on the benefits of a better night's sleep, consumers have shown an increasing willingness to spend more money on mattresses and related products that are of a higher quality and provide extra comfort. The average price for a mattress at wholesale has increased from $92 in 1990 to $259 in 2011, representing an average annual growth rate of 5%. This increasing price point trend is primarily the result of: (1) an industry shift towards specialty mattresses, such as foam and air mattresses, which were sold at wholesale for an average of $559 per mattress in 2011 compared to $210 for a traditional innerspring mattress and (2) consumers desiring more expensive innerspring mattresses that have enhanced technology and comfort features.
- •
- Second, there have been recent technological improvements made to mattresses that are leading people to replace their old mattresses. We believeMattress Firm® is at the forefront of these technological changes, as demonstrated by the variety of specialty mattresses we offer. Specialty product sales comprised 32.4%, 45.3% and 50.1% of our net sales for fiscal 2010, fiscal 2011 and fiscal 2012, respectively. Our growth in this area has outpaced that of the mattress retail industry as a whole. For example, our sales of specialty products nearly increased 58% in fiscal 2012 over the prior year compared with an increase of only 30% in the industry during the comparable period.
- •
- Third, as "baby boomers" (which refers in this Annual Report on Form 10-K to people born between 1946 to 1964) age and begin to spend the income that they have saved during their time in the workforce, it is our belief that they will spend a disproportionate amount compared to the overall population on products that improve their comfort—for example, higher-end luxury mattresses and related products.
Distribution Channels
Wholesale. The U.S. wholesale mattress industry, which includes mattresses and their supporting box springs (also referred to as foundations), and as tracked by ISPA, was comprised of a $6.3 billion market in 2011. The U.S. wholesale mattress segment (which excludes foundations) accounted for $5.0 billion of the total and has grown at an average annual rate of 6.0% since 1990. The mattress segment has historically experienced stable growth, as 2008-2009 was the only period in over 30 years during which the segment experienced a multi-year decline in mattress sales. We believe that the industry has the potential to return to its pre-2008 levels, and that we are poised to take advantage of that future growth.
Retail. The U.S. retail mattress market is made up primarily of mattress specialty retailers, furniture retailers and department stores. Retailers compete based on product selection, customer experience, service, price, store location and brand recognition.
- •
- Mattress Specialty Retailers focus primarily on mattresses and related products and accessories and typically have a broader product selection and quicker availability as compared to other mattress retail channels. Consumers have shown a preference to purchase their mattresses in this channel due to the broad merchandise assortment and higher quality service they receive. As a result, this channel has gained considerable market share relative to traditional furniture stores and department stores, having experienced a market share increase from 19% in 1993 to 43% in 2010 (the most recent year for which retail distribution channel data has been published).
- •
- Traditional Furniture Stores typically dedicate a majority of their retail floor space to home furnishings other than mattresses. While this channel comprised the majority of the U.S.
6
Table of Contents
Brand Overview
There are nearly 500 manufacturers in the bedding industry, with the four largest manufacturers, Serta, Sealy, Simmons and Tempur-Pedic, representing approximately 66% of the dollar value of the mattress market in 2011 while the 15 largest manufacturers accounted for approximately 86% during the same period. In recent years, these four primary manufacturers have undergone business combinations. In March 2013, Sealy merged with a subsidiary of Tempur-Pedic and, while continuing to operate as independent companies, Serta and Simmons currently share a controlling stockholder. The effect of these business combinations and further consolidation among manufacturers remains to be seen, but could have an effect on product offerings and pricing. In general, the bedding industry has faced little competition from imported products as a result of the short lead times required by mattress retailers, high shipping costs and relatively low direct labor expenses in mattress manufacturing. Manufacturers sell traditional innerspring products and specialty products across a wide range of styles, sizes, price points and technologies. While conventional mattresses still accounted for approximately 70% of total bedding sales by manufacturers in the United States in 2011, in recent years, specialty mattresses, which use foam and air technology, have grown at a much faster rate than the industry as a whole. In 2011, specialty bedding producer Tempur-Pedic accounted for approximately 14% of total bedding sales. As new research emerged showing the link between proper sleep and good health,Mattress Firm® responded to the growing demand for specialty mattresses by expanding its product selection.
Merchandising
We believe our destination store retail concept provides our customers with a distinctive shopping experience, by offering an extensive assortment of mattresses and bedding-related products, featuring the best known national brands, a strong value proposition and superior service in a conveniently located, comfortable store environment.
Products
We carry over 75 different models and styles of conventional and specialty mattresses across a wide range of price points. We focus on the best-known national brands but also offer our customers ourHampton & Rhodes® private label mattresses and introducedYuMe™, our exclusive, proprietary brand, into select markets. Because of our strong relationships with our key suppliers, we are able to offer our customers many exclusive products that are available only to us, which adds to our competitive differentiation. Periodically, we also carry limited quantities of special/opportunistic buys and ourSuperCenter® stores carry additional special buys as well as clearance and marked-down merchandise. All of the mattresses we purchase are assembled in the United States, and certain bedding-related furniture products are sourced from Asia.
Conventional Mattresses. Conventional mattresses, such as those manufactured by Sealy (includingSealy Posturepedic andStearns & Foster) and Simmons (includingSimmons Beautyrest), utilize steel-coil
7
Table of Contents
innersprings to provide comfort and support. These conventional mattresses represented approximately 70% of bedding industry sales in the United States in 2011 and approximately 42% of our total sales in fiscal 2012. In addition to these national brands, we also offer ourHampton & Rhodes® private label mattresses to provide our customers a greater choice of value among conventional mattresses.
Specialty Mattresses. In recent years, specialty mattresses, such as those manufactured by Tempur-Pedic, utilize materials other than steel-coil innersprings to provide comfort and support. Specialty mattresses have grown at a much faster rate than the industry as a whole, representing approximately 50% of our total net sales in fiscal 2012. In response to this industry trend, we have expanded our assortment of specialty mattresses that utilize viscoelastic foam, also referred to as memory foam, which features a high-density, temperature sensitive foam core that reduces pressure points, and tossing and turning by contouring to one's body. Tempur-Pedic introduced viscoelastic beds in the United States in 1992 and we believe is the leader in the U.S. market for viscoelastic foam mattresses. We carry a wide range of specialty mattresses from Tempur-Pedic, for which we are the largest retailer in the United States, viscoelastic foam products infused with a gel material manufactured by Serta and marketed under the name iComfort, and similar products manufactured by Sealy and marketed under the name Optimum.
Furniture and Accessories. All of our stores carry an assortment of bedding-related furniture and accessories, including bed frames, mattress pads and pillows. Bedding-related furniture and accessories represented approximately 7% of our total sales from company-operated stores in fiscal 2012.
Pricing Strategy
Our strong price and value proposition is a critical element of our merchandise strategy. We strive to provide customers the best possible value in our markets, supported by event driven print, radio and television advertising and promotions, and offer our customers a low price guarantee whereby we will beat our competitor's price on a comparable or identical sleep set by 10% and refund the customer the difference at any time within 100 days after purchase. In addition, we supplement our regular merchandise line-up with special buys and clearance products at ourMattress Firm SuperCenter® stores to reinforce our value proposition and strong price image by offering a wide range of price points from promotional products (such as a $49 twin-size mattress) to luxury products (such as a $9,299 king-size set). As we continue to grow our national presence, we believe this provides us with a stronger position to negotiate more favorable terms with our vendors, creating incremental value for both our customers and our shareholders.
Customer Service
We enhance our customers' shopping experience with a superior level of service. Our sales associates are well-trained in our products and unique comfort testing process, and are empowered to satisfy our customers' comfort, value and service requirements consistent with established company guidelines. Their goal is to simplify the buying process and narrow customer choices to the one that meets the customer's comfort and price needs. They are also trained to explain our comfort satisfaction and price guarantees as well as our third party deferred financing programs and product warranties. We clearly price all of our merchandise and provide our customers with a clear and concise process to select products and pricing.
After-sale service represents an important part of our overall customer service offering. We believe ourMattress Firm Red Carpet Delivery Service®, under which we generally provide same day delivery service within a three-hour delivery window, is distinctive in the industry. We also provide our customers with comfort satisfaction and price guarantees, in addition to a manufacturer's warranty for product defects.
8
Table of Contents
Store Design and Layout
We utilize two store formats: (i) our traditional store format which averages approximately 4,400 square feet and (ii) our largerSuperCenter® store format which averages approximately 6,500 square feet. As of January 29, 2013, we had 855 stores in our traditional store format and 202 stores in ourSuperCenter® store format. Our traditional stores are bright and open and have a warm, contemporary feel. We use wood, ceramic tile and carpet flooring and natural wood fixtures and shutters to create a comfortable, home-like look and feel. Traditional stores feature a Value Zone display area that efficiently conveys a broad assortment of value priced/promotional conventional bedding. In total, we offer over 75 different models and styles of conventional and specialty mattresses across a wide range of price points in our traditional stores conveying category dominance to our customers.
OurSuperCenter® stores incorporate all of the design elements of our traditional stores and also have a specially merchandised warehouse rack area to display our clearance, overstock and returned products. The warehouse rack merchandise display and signage reinforce our value proposition to our customers.
To enhance the customer in-store experience, our stores are designed to be comfortable and easy-to-shop with our uniqueComfort By Color® shopping program. WithComfort By Color®, customers have the opportunity to determine the physical comfort that is best suited for them by comparing the feel of samples for all four different surface comfort options (Firm, Plush, Pillow-top and Specialty) in our Comfort Comparison Center. Each comfort style is assigned a particular color in our stores (Yellow, Orange, Red or Blue/Green), as denoted through bright and colorful pillows and foot protectors on all mattresses. Once customers have "found their comfort," they simply "follow their color," and focus the balance of their selection time on mattresses that fall into one of the particular color-coded comfort options.Comfort By Color® simplifies shopping for customers and makes it easier to train new associates on the store layout.
Our interior and exterior signage is an important element of our store design and selling strategy. We utilize bright banners, highly prominent signage and lifestyle photographs to highlight the important features of each of our products as well as promotional pricing information. We display light boxes, neon signs, and professionally designed promotional posters in our windows to convey our national brand focus and value proposition. Through signage and other promotional materials, we can emphasize our strong relationship with the key mattress manufacturers with whom we do business.
Marketing and Advertising
The primary objective of our marketing program is to drive traffic intoMattress Firm® stores, with our brand promise ofSave Money. Sleep Happy®. With what we believe to be an effective model for achieving strong market penetration, we are able to leverage our advertising spend on a cost effective basis to build our market leadership position and brand awareness.
Message. Our marketing campaign has a three-prong approach to inform and educate customers as to why they should buy, why they should chooseMattress Firm® and why they should "buy now".Replace Every 8® is a proprietary campaign message to capture consumer interest and educate them on the recommended mattress replacement frequency for optimal health and comfort.Sleep Happy™ isMattress Firm's® unique selling proposition to ensure customers are happy with their price, comfort and service. Promotional events to motivate customers to "buy now" include long term financing,All the best brands...All the best prices!® andSide by side before you decide™. These elements combined with our memorable spokespeople and proprietary song offer compelling reasons for consumers to buy fromMattress Firm®.
Media. Our media strategy focuses on building awareness with our target customer to drive market share. Historically, our advertising program consisted primarily of radio and television, with the balance being print. In early fiscal 2008, due to the recessionary downturn in the U.S. economy, we
9
Table of Contents
altered our marketing in light of decreased consumer confidence and traffic trends. For cost effectiveness, we increased our print program and focused primarily on price with limited-time offers. In response to improving economic trends, we increased advertising spend in fiscal 2010, fiscal 2011 and fiscal 2012, resulting in a shift in our media mix to approximately two-thirds broadcast, designed to build greater recognition of theMattress Firm® brand, and emphasize what we believe to be our key competitive strengths. In addition, our online search engine marketing and alternative media presence has increased. We monitor traffic patterns and sales hourly and can impact media changes through our comprehensive model by market to maximize return on investment.
Alternative Media. The primary objective of our social media strategy is to build awareness and engage interaction as the relevant source of information in our industry. We follow online conversations daily and develop engaging content to distribute via our Facebook, Twitter, Blog or YouTube sites. In addition, to exposeMattress Firm® to additional potential consumers across existing markets and drive qualified, invested traffic, we have partnered with Groupon for their "deal of the day" specials. We have successfully targeted new consumers with no advertising costs to drive incremental sales.
Analysis. To ensure focused marketing, we have implemented a targeted market-level media and message program. To maximize the efficiencies and effectiveness of these efforts, we use ShopperTrak, a nationally recognized company that monitors store traffic patterns and sales, which we consider key performance indicators. As of January 29, 2013, we utilized ShopperTrak in approximately 58% of our company-operated stores. We believe that this is a critical component to understanding our advertising program, spotting trends, supporting market-level tests and increasing local market share.
Purchasing and Distribution
Our merchandising team is responsible for all product selection, supplier negotiations, procurement, initial pricing determinations, product marketing plans and promotions, and coordination with local store and distribution center managers to implement our merchandise programs. Our merchandising team also regularly communicates with our field management and franchisees to monitor shifts in consumer preferences and market trends.
We operate 45 distribution centers, supporting all of our company-operated stores. In substantially all of our markets, a single distribution center serves all of the stores in that market. Our four primary suppliers deliver mattresses to most of our distribution centers within 48 hours of order, up to five days per week. We replenish our distribution centers based on the rate of sales, promotions and predetermined stocking levels. Our merchandise is received, inspected and processed at our distribution centers and then delivered to our customers' homes or, to a lesser extent, to our stores. The majority of our sales result in the delivery of product from our distribution centers to our customers' homes. In all but two of our markets, we contract for the delivery of merchandise to our customers; and in two markets, we utilize our own fleet and delivery services.
Supply Agreements
Sealy. We are party to a 2009 product supply agreement with Sealy for the purchase of mattress and foundation products under theSealy andSealy Posturepedic brand names. The agreement, as amended, will terminate upon the later of December 2015 or the time when the specified purchase target is met. The agreement sets forth (i) various annual and quarterly volume-based rebates, (ii) advertising rebates and subsidies, (iii) discounts on the purchase of floor samples, (iv) new store opening funds and support and (v) various pricing, return and payment terms.
Serta. We are party to a 2011 product supply agreement with Serta for the purchase of mattress and related bedding products under theSerta brand names. The agreement will terminate when the specified purchase target is met. The agreement sets forth (i) various monthly volume-based rebates,
10
Table of Contents
(ii) advertising rebates and subsidies, (iii) discounts on the purchase of floor samples, (iv) new store opening funds and support and (v) various pricing, return and payment terms.
Simmons. We are party to a 2010 dealer incentive agreement with Simmons that expires in June 2013. This agreement provides us with (i) volume-based purchase incentives and rebates, (ii) point of purchase materials, (iii) discounts on the purchase of floor samples, (iv) direct reimbursement of sales and marketing expenses, (v) new store opening funds, (vi) certain pricing and payment terms and (vii) return and delivery policies.
Tempur-Pedic. We are party to a 2012 retailer agreement with Tempur-Pedic, which sets forth the general terms of purchase transactions we may enter into with Tempur-Pedic relating to, among other things, (i) indemnification, (ii) representation of Tempur-Pedic products in our stores and (iii) product warranties. The agreement may be supplemented from time to time by the terms of any Business Development Program offered by Tempur-Pedic in which we participate.
Retail Store Operations
The principal objective of our store operations program is to provide our guests with what we believe is a superior level of customer service by staffing our stores with knowledgeable and enthusiastic sales associates, and proficiently training those associates to satisfy customers' needs while achieving store performance objectives.
Field Management Organization and Store Staffing. Our store operations are centralized, with corporate-level guidelines providing for chain-wide consistency, while still allowing store level flexibility to meet our customers' value and service requirements. As of January 29, 2013, we employed 240 area managers, 22 market managers, 99 district managers and 17 regional sales managers, who, in conjunction with our corporate recruiting and training department, are responsible for the hiring and training of store associates, assistant managers and store managers. Our training and communications programs are designed to ensure chain-wide consistency of merchandise presentation, communicate corporate information to stores and monitor sales and profit performance. In addition, our district and area managers are primarily responsible for developing store managers, assistant managers and sales associates for succession and career development opportunities.
Each store is staffed with one store manager and the appropriate number of associates, depending on the sales volume of the store. Store managers are responsible for maintaining visual merchandise presentations, ensuring the cleanliness and orderliness of the store and achieving store performance targets.
Recruiting and Training. We attempt to recruit sales associates and store managers who are (i) highly motivated, (ii) goal oriented and (iii) opportunistic of the career development opportunities we offer. Our recruitment portfolio includes an employee referral program, campus recruitment at select colleges and universities, and targeted recruiting in local markets for candidates who have relevant retail or consumer product experience. All of our sales associates attend our extensive internal training program, participate in product training sessions provided by vendors, and enroll in our online corporate university for extended learning and development opportunities. This unique training program emphasizes product knowledge, selling skills, and store operations fundamentals. Our sales associates are trained to explain our comfort satisfaction and price guarantees as well as our third-party financing programs and product warranties. They are also empowered to satisfy our customers' comfort, value and service requirements consistent with established company guidelines. Our corporate and field training function is responsible for (i) developing and providing new-hire training, (ii) advanced training and in-store new product training, and (iii) coordinating the implementation of our store assessment program, which measures the effectiveness and consistency of our selling process, in-store promotions, cleanliness and overall customer experience. The store assessment program also serves as an additional educational tool for our sales associates.
11
Table of Contents
We have internally developed a proprietary, best-practice video network for all sales associates called Project 180. Project 180 complements our training efforts by allowing associates to view and contribute to "how-to" videos posted by peer associates offering practical tips and best-practice considerations for particular product-related or general selling concepts. With an active library of approximately 500 videos, this informal social learning tool has quickly become a high-impact staple in our training portfolio.
Compensation. We believe that our store associate compensation structure encourages competition and creates an incentive to sell. The compensation structure for our store associates is commission-based. In addition to a base draw against commissions, our sales associates can earn incentive bonuses based on store performance. All of our field management (regional managers, district managers and distribution center managers) earn a base salary and are eligible for incentive bonuses based on certain individual performance criteria.
Franchise Operations
As of January 29, 2013, our 12 franchisees operated 158 stores in 28 markets. In fiscal 2012, we received $5.4 million in franchise fees and royalty income from our franchisees. We grant franchises by territory, and have granted more than one franchise territory to some of our franchisees. Although we have franchises in the Denver, Colorado and Milwaukee, Wisconsin markets, most of our current franchises are located in markets with a population of less than 1.5 million people. We believe we are diligent in our selection of our franchisees, putting them through multiple vetting processes to ensure they are capable of operating the business at a high level.
Our franchise agreements typically give franchisees the exclusive right to operateMattress Firm® stores in a specified territory and generally contain a 20 or 30 year term, and generally include a renewal option for the franchisee ranging from a 5 to 10 year period, subject to certain conditions. The franchisees are required to pay an initial fee each time they open a store. In addition, the franchisees also pay us royalties based on gross sales. The agreements require franchisees to operate their businesses in accordance with our standard operating procedures, including specifications for the appearance, floor plans, signage, fixtures, displays, staffing and operations of stores. The agreements generally require franchisees to provide us with quarterly profit and loss statements, so that we can monitor their ongoing performance and proactively identify any trouble areas. We generally have the right to inspect and audit their books and records at any time during business hours. During the term of the franchise agreement and subject to certain geographic limitations, for three years after termination of the franchise agreement, franchisees may not operate, directly or indirectly, any other business selling bedding products or furniture. In exchange, we provide franchisees with our standard operations manual, sales training, print advertising materials, and assistance in selecting store sites. We also have a right of first refusal on the sale of each franchise and/or its equipment and inventory and, in certain instances, options to purchase the franchisee's business at a predetermined time and purchase price.
Retail Stores and Markets
Site Selection
Our site selection strategy is to select or develop premium locations, which maximize our sales per store. We select geographic markets and store sites on the basis of (i) demographics, (ii) quality of neighboring tenants, (iii) store visibility and signage opportunities, (iv) accessibility and (v) lease economics. Key demographics include population density, household income and growth rates. We also utilize relative market share analyses to determine the likelihood of becoming the market leader in each market we serve within a certain period of time.
12
Table of Contents
Our internal real estate group identifies opportunities for new and relocated stores with the involvement of our senior executives. We also contract with third party real estate brokers in each of our markets to identify sites and negotiate lease details. We prefer to develop freestanding units located in high traffic power centers with major retailers, such as Target, or other specialty and home furnishings retailers, such as Bed Bath & Beyond, Best Buy, Costco, Dick's Sporting Goods, The Home Depot and Whole Foods. If a free-standing unit or site is unavailable, we prefer to locate our in-line stores on the end of the shopping center for greater visibility.
Hours
Our stores are open 362 days a year, seven days a week, generally from 10:00 a.m. to 8:00 p.m. Monday through Saturday and 12:00 p.m. to 6:00 p.m. on Sunday.
Seasonality
Our business is subject to seasonal fluctuation, with the highest sales activity normally occurring during the second and third quarters of our fiscal year primarily due to a concentration of summer season holidays, including Memorial Day, the Fourth of July and Labor Day. While we expect this trend to continue for the foreseeable future, we also expect that the timing of new store openings and the acquisitions we have or may make and the timing of those acquisitions may have some effect on the impact of these seasonal fluctuations.
Trademarks and Service Marks
We own or have rights to use the trademarks, service marks and trade names that we use in conjunction with the operation of our business. The most important trademarks we own or have rights to use include "Mattress Firm®," "Comfort By Color®," "Mattress Firm Red Carpet Delivery Service®," "Hampton & Rhodes®," "YuMe™," "Mattress Firm SuperCenter®," "Happiness Guarantee®," "Replace Every 8®," "Save Money. Sleep Happy®," "Sleep Happy™," "Dream It's Possible®," "Side by side before you decide™," "Nobody Sells for Less, Nobody!™" and "All the best brands...All the best prices!®." We believe that our trademarks, service marks and trade names have significant value and that some of our trademarks are instrumental in our ability to drive traffic intoMattress Firm® stores.
Information Systems
We have been using the General Electric Retail Systems ("GERS") since May 2004. This system provides sales tracking, inventory management, financial reporting and warehouse management capabilities. Due to current and planned store growth, the version of GERS that we currently utilize is approaching its maximum capacity. We are in the process of implementing Microsoft Dynamics AX for Retail ("Microsoft AX") as a replacement to GERS. We believe Microsoft AX will provide the similar core functionality of GERS with the added ability to support our growth strategy. We completed the implementation of the general ledger and related financial modules of Microsoft AX in April 2012, and completed the pilot market implementation of the point-of-sale and supply chain functionality in December 2012. We will continue to implement the Microsoft AX point-of-sale and supply chain functionality to the remainder of our markets throughout fiscal 2013.
We use components of the Microsoft Business Intelligence suite for data warehousing. This provides access to information from various data sources across the organization through interactive, content-driven dashboards and scorecards that combine data from multiple systems into a single browser-based experience. We also have the capability to produce sales, financial and analytical reports.
We have an e-commerce solution which integrates with GERS. This allows our customers to shop on the internet, purchase products and schedule in-home delivery nationwide. Our website also utilizes
13
Table of Contents
social media to build a community of customers and interactive chat to improve the customer's internet experience.
Our stores, distribution centers and corporate office are all connected by a secure Virtual Private Network, or "VPN," which enables us to take advantage of the cost efficiencies of the internet without compromising data security. The infrastructure that facilitates our VPN is housed in both secure off-site and on-site locations. We leverage our VPN to route our sales transactions, customer third party financing and funding through this communications network.
Employees
As of January 29, 2013, we had approximately 3,340 employees, substantially all of whom were employed by us on a full-time basis. None of our employees are covered by a collective bargaining agreement. We have not experienced any work stoppages, and we consider our relations with our employees to be good.
We were recently recognized on a national level as the 7th top workplace inWorkplace Dynamics' "Top 150—National Top Workplaces 2013" list.
Government Regulation
We believe that we are in compliance in all material respects with the laws to which we are subject. In particular, our business subjects us to regulation in the following areas:
Regulations relating to consumer protection and the bedding industry. Our operations are subject to federal, state and local consumer protection regulations and other regulations relating specifically to the bedding industry. These regulations vary among the states where we operate, but generally impose requirements as to (i) the proper labeling of bedding merchandise, (ii) restrictions regarding the identification of merchandise as "new" or otherwise, (iii) controls as to hygiene and other aspects of product handling, and (iv) sale and penalties for violations. We also are subject to a standard established by the U.S. Consumer Product Safety Commission, which sets mandatory national fire performance criteria for all mattresses sold in the United States on or after July 1, 2007.
Franchise laws and regulations. We are also subject to Federal Trade Commission (FTC) regulations and various state laws regulating the offer and sale of franchises. The FTC and various state laws require us to furnish to prospective franchisees a franchise disclosure document containing prescribed information. Unless an exemption applies, certain states require registration of a franchise offering circular or a filing with state authorities. Substantive state laws that regulate the franchisor-franchisee relationship presently exist in a substantial number of states, and bills have been introduced in the U.S. Congress from time to time which provide for federal regulation of the franchisor-franchisee relationship in certain respects. The state laws often limit, among other things, the duration and scope of non-competition provisions and the ability of a franchisor to terminate or refuse to renew a franchise. The failure to comply with these laws and regulations in any jurisdiction or to obtain required government approvals could result in a ban or temporary suspension on future franchise sales, fines, other penalties, or require us to make offers of rescission or restitution, any of which could adversely affect our business and operating results.
Available Information
The Company maintains an Internet website athttp://www.mattressfirm.com where our Annual Reports on Form 10-K, Quarterly Reports on Form 10-Q, Current Reports on Form 8-K, proxy statement and other documents and all amendments to those reports and documents are available without charge, as soon as reasonably practicable following the time they are filed with, or furnished to, the SEC. References to the Company's website address do not constitute incorporation by reference of
14
Table of Contents
the information contained on the website, and the information contained on the website is not part of this document.
The public may read and copy any materials that the Company files with the SEC at the SEC's Public Reference Room at 100 F Street, NE, Washington, DC 20549. The public may obtain information on the operation of the Public Reference Room by calling the SEC at 1-800-SEC-0330. Also, the SEC maintains an Internet website that contains reports, proxy and information statements, and other information regarding issuers, including the Company, that file electronically with the SEC. The public can obtain any documents that the Company files with the SEC athttp://www.sec.gov.
Item 1A. Risk Factors
Our financial performance is subject to various risks and uncertainties. The risks described below are those which we believe are the material risks we face. Any of the risk factors described below could significantly and adversely affect our business, prospects, sales, gross profit, cash flows, financial condition and results of operations.
Risks Related to Our Business
Our business is dependent on general economic conditions in our markets.
Our sales depend, in part, on discretionary spending by our customers. Pressure on discretionary income brought on by economic downturns and slow recoveries, including housing market declines, rising energy prices, fiscal uncertainty and weak labor markets, may cause consumers to reduce the amount they spend on discretionary items. If recovery from any economic downturn is slow or prolonged, our growth, prospects, results of operations, cash flows and financial condition could be adversely impacted. General economic conditions and discretionary spending are beyond our control and are affected by, among other things:
- •
- consumer confidence in the economy;
- •
- unemployment trends;
- •
- consumer debt levels;
- •
- consumer credit availability;
- •
- the housing market;
- •
- gasoline and fuel prices;
- •
- interest rates and inflation;
- •
- price deflation, which may result from the introduction of low-cost imports;
- •
- slower rates of growth in real disposable personal income;
- •
- natural disasters;
- •
- national security concerns;
- •
- tax rates and tax policy; and
- •
- other matters that influence consumer confidence and spending.
Increasing volatility in financial markets may cause some of the above factors to change with an even greater degree of frequency and magnitude.
15
Table of Contents
Our ability to grow and remain profitable may be limited by direct or indirect competition in the retail bedding industry, which is highly competitive.
The retail bedding industry in the United States is highly competitive. Participants in the bedding industry compete primarily based on store location, service, price, product selection, brand name recognition and advertising. There can be no assurance that we will be able to continue to compete favorably with our competitors in these areas. Our store competitors include regional and local specialty retailers of bedding (such as Sleepy's and Sleep Train), national and regional chains of retail furniture stores carrying bedding (such as Ashley Furniture, Haverty's and Rooms-To-Go), department store chains with bedding departments (such as Macy's, Sears and JC Penney), big box retailers (such as Wal-mart), warehouse clubs (such as Costco) and factory direct stores (such as Original Mattress). Additionally, retail furniture stores may open retail locations specifically targeted for specialty bedding as a way to directly compete with us and other specialty retailers. In the past, we have faced periods of heightened competition that materially affected our results of operations. Certain of our competitors have substantially greater financial and other resources than us. Accordingly, we may face periods of intense competition in the future that could have a material adverse effect on our planned growth and future results of operations. In addition, the barriers to entry into the retail bedding industry are relatively low. New or existing bedding retailers could enter our markets and increase the competition we face. In addition, manufacturers and vendors of mattresses and related products, including those whose products we currently sell, have entered the U.S. mattress retail market and now directly compete with us. Competition in existing and new markets may also prevent or delay our ability to gain relative market share. Any of the developments described above could have a material adverse effect on our planned growth and future results of operations.
If we fail to successfully manage the challenges our planned growth poses or encounter unexpected difficulties during our expansion, our net sales and profitability could be materially adversely affected.
One of our central long term objectives is to increase sales and profitability through market share leadership. Our ability to achieve market share leadership, however, is contingent upon our ability to (i) open stores in favorable locations, (ii) advertise our stores in an effective and cost-efficient manner and (iii) achieve operating results in new stores at the same level as our similarly situated current stores. There can be no assurance, however, that we will be able to open stores in new markets as required to achieve market leadership in such markets, identify and obtain favorable store sites, arrange favorable leases for stores or obtain governmental and other third-party consents, permits and licenses needed to open or operate stores in a timely manner, train and hire a sufficient number of qualified managers for new stores, attract a strong customer base and create brand familiarity in new markets, or successfully compete with established mattress stores in the new markets we enter. Moreover, if we are unable to open an adequate number of stores in a market, or if store-level profitability is lower than expectations, we may be unable to achieve the market presence necessary to justify the considerable expense of radio or television advertising and could be forced to rely upon less effective advertising mediums. Failure to open stores in favorable locations or to advertise in an effective and cost-efficient manner could place us at a competitive disadvantage as compared to retailers who were more adept than us at managing these challenges, which, in turn, could negatively affect our overall operating results.
16
Table of Contents
Our comparable-store sales and results of operations fluctuate due to a variety of economic, operating, industry and environmental factors and may not be fair indicators of our performance.
Our comparable-store sales and operating results have experienced fluctuations, which can be expected to continue. Numerous factors affect our comparable-store sales results, including among others, the timing of new and relocated store openings, the relative proportion of new and relocated stores to mature stores, cannibalization resulting from the opening of new stores in existing markets, the acquisition and rebranding of competitors' stores in existingMattress Firm® markets (including the timing of such acquisitions), changes in advertising and other operating costs, the timing and level of markdowns, changes in our product mix, weather conditions, retail trends, the retail sales environment, economic conditions, inflation, the impact of competition and our ability to execute our business strategy efficiently. As a result, comparable-store sales and operating results may fluctuate, and may cause the price of our common stock to fluctuate significantly. Therefore, we believe period-to-period comparisons of our results may not be a fair indicator of, and should not be relied upon as a measure of, our operating performance.
We intend to aggressively open additional stores in our existing markets, which may diminish sales in our existing stores in those markets and strain our ability to find qualified personnel or divert resources from our existing stores, negatively affecting our overall operating results.
Pursuant to our expansion strategy, we intend to aggressively open additional stores in our existing markets, whether through organic growth or acquisitions, including relocations of existing stores. Because our stores typically draw customers from their local areas, additional stores may draw customers away from nearby existing stores and may cause our comparable-store sales performance and customer counts at those existing stores to decline, which may adversely affect our overall operating results. In addition, our ability to open additional stores or convert and maintain acquired stores will be dependent on our ability to promote and/or recruit enough qualified field managers, store managers, assistant store managers and sales associates. The time and effort required to train and supervise a large number of new managers and associates and integrate them into our culture may divert resources from our existing stores. If we are unable to profitably open additional stores or convert and maintain acquired stores in existing markets and limit the adverse impact of those new or acquired stores on existing stores, it may reduce our comparable-store sales and overall operating results during the implementation of our expansion strategy.
Our expansion strategy will be dependent upon, and limited by, the availability of adequate capital.
Our expansion strategy will require additional capital for, among other purposes, opening new stores and entering into new markets. Such capital expenditures will include (i) researching real estate and consumer markets, (ii) lease, inventory, property and equipment costs, (iii) integration of new stores and markets into company-wide systems and programs and (iv) other costs associated with new stores and market entry expenses and growth. If cash generated internally is insufficient to fund capital requirements, or if funds are not available under our existing credit facility, we will require additional debt or equity financing. Adequate financing may not be available or, if available, may only be available on unfavorable terms. In addition, our debt agreements provide a limit on the amount of capital expenditures we may make annually. If we fail to obtain sufficient additional capital in the future or we are unable to make capital expenditures under our debt agreements, we could be forced to curtail our expansion strategies by reducing or delaying capital expenditures relating to new stores and new market entry. As a result, there can be no assurance that we will be able to fund our current plans for the opening of new stores or entry into new markets. Additionally, we expect to use cash generated internally to fund the purchase price of acquisitions that align with our expansion strategy. As a result, the available cash resources will be limited for other capital expenditures such as inventory, property and equipment costs. You may disagree with the purchase price we agree to pay or the use of cash for
17
Table of Contents
acquisitions. If we fail to obtain sufficient capital to offset the use of cash for acquisitions, or if we are unable to realize a value from an acquisition sufficient to justify the purchase price we paid, other capital expenditures could be delayed and our overall operating results could be adversely affected.
We may from time to time acquire complementary businesses, including operations of our franchisees, which will subject us to a number of risks.
Any acquisitions we may undertake involve a number of risks, including:
- •
- failure of the acquired businesses to achieve the results we expect;
- •
- potential comparable-store sales declines as a result of sales culture integration challenges and conversion of acquired stores to theMattress Firm® brand;
- •
- diversion of capital and management attention from operational matters;
- •
- our inability to retain key personnel of the acquired businesses;
- •
- risks associated with unanticipated events or liabilities;
- •
- the potential disruption and strain on our existing business and resources that could result from our planned growth and continuing integration of our acquisitions; and
- •
- customer dissatisfaction or performance problems at the acquired businesses.
For example, during fiscal 2012, we acquired all of the equity interests of MGHC Holding Corporation (which operated Mattress Giant stores), 34 Mattress X-Press stores and 27 Mattress Source stores. If we are unable to fully integrate or successfully manage any business that we acquire, such as the operations of MGHC Holding Corporation or the Mattress X-Press or Mattress Source stores, we may not realize anticipated cost savings, improved efficiencies or revenue growth, which may result in reduced profitability or operating losses. In addition, we may face competition for acquisition candidates, which may limit the number of acquisition opportunities and may lead to higher acquisition prices. Moreover, acquisitions of businesses may require the issuance of additional equity financing, which would result in the dilution of our existing shareholder base. The realization of all or any of the risks described above could materially and adversely affect our reputation and our results of operations.
A deterioration in our relationships with, or a deterioration of the brand images of, our primary suppliers could adversely affect our brand and customer satisfaction and result in reduced sales and operating results.
We currently rely on Sealy, Simmons, Serta and Tempur-Pedic as our primary suppliers of branded mattresses. Purchases of products from these four manufacturers accounted for 78% of our mattress product costs for fiscal 2012. Because of the large volume of our business with these manufacturers and our use of their branding in our marketing initiatives, our success depends on the continued popularity and reputation of these manufacturers. Any (i) deterioration of their brand image, (ii) reduction in vendor incentives, (iii) adverse change in our relationship with any of them or (iv) an adverse change in their financial condition, production efficiency, product development or marketing capabilities could adversely affect our own brand and the level of our customers' satisfaction, among other things, which could result in reduced sales and operating results.
We use Corsicana as a primary supplier of our private label mattresses, which accounted for 17% of our mattress product costs for fiscal 2012. If our relationships with Sealy, Simmons, Serta, Tempur-Pedic or Corsicana are terminated or otherwise impaired, or if any of them materially increase their prices, it could have a material adverse effect on our business and financial condition.
18
Table of Contents
We depend on a number of suppliers, and any failure by any of them to supply us with products may impair our inventory and adversely affect our ability to meet customer demands, which could result in a decrease in net sales.
Through our operating subsidiaries, we maintain supply agreements with Sealy, Simmons, Serta, Tempur-Pedic and Corsicana, among others. Our current suppliers may not continue to sell products to us on acceptable terms or at all, and we may not be able to establish relationships with new suppliers to ensure delivery of products in a timely manner or on terms acceptable to us. We may not be able to acquire desired merchandise in sufficient quantities on terms acceptable to us in the future. We are also dependent on suppliers for assuring the quality of merchandise supplied to us. Our inability to acquire suitable merchandise in the future or the loss of one or more of our suppliers and our failure to replace them may harm our relationship with our customers and our ability to attract new customers, resulting in a decrease in net sales.
Certain of our suppliers have proposed business combinations, which may reduce product offerings and increase pressures on pricing.
We rely on a limited number of primary suppliers. The consolidation of two or more of these suppliers may reduce the number of products offered as the combined entity re-evaluates redundant product lines. Additionally, business combinations may increase the prices that we pay for the products in order to offset costs or otherwise take advantage of the suppliers' more significant position in the industry. We may not be able to pass any price increases on to our customers or indentify and obtain additional products to supplement our product offerings, which may have an adverse affect on our results of operation.
If customers are unable to obtain third-party financing at acceptable rates, sales of our products could be materially adversely affected.
We offer financing to consumers through third party consumer finance companies. In fiscal 2012, approximately 36% of sales were financed through third party consumer finance companies, and we plan to continue to offer such financing services. Our business is affected by the availability and terms of financing to customers. During much of the fourth quarter of fiscal 2008 and continuing into fiscal 2009, we experienced significantly lower credit approval rates for our customers. Sales results were negatively affected as a result. Another reduction of credit availability to our customers could have a material impact on our results of operations.
We may not be able to successfully anticipate consumer trends and our failure to do so may lead to loss of consumer acceptance of the products we sell, resulting in reduced net sales.
Our success depends on our ability to anticipate and respond to changing trends and consumer demands in a timely manner. If we fail to identify and respond to emerging trends, consumer acceptance of the merchandise we sell and our image with current or potential customers may be harmed, which could reduce our net sales. For example, we have responded to the trend in favor of specialty bedding products and sleep systems, such as viscoelastic foam mattresses, by entering into new arrangements with suppliers and reallocating store display space without certainty of success or that existing relationships with conventional mattress suppliers will not be jeopardized. Additionally, if we misjudge market trends, we may significantly overstock unpopular products and be forced to take significant inventory markdowns, which would have a negative impact on our gross profit and cash flow. Conversely, shortages of models that prove popular could also reduce our net sales.
19
Table of Contents
We depend on a few key employees, and if we lose the services of certain of our principal executive officers, we may not be able to run our business effectively.
Our future success depends in part on our ability to attract and retain key executive, merchandising, marketing and sales personnel. Our executive officers include Steve Stagner, our President and Chief Executive Officer, Steve Fendrich, our Chief Strategy Officer, and Jim Black, our Executive Vice President and Chief Financial Officer. We have an employment agreement with each of Messrs. Stagner, Fendrich and Black. If any of these executive officers cease to be employed by us, we would have to hire additional qualified personnel. Our ability to successfully hire other experienced and qualified executive officers cannot be assured and may be difficult because we face competition for these professionals from our competitors, our suppliers and other companies operating in our industry. As a result, the loss or unavailability of any of our executive officers could have a material adverse effect on us.
Our substantial debt could adversely affect us, make us more vulnerable to adverse economic or industry conditions and prevent us from fulfilling our debt obligations or from funding our expansion strategy.
We have a substantial amount of debt outstanding. As of January 29, 2013, we had $253.0 million of total indebtedness, consisting primarily of $247.7 million outstanding under the credit agreement with UBS Securities LLC and certain of its affiliates and other lenders entered into by Mattress Holding Corp., an indirect subsidiary of ours, as amended on November 5, 2012 (the "2012 Senior Credit Facility"). Our substantial indebtedness could have serious consequences, such as:
- •
- limiting our ability to obtain additional financing to fund our working capital, capital expenditures, debt service requirements, expansion strategy or other purposes;
- •
- placing us at a competitive disadvantage compared to competitors with less debt;
- •
- increasing our vulnerability to, and reducing our flexibility in planning for, adverse changes in economic, industry and competitive conditions; and
- •
- increasing our vulnerability to increases in interest rates because borrowings under the 2012 Senior Credit Facility are subject to variable interest rates.
The potential consequences of our substantial indebtedness make us more vulnerable to defaults and place us at a competitive disadvantage. A substantial or extended increase in interest rates could significantly affect our cash available to make scheduled payments on the 2012 Senior Credit Facility or to fund our expansion strategy.
We may be unable to generate sufficient cash to service all of our indebtedness and other liquidity requirements and may be forced to take other actions to satisfy such requirements, which may not be successful.
We will be required to repay borrowings under the revolving portion of our 2012 Senior Credit Facility on January 18, 2015 and our term loan on January 18, 2014 and January 18, 2016. Our ability to make payments on and to refinance our indebtedness and to fund planned capital expenditures will depend on our ability to generate cash in the future. This, to a certain extent, is subject to general economic, financial, competitive, legislative, regulatory and other factors that are beyond our control.
Our debt agreements contain restrictions that limit our flexibility in operating our business.
The 2012 Senior Credit Facility contains negative covenants that limit our ability to engage in specified types of transactions. These covenants limit our ability and the ability of our restricted subsidiaries to, among other things:
20
Table of Contents
- •
- create liens;
- •
- engage in mergers or consolidations;
- •
- sell assets (including pursuant to sale and leaseback transactions);
- •
- pay dividends and distributions or repurchase our capital stock;
- •
- make investments, acquisitions, loans or advances;
- •
- make capital expenditures;
- •
- repay, prepay or redeem certain indebtedness;
- •
- engage in certain transactions with affiliates;
- •
- enter into agreements limiting subsidiary distributions;
- •
- enter into agreements limiting the ability to create liens;
- •
- amend material agreements governing certain indebtedness; and
- •
- change our lines of business.
A breach of any of these covenants could result in an event of default under the 2012 Senior Credit Facility. Upon the occurrence of an event of default under the 2012 Senior Credit Facility, the lenders could elect to declare all amounts outstanding under such facility to be immediately due and payable and terminate all commitments to extend further credit, or seek amendments to our debt agreements that would provide for terms more favorable to such lenders and that we may have to accept under the circumstances. If we were unable to repay those amounts, the lenders under the 2012 Senior Credit Facility could proceed against the collateral granted to them to secure that indebtedness. We have pledged a significant portion of our assets as collateral under the 2012 Senior Credit Facility. If the lenders under the 2012 Senior Credit Facility accelerate the repayment of borrowings, we cannot guarantee that we will have sufficient assets to repay the 2012 Senior Credit Facility.
If we fail to hire, train and retain qualified managers, sales associates and other employees our superior customer service could be compromised and we could lose sales to our competitors.
A key element of our competitive strategy is to provide product expertise to our customers through our extensively trained, commissioned sales associates. If we are unable to attract and retain qualified personnel and managers as needed in the future, including qualified sales personnel, our level of customer service may decline, which may decrease our net sales and profitability.
Our future growth and profitability will be dependent in part on the effectiveness and efficiency of our advertising expenditures.
Our advertising expenditures, which are the largest component of our sales and marketing expenses, are expected to continue to increase for the foreseeable future. A significant portion of our advertising expenditures are made in the higher cost radio and television formats. We cannot assure you that our planned increases in advertising expenditures or the advertising message that we select will result in increased customer traffic, sales, levels of brand name awareness or market share or that we will be able to manage such advertising expenditures on a cost-effective basis. Should we fail to realize the anticipated benefits of our advertising program, or should we fail to effectively manage advertising costs, this could have a material adverse effect on our growth prospects and profitability.
21
Table of Contents
Our operating results are seasonal and subject to adverse weather and other circumstances, the occurrence of which during periods of expected higher sales may result in disproportionately reduced sales for the entire year.
We historically have experienced and expect to continue to experience seasonality in our net sales and net income. We generally have experienced more sales and a greater portion of income during the second and third quarters of our fiscal year due to a concentration of holidays such as Memorial Day, the Fourth of July and Labor Day occurring in the summer and a higher number of home sales occurring in autumn. Over the past five fiscal years, (i) the second fiscal quarter generated 26.0% of our net sales, (ii) the third fiscal quarter generated 26.7% of our net sales and (iii) the other fiscal quarters generated 47.3% of our net sales. We expect this seasonality to continue for the foreseeable future. Any decrease in our second or third quarter sales, whether because of adverse economic conditions, a slowdown in home sales, adverse weather conditions, timing of holidays or acquisitions within our quarters or other unfavorable circumstances, could have a disproportionately adverse effect on net sales and operating results for the entire fiscal year.
If we are unable to renew or replace our current store leases or if we are unable to enter into leases for additional stores on favorable terms, or if one or more of our current leases are terminated prior to expiration of their stated term and we cannot find suitable alternate locations, our growth and profitability could be negatively impacted.
We currently lease all but one of our store locations. Many of our current leases provide for our unilateral option to renew for several additional rental periods at specific rental rates. Our ability to re-negotiate favorable terms on an expiring lease or to negotiate favorable terms for a suitable alternate location, and our ability to negotiate favorable lease terms for additional store locations could depend on conditions in the real estate market, competition for desirable properties, our relationships with current and prospective landlords or on other factors that are not within our control. Any or all of these factors and conditions could negatively impact our growth and profitability.
Because our stores are generally concentrated in the Gulf Coast and Southeast regions of the United States, we are subject to regional risks.
We have a high concentration of stores in the Gulf Coast and Southeast regions. We therefore have exposure to these local economies as well as weather conditions and natural disasters occurring in these regions, including hurricanes, tornadoes and other natural disasters. If these markets individually or collectively suffer an economic downturn or other significant adverse event, there could be an adverse impact on our comparable-store sales, net sales and profitability and our ability to implement our planned expansion program. Any natural disaster or other serious disruption in these markets due to fire, tornado, hurricane or any other calamity could damage inventory and could result in decreased sales.
Our results may be adversely affected by fluctuations in raw material and energy costs.
Our results may be affected by the prices of the components and raw materials used in the manufacture of the mattress products and accessories we sell. These prices may fluctuate based on a number of factors beyond our control, including: oil prices and other energy related costs, changes in supply and demand, general economic conditions, labor costs, competition, import duties, tariffs, currency exchange rates and government regulation. These fluctuations may result in an increase in our transportation costs for distribution, utility costs for our retail stores and overall costs to purchase products from our vendors.
We may not be able to adjust the prices of our products, especially in the short-term, to recover these cost increases in raw materials and energy. A continual rise in raw material and energy costs
22
Table of Contents
could adversely affect consumer spending and demand for our products and increase our operating costs, both of which could have a material adverse effect on our financial condition and results of operations.
We are subject to government regulation and audits from various taxing authorities, which could impose substantial costs on our operations or reduce our operational flexibility.
Our products and our marketing and advertising programs are and will continue to be subject to regulation in the U.S. by various federal, state and local regulatory authorities, including the Federal Trade Commission. Compliance with these regulations may have an adverse effect on our business. In addition, our operations are subject to federal, state and local consumer protection regulations and other laws relating specifically to the bedding industry. For example, U.S. Consumer Product Safety Commission has adopted rules relating to fire retardancy standards for the mattress and pillow industry. State and local bedding industry regulations vary among the states in which we operate but generally impose requirements as to the proper labeling of bedding merchandise, restrictions regarding the identification of merchandise as "new" or otherwise, controls as to hygiene and other aspects of product handling, sales and resales and penalties for violations. We and/or our suppliers may be required to incur significant expense to the extent that these regulations change and require new and different compliance measures. For example, new legislation aimed at improving the fire retardancy of mattresses or regulating the handling of mattresses in connection with preventing or controlling the spread of bed bugs could be passed, which could result in product recalls or in a significant increase in the cost of operating our business. In addition, failure to comply with these various regulations may result in penalties, the inability to conduct business as previously conducted or at all, and/or adverse publicity, among other things.
We are also subject to Federal Trade Commission and state laws regarding the offering of franchises and their operations and management. State franchise laws may delay or prevent us from terminating a franchise or withholding consent to renew or transfer a franchise. We may, therefore, be required to retain an underperforming franchise and may be unable to replace the franchise, which could have an adverse effect on franchise revenues. Although we believe that we are in compliance with these bedding industry and franchise regulations, we may be required in the future to incur expense and/or modify our operations in order to ensure such compliance.
We are also subject to audits from various taxing authorities. Changes in tax laws in any of the multiple jurisdictions in which we operate, or adverse outcomes from tax audits that we may be subject to in any of the jurisdictions in which we operate, could result in an unfavorable change in our effective tax rate, which could have an adverse effect on our business and results of our operations.
We are subject to varying, inconsistent laws and regulations of state and local jurisdictions, which could result in penalties and other costs if we are unable to establish and maintain compliance efficiently.
As we expand our operations into new markets, we will be subject to tax and employee-related laws and regulations imposed by multiple state and local jurisdictions. Often these laws and regulations vary by jurisdiction and may not conform to our existing tax, payroll and other practices. We will be required to spend time and resources to identify any such laws and regulations, and establishing compliance may distract management or make our other processes and practices less efficient. If we are unable to efficiently identify, monitor and comply with these varying laws and regulations, penalties, fines and other costs may be imposed on the Company and our relationship with certain of our employees could be threatened, each of which could have an adverse effect on our business and results of operations.
23
Table of Contents
Our success is highly dependent on our ability to provide timely delivery to our customers, and any disruption in our delivery capabilities or our related planning and control processes may adversely affect our operating results.
An important part of our success is due to our ability to deliver mattresses and bedding-related products quickly to our customers. This in turn is due to our successful planning and distribution infrastructure, including merchandise ordering, transportation and receipt processing, and the ability of our suppliers to meet our distribution requirements. Our ability to maintain this success depends on the continued identification and implementation of improvements to our planning processes, distribution infrastructure and supply chain. We also need to ensure that our distribution infrastructure and supply chain keep pace with our anticipated growth and increased number of stores. The cost of these enhanced processes could be significant and any failure to maintain, grow or improve them could adversely affect our operating results. Our business could also be adversely affected if there are delays in product shipments to us due to freight difficulties, difficulties of our suppliers involving strikes or other difficulties at their principal transport providers or otherwise.
Our ability to control labor costs is limited, which may negatively affect our business.
Our ability to control labor costs is subject to numerous external factors, including (i) prevailing wage rates and overtime pay regulations, (ii) the impact of legislation or regulations governing healthcare benefits, such as the Patient Protection and Affordable Care Act, (iii) labor relations, such as the Employee Free Choice Act, and (iv) health and other insurance costs. If our labor and/or benefit costs increase, we may not be able to hire or maintain qualified personnel to the extent necessary to execute our competitive strategy, which could adversely affect our results of operations.
There can be no assurance that our warranty claims and comfort exchange return rates will remain within acceptable levels.
Under the terms of our supply agreements with some of our major suppliers of conventional mattress products, we are currently compensated to assume the risk for returns resulting from product defects. We also provide our customers with a 100-day comfort satisfaction guarantee whereby, within 100 days from the date of original purchase, if the customer is not satisfied with the new mattress, we will exchange it for a mattress of equal or similar quality with no exchange fee, subject to standard transportation charges. Additionally, we provide our customers with a low price guarantee whereby if a customer finds the same or comparable sleep set for less than our displayed or advertised price within 100 days of purchase, we will beat our competitor's price on such comparable sleep set by 10% and refund the customer the difference. While we establish reserves at the time of sale for these exposures, there can be no assurance that our reserves adequately reflect this enhancement and no assurance that warranty claims and comfort exchange return rates will remain within acceptable levels. An increase in warranty claims and comfort exchange return rates could have a material adverse effect on our business, financial condition and results of operations.
If we determine that our goodwill or other acquired intangible assets are impaired, we may have to write off all or a portion of the impaired assets.
As of January 29, 2013, we had goodwill and intangible assets, net of accumulated amortization, of $359.0 million and $82.5 million, respectively. In fiscal 2008, as a result of the global economic crisis, we incurred goodwill and intangible asset impairments of $105.0 million, and we may incur goodwill and intangible asset impairments in the future. We recognized a $0.5 million impairment of goodwill related to two markets in fiscal 2010. Additionally in fiscal 2012 we incurred a $2.1 million intangible trade name impairment related to the Mattress Discounters trade name in relation to our decision to re-brand the majority of the stores in the Virginia Beach market toMattress Firm® in fiscal 2013. Management is required to exercise significant judgment in identifying and assessing whether
24
Table of Contents
impairment indicators exist, or if events or changes in circumstances have occurred, including market conditions, operating results, competition and general economic conditions. Current accounting guidance requires that we test our goodwill and indefinite-lived intangible assets for impairment on an annual basis, or more frequently if warranted by the circumstances. Any changes in key assumptions about the business units and their prospects or changes in market conditions or other external factors could result in an impairment charge, and such a charge could have a material adverse effect on our business, results of operations and financial condition. In addition, as we test goodwill impairment at the reporting unit level, which is each Company-operated metropolitan market, we may be required to incur goodwill impairment charges based on adverse changes affecting a particular metropolitan market, regardless of our overall performance. Such impairment charges may have a material adverse effect on our results of operations.
Historically, we have experienced significant losses on store closings and impairment of store assets. There can be no guarantee that we will not experience similar or greater losses of this kind in the future due to (i) general economic conditions, (ii) competitive or operating factors, or (iii) other reasons, which may have a material adverse effect on our results of operations.
We experienced losses on store closings and impairment of store assets of $2.5 million, $0.8 million and $1.1 million in fiscal 2010, fiscal 2011 and fiscal 2012, respectively. These amounts include a non-cash impairment charge for long-lived assets to reduce the carrying value to estimated fair value based on our periodic assessment of whether projected future cash flows of individual stores are sufficient to recover the carrying value of the related assets. This non-cash impairment charge for long-lived assets consists primarily of store leasehold costs and related equipment and was $1.7 million, $0.1 million and $0.2 million during fiscal 2010, fiscal 2011 and fiscal 2012, respectively. If we are forced to close stores in the future due to general economic conditions, competitive or operating factors or other reasons, the related losses may have a material adverse effect on our results of operations. In addition, if we are unsuccessful in our expansion strategy and are required to close a large number of stores, the risk of incurring losses on store closings may increase.
We are a holding company with no business operations of our own and depend on cash flow from our subsidiaries to meet our obligations.
We are a holding company with no business operations of our own or material assets other than the stock of our subsidiaries. Accordingly, all of our operations are conducted by our subsidiaries. As a holding company, we require dividends and other payments from our subsidiaries to meet cash requirements. The terms of the 2012 Senior Credit Facility restrict our subsidiaries from paying dividends and otherwise transferring cash or other assets to us. We currently have no obligations that require cash funding from our subsidiaries. If there is an insolvency, liquidation or other reorganization of any of our subsidiaries, our stockholders likely will have no right to proceed against the assets of those subsidiaries. Creditors of those subsidiaries will be entitled to payment in full from the sale or other disposal of the assets of those subsidiaries before we, as an equity holder, would be entitled to receive any distribution from that sale or disposal. If our subsidiaries are unable to pay us dividends or make other payments to us when needed, we will be unable to pay dividends or satisfy our obligations.
Product safety issues, including product recalls, could harm our reputation, divert resources, reduce sales and increase costs.
The products we sell in our stores are subject to regulation by the Consumer Product Safety Commission and similar state and international regulatory authorities. Such products could be subject to recalls and other actions by these authorities. Product safety concerns may require us to voluntarily remove selected products from our stores. Such recalls and voluntary removal of products can result in,
25
Table of Contents
among other things, lost sales, diverted resources, potential harm to our reputation and increased customer service costs, which could have a material adverse effect on our financial condition.
Our business exposes us to personal injury and product liability claims, which could result in adverse publicity and harm to our brands and our results of operations.
We are from time to time subject to claims due to the alleged injury of an individual in our stores or on our property. In addition, we may be subject to product liability claims for the products that we sell. Subject to certain exceptions, our purchase orders generally require the manufacturer to indemnify us against any product liability claims; however, if the manufacturer does not have insurance or becomes insolvent, there is a risk we would not be indemnified. Any personal injury or product liability claim made against us, whether or not it has merit, could be time consuming and costly to defend, resulting in adverse publicity, or damage to our reputation, and have an adverse effect on our results of operations. In addition, any negative publicity involving our vendors, employees and other parties who are not within our control could negatively impact us.
Our business operations could be disrupted if our information technology systems fail to perform adequately or we are unable to protect the integrity and security of our customers' information.
We depend largely upon our information technology systems in the conduct of all aspects of our operations. If our information technology systems fail to perform as anticipated, we could experience difficulties in virtually any area of our operations, including but not limited to replenishing inventories or in delivering our products to store locations in response to consumer demands. In addition, we are in the process of replacing our enterprise resource planning ("ERP") system and commenced pilot market implementation of the point-of-sale and supply chain functionality in August 2012. As the new system is implemented, we may experience difficulties in transitioning from the old system, including loss of data and decreases in productivity as our personnel become familiar with the new system. Additionally, until all of our markets are operating on the new system, we will be required to operate and support the old system and the new system concurrently, which may increase costs and otherwise adversely affect our ability to operate our business. If we experience difficulties in implementing new or upgraded information systems or experience significant system failures, or if we are unable to successfully modify our information systems to respond to changes in our business needs, our ability to run our business could be adversely affected. It is also possible that our competitors could develop better e-commerce platforms than ours, which could negatively impact our internet sales. Any of these or other systems-related problems could, in turn, adversely affect our sales and profitability.
In addition, in the ordinary course of our business, we collect and store certain personal information from individuals, such as our customers and suppliers, and we process customer payment card and check information, including via our internet platform. Computer hackers may attempt to penetrate our computer system and, if successful, misappropriate personal information, payment card or check information or confidential Company business information. In addition, a Company employee, contractor or other third party with whom we do business may attempt to circumvent our security measures in order to obtain such information and may purposefully or inadvertently cause a breach involving such information. Any failure to maintain the security of our customers' confidential information, or data belonging to us or our suppliers, could put us at a competitive disadvantage, result in deterioration in our customers' confidence in us, subject us to potential litigation and liability, and subject us to fines and penalties, resulting in a possible material adverse impact on our business, results of operations, cash flows and financial performance.
26
Table of Contents
We may be responsible for theft and other liabilities at leased properties that we have vacated prior to the expiration of the lease term.
From time to time, we may vacate a leased facility prior to the expiration of the lease term. Unless otherwise agreed by the landlord, we will continue to be responsible as the tenant under any such lease, which may include liability for any theft or other damage to the leased property. Our current insurance policy does not cover our liability for theft or certain other damages at vacated properties, and we have not identified additional insurance policies at commercially reasonable rates that would cover this exposure.
Risks Related to Our Franchises
A portion of our income is generated from our franchisees and our income could decrease if our franchisees do not conduct their operations profitably.
As of January 29, 2013, approximately 13% of our stores were operated by franchisees. During fiscal 2010, fiscal 2011 and fiscal 2012 we derived $3.2 million, $4.7 million and $5.4 million, respectively, from franchise fees and royalties. Franchisees are independent contractors and are not our employees. We provide training and support to franchisees, but the quality of franchised store operations may be diminished by any number of factors beyond our control, including (i) the closing of franchised stores, (ii) the failure of franchisees to comply with our standard operating procedures, (iii) failure to honor our national advertising campaign offers, (iv) effectively run their operations, or (v) the failure of franchisees to hire and adequately train qualified managers and other personnel could adversely affect our image and reputation, and the image and reputation of other franchisees, and could reduce the amount of our revenues and our franchise revenues, which could result in lower franchise fees and royalties to us. These factors could have a material adverse effect on our financial condition and results of operations. In addition, litigation with franchisees that may arise from time to time could be costly and the outcome thereof would be difficult to predict.
We may be unable to audit or otherwise independently monitor the results of our franchisees, which could adversely affect our results of operations.
Franchisees pay us franchise fees and royalties as a percentage of their gross sales. Although the agreements with our franchisees give us the right to audit their books and records, we may not be able to audit or otherwise readily and independently monitor franchisee performance on a regular basis or at all. As a result, we may experience delays or failures in discovering and/or recouping underpayments. In addition, to the extent that we rely on the integrity of the financial and other information from our franchisees, we may experience difficulties with respect to internal control, measurement and reporting of our franchise fee and royalty receipts and receivables.
The existence of franchisees in some of our markets may restrict our ability to grow in those markets through acquisitions or organically.
We enter into franchise agreements with our franchisees which, among other things, limit our ability to compete with the franchisees in the markets in which they operate. If we determine at some point in the future that we would like to grow in those markets through acquisitions or organically, our ability to do so may be substantially restricted under the franchise agreements.
Item 1B. Unresolved Staff Comments
None.
27
Table of Contents
Item 2. Properties
Our corporate headquarters are located in Houston, Texas and adjoin one of ourMattress Firm SuperCenter® stores. We lease all but one of our company-operated stores, which are located in 23 states, including Texas, Florida, Georgia, North Carolina and Virginia. Initial lease terms are generally for five to ten years, and most leases contain multiple five-year renewal options and rent escalation provisions. We have historically been able to renew or extend leases for our company-operated stores. Our franchisees also lease their own space.
We also lease all of the distribution centers that serve our company-operated stores, generally subject to five-year leases, most of which contain renewal options ranging from two to ten years. As we expand our operations, we may need to find additional distribution center locations or replace existing distribution centers with larger locations to accommodate the increased level of operations. Additionally, from time to time, we may assume lease obligations for distribution centers in connection with our acquisitions, including in markets where we already operate a distribution center. In such an event, we expect to operate many of those acquired distribution centers for a limited time until our distribution operations can be consolidated. We believe that we would not have any difficulty replacing these facilities if we were required to do so. Our largest distribution centers are located in Texas, Florida and Georgia.
Item 3. Legal Proceedings
From time to time, we may be involved in litigation relating to claims arising out of our operations in the normal course of business. We believe that we are not a party to any legal proceedings which, if determined adversely to us, individually or in the aggregate, would have a material adverse effect on our financial position, results of operations or cash flows.
Item 4. Mine Safety Disclosures
Not applicable.
Part II
Item 5. Market for Registrant's Common Equity, Related Stockholder Matters and Issuer Purchases of Equity Securities
Market Information About Our Common Stock
Our common stock began trading on the NASDAQ Global Select Market under the symbol "MFRM" on November 18, 2011. The following table sets forth, for the period indicated, the high and low sales prices of our common stock as reported by the NASDAQ Global Select Market:
| | | | | | | |
Fiscal Quarter | | High | | Low | |
|---|
2011 | | | | | | | |
Fourth quarter (from November 18, 2011 through January 31, 2012) | | $ | 33.60 | | $ | 21.03 | |
2012 | | | | | | | |
First quarter (from February 1, 2012 through May 1, 2012) | | $ | 48.18 | | $ | 30.30 | |
Second quarter (from May 2, 2012 through July 31, 2012) | | $ | 41.54 | | $ | 22.82 | |
Third quarter (from August 1, 2012 through October 30, 2012) | | $ | 33.80 | | $ | 26.42 | |
Fourth quarter (from October 31, 2012 through January 29, 2013) | | $ | 33.04 | | $ | 22.62 | |
28
Table of Contents
Stockholders
On March 28, 2013, the closing price reported on the NASDAQ Global Select Market of our common stock was $34.54 per share. As of March 28, 2013, we had approximately 42 holders of record of our common stock.
Dividends
No dividends were declared or paid in fiscal year 2011 or fiscal 2012. We anticipate that we will retain future earnings, if any, to finance the continued development and expansion of our business. We do not anticipate paying cash dividends in the foreseeable future. Additionally, because we are a holding company, our ability to pay dividends is limited by the ability of our subsidiaries to pay dividends or make distributions to us, including restrictions under the terms of the 2012 Senior Credit Facility and other agreements governing our indebtedness outstanding from time to time. Any future determination with respect to the payment of dividends will be at the discretion of our board of directors and will be dependent upon, among other things, our financial condition, results of operations, capital requirements, the terms of our then existing indebtedness, general economic conditions and other factors considered relevant by our board of directors.
Recent Sales of Unregistered Securities
On July 19, 2011, we issued and sold $40.2 million aggregate principal amount of 12% convertible notes due July 18, 2016 in a private placement to six accredited investors. These unregistered securities were issued in reliance on the exemption afforded by Section 4(2) of the Securities Act and Rule 506 promulgated thereunder. The 12% convertible notes were converted into shares of common stock in connection with our initial public offering in November 2011.
Securities Authorized for Issuance Under Equity Compensation Plans
The following table sets forth information as of January 29, 2013 regarding the Company's equity compensation plans. The only plan pursuant to which the Company may grant equity-based awards is the Mattress Firm Holding Corp. 2011 Omnibus Incentive Plan (the "Omnibus Plan"), which was approved by the board of directors and the Company's shareholders on November 3, 2011.
| | | | | | | | | | |
Plan Category | | Number of
securities to be
issued upon exercise
of outstanding
options, warrants
and rights | | Weighted-average
exercise price of
outstanding
options, warrants
and rights | | Number of securities
remaining available for
future issuance under
equity compensation plans
(excluding securities in
column (a)) | |
|---|
| | (a)
| | (b)
| | (c)
| |
|---|
Equity compensation plans approved by holders | | | 1,388,945 | | | 19.86 | | | 2,790,196 | |
Equity compensation plans not approved by holders | | | — | | | — | | | — | |
| | | | | | | | |
Total | | | 1,388,945 | | | 19.86 | | | 2,790,196 | |
| | | | | | | | |
29
Table of Contents
Performance Graph
The graph set forth below compares the cumulative total shareholder return on our common stock between November 18, 2011 (our first trading day on the NASDAQ Global Select Market) and January 29, 2013 to (i) the cumulative total return of companies listed on the NASDAQ Composite and (ii) the cumulative total return of a peer group selected by the Company. This graph assumes an initial investment of $100 on November 18, 2011, in our common stock, the market index and the peer group and assumes the reinvestment of dividends, if any. The graph also assumes that the price of our common stock on November 18, 2011 was equal to the closing price of $22.00. The historical information set forth below is not necessarily indicative of future price performance.
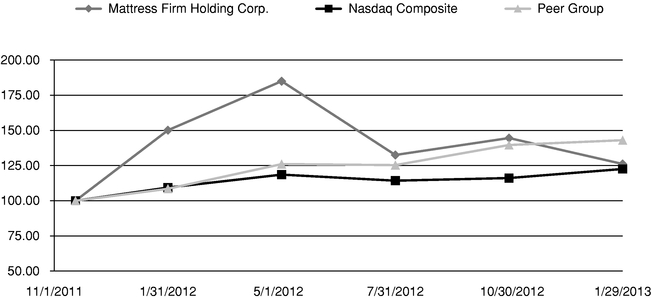
| | | | | | | | | | | | | | | | | | | |
| | 11/18/2011 | | 1/31/2012 | | 5/1/2012 | | 7/31/2012 | | 10/30/2012 | | 1/29/2013 | |
|---|
Mattress Firm Holding Corp. | | | 100.00 | | | 150.14 | | | 185.00 | | | 132.55 | | | 144.59 | | | 126.14 | |
Nasdaq Composite | | | 100.00 | | | 109.38 | | | 118.58 | | | 114.27 | | | 116.15 | | | 122.59 | |
Peer Group | | | 100.00 | | | 108.51 | | | 126.05 | | | 125.34 | | | 139.63 | | | 143.05 | |
- *
- Peer Group Companies
Select Comfort Corporation
Sealy Corporation
Tempur-Pedic International, Inc.
Bed, Bath & Beyond, Inc.
Dick's Sporting Goods, Inc.
Lumber Liquidators Holdings, Inc.
PetSmart, Inc.
Ulta Salon, Cosmetics & Fragrance, Inc.
Vitamin Shoppe, Inc.
Williams-Sonoma, Inc.
30
Table of Contents
Item 6. Selected Financial Data
The following table sets forth a summary of our selected consolidated financial data. We derived the selected balance sheet data as of January 31, 2012 and January 29, 2013, and the statement of operations data and per share data for the fiscal years ended February 1, 2011, January 31, 2012 and January 29, 2013, from our audited consolidated financial statements included elsewhere in this Annual Report on Form 10-K. The selected balance sheet data as of February 3, 2009, February 2, 2010 and February 1, 2011, and the statement of operations data and per share data for the fiscal years ended February 3, 2009 and February 2, 2010, have been derived from our consolidated financial statements for such years, which are not included in this Annual Report on Form 10-K.
Our fiscal year consists of 52 or 53 weeks, ending on the Tuesday nearest to January 31. Each fiscal year is described by the period of the year that comprises the majority of the fiscal year period. For example, the fiscal year ended January 29, 2013 is described as "fiscal 2012." All fiscal years presented include 52 weeks of operations, except fiscal 2008, which includes 53 weeks.
The selected consolidated financial data set forth below is not necessarily indicative of results of future operations and should be read in conjunction with the discussion under "Item 7. Management's Discussion and Analysis of Financial Condition and Results of Operations" and other financial information included elsewhere in this Annual Report on Form 10-K.
| | | | | | | | | | | | | | | | |
| | Fiscal Year | |
|---|
| | 2008 | | 2009 | | 2010 | | 2011 | | 2012 | |
|---|
| | (dollar amounts in thousands, except per share data and store units)
| |
|---|
Statement of Operations: | | | | | | | | | | | | | | | | |
Net sales | | $ | 433,258 | | $ | 432,250 | | $ | 494,115 | | $ | 703,910 | | $ | 1,007,337 | |
Cost of sales | | | 287,744 | | | 280,506 | | | 313,962 | | | 428,018 | | | 614,572 | |
| | | | | | | | | | | | |
Gross profit from retail operations | | | 145,514 | | | 151,744 | | | 180,153 | | | 275,892 | | | 392,765 | |
Franchise fees and royalty income | | | 2,053 | | | 2,100 | | | 3,195 | | | 4,697 | | | 5,396 | |
| | | | | | | | | | | | |
| | | 147,567 | | | 153,844 | | | 183,348 | | | 280,589 | | | 398,161 | |
| | | | | | | | | | | | |
Sales and marketing expenses | | | 94,050 | | | 95,305 | | | 113,963 | | | 167,605 | | | 245,555 | |
General and administrative expenses | | | 33,781 | | | 32,336 | | | 34,111 | | | 51,684 | | | 73,640 | |
Goodwill impairment charge | | | 100,332 | | | — | | | 536 | | | — | | | — | |
Intangible asset impairment charge | | | 4,700 | | | — | | | — | | | — | | | 2,100 | |
Loss on store closings and impairment of store assets(1) | | | 7,419 | | | 5,179 | | | 2,486 | | | 759 | | | 1,050 | |
| | | | | | | | | | | | |
Total operating expenses | | | 240,282 | | | 132,820 | | | 151,096 | | | 220,048 | | | 322,345 | |
| | | | | | | | | | | | |
Income (loss) from operations | | | (92,715 | ) | | 21,024 | | | 32,252 | | | 60,541 | | | 75,816 | |
| | | | | | | | | | | | |
Interest income | | | (9 | ) | | (12 | ) | | (6 | ) | | (9 | ) | | (11 | ) |
Interest expense(2) | | | 28,342 | | | 27,126 | | | 31,063 | | | 29,310 | | | 9,258 | |
Loss (gain) from debt extinguishment(3) | | | — | | | (2,822 | ) | | — | | | 5,704 | | | — | |
| | | | | | | | | | | | |
| | | 28,333 | | | 24,292 | | | 31,057 | | | 35,005 | | | 9,247 | |
| | | | | | | | | | | | |
Income (loss) before income taxes | | | (121,048 | ) | | (3,268 | ) | | 1,195 | | | 25,536 | | | 66,569 | |
Income tax expense (benefit) | | | 3,806 | | | 1,405 | | | 846 | | | (8,815 | ) | | 26,698 | |
| | | | | | | | | | | | |
Net income (loss) | | $ | (124,854 | ) | $ | (4,673 | ) | $ | 349 | | $ | 34,351 | | $ | 39,871 | |
| | | | | | | | | | | | |
Per Share Data: | | | | | | | | | | | | | | | | |
Basic net income (loss) per common share(4) | | $ | (5.57 | ) | $ | (0.21 | ) | $ | 0.02 | | $ | 1.40 | | $ | 1.18 | |
Diluted net income (loss) per common share(4) | | $ | (5.57 | ) | $ | (0.21 | ) | $ | 0.02 | | $ | 1.40 | | $ | 1.18 | |
Adjusted diluted net income (loss) per common share(5) | | $ | (5.57 | ) | $ | (0.21 | ) | $ | 0.02 | | $ | 0.94 | | $ | 1.49 | |
Basic weighted average shares outstanding(4) | | | 22,399,952 | | | 22,399,952 | | | 22,399,952 | | | 24,586,274 | | | 33,770,779 | |
Diluted weighted average shares outstanding(4) | | | 22,399,952 | | | 22,399,952 | | | 22,399,952 | | | 24,586,274 | | | 33,853,276 | |
31
Table of Contents
| | | | | | | | | | | | | | | | |
| | Fiscal Year | |
|---|
| | 2008 | | 2009 | | 2010 | | 2011 | | 2012 | |
|---|
| | (dollar amounts in thousands, except per share data and store units)
| |
|---|
Other Financial Data: | | | | | | | | | | | | | | | | |
EBITDA(6) | | $ | (75,629 | ) | $ | 41,275 | | $ | 49,027 | | $ | 74,005 | | $ | 100,829 | |
Adjusted EBITDA(7) | | $ | 40,168 | | $ | 46,323 | | $ | 57,095 | | $ | 87,487 | | $ | 120,968 | |
Adjusted EBITDA, percentage of net sales | | | 9.3 | % | | 10.7 | % | | 11.6 | % | | 12.4 | % | | 12.0 | % |
Income from operations, percentage of net sales | | | -21.4 | % | | 4.9 | % | | 6.5 | % | | 8.7 | % | | 7.5 | % |
Adjusted income (loss) from operations(5) | | $ | (92,715 | ) | $ | 21,024 | | $ | 32,252 | | $ | 61,185 | | $ | 92,147 | |
Adjusted income (loss) from operations, percentage of net sales | | | -21.4 | % | | 4.9 | % | | 6.5 | % | | 8.6 | % | | 9.1 | % |
Capital expenditures | | $ | 23,888 | | $ | 10,863 | | $ | 27,330 | | $ | 34,356 | | $ | 68,604 | |
Depreciation and amortization | | $ | 16,209 | | $ | 16,286 | | $ | 15,448 | | $ | 17,450 | | $ | 23,507 | |
Operational Data: | | | | | | | | | | | | | | | | |
Comparable-stores sales growth (decline)(8) | | | -23.7 | % | | -4.3 | % | | 6.3 | % | | 20.5 | % | | 6.1 | % |
Stores open at period-end | | | 464 | | | 487 | | | 592 | | | 729 | | | 1,057 | |
Average net sales per store unit(9) | | $ | 1,018 | | $ | 926 | | $ | 962 | | $ | 1,107 | | $ | 1,161 | |
Balance Sheet Data: | | | | | | | | | | | | | | | | |
Working capital | | $ | (18,724 | ) | $ | (8,459 | ) | $ | (7,696 | ) | $ | 49,258 | | $ | (21,095 | ) |
Total assets | | $ | 478,000 | | $ | 465,252 | | $ | 513,633 | | $ | 613,481 | | $ | 724,679 | |
Total debt | | $ | 367,101 | | $ | 369,323 | | $ | 398,703 | | $ | 228,354 | | $ | 252,999 | |
Stockholders' equity (deficit) | | $ | (11,081 | ) | $ | (15,516 | ) | $ | (15,682 | ) | $ | 224,259 | | $ | 267,496 | |
- (1)
- Includes a non-cash impairment charge for long-lived assets, consisting primarily of store leasehold costs and related equipment, to reduce the carrying value to estimated fair value, based on our periodic assessment of whether projected future cash flows of individual stores are sufficient to recover the carrying value of the related assets, in the amounts of $6.3 million, $2.3 million, $1.7 million, $0.1 million and $0.2 million during fiscal 2008, fiscal 2009, fiscal 2010, fiscal 2011 and fiscal 2012, respectively.
- (2)
- Interest expense includes interest that was accrued and paid in kind by adding the interest to the outstanding balance of debt related to our 2009 Loan Facility (defined below), Convertible Notes (defined below) and PIK Notes (defined below) in the amounts of $2.5 million, $17.7 million, $23.2 million and $20.6 million during fiscal 2008, fiscal 2009, fiscal 2010 and fiscal 2011, respectively.
- (3)
- During fiscal 2009, a gain from debt extinguishment was recognized in connection with the amendment of the 2009 Loan Facility. The extinguishment resulted in a $5.8 million downward adjustment of the loan carrying value to its fair value, which was partially offset by the write-off of $3.0 million of unamortized deferred loan fees. During fiscal 2011, a loss from debt extinguishment in the total amount of $5.7 million was recognized, consisting of $1.9 million in connection with the $40.2 million prepayment of the 2009 Loan Facility in July 2011, and $3.8 million in connection with (i) the repayment in full of the 2009 Loan Facility, (ii) the repayment of a portion of the outstanding balance of PIK Notes and the conversion of the remaining outstanding balance of PIK Notes not repaid into shares of our common stock and (iii) the conversion of the outstanding balance of Convertible Notes into shares of our common stock in connection with the initial public offering in November 2011.
- (4)
- Gives effect to a 227,058-for-one stock split effected on November 3, 2011 resulting in 22,399,952 shares of common stock outstanding immediately prior to the consummation of our initial public offering in November 2011, and the issuance of (i) 6,388,888 shares of the Company's common stock as part of the initial public offering, (ii) 2,205,953 additional shares upon the conversion of the Convertible Notes in connection with the initial public offering and (iii) 2,774,035 additional shares upon the conversion of the PIK Notes in connection with the initial public offering, in each case at a price or conversion rate equal to the initial public offering price of $19.00 per share.
32
Table of Contents
- (5)
- Our "As Adjusted" data is considered a non-U.S. GAAP financial measure and is not in accordance with, or preferable to, "As Reported," or GAAP financial data. However, we are providing this information as we believe it facilitates year-over-year comparisons for investors and financial analysts.
| | | | | | | | | | | | | | | | | | | | | | | | | | | | | | | | | |
| | Fiscal Year (Fifty-Two Weeks) Ended | |
|---|
| | January 31, 2012 | |
| | January 29, 2013 | |
|---|
| |
| |
|---|
| | Income
From
Operations | | Income
Before
Income Taxes | | Net
Income | | Diluted
Weighted
Shares | | Diluted
EPS* | |
| | Income
From
Operations | | Income
Before
Income Taxes | | Net
Income | | Diluted
Weighted
Shares | | Diluted
EPS* | |
|---|
| |
| |
|---|
| |
| |
|---|
As Reported | | $ | 60,541 | | $ | 25,536 | | $ | 34,351 | | | 24,586,274 | | $ | 1.40 | | | | $ | 75,816 | | $ | 66,569 | | $ | 39,871 | | | 33,853,276 | | $ | 1.18 | |
% of sales | | | 8.6 | % | | 3.6 | % | | 4.9 | % | | | | | | | | | | 7.5 | % | | 6.6 | % | | 4.0 | % | | | | | | |
IPO Pro Forma Adjustments(a) | | | | | | | | | | | | | | | | | | | | | | | | | | | | | | | | | |
Diluted share count adjustment | | | | | | | | | | | | 9,182,554 | | | (0.38 | ) | | | | | | | | | | | | | | | | | |
Management fees | | | 644 | | | 644 | | | 405 | | | | | | 0.01 | | | | | — | | | — | | | — | | | | | | — | |
Interest expense | | | — | | | 21,131 | | | 13,291 | | | | | | 0.39 | | | | | — | | | — | | | — | | | | | | — | |
Loss from debt extinguishment | | | — | | | 5,688 | | | 3,578 | | | | | | 0.11 | | | | | — | | | — | | | — | | | | | | — | |
Other Adjustments | | | | | | | | | | | | | | | | | | | | | | | | | | | | | | | | | |
Acquisition-related costs(b) | | | — | | | — | | | — | | | | | | — | | | | | 11,980 | | | 11,980 | | | 7,616 | | | | | | 0.23 | |
Secondary offering costs(c) | | | — | | | — | | | — | | | | | | — | | | | | 1,915 | | | 1,915 | | | 1,403 | | | | | | 0.04 | |
Impairment charges(d) | | | — | | | — | | | — | | | | | | — | | | | | 2,256 | | | 2,256 | | | 1,386 | | | | | | 0.04 | |
Other costs(e) | | | — | | | — | | | — | | | | | | — | | | | | 180 | | | 180 | | | 111 | | | | | | 0.00 | |
Release of valuation allowance on deferred tax assets(f) | | | — | | | — | | | (20,050 | ) | | | | | (0.59 | ) | | | | — | | | — | | | — | | | | | | — | |
| | | | | | | | | | | | | | | | | | | | | | | | |
Total adjustments | | | 644 | | | 27,463 | | | (2,776 | ) | | 9,182,554 | | | (0.46 | ) | | | | 16,331 | | | 16,331 | | | 10,516 | | | — | | | 0.31 | |
| | | | | | | | | | | | | | | | | | | | | | | | |
As Adjusted | | $ | 61,185 | | $ | 52,999 | | $ | 31,575 | | | 33,768,828 | | $ | 0.94 | | | | $ | 92,147 | | $ | 82,900 | | $ | 50,387 | | | 33,853,276 | | $ | 1.49 | |
| | | | | | | | | | | | | | | | | | | | | | | | |
% of sales | | | 8.7 | % | | 7.5 | % | | 4.5 | % | | | | | | | | | | 9.1 | % | | 8.2 | % | | 5.0 | % | | | | | | |
- *
- Due to rounding to the nearest cent per diluted share, totals may not equal the sum of the line items in the table above.
- (a)
- IPO Pro Forma Adjustments give effect to the initial public offering that was completed on November 23, 2011, as if the offering had occurred at the beginning of fiscal 2011 (February 2, 2011). These pro forma adjustments reflect the following assumptions: (i) the application of the net proceeds from the initial public offering to repay debt resulting in a decrease to interest expense and a loss from debt extinguishment, (ii) the conversion of a significant portion of convertible debt for which such conversion was elected into shares of our common stock, resulting in a decrease to interest expense, a loss from debt extinguishment, (iii) the reduction in management fee expense in connection with the termination of the management agreement between J.W. Childs Associates, L.P. and the Company that became effective with the completion of the initial public offering, and (iv) the effect on diluted EPS as if the common stock shares outstanding at the completion of the offering had been outstanding for the entire period presented.
- (b)
- On May 2, 2012, we acquired all of the equity interests of MGHC Holding Corporation ("Mattress Giant"), including 181 specialty retail stores. On September 25, 2012, we acquired the leasehold interests, store assets, distribution center assets and related inventories, and assumption of certain liabilities of Mattress XPress, Inc. and Mattress XPress of Georgia, Inc. (collectively, "Mattress X-Press"), including 34 mattress specialty retail stores. On December 11, 2012, we acquired the assets and operations of Factory Mattress & Water Bed Outlet of Charlotte, Inc. ("Mattress Source"), including 27 mattress specialty stores. Acquisition-related costs, consisting of direct transaction costs and integration costs, are included in the results of operations as incurred. During fiscal 2012, we incurred $12.0 million of acquisition-related costs.
- (c)
- Reflects $1.9 million of costs that we incurred in connection with a secondary offering of shares of common stock by certain of our selling stockholders, which was completed in October 2012.
- (d)
- Reflects an intangible trade name impairment charge in the amount of $2.1 million related to the Mattress Discounters trade name and a $0.2 million impairment of store assets recorded during fiscal 2012.
- (e)
- Reflects $0.2 million in expensed legal fees related to our November 2012 debt amendment and extension recorded during fiscal 2012.
- (f)
- The release of the valuation allowance on deferred tax assets reflects utilization of net operating loss carryforwards throughout fiscal 2011 and an expectation of increased future taxable income effective with the completion of our initial public offering and the resulting elimination of interest expense, which provided sufficient evidence that it was more-likely-than-not that deferred tax assets would be realized in future periods and supported the release of the remaining valuation allowance in fiscal 2011.
- (6)
- EBITDA represents net income before income tax expense, interest income, interest expense, depreciation and amortization. We have presented EBITDA because we consider it an important supplemental measure of our performance and believe it is frequently used by analysts, investors and other interested parties in the evaluation of companies in our industry. Management uses EBITDA as a measurement tool for evaluating our actual operating performance compared to budget and prior periods. Other companies in our industry may calculate EBITDA differently than we do. EBITDA is not a measure of performance under U.S. GAAP, and should not be considered as a substitute for net income prepared in accordance with U.S. GAAP. EBITDA has limitations as an analytical tool, and you should not consider it in isolation or as a substitute for analysis of our results as reported under U.S. GAAP. Some of these limitations are:
- •
- EBITDA does not reflect our cash expenditures, or future requirements, for capital expenditures or contractual commitments;
- •
- EBITDA does not reflect interest expense or the cash requirements necessary to service interest or principal payments on our debt;
33
Table of Contents
- •
- EBITDA does not reflect tax expense or the cash requirements necessary to pay for tax obligations; and
- •
- Although depreciation and amortization are non-cash charges, the asset being depreciated and amortized will often have to be replaced in the future, and EBITDA does not reflect any cash requirements for such replacements.
We compensate for these limitations by relying primarily on our U.S. GAAP results and using EBITDA only as a supplemental measure.
- (7)
- Adjusted EBITDA is defined as EBITDA, without giving effect to non-cash goodwill and intangible asset impairment charges, gains or losses on store closings and impairment of store assets, gains or losses related to the early extinguishment of debt, financial sponsor fees and expenses, non-cash charges related to stock-based awards and other items that are excluded by management in reviewing the results of operations. We have presented Adjusted EBITDA because we believe that the exclusion of these items is appropriate to provide additional information to investors about our ongoing operating performance excluding certain non-cash and other items and to provide additional information with respect to our ability to comply with various covenants in documents governing our indebtedness and as a means to evaluate our period-to-period results. In evaluating Adjusted EBITDA, you should be aware that in the future we may incur expenses that are the same as or similar to some of the adjustments in this presentation. Our presentation of Adjusted EBITDA should not be construed to imply that our future results will be unaffected by any such adjustments. We have provided this information to analysts, investors and other third parties to enable them to perform more meaningful comparisons of past, present and future operating results and as a means to evaluate the results of our ongoing operations. The Compensation Committee uses Adjusted EBITDA as a performance measure under our short-term incentive programs for our executive officers. In addition, our compliance with certain covenants under our 2012 Senior Credit Facility that are calculated based on similar measures, which differ from Adjusted EBITDA primarily by the inclusion of pro forma results for acquired businesses in those similar measures. Other companies in our industry may calculate Adjusted EBITDA differently than we do. Adjusted EBITDA is not a measure of performance under U.S. GAAP and should not be considered as a substitute for net income prepared in accordance with U.S. GAAP. Adjusted EBITDA has similar limitations as an analytical tool to those set forth in note (6) related to the use of EBITDA, and you should not consider it in isolation or as a substitute for analysis of our results as reported under U.S. GAAP. Some of the additional limitations to the use of Adjusted EBITDA are:
- •
- Adjusted EBITDA does not reflect the cash requirements of closing underperforming stores;
- •
- Adjusted EBITDA does not reflect costs related to management services previously provided by JWC Mattress Holdings, LLC, a limited liability company managed by J.W. Childs Associates, Inc. ("J.W. Childs"), and
- •
- Adjusted EBITDA does not reflect certain other costs that may recur in future periods.
34
Table of Contents
We compensate for these limitations by relying primarily on our U.S. GAAP results and using Adjusted EBITDA only as a supplemental measure. The following table contains a reconciliation of our net income (loss) determined in accordance with U.S. GAAP to EBITDA and Adjusted EBITDA for the periods indicated:
| | | | | | | | | | | | | | | | |
| | Fiscal Year | |
|---|
| | 2008 | | 2009 | | 2010 | | 2011 | | 2012 | |
|---|
| | (in thousands)
| |
|---|
Net income (loss) | | $ | (124,854 | ) | $ | (4,673 | ) | $ | 349 | | $ | 34,351 | | $ | 39,871 | |
Income tax (benefit) expense | | | 3,806 | | | 1,405 | | | 846 | | | (8,815 | ) | | 26,698 | |
Interest income | | | (9 | ) | | (12 | ) | | (6 | ) | | (9 | ) | | (11 | ) |
Interest expense | | | 28,342 | | | 27,126 | | | 31,063 | | | 29,310 | | | 9,258 | |
Depreciation and amortization | | | 16,209 | | | 16,286 | | | 15,448 | | | 17,450 | | | 23,507 | |
Intangible assets and other amortization | | | 877 | | | 1,143 | | | 1,327 | | | 1,718 | | | 1,506 | |
| | | | | | | | | | | | |
EBITDA | | | (75,629 | ) | | 41,275 | | | 49,027 | | | 74,005 | | | 100,829 | |
| | | | | | | | | | | | |
Goodwill impairment charge | | | 100,332 | | | — | | | 536 | | | — | | | — | |
Intangible asset impairment charge | | | 4,700 | | | — | | | — | | | — | | | 2,100 | |
Loss on store closings and impairment of store assets | | | 7,419 | | | 5,179 | | | 2,486 | | | 759 | | | 1,050 | |
Loss (gain) from debt extinguishment | | | — | | | (2,822 | ) | | — | | | 5,704 | | | — | |
Financial sponsor fees and expenses | | | 490 | | | 395 | | | 407 | | | 644 | | | 74 | |
Stock-based compensation | | | 1,299 | | | 84 | | | (515 | ) | | 523 | | | 2,856 | |
Secondary offering costs | | | — | | | — | | | — | | | — | | | 1,915 | |
Vendor new store funds(a) | | | 681 | | | (87 | ) | | 1,540 | | | 3,169 | | | 953 | |
Acquisition-related costs(b) | | | 138 | | | 2 | | | 453 | | | 886 | | | 11,980 | |
Other(c) | | | 738 | | | 2,297 | | | 3,161 | | | 1,797 | | | (789 | ) |
| | | | | | | | | | | | |
Adjusted EBITDA | | $ | 40,168 | | $ | 46,323 | | $ | 57,095 | | $ | 87,487 | | $ | 120,968 | |
| | | | | | | | | | | | |
- (a)
- We receive cash payments from certain vendors for each new incremental store that we open ("new store funds"). New store funds are initially recorded in other noncurrent liabilities when received and are then amortized as a reduction of cost of sales over 36 months in our financial statements. Historically, we have considered new store funds as a component of Adjusted EBITDA when received since new store funds are included in cash provided from operations. The adjustment includes the amount of new store funds received during the period presented and eliminates the noncash reduction in cost of sales included in our results of operations.
- (b)
- Reflects both non-cash effects included in net income related to acquisition accounting adjustments made to inventories and other acquisition-related cash costs included in net income, such as direct acquisition costs and costs related to integration of acquired businesses.
- (c)
- Consists of various items that management excludes in reviewing the results of operations, including $1.6 million in fiscal 2010 for the estimated costs of a May 26, 2011 settlement of a lawsuit involving alleged violations of the Fair Labor Standards Act brought in April 2010 by a former employee and a $0.5 million benefit in fiscal 2012 for a recovery from the claims-made reversionary fund established to administer the lawsuit settlement.
- (8)
- Comparable-store sales is a measure commonly used in the retail industry, which indicates store performance by measuring the growth in revenue for certain stores for a particular period over the corresponding period in the prior year. New stores are included in the comparable-store sales calculation beginning in the thirteenth full month of operation. Acquired stores are included in the comparable-store sales calculation beginning in the first month following the one-year anniversary date of the acquisition. The comparable-store sales calculation includes sales related to our e-commerce and other comparable sales channels. New stores that are relocated within a two mile radius of a closed store are included in the comparable-store sales calculation beginning with the first full month of operations by measuring the growth in revenue against the prior year sales of the closed store. Stores that are closed, other than relocated stores, are removed from the comparable-store sales calculation in the month of closing. Comparable-store sales during fiscal years that are comprised of 53 weeks exclude sales for the fifty-third week of the year. The method of calculating comparable-store sales varies across the retail industry and our method may not be the same as other retailers' methods.
- (9)
- Calculated using net sales for stores open at both the beginning and the end of the period, excluding temporary "pop-up" stores and sales generated from our website,http://www.mattressfirm.com.
35
Table of Contents
Item 7. Management's Discussion and Analysis of Financial Condition and Results of Operations
The following discussion should be read in conjunction with our audited condensed consolidated financial statements and related notes appearing elsewhere in this Annual Report on Form 10-K. The discussion in this section contains forward-looking statements that involve risks and uncertainties. See "Cautionary Note Regarding Forward-Looking Statements" included elsewhere in this Annual Report on Form 10-K for a discussion of important factors that could cause actual results to differ materially from those described or implied by the forward-looking statements contained herein.
Executive Summary
We operate in the U.S. mattress retail market, in which net sales amounted to $11.4 billion in calendar year 2011. The market is highly fragmented, with no single retailer holding more than an 8% market share and the top ten participants accounting for less than 30% of the total market. According to the most recent information published byFurniture Today, in 2010, mattress specialty retailers had a market share in excess of 43%, which represents the largest share of the market, having more than doubled their share over the past 15 years.
On November 23, 2011, we completed the initial public offering of shares of our common stock pursuant to a registration statement on Form S-1, as amended (File No. 333-174830), which was declared effective on November 17, 2011. Under the registration statement, we registered the offering and sale of up to an aggregate of 6,388,888 shares of common stock (including shares issued pursuant to the underwriters' option to purchase additional shares) at a public offering price of $19.00 per share.
On October 10, 2012, we completed the secondary offering of 5,435,684 shares of our common stock by certain of our selling shareholders. We did not sell any shares of common stock in the offering and did not receive any proceeds from the sale.
Net sales in fiscal 2010, fiscal 2011 and fiscal 2012 improved $61.9 million, $209.8 million and $303.4 million, respectively, from the comparable prior year levels as a result of comparable-store sales growth and the addition of new and acquired store units. We believe that our net sales growth is outpacing our competitors in most of the markets in which we operate and is resulting in increased market share. Net income and other profitability measures improved during fiscal 2010, fiscal 2011 and fiscal 2012, which resulted from the net sales growth and our ability to gain leverage on certain costs thereby increasing profitability per store. These improvements were partially offset by increases in spending in certain expense categories during the period primarily in support of increasing net sales, including general and administrative expenses, and temporary deleverage in store occupancy and other operating expenses related to acquisitions of stores with sales productivity levels that, while improving, remain below the levels of our existing store base. Key results for fiscal 2012 include:
- •
- Net income increased $5.5 million to $39.9 million for fiscal 2012 compared to $34.4 million for fiscal 2011.
- •
- Income from operations increased $15.3 million to $75.8 million for fiscal 2012 compared to $60.5 million for fiscal 2011. Excluding $16.3 million of acquisition-related, secondary offering and impairment costs, adjusted income from operations was $92.1 million for fiscal 2012 and adjusted operating margin improved 40 basis points to 9.1% from 8.7% in fiscal 2011. This operating margin growth for fiscal 2012 on an adjusted basis (excluding acquisition-related, secondary offering and impairment costs) was driven primarily by a 110 basis-point improvement in general and administrative expense offset by 70 basis points of leverage reduction in selling and marketing expense and other areas. Acquisition-related costs for purposes of management's discussion and analysis, which are included in the results of operations, consists of the acquisition-related costs as defined under U.S. GAAP, including advisory, legal, accounting, valuation, and other professional or consulting fees and, in addition, costs of integrating store and warehouse operations and corporate functions that are not expected to recur in future
36
Table of Contents
periods, related to the MGHC Holding Corporation, Mattress X-Press and Mattress Source acquisitions. (Adjusted income from operations is not a performance measure under U.S. GAAP. See "Item 6. Selected Financial Data" for a definition of adjusted income from operations and a reconciliation of adjusted income from operations to income from operations.)
- •
- Net sales increased $303.4 million, or 43.1%, to $1,007.3 million for fiscal 2012, compared to $703.9 million for fiscal 2011. Comparable-store sales increased 6.1% during fiscal 2012.
The components of the net sales increase were as follows (in millions):
| | | | | | | |
| | Increase (Decrease) in
Net Sales | |
|---|
| | Fiscal 2011 | | Fiscal 2012 | |
|---|
Comparable-store sales | | $ | 99.0 | | $ | 41.9 | |
New stores | | | 83.4 | | | 120.8 | |
Acquired stores | | | 33.0 | | | 148.8 | |
Closed stores | | | (5.6 | ) | | (8.1 | ) |
| | | | | | |
| | $ | 209.8 | | $ | 303.4 | |
| | | | | | |
The components of net sales by major category of product and services were as follows (in millions):
| | | | | | | | | | | | | | | | | | | |
| | Fiscal
2010 | | % of
Total | | Fiscal
2011 | | % of
Total | | Fiscal
2012 | | % of
Total | |
|---|
Conventional mattresses | | $ | 288.0 | | | 58.3 | % | $ | 323.4 | | | 45.9 | % | $ | 418.0 | | | 41.5 | % |
Specialty mattresses | | | 160.3 | | | 32.4 | % | | 318.9 | | | 45.3 | % | | 504.9 | | | 50.1 | % |
Furniture and accessories | | | 33.9 | | | 6.9 | % | | 46.4 | | | 6.6 | % | | 65.7 | | | 6.5 | % |
| | | | | | | | | | | | | | | | | |
Total product sales | | | 482.2 | | | 97.6 | % | | 688.7 | | | 97.8 | % | | 988.6 | | | 98.1 | % |
Delivery service revenues | | | 11.9 | | | 2.4 | % | | 15.2 | | | 2.2 | % | | 18.7 | | | 1.9 | % |
| | | | | | | | | | | | | | | | | |
Total net sales | | $ | 494.1 | | | 100.0 | % | $ | 703.9 | | | 100.0 | % | $ | 1,007.3 | | | 100.0 | % |
| | | | | | | | | | | | | | | | | |
Prior-year fiscal 2011 components of the total net sales have been reclassified between specialty mattresses and conventional mattresses in a manner consistent with the current-year presentation.
- •
- Adjusted EBITDA increased $33.5 million to $121.0 million for fiscal 2012 compared with $87.5 million for fiscal 2011. Adjusted EBITDA as a percentage of sales decreased to 12.0% during fiscal 2012 compared with 12.4% for fiscal 2011 as a result of temporary deleverage in store occupancy and other primarily fixed expenses related to acquisitions of stores with sales productivity levels that, while improving, remain below the levels of our existing store base. (Adjusted EBITDA is not a performance measure under U.S. GAAP. See "Item 6. Selected Financial Data" for a definition of Adjusted EBITDA and a reconciliation of Adjusted EBITDA to net income).
- •
- We opened 118 new stores and acquired 242 stores during fiscal 2012. New and acquired stores, net of stores closed, added $261.5 million in net sales during fiscal 2012. The activity with respect to the number of company-operated store units was as follows:
| | | | | | | | | | |
| | Fiscal 2010 | | Fiscal 2011 | | Fiscal 2012 | |
|---|
Store units, beginning of period | | | 487 | | | 592 | | | 729 | |
New stores | | | 86 | | | 106 | | | 118 | |
Acquired stores | | | 33 | | | 55 | | | 242 | |
Closed stores | | | (14 | ) | | (24 | ) | | (32 | ) |
| | | | | | | | |
Store units, end of period | | | 592 | | | 729 | | | 1,057 | |
| | | | | | | | |
37
Table of Contents
- •
- Operating cash flows were $78.7 million during fiscal 2012, which was a funding source for acquisitions, capital expenditures and debt principal payments.
- •
- There were $21.0 million outstanding in revolver borrowings at January 29, 2013. At January 29, 2013, there were standby letters of credit outstanding in the amount of $1.4 million and additional borrowing capacity of $77.6 million.
In connection with our long-term growth plans, we are in the process of implementing an ERP system to replace our current systems and commenced pilot market testing of point-of-sale and supply chain functionality during fiscal 2012. See "Item 1A. Risk Factors—Our business operations could be disrupted if our information technology systems fail to perform adequately or we are unable to protect the integrity and security of our customers' information" for additional information relating to some important risks relating to our information technology.
We believe that the U.S. mattress retail market remains affected by the pent-up demand for mattresses and related products that has developed as consumers have delayed purchases of big-ticket home furnishings, including mattresses, in response to the slow recovery of the national economy, increased tax rates and overall fiscal uncertainty. We expect that this pent-up demand will result in sales growth for the Company as the national economy and consumer confidence continue to improve.
We expect to continue the expansion of our company-operated store base through new store openings in existing markets to increase our market share and new store openings in new markets to provide a platform for future growth. We plan to open 110 to 120 new company-operated stores in fiscal 2013. In addition, we intend to evaluate strategically valuable acquisition opportunities in existing and new markets that may arise from time to time.
We also strive to increase sales and profitability within our existing network of stores through a combination of (i) advertising and marketing initiatives that are aimed at increasing customer traffic, (ii) improved customer conversion through our merchandising approach that improves the customer's shopping experience and the efforts of our highly trained sales associates and (iii) increasing the average price of a transaction through effective sales techniques and the increasing demand for specialty mattresses.
On May 2, 2012, we completed the acquisition of the equity interests of MGHC Holding Corporation for approximately $43.9 million. The acquisition added 181 former Mattress Giant retail stores in Texas and Florida, which are the two largest states in which we currently operate.
On September 25, 2012, we acquired substantially all of the operations and assets of Mattress XPress, Inc. and Mattress XPress of Georgia, Inc. (which entities operated Mattress X-Press stores), including 29 mattress specialty stores located primarily in South Florida and 5 stores in Georgia, for approximately $13.1 million. Prior to the acquisition, we operated stores in South Florida and Georgia. The Mattress X-Press stores have been rebranded asMattress Firm® stores.
On December 11, 2012, we acquired substantially all of the operations and assets of Factory Mattress & Water Bed Outlet of Charlotte, Inc. which operated Mattress Source stores, including 27 mattress specialty stores located in North Carolina and South Carolina for a total purchase price of approximately $11.4 million. Prior to the acquisitions, we operated stores in North Carolina and South Carolina. Permanent rebranding, including renovations and the addition of permanent signage for the Mattress Source stores, is expected to be complete in fiscal 2013.
The aforementioned acquisitions, and subsequent rebranding of the acquired stores asMattress Firm®, is advancing our market-level profitability model that is centered on the benefits of increasing our level of store penetration in several of our major markets. We believe that the incremental sales and store-level contribution attributable to the acquired stores will support our ability to increase the advertising spend in each of the markets, which is expected to drive sales increases in both the acquired
38
Table of Contents
and existing stores. This strategy is expected to provide sales increases, greater leverage over market-level costs and improved market-level profitability.
General Definitions for Operating Results
Net sales are recognized upon delivery and acceptance of mattresses and bedding products by our customers and include fees collected for delivery services, and are recorded net of estimated returns. Customer deposits collected prior to the delivery of merchandise are recorded as a liability. Net sales are recognized net of sales tax collected from customers and remitted to various taxing jurisdictions.
Cost of sales consist of the following:
- •
- Costs associated with purchasing and delivering our products to our stores and customers, net of vendor incentives earned on the purchase of products subsequently sold;
- •
- Physical inventory losses;
- •
- Store and warehouse occupancy and depreciation expense of related facilities and equipment;
- •
- Store and warehouse operating costs, including warehouse (i) labor costs, (ii) utilities, (iii) repairs and maintenance, (iv) supplies and (v) store facilities; and
- •
- Estimated costs to provide for customer returns and exchanges and to service customer warranty claims.
Gross profit from retail operations is net sales minus cost of sales.
Franchise fees and royalty income represents initial franchise fees earned upon the opening of new franchisee stores and ongoing royalties based on a percentage of gross franchisee sales.
Sales and marketing expenses consist of the following:
- •
- Advertising and media production;
- •
- Payroll and benefits for sales associates; and
- •
- Merchant service fees for customer credit and debit card payments, check guarantee fees and promotional financing expense.
General and administrative expenses consist of the following:
- •
- Payroll and benefit costs for corporate office and regional management employees;
- •
- Stock-based compensation costs;
- •
- Occupancy costs of corporate facility;
- •
- Information systems hardware, software and maintenance;
- •
- Depreciation related to corporate assets;
- •
- Management fees;
- •
- Insurance; and
- •
- Other overhead costs.
Goodwill impairment charge consists of a non-cash impairment charge of $0.5 million attributable to the impairment of our goodwill in fiscal 2010.
39
Table of Contents
Intangible asset impairment charge consists of a non-cash impairment charge of $2.1 million attributable to the impairment of our Mattress Discounters trade name in fiscal 2012.
Loss on store closings and impairment of store assets consists of the following:
- •
- Estimated future costs to close locations at the time of closing including, as applicable, the difference between future lease obligations and anticipated sublease rentals;
- •
- The write off of unamortized fixed assets related to store leasehold costs on closed stores; and
- •
- Non-cash charges recognized for long-lived assets generally consisting of leasehold costs and related equipment resulting in a reduction of the carrying value to estimated fair value, based on our periodic assessment of whether projected future cash flows of individual stores are sufficient to recover the carrying value of the related assets.
Income (loss) from operations consists of gross profit from retail operations plus franchise fees and royalty income, minus (i) sales and marketing expenses, (ii) general and administrative expenses, (iii) goodwill and intangible asset impairment charges, and (iv) loss (gain) on store closings and impairment of store assets.
Total other expense includes interest income, interest expense, and gain (loss) on early debt extinguishments. Interest expense includes interest on outstanding debt, amortization of debt discounts, and amortization of financing costs.
Results of Operations
The following table presents the consolidated historical financial operating data for our business expressed as a percentage of net sales for each period indicated. Our fiscal year consists of 52 or 53 weeks, ending on the Tuesday nearest to January 31, divided into twelve fiscal periods of four or five weeks each. Each fiscal year is described by the period of the calendar year that comprises the majority of the fiscal year period. The fiscal year ended January 29, 2013 is described as "fiscal 2012," the fiscal year ended January 31, 2012 is described as "fiscal 2011," and the fiscal year ended February 1, 2011 is described as "fiscal 2010". All fiscal years presented include 52 weeks of operations. The historical results are not necessarily indicative of results to be expected for any future period.
| | | | | | | | | | | | | | | | | | | |
| | Fiscal 2010 | | Fiscal 2011 | | Fiscal 2012 | |
|---|
Net sales | | $ | 494,115 | | | 100.0 | % | $ | 703,910 | | | 100.0 | % | $ | 1,007,337 | | | 100.0 | % |
Costs of sales | | | 313,962 | | | 63.5 | % | | 428,018 | | | 60.8 | % | | 614,572 | | | 61.0 | % |
| | | | | | | | | | | | | | |
Gross profit from retail operations | | | 180,153 | | | 36.5 | % | | 275,892 | | | 39.2 | % | | 392,765 | | | 39.0 | % |
Franchise fees and royalty income | | | 3,195 | | | 0.6 | % | | 4,697 | | | 0.7 | % | | 5,396 | | | 0.5 | % |
| | | | | | | | | | | | | | |
| | | 183,348 | | | 37.1 | % | | 280,589 | | | 39.9 | % | | 398,161 | | | 39.5 | % |
Sales and marketing expenses | | | 113,963 | | | 23.0 | % | | 167,605 | | | 23.9 | % | | 245,555 | | | 24.4 | % |
General and administrative expenses | | | 34,111 | | | 6.9 | % | | 51,684 | | | 7.3 | % | | 73,640 | | | 7.3 | % |
Goodwill impairment charge | | | 536 | | | 0.1 | % | | — | | | 0.0 | % | | — | | | 0.0 | % |
Intangible asset impairment charge | | | — | | | 0.0 | % | | — | | | 0.0 | % | | 2,100 | | | 0.2 | % |
Loss on store closings and impairment of store assets | | | 2,486 | | | 0.5 | % | | 759 | | | 0.1 | % | | 1,050 | | | 0.1 | % |
| | | | | | | | | | | | | | |
Income from operations | | | 32,252 | | | 6.6 | % | | 60,541 | | | 8.6 | % | | 75,816 | | | 7.5 | % |
Other expense, net | | | 31,057 | | | 6.3 | % | | 35,005 | | | 5.0 | % | | 9,247 | | | 0.9 | % |
| | | | | | | | | | | | | | |
Income before income taxes | | | 1,195 | | | 0.3 | % | | 25,536 | | | 3.6 | % | | 66,569 | | | 6.6 | % |
Income tax expense | | | 846 | | | 0.2 | % | | (8,815 | ) | | (1.3 | )% | | 26,698 | | | 2.6 | % |
| | | | | | | | | | | | | | |
Net income | | $ | 349 | | | 0.1 | % | $ | 34,351 | | | 4.9 | % | $ | 39,871 | | | 4.0 | % |
| | | | | | | | | | | | | | |
40
Table of Contents
Fiscal 2012 Compared to Fiscal 2011
Net sales. Net sales increased $303.4 million, or 43.1%, to $1,007.3 million during fiscal 2012, compared to $703.9 million during fiscal 2011. The components of the net sales increase were as follows (in millions):
| | | | |
| | Increase
(Decrease)
in Net Sales | |
|---|
Comparable-store sales | | $ | 41.9 | |
New stores | | | 120.8 | |
Acquired stores | | | 148.8 | |
Closed stores | | | (8.1 | ) |
| | | | |
| | $ | 303.4 | |
| | | | |
The increase in comparable-store net sales represents a 6.1% comparable-store sales increase, which was primarily the result of an increase in the number of customer transactions. The increase in our net sales from new stores was the result of 118 new stores opened at various times throughout fiscal 2012 compared to 106 stores opened throughout fiscal 2011, prior to their inclusion in the comparable-store sales calculation beginning with the thirteenth full fiscal period of operation. The increase in net sales from acquired stores was the result of the acquisitions of 55 Mattress Giant stores in November 2011, 181 Mattress Giant stores in May 2012, 34 Mattress X-Press stores in September 2012 and 27 Mattress Source stores in December 2012. We closed 32 stores in fiscal 2012 and 24 stores in fiscal 2011 and the reduction in sales during fiscal 2012 from these closings totaled $8.1 million. We operated 1,057 stores at the end of fiscal 2012, compared with 729 stores at the end of fiscal 2011.
Cost of sales. Cost of sales increased $186.6 million, or 43.6%, to $614.6 million during fiscal 2012, compared to $428.0 million during fiscal 2011. The major components of the increase in cost of sales are discussed below. Cost of sales as a percentage of net sales increased to 61.0% during fiscal 2012, as compared to 60.8% during fiscal 2011.
Product costs increased by $107.6 million, or 39.6%, to $379.0 million during fiscal 2012, compared with $271.4 million during fiscal 2011. Product costs as a percentage of net sales decreased to 37.6% during fiscal 2012 from 38.6% during fiscal 2011. The increase in the amount of product costs is the result of the corresponding increase in net sales. The decrease of this expense as a percentage of net sales during fiscal 2012 is primarily the result of an increase in the mix of higher margin products and improvement in vendor incentive terms with certain vendors.
Store and warehouse occupancy costs, consisting primarily of lease-related costs of rented facilities, increased $44.1 million, or 47.7%, to $136.7 million during fiscal 2012, compared to $92.6 million during fiscal 2011. Store and warehouse occupancy costs as a percentage of net sales increased to 13.6% during fiscal 2012, compared to 13.2% in fiscal 2011. The increase in the amount of expense during fiscal 2012 was mainly attributable to the increase in the number of stores we operated and the commencement of warehouse operations in a number of new markets. The increase in expenses as a percentage of net sales during fiscal 2012 was attributable to the acquisition of Mattress Giant stores in November 2011 and May 2012, Mattress X-Press stores in September 2012 and Mattress Source stores in December 2012 with lower store occupancy leverage as a result of average sales per store that, while improving, were lower than the average of our existing store base.
Depreciation expense of leasehold improvement and other fixed assets used in stores and warehouse operations increased $5.8 million, or 36.7%, to $21.5 million, during fiscal 2012, compared to $15.7 million during fiscal 2011. The increase in expense was primarily attributable to the increase in the number of stores we operated during fiscal 2012, as compared with fiscal 2011.
41
Table of Contents
Other cost of sales, consisting of store and warehouse operating and delivery costs, increased $29.1 million, or 60.2%, to $77.4 million, during fiscal 2012, compared to $48.3 million during fiscal 2011, primarily as a result of the increase in net sales and in the number of stores we operated during fiscal 2012, as compared with the prior year period. Other cost of sales included $2.6 million of acquisition-related costs related to the Mattress Giant, Mattress X-Press and Mattress Source acquisitions, consisting of costs to transfer merchandise to and from the acquired stores and temporary storage facilities during the integration periods and duplicate costs attributable to certain warehouse facilities that have or will have to be consolidated in the future.
Gross profit from retail operations. As a result of the above, gross profit from retail operations increased $116.9 million, or 42.4%, to $392.8 million, during fiscal 2012, compared with $275.9 million during fiscal 2011. Gross profit from retail operations as a percentage of net sales decreased to 39.0% during fiscal 2012, as compared to 39.2% during fiscal 2011.
Franchise fees and royalty income. Franchise fees and royalty income increased $0.7 million, or 15.2%, to $5.4 million during fiscal 2012, compared to $4.7 million during fiscal 2011. The increase in income was attributable to a $1.0 million increase in royalty income, which was primarily due to increases in sales for franchise stores as compared with the prior year period mainly due to franchise store sales increases, which was partially offset by a $0.3 million decrease in initial fees, resulting from a decrease in the number of new franchisee stores opened during fiscal 2012 as compared with fiscal 2011. Our franchisees operated 158 stores at January 29, 2013.
Sales and marketing expenses. Sales and marketing expenses increased $78.0 million, or 46.5%, to $245.6 million during fiscal 2012, compared to $167.6 million during fiscal 2011. Sales and marketing expenses as a percentage of net sales increased to 24.4% during fiscal 2012, compared to 23.8% during fiscal 2011. The components of sales and marketing expenses are explained below.
Advertising expense increased $27.0 million, or 44.9%, to $87.2 million during fiscal 2012, from $60.2 million during fiscal 2011. Advertising expense as a percentage of net sales increased to 8.7% during fiscal 2012, compared to 8.5% during fiscal 2011. The increase in the amount of advertising spending was mainly attributable to our efforts to increase the number of customers shopping in our stores, and to a lesser extent, our expansion into new markets. We expect to maintain or increase advertising expense as a percentage of sales if we continue to experience sales per store and comparable-store sales growth and gain expense leverage in other operating expense areas. We receive funds from time to time from certain vendors for the advertisement of their products, and we recognize these funds as a direct reduction of advertising expense. The amount of vendor advertising funds that were recognized as a reduction of advertising expense totaled $5.2 million during fiscal 2012, compared with $3.9 million during fiscal 2011.
Other sales and marketing expenses, consisting mainly of salesman compensation costs, but also including costs incurred to accept payments from our customers, such as credit card and third party finance fees, increased $51.0 million, or 47.4%, to $158.3 million during fiscal 2012, compared to $107.4 million during fiscal 2011, primarily as a result of the increase in net sales during the period due to an increase in the number of stores we operated. Other sales and marketing expenses as a percentage of net sales increased to 15.7% during fiscal 2012, compared to 15.3% during fiscal 2011. The increase in expense as a percentage of sales reflects higher per store staffing levels that occurred in connection with the recent acquisitions and related pre-acquisition hiring efforts, as well as lower than anticipated attrition levels of the former Mattress Giant sales associates. We expect that per store staffing levels will normalize over the next two quarters primarily through planned store growth.
General and administrative expenses. General and administrative expenses increased $21.9 million, or 42.5%, to $73.6 million during fiscal 2012, compared to $51.7 million during fiscal 2011. General and administrative expenses as a percentage of net sales remained flat at 7.3% during both fiscal 2012 and
42
Table of Contents
fiscal 2011. General and administrative expenses increased primarily as a result of our growth, and increased costs associated with being a publicly traded company, including a $10.4 million increase in wages and benefits resulting from employee additions to our corporate office, $9.4 million of acquisition-related costs related to the Mattress Giant, Mattress X-Press and Mattress Source acquisitions, $1.9 million of costs incurred in connection with a secondary offering of shares of common stock by certain of our stockholders which was completed in October 2012, and an aggregate increase of $0.2 million in various other general and administrative expense categories. We expect to continue making investments in our corporate infrastructure commensurate with our growth strategy.
Intangible asset impairment charge. During fiscal 2012, we recognized an impairment charge in the amount of $2.1 million to reduce the carrying amount of our Mattress Discounters trade name intangible to its estimated fair value as a result of our decision to rebrand 20 stores asMattress Firm® that were acquired in 2010 in and around Virginia Beach, Virginia and had been operated under the acquired brandMattress Discounters. No impairment charges related to our intangible assets were recognized in fiscal 2011.
Loss on store closings and impairment of store assets. Loss on store closings and impairment of store assets increased $0.3 million to $1.1 million during fiscal 2012 compared with $0.8 million during fiscal 2011. The increase in the loss during fiscal 2012 was mainly attributable to an increase in the amount of remaining lease commitments on stores that we closed during the fiscal year.
Other expense, net. Other expense, net, for both periods consisted primarily of interest expense. Interest expense decreased $20.0 million, or 68.4%, to $9.3 million during fiscal 2012, compared to $29.3 million during fiscal 2011, primarily as a result of the repayment of related-party debt in conjunction with the initial public offering in November 2011. Fiscal 2011 also includes a $5.7 million loss from debt extinguishment related to the repayment of related-party debt.
Income tax (benefit) expense. We recognized $26.7 million of income tax expense during fiscal 2012, compared to $(8.8) million of income tax benefit during fiscal 2011. The effective tax rate was 40.1% during fiscal 2012, compared to (34.5)% during fiscal 2011, and differs primarily as a result of the change in the valuation allowance recorded against our deferred tax assets during fiscal 2011.
Our estimated full year effective tax rate during fiscal 2012 was 40.1%, which is above the federal statutory rate of 35.0% primarily due to state income taxes and certain acquisition-related and secondary offering costs that are were deductible for income tax purposes.
Net income (loss). As a result of the above, our net income was $39.9 million during fiscal 2012 compared to $34.4 million during fiscal 2011.
Fiscal 2011 Compared to Fiscal 2010
Net sales. Net sales increased $209.8 million, or 42.5%, to $703.9 million during fiscal 2011, compared to $494.1 million for 2010. The components of the net sales increase in fiscal 2011 were as follows (in millions):
| | | | |
| | Increase
(Decrease)
in Net Sales | |
|---|
Comparable-store sales | | $ | 99.0 | |
New stores | | | 83.4 | |
Acquired stores | | | 33.0 | |
Closed stores | | | (5.6 | ) |
| | | | |
| | $ | 209.8 | |
| | | | |
43
Table of Contents
The increase in comparable-store net sales represents a 20.5% comparable-store sales growth, which was primarily the result of an increase in the number of customer transactions. The increase in our net sales from new stores was the result of 106 new stores opened at various times throughout fiscal 2011 compared to 86 stores opened throughout fiscal 2010, prior to their inclusion in comparable-store sales results in fiscal 2011 beginning with the thirteenth fiscal period of operations. The increase in net sales for acquired stores was the result of the acquisition of 55 stores in November 2011 compared to 33 stores acquired in fiscal 2010 from two separate acquisitions in October 2010 and December 2010, prior to their inclusion in comparable-store sales results in fiscal 2011 beginning with the first full month after the one-year anniversaries of the acquisitions. We closed 24 stores in fiscal 2011 and 14 stores in fiscal 2010 and the reduction in sales during fiscal 2011 from these closings totaled $5.6 million. We operated 729 stores at the end of fiscal 2011, compared with 592 stores at the end of fiscal 2010.
Cost of sales. Cost of sales increased $114.0 million, or 36.3%, to $428.0 million during fiscal 2011, compared to $314.0 million during fiscal 2010. The major components of the increase in cost of sales are explained below. Cost of sales as a percentage of net sales decreased to 60.8% during fiscal 2011, compared to 63.5% during fiscal 2010.
Product costs increased $87.5 million, or 47.6%, to $271.4 million during fiscal 2011, compared with $183.9 million during fiscal 2010. Product costs as a percentage of net sales increased to 38.6% during fiscal 2011, as compared to 37.2% during fiscal 2010. The increase in the amount of product costs during fiscal 2011 is the result of the corresponding increase in net sales. The increase of this expense as a percentage of net sales during fiscal 2011 is primarily the result of an increase in the mix of products with higher product costs. Product costs as a percentage of net sales are affected by several factors, including the mix of the products we sell, the terms of our vendor agreements and the competitive environment in which we operate. The combination of these effects may result in product costs as a percentage of net sales in future periods that are higher or lower than our recent results.
Store and warehouse occupancy costs, consisting primarily of lease-related costs of rented facilities, increased $13.7 million, or 17.4%, to $92.6 million during fiscal 2011, compared to $78.9 million during fiscal 2010. Store and warehouse occupancy costs as a percentage of net sales decreased to 13.2% during fiscal 2011, as compared to 16.0% during fiscal 2010. The increase in the amount of expense during fiscal 2011 is mainly attributable to the increase in the number of stores we operated. The reduction of expense as a percentage of net sales was primarily attributable to comparable-store sales growth in fiscal 2011 as compared with fiscal 2010.
Depreciation expense of leasehold improvements and other fixed assets used in store and warehouse operations increased $2.6 million, or 20.1%, to $15.7 million during fiscal 2011, compared with $13.1 million during fiscal 2010. The increase in depreciation expense was primarily attributable to the increase in the number of stores we operated during fiscal 2011 as compared with fiscal 2010.
Other cost of sales, consisting of store and warehouse operating and delivery costs, increased $10.2 million, or 26.8%, to $48.3 million, during fiscal 2011, compared to $38.1 million during fiscal 2010, primarily as a result of the increase in net sales and in the number of stores we operated during fiscal 2011, as compared with fiscal 2010.
Gross profit from retail operations. As a result of the above, gross profit from retail operations increased $95.7 million, or 53.1%, to $275.9 million during fiscal 2011, as compared with $180.2 million during fiscal 2010. Gross profit from retail operations as a percentage of net sales increased to 39.2% during fiscal 2011, as compared to 36.5% during fiscal 2010.
Franchise fees and royalty income. Franchise fees and royalty income is comprised of initial fees earned upon the opening of each new franchisee store and ongoing royalty income that is earned on a percentage of franchisee net sales. Franchise fees and royalty income increased $1.5 million, or 47.0%,
44
Table of Contents
to $4.7 million during fiscal 2011, compared with $3.2 million during fiscal 2010. The increase in income was comprised of a $0.2 million increase in initial fees, which was attributable to an increase in the number of new franchisee stores opened during fiscal 2011 as compared with fiscal 2010, and a $1.3 million increase in royalty income, which was mainly attributable to an increase in net sales per store and total sales results for franchisee stores as compared with fiscal 2010. Our franchisees operated 128 stores at January 31, 2012.
Sales and marketing expenses. Sales and marketing expenses increased $53.6 million, or 47.1%, to $167.6 million during fiscal 2011, compared to $114.0 million during fiscal 2010. The components of sales and marketing expenses are explained below. Sales and marketing expenses as a percentage of net sales increased to 23.7% during fiscal 2011, compared to 23.1% during fiscal 2010.
Advertising expense increased $21.1 million, or 53.8%, to $60.2 million during fiscal 2011, compared with $39.1 million during fiscal 2010. Advertising expense as a percentage of net sales increased to 8.5% during fiscal 2011, as compared to 7.9% during fiscal 2010. The increase in the amount of advertising spending was mainly attributable to our efforts to increase the number of customers shopping in our stores and, to a lesser extent, our expansion into new markets in which we operate as a result of new store growth and acquisitions. We expect to maintain or increase advertising expense as a percentage of sales if we continue to experience sales per store and comparable-store sales growth and gain expense leverage in other operating expense areas. We receive funds from time to time from certain vendors for the advertisement of their products, and we recognize the funds as a direct reduction of advertising expense. The amount of vendor advertising funds that were recognized as a reduction of advertising expense totaled $3.9 million during fiscal 2011, compared with $3.7 million during fiscal 2010.
Other sales and marketing expenses, consisting of salesman compensation costs and also including fees associated with customer credit card and third party finance fees, increased $32.5 million, or 43.5%, to $107.4 million during fiscal 2011 compared with $74.9 million during fiscal 2010 primarily as a result of the increase in net sales during fiscal 2011. Other sales and marketing expenses as a percentage of net sales increased to 15.3% during fiscal 2011, compared to 15.2% during fiscal 2010.
General and administrative expenses. General and administrative expenses increased $17.6 million, or 51.5%, to $51.7 million during fiscal 2011, compared to $34.1 million during fiscal 2010. General and administrative expenses as a percentage of net sales increased to 7.3% during fiscal 2011 as compared to 6.9% during fiscal 2010. The increase was primarily a result of our growth, including a $7.7 million increase in wages and benefits resulting from employee additions in our corporate office, a $3.6 million increase in performance-based compensation costs, a $1.0 million increase in stock-based compensation costs and an aggregate increase of $5.3 million in various general and administrative expense categories.
Goodwill impairment charge. During fiscal 2010, we recognized pre-tax impairment charges totaling $0.5 million to reduce the carrying amount of our goodwill to estimated fair value for two reporting units. No impairment charges related to our goodwill or intangible assets were recognized in fiscal 2011.
Loss on store closings and impairment of store assets. Loss on store closings and impairment of store assets decreased $1.7 million to $0.8 million during fiscal 2011 compared with $2.5 million during fiscal 2010. The decrease in the loss during fiscal 2011 was mainly attributable to a reduction in the amount of remaining lease commitments on stores that we closed during the fiscal year.
Other expense, net. Other expense, net during fiscal 2011 consists primarily of interest expense and loss on debt extinguishment. Interest expense decreased $1.8 million, or 5.6%, to $29.3 million during fiscal 2011, as compared to $31.1 million during fiscal 2010. During fiscal 2011 a loss on debt extinguishment of $5.7 million was recognized compared to no loss during fiscal 2010. The decrease in
45
Table of Contents
interest expense and the loss on debt extinguishment were due to reductions in debt related to prepayments and conversions of debt into shares of our common stock in advance of, and in connection with, the initial public offering completed in November 2011, which resulted in the retirement of the full outstanding balances of the 2009 Loan Facility (defined below), the PIK Notes (defined below) and the Convertible Notes (defined below).
Income tax (benefit) expense. We recognized ($8.8) million of income tax benefit during fiscal 2011, compared to $0.8 million of income tax expense during fiscal 2010. The effective tax rate was (34.5)% during fiscal 2011, compared to 70.7% during fiscal 2010, and differs primarily as a result of the change in the valuation allowance for deferred tax assets recognized during fiscal 2011 as compared with the prior year.
The effective tax rate during fiscal 2011 differs from the federal statutory rate primarily as a result of the change in valuation allowance for deferred tax assets in an amount that coincides with a reduction in deferred tax assets associated with current year operations as well as the release of the remaining valuation allowance during the fourth quarter ended January 31, 2012.
Prior to January 31, 2012, we provided a valuation allowance for deferred tax assets based on our evaluation that realizability of such assets was not "more likely than not" as required by generally accepted accounting principles. ASC 740 (Accounting for Income Taxes) requires that all available evidence, both positive and negative, be identified and considered in making a determination as to whether it is "more likely than not" that all of the deferred tax assets related to tax attributes and other deductible temporary differences will be realized. During fiscal 2011, we continuously evaluated additional facts representing positive and negative evidence in the determination of the realizability of our deferred tax assets. Such deferred tax assets consisted primarily of net operating loss carryforwards and temporary differences on goodwill and noncurrent liabilities. The Company's results of operations during fiscal 2011 resulted in the utilization of a portion of net operating loss carryforwards. Furthermore, during the fourth quarter of fiscal 2011, based on additional evidence regarding our past earnings, scheduling of deferred tax liabilities and projected future taxable income from operating activities, including the cessation of interest deductions due to current year debt retirements resulting from the completion of the initial public offering on November 23, 2011, we determined that it was more likely than not that the deferred tax assets as of January 31, 2012 would be realized. Accordingly, the results of operations during fiscal 2011 include a deferred tax benefit in the amount of $20.1 million related to the change in valuation allowance for deferred tax assets that occurred through the combination of current operations and the release of the remaining valuation allowance as of January 31, 2012.
Net income (loss). As a result of the above, our net income was $34.4 million during fiscal 2011 compared to $0.3 million during fiscal 2010.
Liquidity and Capital Resources
Cash Flows
The following table summarizes the principal elements of our cash flows (in thousands):
| | | | | | | | | | |
| | Fiscal
2010 | | Fiscal
2011 | | Fiscal
2012 | |
|---|
Total cash provided by (used in): | | | | | | | | | | |
Operating activities | | $ | 42,429 | | $ | 81,675 | | $ | 78,738 | |
Investing activities | | | (38,092 | ) | | (42,314 | ) | | (131,655 | ) |
Financing activities | | | (286 | ) | | 4,140 | | | 19,527 | |
| | | | | | | | |
Net increase (decrease) in cash and cash equivalents | | | 4,051 | | | 43,501 | | | (33,390 | ) |
Cash and cash equivalents, beginning of period | | | 394 | | | 4,445 | | | 47,946 | |
| | | | | | | | |
Cash and cash equivalents, end of period | | $ | 4,445 | | $ | 47,946 | | $ | 14,556 | |
| | | | | | | | |
46
Table of Contents
Operating cash flows. Net cash provided by operating activities was $78.7 million for fiscal 2012, compared to $81.7 million for fiscal 2011. The $3.0 million decrease in cash flows from operating activities as compared to the prior year was primarily due to (i) a $5.5 million improvement in net income, which includes an $8.9 million increase in cash income taxes resulting from our utilization of net operating loss carryforwards to offset only a portion of taxable income during 2012, and as increased by $13.0 million from the exclusion of the changes in noncash items included in net income, compared to the prior year, and (ii) changes in operating assets and liabilities, which resulted in an incremental use of operating cash flows of $21.5 million, as compared to the prior year, consisting primarily of (a) $5.2 million in cash used in fiscal 2012 to satisfy obligations related to accounts payable and accrued liabilities assumed in acquisitions, (b) $8.9 million in cash used for increases in floor sample inventories related to the addition of new and acquired stores in fiscal 2012, and (c) $7.4 million in cash used from changes in other operating assets and liabilities related to our growth and from normal fluctuations.
Net cash provided by operating activities was $81.7 million for fiscal 2011, compared to $42.4 million for fiscal 2010. The $39.2 million increase in cash flows from operating activities was comprised of the $34.0 million improvement in our net income during fiscal 2011 as compared to the prior year and an $11.2 million increase in cash from changes in operating assets and liabilities as compared to the prior year due to an increase in accounts payable and accrued liabilities due to increased sales levels, partially offset by a $6.0 million decrease in adjustments to reconcile net income to net cash provided by operating activities primarily due to a deferred income tax benefit upon release of our valuation allowance, net of a non-cash loss from debt extinguishment.
Investing cash flows. Net cash used in investing activities was $131.6 million for fiscal 2012, compared to net cash used of $42.3 million for fiscal 2011. The $89.3 million increase was primarily due to the May 2012 Mattress Giant, September 2012 Mattress X-Press, and December 2012 Mattress Source acquisitions that utilized approximately $43.9 million, $7.7 million and $11.4 million in cash during fiscal 2012, respectively. Capital expenditures increased $34.3 million primarily due to new store openings, rebranding and renovations of acquired stores and the ongoing design and implementation of our new enterprise resource planning system. Excluding stores added through acquisitions, we opened 118 new stores during fiscal 2012, compared to 106 new stores in fiscal 2011. The renovations of Mattress Giant stores acquired in November 2011 and May 2012 resulted in approximately $17.8 million in capital expenditures during fiscal 2012. The renovations of Mattress X-Press and Mattress Source stores acquired in September 2012 and December 2012, respectively, resulted in approximately $2.4 million in capital expenditures during fiscal 2012. We expect to incur approximately $3.0 million during fiscal 2013 to complete the rebranding and renovation of the acquired Mattress Giant, Mattress X-Press and Mattress Source stores.
Net cash used in investing activities was $42.3 million for fiscal 2011, compared to $38.1 million in fiscal 2010. Capital expenditures increased $7.0 million. Excluding stores added through acquisitions, we opened 106 new stores during fiscal 2011, compared to 85 new stores in fiscal 2010. Partially offsetting the increase in cash used for investing activities during fiscal 2011 was a decrease of $2.8 million in cash used to complete our acquisition in fiscal 2011 as compared to two acquisitions that occurred in fiscal 2010. The fiscal 2011 acquisition added 55 new stores.
Financing cash flows. Our financing cash flows consist of (i) proceeds from the issuance of common stock, exercise of stock options, issuance of debt and borrowings under the revolving portion of the 2012 Senior Credit Facility, and (ii) uses primarily from scheduled payments and, from time-to-time, prepayments of our outstanding amounts of debt and borrowings under the revolving portion of the 2012 Senior Credit Facility. Net cash provided by financing activities was $19.5 million for fiscal 2012, compared to net cash provided of $4.1 million for fiscal 2011. The $15.4 million increase was primarily the result of net borrowings under the revolving portion of the 2012 Senior Credit Facility.
47
Table of Contents
During fiscal 2011, net cash provided by financing activities was $4.1 million, compared to net cash used of $0.3 million in fiscal 2010. The $4.4 million increase in net cash provided by financing activities during fiscal 2011 was attributable to $110.4 million in proceeds from issuance of common stock, net of costs, in connection with the initial public offering partially offset by net debt repayments, utilizing proceeds from the initial public offering, and debt issuance costs in the aggregate amount of $106.3 million during fiscal 2011.
Initial Public Offering
On November 23, 2011, we completed the initial public offering of 6,388,888 shares of our common stock, par value $0.01 per share, at $19.00 per share, before underwriting discounts and commissions. The initial public offering generated net proceeds to us of approximately $110.4 million, after deducting the underwriting discount and offering-related costs. The Company used a portion of the proceeds to repay the 2007 Subordinated Loan Facility, as amended in March 2009 (the "2009 Loan Facility") in full. In connection with the offering, the principal and accrued interest of the 12% payment-in-kind investor notes maturing at various times from October 24, 2012 through March 19, 2015 (the "PIK Notes") were either repaid or converted into shares of our common stock and the 12% convertible notes due July 18, 2016 (the "Convertible Notes") were converted into shares of our common stock.
As a result, we reduced our outstanding debt, with a weighted average interest rate of 14.5%, in the aggregate amount of $188.0 million in principal and accrued interest thereon. We recognized a loss on debt extinguishment in the amount of $5.7 million during the fiscal 2011, related to the reduction of debt in advance of and in connection with the initial public offering. As a result of the initial public offering we are incurring significantly lower amounts of interest expense.
Sources of Liquidity and Capital Requirements
Our primary uses of cash are to fund growth capital and maintenance expenditures for our stores and distribution centers, purchases and replacement of floor sample inventories maintained in our stores, scheduled debt service payments and strategic acquisitions of mattress specialty retailers. Historically, we have satisfied these cash requirements from cash flows provided by our operations and availability under the revolving portion of the 2012 Senior Credit Facility.
Historically, we have collected payment from our customers at or near the time of sale, and, as such, we do not carry significant accounts receivable balances from our customers. Many of our suppliers deliver product to our distribution centers within 48 hours following our placement of a purchase order, which allows us to carry lower inventory levels. We pay the majority of our vendors for our purchases on terms that, on average, allow us to collect payments on the sale of our products before we must pay our vendors. The attributes of our operating cycle lower our working capital requirements and have historically allowed us to operate for extended periods while maintaining a negative working capital position.
Our future capital requirements will vary based on the number of additional stores, including relocated stores, we open and the number of stores we choose to renovate, and the number and size of any acquisitions we choose to make, including franchisee acquisitions. Our decisions regarding opening, relocating or renovating stores, and whether to engage in strategic acquisitions, are based in part on macroeconomic factors and the general state of the U.S. economy, as well as the local economies in the markets in which our stores are located.
We plan to spend approximately $55.0 million to $57.0 million in capital expenditures during fiscal 2013, including estimated costs to complete the rebranding and renovation of stores from the recent acquisitions. We are permitted to spend up to $80.0 million per year in capital expenditures under the terms of the 2012 Senior Credit Facility. The permitted amount may be increased for any year by the
48
Table of Contents
amount of equity capital that is contributed to Mattress Holding Corp. during the year for that purpose. In addition, to the extent capital expenditures made in any year are less than the permitted amount, the amount of the shortfall in that year may increase the permitted amount of capital expenditures for the immediately succeeding (but not any subsequent) year. We can also utilize the permitted amount from the following year to increase the permitted amount in the current year with a reduction in the following year's permitted amount. We believe the permitted amount of capital expenditures under our 2012 Senior Credit Facility is in excess of our expected capital expenditure requirements for fiscal 2013.
We believe that we will be able to satisfy our capital requirements for the next twelve months, including supporting our existing operations, continuing our growth strategy, and satisfying our scheduled debt service payments, through a combination of our existing reserves of cash and cash equivalents, internally generated cash flows from operations, and, as required, borrowings under the revolving portion of the 2012 Senior Credit Facility. The revolving portion of the 2012 Senior Credit Facility allows us to borrow up to $100.0 million, of which up to $15.0 million is available for issuance as letters of credit. There were $21.0 million in outstanding borrowings under the revolving facility as of January 29, 2013. On January 29, 2013, outstanding letters of credit under the revolving facility were $1.4 million, resulting in $77.6 million of available borrowings as of such date. The $100.0 million revolving credit facility portion of the 2012 Senior Credit Facility matures on January 18, 2015. In addition, we had $14.6 million of cash and cash equivalents as of January 29, 2013, compared to cash and cash equivalents of $47.9 million as of January 31, 2012. Subsequent to January 29, 2013, we repaid $16.0 million of revolving borrowings and, as of April 1, 2013 there were $5.0 million in outstanding revolving borrowings and $93.6 million of available borrowings.
During fiscal 2011 and fiscal 2012, we utilized net operating loss carryforwards generated in prior years to reduce a significant portion of our federal and state income tax requirements. The remainder of those prior year net operating loss carryforwards were fully utilized to offset a portion of taxable income during fiscal 2012, resulting in an increase in the cash requirements for income taxes of $8.9 million, as compared with fiscal 2011. We had approximately $12.0 million of net operating loss carryforwards at January 29, 2013 that begin expiring in fiscal 2029, if not utilized to offset future taxable income. These net operating loss carryforwards arose from the acquisition of MGHC Holding Corporation, and after application of Section 382 of the Internal Revenue Code of 1986, as amended (the "Code"), are limited to an average use of $2.7 million per year over the next five years, unless we undergo a more than 50% "ownership change" within the meaning of the Code, which may limit our ability to utilize pre-change losses. We expect that our cash requirements for income taxes will increase significantly during fiscal 2013 due to the significant reduction in net operating loss carryforwards available to us in future periods.
Debt Service
As of January 29, 2013, we had total indebtedness of $253.0 million. The components of our debt as of January 29, 2013 were as follows (amounts in thousands):
| | | | |
2012 Senior Credit Facility | | $ | 247,704 | |
Other | | | 5,295 | |
| | | | |
Total long-term debt | | $ | 252,999 | |
| | | | |
2012 Senior Credit Facility—On January 18, 2007, Mattress Holding Corp., an indirect consolidated subsidiary of ours, entered into a credit agreement with UBS Securities LLC and certain of its affiliates and other lenders for a senior secured term loan and revolving credit facility, which was amended on November 5, 2012 (as amended, the "2012 Senior Credit Facility"). The amendment, among other things, (i) increased the revolving loan commitment from $35 million to $100 million,
49
Table of Contents
(ii) extended the maturity date of the revolving loan by two years to January 2015, (iii) extended the maturity date of outstanding term loans having an aggregate principal amount of $200 million by two years to January 2016 ("extended term loans"), (iv) increased the interest rate applicable to amounts outstanding under the extended term loans and revolving loans by 1.25%, (v) increased the amount of permitted capital expenditures to $80 million on an annual basis, beginning with capital expenditures incurred during fiscal 2012, and (vi) increased the maximum cumulative amount that Mattress Holding Corp. and its subsidiary guarantors may incur for permitted acquisitions through the extended maturity date. We incurred fees in connection with the amendment of approximately $1.5 million. Certain holders of term loans with an outstanding balance of $26.7 million at January 29, 2013 did not elect to extend the original January 2014 maturity date in connection with the November 5, 2012 amendment ("non-extended term loans").
As of January 29, 2013, the 2012 Senior Credit Facility consisted of (i) a $240.0 million term loan with outstanding term borrowings of $226.7 million and (ii) $21.0 million of outstanding borrowings under a $100.0 million revolving credit facility maturing on January 18, 2015, which includes a $15.0 million letter of credit subfacility and a $5.0 million swingline loan subfacility. At January 29, 2013, there was approximately $1.4 million in outstanding letters of credit, resulting in remaining availability under the revolving credit facility of $77.6 million.
Borrowings under the 2012 Senior Credit Facility bear interest at a rate equal to an applicable margin plus, at our option, either (i) a base rate determined by reference to the highest of (a) the corporate base rate of interest established by the administrative agent and (b) the federal funds effective rate from time to time plus 0.50%, or (ii) the London Interbank Offered Rate, or "LIBOR," determined by reference to the costs of funds for deposits for the interest period relevant to such borrowing adjusted for certain additional costs.
The applicable margin percentages for extended term loans are 2.50% for base rate loans and 3.50% for LIBOR loans. The applicable margin percentages for non-extended term loans are 1.25% for base rate loans and 2.25% for LIBOR loans. The applicable margin percentages for revolving loans are 2.50% for base rate loans and 3.50% for LIBOR loans. Swingline loans bear interest at an interest rate equal to the interest rate for base rate loans, and as of January 29, 2013, no such borrowings were outstanding. On the last day of each quarter, we also pay a commitment fee (payable in arrears) in respect of any unused commitments under the revolving credit facility, subject to adjustment based upon the level of the total leverage ratio which varies from 0.375% to 0.50%. As of January 29, 2013, the commitment fee was 0.375%. We also pay fees for the issuance and maintenance of letters of credit.
Outstanding term borrowings under the 2012 Senior Credit Facility are payable in quarterly principal installments of $0.6 million in fiscal 2013 and quarterly principal installments of $0.5 million in fiscal 2014 and fiscal 2015. In addition, non-extended term loans in aggregate principal amount of approximately $26 million mature on January 18, 2014. Accrued interest on outstanding borrowings is payable from time-to-time and no less frequently than quarterly. Furthermore, we are subject to an annual mandatory principal prepayment in an amount equal to a portion of "excess cash flow," as defined in the 2012 Senior Credit Facility, payable no later than 120 days after the end of each fiscal year. Such prepayments are first applied to reduce scheduled quarterly principal repayments for the next four quarters in order of maturity and then to reduce future quarterly payments through maturity on a pro-rata basis. We made an excess cash flow payment in the amount of $0.8 million on June 1, 2011, with respect to excess cash flows related to fiscal 2010. No excess cash flow payments were required with respect to the operations in fiscal 2011 and fiscal 2012. There are other mandatory prepayment requirements, subject to certain exceptions, from the net cash proceeds of certain asset sale and casualty and condemnation events, subject to reinvestment rights, from the net cash proceeds of any incurrence of certain debt, other than debt permitted under the 2012 Senior Credit Facility, and from the net cash proceeds of specified issuances of preferred equity securities. No such prepayments
50
Table of Contents
were required in fiscal 2010, fiscal 2011, and fiscal 2012. We may voluntarily repay outstanding loans under the 2012 Senior Credit Facility at any time without premium or penalty, other than customary "breakage" costs with respect to LIBOR loans.
Other Indebtedness. Our subsidiaries have various notes payable related to the purchase Mattress X-Press and of equipment totaling $5.3 million that bear interest at 6.8%-8.0%, with monthly principal and interest payments of various amounts through 2013. Notes payable for financing of equipment purchases are collateralized by certain equipment with carrying amounts that approximate the outstanding principal balances of the related notes payable as of January 29, 2013.
Covenant Compliance
We were in compliance with all of the financial covenants required under the 2012 Senior Credit Facility and our other indebtedness as of January 29, 2013. We believe that we will be able to maintain compliance with the various covenants required under our debt agreements for the next twelve months without amending any of the debt agreements or requesting waivers from the lenders that are party to the debt agreements.
Critical Accounting Policies and Use of Estimates
Our consolidated financial statements are prepared in accordance with U.S. GAAP. In connection with the preparation of our financial statements, we are required to make assumptions and estimates about future events, and apply judgments that affect the reported amounts of assets, liabilities, revenues, expenses and the related disclosures. We base our assumptions, estimates and judgments on historical experience, current trends and other factors that management believes to be relevant at the time our consolidated financial statements are prepared. On a regular basis, we review the accounting policies, assumptions, estimates and judgments to ensure that our financial statements are presented fairly and in accordance with U.S. GAAP. However, because future events and their effects cannot be determined with certainty, actual results could differ from our assumptions and estimates, and such differences could be material.
51
Table of Contents
Our significant accounting policies are discussed in Note 1,Business and Summary of Significant Accounting Policies, of the Notes to Consolidated Financial Statements, included elsewhere in this Annual Report on Form 10-K. We believe that the following accounting estimates are the most critical to aid in fully understanding and evaluating our reported financial results, and they require our most difficult subjective or complex judgments, resulting from the need to make estimates about the effect of matters that are inherently uncertain. We have reviewed these critical accounting estimates and related disclosures with the audit committee of our board of directors.
| | | | | | | | |
| Description | |
| | Judgments and Uncertainties | |
| | Effect if Actual Results Differ From
Assumptions |
|---|
| Revenue Recognition | | | | | | | | |
Sales revenue, including fees collected for delivery services, is recognized upon delivery and acceptance of mattresses and bedding products by the Company's customers and is recorded net of returns. Customer deposits collected prior to the delivery of merchandise are recorded as a liability.
The Company accrues a liability for estimated sales returns and exchanges in the period that the related sales are recognized. The Company provides its customers with a comfort satisfaction guarantee whereby the customer may return or exchange the original mattress anytime during 100 days from the date of original purchase. Mattresses received back are reconditioned pursuant to state law and resold through the Company's clearance center stores as used merchandise. The Company accrues a liability for the estimated costs, net of estimated restocking fees, related to the diminishment in value of the returned merchandise at the time the sale is recognized based upon historical experience. The liability for sales returns and sales exchanges is included in other accrued liabilities. |
|
|
|
Our revenue recognition accounting methodology contains uncertainties in that management is required to make assumptions and to apply judgment to estimate future sales returns and exchanges and the associated costs.
Effective August 2010, we revised our return and exchange policy to enable our customers to return products for any reason up to 100 days after the purchase date for either a full refund or exchange credit without the incurrence of exchange or other fees. The policy is referred to as theHappiness Guarantee®. Prior to this new policy, a customer could exchange a mattress for a similar mattress from 30 days to 90 days from the original purchase date, subject to a restocking fee, although the restocking fee could be waived at the discretion of the sales associate.
TheHappiness Guarantee® has resulted in an increased amount of returns and exchanges. The increased activity and the elimination of exchange fee collections will continue to increase the estimated cost of sales returns and exchanges. |
|
|
|
We have not made any material changes in the policy we use to measure the estimated liability for sales returns and exchanges. TheHappiness Guarantee® has resulted in an increase in such costs and we will review and revise our estimates as additional experience is obtained. However, if actual results are not consistent with our estimates or assumptions, we may be exposed to losses or gains that could be material. |
|
|
|
|
|
|
|
|
|
52
Table of Contents
| | | | | | | | |
| Description | |
| | Judgments and Uncertainties | |
| | Effect if Actual Results Differ From
Assumptions |
|---|
| Vendor Incentives | | | | | | | | |
Cash payments received from vendors as incentives to enter into or to maintain long-term supply arrangements, including payments received in connection with the opening of new stores, are deferred and amortized as a reduction of cost of sales using a systematic approach. Payments received from vendors in connection with new store openings are deferred and amortized over 36 months, which is the estimated period over which the incentives are earned.
Vendor incentives that are based on a percentage of the cost of purchased merchandise, such as cooperative advertising funds, are accounted for as a reduction of the price of the vendor's products and result in a reduction of cost of sales when the merchandise is sold. Vendor incentives that are direct reimbursements of costs incurred by the Company to sell the vendor's products are accounted for as a reduction of the related costs when recognized in the Company's results of operations. |
|
|
|
Certain of our vendor agreements contain purchase volume incentives that require minimum purchase volumes and may provide for increased incentives when graduated purchase volumes are met. Amounts accrued as vendor receivables throughout the year could be impacted if actual purchase volumes differ from projected annual purchase volumes. |
|
|
|
We have not made any material changes in the policy we use to recognize vendor receivables during the past three fiscal years.
If actual results are not consistent with the assumptions and estimates used, we may be exposed to additional adjustments that could materially, either positively or negatively, impact our gross profit and inventory valuation. However, substantially all receivables associated with these activities are collected within the following fiscal year and all amounts deferred against inventory turnover within the following fiscal year are realized. As a result, subjective long-term estimates are not required. Adjustments to our gross profit and inventory in the following fiscal year have historically not been material. |
Self-Insured Liabilities |
|
|
|
|
|
|
|
|
We are self-insured for certain losses related to employee health and workers' compensation liability claims. However, we obtain third-party insurance coverage to limit our exposure to these claims.
When estimating our self-insured liabilities, we consider a number of factors, including historical claims experience, demographic factors, severity factors and valuations provided by independent third-party actuaries.
Periodically, we review our assumptions and the valuation provided by independent third-party actuaries to determine the adequacy of our self-insured liabilities. |
|
|
|
Our self-insurance liabilities contain uncertainties because management is required to make assumptions and to apply judgment to estimate the ultimate cost to settle reported claims and claims incurred but not reported at the balance sheet date. |
|
|
|
We have not made any material changes in the policy we use to establish our self-insured liabilities during the past three fiscal years.
We do not believe there is a reasonable likelihood there will be a material change in the estimates or assumptions we use to calculate our self-insured liabilities. However, if actual results are not consistent with our estimates or assumptions, we may be exposed to losses or gains that could be material. |
|
|
|
|
|
|
|
|
|
53
Table of Contents
| | | | | | | | |
| Description | |
| | Judgments and Uncertainties | |
| | Effect if Actual Results Differ From
Assumptions |
|---|
Goodwill and Indefinite-Lived Intangible Assets | | | | | | | | |
We evaluate goodwill and indefinite-lived intangible assets for impairment annually or whenever events or changes in circumstances indicate the carrying value of the goodwill or indefinite-lived intangible assets may not be recoverable.
We assign the carrying value of these intangible assets to their "reporting units" and apply the impairment test at the reporting unit level. We complete our impairment evaluation by performing internal valuation analyses, considering other publicly available market information and using an independent valuation firm, as appropriate.
The test for goodwill impairment involves a qualitative evaluation as to whether or not it is more likely than not that the fair value of a reporting unit is less than its carrying value using an assessment of relevant events and circumstances. If any reporting unit is concluded to be more likely impaired than not the following steps are performed for such reporting unit: (1) comparing the fair value of a reporting unit with the carrying value of its net assets and (2) if the carrying value exceeds fair value, the fair value of goodwill is compared with the respective carrying value and an impairment loss is recognized in the amount of the excess. The impairment test for indefinite-lived assets consists of a comparison of the fair value of the asset with its carrying amount. If the carrying amount of an intangible asset exceeds its fair value, an impairment loss is recognized in an amount equal to that excess. After an impairment loss is recognized, the adjusted carrying amount of the asset establishes the new accounting basis. |
|
|
|
We determine enterprise fair value by reference to our publicly-traded stock price or by using widely accepted valuation techniques, including the income approach and the market approach. These types of valuation techniques contain uncertainties because they require management to make assumptions and to apply judgment to estimate industry economic factors and the profitability of future business strategies. It is our policy to conduct impairment testing based on our current business strategy in light of present industry and economic conditions, as well as our future expectations. Enterprise value is allocated to each reporting unit based on a systematic rationale and consistent methodology, which takes into consideration the relative operating performance of each reporting unit as determined by historical and expected future operating results based upon management's estimates.
The impairment test for goodwill is applied to the "reporting unit." A reporting unit is defined as an operating segment and one level below a segment, a component. Each metropolitan market is a separate operating segment. The store unit components that comprise each operating segment are aggregated within each operating segment as all of the stores have similar economic characteristics. All of our goodwill has been allocated to our market-level reporting units for impairment testing. |
|
|
|
As we test goodwill impairment at the reporting unit level, which is each company-operated metropolitan market, we may be required to incur goodwill impairment charges based on adverse changes affecting a particular metropolitan market, regardless of overall performance. Such impairment charges may have a material adverse effect on our results of operations.
The fair values of the majority of our reporting units, as determined by an allocation of total enterprise value to the reporting units based on a systematic rationale and consistent methodology, were substantially in excess of the related carrying values in the most recent impairment test performed as of the end of the fourth quarter of fiscal 2012.
We do not believe there is a reasonable likelihood that there will be a material change in the future estimates or assumptions we use to test for impairment of goodwill and other indefinite-lived intangible assets. However, if actual results are not consistent with our estimate or assumptions, we may be exposed to an impairment charge that could be material. |
54
Table of Contents
| | | | | | | | |
| Description | |
| | Judgments and Uncertainties | |
| | Effect if Actual Results Differ From
Assumptions |
|---|
| Long-Lived Assets | | | | | | | | |
Long-lived assets are evaluated for impairment whenever events or changes in circumstances indicate that the carrying value may not be recoverable. Our investment in store leasehold improvements, including fixtures and equipment, is the most significant long-lived asset.
When evaluating long-lived assets for potential impairment, we first compare the carrying value of the asset to the asset's undiscounted estimated future cash flows. If the estimated future cash flows are less than the carrying value of the asset, we calculate an impairment loss based on the asset's carrying value in excess of the asset's estimated fair value. |
|
|
|
The impairment review of long-lived assets related to stores is evaluated at the individual store level. The results of individual stores may deteriorate based on factors outside the control of the Company, such as the proximity of competitors, shifting retail trade area demographics and other macro-economic factors.
Our impairment loss calculations contain uncertainties because they require management to make assumptions and to apply judgment to estimated future cash flows and asset fair values, including forecasting useful lives of the assets and selecting the discount rate that reflects the risk inherent in future cash flows. |
|
|
|
We have not made any material changes in the policy we use to assess impairment losses during the past three fiscal years.
We do not believe there is a reasonable likelihood that there will be a material charge in the estimates or assumptions we use to calculate long-lived asset impairment losses. However, if actual results are not consistent with our estimates and assumptions used in estimating future cash flows and asset fair values, we may be exposed to losses that could be material. |
Costs Associated With Location Closings | | | | | | | | |
We lease the vast majority of our stores and other locations under long-term leases and we occasionally vacate locations prior to the expiration of the related lease. For vacated locations that are under long-term leases, we record an expense for the difference between our future lease payments and related costs (e.g., real estate taxes and common area maintenance) from the date of closure through the end of the remaining lease term, net of expected future sublease rental income.
Our estimate of future cash flows is based on historical experience; our analysis of the specific real estate market, including input from independent real estate firms; and economic conditions that can be difficult to predict. We do not discount cash flows in estimating the liability recorded for location closures. |
|
|
|
The liability recorded for location closures contains uncertainties because management is required to make assumptions and to apply judgment to estimate the duration of future vacancy periods, the amount and timing of future settlement payments, and the amount and timing of potential sublease rental income. When making these assumptions, management considers a number of factors, including the historical settlement experience, the owner of the property, the location and condition of the property, the terms of the underlying lease, the specific marketplace demand and general economic conditions. |
|
|
|
We have not made any material changes in the policy we use to establish our location closing liability during the past three fiscal years.
A 10% change in our location closing liability at January 29, 2013, would have affected net income by less than $0.1 million in fiscal 2012. |
|
|
|
|
|
|
|
|
|
55
Table of Contents
| | | | | | | | |
| Description | |
| | Judgments and Uncertainties | |
| | Effect if Actual Results Differ From
Assumptions |
|---|
Acquisitions—Purchase Price Allocation | | | | | | | | |
In accordance with accounting for business acquisitions, we allocate the purchase price of an acquired business to its identifiable assets and liabilities based on estimated fair values. The excess of the purchase price over the amount allocated to the assets and liabilities, if any, is recorded to goodwill, which is assigned to reporting units. |
|
|
|
Our purchase price allocation methodology contains uncertainties because it requires management to make assumptions and to apply judgment to estimate the fair value of acquired assets and liabilities.
Management estimates the fair value of assets and liabilities based upon quoted market prices, the carrying value of the acquired assets and widely accepted valuation techniques, including the income approach and the market approach. Unanticipated events or circumstances may occur which could affect the accuracy of our fair value estimates, including assumptions regarding industry economic factors and business strategies.
We typically engage an independent valuation firm to assist in estimating the fair value of significant assets and liabilities of acquired businesses.
The total amount of goodwill arising from an acquisition may be assigned to one or more reporting units in situations where the acquired business consists of specialty mattress retail operations in multiple metropolitan markets or when other reporting units are expected to benefit from synergies of the acquisition. The method of assigning goodwill to reporting units is reasonable and supportable and applied in a consistent manner and may involve estimates and assumptions. |
|
|
|
We do not believe there is a reasonable likelihood that there will be a material change in the future estimates or assumptions we use to complete the purchase price allocation and estimate the fair values of acquired assets and liabilities for those acquisitions completed in fiscal 2010, fiscal 2011 and fiscal 2012. However, if actual results are not consistent with our estimates or assumptions, we may be exposed to losses or gains that could be material.
The amounts of goodwill assigned to reporting units may give rise to goodwill impairment charges in future periods based upon the operating results of the reporting units relative to other reporting units and the resulting effect on the allocation of enterprise value to reporting units for goodwill impairment testing. |
|
|
|
|
|
|
|
|
|
56
Table of Contents
| | | | | | | | |
| Description | |
| | Judgments and Uncertainties | |
| | Effect if Actual Results Differ From
Assumptions |
|---|
| Product Warranties | | | | | | | | |
Pursuant to certain of our negotiated supply agreements we are responsible for manufacturer service warranties and any extended warranties we may offer. The customer is not charged a fee for warranty coverage.
We accrue for the estimated cost of warranty coverage at the time the sale is recognized. |
|
|
|
In estimating the liability for product warranties, we consider the impact of recoverable salvage value on the product received back under warranty. Based upon our historical warranty claims experience, as well as recent trends that might suggest that past experience may differ from future claims, we periodically review and adjust, if necessary, the liability for product warranties. |
|
|
|
If our actual claims during the period are materially different than our provision for warranty claims, our results could be materially and adversely affected.
During the past three fiscal years we have not made any material changes to the methodology we use to establish our reserves for warranty claims.
We do not believe that there is a reasonable likelihood that there will be a material change in the future estimates or assumptions we use to establish our provision for warranty claims. However, if actual warranty claims are not consistent with our estimates or assumptions, we may be exposed to losses or gains that could be material.
A 10% change in our warranty liability at January 29, 2013, would have affected net income by less than $0.4 million in fiscal 2012. |
|
|
|
|
|
|
|
|
|
57
Table of Contents
| | | | | | | | |
| Description | |
| | Judgments and Uncertainties | |
| | Effect if Actual Results Differ From
Assumptions |
|---|
| Income Taxes | | | | | | | | |
Deferred tax assets and liabilities are reflected on the balance sheet for temporary differences between the amount of assets and liabilities for financial and tax reporting purposes that will reverse in subsequent years. Deferred tax assets and liabilities are measured using the tax rates expected to apply to taxable income in the years in which those temporary differences are estimated to be recovered or settled. The effect on deferred tax assets and liabilities of a change in the tax rate is recognized in income or expense in the period that the change is effective. Valuation allowances are established when necessary to reduce deferred tax assets to the amounts that are more likely than not to be realized. |
|
|
|
In estimating the value of our deferred tax assets and liabilities, we are required to make judgments about the tax rates expected to be in effect in the years in which those temporary differences are estimated to be realized or settled. In addition, we are also required to make estimates about the valuation allowances that we carry against our deferred tax assets in order to bring them to their net realizable value. Finally, our estimates of reserves related to potential tax exposures when it is more likely than not that a taxing authority will take a sustainable position that is contrary to ours requires significant judgment. |
|
|
|
During fiscal 2008, we determined that it was more likely than not that 100% of the deferred tax benefit related to our net operating losses ("NOLs") would not be realized in future periods; as such, we recognized a valuation allowance to reduce the deferred tax asset to its net realizable value. As of January 31, 2012, we determined that it was more likely than not that the deferred tax assets would be realized. Accordingly, the change in valuation allowance of $20.1 million, through the combination of current year operations and the valuation allowance release due to our determination that the realization of deferred tax assets is more likely than not, resulted in a benefit to deferred tax expense in our statement of operations. |
|
|
|
|
|
|
|
|
We do not believe that there is a reasonable likelihood that there will be a material change in the future estimates or assumptions we use to establish our deferred tax assets and liabilities. |
|
|
|
|
|
|
|
|
|
58
Table of Contents
| | | | | | | | |
| Description | |
| | Judgments and Uncertainties | |
| | Effect if Actual Results Differ From
Assumptions |
|---|
| Stock-Based Compensation | | | | | | | | |
For all stock-based awards, we measure compensation cost at fair value on the date of grant and recognize compensation expense over the service period in which the awards are expected to vest.
Eligible employees were granted stock options at an exercise price equal to the grant day closing price of our common stock. A portion of the stock options granted to the Company's employees are subject to a five-year time-based vesting schedule, while the remaining portion of the stock options are subject to a four-year market-based vesting schedule, with such vesting based on specified stock price increase targets, as set forth in the option award agreement evidencing the grant of such stock options.
In addition non-employee independent directors and certain of our employees were granted restricted stock with a fair value equal to our closing stock price on the date of grant. The grants to non-employee independent directors vest over one year, while the restricted stock granted to certain of our employees vest over three years. |
|
|
|
The Company estimates the fair value of stock awards granted pursuant to the Omnibus Plan based upon the nature of the awards. Stock options that vest based upon the passage of time are valued using a Black-Scholes option pricing model, which utilizes assumptions for risk-free interest rate, dividend yield, stock price volatility and weighted average expected term. Stock options that include additional market vesting conditions are valued using a Monte Carlo Simulation approach, which utilizes similar input assumptions as the Black-Scholes option pricing model, plus a suboptimal exercise factor. The assumptions involving stock price volatility and stock option term are subject to a higher degree of uncertainty due to the limited period of time that the Company's equity shares have been publicly traded and limited experience with stock option awards. The Company has utilized data of publicly-traded peer companies to provide a reasonable basis for such assumptions and has applied the simplified method as permitted by SAB 107 and SAB 110 in determining the stock option term. |
|
|
|
We have not made any material changes in the policy we use to estimate the fair value of stock-based awards and the period over which compensation expense is recognized. However, if actual results are not consistent with our estimates or assumptions, we may be exposed to changes in stock-based compensation expense that could be material.
In addition, if actual results are not consistent with the assumptions used, the stock-based compensation expense reported in our financial statements may not be representative of the actual economic cost of the stock-based compensation. Finally, if the actual forfeiture rates are not consistent with the assumptions used, we could experience future earnings adjustments.
A 10% change in our stock-based compensation expense for the year ended January 29, 2013, would have affected net income by less than $0.3 million in fiscal 2012. |
|
|
|
|
|
|
|
|
|
Seasonality
Our business is subject to seasonal fluctuations and we generally have experienced more sales and a greater portion of income during the second and third quarters of our fiscal year due to a concentration of summer season holidays, including Memorial Day, the Fourth of July and Labor Day, and other seasonal factors. While we expect this trend to continue for the foreseeable future, we also expect that the acquisitions we make and the timing of those acquisitions may have some effect on the impact of these seasonal fluctuations.
59
Table of Contents
Summary Disclosures about Contractual Obligations and Commercial Commitments
The following summarizes certain of our contractual obligations at January 29, 2013 and the effect such obligations are expected to have on our liquidity and cash flows in future periods (amounts in thousands):
| | | | | | | | | | | | | | | | | | | | | | |
| | Payments Due by Period | |
|---|
| | Fiscal
2013 | | Fiscal
2014 | | Fiscal
2015 | | Fiscal
2016 | | Fiscal
2017 | | Thereafter | | Total | |
|---|
Long-term debt, including principal and interest(1) | | $ | 43,694 | | $ | 31,324 | | $ | 203,947 | | $ | — | | $ | — | | $ | — | | $ | 278,965 | |
Operating leases(2) | | | 120,065 | | | 103,070 | | | 85,917 | | | 64,859 | | | 46,720 | | | 132,118 | | | 552,749 | |
Operating contracts(3) | | | 1,978 | | | 1,006 | | | — | | | — | | | — | | | — | | | 2,984 | |
Letters of credit(4) | | | — | | | 25 | | | 25 | | | 25 | | | — | | | 125 | | | 200 | |
| | | | | | | | | | | | | | | | |
Total | | $ | 165,737 | | $ | 135,425 | | $ | 289,889 | | $ | 64,884 | | $ | 46,720 | | $ | 132,243 | | $ | 834,898 | |
| | | | | | | | | | | | | | | | |
- (1)
- Future contractual obligations on the 2012 Senior Credit Facility reflect the Company's current interest rate, which is based on LIBOR plus 3.50% on the majority of the outstanding debt balance.
- (2)
- Does not include certain other expenses required to be paid by the Company under such operating leases, comprised primarily of the Company's proportionate share of common area maintenance, property taxes and insurance. These other expenses have typically amounted to approximately 25% of the base rent expense during recent fiscal years.
- (3)
- We have certain operating contracts related to sponsorships and space rentals at special event venues.
- (4)
- We have outstanding letters of credit at January 29, 2013, which expire at varying times through 2017, including $1.2 million that are subject to automatic renewal for an additional one-year period on the anniversary date of the agreement, unless we receive notice from the counterparty that the letter of credit agreement has been terminated at least 30 days prior to the automatic renewal date.
We have $0.4 million of reserves for uncertain tax positions that are based on potential exposures when it is considered more likely than not that a taxing authority may take a sustainable position on a matter contrary to our position. We cannot determine what date, if at all, the $0.4 million reserve will result in an obligation that must be settled.
Off-Balance Sheet Arrangements
We do not have any "off-balance sheet arrangements" (as such term is defined in Item 303 of Regulation S-K) that are reasonably likely to have a current or future effect on our financial condition, changes in financial condition, revenues or expenses, results of operations, liquidity, capital expenditures or capital resources.
Recent Accounting Pronouncements
In May 2011, the FASB issued new guidance regarding fair value measurements to ensure consistency between U.S. GAAP and International Financial Reporting Standards. The new guidance applies to all reporting entities that are required or permitted to measure or disclose the fair value of an asset, a liability, or an instrument classified in a reporting entity's stockholders' equity in the financial statements. The new guidance applies prospectively to periods beginning after December 15,
60
Table of Contents
2011. We adopted the provisions of the new guidance effective February 1, 2012 and the adoption of this standard did not have a material impact on our consolidated financial statements.
In June 2011, the FASB issued new guidance to increase the prominence of other comprehensive income in financial statements. This guidance provides the option to present the components of net income and comprehensive income in either one single statement or in two consecutive statements reporting net income and other comprehensive income. This guidance is effective for fiscal years and interim periods beginning after December 15, 2011. We adopted the provisions of the new guidance effective February 1, 2012 and the adoption of this standard did not have a material impact on our consolidated financial statements.
In July 2012, the FASB issued new guidance which gives companies the option to perform an annual qualitative assessment to determine whether it is more likely than not that an indefinite-lived intangible asset is impaired, and in some cases, bypass the two-step impairment test. This guidance is effective for annual and interim indefinite-lived intangible asset impairment tests performed for fiscal years beginning after September 15, 2012; however, early adoption of the new guidance is permitted. We adopted this guidance effective August 1, 2012 and the adoption of this standard did not have a material impact on our consolidated financial statements.
Item 7A. Quantitative and Qualitative Disclosures About Market Risk
Interest Rate Risk. Our earnings are affected by changes in interest rates due to the impact those changes have on our interest expense on borrowings under the 2012 Senior Credit Facility with interest rates that vary in direct relationship to changes in the prime interest rate or LIBOR. Our floating rate indebtedness was approximately $247.7 million at January 29, 2013. If short-term floating interest rates increased by 100 basis points during the prior twelve months, our interest expense would have increased by approximately $2.5 million during that year. This amount is determined by considering the impact of the hypothetical change in interest rates on our average amount of floating rate indebtedness outstanding and cash equivalent balances for fiscal 2012.
Impact of Inflation. We believe that inflation has not had a material impact on our results of operations for any fiscal year during the three-year period ended January 29, 2013. We cannot be sure that inflation will not have an adverse impact on our operating results or financial condition in future periods.
61
Table of Contents
Item 8. Financial Statements and Supplementary Data
INDEX TO CONSOLIDATED FINANCIAL STATEMENTS
| | | | |
Reports of Independent Registered Public Accounting Firm | | | 63 | |
Consolidated Balance Sheets | | | 65 | |
Consolidated Statements of Operations | | | 66 | |
Consolidated Statements of Stockholders' Equity | | | 67 | |
Consolidated Statements of Cash Flows | | | 68 | |
Notes to Consolidated Financial Statements | | | 69 | |
Schedules to Consolidated Financial Statements | | | 112 | |
62
Table of Contents
REPORT OF INDEPENDENT REGISTERED PUBLIC ACCOUNTING FIRM
Board of Directors and Stockholders of
Mattress Firm Holding Corp.
We have audited the accompanying consolidated balance sheets of Mattress Firm Holding Corp. (a Delaware corporation) and subsidiaries (the "Company") as of January 31, 2012 and January 29, 2013, and the related consolidated statements of operations, changes in stockholders' equity, and cash flows for each of the three years in the period ended January 29, 2013. Our audits of the basic consolidated financial statements included the financial statement schedules listed in the index appearing under Item 15. These financial statements and financial statement schedules are the responsibility of the Company's management. Our responsibility is to express an opinion on these financial statements and financial statement schedules based on our audits.
We conducted our audits in accordance with the standards of the Public Company Accounting Oversight Board (United States). Those standards require that we plan and perform the audit to obtain reasonable assurance about whether the financial statements are free of material misstatement. An audit includes examining, on a test basis, evidence supporting the amounts and disclosures in the financial statements. An audit also includes assessing the accounting principles used and significant estimates made by management, as well as evaluating the overall financial statement presentation. We believe that our audits provide a reasonable basis for our opinion.
In our opinion, the consolidated financial statements referred to above present fairly, in all material respects, the financial position of Mattress Firm Holding Corp. and subsidiaries as of January 31, 2012 and January 29, 2013, and the results of their operations and their cash flows for each of the three years in the period ended January 29, 2013 in conformity with accounting principles generally accepted in the United States of America.
We also have audited, in accordance with the standards of the Public Company Accounting Oversight Board (United States), the Company's internal control over financial reporting as of January 29, 2013, based on criteria established inInternal Control—Integrated Framework issued by the Committee of Sponsoring Organizations of the Treadway Commission (COSO), and our report dated April 1, 2013 expressed an unqualified opinion on the effectiveness of internal control over financial reporting.
/s/ GRANT THORNTON LLP
Houston, Texas
April 1, 2013
63
Table of Contents
REPORT OF INDEPENDENT REGISTERED PUBLIC ACCOUNTING FIRM
Board of Directors and Stockholders of
Mattress Firm Holding Corp.
We have audited the internal control over financial reporting of Mattress Firm Holding Corp. (a Delaware corporation) and subsidiaries (the "Company") as of January 29, 2013, based on criteria established inInternal Control—Integrated Framework issued by the Committee of Sponsoring Organizations of the Treadway Commission (COSO). The Company's management is responsible for maintaining effective internal control over financial reporting and for its assessment of the effectiveness of internal control over financial reporting, included in the accompanying Management's Report on Internal Control Over Financial Reporting appearing under Item 9A. Our responsibility is to express an opinion on the Company's internal control over financial reporting based on our audit.
We conducted our audit in accordance with the standards of the Public Company Accounting Oversight Board (United States). Those standards require that we plan and perform the audit to obtain reasonable assurance about whether effective internal control over financial reporting was maintained in all material respects. Our audit included obtaining an understanding of internal control over financial reporting, assessing the risk that a material weakness exists, testing and evaluating the design and operating effectiveness of internal control based on the assessed risk, and performing such other procedures as we considered necessary in the circumstances. We believe that our audit provides a reasonable basis for our opinion.
A company's internal control over financial reporting is a process designed to provide reasonable assurance regarding the reliability of financial reporting and the preparation of financial statements for external purposes in accordance with generally accepted accounting principles. A company's internal control over financial reporting includes those policies and procedures that (1) pertain to the maintenance of records that, in reasonable detail, accurately and fairly reflect the transactions and dispositions of the assets of the company; (2) provide reasonable assurance that transactions are recorded as necessary to permit preparation of financial statements in accordance with generally accepted accounting principles, and that receipts and expenditures of the company are being made only in accordance with authorizations of management and directors of the company; and (3) provide reasonable assurance regarding prevention or timely detection of unauthorized acquisition, use, or disposition of the company's assets that could have a material effect on the financial statements.
Because of its inherent limitations, internal control over financial reporting may not prevent or detect misstatements. Also, projections of any evaluation of effectiveness to future periods are subject to the risk that controls may become inadequate because of changes in conditions, or that the degree of compliance with the policies or procedures may deteriorate.
In our opinion, the Company maintained, in all material respects, effective internal control over financial reporting as of January 29, 2013, based on criteria established inInternal Control—Integrated Framework issued by COSO.
We also have audited, in accordance with the standards of the Public Company Accounting Oversight Board (United States), the consolidated financial statements of the Company as of and for the year ended January 29, 2013, and our report dated April 1, 2013 expressed an unqualified opinion on those financial statements.
/s/ GRANT THORNTON LLP
Houston, Texas
April 1, 2013
64
Table of Contents
MATTRESS FIRM HOLDING CORP.
CONSOLIDATED BALANCE SHEETS
| | | | | | | |
| | January 31,
2012 | | January 29,
2013 | |
|---|
| | (in thousands, except
share amounts)
| |
|---|
Assets | | | | | | | |
Cash and cash equivalents | | $ | 47,946 | | $ | 14,556 | |
Accounts receivable, net | | | 18,607 | | | 26,246 | |
Inventories | | | 40,961 | | | 63,228 | |
Deferred income taxes | | | 12,574 | | | 3,710 | |
Prepaid expenses and other current assets | | | 12,054 | | | 18,855 | |
| | | | | | |
Total current assets | | | 132,142 | | | 126,595 | |
Property and equipment, net | | | 95,674 | | | 144,612 | |
Intangible assets, net | | | 84,795 | | | 82,479 | |
Goodwill | | | 291,141 | | | 358,978 | |
Debt issue costs and other, net | | | 9,729 | | | 12,015 | |
| | | | | | |
Total assets | | $ | 613,481 | | $ | 724,679 | |
| | | | | | |
Liabilities and Stockholders' Equity | | | | | | | |
Current liabilities: | | | | | | | |
Notes payable and current maturities of long-term debt | | $ | 2,414 | | $ | 33,930 | |
Accounts payable | | | 42,396 | | | 64,642 | |
Accrued liabilities | | | 31,780 | | | 41,106 | |
Customer deposits | | | 6,294 | | | 8,012 | |
| | | | | | |
Total current liabilities | | | 82,884 | | | 147,690 | |
Long-term debt, net of current maturities | | | 225,940 | | | 219,069 | |
Deferred income taxes | | | 31,045 | | | 26,800 | |
Other noncurrent liabilities | | | 49,353 | | | 63,624 | |
| | | | | | |
Total liabilities | | | 389,222 | | | 457,183 | |
| | | | | | |
Commitments and contingencies (Note 10) | | | | | | | |
Stockholders' equity: | | | | | | | |
Common stock, $0.01 par value; 120,000,000 shares authorized; 33,768,828 and 33,795,630 shares issued and outstanding at January 31, 2012 and January 29, 2013, respectively | | | 338 | | | 338 | |
Additional paid-in capital | | | 361,717 | | | 365,083 | |
Accumulated deficit | | | (137,796 | ) | | (97,925 | ) |
| | | | | | |
Total stockholders' equity | | | 224,259 | | | 267,496 | |
| | | | | | |
Total liabilities and stockholders' equity | | $ | 613,481 | | $ | 724,679 | |
| | | | | | |
The accompanying notes are an integral part of these consolidated financial statements.
65
Table of Contents
MATTRESS FIRM HOLDING CORP.
CONSOLIDATED STATEMENTS OF OPERATIONS
| | | | | | | | | | |
| | Fiscal
2010 | | Fiscal
2011 | | Fiscal
2012 | |
|---|
| | (in thousands, except share and
per share amounts)
| |
|---|
Net sales | | $ | 494,115 | | $ | 703,910 | | $ | 1,007,337 | |
Cost of sales | | | 313,962 | | | 428,018 | | | 614,572 | |
| | | | | | | | |
Gross profit from retail operations | | | 180,153 | | | 275,892 | | | 392,765 | |
Franchise fees and royalty income | | | 3,195 | | | 4,697 | | | 5,396 | |
| | | | | | | | |
| | | 183,348 | | | 280,589 | | | 398,161 | |
| | | | | | | | |
Operating expenses: | | | | | | | | | | |
Sales and marketing expenses | | | 113,963 | | | 167,605 | | | 245,555 | |
General and administrative expenses | | | 34,111 | | | 51,684 | | | 73,640 | |
Goodwill impairment charge | | | 536 | | | — | | | — | |
Intangible asset impairment charge | | | — | | | — | | | 2,100 | |
Loss on store closings and impairment of store assets | | | 2,486 | | | 759 | | | 1,050 | |
| | | | | | | | |
Total operating expenses | | | 151,096 | | | 220,048 | | | 322,345 | |
| | | | | | | | |
Income from operations | | | 32,252 | | | 60,541 | | | 75,816 | |
| | | | | | | | |
Other expense (income): | | | | | | | | | | |
Interest income | | | (6 | ) | | (9 | ) | | (11 | ) |
Interest expense | | | 31,063 | | | 29,310 | | | 9,258 | |
Loss from debt extinguishment | | | — | | | 5,704 | | | — | |
| | | | | | | | |
| | | 31,057 | | | 35,005 | | | 9,247 | |
| | | | | | | | |
Income before income taxes | | | 1,195 | | | 25,536 | | | 66,569 | |
Income tax expense (benefit) | | | 846 | | | (8,815 | ) | | 26,698 | |
| | | | | | | | |
Net income | | $ | 349 | | $ | 34,351 | | $ | 39,871 | |
| | | | | | | | |
Basic net income per common share | |
$ |
0.02 | |
$ |
1.40 | |
$ |
1.18 | |
Diluted net income per common share | | $ | 0.02 | | $ | 1.40 | | $ | 1.18 | |
Basic weighted average shares outstanding | | |
22,399,952 | | |
24,586,274 | | |
33,770,779 | |
Diluted weighted average shares outstanding | | | 22,399,952 | | | 24,586,274 | | | 33,853,276 | |
The accompanying notes are an integral part of these consolidated financial statements.
66
Table of Contents
MATTRESS FIRM HOLDING CORP.
CONSOLIDATED STATEMENTS OF STOCKHOLDERS' EQUITY
| | | | | | | | | | | | | | | | |
| | Common Stock | |
| |
| | Total
Stockholders'
Equity
(Deficit) | |
|---|
| | Additional
Paid-in
Capital | | Accumulated
Deficit | |
|---|
| | Shares | | Par Value | |
|---|
| | (in thousands, except share amounts)
| |
|---|
Balances at February 2, 2010 | | | 22,399,952 | | $ | 224 | | $ | 156,756 | | $ | (172,496 | ) | $ | (15,516 | ) |
Stock-based compensation | | | — | | | — | | | (515 | ) | | — | | | (515 | ) |
Net income | | | — | | | — | | | — | | | 349 | | | 349 | |
| | | | | | | | | | | | |
Balances at February 1, 2011 | | | 22,399,952 | | | 224 | | | 156,241 | | | (172,147 | ) | | (15,682 | ) |
Public offering of common stock, net of costs | | | 6,388,888 | | | 64 | | | 110,382 | | | — | | | 110,446 | |
Issuance of common stock upon conversion of PIK notes | | | 2,774,035 | | | 28 | | | 52,680 | | | — | | | 52,708 | |
Issuance of common stock upon conversion of Convertible Notes | | | 2,205,953 | | | 22 | | | 41,891 | | | — | | | 41,913 | |
Stock-based compensation | | | — | | | — | | | 523 | | | — | | | 523 | |
Net income | | | — | | | — | | | — | | | 34,351 | | | 34,351 | |
| | | | | | | | | | | | |
Balances at January 31, 2012 | | | 33,768,828 | | | 338 | | | 361,717 | | | (137,796 | ) | | 224,259 | |
Cancellation of residual Mattress Holdings, LLC shares | | | (57 | ) | | — | | | — | | | — | | | — | |
Exercise of common stock options | | | 26,859 | | | — | | | 510 | | | — | | | 510 | |
Stock-based compensation | | | — | | | — | | | 2,856 | | | — | | | 2,856 | |
Net income | | | — | | | — | | | — | | | 39,871 | | | 39,871 | |
| | | | | | | | | | | | |
Balances at January 29, 2013 | | | 33,795,630 | | $ | 338 | | $ | 365,083 | | $ | (97,925 | ) | $ | 267,496 | |
| | | | | | | | | | | | |
The accompanying notes are an integral part of these consolidated financial statements.
67
Table of Contents
MATTRESS FIRM HOLDING CORP.
CONSOLIDATED STATEMENTS OF CASH FLOWS
| | | | | | | | | | |
| | Fiscal
2010 | | Fiscal
2011 | | Fiscal
2012 | |
|---|
| | (in thousands)
| |
|---|
Cash flows from operating activities: | | | | | | | | | | |
Net income | | $ | 349 | | $ | 34,351 | | $ | 39,871 | |
Adjustments to reconcile net income to cash flows provided by operating activities: | | | | | | | | | | |
Depreciation and amortization | | | 15,448 | | | 17,450 | | | 23,507 | |
Interest expense accrued and paid-in-kind | | | 23,201 | | | 20,575 | | | — | |
Loan fees and other amortization | | | 2,221 | | | 2,530 | | | 2,361 | |
Loss from debt extinguishment | | | — | | | 5,704 | | | — | |
Deferred income tax expense (benefit) | | | (118 | ) | | (11,271 | ) | | 17,131 | |
Stock-based compensation | | | (515 | ) | | 523 | | | 2,856 | |
Goodwill and intangible asset impairment charges | | | 536 | | | — | | | 2,100 | |
Loss on store closings and impairment of store assets | | | 1,034 | | | 324 | | | 894 | |
Effects of changes in operating assets and liabilities, excluding business acquisitions: | | | | | | | | | | |
Accounts receivable | | | (6,028 | ) | | (6,574 | ) | | (4,947 | ) |
Inventories | | | (2,056 | ) | | (10,555 | ) | | (15,714 | ) |
Prepaid expenses and other current assets | | | (2,178 | ) | | (1,306 | ) | | (3,616 | ) |
Other assets | | | (2,773 | ) | | (2,914 | ) | | (3,219 | ) |
Accounts payable | | | 6,265 | | | 13,159 | | | 9,324 | |
Accrued liabilities | | | 1,454 | | | 9,333 | | | 1,389 | |
Customer deposits | | | 1,068 | | | 1,518 | | | (218 | ) |
Other noncurrent liabilities | | | 4,521 | | | 8,828 | | | 7,019 | |
| | | | | | | | |
Net cash provided by operating activities | | | 42,429 | | | 81,675 | | | 78,738 | |
| | | | | | | | |
Cash flows from investing activities: | | | | | | | | | | |
Purchases of property and equipment | | | (27,330 | ) | | (34,356 | ) | | (68,604 | ) |
Business acquisitions, net of cash acquired | | | (10,762 | ) | | (7,958 | ) | | (63,051 | ) |
| | | | | | | | |
Net cash used in investing activities | | | (38,092 | ) | | (42,314 | ) | | (131,655 | ) |
| | | | | | | | |
Cash flows from financing activities: | | | | | | | | | | |
Proceeds from issuance of debt | | | 2,985 | | | 40,198 | | | 56,000 | |
Principal payments of debt | | | (3,271 | ) | | (145,231 | ) | | (36,983 | ) |
Proceeds from issuance of common stock, net of costs | | | — | | | 110,446 | | | — | |
Proceeds from exercise of common stock options | | | — | | | — | | | 510 | |
Debt issuance costs | | | — | | | (1,273 | ) | | — | |
| | | | | | | | |
Net cash provided by (used in) financing activities | | | (286 | ) | | 4,140 | | | 19,527 | |
| | | | | | | | |
Net increase (decrease) in cash and cash equivalents | | | 4,051 | | | 43,501 | | | (33,390 | ) |
Cash and cash equivalents, beginning of period | | | 394 | | | 4,445 | | | 47,946 | |
| | | | | | | | |
Cash and cash equivalents, end of period | | $ | 4,445 | | $ | 47,946 | | $ | 14,556 | |
| | | | | | | | |
The accompanying notes are an integral part of these consolidated financial statements.
68
Table of Contents
MATTRESS FIRM HOLDING CORP.
NOTES TO CONSOLIDATED FINANCIAL STATEMENTS
1. Business and Summary of Significant Accounting Policies
Business—Mattress Firm Holding Corp., through its wholly owned subsidiaries, is engaged in the retail sale of mattresses and bedding-related products in various metropolitan markets in the United States through company-operated and franchisee-owned mattress specialty stores that operate primarily under the nameMattress Firm®. Mattress Firm Holding Corp. and its wholly owned subsidiaries are referred to collectively as the "Company" or "Mattress Firm."
Initial Public Offering—On November 23, 2011, the Company completed the initial public offering of 6,388,888 shares of its common stock at a public offering price of $19.00 per share pursuant to a registration statement on Form S-1, as amended (File No. 333-174830), which was declared effective on November 17, 2011. The Company raised a total of $121.4 million in gross proceeds in the initial public offering or approximately $110.4 million in net proceeds after deducting underwriting discounts and commissions of $8.5 million and $2.5 million of offering-related costs.
On November 23, 2011, the Company used a portion of the net proceeds from the initial public offering as follows: (i) $88.8 million to repay in full all amounts outstanding under the 2009 Loan Facility (see Note 12); (ii) $4.6 million to repay in full the Company's PIK Notes that did not convert into shares of the Company's common stock upon the completion of the initial public offering (see Note12); and (iii) $1.6 million to pay accrued management fees and interest thereon and a related termination fee to J.W. Childs Associates, L.P. in connection with the termination of the management agreement between J.W. Childs Associates, L.P. and the Company that became effective with the completion of the initial public offering. The remaining net proceeds after payment of other estimated costs associated with the initial public offering, were retained by the Company for working capital and general corporate purposes.
Furthermore, in connection with the consummation of the initial public offering, (i) Convertible Notes with an aggregate principal and accrued interest balance of $41.9 million were converted into 2,205,953 shares the Company's common stock at a price per share equal to the initial public offering price, and (ii) the PIK Notes that were not repaid with net proceeds from the initial public offering, with an aggregate principal and accrued interest balance of $52.7 million, were converted into 2,774,035 shares of the Company's common stock at a price per share equal to the initial public offering price (see Note 12).
Ownership—As of January 29, 2013, J.W. Childs Equity Partners III, L.P. owns 18.1 million shares of the Company's common stock and is the majority stockholder. Prior to the initial public offering, the Company was a wholly-owned subsidiary of Mattress Holdings, LLC. Mattress Holdings, LLC was majority owned by JWC Mattress Holdings, LLC, a limited liability company managed by J.W. Childs Associates, Inc. ("J.W. Childs"), and had various minority owners including certain members of the Company's management (together with J.W. Childs, the "Equity Owners"). On September 27, 2012, Mattress Holdings, LLC distributed its holdings of Mattress Firm common stock to the Equity Owners and was subsequently dissolved.
Basis of Presentation—The accompanying financial statements present the consolidated balance sheets, statements of operations, stockholders' equity and cash flows of the Company. All significant intercompany accounts and transactions have been eliminated.
69
Table of Contents
MATTRESS FIRM HOLDING CORP.
NOTES TO CONSOLIDATED FINANCIAL STATEMENTS (Continued)
1. Business and Summary of Significant Accounting Policies (Continued)
Fiscal Year—The Company's fiscal year consists of 52 or 53 weeks ending on the Tuesday closest to January 31. Each of the fiscal years ended February 1, 2011 ("Fiscal 2010"), January 31, 2012 ("Fiscal 2011") and January 29, 2013 ("Fiscal 2012") consisted of 52 weeks.
Accounting Estimates—The preparation of financial statements in conformity with U.S. GAAP requires management to make estimates and assumptions that affect the reported amounts of (i) assets and liabilities, (ii) disclosure of contingent assets and liabilities at the date of the financial statements and (iii) the reported amounts of revenues and expenses during the reporting periods. Actual results could differ from those estimates. Estimates that are more susceptible to change in the near term are the accruals for sales returns and exchanges, product warranty costs, asset impairments and store closing costs.
Fair Value Measures—The amounts reported in the consolidated balance sheets for cash and cash equivalents, accounts receivable, accounts payable and accrued liabilities approximate their respective fair values due to the short-term maturity of these instruments.
The Financial Accounting Standards Board ("FASB") has issued guidance on the definition of fair value, the framework for using fair value to measure assets and liabilities, and disclosure about fair value measurements. The guidance establishes a three-tier fair value hierarchy, which prioritizes the inputs used to measure fair value. These tiers include:
- •
- Level 1: Defined as observable inputs such as quoted prices in active markets for identical assets or liabilities as of the reporting date. Active markets are those in which transactions for the asset or liability occur in sufficient frequency and volume to provide pricing information on an ongoing basis.
- •
- Level 2: Defined as pricing inputs other than quoted prices in active markets included in Level 1, which are either directly or indirectly observable as of the reporting date. Level 2 includes those financial instruments that are valued using models or other valuation methodologies. These models are primarily industry-standard models that consider various assumptions, including quoted forward prices for commodities, time value, volatility factors and current market and contractual prices for the underlying instruments, as well as other relevant economic measures.
- •
- Level 3: Defined as pricing inputs that are unobservable from objective sources. These inputs may be used with internally developed methodologies that result in management's best estimate of fair value.
The Company measures the fair value of its nonqualified deferred compensation plan on a recurring basis. The plan's assets are valued based on the marketable securities tied to the plan. Additionally, the Company measures the fair values of goodwill, intangible assets, and property and equipment on a nonrecurring basis if required by impairment tests applicable to these assets. Assets requiring recurring or non-recurring fair value measurements consisted of the following (amounts in thousands):
70
Table of Contents
MATTRESS FIRM HOLDING CORP.
NOTES TO CONSOLIDATED FINANCIAL STATEMENTS (Continued)
1. Business and Summary of Significant Accounting Policies (Continued)
Assets requiring recurring or non-recurring fair value measurements as previously described consisted of the following (amounts in thousands):
| | | | | | | | | | | | | | | | |
| |
| | Fair Value Measurements | |
| |
|---|
| | Net Book
Value as of
Jan. 31, 2012 | | Fiscal 2011
Impairments | |
|---|
| | Level 1 | | Level 2 | | Level 3 | |
|---|
Nonqualified deferred compensation plan (Note 13) | | $ | 882 | | $ | — | | $ | 882 | | $ | — | | $ | — | |
Property and equipment requiring impairment review (Note 3) | | $ | 246 | | $ | — | | $ | — | | $ | 246 | | $ | 134 | |
| | | | | | | | | | | | | | | | |
| |
| | Fair Value Measurements | |
| |
|---|
| | Net Book
Value as of
Jan. 29, 2013 | | Fiscal 2012
Impairments | |
|---|
| | Level 1 | | Level 2 | | Level 3 | |
|---|
Nonqualified deferred compensation plan (Note 13) | | $ | 1,138 | | $ | — | | $ | 1,138 | | $ | — | | $ | — | |
Goodwill requiring impairment review (Note 4) | | $ | 40,543 | | $ | — | | $ | — | | $ | 40,543 | | $ | — | |
Intangible assets requiring impairment review (Note 4) | | $ | 786 | | $ | — | | $ | — | | $ | 786 | | $ | 2,100 | |
Property and equipment requiring impairment review (Note 3) | | $ | — | | $ | — | | $ | — | | $ | — | | $ | 156 | |
The table below summarizes the estimated fair values and respective carrying values of the Company's 2012 Senior Credit Facility as of January 31, 2012 and January 29, 2013 (in millions):
| | | | | | | | | | | | | |
| | January 31, 2012 | | January 29, 2013 | |
|---|
| | Estimated Fair
Value | | Carrying
Value | | Estimated Fair
Value | | Carrying
Value | |
|---|
Senior Credit Facility—Term Loans | | $ | 223.0 | | $ | 228.3 | | $ | 226.3 | | $ | 226.7 | |
The fair value of the 2012 Senior Credit Facility term loans was estimated based on the ask and bid prices quoted from an external source. The carrying amounts of other debt instruments at fixed rates approximated their respective fair values due to the comparability of interest rates for the same or similar issues that are available.
Net Sales—Sales revenue, including fees collected for delivery services, is recognized upon delivery and acceptance of mattresses and bedding products by the Company's customers and is recorded net of estimated returns. Customer deposits collected prior to the delivery of merchandise are recorded as a liability. Net sales are recognized net of sales tax collected from customers and remitted to various taxing jurisdictions.
Cost of Sales, Sales and Marketing and General and Administrative Expense—The following summarizes the primary costs classified in each major expense category (the classification of which may vary within the Company's industry).
Cost of sales:
- •
- Costs associated with purchasing and delivering the Company's products to the Company's stores and customers, net of vendor incentives earned on the purchase of products subsequently sold;
71
Table of Contents
MATTRESS FIRM HOLDING CORP.
NOTES TO CONSOLIDATED FINANCIAL STATEMENTS (Continued)
1. Business and Summary of Significant Accounting Policies (Continued)
- •
- Physical inventory losses;
- •
- Store and warehouse occupancy and depreciation expense of related facilities and equipment;
- •
- Store and warehouse operating costs, including (i) warehouse labor costs, (ii) utilities, (iii) repairs and maintenance, (iv) supplies, (v) and store facilities; and
- •
- Estimated costs to provide for customer returns and exchanges and to service customer warranty claims.
Sales and marketing expenses:
- •
- Advertising and media production;
- •
- Payroll and benefits for sales associates; and
- •
- Merchant service fees for customer credit and debit card payments, check guarantee fees and promotional financing expense.
General and administrative expenses:
- •
- Payroll and benefit costs for corporate office and regional management employees;
- •
- Stock-based compensation costs;
- •
- Occupancy costs of corporate facility;
- •
- Information systems hardware, software and maintenance;
- •
- Depreciation related to corporate assets;
- •
- Management fees;
- •
- Insurance; and
- •
- Other overhead costs.
Vendor Incentives—Cash payments received from vendors as incentives to enter into or to maintain long-term supply arrangements, including new store funds described in the following paragraph, are deferred and amortized as a reduction of cost of sales using a systematic approach. Vendor incentives that are based on a percentage of the cost of purchased merchandise, such as cooperative advertising funds, are accounted for as a reduction of the price of the vendor's products and result in a reduction of cost of sales when the merchandise is sold. Certain vendor arrangements provide for volume-based incentives that require minimum purchase volumes and may provide for increased incentives upon higher levels of volume purchased. The recognition of earned incentives that vary based on purchase levels includes the effect of estimates of the Company's purchases of the vendor's products and may result in adjustments in subsequent periods if actual purchase volumes deviate from the estimates. Vendor incentives that are direct reimbursements of costs incurred by the Company to sell the vendor's products are accounted for as a reduction of the related costs when recognized in the Company's results of operations. From time to time, certain vendors provide funds to the Company to advertise their products. The Company recognized $3.7 million, $3.9 million and $5.2 million as a reduction to sales and marketing expense during fiscal 2010, fiscal 2011 and fiscal 2012, respectively, related to such direct vendor advertising funds.
72
Table of Contents
MATTRESS FIRM HOLDING CORP.
NOTES TO CONSOLIDATED FINANCIAL STATEMENTS (Continued)
1. Business and Summary of Significant Accounting Policies (Continued)
The Company receives cash funds from certain vendors upon the opening of a new store ("new store funds") if the opening results in an increase in the total number of stores in operation. Under the current supply arrangements, the Company is obligated to repay a portion of new store funds if an arrangement is terminated early. The Company classifies new store funds as a noncurrent liability and recognizes a pro-rata reduction of cost of sales in the results of operations over 36 months.
Sales Returns and Exchanges—The Company accrues a liability for estimated costs of sales returns and exchanges in the period that the related sales are recognized. The Company provides its customers with a comfort satisfaction guarantee whereby the customer may receive a refund or exchange the original mattress for a replacement of equal or similar quality for a period of up to 100 days after the original purchase. Mattresses received back under this policy are reconditioned pursuant to state laws and resold through the Company's clearance center stores as used merchandise. The Company accrues a liability for the estimated costs related to the revaluation of the returned merchandise to the lower of cost or market at the time the sale is recorded based upon historical experience. In August 2010, the Company revised its general exchange policy to eliminate the majority of exchange fees previously charged to a customer, which has resulted in a higher estimate of future exchange costs. The Company regularly assesses and adjusts the estimated liability by updating claims rates based on actual trends and projected claim costs. A revision of estimated claim rates and claim costs or revisions to the Company's exchange policies may have a material adverse effect on future results of operations.
Activity with respect to the liability for sales returns and exchanges, included in accrued liabilities, was as follows (amounts in thousands):
| | | | | | | | | | |
| | Fiscal
2010 | | Fiscal
2011 | | Fiscal
2012 | |
|---|
Balance at beginning of period | | $ | 68 | | $ | 513 | | $ | 1,079 | |
Sales return and exchange provision | | | 1,613 | | | 3,651 | | | 6,230 | |
Sales return and exchange claims | | | (1,168 | ) | | (3,085 | ) | | (5,824 | ) |
| | | | | | | | |
Balance at end of period | | $ | 513 | | $ | 1,079 | | $ | 1,485 | |
| | | | | | | | |
Product Warranties—Pursuant to certain of the Company's negotiated supply agreements, the Company may be responsible for manufacturer service warranties and any extended warranties the Company may offer. The customer is not charged a fee for warranty coverage. The Company accrues for the estimated cost of warranty coverage at the time the sale is recorded. In estimating the liability for product warranties, the Company considers the impact of recoverable salvage value on product received back under warranty. Based upon the Company's historical warranty claim experience, as well as recent trends that might suggest that past experience may differ from future claims, management periodically reviews and adjusts, if necessary, the liability for product warranties.
73
Table of Contents
MATTRESS FIRM HOLDING CORP.
NOTES TO CONSOLIDATED FINANCIAL STATEMENTS (Continued)
1. Business and Summary of Significant Accounting Policies (Continued)
Activity with respect to the liability for product warranties was as follows (amounts in thousands):
| | | | | | | | | | |
| | Fiscal
2010 | | Fiscal
2011 | | Fiscal
2012 | |
|---|
Balance at beginning of period | | $ | 1,802 | | $ | 2,063 | | $ | 2,766 | |
Warranty provision | | | 1,265 | | | 2,238 | | | 2,414 | |
Warranty claims | | | (1,004 | ) | | (1,535 | ) | | (1,401 | ) |
| | | | | | | | |
Balance at end of period | | | 2,063 | | | 2,766 | | | 3,779 | |
Less: Current portion included in accrued liabilities | | | 783 | | | 1,285 | | | 1,735 | |
| | | | | | | | |
Noncurrent portion included in other non-current liabilities | | $ | 1,280 | | $ | 1,481 | | $ | 2,044 | |
| | | | | | | | |
Franchise Fees and Royalty Income—The Company has granted franchise rights to private operators for a term of generally 20 to 30 years on a market-by-market basis. The Company provides standard operating procedure manuals, the right to use systems and trademarks, assistance in site locations of stores and warehouses, training and support services, advertising materials and management and accounting software to its franchisees. The Company is entitled to a nonrefundable initial franchise fee that is recognized in income when all material services have been substantially performed, which is upon the opening of a new store. In addition, the Company earns ongoing royalties based on a percentage of gross franchisee sales, payable twice a month, which are recognized in income during the period sales are recognized by the franchisees.
The Company evaluates the credentials, business plans and the financial strength of potential franchisees before entering into franchise agreements and before extending credit terms for franchise fee and royalty payments. Concentrations of credit risk with respect to accounts receivable with franchisees after considering existing allowances for doubtful accounts, are considered by management to be limited as a result of the small size of the franchisee network relative to company-operated stores and the years of experience with the current franchisee owners. The Company generally has the right, under the terms of its franchise agreements, to assume the operations of franchisees that do not comply with the conditions of the franchise agreement, including a default on the payments owed to the Company. In such instances, the assumption may involve purchase consideration in the form of cash and the assumption of certain franchisee obligations, including obligations to the Company. Based upon collection experience with existing franchisees and the collateral position, the allowance for doubtful accounts was less than $0.1 million and none as of January 31, 2012 and January 29, 2013, respectively.
Pre-opening Expense—Store pre-opening expenses, which consist primarily of occupancy costs, are expensed as incurred.
Advertising and Media Production Expense—The Company incurs advertising costs associated with print and broadcast advertisements. Such costs are expensed as incurred except for media production costs, which are deferred and charged to expense in the period that the advertisement initially airs. Advertising and media production expense, net of direct funds received from certain vendors, was $39.1 million, $60.2 million, and $87.2 million for fiscal 2010, fiscal 2011 and fiscal 2012, respectively.
74
Table of Contents
MATTRESS FIRM HOLDING CORP.
NOTES TO CONSOLIDATED FINANCIAL STATEMENTS (Continued)
1. Business and Summary of Significant Accounting Policies (Continued)
Income Taxes—Deferred tax assets and liabilities are reflected on the balance sheet for temporary differences between the amount of assets and liabilities for financial and tax reporting purposes that will reverse in subsequent years. Deferred tax assets and liabilities are measured using tax rates expected to apply to taxable income in the years in which those temporary differences are estimated to be recovered or settled. The effect on deferred tax assets and liabilities of a change in the tax rate is recognized in the statement of operations in the period that the change is effective. Valuation allowances are established when necessary to reduce deferred tax assets to the amounts that are more likely than not to be realized.
The Company calculates its current deferred tax provision based on estimates and assumptions that could differ from the actual results reflected in income tax returns filed in subsequent years. Adjustments based on filed returns are recorded when identified.
The amount of income taxes the Company pays is subject to ongoing audits by federal and state tax authorities. Reserves are provided for potential exposures when it is considered more-likely-than-not that a taxing authority may take a sustainable position on a matter contrary to the Company's position. The Company evaluates these reserves, including interest thereon, on a periodic basis to ensure that they have been appropriately adjusted for events, including audit settlements that may impact the ultimate payment for such exposure. To the extent that the Company's assessment of such tax positions changes, the change in estimate is recorded in the period in which the determination is made. The Company reports tax-related interest and penalties as a component of income tax expense.
Stock Based Compensation—The Company measures compensation cost with respect to equity instruments granted as stock-based payments to employees based upon the estimated fair value of the equity instruments at the date of the grant. The cost as measured is recognized as expense over the period during which an employee is required to provide services in exchange for the award, or to their eligible retirement date, if earlier. The benefit of tax deductions in excess of recognized compensation expense, if any, is reported as a financing cash flow in the Statement of Cash Flows.
The Company follows the SEC's Staff Accounting Bulletin No. 107 "Share-Based Payment" ("SAB 107"), as amended by Staff Accounting Bulletin No. 110 ("SAB 110"), which provides supplemental application guidance based on the views of the SEC. The Company estimates the expected term of the stock options, which represents the period of time that the Company expects its stock options to remain outstanding, using the simplified method as permitted by SAB 107 and SAB 110. The Company applies the simplified method because it does not have sufficient historical exercise data to provide a reasonable basis upon which to estimate the expected terms of its stock options due to the limited period of time its common stock has been publicly traded.
Cash and Cash Equivalents—Cash and cash equivalents include cash and highly liquid investments that are readily convertible into cash within three months or less when purchased. In addition, cash equivalents include sales proceeds in the course of settlement from credit card merchant service providers, which typically convert to cash within three days of the sales transaction.
Accounts Receivable—Accounts receivable are recorded net of an allowance for expected losses.
The Company offers financing to customers by utilizing the services of independent, third party finance companies that extend credit directly to the Company's customers with no recourse to the Company for credit related losses. The finance companies have the discretion to establish and revise
75
Table of Contents
MATTRESS FIRM HOLDING CORP.
NOTES TO CONSOLIDATED FINANCIAL STATEMENTS (Continued)
1. Business and Summary of Significant Accounting Policies (Continued)
the credit criteria used in evaluating whether to extend financing to the Company's customers. Accounts receivable include sales proceeds of financed sales, net of related fees, which are in the course of funding by the finance companies. The Company reviews the financial condition of its finance providers and has experienced only minimal losses on the collection of accounts receivable. Accounts receivable from finance companies are recorded net of an allowance for expected losses of approximately $0.1 million and $0.3 million as of January 31, 2012 and January 29, 2013, respectively. The remaining receivables are periodically evaluated for collectability and an allowance is established based on historical collection trends and write-off history as appropriate.
Accounts receivable consists of the following (amounts in thousands):
| | | | | | | |
| | January 31,
2012 | | January 29,
2013 | |
|---|
Vendor incentives | | $ | 11,054 | | $ | 14,421 | |
Finance companies | | | 4,106 | | | 7,522 | |
Tenant improvement allowances | | | 2,068 | | | 1,665 | |
Franchisees and other | | | 1,379 | | | 2,638 | |
| | | | | | |
| | $ | 18,607 | | $ | 26,246 | |
| | | | | | |
Inventories��The Company's inventories consist of finished goods inventories of mattresses and other products, including finished goods that are for showroom display in the Company's stores. Inventories are valued at the lower of cost or market. Cost is determined by the first-in, first-out method and consists primarily of the purchase price paid to vendors, as adjusted to include the effect of vendor incentives that are generally based on a percentage of the cost of purchased merchandise. The Company does not purchase or hold inventories on behalf of franchisees.
Property and Equipment—Property and equipment are stated at cost less accumulated depreciation. Improvements to leased property are amortized over the shorter of their estimated useful lives or lease periods (including expected renewal periods). Repairs and maintenance are expensed as incurred. Expenditures which extend asset useful lives are capitalized. Property and equipment acquired in acquisitions is valued at fair value consistent with acquisition accounting (Note 2).
Depreciation is provided on the straight-line method at rates based on the estimated useful lives of individual assets or classes of assets as follows:
| | | | |
| | Years | |
|---|
Buildings | | | 30 | |
Equipment, computers and software | | | 3 - 5 | |
Furniture and fixtures | | | 7 | |
Store signs | | | 7 | |
Vehicles | | | 5 | |
76
Table of Contents
MATTRESS FIRM HOLDING CORP.
NOTES TO CONSOLIDATED FINANCIAL STATEMENTS (Continued)
1. Business and Summary of Significant Accounting Policies (Continued)
The Company capitalizes costs of software developed or purchased for internal use in accordance with ASC 350-40 "Accounting for the Costs of Computer Software Developed or Obtained for Internal Use". Once the capitalization criteria have been met, external direct costs of materials and services used in development of internal-use software, payroll and payroll related costs for employees directly involved in the development of internal-use software and interest costs incurred when developing software for internal use are capitalized. These capitalized costs are amortized over the useful life of the software on a straight-line basis.
The cost and accumulated depreciation of assets sold or otherwise disposed of are removed from the accounts and any gain or loss thereon is included in the results of operations.
The Company considers future asset retirement obligations, if such obligations can be reasonably estimated, at the time an asset is acquired or constructed with a corresponding increase in the cost basis of the asset. The Company generally has minimal conditional obligations with respect to the termination and abandonment of leased locations and the estimated fair value of such obligations is immaterial for the fiscal years ended January 31, 2012 and January 29, 2013.
The Company reviews long-lived assets for impairment when events or changes in circumstances indicate the carrying value of these assets may exceed their current fair values. The investments in store leasehold costs and related equipment represent the Company's most significant long-lived assets. The Company evaluates store-level results to determine whether projected future cash flows over the remaining lease terms are sufficient to recover the carrying value of the fixed asset investment in each individual store. If projected future cash flows are less than the carrying value of the fixed asset investment, an impairment charge is recognized to the extent that the fair value, as determined by discounted cash flows or appraisals, is less than the carrying value of such assets. The carrying value of leasehold improvements as well as certain other property and equipment are subject to impairment write-downs as a result of such evaluation. After an impairment loss is recognized, the adjusted carrying amount of the asset group establishes the new accounting basis. As further described in Note 3, the Company has recognized impairment losses during fiscal 2010, fiscal 2011 and fiscal 2012.
Goodwill and Intangible Assets—Assets acquired and liabilities assumed in a business acquisition are recorded at fair value on the date of the acquisition. Purchase consideration in excess of the aggregate fair value of acquired net assets is allocated to identifiable intangible assets, to the extent of their fair value, and any remaining excess purchase consideration is allocated to goodwill. The total amount of goodwill arising from an acquisition may be assigned to one or more reporting units in situations where the acquired business consists of specialty mattress retail operations in multiple metropolitan markets or when other reporting units are expected to benefit from synergies of the combination. The method of assigning goodwill to reporting units is applied in a consistent manner and may involve estimates and assumptions.
The Company tests goodwill and other indefinite lived intangible assets for impairment annually or when events and circumstances indicate that the carrying value of these assets may exceed their current fair values. The Company assigns the carrying value of these intangible assets to its "reporting units" and applies the test for goodwill at the reporting unit level. A reporting unit is defined as an operating segment or one level below a segment (a "component") if the component is a business and discrete information is prepared and reviewed regularly by segment management. Each of the Company's metropolitan markets is an operating segment. The store unit components that comprise each operating
77
Table of Contents
MATTRESS FIRM HOLDING CORP.
NOTES TO CONSOLIDATED FINANCIAL STATEMENTS (Continued)
1. Business and Summary of Significant Accounting Policies (Continued)
segment are aggregated into a reporting unit on the basis that all stores have similar economic characteristics. All of the Company's goodwill has been allocated to its metropolitan market reporting units for impairment testing. The test for goodwill impairment involves a qualitative evaluation as to whether or not it is more likely than not that the fair value of a reporting unit is less than its carrying value using an assessment of relevant events and circumstances. If any reporting unit is concluded to be more likely impaired than not the following steps are performed for such reporting unit: (i) comparing the fair value of a reporting unit with the carrying value of its net assets and (ii) if the carrying value exceeds fair value, the fair value of goodwill is compared with the respective carrying value and an impairment loss is recognized in the amount of the excess.
The impairment test for indefinite lived assets consists of a comparison of the fair value of the asset with its carrying amount. If the carrying amount of an intangible asset exceeds its fair value, an impairment loss is recognized in an amount equal to that excess. After an impairment loss is recognized, the adjusted carrying amount of the asset establishes the new accounting basis. The Company determines the fair value of intangible trade names by utilizing the relief from royalty method, a specific discounted cash flow approach that estimates value by royalties saved from owning the respective name rather than having to license it from another party.
Debt Issue Costs and Other Assets—Significant components of other assets include debt issue costs, lease deposits and other assets. Debt issue costs are amortized to interest expense over the term of the related debt instruments. Debt issue costs and other assets are amortized over their estimated useful lives. Debt issue costs and other assets net of accumulated amortization were $9.7 million and $12.0 million as of January 31, 2012 and January 29, 2013, respectively. Accumulated amortization on debt issue costs and other assets was $9.5 million and $11.6 million as of January 31, 2012 and January 29, 2013, respectively.
Deferred Lease Liabilities—Rent expense is recognized on a straight-line basis over the lease term (including expected renewal periods), after consideration of rent escalations, rent holidays and up-front payments or rent allowances provided by landlords as incentives to enter into lease agreements. The start of the lease term for the purposes of the calculation is the earlier of the lease commencement date or the date the Company takes possession of the property. A deferred lease liability is recognized for the cumulative difference between rental payments and straight-line rent expense. Deferred lease liabilities are a component of other noncurrent liabilities.
Reportable Segments—The Company's operations consist primarily of the retail sale of mattresses and bedding-related products in various metropolitan areas in the United States through company-operated and franchisee-operated mattress specialty stores that operate under the name Mattress Firm. The Company also generates sales through its website and special events primarily to customers who reside in the metropolitan markets in which company-operated stores are located. The Company's management reviews the aggregated results of company-operated stores at the metropolitan market level, including market-level cost data, consisting primarily of advertising, warehousing and overhead expenses that are directly incurred, managed and reported at the market level. Management focuses on improving the profitability at the market level and, therefore, each company-operated metropolitan market is an operating segment. The company-operated market, website and special events business segments are aggregated into a single reportable segment ("retail segment") as a result of the similar nature of the products sold and other similar economic characteristics that are expected to continue into future periods. Furthermore, the Company generates franchise fees and royalty income from the
78
Table of Contents
MATTRESS FIRM HOLDING CORP.
NOTES TO CONSOLIDATED FINANCIAL STATEMENTS (Continued)
1. Business and Summary of Significant Accounting Policies (Continued)
operation of franchisee-operated Mattress Firm stores in metropolitan markets in which the Company does not operate. Franchise operations are a separate reportable segment, for which the results of operations, as viewed by management, are fully represented by the franchise fees and royalty income reported on the face of the statements of operations because costs associated with the franchise business are not distinguished from other cost data viewed by management. The Company's assets are used primarily in the operation of its retail segment and the assets directly attributed to the franchise operations are not separately disclosed because they are not material.
The Company's total net sales are generated from three major categories of products, consisting of (i) conventional mattresses which utilize steel-coil innersprings, (ii) specialty mattresses which utilize materials other than steel-coil innersprings and (iii) furniture and accessories which include headboards and footboards, bed frames, mattress pads and pillows. In addition to product sales, total net sales also includes delivery service revenues for merchandise sold to customers.
The following table represents the components of the Company's total net sales (amounts in thousands):
| | | | | | | | | | |
| | Fiscal
2010 | | Fiscal
2011 | | Fiscal
2012 | |
|---|
Conventional mattresses | | $ | 288,058 | | $ | 323,461 | | $ | 418,019 | |
Specialty mattresses | | | 160,281 | | | 318,868 | | | 504,918 | |
Furniture and accessories | | | 33,905 | | | 46,367 | | | 65,726 | |
| | | | | | | | |
Total product sales | | | 482,244 | | | 688,696 | | | 988,663 | |
Delivery service revenues | | | 11,871 | | | 15,214 | | | 18,674 | |
| | | | | | | | |
Total net sales | | $ | 494,115 | | $ | 703,910 | | $ | 1,007,337 | |
| | | | | | | | |
Prior-year components of the Company's total net sales have been reclassified between specialty mattresses and conventional mattresses in a manner consistent with the current fiscal year presentation.
New Accounting Standards Adopted in this Report—In May 2011, the FASB issued new guidance regarding fair value measurements to ensure consistency between U.S. GAAP and International Financial Reporting Standards. The new guidance applies to all reporting entities that are required or permitted to measure or disclose the fair value of an asset, a liability, or an instrument classified in a reporting entity's stockholders' equity in the financial statements. The new guidance applies prospectively effective during periods beginning after December 15, 2011. The Company adopted the provisions of the new guidance effective February 1, 2012 and the adoption of this standard did not have a material impact on the Company's consolidated financial statements.
In June 2011, the FASB issued new guidance to increase the prominence of other comprehensive income in financial statements. This guidance provides the option to present the components of net income and comprehensive income in either one single statement or in two consecutive statements reporting net income and other comprehensive income. This guidance is effective for fiscal years and interim periods beginning after December 15, 2011. The Company adopted the provisions of the new guidance effective February 1, 2012 and the adoption of this standard did not have a material impact on the Company's consolidated financial statements.
79
Table of Contents
MATTRESS FIRM HOLDING CORP.
NOTES TO CONSOLIDATED FINANCIAL STATEMENTS (Continued)
1. Business and Summary of Significant Accounting Policies (Continued)
In July 2012, the FASB issued new guidance which gives companies the option to perform a qualitative assessment to determine whether it is more likely than not that an indefinite-lived intangible asset is impaired, and in some cases, bypass the two-step impairment test. This guidance is effective for annual and interim indefinite-lived intangible asset impairment tests performed for fiscal years beginning after September 15, 2012; however, early adoption of the new guidance is permitted. The Company adopted this guidance effective August 1, 2012 and the adoption of this standard did not have a material impact on the Company's consolidated financial statements.
2. Acquisitions
The Company completed a number of acquisitions of the equity interests or operating assets of specialty mattress retailers during fiscal 2011 and fiscal 2012. These acquisitions: (i) increase the Company's store locations and market share in markets in which the Company previously operated, which generally results in greater expense synergies and leverage over market-level costs, such as advertising and warehousing, or (ii) provide an efficient way to enter new markets in which the Company did not previously operate and which provide a platform for further growth. Results of operations of the acquired businesses are included in the Company's results of operations from the respective effective dates of the acquisitions.
Acquisitions During Fiscal 2012—Effective May 2, 2012, the Company completed the acquisition of all of the equity interests in MGHC Holding Corporation ("Mattress Giant") for approximately $43.9 million in cash. The acquisition added 181 mattress specialty retail stores in certain markets in Florida and Texas where the Company was already operatingMattress Firm® stores at the time of the acquisition.
Effective September 25, 2012, the Company acquired the leasehold interests, store assets, distribution center assets and related inventories, and assumed certain liabilities, of Mattress XPress, Inc. and Mattress XPress of Georgia, Inc. (collectively, "Mattress X-Press") relating to the operation of 34 mattress specialty stores located in Florida and Georgia for a total purchase price of approximately $13.1 million. The purchase consisted of cash of $5.4 million and unsecured notes issued to Mattress X-Press in the principal amount of $7.8 million, which are payable over a term of one year in quarterly installments, including interest at 8%.
Effective December 11, 2012, the Company acquired the leasehold interests, store assets, distribution center assets and related inventories, and assumed certain liabilities, of Factory Mattress & Water Bed Outlet of Charlotte, Inc. ("Mattress Source") relating to the operation of 27 mattress specialty stores located in North Carolina and South Carolina for a total purchase price of approximately $11.4 million in cash.
The majority of the stores obtained in the aforementioned acquisitions had been rebranded asMattress Firm® stores as of the end of fiscal 2012. The acquisitions increased the Company's store locations and market share in markets in which the Company previously operated, with expectations of greater expense synergies and leverage over market-level costs, such as advertising and warehousing. The acquisitions resulted in $67.8 million of goodwill based on management's estimate on the acquisition closing date, of which $38.4 million will not be deductible for income tax purposes.
80
Table of Contents
MATTRESS FIRM HOLDING CORP.
NOTES TO CONSOLIDATED FINANCIAL STATEMENTS (Continued)
2. Acquisitions (Continued)
The allocation of the purchase price to the acquired assets and liabilities, based on management's estimate of their fair values on the respective acquisition closing dates, is as follows (amounts in thousands):
| | | | | | | | | | | | | |
| | Mattress
Giant | | Mattress
X-Press | | Mattress
Source | | Total | |
|---|
Cash | | $ | — | | $ | 313 | | $ | — | | $ | 313 | |
Accounts receivable | | | 2,667 | | | 26 | | | — | | | 2,693 | |
Inventories | | | 5,167 | | | 834 | | | 552 | | | 6,553 | |
Prepaid expenses and other current assets | | | 2,819 | | | 195 | | | 171 | | | 3,185 | |
Property and equipment | | | 3,043 | | | 884 | | | 585 | | | 4,512 | |
Intangible assets | | | 5,119 | | | 1,313 | | | 765 | | | 7,197 | |
Goodwill | | | 43,186 | | | 14,552 | | | 10,108 | | | 67,846 | |
Deferred income tax asset | | | 4,253 | | | 751 | | | 179 | | | 5,183 | |
Other assets | | | 639 | | | 419 | | | 114 | | | 1,172 | |
Accounts payable | | | (12,896 | ) | | (4,522 | ) | | (505 | ) | | (17,923 | ) |
Accrued liabilities | | | (7,693 | ) | | (487 | ) | | (98 | ) | | (8,278 | ) |
Customer deposits | | | (1,559 | ) | | (304 | ) | | (73 | ) | | (1,936 | ) |
Notes payable | | | — | | | (163 | ) | | (159 | ) | | (322 | ) |
Other noncurrent liabilities | | | (820 | ) | | (667 | ) | | (200 | ) | | (1,687 | ) |
| | | | | | | | | | |
Fair value of assets and liabilities acquired | | | 43,925 | | | 13,144 | | | 11,439 | | | 68,508 | |
Reconciliation to cash used in acquisitions: | | | | | | | | | | | | | |
Seller notes issued | | | — | | | (7,750 | ) | | — | | | (7,750 | ) |
Purchase price adjustment offset against payment obligations on Seller notes | | | — | | | 2,606 | | | — | | | 2,606 | |
Cash of acquired businesses | | | — | | | (313 | ) | | — | | | (313 | ) |
| | | | | | | | | | |
Cash used in acquisitions, net of cash acquired | | $ | 43,925 | | $ | 7,687 | | $ | 11,439 | | $ | 63,051 | |
| | | | | | | | | | |
Goodwill represents the future economic benefits arising from other assets acquired that could not be individually identified and separately recognized. The goodwill arising from the acquisitions is primarily due to the factors discussed above.
The net sales included in the Company's consolidated statement of operations derived from the Mattress Giant, Mattress X-Press and Mattress Source acquisitions from the respective acquisition dates to January 29, 2013 were $110.1 million, $7.0 million and $1.8 million, respectively.
The following table presents the selected consolidated financial information of the Company on a pro forma basis, assuming that the Mattress Giant acquisition had occurred as of February 2, 2011. The historical financial information has been adjusted to give effect to pro forma items that are directly attributable to the acquisition and are expected to have a continuing impact on the consolidated results. These items include adjustments to record incremental depreciation and amortization expense related to the increase in fair value of the acquired assets.
The unaudited financial information set forth below has been compiled from the historical financial statements and other information, but is not necessarily indicative of the results that actually
81
Table of Contents
MATTRESS FIRM HOLDING CORP.
NOTES TO CONSOLIDATED FINANCIAL STATEMENTS (Continued)
2. Acquisitions (Continued)
would have been achieved had the transaction occurred on the date indicated or that may be achieved in the future (amounts in thousands, except per share amounts):
| | | | | | | | | | | | | | | | | | | |
| | Fiscal 2011 | | Fiscal 2012 | |
|---|
| | As Reported | | Pro Forma
Adjustments | | Pro Forma | | As Reported | | Pro Forma
Adjustments | | Pro Forma | |
|---|
Net sales | | $ | 703,910 | | $ | 128,155 | | $ | 832,065 | | $ | 1,007,337 | | $ | 31,825 | | $ | 1,039,162 | |
Net income | | | 34,351 | | | 4,570 | | | 38,921 | | | 39,871 | | | 1,479 | | | 41,350 | |
Diluted net income per common share* | | $ | 1.40 | | $ | 0.19 | | $ | 1.58 | | $ | 1.18 | | $ | 0.04 | | $ | 1.22 | |
- *
- Due to rounding to the nearest cent, totals may not equal the sum of the lines in the table above.
Acquisition-related costs for U.S. GAAP purposes are costs the acquirer incurs to effect a business combination, including advisory, legal, accounting, valuation, and other professional or consulting fees. The Company incurred a total of $2.5 million of acquisition-related costs charged to general and administrative expenses during fiscal 2012 related to the acquisitions discussed above.
Acquisition During Fiscal 2011—Effective November 15, 2011, the Company acquired the leasehold interests, store assets, distribution center assets and related inventory, and assumed certain liabilities, of Mattress Giant Corporation relating to the operation of 55 mattress specialty retail stores and three distribution centers located in the states of Georgia, Missouri, Illinois and Minnesota for a cash purchase price of approximately $7.9 million. The Company incurred a total of $0.6 million of acquisition-related that were charged to general and administrative expenses during fiscal 2011. The acquired stores were rebranded asMattress Firm® stores during fiscal 2012. The acquisition resulted in $3.2 million of goodwill, the majority of which was deductible for income tax purposes.
The allocation of the purchase price to the assets and liabilities of the acquisition, based on management's estimate of their fair values on the acquisition closing date is as follows (amounts in thousands):
| | | | |
Current assets | | $ | 3,815 | |
Property and equipment | | | 1,414 | |
Goodwill | | | 3,165 | |
Intangible assets | | | 150 | |
Other noncurrent assets | | | 81 | |
Current liabilities | | | (404 | ) |
Other noncurrent liabilities | | | (363 | ) |
| | | | |
Fair value of assets and liabilities acquired and cash used in acquisition | | $ | 7,858 | |
| | | | |
Acquisitions During Fiscal 2010—Effective May 13, 2010, the Company acquired the land and building of aMattress Firm® store location in Houston, Texas, for a purchase price of $2.3 million consisting of cash and a mortgage loan in the amount of $2.1 million. No goodwill was recognized related to the transaction.
Effective October 15, 2010, the Company acquired the equity interests of a mattress specialty retailer, Peak Management, LLC ("Peak"), a formerMattress Firm® franchisee, for $3.8 million,
82
Table of Contents
MATTRESS FIRM HOLDING CORP.
NOTES TO CONSOLIDATED FINANCIAL STATEMENTS (Continued)
2. Acquisitions (Continued)
consisting of cash and a contingent payment that is based on future sales of the acquired stores. The contingent payment in the amount of $2.0 million was paid in December 2011 based on sales results during the 12-month period ending November 30, 2011. The acquisition added 8 stores in eastern Tennessee and northeast Alabama, which were new areas of Company operations. The acquisition resulted in $3.0 million of goodwill, the majority of which was expected to be deductible for income tax purposes.
Effective December 1, 2010, the Company acquired the equity interests of a mattress specialty retailer, Maggie's Enterprises, Inc. ("Maggie's"), for $15.7 million, consisting of cash and issuance of a seller note in the principal amount of $7.2 million. The acquisition added 26 stores, primarily in eastern Virginia, an area where the Company did not previously conduct operations. The acquired stores continued to be operated under the former nameMattress Discounters through the end of fiscal 2012. As further described in Note 4, the Company will rebrand the stores asMattress Firm® during fiscal 2013. The acquisition resulted in $11.1 million of goodwill, the majority of which was expected to be deductible for income tax purposes.
The allocation of the purchase price to the assets and liabilities of the acquisitions, based on management's estimate of their fair values, and a reconciliation to the cash provided by the acquisitions on the respective acquisition closing dates is as follows (amounts in thousands):
| | | | | | | | | | |
| | Maggie's | | Peak and Other | | Total | |
|---|
Current assets | | $ | 4,024 | | $ | 970 | | $ | 4,994 | |
Property and equipment | | | 784 | | | 3,103 | | | 3,887 | |
Goodwill | | | 11,130 | | | 2,978 | | | 14,108 | |
Other noncurrent assets | | | 3,319 | | | 66 | | | 3,385 | |
Current liabilities | | | (2,148 | ) | | (763 | ) | | (2,911 | ) |
Other noncurrent liabilities | | | (1,375 | ) | | (290 | ) | | (1,665 | ) |
| | | | | | | | |
Fair value of assets and liabilities acquired | | | 15,734 | | | 6,064 | | | 21,798 | |
Reconciliation to cash used in acquisitions: | | | | | | | | | | |
Contingent payment obligation | | | — | | | (1,980 | ) | | (1,980 | ) |
Seller notes issued | | | (7,200 | ) | | — | | | (7,200 | ) |
Cash of acquired businesses | | | (1,769 | ) | | (87 | ) | | (1,856 | ) |
| | | | | | | | |
Cash used in acquisitions, net of cash acquired | | $ | 6,765 | | $ | 3,997 | | $ | 10,762 | |
| | | | | | | | |
The net sales, pre-tax income and net income included in the Company's Fiscal 2010 results of operations related to the acquisition of Maggie's from the acquisition date to February 1, 2011 were $3.2 million, $0.3 million and $0.2 million, respectively.
83
Table of Contents
MATTRESS FIRM HOLDING CORP.
NOTES TO CONSOLIDATED FINANCIAL STATEMENTS (Continued)
3. Property and Equipment
Property and equipment consist of the following (amounts in thousands):
| | | | | | | |
| | January 31,
2012 | | January 29,
2013 | |
|---|
Land | | $ | 1,159 | | $ | 1,159 | |
Building | | | 1,621 | | | 1,621 | |
Leasehold improvements | | | 118,546 | | | 167,792 | |
Equipment, computers and software | | | 23,683 | | | 30,711 | |
Store signs | | | 12,762 | | | 20,753 | |
Furniture and fixtures | | | 10,478 | | | 16,955 | |
Vehicles | | | 474 | | | 961 | |
| | | | | | |
Property and equipment | | | 168,723 | | | 239,952 | |
Accumulated depreciation | | | (73,049 | ) | | (95,340 | ) |
| | | | | | |
Property and equipment, net | | $ | 95,674 | | $ | 144,612 | |
| | | | | | |
Based upon the review of the performance of individual stores, including a decline in performance of certain stores, impairment losses of approximately $1.7 million, $0.1 million and $0.2 million were recognized during fiscal 2010, fiscal 2011 and fiscal 2012, respectively. Impairment losses are reported as a component of "Loss on store closings and impairment of store assets" in the statements of operations. The impairment loss amounts were determined as the excess of the carrying value of property and equipment of those stores with potential impairment in excess of the estimated fair value based on estimated cash flows. Estimated cash flows are primarily based on projected revenues, operating costs and maintenance capital expenditures of individual stores and are discounted based on comparable industry average rates for weighted average cost of capital.
4. Goodwill and Intangible Assets
A summary of the changes in the carrying amounts of goodwill and non-amortizable intangible assets for fiscal 2011 and fiscal 2012 were as follows (amounts in thousands):
| | | | | | | |
| | Goodwill | | Nonamortizable
Intangibles | |
|---|
Balance at February 1, 2011 | | $ | 287,379 | | $ | 80,600 | |
Prior year business acquisition adjustment | | | 597 | | | — | |
Current period business acquisitions | | | 3,165 | | | — | |
| | | | | | |
Balance at January 31, 2012 | | | 291,141 | | | 80,600 | |
Prior year business acquisition adjustment | | | (9 | ) | | — | |
Current period business acquisitions | | | 67,846 | | | — | |
Deferred tax adjustment (See Note 6) | | | — | | | (7,319 | ) |
| | | | | | |
Balance at January 29, 2013 | | $ | 358,978 | | $ | 73,281 | |
| | | | | | |
The amounts of accumulated goodwill impairment were $144.4 million as of February 1, 2011, January 31, 2012 and January 29, 2013.
84
Table of Contents
MATTRESS FIRM HOLDING CORP.
NOTES TO CONSOLIDATED FINANCIAL STATEMENTS (Continued)
4. Goodwill and Intangible Assets (Continued)
A summary of the changes in the carrying amounts of amortizable intangible assets for fiscal 2011 and fiscal 2012 were as follows (amounts in thousands):
| | | | | | | | | | |
| | Gross
Cost | | Accumulated
Amortization | | Net Carrying
Value | |
|---|
Balance at February 1, 2011 | | $ | 5,973 | | $ | (1,660 | ) | $ | 4,313 | |
Current period business acquisitions | | | 150 | | | — | | | 150 | |
Reaquired franchise rights | | | 205 | | | — | | | 205 | |
Amortization expense | | | — | | | (473 | ) | | (473 | ) |
| | | | | | | | |
Balance at January 31, 2012 | | | 6,328 | | | (2,133 | ) | | 4,195 | |
Current period business acquisitions | | | 7,197 | | | — | | | 7,197 | |
Reaquired franchise rights | | | 140 | | | — | | | 140 | |
Trademarks defense | | | 571 | | | — | | | 571 | |
Trade name impairment | | | (2,100 | ) | | — | | | (2,100 | ) |
Amortization expense | | | — | | | (805 | ) | | (805 | ) |
| | | | | | | | |
Balance at January 29, 2013 | | $ | 12,136 | | $ | (2,938 | ) | $ | 9,198 | |
| | | | | | | | |
The components of intangible assets were as follows (dollar amounts in thousands):
| | | | | | | | | |
| | Useful Life
(Years) | | January 31,
2012 | | January 29,
2013 | |
|---|
Nonamortizing: | | | | | | | | | |
Trade names and trademarks | | | | $ | 80,600 | | $ | 73,281 | |
| | | | | | | | |
Amortizing: | | | | | | | | | |
Franchise agreement rights | | 20 | | $ | 1,205 | | $ | 1,345 | |
Acquired trade names | | 2 - 20 | | | 4,035 | | | 9,084 | |
Trademarks defense | | 8 | | | — | | | 571 | |
Non-compete agreements | | 3 - 5 | | | 1,088 | | | 1,136 | |
| | | | | | | | |
| | | | | 6,328 | | | 12,136 | |
Accumulated amortization | | | | | (2,133 | ) | | (2,938 | ) |
| | | | | | | | |
| | | | | 4,195 | | | 9,198 | |
| | | | | | | | |
| | | | $ | 84,795 | | $ | 82,479 | |
| | | | | | | | |
Expense included in general and administrative expense related to the amortization of intangible assets was $0.3 million, $0.5 million and $0.8 million for fiscal 2010, fiscal 2011 and fiscal 2012, respectively.
85
Table of Contents
MATTRESS FIRM HOLDING CORP.
NOTES TO CONSOLIDATED FINANCIAL STATEMENTS (Continued)
4. Goodwill and Intangible Assets (Continued)
The weighted average amortization period remaining for intangible assets is 18 years. As of January 29, 2013, amortization expense for intangible assets is expected to be as follows for each of the next five fiscal years (amounts in thousands):
| | | | |
Fiscal Year | |
| |
|---|
2013 | | $ | 592 | |
2014 | | $ | 574 | |
2015 | | $ | 547 | |
2016 | | $ | 547 | |
2017 | | $ | 546 | |
Goodwill is related to purchase price allocation resulting from acquisitions. The Company's operations are comprised of market-level operating segments that are each a reporting unit for goodwill impairment purposes. To the extent Step 2 of the goodwill impairment test is required, it consists of (i) comparing the fair value of a reporting unit with the carrying value of its net assets and (ii) if the carrying value exceeds fair value, the fair value of goodwill is compared with the respective carrying value and an impairment loss is recognized in the amount of the excess. An estimated fair value of a reporting unit is derived by a combination of an income approach and a market approach, which incorporates both management's views and those of the market. The income approach provides an estimated fair value based on the Company's anticipated cash flows that are discounted using a weighted average cost of capital rate based on comparable industry average rates. The market approach provides an estimated fair value based on market multiples applied to the Company's historical operating results. The estimated fair values computed using the income approach and the market approach are then weighted and combined into a concluded fair value.
For the goodwill impairment test performed for fiscal 2010, the estimated fair value was less than the respective carrying value of net assets, inclusive of goodwill, for two reporting units, which experienced declines in results of operations in fiscal 2010. The Company performed Step 2 of the goodwill impairment test and determined that the carrying value of goodwill exceeded the fair value for the two reporting units and, accordingly, a non-cash impairment charge of $0.5 million was recognized in fiscal 2010. No goodwill impairment charges were recognized in fiscal 2011 and fiscal 2012.
During fiscal 2012, the Company recognized an impairment charge in the amount of $2.1 million to reduce the carrying amount of theMattress Discounters trade name intangible asset acquired in the fiscal 2010 Maggie's acquisition. The impairment charge reflects the reduction in the estimated fair value of the intangible trade name asset using the relief from royalty valuation method as a result of the Company's decision in fiscal 2012 to rebrand 20 stores asMattress Firm® during fiscal 2013. No impairment charges related to intangible assets were recognized in fiscal 2010 and fiscal 2011.
86
Table of Contents
MATTRESS FIRM HOLDING CORP.
NOTES TO CONSOLIDATED FINANCIAL STATEMENTS (Continued)
5. Notes Payable and Long-term Debt
Notes payable and long-term debt consist of the following (amounts in thousands):
| | | | | | | |
| | January 31,
2012 | | January 29,
2013 | |
|---|
2012 Senior Credit Facility—term loans | | $ | 228,330 | | $ | 226,704 | |
2012 Senior Credit Facility—revolver borrowings | | | — | | | 21,000 | |
Equipment financing and other notes payable | | | 24 | | | 5,295 | |
| | | | | | |
Total long-term debt | | | 228,354 | | | 252,999 | |
Current maturities of long-term debt | | | 2,414 | | | 33,930 | |
| | | | | | |
Long-term debt, net of current maturities | | $ | 225,940 | | $ | 219,069 | |
| | | | | | |
2012 Senior Credit Facility—On January 18, 2007, Mattress Holding Corp., an indirect consolidated subsidiary of the Company, entered into a credit agreement with UBS Securities LLC and certain of its affiliates and other lenders for a senior secured term loan and revolving credit facility, which was amended on November 5, 2012 (as amended, the "2012 Senior Credit Facility"). The amendment, among other things, (i) increased the revolving loan commitment from $35 million to $100 million, (ii) extended the maturity date of the revolving loan by two years to January 2015, (iii) extended the maturity date of outstanding term loans having an aggregate principal amount of $200 million by two years to January 2016 ("extended term loans"), (iv) increased the interest rate applicable to amounts outstanding under the extended term loans and revolving loans by 1.25%, (v) increased the amount of permitted capital expenditures to $80 million on an annual basis, beginning with capital expenditures incurred during fiscal 2012, and (vi) increased the maximum cumulative amount that Mattress Holding Corp. and its subsidiary guarantors may incur for permitted acquisitions through the extended maturity date. The Company incurred fees in connection with the amendment of approximately $1.5 million. Certain holders of term loans with an outstanding balance of $26.7 million at January 29, 2013 did not elect to extend the original January 2014 maturity date in connection with the November 5, 2012 amendment ("non-extended term loans").
Outstanding borrowings at January 31, 2012 and January 29, 2013 are reported net of an unamortized discount of approximately $0.3 million and $0.2 million, respectively.
Borrowings under the 2012 Senior Credit Facility bear interest at a rate equal to an applicable margin plus, at the Company's option, either (i) a base rate determined by reference to the highest of (a) the corporate base rate of interest established by the administrative agent and (b) the federal funds effective rate from time to time plus 0.50%, or (ii) the London Interbank Offered Rate, or "LIBOR," determined by reference to the costs of funds for deposits for the interest period relevant to such borrowing adjusted for certain additional costs. The applicable margin percentages for extended term loans are 2.50% for base rate loans and 3.50% for LIBOR loans. The applicable margin percentages for non-extended term loans are 1.25% for base rate loans and 2.25% for LIBOR loans. The applicable margin percentages for revolving loans are 2.50% for base rate loans and 3.50% for LIBOR loans. The weighted average interest rate applicable to outstanding borrowings was 2.6% and 3.8% at January 31, 2012 and January 29, 2013, respectively.
Outstanding term borrowings under the 2012 Senior Credit Facility are payable in quarterly principal installments of $0.6 million in fiscal 2013 and quarterly principal installments of $0.5 million in fiscal 2014 and fiscal 2015. In addition, non-extended term loans in aggregate principal amount of
87
Table of Contents
MATTRESS FIRM HOLDING CORP.
NOTES TO CONSOLIDATED FINANCIAL STATEMENTS (Continued)
5. Notes Payable and Long-term Debt (Continued)
approximately $26 million mature on January 18, 2014. Accrued interest on outstanding borrowings is payable from time-to-time and no less frequently than quarterly. Furthermore, the Company is subject to an annual mandatory principal prepayment in an amount equal to a portion of "excess cash flow," as defined in the 2012 Senior Credit Facility, payable no later than 120 days after the end of each fiscal year. Such prepayments are first applied to reduce scheduled quarterly principal repayments for the next four quarters in order of maturity and then to reduce future quarterly payments through maturity on a pro-rata basis. The Company made an excess cash flow payment in the amount of $0.8 million on June 1, 2011, with respect to excess cash flows related to fiscal 2010. No excess cash flow payments were required with respect to the operations in fiscal 2011 and fiscal 2012. There are other mandatory prepayment requirements, subject to certain exceptions, from the net cash proceeds of certain asset sale and casualty and condemnation events, subject to reinvestment rights, from the net cash proceeds of any incurrence of certain debt, other than debt permitted under the 2012 Senior Credit Facility, and from the net cash proceeds of specified issuances of preferred equity securities. No such prepayments were required in fiscal 2010, fiscal 2011, and fiscal 2012. The Company may voluntarily repay outstanding loans under the 2012 Senior Credit Facility at any time without premium or penalty, other than customary "breakage" costs with respect to LIBOR loans.
The revolving loan portion of the 2012 Senior Credit Facility provides Mattress Holding Corp. with up to $100.0 million in outstanding revolving borrowings, with up to $15.0 million of that amount available for the issuance of letters of credit. Outstanding revolving borrowings were zero and $21.0 million at January 31, 2012 and January 29, 2013, respectively. Outstanding letters of credit on the revolving facility were $1.4 million at January 29, 2013, resulting in $77.6 million of availability for revolving borrowings and up to $13.6 million of that amount available for the issuance of letters of credit. Subsequent to year end, the Company repaid $16 million of revolving borrowings that were outstanding at January 29, 2013.
The 2012 Senior Credit Facility, subject to certain exceptions, is guaranteed by Mattress Holding Corp's immediate parent entity, Mattress Holdco, Inc., and by each of the existing and future subsidiaries of Mattress Holding Corp. All obligations under the 2012 Senior Credit Facility, and the guarantees of those obligations, are secured by substantially all of the existing and future property and assets of Mattress Holding Corp. and the subsidiaries under the 2012 Senior Credit Facility, and by a pledge of Mattress Holding Corp's capital stock and the capital stock of each of its subsidiaries. Mattress Holding Corp. is subject to certain financial covenants under the agreement principally consisting of maximum debt leverage and minimum interest coverage ratios. Subject to certain restrictions, Mattress Holding Corp. has the ability to exercise equity cure rights, which allow the inclusion of capital contributions received from the Company in the results of operations for the purpose of measuring the maximum debt leverage and minimum interest coverage ratios. In addition, the 2012 Senior Credit Facility places limits on the amounts of annual capital expenditures and contains restrictions on certain transactions with affiliates; prepaying subordinated debt; incurring indebtedness and liens; declaring dividends or redeeming or repurchasing capital stock; making loans and investments; and engaging in mergers, acquisitions, consolidations and asset sales. Mattress Holding Corp. was in compliance with all financial covenants at January 29, 2013.
Equipment Financing and Other Short-Term Notes Payable—Mattress Holding Corp. and its subsidiaries have various outstanding notes payable related to the purchase of equipment and unsecured seller notes issued in connection with acquisitions. The interest rates on these notes range
88
Table of Contents
MATTRESS FIRM HOLDING CORP.
NOTES TO CONSOLIDATED FINANCIAL STATEMENTS (Continued)
5. Notes Payable and Long-term Debt (Continued)
from 6.8% to 8.0% with monthly and quarterly principal and interest payments of various amounts with the majority of these notes having final maturities at various dates during fiscal 2013. Equipment financing notes payable are collateralized by certain equipment with carrying values that approximate the outstanding principal balances of the related notes payable.
Future Maturities of Notes Payable and Long-Term Debt—The aggregate maturities of notes payable and long-term debt at January 29, 2013 were as follows (amounts in thousands):
| | | | |
Fiscal Year | |
| |
|---|
2013 | | $ | 34,105 | |
2014 | | | 22,579 | |
2015 | | | 196,490 | |
2016 | | | — | |
2017 | | | — | |
Thereafter | | | — | |
| | | | |
| | $ | 253,174 | |
| | | | |
6. Income Taxes
Income tax expense (benefit) consists of the following (amounts in thousands):
| | | | | | | | | | |
| | Fiscal 2010 | | Fiscal 2011 | | Fiscal 2012 | |
|---|
Current: | | | | | | | | | | |
Federal | | $ | — | | $ | 291 | | $ | 5,686 | |
State | | | 964 | | | 2,165 | | | 3,881 | |
| | | | | | | | |
| | | 964 | | | 2,456 | | | 9,567 | |
| | | | | | | | |
Deferred: | | | | | | | | | | |
Federal | | | — | | | (10,912 | ) | | 16,918 | |
State | | | (118 | ) | | (359 | ) | | 213 | |
| | | | | | | | |
| | | (118 | ) | | (11,271 | ) | | 17,131 | |
| | | | | | | | |
Total income tax expense (benefit) | | $ | 846 | | $ | (8,815 | ) | $ | 26,698 | |
| | | | | | | | |
89
Table of Contents
MATTRESS FIRM HOLDING CORP.
NOTES TO CONSOLIDATED FINANCIAL STATEMENTS (Continued)
6. Income Taxes (Continued)
The differences between the effective tax rate reflected in the provision for income taxes on income (loss) before income taxes and the statutory federal rate is as follows (amounts in thousands, except for percentages):
| | | | | | | | | | |
| | Fiscal 2010 | | Fiscal 2011 | | Fiscal 2012 | |
|---|
Computed tax at 35% of income | | $ | 419 | | $ | 8,938 | | $ | 23,299 | |
State income taxes, net of federal income tax benefit | | | 627 | | | 2,168 | | | 2,670 | |
Stock-based compensation | | | (180 | ) | | 53 | | | 14 | |
Goodwill impairment | | | 164 | | | — | | | — | |
Change in valuation allowance | | | (234 | ) | | (20,050 | ) | | — | |
Non-deductible items | | | — | | | — | | | 647 | |
Other | | | 50 | | | 76 | | | 68 | |
| | | | | | | | |
Total income tax expense (benefit) | | $ | 846 | | $ | (8,815 | ) | $ | 26,698 | |
| | | | | | | | |
Effective income tax rate | | | 70.7 | % | | (34.5 | )% | | 40.1 | % |
The effective tax rate was 40.1% for the year ended January 29, 2013, compared to (34.5%) for the year ended January 31, 2012, and differs primarily as a result of the Company releasing all of its valuation allowance during fiscal 2011.
The effective tax rate was (34.5%) for the year ended January 31, 2012, compared to 70.7% for the year ended February 1, 2011, and differs primarily as a result of the Company releasing all of its valuation allowance during fiscal 2011.
Deferred income taxes reflect the net tax effects of temporary differences between the carrying amount of assets and liabilities for financial reporting purposes and the amounts used for income tax
90
Table of Contents
MATTRESS FIRM HOLDING CORP.
NOTES TO CONSOLIDATED FINANCIAL STATEMENTS (Continued)
6. Income Taxes (Continued)
purposes. The significant components of the Company's deferred tax assets and liabilities are as follows (amounts in thousands):
| | | | | | | | | | | | | |
| | January 31, 2012 | | January 29, 2013 | |
|---|
| | Current | | Noncurrent | | Current | | Noncurrent | |
|---|
Deferred income tax assets: | | | | | | | | | | | | | |
Allowance for doubtful accounts | | $ | 36 | | $ | — | | $ | 101 | | $ | — | |
Inventories | | | 682 | | | — | | | 1,075 | | | — | |
Accrued liabilities | | | 2,799 | | | — | | | 2,925 | | | — | |
Noncurrent liabilities | | | — | | | 3,392 | | | — | | | 7,546 | |
Charitable contribution carryforward | | | 250 | | | — | | | — | | | — | |
Tax credits | | | 654 | | | — | | | — | | | — | |
Net operating loss carryforward | | | 8,286 | | | — | | | 21 | | | 4,715 | |
Goodwill | | | — | | | 2,328 | | | — | | | — | |
| | | | | | | | | | |
| | | 12,707 | | | 5,720 | | | 4,122 | | | 12,261 | |
| | | | | | | | | | |
Deferred income tax liabilities: | | | | | | | | | | | | | |
Nonamortizing intangible assets | | | — | | | (30,053 | ) | | — | | | (27,428 | ) |
Goodwill | | | — | | | — | | | — | | | (1,131 | ) |
Other current assets | | | (133 | ) | | — | | | (412 | ) | | — | |
Amortizable intangible assets | | | — | | | (756 | ) | | — | | | (327 | ) |
Property and equipment | | | — | | | (5,956 | ) | | — | | | (10,175 | ) |
| | | | | | | | | | |
| | | (133 | ) | | (36,765 | ) | | (412 | ) | | (39,061 | ) |
| | | | | | | | | | |
Net deferred income tax assets (liabilities) | | $ | 12,574 | | $ | (31,045 | ) | $ | 3,710 | | $ | (26,800 | ) |
| | | | | | | | | | |
During fiscal 2011 and fiscal 2012, the Company utilized net operating loss carryforwards generated in prior years to reduce a significant portion of federal and state current income tax requirements. The remainder of those prior year net operating loss carryforwards was fully utilized to offset a portion of taxable income during fiscal 2012. The Company had approximately $12.0 million of net operating loss carryforwards at January 29, 2013 that begin expiring in fiscal 2029, if not utilized to offset future taxable income. These net operating loss carryforwards arose from the acquisition of MGHC Holding Corporation during fiscal 2012, and after application of Section 382 of the Internal Revenue Code of 1986, as amended, are limited to an average use of $2.7 million per year over the next five years.
The Company has an intangible asset for theMattress Firm® trade name that arose from an acquisition prior to December 15, 2008. The intangible asset has a tax basis that generates amortization for tax purposes, for which there is no corresponding expense for financial reporting purposes since the asset has an indefinite life and is non-amortizable. The tax benefit from the amortization of the intangible asset, which was suspended in prior year net operating losses, was realized with the utilization of net operating loss carryforwards during fiscal 2012 and, accordingly, was recorded as a direct reduction of the financial reporting carrying value of intangible assets in the amount of $7.3 million during fiscal 2012. Future tax-basis amortization benefits will continue to be recorded as reductions of the carrying value of the intangible asset.
As of February 2, 2011, the Company provided a valuation allowance in the amount of $20.1 million to reduce deferred tax assets related to net operating loss carryforwards and other deductible temporary differences to the amount that was considered more-likely-than-not to be realized. The determination that a valuation allowance was required was based in part on the existence
91
Table of Contents
MATTRESS FIRM HOLDING CORP.
NOTES TO CONSOLIDATED FINANCIAL STATEMENTS (Continued)
6. Income Taxes (Continued)
of net operating losses in prior fiscal years, as adjusted for permanent differences. As of January 31, 2012, operating income in fiscal 2011 and projected future taxable income, including income associated with the cessation of interest deductions resulting from fiscal 2011 debt retirements and the future reversal of temporary differences related to existing deferred tax liabilities, provides sufficient evidence that it is more-likely-than-not that deferred tax assets will be realized in future periods. Accordingly, the Company recognized a deferred tax benefit during fiscal 2011 in the amount of $20.1 million, consisting of a $5.9 million reduction resulting primarily from the utilization of net operating loss carryforwards and a $14.2 million reduction resulting from the year-end evaluation supporting that deferred tax assets would more likely than not be realized in future periods.
The Company and its subsidiaries are included in a consolidated income tax return in the U.S. federal jurisdiction and file separate income tax returns in several states. As of January 29, 2013, open tax years in federal and some state jurisdictions date back to October 2002 due to the taxing authorities' ability to adjust operating loss carryforwards. The Company and its subsidiaries and are not currently undergoing an income tax examination in any jurisdiction.
The Company's accounting policy with respect to uncertain tax positions is described in Note 1. All unrecognized tax benefits were in connection with a previous acquisition, and resulted in a $0.4 million increase to goodwill, with a corresponding reduction of deferred tax assets related to net operating loss carryforwards. During fiscal 2012, the Company used all prior net operating losses and reclassified the presentation of their unrecognized tax benefits from net presentation as a reduction to net operating loss carryforwards to gross presentation as a long-term tax payable. These unrecognized tax benefits, if recognized, would be recorded in the statement of operations and thus would impact the company's effective tax rate in the period in which they are recognized. Unrecognized tax benefits, if recognized, will favorably affect the Company's effective income tax rate upon recognition.
The Company recognizes interest and penalties related to unrecognized tax benefits for uncertain tax positions as a component of income tax expense. The Company has not accrued any interest expense on unrecognized tax benefits as of January 29, 2013. The Company does not anticipate it will be assessed penalties on this filing position. Interest will begin to accrue during fiscal 2013 related to uncertain tax positions. The Company does not expect that any significant changes will occur in unrecognized tax benefits over the next twelve months. A reconciliation of the beginning and ending amount of unrecognized tax benefits for fiscal 2011 and 2012 is as follows (amounts in thousands):
| | | | |
Balance at February 2, 2010 | | $ | 369 | |
Change | | | — | |
| | | | |
Balance at February 1, 2011 | | | 369 | |
Increases related to prior year tax positions | | | 4 | |
| | | | |
Balance at January 31, 2012 | | | 373 | |
Increases related to prior year tax positions | | | 12 | |
| | | | |
Balance at January 29, 2013 | | $ | 385 | |
| | | | |
The determination of the consolidated provision for income taxes, deferred tax assets and liabilities and related valuation allowance needs require management to make judgments and estimates. Although management believes that its tax estimates are reasonable, the ultimate tax determination involves significant judgments that could become subject to audit by tax authorities in the ordinary course of business, as well as the generation of sufficient future taxable income.
92
Table of Contents
MATTRESS FIRM HOLDING CORP.
NOTES TO CONSOLIDATED FINANCIAL STATEMENTS (Continued)
7. Accrued Liabilities and Other Noncurrent Liabilities
The Company estimates certain liabilities in an effort to recognize those expenses in the period incurred. The most significant estimates relate to lease commitment reserves related to store closings (see Note 8), product warranty returns (see Note 1) and insurance-related expenses, significant portions of which are self-insured related to workers' compensation and employee health insurance. The ultimate cost of the Company's workers' compensation insurance accruals is recorded based on actuarial valuations and historical claims experience. The Company's employee medical insurance accruals are recorded based on the Company's medical claims processed as well as historical medical claims experience for claims incurred but not yet reported. The Company maintains stop-loss coverage to limit the exposure to certain insurance-related risks. Differences in the Company's estimates and assumptions could result in an accrual requirement materially different from the calculated accrual. Historically, such differences have not been significant.
Accrued liabilities consist of the following (amounts in thousands):
| | | | | | | |
| | January 31,
2012 | | January 29,
2013 | |
|---|
Employee wages, payroll taxes and withholdings | | $ | 7,861 | | $ | 12,199 | |
Unbilled advertising | | | 5,212 | | | 6,759 | |
Sales tax | | | 4,720 | | | 6,792 | |
Accrued construction in-progress costs | | | 1,489 | | | 1,960 | |
Accrued interest | | | 575 | | | 1,781 | |
Product warranty returns | | | 1,285 | | | 1,735 | |
Accrued employee compensated absences | | | 1,114 | | | 1,685 | |
Insurance | | | 1,652 | | | 701 | |
Income tax payable | | | 1,985 | | | 293 | |
Other | | | 5,887 | | | 7,201 | |
| | | | | | |
| | $ | 31,780 | | $ | 41,106 | |
| | | | | | |
Other noncurrent liabilities consist of the following (amounts in thousands):
| | | | | | | |
| | January 31,
2012 | | January 29,
2013 | |
|---|
Deferred lease liabilities | | $ | 39,344 | | $ | 46,789 | |
Deferred vendor incentives | | | 7,646 | | | 13,653 | |
Product warranty returns, less current portion | | | 1,481 | | | 2,044 | |
Other | | | 882 | | | 1,138 | |
| | | | | | |
| | $ | 49,353 | | $ | 63,624 | |
| | | | | | |
8. Store Closings
Management reviews the performance of individual stores to determine whether to renew or extend leases or to close a store at or prior to the lease termination date. Results of operations and estimated closing costs from individual store and warehouse location closings are included in continuing operations. Management also reviews retail operating results at the market level in determining whether to exit and close all store and warehouse locations in a market based on an evaluation of the
93
Table of Contents
MATTRESS FIRM HOLDING CORP.
NOTES TO CONSOLIDATED FINANCIAL STATEMENTS (Continued)
8. Store Closings (Continued)
investment required to improve market results to an acceptable level and the estimated costs to discontinue operations. Each market is an operating segment and, accordingly, operating results of stores and warehouses closed for an entire market and the related loss from closing are reported as discontinued operations. The Company did not exit any markets during fiscal 2010, fiscal 2011 or fiscal 2012.
The Company remains directly liable for future lease obligations for certain closed store and warehouse locations and contingently liable for locations that are assigned to third parties. The Company may enter into sublease agreements with third parties for certain closed locations while retaining the primary lease obligation with landlords. The Company accrues a liability for the estimated future costs to close locations at the time of closing. Such accruals include, as applicable, the difference between future lease obligations and anticipated sublease rentals. Future contingent lease commitments related to assigned and subleased properties and the related future sublease rentals are disclosed in Note 10.
The change in the estimated liability for location closing costs, which is included in other accrued liabilities, is as follows (amounts in thousands):
| | | | | | | |
| | Fiscal 2011 | | Fiscal 2012 | |
|---|
Balance at beginning of period | | $ | 153 | | $ | 564 | |
Increase (decrease) in store closing reserves: | | | | | | | |
Rent paid | | | (784 | ) | | (752 | ) |
Sublease income | | | 512 | | | 440 | |
Closed store additions | | | 650 | | | — | |
Adjustments to existing reserves | | | 33 | | | (11 | ) |
| | | | | | |
Balance at end of period | | $ | 564 | | $ | 241 | |
| | | | | | |
The Company revises the estimated liability for location closing costs when new facts and circumstances become available. It is reasonably possible that the Company's actual future costs to sublease or otherwise terminate leases related to closed properties could be different than the estimate as a result of economic conditions outside the control of the Company and that the effects could be material to the Company's consolidated financial statements.
9. Stockholders' Equity
Dividends
As a holding company, the ability of Mattress Firm Holding Corp. to pay dividends is limited by its ability to receive dividends or distributions from its subsidiaries. The 2012 Senior Credit Facility imposes restrictions on Mattress Holding Corp. and its subsidiary guarantors with respect to the payment of dividends to Mattress Firm Holding Corp. Since inception of Mattress Firm Holding Corp. no dividends have been paid to stockholders.
Common Stock
On November 3, 2011, the Company's board of directors approved an increase in the number of authorized shares of the Company's common stock to 120,000,000 and a 227,058-for-one forward stock
94
Table of Contents
MATTRESS FIRM HOLDING CORP.
NOTES TO CONSOLIDATED FINANCIAL STATEMENTS (Continued)
9. Stockholders' Equity (Continued)
split of the Company's common stock, with no corresponding change to the par value. All common share numbers and per share amounts for all periods presented have been adjusted retroactively.
As further described in Note 1, the Company completed an initial public offering of 6,388,888 shares of common stock on November 23, 2011 at $19 per share, resulting in $110.4 million of net proceeds after deducting underwriting discounts and commissions of $8.5 million and $2.5 million of offering related costs. In addition, as further described in Notes 1 and 12, the Company issued an aggregate of 4,979,988 shares of common stock in the conversion of PIK Notes and Convertible Notes in connection with the completion of the offering.
On October 10, 2012, the Company completed the public secondary offering of 5,435,684 shares of common stock by certain selling shareholders. The Company did not sell any shares of common stock in the offering and did not receive any proceeds from the sale. The Company incurred approximately $1.9 million in costs related to the offering.
Common Stock Reserved for Future Issuance
As further described in Note 14, approximately 4,206,000 million shares of common stock are reserved for issuances under the 2011 Omnibus Incentive Plan. As of January 29, 2013, there were 2,790,196 shares available for future grants under the stock incentive plan.
Earnings per Share
Basic net income (loss) per common share is computed by dividing the net income applicable to common shares by the weighted average number of common shares outstanding during the period. Diluted net income per common share is computed by dividing net income by the weighted average number of common shares outstanding during the period, adjusted to reflect potentially dilutive securities using the treasury stock method for stock option awards. Diluted net income per common share adjusts basic net income per common share for the effects of stock options and other potentially dilutive financial instruments only in the periods in which such effect is dilutive.
The following table presents a reconciliation of the weighted average shares outstanding used in the earnings per share calculations:
| | | | | | | | | | |
| | Fiscal 2010 | | Fiscal 2011 | | Fiscal 2012 | |
|---|
Basic weighted average shares outstanding | | | 22,399,952 | | | 24,586,274 | | | 33,770,779 | |
Effect of dilutive securities: | | | | | | | | | | |
Stock options | | | — | | | — | | | 76,669 | |
Restricted shares | | | — | | | — | | | 5,828 | |
| | | | | | | | |
Diluted weighted average shares outstanding | | | 22,399,952 | | | 24,586,274 | | | 33,853,276 | |
| | | | | | | | |
Diluted net income per common share for fiscal 2011and fiscal 2012 excludes stock options for the purchase of 1,223,874 and 105,148 shares, respectively, of common stock as their inclusion would be anti-dilutive.
A portion of the stock options granted to the Company's employees are subject to a five-year time-based vesting schedule, while the remaining stock options are subject to a four-year market-based vesting schedule, with such vesting based on specified stock price increase targets, as set forth in the
95
Table of Contents
MATTRESS FIRM HOLDING CORP.
NOTES TO CONSOLIDATED FINANCIAL STATEMENTS (Continued)
9. Stockholders' Equity (Continued)
option award agreement evidencing the grant of such stock options. The Company includes market-based stock option awards in the dilutive potential common shares when they become contingently issuable and exclude the awards when they are not contingently issuable. Diluted weighted average shares outstanding for the fiscal 2012 excludes stock options for the purchase of 436,001 shares of common stock as the applicable vesting criteria were not satisfied as of January 29, 2013.
10. Commitments and Contingencies
The Company conducts the majority of its operations from leased store and warehouse facilities pursuant to non-cancellable operating lease agreements with initial terms ranging from 1 to 15 years. Certain leases include renewal options generally ranging from 1 to 5 years and contain certain rent escalation clauses. Most leases require the Company to pay its proportionate share of the property tax, insurance and maintenance expenses of the property. Certain leases provide for contingent rentals based on sales volumes; however, incremental rent expense resulting from such arrangements are accrued for those stores expected to surpass the sales threshold subject to their respective lease agreements.
Total expense incurred under operating leases, consisting of base rents and other expenses (comprised primarily of common area maintenance, property tax, and insurance), is as follows (amounts in thousands):
| | | | | | | | | | |
| | Base Rents | | Other
Expense | | Total Lease
Expense | |
|---|
Fiscal 2010 | | $ | 63,932 | | $ | 16,931 | | $ | 80,863 | |
Fiscal 2011 | | $ | 76,108 | | $ | 16,879 | | $ | 92,987 | |
Fiscal 2012 | | $ | 111,785 | | $ | 25,611 | | $ | 137,396 | |
Future minimum lease payments under operating leases as of January 29, 2013, related to properties operated by the Company is as follows (amounts in thousands):
| | | | |
Fiscal Year | |
| |
|---|
2013 | | $ | 120,065 | |
2014 | | | 103,070 | |
2015 | | | 85,917 | |
2016 | | | 64,859 | |
2017 | | | 46,720 | |
Thereafter | | | 132,118 | |
| | | | |
| | $ | 552,749 | |
| | | | |
The Company remains directly and contingently obligated under lease agreements related to leased properties no longer operated by the Company as further described in Note 8. In certain instances, the Company has entered into assignment and sublease agreements with third parties, although the Company remains contingently liable with respect to future lease obligations for such leased properties. Future minimum lease payments under operating leases as of January 29, 2013, associated with
96
Table of Contents
MATTRESS FIRM HOLDING CORP.
NOTES TO CONSOLIDATED FINANCIAL STATEMENTS (Continued)
10. Commitments and Contingencies (Continued)
properties no longer operated by the Company, and the related future sublease rentals is as follows (amounts in thousands):
| | | | | | | |
Fiscal Year | | Company's
Commitment | | Sublease
Rentals | |
|---|
2013 | | $ | 528 | | $ | 349 | |
2014 | | | 345 | | | 310 | |
2015 | | | 263 | | | 253 | |
2016 | | | 268 | | | 259 | |
2017 | | | 228 | | | 220 | |
Thereafter | | | — | | | — | |
| | | | | | |
| | $ | 1,632 | | $ | 1,391 | |
| | | | | | |
As of January 29, 2013, the Company guarantees and is primarily liable for approximately $1.0 million in future lease commitments through November 30, 2017 with respect to a real estate lease of a franchisee.
The Company has contracts related to sponsorships and space rentals at special event venues, with future minimum commitments as of January 29, 2013 of $2.0 million and $1.0 million for fiscal 2013 and fiscal 2014, respectively.
The Company is subject to legal proceedings and claims that arise in the ordinary course of business. Management does not believe that the outcome of any of those matters will have a material adverse effect on the Company's financial position, results of operations or cash flows.
On May 26, 2011, the Company settled a lawsuit involving alleged violations of the Fair Labor Standards Act brought in April 2010 by a former employee. The Company paid the settlement amount of $1.6 million to a claims-made reversionary fund on August 9, 2011, and such amount was recognized in sales and marketing expenses during the fiscal year ended February 1, 2011 and was included in accrued liabilities at February 1, 2011, with a corresponding charge to sales and marketing expense. The Company recovered $0.5 million from the claims-made reversionary fund upon completion of the settlement distribution process, which was recognized as a reduction of sales and marketing expenses during the fiscal year ended January 29, 2013.
11. Concentration Risk
Financial instruments that potentially subject the Company to concentrations of risk are primarily cash and cash equivalents and accounts receivable. Information with respect to the credit risk associated with accounts receivable is described in Note 1.
The Company places its cash deposits with financial institutions. At times, such amounts may be in excess of the federally insured limits. Management believes the financial strength of the financial institutions minimizes the credit risk related to the Company's deposits.
12. Related Party Transactions
Prior to the completion of the initial public offering on November 23, 2011, the Company had outstanding debt with parties that own equity interests in Mattress Holdings LLC and certain affiliates
97
Table of Contents
MATTRESS FIRM HOLDING CORP.
NOTES TO CONSOLIDATED FINANCIAL STATEMENTS (Continued)
12. Related Party Transactions (Continued)
of those equity investors, consisting of the 2009 Loan Facility, PIK Notes and Convertible Notes (collectively, "Related Party Debt"). Interest accrued on Related Party Debt was added to the outstanding principal amount of debt. In connection with the completion of the initial public offering, the total outstanding obligations of Related Party Debt was paid off with net proceeds from the offering or were converted to shares of the Company's common stock. Prior to the completion of the initial public offering the aggregate outstanding borrowings on Related Party Debt was $188.0 million at November 23, 2011. Interest expense on Related Party Debt included in the results of operations totaled $23.2 million and $20.6 million in fiscal 2010 and fiscal 2011, respectively.
2009 Loan Facility—On January 18, 2007, Mattress Holding entered into a financing agreement with a group of institutional investors that also own equity interests in Mattress Holdings, LLC, for a senior subordinated loan facility for term borrowings in the original amount of $120.0 million. The financing agreement was amended on February 16, 2007, which included a prepayment of the original borrowing in the amount of $40.0 million (the "2007 Subordinated Loan Facility"). The 2007 Subordinated Loan Facility was originally guaranteed by each existing subsidiary of Mattress Holding and its immediate parent Mattress Holdco, Inc. ("Mattress Holdco"). On March 20, 2009, Mattress Intermediate Holdings. Inc. ("Mattress Intermediate"), an indirect parent of Mattress Holding and a direct subsidiary of Mattress Firm Holding Corp., assumed all obligations of Mattress Holding in respect of the 2007 Subordinated Loan Facility, including accrued interest through such date, and the obligations and guarantees of Mattress Holding, Mattress Holdco and their respective subsidiaries were released and discharged. In connection therewith, the 2007 Subordinated Loan Facility was amended ("2009 Loan Facility").
Effective March 20, 2009, borrowings under the 2009 Loan Facility bore interest at 16% per annum. Accrued interest was payable quarterly by adding such interest to the principal amount outstanding on each interest payment date. The 2009 Loan Facility required no principal payments prior to its maturity on January 18, 2015, except for mandatory quarterly principal payments on or after March 20, 2014 to the extent required to prevent the loan from being considered an "applicable high yield discount obligation" within the meaning of the Internal Revenue Code. All obligations under the 2009 Loan Facility were unsecured.
The amendment resulting in the 2009 Loan Facility was recognized as an extinguishment of the 2007 Subordinated Loan Facility for financial reporting purposes. Accordingly, the carrying value of the debt was adjusted to its estimated market value as of March 20, 2009, which resulted in a $5.8 million debt discount and a gain on extinguishment, net of a loss of $2.8 million from the write off of unamortized debt issue costs, resulting in the recognition of a net gain on debt extinguishment of $2.8 million during fiscal 2009. The debt discount was being amortized over the remaining term of the 2009 Loan Facility, resulting in a 17.2% effective interest rate. The Company incurred $1.0 million of direct costs related to the amendment, which was being amortized over the remaining term of the 2009 Loan Facility.
On July 19, 2011, the Company made a voluntary prepayment of $40.0 million under the 2009 Loan Facility. On November 23, 2011 the Company used $88.8 million of the net proceeds from the initial public offering to repay in full all amounts outstanding under the 2009 Loan Facility. In connection with the voluntary prepayments, the Company recognized a loss on debt extinguishment in the amount of $5.7 million during fiscal 2011.
98
Table of Contents
MATTRESS FIRM HOLDING CORP.
NOTES TO CONSOLIDATED FINANCIAL STATEMENTS (Continued)
12. Related Party Transactions (Continued)
PIK Notes—At various times from October 24, 2007 through May 20, 2009, Mattress Firm Holding Corp. issued paid-in-kind notes ("PIK Notes") to certain equity investors of Mattress Holdings, LLC and certain affiliates of those equity investors. The proceeds from each separate issuance were contributed to the equity of Mattress Holding for various purposes. Under the terms issued, the PIK Notes would mature at various dates between October 24, 2012 and March 19, 2015.
The PIK Notes bore interest at a rate of 12% per annum. Accrued interest was payable either annually or semiannually, as was applicable for each separate note issuance, with each such interest payment made through the addition of such interest amount to the outstanding principal amount of each of the PIK Notes. The PIK Notes required no principal payments prior to their maturity and the Company was permitted to prepay the PIK Notes, in whole or in part, at anytime without premium or penalty. The PIK Notes were not guaranteed by any of the Company's subsidiaries or parent entities and all obligations under the PIK Notes were unsecured.
On November 23, 2011, in connection with the consummation of the initial public offering, (1) the Company used $4.6 million of the net proceeds from the initial public offering to repay in full the Company's PIK Notes that did not convert into shares of the Company's common stock upon the completion of the initial public offering and (2) the aggregate remaining principal and accrued interest balance of $52.7 million were converted into 2,774,035 shares the Company's common stock at a price per share equal to the initial public offering price of $19.00 per common share.
Convertible Notes—On July 19, 2011, the Company issued convertible notes in an aggregate principal amount of $40.2 million ("Convertible Notes") to certain equity investors of Mattress Holdings, LLC and certain affiliates of those equity investors. The Convertible Notes bore interest at a rate of 12%, payable annually on July 18 of each year through the addition of the accrued interest to the outstanding principal balance of the notes. The Convertible Notes were to mature on July 18, 2016, although the Company was permitted to prepay the Convertible Notes, in whole or in part, at any time without premium or penalty. The Convertible Notes did not contain any financial or operating covenants. Pursuant to an automatic conversion feature, on November 23, 2011, in connection with the consummation of the initial public offering, the Convertible Notes with an aggregate principal and accrued interest balance of $41.9 million converted into 2,205,953 shares of common stock at a price per share equal to the initial public offering price of $19.00 per common share.
The Company incurred management fees and other direct expenses from affiliates of J.W. Childs under the terms of a management agreement prior to the termination of the agreement on November 23, 2011. Beginning on March 20, 2009, and continuing until the termination of the agreement, the Company was not required to pay accrued management fees until such time as the Company began making interest payments related to the outstanding amounts under the then existing credit facility. Interest on the outstanding balance of accrued management fees accrued at a rate of 16%, and all accrued interest was added to the outstanding balance of accrued management fees. On November 23, 2011, the management agreement was terminated in connection with Company's initial public offering, and $1.6 million of the net proceeds raised in the offering were used to pay the outstanding balance of accrued management fees, including accrued interest, and a management agreement termination fee of $0.4 million. The aggregate amount of management fees, interest expense
99
Table of Contents
MATTRESS FIRM HOLDING CORP.
NOTES TO CONSOLIDATED FINANCIAL STATEMENTS (Continued)
12. Related Party Transactions (Continued)
accrued thereon, and the termination fee recognized in the Company's results of operations totaled $0.4 million and $0.6 million for fiscal 2010 and fiscal 2011, respectively.
13. Retirement Plans
The Company sponsors a 401(k) defined contribution plan (the "Retirement Plan") that covers substantially all employees. Participants may elect to defer a percentage of their salary, subject to annual limitations imposed by the Internal Revenue Code. The Company makes matching contributions at its discretion. The Company temporarily suspended matching contributions beginning in March 2009 and continuing through April 2010. Approximate matching contributions and other expenses related to the Retirement Plan were as follows (amounts in thousands):
| | | | |
Fiscal 2010 | | $ | 333 | |
Fiscal 2011 | | $ | 534 | |
Fiscal 2012 | | $ | 816 | |
The Company also sponsors an executive nonqualified deferred compensation plan. Participants may elect to defer a percentage of their earned wages to the plan. The Company may, at its discretion, provide matching and profit-sharing contributions under this plan. The Company has not elected to make any discretionary contributions. The plan assets and related deferred compensation liability included in other assets and other noncurrent liabilities at January 31, 2012 and January 29, 2013, were approximately $0.9 million and $1.1 million, respectively. The plan assets are held within a rabbi trust and are restricted from Company access.
14. Stock-Based Compensation
2011 Omnibus Incentive Plan—On November 3, 2011, the Company's board of directors and shareholders adopted the Mattress Firm Holding Corp. 2011 Omnibus Incentive Plan to provide for the grant of equity-based awards to Company employees, directors and other service providers. A total of 4,206,000 shares of the Company's common stock were reserved for grants under the 2011 Omnibus Incentive Plan. There were 2,790,196 shares available for future grants under the stock incentive plan as of January 29, 2013.
Stock Options—A portion of the stock options granted to the Company's employees are subject to a five-year time-based vesting schedule, while the remaining portion of the stock options are subject to a four-year market-based vesting schedule, with such vesting based on specified stock price increase targets, as set forth in the option award agreements evidencing the grant of such stock options. The exercise price of the options is the closing market value of the Company's common stock on the date of grant, and the options have a term of 10 years. Future vesting dates on the stock options range from November 17, 2013 to August 13, 2017. The expiration dates of stock options that are currently outstanding range from November 17, 2021 to August 13, 2022.
100
Table of Contents
MATTRESS FIRM HOLDING CORP.
NOTES TO CONSOLIDATED FINANCIAL STATEMENTS (Continued)
14. Stock-Based Compensation (Continued)
A summary of the Company's stock options is as follows (options in thousands):
| | | | | | | | | | | | | |
| | Fiscal 2011 | | Fiscal 2012 | |
|---|
| | Stock
Options | | Weighted
Average
Exercise Price
Per Share | | Stock
Options | | Weighted
Average
Exercise Price
Per Share | |
|---|
Outstanding, beginning of fiscal year | | | — | | $ | — | | | 1,224 | | $ | 19.00 | |
Granted(a) | | | 1,248 | | $ | 19.00 | | | 105 | | $ | 29.26 | |
Exercised(b) | | | — | | $ | — | | | (27 | ) | $ | 19.00 | |
Forfeited | | | (24 | ) | $ | 19.00 | | | (52 | ) | $ | 19.00 | |
| | | | | | | | | | | | |
Outstanding, end of fiscal year(c) | | | 1,224 | | $ | 19.00 | | | 1,250 | | $ | 19.86 | |
| | | | | | | | | | | | |
Exercisable, end of fiscal year(d) | | | — | | $ | — | | | 246 | | $ | 19.00 | |
- (a)
- The weighted average grant-date fair value of stock options granted during fiscal 2011 and fiscal 2012 was $8.50 and $14.10, respectively.
- (b)
- The aggregate intrinsic value of stock options exercised during fiscal 2012 was $0.2 million.
- (c)
- Stock options outstanding as of January 29, 2013 have a weighted average remaining contractual term of 8.83 years and an aggregate intrinsic value of $10.0 million based on the market value of common stock on January 29, 2013.
- (d)
- Stock options exercisable as of January 29, 2013 have a weighted average remaining contractual term of 8.60 years and an aggregate intrinsic value of $2.2 million based on the market value of common stock on January 29, 2013.
The Company received cash proceeds of $0.5 million during fiscal 2012 from employee stock option exercises that are presented as cash proceeds from financing activities in the Company's consolidated statements of cash flows.
The Company accounts for employee stock options under the fair value method of accounting using a Black-Scholes methodology to measure time based option expense at the date of grant and a Monte Carlo Simulation approach to measure market-based option expense at the date of grant. The fair value of the stock options at the date of grant is recognized as expense over the vesting period. The following assumptions were used to calculate the fair value of the Company's time-based stock options on the date of grant utilizing the Black- Scholes option pricing model:
| | | | | | | |
| | Fiscal
2011 | | Fiscal
2012 | |
|---|
Weighted average expected life (in years) | | | 6.5 | | | 6.5 | |
Volatility factor | | | 55 | % | | 60 | % |
Dividend yield | | | 0 | % | | 0 | % |
Risk-free interest rate | | | 1.28 | % | | 1.02 | % |
101
Table of Contents
MATTRESS FIRM HOLDING CORP.
NOTES TO CONSOLIDATED FINANCIAL STATEMENTS (Continued)
14. Stock-Based Compensation (Continued)
The following assumptions were used to calculate the fair value of the Company's market-based stock options on the grant date utilizing a Monte Carlo Simulation approach:
| | | | | | | |
| | Fiscal
2011 | | Fiscal
2012 | |
|---|
Suboptimal exercise factor | | | 2.5x | | | 2.5x | |
Volatility factor | | | 55 | % | | 60 | % |
Dividend yield | | | 0 | % | | 0 | % |
Risk-free interest rate | | | 1.28 | % | | 1.02 | % |
The Company bases it expected option life on the expected exercise and termination behavior of the option holders and an appropriate model of the Company's future stock price. The expected volatility assumption is derived from the historical volatility of similar companies' common stock over the most recent period commensurate with the estimated expected life of the Company's stock options, combined with other relevant factors. The dividend yield is the annual rate of dividends per share over the exercise price of the option as of the grant date.
For the years ended January 31, 2012 and January 29, 2013 the Company recognized $0.4 million and $2.4 million, respectively of compensation expense associated with stock options awards in general and administrative expenses in the consolidated statement of operations. The Company has not capitalized any equity-based compensation costs related to stock options during the years ended January 31, 2012 and January 29, 2013.
As of January 29, 2013, the Company estimates that a total of approximately $6.7 million of currently unrecognized forfeiture adjusted compensation expense will be recognized over a weighted average period of 3.20 years for unvested stock option awards issued and outstanding.
Restricted Stock—The Company grants restricted stock to non-employee independent directors and certain of the Company's employees. The outstanding restricted stock awards to non-employee independent directors is subject to one year cliff vesting and the currently outstanding restricted stock granted to certain of the Company's employees is subject to a three-year time-based vesting schedule.
A summary of the Company's restricted stock is as follows (restricted shares in thousands):
| | | | | | | |
| | Fiscal 2012 | |
|---|
| | Restricted
Shares | | Weighted
Average
Fair
Value | |
|---|
Outstanding, beginning of fiscal year | | | — | | $ | — | |
Granted(a) | | | 139 | | $ | 29.10 | |
Vested | | | — | | $ | — | |
Forfeited | | | — | | $ | — | |
| | | | | | | |
Unvested, end of fiscal year | | | 139 | | $ | 29.10 | |
| | | | | | | |
- (a)
- The total grant-date fair value of restricted stock awards granted during the period was $4.0 million.
102
Table of Contents
MATTRESS FIRM HOLDING CORP.
NOTES TO CONSOLIDATED FINANCIAL STATEMENTS (Continued)
14. Stock-Based Compensation (Continued)
For the year ended January 29, 2013, the Company recognized $0.5 million of compensation expense associated with restricted stock awards in general and administrative expenses in the consolidated statement of operations. The Company has not capitalized any equity-based compensation costs related to restricted stock awards during the year ended January 29, 2013.
As of January 29, 2013, the Company estimates that a total of approximately $3.0 million of currently unrecognized forfeiture adjusted compensation expense will be recognized over a weighted average period of 2.65 years for unvested restricted stock awards.
Class B Units—Mattress Holdings, LLC, the former parent of Mattress Firm Holding Corp., established a class of equity ownership units ("Class B Units") that were issued primarily to employees of the Company for future services at the discretion of the board of managers of Mattress Holdings, LLC. The previously issued and unforfeited Class B Units remained outstanding until the shares of common stock of Mattress Firm Holding Corp. held by Mattress Holdings, LLC were distributed to its unit holders, including holders of Class B Units, on September 27, 2012, in connection with the pending dissolution of Mattress Holdings, LLC.
The method used by the Company to estimate the fair value of Class B Unit granted in prior years was based upon a two-step process as of the date of each award. The first step involved valuation of the Company and the related after-debt value attributable to the equity owners.
The Company's fair value for grants of Class B Unit awards was based upon a composite of values determined by a market approach, using both market multiple and comparable transaction methodologies, and a discounted cash flow methodology. The second step to valuing Class B Units involved the allocation of the total equity value determined on each grant date among the Class B Units and other equity holders using a probability-weighted expected return methodology. Under this method, the allocation of equity value to Class B units was determined for a number of possible outcomes, with each outcome weighted based upon management's estimate of the likelihood of such outcome. The outcomes considered were: (1) ongoing operations without a Liquidity Event, (2) Liquidity Event resulting from a merger or sale to another party, (3) Liquidity Event resulting from an initial public offering of the Company's common stock and (4) a distressed sale.
The fair value of the Class B Unit awards, net of estimated forfeitures, was recognized as expense over terms that ranged from 2.5 years to 2.9 years, which were based upon the timing and weighting of the expected outcomes derived from the fair value calculation. Stock-based compensation expense (benefit) recognized in the consolidated results of operations related to the Class B Units was approximately ($0.5 million), approximately $0.2 million and less than $0.1 million during fiscal 2010, fiscal 2011 and fiscal 2012, respectively. No income tax benefits were recognized by the Company with respect to the issuance and subsequent vesting of Class B Units. Compensation expense recorded during fiscal 2010 included the effect of forfeitures that occurred during fiscal 2010 that were in excess of previous estimates and which resulted in the reversal of previously recognized expense in the amount of approximately $0.6 million.
103
Table of Contents
MATTRESS FIRM HOLDING CORP.
NOTES TO CONSOLIDATED FINANCIAL STATEMENTS (Continued)
14. Stock-Based Compensation (Continued)
A summary of the status of unvested Class B Units at January 29, 2013, and changes during fiscal 2012 is as follows (unit amounts in thousands):
| | | | | | | | | | | | | |
| | Fiscal 2011 | | Fiscal 2012 | |
|---|
| | Class B
Units | | Weighted
Average
Grant-Date
Fair Value | | Class B
Units | | Weighted
Average
Grant-Date
Fair Value | |
|---|
Unvested, beginning of fiscal year | | | 1,628 | | $ | 0.89 | | | 1,277 | | $ | 0.98 | |
Granted | | | — | | $ | — | | | — | | $ | — | |
Vested | | | (313 | ) | $ | 0.61 | | | (1,277 | ) | $ | 0.98 | |
Forfeited | | | (38 | ) | $ | 0.23 | | | — | | $ | — | |
| | | | | | | | | | | | |
Unvested, end of fiscal year | | | 1,277 | | $ | 0.98 | | | — | | $ | — | |
| | | | | | | | | | | | |
The total fair value of Class B Units, as determined on the respective grant dates, was approximately $0.1 million, $0.2 million and $1.3 million for Class B Units that vested during fiscal 2010, fiscal 2011 and fiscal 2012, respectively.
15. Supplemental Statement of Cash Flow Information
Supplemental information to the statement of cash flows is as follows (amounts in thousands):
| | | | | | | | | | |
| | Fiscal 2010 | | Fiscal 2011 | | Fiscal 2012 | |
|---|
Interest paid | | $ | 6,430 | | $ | 7,512 | | $ | 8,052 | |
Net taxes paid | | $ | 674 | | $ | 2,490 | | $ | 11,406 | |
Noncash Investing and Financing Activities—Assets acquired, liabilities assumed and debt issued in connection with business combinations are described in Note 2. Noncash interest expense including amounts accrued in other noncurrent liabilities and added to the outstanding principal balance of the 2009 Loan Facility, PIK Notes and Convertible Notes totaled $23.2 million and $20.6 million for fiscal 2010 and fiscal 2011, respectively.
On November 23, 2011, in connection with the initial public offering, the PIK Notes and Convertible Notes were either repaid or converted into shares of the Company's common stock. As a result of the transaction, $90.7 million in debt and $3.9 million in accrued interest was converted to the Company's common stock.
In December 2012, the Company determined the final post closing adjustment to the purchase price of the Mattress X-Press acquisition, which resulted in a $2.6 million reduction in the purchase price that was settled through direct offsets of the Company's quarterly payment obligations on seller notes issued in connection with the acquisition.
104
Table of Contents
MATTRESS FIRM HOLDING CORP.
NOTES TO CONSOLIDATED FINANCIAL STATEMENTS (Continued)
16. Quarterly Results of Operations (Unaudited)
| | | | | | | | | | | | | | | | | | | | | | | | | |
| | 1st Quarter | | 2nd Quarter | | 3rd Quarter | | 4th Quarter | |
|---|
| | FY 2011 | | FY 2012 | | FY 2011 | | FY 2012 | | FY 2011 | | FY 2012 | | FY 2011 | | FY 2012 | |
|---|
Net sales | | $ | 151,924 | | $ | 209,814 | | $ | 179,914 | | $ | 262,018 | | $ | 183,514 | | $ | 277,259 | | $ | 188,558 | | $ | 258,246 | |
Cost of sales | | | 95,946 | | | 127,272 | | | 109,281 | | | 159,854 | | | 110,106 | | | 167,173 | | | 112,685 | | | 160,273 | |
| | | | | | | | | | | | | | | | | | |
Gross profit from retail operations | | | 55,978 | | | 82,542 | | | 70,633 | | | 102,164 | | | 73,408 | | | 110,086 | | | 75,873 | | | 97,973 | |
Franchise fees and royalty income | | | 987 | | | 1,205 | | | 1,085 | | | 1,327 | | | 1,329 | | | 1,490 | | | 1,296 | | | 1,374 | |
| | | | | | | | | | | | | | | | | | |
| | | 56,965 | | | 83,747 | | | 71,718 | | | 103,491 | | | 74,737 | | | 111,576 | | | 77,169 | | | 99,347 | |
| | | | | | | | | | | | | | | | | | |
Operating expenses: | | | | | | | | | | | | | | | | | | | | | | | | | |
Sales and marketing expenses | | | 35,637 | | | 49,128 | | | 45,077 | | | 66,564 | | | 41,420 | | | 67,475 | | | 45,471 | | | 62,388 | |
General and administrative expenses | | | 11,770 | | | 16,630 | | | 12,357 | | | 19,248 | | | 11,638 | | | 20,868 | | | 15,919 | | | 16,894 | |
Intangible asset impairment charge | | | — | | | — | | | — | | | — | | | — | | | — | | | — | | | 2,100 | |
Loss (gain) on store closings and impairment of store assets | | | 174 | | | 17 | | | (135 | ) | | 54 | | | 285 | | | 196 | | | 435 | | | 783 | |
| | | | | | | | | | | | | | | | | | |
Total operating expenses | | | 47,581 | | | 65,775 | | | 57,299 | | | 85,866 | | | 53,343 | | | 88,539 | | | 61,825 | | | 82,165 | |
| | | | | | | | | | | | | | | | | | |
Income from operations | | | 9,384 | | | 17,972 | | | 14,419 | | | 17,625 | | | 21,394 | | | 23,037 | | | 15,344 | | | 17,182 | |
| | | | | | | | | | | | | | | | | | |
Other expense (income): | | | | | | | | | | | | | | | | | | | | | | | | | |
Interest income | | | (2 | ) | | (1 | ) | | (1 | ) | | — | | | (1 | ) | | — | | | (5 | ) | | (10 | ) |
Interest expense | | | 8,277 | | | 2,075 | | | 8,672 | | | 2,214 | | | 8,530 | | | 2,097 | | | 3,831 | | | 2,872 | |
Loss from debt extinguishment | | | — | | | — | | | 1,873 | | | — | | | — | | | — | | | 3,831 | | | — | |
| | | | | | | | | | | | | | | | | | |
| | | 8,275 | | | 2,074 | | | 10,544 | | | 2,214 | | | 8,529 | | | 2,097 | | | 7,657 | | | 2,862 | |
| | | | | | | | | | | | | | | | | | |
Income before income taxes | | | 1,109 | | | 15,898 | | | 3,875 | | | 15,411 | | | 12,865 | | | 20,940 | | | 7,687 | | | 14,320 | |
Income tax expense (benefit) | | | 80 | | | 6,162 | | | 239 | | | 5,326 | | | 551 | | | 8,484 | | | (9,685 | ) | | 6,726 | |
| | | | | | | | | | | | | | | | | | |
Net income | | $ | 1,029 | | $ | 9,736 | | $ | 3,636 | | $ | 10,085 | | $ | 12,314 | | $ | 12,456 | | $ | 17,372 | | $ | 7,594 | |
| | | | | | | | | | | | | | | | | | |
Basic net income per common share | | $ | 0.05 | | $ | 0.29 | | $ | 0.16 | | $ | 0.30 | | $ | 0.55 | | $ | 0.37 | | $ | 0.56 | | $ | 0.22 | |
Diluted net income per common share | | $ | 0.05 | | $ | 0.29 | | $ | 0.16 | | $ | 0.30 | | $ | 0.55 | | $ | 0.37 | | $ | 0.56 | | $ | 0.22 | |
Due to the method of calculating weighted average common shares outstanding, the sum of the quarterly per share amounts may not equal net earnings per common share attributable to common shareholders for the respective years.
As further described in Note 4, the Company recognized a $2.1 million intangible asset impairment loss in the fourth quarter of fiscal 2012 related to the Mattress Discounters trade name.
As further described in Note 12, on July 19, 2011, the Company made a voluntary prepayment of $40.0 million under the 2009 Loan Facility. In connection with the voluntary prepayment, the Company recognized a loss on debt extinguishment in the amount of $1.9 million in the second quarter of fiscal 2011. In addition, on November 23, 2011 the Company used $88.8 million of the net proceeds from the initial public offering to repay in full all amounts outstanding under the 2009 Loan Facility. In connection with the voluntary prepayment, the Company recognized a loss on debt extinguishment in the amount of $3.8 million in the fourth quarter of fiscal 2011.
105
Table of Contents
MATTRESS FIRM HOLDING CORP.
NOTES TO CONSOLIDATED FINANCIAL STATEMENTS (Continued)
16. Quarterly Results of Operations (Unaudited) (Continued)
As further described in Note 6, the Company recognized a deferred tax benefit during fiscal 2011 in the amount of $20.1 million, consisting of a $5.9 million reduction over the course of the first three quarters of fiscal 2011 resulting from the utilization of deferred tax assets, primarily net operating loss carryforwards, and a $14.2 million reduction in the fourth quarter of fiscal 2011 resulting from the year-end evaluation supporting that deferred tax assets will be realized in future periods.
106
Table of Contents
Item 9. Changes in and Disagreements with Accountants on Accounting and Financial Disclosure
None.
Item 9A. Controls and Procedures
Evaluation of Disclosure Controls and Procedures
We have established disclosure controls and procedures (as defined in Rule 13a-15(e) under the Securities Exchange Act of 1932, as amended (the "Exchange Act")) to ensure that information relating to our company, including our consolidated subsidiaries, that would be required to be disclosed in Exchange Act reports is recorded, processed, summarized and reported within the time periods specified in the SEC's rules and forms, and such information is accumulated and communicated to the officers who certify our financial reports and to other members of senior management and our board of directors.
We carried out an evaluation, under the supervision and with the participation of our management, including our Chief Executive Officer and Chief Financial Officer, of the effectiveness of the design of our disclosure controls and procedures as of January 29, 2013. Based on that evaluation, our Chief Executive Officer and Chief Financial Officer have concluded that our disclosure controls and procedures (as defined in Rules 13a-15(e) and 15d-15(e) under the Exchange Act) are effective as of January 29, 2013.
Our management, including our Chief Executive Officer and Chief Financial Officer, does not expect that our disclosure controls and procedures or internal controls will prevent all possible error and fraud. Our disclosure controls and procedures are, however, designed to provide reasonable assurance of achieving their objectives, and our Chief Executive Officer and Chief Financial Officer have concluded that our financial controls and procedures are effective at that reasonable assurance level.
Management's Report on Internal Control over Financial Reporting
Our management is responsible for establishing and maintaining adequate internal control over financial reporting as defined in Rule 13a-15(f) under the Exchange Act. Our management conducted an evaluation of the effectiveness of our internal controls over financial reporting based on the framework inInternal Control—Integrated Framework issued by the Committee of Sponsoring Organizations of the Treadway Commission (the COSO criteria). Based on its evaluation, our management concluded that our internal control over financial reporting was effective as of January 29, 2013.
Grant Thornton, LLP, an independent registered public accounting firm, has issued an attestation report on our internal control over financial reporting. The attestation report is included herein.
Changes in Internal Control Over Financial Reporting
There has been no change in our internal control over financial reporting during the fourth quarter of 2012 that has materially affected, or is reasonably likely to materially affect, our internal control over financial reporting.
Item 9B. Other Information
None.
107
Table of Contents
Part III
Item 10. Directors, Executive Officers and Corporate Governance
The information required by this item will be contained in our definitive proxy statement for our 2013 Annual Meeting of Stockholders, which will be filed no later than 120 days after January 29, 2013, the end of our 2012 fiscal year (the "Definitive Proxy Statement") and is incorporated herein by reference.
Item 11. Executive Compensation
The information required by this item will be contained in the Definitive Proxy Statement and is incorporated herein by reference. The Compensation Committee Report and related information incorporated by reference herein shall not be deemed "soliciting material" or to be "filed" with the SEC, nor shall such information be incorporated by reference into any future filing under the Securities Act of 1933, as amended, or Securities Exchange Act of 1934, as amended, except to the extent that the Company specifically incorporates such information by reference into such a filing.
Item 12. Security Ownership of Certain Beneficial Owners and Management and Related Stockholder Matters
The information required by this item will be contained in the Definitive Proxy Statement and is incorporated herein by reference.
Item 13. Certain Relationships and Related Transactions, and Director Independence
The information required by this item will be contained in the Definitive Proxy Statement and is incorporated herein by reference.
Item 14. Principal Accountant Fees and Services
The information required by this item will be contained in the Definitive Proxy Statement and is incorporated herein by reference.
PART IV
Item 15. Exhibits and Financial Statement Schedules
Documents filed as a part of the report:
- (2)
- Financial Statement Schedules.
As listed in the Index to Financial Statements and Supplementary Data on page 62.
Note: All other schedules are omitted as the required information is not applicable or the information is presented in the consolidated financial statements or related notes.
- (3)
- Exhibits.
See Exhibit Index on pages 109-111 for list of exhibits filed with this Annual Report on Form 10-K. Management contracts and compensatory plans or arrangements are identified with asterisks on the Exhibit Index.
108
Table of Contents
Exhibit Index
| | | |
Exhibit
Number | | Exhibit Title |
|---|
| | 2.1 | | Stock Purchase Agreement dated as of April 9, 2012, by and among Mattress Firm, Inc., as buyer, the sellers party thereto and FS Equity Partners V, L.P., as seller representative (incorporated by reference to Exhibit 2.1 to Mattress Firm Holding Corp's Current Report on Form 8-K filed April 10, 2012). |
| | | | |
| | 2.2 | | Asset Purchase Agreement dated September 4, 2012, by and among Mattress Firm, Inc., as buyer, Mattress XPress, Inc., Mattress XPress of Georgia, Inc., Steven Milesic and Steve Lytell (incorporated by reference to Exhibit 2.1 to Mattress Firm Holding Corp.'s Current Report on Form 8-K filed September 6, 2012). |
| | | | |
| | 3.1 | | Amended and Restated Certificate of Incorporation of Mattress Firm Holding Corp. (incorporated by reference to Exhibit 3.1 to Mattress Firm Holding Corp's Current Report on Form 8-K filed November 29, 2011). |
| | | | |
| | 3.2 | * | Amended and Restated Bylaws of Mattress Firm Holding Corp. |
| | | | |
| | 4.1 | | Registration Rights Agreement between Mattress Firm Holding Corp. and certain equity holders of Mattress Holdings, LLC (incorporated by reference to Exhibit 4.1 to Mattress Firm Holding Corp.'s Registration Statement on Form S-1/A (File No. 333-174830) filed September 28, 2011). |
| | | | |
| | 10.1 | + | Mattress Firm Holding Corp. 2011 Omnibus Incentive Plan (incorporated by reference to Exhibit 10.1 to Mattress Firm Holding Corp.'s Registration Statement on Form S-1/A (File No. 333-174830) filed November 7, 2011). |
| | | | |
| | 10.2 | + | Second Amended and Restated Employment Agreement of R. Stephen Stagner, dated September 14, 2011(incorporated by reference to Exhibit 10.2 to Mattress Firm Holding Corp.'s Registration Statement on Form S-1/A (File No. 333-174830) filed September 28, 2011). |
| | | | |
| | 10.3 | + | Amended and Restated Employment Agreement of James R. Black, dated September 14, 2011(incorporated by reference to Exhibit 10.3 to Mattress Firm Holding Corp.'s Registration Statement on Form S-1/A (File No. 333-174830) filed September 28, 2011). |
| | | | |
| | 10.4 | + | Amended and Restated Employment Agreement of Stephen G. Fendrich, dated September 14, 2011 (incorporated by reference to Exhibit 10.4 to Mattress Firm Holding Corp.'s Registration Statement on Form S-1/A (File No. 333-174830) filed September 28, 2011). |
| | | | |
| | 10.5 | + | Offer Letter and Employment, Confidentiality and Non-Competition Agreement of George McGill, dated June 5, 2009 and June 8, 2009, respectively (incorporated by reference to Exhibit 10.5 to Mattress Firm Holding Corp.'s Registration Statement on Form S-1/A (File No. 333-174830) filed September 28, 2011). |
| | | | |
| | 10.6 | + | Offer Letter and Employment, Confidentiality and Non-Competition Agreement of Bruce Levy, dated December 10, 2008 and December 12, 2008, respectively (incorporated by reference to Exhibit 10.6 to Mattress Firm Holding Corp.'s Registration Statement on Form S-1/A filed September 28, 2011). |
| | | | |
| | 10.7 | +* | Offer Letter and Employment, Confidentiality and Non-Competition Agreement of Karrie Forbes, dated January 4, 2012 and January 24, 2012, respectively. |
| |
| | |
109
Table of Contents
| | | |
Exhibit
Number | | Exhibit Title |
|---|
| | 10.8 | +* | Offer Letter and Employment, Confidentiality and Non-Competition Agreement of Kenneth E. Murphy III, dated January 4, 2012 and January 19, 2012, respectively. |
| | | | |
| | 10.9 | | Restatement Amendment dated November 5, 2012, among Mattress Holding Corp., as borrower, Mattress Holdco, Inc., certain subsidiary guarantors party thereto and UBS AG, Stamford Branch, as administrative agent (incorporated by reference to Exhibit 10.1 to Mattress Firm Holding Corp.'s Current Report on Form 8-K filed November 7, 2012). |
| | | | |
| | 10.10 | | Form of Director and Officer Indemnification Agreement (incorporated by reference to Exhibit 10.11 to Mattress Firm Holding Corp.'s Registration Statement on Form S-1/A (File No. 333-174830) filed September 28, 2011). |
| | | | |
| | 10.11 | | Simmons Dealer Incentive Agreement between Simmons Bedding Company and Mattress Firm, Inc., dated June 1, 2010 (incorporated by reference to Exhibit 10.13 to Mattress Firm Holding Corp.'s Registration Statement on Form S-1/A (File No. 333-174830) filed July 8, 2011). |
| | | | |
| | 10.12 | | Product Supply Agreement between Sealy Mattress Company and Mattress Firm, Inc., dated January 1, 2009 (incorporated by reference to Exhibit 10.14 to Mattress Firm Holding Corp.'s Registration Statement on Form S-1/A (File No. 333-174830) filed July 8, 2011). |
| | | | |
| | 10.13 | | Amendment to 2009 Agreement between Sealy Mattress Company and Mattress Firm, Inc., dated November 30, 2010 (incorporated by reference to Exhibit 10.15 to Mattress Firm Holding Corp.'s Registration Statement on Form S-1/A (File No. 333-174830) filed July 8, 2011). |
| | | | |
| | 10.14 | | Stearn & Fosters Product Supply Agreement between Sealy Mattress Company and Mattress Firm, Inc., dated April 1, 2009 (incorporated by reference to Exhibit 10.16 to Mattress Firm Holding Corp.'s Registration Statement on Form S-1/A filed July 8, 2011). |
| | | | |
| | 10.15 | | First Amendment to Product Supply Agreement between Sealy Mattress Company and Mattress Firm, Inc., dated May 1, 2009 (incorporated by reference to Exhibit 10.17 to Mattress Firm Holding Corp.'s Registration Statement on Form S-1/A (File No. 333-174830) filed July 8, 2011). |
| | | | |
| | 10.16 | | Retailer Agreement between Mattress Firm, Inc. and Tempur-Pedic North America, LLC, effective May 23, 2012 (incorporated by reference to Exhibit 10.1 to Mattress Firm Holding Corp.'s Current Report on Form 8-K filed September 12, 2012). |
| | | | |
| | 10.17 | | Mattress Firm Holding Corp. Executive Annual Incentive Plan (incorporated by reference to Exhibit 10.21 to Mattress Firm Holding Corp.'s Registration Statement on Form S-1/A (File No. 333-174830) filed November 7, 2011). |
| | | | |
| | 10.25 | +* | Independent Director Compensation Policy. |
| | | | |
| | 21.1 | * | Subsidiaries of Mattress Firm Holding Corp. |
| | | | |
| | 23.1 | * | Consent of Grant Thornton LLP. |
| | | | |
| | 31.1 | * | Principal Executive Officer Certification Pursuant to Securities Exchange Act Rules 13a-14 and 15d-14 as Adopted Pursuant to the Section 302 of the Sarbanes-Oxley Act of 2002. |
| |
| | |
110
Table of Contents
| | | |
Exhibit
Number | | Exhibit Title |
|---|
| | 31.2 | * | Principal Financial Officer Certification Pursuant to Securities Exchange Act Rules 13a-14 and 15d-14 as Adopted Pursuant to the Section 302 of the Sarbanes-Oxley Act of 2002. |
| | | | |
| | 32.1 | * | Principal Executive Officer Certification Pursuant to 18 U.S.C. Section 1350 as Adopted Pursuant to Section 906 of the Sarbanes-Oxley Act of 2002. |
| | | | |
| | 32.2 | * | Principal Financial Officer Certification Pursuant to 18 U.S.C. Section 1350 as Adopted Pursuant to Section 906 of the Sarbanes-Oxley Act of 2002. |
| | | | |
| | 101.INS | ** | XBRL Instance Document |
| | | | |
| | 101.SCH | ** | XBRL Taxonomy Extension Schema Document |
| | | | |
| | 101.CAL | ** | XBRL Taxonomy Extension Calculation Linkbase Document |
| | | | |
| | 101.LAB | ** | XBRL Taxonomy Extension Lables Linkbase Document |
| | | | |
| | 101.PRE | ** | XBRL Taxonomy Extension Presentation Linkbase Document |
| | | | |
| | 101.DEF | ** | XBRL Taxonomy Extension Definition Linkbase Document |
- +
- Management contract or compensatory plan or arrangement.
- *
- Filed herewith.
- **
- Pursuant to Rule 406T of Regulation S-T of the SEC, and subject to the conditions set forth therein, the interactive data files furnished on Exhibit 101 hereto are deemed not filed or part of a registration statement or prospectus for purposes of Sections 11 or 12 of the Securities Act of 1933, as amended, are deemed not filed for purpose of Section 18 of the Securities Exchange Act of 1934, as amended, and otherwise are not subject to liability under those sections.
111
Table of Contents
MATTRESS FIRM HOLDING CORP.
SCHEDULE I—CONDENSED FINANCIAL INFORMATION OF
MATTRESS FIRM HOLDING CORP.
(PARENT COMPANY)
BALANCE SHEETS
| | | | | | | |
| | January 31,
2012 | | January 29,
2013 | |
|---|
| | (in thousands)
| |
|---|
Assets | | | | | | | |
Cash and cash equivalents | | $ | 15,473 | | $ | 11,180 | |
Investment in subsidiary | | | 229,217 | | | 253,435 | |
Deferred income taxes | | | 12,574 | | | — | |
| | | | | | |
Total assets | | $ | 257,264 | | $ | 264,615 | |
| | | | | | |
Liabilities and Stockholder's Equity | | | | | | | |
Current liabilities | | $ | 1,985 | | | — | |
Deferred income taxes | | | 31,045 | | | — | |
| | | | | | |
Total liabilities | | | 33,030 | | | — | |
Commitments and contingencies | | | | | | | |
Common stock, $0.01 par value; 120,000,000 shares authorized; 33,768,828 and 33,795,630 shares issued and outstanding at January 31, 2012 and January 29, 2013, respectively | | |
338 | | |
338 | |
Additional paid-in capital | | | 361,692 | | | 362,202 | |
Accumulated deficit | | | (137,796 | ) | | (97,925 | ) |
| | | | | | |
Total stockholder's equity | | | 224,234 | | | 264,615 | |
| | | | | | |
Total liabilities and stockholder's equity | | $ | 257,264 | | $ | 264,615 | |
| | | | | | |
112
Table of Contents
MATTRESS FIRM HOLDING CORP.
SCHEDULE I—CONDENSED FINANCIAL INFORMATION OF
MATTRESS FIRM HOLDING CORP.
(PARENT COMPANY)
STATEMENTS OF OPERATIONS
| | | | | | | | | | |
| | Fiscal
2010 | | Fiscal
2011 | | Fiscal
2012 | |
|---|
| | (in thousands)
| |
|---|
Equity in undistributed earnings of subsidiary | | $ | 6,920 | | $ | 32,448 | | $ | 39,871 | |
Interest expense | | | 5,725 | | | 6,912 | | | — | |
| | | | | | | | |
Income before income taxes | | | 1,195 | | | 25,536 | | | 39,871 | |
Income tax expense (benefit) | | | 846 | | | (8,815 | ) | | — | |
| | | | | | | | |
Net income | | $ | 349 | | $ | 34,351 | | $ | 39,871 | |
| | | | | | | | |
113
Table of Contents
MATTRESS FIRM HOLDING CORP.
SCHEDULE I—CONDENSED FINANCIAL INFORMATION OF
MATTRESS FIRM HOLDING CORP.
(PARENT COMPANY)
STATEMENTS OF CASH FLOWS
| | | | | | | | | | |
| | Fiscal
2010 | | Fiscal
2011 | | Fiscal
2012 | |
|---|
| | (in thousands)
| |
|---|
Cash flows from operating activities: | | | | | | | | | | |
Net income | | $ | 349 | | $ | 34,351 | | $ | 39,871 | |
Adjustments to reconcile net income to net cash provided by operating activities | | | | | | | | | | |
Equity in earnings of subsidiary | | | (6,920 | ) | | (32,448 | ) | | (39,871 | ) |
Deferred income tax benefit | | | (118 | ) | | (11,407 | ) | | (18,471 | ) |
Amortization of deferred issuance costs | | | 46 | | | 37 | | | — | |
Loss from debt extinguishment | | | — | | | 51 | | | — | |
Effects of changes in operating assets and liabilties: | | | | | | | | | | |
Accrued liabilities | | | 964 | | | 566 | | | (1,985 | ) |
Other noncurrent liabilities | | | 5,679 | | | 6,912 | | | — | |
| | | | | | | | |
Net cash used in operating activities | | | — | | | (1,938 | ) | | (20,456 | ) |
| | | | | | | | |
Cash flows from investing activities: | | | | | | | | | | |
Investments in subsidiaries | | | — | | | (128,674 | ) | | 15,653 | |
| | | | | | | | |
Net cash provided by (used in) investing activities | | | — | | | (128,674 | ) | | 15,653 | |
| | | | | | | | |
Cash flows from financing activities: | | | | | | | | | | |
Proceeds from issuance of debt | | | — | | | 40,198 | | | — | |
Principal payments of debt | | | — | | | (4,559 | ) | | — | |
Proceeds from issuance of common stock, net of costs | | | — | | | 110,446 | | | — | |
Proceeds from exercise of common stock options | | | — | | | — | | | 510 | |
| | | | | | | | |
Net cash provided by financing activities | | | — | | | 146,085 | | | 510 | |
| | | | | | | | |
Net change in cash and cash equivalents | | | — | | | 15,473 | | | (4,293 | ) |
Cash and cash equivalents, beginning of period | | | — | | | — | | | 15,473 | |
| | | | | | | | |
Cash and cash equivalents, end of period | | $ | — | | $ | 15,473 | | $ | 11,180 | |
| | | | | | | | |
114
Table of Contents
MATTRESS FIRM HOLDING CORP.
SCHEDULE I—NOTES TO CONSOLIDATED FINANCIAL INFORMATION (PARENT COMPANY)
1. Background
These condensed parent company financial statements and notes of Mattress Firm Holding Corp. (the "Company") should be read in conjunction with the consolidated financial statements of Mattress Firm Holding Corp. and subsidiaries. The 2012 Senior Credit Facility of Mattress Holding, an indirect subsidiary of Mattress Firm Holding Corp., contains provisions whereby Mattress Holding Corp. is prohibited from distributing dividends to Mattress Firm Holding Corp. or other subsidiaries of Mattress Firm Holding Corp.
2. Initial Public Offering
On November 23, 2011, the Company completed the initial public offering of shares of its common stock pursuant to a registration statement on Form S-1, as amended (File No. 333-174830), which was declared effective on November 17, 2011. Under the registration statement, the Company registered the offering and sale of up to an aggregate of 6,388,888 shares of common stock at a public offering price of $19.00 per share. The Company raised a total of $121.4 million in gross proceeds in the initial public offering of all 6,388,888 shares, or approximately $110.4 million in net proceeds after deducting underwriting discounts and commissions of $8.5 million and $2.5 million of estimated offering-related costs.
On November 23, 2011, the Company contributed a portion of the net proceeds from the initial public offering as follows: (i) $88.8 million of such net proceeds to repay in full all amounts outstanding under the loan facility between Mattress Intermediate Holdings, Inc., the Company's direct subsidiary, and a group of lenders maturing in January 2015 and the related accrued interest; (ii) $4.6 million of such net proceeds to repay in full the Company's 12% payment-in-kind investor notes that did not convert into shares of the Company's common stock upon the completion of the initial public offering; and (iii) $1.6 million of such net proceeds to pay accrued managed fees and interested thereon and a related termination fee to J.W. Childs Associates, L.P. in connection with the termination of the management agreement between J.W. Childs Associates, L.P. and the Company that became effective with the completion of the initial public offering. Also in connection with the consummation of the initial public offering, the Company's 12% payment-in-kind investor notes converted into 4,979,888 shares of the Company's common stock at a price per share equal to the initial public offering price of $19.00 per common share. See Note 3 for additional information on debt activity.
3. Long-term Debt
As of February 1 , 2011 Mattress Firm Holding Corp. had $48.9 million of outstanding Paid-in-Kind Notes, or "PIK Notes," issued to the equity investors of Mattress Holding, LLC (the parent company of Mattress Firm Holding Corp.) and various affiliates of those equity investors. The PIK Notes were issued at various times from October 24, 2007 through May 20, 2009 and mature at various dates between October 24, 2012 and March 19, 2015.
The PIK Notes bore interest at a rate of 12% per annum. Accrued interest was payable annually or semiannually, as applicable, with each such interest payment to be made through the addition of such interest amount to the outstanding principal amount of the PIK Notes. The PIK Notes required no principal payments prior to their maturity, and Mattress Firm Holding Corp. was permitted to prepay the PIK Notes, in whole or in part, at any time without premium or penalty. Amounts prepaid
115
Table of Contents
MATTRESS FIRM HOLDING CORP.
SCHEDULE I—NOTES TO CONSOLIDATED FINANCIAL INFORMATION (PARENT COMPANY) (Continued)
3. Long-term Debt (Continued)
will be applied first to accrued interest and then to the repayment of the outstanding principal amounts of the PIK Notes.
On November 23, 2011, in connection with the consummation of the initial public offering, (1) the Company used $4.6 million of the net proceeds from the initial public offering to repay in full the Company's PIK Notes that did not convert into shares of the Company's common stock upon the completion of the initial public offering and (2) the aggregate remaining principal and accrued interest balance of $41.9 million were converted into 2,205,953 shares the Company's common stock at a price per share equal to the initial public offering price of $19.00 per common share.
The PIK Notes were not guaranteed by any of the subsidiaries of Mattress Firm Holding Corp. All obligations under the PIK Notes were unsecured. The PIK Notes contained no financial or restrictive covenants.
On July 19, 2011, the Company issued convertible notes in an aggregate principal amount of $40.2 million ("Convertible Notes"). The Convertible Notes accrued interest at an annual rate of 12%, payable annually on July 18 of each year and are to mature on July 18, 2016. All interest was paid "in kind" rather than in cash, meaning that payments of interest were made as additions to the outstanding principal amount of the Convertible Notes. The Company was permitted to prepay the Convertible Notes, in whole or in part, at any time without premium or penalty. On November 23, 2011, in connection with the consummation of the initial public offering, the Convertible Notes with an aggregate principal and accrued interest balance of $41.9 million automatically converted into 2,205,953 shares of common stock at a price per share equal to the initial public offering price of $19.00 per common share.
116
Table of Contents
MATTRESS FIRM HOLDING CORP.
SCHEDULE II—VALUATION AND QUALIFYING ACCOUNTS
For the three years ended January 29, 2013
| | | | | | | | | | | | | | | | |
| |
| | Additions | |
| |
| |
|---|
Description | | Balance at
Beginning of
Period | | Charged to
Income | | Charged to
Other
Accounts | | Deductions
from
Reserves(1) | | Balance at
End of
Period | |
|---|
| | (in thousands)
| |
|---|
Year Ended February 1, 2011: | | | | | | | | | | | | | | | | |
Uncollectible accounts receivable | | $ | 117 | | $ | — | | $ | — | | $ | 13 | | $ | 104 | |
Sales returns reserve | | | 68 | | | 1,613 | | | — | | | 1,168 | | | 513 | |
Store closing reserve | | | 1,714 | | | 666 | | | — | | | 2,227 | | | 153 | |
Year Ended January 31, 2012: | | | | | | | | | | | | | | | | |
Uncollectible accounts receivable | | $ | 104 | | $ | — | | $ | — | | $ | 7 | | $ | 97 | |
Sales returns reserve | | | 513 | | | 3,651 | | | — | | | 3,085 | | | 1,079 | |
Store closing reserve | | | 153 | | | 1,402 | | | — | | | 991 | | | 564 | |
Year Ended January 29, 2013: | | | | | | | | | | | | | | | | |
Uncollectible accounts receivable | | $ | 97 | | $ | 172 | | $ | — | | $ | — | | $ | 269 | |
Sales returns reserve | | | 1,079 | | | 5,972 | | | 258 | | | 5,824 | | | 1,485 | |
Store closing reserve | | | 564 | | | (11 | ) | | — | | | 312 | | | 241 | |
- (1)
- Deductions from reserves represent losses or expenses for which the respective reserves were created. In the case of the uncollectible accounts receivable, deductions are net of recovered amounts previously written off.
117
Table of Contents
SIGNATURES
Pursuant to the requirements of Section 13 or 15(d) of the Securities Exchange Act of 1934, the registrant has duly caused this report to be signed on its behalf by the undersigned, thereunto duly authorized.
| | | | | | |
| | | MATTRESS FIRM HOLDING CORP. |
|
|
By: |
|
/s/ R. STEPHEN STAGNER
|
| | | | | Name: | | R. Stephen Stagner |
| | | | | Title: | | President and Chief Executive Officer |
Date: April 1, 2013
Pursuant to the requirements of the Securities Exchange Act of 1934, this report has been signed below by the following persons on behalf of the registrant and in the capacities and on the dates indicated:
| | | | |
Signature | | Title | | Date |
|---|
|
|
|
|
|
/s/ R. STEPHEN STAGNER
R. Stephen Stagner | | President and Chief Executive Officer (principal executive officer) | | April 1, 2013 |
/s/ JIM R. BLACK
Jim R. Black |
|
Executive Vice President, Chief Financial Officer and Treasurer (principal financial officer) |
|
April 1, 2013 |
/s/ MICHAEL S. GALVAN
Michael S. Galvan |
|
Senior Vice President and Chief Accounting Officer (principal accounting officer) |
|
April 1, 2013 |
/s/ JOHN W. CHILDS
John W. Childs |
|
Director |
|
April 1, 2013 |
/s/ ADAM L. SUTTIN
Adam L. Suttin |
|
Director |
|
April 1, 2013 |
/s/ DAVID A. FIORENTINO
David A. Fiorentino |
|
Director |
|
April 1, 2013 |
/s/ WILLIAM E. WATTS
William E. Watts |
|
Director |
|
April 1, 2013 |
118
Table of Contents
| | | | |
Signature | | Title | | Date |
|---|
|
|
|
|
|
/s/ FREDERICK C. TINSEY III
Frederick C. Tinsey III | | Director | | April 1, 2013 |
/s/ CHARLES R. EITEL
Charles R. Eitel |
|
Director |
|
April 1, 2013 |
/s/ JOSEPH M. FORTUNATO
Joseph M. Fortunato |
|
Director |
|
April 1, 2013 |
119