UNITED STATES
SECURITIES AND EXCHANGE COMMISSION
WASHINGTON, D.C. 20549
___________________________________________________________
FORM 6-K
___________________________________________________________
Report of Foreign Private Issuer
Pursuant to Rule 13a-16 or 15d-16 of
the Securities Exchange Act of 1934
For the quarterly period ended June 30, 2019
Commission file number 1-33867
___________________________________________________________
TEEKAY TANKERS LTD.
(Exact name of Registrant as specified in its charter)
___________________________________________________________
Suite 2000 - 550 Burrard Street, Bentall 5, Vancouver, BC V6C 2K2 Canada
(Address of principal executive offices)
___________________________________________________________
Indicate by check mark whether the registrant files or will file annual reports under cover Form 20-F or Form 40-F.
Form 20-F ý Form 40-F ¨
Indicate by check mark if the registrant is submitting the Form 6-K in paper as permitted by Regulation S-T Rule 101(b)(1).
Yes ¨ No ý
Indicate by check mark if the registrant is submitting the Form 6-K in paper as permitted by Regulation S-T Rule 101(b)(7).
Yes ¨ No ý
TEEKAY TANKERS LTD.
REPORT ON FORM 6-K FOR THE QUARTERLY PERIOD ENDED JUNE 30, 2019
INDEX
| PAGE | ||
| Item 1. | ||
| Item 2. | ||
PART I – FINANCIAL INFORMATION
ITEM 1 — FINANCIAL STATEMENTS
TEEKAY TANKERS LTD. AND SUBSIDIARIES
UNAUDITED CONSOLIDATED STATEMENTS OF LOSS (notes 1 and 2)
(in thousands of U.S. dollars, except share and per share amounts)
| Three Months Ended June 30, | Six Months Ended June 30, | |||||||||||
| 2019 | 2018 | 2019 | 2018 | |||||||||
| $ | $ | $ | $ | |||||||||
| REVENUES | ||||||||||||
Voyage charter revenues (note 3) | 186,805 | 144,328 | 403,222 | 279,970 | ||||||||
Time-charter revenues (note 3) | 1,456 | 17,384 | 4,866 | 39,494 | ||||||||
Other revenues (notes 3 and 4) | 14,016 | 9,947 | 26,690 | 20,660 | ||||||||
| Total revenues | 202,277 | 171,659 | 434,778 | 340,124 | ||||||||
Voyage expenses (note 14e) | (92,668 | ) | (86,933 | ) | (190,007 | ) | (166,926 | ) | ||||
Vessel operating expenses (note 14b) | (53,600 | ) | (52,652 | ) | (108,187 | ) | (105,647 | ) | ||||
Time-charter hire expenses (note 8) | (10,792 | ) | (5,697 | ) | (20,240 | ) | (10,380 | ) | ||||
| Depreciation and amortization | (30,658 | ) | (29,573 | ) | (60,523 | ) | (59,003 | ) | ||||
General and administrative expenses (note 14b) | (9,508 | ) | (9,407 | ) | (18,673 | ) | (19,192 | ) | ||||
Gain on sale of vessel (note 16) | — | 170 | — | 170 | ||||||||
Restructuring charges (note 18) | — | (982 | ) | — | (982 | ) | ||||||
| Income (loss) from operations | 5,051 | (13,415 | ) | 37,148 | (21,836 | ) | ||||||
| Interest expense | (16,607 | ) | (13,931 | ) | (33,549 | ) | (26,660 | ) | ||||
| Interest income | 221 | 160 | 586 | 318 | ||||||||
Realized and unrealized (loss) gain on derivative instruments (note 9) | (1,778 | ) | 1,116 | (2,625 | ) | 4,129 | ||||||
Equity (loss) income (note 5) | (169 | ) | (70 | ) | 584 | 624 | ||||||
Freight tax and other tax expenses (note 11) | (1,639 | ) | (6,086 | ) | (4,253 | ) | (7,964 | ) | ||||
Other income (note 10) | 614 | 4,813 | 249 | 4,823 | ||||||||
| Net loss | (14,307 | ) | (27,413 | ) | (1,860 | ) | (46,566 | ) | ||||
Per common share amounts (note 15) | ||||||||||||
| - Basic loss per share | (0.05 | ) | (0.10 | ) | — | (0.17 | ) | |||||
| - Diluted loss per share | (0.05 | ) | (0.10 | ) | — | (0.17 | ) | |||||
Weighted-average number of Class A and Class B common stock outstanding (note 15) | ||||||||||||
| - Basic and diluted | 268,990,399 | 268,558,556 | 268,835,175 | 268,426,201 | ||||||||
Related party transactions (note 14) | ||||||||||||
The accompanying notes are an integral part of the unaudited consolidated financial statements.
1
TEEKAY TANKERS LTD. AND SUBSIDIARIES
UNAUDITED CONSOLIDATED BALANCE SHEETS (notes 1 and 2)
(in thousands of U.S. dollars)
| As at | As at | |||||
June 30, 2019 | December 31, 2018 | |||||
| $ | $ | |||||
| ASSETS | ||||||
| Current | ||||||
| Cash and cash equivalents | 35,429 | 54,917 | ||||
Restricted cash – current (note 17) | 1,916 | 2,153 | ||||
Pool receivable from affiliates, net (note 14d) | 15,330 | 56,549 | ||||
Accounts receivable, including affiliate balances of $1.7 million (2018 - $2.1 million) (note 9) | 51,451 | 17,365 | ||||
Due from affiliates (note 14c) | 1,240 | 39,663 | ||||
Current portion of derivative assets (note 9) | 1,229 | 2,905 | ||||
Bunker and lube oil inventory (note 1) | 63,441 | 23,179 | ||||
| Prepaid expenses | 10,146 | 10,917 | ||||
| Other current assets | 48,296 | 17,943 | ||||
| Total current assets | 228,478 | 225,591 | ||||
Restricted cash – long-term (note 17) | 3,437 | 3,437 | ||||
| Vessels and equipment | ||||||
At cost, less accumulated depreciation of $531.0 million (2018 - $494.4 million) (note 6) | 1,327,480 | 1,401,551 | ||||
Vessels related to finance leases, at cost, less accumulated depreciation of $128.1 million (2018 - $111.3 million) (note 8) | 529,286 | 482,010 | ||||
Operating lease right-of-use assets (notes 2 and 8) | 19,089 | — | ||||
| Total vessels and equipment | 1,875,855 | 1,883,561 | ||||
Investment in and advances to equity-accounted joint venture (note 5) | 26,351 | 25,766 | ||||
Derivative assets (note 9) | 240 | 2,973 | ||||
| Other non-current assets | 1,010 | 74 | ||||
| Intangible assets at cost, less accumulated amortization of $12.0 million (2018 - $10.9 million) | 10,498 | 11,625 | ||||
| Goodwill | 8,059 | 8,059 | ||||
| Total assets | 2,153,928 | 2,161,086 | ||||
| LIABILITIES AND EQUITY | ||||||
| Current | ||||||
| Accounts payable, including affiliate balances of $0.1 million (2018 - $0.6 million) | 47,532 | 11,146 | ||||
Accrued liabilities (notes 9 and 14c) | 56,448 | 40,856 | ||||
Short-term debt (note 7) | 15,000 | — | ||||
Due to affiliates (note 14c) | 12,320 | 18,570 | ||||
Current portion of derivative liabilities (note 9) | — | 57 | ||||
Current portion of long-term debt (note 6) | 101,264 | 106,236 | ||||
Current obligations related to finance leases (note 8) | 24,397 | 20,896 | ||||
Current portion of operating lease liabilities (note 2 and 8) | 12,224 | — | ||||
| Other current liabilities | 316 | — | ||||
| Total current liabilities | 269,501 | 197,761 | ||||
Long-term debt (note 6) | 491,962 | 629,170 | ||||
Long-term obligations related to finance leases (note 8) | 402,539 | 354,393 | ||||
Long-term operating lease liabilities (notes 2 and 8) | 6,865 | — | ||||
Other long-term liabilities (note 11) | 37,166 | 32,829 | ||||
| Total liabilities | 1,208,033 | 1,214,153 | ||||
Commitments and contingencies (notes 5, 6, 7, 8 and 9) | ||||||
| Equity | ||||||
Common stock and additional paid-in capital (585.0 million shares authorized, 232.0 million Class A and 37.0 million Class B shares issued and outstanding as of June 30, 2019 and 585.0 million shares authorized, 231.6 million Class A and 37.0 million Class B shares issued and outstanding as of December 31, 2018) (note 13) | 1,296,751 | 1,295,929 | ||||
| Accumulated deficit | (350,856 | ) | (348,996 | ) | ||
| Total equity | 945,895 | 946,933 | ||||
| Total liabilities and equity | 2,153,928 | 2,161,086 | ||||
The accompanying notes are an integral part of the unaudited consolidated financial statements.
2
TEEKAY TANKERS LTD. AND SUBSIDIARIES
UNAUDITED CONSOLIDATED STATEMENTS OF CASH FLOWS (notes 1 and 2)
(in thousands of U.S. dollars)
| Six Months Ended June 30, | ||||||
| 2019 | 2018 | |||||
| $ | $ | |||||
| Cash, cash equivalents and restricted cash provided by (used for) | ||||||
| OPERATING ACTIVITIES | ||||||
| Net loss | (1,860 | ) | (46,566 | ) | ||
| Non-cash items: | ||||||
| Depreciation and amortization | 60,523 | 59,003 | ||||
Gain on sale of vessel (note 16) | — | (170 | ) | |||
Unrealized loss (gain) on derivative instruments (note 9) | 4,366 | (3,283 | ) | |||
Equity income (note 5) | (584 | ) | (624 | ) | ||
| Other | 6,538 | 5,467 | ||||
| Change in operating assets and liabilities | 23,198 | 3,368 | ||||
| Expenditures for dry docking | (27,815 | ) | (6,725 | ) | ||
| Net operating cash flow | 64,366 | 10,470 | ||||
| FINANCING ACTIVITIES | ||||||
Proceeds from short-term debt (note 7) | 65,000 | — | ||||
| Proceeds from long-term debt, net of issuance costs | 16,421 | 45,659 | ||||
| Scheduled repayments of long-term debt | (50,800 | ) | (66,333 | ) | ||
| Prepayments of long-term debt | (109,688 | ) | — | |||
Prepayments of short-term debt (note 7) | (50,000 | ) | — | |||
Proceeds from financing related to sales and leaseback of vessels (note 8) | 63,720 | — | ||||
Scheduled repayments of obligations related to finance leases (note 8) | (12,073 | ) | (3,503 | ) | ||
| Cash dividends paid | — | (8,052 | ) | |||
| Other | (126 | ) | (92 | ) | ||
| Net financing cash flow | (77,546 | ) | (32,321 | ) | ||
| INVESTING ACTIVITIES | ||||||
Proceeds from sale of vessel (note 16) | — | 589 | ||||
| Expenditures for vessels and equipment | (6,545 | ) | (2,207 | ) | ||
| Return of capital from equity-accounted for joint venture | — | 746 | ||||
| Net investing cash flow | (6,545 | ) | (872 | ) | ||
| Decrease in cash, cash equivalents and restricted cash | (19,725 | ) | (22,723 | ) | ||
| Cash, cash equivalents and restricted cash, beginning of the period | 60,507 | 75,710 | ||||
| Cash, cash equivalents and restricted cash, end of the period | 40,782 | 52,987 | ||||
Supplemental cash flow information (note 17)
The accompanying notes are an integral part of the unaudited consolidated financial statements.
3
TEEKAY TANKERS LTD. AND SUBSIDIARIES
UNAUDITED CONSOLIDATED STATEMENT OF CHANGES IN EQUITY (notes 1 and 2)
(in thousands of U.S. dollars, except share amounts)
Common Stock and Additional Paid-in Capital | |||||||||||||||
Thousands of Common Shares # | Class A Common Shares $ | Class B Common Shares $ | Accumulated Deficit $ | Total $ | |||||||||||
| Balance as at December 31, 2018 | 268,559 | 1,207,397 | 88,532 | (348,996 | ) | 946,933 | |||||||||
| Net income | — | — | — | 12,447 | 12,447 | ||||||||||
Equity-based compensation (note 13) | 432 | 668 | — | — | 668 | ||||||||||
| Balance as at March 31, 2019 | 268,991 | 1,208,065 | 88,532 | (336,549 | ) | 960,048 | |||||||||
| Net loss | — | — | — | (14,307 | ) | (14,307 | ) | ||||||||
Equity-based compensation (note 13) | — | 154 | — | — | 154 | ||||||||||
| Balance as at June 30, 2019 | 268,991 | 1,208,219 | 88,532 | (350,856 | ) | 945,895 | |||||||||
Common Stock and Additional Paid-in Capital | |||||||||||||||
Thousands of Common Shares # | Class A Common Shares $ | Class B Common Shares $ | Accumulated Deficit $ | Total $ | |||||||||||
| Balance as at December 31, 2017 | 268,202 | 1,206,466 | 88,532 | (288,397 | ) | 1,006,601 | |||||||||
| Net loss | — | — | — | (19,153 | ) | (19,153 | ) | ||||||||
| Dividends declared ($0.03 per share) | — | — | — | (8,052 | ) | (8,052 | ) | ||||||||
Equity-based compensation (note 13) | 357 | 613 | — | — | 613 | ||||||||||
| Other | — | (274 | ) | — | — | (274 | ) | ||||||||
| Balance as at March 31, 2018 | 268,559 | 1,206,805 | 88,532 | (315,602 | ) | 979,735 | |||||||||
| Net loss | — | — | — | (27,413 | ) | (27,413 | ) | ||||||||
Equity-based compensation (note 13) | — | 148 | — | — | 148 | ||||||||||
| Balance as at June 30, 2018 | 268,559 | 1,206,953 | 88,532 | (343,015 | ) | 952,470 | |||||||||
The accompanying notes are an integral part of the unaudited consolidated financial statements.
4
TEEKAY TANKERS LTD. AND SUBSIDIARIES
NOTES TO THE UNAUDITED CONSOLIDATED FINANCIAL STATEMENTS
(all tabular amounts stated in thousands of U.S. dollars, other than share or per share data)
| 1. | Basis of Presentation |
The unaudited interim consolidated financial statements (or consolidated financial statements) have been prepared in accordance with United States generally accepted accounting principles (or GAAP). These consolidated financial statements include the accounts of Teekay Tankers Ltd., its wholly-owned subsidiaries, equity-accounted joint venture and any variable interest entities (or VIEs) of which it is the primary beneficiary (collectively, the Company). The preparation of consolidated financial statements in conformity with GAAP requires management to make estimates and assumptions that affect the amounts reported in the consolidated financial statements and accompanying notes. Actual results could differ from those estimates.
Certain information and footnote disclosures required by GAAP for complete annual financial statements have been omitted and, therefore, these consolidated financial statements should be read in conjunction with the Company’s audited consolidated financial statements for the year ended December 31, 2018, filed on Form 20-F with the U.S. Securities and Exchange Commission (or the SEC) on April 10, 2019. In the opinion of management, these consolidated financial statements reflect all adjustments, consisting solely of a normal recurring nature, necessary to present fairly, in all material respects, the Company’s consolidated financial position, results of operations, and cash flows for the interim periods presented. The results of operations for the interim periods presented are not necessarily indicative of those for a full fiscal year. Intercompany balances and transactions have been eliminated upon consolidation.
Effective March 31, 2019, the Company separately presents bunker and lube oil inventory on the Company’s balance sheet. Such amounts were previously classified as prepaid expenses. Bunker and lube oil inventory has increased significantly commencing in the first quarter of 2019 as a result of changes to the Company’s revenue sharing arrangements (or RSAs) whereby the Company now directly procures and has legal title to the bunker fuel for the vessels in the RSAs, with such assets being used as collateral for the new working capital loan arrangement entered into by the Company. Bunker and lube oil inventory is stated at cost, which is determined on a first-in, first-out basis. Comparative figures have been reclassified to conform to the presentation adopted in the current period.
| 2. | Recent Accounting Pronouncement |
In February 2016, the Financial Accounting Standards Board (or FASB) issued Accounting Standards Update 2016-02, Leases (or ASU 2016-02). ASU 2016-02 established a right-of-use model that requires a lessee to record a right-of-use asset and a lease liability on the balance sheet for all leases with terms longer than 12 months. For lessees, leases are classified as either finance or operating, with classification affecting the pattern of expense recognition in the income statement. ASU 2016-02 requires lessors to classify leases as a sales-type, direct financing, or operating lease. A lease is a sales-type lease if any one of five criteria are met, each of which indicate that the lease, in effect, transfers control of the underlying asset to the lessee. If none of those five criteria are met, but two additional criteria are both met, indicating that the lessor has transferred substantially all of the risks and benefits of the underlying asset to the lessee and a third party, the lease is a direct financing lease. All leases that are not sales-type leases or direct financing leases are operating leases. FASB issued an additional accounting standards update in July 2018 that made further amendments to accounting for leases, including allowing the use of a transition approach whereby a cumulative effect adjustment is made as of the effective date, with no retrospective effect and providing an optional practical expedient to lessors to not separate lease and non-lease components of a contract if certain criteria are met. The Company adopted ASU 2016-02 on January 1, 2019 and has elected to use this new optional transition approach. To determine the cumulative effect adjustment, the Company has not reassessed lease classification, initial direct costs for any existing leases and whether any expired or existing contracts are or contain leases. The adoption of ASU 2016-02 has resulted in a change in accounting method for the lease portion of the daily charter hire for the Company’s chartered-in vessels accounted for as operating leases with firm periods of greater than one year as well as a small number of office leases. The Company’s time charters and voyage charters include both a lease component, consisting of the lease of the vessel, and non-lease component, consisting of operation of the vessel for the customer. The Company has elected not to separate the non-lease component from the lease component for all such charters, where the lease component is classified as an operating lease, and account for the combined component as an operating lease. The Company identified the following differences:
| • | Under ASU 2016-02, the Company recognizes an operating lease right-of-use asset and an operating lease liability on the balance sheet for these chartered-in vessels and office leases based on the present value of future minimum lease payments, whereas previously no right-of-use asset or lease liability was recognized. As a result, operating lease right-of-use assets and operating lease liabilities of $11.0 million were each recognized on January 1, 2019. The pattern of expense recognition of chartered-in vessels has remained unchanged, unless the right-of-use asset becomes impaired. |
| • | The adoption of ASU 2016-02 results in sale and leaseback transactions where the seller lessee has a fixed price repurchase option, or other situations where the leaseback would be classified as a finance lease, being accounted for as a failed sale of the vessel and a failed purchase of the vessel by the buyer lessor. Prior to the adoption of ASU 2016-02, such transactions were accounted for as a completed sale and a completed purchase. Consequently, for such transactions, the Company does not derecognize the vessel sold and continues to depreciate the vessel as if it was the legal owner. Proceeds received from the sale of the vessel are recognized as an obligation related to finance lease, and bareboat charter hire payments made by the Company to the lessor are allocated between interest expense and principal repayments on the obligation related to finance lease. The adoption of ASU 2016-02 has resulted in the sale and leaseback of the Aspen Spirit and Cascade Spirit during the second quarter of 2019 being accounted for as a failed sale and unlike the 14 sale-leaseback transactions entered into in prior years, the Company is not considered as holding a variable interest in the buyer lessor entity and, thus, does not consolidate the buyer lessor entities (see note 8). |
5
TEEKAY TANKERS LTD. AND SUBSIDIARIES
NOTES TO THE UNAUDITED CONSOLIDATED FINANCIAL STATEMENTS
(all tabular amounts stated in thousands of U.S. dollars, other than share or per share data)
| 3. | Revenue |
The Company’s primary source of revenue is from chartering its vessels (Aframax tankers, Suezmax tankers and Long Range 2 (or LR2) tankers) to its customers. The Company utilizes two primary forms of contracts, consisting of voyage charters and time-charters.
The extent to which the Company employs its vessels on voyage charters versus time charters is dependent upon the Company’s chartering strategy and the availability of time charters. Spot market rates for voyage charters, including conventional voyages and lightering voyages, are volatile from period to period, whereas time charters provide a stable source of monthly revenue. The Company also provides ship-to-ship support services, which include managing the process of transferring cargo between seagoing ships positioned alongside each other, either stationary or underway, as well as commercial management services to third-party owners of vessels. Finally, the Company manages liquefied natural gas (or LNG) terminals and procures LNG-related goods for terminal owners and other customers. For descriptions of these types of contracts, see Item 18 - Financial Statements: Note 3 in the Company’s audited consolidated financial statements filed with its Annual Report on Form 20-F for the year ended December 31, 2018.
The following table contains a breakdown of the Company's revenue by contract type for the three and six months ended June 30, 2019 and June 30, 2018. All revenue is part of the Company's conventional tanker segment, except for revenue for ship-to-ship support services and LNG terminal management, consultancy, procurement and other related services, which are part of the Company's ship-to-ship transfer segment. The Company’s lease income consists of the revenue from its voyage charters and time-charters.
| Three Months Ended June 30, | Six Months Ended June 30, | ||||||||||
| 2019 | 2018 | 2019 | 2018 | ||||||||
| $ | $ | $ | $ | ||||||||
| Voyage charter revenues | |||||||||||
| Suezmax | 84,471 | 80,721 | 183,449 | 153,504 | |||||||
| Aframax | 48,029 | 24,265 | 113,306 | 47,742 | |||||||
| LR2 | 25,705 | 11,979 | 60,012 | 23,600 | |||||||
| Full service lightering | 28,600 | 27,363 | 46,455 | 55,124 | |||||||
| Total | 186,805 | 144,328 | 403,222 | 279,970 | |||||||
| Time-charter revenues | |||||||||||
| Aframax | — | 11,021 | 1,837 | 23,824 | |||||||
| Suezmax | 1,456 | 3,957 | 3,029 | 10,154 | |||||||
| LR2 | — | 2,406 | — | 5,516 | |||||||
| Total | 1,456 | 17,384 | 4,866 | 39,494 | |||||||
| Other revenues | |||||||||||
| Ship-to-ship support services | 8,222 | 6,902 | 13,161 | 14,235 | |||||||
| Commercial management | 2,090 | 2,138 | 4,326 | 4,196 | |||||||
| LNG terminal management, consultancy, procurement and other | 3,704 | 907 | 9,203 | 2,229 | |||||||
| Total | 14,016 | 9,947 | 26,690 | 20,660 | |||||||
| Total revenues | 202,277 | 171,659 | 434,778 | 340,124 | |||||||
Charters-out
As at June 30, 2019, one (December 31, 2018 - two) of the Company’s vessels operated under a fixed-rate time charter contract, which is scheduled to expire in 2020. As at June 30, 2019, the minimum scheduled future revenues to be received by the Company under this time charter were approximately $8.3 million (December 31, 2018 - $6.3 million).
6
TEEKAY TANKERS LTD. AND SUBSIDIARIES
NOTES TO THE UNAUDITED CONSOLIDATED FINANCIAL STATEMENTS
(all tabular amounts stated in thousands of U.S. dollars, other than share or per share data)
| 4. | Segment Reporting |
The Company has two reportable segments, its conventional tanker segment and its ship-to-ship transfer segment. The Company’s conventional tanker segment consists of the operation and commercial management of all of its tankers and those tankers employed on full service lightering contracts. The Company’s ship-to-ship transfer segment consists of the Company’s ship-to-ship support services, including those provided to the Company’s conventional tanker segment as part of full service lightering operations and LNG terminal management, consultancy, procurement and other related services. Segment results are evaluated based on income (loss) from operations. The accounting policies applied to the reportable segments are the same as those used in the preparation of the Company’s consolidated financial statements.
The following tables include results for the Company’s revenues and income (loss) from operations by segment for the three and six months ended June 30, 2019 and June 30, 2018.
| Three Months Ended June 30, 2019 | |||||||||||||||
| Conventional Tanker Segment | Ship-to-Ship Transfer Segment | Inter-segment Adjustment (1) | Total | ||||||||||||
| $ | $ | $ | $ | ||||||||||||
Revenues (2) | 190,351 | 14,429 | (2,503 | ) | 202,277 | ||||||||||
| Voyage expenses | (95,171 | ) | — | 2,503 | (92,668 | ) | |||||||||
| Vessel operating expenses | (43,375 | ) | (10,225 | ) | — | (53,600 | ) | ||||||||
| Time-charter hire expenses | (9,196 | ) | (1,596 | ) | — | (10,792 | ) | ||||||||
| Depreciation and amortization | (29,762 | ) | (896 | ) | — | (30,658 | ) | ||||||||
General and administrative expenses (3) | (8,729 | ) | (779 | ) | — | (9,508 | ) | ||||||||
| Income from operations | 4,118 | 933 | — | 5,051 | |||||||||||
| Equity loss | (169 | ) | — | — | (169 | ) | |||||||||
| Three Months Ended June 30, 2018 | |||||||||||||||
| Conventional Tanker Segment | Ship-to-Ship Transfer Segment | Inter-segment Adjustment (1) | Total | ||||||||||||
| $ | $ | $ | $ | ||||||||||||
Revenues (2) | 163,849 | 11,210 | (3,400 | ) | 171,659 | ||||||||||
| Voyage expenses | (90,333 | ) | — | 3,400 | (86,933 | ) | |||||||||
| Vessel operating expenses | (44,738 | ) | (7,914 | ) | — | (52,652 | ) | ||||||||
| Time-charter hire expenses | (4,113 | ) | (1,584 | ) | — | (5,697 | ) | ||||||||
| Depreciation and amortization | (28,454 | ) | (1,119 | ) | — | (29,573 | ) | ||||||||
General and administrative expenses (3) | (8,433 | ) | (974 | ) | — | (9,407 | ) | ||||||||
| Gain on sale of vessel | — | 170 | — | 170 | |||||||||||
| Restructuring charges | (152 | ) | (830 | ) | — | (982 | ) | ||||||||
| Loss from operations | (12,374 | ) | (1,041 | ) | — | (13,415 | ) | ||||||||
| Equity loss | (70 | ) | — | — | (70 | ) | |||||||||
7
TEEKAY TANKERS LTD. AND SUBSIDIARIES
NOTES TO THE UNAUDITED CONSOLIDATED FINANCIAL STATEMENTS
(all tabular amounts stated in thousands of U.S. dollars, other than share or per share data)
| Six Months Ended June 30, 2019 | |||||||||||||||
| Conventional Tanker Segment | Ship-to-Ship Transfer Segment | Inter-segment Adjustment (1) | Total | ||||||||||||
| $ | $ | $ | $ | ||||||||||||
Revenues (2) | 412,414 | 27,736 | (5,372 | ) | 434,778 | ||||||||||
| Voyage expenses | (195,379 | ) | — | 5,372 | (190,007 | ) | |||||||||
| Vessel operating expenses | (87,722 | ) | (20,465 | ) | — | (108,187 | ) | ||||||||
| Time-charter hire expenses | (17,166 | ) | (3,074 | ) | — | (20,240 | ) | ||||||||
| Depreciation and amortization | (58,788 | ) | (1,735 | ) | — | (60,523 | ) | ||||||||
General and administrative expenses (3) | (17,075 | ) | (1,598 | ) | — | (18,673 | ) | ||||||||
| Income from operations | 36,284 | 864 | — | 37,148 | |||||||||||
| Equity income | 584 | — | — | 584 | |||||||||||
| Six months ended June 30, 2018 | |||||||||||||||
| Conventional Tanker Segment | Ship-to-Ship Transfer Segment | Inter-segment Adjustment (1) | Total | ||||||||||||
| $ | $ | $ | $ | ||||||||||||
Revenues (2) | 323,660 | 23,042 | (6,578 | ) | 340,124 | ||||||||||
| Voyage expenses | (173,504 | ) | — | 6,578 | (166,926 | ) | |||||||||
| Vessel operating expenses | (88,454 | ) | (17,193 | ) | — | (105,647 | ) | ||||||||
| Time-charter hire expenses | (7,391 | ) | (2,989 | ) | — | (10,380 | ) | ||||||||
| Depreciation and amortization | (56,639 | ) | (2,364 | ) | — | (59,003 | ) | ||||||||
General and administrative expenses (3) | (17,400 | ) | (1,792 | ) | — | (19,192 | ) | ||||||||
| Gain on sale of vessel | — | 170 | — | 170 | |||||||||||
| Restructuring charges | (152 | ) | (830 | ) | — | (982 | ) | ||||||||
| Loss from operations | (19,880 | ) | (1,956 | ) | — | (21,836 | ) | ||||||||
| Equity income | 624 | — | — | 624 | |||||||||||
| (1) | The ship-to-ship transfer segment provides lightering support services to the conventional tanker segment for full service lightering operations and the pricing for such services was based on actual costs incurred. |
| (2) | Revenues, net of the inter-segment adjustment, earned from the ship-to-ship transfer segment are reflected in Other Revenues in the Company's consolidated statements of loss. |
| (3) | Includes direct general and administrative expenses and indirect general and administrative expenses (allocated to each segment based on estimated use of corporate resources). |
A reconciliation of total segment assets to total assets presented in the accompanying consolidated balance sheets is as follows:
| As at | As at | ||||
| June 30, 2019 | December 31, 2018 | ||||
| $ | $ | ||||
| Conventional Tanker Segment | 2,080,124 | 2,069,854 | |||
| Ship-to-Ship Transfer Segment | 38,375 | 36,315 | |||
| Cash and cash equivalents | 35,429 | 54,917 | |||
| Consolidated total assets | 2,153,928 | 2,161,086 | |||
5. Investment in and Advances to Equity-Accounted Joint Venture
| As at June 30, 2019 | As at December 31, 2018 | |||||
| $ | $ | |||||
| High-Q Joint Venture | 26,351 | 25,766 | ||||
The Company has a joint venture arrangement with Wah Kwong Maritime Transport Holdings Limited (or Wah Kwong), whereby the Company has a 50% economic interest in the High-Q joint venture, which is jointly controlled by the Company and Wah Kwong. The High-Q joint venture owns one Very Large Crude Carrier (or VLCC), which traded on a fixed time charter-out contract that expired in May 2018. Under the fixed contract, the vessel earned a daily rate and an additional amount if the daily rate of sub-charters exceeded a certain threshold. The VLCC completed its dry dock in July 2018 and subsequently began trading on spot voyage charters in a pooling arrangement managed by a third party.
As at June 30, 2019, the High-Q joint venture had a loan of $35.1 million (December 31, 2018 – $37.5 million) outstanding with a financial institution. The loan is secured by a first-priority mortgage on the VLCC owned by the High-Q joint venture and 50% of the outstanding loan balance is guaranteed by the Company. The High-Q joint venture also had an interest rate swap agreement that expired in June 2018. The interest rate swap exchanged a receipt of floating interest based on 3-months LIBOR for a payment of a fixed rate of 1.47% every three months.
6. Long-Term Debt
| As at | As at | ||||
| June 30, 2019 | December 31, 2018 | ||||
| $ | $ | ||||
| Revolving Credit Facilities due through 2022 | 323,929 | 417,997 | |||
| Term Loans due through 2021 | 273,996 | 323,995 | |||
| Total principal | 597,925 | 741,992 | |||
| Less: unamortized discount and debt issuance costs | (4,699 | ) | (6,586 | ) | |
| Total debt | 593,226 | 735,406 | |||
| Less: current portion | (101,264 | ) | (106,236 | ) | |
| Non-current portion of long-term debt | 491,962 | 629,170 | |||
As at June 30, 2019, the Company had two revolving credit facilities (or the Revolvers), which, as at such date, provided for aggregate borrowings of up to $385.4 million, of which $61.4 million was undrawn (December 31, 2018 - $429.8 million, of which $11.8 million was undrawn). Interest payments are based on LIBOR plus margins. As at June 30, 2019, such margins ranged between 2.00% and 2.75% (December 31, 2018 - 2.00% and 2.75%). The total amount available under the Revolvers will decrease by $6.1 million (remainder of 2019), $12.1 million (2020), $304.8 million (2021) and $62.4 million (2022). As at June 30, 2019, the Company also had three term loans outstanding, which totaled $274.0 million (December 31, 2018 - $324.0 million). Interest payments on the term loans are based on a combination of a fixed rate of 5.4% (December 31, 2018 - 5.4%) and variable rates based on LIBOR plus margins. As at June 30, 2019, the margins ranged from 0.3% to 2.0% (December 31, 2018 - 0.3% to 2.0%). The term loan repayments are made in quarterly or semi-annual payments. Two of the term loans also have a balloon or bullet repayment due at maturity in 2021. The Revolvers and term loans are further described below.
In May 2019, the Company completed a $63.7 million sale-leaseback financing transaction relating to two of the Company's vessels (note 8). The Company used the proceeds from the sale-leaseback transaction to prepay a portion of the Company's 2017 Revolver (as defined below). In November 2018, the Company completed an $84.7 million sale-leaseback financing transaction relating to four of the Company's vessels (note 8). The Company used the proceeds from the sale-leaseback transaction to refinance one of the Company's corporate revolving credit facilities that matured in November 2018 and to prepay a portion of the Company's 2017 Revolver. In September 2018, the Company completed a $156.6 million sale-leaseback financing transaction relating to six of the Company's vessels (note 8). The Company used the proceeds from the sale-leaseback transaction to prepay a portion of the Company's 2017 Revolver.
In December 2017, the Company entered into a $270.0 million long-term debt facility (or the 2017 Revolver), which is scheduled to mature in December 2022 and which had an outstanding balance of $31.2 million as at June 30, 2019 (December 31, 2018 - $125.3 million). The 2017 Revolver is collateralized by five of the Company's vessels, together with other related security. The total net book value for the five vessels as at June 30, 2019 was $142.0 million (December 31, 2018 - $192.6 million). The 2017 Revolver requires that the Company maintain a minimum hull coverage ratio of 125% of the total outstanding drawn balance for the facility period. Such requirement is assessed on a semi-annual basis with reference to vessel valuations compiled by two or more agreed upon third parties. Should the ratio drop below the required amount, the lender may request that the Company either prepay a portion of the loan in the amount of the shortfall or provide additional collateral in the amount of the shortfall, at the Company's option. As of June 30, 2019, the hull coverage ratio was 511% (December 31, 2018 - 163%). The vessel values used in this ratio are appraised values provided by third parties where available or prepared by the Company based on second-hand sale and purchase market data. A decline in the tanker market could negatively affect the ratio. In addition, the Company is required to maintain a minimum liquidity (cash, cash equivalents and undrawn committed revolving credit lines with at least six months to maturity) of $35.0 million and at least 5% of the Company's total consolidated debt.
In January 2016, the Company entered into a $894.4 million long-term debt facility (or the 2016 Debt Facility), consisting of both a term loan of $118.2 million and a revolving credit component of $292.7 million, which are scheduled to mature in December 2020 and January 2021, respectively, and which had a total outstanding balance of $410.9 million as at June 30, 2019 (December 31, 2018 - $450.3 million). The 2016 Debt Facility is collateralized by 29 of the Company’s vessels, together with other related security. The total net book value for the 29 vessels as at June 30, 2019 was $945.1 million (December 31, 2018 - $972.5 million). The 2016 Debt Facility also requires that the Company maintain a minimum hull coverage ratio of 125% of the total outstanding drawn balance for the facility period. Such requirement is assessed on a semi-annual basis with reference to vessel valuations compiled by two or more agreed upon third parties. Should the ratio drop below the required amount, the lender may request that the Company either prepay a portion of the loan in the amount of the shortfall or provide additional collateral in the amount of the shortfall, at the Company’s option. As at June 30, 2019, the hull coverage ratio was 164% (December 31, 2018 - 137%). The vessel values used in this ratio are appraised values provided by third parties where available or prepared by the Company based on second-hand sale and purchase market data. A decline in the tanker market could negatively affect the ratio. In addition, the Company is required to maintain a minimum liquidity (cash, cash equivalents and undrawn committed revolving credit lines with at least six months to maturity) of $35.0 million and at least 5.0% of the Company’s total consolidated debt.
8
TEEKAY TANKERS LTD. AND SUBSIDIARIES
NOTES TO THE UNAUDITED CONSOLIDATED FINANCIAL STATEMENTS
(all tabular amounts stated in thousands of U.S. dollars, other than share or per share data)
The Company’s remaining two term loans, with a total outstanding balance of $155.8 million as at June 30, 2019 (December 31, 2018 - $166.4 million), which are scheduled to mature between October 2020 and August 2021, are guaranteed by Teekay Corporation (or Teekay) and are collateralized by six of the Company’s vessels, together with other related security. One of the term loans contains covenants that require Teekay to maintain the greater of (a) free cash (cash and cash equivalents) and undrawn committed revolving credit lines with at least six months to maturity of at least $50.0 million and (b) an aggregate of free cash and undrawn committed revolving credit lines with at least six months to maturity of at least 5.0% of Teekay’s total consolidated debt (excluding the debt of Teekay LNG Partners L.P., or TGP and its subsidiaries and the Company and its subsidiaries that are non-recourse to Teekay). The other term loan requires Teekay and the Company collectively to maintain the greater of (a) free cash (cash and cash equivalents) of at least $100.0 million and (b) an aggregate of free cash and undrawn committed revolving credit lines with at least six months to maturity of at least 7.5% of Teekay's total consolidated debt (excluding the debt of TGP).
As at June 30, 2019, the Company was in compliance with all covenants in respect of the Revolvers and term loans. Teekay has also advised the Company that Teekay is in compliance with all covenants relating to the revolving credit facilities and term loans to which the Company is a party.
The weighted-average interest rate on the Company’s long-term debt as at June 30, 2019 was 4.4% (December 31, 2018 - 4.6%). This rate does not reflect the effect of the Company’s interest rate swap agreements (note 9).
The aggregate annual long-term principal repayments required to be made by the Company under the Revolvers and term loans subsequent to June 30, 2019 are $50.8 million (remainder of 2019), $101.8 million (2020), $414.1 million (2021) and $31.2 million (2022).
7. Short-Term Debt
In November 2018, a wholly-owned subsidiary of the Company entered into a working capital loan facility agreement (or the Working Capital Loan), which provided available aggregate borrowings of up to $40.0 million for the subsidiary, with the option to increase the facility up to $55.0 million, subject to approval of the lender. In May 2019, the Company obtained approval from the lender to increase the working capital facility limit to $55.0 million. In June 2019, the Company completed the conditions required in order for the facility limit increase to be effective. Proceeds of this loan are used to provide working capital in relation to certain vessels trading in the RSAs and to fund pooling operations. The Working Capital Loan has a maturity date of six months after the first utilization date (which was in February 2019) but shall be continually extended for further periods of six months thereafter until the lender gives notice in writing that no further extensions shall occur. Interest payments are based on LIBOR plus a margin of 3.5%. The Working Capital Loan is collateralized by the assets of Teekay Tankers Chartering Pte. Ltd., a manager of the Company's RSAs. The Working Capital Loan requires the Company to maintain its paid-in capital contribution to the RSAs and the retained distributions of the RSA participants in an amount equal to the greater of (a) an amount equal to the minimum average capital contributed by the RSA participants per vessel in respect of the RSA (including cash, bunkers or other working capital contributions and amounts accrued to the RSA participants but unpaid) and (b) $20.0 million. As at June 30, 2019, $15.0 million (December 31, 2018 - nil) was owing under this facility and the effective interest rate on the facility was 5.9% (December 31, 2018 - nil). As at June 30, 2019, the Company was in compliance with all covenants in respect of this facility.
9
TEEKAY TANKERS LTD. AND SUBSIDIARIES
NOTES TO THE UNAUDITED CONSOLIDATED FINANCIAL STATEMENTS
(all tabular amounts stated in thousands of U.S. dollars, other than share or per share data)
8. Operating Leases and Obligations Related to Finance Leases
Operating Leases
The Company charters-in vessels from other vessel owners on time-charter contracts, whereby the vessel owner provides use and technical operation of the vessel for the Company. A time charter-in contract is typically for a fixed period of time, although in certain cases, the Company may have the option to extend the charter. The Company typically pays the owner a daily hire rate that is fixed over the duration of the charter. The Company is generally not required to pay the daily hire rate during periods the vessel is not able to operate.
The Company has determined that all of its time charter-in contracts contain both a lease component (lease of the vessel) and a non-lease component (technical operation of the vessel). The Company has allocated the contract consideration between the lease component and non-lease component on a relative standalone selling price basis. The standalone selling price of the non-lease component has been determined using a cost-plus approach, whereby the Company estimates the cost to technically operate the vessel using cost benchmarking studies prepared by a third party, when available, or internal estimates when not available, plus a profit margin. The standalone selling price of the lease component has been determined using an adjusted market approach, whereby the Company calculates a rate excluding the operating component based on a market time-charter rate information from published broker estimates, when available, or internal estimates when not available. Given that there are no observable standalone selling prices for either of these two components, judgment is required in determining the standalone selling price of each component. The discount rate of the lease is determined using the Company’s incremental borrowing rate, which is based on the fixed interest rate the Company could obtain when entering into a secured loan facility of similar terms.
With respect to time charter-in contracts with an original term of more than one year, for the three and six months ended June 30, 2019, the Company incurred $5.9 million and $11.0 million of time-charter hire expense related to three time charter-in contracts, of which $3.3 million and $6.2 million were allocable to the lease component and $2.6 million and $4.8 million were allocable to the non-lease component. The $3.3 million and $6.2 million allocable to the lease component approximate the cash paid for the amounts included in lease liabilities and reflected as a reduction in operating cash flows for the three and six months ended June 30, 2019. Two of these time charter-in contracts include an option to extend the charter for an additional one-year term. Since it is not reasonably certain that the Company will exercise the options, the lease components of the options are not recognized as part of the right-of-use assets and lease liabilities. As at June 30, 2019, the weighted-average remaining lease term and weighted-average discount rate for these time charter-in contracts were 1.5 years and 6.05%, respectively.
The Company has elected to recognize the lease payments of short-term leases in the statement of loss on a straight-line basis over the lease term and variable lease payments in the period in which the obligation for those payments is incurred, which is consistent with the recognition of payment for the non-lease component. Short-term leases are leases with an original term of one year or less, excluding those leases with an option to extend the lease for greater than one year or an option to purchase the underlying asset that the lessee is deemed reasonably certain to exercise. For the three and six months ended June 30, 2019, the Company incurred $4.9 million and $9.2 million of time-charter hire expense related to time charter-in contracts classified as short-term leases, respectively.
During the six months ended June 30, 2019, the Company chartered in two LR2 vessels for a period of 24 months, which resulted in the Company recognizing right-of-use assets of $14.7 million on the lease commencement dates.
A maturity analysis of the Company’s operating lease liabilities from time charter-in contracts (excluding short-term leases) as at June 30, 2019 is as follows:
Lease Commitment | Non-Lease Commitment | Total Commitment | ||||||
| $ | $ | $ | ||||||
| As at June 30, 2019 | ||||||||
| Payments: | ||||||||
| July to December 2019 | 6,565 | 5,165 | 11,730 | |||||
| 2020 | 12,701 | 9,976 | 22,677 | |||||
| 2021 | 792 | 550 | 1,342 | |||||
| Total payments | 20,058 | 15,691 | 35,749 | |||||
| Less: imputed interest | (969 | ) | ||||||
| Carrying value of operating lease liabilities | 19,089 | |||||||
As at June 30, 2019, minimum commitments to be incurred by the Company under short-term time charter-in contracts, were approximately $6.0 million (remainder of 2019) and $0.6 million (2020). As at December 31, 2018, minimum commitments to be incurred by the Company relating to eight chartered-in vessels accounted for as operating leases, including three workboats for the Company's lightering support services, were approximately $36.9 million (2019), $23.5 million (2020) and $2.0 million (2021).
10
TEEKAY TANKERS LTD. AND SUBSIDIARIES
NOTES TO THE UNAUDITED CONSOLIDATED FINANCIAL STATEMENTS
(all tabular amounts stated in thousands of U.S. dollars, other than share or per share data)
Obligations Related to Finance Leases
| As at | As at | ||||
| June 30, 2019 | December 31, 2018 | ||||
| $ | $ | ||||
| Total obligations related to finance leases | 426,936 | 375,289 | |||
| Less: current portion | (24,397 | ) | (20,896 | ) | |
| Long-term obligations related to finance leases | 402,539 | 354,393 | |||
In May 2019, the Company completed a $63.7 million sale-leaseback financing transaction with a financial institution relating to two of the Company's Suezmax tankers, Aspen Spirit and Cascade Spirit.
In November 2018, the Company completed an $84.7 million sale-leaseback financing transaction with a financial institution relating to four of the Company's tankers, consisting of two Aframax tankers, one Suezmax tanker and one LR2 product tanker, the Explorer Spirit, Navigator Spirit, Pinnacle Spirit and Trysil Spirit.
In September 2018, the Company completed a $156.6 million sale-leaseback financing transaction with a financial institution relating to six of the Company's Aframax tankers, the Blackcomb Spirit, Emerald Spirit, Garibaldi Spirit, Peak Spirit, Tarbet Spirit and Whistler Spirit.
In July 2017, the Company also completed a $153.0 million sale-leaseback financing transaction with a financial institution relating to four of the Company's Suezmax tankers, the Athens Spirit, Beijing Spirit, Moscow Spirit and Sydney Spirit.
Under these arrangements, the Company transferred the vessels to subsidiaries of the financial institutions (or collectively, the Lessors) and leased the vessels back from the Lessors on bareboat charters ranging from 9- to 12-year terms. The Company is obligated to purchase six of the Aframax vessels and two of the Suezmax vessels upon maturity of their respective bareboat charters. The Company also has the option to purchase each of the 16 tankers at various times starting between July 2020 and November 2021 until the end of their respective lease terms.
The Company consolidates 14 of the 16 Lessors for financial reporting purposes as VIEs. The Company understands that these vessels and lease operations are the only assets and operations of the Lessors. The Company operates the vessels during the lease terms, and as a result, is considered to be the Lessors' primary beneficiary.
The liabilities of the 14 Lessors are loans and are non-recourse to the Company. The amounts funded to the 14 Lessors in order to purchase the vessels materially match the funding to be paid by the Company's subsidiaries under these lease-back transactions. As a result, the amounts due by the Company's subsidiaries to the 14 Lessors considered as VIEs have been included in obligations related to finance leases as representing the Lessors' loans.
Subsequent to the adoption of ASU 2016-02 on January 1, 2019, sale and leaseback transactions where the lessee has a purchase obligation are treated as a failed sale. Consequently, the Company has not derecognized the Aspen Spirit and Cascade Spirit and continues to depreciate the assets as if it was the legal owner. Proceeds received from the sale are set up as an obligation related to finance lease and bareboat charter hire payments made by the Company to the Lessor are allocated between interest expense and principal repayments on the obligation related to finance lease.
The bareboat charters related to these vessels require that the Company maintain a minimum liquidity (cash, cash equivalents and undrawn committed revolving credit lines with at least six months to maturity) of $35.0 million and at least 5.0% of the Company's consolidated debt and obligations related to finance leases (excluding applicable security deposits reflected in restricted cash - long-term on the Company's consolidated balance sheets).
Four of the bareboat charters require the Company to maintain, for each vessel, a minimum hull coverage ratio of 90% of the total outstanding principal balance during the first three years of the lease period and 100% of the total outstanding principal balance thereafter. As at June 30, 2019, this ratio was approximately 112% (December 31, 2018 - 101%).
Six of the bareboat charters require the Company to maintain, for each vessel, a minimum hull coverage ratio of 75% of the total outstanding principal balance during the first year of the lease period, 78% for the second year, 80% for the following two years and 90% of the total outstanding principal balance thereafter. As at June 30, 2019, this ratio was approximately 102% (December 31, 2018 - 91%).
Four of the bareboat charters also require the Company to maintain, for each vessel, a minimum hull overage ratio of 100% of the total outstanding principal balance. As at June 30, 2019, this ratio was approximately 133% (December 31, 2018 - 122%).
The remaining two bareboat charters also require the Company to maintain, for each vessel, a minimum hull coverage ratio of 75% of the total outstanding principal balance during the first year of the lease period, 78% for the second year, 80% for the following two years and 90% of the total outstanding principal balance thereafter. As at June 30, 2019, this ratio was approximately 97% (December 31, 2018 - nil).
Such requirement is assessed annually with reference to vessel valuations compiled by one or more agreed upon third parties. As at June 30, 2019, the Company was in compliance with all covenants in respect of its obligations related to finance leases.
11
TEEKAY TANKERS LTD. AND SUBSIDIARIES
NOTES TO THE UNAUDITED CONSOLIDATED FINANCIAL STATEMENTS
(all tabular amounts stated in thousands of U.S. dollars, other than share or per share data)
The weighted-average interest rate on the Company’s obligations related to finance leases as at June 30, 2019 was 7.7% (December 31, 2018 - 7.5%).
As at June 30, 2019, the Company's total remaining commitments related to the financial liabilities of these Suezmax, Aframax and LR2 product tankers were approximately $632.0 million, including imputed interest of $203.2 million, repayable from 2019 through 2030, as indicated below:
| Year | Commitment | |||
| Remainder of 2019 | $ | 30,336 | ||
| 2020 | $ | 56,364 | ||
| 2021 | $ | 56,202 | ||
| 2022 | $ | 56,193 | ||
| 2023 | $ | 56,184 | ||
| Thereafter | $ | 376,750 | ||
9. Derivative Instruments
Interest rate swap agreements
The Company uses derivative instruments in accordance with its overall risk management policies. The Company enters into interest rate swap agreements which exchange a receipt of floating interest for a payment of fixed interest to reduce the Company’s exposure to interest rate variability on its outstanding floating-rate debt. The Company has not designated, for accounting purposes, its interest rate swaps as cash flow hedges of its U.S. Dollar LIBOR-denominated borrowings.
As at June 30, 2019, the Company was committed to the following interest rate swap agreements:
| Interest Rate | Notional Amount | Fair Value / Carrying Amount of Asset | Remaining Term | Fixed Interest Rate | |||||||||
| Index | $ | $ | (years) | (%) (1) | |||||||||
| LIBOR-Based Debt: | |||||||||||||
U.S. Dollar-denominated interest rate swaps (2) | LIBOR | 69,422 | 292 | 1.5 | 1.46 | ||||||||
| U.S. Dollar-denominated interest rate swaps | LIBOR | 150,000 | 610 | 1.5 | 1.55 | ||||||||
| U.S. Dollar-denominated interest rate swaps | LIBOR | 50,000 | 506 | 1.5 | 1.16 | ||||||||
| (1) | Excludes the margin the Company pays on its variable-rate debt, which, as of June 30, 2019, ranged from 0.30% to 3.50%. |
| (2) | Notional amount reduces quarterly. |
The Company is potentially exposed to credit loss in the event of non-performance by the counterparty to the interest rate swap agreements in the event that the fair value results in an asset being recorded. In order to minimize counterparty risk, the Company only enters into interest rate swap agreements with counterparties that are rated A– or better by Standard & Poor’s or A3 or better by Moody’s at the time transactions are entered into.
Forward freight agreements
The Company uses forward freight agreements (or FFAs) in non-hedge-related transactions to increase or decrease its exposure to spot market rates, within defined limits. Net gains and losses from FFAs are recorded within realized and unrealized gain (loss) on derivative instruments in the Company's consolidated statements of loss.
The following table presents the location and fair value amounts of derivative instruments, segregated by type of contract, on the Company’s consolidated balance sheets.
12
TEEKAY TANKERS LTD. AND SUBSIDIARIES
NOTES TO THE UNAUDITED CONSOLIDATED FINANCIAL STATEMENTS
(all tabular amounts stated in thousands of U.S. dollars, other than share or per share data)
| Current portion of derivative assets | Derivative assets | Accounts receivable (Accrued liabilities) | Current portion of derivative liabilities | ||||||||
| $ | $ | $ | $ | ||||||||
| As at June 30, 2019 | |||||||||||
| Interest rate swap agreements | 1,168 | 240 | 487 | — | |||||||
| Forward freight agreements | 61 | — | — | — | |||||||
| 1,229 | 240 | 487 | — | ||||||||
| As at December 31, 2018 | |||||||||||
| Interest rate swap agreements | 2,905 | 2,973 | 422 | — | |||||||
| Forward freight agreements | — | — | (3 | ) | (57 | ) | |||||
| 2,905 | 2,973 | 419 | (57 | ) | |||||||
Realized and unrealized gains (losses) relating to the interest rate swaps and FFAs are recognized in earnings and reported in realized and unrealized gain (loss) on derivative instruments in the Company’s consolidated statements of loss as follows:
| Three Months Ended | Three Months Ended | ||||||||||||
| June 30, 2019 | June 30, 2018 | ||||||||||||
| Realized gains (losses) | Unrealized (losses) gains | Total | Realized gains (losses) | Unrealized gains | Total | ||||||||
| $ | $ | $ | $ | $ | $ | ||||||||
| Interest rate swap agreements | 829 | (2,699 | ) | (1,870 | ) | 674 | 426 | 1,100 | |||||
| Forward freight agreements | (29 | ) | 121 | 92 | (18 | ) | 34 | 16 | |||||
| 800 | (2,578 | ) | (1,778 | ) | 656 | 460 | 1,116 | ||||||
| Six Months Ended | Six Months Ended | ||||||||||||
| June 30, 2019 | June 30, 2018 | ||||||||||||
| Realized gains (losses) | Unrealized (losses) gains | Total | Realized gains (losses) | Unrealized gains | Total | ||||||||
| $ | $ | $ | $ | $ | $ | ||||||||
| Interest rate swap agreements | 1,783 | (4,470 | ) | (2,687 | ) | 864 | 3,249 | 4,113 | |||||
| Forward freight agreements | (42 | ) | 104 | 62 | (18 | ) | 34 | 16 | |||||
| 1,741 | (4,366 | ) | (2,625 | ) | 846 | 3,283 | 4,129 | ||||||
10. Other Income
The components of other income are as follows:
| Three Months Ended June 30, | Six Months Ended June 30, | |||||||||
| 2019 | 2018 | 2019 | 2018 | |||||||
| $ | $ | $ | $ | |||||||
| Foreign exchange gain | 595 | 4,794 | 182 | 4,774 | ||||||
| Other income | 19 | 19 | 67 | 49 | ||||||
| Total | 614 | 4,813 | 249 | 4,823 | ||||||
13
TEEKAY TANKERS LTD. AND SUBSIDIARIES
NOTES TO THE UNAUDITED CONSOLIDATED FINANCIAL STATEMENTS
(all tabular amounts stated in thousands of U.S. dollars, other than share or per share data)
| 11. | Freight Tax and Other Tax Expenses |
The following table reflects changes in uncertain tax positions relating to freight tax liabilities, which are recorded in other long-term liabilities on the Company's consolidated balance sheets:
| Six Months Ended June 30, | |||||
| 2019 $ | 2018 $ | ||||
| Balance of unrecognized tax benefits as at January 1 | 32,059 | 26,054 | |||
| Increases for positions related to the current year | 1,686 | 1,467 | |||
| Changes for positions taken in prior years | 2,047 | 1,483 | |||
| Decreases related to statute of limitations | — | (93 | ) | ||
| Balance of unrecognized tax benefits as at June 30 | 35,792 | 28,911 | |||
The Company does not presently anticipate its uncertain tax positions will significantly increase in the next 12 months; however, this is dependent on the jurisdictions of the trading activity of its vessels. The Company reviews its freight tax obligations on a regular basis and may update its assessment of its tax positions based on available information at that time. Such information may include legal advice as to applicability of freight taxes in relevant jurisdictions. Freight tax regulations are subject to change and interpretation; therefore, the amounts recorded by the Company may change accordingly.
12. Financial Instruments
| a. | Fair Value Measurements |
For a description of how the Company estimates fair value and for a description of the fair value hierarchy levels, see Item 18 - Financial Statements : Note 13 to the Company’s audited consolidated financial statements filed with its Annual Report on Form 20-F for the year ended December 31, 2018.
The following table includes the estimated fair value and carrying value of those assets and liabilities that are measured at fair value on a recurring basis, as well as the estimated fair value of the Company’s financial instruments that are not accounted for at the fair value on a recurring basis.
| June 30, 2019 | December 31, 2018 | |||||||||||||
Fair Value Hierarchy Level | Carrying Amount Asset / (Liability) $ | Fair Value Asset / (Liability) $ | Carrying Amount Asset / (Liability) $ | Fair Value Asset / (Liability) $ | ||||||||||
| Recurring: | ||||||||||||||
| Cash, cash equivalents and restricted cash | Level 1 | 40,782 | 40,782 | 60,507 | 60,507 | |||||||||
Derivative instruments (note 9) | ||||||||||||||
Interest rate swap agreements (1) | Level 2 | 1,408 | 1,408 | 5,878 | 5,878 | |||||||||
Forward freight agreements (1) | Level 2 | 61 | 61 | (57 | ) | (57 | ) | |||||||
| Other: | ||||||||||||||
| Short-term debt | Level 2 | (15,000 | ) | (15,000 | ) | — | — | |||||||
| Advances to equity-accounted for joint venture | (2) | 9,930 | (2) | 9,930 | (2) | |||||||||
| Long-term debt, including current portion | Level 2 | (593,226 | ) | (585,052 | ) | (735,406 | ) | (723,031 | ) | |||||
| Obligations related to finance leases, including current portion | Level 2 | (426,936 | ) | (451,746 | ) | (375,289 | ) | (377,652 | ) | |||||
| (1) | The fair value of the Company’s interest rate swap agreements and FFAs at June 30, 2019 and December 31, 2018 excludes accrued interest income and expenses which are recorded in accounts receivables and accrued liabilities, respectively, on the unaudited consolidated balance sheets. |
| (2) | The advances to its equity-accounted joint venture, together with the Company’s investment in the equity-accounted joint venture, form the net aggregate carrying value of the Company’s interests in the equity-accounted joint venture in these consolidated financial statements. The fair values of the individual components of such aggregate interests as at June 30, 2019 and December 31, 2018 were not determinable. |
14
TEEKAY TANKERS LTD. AND SUBSIDIARIES
NOTES TO THE UNAUDITED CONSOLIDATED FINANCIAL STATEMENTS
(all tabular amounts stated in thousands of U.S. dollars, other than share or per share data)
| b. | Financing Receivables |
The following table contains a summary of the Company’s financing receivables by type and the method by which the Company monitors the credit quality of its financing receivables on a quarterly basis.
| June 30, 2019 | December 31, 2018 | |||||||
| Class of Financing Receivable | Credit Quality Indicator | Grade | $ | $ | ||||
| Advances to equity-accounted joint venture | Other internal metrics | Performing | 9,930 | 9,930 | ||||
| Total | 9,930 | 9,930 | ||||||
13. Capital Stock and Equity-Based Compensation
The authorized capital stock of the Company at June 30, 2019 was 100,000,000 shares of preferred stock (December 31, 2018 - 100,000,000), with a par value of $0.01 per share, 485,000,000 shares of Class A common stock (December 31, 2018 - 485,000,000), with a par value of $0.01 per share, and 100,000,000 shares of Class B common stock (December 31, 2018 - 100,000,000), with a par value of $0.01 per share. A share of Class A common stock entitles the holder to one vote per share while a share of Class B common stock entitles the holder to five votes per share, subject to a 49% aggregate Class B common stock voting power maximum. As of June 30, 2019, the Company had 232.0 million shares of Class A common stock (December 31, 2018 – 231.6 million), 37.0 million shares of Class B common stock (December 31, 2018 – 37.0 million) and no shares of preferred stock (December 31, 2018 – nil) issued and outstanding.
During March 2019, the Company granted, under the Teekay Tankers Ltd. 2007 Long-Term Incentive Plan, a total of 159,375 shares of Class A common stock with an aggregate value of $0.2 million and 0.5 million stock options with an exercise price of $1.00 per share to the Company’s non-management directors as part of their annual compensation for 2018. During March 2018, 0.5 million stock options with an exercise price of $1.22 per share were granted to non-management directors of the Company. These stock options have a ten-year term and vest immediately. For the six months ended June 30, 2019 and 2018, the compensation relating to the granting of such stock and stock options has been included in general and administrative expenses in the amount of $0.3 million and $0.4 million, respectively.
The Company also grants stock options and restricted stock units as incentive-based compensation under the Teekay Tankers Ltd. 2007 Long-Term Incentive Plan to the officers of the Company and certain employees of Teekay subsidiaries that provide services to the Company. The Company measures the cost of such awards using the grant date fair value of the award and recognizes that cost, net of estimated forfeitures, over the requisite service period. The requisite service period consists of the period from the grant date of the award to the earlier of the date of vesting or the date the recipient becomes eligible for retirement. For stock-based compensation awards subject to graded vesting, the Company calculates the value for the award as if it was one single award with one expected life and amortizes the calculated expense for the entire award on a straight-line basis over the requisite service period. The compensation cost of the Company's stock-based compensation awards is reflected in general and administrative expenses in the Company’s consolidated statements of loss.
During March 2019, the Company granted 1.4 million (2018 - 0.7 million) stock options with an exercise price of $1.00 (2018 - $1.22) per share to the officers of the Company and certain employees of Teekay subsidiaries that provide services to the Company. Each stock option has a ten-year term and vests equally over three years from the grant date.
The weighted-average fair value of the stock options granted in 2019 to non-management directors, officers and certain employees of Teekay subsidiaries that provide services to the Company was $0.35 (2018 - $0.35) per option, estimated on the grant date using the Black-Scholes option pricing model. The following assumptions were used in computing the fair value of the stock options granted: expected volatility of 48.7% (2018 - 48.7%); expected life of five years (2018 - five years); dividend yield of 3.0% (2018 - 5.5%); and risk-free interest rate of 2.4% (2018 - 2.6%). The expected life of the stock options granted was estimated using the historical exercise behavior of employees of Teekay that receive stock options from Teekay. The expected volatility was based on historical volatility of the Company's share price as calculated using historical data during the five years prior to the grant date.
During March 2019, the Company also granted 0.6 million (2018 - 0.8 million) restricted stock units to the officers of the Company and certain employees of Teekay subsidiaries that provide services to the Company with an aggregate fair value of $0.6 million (2018 - $0.9 million). Each restricted stock unit is equal to one share of the Company’s common stock plus reinvested distributions from the grant date to the vesting date. The restricted stock units vest equally over three years from the grant date. Any portion of a restricted stock unit award that is not vested on the date of the recipient’s termination of service is cancelled, unless the recipient's termination arises as a result of the recipient’s retirement and, in this case, the restricted stock unit award will continue to vest in accordance with the vesting schedule. Upon vesting, the value of the restricted stock unit awards, net of withholding taxes, is paid to each recipient in the form of common stock.
During the three and six months ended June 30, 2019 and 2018, the Company recorded $0.2 million and $0.6 million (2018 - $0.2 million and $0.5 million), respectively, of expenses related to the restricted stock units and stock options. During the six months ended June 30, 2019, a total of 0.4 million restricted stock units (2018 - 0.3 million) with a market value of $0.5 million (2018 - $0.3 million) vested and were paid to the grantees by issuing 0.3 million shares (2018 - 0.2 million shares) of Class A common stock, net of withholding taxes.
15
TEEKAY TANKERS LTD. AND SUBSIDIARIES
NOTES TO THE UNAUDITED CONSOLIDATED FINANCIAL STATEMENTS
(all tabular amounts stated in thousands of U.S. dollars, other than share or per share data)
| 14. | Related Party Transactions |
Management Fee - Related and Other
| a. | The Company's operations are conducted in part by its subsidiaries, which receive services from Teekay's wholly-owned subsidiary, Teekay Shipping Ltd. (or the Manager, as successor by merger to Teekay Tankers Management Services Ltd.) and its affiliates. The Manager provides various services under a long-term management agreement (the Management Agreement). Commencing October 1, 2018, the Company elected to receive commercial and technical management services for its owned and leased vessels (other than certain former TIL vessels, which are managed by a third party) from its wholly-owned subsidiaries and no longer contracts these services from the Manager. Prior to this date, the Manager provided these services to the Company, which it did by subcontracting such services from the Company's subsidiary, Teekay Tanker Operations Ltd. (or TTOL) and its affiliates. Certain of the Company’s vessels participate in RSAs that are managed by the Company's subsidiaries, TTOL or Teekay Tankers Chartering Pte Ltd. |
b. Amounts received and (paid by) the Company for related party transactions for the periods indicated were as follows:
| Three Months Ended | Six Months Ended | |||||||
| June 30, 2019 | June 30, 2018 | June 30, 2019 | June 30, 2018 | |||||
| $ | $ | $ | $ | |||||
Vessel operating expenses - technical management fee (i) | — | (2,800 | ) | — | (6,100 | ) | ||
Strategic and administrative service fees (ii) | (7,950 | ) | (8,633 | ) | (15,742 | ) | (17,329 | ) |
Secondment fees (iii) | (40 | ) | (142 | ) | (99 | ) | (359 | ) |
LNG service revenues (iv) | 1,000 | 31 | 2,129 | 272 | ||||
Technical management fee revenue (v) | 169 | 3,171 | 427 | 6,329 | ||||
Service revenues (vi) | 67 | 254 | 217 | 415 | ||||
| (i) | The cost of ship management services provided by the Manager has been presented as vessel operating expenses on the Company's consolidated statements of loss. |
| (ii) | The Manager’s strategic and administrative service fees have been presented in general and administrative expenses, except for fees related to technical management services, which have been presented in vessel operating expenses, on the Company’s consolidated statements of loss. The Company’s executive officers are employees of Teekay or subsidiaries thereof, and their compensation (other than any awards under the Company’s long-term incentive plan described in note 13) is set and paid by Teekay or such other subsidiaries. The Company reimburses Teekay for time spent by its executive officers on the Company’s management matters through the strategic portion of the management fee. |
| (iii) | The Company pays secondment fees for services provided by some employees of Teekay. Secondment fees have been presented in general and administrative expenses, except for fees related to technical management services, which have been presented in vessel operating expenses on the Company's consolidated statements of loss. |
| (iv) | In November 2016, the Company's ship-to-ship transfer business signed an operational and maintenance subcontract with Teekay LNG Bahrain Operations L.L.C., an entity wholly-owned by TGP, for the Bahrain LNG Import Terminal. The terminal is owned by Bahrain LNG W.I.L., a joint venture for which Teekay LNG Operating L.L.C., an entity wholly-owned by TGP, has a 30% interest. The sub-contract ended in April 2019. |
| (v) | The Company receives reimbursements from Teekay, which subcontracts technical management services from the Manager. These reimbursements have been presented in general and administrative expenses on the Company's consolidated statements of loss. |
| (vi) | The Company recorded revenue relating to TTOL's administration of certain RSAs and provision of certain commercial services to participants in the arrangements. |
| c. | The Manager and other subsidiaries of Teekay collect revenues and remit payments for expenses incurred by the Company’s vessels. Such amounts, which are presented on the Company’s consolidated balance sheets in "due from affiliates" or "due to affiliates," as applicable, are without interest or stated terms of repayment. In addition, $7.8 million and $7.6 million were payable as crewing and manning costs as at June 30, 2019 and December 31, 2018, respectively, and such amounts are included in accrued liabilities in the consolidated balance sheets. These crewing and manning costs will be payable as reimbursement to the Manager once they are paid by the Manager to the vessels' crew. The amounts owing from the RSAs, which are reflected in the consolidated balance sheets as pool receivables from affiliates, are without interest and are repayable upon the terms contained within the applicable RSA. In addition, the Company had advanced $nil and $34.9 million as at June 30, 2019 and December 31, 2018, respectively, to the RSAs for working capital purposes. These activities, which are reflected in the Company's consolidated balance sheets as due from affiliates, are without interest or stated terms of repayment. |
16
TEEKAY TANKERS LTD. AND SUBSIDIARIES
NOTES TO THE UNAUDITED CONSOLIDATED FINANCIAL STATEMENTS
(all tabular amounts stated in thousands of U.S. dollars, other than share or per share data)
| d. | Pursuant to certain RSAs, TTOL provides certain commercial services to the RSA participants and administers the RSAs in exchange for a fee currently equal to 1.25% of the gross revenues attributable to each RSA participant’s vessels and a fixed amount per vessel per day which ranges from $275 to $350. Voyage revenues and voyage expenses of the Company’s vessels operating in these RSAs are pooled with the voyage revenues and voyage expenses of other RSA participants. The resulting net pool revenues, calculated on a time-charter equivalent basis, are allocated to the RSA participants according to an agreed formula. The pool receivables from affiliates as at June 30, 2019 and December 31, 2018 were $15.3 million and $56.5 million, respectively. |
| e. | Pursuant to a service agreement with the Teekay Aframax RSA, from time to time, the Company may hire vessels to perform full service lightering services. During the three and six months ended June 30, 2019, the Company recognized $5.1 million and $7.4 million (June 30, 2018 - $7.4 million and $15.8 million), respectively, related to vessels that were chartered-in from the RSA to assist with full service lightering operations. These amounts have been presented in voyage expenses on the Company's consolidated statements of loss. |
| 15. | Loss Per Share |
The net loss available for common shareholders and loss per common share are presented in the table below:
| Three Months Ended | Six Months Ended | ||||||||||
| June 30, 2019 | June 30, 2018 | June 30, 2019 | June 30, 2018 | ||||||||
| $ | $ | $ | $ | ||||||||
| Net loss | (14,307 | ) | (27,413 | ) | (1,860 | ) | (46,566 | ) | |||
| Weighted average number of common shares – basic | 268,990,399 | 268,558,556 | 268,835,175 | 268,426,201 | |||||||
| Dilutive effect of stock-based awards | — | — | — | — | |||||||
| Weighted average number of common shares – diluted | 268,990,399 | 268,558,556 | 268,835,175 | 268,426,201 | |||||||
| Loss per common share: | |||||||||||
| – Basic | (0.05 | ) | (0.10 | ) | — | (0.17 | ) | ||||
| – Diluted | (0.05 | ) | (0.10 | ) | — | (0.17 | ) | ||||
Stock-based awards that have an anti-dilutive effect on the calculation of diluted earnings per common share are excluded from this calculation. In the periods where a loss attributable to shareholders has been incurred, all stock-based awards are anti-dilutive.
16. Sale of Vessel
In the second quarter of 2018, the Company sold and delivered a lightering support vessel to its buyer and recognized a gain on sale of vessel of $0.2 million.
17. Supplemental Cash Flow Information
Total cash, cash equivalents and restricted cash is as follows:
| As at | As at | As at | As at | ||||||||
| June 30, 2019 | December 31, 2018 | June 30, 2018 | December 31, 2017 | ||||||||
| $ | $ | $ | $ | ||||||||
| Cash and cash equivalents | 35,429 | 54,917 | 48,457 | 71,439 | |||||||
| Restricted cash – current | 1,916 | 2,153 | 1,858 | 1,599 | |||||||
| Restricted cash – long-term | 3,437 | 3,437 | 2,672 | 2,672 | |||||||
| 40,782 | 60,507 | 52,987 | 75,710 | ||||||||
The Company maintains restricted cash deposits relating to certain FFAs (note 9), LNG terminal management and leasing arrangements (note 8).
17
TEEKAY TANKERS LTD. AND SUBSIDIARIES
NOTES TO THE UNAUDITED CONSOLIDATED FINANCIAL STATEMENTS
(all tabular amounts stated in thousands of U.S. dollars, other than share or per share data)
Non-cash items related to operating lease right-of-use assets and operating lease liabilities are as follows:
| For the six months ended | |||||||||
| June 30, 2019 | June 30, 2018 | ||||||||
| $ | $ | ||||||||
| Leased assets obtained in exchange for new operating lease liabilities | 25,656 | — | |||||||
| 18. | Restructuring Charges |
The restructuring charges for the three and six months ended June 30, 2018 are primarily related to the termination of certain employees in the ship-to-ship transfer segment as a result of the reorganization of that segment.
| 19. | Liquidity |
Management is required to assess if the Company will have sufficient liquidity to continue as a going concern for the one-year period following the issuance of its consolidated financial statements. Based on the Company’s liquidity at the date these consolidated financial statements were issued and the liquidity it expects to generate from operations over the following year, the Company estimates that it will have sufficient liquidity to continue as a going concern for at least the one-year period following the issuance of these consolidated financial statements. Such estimate assumes there is no significant decline in spot tanker rates for the forecast period and Teekay’s continued compliance with the covenants related to two of the Company’s term loans (see note 6).
18
ITEM 2 – MANAGEMENT’S DISCUSSION AND ANALYSIS OF FINANCIAL CONDITION AND RESULTS OF OPERATIONS
The following Management’s Discussion and Analysis of Financial Condition and Results of Operations should be read in conjunction with the consolidated financial statements and accompanying notes contained in Item 1 – Financial Statements of this Report on Form 6-K and with our audited consolidated financial statements contained in Item 18 – Financial Statements and Management’s Discussion and Analysis of Financial Condition and Results of Operations in Item 5 – Operating and Financial Review and Prospects of our Annual Report on Form 20-F for the year ended December 31, 2018.
OVERVIEW
Our business is to own and operate crude oil and product tankers, and we employ a chartering strategy that seeks to capture upside opportunities in the tanker spot market while using fixed-rate time charters to reduce potential downside risks. As an adjacency to these core competencies, we also provide full service lightering (or FSL) and lightering support services in our ship-to-ship (or STS) transfer business. As at June 30, 2019, our fleet consisted of 68 vessels, including eight in-chartered vessels, three STS support vessels and one 50%-owned Very Large Crude Carrier (or VLCC). The following table summarizes our fleet as at June 30, 2019:
| Owned and Leased Vessels | Chartered-in Vessels | Total | ||
| Fixed-rate: | ||||
| Suezmax Tankers | 1 | — | 1 | |
Total Fixed-Rate Fleet (1) | 1 | — | 1 | |
| Spot-rate: | ||||
| Suezmax Tankers | 29 | — | 29 | |
Aframax Tankers (2) | 17 | 3 | 20 | |
LR2 Product Tankers (2)(3) | 9 | 2 | 11 | |
VLCC Tanker (4) | 1 | — | 1 | |
Total Spot Fleet (5) | 56 | 5 | 61 | |
| STS Support Vessels | 3 | 3 | 6 | |
| Total Teekay Tankers Fleet | 60 | 8 | 68 | |
| 1. | Time charter-out contract is scheduled to expire in 2020. |
| 2. | One Aframax tanker is currently time-chartered in for a period of 60 months expiring in 2021, two Aframax tankers are currently time-chartered in for periods of 12 months expiring in 2019, and two LR2 tankers are currently time-chartered in for periods of 24 months expiring in 2021, each with an option to extend for one year. |
| 3. | Long Range 2 (or LR2) product tankers. |
| 4. | VLCC owned through a 50/50 joint venture. As at June 30, 2019, the VLCC was trading on spot voyage charters in a pooling arrangement managed by a third party. |
| 5. | As at June 30, 2019, a total of 52 of our owned, leased and chartered-in vessels operated in the spot market in revenue sharing arrangements (or RSAs), which are managed by our subsidiaries TTOL and Teekay Tankers Chartering Pte Ltd. As at June 30, 2019, the RSAs in which we participate were comprised of a total of 35 Aframax tankers, 33 Suezmax tankers and 11 LR2 product tankers (of which five LR2 tankers were cross-trading in the Aframax RSA), including vessels owned by other members of the RSAs. |
ITEMS YOU SHOULD CONSIDER WHEN EVALUATING OUR RESULTS
There are a number of factors that should be considered when evaluating our historical financial performance and assessing our future prospects, and we use a variety of financial and operational terms and concepts when analyzing our results of operations. These items can be found in "Item 5 – Operating and Financial Review and Prospects” in our Annual Report on Form 20-F for the year ended December 31, 2018.
SIGNIFICANT DEVELOPMENTS IN 2019
Working Capital Loan
In May 2019, we obtained approval from the lender for an increase to the limit of our working capital loan facility by up to an additional $15.0 million to $55.0 million.
19
Sale-leaseback Financing Transaction
In May 2019, we completed a $63.7 million sale-leaseback financing transaction for two of our Suezmax tankers. Each vessel is leased on a bareboat charter for nine years, with a fixed daily rate of $12,300, purchase options throughout the lease term commencing at the end of the second year, and a purchase obligation at the end of the lease term. Proceeds from the sale-leaseback transaction were used to prepay a portion of one of our loan facilities. The vessels were delivered to the buyer in May 2019.
Time Chartered-in Vessels
In the second quarter of 2019, we entered into a time charter-in contract for one Aframax tanker for a firm period of two years at a daily rate of $21,000 with an option period of one year at $22,000 per day. The vessel is expected to be delivered to us during the third quarter of 2019.
In the first quarter of 2019, we entered into time charter-in contracts for two LR2 product tankers, each of which has a two-year term with a one-year extension option. The two time charter-in contracts have a weighted-average daily rate of $20,500, and we entered into a risk-sharing agreement with a third party for one of the vessels, whereby an agreed portion of net profit or loss is shared with the third party. Both vessels delivered in January 2019 and have been trading in the Taurus LR2 RSA.
Time Chartered-out Vessel
In June 2019, the charterer of one Suezmax vessel exercised its one-year option period at a daily rate of $22,750. The option period will commence in August 2019.
RESULTS OF OPERATIONS
There are a number of factors that should be considered when evaluating our historical financial performance and assessing our future prospects, and we use a variety of financial and operational terms and concepts when analyzing our results of operations. These can be found in Item 5 – Operating and Financial Review and Prospects in our Annual Report on Form 20-F for the year ended December 31, 2018.
In accordance with GAAP, we report gross revenues in our consolidated statements of income (loss) and include voyage expenses among our operating expenses. However, ship-owners base economic decisions regarding the employment of their vessels upon anticipated “time-charter equivalent” (or TCE) rates, which represent net revenues (or revenue less voyage expenses) divided by revenue days, and industry analysts typically measure bulk shipping freight rates in terms of TCE rates. This is because under time charter-out contracts the customer usually pays the voyage expenses, while under voyage charters the ship-owner usually pays the voyage expenses, which typically are added to the hire rate at an approximate cost. Accordingly, the discussion of revenue below focuses on net revenues and TCE rates (both of which are non-GAAP financial measures) where applicable.
Summary
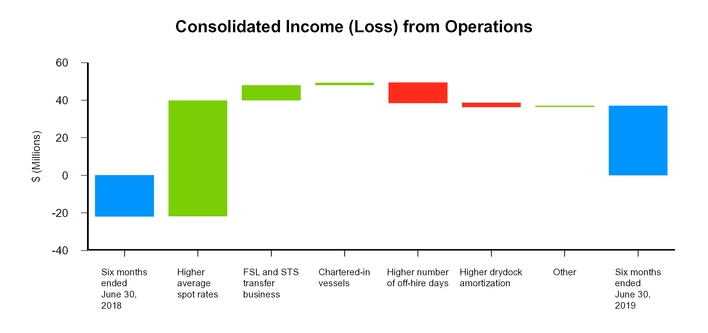
Our consolidated income from operations increased to income of $37.1 million for the six months ended June 30, 2019, compared to a loss from operations of $21.8 million in the same period last year. The primary reasons for this increased income are as follows:
| • | an increase of $61.7 million due to higher overall average realized spot TCE rates earned by our Suezmax, Aframax and LR2 product tankers; |
| • | an increase of $8.1 million due to improved net results from our FSL and STS transfer businesses; and |
20
| • | an increase of $1.3 million due to the addition of two Aframax and two LR2 chartered-in tankers that were delivered to us in the fourth quarter of 2018 and first quarter of 2019; |
partially offset by
| • | a decrease of $10.7 million due a higher number of off-hire days and off-hire bunker expenses compared to the same period in the prior year; and |
| • | a decrease of $2.2 million due to the amortization of new dry dockings with higher costs and completing the first dry dockings for various former TIL vessels subsequent to our acquisition of TIL in late 2017. |
We manage our business and analyze and report our results of operations on the basis of two reportable segments: the conventional tanker segment and the STS transfer segment. Please read “Item 1 - Financial Statements: Note 4 - Segment Reporting.”
Details of the changes to our results of operations for each of our segments for the three and six months ended June 30, 2019, compared to the three and six months ended June 30, 2018 are provided below.
Three and Six Months Ended June 30, 2019 versus Three and Six Months Ended June 30, 2018
Conventional Tanker Segment
Our conventional tanker segment consists of conventional crude oil and product tankers that (i) are subject to long-term, fixed-rate time-charter contracts (which have an original term of one year or more), (ii) operate in the spot tanker market, or (iii) are subject to time-charters that are priced on a spot market basis or are short-term, fixed-rate contracts (which have original terms of less than one year), including those employed on FSL contracts.
The following table presents the operating results of our conventional tanker segment for the three and six months ended June 30, 2019 and 2018, and compares net revenues, a non-GAAP financial measure, for those periods to revenues, the most directly comparable GAAP financial measure:
| Three Months Ended June 30, | Six Months Ended June 30, | |||||||||||||||
| (in thousands of U.S. dollars, except percentage changes) | 2019 | 2018 | % Change | 2019 | 2018 | % Change | ||||||||||
| Revenues | 190,351 | 163,849 | 16.2 | % | 412,414 | 323,660 | 27.4 | % | ||||||||
Less: Voyage expenses (1) | (95,171 | ) | (90,333 | ) | 5.4 | % | (195,379) | (173,504 | ) | 12.6 | % | |||||
| Net revenues | 95,180 | 73,516 | 29.5 | % | 217,035 | 150,156 | 44.5 | % | ||||||||
| Vessel operating expenses | (43,375 | ) | (44,738 | ) | (3.0 | )% | (87,722) | (88,454 | ) | (0.8 | )% | |||||
| Time-charter hire expenses | (9,196 | ) | (4,113 | ) | 123.6 | % | (17,166) | (7,391 | ) | 132.3 | % | |||||
| Depreciation and amortization | (29,762 | ) | (28,454 | ) | 4.6 | % | (58,788) | (56,639 | ) | 3.8 | % | |||||
| General and administrative expenses | (8,729 | ) | (8,433 | ) | 3.5 | % | (17,075) | (17,400 | ) | (1.9 | )% | |||||
| Restructuring charges | — | (152 | ) | (100.0 | )% | — | (152 | ) | (100.0 | )% | ||||||
| Income (loss) from operations | 4,118 | (12,374 | ) | 133.3 | % | 36,284 | (19,880 | ) | 282.5 | % | ||||||
| Equity (loss) income | (169 | ) | (70 | ) | 141.4 | % | 584 | 624 | (6.4 | )% | ||||||
| (1) | Includes $2.5 million and $5.4 million of voyage expenses for the three and six months ended June 30, 2019, respectively, and $3.4 million and $6.6 million of voyage expenses for the three and six months ended June 30, 2018, respectively, relating to lightering support services, which the STS transfer segment provided to the conventional tanker segment for FSL operations. |
Tanker Market
Crude tanker spot rates declined during the second quarter of 2019 compared to the first quarter of 2019 primarily due to seasonal factors, as well as some near-term headwinds which have continued into the beginning of the third quarter.
Lower OPEC oil production has impacted crude tanker demand during the first half of 2019, with OPEC crude oil production down by around 2.5 million barrels per day (mb/d) since November 2018. This reduction is due to both over-compliance with the 1.2 mb/d of supply cuts announced in early-2019 and reduced volumes from Iran and Venezuela due to U.S. sanctions. In addition, the elimination of Venezuelan oil shipments to the U.S. has resulted in a reduction in shipping activity in the U.S. Gulf / Caribbean Aframax market.
21
Tanker rates have also been impacted by heavier than normal refinery maintenance in the first half of the year as refiners prepare for the upcoming IMO 2020 regulations. According to the IEA, global refining throughput fell by 0.7 mb/d year-on-year in the second quarter of 2019, the largest annual decline in 10 years. This led to reduced crude tanker demand, which has carried over into the early part of the third quarter.
Finally, the first half of 2019 saw relatively high tanker fleet growth of 20.5 million deadweight tonnes (mdwt), or 3.5%, which was the highest level of fleet growth in a six-month period since the first half of 2011. This high fleet growth was a result of a heavy newbuilding delivery schedule since the start of the year and a lack of tanker scrapping, with just 2.7 mdwt of vessels removed in the first half of the year compared to 21.5 mdwt for the full year of 2018.
Despite some near-term headwinds, the tanker market fundamentals continue to support a market recovery in the latter part of the year and into 2020. First, refinery throughput is expected to increase significantly in the coming months as refiners ramp up activity in order to produce sufficient low sulphur fuels ahead of the impending IMO 2020 regulations. According to the IEA, global refinery throughput is estimated to increase by over 3 mb/d in the third quarter of 2019 compared to the second quarter, which is expected to be positive for crude tanker demand. The new IMO 2020 regulations could create additional volatility for the tanker market through new trade patterns and arbitrage movements, floating storage demand, and a potential increase in port congestion as the market adjusts to the change.
U.S. crude oil exports have averaged 2.8 mb/d in 2019 to date, up from 2.0 mb/d last year. However, further increases are being hampered by a lack of pipeline capacity to the Gulf coast. This is expected to be alleviated in the coming months when three large pipelines with a combined capacity of around 2 mb/d are planned to come online, allowing U.S. crude exports to increase significantly. This is expected to be positive for mid-size tanker demand due to both direct exports to Europe on Aframax and Suezmax tankers, and increased Aframax lightering demand for transportation on Very Large Crude Carriers (VLCCs) to Asia.
Finally, the tanker fleet is set for a period of much lower fleet growth over the next two years due to a relatively small orderbook. The tanker orderbook currently totals 53 mdwt, or 8.7% of the existing fleet size, which is the lowest tanker fleet-to-orderbook ratio since early-1997. Fleet growth could be further offset by an increase in vessel off-hire time in the coming months as ships are taken out of service for scrubber retrofitting in anticipation of IMO 2020 regulations. As a result, lower fleet growth levels are expected in the second half of the year, with continued low fleet growth during 2020.
In summary, the tanker market is currently at a seasonal low point, which is compounded by some near-term factors. However, the fundamentals continue to point towards a stronger tanker market during the latter part of 2019 and into 2020 due to a tighter tanker supply / demand balance.
Fleet and TCE Rates
As at June 30, 2019, we owned 56 double-hulled conventional oil and product tankers and time chartered-in three Aframax and two LR2 tankers. We also owned a 50% interest in one VLCC, the results of which are included in equity income (loss).
The following table highlights the operating performance of our time-charter vessels and spot vessels trading in RSAs, on voyage charters and in FSL, measured in net voyage revenue per revenue day, or TCE rates, before off-hire bunker expenses:
| Conventional Tanker Segment | ||||||||||||||||||
| Three Months Ended June 30, 2019 | ||||||||||||||||||
Revenues (1)(5) | Voyage Expenses (2)(5) | Adjustments (3) | TCE Revenues | Revenue Days | Average TCE per Revenue Day (3) | |||||||||||||
| (in thousands) | (in thousands) | (in thousands) | (in thousands) | |||||||||||||||
| Voyage-charter contracts - Suezmax | $84,472 | ($43,705 | ) | $984 | $41,751 | 2,418 | $17,267 | |||||||||||
Voyage-charter contracts - Aframax (4)(5) | $76,058 | ($41,180 | ) | $507 | $35,385 | 1,763 | $20,075 | |||||||||||
Voyage-charter contracts - LR2 (5) | $25,662 | ($12,593 | ) | $99 | $13,168 | 840 | $15,679 | |||||||||||
| Time-charter out contracts - Suezmax | $1,455 | ($4 | ) | $122 | $1,573 | 91 | $17,281 | |||||||||||
| Time-charter out contracts - Aframax | — | $137 | ($138 | ) | ($1 | ) | — | — | ||||||||||
| Total | $187,647 | ($97,345 | ) | $1,574 | $91,876 | 5,112 | $17,975 | |||||||||||
| (1) | Includes $4.1 million of revenue earned from the vessels that were chartered from the RSAs to perform FSL. Excludes $1.5 million of commissions and management fees earned for the management of external vessels trading in RSAs and $0.6 million of bunker commissions earned. |
| (2) | Includes $2.5 million of inter-segment voyage expenses relating to lightering support services provided by the STS transfer segment and $4.1 million of voyage expenses incurred by the vessels that were chartered from the RSAs to perform FSL. |
| (3) | Adjustments primarily include off-hire bunker expenses, which are excluded from Average TCE per revenue day. |
| (4) | Includes $28.6 million of revenues and $19.5 million of voyage expenses related to the FSL business, which includes $2.5 million of inter-segment voyage expenses referenced in note (2) above relating to the FSL business by the STS transfer segment. |
| (5) | Excludes $4.6 million of revenues and $1.9 million of voyage expenses related to the risk-sharing agreements that were entered during the first quarter of 2019 for two time charter-in contracts that were entered during late 2018. Please read "Significant Developments in 2019 - Time Chartered-In Vessels". |
22
| Conventional Tanker Segment | ||||||||||||||||||
| Three Months Ended June 30, 2018 | ||||||||||||||||||
Revenues (1) | Voyage Expenses (2) | Adjustments (3) | TCE Revenues | Revenue Days | Average TCE per Revenue Day (3) | |||||||||||||
| (in thousands) | (in thousands) | (in thousands) | (in thousands) | |||||||||||||||
| Voyage-charter contracts - Suezmax | $80,800 | ($48,874 | ) | $146 | $32,072 | 2,516 | $12,745 | |||||||||||
Voyage-charter contracts - Aframax (4) | $53,732 | ($37,667 | ) | $226 | $16,291 | 1,345 | $12,113 | |||||||||||
| Voyage-charter contracts - LR2 | $13,242 | ($6,898 | ) | $54 | $6,398 | 590 | $10,854 | |||||||||||
| Time-charter out contracts - Suezmax | $3,958 | ($66 | ) | $23 | $3,915 | 182 | $21,508 | |||||||||||
| Time-charter out contracts - Aframax | $11,021 | ($249 | ) | $122 | $10,894 | 512 | $21,269 | |||||||||||
| Time-charter out contracts - LR2 | $2,406 | ($39 | ) | — | $2,367 | 137 | $17,214 | |||||||||||
| Total | $165,159 | ($93,793 | ) | $571 | $71,937 | 5,282 | $13,618 | |||||||||||
| (1) | Includes $3.4 million of revenue earned from the vessels that were chartered from the RSAs to perform FSL. Excludes $1.4 million of commissions and management fees earned for the management of external vessels trading in RSAs and $0.7 million of bunker commissions earned. |
| (2) | Includes $3.4 million of inter-segment voyage expenses relating to lightering support services provided by the STS transfer segment and $3.4 million of voyage expenses incurred by the vessels that were chartered from the RSAs to perform FSL. |
| (3) | Adjustments primarily include off-hire bunker expenses, which are excluded from Average TCE per revenue day. |
| (4) | Includes $27.4 million of revenues and $22.9 million of voyage expenses related to the FSL business, which includes $3.4 million of inter-segment voyage expenses referenced in note (2) above relating to the FSL business by the STS transfer segment. |
| Conventional Tanker Segment | ||||||||||||||||||
| Six Months Ended June 30, 2019 | ||||||||||||||||||
Revenues (1)(5) | Voyage Expenses (2)(5) | Adjustments (3) | TCE Revenues | Revenue Days | Average TCE per Revenue Day (3) | |||||||||||||
| (in thousands) | (in thousands) | (in thousands) | (in thousands) | |||||||||||||||
| Voyage-charter contracts - Suezmax | $183,450 | ($87,936 | ) | $3,147 | $98,661 | 4,833 | $20,415 | |||||||||||
Voyage-charter contracts - Aframax (4)(5) | $158,550 | ($80,561 | ) | $851 | $78,840 | 3,515 | $22,429 | |||||||||||
Voyage-charter contracts - LR2 (5) | $59,391 | ($29,571 | ) | $206 | $30,026 | 1,655 | $18,148 | |||||||||||
| Time-charter out contracts - Suezmax | $3,028 | ($96 | ) | $196 | $3,128 | 181 | $17,281 | |||||||||||
| Time-charter out contracts - Aframax | $1,838 | $127 | ($137 | ) | $1,828 | 75 | $24,276 | |||||||||||
| Total | $406,257 | ($198,037 | ) | $4,263 | $212,483 | 10,259 | $20,713 | |||||||||||
| (1) | Includes $6.1 million of revenue earned from the vessels that were chartered from the RSAs to perform FSL. Excludes $3.1 million of commissions and management fees earned for the management of external vessels trading in RSAs and $1.2 million of bunker commissions earned. |
| (2) | Includes $5.4 million of inter-segment voyage expenses relating to lightering support services provided by the STS transfer segment and $6.1 million of voyage expenses incurred by the vessels that were chartered from the RSAs to perform FSL. |
| (3) | Adjustments primarily include off-hire bunker expenses, which are excluded from Average TCE per revenue day. |
| (4) | Includes $46.5 million of revenues and $30.9 million of voyage expenses related to the FSL business, which includes $5.4 million of inter-segment voyage expenses referenced in note (2) above relating to the FSL business by the STS transfer segment. |
| (5) | Excludes $7.9 million of revenues and $3.5 million of voyage expenses related to the risk-sharing agreements that were entered during the first quarter of 2019 for two time charter-in contracts that were entered during late 2018. Please read "Significant Developments in 2019 - Time Chartered-In Vessels". |
23
| Conventional Tanker Segment | ||||||||||||||||||
| Six Months Ended June 30, 2018 | ||||||||||||||||||
Revenues (1) | Voyage Expenses (2) | Adjustments (3) | TCE Revenues | Revenue Days | Average TCE per Revenue Day (3) | |||||||||||||
| (in thousands) | (in thousands) | (in thousands) | (in thousands) | |||||||||||||||
| Voyage-charter contracts - Suezmax | $153,583 | ($92,264 | ) | $547 | $61,866 | 4,891 | $12,647 | |||||||||||
Voyage-charter contracts - Aframax (4) | $107,651 | ($74,324 | ) | $393 | $33,720 | 2,501 | $13,486 | |||||||||||
| Voyage-charter contracts - LR2 | $25,834 | ($13,149 | ) | $66 | $12,751 | 1,121 | $11,384 | |||||||||||
| Time-charter out contracts - Suezmax | $10,155 | ($286 | ) | $23 | $9,892 | 477 | $20,721 | |||||||||||
| Time-charter out contracts - Aframax | $23,823 | ($510 | ) | $122 | $23,435 | 1,109 | $21,137 | |||||||||||
| Time-charter out contracts - LR2 | $5,516 | ($78 | ) | — | $5,438 | 316 | $17,184 | |||||||||||
| Total | $326,562 | ($180,611 | ) | $1,151 | $147,102 | 10,415 | $14,124 | |||||||||||
| (1) | Includes $7.1 million of revenue earned from the vessels that were chartered from the RSAs to perform FSL. Excludes $2.8 million of commissions and management fees earned for the management of external vessels trading in RSAs and $1.4 million of bunker commissions earned. |
| (2) | Includes $6.6 million of inter-segment voyage expenses relating to lightering support services provided by the STS transfer segment and $7.1 million of voyage expenses incurred by the vessels that were chartered from the RSAs to perform FSL. |
| (3) | Adjustments primarily include off-hire bunker expenses, which are excluded from Average TCE per revenue day. |
| (4) | Includes $55.2 million of revenues and $44.3 million of voyage expenses related to the FSL business, which includes $6.6 million of inter-segment voyage expenses referenced in note (2) above relating to the FSL business by the STS transfer segment. |
Net Revenues. Net revenues were $95.2 million and $217.0 million for the three and six months ended June 30, 2019, respectively, compared to $73.5 million and $150.2 million for the same periods in the prior year.
The increases for the three and six months ended June 30, 2019 compared to the same periods in 2018 were primarily the result of:
| • | increases of $20.3 million and $61.7 million for the three and six months ended June 30, 2019, respectively, due to higher overall average realized spot rates by our Suezmax, Aframax and LR2 product tankers; |
| • | increases of $4.8 million and $6.6 million for the three and six months ended June 30, 2019, respectively, due to higher average realized spot FSL rates and a decrease in the cost of short-term in-charters to support FSL operations; and |
| • | increases of $4.4 million and $10.4 million for the three and six months ended June 30, 2019, respectively, primarily due to the addition of two Aframax and two LR2 in-chartered tankers that were delivered to us in the fourth quarter of 2018 and first quarter of 2019, partially offset by the redeliveries of three Aframax in-chartered tankers to their owners at various times during 2018; |
partially offset by
| • | net decreases of $5.5 million and $10.7 million for the three and six months ended June 30, 2019, respectively, due to a higher number of off-hire days and off-hire bunker expenses compared to the same periods in the prior year; and |
| • | net decreases of $2.2 million and $1.2 million for the three and six months ended June 30, 2019, respectively, primarily due to the expiry of time-charter out contracts for various vessels, which subsequently traded on spot voyages at lower average realized rates. |
Vessel Operating Expenses. Vessel operating expenses were $43.4 million and $87.7 million for the three and six months ended June 30, 2019, respectively, compared to $44.7 million and $88.5 million, for the same periods in the prior year. The decreases in vessel operating expenses were primarily due to fewer repairs and planned maintenance activities, timing of crew/manning expenses and lower fleet overhead expenditures.
Time-charter Hire Expenses. Time-charter hire expenses increased to $9.2 million and $17.2 million for the three and six months ended June 30, 2019, respectively, compared to $4.1 million and $7.4 million for the same periods in the prior year. The increases were primarily due to the addition of three Aframax and two LR2 in-chartered tankers that were delivered to us in the fourth quarter of 2018 and first quarter of 2019, partially offset by the redeliveries of three Aframax in-chartered tankers to their owners at various times during 2018.
Depreciation and Amortization. Depreciation and amortization expense was $29.8 million and $58.8 million for the three and six months ended June 30, 2019, respectively, compared to $28.5 million and $56.6 million for the same periods in the prior year. These increases were primarily due to depreciation related to capitalized dry-docking expenditures, which increased in the first half of 2019 compared to the same period in the prior year.
Ship-to-ship Transfer Segment
Our STS transfer segment consists of our lightering support services (including those services provided to our conventional tanker segment as part of FSL operations), consultancy, procurement, LNG terminal management and other related services.
24
The following table presents the operating results for our STS transfer segment for the three and six months ended June 30, 2019 and 2018:
| Three Months Ended June 30, | Six Months Ended June 30, | |||||||||||||||||
| (in thousands of U.S. dollars, except percentage changes) | 2019 | 2018 | % Change | 2019 | 2018 | % Change | ||||||||||||
Revenues (1) | 14,429 | 11,210 | 28.7 | % | 27,736 | 23,042 | 20.4 | % | ||||||||||
| Vessel operating expenses | (10,225 | ) | (7,914 | ) | 29.2 | % | (20,465 | ) | (17,193 | ) | 19.0 | % | ||||||
| Time-charter hire expenses | (1,596 | ) | (1,584 | ) | 0.8 | % | (3,074 | ) | (2,989 | ) | 2.8 | % | ||||||
| Depreciation and amortization | (896 | ) | (1,119 | ) | (19.9 | )% | (1,735 | ) | (2,364 | ) | (26.6 | )% | ||||||
| General and administrative expenses | (779 | ) | (974 | ) | (20.0 | )% | (1,598 | ) | (1,792 | ) | (10.8 | )% | ||||||
| Gain on sale of vessel | — | 170 | (100.0 | )% | — | 170 | (100.0 | )% | ||||||||||
| Restructuring charges | — | (830 | ) | 100.0 | % | — | (830 | ) | 100.0 | % | ||||||||
| Income (loss) from operations | 933 | (1,041 | ) | 189.6 | % | 864 | (1,956 | ) | 144.2 | % | ||||||||
| (1) | Includes $2.5 million and $5.4 million of revenues for the three and six months ended June 30, 2019, respectively, and $3.4 million and $6.6 million of revenues for the three and six months ended June 30, 2018, respectively, relating to lightering support services, which the STS transfer segment provided to the conventional tanker segment for FSL operations. |
Revenues. Revenues were $14.4 million and $27.7 million for the three and six months ended June 30, 2019, respectively, compared to $11.2 million and $23.0 million for the same periods in the prior year. The increases were primarily due to a new contract to provide LNG STS transfer support and equipment rental in Norway, which commenced in the fourth quarter of 2018 and completed in July 2019, as well as an LNG terminal project that generated revenues from reimbursable staff costs charged to the customer commencing in the first quarter of 2019.
Vessel Operating Expenses. Vessel operating expenses were $10.2 million and $20.5 million for the three and six months ended June 30, 2019, respectively, compared to $7.9 million and $17.2 million for the same periods in the prior year. The increases were primarily due to increases in reimbursable staff costs related to an LNG terminal project.
Depreciation and Amortization, Depreciation and amortization expense was $0.9 million and $1.7 million for the three and six months ended June 30, 2019, respectively, compared to $1.1 million and $2.4 million for the same periods last year. The decreases were primarily due to lower amortization of customer contract intangible assets and the sale of one lightering support vessel during the second quarter of 2018.
Other Operating Results
The following table compares our other operating results for the three and six months ended June 30, 2019 and 2018:
| Three Months Ended | Six Months Ended | |||||||||||
| June 30, 2019 | June 30, 2018 | June 30, 2019 | June 30, 2018 | |||||||||
| (in thousands of U.S. dollars) | $ | $ | $ | $ | ||||||||
| Interest expense | (16,607 | ) | (13,931 | ) | (33,549 | ) | (26,660 | ) | ||||
| Interest income | 221 | 160 | 586 | 318 | ||||||||
| Realized and unrealized (loss) gain on derivative instruments | (1,778 | ) | 1,116 | (2,625 | ) | 4,129 | ||||||
| Freight tax and other tax expenses | (1,639 | ) | (6,086 | ) | (4,253 | ) | (7,964 | ) | ||||
| Other income | 614 | 4,813 | 249 | 4,823 | ||||||||
Interest Expense. Interest expense was $16.6 million and $33.5 million for the three and six months ended June 30, 2019, respectively, compared to $13.9 million and $26.7 million for the same periods in the prior year. The increases of $2.7 million and $6.8 million for the three and six months, respectively, were due to the additional interest expense incurred with respect to the three sale-leaseback transactions completed in September 2018, November 2018 and May 2019.
Realized and Unrealized (Loss) Gain on Derivative Instruments. Realized and unrealized losses on interest rate swaps were $1.8 million and $2.6 million for the three and six months ended June 30, 2019, respectively, compared to realized and unrealized gains of $1.1 million and $4.1 million for the same periods in the prior year.
As at June 30, 2019, we had interest rate swap agreements with aggregate outstanding notional amounts of $269.4 million and with a weighted-average fixed rate of 1.5%.
The changes in the fair value of the interest rate swaps resulted in unrealized losses of $2.7 million and $4.5 million for the three and six months ended June 30, 2019, respectively, compared to unrealized gains of $0.4 million and $3.2 million for the same periods in the prior year, which differences were primarily due to changes in the long-term benchmark interest rates.
25
Freight Tax and Other Tax Expenses. Freight tax and other tax expenses were $1.6 million and $4.3 million for the three and six months ended June 30, 2019, respectively, compared to $6.1 million and $8.0 million for the same periods in the prior year. These decreases were primarily due to changes in our RSA structure which now benefits from treaty exemptions in certain jurisdictions, and the trading patterns of our fleet.
Other income. Other income was $0.6 million and $0.2 million for the three and six months ended June 30, 2019, respectively, compared to $4.8 million and $4.8 million for the same periods in the prior year. These decreases were primarily due to lower unrealized foreign exchange gains recognized on our estimated freight tax accruals.
Liquidity and Capital Resources
Liquidity and Cash Needs
As at June 30, 2019, we had a working capital deficiency of $41.0 million, compared to a working capital surplus of $27.8 million as at December 31, 2018. The change in working capital balance was primarily due to a decrease in our cash balance as described below, the impact of transitioning to a new RSA structure whereby RSA asset and liability balances are consolidated and an increase in current liabilities due to the recognition of operating lease liabilities as a result of our adoption of ASU 2016-02 from January 1, 2019. We expect the working capital deficit will be addressed through cash generated from operations and existing sources of liquidity.
Our primary sources of liquidity are cash and cash equivalents, cash flows provided by our operations, our undrawn credit facilities and capital raised through financing transactions. As at June 30, 2019, our total consolidated cash and cash equivalents was $35.4 million, compared to $54.9 million at December 31, 2018. Our cash balance as at June 30, 2019 decreased primarily as a result of higher net prepayments of our revolving credit facilities.
Our total consolidated liquidity, including cash and undrawn credit facilities, was $119.5 million as at June 30, 2019, compared to $66.7 million as at December 31, 2018. We anticipate that our primary sources of funds for our short-term liquidity needs will be cash flows from operations based on an expected tanker market recovery, existing cash and cash equivalents and undrawn short-term and long-term borrowings, which we believe will be sufficient to meet our existing liquidity needs for at least the next 12 months.
Two of our term loans, with an aggregate outstanding balance of $155.8 million as at June 30, 2019, are guaranteed by Teekay Corporation (or Teekay) and contain certain covenants. Please read "Item 1 - Financial Statements: Note 6 - Long-term Debt" in the notes to our consolidated financial statements. As part of our assessment of our liquidity, we have considered Teekay’s ability to comply with the covenants of these term loans for the one-year period following the issuance of our consolidated financial statements. Teekay has informed us that it expects it will comply with all required covenants and have sufficient liquidity to continue as a going concern for at least the one-year period following the issuance of Teekay’s consolidated financial statements, taking into account Teekay's recent refinancing of a substantial majority of its senior notes that were due in January 2020. Consequently, we do not expect any negative impact on our liquidity as a result of Teekay’s obligations under the two term loans.
Our short-term liquidity requirements include the payment of operating expenses, dry-docking expenditures, debt servicing costs, scheduled repayments of long-term debt, scheduled repayments of our obligations related to finance leases, as well as funding our other working capital requirements. Our short-term charters and spot market tanker operations contribute to the volatility of our net operating cash flow, and thus impact our ability to generate sufficient cash flows to meet our short-term liquidity needs. Historically, the tanker industry has been cyclical, experiencing volatility in profitability and asset values resulting from changes in the supply of, and demand for, vessel capacity. In addition, tanker spot markets historically have exhibited seasonal variations in charter rates. Tanker spot markets are typically stronger in the winter months as a result of increased oil consumption in the northern hemisphere and unpredictable weather patterns that tend to disrupt vessel scheduling.
Our long-term capital needs are primarily for capital expenditures and repayment of our loan facilities and obligations related to finance leases. Generally, we expect that our long-term sources of funds will be cash from operations, cash balances, long-term bank borrowings and other debt or equity financings. We expect that we will rely upon external financing sources, including bank borrowings and the issuance of debt and equity securities, to fund acquisitions and expansion capital expenditures, including opportunities we may pursue to purchase additional vessels.
In May 2019, we completed a $63.7 million sale-leaseback financing transaction for two of our Suezmax tankers. Each vessel is leased on a bareboat charter for nine years, with a fixed daily rate of $12,300, with purchase options throughout the lease term commencing at the end of the second year, and a purchase obligation at the end of the lease term. Proceeds from the sale-leaseback transaction were used to prepay a portion of one of our loan facilities.
Our operating lease commitments and obligations related to finance leases are described Item 1 - Financial Statements: Note 8 - Operating Leases and Obligations Related to Finance Leases, our revolving credit facilities and term loans are described in Item 1 - Financial Statements: Note 6 - Long-term Debt and our working capital loan is described in Item 1 - Financial Statements: Note 7 - Short-term Debt of this Report. Our obligations related to finance leases require us to maintain minimum levels of cash and aggregate liquidity. Our working capital loan requires us to maintain a minimum threshold of paid-in capital contribution and retained distributions of the RSA participants. Our revolving credit facilities and term loans contain covenants and other restrictions that we believe are typical of debt financing collateralized by vessels, including those that restrict the relevant subsidiaries from: incurring or guaranteeing additional indebtedness; making certain negative pledges or granting certain liens; and selling, transferring, assigning or conveying assets. In addition, an event of default of our term loans will occur if any financial indebtedness of Teekay in excess of the covenant requirement is not paid when due. In the future, some of the covenants and restrictions in our financing agreements could restrict the use of cash generated by ship-owning subsidiaries in a manner that could adversely affect our ability to pay dividends on our common stock. However, we currently do not expect that these covenants will have such an effect. Our revolving credit facilities and term loans require us to maintain financial covenants, which are described in further detail in Note 6 of our unaudited interim consolidated financial statements. If we do not meet these financial covenants, the lender may declare our obligations under the agreements immediately due and payable and terminate any further loan commitments, which would significantly affect our short-term liquidity requirements.
26
As at June 30, 2019, we were in compliance with all covenants relating to our revolving credit facilities, term loans, working capital loan and obligations related to finance leases. Teekay also advised us that, as at June 30, 2019, it was in compliance with all covenants relating to its credit facilities and term loans to which we are party.
Cash Flows
The following table summarizes our sources and uses of cash for the periods presented:
| Six Months Ended June 30, | ||||||
| 2019 | 2018 | |||||
| (in thousands of U.S. dollars) | $ | $ | ||||
| Net cash flow provided by operating activities | 64,366 | 10,470 | ||||
| Net cash flow used for financing activities | (77,546 | ) | (32,321 | ) | ||
| Net cash flow used for investing activities | (6,545 | ) | (872 | ) | ||
Operating Cash Flows
Net cash flow provided by operating activities primarily reflects fluctuations as a result of changes in realized TCE rates, changes in interest rates, fluctuations in working capital balances, the timing and the amount of dry-docking expenditures, repairs and maintenance activities, and the average number of vessels in service. Our exposure to the spot tanker market has contributed significantly to fluctuations in operating cash flows historically as a result of highly cyclical spot tanker rates.
Net cash flow provided by operating activities increased by $53.9 million for the six months ended June 30, 2019 compared to the same period in 2018. This increase was primarily due to:
| • | a net increase of $55.2 million in cash inflows primarily due to higher operating earnings resulting from higher average realized spot tanker rates, partially offset by a higher number of off-hire days and the expiry of time-charter out contracts for various vessels that subsequently traded on spot voyages at lower average realized rates; and |
| • | a net increase of $19.8 million in cash inflows due to changes in working capital; |
partially offset by
| • | an increase of $21.1 million in cash outflows relating to higher expenditures for dry-docking activities. |
Financing Cash Flows
Net cash flow used for financing activities increased by $45.2 million for the six months ended June 30, 2019 compared to the same period in 2018. The increase was primarily due to:
| • | a net increase of $123.4 million in cash outflows due to a net increase in prepayments and scheduled repayments on our term loans and revolving credit facilities and lower proceeds from the draw-down of our term loans and revolving credit facilities; and |
| • | an increase of $8.6 million in cash outflows due to scheduled payments on our obligations related to our finance leases, which we entered into in September 2018, November 2018 and May 2019; |
partially offset by
| • | an increase of $63.7 million in cash inflows due to proceeds received on the sale-leaseback financing transaction of the two Suezmax tankers in the second quarter of 2019; |
| • | a net increase of $15.0 million in cash inflows primarily due to borrowings under our working capital loan facility; and |
| • | a decrease of $8.1 million in cash outflows due to no cash dividends paid during the three and six months ended June 30, 2019. |
27
Investing Cash Flows
Net cash flow used for investing activities increased by $5.7 million for the six months ended June 30, 2019 compared to the same period in 2018. The increase was primarily due to:
| • | an increase of $4.3 million in cash outflows due to a higher amount of capital expenditures for the fleet during the six months ended June 30, 2019; |
| • | a decrease of $0.7 million in cash inflows due to the return of capital from our equity-accounted joint venture in Gemini Tankers L.L.C. in 2018; and |
| • | a decrease of $0.6 million in cash inflows due to the proceeds received from the sale of one lightering support vessel during the six months ended June 30, 2018. |
Contractual Obligations and Contingencies
The following table summarizes our long-term contractual obligations as at June 30, 2019:
| Remainder of | Beyond | ||||||||||||||||||||
| (in millions of U.S. dollars) | Total | 2019 | 2020 | 2021 | 2022 | 2023 | 2023 | ||||||||||||||
| U.S. Dollar-Denominated Obligations | |||||||||||||||||||||
Scheduled repayments of revolving facilities, term loans and other debt (1) | 164.6 | 50.8 | 101.8 | 12.0 | — | — | — | ||||||||||||||
Repayments at maturity of revolving facilities, term loans and other debt (1) | 448.3 | 15.0 | — | 402.1 | 31.2 | — | — | ||||||||||||||
Scheduled repayments of obligations related to finance leases (2) | 426.9 | 12.1 | 25.4 | 27.3 | 29.5 | 31.9 | 300.7 | ||||||||||||||
Chartered-in vessels (operating leases) (3) | 57.8 | 20.3 | 31.0 | 6.5 | — | — | — | ||||||||||||||
| Total | 1,097.6 | 98.2 | 158.2 | 447.9 | 60.7 | 31.9 | 300.7 | ||||||||||||||
| (1) | Excludes expected interest payments of $12.7 million (remainder of 2019), $21.7 million (2020), $10.5 million (2021) and $0.8 million (2022). Expected interest payments are based on the existing interest rates for variable-rate loans at LIBOR plus margins that range from 0.30% to 3.50% at June 30, 2019. The expected interest payments do not reflect the effect of related interest rate swaps that we have used to hedge certain of our floating-rate debt. |
| (2) | Excludes imputed interest payments of $16.3 million (remainder of 2019), $31.0 million (2020), $28.9 million (2021), $26.7 million (2022), $24.3 million (2023) and $76.0 million (thereafter). |
| (3) | Excludes payments required if we execute options to extend the terms of in-chartered leases signed as of June 30, 2019. If we exercise all options to extend the terms of signed in-chartered leases, we would expect total payments of $21.1 million (remainder of 2019), $36.6 million (2020), $25.5 million (2021) and $5.3 million (2022). |
Off-Balance Sheet Arrangements
We have no off-balance sheet arrangements that have, or are reasonably likely to have, a current or future material effect on our financial condition, results of operations, liquidity, capital expenditures or capital resources.
Critical Accounting Estimates
We prepare our consolidated financial statements in accordance with GAAP, which require us to make estimates in the application of our accounting policies based on our best assumptions, judgments and opinions. On a regular basis, management reviews the accounting policies, assumptions, estimates and judgments to ensure that our consolidated financial statements are presented fairly and in accordance with GAAP. However, because future events and their effects cannot be determined with certainty, actual results could differ from our assumptions and estimates, and such differences could be material. Accounting estimates and assumptions that we consider to be the most critical to an understanding of our financial statements because they inherently involve significant judgments and uncertainties are discussed in Item 5 – Operating and Financial Review and Prospects in our Annual Report on Form 20-F for the year ended December 31, 2018. There have been no significant changes to these estimates and assumptions in the six months ended June 30, 2019.
28
FORWARD-LOOKING STATEMENTS
This Report on Form 6-K for the three and six months ended June 30, 2019 contains certain forward-looking statements (as such term is defined in Section 27A of the Securities Act of 1933, as amended, and Section 21E of the Securities Exchange Act of 1934, as amended) concerning future events and our operations, performance and financial condition, including, in particular, statements regarding:
| • | the crude oil and refined product tanker market fundamentals, including the balance of supply and demand in the tanker market and the occurrence and expected timing of a tanker market recovery, estimated growth in the world tanker fleet (including for Suezmax, Aframax and LR2 tankers), estimated changes in vessel off-hire time, estimated growth in global oil demand and crude oil tanker demand, future tanker rates, future OPEC oil supply, future oil prices and production, future crude oil exports, future pipeline capacity and refinery throughput and the anticipated impact of IMO 2020 fuel regulations on tanker demand; |
| • | the expected timing of tanker deliveries; |
| • | our liquidity needs for the upcoming 12 months, including anticipated funds and sources of financing for liquidity and capital expenditure needs and the sufficiency of cash flows; |
| • | our and Teekay's compliance with, and the effect on our and Teekay's business and operating results on, covenants under our term loans and credit facilities; and |
| • | expected interest payments on our contractual obligations and the impact on our payment obligations if we exercise options to extend in-chartered leases. |
Forward-looking statements include, without limitation, any statement that may predict, forecast, indicate or imply future results, performance or achievements, and may contain the words “believe”, “anticipate”, “expect”, “estimate”, “project”, “will be”, “will continue”, “will likely result”, or words or phrases of similar meanings. These statements involve known and unknown risks and are based upon a number of assumptions and estimates that are inherently subject to significant uncertainties and contingencies, many of which are beyond our control. Actual results may differ materially from those expressed or implied by such forward-looking statements, which involve risks and uncertainties. Important factors that could cause actual results to differ materially include, but are not limited to: spot tanker market rate fluctuations; changes in vessel values; changes in price, the production of or demand for oil; changes in trading patterns significantly affecting overall vessel tonnage requirements; greater or lower than expected levels of tanker scrapping; changes in applicable industry laws and regulations and the timing of implementation of new laws and regulations; the potential for early termination of short- or medium-term contracts and our potential inability to renew or replace short- or medium- term contracts; our potential inability to implement our growth strategy; competitive factors in the markets in which we operate; loss of any customer, time-charter or vessel; our potential inability to refinance existing debt obligations or meet our going concern requirements and liquidity needs; our future capital expenditure requirements; changes in interest rates and the capital markets; future issuances of our common stock; changes in our costs, such as the cost of crews, dry-docking expenses and associated off-hire days; dry-docking delays; geopolitical tensions, increased costs; our exposure to foreign currency exchange rate fluctuations; and other factors detailed from time to time in our periodic reports filed with the SEC, including our Annual Report on Form 20-F for the year ended December 31, 2018. We do not intend to release publicly any updates or revisions to any forward-looking statements contained herein to reflect any change in our expectations with respect thereto or any change in events, conditions or circumstances on which any such statement is based.
29
TEEKAY TANKERS LTD. AND SUBSIDIARIES
June 30, 2019
PART II – OTHER INFORMATION
Item 1 – Legal Proceedings
None.
Item 1A – Risk Factors
In addition to the other information set forth in this Report on Form 6-K, you should carefully consider the risk factors discussed in Part I, “Item 3. Key Information—Risk Factors” in our Annual Report on Form 20-F for the year ended December 31, 2018, which could materially affect our business, financial condition or results of operations and the price and value of our securities.
As a Marshall Islands corporation, and with a majority of our subsidiaries being Marshall Islands entities and also having subsidiaries in other offshore jurisdictions, our operations may be subject to economic substance requirements of the European Union, which could harm our business.
Finance ministers of the European Union (or EU) rate jurisdictions for tax transparency, governance, real economic activity and corporate tax rate. Countries that do not adequately cooperate with the finance ministers are put on a “grey list” or a “blacklist”. Various countries, including the Republic of the Marshall Islands, are currently on the blacklist. Bermuda has been removed from the list. EU member states have agreed upon a set of measures, which they can choose to apply against the listed countries, including increased monitoring and audits, withholding taxes, special documentation requirements and anti-abuse provisions. The European Commission has stated it will continue to support member states' efforts to develop a more coordinated approach to sanctions for the listed countries in 2019. EU legislation prohibits EU funds from being channeled or transited through entities in countries on the blacklist. In July 2019, the Registrar of Corporations for the Republic of the Marshall Islands announced that the Republic of the Marshall Islands expects to be removed from the blacklist following the September and October meetings of the EU Code of Conduct Group and the Economic and Financial Affairs Council. However, it is not assured that such removal will occur at that time, or at all.
The effect of the EU blacklist, and any noncompliance by us with any legislation adopted by applicable countries to achieve removal from the list, could have a material adverse effect on our business, financial condition and operating results.
Item 2 – Unregistered Sales of Equity Securities and Use of Proceeds
None.
Item 3 – Defaults Upon Senior Securities
None.
Item 4 – Mine Safety Disclosures
N/A.
Item 5 – Other Information
Our 2019 Annual Meeting of Shareholders was held on June 12, 2019. The following persons were elected directors for one-year period by the votes set forth opposite their names:
| Terms of Expiring 2020 | Votes For | Votes Withheld | Votes Against | Broker Non-Votes |
| Arthur Bensler | 260,278,678 | 36,344,982 | N/A | N/A |
Sai Chu (1) | 296,623,660 | — | N/A | N/A |
| Richard T. Du Moulin | 272,572,699 | 24,050,961 | N/A | N/A |
| Kenneth Hvid | 264,394,474 | 32,229,186 | N/A | N/A |
| David Schellenberg | 292,917,004 | 3,706,656 | N/A | N/A |
(1) At the annual general meeting, the proxyholders used their authority to vote in favor of re-electing Mr. Chu to the Board for a period of one year as the original nominee was no longer a candidate.
Item 6 – Exhibits
N/A.
THIS REPORT ON FORM 6-K IS HEREBY INCORPORATED BY REFERENCE INTO THE FOLLOWING REGISTRATION STATEMENTS OF THE COMPANY.
REGISTRATION STATEMENT ON FORM S-8 (FILE NO. 333-148055) FILED WITH THE SEC ON DECEMBER 13, 2007.
REGISTRATION STATEMENT ON FORM S-8 (FILE NO. 333-194404) FILED WITH THE SEC ON MARCH 7, 2014.
REGISTRATION STATEMENT ON FORM S-8 (FILE NO. 333-223824) FILED WITH THE SEC ON MARCH 21, 2018.
30
SIGNATURE
Pursuant to the requirements of the Securities Exchange Act of 1934, the registrant has duly caused this report to be signed on its behalf by the undersigned, thereunto duly authorized.
| TEEKAY TANKERS LTD. | |||||
| Date: | August 15, 2019 | By: | /s/ Stewart Andrade | ||
Stewart Andrade Chief Financial Officer (Principal Financial and Accounting Officer) | |||||
31