EXHIBIT 99.3
PRO FORMA VALUATION REPORT
MUTUAL HOLDING COMPANY STOCK OFFERING
MALVERN FEDERAL BANCORP, INC.
Paoli, Pennsylvania
PROPOSED MID-TIER HOLDING COMPANY FOR:
MALVERN FEDERAL SAVINGS BANK
Paoli, Pennsylvania
Dated As Of:
December 7, 2007
|
|
Prepared By: |
|
|
RP® Financial, LC. |
|
|
|
RP® FINANCIAL, LC. |
|
| |
Financial Services Industry Consultants |
|
|
|
| December 7, 2007 |
|
|
| Board of Directors |
|
|
| Members of the Board of Directors: |
|
|
| At your request, we have completed and hereby provide an independent appraisal (“Appraisal”) of the estimated pro forma market value of the common stock which is to be offered in connection with the mutual-to-stock conversion transaction described below. |
|
|
| This Appraisal is furnished pursuant to the conversion regulations promulgated by the Office of Thrift Supervision (“OTS”). Specifically, this Appraisal has been prepared in accordance with the “Guidelines for Appraisal Reports for the Valuation of Savings and Loan Associations Converting from Mutual to Stock Form of Organization” as set forth by the OTS, and applicable regulatory interpretations thereof. |
|
|
| Description of Plan of Reorganization and Stock Offering |
|
|
| The Board of Directors of Malvern Federal Savings Bank (“Malvern Federal” or the “Bank”) has adopted a plan of reorganization and plan of stock issuance, pursuant to which the Bank will reorganize into a federal mutual holding company structure. As part of the plan of reorganization, the Bank will convert from a federally-chartered mutual savings bank to a federally-chartered stock savings bank and will become a wholly-owned subsidiary of Malvern Federal Bancorp, Inc. (“Bancorp”), a federally-chartered mid-tier holding corporation. Bancorp will issue a majority of its common stock to Malvern Federal Mutual Holding Company (the “MHC”), a federally-chartered mutual holding company, and sell a minority of its common stock to the public. It is anticipated that the public shares will be offered in a subscription offering to the Bank’s Eligible Account Holders, Employee Stock Ownership Plan, Supplemental Eligible Account Holders and Other Members, as such terms are defined for purposes of applicable federal regulatory requirements governing mutual-to-stock conversions. To the extent that shares remain available for purchase after satisfaction of all subscriptions received in the subscription offering, the shares may be offered for sale in a community offering and/or a syndicated community offering In addition, as part of the reorganization, the Bank will form the Malvern Federal Charitable Foundation (the “Foundation”) to further the Bank’s commitment to the local community. The Foundation will be funded with stock equal to 2% of the stock to be issued in the reorganization |
|
|
Washington Headquarters |
|
Rosslyn Center | Telephone: (703) 528-1700 |
1700 North Moore Street, Suite 2210 | Fax No.: (703) 528-1788 |
Arlington, VA 22209 | Toll-Free No.: (866) 723-0594 |
www.rpfinancial.com | E-Mail: mail@rpfinancial.com |
|
|
| Board of Directors |
|
|
| The total shares offered for sale to the public and issued to the Foundation will constitute a minority of Bancorp’s stock (49.0% or less). |
|
|
| RP® Financial, LC. |
|
|
| RP® Financial, LC. (“RP Financial”) is a financial consulting firm serving the financial services industry nationwide that, among other things, specializes in financial valuations and analyses of business enterprises and securities, including the pro forma valuation for savings institutions converting from mutual-to-stock form. The background and experience of RP Financial is detailed in Exhibit V-1. We believe that, except for the fee we will receive for our appraisal, we are independent of the Bank and the other parties engaged by the Bank to assist in the corporate reorganization and minority stock issuance process. |
|
|
| Valuation Methodology |
|
|
| In preparing our appraisal, we have reviewed the Bank’s, Bancorp’s and MHC’s regulatory applications, including the prospectus as filed with the OTS and the Securities and Exchange Commission (“SEC”). We have conducted a financial analysis of the Bank that has included due diligence related discussions with the Bank’s management; Beard Miller Company LLP, the Bank’s independent auditor; Elias, Matz, Tiernan & Herrick L.L.P., the Bank’s conversion counsel; and Stifel, Nicolaus & Company, Incorporated, which has been retained as the marketing advisor in connection with the Bank’s stock offering. All conclusions set forth in the Appraisal were reached independently from such discussions. In addition, where appropriate, we have considered information based on other available published sources that we believe are reliable. While we believe the information and data gathered from all these sources are reliable, we cannot guarantee the accuracy and completeness of such information. |
|
|
| We have investigated the competitive environment within which the Bank operates and have assessed the Bank’s relative strengths and weaknesses. We have monitored all material regulatory and legislative actions affecting financial institutions generally and analyzed the potential impact of such developments on the Bank and the industry as a whole to the extent we were aware of such matters. We have analyzed |
|
|
| Board of Directors |
|
|
| the potential effects of the stock conversion on the Bank’s operating characteristics and financial performance as they relate to the pro forma market value of Bancorp. We have reviewed the economy and demographic characteristics of the primary market area in which the Bank currently operates. We have compared the Bank’s financial performance and condition with publicly-traded thrift institutions evaluated and selected in accordance with the Valuation Guidelines, as well as all publicly-traded thrifts and thrift holding companies. We have reviewed conditions in the securities markets in general and the markets for thrifts, thrift holding companies and mutual holding companies including mutual holding company offerings. |
|
|
| The Appraisal is based on the Bank’s representation that the information contained in the regulatory applications and additional information furnished to us by the Bank and its independent auditors, legal counsel, investment bankers and other authorized agents are truthful, accurate and complete. We did not independently verify the financial statements and other information provided by the Bank, or its independent auditors, legal counsel, investment bankers and other authorized agents nor did we independently value the assets or liabilities of the Bank. The valuation considers the Bank only as a going concern and should not be considered as an indication of the Bank’s liquidation value. |
|
|
| Our appraised value is predicated on a continuation of the current operating environment for the Bank, the MHC and Bancorp and for all thrifts and their holding companies. Changes in the local and national economy, the federal and state legislative and regulatory environments for financial institutions and mutual holding companies, the stock market, interest rates, and other external forces (such as natural disasters or significant world events) may occur from time to time, often with great unpredictability, and may materially impact the value of thrift stocks as a whole or the Bank’s value alone. It is our understanding that there are no current plans for pursuing a second-step conversion or for selling control of Bancorp or the Bank following the offering. To the extent that such factors can be foreseen, they have been factored into our analysis. |
|
|
| The estimated pro forma market value is defined as the price at which Bancorp’s stock, immediately upon completion of the offering, would change hands between a willing buyer and a willing seller, neither being under any compulsion to buy or sell and both having reasonable knowledge of relevant facts. |
|
|
| Valuation Conclusion |
|
|
| It is our opinion that, as of December 7, 2007, the estimated aggregate pro forma market value of the shares to be issued immediately following the offering, including shares issued publicly as well as to the Foundation and the MHC, was $70,000,000 at the midpoint, equal to 7,000,000 shares issued at a per share value of $10.00. The Board of Directors has established a public offering range such that the public |
|
|
| Board of Directors |
|
|
| ownership of Bancorp will constitute a 43.0% ownership interest of Bancorp, excluding the issuance of the shares to the Foundation. Based on the public offering range, and inclusive of the shares issued to the Foundation, the public ownership of the shares will represent 45.0% of the shares issued, with the MHC owning the majority of the shares. Based on the foregoing valuation, the corresponding range of shares and market values based on a $10.00 per share price are as follows: |
|
|
|
|
|
|
|
|
|
|
|
|
|
|
|
| Offering |
| MHC | Foundation |
| Total |
| |||||
|
| Shares |
| Shares |
| Shares |
| Shares |
| ||||
|
|
|
|
|
| ||||||||
Shares |
|
|
|
|
|
|
|
|
|
|
|
|
|
Supermaximum |
|
| 3,980,725 |
|
| 5,091,625 |
|
| 185,150 |
|
| 9,257,500 |
|
Maximum |
|
| 3,461,500 |
|
| 4,427,500 |
|
| 161,000 |
|
| 8,050,000 |
|
Midpoint |
|
| 3,010,000 |
|
| 3,850,000 |
|
| 140,000 |
|
| 7,000,000 |
|
Minimum |
|
| 2,558,500 |
|
| 3,272,500 |
|
| 119,000 |
|
| 5,950,000 |
|
|
|
|
|
|
|
|
|
|
|
|
|
|
|
Market Value |
|
|
|
|
|
|
|
|
|
|
|
|
|
Supermaximum |
| $ | 39,807,250 |
| $ | 50,916,250 |
| $ | 1,851,500 |
| $ | 92,575,000 |
|
Maximum |
|
| 34,615,000 |
|
| 44,275,000 |
|
| 1,610,000 |
|
| 80,500,000 |
|
Midpoint |
|
| 30,100,000 |
|
| 38,500,000 |
|
| 1,400,000 |
|
| 70,000,000 |
|
Minimum |
|
| 25,585,000 |
|
| 32,725,000 |
|
| 1,190,000 |
|
| 59,500,000 |
|
|
|
| Limiting Factors and Considerations |
|
|
| The valuation is not intended, and must not be construed, as a recommendation of any kind as to the advisability of purchasing shares of the common stock. Moreover, because such valuation is determined in accordance with applicable OTS regulatory guidelines and is necessarily based upon estimates and projections of a number of matters, all of which are subject to change from time to time, no assurance can be given that persons who purchase shares of common stock in the conversion will thereafter be able to buy or sell such shares at prices related to the foregoing valuation of the estimated pro forma market value thereof. The appraisal reflects only a valuation range as of this date for the pro forma market value of Bancorp immediately upon issuance of the stock and does not take into account any trading activity with respect to the purchase and sale of common stock in the secondary market on the date of issuance of such securities or at anytime thereafter following the completion of the public stock offering. |
|
|
| The valuation prepared by RP Financial in accordance with applicable OTS regulatory guidelines was based on the financial condition and operations of the Bank as of September 30, 2007, the date of the financial data included in the prospectus. |
|
|
| Board of Directors |
|
|
| RP Financial is not a seller of securities within the meaning of any federal and state securities laws and any report prepared by RP Financial shall not be used as an offer or solicitation with respect to the purchase or sale of any securities. RP Financial maintains a policy which prohibits RP Financial, its principals or employees from purchasing stock of its financial institution clients. |
|
|
| The valuation will be updated as provided for in the OTS conversion regulations and guidelines. These updates will consider, among other things, any developments or changes in the financial performance and condition of Bancorp, management policies, and current conditions in the equity markets for thrift stocks, both existing issues and new issues. These updates may also consider changes in other external factors which impact value including, but not limited to: various changes in the federal and state legislative and regulatory environments for financial institutions, the stock market and the market for thrift stocks, and interest rates. Should any such new developments or changes be material, in our opinion, to the valuation of the shares, appropriate adjustments to the estimated pro forma market value will be made. The reasons for any such adjustments will be explained in the update at the date of the release of the update. |
|
|
| Respectfully submitted, |
|
|
| RP® FINANCIAL, LC. |
|
|
| /s/ Ronald S. Riggins |
| President and Managing Director |
|
|
| /s/ Gregory E. Dunn |
|
|
RP® Financial, LC. | TABLE OF CONTENTS |
| i |
TABLE OF CONTENTS
MALVERN FEDERAL BANCORP, INC.
Paoli, Pennsylvania
|
|
|
|
DESCRIPTION |
| PAGE | |
| |||
|
|
|
|
|
| ||
|
|
|
|
| I.1 | ||
| I.1 | ||
| I.2 | ||
| I.5 | ||
| I.9 | ||
| I.13 | ||
| I.14 | ||
| I.18 | ||
| I.18 | ||
| I.19 | ||
| I.20 | ||
|
|
|
|
|
| ||
|
|
|
|
| II.1 | ||
| II.3 | ||
| II.7 | ||
| II.8 | ||
| II.13 | ||
| II.13 | ||
|
|
|
|
|
| ||
|
|
|
|
| III.1 | ||
| III.2 | ||
| III.3 | ||
| III.6 | ||
| III.9 | ||
| III.12 | ||
| III.14 | ||
| III.16 | ||
| III.16 | ||
|
|
RP® Financial, LC. | TABLE OF CONTENTS |
| ii |
TABLE OF CONTENTS
MALVERN FEDERAL BANCORP, INC.
Paoli, Pennsylvania
(continued)
|
|
|
|
|
|
|
|
DESCRIPTION |
|
| PAGE | ||||
|
| ||||||
|
|
| |||||
|
| ||||||
|
|
|
| ||||
|
| IV.1 | |||||
|
| IV.1 | |||||
|
| IV.2 | |||||
|
| IV.3 | |||||
|
|
| IV.3 | ||||
|
|
| IV.5 | ||||
|
|
| IV.7 | ||||
|
|
| IV.7 | ||||
|
|
| IV.8 | ||||
|
|
| IV.9 | ||||
|
|
| IV.10 | ||||
|
|
|
| IV.10 | |||
|
|
|
| IV.17 | |||
|
|
|
| IV.19 | |||
|
|
| IV.21 | ||||
|
|
| IV.21 | ||||
|
| IV.21 | |||||
|
| IV.22 | |||||
|
| IV.23 | |||||
|
|
| IV.26 | ||||
|
|
| IV.30 | ||||
|
|
| IV.31 | ||||
|
| IV.31 | |||||
|
| IV.32 | |||||
|
|
RP® Financial, LC. | LIST OF TABLES |
| iii |
LIST OF TABLES
MALVERN FEDERAL BANCORP, INC.
Paoli, Pennsylvania
|
|
|
|
|
TABLE |
| DESCRIPTION | PAGE | |
| ||||
|
|
|
|
|
|
| I.6 | ||
|
| I.10 | ||
|
|
|
|
|
|
| II.2 | ||
|
| II.9 | ||
|
| II.10 | ||
|
| II.11 | ||
|
| II.13 | ||
|
| II.14 | ||
|
| II.15 | ||
|
|
|
|
|
|
| III.5 | ||
|
| III.7 | ||
|
| III.10 | ||
|
| III.13 | ||
| Interest Rate Risk Measures and Net Interest Income Volatility |
| III.15 | |
|
| III.17 | ||
|
|
|
|
|
|
| IV.8 | ||
|
| IV.18 | ||
|
| IV.20 | ||
|
| IV.24 | ||
|
| IV.28 | ||
|
| IV.29 | ||
|
|
RP® Financial, LC. | OVERVIEW AND FINANCIAL ANALYSIS |
| I.1 |
I. OVERVIEW AND FINANCIAL ANALYSIS
Malvern Federal Savings Bank (“Malvern Federal” or the “Bank”), chartered in 1887, is a federally-chartered savings bank headquartered in Paoli, Pennsylvania. The Bank serves the Philadelphia-Camden-Wilmington metropolitan area (“Philadelphia MSA”) through its main office in Paoli and six financial centers (“branch offices”), all of which are located in Chester County, Pennsylvania. A map of the Bank’s branch offices is provided in Exhibit I-1. The Bank is a member of the Federal Home Loan Bank (“FHLB”) system, and its deposits are insured up to the regulatory maximums by the Federal Deposit Insurance Corporation (“FDIC”). At September 30, 2007, the Bank had $551.9 million in assets, $433.5 million in deposits and total equity of $44.0 million, equal to 8.0% of total assets. The Bank’s audited financial statements are incorporated by reference as Exhibit I-2.
The Board of Directors of the Bank adopted the plan of reorganization and the plan of stock issuance to reorganize from the mutual form of organization to the mutual holding company form of organization. Pursuant to the reorganization, (1) the Bank will become a wholly-owned subsidiary of Malvern Federal Bancorp, Inc. (“Bancorp”), a federally-chartered mid-tier holding corporation, and (2) Bancorp will issue the majority percentage of its common stock to Malvern Federal Mutual Holding Company (the “MHC”), a federally-chartered mutual holding company, and (3) Bancorp will sell the minority percentage of its common stock to the public. The MHC will own a controlling interest in Bancorp of at least 51%, and Bancorp will be the sole subsidiary of the MHC. Bancorp will own 100% of the Bank’s outstanding stock.
Concurrent with the reorganization, Bancorp will retain up to 50% of the net stock proceeds. At the present time, it is not anticipated that the MHC or Bancorp will engage in any business activity other than ownership of their respective subsidiaries, investment of stock proceeds that are retained by Bancorp (initially in short-term investment
|
|
RP® Financial, LC. | OVERVIEW AND FINANCIAL ANALYSIS |
| I.2 |
securities) and Bancorp extending a loan to the Bank’s newly-formed employee stock ownership plan (“ESOP”). Subsequent activities of Bancorp may include payment of regular or special dividends, acquisitions of other financial institutions or financial service providers and/or stock repurchases.
The plan of reorganization provides for the establishment of the Malvern Federal Charitable Foundation (the “Foundation”), which will be funded with stock equal to 2.0% of the total shares to be outstanding. The Foundation will be dedicated to assist the communities and organization’s within the Bank’s market area beyond community development and lending and will enhance the Bank’s current activities under the Community Reinvestment Act (“CRA”).
Malvern Federal maintains a local community banking emphasis, with a primary strategic objective of meeting the borrowing and savings needs of its local customer base. Historically, Malvern Federal’s operating strategy has been fairly reflective of a traditional thrift operating strategy in which 1-4 family residential mortgage loans and retail deposits have constituted the principal components of the Bank’s assets and liabilities, respectively. Beyond 1-4 family permanent mortgage loans, the Bank’s lending activities include diversification into commercial real estate, construction, commercial business, and consumer loans. Pursuant to the Bank’s current strategic plan, Malvern Federal will continue to emphasize 1-4 family lending and will also continue to pursue lending diversification in which growth of commercial real estate loans will continue to be emphasized as the primary area of lending diversification.
Investments serve as a supplement to the Bank’s lending activities and the investment portfolio is considered to be indicative of a low risk investment philosophy. The Bank’s investments include a mix of U.S. Government and agency securities, mortgage-backed securities, trust preferred securities, municipal bonds and FHLB stock.
|
|
RP® Financial, LC. | OVERVIEW AND FINANCIAL ANALYSIS |
| I.3 |
The Bank’s lending and investment strategies have supported management of credit risk exposure, as evidenced by favorable credit quality measures for non-performing assets and credit quality related losses. Malvern Federal is not a subprime lender and does not hold any investments in high risk collateralized debt obligations (“CDOs”). During fiscal 2007, the Bank established a relatively high amount of loan loss provisions which was mostly related to a $3.5 million commercial real estate loan that became delinquent in the fourth quarter of fiscal year 2007.
Retail deposits have consistently served as the primary interest-bearing funding source for the Bank. The deposit base is concentrated in time deposits, which are locally generated deposits. Malvern Federal does not maintain any brokered certificate of deposits (“CDs”). Growth of transaction accounts and, in particular, growth of checking account deposits has been targeted as an area of emphasis in the Bank’s business plan. The Bank utilizes borrowings as a supplemental funding source to facilitate management of funding costs and interest rate risk. FHLB advances currently account for all of the Bank’s borrowings, which consist of a mix of variable and fixed rate advances with maturities out to 2011.
Malvern Federal’s earnings base is largely dependent upon net interest income and operating expense levels. In general, the Bank’s operating strategy has provided for a stronger net margin, as asset growth sustained by loan growth has served to increase the overall yield earned on interest-earning assets relative to funding cost increases and, in turn, support wider yield-cost spreads. However, due largely to interest rate spread compression resulting from the flat and inverted yield curve, the Bank’s net interest margin declined in fiscal 2007. A steady trend of asset growth and a relatively non-diversified operating strategy has supported effective containment of the Bank’s operating expenses, as implied by operating expense ratios that have been maintained at less than 2.0% of assets. While the Bank’s relatively streamlined operating strategy has helped to contain operating expenses, it has also limited revenues generated non-interest sources of income. Most of the Bank’s non-interest income is generated through fees and service charges on deposit accounts.
|
|
RP® Financial, LC. | OVERVIEW AND FINANCIAL ANALYSIS |
| I.4 |
The post-offering business plan of the Bank is expected to continue to focus on operating and growing a profitable institution serving retail customers and small businesses in local markets. Accordingly, Malvern Federal will continue to be an independent community-oriented financial institution with a commitment to meeting the retail and commercial banking needs of individuals and businesses in Chester County and throughout the Philadelphia MSA area. In addition, the Bank will seek to implement strategies that will support growth of the Bank, through expansion of market area and diversification of products and services.
The Bank’s Board of Directors has elected to complete a public stock offering to improve the competitive position of Malvern Federal. The capital realized from the minority stock offering will increase the operating flexibility and overall financial strength of Malvern Federal. The additional capital realized from stock proceeds will increase liquidity to support funding of future loan growth and other interest-earning assets. Malvern Federal’s higher capital position resulting from the infusion of stock proceeds will also serve to reduce interest rate risk, particularly through enhancing the Bank’s interest-earning-assets-to-interest-bearing-liabilities (“IEA/IBL”) ratio. The additional funds realized from the stock offering will provide an alternative funding source to deposits and borrowings in meeting the Bank’s future funding needs, which may facilitate a reduction in Malvern Federal’s funding costs. Additionally, Malvern Federal’s higher equity-to-assets ratio will also better position the Bank to take advantage of expansion opportunities as they arise. Such expansion would most likely occur through the establishment or acquisition of additional banking offices or customer facilities that would increase market penetration in the markets currently served by the Bank or to gain a market presence into nearby complementary markets. The Bank will also be bettered position to pursue growth through acquisition of other financial service providers following the stock offering, given its strengthened capital position. At this time, the Bank has no specific plans for expansion other than through establishing additional branches. The projected uses of proceeds are highlighted below.
|
|
|
| o | MHC. The Bank intends to capitalize the MHC with $100,000 of cash. The primary activity of the MHC will be ownership of the majority interest |
|
|
RP® Financial, LC. | OVERVIEW AND FINANCIAL ANALYSIS |
| I.5 |
|
|
|
|
| in the Company. The MHC funds will be held in low risk liquid instruments. |
|
|
|
| o | Bancorp. Bancorp is expected to retain up to 50% of the net offering proceeds. At present, funds at the mid-tier holding company level, net of the loan to the ESOP, are expected to be primarily invested initially into short-term investment grade securities. Over time, the funds may be utilized for various corporate purposes, possibly including acquisitions, infusing additional equity into the Bank, repurchases of common stock, and the payment of regular and/or special cash dividends. |
|
|
|
| o | Malvern Federal. Approximately 50% of the net stock proceeds will be infused into the Bank in exchange for all of the Bank’s newly issued stock. Cash proceeds (i.e., net proceeds less deposits withdrawn to fund stock purchases) infused into the Bank are anticipated to become part of general operating funds, and are expected to be primarily utilized to fund loan growth. |
Overall, it is the Bank’s objective to pursue growth that will serve to increase returns, while, at the same time, growth will not be pursued that could potentially compromise the overall risk associated with Malvern Federal’s operations.
Table 1.1 shows the Bank’s historical balance sheet data for the past five fiscal years. From September 30, 2003 through September 30, 2007, Malvern Federal’s assets increased at a 4.7% annual rate. Asset growth was largely sustained by loan growth, which was funded with a combination of deposits and borrowings as well as redeployment of cash and investments. A summary of Malvern Federal’s key operating ratios for the past fiscal years is presented in Exhibit I-3.
Malvern Federal’s loans receivable portfolio increased at a 12.1% annual rate from year fiscal end 2003 through fiscal year end 2007, with the portfolio exhibiting positive growth throughout the period. The Bank’s stronger loan growth rate compared to its asset growth rate served to increase the loans-to-assets ratio from 64.3% at fiscal year end 2003 to 84.5% at fiscal year end 2007. While 1-4 family permanent mortgage loans represent the largest concentration in the Bank’s loan portfolio, Malvern Federal’s emphasis on implementation of a diversified lending strategy is evidenced by recent trends in the loan portfolio. Trends in the Bank’s loan portfolio composition over the
|
|
RP® Financial, LC. | OVERVIEW AND FINANCIAL ANALYSIS |
Table 1.1
Malvern Federal Savings Bank
Historical Balance Sheet Data
|
|
|
|
|
|
|
|
|
|
|
|
|
|
|
|
|
|
|
|
|
|
|
|
|
|
|
|
|
|
|
|
|
|
|
|
|
|
|
|
|
|
|
|
|
|
|
|
|
|
|
|
|
|
|
|
|
|
|
|
|
|
|
|
|
|
| 9/30/03- |
| |
|
|
|
|
|
|
|
|
|
|
|
|
|
|
|
|
|
|
|
|
|
|
|
|
|
|
|
|
|
|
|
|
| ||
|
|
|
| |||||||||||||||||||||||||||||||
|
| 2003 |
| 2004 |
| 2005 |
| 2006 |
| 2007 |
|
| ||||||||||||||||||||||
|
|
|
|
|
|
|
| |||||||||||||||||||||||||||
|
| Amount |
| Pct(1) |
| Amount |
| Pct(1) |
| Amount |
| Pct(1) |
| Amount |
| Pct(1) |
| Amount |
| Pct(1) |
| Pct |
| |||||||||||
|
|
|
|
|
|
|
|
|
|
|
|
| ||||||||||||||||||||||
|
| ($000) |
| (%) |
| ($000) |
| (%) |
| ($000) |
| (%) |
| ($000) |
| (%) |
| ($000) |
| (%) |
| (%) |
| |||||||||||
|
|
|
|
|
|
|
|
|
|
|
|
|
|
|
|
|
|
|
|
|
|
|
|
|
|
|
|
|
|
|
|
|
|
|
Total Amount of: |
|
|
|
|
|
|
|
|
|
|
|
|
|
|
|
|
|
|
|
|
|
|
|
|
|
|
|
|
|
|
|
|
|
|
Assets |
| $ | 459,849 |
|
| 100.00 | % | $ | 457,941 |
|
| 100.00 | % | $ | 487,266 |
|
| 100.00 | % | $ | 516,959 |
|
| 100.00 | % | $ | 551,932 |
|
| 100.00 | % |
| 4.67 | % |
Cash and cash equivalents |
|
| 46,530 |
|
| 10.12 | % |
| 10,816 |
|
| 2.36 | % |
| 5,487 |
|
| 1.13 | % |
| 7,032 |
|
| 1.36 | % |
| 18,967 |
|
| 3.44 | % |
| -20.10 | % |
Investment securities |
|
| 100,809 |
|
| 21.92 | % |
| 67,296 |
|
| 14.70 | % |
| 42,220 |
|
| 8.66 | % |
| 29,757 |
|
| 5.76 | % |
| 30,577 |
|
| 5.54 | % |
| -25.79 | % |
Loans receivable, net |
|
| 295,518 |
|
| 64.26 | % |
| 356,633 |
|
| 77.88 | % |
| 414,684 |
|
| 85.10 | % |
| 455,813 |
|
| 88.17 | % |
| 466,192 |
|
| 84.47 | % |
| 12.07 | % |
FHLB Stock |
|
| 4,532 |
|
| 0.99 | % |
| 4,427 |
|
| 0.97 | % |
| 4,326 |
|
| 0.89 | % |
| 4,754 |
|
| 0.92 | % |
| 4,560 |
|
| 0.83 | % |
| 0.15 | % |
Bank-Owned Life Insurance |
|
| 0 |
|
| 0.00 | % |
| 5,308 |
|
| 1.16 | % |
| 5,515 |
|
| 1.13 | % |
| 5,716 |
|
| 1.11 | % |
| 7,787 |
|
| 1.41 | % |
| NM |
|
Deposits |
| $ | 355,627 |
|
| 77.34 | % | $ | 364,910 |
|
| 79.68 | % | $ | 385,045 |
|
| 79.02 | % | $ | 402,078 |
|
| 77.78 | % | $ | 433,488 |
|
| 78.54 | % |
| 5.07 | % |
FHLB advances, other borrowed funds |
|
| 67,641 |
|
| 14.71 | % |
| 55,390 |
|
| 12.10 | % |
| 61,500 |
|
| 12.62 | % |
| 70,870 |
|
| 13.71 | % |
| 71,387 |
|
| 12.93 | % |
| 1.36 | % |
|
|
|
|
|
|
|
|
|
|
|
|
|
|
|
|
|
|
|
|
|
|
|
|
|
|
|
|
|
|
|
|
|
|
|
Equity |
| $ | 34,960 |
|
| 7.60 | % | $ | 35,996 |
|
| 7.86 | % | $ | 38,311 |
|
| 7.86 | % | $ | 41,166 |
|
| 7.96 | % | $ | 44,039 |
|
| 7.98 | % |
| 5.94 | % |
|
|
|
|
|
|
|
|
|
|
|
|
|
|
|
|
|
|
|
|
|
|
|
|
|
|
|
|
|
|
|
|
|
|
|
Loans/Deposits |
|
|
|
|
| 83.10 | % |
|
|
|
| 97.73 | % |
|
|
|
| 107.70 | % |
|
|
|
| 113.36 | % |
|
|
|
| 107.54 | % |
|
|
|
|
|
|
|
|
|
|
|
|
|
|
|
|
|
|
|
|
|
|
|
|
|
|
|
|
|
|
|
|
|
|
|
|
|
|
Offices Open |
|
| 6 |
|
|
|
|
| 7 |
|
|
|
|
| 7 |
|
|
|
|
| 7 |
|
|
|
|
| 7 |
|
|
|
|
|
|
|
(1) Ratios are as a percent of ending assets.
Sources: Malvern Federal’s prospectus, audited and unaudited financial statements and RP Financial calculations.
RP® Financial, LC. | OVERVIEW AND FINANCIAL ANALYSIS |
past five fiscal years show that the concentration of 1-4 family loans comprising total loans decreased from 59.5% of total loans at fiscal year end 2003 to 40.4% of total loans at fiscal year end 2007. The decrease in the ratio of 1-4 family loans comprising total loans since year fiscal year end 2003 was the result of comparatively stronger growth of other areas of lending, which was in part related to the Bank’s general philosophy of selling longer term 1-4 family fixed rate loans for purposes of interest rate risk management. Since fiscal year end 2003, lending diversification by the Bank has been mostly in the areas of commercial real estate loans, consumer loans and construction loans. From fiscal year end 2003 through fiscal year end 2007, commercial real estate loans (inclusive of multi-family loans) increased from 15.4% to 23.2% of total loans, consumer loans increased from 12.6% to 19.3% of total loans and construction loans increased from 3.9% to 12.4% of total loans. Other areas of lending diversification for Malvern Federal include land loans, which decreased from 2.2% to 1.4% of total loans from fiscal year end 2003 through fiscal year end 2007, and commercial business loans, which decreased from 6.4% to 3.3% of total loans from fiscal year end 2003 through fiscal year end 2007.
The intent of the Bank’s investment policy is to provide adequate liquidity and to generate a favorable return within the context of supporting Malvern Federal’s overall credit and interest rate risk objectives. It is anticipated that proceeds retained at the holding company level will primarily be invested into investments with short-term maturities. Over the past five fiscal years, the Bank’s level of cash and investment securities (inclusive of FHLB stock) ranged from a high of 33.0% of assets at fiscal year end 2003 to a low of 8.0% of assets at fiscal year end 2006. Cash and investments equaled 9.8% of assets at fiscal year end 2007. The general downward trend in the level of cash and investments maintained by the Bank reflects the redeployment of liquidity and cash flow realized from maturing or the sale of investments into loan growth. Mortgage-backed securities comprise the most significant component of the Bank’s investment portfolio, with the portfolio consisting of pass-through securities guaranteed or insured by Government Sponsored Enterprises (“GSEs”). Mortgage-backed securities are generally purchased as a means to deploy excess liquidity at more favorable yields than other investment alternatives that are consistent with
|
|
RP® Financial, LC. | OVERVIEW AND FINANCIAL ANALYSIS |
Malvern Federal’s investment philosophy. As of September 30, 2007, the mortgage-backed securities portfolio totaled $13.7 million, in which $12.2 million of the portfolio was classified as available for sale and $1.5 million of the portfolio was classified as held to maturity. As of September 30, 2007, the net unrealized loss on the available for sale mortgage-backed securities portfolio equaled $356,000.
Beyond the Bank’s investment in mortgage-backed securities, investment securities held by the Bank at September 30, 2007 consisted of U.S. Government and agency securities ($13.0 million), municipal bonds ($2.9 million) and trust preferred securities ($913,000). The Bank also held $19.0 million of cash and cash equivalents and $4.6 million of FHLB stock at September 30, 2007. Investment securities are maintained as available for sale. As of September 30, 2007, the net unrealized loss on the investment portfolio equaled $105,000. Exhibit I-4 provides historical detail of the Bank’s investment and mortgage-backed securities portfolios.
The Bank also maintains an investment in bank-owned life insurance (“BOLI”) policies, which cover the lives of some of the Bank’s employees and directors. The purpose of the investment is to provide funding for the benefit plans of the covered individuals. The life insurance policies earn tax-exempt income through cash value accumulation and death proceeds. As of September 30, 2007, the cash surrender value of the Bank’s BOLI equaled $7.8 million.
Over the past five fiscal years, Malvern Federal’s funding needs have been largely addressed through retail deposits and internal cash flows, with supplemental funding provided by borrowings and retained earnings. From fiscal year end 2003 through fiscal year end 2007, the Bank’s deposits increased at an annual rate of 5.1%. Positive deposit growth was sustained throughout the period covered in Table 1.1, with the most significant growth occurring in fiscal 2007. Deposits as a percent of assets have been maintained at slightly below 80% of assets through the past five fiscal years and equaled 78.5% of asset at fiscal year end 2007. CDs have consistently accounted for the major portion of the Company’s deposit composition and equaled 61.9% of total deposits at fiscal year end 2007, versus 63.8% of total deposits at fiscal year end 2005. A comparatively strong growth rate for the Bank’s transaction and savings account
|
|
RP® Financial, LC. | OVERVIEW AND FINANCIAL ANALYSIS |
deposits facilitated the reduction in the concentration of time deposits comprising total deposits since fiscal year end 2005.
Borrowings serve as an alternative funding source for the Bank to address funding needs for growth and to support management of deposit costs and interest rate risk. Malvern Federal’s utilization of borrowings has been fairly stable over the past five fiscal years, ranging from a low of $55.4 million or 12.1% of assets at fiscal year end 2004 to a high of $71.4 million or 12.9% of assets at fiscal year end 2007. Borrowings held by the Bank consist primarily of long-term FHLB advances with terms out to five years and, to a lesser extent, the Bank’s utilization of borrowings includes short-term FHLB advances.
Since fiscal year end 2003, retention of earnings and the adjustment for accumulated other comprehensive income translated into an annual capital growth rate of 5.9% for the Bank. Capital growth slightly outpaced the Bank’s asset growth rate, as Malvern Federal’s equity-to-assets ratio increased from 7.6% at fiscal year end 2003 to 8.0% at fiscal year end 2007. All of the Bank’s capital is tangible capital, and the Bank maintained capital surpluses relative to all of its regulatory capital requirements at September 30, 2007. The addition of stock proceeds will serve to strengthen the Bank’s capital position, as well as support growth opportunities. At the same time, as the result of the significant increase that will be realized in the Bank’s pro forma capital position, Malvern Federal’s ROE can be expected to initially decline from current returns
Table 1.2 shows the Bank’s historical income statements for the past five fiscal years. The Bank reported positive earnings over the past five years, ranging from a low of 0.34% of average assets during fiscal 2003 to a high of 0.64% of average assets during fiscal 2006. For fiscal 2007, the Bank reported net income of $2.4 million for a return on average assets of 0.45%. Net interest income and operating expenses represent the primary components of the Bank’s earnings. Non-interest operating income has been somewhat of limited contributor to the Bank’s earnings, consisting primarily of service fees and charges. Favorable credit quality measures have generally
|
|
RP®Financial, LC. | OVERVIEW AND FINANCIAL ANALYSIS |
Table 1.2
Malvern Federal Savings Bank
Historical Income Statements
|
|
|
|
|
|
|
|
|
|
|
|
|
|
|
|
|
|
|
|
|
|
|
|
|
|
|
|
|
|
|
|
|
| For the Fiscal Year Ended September 30, |
| ||||||||||||||||||||||||||||
|
|
| |||||||||||||||||||||||||||||
|
| 2003 |
| 2004 |
| 2005 |
| 2006 |
| 2007 |
| ||||||||||||||||||||
|
|
|
|
|
|
| |||||||||||||||||||||||||
|
| Amount |
| Pct(1) |
| Amount |
| Pct(1) |
| Amount |
| Pct(1) |
| Amount |
| Pct(1) |
| Amount |
| Pct(1) |
| ||||||||||
|
|
|
|
|
|
|
|
|
|
|
| ||||||||||||||||||||
|
| ($000) |
| (%) |
| ($000) |
| (%) |
| ($000) |
| (%) |
| ($000) |
| (%) |
| ($000) |
| (%) |
| ||||||||||
|
|
|
|
|
|
|
|
|
|
|
|
|
|
|
|
|
|
|
|
|
| ||||||||||
Interest income |
| $ | 23,782 |
|
| 5.29 | % | $ | 22,629 |
|
| 4.93 | % | $ | 25,426 |
|
| 5.38 | % | $ | 30,159 |
|
| 6.02 | % | $ | 32,769 |
|
| 6.11 | % |
Interest expense |
|
| (14,506 | ) |
| -3.23 | % |
| (13,184 | ) |
| -2.87 | % |
| (13,710 | ) |
| -2.90 | % |
| (16,503 | ) |
| -3.30 | % |
| (19,235 | ) |
| -3.59 | % |
|
|
|
|
|
|
|
|
|
|
|
| ||||||||||||||||||||
Net interest income |
| $ | 9,276 |
|
| 2.06 | % | $ | 9,445 |
|
| 2.06 | % | $ | 11,716 |
|
| 2.48 | % | $ | 13,656 |
|
| 2.73 | % | $ | 13,534 |
|
| 2.52 | % |
Provision for loan losses |
|
| (61 | ) |
| -0.01 | % |
| (60 | ) |
| -0.01 | % |
| (290 | ) |
| -0.06 | % |
| (451 | ) |
| -0.09 | % |
| (1,298 | ) |
| -0.24 | % |
|
|
|
|
|
|
|
|
|
|
|
| ||||||||||||||||||||
Net interest income after provisions |
| $ | 9,215 |
|
| 2.05 | % | $ | 9,385 |
|
| 2.04 | % | $ | 11,426 |
|
| 2.42 | % | $ | 13,205 |
|
| 2.64 | % | $ | 12,236 |
|
| 2.28 | % |
|
|
|
|
|
|
|
|
|
|
|
|
|
|
|
|
|
|
|
|
|
|
|
|
|
|
|
|
|
|
|
|
Other operating income |
| $ | 1,087 |
|
| 0.24 | % | $ | 1,011 |
|
| 0.22 | % | $ | 1,376 |
|
| 0.29 | % | $ | 1,425 |
|
| 0.28 | % | $ | 1,461 |
|
| 0.27 | % |
Operating expense |
|
| (8,304 | ) |
| -1.85 | % |
| (8,094 | ) |
| -1.76 | % |
| (9,197 | ) |
| -1.95 | % |
| (9,763 | ) |
| -1.95 | % |
| (10,154 | ) |
| -1.89 | % |
|
|
|
|
|
|
|
|
|
|
|
| ||||||||||||||||||||
Net operating income |
| $ | 1,998 |
|
| 0.44 | % | $ | 2,302 |
|
| 0.50 | % | $ | 3,605 |
|
| 0.76 | % | $ | 4,867 |
|
| 0.97 | % | $ | 3,543 |
|
| 0.66 | % |
|
|
|
|
|
|
|
|
|
|
|
|
|
|
|
|
|
|
|
|
|
|
|
|
|
|
|
|
|
|
|
|
Non-Operating Income |
|
|
|
|
|
|
|
|
|
|
|
|
|
|
|
|
|
|
|
|
|
|
|
|
|
|
|
|
|
|
|
Gain(loss) on sale of investments |
| $ | 91 |
|
| 0.02 | % | $ | 10 |
|
| 0.00 | % | ($ | 231 | ) |
| -0.05 | % | $ | 24 |
|
| 0.00 | % | ($ | 8 | ) |
| 0.00 | % |
Gain(loss) on sale of loans |
|
| 0 |
|
| 0.00 | % |
| 26 |
|
| 0.01 | % |
| 240 |
|
| 0.05 | % |
| 102 |
|
| 0.02 | % |
| 0 |
|
| 0.00 | % |
Gain(loss) on sale of other assets |
|
| 0 |
|
| 0.00 | % |
| (28 | ) |
| -0.01 | % |
| 0 |
|
| 0.00 | % |
| 0 |
|
| 0.00 | % |
| 0 |
|
| 0.00 | % |
|
|
|
|
|
|
|
|
|
|
|
| ||||||||||||||||||||
Net non-operating income |
| $ | 91 |
|
| 0.02 | % | $ | 8 |
|
| 0.00 | % | $ | 9 |
|
| 0.00 | % | $ | 126 |
|
| 0.03 | % | ($ | 8 | ) |
| 0.00 | % |
|
|
|
|
|
|
|
|
|
|
|
|
|
|
|
|
|
|
|
|
|
|
|
|
|
|
|
|
|
|
|
|
Net income before tax |
| $ | 2,089 |
|
| 0.46 | % | $ | 2,310 |
|
| 0.50 | % | $ | 3,614 |
|
| 0.76 | % | $ | 4,993 |
|
| 1.00 | % | $ | 3,535 |
|
| 0.66 | % |
Income tax provision |
|
| (561 | ) |
| -0.12 | % |
| (703 | ) |
| -0.15 | % |
| (1,109 | ) |
| -0.23 | % |
| (1,788 | ) |
| -0.36 | % |
| (1,123 | ) |
| -0.21 | % |
|
|
|
|
|
|
|
|
|
|
|
| ||||||||||||||||||||
Net income (loss) |
| $ | 1,528 |
|
| 0.34 | % | $ | 1,607 |
|
| 0.35 | % | $ | 2,505 |
|
| 0.53 | % | $ | 3,205 |
|
| 0.64 | % | $ | 2,412 |
|
| 0.45 | % |
|
|
|
|
|
|
|
|
|
|
|
|
|
|
|
|
|
|
|
|
|
|
|
|
|
|
|
|
|
|
|
|
Adjusted Earnings |
|
|
|
|
|
|
|
|
|
|
|
|
|
|
|
|
|
|
|
|
|
|
|
|
|
|
|
|
|
|
|
Net income |
| $ | 1,528 |
|
| 0.34 | % | $ | 1,607 |
|
| 0.35 | % | $ | 2,505 |
|
| 0.53 | % | $ | 3,205 |
|
| 0.64 | % | $ | 2,412 |
|
| 0.45 | % |
Add(Deduct): Net gain/(loss) on sale |
|
| (91 | ) |
| -0.02 | % |
| (8 | ) |
| 0.00 | % |
| (9 | ) |
| 0.00 | % |
| (126 | ) |
| -0.03 | % |
| 8 |
|
| 0.00 | % |
Tax effect (2) |
|
| 35 |
|
| 0.01 | % |
| 3 |
|
| 0.00 | % |
| 3 |
|
| 0.00 | % |
| 49 |
|
| 0.01 | % |
| (3 | ) |
| 0.00 | % |
|
|
|
|
|
|
|
|
|
|
|
| ||||||||||||||||||||
Adjusted earnings |
| $ | 1,472 |
|
| 0.33 | % | $ | 1,602 |
|
| 0.35 | % | $ | 2,499 |
|
| 0.53 | % | $ | 3,128 |
|
| 0.62 | % | $ | 2,417 |
|
| 0.45 | % |
|
|
|
|
|
|
|
|
|
|
|
|
|
|
|
|
|
|
|
|
|
|
|
|
|
|
|
|
|
|
|
|
Expense Coverage Ratio (3) |
|
| 111.7 | % |
|
|
|
| 116.7 | % |
|
|
|
| 127.4 | % |
|
|
|
| 139.9 | % |
|
|
|
| 133.3 | % |
|
|
|
Efficiency Ratio (4) |
|
| 80.4 | % |
|
|
|
| 77.4 | % |
|
|
|
| 70.2 | % |
|
|
|
| 64.7 | % |
|
|
|
| 67.7 | % |
|
|
|
|
|
(1) | Ratios are as a percent of average assets. |
(2) | Assumes a 38.5% effective tax rate for federal & state income taxes. |
(3) | Expense coverage ratio calculated as net interest income before provisions for loan losses divided by operating expenses. |
(4) | Efficiency ratio calculated as operating expenses divided by the sum of net interest income before provisions for loan losses plus other income (excluding net gains). |
Sources: Malvern Federal’s prospectus, audited & unaudited financial statements and RP Financial calculations.
|
|
RP® Financial, LC. | OVERVIEW AND FINANCIAL ANALYSIS |
| I.11 |
served to limit the amount of loan loss provisions established over the past five fiscal years. Gains and losses from the sale of loans and investments have been a relatively minor factor in the Bank’s earnings over the past five fiscal years.
Over the past five fiscal years, the Bank’s net interest income to average assets ratio ranged from a low of 2.06% during fiscal years 2003 and 2004 to a high of 2.73% during fiscal year 2006. The positive trend in the Bank’s net interest income ratio from fiscal year 2004 through fiscal year 2006 was supported by a widening yield-cost spread, which increased from 2.00% during fiscal year 2004 to 2.65% during fiscal year 2006. The increase in the interest rate spread resulted from a more significant increase in the overall yield earned on interest-earning assets relative to the overall rate paid on funding liabilities. The positive yield trend was facilitated by a shift in the Bank’s interest-earning asset composition towards a higher concentration of loans, as asset growth was largely sustained by loan growth during that period. Comparatively, the decrease in the Bank’s net interest income ratio during fiscal 2007 was the result of a narrowing of the yield-cost spread to 2.42%. The decrease in Malvern Federal’s 2007 interest rate spread resulted from funding costs increasing more than yields earned on assets, reflecting the adverse impact of rising short-term interest rates on a balance sheet that is liability sensitive in the short-term. The Bank’s net interest rate spreads and yields and costs for the past five fiscal years are set forth in Exhibits I-3 and I-5.
Non-interest operating income has been a fairly minor contributor to Malvern Federal’s earnings, as the Bank has not pursued any significant diversification into products and services that generate revenues from sources of non-interest operating income. Throughout the period shown in Table 1.2, sources of non-interest operating income have been maintained at a relatively stable level, ranging from a low of 0.22% of average assets during fiscal year 2004 to a high of 0.29% of average assets during fiscal year 2005. Non-interest operating income equaled 0.27% of average assets during fiscal year 2007. Service charges and fees generated from retail banking activities constitute the primary sources of the Bank’s non-interest operating income. Rental income and income earned from BOLI account for the other major contributors to the Bank’s non-interest revenues.
|
|
RP® Financial, LC. | OVERVIEW AND FINANCIAL ANALYSIS |
| I.12 |
Implementation of a relatively undiversified operating strategy has also facilitated relatively low levels of operating expenses for Malvern Federal. Over the past five fiscal years, operating expenses ranged from a low of 1.76% of average assets during fiscal year 2004 to a high of 1.95% of average assets during fiscal years 2005 and 2006. For fiscal year 2007, operating expenses equaled 1.89% of average assets. In addition to implementation of a fairly streamlined operating strategy, the utilization of brokers as a major source of loan production has supported containment of the Bank’s operating expenses. Upward pressure will be placed on the Bank’s operating expense ratio following the stock offering, due to expenses associated with operating as a publicly-traded company, including expenses related to the stock benefit plans. At the same time, the increase in capital realized from the stock offering will increase the Bank’s capacity to leverage operating expenses through pursuing a more aggressive growth strategy.
Overall, the general trends in the Bank’s net interest margin and operating expense ratio since fiscal year 2003 reflect an increase in core earnings, as indicated by the Bank’s expense coverage ratio (net interest income divided by operating expenses). Malvern Federal’s expense coverage ratio equaled 1.11 times during fiscal year 2003, versus a comparable ratio of 1.33 times during fiscal year 2007. The increase in the expense coverage ratio resulted from a more significant increase in the net interest income ratio compared to the increase in the operating expense ratio. Similarly, Malvern Federal’s efficiency ratio (operating expenses, net of amortization of intangibles, as a percent of the sum of net interest income and other operating income) of 80.4% during fiscal 2003 was less favorable than the 67.7% efficiency ratio maintained for fiscal year 2007.
Over the past five fiscal years, maintenance of generally favorable credit quality measures has generally served to limit the amount of loss provisions established during the period. Loan loss provisions established by the Bank ranged from a low of 0.01% of average assets in fiscal years 2003 and 2004 to a high of 0.24% of average assets during fiscal year 2007. The higher loan loss provisions established during fiscal year 2007 was mostly related to a $3.5 million commercial real estate loan going delinquent
|
|
RP® Financial, LC. | OVERVIEW AND FINANCIAL ANALYSIS |
| I.13 |
in the fourth quarter of fiscal year 2007. As of September 30, 2007, the Bank maintained valuation allowances of $4.5 million, equal to 0.97% of net loans receivable and 195.1% of non-performing loans. Exhibit I-6 sets forth the Bank’s loan loss allowance activity during the past five fiscal years.
Non-operating income, consisting of gains and losses on the sale of loans, investments and other assets, had a relatively minor impact on the Bank’s earnings over the past five fiscal years. Loan sale gains reflect the sale of fixed rate loans for purposes of interest rate risk management. Loans are generally sold with servicing retained. The Bank also recorded modest gains and losses from the sale of investment securities throughout past five fiscal years, reflecting ongoing management of the investment portfolio for purposes of enhancing returns and managing interest rate risk. In fiscal 2004, the Bank recorded a small loss on the sale of property and equipment. The gains and losses realized from the sale of investment securities and property and equipment are viewed as non-recurring income items, while gains generated from the sale of fixed rate loans have been an ongoing activity for the Bank. However, gains realized through secondary market activities are subject to a certain degree of volatility as well, given the dependence of such gains on the interest rate environment and resulting demand for longer term fixed rate loans.
The Bank’s effective tax rate ranged from a low of 26.86% during fiscal year 2003 to a high of 35.81% during fiscal year 2006. For fiscal year 2007, the Bank’s effective tax rate equaled 31.77%. As set forth in the prospectus, the Bank’s marginal effective statutory tax rate approximates 38.5%.
The Bank’s balance sheet is liability-sensitive in the short-term (less than one year) and, thus, the net interest margin will typically be adversely affected during periods of rising and higher interest rates, as well as in the interest rate environment that generally prevailed during 2006 and year-to-date 2007, in which the yield curve was inverted due to short-term interest rates increasing to levels that exceed the yields earned on longer-term Treasury bonds. As of September 30, 2007 the Bank’s Net
|
|
RP® Financial, LC. | OVERVIEW AND FINANCIAL ANALYSIS |
| I.14 |
Portfolio Value (“NPV”) analysis indicated that a 2.0% instantaneous and sustained increase in interest rates would result in a 30% decline in the Bank’s NPV (see Exhibit I-7).
The Bank pursues a number of strategies to manage interest rate risk, particularly with respect to seeking to limit the repricing mismatch between interest rate sensitive assets and liabilities. The Bank manages interest rate risk from the asset side of the balance sheet through underwriting residential mortgages that will allow for their sale to the secondary market when such a strategy is appropriate, originating 1-4 family ARM loans, diversifying into other types of lending beyond 1-4 family permanent mortgage loans which consist primarily of shorter term and adjustable rate loans and emphasizing investing in securities with maturities of less than years or with floating rates. As of September 30, 2007, of the Bank’s total loans due after September 30, 2008, ARM loans comprised 34.5% of those loans (see Exhibit I-8). On the liability side of the balance sheet, management of interest rate risk has been pursued through emphasizing growth of lower cost and less interest rate sensitive transaction and savings account deposits, extending CD maturities through offering attractive rates on certain CDs with maturities of more than one year and utilizing fixed rate FHLB advances with terms out to five years. The infusion of stock proceeds will serve to further limit the Bank’s interest rate risk exposure, as most of the net proceeds will be redeployed into interest-earning assets and the increase in the Bank’s capital will lessen the proportion of interest rate sensitive liabilities funding assets.
Lending Activities and Strategy
The Bank’s lending activities have traditionally emphasized 1-4 family permanent mortgage loans and such loans continue to comprise the largest component of the Bank’s loan portfolio. Beyond 1-4 family loans, lending diversification by the Bank has emphasized commercial real estate loans followed by consumer loans and construction loans. Land loans and commercial business loans constitute less significant areas of lending diversification for the Bank. Going forward, the Bank’s lending strategy is to pursue further diversification of the loan portfolio, whereby growth of commercial real
|
|
RP® Financial, LC. | OVERVIEW AND FINANCIAL ANALYSIS |
| I.15 |
estate loans will be emphasized as the primary area of lending diversification. It is anticipated that growth of the 1- 4 family portfolio will continue to be slowed somewhat by the sale of a portion of the fixed rate originations, which will further the trend of 1-4 family loans becoming a smaller portion of the Bank’s loan portfolio composition. Exhibit I-9 provides historical detail of Malvern Federal’s loan portfolio composition over the past five fiscal years and Exhibit I-10 provides the contractual maturity of the Bank’s loan portfolio by loan type as of September 30, 2007.
Malvern Federal offers both fixed rate and adjustable rate 1-4 family permanent mortgage loans. Loans are underwritten to secondary market guidelines, as the Bank’s general practice has been to sell originations of longer term fixed rate loans. Malvern Federal typically retains the servicing on loans that are sold. ARM loans offered by the Company include loans with repricing terms of one, three, five or seven years and are indexed to U.S. Treasury notes of comparable maturities as the repricing term. Initial rates on ARM loans are typically discounted from the fully-indexed rate. After the initial repricing period, ARM loans convert to a one-year ARM loan for the balance of the mortgage term. Fixed rate loans are offered for terms of up to 30 years, which may include a balloon provision of five or seven years. A portion of the Bank’s 1-4 family loan volume is generated through loan brokers, in which the loans are secured by residences in southeastern Pennsylvania. As of September 30, 2007, the Bank’s outstanding balance of 1-4 family loans equaled $193.5 million or 40.4% of total loans outstanding.
Construction loans originated by the Bank consist of loans to finance the construction of 1-4 family residences, as well as multi-family and commercial real estate properties. The Company’s 1-4 family construction lending activities consist of construction financing for construction/permanent loans as well as financing for speculative loans that are extended to builders. Construction loans for the construction of commercial properties are originated as construction permanent loans. Construction loans are prime rate based loans and require payment of interest only during the construction period. Construction loans are extended up to a loan-to-value (“LTV”) ratio
|
|
RP® Financial, LC. | OVERVIEW AND FINANCIAL ANALYSIS |
| I.16 |
of 80.0%. As of September 30, 2007, Malvern Federal’s outstanding balance of construction loans equaled $58.9 million or 12.4% of total loans outstanding.
Land loans consist substantially of properties that will be used for residential and commercial development. Land loans are typically prime rate based loans that require payment of interest only for terms of up to three years and are extended up to a LTV ratio of 80%. As of September 30, 2007, Malvern Federal’s outstanding balance of land loans equaled $6.7 million or 1.4% of total loans outstanding.
The balance of the mortgage loan portfolio consists of commercial real estate and multi-family loans, which are substantially collateralized by properties in the Philadelphia MSA. Malvern Federal originates commercial real estate and multi-family loans up to a maximum LTV ratio of 80.0% and requires a minimum debt-coverage ratio of 1.2 times. Commercial real estate and multi-family loans are generally extended as ten year notes, with a five year repricing term indexed to the five year Treasury rate. Commercial real estate and multi-family loans generally have amortization terms of up to 20 years. Approximately 15% of the Bank’s commercial real estate/multi-family loan production is generated through loan brokers. Properties securing the commercial real estate and multi-family loan portfolio include office buildings, warehouses, retail properties, mixed-use properties, medical and professional buildings, churches and apartment buildings. As of September 30, 2007, the Bank’s largest commercial real estate/multi-family loan on one property was a participation loan with an outstanding balance of $4.8 million and was secured by an office complex. The loan was performing in accordance with its terms at September 30, 2007. As of September 30, 2007, the Bank’s outstanding balance of commercial real estate and multi-family loans totaled $110.8 million equal to 23.2% of the total loan portfolio.
Malvern Federal’s diversification into non-mortgage loans consists primarily of consumer loans, with second mortgage loans and home equity lines of credit constituting the major portion of the consumer loan portfolio. Most of the Bank’s second mortgage loans are generated through loan brokers operating in southeastern Pennsylvania. Second mortgage loans are offered as fixed rate amortizing loans, while home equity lines of credit have a floating rate tied to the prime rate. The Bank will
|
|
RP® Financial, LC. | OVERVIEW AND FINANCIAL ANALYSIS |
| I.17 |
originate second mortgage loans and home equity lines of credit up to a LTV ratio of 95.0%, inclusive of other liens on the property. Other than second mortgage loans and home equity lines of credit, consumer lending has been a relatively minor area of lending diversification for the Bank, with the balance of the portfolio consisting of various types of installment loans and loans secured by deposits. As of September 30, 2007, the Bank’s outstanding balance of consumer loans equaled $92.1 million or 19.3% of total loans outstanding. Second mortgage loans and home equity lines of credit accounted for $90.5 million of the consumer loan balance at September 30, 2007.
The Bank offers commercial business loans and lines of credit to small- and medium-sized companies in its market area. Commercial business loans offered by the Bank consist of fixed rate term loans and floating rate lines of credit indexed to the prime rate. The commercial business loan portfolio consists substantially of secured loans. Growth of the commercial business loan portfolio will be pursued in conjunction with the Bank’s commercial real estate lending activities, pursuant to which the Bank will seek to become a full service community bank to its commercial loan customers through offering a full range of commercial loan products that can be packaged with lower cost commercial deposit products. As of September 30, 2007, the Bank’s outstanding balance of commercial business loans equaled $15.8 million or 3.3% of total loans outstanding.
Exhibit I-11 provides a summary of the Bank’s lending activities over the past three fiscal years. Over the past three fiscal years, total loans originated and purchased ranged from a low of $158.8 million in fiscal year 2007 to a high of $186.7 million in fiscal year 2006. Construction loans followed by 1-4 family loans and second mortgage loans have been the largest sources of originations and purchases for Malvern Federal during the past three fiscal years. Net loan growth showed a declining trend over the past three fiscal years, decreasing from $57.7 million in fiscal 2005 to $40.9 million in fiscal year 2006 and to $20.3 million in fiscal year 2007. The downward trend in loan growth was attributable to increased loan sales in fiscal year 2006, higher loan repayments in fiscal years 2006 and 2007 and a decrease in loan originations and purchases in fiscal year 2007.
|
|
RP® Financial, LC. | OVERVIEW AND FINANCIAL ANALYSIS |
| I.18 |
The Bank’s historical 1-4 family lending emphasis, as well as generally favorable real estate market conditions in the Bank’s lending area, have supported the maintenance of relatively favorable credit quality measures during the past five fiscal years. Over the past five fiscal years, Malvern Federal’s balance of non-performing assets ranged from a high of 0.82% at fiscal year end 2005 to a low of 0.47% of assets at fiscal year end 2007. The comparatively higher non-performing assets ratio for fiscal year end 2005 was related to an increase in the balance of restructured loans, which totaled $2.2 million at fiscal year end 2005. As shown in Exhibit I-12, non-performing assets at fiscal year end 2007 totaled $2.6 million and consisted of $2.3 million of non-accruing loans, $227,000 of foreclosed real estate and $121,000 of restructured loans. Commercial business loans and commercial real estate loans constituted the two largest components of the non-accruing loan balance at fiscal year end 2007, with respective non-accruing loan balances of $780,000 and $661,000.
To track the Company’s asset quality and the adequacy of valuation allowances, Malvern Federal has established detailed asset classification policies and procedures which are consistent with regulatory guidelines. Detailed asset classifications are reviewed quarterly by senior management and the Board. Pursuant to these procedures, when needed, the Bank establishes additional valuation allowances to cover anticipated losses in classified or non-classified assets. As of September 30, 2007, the Bank maintained valuation allowances of $4.5 million, equal to 0.97% of net loans receivable and 190.2% of non-performing loans.
Funding Composition and Strategy
Deposits have consistently served as the Bank’s primary funding source and at September 30, 2007 deposits accounted for 85.9% of Malvern Federal’s interest-bearing funding composition. Exhibit I-13 sets forth the Bank’s deposit composition for the past three fiscal years and Exhibit I-14 provides the interest rate and maturity composition of the CD portfolio at September 30, 2007. CDs constitute the largest
|
|
RP® Financial, LC. | OVERVIEW AND FINANCIAL ANALYSIS |
| I.19 |
component of the Bank’s deposit composition, although the concentration of CDs comprising total deposits has declined slightly in recent years due to a comparative stronger growth rate for transaction and savings account deposits. As of September 30, 2007, the CD portfolio totaled $268.2 million or 61.9% of total deposits, versus comparable measures of $245.7 million and 63.8% of total deposits at fiscal year end 2005. CDs with scheduled maturities of one year or less comprised 76.1% of the Bank’s CDs at September 30, 2007. As of September 30, 2007, jumbo CDs (CD accounts with balances of $100,000 or more) amounted to $84.7 million or 31.6% of total CDs. The Bank did not hold any brokered deposits at September 30, 2007.
The Bank maintained $165.2 million of savings and transaction account deposits at September 30, 2007, which equaled 38.1% of total deposits. Comparatively, core deposits equaled $139.4 million or 36.2% of total deposits at fiscal year end 2005. Since fiscal year end 2005, money market and interest-bearing checking accounts have been the sources of core deposit growth for the Bank. Comparatively, declining balances have been experienced for the Bank’s savings account and non-interest-bearing demand account deposits since fiscal year end 2005.
Borrowings serve as an alternative funding source for the Bank to facilitate management of funding costs and interest rate risk. The Bank maintained $71.4 million of FHLB advances at September 30, 2007 with a weighted average rate of 5.96%. FHBL advances held by the Bank at September 30, 2007 consisted of a line of credit with an outstanding balance of $8.0 million and $63.4 million of fixed rate borrowings with maturity dates through 2011. Exhibit I-15 provides further detail of the Bank’s borrowings activities during the past three fiscal years.
Malvern Federal has one wholly-owned subsidiary, Strategic Asset Managements Group, Inc. (“SAM”). SAM is a Pennsylvania corporation, which acquired a 50% interest in the Malvern Insurance Agency in 2004. Malvern Insurance Agency earns commission income through the sale of property and casualty insurance, commercial insurance and life and health insurance. To date, income generated
|
|
RP® Financial, LC. | OVERVIEW AND FINANCIAL ANALYSIS |
| I.20 |
through SAM has been nominal.
Malvern Federal is not currently party to any pending legal proceedings that the Bank’s management believes would have a material adverse effect on the Bank’s financial condition, results of operations or cash flows.
|
|
RP® Financial, LC. | MARKET AREA |
| II.1 |
The Bank conducts operations out of the main office and six branch offices, all in Chester County, Pennsylvania, approximately 30 miles west of Philadelphia. The main office is located in Paoli, and the branches are in Malvern, Exton, Pottstown, Berwyn, Downingtown and West Chester. Exhibit II-1 provides information on the Bank’s office properties. The primary market area for business operations is the Philadelphia MSA. The population of the Philadelphia MSA was an estimated 5.9 million in 2007, nearly one-half of the state’s population.
The Philadelphia MSA is the nation’s fourth largest metropolitan region in terms of total population. Montgomery, Bucks, Chester, and Delaware Counties as well as the southwestern New Jersey counties of Burlington, Camden and Mercer are bedroom communities for commuters to nearby Philadelphia, although suburban employment has continued to grow as many businesses have found nearby locations to be attractive given the proximity to highly educated and affluent residents. The economy of the Bank’s market has become increasingly diverse as the Philadelphia MSA has grown based on several factors including: (1) the location in the heart of the Boston-to-Richmond megalopolis, coupled with its convenience to the Philadelphia core city area; (2) the presence of a highly educated workforce which is supported by a high quality public education system and presence of a variety of colleges and universities locally; and (3) diversity of the local economy as traditional employers in the manufacturing and financial services industry have been bolstered by growth in the life sciences and healthcare industries as well as the information technology and communication sectors.
The Philadelphia MSA today is a major center for financial services, and the Bank competes with a number of very large financial institutions that are either headquartered or maintain office networks in southeastern Pennsylvania or southwestern New Jersey. Some of the larger commercial banks operating in the MSA include Wachovia, PNC Bank Corp and Citizens Bank. The Bank also competes with a number of large savings institutions that maintain branches in or are headquartered in
|
|
RP® Financial, LC. | MARKET AREA |
| II.2 |
southeastern Pennsylvania or southwestern New Jersey, including Sovereign Bank and Willow Financial Bank. Overall, the magnitude of the competition that the Bank faces is apparent with more than 2,000 financial institution branches in the MSA (excluding credit unions). These numbers do not include competition from mortgage banking companies, investment houses, mutual funds and many other financial services providers.
A map showing the Bank’s office coverage is set forth in Table 2.1 below and in Exhibit I-1. Future growth opportunities for the Bank depend on the future growth and stability of the regional economy, demographic growth trends, and the nature and intensity of the competitive environment. These factors have been briefly examined to help determine the growth potential that exists for the Bank and the relative economic health of the Bank’s market area.
Table 2.1
Malvern Federal Savings Bank
Map of Branch Office Network

|
|
RP® Financial, LC. | MARKET AREA |
| II.3 |
The future success of the Bank’s operations is partially dependent upon various national and local economic trends. The economy showed signs of resilience in November 2006, as new home building rose in November despite the glut of unsold homes on the market and retail sales rose more than expected in November. The November employment report showed continued job growth, but the unemployment rate edged up to 4.5%. In a sign that the housing slump could be bottoming out, sales of new and existing homes rose in November. Retailers reported a modest increase in December same store sales, while job growth was stronger than expected in December. The December unemployment rate held steady at 4.5%. Housing starts rose in December, although the housing market remained weak. Fourth quarter GDP increased at a 2.2% annual rate.
Signs of slower economic growth continued to emerge at the start of 2007, as manufacturing activity declined in January. The employment report for January was also less favorable, based on fewer jobs added and an increase in the unemployment rate to 4.6%. Retail sales were flat in January, while economic activity in the service sector continued to expand during January. Durable-goods orders fell 7.8% in January as demand for transportation equipment plunged. Existing home sales rose 3% in January on lower prices. Comparatively, new home sales fell by 16.6% in January from the previous month, the largest drop in 13 years. While the manufacturing sector grew in February, the service sector expanded at a slower than expected pace in February. The February unemployment rate dipped to 4.5%, even though job growth slowed during February. Other signs of a cooling economy included a nominal increase in retail sales during February, sales of new homes fell for the second straight month in February and capital goods orders, excluding defense and aircraft, fell in February. Comparatively, March data showed signs of a more resilient economy, retail sales were up strongly in March and the March unemployment rate dropped to a five-month low of 4.4% on stronger than expected job growth. Despite rising inventories of unsold homes, housing starts were also stronger than expected in March.
|
|
RP® Financial, LC. | MARKET AREA |
| II.4 |
The beginning of the second quarter of 2007 showed indications of a slowing economy. The April unemployment rate edged up to 4.5%, as cautious employers added the fewest jobs in more than two years. Major retailers experienced a 2.3% decrease in same store sales during April and home building permits slid in April to their lowest point in almost a decade. The general economy also showed some areas of strength in April, which included a jump in industrial output and an increase in manufacturing activity. Consumer confidence rose in May, as rising stocks and a strong job market kept Americans upbeat. The U.S. housing market remained sluggish in May, as the inventory of unsold homes was up in 18 major metropolitan areas and new housing starts continued to decline. Better-than-expected job growth maintained the national unemployment rate at 4.5% for May. Manufacturing activity picked up in June, while the housing market continued to struggle as the inventory of homes for sale continued to rise in June. New and existing home sales both declined in June. Solid job growth for June held the national unemployment rate at 4.5% and GDP grew at a stronger than expected 4.0% annualized rate during the second quarter.
Retail sales were up modestly in July 2007, while the unemployment rate for July increased to 4.6% on slower job growth. Industrial output showed a stronger than expected increase in July, while the housing market continued to struggle. New home construction fell in July to its lowest level in a decade and existing home sales dropped for a fifth straight month in July. Home prices also fell in July for a record 12th consecutive month, with the drop in prices accelerating amid a glut of unsold homes and tighter lending standards. Consumer confidence fell in August, with the decline being attributed to softening of business and labor-market conditions. Other signs of economic weakness were reflected in the relatively modest gains posted for retail sales and industrial production in August, as well as the loss of jobs in August. The August employment report showed a reduction of 4,000 jobs, which was the first drop in four years. The August unemployment rate held steady at 4.6%. The housing market showed further deterioration in August, as sales of existing homes tumbled and home inventories continued to rise. Lower demand for transportation goods translated into a reduction for durable-goods orders in August as well. The manufacturing and service sectors continued to expand in September, but at slower paces compared to August.
|
|
RP® Financial, LC. | MARKET AREA |
| II.5 |
Job growth rebounded in September, although the national unemployment rate edged up to 4.7%. Retailers posted weaker than expected sales in September and the housing market continued to show further deterioration. New home starts fell to their lowest level in 14 years in September, as sales of previously occupied homes dropped 19% in September. New home sales rose in September, as builders cut home prices to reduce the inventory of unsold homes. Economic weakness was also reflected by a decrease in September durable goods orders. While most of the most economic data pointed towards a slowing economy, third quarter GDP grew at a stronger than expected 3.9% annualized rate.
Economic data at the start of the fourth quarter of 2007 generally pointed to weaker growth. Manufacturing slowed in October and retailers posted weak October sales. Employers boosted payrolls by a surprisingly strong 166,000 in October, while the October national unemployment rate held steady at 4.7%. Existing home sales declined for an eighth straight month in October, despite a sharp decline in home prices. Orders of durable goods also declined in October. Manufacturing activity fell in November, but stayed above recession levels. The November U.S. unemployment rate remained at 4.7%, as 94,000 jobs were added in November.
In terms of interest rate trends over the past year, interest rates stabilized in early-December 2006 and then edged higher following the November employment report which reflected solid job growth. The Federal Reserve left interest rates unchanged at its mid-December meeting, indicating that inflation remained its principal concern. There was little change in interest rates through most of December with the inverted yield curve remaining inverted for a longer period than many economists had forecast.
A stable interest rate environment continued to prevail at the beginning of 2007, which was followed by a mild upward trend in interest rates in mid-January. Lower oil prices and increased expectations of the Federal Reserve not cutting rates anytime soon contributed to the rise in long-term Treasury yields. Following the Federal Reserve’s decision to leave rates unchanged at its end of January meeting, interest rates stabilized during the first half of February. Treasury bonds rallied in mid-February,
|
|
RP® Financial, LC. | MARKET AREA |
| II.6 |
based on indications from the Federal Reserve Chairman that inflation was headed lower. Signs of slower economic growth and a sell-off in the stock market continued the downward trend in Treasury yields in late-February. A stable interest rate environment prevailed throughout most of March, as economic measures generally reflected a downturn in economic activity and the March meeting of the Federal Reserve concluded with no change in the federal funds target rate. The Federal Reserve statement from the March meeting continued to cite inflation concerns, but the Federal Reserve dropped its stated bias to raise rates.
Some stronger than expected economic reports pushed long-term Treasury yields higher at the start of the second quarter of 2007. The release of the March minutes of the Federal Reserve, which revealed that more rate increases may be needed to combat inflation, further contributed to the rise in interest rates. Treasury yields eased lower in mid-April on tame inflation data reflected in the March consumer price numbers. Interest rates stabilized through the balance of April and for the first half of May. The Federal Reserve left interest rates unchanged at its May meeting and gave no signs that it was moving towards an interest rate cut. Long-term Treasury yields moved higher heading into late-May, with such factors as global growth, an increase in May consumer confidence and initial jobless claims falling for a fifth straight week contributing to the upward trend in interest rates. Bond prices plunged on inflation worries during the first half of June, with the yield on the 10-year Treasury note rising to a five year high of 5.25%. Interest rates eased lower during the second half of June on mixed economic data. The Federal Reserve left rates unchanged at its late-June meeting, but softened its hawkish inflation stance. At the same time, the Federal Reserve seemed to rule out the possibility of cutting rates any time soon.
Healthy job growth reflected in the June 2007 employment report pushed Treasury yields higher at the start of the third quarter. However, Treasury bonds rallied in mid-July on news of rating cuts on bonds backed by subprime mortgages, as investors dumped junk bonds for the relative safety of Treasury bonds. The rally in long-term Treasury bonds continued into late-July, on fears that the housing slump was spreading to the broader economy. Interest rates stabilized during the first half of
|
|
RP® Financial, LC. | MARKET AREA |
| II.7 |
August, as the Federal Reserve held rates steady as expected and core wholesale inflation showed only a modest increase in July. A half point cut in the Federal Reserve’s discount rate and increased speculation that the Federal Reserve would cut the federal funds rate in September pushed interest rates lower heading into the second half of August, with short-term Treasury yields posting their biggest decline in 19 years. The comparatively larger decline in short-term Treasury yields provided for a slightly positive slope to the yield curve in late-August. Interest rates stabilized somewhat during the first half of September, as investors awaited the outcome of the September meeting of the Federal Reserve. The Federal Reserve concluded the September meeting by cutting the federal funds rate by 0.5%, which exceeded the 0.25% rate cut most economists had expected. The rate cut provided for a steeper yield, as short-term Treasury yields declined and long-term Treasury yields were generally stable to slightly higher through the end of September.
Inflation jitters amid stronger than expected job growth for September pushed interest rates higher at the start of the fourth quarter of 2007. Gloomy economic data, along with consumer confidence dropping to a two year lower, provided for a pullback in long-term Treasury yields during the second half of October. As generally expected, the Federal Reserve concluded its October meeting with a 25 basis rate cut. The downward trend in Treasury yields continued into November, as concerns about the credit squeeze and economic downturn sent investors seeking safety in U.S. Treasury bonds. Growing credit fears pushed the yield on the 10-year Treasury bond below 4.0% in late-November and early-December, its lowest level in more than three years. Treasury yields moved higher ahead of the December Federal Reserve meeting, amid expectations that the Federal Reserve would implement another rate cut. As of December 7, 2007, the bond equivalent yields for U.S. Treasury bonds with terms of one and ten years equaled 3.24% and 4.12%, respectively, versus comparable year ago yields of 4.90% and 4.49%. Exhibit II-2 provides historical interest rate trends.
Key demographic and economic indicators in the Bank’s market include population, number of households and household/per capita income levels. Trends in
|
|
RP® Financial, LC. | MARKET AREA |
| II.8 |
these key measures are summarized by the data presented in Table 2.2 from 2000 to 2007 and projected through 2012. Data for the nation as well as for Pennsylvania and the Philadelphia MSA are included for comparative purposes. Chester County had a population of 491,000 in 2007. Chester County’s population increased at a 1.8% annual rate for the past seven years, which was higher than the comparable growth rates for the Philadelphia MSA (0.6%), Pennsylvania (0.4%), as well as the nation (1.2%). The higher population growth rate in Chester County illustrates the movement of people from Center City Philadelphia to the suburban markets surrounding the city. Growth in households for Chester County and the Philadelphia MSA paralleled population growth trends. These trends are projected to continue over the next five years through 2012.
The median household income levels in Chester County compared favorably to the Philadelphia MSA median, as well as the state and national medians. Likewise, Chester County’s per capita income as of 2007 was well above the Philadelphia MSA, state and national measures for per capita income. Household income distribution patterns provide further evidence of the relative affluence of Chester County, as approximately 43% of all Chester County households had income levels in excess of $100,000 in 2007, compared to 27% of the Philadelphia MSA, 19% of Pennsylvania, and 21% of the nation.
The economy of the Bank’s market is relatively diverse and has several significant components. Employment data, shown in Table 2.3, indicates that trade, transportation, and utilities are the most prominent sector of the economy of the Greater Philadelphia region, comprising approximately 18.8% of total employment. The next largest component of the economy of the market is education and health services, which approximates 18.1% of total employment, followed by professional and business services (approximating 14.9% of employment) and government (approximating 13.9% of total employment).
|
|
RP®Financial, LC. | MARKET AREA |
| II.9 |
Table 2.2
Malvern Federal Savings Bank
Summary Demographic Data
|
|
|
|
|
|
|
|
|
|
|
|
|
|
|
|
|
|
| Year |
| Annual Growth Rate |
| |||||||||||
|
|
|
| |||||||||||||
|
| 2000 |
| 2007 |
| 2012 |
| 2000-2007 |
| 2007-2012 |
| |||||
|
|
|
|
|
|
| ||||||||||
Population (000) |
|
|
|
|
|
|
|
|
|
|
|
|
|
|
|
|
United States |
|
| 281,422 |
|
| 306,348 |
|
| 325,526 |
|
| 1.2 | % |
| 1.2 | % |
Pennsylvania |
|
| 12,281 |
|
| 12,643 |
|
| 12,910 |
|
| 0.4 | % |
| 0.4 | % |
Philadelphia-Camden-Wilmington MSA |
|
| 5,687 |
|
| 5,930 |
|
| 6,107 |
|
| 0.6 | % |
| 0.6 | % |
Chester County |
|
| 434 |
|
| 491 |
|
| 536 |
|
| 1.8 | % |
| 1.7 | % |
|
|
|
|
|
|
|
|
|
|
|
|
|
|
|
|
|
Households (000) |
|
|
|
|
|
|
|
|
|
|
|
|
|
|
|
|
United States |
|
| 105,480 |
|
| 115,337 |
|
| 122,831 |
|
| 1.3 | % |
| 1.3 | % |
Pennsylvania |
|
| 4,777 |
|
| 4,966 |
|
| 5,095 |
|
| 0.6 | % |
| 0.5 | % |
Philadelphia-Camden-Wilmington MSA |
|
| 2,134 |
|
| 2,236 |
|
| 2,310 |
|
| 0.7 | % |
| 0.7 | % |
Chester County |
|
| 158 |
|
| 180 |
|
| 198 |
|
| 1.9 | % |
| 1.9 | % |
|
|
|
|
|
|
|
|
|
|
|
|
|
|
|
|
|
Median Household Income ($) |
|
|
|
|
|
|
|
|
|
|
|
|
|
|
|
|
United States |
| $ | 42,164 |
| $ | 53,154 |
| $ | 62,503 |
|
| 3.4 | % |
| 3.3 | % |
Pennsylvania |
|
| 40,108 |
|
| 51,375 |
|
| 60,635 |
|
| 3.6 | % |
| 3.4 | % |
Philadelphia-Camden-Wilmington MSA |
|
| 48,201 |
|
| 62,790 |
|
| 75,624 |
|
| 3.8 | % |
| 3.8 | % |
Chester County |
|
| 64,836 |
|
| 85,956 |
|
| 104,946 |
|
| 4.1 | % |
| 4.1 | % |
|
|
|
|
|
|
|
|
|
|
|
|
|
|
|
|
|
Per Capita Income ($) |
|
|
|
|
|
|
|
|
|
|
|
|
|
|
|
|
United States |
| $ | 21,587 |
| $ | 27,916 |
| $ | 33,873 |
|
| 3.7 | % |
| 3.9 | % |
Pennsylvania |
|
| 20,880 |
|
| 27,602 |
|
| 33,849 |
|
| 4.1 | % |
| 4.2 | % |
Philadelphia-Camden-Wilmington MSA |
|
| 23,972 |
|
| 32,067 |
|
| 39,748 |
|
| 4.2 | % |
| 4.4 | % |
Chester County |
|
| 31,627 |
|
| 43,177 |
|
| 54,410 |
|
| 4.5 | % |
| 4.7 | % |
|
|
|
|
|
|
|
|
|
|
|
|
|
|
|
|
|
|
| $0 to |
| $25,000- |
| $50,000- |
| $100,000+ |
|
|
|
| ||||
|
|
|
|
|
|
|
|
| ||||||||
2007 HH Net Income Dist. (%) |
|
|
|
|
|
|
|
|
|
|
|
| ||||
United States |
|
| 21.91 | % |
| 25.02 | % |
| 32.32 | % |
| 20.75 | % |
|
|
|
Pennsylvania |
|
| 22.85 | % |
| 25.79 | % |
| 32.45 | % |
| 18.91 | % |
|
|
|
Philadelphia-Camden-Wilmington MSA |
|
| 18.68 | % |
| 21.27 | % |
| 32.93 | % |
| 27.12 | % |
|
|
|
Chester County |
|
| 9.81 | % |
| 16.33 | % |
| 31.16 | % |
| 42.70 | % |
|
|
|
|
|
|
|
|
|
|
|
|
|
|
|
|
|
|
|
|
|
| 0-14 Yrs. |
| 15-34 Yrs. |
| 35-54 Yrs. |
| 55-69 Yrs. |
| 70+ Yrs. |
| |||||
|
|
|
|
|
|
| ||||||||||
2007 Age Distribution(%) |
|
|
|
|
|
|
|
|
|
|
| |||||
United States |
|
| 20.26 | % |
| 27.33 | % |
| 29.07 | % |
| 14.30 | % |
| 9.04 | % |
Pennsylvania |
|
| 18.04 | % |
| 25.11 | % |
| 29.71 | % |
| 15.34 | % |
| 11.80 | % |
Philadelphia-Camden-Wilmington MSA |
|
| 19.83 | % |
| 25.80 | % |
| 29.93 | % |
| 14.22 | % |
| 10.22 | % |
Chester County |
|
| 20.94 | % |
| 23.53 | % |
| 31.69 | % |
| 14.93 | % |
| 8.91 | % |
Source: SNL Financial, LC.
|
|
RP®Financial, LC. | MARKET AREA |
| II.10 |
Table 2.3
Malvern Federal Savings Bank
Employment by Sector

Source: Global Insight, July, 2006.
Growth sectors of the local economy included the life science and healthcare industries, whose expansion has been fostered by the presence of major research universities, locally and a highly educated technically proficient workforce. Similarly, growth in information technology and communications industries reflects many of these same factors. The market area’s core industries with emphasis on those which are perceived to be supporting future growth have been described below. Table 2.4 lists the largest employers in the Greater Philadelphia region by number of employees.
Financial Services. The financial services sector has always been an important element of the Philadelphia MSA economy. The Vanguard Group is the largest employer in Chester County with 8,000 employees. Moreover, Montgomery
|
|
RP®Financial, LC. | MARKET AREA |
| II.11 |
Table 2.4
Malvern Federal Savings Bank
Largest Employers in the Greater Philadelphia Region
|
|
|
|
|
|
|
|
|
|
|
Company |
| Employment |
| City |
| County |
| State |
| Product/Service |
University of Pennsylvania |
| 22,605 |
| Philadelphia |
| Philadelphia |
| PA |
| Education, Research, Health Care |
Jefferson Health System |
| 14,317 |
| Philadelphia |
| Philadelphia |
| PA |
| Health Care |
MBNA |
| 10,500 |
| Wilmington |
| New Castle |
| DE |
| National Commerical Bank, Credit Card Processing |
Merck & Co. |
| 10,000 |
| West Point |
| Montgomery |
| PA |
| Pharmaceutical Products |
Du Pont |
| 9,906 |
| Wilmington |
| New Castle |
| DE |
| Plastic Materials, Industrial Organic |
|
|
|
|
|
|
|
|
|
| Chemicals |
Christiana Health Care System |
| 9,500 |
| Wilmington |
| New Castle |
| DE |
| Health Care |
Vanguard Group, Inc. |
| 8,000 |
| Valley Forge |
| Chester |
| PA |
| Investment Services Firm |
Crozer-Keystone Health System |
| 7,026 |
| Springfield |
| Delaware |
| PA |
| Health Care |
Tenet Health Systems |
| 7,002 |
| Philadelphia |
| Philadelphia |
| PA |
| Health Care |
Prudential |
| 6,568 |
| Dresher |
| Montgomery |
| PA |
| Financial Services |
Lockheed Martin |
| 6,500 |
|
|
|
|
| NJ/PA |
| Guided Missles and Space Vehicles |
Children’s Hospital of PA (CHOP) |
| 6,200 |
| Philadelphia |
| Philadelphia |
| PA |
| Children's Hospital |
JP Morgan Chase |
| 5,900 |
| Wilmington |
| New Castle |
| DE |
| Financial Services |
Cendant Mortgage Corporation |
| 5,481 |
| Mt. Laurel |
| Burlington |
| NJ |
| Mortgages and Financial Institutes |
Independence Blue Cross |
| 5,040 |
| Philadelphia |
| Philadelphia |
| PA |
| Ins., Hospital, and Medical Service |
Allied Security |
| 5,000 |
| King of Prussia |
| Montgomery |
| PA |
| Security Officer Services |
Rosenbluth International |
| 5,000 |
| Philadelphia |
| Philadelphia |
| PA |
| Travel Management Services |
Abington Memorial Hospital |
| 4,586 |
| Abington |
| Montgomery |
| PA |
| Teaching Hospital |
Boeing |
| 4,400 |
| Ridley Park |
| Delaware |
| PA |
| Aerospace Manufacturing |
Verizon Communications |
| 4,270 |
| Philadelphia |
| Philadelphia |
| PA |
| Telecommunications |
Cardone Industries, Inc. |
| 4,091 |
| Philadelphia |
| Philadelphia |
| PA |
| Automotive Maunfacturer |
The Cooper Health System |
| 3,951 |
| Camden |
| Camden |
| NJ |
| Health Care |
University of Delaware |
| 3,800 |
| Newark |
| New Castle |
| DE |
| Higher Education |
Aetna U.S. Healthcare |
| 3,524 |
| Blue Bell |
| Montgomery |
| PA |
| Hospital and Medical Service Plans |
QVC, Inc. |
| 3,500 |
| West Chester |
| Chester |
| PA |
| E-Commerce |
Siemens Medical Solutions Health |
| 3,400 |
| Malvern |
| Chester |
| PA |
| Professional Services to Health Organizations |
United Parcel Post |
| 3,273 |
| Philadelphia |
| Philadelphia |
| PA |
| Integrated Package Delivery Company |
Virtua Health |
| 3,266 |
| Marlton |
| Burlington |
| NJ |
| Health Care |
Comcast Corporation |
| 3,000 |
| Philadelphia |
| Philadelphia |
| PA |
| Cable and TV Services |
Genuardi's Family Markets |
| 2,896 |
| Norristown |
| Montgomery |
| PA |
| Retail Food Supermarket |
Mercy Health System |
| 2,816 |
| Philadelphia |
| Philadelphia |
| PA |
| Health System |
Wyeth Pharmaceutical and Resear |
| 2,633 |
| Collegeville |
| Montgomery |
| PA |
| Pharmaceutical Products |
Bank One Card Services |
| 2,600 |
| Wilmington |
| New Castle |
| DE |
| Payment Business |
Alfred I. DuPont Hospital for Childre |
| 2,500 |
| Wilmington |
| New Castle |
| DE |
| Full Service Hospital for Children |
GlaxoSmithKline |
| 2,500 |
| Philadelphia |
| Philadelphia |
| PA |
| Pharmaceutical Research and |
|
|
|
|
|
|
|
|
|
| Development |
Jevic Transportation, Inc. |
| 2,445 |
| Delanco |
| Burlington |
| NJ |
| Truckload Services |
Commerce Bank |
| 2,444 |
| Cherry Hill |
| Camden |
| NJ |
| Financial Service Retailer |
Kennedy Health System |
| 2,441 |
| Voorhees |
| Camden |
| NJ |
| Health Care Delivery System |
The Chrysler Group/Daimler Chrysl |
| 2,400 |
| Newark |
| New Castle |
| DE |
| Manufactures SUV Bodies |
Wilmington Trust |
| 2,332 |
| Wilmington |
| New Castle |
| DE |
| Banking and Financial Services |
Quest Diagnostics |
| 2,321 |
| Collegeville |
| Montgomery |
| PA |
| Health Care Testing and Services |
The PNC Financial Services Group |
| 2,244 |
| Philadelphia |
| Philadelphia |
| PA |
| Banking and Financial Services |
Holy Redeemer Health System |
| 2,223 |
| Huntington |
| Montgomery |
| PA |
| Health System |
Mercy Fitzgerald Hospital |
| 2,200 |
| Darby |
| Delaware |
| PA |
| An Acute-Care, Teaching Hospital |
Elwyn, Inc. |
| 2,190 |
| Media |
| Delaware |
| PA |
| Human Services Serving Adults and Children with Disabilities |
Drexel University |
| 2,181 |
| Philadelphia |
| Philadelphia |
| PA |
| Higher Education |
Fox Chase Cancer Center |
| 2,092 |
| Philadelphia |
| Philadelphia |
| PA |
| Cancer Research, Treatment, and Community Outreach |
Aramark |
| 2,000 |
| Philadelphia |
| Philadelphia |
| PA |
| Food and Facilities Management |
|
|
Sources: | Philadelphia Business Journal Book of Lists, 2005 |
| The Business Ledger of Delaware Book of Lists, 2005 |
|
|
RP® Financial, LC. | MARKET AREA |
| II.12 |
County has several well-known insurers with major operations there including Prudential (6,568 employees) and Aetna US Healthcare (3,524 employees).
Bio-technology and Pharmaceutical Industries. The Philadelphia MSA area is one of the leading regions of the world for biotech and pharmaceutical research and development. In this regard, 80% of the world’s largest pharmaceutical companies have a presence in the region including such market leaders as Wyeth, GlaxoSmithKline, Merck, Centocor, and Cephalon. Most notably, Merck employs 10,000 at a major manufacturing research facility in Montgomery County. The Danish pharmaceutical company, H. Lundbeck A/S plans to locate its new U.S. commercial headquarters to the Greater Philadelphia market and Osstem Co. Ltd., a South Korean firm, will invest over $70 million in a new manufacturing facility in Bucks County, anticipating the creation of 600 jobs over the next five years.
Health Care. Many of the same factors leading to the growth of the bio-tech and pharmaceuticals industries have also made the market area a center for health care. In this regard, there are a variety of primary and secondary health care facilities in the market area with Jefferson Health System (14,317 employees) in Philadelphia County, Crozer-Keystone Health System (7,026 employees) in Delaware County, The Cooper Health System (3,951 employees) in Camden County and Virtua Health (3,266 employees) in Burlington County being among the largest.
Science and Technology. The Philadelphia area is a center for science and technology employment, as it is the 6th largest information technology sector in the country. Additionally, area colleges graduate 66,000 each year to bolster the available pool of educated workers. Furthermore, the area’s high concentration of major science, technology and large businesses that utilize technology (e.g., Lockheed Martin, Boeing, SAP, Siemens, GlaxoSmithKline, Merck, the U.S. Navy and others) has created numerous spin-off business opportunities, supports cluster development and act as magnets for other companies to locate to the market area.
|
|
RP® Financial, LC. | MARKET AREA |
| II.13 |
Comparative unemployment rates for Chester County, as well as for the U.S. and Pennsylvania, are shown in Table 2.5. Chester County’s September 2007 unemployment rate of 3.1% was below the respective U.S. and Pennsylvania unemployment rates of 4.5% and 4.1%. The comparatively lower unemployment rate indicated for Chester County is indicative of the area’s favorable demographic characteristics, which has fostered growth of the local economy. September 2007 unemployment rates for Chester County and Pennsylvania were slightly lower compared to a year ago, while the September 2007 unemployment rate for the U.S. was slightly higher compared to the year ago rate.
Table 2.5
Malvern Federal Savings Bank
Unemployment Trends (1)
|
|
|
|
|
|
|
|
Region |
| September 2006 |
| September 2007 |
| ||
|
|
| |||||
United States |
|
| 4.4% |
|
| 4.5% |
|
Pennsylvania |
|
| 4.3 |
|
| 4.1 |
|
Chester County |
|
| 3.3 |
|
| 3.1 |
|
(1) Unemployment rates have not been seasonally adjusted.
Source: U.S. Bureau of Labor Statistics.
Market Area Deposit Characteristics and Competition
The Bank’s retail deposit base is closely tied to the economic fortunes of Chester County and, in particular, the areas of the county that are nearby to one of Malvern Federal’s branches. Table 2.6 displays deposit market trends from June 30, 2004 through June 30, 2007 for Malvern Federal, as well as for all commercial bank and savings institution branches located in Chester County and Pennsylvania. The data indicates that bank and thrift deposits in Chester County increased at a 7.1% annual rate from June 30, 2004 through June 30, 2007, which approximated Pennsylvania’s annual deposit growth rate of 7.1%. Consistent with the state of Pennsylvania, banks maintained a larger market share of deposits than savings institutions in Chester
|
|
RP® Financial, LC. | MARKET AREA |
| II.14 |
Table 2.6
Malvern Federal Savings Bank
Deposit Summary
|
|
|
|
|
|
|
|
|
|
|
|
|
|
|
|
|
|
|
|
|
|
|
|
| As of June 30, |
|
|
|
| ||||||||||||||||
|
|
|
|
|
| |||||||||||||||||
|
| 2004 |
| 2007 |
| Deposit |
| |||||||||||||||
|
|
|
| |||||||||||||||||||
|
| Deposits |
| Market |
| Number of |
| Deposits |
| Market |
| No. of |
| |||||||||
| ||||||||||||||||||||||
|
|
|
|
|
|
|
|
| ||||||||||||||
|
| (Dollars in Millions) |
| (%) |
| |||||||||||||||||
|
|
|
|
|
|
|
|
|
|
|
|
|
|
|
|
|
|
|
|
|
|
|
Pennsylvania |
| $ | 210,672 |
|
| 100.0 | % |
| 4,608 |
| $ | 259,411 |
|
| 100.0 | % |
| 4,758 |
|
| 7.2 | % |
Commercial Banks |
|
| 151,088 |
|
| 71.7 | % |
| 3,331 |
|
| 189,718 |
|
| 73.1 | % |
| 3,432 |
|
| 7.9 | % |
Savings Institutions |
|
| 59,584 |
|
| 28.3 | % |
| 1,277 |
|
| 69,693 |
|
| 26.9 | % |
| 1,326 |
|
| 5.4 | % |
|
|
|
|
|
|
|
|
|
|
|
|
|
|
|
|
|
|
|
|
|
|
|
Chester County |
| $ | 7,395 |
|
| 100.0 | % |
| 185 |
| $ | 9,097 |
|
| 100.0 | % |
| 208 |
|
| 7.1 | % |
Commercial Banks |
|
| 5,355 |
|
| 72.4 | % |
| 138 |
|
| 6,503 |
|
| 71.5 | % |
| 142 |
|
| 6.7 | % |
Savings Institutions |
|
| 2,040 |
|
| 27.6 | % |
| 47 |
|
| 2,594 |
|
| 28.5 | % |
| 66 |
|
| 8.3 | % |
Malvern FSB |
|
| 372 |
|
| 5.0 | % |
| 6 |
|
| 430 |
|
| 4.7 | % |
| 7 |
|
| 4.9 | % |
Source: FDIC.
County. The larger deposit market share maintained by commercial banks was supported by their significantly larger branch presence.
The Bank’s $430 million of deposits at June 30, 2007 represented a 4.7% market share of bank and thrift deposits maintained in Chester County. Malvern Federal’s deposits increased at a 4.9% annual rate from June 30, 2004 through June 30, 2007, which resulted in a slight reduction in the Bank’s deposit market share from 5.0% to 4.7% for the three year period.
The Bank faces notable competition in both deposit gathering and lending activities, including direct competition with several financial institutions that primarily have a local or regional presence. Securities firms, credit unions and mutual funds also represent major sources of competition in raising deposits. In many cases, these competitors are also seeking to provide some or all of the community-oriented services as Malvern Federal. With regard to lending competition, the Bank encounters the most significant competition from the same institutions providing deposit services. In addition, the Bank competes with mortgage companies and independent mortgage brokers for mortgage loan market share. Table 2.7 lists the Bank’s largest competitors
|
|
RP® Financial, LC. | MARKET AREA |
| II.15 |
in Chester County, based on deposit market share as noted parenthetically. As of June 30, 2007, the Bank’s 4.7% deposit market share represented the eighth largest market share of deposits in Chester County.
Table 2.7
Malvern Federal Savings Bank
Market Area Deposit Competitors
|
|
|
Location |
| Name |
| ||
Chester County |
| Wachovia Bank (15.6%) |
|
| Citizens Bank (9.8%) |
|
| National Penn Bank (8.5%) |
|
| Malvern Federal (4.7%) - Rank of 8 |
Source: FDIC. |
|
|
|
|
RP® Financial, LC. | PEER GROUP ANALYSIS |
| III.1 |
This chapter presents an analysis of Malvern Federal’s operations versus a group of comparable companies (the “Peer Group”) selected from the universe of all publicly-traded savings institutions. The primary basis of the pro forma market valuation of the Bank is provided by these public companies. Factors affecting the Bank’s pro forma market value such as financial condition, credit risk, interest rate risk, and recent operating results can be readily assessed in relation to the Peer Group. Current market pricing of the Peer Group, subject to appropriate adjustments to account for differences between the Bank and the Peer Group, will then be used as a basis for the valuation of the Bank’s to-be-issued common stock.
The mutual holding company form of ownership has been in existence in its present form since 1991. As of the date of this appraisal, there were approximately 40 publicly-traded institutions operating as subsidiaries of MHCs. We believe there are a number of characteristics of MHC shares that make them different from the shares of fully-converted companies. These factors include: (1) lower aftermarket liquidity in the MHC shares since less than 50% of the shares are available for trading; (2) guaranteed minority ownership interest, with no opportunity of exercising voting control of the institution in the MHC form of organization; (3) the potential impact of “second-step” conversions on the pricing of public MHC institutions; (4) the regulatory policies regarding the dividend waiver by MHC institutions; and (5) most MHCs have formed mid-tier holding companies, facilitating the ability for stock repurchases, thus improving the liquidity of the stock on an interim basis. We believe that each of these factors has an impact on the pricing of the shares of MHC institutions, and that such factors are not reflected in the pricing of fully-converted public companies.
Given the unique characteristics of the MHC form of ownership, RP Financial concluded that the appropriate Peer Group for the Bank’s valuation should be comprised of subsidiary institutions of mutual holding companies. The selection of
|
|
RP® Financial, LC. | PEER GROUP ANALYSIS |
| III.2 |
publicly-traded mutual holding companies for the Bank’s Peer Group is consistent with the regulatory guidelines and other recently completed MHC transactions. Further, the Peer Group should be comprised of only those MHC institutions whose common stock is either listed on a national exchange or is NASDAQ listed, since the market for companies trading in this fashion is regular and reported. We believe non-listed MHC institutions are inappropriate for the Peer Group, since the trading activity for thinly-traded stocks is typically highly irregular in terms of frequency and price and may not be a reliable indicator of market value. We have excluded from the Peer Group those public MHC institutions that are currently pursuing a “second-step” conversion and/or companies whose market prices appear to be distorted by speculative factors or unusual operating conditions. MHCs which have recently completed a minority stock offering have been excluded as well, due to the lack of a seasoned trading history and insufficient quarterly financial data that includes the impact of the offering proceeds. The universe of all publicly-traded institutions is included as Exhibit III-1.
This appraisal includes two sets of financial data and ratios for the Peer Group institutions. The first set of financial data reflects the actual book value, earnings, assets and operating results reported by the Peer Group institutions in its public filings inclusive of the minority ownership interest outstanding to the public. The second set of financial data, discussed at length in the following chapter, places the Peer Group institutions on equal footing by restating their financial data and pricing ratios on a “fully-converted” basis through assuming the sale of the majority shares held by the MHCs in public offerings based on their current trading prices and standard assumptions for a thrift conversion offering. Throughout the appraisal, the adjusted figures will be specifically identified as being on a “fully-converted” basis. Unless so noted, the figures referred to in the appraisal will be actual financial data reported by the Peer Group institutions.
Both sets of financial data have their specific use and applicability to the appraisal. The actual financial data, as reported by the Peer Group companies and
|
|
RP® Financial, LC. | PEER GROUP ANALYSIS |
| III.3 |
reflective of the minority interest outstanding, will be used in Chapter III to make financial comparisons between the Peer Group and the Bank. The differences between the Peer Group’s reported financial data and the financial data of the Bank are not significant enough to distort the conclusions of the comparison (in fact, such differences are greater in a standard conversion appraisal). The adjusted financial data (fully-converted basis) will be more fully described and quantified in the pricing analysis discussed in Chapter IV. The fully-converted pricing ratios are considered critical to the valuation analysis in Chapter IV, because they place each Peer Group institution on a fully-converted basis (making their pricing ratios comparable to the pro forma valuation conclusion reached herein), eliminate distortion in pricing ratios between Peer Group institutions that have sold different percentage ownership interests to the public, and reflect the implied pricing ratios being placed on the Peer Group institutions in the market today to reflect the unique trading characteristics of publicly-traded MHC institutions.
Under ideal circumstances, the Peer Group would be comprised of ten publicly-traded Washington-based MHC institutions with capital, earnings, credit quality and interest rate risk comparable to the Bank. However, given the limited number of publicly-traded institutions in the MHC form of ownership, the selection criteria was somewhat broad-based. In selecting Malvern Federal’s Peer Group, the following criteria were applied: (1) publicly-traded MHCs based in the Mid-Atlantic region of the U.S.; (2) assets between $350 million and $1 billion; and (3) profitable on a reported and core earnings basis. Peer Group candidates with less than one year of trading history or have announced second-step conversions were excluded from consideration for the Peer Group. The universe of all publicly-traded MHC institutions, exclusive of institutions that have announced second-step conversions, is included as Exhibit III-2 and Exhibit III-3 provides summary demographic and deposit market share data for the primary market areas served by each of the Peer Group companies.
|
|
RP® Financial, LC. | PEER GROUP ANALYSIS |
| III.4 |
Unlike the universe of fully-converted publicly-traded thrifts, which includes approximately 125 companies, the universe of public MHC institutions is small, thereby reducing the prospects of a highly comparable Peer Group. Nonetheless, because the trading characteristics of public MHC institution shares are significantly different from those of fully-converted companies, public MHC institutions were the most appropriate group to consider as Peer Group candidates for this valuation. Relying solely on full stock public companies for the Peer Group would not capture the difference in current market pricing for public MHC institutions and thus could lead to distorted valuation conclusions. The federal regulatory agencies have previously concurred with this selection procedure of the Peer Group for MHC valuations. To account for differences between the Bank and the MHC Peer Group in reaching a valuation conclusion, it will be necessary to make certain valuation adjustments. The following discussion addresses financial similarities and differences between the Bank and the Peer Group.
Table 3.1 on the following page lists key general characteristics of the Peer Group companies. Although there are differences among several of the Peer Group members, by and large they are well-capitalized and profitable institutions and their decision to reorganize in MHC form suggests a commonality of operating philosophy. Importantly, the trading prices of the Peer Group companies reflect the unique operating and other characteristics of public MHC institutions. While the Peer Group is not exactly comparable to Malvern Federal, we believe such companies form a good basis for the valuation of the Bank, subject to certain valuation adjustments.
In aggregate, the Peer Group companies maintain a higher level of capital relative to the universe of all public thrifts (15.91% of assets versus 12.75% for the all public average), generate comparable earnings on a return on average assets basis (0.56% ROAA versus 0.52% for the all public average), and generate a lower return on equity (3.56% ROE versus 4.65% for the all public average). The summary table below underscores the key differences, particularly in the average pricing ratios between full stock and MHC institutions (both as reported and on a fully-converted basis).
|
|
RP® Financial, LC. | PEER GROUP ANALYSIS |
| III.5 |
Table 3.1
Peer Group of Publicly-Traded Thrifts
December 7, 2007(1)
|
|
|
|
|
|
|
|
|
|
|
|
|
|
|
|
|
|
|
|
|
|
|
|
|
|
|
|
Ticker |
| Financial Institution |
| Exchange |
| Primary Market |
| Operating |
| Total |
| Offices |
| Fiscal |
| Conv. |
| Stock |
| Market |
| ||||||
|
|
|
|
|
|
|
|
|
|
| |||||||||||||||||
|
|
|
|
|
|
|
|
|
|
|
|
|
|
|
|
|
|
|
|
|
| ||||||
ROMA |
| Roma Financial Corp. MHC of NJ (31.0) |
| NASDAQ |
| Robbinsville, NJ |
| Thrift |
| $ | 877 |
|
| 8 |
|
| 12-31 |
|
| 07/06 |
| $ | 16.35 |
| $ | 519 |
|
CSBK |
| Clifton Savings Bancorp MHC of NJ (41.0) |
| NASDAQ |
| Clifton, NJ |
| Thrift |
| $ | 792 |
|
| 10 |
|
| 03-31 |
|
| 03/04 |
| $ | 10.40 |
| $ | 290 |
|
FXCB |
| Fox Chase Bancorp MHC of PA (44.5) |
| NASDAQ |
| Hatboro, PA |
| Thrift |
| $ | 745 |
|
| 11 |
|
| 12-31 |
|
| 10/06 |
| $ | 11.95 |
| $ | 175 |
|
OSHC |
| Ocean Shore Holding MHC of NJ (44.0) |
| NASDAQ |
| Ocean City, NJ |
| Thrift |
| $ | 603 |
|
| 6 |
|
| 12-31 |
|
| 12/04 |
| $ | 10.35 |
| $ | 87 |
|
ONFC |
| Oneida Financial MHC of NY (43.9) |
| NASDAQ |
| Oneida, NY |
| Thrift |
| $ | 514 |
|
| 10 |
|
| 12-31 |
|
| 12/98 |
| $ | 10.25 |
| $ | 80 |
|
PBIP |
| Prudential Bancorp MHC PA (40.5) |
| NASDAQ |
| Philadelphia, PA |
| Thrift |
| $ | 477 | J |
| 6 |
|
| 09-30 |
|
| 03/05 |
| $ | 12.50 |
| $ | 145 |
|
MGYR |
| Magyar Bancorp MHC of NJ (45.1) |
| NASDAQ |
| New Brunswick, NJ |
| Thrift |
| $ | 474 | J |
| 3 |
|
| 09-30 |
|
| 01/06 |
| $ | 11.06 |
| $ | 64 |
|
COBK |
| Colonial Bank MHC of NJ (44.9) |
| NASDAQ |
| Bridgeton, NJ |
| Thrift |
| $ | 439 |
|
| 6 |
|
| 12-31 |
|
| 06/05 |
| $ | 10.38 |
| $ | 46 |
|
BFSB |
| Brooklyn Federal MHC of NY (31.0) |
| NASDAQ |
| Brooklyn, NY |
| Thrift |
| $ | 390 |
|
| 4 |
|
| 09-30 |
|
| 04/05 |
| $ | 13.60 |
| $ | 182 |
|
LSBK |
| Lake Shore Bancorp MHC of NY (43.7) |
| NASDAQ |
| Dunkirk, NY |
| Thrift |
| $ | 356 |
|
| 8 |
|
| 12-31 |
|
| 04/06 |
| $ | 9.00 |
| $ | 58 |
|
|
|
|
NOTES: | (1) | Or most recent date available (M=March, S=September, D=December, J=June, E=Estimated, and P=Pro Forma). |
|
|
|
| (2) | Operating strategies are: Thrift=Traditional Thrift, M.B.=Mortgage Banker, R.E.=Real Estate Developer, Div.=Diversified and Ret.=Retail Banking. |
|
|
|
| (3) | BIF-insured savings bank institution. |
|
|
|
Source: | Corporate offering circulars, data derived from information published in SNL Securities Quarterly Thrift Report, and financial reports of publicly-traded thrifts. | |
|
|
RP® Financial, LC. | PEER GROUP ANALYSIS |
| III.6 |
|
|
|
|
|
|
|
|
|
|
|
|
| All Publicly- |
| Reported |
| Fully |
| |||
|
|
|
|
| ||||||
Financial Characteristics (Averages) |
|
|
|
|
|
|
|
|
|
|
Assets ($Mil) |
|
| 3,173 |
|
| 567 |
|
| 653 |
|
Equity/Assets (%) |
|
| 12.75 | % |
| 15.91 | % |
| 25.30 | % |
Return on Assets (%) |
|
| 0.52 |
|
| 0.56 |
|
| 0.71 |
|
Return on Equity (%) |
|
| 4.65 |
|
| 3.56 |
|
| 2.85 |
|
|
|
|
|
|
|
|
|
|
|
|
Pricing Ratios (Averages)(2) |
|
|
|
|
|
|
|
|
|
|
Price/Earnings (x) |
|
| 20.53 | x |
| 33.01 | x |
| 28.33 | x |
Price/Book (%) |
|
| 117.66 | % |
| 156.75 | % |
| 86.51 | % |
Price/Assets (%) |
|
| 15.21 |
|
| 26.68 |
|
| 22.53 |
|
|
|
|
| (1) | Includes thrifts in full stock and MHC form. |
|
|
|
| (2) | Based on market prices as of December 7, 2007. |
�� The following sections present a comparison of the Bank’s financial condition, income and expense trends, loan composition, interest rate risk and credit risk versus the figures reported by the Peer Group. The conclusions drawn from the comparative analysis are then factored into the valuation analysis discussed in the final chapter.
Table 3.2 shows comparative balance sheet measures for Malvern Federal and the Peer Group, as of September 30, 2007 or the most recent date publicly available. The Bank’s equity ratio of 8.0% of assets was well below the Peer Group’s average ratio of 15.9%. With the consummation of the reorganization and infusion of the net conversion proceeds, the Bank’s equity ratio will be more comparable to the Peer Group average. All of Malvern Federal’s equity consisted of tangible equity, while the Peer Group’s equity included intangibles equal to 0.5% of assets.
The interest-earning asset compositions for the Bank and the Peer Group were somewhat similar, with loans constituting the bulk of interest-earning assets for both Malvern Federal and the Peer Group. The Bank’s loans-to-assets ratio of 86.1% was higher than the comparable Peer Group ratio of 61.1%. Comparatively, the Bank’s cash and investments-to-assets ratio of 9.8% was lower than the comparable ratio for the
|
|
RP® Financial, LC. | PEER GROUP ANALYSIS |
| III.7 |
Table 3.2
Balance Sheet Composition and Growth Rates
Comparable Institution Analysis
As of September 30, 2007
|
|
|
|
|
|
|
|
|
|
|
|
|
|
|
|
|
|
|
|
|
|
|
|
|
|
|
|
|
|
|
|
|
|
|
| Balance Sheet as a Percent of Assets |
| ||||||||||||||||||||||||||||||
|
| ||||||||||||||||||||||||||||||||
|
| Cash & |
| MBS & |
| Loans |
| Deposits |
| Borrowed |
| Subd. |
| Net |
| Goodwill |
| Tng Net |
| MEMO: |
| ||||||||||||
|
|
|
|
|
|
|
|
|
|
|
| ||||||||||||||||||||||
Malvern Federal Savings Bank |
|
|
|
|
|
|
|
|
|
|
|
|
|
|
|
|
|
|
|
|
|
|
|
|
|
|
|
|
|
|
| ||
September 30, 2007 |
|
| 3.4 | % |
| 6.4 | % |
| 86.1 | % |
| 78.5 | % |
| 12.9 | % |
| 0.0 | % |
| 8.0 | % |
| 0.0 | % |
| 8.0 | % |
| 0.0 | % | ||
|
|
|
|
|
|
|
|
|
|
|
|
|
|
|
|
|
|
|
|
|
|
|
|
|
|
|
|
|
|
|
| ||
All Public Companies |
|
|
|
|
|
|
|
|
|
|
|
|
|
|
|
|
|
|
|
|
|
|
|
|
|
|
|
|
|
|
| ||
Averages |
|
| 3.7 | % |
| 20.1 | % |
| 70.7 | % |
| 68.0 | % |
| 17.8 | % |
| 0.6 | % |
| 12.3 | % |
| 1.0 | % |
| 11.3 | % |
| 0.0 | % | ||
Medians |
|
| 2.6 | % |
| 18.5 | % |
| 72.4 | % |
| 69.2 | % |
| 16.6 | % |
| 0.0 | % |
| 10.4 | % |
| 0.1 | % |
| 9.4 | % |
| 0.0 | % | ||
|
|
|
|
|
|
|
|
|
|
|
|
|
|
|
|
|
|
|
|
|
|
|
|
|
|
|
|
|
|
|
| ||
State of PA |
|
|
|
|
|
|
|
|
|
|
|
|
|
|
|
|
|
|
|
|
|
|
|
|
|
|
|
|
|
|
| ||
Averages |
|
| 3.8 | % |
| 32.7 | % |
| 57.8 | % |
| 63.1 | % |
| 22.7 | % |
| 0.8 | % |
| 12.1 | % |
| 1.5 | % |
| 10.6 | % |
| 0.0 | % | ||
Medians |
|
| 2.0 | % |
| 28.1 | % |
| 62.0 | % |
| 66.2 | % |
| 19.8 | % |
| 0.0 | % |
| 10.1 | % |
| 0.4 | % |
| 6.9 | % |
| 0.0 | % | ||
|
|
|
|
|
|
|
|
|
|
|
|
|
|
|
|
|
|
|
|
|
|
|
|
|
|
|
|
|
|
|
| ||
Comparable Group |
|
|
|
|
|
|
|
|
|
|
|
|
|
|
|
|
|
|
|
|
|
|
|
|
|
|
|
|
|
|
| ||
Averages |
|
| 3.3 | % |
| 29.6 | % |
| 61.1 | % |
| 74.8 | % |
| 7.8 | % |
| 0.3 | % |
| 15.9 | % |
| 0.5 | % |
| 15.4 | % |
| 0.0 | % | ||
Medians |
|
| 2.8 | % |
| 32.9 | % |
| 55.7 | % |
| 73.9 | % |
| 6.3 | % |
| 0.0 | % |
| 16.0 | % |
| 0.0 | % |
| 16.0 | % |
| 0.0 | % | ||
|
|
|
|
|
|
|
|
|
|
|
|
|
|
|
|
|
|
|
|
|
|
|
|
|
|
|
|
|
|
|
| ||
Comparable Group |
|
|
|
|
|
|
|
|
|
|
|
|
|
|
|
|
|
|
|
|
|
|
|
|
|
|
|
|
|
|
| ||
BFSB |
| Brooklyn Federal MHC of NY (31.0) |
|
| 2.4 | % |
| 20.2 | % |
| 72.9 | % |
| 73.5 | % |
| 2.4 | % |
| 0.0 | % |
| 21.8 | % |
| 0.0 | % |
| 21.8 | % |
| 0.0 | % |
CSBK |
| Clifton Savings Bncrp MHC of NJ (41.0) |
|
| 2.9 | % |
| 37.7 | % |
| 54.6 | % |
| 71.1 | % |
| 5.7 | % |
| 0.0 | % |
| 22.2 | % |
| 0.0 | % |
| 22.2 | % |
| 0.0 | % |
COBK |
| Colonial Bank MHC of NJ (44.9) |
|
| 2.7 | % |
| 40.5 | % |
| 52.7 | % |
| 87.2 | % |
| 3.8 | % |
| 0.0 | % |
| 8.6 | % |
| 0.0 | % |
| 8.6 | % |
| 0.0 | % |
FXCB |
| Fox Chase Bancorp MHC of PA (44.5) |
|
| 4.6 | % |
| 34.4 | % |
| 56.7 | % |
| 78.4 | % |
| 4.0 | % |
| 0.0 | % |
| 17.0 | % |
| 0.0 | % |
| 17.0 | % |
| 0.0 | % |
LSBK |
| Lake Shore Bancorp MHC of NY (43.7) |
|
| 2.3 | % |
| 31.4 | % |
| 60.8 | % |
| 67.4 | % |
| 16.0 | % |
| 0.0 | % |
| 15.0 | % |
| 0.0 | % |
| 15.0 | % |
| 0.0 | % |
MGYR |
| Magyar Bancorp MHC of NJ (45.1)(1) |
|
| 1.2 | % |
| 10.7 | % |
| 80.1 | % |
| 75.7 | % |
| 12.7 | % |
| 0.0 | % |
| 10.0 | % |
| 0.0 | % |
| 10.0 | % |
| 0.0 | % |
OSHC |
| Ocean Shore Holding MHC of NJ (44.0) |
|
| 4.1 | % |
| 10.9 | % |
| 80.6 | % |
| 71.0 | % |
| 15.0 | % |
| 2.6 | % |
| 10.4 | % |
| 0.0 | % |
| 10.4 | % |
| 0.0 | % |
ONFC |
| Oneida Financial MHC of NY (43.9) |
|
| 5.5 | % |
| 25.7 | % |
| 54.6 | % |
| 76.5 | % |
| 11.1 | % |
| 0.0 | % |
| 11.4 | % |
| 5.0 | % |
| 6.4 | % |
| 0.0 | % |
PBIP |
| Prudential Bancorp MHC PA (40.5)(1) |
|
| 2.3 | % |
| 48.0 | % |
| 46.8 | % |
| 74.2 | % |
| 6.9 | % |
| 0.0 | % |
| 17.3 | % |
| 0.0 | % |
| 17.3 | % |
| 0.0 | % |
ROMA |
| Roma Financial Corp MHC of NJ (31.0) |
|
| 5.3 | % |
| 36.4 | % |
| 51.3 | % |
| 72.6 | % |
| 0.7 | % |
| 0.0 | % |
| 25.4 | % |
| 0.1 | % |
| 25.3 | % |
| 0.0 | % |
|
|
|
|
|
|
|
|
|
|
|
|
|
|
|
|
|
|
|
|
|
|
|
|
|
|
|
|
|
|
|
|
|
|
|
| Balance Sheet Annual Growth Rates |
|
|
| Regulatory Capital |
| ||||||||||||||||||||||||||
|
|
| |||||||||||||||||||||||||||||||
|
| Assets |
| MBS, Cash & |
| Loans |
| Deposits |
| Borrows. |
| Net |
| Tng Net |
| Tangible |
| Core |
| Reg. Cap. |
| ||||||||||||
|
|
|
|
|
|
|
|
|
|
|
| ||||||||||||||||||||||
Malvern Federal Savings Bank |
|
|
|
|
|
|
|
|
|
|
|
|
|
|
|
|
|
|
|
|
|
|
|
|
|
|
|
|
|
|
| ||
September 30, 2007 |
|
| 6.77 | % |
| 30.24 | % |
| 4.31 | % |
| 7.81 | % |
| 0.73 | % |
| 6.98 | % |
| 6.98 | % |
| 8.03 | % |
| 8.03 | % |
| 11.43 | % | ||
|
|
|
|
|
|
|
|
|
|
|
|
|
|
|
|
|
|
|
|
|
|
|
|
|
|
|
|
|
|
|
| ||
All Public Companies |
|
|
|
|
|
|
|
|
|
|
|
|
|
|
|
|
|
|
|
|
|
|
|
|
|
|
|
|
|
|
| ||
Averages |
|
| 5.24 | % |
| -0.95 | % |
| 7.73 | % |
| 4.32 | % |
| 0.64 | % |
| 0.95 | % |
| -0.12 | % |
| 10.86 | % |
| 10.70 | % |
| 17.56 | % | ||
Medians |
|
| 3.24 | % |
| -2.26 | % |
| 5.86 | % |
| 2.94 | % |
| 0.00 | % |
| 0.27 | % |
| -0.27 | % |
| 9.34 | % |
| 9.14 | % |
| 14.57 | % | ||
|
|
|
|
|
|
|
|
|
|
|
|
|
|
|
|
|
|
|
|
|
|
|
|
|
|
|
|
|
|
|
| ||
State of PA |
|
|
|
|
|
|
|
|
|
|
|
|
|
|
|
|
|
|
|
|
|
|
|
|
|
|
|
|
|
|
| ||
Averages |
|
| 2.11 | % |
| -2.21 | % |
| 5.44 | % |
| -2.33 | % |
| 0.52 | % |
| 5.04 | % |
| 4.83 | % |
| 9.57 | % |
| 8.87 | % |
| 18.13 | % | ||
Medians |
|
| 0.70 | % |
| -5.07 | % |
| 5.40 | % |
| 1.67 | % |
| -1.32 | % |
| 1.57 | % |
| 3.43 | % |
| 8.77 | % |
| 8.04 | % |
| 15.80 | % | ||
|
|
|
|
|
|
|
|
|
|
|
|
|
|
|
|
|
|
|
|
|
|
|
|
|
|
|
|
|
|
|
| ||
Comparable Group |
|
|
|
|
|
|
|
|
|
|
|
|
|
|
|
|
|
|
|
|
|
|
|
|
|
|
|
|
|
|
| ||
Averages |
|
| 5.03 | % |
| -4.71 | % |
| 10.01 | % |
| 6.95 | % |
| -2.15 | % |
| -0.49 | % |
| -1.76 | % |
| 12.94 | % |
| 12.94 | % |
| 25.49 | % | ||
Medians |
|
| 2.00 | % |
| -8.64 | % |
| 10.37 | % |
| 2.36 | % |
| -9.26 | % |
| 0.61 | % |
| -1.02 | % |
| 12.41 | % |
| 12.41 | % |
| 24.25 | % | ||
|
|
|
|
|
|
|
|
|
|
|
|
|
|
|
|
|
|
|
|
|
|
|
|
|
|
|
|
|
|
|
| ||
Comparable Group |
|
|
|
|
|
|
|
|
|
|
|
|
|
|
|
|
|
|
|
|
|
|
|
|
|
|
|
|
|
|
| ||
BFSB |
| Brooklyn Federal MHC of NY (31.0) |
|
| -4.32 | % |
| -16.22 | % |
| -0.69 | % |
| 5.96 | % |
| -81.24 | % |
| 6.62 | % |
| 6.62 | % |
| 17.20 | % |
| 17.20 | % |
| 24.30 | % |
CSBK |
| Clifton Savings Bncrp MHC of NJ (41.0) |
|
| -3.75 | % |
| -14.72 | % |
| 0.88 | % |
| 0.27 | % |
| -25.52 | % |
| -8.84 | % |
| -8.84 | % |
| 18.24 | % |
| 18.24 | % |
| 46.81 | % |
COBK |
| Colonial Bank MHC of NJ (44.9) |
|
| 15.85 | % |
| 10.32 | % |
| 19.16 | % |
| 20.72 | % |
| -29.12 | % |
| 1.80 | % |
| 1.80 | % |
| 8.22 | % |
| 8.22 | % |
| 16.26 | % |
FXCB |
| Fox Chase Bancorp MHC of PA (44.5) |
|
| -2.84 | % |
| -23.76 | % |
| 19.54 | % |
| -3.36 | % |
| 0.00 | % |
| 3.47 | % |
| 3.47 | % |
| 12.62 | % |
| 12.62 | % |
| 25.14 | % |
LSBK |
| Lake Shore Bancorp MHC of NY (43.7) |
|
| 1.72 | % |
| -7.14 | % |
| 5.44 | % |
| -1.49 | % |
| 26.40 | % |
| -2.60 | % |
| -2.60 | % |
| 12.20 | % |
| 12.20 | % |
| 24.20 | % |
MGYR |
| Magyar Bancorp MHC of NJ (45.1)(1) |
|
| 15.51 | % |
| 8.35 | % |
| 17.21 | % |
| 12.76 | % |
| 59.11 | % |
| 0.56 | % |
| 0.56 | % |
| NA |
|
| NA |
|
| NA |
|
OSHC |
| Ocean Shore Holding MHC of NJ (44.0) |
|
| 7.24 | % |
| -15.51 | % |
| 12.17 | % |
| 0.29 | % |
| 56.48 | % |
| 0.66 | % |
| 0.66 | % |
| 10.52 | % |
| 10.52 | % |
| 18.89 | % |
ONFC |
| Oneida Financial MHC of NY (43.9) |
|
| 18.27 | % |
| 21.87 | % |
| 13.66 | % |
| 29.68 | % |
| -18.51 | % |
| 5.06 | % |
| -7.65 | % |
| 6.98 | % |
| 6.98 | % |
| 10.69 | % |
PBIP |
| Prudential Bancorp MHC PA (40.5)(1) |
|
| 2.28 | % |
| -0.18 | % |
| 4.18 | % |
| 2.95 | % |
| 13.75 | % |
| -6.99 | % |
| -6.99 | % |
| 17.51 | % |
| 17.51 | % |
| 37.66 | % |
ROMA |
| Roma Financial Corp MHC of NJ (31.0) |
|
| 0.35 | % |
| -10.14 | % |
| 8.57 | % |
| 1.76 | % |
| -22.82 | % |
| -4.63 | % |
| -4.64 | % |
| NA |
|
| NA |
|
| NA |
|
|
|
(1) | Financial information is for the quarter ending June 30, 2007. |
Source: Audited and unaudited financial statements, corporate reports and offering circulars, and RP® Financial, LC. calculations. The information provided in this table has been obtained from sources we believe are reliable.
|
|
RP® Financial, LC. | PEER GROUP ANALYSIS |
| III.8 |
Peer Group of 32.9%. Overall, Malvern Federal’s interest-earning assets amounted to 95.9% of assets, which exceeded the comparable Peer Group ratio of 94.0%.
Malvern Federal’s funding liabilities reflected a funding strategy that was somewhat similar to that of the Peer Group’s funding composition. The Bank’s deposits equaled 78.5% of assets, which was above the Peer Group’s ratio of 74.8%. Malvern Federal also maintained a slightly higher level of borrowings than the Peer Group, as indicated by borrowings-to-assets ratios of 12.9% and 8.1% for Malvern Federal and the Peer Group, respectively. Total interest-bearing liabilities maintained by the Bank and the Peer Group, as a percent of assets, equaled 91.4% and 82.9%, respectively. Following the increase in capital provided by the net proceeds of the stock offering, the Bank’s ratio of interest-bearing liabilities as a percent of assets will be more comparable to the Peer Group’s ratio.
A key measure of balance sheet strength for a thrift institution is its IEA/IBL ratio. Presently, the Bank’s IEA/IBL ratio is lower than the Peer Group’s ratio, based on respective ratios of 104.9% and 113.4%. The additional capital realized from stock proceeds should serve to increase the Bank’s IEA/IBL ratio, as the interest free capital realized in Malvern Federal’s stock offering will reduce the level of interest-bearing liabilities funding assets and net proceeds realized from the stock offering are expected to be mostly deployed into interest-earning assets.
The growth rate section of Table 3.2 shows annual growth rates for key balance sheet items. Malvern Federal’s and the Peer Group’s growth rates are based on annual growth rates for the twelve months ended September 30, 2007 or the most recent period available for the Peer Group companies. Malvern Federal and the Peer Group posted comparable asset growth rates of 6.8% and 5.0%, respectively. Asset growth for Malvern Federal consisted of a combination of cash and investments and loans, with the significantly higher growth rate indicated for cash and investments attributable to the comparatively lower balance of cash and investments maintained relative to loans. Asset growth for the Peer Group was sustained by loan growth, which was in part funded with redeployment of cash and investments.
|
|
RP® Financial, LC. | PEER GROUP ANALYSIS |
| III.9 |
Deposit growth of 7.8% funded most of the Bank’s asset growth, which was supplemented with a nominal increase in borrowings. The Peer Group posted a slightly lower deposit growth rate of 7.0% and a 2.2% decrease in borrowings. The Bank’s capital growth rate equaled 7.0%, versus a 0.5% decline in capital for the Peer Group. The Bank’s higher capital growth rate was supported by retention of all of its earnings and maintenance of a lower level of capital. Comparatively, the Peer Group’s capital growth rate was slowed by dividend payments as well as stock repurchases. The increase in capital realized from stock proceeds will likely depress the Bank’s capital growth rate initially following the stock offering. Dividend payments and stock repurchases, pursuant to regulatory limitations and guidelines, could also potentially slow the Bank’s capital growth rate in the longer term following the stock offering.
Table 3.3 displays statements of operations for the Bank and the Peer Group, based on earnings for the twelve months ended September 30, 2007, unless otherwise indicated for the Peer Group companies. Malvern Federal and the Peer Group reported net income to average assets ratios of 0.45% and 0.56%, respectively. Higher levels of net interest income and non-interest operating income, a lower level of loan loss provisions and a lower effective tax rate accounted for the Peer Group’s higher return. The Bank’s earnings reflected a comparative earnings advantage with respect to maintaining a lower level of operating expenses.
The Peer Group’s stronger net interest margin was realized through maintenance of a lower interest expense ratio, which was partially offset by the Bank’s higher interest income ratio. The Bank’s higher interest income ratio was realized through maintaining a higher concentration of assets in interest-earning assets and earning a higher yield on interest-earning assets (6.42% versus 5.88% for the Peer Group). The higher yield earned by Malvern Federal was supported by an interest-earning asset composition that consisted of a higher concentration of loans in comparison to the Peer Group’s interest-earning asset composition. The Peer Group’s lower interest expense ratio was supported by maintenance of a lower cost of funds (3.40% versus 4.00% for the Bank)
|
|
RP® Financial, LC. | PEER GROUP ANALYSIS |
|
Income as Percent of Average Assets and Yields, Costs, Spreads |
Comparable Institution Analysis |
For the 12 Months Ended September 30, 2007 |
|
|
|
|
|
|
|
|
|
|
|
|
|
|
|
|
|
|
|
|
|
|
|
|
|
|
|
|
|
|
|
|
|
|
|
|
|
| Net Interest Income |
|
|
| Other Income |
|
|
| ||||||||||||||||||||||
|
|
|
|
|
|
|
|
|
| ||||||||||||||||||||||||
|
| Net |
| Income |
| Expense |
| NII |
| Loss |
| NII |
| Loan |
| R. E. |
| Other |
| Total |
| ||||||||||||
|
|
|
|
|
|
|
|
|
|
|
| ||||||||||||||||||||||
|
|
|
|
|
|
|
|
|
|
|
|
|
|
|
|
|
|
|
|
|
|
|
|
|
|
|
|
|
|
|
| ||
Malvern Federal Savings Bank |
|
|
|
|
|
|
|
|
|
|
|
|
|
|
|
|
|
|
|
|
|
|
|
|
|
|
|
|
|
|
| ||
September 30, 2007 |
|
| 0.45 | % |
| 6.11 | % |
| 3.59 | % |
| 2.52 | % |
| 0.24 | % |
| 2.28 | % |
| 0.00 | % |
| 0.00 | % |
| 0.27 | % |
| 0.27 | % | ||
|
|
|
|
|
|
|
|
|
|
|
|
|
|
|
|
|
|
|
|
|
|
|
|
|
|
|
|
|
|
|
| ||
All Public Companies |
|
|
|
|
|
|
|
|
|
|
|
|
|
|
|
|
|
|
|
|
|
|
|
|
|
|
|
|
|
|
| ||
Averages |
|
| 0.50 | % |
| 5.88 | % |
| 3.17 | % |
| 2.71 | % |
| 0.13 | % |
| 2.58 | % |
| 0.03 | % |
| 0.00 | % |
| 0.61 | % |
| 0.64 | % | ||
Medians |
|
| 0.49 | % |
| 5.80 | % |
| 3.18 | % |
| 2.71 | % |
| 0.07 | % |
| 2.57 | % |
| 0.00 | % |
| 0.00 | % |
| 0.48 | % |
| 0.50 | % | ||
|
|
|
|
|
|
|
|
|
|
|
|
|
|
|
|
|
|
|
|
|
|
|
|
|
|
|
|
|
|
|
| ||
State of PA |
|
|
|
|
|
|
|
|
|
|
|
|
|
|
|
|
|
|
|
|
|
|
|
|
|
|
|
|
|
|
| ||
Averages |
|
| 0.42 | % |
| 5.56 | % |
| 3.20 | % |
| 2.36 | % |
| 0.08 | % |
| 2.29 | % |
| 0.01 | % |
| 0.00 | % |
| 0.44 | % |
| 0.45 | % | ||
Medians |
|
| 0.50 | % |
| 5.57 | % |
| 3.15 | % |
| 2.45 | % |
| 0.04 | % |
| 2.42 | % |
| 0.00 | % |
| 0.00 | % |
| 0.44 | % |
| 0.47 | % | ||
|
|
|
|
|
|
|
|
|
|
|
|
|
|
|
|
|
|
|
|
|
|
|
|
|
|
|
|
|
|
|
| ||
Comparable Group |
|
|
|
|
|
|
|
|
|
|
|
|
|
|
|
|
|
|
|
|
|
|
|
|
|
|
|
|
|
|
| ||
Averages |
|
| 0.56 | % |
| 5.54 | % |
| 2.81 | % |
| 2.73 | % |
| 0.01 | % |
| 2.72 | % |
| 0.00 | % |
| 0.00 | % |
| 0.72 | % |
| 0.73 | % | ||
Medians |
|
| 0.46 | % |
| 5.35 | % |
| 2.90 | % |
| 2.62 | % |
| 0.04 | % |
| 2.67 | % |
| 0.00 | % |
| 0.00 | % |
| 0.40 | % |
| 0.41 | % | ||
|
|
|
|
|
|
|
|
|
|
|
|
|
|
|
|
|
|
|
|
|
|
|
|
|
|
|
|
|
|
|
| ||
|
|
|
|
|
|
|
|
|
|
|
|
|
|
|
|
|
|
|
|
|
|
|
|
|
|
|
|
|
|
|
| ||
Comparable Group |
|
|
|
|
|
|
|
|
|
|
|
|
|
|
|
|
|
|
|
|
|
|
|
|
|
|
|
|
|
|
| ||
BFSB |
| Brooklyn Federal MHC of NY (31.0) |
|
| 0.96 | % |
| 6.93 | % |
| 2.67 | % |
| 4.26 | % |
| 0.01 | % |
| 4.24 | % |
| 0.00 | % |
| 0.00 | % |
| 0.72 | % |
| 0.72 | % |
CSBK |
| Clifton Savings Bncrp MHC of NJ (41.0)(3) |
|
| 0.25 | % |
| 4.74 | % |
| 3.01 | % |
| 1.73 | % |
| 0.05 | % |
| 1.69 | % |
| 0.00 | % |
| 0.00 | % |
| 0.14 | % |
| 0.14 | % |
COBK |
| Colonial Bank MHC of NJ (44.9) |
|
| 0.36 | % |
| 5.35 | % |
| 3.30 | % |
| 2.06 | % |
| 0.03 | % |
| 2.02 | % |
| 0.02 | % |
| 0.00 | % |
| 0.25 | % |
| 0.27 | % |
FXCB |
| Fox Chase Bancorp MHC of PA (44.5) |
|
| 0.48 | % |
| 5.35 | % |
| 2.88 | % |
| 2.47 | % |
| -0.27 | % |
| 2.74 | % |
| 0.00 | % |
| 0.00 | % |
| 0.33 | % |
| 0.33 | % |
LSBK |
| Lake Shore Bancorp MHC of NY (43.7) |
|
| 0.43 | % |
| 5.15 | % |
| 2.53 | % |
| 2.62 | % |
| 0.04 | % |
| 2.58 | % |
| 0.00 | % |
| 0.00 | % |
| 0.56 | % |
| 0.56 | % |
MGYR |
| Magyar Bancorp MHC of NJ (45.1)(1)(3) |
|
| 0.16 | % |
| 6.33 | % |
| 3.44 | % |
| 2.89 | % |
| 0.06 | % |
| 2.83 | % |
| 0.00 | % |
| 0.00 | % |
| 0.39 | % |
| 0.39 | % |
OSHC |
| Ocean Shore Holding MHC of NJ (44.0) |
|
| 0.43 | % |
| 5.48 | % |
| 2.91 | % |
| 2.57 | % |
| 0.05 | % |
| 2.53 | % |
| 0.00 | % |
| 0.00 | % |
| 0.43 | % |
| 0.43 | % |
ONFC |
| Oneida Financial MHC of NY (43.9) |
|
| 0.82 | % |
| 5.22 | % |
| 2.40 | % |
| 2.82 | % |
| 0.01 | % |
| 2.81 | % |
| 0.00 | % |
| 0.00 | % |
| 3.77 | % |
| 3.77 | % |
PBIP |
| Prudential Bancorp MHC PA (40.5)(1) |
|
| 0.80 | % |
| 5.68 | % |
| 3.05 | % |
| 2.63 | % |
| 0.02 | % |
| 2.61 | % |
| 0.00 | % |
| 0.00 | % |
| 0.21 | % |
| 0.21 | % |
ROMA |
| Roma Financial Corp MHC of NJ (31.0) |
|
| 0.89 | % |
| 5.13 | % |
| 1.93 | % |
| 3.20 | % |
| 0.05 | % |
| 3.16 | % |
| 0.01 | % |
| 0.00 | % |
| 0.42 | % |
| 0.43 | % |
|
|
|
|
|
|
|
|
|
|
|
|
|
|
|
|
|
|
|
|
|
|
|
|
|
|
|
|
|
|
|
|
| G&A/Other Exp. |
| Non-Op. Items |
| Yields, Costs, and Spreads |
|
|
| |||||||||||||||||||||
|
|
|
|
|
|
| ||||||||||||||||||||||||
|
| G&A |
| Goodwill |
| Net |
| Extrao. |
| Yield |
| Cost |
| Yld-Cost |
| MEMO: |
| MEMO: |
| |||||||||||
|
|
|
|
|
|
|
|
|
|
| ||||||||||||||||||||
|
|
|
|
|
|
|
|
|
|
|
|
|
|
|
|
|
|
|
|
|
|
|
|
|
|
|
|
| ||
Malvern Federal Savings Bank |
|
|
|
|
|
|
|
|
|
|
|
|
|
|
|
|
|
|
|
|
|
|
|
|
|
|
|
| ||
September 30, 2007 |
|
| 1.89 | % |
| 0.00 | % |
| 0.00 | % |
| 0.00 | % |
| 6.42 | % |
| 4.00 | % |
| 2.42 | % | $ | 6,814 |
|
| 31.77 | % | ||
|
|
|
|
|
|
|
|
|
|
|
|
|
|
|
|
|
|
|
|
|
|
|
|
|
|
|
|
| ||
All Public Companies |
|
|
|
|
|
|
|
|
|
|
|
|
|
|
|
|
|
|
|
|
|
|
|
|
|
|
|
| ||
Averages |
|
| 2.52 | % |
| 0.02 | % |
| 0.06 | % |
| 0.00 | % |
| 6.24 | % |
| 3.65 | % |
| 2.59 | % | $ | 5,770 |
|
| 32.62 | % | ||
Medians |
|
| 2.49 | % |
| 0.00 | % |
| 0.01 | % |
| 0.00 | % |
| 6.07 | % |
| 3.67 | % |
| 2.65 | % | $ | 4,675 |
|
| 32.30 | % | ||
|
|
|
|
|
|
|
|
|
|
|
|
|
|
|
|
|
|
|
|
|
|
|
|
|
|
|
|
| ||
State of PA |
|
|
|
|
|
|
|
|
|
|
|
|
|
|
|
|
|
|
|
|
|
|
|
|
|
|
|
| ||
Averages |
|
| 2.14 | % |
| 0.04 | % |
| -0.01 | % |
| 0.00 | % |
| 5.89 | % |
| 3.65 | % |
| 2.24 | % | $ | 5,900 |
|
| 22.07 | % | ||
Medians |
|
| 2.17 | % |
| 0.00 | % |
| 0.00 | % |
| 0.00 | % |
| 5.83 | % |
| 3.72 | % |
| 2.08 | % | $ | 5,283 |
|
| 25.89 | % | ||
|
|
|
|
|
|
|
|
|
|
|
|
|
|
|
|
|
|
|
|
|
|
|
|
|
|
|
|
| ||
Comparable Group |
|
|
|
|
|
|
|
|
|
|
|
|
|
|
|
|
|
|
|
|
|
|
|
|
|
|
|
| ||
Averages |
|
| 2.68 | % |
| 0.01 | % |
| 0.00 | % |
| 0.00 | % |
| 5.88 | % |
| 3.40 | % |
| 2.48 | % | $ | 5,175 |
|
| 29.38 | % | ||
Medians |
|
| 2.38 | % |
| 0.00 | % |
| 0.00 | % |
| 0.00 | % |
| 5.66 | % |
| 3.48 | % |
| 2.41 | % | $ | 5,286 |
|
| 30.25 | % | ||
|
|
|
|
|
|
|
|
|
|
|
|
|
|
|
|
|
|
|
|
|
|
|
|
|
|
|
|
| ||
Comparable Group |
|
|
|
|
|
|
|
|
|
|
|
|
|
|
|
|
|
|
|
|
|
|
|
|
|
|
|
| ||
BFSB |
| Brooklyn Federal MHC of NY (31.0) |
|
| 3.52 | % |
| 0.00 | % |
| 0.06 | % |
| 0.00 | % |
| 7.24 | % |
| 3.46 | % |
| 3.78 | % |
| NM |
|
| 36.18 | % |
CSBK |
| Clifton Savings Bncrp MHC of NJ (41.0)(3) |
|
| 1.53 | % |
| 0.00 | % |
| 0.00 | % |
| 0.00 | % |
| 4.98 | % |
| 3.93 | % |
| 1.05 | % | $ | 8,897 |
|
| 17.37 | % |
COBK |
| Colonial Bank MHC of NJ (44.9) |
|
| 2.07 | % |
| 0.00 | % |
| 0.01 | % |
| 0.00 | % |
| 5.57 | % |
| 3.64 | % |
| 1.93 | % | $ | 5,700 |
|
| NM |
|
FXCB |
| Fox Chase Bancorp MHC of PA (44.5) |
|
| 2.51 | % |
| 0.00 | % |
| -0.09 | % |
| 0.00 | % |
| 5.60 | % |
| 3.49 | % |
| 2.11 | % | $ | 5,286 |
|
| 23.33 | % |
LSBK |
| Lake Shore Bancorp MHC of NY (43.7) |
|
| 2.56 | % |
| 0.00 | % |
| 0.00 | % |
| 0.00 | % |
| 5.44 | % |
| 3.05 | % |
| 2.39 | % | $ | 3,832 |
|
| 25.10 | % |
MGYR |
| Magyar Bancorp MHC of NJ (45.1)(1)(3) |
|
| 2.99 | % |
| 0.00 | % |
| 0.00 | % |
| 0.00 | % |
| 6.88 | % |
| 3.89 | % |
| 2.99 | % |
| NM |
|
| NM |
|
OSHC |
| Ocean Shore Holding MHC of NJ (44.0) |
|
| 2.26 | % |
| 0.00 | % |
| 0.00 | % |
| 0.00 | % |
| 5.73 | % |
| 3.30 | % |
| 2.43 | % | $ | 5,071 |
|
| 38.19 | % |
ONFC |
| Oneida Financial MHC of NY (43.9) |
|
| 5.40 | % |
| 0.13 | % |
| -0.02 | % |
| 0.00 | % |
| 6.08 | % |
| 2.78 | % |
| 3.30 | % | $ | 1,854 |
|
| 31.32 | % |
PBIP |
| Prudential Bancorp MHC PA (40.5)(1) |
|
| 1.71 | % |
| 0.00 | % |
| 0.01 | % |
| 0.00 | % |
| 5.83 | % |
| 3.79 | % |
| 2.04 | % |
| NM |
|
| 29.19 | % |
ROMA |
| Roma Financial Corp MHC of NJ (31.0) |
|
| 2.23 | % |
| 0.00 | % |
| 0.00 | % |
| 0.00 | % |
| 5.49 | % |
| 2.66 | % |
| 2.83 | % | $ | 5,585 |
|
| 34.36 | % |
|
|
(1) | Financial information is for the quarter ending June 30, 2007. |
| |
(3) | Income and expense information has been annualized from available financial information. |
|
|
Source: | Audited and unaudited financial statements, corporate reports and offering circulars, and RP® Financial, LC. calculations. The information provided in this table has been obtained from sources we believe are reliable, but we cannot guarantee the accuracy or completeness of such information. |
| |
Copyright (c) 2007 by RP® Financial, LC. | |
|
|
RP® Financial, LC. | PEER GROUP ANALYSIS |
and maintenance of a lower level of interest-bearing liabilities funding assets. Overall, Malvern Federal and the Peer Group reported net interest income to average assets ratios of 2.52% and 2.73%, respectively.
In another key area of core earnings strength, the Bank maintained a lower level of operating expenses than the Peer Group. For the period covered in Table 3.3, the Bank and the Peer Group reported operating expense to average assets ratios of 1.89% and 2.69%, respectively. Consistent with the Bank’s lower operating expense ratio, Malvern Federal maintained a comparatively lower number of employees relative to its asset size. Assets per full time equivalent employee equaled $6.8 million for the Bank, versus a comparable measure of $5.2 million for the Peer Group. The Peer Group’s higher operating expense ratio could in part be attributed to greater diversification of operations with respect to generating revenues derived from non-interest operating income. On a post-offering basis, the Bank’s operating expenses can be expected to increase with the addition of stock benefit plans and certain expenses that result from being a publicly-traded company, with such expenses already impacting the Peer Group’s operating expenses. At the same time, Malvern Federal’s capacity to leverage operating expenses will be more comparable to the Peer Group’s leverage capacity following the increase in capital realized from the infusion of net stock proceeds.
When viewed together, net interest income and operating expenses provide considerable insight into a thrift’s earnings strength, since those sources of income and expenses are typically the most prominent components of earnings and are generally more predictable than losses and gains realized from the sale of assets or other non-recurring activities. In this regard, as measured by their expense coverage ratios (net interest income divided by operating expenses), the Bank’s earnings were stronger than the Peer Group’s. Expense coverage ratios posted by Malvern Federal and the Peer Group equaled 1.33x and 1.01x, respectively.
As noted above, sources of non-interest operating income provided a larger contribution to the Peer Group’s earnings. Non-interest operating income equaled 0.27% and 0.73% of Malvern Federal’s and the Peer Group’s average assets, respectively. Taking non-interest operating income into account in comparing the
|
|
RP® Financial, LC. | PEER GROUP ANALYSIS |
Bank’s and the Peer Group’s earnings, Malvern Federal’s efficiency ratio (operating expenses, net of amortization of intangibles, as a percent of the sum of non-interest operating income and net interest income) of 67.7% was more favorable than the Peer Group’s efficiency ratio of 77.5%.
Loan loss provisions had a larger impact on Malvern Federal’s earnings, with loan loss provisions established by the Bank and the Peer Group equaling 0.24% and 0.01% of average assets, respectively. The comparatively larger impact of loan loss provisions on the Bank’s earnings was consistent with the Bank’s higher concentration of assets maintained in loans, as well as a comparatively greater degree of diversification into higher risk types of loans (see Table 3.4).
Net gains and losses were not a material factor in either the Bank’s or the Peer Group’s earnings for twelve month period analyzed. Typically, gains and losses generated from the sale of assets are viewed as earnings with a relatively high degree of volatility, particularly to the extent that such gains and losses result from the sale of investments or other assets that are not considered to be part of an institution’s core operations. Extraordinary items also were not a factor in either the Bank’s or the Peer Group’s earnings.
Taxes had a slightly larger impact on the Peer Group’s earnings, as the Bank and the Peer Group posted effective tax rates of 31.77% and 29.38%, respectively. As indicated in the prospectus, the Bank’s effective marginal tax rate is equal to 38.5%.
Table 3.4 presents data related to the Bank’s and the Peer Group’s loan portfolio compositions (including the investment in mortgage-backed securities and CMOs). The Bank’s loan portfolio composition reflected a lower concentration of 1-4 family permanent mortgage loans and mortgage-backed securities than maintained by the Peer Group (37.5% of assets versus 53.3% for the Peer Group). The Bank’s lower ratio was primarily attributable to maintaining a lower concentration of mortgage-backed securities, while the Bank also maintained a slightly lower concentration of 1-4 family loans than the Peer Group. Loans serviced for others equaled 7.7% and 7.1% of the
|
|
RP® Financial, LC. | PEER GROUP ANALYSIS |
| III.13 |
Table 3.4
Loan Portfolio Composition and Related Information
Comparable Institution Analysis
As of September 30, 2007
|
|
|
|
|
|
|
|
|
|
|
|
|
|
|
|
|
|
|
|
|
|
|
|
|
|
|
|
|
|
|
| Portfolio Composition as a Percent of Assets |
|
|
|
|
|
|
| ||||||||||||||||||||
|
|
|
|
|
|
|
|
| |||||||||||||||||||||
Institution |
| MBS |
| 1-4 |
| Constr. |
| 5+Unit |
| Commerc. |
| Consumer |
| RWA/ |
| Serviced |
| Servicing |
| ||||||||||
|
|
|
|
|
|
|
|
|
| ||||||||||||||||||||
|
| (%) |
| (%) |
| (%) |
| (%) |
| (%) |
| (%) |
| (%) |
| ($000) |
| ($000) |
| ||||||||||
|
|
|
|
|
|
|
|
|
|
|
|
|
|
|
|
|
|
|
|
|
|
|
|
|
|
|
|
| |
Malvern Federal Savings Bank |
|
| 2.48 | % |
| 35.05 | % |
| 11.87 | % |
| 20.07 | % |
| 2.86 | % |
| 16.68 | % |
| 77.44 | % | $ | 42,650 |
| $ | 371 |
| |
|
|
|
|
|
|
|
|
|
|
|
|
|
|
|
|
|
|
|
|
|
|
|
|
|
|
|
|
| |
Comparable Group |
|
|
|
|
|
|
|
|
|
|
|
|
|
|
|
|
|
|
|
|
|
|
|
|
|
|
|
| |
Averages |
|
| 13.81 | % |
| 39.52 | % |
| 5.56 | % |
| 11.74 | % |
| 2.55 | % |
| 1.67 | % |
| 57.42 | % | $ | 40,060 |
| $ | 157 |
| |
Medians |
|
| 14.93 | % |
| 36.79 | % |
| 2.86 | % |
| 7.67 | % |
| 1.92 | % |
| 0.43 | % |
| 54.49 | % | $ | 7,222 |
| $ | 11 |
| |
|
|
|
|
|
|
|
|
|
|
|
|
|
|
|
|
|
|
|
|
|
|
|
|
|
|
|
|
| |
Comparable Group |
|
|
|
|
|
|
|
|
|
|
|
|
|
|
|
|
|
|
|
|
|
|
|
|
|
|
|
| |
BFSB | Brooklyn Federal Bancorp, Inc. (MHC)(1) |
|
| 19.73 | % |
| 14.98 | % |
| 12.37 | % |
| 45.21 | % |
| 0.00 | % |
| 0.24 | % |
| 72.62 | % | $ | 139,239 |
| $ | 0 |
|
CSBK | Clifton Savings Bancorp, Inc. (MHC)(1) |
|
| 19.38 | % |
| 50.38 | % |
| 0.12 | % |
| 2.01 | % |
| 0.00 | % |
| 0.16 | % |
| 39.41 | % | $ | 0 |
| $ | 0 |
|
COBK | Colonial Bankshares, Inc. (MHC)(1) |
|
| 14.46 | % |
| 35.75 | % |
| 3.95 | % |
| 9.43 | % |
| 2.48 | % |
| 0.62 | % |
| 52.92 | % | $ | 464 |
| $ | 0 |
|
FXCB | Fox Chase Bancorp, Inc. (MHC)(1) |
|
| 17.43 | % |
| 39.12 | % |
| 3.51 | % |
| 6.48 | % |
| 4.68 | % |
| 0.12 | % |
| 51.93 | % | $ | 123,516 |
| $ | 1,115 |
|
LSBK | Lake Shore Bancorp, Inc. (MHC)(1) |
|
| 20.09 | % |
| 51.54 | % |
| 1.37 | % |
| 5.12 | % |
| 2.36 | % |
| 0.67 | % |
| 52.64 | % | $ | 13,251 |
| $ | 0 |
|
MGYR | Magyar Bancorp, Inc. (MHC)(1) |
|
| 8.83 | % |
| 33.63 | % |
| 21.10 | % |
| 16.75 | % |
| 6.10 | % |
| 3.37 | % |
| 78.66 | % | $ | 2,257 |
| $ | 22 |
|
OSHC | Ocean Shore Holding Co. (MHC)(1) |
|
| 5.19 | % |
| 73.58 | % |
| 2.20 | % |
| 5.57 | % |
| 1.49 | % |
| 0.16 | % |
| 57.78 | % | $ | 7,254 |
| $ | 62 |
|
ONFC | Oneida Financial Corp. (MHC)(1) |
|
| 6.49 | % |
| 24.90 | % |
| 0.04 | % |
| 13.72 | % |
| 7.73 | % |
| 9.00 | % |
| 65.84 | % | $ | 101,984 |
| $ | 344 |
|
PBIP | Prudential Bancorp, Inc. of PA (MHC)(1) |
|
| 11.12 | % |
| 33.51 | % |
| 8.78 | % |
| 4.30 | % |
| 0.21 | % |
| 0.17 | % |
| 46.34 | % | $ | 5,446 |
| $ | 25 |
|
ROMA | Roma Financial Corporation (MHC) |
|
| 15.42 | % |
| 37.83 | % |
| 2.18 | % |
| 8.87 | % |
| 0.41 | % |
| 2.21 | % |
| 56.08 | % | $ | 7,190 |
| $ | 0 |
|
(1) Financial information is for the quarter ending June 30, 2007.
|
|
Source: | SNL Financial LC. and RP® Financial, LC. calculations. The information provided in this table has been obtained from sources we believe are reliable, but we cannot guarantee the accuracy or completeness of such information. |
|
|
RP® Financial, LC. | PEER GROUP ANALYSIS |
| III.14 |
Bank’s and the Peer Group’s assets, respectively, thereby indicating a similar influence of loan servicing income on the Bank’s and the Peer Group’s earnings. The Bank and the Peer Group maintained modest balances of servicing intangibles.
Diversification into higher risk and higher yielding types of lending was more significant for the Bank in comparison to the Peer Group companies on average. Commercial real estate/multi-family loans represented the most significant area of lending diversification for the Bank (20.1% of assets), followed by consumer loans (16.7% of assets). The Peer Group’s lending diversification also consisted primarily of commercial real estate/multi-family loans (11.7% of assets), followed by construction/land loans (5.6% of assets). Other areas of lending diversification for the Bank consisted of construction/land loans (11.9% of assets) and commercial business loans (2.9% of assets), while the balance of the Peer Group’s loan portfolio composition showed modest diversification into commercial business loans (2.6% of assets) and consumer loans (1.7% of assets). The Bank’s higher concentration of assets in loans and greater diversification into higher risk types of loans translated into a higher risk weighted assets-to-assets ratio for the Bank (77.44% versus 57.42% for the Peer Group).
Table 3.5 reflects various key ratios highlighting the relative interest rate risk exposure of the Bank versus the Peer Group. In terms of balance sheet composition, Malvern Federal’s interest rate risk characteristics were generally considered to be less favorable than the Peer Group’s. Most notably, Malvern Federal’s lower tangible capital position and lower IEA/IBL ratio indicate a greater dependence on the yield-cost spread to sustain the net interest margin. Those disadvantages were partially negated by the Bank’s lower level of non-interest earning assets. On a pro forma basis, the infusion of net offering proceeds should serve to diminish the Bank’s disadvantages relative to the Peer Group’s balance sheet interest rate risk characteristics.
To analyze interest rate risk associated with the net interest margin, we reviewed quarterly changes in net interest income as a percent of average assets for Malvern
|
|
RP® Financial, LC. | PEER GROUP ANALYSIS |
| III.15 |
Table 3.5
Interest Rate Risk Measures and Net Interest Income Volatility
Comparable Institution Analysis
As of September 30, 2007 or Most Recent Date Available
|
|
|
|
|
|
|
|
|
|
|
|
|
|
|
|
|
|
|
|
|
|
|
|
|
|
|
|
|
|
|
|
| Balance Sheet Measures |
|
|
| |||||||||||||||||||||||
|
|
|
|
|
| ||||||||||||||||||||||||
Institution |
| Equity/ |
| IEA/ |
| Non-Earn. |
| Quarterly Change in Net Interest Income |
| ||||||||||||||||||||
| |||||||||||||||||||||||||||||
6/30/2007 |
| 3/31/2007 |
| 12/31/2006 |
| 9/30/2006 |
| 6/30/2006 |
| 3/31/2006 |
| ||||||||||||||||||
|
|
|
|
|
|
|
|
|
| ||||||||||||||||||||
|
|
| (%) |
| (%) |
| (%) |
| (change in net interest income is annualized in basis points) |
| |||||||||||||||||||
|
|
|
|
|
|
|
|
|
|
|
|
|
|
|
|
|
|
|
|
|
|
|
|
|
|
|
|
|
|
Malvern Federal Savings Bank |
|
| 8.0 | % |
| 104.9 | % |
| 4.1 | % |
| -13 |
|
| 13 |
|
| -18 |
|
| 13 |
|
| -15 |
|
| -10 |
| |
|
|
|
|
|
|
|
|
|
|
|
|
|
|
|
|
|
|
|
|
|
|
|
|
|
|
|
|
|
|
All Public Companies |
|
| 11.0 | % |
| 107.0 | % |
| 5.4 | % |
| 0 |
|
| 1 |
|
| 0 |
|
| -8 |
|
| -6 |
|
| -1 |
| |
State of PA |
|
| 10.6 | % |
| 109.3 | % |
| 5.7 | % |
| 10 |
|
| 3 |
|
| 1 |
|
| -4 |
|
| -8 |
|
| -2 |
| |
|
|
|
|
|
|
|
|
|
|
|
|
|
|
|
|
|
|
|
|
|
|
|
|
|
|
|
|
|
|
Comparable Group |
|
|
|
|
|
|
|
|
|
|
|
|
|
|
|
|
|
|
|
|
|
|
|
|
|
|
|
| |
Averages |
|
| 15.4 | % |
| 114.1 | % |
| 6.0 | % |
| 3 |
|
| -3 |
|
| -6 |
|
| 2 |
|
| 1 |
|
| 2 |
| |
Medians |
|
| 16.0 | % |
| 114.7 | % |
| 4.7 | % |
| -2 |
|
| -5 |
|
| -4 |
|
| -5 |
|
| -4 |
|
| -2 |
| |
|
|
|
|
|
|
|
|
|
|
|
|
|
|
|
|
|
|
|
|
|
|
|
|
|
|
|
|
|
|
Comparable Group |
|
|
|
|
|
|
|
|
|
|
|
|
|
|
|
|
|
|
|
|
|
|
|
|
|
|
|
| |
BFSB | Brooklyn Federal MHC of NY (31.0) |
|
| 21.8 | % |
| 125.8 | % |
| 4.5 | % |
| -11 |
|
| -13 |
|
| 7 |
|
| 19 |
|
| 6 |
|
| 9 |
|
CSBK | Clifton Savings Bncrp MHC of NJ (41.0) |
|
| 22.2 | % |
| 123.8 | % |
| 4.8 | % |
| -5 |
|
| NA |
|
| NA |
|
| -12 |
|
| -7 |
|
| -2 |
|
COBK | Colonial Bank MHC of NJ (44.9) |
|
| 8.6 | % |
| 105.4 | % |
| 4.1 | % |
| -8 |
|
| -5 |
|
| -11 |
|
| -8 |
|
| -11 |
|
| 1 |
|
FXCB | Fox Chase Bancorp MHC of PA (44.5) |
|
| 17.0 | % |
| 115.9 | % |
| 4.4 | % |
| 21 |
|
| 8 |
|
| -23 |
|
| 49 |
|
| -8 |
|
| NA |
|
LSBK | Lake Shore Bancorp MHC of NY (43.7) |
|
| 15.0 | % |
| 113.4 | % |
| 5.5 | % |
| 33 |
|
| -9 |
|
| -3 |
|
| -28 |
|
| 11 |
|
| 32 |
|
MGYR | Magyar Bancorp MHC of NJ (45.1)(1) |
|
| 10.0 | % |
| 104.0 | % |
| 8.0 | % |
| NA |
|
| -11 |
|
| -4 |
|
| NA |
|
| NA |
|
| -2 |
|
OSHC | Ocean Shore Holding MHC of NJ (44.0) |
|
| 10.4 | % |
| 108.0 | % |
| 4.4 | % |
| 1 |
|
| -2 |
|
| -11 |
|
| -9 |
|
| 5 |
|
| -2 |
|
ONFC | Oneida Financial MHC of NY (43.9) |
|
| 6.4 | % |
| 97.9 | % |
| 14.3 | % |
| -8 |
|
| 11 |
|
| -15 |
|
| -5 |
|
| -5 |
|
| 1 |
|
PBIP | Prudential Bancorp MHC PA (40.5)(1) |
|
| 17.3 | % |
| 119.9 | % |
| 2.9 | % |
| NA |
|
| -13 |
|
| 4 |
|
| -5 |
|
| -4 |
|
| -9 |
|
ROMA | Roma Financial Corp MHC of NJ (31.0) |
|
| 25.3 | % |
| 126.9 | % |
| 7.0 | % |
| 5 |
|
| 3 |
|
| -1 |
|
| 15 |
|
| 25 |
|
| -12 |
|
|
|
|
|
(1) Financial information is for the quarter ending June 30, 2007. | |
NA=Change is greater than 100 basis points during the quarter. | |
|
|
Source: | Audited and unaudited financial statements, corporate reports and offering circulars, and RP®Financial, LC. calculations. The information provided in this table has been obtained from sources we believe are reliable, but we cannot guarantee the accuracy or completeness of such information. |
|
|
Copyright (c) 2007 by RP® Financial, LC. | |
|
|
RP® Financial, LC. | PEER GROUP ANALYSIS |
| III.16 |
Federal and the Peer Group. In general, there was a greater degree of volatility reflected in the quarterly changes in the Bank’s net interest income ratios, based on the interest rate environment that prevailed during the period covered in Table 3.5. However, the stability of the Bank’s net interest margin should be enhanced by the infusion of stock proceeds, since interest rate sensitive liabilities will be funding a lower portion of the Bank’s assets.
Overall, based on a comparison of credit quality measures, the Bank’s credit risk exposure was considered to be slightly greater than Peer Group’s. As shown in Table 3.6, the Bank’s non-performing assets/assets and non-performing loans/loans ratios equaled 0.47% and 0.51%, respectively, versus comparable measures of 0.32% and 0.19% for the Peer Group. The Bank’s and Peer Group’s loss reserves as a percent of non-performing loans equaled 190.2% and 400.1%, respectively. Loss reserves maintained as percent of net loans receivable equaled 0.97% for the Bank, versus 0.60% for the Peer Group. Net loan charge-offs were comparable for the Bank and the Peer Group, as net loan charge-offs recorded by the Bank and the Peer Group equaled 0.03% and 0.05% of net loans receivable, respectively. As noted in the Loan Composition discussion, Malvern Federal’s higher concentration of loans and greater diversification into higher risk types of loans translated into a higher risk weighted assets-to-assets ratio in comparison to the Peer Group’s ratio.
Based on the above analysis, RP Financial concluded that the Peer Group forms a reasonable basis for determining the pro forma market value of the Bank. Such general characteristics as asset size, capital position, interest-earning asset composition, funding composition, core earnings measures, loan composition, credit quality and exposure to interest rate risk all tend to support the reasonability of the Peer Group from a financial standpoint. Those areas where differences exist will be addressed in the form of valuation adjustments to the extent necessary.
|
|
RP® Financial, LC. | PEER GROUP ANALYSIS |
| III.17 |
Table 3.6
Credit Risk Measures and Related Information
Comparable Institution Analysis
As of September 30, 2007 or Most Recent Date Available
|
|
|
|
|
|
|
|
|
|
|
|
|
|
|
|
|
|
|
|
|
|
|
|
|
|
|
Institution |
| REO/ |
| NPAs & |
| NPLs/ |
| Rsrves/ |
| Rsrves/ |
| Rsrves/ |
| Net Loan |
| NLCs/ |
| |||||||||
|
|
|
|
|
|
|
|
| ||||||||||||||||||
|
| (%) |
| (%) |
| (%) |
| (%) |
| (%) |
| (%) |
| ($000) |
| (%) |
| |||||||||
|
|
|
|
|
|
|
|
|
|
|
|
|
|
|
|
|
| |||||||||
Malvern Federal Savings Bank |
|
| 0.04 | % |
| 0.47 | % |
| 0.51 | % |
| 0.97 | % |
| 190.16 | % |
| 173.65 | % | $ | 150 |
|
| 0.03 | % | |
|
|
|
|
|
|
|
|
|
|
|
|
|
|
|
|
|
|
|
|
|
|
|
|
|
| |
All Public Companies |
|
|
|
|
|
|
|
|
|
|
|
|
|
|
|
|
|
|
|
|
|
|
|
|
| |
Averages |
|
| 0.11 | % |
| 0.65 | % |
| 0.70 | % |
| 0.87 | % |
| 212.62 | % |
| 198.06 | % | $ | 474 |
|
| 0.11 | % | |
Medians |
|
| 0.01 | % |
| 0.41 | % |
| 0.45 | % |
| 0.80 | % |
| 133.15 | % |
| 115.79 | % | $ | 73 |
|
| 0.04 | % | |
|
|
|
|
|
|
|
|
|
|
|
|
|
|
|
|
|
|
|
|
|
|
|
|
|
| |
State of PA |
|
|
|
|
|
|
|
|
|
|
|
|
|
|
|
|
|
|
|
|
|
|
|
|
| |
Averages |
|
| 0.05 | % |
| 0.35 | % |
| 0.56 | % |
| 0.85 | % |
| 249.47 | % |
| 173.24 | % | $ | 155 |
|
| 0.07 | % | |
Medians |
|
| 0.00 | % |
| 0.37 | % |
| 0.41 | % |
| 0.85 | % |
| 216.47 | % |
| 135.01 | % | $ | 13 |
|
| 0.01 | % | |
|
|
|
|
|
|
|
|
|
|
|
|
|
|
|
|
|
|
|
|
|
|
|
|
|
| |
Comparable Group |
|
|
|
|
|
|
|
|
|
|
|
|
|
|
|
|
|
|
|
|
|
|
|
|
| |
Averages |
|
| 0.05 | % |
| 0.32 | % |
| 0.19 | % |
| 0.60 | % |
| 400.11 | % |
| 289.85 | % | $ | 47 |
|
| 0.05 | % | |
Medians |
|
| 0.00 | % |
| 0.06 | % |
| 0.06 | % |
| 0.61 | % |
| 256.23 | % |
| 120.88 | % | $ | 5 |
|
| 0.01 | % | |
|
|
|
|
|
|
|
|
|
|
|
|
|
|
|
|
|
|
|
|
|
|
|
|
|
| |
Comparable Group |
|
|
|
|
|
|
|
|
|
|
|
|
|
|
|
|
|
|
|
|
|
|
|
|
| |
BFSB | Brooklyn Federal MHC of NY (31.0) |
|
| 0.00 | % |
| 0.02 | % |
| 0.02 | % |
| 0.63 | % |
| NA |
|
| NA |
| $ | 0 |
|
| 0.00 | % |
CSBK | Clifton Savings Bncrp MHC of NJ (41.0) |
|
| 0.00 | % |
| 0.03 | % |
| 0.05 | % |
| 0.33 | % |
| 256.23 | % |
| 665.02 | % | $ | 0 |
|
| 0.00 | % |
COBK | Colonial Bank MHC of NJ (44.9) |
|
| 0.00 | % |
| 0.32 | % |
| 0.61 | % |
| 0.63 | % |
| 105.74 | % |
| 106.74 | % | $ | 0 |
|
| 0.00 | % |
FXCB | Fox Chase Bancorp MHC of PA (44.5) |
|
| 0.00 | % |
| 0.03 | % |
| 0.06 | % |
| 0.74 | % |
| 604.61 | % |
| NA |
| $ | 0 |
|
| 0.00 | % |
LSBK | Lake Shore Bancorp MHC of NY (43.7) |
|
| 0.01 | % |
| 0.37 | % |
| 0.45 | % |
| 0.59 | % |
| 125.86 | % |
| 101.17 | % | $ | 20 |
|
| 0.04 | % |
MGYR | Magyar Bancorp MHC of NJ (45.1)(1) |
|
| 0.47 | % |
| 1.90 | % |
| NA |
|
| 0.97 | % |
| NA |
|
| 45.20 | % | $ | 359 |
|
| 0.37 | % |
OSHC | Ocean Shore Holding MHC of NJ (44.0) |
|
| 0.00 | % |
| 0.06 | % |
| 0.07 | % |
| 0.46 | % |
| 908.10 | % |
| 685.98 | % | $ | 7 |
|
| 0.01 | % |
ONFC | Oneida Financial MHC of NY (43.9) |
|
| 0.00 | % |
| 0.03 | % |
| 0.05 | % |
| 0.90 | % |
| NA |
|
| NA |
| $ | 61 |
|
| 0.09 | % |
PBIP | Prudential Bancorp MHC PA (40.5)(1) |
|
| 0.00 | % |
| 0.10 | % |
| NA |
|
| 0.45 | % |
| NA |
|
| 135.01 | % | $ | 2 |
|
| 0.00 | % |
ROMA | Roma Financial Corp MHC of NJ (31.0) |
|
| 0.00 | % |
| NA |
|
| nNA |
|
| 0.33 | % |
| NA |
|
| NA |
| $ | 21 |
|
| 0.02 | % |
|
|
(1) Financial information is for the quarter ending June 30, 2007. | |
|
|
Source: | Audited and unaudited financial statements, corporate reports and offering circulars, and RP® Financial, LC. calculations. The information provided in this table has been obtained from sources we believe are reliable, but we cannot guarantee the accuracy or completeness of such information. |
| |
Copyright (c) 2007 by RP® Financial, LC. | |
|
|
RP® Financial, LC. | VALUATION ANALYSIS |
This chapter presents the valuation analysis and methodology used to determine the Bank’s estimated pro forma market value for purposes of pricing the minority stock. The valuation incorporates the appraisal methodology promulgated by the OTS and adopted in practice by the FDIC for standard conversions and mutual holding company offerings, particularly regarding selection of the Peer Group, fundamental analysis on both the Bank and the Peer Group, and determination of the Bank’s pro forma market value utilizing the market value approach.
The OTS written appraisal guidelines specify the market value methodology for estimating the pro forma market value of an institution. The FDIC, state banking agencies and other Federal agencies have endorsed the OTS appraisal guidelines as the appropriate guidelines involving mutual-to-stock conversions. As previously noted, the appraisal guidelines for MHC offerings are somewhat different, particularly in the Peer Group selection process. Specifically, the regulatory agencies have indicated that the Peer Group should be based on the pro forma fully-converted pricing characteristics of publicly-traded MHCs, rather than on already fully-converted publicly-traded stock thrifts, given the unique differences in stock pricing of MHCs and fully-converted stock thrifts. Pursuant to this methodology: (1) a peer group of comparable publicly-traded MHC institutions is selected; (2) a financial and operational comparison of the subject company to the peer group is conducted to discern key differences; and (3) the pro forma market value of the subject company is determined based on the market pricing of the peer group, subject to certain valuation adjustments based on key differences. In addition, the pricing characteristics of recent conversions and MHC offerings must be considered.
|
|
RP® Financial, LC. | VALUATION ANALYSIS |
RP Financial Approach to the Valuation
The valuation analysis herein complies with such regulatory approval guidelines. Accordingly, the valuation incorporates a detailed analysis based on the Peer Group, discussed in Chapter III, which constitutes “fundamental analysis” techniques. Additionally, the valuation incorporates a “technical analysis” of recently completed conversions and stock offerings of comparable MHCs, including closing pricing and aftermarket trading of such offerings. It should be noted that these valuation analyses, based on either the Peer Group or the recent conversions and MHC transactions, cannot possibly fully account for all the market forces which impact trading activity and pricing characteristics of a stock on a given day.
The pro forma market value determined herein is a preliminary value for the Bank’s to-be-issued stock. Throughout the MHC process, RP Financial will: (1) review changes in the Bank’s operations and financial condition; (2) monitor the Bank’s operations and financial condition relative to the Peer Group to identify any fundamental changes; (3) monitor the external factors affecting value including, but not limited to, local and national economic conditions, interest rates, and the stock market environment, including the market for thrift stocks; and (4) monitor pending MHC offerings, and to a lesser extent, standard conversion offerings, both regionally and nationally. If material changes should occur prior to the close of the offering, RP Financial will evaluate if updated valuation reports should be prepared reflecting such changes and their related impact on value, if any. RP Financial will also prepare a final valuation update at the closing of the offering to determine if the prepared valuation analysis and resulting range of value continues to be appropriate.
The appraised value determined herein is based on the current market and operating environment for Malvern Federal and for all thrifts. Subsequent changes in the local and national economy, the legislative and regulatory environment, the stock market, interest rates, and other external forces (such as natural disasters or major world events), which may occur from time to time (often with great unpredictability) may materially impact the market value of all thrift stocks, including the Bank’s value, the market value of the stocks of public MHC institutions, or the Bank’s value alone. To the
|
|
RP® Financial, LC. | VALUATION ANALYSIS |
extent a change in factors impacting the Bank’s value can be reasonably anticipated and/or quantified, RP Financial has incorporated the estimated impact into its analysis.
A fundamental analysis discussing similarities and differences relative to the Peer Group was presented in Chapter III. The following sections summarize the key differences between the Bank and the Peer Group and how those differences affect the pro forma valuation. Emphasis is placed on the specific strengths and weaknesses of the Bank relative to the Peer Group in such key areas as financial condition, profitability, growth and viability of earnings, asset growth, primary market area, dividends, liquidity of the shares, marketing of the issue, management, and the effect of government regulations and/or regulatory reform. We have also considered the market for thrift stocks, in particular new issues, to assess the impact on value of the Bank coming to market at this time.
|
|
1. |
The financial condition of an institution is an important determinant in pro forma market value because investors typically look to such factors as liquidity, capital, asset composition and quality, and funding sources in assessing investment attractiveness. The similarities and differences in the Bank’s and the Peer Group’s financial strengths are noted as follows:
|
|
|
| • | Overall A/L Composition. Loans funded by retail deposits were the primary components of both Malvern Federal’s and the Peer Group’s balance sheets. The Bank’s interest-earning asset composition exhibited a higher concentration of loans and a greater degree of diversification into higher risk and higher yielding types of loans. Overall, the Bank’s asset composition provided for a higher yield earned on interest-earning assets and a higher risk weighted assets-to-assets ratio than maintained by the Peer Group. Malvern Federal’s funding composition reflected higher levels of deposits and borrowings than the comparable Peer Group ratios, which translated into a higher cost of funds for the Bank. Overall, as a percent of assets, the Bank maintained higher levels of interest-earning assets and interest-bearing liabilities compared to the Peer Group’s ratios, which resulted in a lower IEA/IBL ratio for the Bank. After factoring in the impact of the net stock |
|
|
RP® Financial, LC. | VALUATION ANALYSIS |
|
|
|
|
| proceeds, the Bank’s IEA/IBL ratio will be more comparable to the Peer Group’s ratio. On balance, RP Financial concluded that asset/liability composition was a neutral factor in our adjustment for financial condition. |
|
|
|
| • | Credit Quality. The Bank’s ratios for non-performing assets and non-performing loans were less favorable than the comparable Peer Group ratios. Loss reserves as a percent loans were higher for the Bank, while the Peer Group maintained higher loss reserves as a percent of non-performing loans. Net loan charge-offs were comparable for the Bank and the Peer Group. As noted above, the Bank’s risk weighted assets-to-assets ratio was higher than the Peer Group’s. Overall, RP Financial concluded that credit quality was a slightly negative factor in our adjustment for financial condition. |
|
|
|
| • | Balance Sheet Liquidity. The Bank operated with a lower level of cash and investment securities relative to the Peer Group (9.8% of assets versus 32.9% for the Peer Group). Following the infusion of stock proceeds, the Bank’s cash and investments ratio is expected to increase as the proceeds retained at the holding company level will be initially deployed into investments. The Bank’s future borrowing capacity was considered to be fairly comparable to the Peer Group’s, as both the Bank and the Peer Group were considered to have ample borrowing capacities based on their current ratios of borrowings-to-assets. Overall, RP Financial concluded that balance sheet liquidity was a neutral factor in our adjustment for financial condition. |
|
|
|
| • | Funding Liabilities. The Bank’s interest-bearing funding composition reflected higher concentrations of deposits and borrowings relative to the comparable Peer Group ratios, which translated into a higher cost of funds for the Bank as well. Total interest-bearing liabilities as a percent of assets were higher for the Bank compared to the Peer Group’s ratio, which was attributable to Malvern Federal’s lower capital position. Following the stock offering, the increase in the Bank’s capital position should provide Malvern Federal with a comparable level of interest-bearing liabilities as maintained by the Peer Group. Overall, RP Financial concluded that funding liabilities was a slightly negative factor in our adjustment for financial condition. |
|
|
|
| • | Capital. The Peer Group operates with a higher equity-to-assets ratio than the Bank. However, following the stock offering, Malvern Federal’s pro forma capital position will be more comparable to the Peer Group’s equity-to-assets ratio. The increase in the Bank’s pro forma capital position will result in greater leverage potential and reduce the level of interest-bearing liabilities utilized to fund assets. At the same time, the Bank’s more significant capital surplus will likely result in a lower ROE. On balance, RP Financial concluded that capital strength was a neutral factor in our adjustment for financial condition. |
On balance, Malvern Federal’s balance sheet strength was considered to be fairly comparable to the Peer Group’s and, thus, no adjustment was applied for the Bank’s financial condition.
|
|
RP® Financial, LC. | VALUATION ANALYSIS |
|
|
2. |
Earnings are a key factor in determining pro forma market value, as the level and risk characteristics of an institution’s earnings stream and the prospects and ability to generate future earnings heavily influence the multiple that the investment community will pay for earnings. The major factors considered in the valuation are described below.
|
|
|
| • | Reported Earnings. The Bank’s reported earnings were lower than the Peer Group’s on a ROAA basis (0.45% of average assets versus 0.56% for the Peer Group). The Peer Group’s higher earnings were supported by higher levels of net interest income and non-interest operating income, a lower level of loan loss provisions and a lower effective tax rate. Somewhat offsetting the Peer Group’s earnings advantages were the Bank’s lower level of operating expenses. Reinvestment of stock proceeds into interest-earning assets will serve to increase the Bank’s earnings, with the benefit of reinvesting proceeds expected to be somewhat offset by higher operating expenses associated with operating as a publicly-traded company and the implementation of stock benefit plans. On balance, RP Financial concluded that the Bank’s reported earnings were a neutral factor in our adjustment for profitability, growth and viability of earnings. |
|
|
|
| • | Core Earnings. Both the Bank’s and the Peer Group’s earnings were derived largely from recurring sources, including net interest income, operating expenses, and non-interest operating income. In these measures, the Bank operated with a lower net interest margin, a lower operating expense ratio and a lower level of non-interest operating income. The Bank’s lower ratios for net interest income and operating expenses translated into an expense coverage ratio that was higher than the Peer Group’s ratio (1.33x versus 1.01x for the Peer Group). Similarly, the Bank’s efficiency ratio of 67.7% was more favorable than the Peer Group’s efficiency ratio of 77.5%, as the Bank’s lower operating expense ratio more than offset the Peer Group’s higher ratios for net interest income and non-interest operating income. Loss provisions had a larger impact on the Bank’s earnings and the Peer Group maintained a lower effective tax rate than the Bank. Overall, these measures, as well as the expected earnings benefits the Bank should realize from the redeployment of stock proceeds into interest-earning assets, which will be somewhat negated by expenses associated with the stock benefit plans and operating as a publicly-traded company, indicate that the Bank’s and the Peer Group’s core earnings are fairly comparable. Therefore, RP Financial concluded that this was a neutral factor in our adjustment for profitability, growth and viability of earnings. |
|
|
|
| • | Interest Rate Risk. Quarterly changes in the Bank’s and the Peer Group’s net interest income to average assets ratios indicated that a higher degree of |
|
|
RP® Financial, LC. | VALUATION ANALYSIS |
|
|
|
|
| volatility was associated with the Bank’s net interest margin. Other measures of interest rate risk, such as capital and IEA/IBL ratios, were more favorable for the Peer Group, thereby indicating a lower dependence on the yield-cost spread to sustain net interest income. On a pro forma basis, the infusion of stock proceeds can be expected to provide the Bank with equity-to-assets and IEA/ILB ratios that are more comparable to the Peer Group ratios, as well as enhance the stability of the Bank’s net interest margin through the reinvestment of stock proceeds into interest-earning assets. Accordingly, on balance, this was a neutral factor in our adjustment for profitability, growth and viability of earnings. |
|
|
|
| • | Credit Risk. Loan loss provisions were a larger factor in the Bank’s earnings (0.24% of average assets versus 0.01% of average assets for the Peer Group). In terms of future exposure to credit quality related losses, the Bank maintained a higher concentration of assets in loans and lending diversification into higher risk types of loans was more significant for the Bank, which translated into a higher risk weighed assets-to-assets ratio for the Bank. Credit quality measures for non-performing assets and loss reserves as a percent of non-performing loans were slightly more favorable for the Peer Group. While Malvern Federal maintained higher loss reserves as a percent of loans. Overall, RP Financial concluded that earnings credit risk was a slightly negative factor in our adjustment for profitability, growth and viability of earnings. |
|
|
|
| • | Earnings Growth Potential. Several factors were considered in assessing earnings growth potential. First, the Peer Group maintained a more favorable interest rate spread than the Bank, which would tend to support a stronger net interest margin going forward for the Peer Group. Second, the infusion of stock proceeds will provide the Bank with comparable growth potential through leverage as currently maintained by the Peer Group. Lastly, the Bank’s more favorable efficiency ratio, which was supported by maintenance of a lower operating expense ratio, implies greater earnings growth potential and sustainability of earnings during periods when net interest margins come under pressure as the result of adverse changes in interest rates. Overall, earnings growth potential was considered to be a slightly positive factor in our adjustment for profitability, growth and viability of earnings. |
|
|
|
| • | Return on Equity. Currently, the Bank’s ROE is above the Peer Group’s ROE, which is facilitated by the Bank’s lower capital position. As the result of the significant increase in capital that will be realized from the infusion of net stock proceeds into the Bank’s equity, the Bank’s pro forma return equity on a core earnings basis will be more comparable to the Peer Group’s ROE. Accordingly, this was a neutral factor in the adjustment for profitability, growth and viability of earnings. |
On balance, Malvern Federal’s pro forma earnings strength was considered to be
|
|
RP® Financial, LC. | VALUATION ANALYSIS |
fairly comparable to the Peer Group’s and, thus, no adjustment was applied for profitability, growth and viability of earnings.
|
|
3. |
Malvern Federal’s asset growth rate exceeded the Peer Group’s growth rate during the period covered in our comparative analysis (6.8% versus 5.0% for the Peer Group). The Bank’s stronger asset growth was supported by growth of loans and cash and investments, while the Peer Group’s loan growth was in part funded with cash and investments. On a pro forma basis, the Company’s tangible equity-to-assets ratio will be more comparable to the Peer Group’s tangible equity-to-assets ratio, indicating comparable leverage capacity for the Company. On balance, we concluded that no adjustment was warranted for asset growth.
|
|
4. |
The general condition of an institution’s market area has an impact on value, as future success is in part dependent upon opportunities for profitable activities in the local market served. Malvern Federal serves the Philadelphia MSA through seven office locations, all which are located in Chester County. Chester County is an affluent suburb of Philadelphia, which has experienced favorable demographic growth since the beginning of the decade. The favorable demographic characteristics of the Bank’s market area has also fostered a highly competitive banking environment, in which the Bank competes against other community banks as well as institutions with a regional or national presence.
The Peer Group companies generally operate in suburban markets with comparable populations as Chester County. The markets served by the Peer Group companies reflected slower population growth and lower per capita income compared to Chester County. The average and median deposit market shares maintained by the Peer Group companies were above the Company’s market share of deposits in Chester County. Overall, the degree of competition faced by the Peer Group companies was viewed to be less than faced by Malvern Federal in Chester County, while the growth
|
|
RP® Financial, LC. | VALUATION ANALYSIS |
potential in the markets served by the Peer Group companies was also viewed to be less favorable in comparison to Malvern Federal’s market area. Summary demographic and deposit market share data for the Bank and the Peer Group companies is provided in Exhibit III-3. As shown in Table 4.1, September 2007 unemployment rates for all of markets served by the Peer Group companies exceeded the unemployment rate reflected for Chester County. On balance, we concluded that a moderate upward adjustment was appropriate for the Bank’s market area.
Table 4.1
Market Area Unemployment Rates
Malvern FSB and the Peer Group Companies(1)
|
|
|
|
|
|
|
|
|
|
|
| County |
|
| September 2007 |
| |
|
|
|
|
|
| |||
Malvern FSB - PA |
|
| Chester |
|
| 3.1 | % |
|
|
|
|
|
|
|
|
|
|
Peer Group Average |
|
|
|
|
| 4.5 | % |
|
|
|
|
|
|
|
|
|
|
Brooklyn Federal MHC – NY |
|
| Kings |
|
| 5.4 | % |
|
Clifton Savings Bancorp MHC – NJ |
|
| Passaic |
|
| 5.2 |
|
|
Colonial Bankshares MHC – NJ |
|
| Cumberland |
|
| 5.8 |
|
|
Fox Chase Bancorp MHC – PA |
|
| Montgomery |
|
| 3.3 |
|
|
Lake Shore Bancorp MHC - NY |
|
| Chautauqua |
|
| 4.1 |
|
|
Magyar Bancorp MHC – NJ |
|
| Middlesex |
|
| 3.8 |
|
|
Ocean Shore Holding MHC – NJ |
|
| Cape May |
|
| 4.0 |
|
|
Oneida Financial MHC – NY |
|
| Madison |
|
| 4.0 |
|
|
Prudential Bancorp MHC – PA |
|
| Philadelphia |
|
| 6.1 |
|
|
Roma Financial Corp MHC - NJ |
|
| Mercer |
|
| 3.6 |
|
|
|
|
| (1) Unemployment rates are not seasonally adjusted. |
|
|
| Source: U.S. Bureau of Labor Statistics. |
|
|
5. |
At this time the Bank has not established a dividend policy. Future declarations of dividends by the Board of Directors will depend upon a number of factors, including investment opportunities, growth objectives, financial condition, profitability, tax considerations, minimum capital requirements, regulatory limitations, stock market characteristics and general economic conditions.
|
|
RP® Financial, LC. | VALUATION ANALYSIS |
Six out of the ten of the Peer Group companies pay regular cash dividends, with implied dividend yields ranging from 1.47% to 4.68%. The average dividend yield on the stocks of the Peer Group institutions equaled 1.29% as of December 7, 2007. As of December 7, 2007, approximately 80% of all publicly-traded thrifts had adopted cash dividend policies (see Exhibit IV-1), exhibiting an average yield of 2.53%. The dividend paying thrifts generally maintain higher than average profitability ratios, facilitating their ability to pay cash dividends.
Our valuation adjustment for dividends for the Bank also considered the regulatory policy with regard to waiver of dividends by the MHC. Under current policy, any waiver of dividends by an FDIC regulated MHC requires that the minority stockholders’ ownership interest be reduced in a second-step conversion to reflect the cumulative waived dividend account. Comparatively, no adjustment for waived dividends is required for OTS regulated companies in a second-step conversion. As an MHC operating under OTS regulation, the Bank will be subject to the same regulatory dividend policy as all of the Peer Group companies. Accordingly, we believe that to the extent the Bank’s pro forma market value would be influenced by the OTS’ dividend policy regarding MHC institutions, it has been sufficiently captured in the pricing of the Peer Group companies.
While the Bank has not established a definitive dividend policy prior to converting, the Bank will have the capacity to pay a dividend comparable to the Peer Group’s average dividend yield based on pro forma earnings and capitalization. On balance, we concluded that no adjustment was warranted for this factor.
|
|
6. |
The Peer Group is by definition composed of companies that are traded in the public markets. All ten of the Peer Group companies trade on the NASDAQ Global Market. Typically, the number of shares outstanding and market capitalization provides an indication of how much liquidity there will be in a particular stock. The market capitalization of the Peer Group companies, based on the shares issued and outstanding to public shareholders (i.e., excluding the majority ownership interest
|
|
RP® Financial, LC. | VALUATION ANALYSIS |
owned by the respective MHCs) ranged from $21.6 million to $165.9 million as of December 7, 2007, with average and median market values of $65.0 million and $47.0 million, respectively. The shares issued and outstanding to the public shareholders of the Peer Group members ranged from 2.1 million to 12.8 million, with average and median shares outstanding of 5.4 million and 3.9 million, respectively. The Bank’s minority stock offering is expected to have a pro forma market value and shares outstanding that will be somewhat comparable to the median market value and shares outstanding indicated for the Peer Group. It is anticipated that the Bank’s stock will also be quoted on the NASDAQ Global Market. Overall, we anticipate that the Bank’s public stock will have a comparable trading market as the majority of the Peer Group companies and, therefore, concluded that no adjustment was necessary for this factor.
|
|
7. |
Three separate markets exist for thrift stocks: (1) the after-market for public companies, both fully-converted stock companies and MHCs, in which trading activity is regular and investment decisions are made based upon financial condition, earnings, capital, ROE, dividends and future prospects; (2) the new issue market in which converting thrifts are evaluated on the basis of the same factors but on a pro forma basis without the benefit of prior operations as a publicly-held company and stock trading history; and (3) the thrift acquisition market. All three of these markets were considered in the valuation of the Bank’s to-be-issued stock.
|
|
|
| A. |
The value of publicly-traded thrift stocks is easily measurable, and is tracked by most investment houses and related organizations. Exhibit IV-1 provides pricing and financial data on all publicly-traded thrifts. In general, thrift stock values react to market stimuli such as interest rates, inflation, perceived industry health, projected rates of economic growth, regulatory issues and stock market conditions in general. Exhibit IV-2 displays historical stock market trends for various indices and includes historical stock price index values for thrifts and commercial banks. Exhibit IV-3 displays historical stock price indices for thrifts only.
|
|
RP® Financial, LC. | VALUATION ANALYSIS |
In terms of assessing general stock market conditions, the performance of the overall stock market has been mixed over the past year. Stocks traded in a narrow range ahead of the holiday shopping season in late-November 2006. After posting a big one day loss in late-November on concerns about retail sales, lower oil prices, merger news and favorable economic reports provided a boost to stocks in early-December. The Dow Jones Industrial Average (“DJIA”) traded to record highs in mid- and late-December, as stocks benefited from some robust economic reports and investors betting on a strong finish for the year.
Lower oil prices helped to sustain the positive trend in stocks at the start of 2007, which was followed by a mild pullback due to weakness in technology stocks. Optimism about the economy and some favorable earnings reports helped to lift the DJIA to a record high heading into late-January 2007, which was followed by a one day sell-off on a weak housing report and concerns about higher rates. Stocks surged higher at the end of January 2007, as the Federal Reserve’s late-January meeting concluded with no change in rates. The broader stock market traded in a narrow range in early-February and then the DJIA rallied to a new record in mid-February. Comments by the Federal Reserve Chairman that helped to alleviate concerns of higher rates, as well as lower oil prices, were factors that contributed to the mid-February rally. Comparatively, higher oil prices contributed to a downturn in stocks heading into late-February. A sell-off in China’s stock market turned into a global market sell-off, as the DJIA plunged over 400 points on February 27th.
Stocks recovered some of the losses from the one day sell-off in early-March 2007, as the broader stock market benefited from a rebound in China’s stock market. Mounting troubles for subprime mortgage lenders and weak economic data fueled a sharp downturn in the broader stock market in mid-March. Following the sell-off, merger announcements, rallies in overseas markets and a drop in oil prices supported a rebound in the broader stock market ahead of the March meeting of the Federal Reserve. The Federal Reserve’s decision to hold rates steady further strengthened the rebound in the stock market as investors were buoyed by the Federal
|
|
RP® Financial, LC. | VALUATION ANALYSIS |
Reserve’s assessment that the economy would continue to expand at a moderate pace. Stocks fluctuated at the close of the first quarter on mixed economic data.
Signs of an improving housing market provided a boost to the stock market at the start of the second quarter 2007, with news of an increase in an index of pending existing home sales during February supporting a one-day gain of more than 120 points in the DJIA. News of Iran’s release of British hostages, lower oil prices and a favorable March employment report also contributed to the broader market gains in early-April. The broader market rally continued through most of April, as merger news and strong corporate profits lifted the DJIA above a close of 13000 in late-April. For the month of April, the DJIA closed up 5.7%. Stronger than expected manufacturing data and lower oil prices helped to propel the DJIA to five consecutive record highs in early-May. Following a sharp one day sell-off on a weak retail sales report for April, the positive trend in the broader stock market continued into mid-May. A new wave of corporate deals, lower oil prices and a stronger than expected reading for May consumer confidence were noted factors that help to sustain the rally. Stocks eased lower in late-May, reflecting profit taking and concerns about a pullback in China’s stock market. Inflation worries and higher rates pushed stocks lower in early-June, while a strong retail sales report for May triggered a rebound in the stock market in mid-June. Stocks generally traded lower in the second half of June on continued inflation concerns, as well as higher oil prices and weakness in the housing market.
The broader stock market showed a positive trend at the start of third quarter of 2007, with the DJIA closing at record highs in mid-July. A positive report on manufacturing activity in June, healthy job growth reflected in the June employment report and merger news contributed to the stock market rally. A favorable second quarter earnings report by IBM helped the DJIA close above the 14000 mark heading into late-July, which was followed a general downturn in stocks during late-July and early-August. Stocks were driven lower by fears that the housing slump was spreading to the broader economy and concerns of a widening credit crunch prompted by home mortgage lenders cutting off credit or raising rates for a growing number of borrowers. The stock market turned highly volatile in mid-August, reflecting mixed economic news
|
|
RP® Financial, LC. | VALUATION ANALYSIS |
and the ongoing fallout from the credit crisis. Volatility in the stock market continued to prevail through the end of August, based on concerns about the impact of the credit crunch on the economy and speculation about whether or not the Federal Reserve would cut rates at its September meeting. A disappointing employment report for August, which showed a drop in jobs for the first time in four years, caused stocks to plummet in early-September. However, upbeat news about consumer demand boosted stocks in mid-September ahead of the Federal Reserve meeting. Stocks soared on news of the Federal Reserve’s decision to cut the federal funds rate by a half of percentage point rate, which exceeded the quarter-point rate cut most economists had expected. The larger than expected rate cut generally sustained the positive trend in the broader stock market through the end of the third quarter.
The DJIA started the fourth quarter of 2007 soaring to a record high, which was followed by an uneven market for stocks into mid-October reflecting uncertainty over forthcoming third quarter earnings reports. Lackluster earnings and credit concerns sparked a mid-October sell-off, as Standard & Poor’s reduced its rating on more than 1,400 types of residential mortgage-backed securities. Stocks rebounded somewhat in late-October, supported by some good third quarter earnings in the technology sector and the Federal Reserve’s decision to cut rates by a quarter point as expected. Fresh concerns about problems in the credit markets becoming worse, fears of soaring energy prices and the dollar falling caused stocks to plummet in early-November. Following a close below 13000, the DJIA had a one day rebound of over 300 points on bargain hunting. Stocks pulled back heading into the second half of November, reflecting concerns that the weak housing market would depress consumer spending and expectations of more write-downs to be taken on risky debt. Stocks rebounded in late-November and early-December, amid growing expectations that the Federal Reserve would cut rates at its mid-December meeting. As an indication of the general trends in the nation’s stock markets over the past year, as of December 7, 2007 the DJIA closed at 13625.58 an increase of 10.7% from one year ago and an increase of 9.3% year-to-date, and the NASDAQ closed at 2706.16 an increase of 11.0% from one year ago and an increase of 12.0% year-to-date. The Standard & Poor’s 500 Index
|
|
RP® Financial, LC. | VALUATION ANALYSIS |
closed at 1504.66 on December 7, 2007 an increase of 6.7% from one year ago and an increase of 6.1% year-to-date.
The market for thrift stocks has been mixed during the past 12 months, but, in general, thrift stocks have underperformed the broader stock market. Weaker than expected housing data pressured thrift stocks lower heading into late-November 2006. Merger news, including Bank of New York’s announced merger with Mellon Financial Corp., sparked gains in thrift stocks in early-December 2006. Thrift stocks traded in a narrow range through mid-December, as the Federal Reserve left interest rates unchanged as expected. An upbeat report on home sales helped thrift and bank stocks participate in the broader market rally in late-December.
Thrift stocks traded lower at the beginning of 2007, as a favorable employment report for December reduced expectations of the Federal Reserve cutting interest rates. Mixed fourth quarter earnings reports and investor nervousness ahead of the Federal Reserve meeting provided for a choppy trading market for thrift issues in mid- and late-January. Thrift stocks posted gains in late-January and early-February, as thrift investors reacted favorably to the Federal Reserve’s decision to hold rates steady. While the DJIA moved to a new high in mid-February, thrift stocks traded in a narrow range heading into late-February. The late-February sell-off triggered by the downturn in China’s stock market hit thrift stocks as well. Selling pressure in thrift stocks increased during the first half of March, as mortgage lenders in general were hurt by the deterioration in market conditions for subprime mortgage lenders. In mid-March, the Mortgage Bankers Association reported that subprime mortgage delinquencies rose to a four year high during the fourth quarter of 2006. Thrift stocks participated in the broader stock market rally following the Federal Reserve’s decision to hold rates steady at its March meeting, based on expectations that the economy would continue to expand at a moderate pace. Thrift stocks pulled back in late-March, as lenders were hurt by news that sales of new homes fell for the second straight month in February and consumer confidence dropped in March.
A favorable report on February pending existing home sales sparked gains in thrift stocks at the start of the second quarter of 2007. In contrast to the
|
|
RP® Financial, LC. | VALUATION ANALYSIS |
broader market, thrift stocks trended lower in mid-April as a weak housing market and the overhang of problems in the subprime lending market continued to weigh on the thrift sector. Some positive earnings reports helped to boost thrift stocks heading into the second half of April, but the rally did not match gains posted in the broader market. A late-April report showing a decline in home sales in March served to dampen enthusiasm for thrift stocks, while news of Bank of America’s $21 billion proposed acquisition of LaSalle Bank Corp. had little impact on trading activity among thrift and bank stocks. Thrift stocks headed higher along with the broader stock market in early-May, but did not sustain the upward momentum into mid-May. A disappointing report on the outlook for the housing market weighed on the thrift sector in mid-May, with the National Association of Home Builders report projecting that home sales and housing production would not begin to improve until late in 2007. Merger news provided a boost to thrift stocks heading into late-May, but the gains were not sustained as thrift stocks traded lower on news of stronger than expected economic data and higher interest rates. A favorable employment report for May boosted thrift stocks at the start of June, which was followed by a general downturn in thrift stocks going into mid-June on higher interest rates. Higher interest rates and lackluster housing data furthered the downward trend in thrift stocks during the second half of June.
The thrift sector continued to struggle at the beginning of the third quarter of 2007 on earnings worries and the widening meltdown in the subprime market as Standard & Poor’s and Moody’s announced plans to downgrade securities backed by subprime mortgages. Bargain hunting and strength in the broader market supported a brief rebound in thrift stocks in mid-July, which was followed a sharp sell off on fears of spreading subprime problems and some second quarter earnings reports showing deterioration in credit quality. A disappointing second quarter earnings report by Countrywide Financial and a larger-than-expected decline in new home sales knocked thrift equities lower in late-July. The downturn in thrift stocks continued into the beginning of August on news that American Home Mortgage Investment Corp. was shutting down operations due to liquidity problems. Thrift stocks participated in the volatility exhibited in the broader market in mid-August, but, in general, the downward trend in thrift equities continued during the first half of August. Thrift equities benefited
|
|
RP® Financial, LC. | VALUATION ANALYSIS |
from the mid-August discount rate cut by the Federal Reserve and then fluctuated along with the broader market through the end of August based on speculation over the outcome of the Federal Reserve’s next meeting. The weaker-than-expected employment report for August depressed thrift issues in early-September, but thrift stocks bounced back in mid-September. The recovery in thrift stocks was aided by news that Countrywide Financial had arranged for an additional $12 billion of secured borrowings. Thrift stocks participated in the broader stock market rally on news of the larger than expected 50 basis rate cut by the Federal Reserve, although the positive trend in thrift stocks was not sustained through the end of the third quarter. The pull back in thrift stocks reflected ongoing concerns over the weak housing market and the anticipated rise in credit quality related losses that were expected to be seen in third quarter earnings.
Thrift stocks traded in a narrow range at the start of the fourth quarter, but then headed lower in mid-October. The downturn was led by thrifts with exposure to the subprime market, as those institutions reported larger than credit losses for the third quarter. The as expected quarter point rate cut by the Federal Reserve helped thrift stocks to stabilize in late-October, although the sell-off in thrift equities resumed in early-November. Institutions with exposure to the subprime mortgage market continued to lead the downturn, as Washington Mutual’s stock plunged on expectations that it would continue to experience significant credit losses in 2008. Beaten down thrift stocks recovered modestly going into mid-November, but the downturn resumed on worries over further deterioration in the subprime market and the depressed housing market. Freddie Mac’s significantly larger-than-expected loss for the third quarter prompted further selling in thrift stocks heading into late-November. Hopes for a rate cut at the next Federal Reserve meeting boosted the thrift sector in late-November. Thrift stocks traded in narrow range in the first week of December, as investors awaited the out come of the forthcoming Federal Reserve meeting. On December 7, 2007, the SNL Index for all publicly-traded thrifts closed at 1,184.2, a decrease of 34.1% from one year ago and a decrease of 35.3% year-to-date. Comparatively, the SNL MHC Index closed at 3,474.3 on December 7, 2007, a decrease of 9.8% from one year ago and a decrease of 10.3% year-to-date.
|
|
RP® Financial, LC. | VALUATION ANALYSIS |
|
|
|
| B. |
In addition to thrift stock market conditions in general, the new issue market for converting thrifts is also an important consideration in determining the Bank’s pro forma market value. The new issue market is separate and distinct from the market for seasoned thrift stocks in that the pricing ratios for converting issues are computed on a pro forma basis, specifically: (1) the numerator and denominator are both impacted by the conversion offering amount, unlike existing stock issues in which price change affects only the numerator; and (2) the pro forma pricing ratio incorporates assumptions regarding source and use of proceeds, effective tax rates, stock plan purchases, etc. which impact pro forma financials, whereas pricing for existing issues are based on reported financials. The distinction between pricing of converting and existing issues is perhaps no clearer than in the case of the price/book (“P/B”) ratio in that the P/B ratio of a converting thrift will typically result in a discount to book value whereas in the current market for existing thrifts the P/B ratio often reflects a premium to book value. Therefore, it is appropriate to also consider the market for new issues, both at the time of the conversion and in the aftermarket.
The market for recent conversions has pulled back along with the thrift sector in general, with a number of the recent offerings being undersubscribed and typically reflecting only modest price appreciation or, in some cases, trading below their IPO prices in initial after market trading activity. As shown in Table 4.2, three standard conversions, two second-step conversions and two mutual holding company offerings were completed during the past three months. The mutual holding company offerings are considered to be more relevant for purposes of our analysis. Laporte Bancorp was closed between the minimum and the midpoint of the offering range with gross proceeds of $13.0 million and Northfield Bancorp was closed at the top of the offering range with gross proceeds of $192.7 million. In general, investor interest in smaller offerings with resulting less liquid trading markets has been for the most not as strong compared to larger offerings with more liquid trading markets. On a fully-converted basis, LaPorte’s and Northfield’s closing pro forma price/tangible book ratios equaled 81.1% and 83.3%, respectively. LaPorte’s P/TB reflects the impact of intangibles
|
|
RP® Financial, LC. | Valuation Analysis |
Table 4.2
Pricing Characteristics and After-Market Trends
Recent Conversions Completed (Last Three Months)
|
|
|
|
|
|
|
|
|
|
|
|
|
|
|
|
|
|
|
|
|
|
|
|
|
|
|
|
|
|
|
|
|
|
|
|
|
|
Institutional Information |
| Pre-Conversion Data |
| Offering Information |
| Contribution to |
| ||||||||||||||||||||||||||||||
|
|
|
| ||||||||||||||||||||||||||||||||||
|
|
|
|
|
| Financial Info. |
| Asset Quality |
|
|
| ||||||||||||||||||||||||||
|
|
|
|
|
|
|
|
|
| ||||||||||||||||||||||||||||
Institution |
| Conver. |
| Ticker |
| Assets |
| Equity/ |
| NPAs/ |
| Res. |
| Gross |
| % |
| % of |
| Exp./ |
| Form |
| % of |
| ||||||||||||
|
|
|
|
|
|
|
|
|
|
|
|
| |||||||||||||||||||||||||
|
|
|
|
|
| ($Mil) |
| (%) |
| (%) |
| (%) |
| ($Mil.) |
| (%) |
| (%) |
| (%) |
| (%) |
| (%) |
| ||||||||||||
| |||||||||||||||||||||||||||||||||||||
|
|
|
|
|
|
|
|
|
|
|
|
|
|
|
|
|
|
|
|
|
|
|
|
|
|
|
|
|
|
|
|
|
|
|
|
|
|
Standard Conversions |
|
|
|
|
|
|
|
|
|
|
|
|
|
|
|
|
|
|
|
|
|
|
|
|
|
|
|
|
|
|
|
|
|
|
|
|
|
First Advantage Bancorp, TN |
|
| 11/30/07 |
|
| FABK-NASDAQ |
| $ | 219 |
|
| 14.70 | % |
| 0.80 | % |
| 114 | % | $ | 53.6 |
|
| 100 | % |
| 110 | % |
| 2.7 | % |
| N.A. |
|
| N.A. |
|
First Financial Northwest, Inc., WA |
|
| 10/10/07 |
|
| FFNW-NASDAQ |
| $ | 1,088 |
|
| 9.84 | % |
| 0.01 | % |
| NM |
| $ | 211.6 |
|
| 100 | % |
| 132 | % |
| 1.6 | % |
| S |
|
| 8.0 | % |
Beacon Federal Bancorp, Inc., NY |
|
| 10/2/07 |
|
| BFED-NASDAQ |
| $ | 689 |
|
| 6.58 | % |
| 0.11 | % |
| NM |
| $ | 74.1 |
|
| 100 | % |
| 90 | % |
| 2.7 | % |
| N.A. |
|
| N.A. |
|
|
|
|
|
|
|
|
|
|
|
|
|
|
|
|
|
|
|
|
|
|
|
|
|
|
|
|
|
|
|
|
|
|
|
|
|
|
|
Averages - Standard Conversions: |
| $ | 665 |
|
| 10.37 | % |
| 0.31 | % |
| NM |
| $ | 113.1 |
|
| 100 | % |
| 111 | % |
| 2.4 | % |
| N.A. |
|
| N.A. |
| ||||||
Medians - Standard Conversions: |
| $ | 689 |
|
| 9.84 | % |
| 0.11 | % |
| NM |
| $ | 74.1 |
|
| 100 | % |
| 110 | % |
| 2.7 | % |
| N.A. |
|
| N.A. |
| ||||||
|
|
|
|
|
|
|
|
|
|
|
|
|
|
|
|
|
|
|
|
|
|
|
|
|
|
|
|
|
|
|
|
|
|
|
|
|
|
Second Step Conversions |
|
|
|
|
|
|
|
|
|
|
|
|
|
|
|
|
|
|
|
|
|
|
|
|
|
|
|
|
|
|
|
|
|
|
|
|
|
United Financial Bancorp, Inc., MA* |
|
| 12/4/07 |
|
| UBNK-NASDAQ |
| $ | 1,064 |
|
| 13.28 | % |
| 0.29 | % |
| 260 | % | $ | 95.6 |
|
| 54 | % |
| 85 | % |
| 2.5 | % |
| N.A. |
|
| N.A. |
|
North Penn Bancorp, Inc., PA* |
|
| 10/2/07 |
|
| NPBP-OTCBB |
| $ | 119 |
|
| 10.98 | % |
| 0.43 | % |
| 283 | % | $ | 8.5 |
|
| 54 | % |
| 85 | % |
| 12.5 | % |
| N.A. |
|
| N.A. |
|
|
|
|
|
|
|
|
|
|
|
|
|
|
|
|
|
|
|
|
|
|
|
|
|
|
|
|
|
|
|
|
|
|
|
|
|
|
|
Averages - Second Step Conversions: |
| $ | 592 |
|
| 12.13 | % |
| 0.36 | % |
| 272 | % | $ | 52.1 |
|
| 54 | % |
| 85 | % |
| 7.5 | % |
| N.A. |
|
| N.A. |
| ||||||
Medians - Second Step Conversions: |
| $ | 592 |
|
| 12.13 | % |
| 0.36 | % |
| 272 | % | $ | 52.1 |
|
| 54 | % |
| 85 | % |
| 7.5 | % |
| N.A. |
|
| N.A. |
| ||||||
|
|
|
|
|
|
|
|
|
|
|
|
|
|
|
|
|
|
|
|
|
|
|
|
|
|
|
|
|
|
|
|
|
|
|
|
|
|
Mutual Holding Company Conversions |
|
|
|
|
|
|
|
|
|
|
|
|
|
|
|
|
|
|
|
|
|
|
|
|
|
|
|
|
|
|
| ||||||
Northfield Bancorp, Inc., NY |
|
| 11/8/07 |
|
| NFBK-NASDAQ |
| $ | 1,288 |
|
| 13.21 | % |
| 0.91 | % |
| 40 | % | $ | 192.7 |
|
| 43 | % |
| 132 | % |
| 1.6 | % |
| C/S |
|
| 3M/4.65 | % |
LaPorte Bancorp, Inc., IN |
|
| 10/15/07 |
|
| LPSB-NASDAQ |
| $ | 378 |
|
| 9.62 | % |
| 1.13 | % |
| 101 | % | $ | 13.0 |
|
| 47 | % |
| 91 | % |
| 7.2 | % |
| N.A. |
|
| N.A. |
|
|
|
|
|
|
|
|
|
|
|
|
|
|
|
|
|
|
|
|
|
|
|
|
|
|
|
|
|
|
|
|
|
|
|
|
|
|
|
Averages - Mutual Holding Company Conversions: |
| $ | 833 |
|
| 11.42 | % |
| 1.02 | % |
| 71 | % | $ | 102.8 |
|
| 45 | % |
| 112 | % |
| 4.4 | % |
| NA |
|
| NA |
| ||||||
Medians - Mutual Holding Company Conversions: |
| $ | 833 |
|
| 11.42 | % |
| 1.02 | % |
| 71 | % | $ | 102.8 |
|
| 45 | % |
| 112 | % |
| 4.4 | % |
| NA |
|
| NA |
| ||||||
|
|
|
|
|
|
|
|
|
|
|
|
|
|
|
|
|
|
|
|
|
|
|
|
|
|
|
|
|
|
|
|
|
|
|
|
|
|
Averages - All Conversions: |
| $ | 692 |
|
| 11.17 | % |
| 0.53 | % |
| 160 | % | $ | 92.7 |
|
| 71 | % |
| 104 | % |
| 4.4 | % |
| NA |
|
| NA |
| ||||||
Medians - All Conversions: |
| $ | 689 |
|
| 10.98 | % |
| 0.43 | % |
| 114 | % | $ | 74.1 |
|
| 54 | % |
| 91 | % |
| 2.7 | % |
| NA |
|
| NA |
| ||||||
|
|
|
|
|
|
|
|
|
|
|
|
|
|
|
|
|
|
|
|
|
|
|
|
|
|
|
|
|
|
|
|
|
|
|
|
|
|
|
|
|
Institutional Information |
| Insider Purchases |
|
|
| Pro Forma Data |
| |||||||||||||||||||||||||||||||||
|
|
|
|
| ||||||||||||||||||||||||||||||||||||
|
|
|
|
|
| % Off Incl. Fdn. |
|
|
|
|
| Pricing Ratios(3) |
| Financial Charac. |
| |||||||||||||||||||||||||
|
|
|
|
|
|
|
|
|
|
|
|
| ||||||||||||||||||||||||||||
|
|
|
|
|
| Benefit Plans |
| Mgmt.& |
| Initial |
| P/TB |
| Core |
| P/A |
| Core |
| TE/A |
| Core |
| |||||||||||||||||
|
|
|
|
|
|
|
|
|
|
|
|
|
|
| ||||||||||||||||||||||||||
Institution |
| Conver. |
| Ticker |
| ESOP |
| Recog. |
| Stk |
|
|
|
|
|
|
|
|
| |||||||||||||||||||||
|
|
|
|
|
|
|
|
|
|
|
|
|
| |||||||||||||||||||||||||||
|
|
|
|
|
| (%) |
| (%) |
| (%) |
| (%)(2) |
| (%) |
| (%) |
| (x) |
| (%) |
| (%) |
| (%) |
| (%) |
| |||||||||||||
| ||||||||||||||||||||||||||||||||||||||||
| ||||||||||||||||||||||||||||||||||||||||
Standard Conversions |
|
|
|
|
|
|
|
|
|
|
|
|
|
|
|
|
|
|
|
|
|
|
|
|
|
|
|
|
|
|
|
|
|
|
|
|
|
|
|
|
First Advantage Bancorp, TN |
|
| 11/30/07 |
|
| FABK-NASDAQ |
|
| 8.0 | % |
| 4.0 | % |
| 10.0 | % |
| 10.0 | % |
| 0.00 | % |
| 68.3 | % |
| 42.6x |
|
| 19.9 | % |
| 0.8 | % |
| 47.0 | % |
| 1.6 | % |
First Financial Northwest, Inc., WA |
|
| 10/10/07 |
|
| FFNW-NASDAQ |
|
| 7.4 | % |
| 4.0 | % |
| 10.0 | % |
| 2.3 | % |
| 0.00 | % |
| 81.4 | % |
| 23.7x |
|
| 19.4 | % |
| 0.8 | % |
| 23.9 | % |
| 3.4 | % |
Beacon Federal Bancorp, Inc., NY |
|
| 10/2/07 |
|
| BFED-NASDAQ |
|
| 8.0 | % |
| 4.0 | % |
| 10.0 | % |
| 3.8 | % |
| 0.00 | % |
| 68.3 | % |
| 30.4x |
|
| 9.9 | % |
| 0.3 | % |
| 14.4 | % |
| 2.3 | % |
|
|
|
|
|
|
|
|
|
|
|
|
|
|
|
|
|
|
|
|
|
|
|
|
|
|
|
|
|
|
|
|
|
|
|
|
|
|
|
|
|
Averages - Standard Conversions: |
|
| 7.8 | % |
| 4.0 | % |
| 10.0 | % |
| 5.4 | % |
| 0.00 | % |
| 72.6 | % |
| 32.2x |
|
| 16.4 | % |
| 0.6 | % |
| 28.4 | % |
| 2.4 | % | ||||||
Medians - Standard Conversions: |
|
| 8.0 | % |
| 4.0 | % |
| 10.0 | % |
| 3.8 | % |
| 0.00 | % |
| 68.3 | % |
| 30.4x |
|
| 19.4 | % |
| 0.8 | % |
| 23.9 | % |
| 2.3 | % | ||||||
|
|
|
|
|
|
|
|
|
|
|
|
|
|
|
|
|
|
|
|
|
|
|
|
|
|
|
|
|
|
|
|
|
|
|
|
|
|
|
|
|
Second Step Conversions |
|
|
|
|
|
|
|
|
|
|
|
|
|
|
|
|
|
|
|
|
|
|
|
|
|
|
|
|
|
|
|
|
|
|
|
|
|
|
|
|
United Financial Bancorp, Inc., MA* |
|
| 12/4/07 |
|
| UBNK-NASDAQ |
|
| 7.9 | % |
| 3.8 | % |
| 9.4 | % |
| 0.4 | % |
| 2.30 | % |
| 79.5 | % |
| 35.2x |
|
| 15.5 | % |
| 0.4 | % |
| 19.5 | % |
| 2.3 | % |
North Penn Bancorp, Inc., PA* |
|
| 10/2/07 |
|
| NPBP-OTCBB |
|
| 8.0 | % |
| 4.0 | % |
| 10.0 | % |
| 4.9 | % |
| 1.10 | % |
| 80.1 | % |
| 51.6x |
|
| 12.5 | % |
| 0.3 | % |
| 15.7 | % |
| 1.6 | % |
|
|
|
|
|
|
|
|
|
|
|
|
|
|
|
|
|
|
|
|
|
|
|
|
|
|
|
|
|
|
|
|
|
|
|
|
|
|
|
|
|
Averages - Second Step Conversions: |
|
| 7.9 | % |
| 3.9 | % |
| 9.7 | % |
| 2.6 | % |
| 1.70 | % |
| 79.8 | % |
| 43.4x |
|
| 14.0 | % |
| 0.4 | % |
| 17.6 | % |
| 1.9 | % | ||||||
Medians - Second Step Conversions: |
|
| 7.9 | % |
| 3.9 | % |
| 9.7 | % |
| 2.6 | % |
| 1.70 | % |
| 79.8 | % |
| 43.4x |
|
| 14.0 | % |
| 0.4 | % |
| 17.6 | % |
| 1.9 | % | ||||||
|
|
|
|
|
|
|
|
|
|
|
|
|
|
|
|
|
|
|
|
|
|
|
|
|
|
|
|
|
|
|
|
|
|
|
|
|
|
|
|
|
Mutual Holding Company Conversions |
|
|
|
|
|
|
|
|
|
|
|
|
|
|
|
|
|
|
|
|
|
|
|
|
|
|
|
|
|
|
|
|
|
|
|
|
| |||
Northfield Bancorp, Inc., NY |
|
| 11/8/07 |
|
| NFBK-NASDAQ |
|
| 8.7 | % |
| 4.4 | % |
| 10.9 | % |
| 2.0 | % |
| 0.00 | % |
| 83.3 | % |
| 30.2x |
|
| 26.8 | % |
| 0.8 | % |
| 21.8 | % |
| 3.3 | % |
LaPorte Bancorp, Inc., IN |
|
| 10/15/07 |
|
| LPSB-NASDAQ |
|
| 8.0 | % |
| 4.2 | % |
| 10.4 | % |
| 6.8 | % |
| 0.00 | % |
| 81.1 | % |
| 38.2x |
|
| 11.6 | % |
| 0.2 | % |
| 9.2 | % |
| 1.9 | % |
|
|
|
|
|
|
|
|
|
|
|
|
|
|
|
|
|
|
|
|
|
|
|
|
|
|
|
|
|
|
|
|
|
|
|
|
|
|
|
|
|
Averages - Mutual Holding Company Conversions: |
|
| 8.4 | % |
| 4.3 | % |
| 10.6 | % |
| 4.4 | % |
| 0.00 | % |
| 82.2 | % |
| 34.2x |
|
| 19.2 | % |
| 0.5 | % |
| 15.5 | % |
| 2.6 | % | ||||||
Medians - Mutual Holding Company Conversions: |
|
| 8.4 | % |
| 4.3 | % |
| 10.6 | % |
| 4.4 | % |
| 0.00 | % |
| 82.2 | % |
| 34.2x |
|
| 19.2 | % |
| 0.5 | % |
| 15.5 | % |
| 2.6 | % | ||||||
|
|
|
|
|
|
|
|
|
|
|
|
|
|
|
|
|
|
|
|
|
|
|
|
|
|
|
|
|
|
|
|
|
|
|
|
|
|
|
|
|
Averages - All Conversions: |
|
| 8.0 | % |
| 4.0 | % |
| 10.1 | % |
| 4.3 | % |
| 0.49 | % |
| 77.4 | % |
| 36.0x |
|
| 16.5 | % |
| 0.5 | % |
| 21.6 | % |
| 2.3 | % | ||||||
Medians - All Conversions: |
|
| 8.0 | % |
| 4.0 | % |
| 10.0 | % |
| 3.8 | % |
| 0.00 | % |
| 80.1 | % |
| 35.2x |
|
| 15.5 | % |
| 0.4 | % |
| 19.5 | % |
| 2.3 | % | ||||||
|
|
|
|
|
|
|
|
|
|
|
|
|
|
|
|
|
|
|
|
|
|
|
|
|
|
|
|
|
|
|
|
|
|
| ||||||||||||||||||||||||
Institutional Information |
| IPO |
| Post-IPO Pricing Trends |
| |||||||||||||||||||||||||||||||||||||||||||||||||||||
|
| |||||||||||||||||||||||||||||||||||||||||||||||||||||||||
|
|
|
|
|
|
| Closing Price: |
| ||||||||||||||||||||||||||||||||||||||||||||||||||
|
|
|
|
|
|
|
| |||||||||||||||||||||||||||||||||||||||||||||||||||
Institution |
| Conver. |
| Ticker |
|
| First |
| % |
| After |
| % |
| After |
| % |
| Thru |
| % |
| ||||||||||||||||||||||||||||||||||||
|
|
|
|
|
|
|
|
|
|
|
| |||||||||||||||||||||||||||||||||||||||||||||||
|
|
|
|
|
| ($) |
| ($) |
| (%) |
| ($) |
| (%) |
| ($) |
| (%) |
| ($) |
| (%) |
| |||||||||||||||||||||||||||||||||||
| ||||||||||||||||||||||||||||||||||||||||||||||||||||||||||
|
|
|
|
|
|
|
|
|
|
|
|
|
|
|
|
|
|
|
|
|
|
|
|
|
|
|
|
| ||||||||||||||||||||||||||||||
Standard Conversions |
|
|
|
|
|
|
|
|
|
|
|
|
|
|
|
|
|
|
|
|
|
|
|
|
|
|
|
| ||||||||||||||||||||||||||||||
First Advantage Bancorp, TN |
|
| 11/30/07 |
|
| FABK-NASDAQ |
| $ | 10.00 |
| $ | 11.17 |
|
| 11.7 | % | $ | 10.70 |
|
| 7.0 | % | $ | 10.70 |
|
| 7.0 | % | $ | 10.70 |
|
| 7.0 | % | ||||||||||||||||||||||||
First Financial Northwest, Inc., WA |
|
| 10/10/07 |
|
| FFNW-NASDAQ |
| $ | 10.00 |
| $ | 11.73 |
|
| 17.3 | % | $ | 11.50 |
|
| 15.0 | % | $ | 10.81 |
|
| 8.1 | % | $ | 10.16 |
|
| 1.6 | % | ||||||||||||||||||||||||
Beacon Federal Bancorp, Inc., NY |
|
| 10/2/07 |
|
| BFED-NASDAQ |
| $ | 10.00 |
| $ | 11.60 |
|
| 16.0 | % | $ | 11.79 |
|
| 17.9 | % | $ | 10.60 |
|
| 6.0 | % | $ | 10.10 |
|
| 1.0 | % | ||||||||||||||||||||||||
|
|
|
|
|
|
|
|
|
|
|
|
|
|
|
|
|
|
|
|
|
|
|
|
|
|
|
|
|
|
|
|
|
|
| ||||||||||||||||||||||||
Averages - Standard Conversions: |
| $ | 10.00 |
| $ | 11.50 |
|
| 15.0 | % | $ | 11.33 |
|
| 13.3 | % | $ | 10.70 |
|
| 7.0 | % | $ | 10.32 |
|
| 3.2 | % | ||||||||||||||||||||||||||||||
Medians - Standard Conversions: |
| $ | 10.00 |
| $ | 11.60 |
|
| 16.0 | % | $ | 11.50 |
|
| 15.0 | % | $ | 10.70 |
|
| 7.0 | % | $ | 10.16 |
|
| 1.6 | % | ||||||||||||||||||||||||||||||
|
|
|
|
|
|
|
|
|
|
|
|
|
|
|
|
|
|
|
|
|
|
|
|
|
|
|
|
|
|
|
|
|
|
| ||||||||||||||||||||||||
Second Step Conversions |
|
|
|
|
|
|
|
|
|
|
|
|
|
|
|
|
|
|
|
|
|
|
|
|
|
|
|
| ||||||||||||||||||||||||||||||
United Financial Bancorp, Inc., MA* |
|
| 12/4/07 |
|
| UBNK-NASDAQ |
| $ | 10.00 |
| $ | 10.30 |
|
| 3.0 | % | $ | 10.35 |
|
| 3.5 | % | $ | 10.35 |
|
| 3.5 | % | $ | 10.35 |
|
| 3.5 | % | ||||||||||||||||||||||||
North Penn Bancorp, Inc., PA* |
|
| 10/2/07 |
|
| NPBP-OTCBB |
| $ | 10.00 |
| $ | 10.28 |
|
| 2.8 | % | $ | 10.20 |
|
| 2.0 | % | $ | 9.80 |
|
| -2.0 | % | $ | 8.60 |
|
| -14.0 | % | ||||||||||||||||||||||||
|
|
|
|
|
|
|
|
|
|
|
|
|
|
|
|
|
|
|
|
|
|
|
|
|
|
|
|
|
|
|
|
|
|
| ||||||||||||||||||||||||
Averages - Second Step Conversions: |
| $ | 10.00 |
| $ | 10.29 |
|
| 2.9 | % | $ | 10.28 |
|
| 2.7 | % | $ | 10.08 |
|
| 0.8 | % | $ | 9.48 |
|
| -5.3 | % | ||||||||||||||||||||||||||||||
Medians - Second Step Conversions: |
| $ | 10.00 |
| $ | 10.29 |
|
| 2.9 | % | $ | 10.28 |
|
| 2.7 | % | $ | 10.08 |
|
| 0.8 | % | $ | 9.48 |
|
| -5.3 | % | ||||||||||||||||||||||||||||||
|
|
|
|
|
|
|
|
|
|
|
|
|
|
|
|
|
|
|
|
|
|
|
|
|
|
|
|
|
|
|
|
|
|
| ||||||||||||||||||||||||
|
|
|
|
|
|
|
|
|
|
|
|
|
|
|
|
|
|
|
|
|
|
|
|
|
|
|
|
|
|
|
|
|
|
| ||||||||||||||||||||||||
Mutual Holding Company Conversions |
|
|
|
|
|
|
|
|
|
|
|
|
|
|
|
|
|
|
|
|
|
|
|
|
|
|
|
| ||||||||||||||||||||||||||||||
Northfield Bancorp, Inc., NY |
|
| 11/8/07 |
|
| NFBK-NASDAQ |
| $ | 10.00 |
| $ | 10.45 |
|
| 4.5 | % | $ | 11.67 |
|
| 16.7 | % | $ | 10.49 |
|
| 4.9 | % | $ | 10.49 |
|
| 4.9 | % | ||||||||||||||||||||||||
LaPorte Bancorp, Inc., IN |
|
| 10/15/07 |
|
| LPSB-NASDAQ |
| $ | 10.00 |
| $ | 9.19 |
|
| -8.1 | % | $ | 8.28 |
|
| -17.2 | % | $ | 8.13 |
|
| -18.7 | % | $ | 7.73 |
|
| -22.7 | % | ||||||||||||||||||||||||
|
|
|
|
|
|
|
|
|
|
|
|
|
|
|
|
|
|
|
|
|
|
|
|
|
|
|
|
|
|
|
|
|
|
| ||||||||||||||||||||||||
Averages - Mutual Holding Company Conversions: |
| $ | 10.00 |
| $ | 9.82 |
|
| -1.8 | % | $ | 9.98 |
|
| -0.3 | % | $ | 9.31 |
|
| -6.9 | % | $ | 9.11 |
|
| -8.9 | % | ||||||||||||||||||||||||||||||
Medians - Mutual Holding Company Conversions: |
| $ | 10.00 |
| $ | 9.82 |
|
| -1.8 | % | $ | 9.98 |
|
| -0.3 | % | $ | 9.31 |
|
| -6.9 | % | $ | 9.11 |
|
| -8.9 | % | ||||||||||||||||||||||||||||||
|
|
|
|
|
|
|
|
|
|
|
|
|
|
|
|
|
|
|
|
|
|
|
|
|
|
|
|
|
|
|
|
|
|
| ||||||||||||||||||||||||
Averages - All Conversions: |
| $ | 10.00 |
| $ | 10.67 |
|
| 6.7 | % | $ | 10.64 |
|
| 6.4 | % | $ | 10.13 |
|
| 1.3 | % | $ | 9.73 |
|
| -2.7 | % | ||||||||||||||||||||||||||||||
Medians - All Conversions: |
| $ | 10.00 |
| $ | 10.45 |
|
| 4.5 | % | $ | 10.70 |
|
| 7.0 | % | $ | 10.49 |
|
| 4.9 | % | $ | 10.16 |
|
| 1.6 | % | ||||||||||||||||||||||||||||||
Note: * - Appraisal performed by RP Financial; BOLD=RP Financial did the Conversion Business Plan. “NT” - Not Traded; “NA” - Not Applicable, Not Available; C/S-Cash/Stock.
|
|
(1) | Non-OTS regulated thrift. |
|
|
(2) | As a percent of MHC offering for MHC transactions. |
|
|
(3) | Does not take into account the adoption of SOP 93-6. |
|
|
(4) | Latest price if offering is less than one week old. |
|
|
(5) | Latest price if offering is more than one week but less than one month old. |
|
|
(6) | Mutual holding company pro forma data on full conversion basis. |
|
|
(7) | Simultaneously completed acquisition of another financial institution. |
|
|
(8) | Simultaneously converted to a commercial bank charter. |
|
|
(9) | Former credit union. |
December 7, 2007
|
|
RP® Financial, LC. | VALUATION ANALYSIS |
| IV.19 |
created by completing an acquisition of another financial simultaneous with the first step offering. LaPorte’s stock price was down 17.2% from the IPO price after the first week of trading, versus a 16.7% increase in Northfield’s stock price after one week of trading. As of December 7, 2007, LaPorte’s stock price closed 22.7% below the IPO price and Northfield’s stock price closed 4.9% above the IPO price.
Shown in Table 4.3 are the current pricing ratios for the two companies that have completed fully-converted offerings during the past three months and are traded on NASDAQ or an Exchange. Both offerings were standard conversions. The current average P/TB ratio of the publicly-traded recent conversions equaled 76.73%.
|
|
|
| C. |
Also considered in the valuation was the potential impact on the Bank’s stock price of recently completed and pending acquisitions of other savings institutions and banks operating in Pennsylvania. As shown in Exhibit IV-4, there were six Pennsylvania acquisitions of thrifts completed from the beginning of 2004 through year-to-date 2007, and there is currently one acquisition pending for a Pennsylvania thrift. To the extent that speculation of a re-mutualization may impact the Bank’s valuation, we have largely taken this into account in selecting companies which operate in the MHC form of ownership. Accordingly, the Peer Group companies are considered to be subject to the same type of acquisition speculation that may influence the Bank’s trading price.
* * * * * * * * * * *
In determining our valuation adjustment for marketing of the issue, we considered trends in both the overall thrift market, the new issue market including the new issue market for MHC shares and the local acquisition market for thrift and bank stocks. Taking these factors and trends into account, RP Financial concluded that a moderate downward adjustment was appropriate in the valuation analysis for purposes of marketing of the issue.
|
|
RP® Financial, LC. | VALUATION ANALYSIS |
| IV.20 |
Table 4.3
Market Pricing Comparatives
Prices As of December 7, 2007
|
|
|
|
|
|
|
|
|
|
|
|
|
|
|
|
|
|
|
|
|
|
|
|
|
|
|
|
|
|
|
| Market |
| Per Share Data |
|
|
|
|
|
|
|
|
|
|
|
|
|
|
|
| |||||||||
|
|
|
|
|
|
|
|
|
|
|
|
|
|
|
|
|
|
| |||||||||||
|
|
| Core |
| Book |
| Pricing Ratios(3) |
| |||||||||||||||||||||
|
| Price/ |
| Market |
|
|
|
| |||||||||||||||||||||
Financial Institution |
|
|
|
|
| P/E |
| P/B |
| P/A |
| P/TB |
| P/Core |
| ||||||||||||||
|
|
|
|
|
|
|
|
|
| ||||||||||||||||||||
|
| ($) |
| ($Mil) |
| ($) |
| ($) |
| (x) |
| (%) |
| (%) |
| (%) |
| (x) |
| ||||||||||
|
|
|
|
|
|
|
|
|
|
|
|
|
|
|
|
|
|
|
| ||||||||||
All Public Companies |
| $ | 14.80 |
| $ | 361.58 |
| $ | 0.71 |
| $ | 13.53 |
|
| 20.53 | x |
| 117.66 | % |
| 15.21 | % |
| 133.26 | % |
| 21.00 | x | |
Converted Last 3 Months (no MHC) |
| $ | 10.33 |
| $ | 136.79 |
| $ | 0.32 |
| $ | 13.70 |
|
| 30.69 | x |
| 75.75 | % |
| 16.77 | % |
| 76.77 | % |
| 30.59 | x | |
|
|
|
|
|
|
|
|
|
|
|
|
|
|
|
|
|
|
|
|
|
|
|
|
|
|
|
|
| |
Converted Last 3 Months (no MHC) |
|
|
|
|
|
|
|
|
|
|
|
|
|
|
|
|
|
|
|
|
|
|
|
|
|
|
|
| |
BFED | Beacon Federal Bancorp of NY |
| $ | 10.10 |
| $ | 74.79 |
| $ | 0.33 |
| $ | 14.64 |
|
| 29.71 | x |
| 68.99 | % |
| 9.95 | % |
| 68.99 | % |
| 30.61 | x |
FABK | First Advantage Bancorp of TN |
| $ | 10.70 |
| $ | 56.34 |
| $ | 0.23 |
| $ | 14.65 |
|
| NM |
|
| 73.04 | % |
| 21.32 | % |
| 73.04 | % |
| NM |
|
FFNW | First Financial NW, Inc of Renton, WA |
| $ | 10.16 |
| $ | 232.19 |
| $ | 0.42 |
| $ | 12.91 |
|
| 25.40 | x |
| 78.70 | % |
| 19.75 | % |
| 82.67 | % |
| 24.19 | x |
UBNKD | United Financial Bancorp of MA |
| $ | 10.35 |
| $ | 183.86 |
| $ | 0.28 |
| $ | 12.58 |
|
| 36.96 | x |
| 82.27 | % |
| 16.04 | % |
| 82.40 | % |
| 36.96 | x |
|
|
|
|
|
|
|
|
|
|
|
|
|
|
|
|
|
|
|
|
|
|
|
|
|
|
|
|
|
|
|
| |
|
|
|
|
|
|
|
|
|
|
|
| Financial Characteristics(6) |
| |||||||||||||||||||
|
| Dividends(4) |
|
| ||||||||||||||||||||||||||||
|
|
|
|
|
|
|
|
|
|
|
| Reported |
| Core |
| |||||||||||||||||
|
| Amount/ |
| Yield |
| Payout |
| Total |
| Equity/ |
| NPAs/ |
|
|
| |||||||||||||||||
Financial Institution |
|
|
|
|
|
|
| ROA |
| ROE |
| ROA |
| ROE |
| |||||||||||||||||
|
|
|
|
|
|
|
|
|
|
| ||||||||||||||||||||||
|
| ($) |
| (%) |
| (%) |
| ($Mil) |
| (%) |
| (%) |
| (%) |
| (%) |
| (%) |
| (%) |
| |||||||||||
|
|
|
|
|
|
|
|
|
|
|
|
|
|
|
|
|
|
|
|
|
|
|
|
|
|
|
|
|
|
|
| |
All Public Companies |
| $ | 0.39 |
|
| 2.53 | % |
| 33.73 | % | $ | 3,173 |
|
| 12.75 | % |
| 0.65 | % |
| 0.52 | % |
| 4.65 | % |
| 0.48 | % |
| 4.44 | % | |
Converted Last 3 Months (no MHC) |
| $ | 0.06 |
|
| 0.56 | % |
| 0.00 | % | $ | 834 |
|
| 22.05 | % |
| 0.14 | % |
| 0.48 | % |
| 2.24 | % |
| 0.51 | % |
| 2.33 | % | |
|
|
|
|
|
|
|
|
|
|
|
|
|
|
|
|
|
|
|
|
|
|
|
|
|
|
|
|
|
|
|
| |
Converted Last 3 Months (no MHC) |
|
|
|
|
|
|
|
|
|
|
|
|
|
|
|
|
|
|
|
|
|
|
|
|
|
|
|
|
|
|
| |
BFED | Beacon Federal |
| $ | 0.00 |
|
| 0.00 | % |
| 0.00 | % | $ | 752 |
|
| 14.42 | % |
| 0.11 | % |
| 0.33 | % |
| 2.32 | % |
| 0.32 | % |
| 2.25 | % |
FABK | First Advantage |
| $ | 0.00 |
|
| 0.00 | % |
| 0.00 | % | $ | 264 |
|
| 29.19 | % |
| NA |
|
| 0.38 | % |
| 1.30 | % |
| 0.46 | % |
| 1.57 | % |
FFNW | First Financial NW, |
| $ | 0.00 |
|
| 0.00 | % |
| 0.00 | % | $ | 1,176 |
|
| 25.10 | % |
| 0.01 | % |
| 0.78 | % |
| 3.10 | % |
| 0.82 | % |
| 3.25 | % |
UBNKD | United Financial |
| $ | 0.23 |
|
| 2.22 | % |
| NM |
| $ | 1,146 |
|
| 19.49 | % |
| 0.29 | % |
| 0.43 | % |
| 2.23 | % |
| 0.43 | % |
| 2.23 | % |
|
|
(1) | Average of High/Low or Bid/Ask price per share. |
|
|
(2) | EPS (estimate core basis) is based on actual trailing 12 month data, adjusted to omit non-operating items on a tax-effected basis. |
|
|
(3) | P/E = Price to earnings; P/B = Price to book; P/A = Price to assets; P/TB = Price to tangible book value; and P/Core = Price to core earnings. |
|
|
(4) | Indicated 12 month dividend, based on last quarterly dividend declared. |
|
|
(5) | Indicated 12 month dividend as a percent of trailing 12 month estimated core earnings. |
|
|
(6) | ROA (return on assets) and ROE (return on equity) are indicated ratios based on trailing 12 month common earnings and average common equity and total assets balances. |
|
|
(7) | Excludes from averages and medians those companies the subject of actual or rumored acquisition activities or unusual operating characteristics. |
Source: Corporate reports, offering circulars, and RP® Financial, LC. calculations. The information provided in this report has been obtained from sources we believe are reliable, but we cannot guarantee the accuracy or completeness of such information.
Copyright (c) 2007 by RP® Financial, LC.
|
|
RP® Financial, LC. | VALUATION ANALYSIS |
| IV.21 |
|
|
8. |
The Bank’s management team appears to have experience and expertise in all of the key areas of the Bank’s operations. Exhibit IV-5 provides summary resumes of the Bank’s Board of Directors and senior management. The financial characteristics of the Bank suggest that the Board and senior management have been effective in implementing an operating strategy that can be well managed by the Bank’s present organizational structure. The Bank currently does not have any senior management positions that are vacant.
Similarly, the returns, equity positions and other operating measures of the Peer Group companies are indicative of well-managed financial institutions, which have Boards and management teams that have been effective in implementing competitive operating strategies. Therefore, on balance, we concluded no valuation adjustment relative to the Peer Group was appropriate for this factor.
|
|
9. |
In summary, as a federally-insured savings institution operating in the MHC form of ownership, the Bank will operate in substantially the same regulatory environment as the Peer Group members -- all of whom are adequately capitalized institutions and are operating with no apparent restrictions. Exhibit IV-6 reflects the Bank’s pro forma regulatory capital ratios. On balance, no adjustment has been applied for the effect of government regulation and regulatory reform.
Overall, based on the factors discussed above, we concluded that the Bank’s pro forma market value should reflect the following valuation adjustments relative to the Peer Group:
|
|
RP® Financial, LC. | VALUATION ANALYSIS |
| IV.22 |
|
|
|
Key Valuation Parameters: |
| Valuation Adjustment |
| ||
Financial Condition |
| No Adjustment |
Profitability, Growth and Viability of Earnings |
| No Adjustment |
Asset Growth |
| No Adjustment |
Primary Market Area |
| Moderate Upward |
Dividends |
| No Adjustment |
Liquidity of the Shares |
| No Adjustment |
Marketing of the Issue |
| Moderate Downward |
Management |
| No Adjustment |
Effect of Govt. Regulations and Regulatory Reform |
| No Adjustment |
Basis of Valuation - Fully-Converted Pricing Ratios
As indicated in Chapter III, the valuation analysis included in this section places the Peer Group institutions on equal footing by restating their financial data and pricing ratios on a “fully-converted” basis. We believe there are a number of characteristics of MHC shares that make them different from the shares of fully-converted companies. These factors include: (1) lower aftermarket liquidity in the MHC shares since less than 50% of the shares are available for trading; (2) no opportunity for public shareholders to exercise voting control; (3) the potential pro forma impact of second-step conversions on the pricing of MHC institutions; and (4) the regulatory policies regarding the dividend waiver policy by MHC institutions. The above characteristics of MHC shares have provided MHC shares with different trading characteristics versus fully-converted companies. To account for the unique trading characteristics of MHC shares, RP Financial has placed the financial data and pricing ratios of the Peer Group on a fully-converted basis to make them comparable for valuation purposes. Using the per share and pricing information of the Peer Group on a fully-converted basis accomplishes a number of objectives. First, such figures eliminate distortions that result when trying to compare institutions that have different public ownership interests outstanding. Secondly, such an analysis provides ratios that are comparable to the pricing information of fully-converted public companies, and more importantly, are directly applicable to determining the pro forma market value range of the 100% ownership interest in the Bank as an MHC. Lastly, such an analysis allows for consideration of the potential dilutive impact of dividend waiver policies adopted by the Federal agencies.
|
|
RP® Financial, LC. | VALUATION ANALYSIS |
| IV.23 |
This technique is validated by the investment community’s evaluation of MHC pricing, which also incorporates the pro forma impact of a second-step conversion based on the current market price.
To calculate the fully-converted pricing information for MHCs, the reported financial information for the public MHCs must incorporate the following assumptions, based on completed second-step conversions to date: (1) all shares owned by the MHC are assumed to be sold at the current trading price in a second step-conversion; (2) the gross proceeds from such a sale are adjusted to reflect reasonable offering expenses and standard stock based benefit plan parameters that would be factored into a second-step conversion of MHC institutions; (3) net proceeds are assumed to be reinvested at market rates on a tax effected basis; and (4) the public ownership interest is adjusted to reflect the pro forma impact of the waived dividends pursuant to applicable regulatory policy. Book value per share and earnings per share figures for the public MHCs were adjusted by the impact of the assumed second step-conversion, resulting in an estimation of book value per share and earnings per share figures on a fully-converted basis. Table 4.4 on the following page shows the calculation of per share financial data (fully-converted basis) for each of the ten public MHC institutions that form the Peer Group.
Valuation Approaches: Fully-Converted Basis
In applying the accepted valuation methodology promulgated by the OTS and adopted by the FDIC, i.e., the pro forma market value approach, including the fully-converted analysis described above, we considered the three key pricing ratios in valuing the Bank’s to-be-issued stock -- price/earnings (“P/E”), price/book (“P/B”), and price/assets (“P/A”) approaches -- all performed on a pro forma basis including the effects of the stock proceeds. In computing the pro forma impact of the conversion and the related pricing ratios, we have incorporated the valuation parameters disclosed in the Bank’s prospectus for reinvestment rate, effective tax rate, stock benefit plan assumptions and the Foundation (summarized in Exhibits IV-7 and IV-8). Pursuant to the minority stock offering, we have also incorporated the valuation parameters
|
|
RP® Financial, LC. | VALUATION ANALYSIS |
Table 4.4
Calculation of Implied Per Share Data -- Incorporating MHC Second Step Conversion
Comparable Institution Analysis
For the 12 Months Ended September 30, 2007
|
|
|
|
|
|
|
|
|
|
|
|
|
|
|
|
|
|
|
|
|
|
|
|
|
|
|
|
|
| Current Ownership |
| Current Per Share Data (MHC Ratios) |
| ||||||||||||||||||||||
|
|
|
| ||||||||||||||||||||||||
|
| Total |
| Public |
| MHC |
| EPS |
| Core |
| Book |
| Tang. |
| Assets |
| ||||||||||
|
|
|
|
|
|
|
|
|
| ||||||||||||||||||
|
| (000) |
| (000) |
| (000) |
| ($) |
| ($) |
| ($) |
| ($) |
| ($) |
| ||||||||||
Publicly-Traded MHC Institutions |
|
|
|
|
|
|
|
|
|
|
|
|
|
|
|
|
|
|
|
|
|
|
|
|
| ||
BFSB |
| Brooklyn Federal MHC of NY (31.0) |
|
| 13,418 |
|
| 3,968 |
|
| 9,450 |
|
| 0.29 |
|
| 0.27 |
|
| 6.35 |
|
| 6.35 |
|
| 29.10 |
|
COBK |
| Colonial Bank MHC of NJ (44.9) |
|
| 4,433 |
|
| 2,080 |
|
| 2,353 |
|
| 0.33 |
|
| 0.32 |
|
| 8.5 |
|
| 8.50 |
|
| 99.00 |
|
CSBK |
| Clifton Savings Bncrp MHC of NJ (41.0) |
|
| 27,890 |
|
| 12,813 |
|
| 15,077 |
|
| 0.08 |
|
| 0.08 |
|
| 6.3 |
|
| 6.30 |
|
| 28.39 |
|
FXCB |
| Fox Chase Bancorp MHC of PA (44.5) |
|
| 14,680 |
|
| 6,531 |
|
| 8,149 |
|
| 0.25 |
|
| 0.28 |
|
| 8.66 |
|
| 8.66 |
|
| 50.77 |
|
LSBK |
| Lake Shore Bancorp MHC of NY (43.7) |
|
| 6,464 |
|
| 2,976 |
|
| 3,488 |
|
| 0.23 |
|
| 0.23 |
|
| 8.24 |
|
| 8.24 |
|
| 55.13 |
|
MGYR |
| Magyar Bancorp MHC of NJ (45.1) |
|
| 5,799 |
|
| 2,723 |
|
| 3,076 |
|
| 0.14 |
|
| 0.14 |
|
| 8.21 |
|
| 8.21 |
|
| 81.81 |
|
ONFC |
| Oneida Financial MHC of NY (43.9) |
|
| 7,788 |
|
| 3,474 |
|
| 4,314 |
|
| 0.49 |
|
| 0.5 |
|
| 7.53 |
|
| 4.25 |
|
| 65.94 |
|
OSHC |
| Ocean Shore Holding MHC of NJ (44.0) |
|
| 8,408 |
|
| 3,860 |
|
| 4,548 |
|
| 0.3 |
|
| 0.3 |
|
| 7.43 |
|
| 7.43 |
|
| 71.77 |
|
PBIP |
| Prudential Bancorp MHC PA (40.5) |
|
| 11,614 |
|
| 5155 |
|
| 6,459 |
|
| 0.32 |
|
| 0.32 |
|
| 7.12 |
|
| 7.12 |
|
| 41.11 |
|
ROMA |
| Roma Financial Corp MHC of NJ (31.0) |
|
| 31,750 |
|
| 10,147 |
|
| 21,603 |
|
| 0.25 |
|
| 0.25 |
|
| 7.01 |
|
| 6.99 |
|
| 27.62 |
|
|
|
|
|
|
|
|
|
|
|
|
|
|
|
|
|
|
|
|
|
|
|
|
|
|
|
|
|
|
|
|
|
|
|
|
|
|
|
| Impact of Second Step Conversion(4) |
| Pro Forma |
| Pro Forma(5) |
| |||||||||||||||||||||||||||||
|
|
|
|
| ||||||||||||||||||||||||||||||||
|
| Share |
| Gross |
| Net Incr. |
| Net Incr. |
| EPS |
| Core |
| Book |
| Tang. |
| Assets |
| Public |
| Dilution |
| |||||||||||||
|
|
|
|
|
|
|
|
|
|
|
|
| ||||||||||||||||||||||||
|
| ($) |
| ($000) |
| ($000) |
| ($000) |
| ($) |
| ($) |
| ($) |
| ($) |
| ($) |
| (%) |
| (%) |
| |||||||||||||
Publicly-Traded MHC Institutions |
|
|
|
|
|
|
|
|
|
|
|
|
|
|
|
|
|
|
|
|
|
|
| |||||||||||||
BFSB |
| Brooklyn Federal MHC of NY (31.0) |
|
| 13.60 |
|
| 128,520 |
|
| 110,527 |
|
| 2,158 |
|
| 0.45 |
|
| 0.43 |
|
| 14.59 |
|
| 14.59 |
|
| 37.34 |
|
| 29.6 |
|
| 0.0 |
|
COBK |
| Colonial Bank MHC of NJ (44.9) |
|
| 10.38 |
|
| 24,424 |
|
| 21,005 |
|
| 410 |
|
| 0.42 |
|
| 0.41 |
|
| 13.24 |
|
| 13.24 |
|
| 103.74 |
|
| 46.9 |
|
| 0.0 |
|
CSBK |
| Clifton Savings Bncrp MHC of NJ (41.0) |
|
| 10.40 |
|
| 156,801 |
|
| 134,849 |
|
| 2,632 |
|
| 0.17 |
|
| 0.17 |
|
| 11.14 |
|
| 11.14 |
|
| 33.23 |
|
| 45.9 |
|
| 0.0 |
|
FXCB |
| Fox Chase Bancorp MHC of PA (44.5) |
|
| 11.95 |
|
| 97,381 |
|
| 83,747 |
|
| 1,635 |
|
| 0.36 |
|
| 0.39 |
|
| 14.36 |
|
| 14.36 |
|
| 56.47 |
|
| 44.5 |
|
| 0.0 |
|
LSBK |
| Lake Shore Bancorp MHC of NY (43.7) |
|
| 9.00 |
|
| 31,392 |
|
| 26,997 |
|
| 527 |
|
| 0.31 |
|
| 0.31 |
|
| 12.42 |
|
| 12.42 |
|
| 59.31 |
|
| 46.0 |
|
| 0.0 |
|
MGYR |
| Magyar Bancorp MHC of NJ (45.1) |
|
| 11.06 |
|
| 34,046 |
|
| 29,304 |
|
| 572 |
|
| 0.24 |
|
| 0.24 |
|
| 13.26 |
|
| 13.26 |
|
| 86.83 |
|
| 46.9 |
|
| 0.0 |
|
ONFC |
| Oneida Financial MHC of NY (43.9) |
|
| 10.25 |
|
| 44,219 |
|
| 38,028 |
|
| 742 |
|
| 0.59 |
|
| 0.60 |
|
| 12.41 |
|
| 9.13 |
|
| 70.82 |
|
| 44.6 |
|
| 0.0 |
|
OSHC |
| Ocean Shore Holding MHC of NJ (44.0) |
|
| 10.35 |
|
| 47,072 |
|
| 40,482 |
|
| 790 |
|
| 0.39 |
|
| 0.39 |
|
| 12.24 |
|
| 12.24 |
|
| 76.58 |
|
| 45.9 |
|
| 0.0 |
|
PBIP |
| Prudential Bancorp MHC PA (40.5) |
|
| 12.50 |
|
| 81,114 |
|
| 70,134 |
|
| 1374 |
|
| 0.44 |
|
| 0.44 |
|
| 13.12 |
|
| 13.12 |
|
| 47.03 |
|
| 44.3 |
|
| -0.1 |
|
ROMA |
| Roma Financial Corp MHC of NJ (31.0) |
|
| 16.35 |
|
| 353,209 |
|
| 303,760 |
|
| 5,930 |
|
| 0.44 |
|
| 0.44 |
|
| 16.58 |
|
| 16.56 |
|
| 37.19 |
|
| 32.0 |
|
| 0.0 |
|
|
|
(1) | Gross proceeds calculated as stock price multiplied by the number of shares owned by the mutual holding company (i.e., non-public shares). |
|
|
(2) | Net increase in capital reflects gross proceeds less offering expenses, contra-equity account for leveraged ESOP and deferred compensation account for restricted stock plan. For institutions with assets at the MHC level, the net increase in capital also includes consolidation of MHC assets with the capital of the institution concurrent with hypothetical second step. |
|
|
|
|
|
|
| Offering expense percent |
|
| 2.00 | % |
| ESOP percent purchase |
|
| 8.00 | % |
| Recognition plan percent |
|
| 4.00 | % |
|
|
(3) | Net increase in earnings reflects after-tax reinvestment income (assumes ESOP and recognition plan do not generate reinvestment income), less after-tax ESOP amortization and recognition plan vesting: |
|
|
|
|
|
|
| After-tax reinvestment |
|
| 3.18 | % |
| ESOP loan term (years) |
|
| 10 |
|
| Recognition plan vesting (years) |
|
| 5 |
|
| Effective tax rate |
|
| 34.00 | % |
|
|
(4) | Figures reflect adjustments to “non-grandfathered” companies to reflect dilutive impact of cumulative dividends waived by the MHC (reflect FDIC policy regarding waived dividends). |
|
|
(5) | Reflects pro forma ownership position of minority stockholders after taking into account the OTS and FDIC policies regarding waived dividends assuming a hypothetical second step. For OTS “grandfathered” companies, dilution reflects excess waived dividends and MHC assets. For all other companies, dilution reflects all waived dividends and MHC assets. |
|
|
Source: | Audited and unaudited financial statements, corporate reports, offering circulars, and RP Financial, LC. calculations. The information provided in this report has been obtained from sources we believe are reliable, but we cannot guarantee the accuracy or completeness of such information. |
Copyright (c) 2007 by RP® Financial, LC.
|
|
RP®Financial, LC. | VALUATION ANALYSIS |
| IV.25 |
disclosed in the Bank’s prospectus for offering expenses. The assumptions utilized in the pro forma analysis in calculating the Bank’s full conversion value were consistent with the assumptions utilized for the minority stock offering.
In our estimate of value, we assessed the relationship of the pro forma pricing ratios relative to the Peer Group, recent conversions and MHC offerings.
RP Financial’s valuation placed an emphasis on the following:
|
|
|
| • | P/E Approach. The P/E approach is generally the best indicator of long-term value for a stock. Given the similarities between the Bank’s and the Peer Group’s earnings composition and overall financial condition, the P/E approach was carefully considered in this valuation. At the same time, recognizing that (1) the earnings multiples will be evaluated on a pro forma fully-converted basis for the Bank as well as for the Peer Group; and (2) the Peer Group on average has had the opportunity to realize the benefit of reinvesting the minority offering proceeds, we also gave weight to the other valuation approaches. |
|
|
|
| • | P/B Approach. P/B ratios have generally served as a useful benchmark in the valuation of thrift stocks, particularly in the context of an initial public offering, as the earnings approach involves assumptions regarding the use of proceeds. RP Financial considered the P/B approach to be a valuable indicator of pro forma value taking into account the pricing ratios under the P/E and P/A approaches. We have also modified the P/B approach to exclude the impact of intangible assets (i.e., price/tangible book value or “P/TB”), in that the investment community frequently makes this adjustment in its evaluation of this pricing approach. |
|
|
|
| • | P/A Approach. P/A ratios are generally a less reliable indicator of market value, as investors typically assign less weight to assets and attribute greater weight to book value and earnings. Furthermore, this approach as set forth in the regulatory valuation guidelines does not take into account the amount of stock purchases funded by deposit withdrawals, thus understating the pro forma P/A ratio. At the same time, the P/A ratio is an indicator of franchise value, and, in the case of highly capitalized institutions, high P/A ratios may limit the investment community’s willingness to pay market multiples for earnings or book value when ROE is expected to be low. |
The Bank will adopt Statement of Position (“SOP”) 93-6, which will cause earnings per share computations to be based on shares issued and outstanding excluding unreleased ESOP shares. For purposes of preparing the pro forma pricing analyses, we have reflected all shares issued in the offering, including all ESOP shares,
|
|
RP®Financial, LC. | VALUATION ANALYSIS |
| IV.26 |
to capture the full dilutive impact, particularly since the ESOP shares are economically dilutive, receive dividends and can be voted. However, we did consider the impact of the adoption of SOP 93-6 in the valuation.
Based on the application of the three valuation approaches, taking into consideration the valuation adjustments discussed above, RP Financial concluded that as of December 7, 2007, the pro forma market value of the Bank’s full conversion offering, taking into account the dilutive impact of the stock contribution to the Foundation, equaled $70,000,000 at the midpoint, equal to 7,000,000 shares at $10.00 per share.
|
|
|
|
|
|
| Amount |
| |
|
|
| ||
|
| ($000) |
| |
|
|
|
| |
Net income |
| $ | 2,412 |
|
Add back: Loss on sale of investments(1) |
|
| 5 |
|
|
|
| ||
Core earnings estimate |
| $ | 2,417 |
|
|
|
|
| (1) | Tax effected at 38.5%. |
|
|
RP®Financial, LC. | VALUATION ANALYSIS |
| IV.27 |
Based on the Bank’s reported and estimated core earnings and incorporating the impact of the pro forma assumptions discussed previously, the Bank’s pro forma reported and core P/E multiples (fully-converted basis) at the $70.0 million midpoint value equaled 24.94 times and 24.90 times, respectively, which provided for discounts 12.0% and 11.8% relative to the Peer Group’s average reported and core P/E multiples (fully-converted basis) of 28.33 times and 28.23 times, respectively (see Table 4.5). In comparison to the Peer Group’s median reported and core earnings multiples which both equaled of 28.72 times, the Bank’s pro forma reported and core P/E multiples at the midpoint value indicated discounts of 13.2% and 13.3%, respectively. At the top of the super range, the Bank’s reported and core P/E multiples equaled 31.56 times and 31.50 times, respectively. In comparison to the Peer Group’s average reported and core P/E multiples, the Bank’ P/E multiples at the top of the super range reflected premiums of 11.4% and 11.6%, respectively. In comparison to the Peer Group’s median reported and core P/E multiples, the Bank’ P/E multiples at the top of the super range reflected premiums of 9.9% and 9.7%, respectively.
On an MHC reported basis, the Bank’s reported and core P/E multiples at the midpoint value of $70.0 million equaled 27.96 times and 27.90 times, respectively. The Bank’s reported and core P/E multiples provided for discounts of 15.3% and 15.8% relative to the Peer Group’s average reported and core P/E multiples of 33.01 times and 33.13 times, respectively. In comparison to the Peer Group’s median reported and core earnings multiples which both equaled 34.50 times, the Bank’s pro forma reported and core P/E multiples on an MHC basis at the midpoint value indicated discounts of 19.0% and 19.1%, respectively. At the top of the super range on an MHC basis, the Bank’s reported and core P/E multiples equaled 36.41 times and 36.34 times, respectively. In comparison to the Peer Group’s average reported and core P/E multiples, the Bank’ P/E multiples at the top of the super range reflected premiums of 10.3% and 9.7%, respectively. In comparison to the Peer Group’s median reported and core P/E multiples, the Bank’ P/E multiples at the top of the super range reflected premiums of 5.5% and 5.3%, respectively. The Bank’s implied MHC pricing ratios relative to the MHC pricing ratios for the Peer Group are shown in Table 4.6, and the pro forma calculations are detailed in Exhibits IV-10 and Exhibit IV-11.
|
|
RP® Financial, LC. | VALUATION ANALYSIS |
| IV.28 |
Table 4.5
MHC Institutions — Implied Pricing Ratios, Full Conversion Basis
Malvern Federal Savings Bank and the Comparables
As of December 7, 2007
|
|
|
|
|
|
|
|
|
|
|
|
|
|
|
|
|
|
|
|
|
|
|
|
|
|
|
|
|
|
|
|
| Fully Converted |
| Per Share(8) |
|
|
| |||||||||||||||||||||
|
|
|
|
|
| Pricing Ratios(3) |
| ||||||||||||||||||||||
Financial Institution |
| Price/ |
| Market |
| Core 12 Mo. |
| Book Value/ |
|
| |||||||||||||||||||
| P/E |
| P/B |
| P/A |
| P/TB |
| P/Core |
| |||||||||||||||||||
|
|
|
|
|
|
|
|
|
| ||||||||||||||||||||
|
|
| ($) |
| ($Mil) |
| ($) |
| ($) |
| (x) |
| (%) |
| (%) |
| (%) |
| (x) |
| |||||||||
Malvern Federal Savings Bank |
|
|
|
|
|
|
|
|
|
|
|
|
|
|
|
|
|
|
|
|
|
|
|
|
|
|
|
| |
Superrange |
| $ | 10.00 |
| $ | 92.58 |
| $ | 0.32 |
| $ | 13.19 |
|
| 31.56x |
|
| 75.82 | % |
| 14.69 | % |
| 75.82 | % |
| 31.50x |
| |
Maximum |
| $ | 10.00 |
| $ | 80.50 |
| $ | 0.36 |
| $ | 13.90 |
|
| 28.09x |
|
| 71.94 | % |
| 12.99 | % |
| 71.94 | % |
| 28.04x |
| |
Midpoint |
| $ | 10.00 |
| $ | 70.00 |
| $ | 0.40 |
| $ | 14.72 |
|
| 24.94x |
|
| 67.93 | % |
| 11.46 | % |
| 67.93 | % |
| 24.90x |
| |
Minimum |
| $ | 10.00 |
| $ | 59.50 |
| $ | 0.46 |
| $ | 15.83 |
|
| 21.66x |
|
| 63.17 | % |
| 9.88 | % |
| 63.17 | % |
| 21.62x |
| |
|
|
|
|
|
|
|
|
|
|
|
|
|
|
|
|
|
|
|
|
|
|
|
|
|
|
|
|
| |
All Public Companies(7) |
|
|
|
|
|
|
|
|
|
|
|
|
|
|
|
|
|
|
|
|
|
|
|
|
|
|
|
| |
Averages |
| $ | 14.80 |
| $ | 361.58 |
| $ | 0.71 |
| $ | 13.53 |
|
| 20.53x |
|
| 117.66 | % |
| 15.21 | % |
| 133.26 | % |
| 21.00x |
| |
Medians |
| $ | 12.49 |
| $ | 79.37 |
| $ | 0.44 |
| $ | 11.77 |
|
| 19.59x |
|
| 108.07 | % |
| 12.25 | % |
| 124.38 | % |
| 19.77x |
| |
|
|
|
|
|
|
|
|
|
|
|
|
|
|
|
|
|
|
|
|
|
|
|
|
|
|
|
|
| |
All Non-MHC State of PA(7) |
|
|
|
|
|
|
|
|
|
|
|
|
|
|
|
|
|
|
|
|
|
|
|
|
|
|
|
| |
Averages |
| $ | 14.46 |
| $ | 641.25 |
| $ | 0.86 |
| $ | 15.09 |
|
| 18.19x |
|
| 93.78 | % |
| 9.77 | % |
| 121.31 | % |
| 18.74x |
| |
Medians |
| $ | 12.15 |
| $ | 130.18 |
| $ | 0.59 |
| $ | 13.72 |
|
| 15.04x |
|
| 96.15 | % |
| 8.10 | % |
| 117.35 | % |
| 16.51x |
| |
|
|
|
|
|
|
|
|
|
|
|
|
|
|
|
|
|
|
|
|
|
|
|
|
|
|
|
|
| |
Publicly-Traded MHC Institutions, Full Conversion Basis |
|
|
|
|
|
|
|
|
|
|
|
|
|
|
|
|
|
|
|
|
|
|
|
|
|
|
|
| |
Averages |
| $ | 11.58 |
| $ | 164.78 |
| $ | 0.38 |
| $ | 13.34 |
|
| 28.33x |
|
| 86.51 | % |
| 22.53 | % |
| 89.49 | % |
| 28.23x |
| |
Medians |
| $ | 10.73 |
| $ | 116.29 |
| $ | 0.40 |
| $ | 13.18 |
|
| 28.72x |
|
| 83.99 | % |
| 18.17 | % |
| 88.89 | % |
| 28.72x |
| |
|
|
|
|
|
|
|
|
|
|
|
|
|
|
|
|
|
|
|
|
|
|
|
|
|
|
|
|
| |
Publicly-Traded MHC Institutions, Full Conversion Basis |
|
|
|
|
|
|
|
|
|
|
|
|
|
|
|
|
|
|
|
|
|
|
|
|
|
|
|
| |
BFSB | Brooklyn Federal MHC of NY (31.0) |
| $ | 13.60 |
| $ | 182.48 |
| $ | 0.43 |
| $ | 14.59 |
|
| 30.22x |
|
| 93.21 | % |
| 36.42 | % |
| 93.21 | % |
| 31.63x |
|
CSBK | Clifton Savings Bncrp MHC of NJ (41.0) |
| $ | 10.40 |
| $ | 290.06 |
| $ | 0.17 |
| $ | 11.14 |
|
| NM |
|
| 93.36 | % |
| 31.30 | % |
| 93.36 | % |
| NM |
|
COBK | Colonial Bank MHC of NJ (44.9) |
| $ | 10.38 |
| $ | 46.01 |
| $ | 0.41 |
| $ | 13.24 |
|
| 24.71x |
|
| 78.40 | % |
| 10.01 | % |
| 78.40 | % |
| 25.32x |
|
FXCB | Fox Chase Bancorp MHC of PA (44.5) |
| $ | 11.95 |
| $ | 175.43 |
| $ | 0.39 |
| $ | 14.36 |
|
| 33.19x |
|
| 83.22 | % |
| 21.16 | % |
| 83.22 | % |
| 30.64x |
|
LSBK | Lake Shore Bancorp MHC of NY (43.7) |
| $ | 9.00 |
| $ | 58.18 |
| $ | 0.31 |
| $ | 12.42 |
|
| 29.03x |
|
| 72.46 | % |
| 15.17 | % |
| 72.46 | % |
| 29.03x |
|
MGYR | Magyar Bancorp MHC of NJ (45.1) |
| $ | 11.06 |
| $ | 64.16 |
| $ | 0.24 |
| $ | 13.26 |
|
| NM |
|
| 83.41 | % |
| 12.74 | % |
| 83.41 | % |
| NM |
|
OSHC | Ocean Shore Holding MHC of NJ (44.0) |
| $ | 10.35 |
| $ | 87.02 |
| $ | 0.39 |
| $ | 12.24 |
|
| 26.54x |
|
| 84.56 | % |
| 13.52 | % |
| 84.56 | % |
| 26.54x |
|
ONFC | Oneida Financial MHC of NY (43.9) |
| $ | 10.25 |
| $ | 79.83 |
| $ | 0.60 |
| $ | 12.41 |
|
| 17.37x |
|
| 82.59 | % |
| 14.47 | % |
| 112.27 | % |
| 17.08x |
|
PBIP | Prudential Bancorp MHC PA (40.5) |
| $ | 12.50 |
| $ | 145.55 |
| $ | 0.44 |
| $ | 13.12 |
|
| 28.41x |
|
| 95.27 | % |
| 26.58 | % |
| 95.27 | % |
| 28.41x |
|
ROMA | Roma Financial Corp MHC of NJ (31.0) |
| $ | 16.35 |
| $ | 519.11 |
| $ | 0.44 |
| $ | 16.58 |
|
| 37.16x |
|
| 98.61 | % |
| 43.96 | % |
| 98.73 | % |
| 37.16x |
|
|
|
|
|
|
|
|
|
|
|
|
|
|
|
|
|
|
|
|
|
|
|
|
|
|
|
|
|
|
|
|
|
|
|
|
|
|
| Dividends(4) |
| Financial Characteristics(6) |
|
|
| ||||||||||||||||||||||||||||
|
|
|
|
|
| ||||||||||||||||||||||||||||||
|
|
|
|
|
|
|
|
|
|
|
|
|
|
|
|
|
|
|
|
| Reported |
| Core |
|
|
| |||||||||
Financial Institution |
| Amount/ |
| Yield |
| Payout |
| Total |
| Equity/ |
| NPAs/ |
|
|
| Offering |
| ||||||||||||||||||
ROA |
| ROE |
| ROA |
| ROE | |||||||||||||||||||||||||||||
|
|
|
|
|
|
|
|
|
|
|
| ||||||||||||||||||||||||
|
|
| ($) |
| (%) |
| (%) |
| ($Mil) |
| (%) |
| (%) |
| (%) |
| (%) |
| (%) |
| (%) |
| ($Mil) |
| |||||||||||
Malvern Federal Savings Bank |
|
|
|
|
|
|
|
|
|
|
|
|
|
|
|
|
|
|
|
|
|
|
|
|
|
|
|
|
|
|
|
|
|
| |
Superrange |
| $ | 0.00 |
|
| 0.00 | % |
| 0.00 | % | $ | 630 |
|
| 19.38 | % |
| 0.41 | % |
| 0.47 | % |
| 2.40 | % |
| 0.47 | % |
| 2.41 | % | $ | 90.7 |
| |
Maximum |
| $ | 0.00 |
|
| 0.00 | % |
| 0.00 | % | $ | 620 |
|
| 18.06 | % |
| 0.41 | % |
| 0.46 | % |
| 2.56 | % |
| 0.46 | % |
| 2.56 | % | $ | 78.9 |
| |
Midpoint |
| $ | 0.00 |
|
| 0.00 | % |
| 0.00 | % | $ | 611 |
|
| 16.87 | % |
| 0.42 | % |
| 0.46 | % |
| 2.72 | % |
| 0.46 | % |
| 2.73 | % | $ | 68.6 |
| |
Minimum |
| $ | 0.00 |
|
| 0.00 | % |
| 0.00 | % | $ | 602 |
|
| 15.65 | % |
| 0.42 | % |
| 0.46 | % |
| 2.92 | % |
| 0.46 | % |
| 2.92 | % | $ | 58.3 |
| |
|
|
|
|
|
|
|
|
|
|
|
|
|
|
|
|
|
|
|
|
|
|
|
|
|
|
|
|
|
|
|
|
|
|
| |
All Public Companies(7) |
|
|
|
|
|
|
|
|
|
|
|
|
|
|
|
|
|
|
|
|
|
|
|
|
|
|
|
|
|
|
|
|
|
| |
Averages |
| $ | 0.39 |
|
| 2.53 | % |
| 33.73 | % | $ | 3,173 |
|
| 12.75 | % |
| 0.65 | % |
| 0.52 | % |
| 4.65 | % |
| 0.48 | % |
| 4.44 | % |
|
|
| |
Medians |
| $ | 0.32 |
|
| 2.66 | % |
| 18.44 | % | $ | 772 |
|
| 10.65 | % |
| 0.41 | % |
| 0.51 | % |
| 4.45 | % |
| 0.52 | % |
| 4.17 | % |
|
|
| |
|
|
|
|
|
|
|
|
|
|
|
|
|
|
|
|
|
|
|
|
|
|
|
|
|
|
|
|
|
|
|
|
|
|
| |
All Non-MHC State of PA(7) |
|
|
|
|
|
|
|
|
|
|
|
|
|
|
|
|
|
|
|
|
|
|
|
|
|
|
|
|
|
|
|
|
|
| |
Averages |
| $ | 0.45 |
|
| 3.02 | % |
| 46.76 | % | $ | 8,826 |
|
| 10.70 | % |
| 0.35 | % |
| 0.38 | % |
| 5.29 | % |
| 0.38 | % |
| 5.30 | % |
|
|
| |
Medians |
| $ | 0.46 |
|
| 3.11 | % |
| 46.51 | % | $ | 910 |
|
| 7.00 | % |
| 0.32 | % |
| 0.50 | % |
| 6.33 | % |
| 0.47 | % |
| 5.84 | % |
|
|
| |
|
|
|
|
|
|
|
|
|
|
|
|
|
|
|
|
|
|
|
|
|
|
|
|
|
|
|
|
|
|
|
|
|
|
| |
Publicly-Traded MHC Institutions, Full Conversion Basis |
|
|
|
|
|
|
|
|
|
|
|
|
|
|
|
|
|
|
|
|
|
|
|
|
|
|
|
|
|
|
|
|
|
| |
Averages |
| $ | 0.15 |
|
| 1.29 | % |
| 24.77 | % | $ | 653 |
|
| 25.30 | % |
| 0.32 | % |
| 0.71 | % |
| 2.85 | % |
| 0.71 | % |
| 2.86 | % |
|
|
| |
Medians |
| $ | 0.18 |
|
| 1.47 | % |
| 22.73 | % | $ | 550 |
|
| 23.19 | % |
| 0.06 | % |
| 0.58 | % |
| 2.86 | % |
| 0.61 | % |
| 2.85 | % |
|
|
| |
|
|
|
|
|
|
|
|
|
|
|
|
|
|
|
|
|
|
|
|
|
|
|
|
|
|
|
|
|
|
|
|
|
|
| |
Publicly-Traded MHC Institutions, Full Conversion Basis |
|
|
|
|
|
|
|
|
|
|
|
|
|
|
|
|
|
|
|
|
|
|
|
|
|
|
|
|
|
|
|
|
|
| |
BFSB | Brooklyn Federal MHC of NY (31.0) |
| $ | 0.20 |
|
| 1.47 | % |
| 46.51 | % | $ | 501 |
|
| 39.07 | % |
| 0.02 | % |
| 1.18 | % |
| 3.11 | % |
| 1.13 | % |
| 2.98 | % |
|
|
|
CSBK | Clifton Savings Bncrp MHC of NJ (41.0) |
| $ | 0.20 |
|
| 1.92 | % |
| NM |
| $ | 927 |
|
| 33.52 | % |
| 0.03 | % |
| 0.51 | % |
| 1.51 | % |
| 0.51 | % |
| 1.51 | % |
|
|
|
COBK | Colonial Bank MHC of NJ (44.9) |
| $ | 0.00 |
|
| 0.00 | % |
| 0.00 | % | $ | 460 |
|
| 12.76 | % |
| 0.32 | % |
| 0.43 | % |
| 3.21 | % |
| 0.42 | % |
| 3.13 | % |
|
|
|
FXCB | Fox Chase Bancorp MHC of PA (44.5) |
| $ | 0.00 |
|
| 0.00 | % |
| 0.00 | % | $ | 829 |
|
| 25.43 | % |
| 0.03 | % |
| 0.63 | % |
| 2.52 | % |
| 0.68 | % |
| 2.73 | % |
|
|
|
LSBK | Lake Shore Bancorp MHC of NY (43.7) |
| $ | 0.16 |
|
| 1.78 | % |
| 51.61 | % | $ | 383 |
|
| 20.94 | % |
| 0.37 | % |
| 0.53 | % |
| 2.49 | % |
| 0.53 | % |
| 2.49 | % |
|
|
|
MGYR | Magyar Bancorp MHC of NJ (45.1) |
| $ | 0.00 |
|
| 0.00 | % |
| 0.00 | % | $ | 504 |
|
| 15.27 | % |
| 1.90 | % |
| 0.28 | % |
| 1.80 | % |
| 0.28 | % |
| 1.80 | % |
|
|
|
OSHC | Ocean Shore Holding MHC of NJ (44.0) |
| $ | 0.00 |
|
| 0.00 | % |
| 0.00 | % | $ | 644 |
|
| 15.98 | % |
| 0.06 | % |
| 0.53 | % |
| 3.18 | % |
| 0.53 | % |
| 3.18 | % |
|
|
|
ONFC | Oneida Financial MHC of NY (43.9) |
| $ | 0.48 |
|
| 4.68 | % |
| NM |
| $ | 552 |
|
| 17.52 | % |
| 0.03 | % |
| 0.90 | % |
| 4.79 | % |
| 0.92 | % |
| 4.87 | % |
|
|
|
PBIP | Prudential Bancorp MHC PA (40.5) |
| $ | 0.20 |
|
| 1.60 | % |
| 45.45 | % | $ | 548 |
|
| 27.90 | % |
| 0.10 | % |
| 0.95 | % |
| 3.28 | % |
| 0.95 | % |
| 3.28 | % |
|
|
|
ROMA | Roma Financial Corp MHC of NJ (31.0) |
| $ | 0.24 |
|
| 1.47 | % |
| 54.55 | % | $ | 1,181 |
|
| 44.58 | % |
| NA |
|
| 1.18 | % |
| 2.60 | % |
| 1.18 | % |
| 2.60 | % |
|
|
|
|
|
(1) | Current stock price of minority stock. Average of High/Low or Bid/Ask price per share. |
|
|
(2) | EPS (estimated core earnings) is based on reported trailing 12 month data, adjusted to omit non-operating gains and losses on a tax-effected basis. Public MHC data reflects additional earnings from reinvestment of proceeds of second step conversion. |
|
|
(3) | P/E = Price to Earnings; P/B = Price to Book; P/A = Price to Assets; P/TB = Price to Tangible Book; and P/Core = Price to Core Earnings. Ratios are pro forma assuming a second step conversion to full stock form. |
|
|
(4) | Indicated 12 month dividend, based on last quarterly dividend declared. |
|
|
(5) | Indicated 12 month dividend as a percent of trailing 12 month estimated core earnings (earnings adjusted to reflect second step conversion). |
|
|
(6) | ROA (return on assets) and ROE (return on equity) are indicated ratios based on trailing 12 month earnings and average equity and assets balances. |
|
|
(7) | Excludes from averages and medians those companies the subject of actual or rumored acquisition activities or unusual operating characteristics. |
|
|
(8) | Figures estimated by RP Financial to reflect a second step conversion of the MHC to full stock form. |
Source: Corporate reports, offering circulars, and RP® Financial, LC. calculations. The information provided in this report has been obtained from sources we believe are reliable, but we cannot guarantee the accuracy or completeness of such information.
Copyright (c) 2007 by RP® Financial, LC.
|
|
RP® Financial, LC. | VALUATION ANALYSIS |
Table 4.6
Public Market Pricing
Malvern Federal Savings Bank and the Comparables
As of December 7, 2007
|
|
|
|
|
|
|
|
|
|
|
|
|
|
|
|
|
|
|
|
|
|
|
|
|
|
|
|
|
|
|
| Market |
| Per Share Data |
|
|
|
|
|
|
|
|
|
|
|
|
|
|
|
| |||||||||
|
|
|
|
|
|
|
|
|
|
|
|
|
|
|
|
|
|
| |||||||||||
|
|
| Core |
| Book |
| Pricing Ratios(3) |
| |||||||||||||||||||||
| Price/ |
| Market | ||||||||||||||||||||||||||
| P/E |
| P/B |
| P/A |
| P/TB |
| P/Core | ||||||||||||||||||||
|
|
|
|
|
|
|
|
|
|
| |||||||||||||||||||
|
| ($) |
| ($Mil) |
| ($) |
| ($) |
| (x) |
| (%) |
| (%) |
| (%) |
| (x) |
| ||||||||||
Malvern Federal Savings Bank |
|
|
|
|
|
|
|
|
|
|
|
|
|
|
|
|
|
|
|
|
|
|
|
|
|
|
|
| |
Superrange |
| $ | 10.00 |
| $ | 92.58 |
| $ | 0.28 |
| $ | 8.39 |
|
| 36.41x |
|
| 119.19 | % |
| 15.81 | % |
| 119.19 | % |
| 36.34x |
| |
Maximum |
| $ | 10.00 |
| $ | 80.50 |
| $ | 0.31 |
| $ | 9.08 |
|
| 31.92x |
|
| 110.13 | % |
| 13.86 | % |
| 110.13 | % |
| 31.86x |
| |
Midpoint |
| $ | 10.00 |
| $ | 70.00 |
| $ | 0.36 |
| $ | 9.88 |
| �� | 27.96x |
|
| 101.21 | % |
| 12.13 | % |
| 101.21 | % |
| 27.90x |
| |
Minimum |
| $ | 10.00 |
| $ | 59.50 |
| $ | 0.42 |
| $ | 10.96 |
|
| 23.93x |
|
| 91.24 | % |
| 10.38 | % |
| 91.24 | % |
| 23.89x |
| |
|
|
|
|
|
|
|
|
|
|
|
|
|
|
|
|
|
|
|
|
|
|
|
|
|
|
|
|
| |
All Public Companies(7) |
|
|
|
|
|
|
|
|
|
|
|
|
|
|
|
|
|
|
|
|
|
|
|
|
|
|
|
| |
Averages |
| $ | 14.80 |
| $ | 361.58 |
| $ | 0.71 |
| $ | 13.53 |
|
| 20.53x |
|
| 117.66 | % |
| 15.21 | % |
| 133.26 | % |
| 21.00x |
| |
Medians |
| $ | 12.49 |
| $ | 79.37 |
| $ | 0.44 |
| $ | 11.77 |
|
| 19.59x |
|
| 108.07 | % |
| 12.25 | % |
| 124.38 | % |
| 19.77x |
| |
|
|
|
|
|
|
|
|
|
|
|
|
|
|
|
|
|
|
|
|
|
|
|
|
|
|
|
|
| |
All Non-MHC State of PA(7) |
|
|
|
|
|
|
|
|
|
|
|
|
|
|
|
|
|
|
|
|
|
|
|
|
|
|
|
| |
Averages |
| $ | 14.46 |
| $ | 641.25 |
| $ | 0.86 |
| $ | 15.09 |
|
| 18.19x |
|
| 93.78 | % |
| 9.77 | % |
| 121.31 | % |
| 18.74x |
| |
Medians |
| $ | 12.15 |
| $ | 130.18 |
| $ | 0.59 |
| $ | 13.72 |
|
| 15.04x |
|
| 96.15 | % |
| 8.10 | % |
| 117.35 | % |
| 16.51x |
| |
|
|
|
|
|
|
|
|
|
|
|
|
|
|
|
|
|
|
|
|
|
|
|
|
|
|
|
|
| |
Comparable Group Averages |
|
|
|
|
|
|
|
|
|
|
|
|
|
|
|
|
|
|
|
|
|
|
|
|
|
|
|
| |
Averages |
| $ | 11.58 |
| $ | 64.97 |
| $ | 0.27 |
| $ | 7.53 |
|
| 33.01x |
|
| 156.75 | % |
| 26.68 | % |
| 167.32 | % |
| 33.13x |
| |
Medians |
| $ | 10.73 |
| $ | 46.96 |
| $ | 0.28 |
| $ | 7.48 |
|
| 34.50x |
|
| 138.65 | % |
| 19.94 | % |
| 152.19 | % |
| 34.50x |
| |
|
|
|
|
|
|
|
|
|
|
|
|
|
|
|
|
|
|
|
|
|
|
|
|
|
|
|
|
| |
Comparable Group |
|
|
|
|
|
|
|
|
|
|
|
|
|
|
|
|
|
|
|
|
|
|
|
|
|
|
|
| |
BFSB | Brooklyn Federal MHC of NY (31.0) |
| $ | 13.60 |
| $ | 53.96 |
| $ | 0.27 |
| $ | 6.35 |
|
| NM |
|
| 214.17 | % |
| 46.74 | % |
| 214.17 | % |
| NM |
|
CSBK | Clifton Savings Bncrp MHC of NJ (41.0) |
| $ | 10.40 |
| $ | 133.26 |
| $ | 0.08 |
| $ | 6.30 |
|
| NM |
|
| 165.08 | % |
| 36.63 | % |
| 165.08 | % |
| NM |
|
COBK | Colonial Bank MHC of NJ (44.9) |
| $ | 10.38 |
| $ | 21.59 |
| $ | 0.32 |
| $ | 8.50 |
|
| 31.45 |
|
| 122.12 | % |
| 10.48 | % |
| 122.12 | % |
| 32.44x |
|
FXCB | Fox Chase Bancorp MHC of PA (44.5) |
| $ | 11.95 |
| $ | 78.05 |
| $ | 0.28 |
| $ | 8.66 |
|
| NM |
|
| 137.99 | % |
| 23.54 | % |
| 137.99 | % |
| NM |
|
LSBK | Lake Shore Bancorp MHC of NY (43.7) |
| $ | 9.00 |
| $ | 26.78 |
| $ | 0.23 |
| $ | 8.24 |
|
| 39.13 |
|
| 109.22 | % |
| 16.33 | % |
| 109.22 | % |
| 39.13x |
|
MGYR | Magyar Bancorp MHC of NJ (45.1) |
| $ | 11.06 |
| $ | 30.12 |
| $ | 0.14 |
| $ | 8.21 |
|
| NM |
|
| 134.71 | % |
| 13.52 | % |
| 134.71 | % |
| NM |
|
OSHC | Ocean Shore Holding MHC of NJ (44.0) |
| $ | 10.35 |
| $ | 39.95 |
| $ | 0.30 |
| $ | 7.43 |
|
| 34.5 |
|
| 139.30 | % |
| 14.42 | % |
| 139.30 | % |
| 34.50x |
|
ONFC | Oneida Financial MHC of NY (43.9) |
| $ | 10.25 |
| $ | 35.61 |
| $ | 0.50 |
| $ | 7.53 |
|
| 20.92 |
|
| 136.12 | % |
| 15.54 | % |
| 241.18 | % |
| 20.50x |
|
PBIP | Prudential Bancorp MHC PA (40.5) |
| $ | 12.50 |
| $ | 64.44 |
| $ | 0.32 |
| $ | 7.12 |
|
| 39.06 |
|
| 175.56 | % |
| 30.41 | % |
| 175.56 | % |
| 39.06x |
|
ROMA | Roma Financial Corp MHC of NJ (31.0) |
| $ | 16.35 |
| $ | 165.90 |
| $ | 0.25 |
| $ | 7.01 |
|
| NM |
|
| 233.24 | % |
| 59.20 | % |
| 233.91 | % |
| NM |
|
|
|
|
|
|
|
|
|
|
|
|
|
|
|
|
|
|
|
|
|
|
|
|
|
|
|
|
|
|
|
|
|
|
|
| |||||
|
|
|
| Financial Characteristics(6) |
|
| |||||||||||||||||||||||||||||||||
|
| Dividends(4) |
|
|
| ||||||||||||||||||||||||||||||||||
|
|
|
|
|
|
|
|
|
|
|
| Reported |
| Core |
|
| |||||||||||||||||||||||
|
| Amount/ |
| Yield |
| Payout |
| Total |
| Equity/ |
| NPAs/ |
|
|
| Offering | |||||||||||||||||||||||
|
|
|
|
|
|
| ROA |
| ROE |
| ROA |
| ROE |
| |||||||||||||||||||||||||
|
|
|
|
|
|
|
|
|
|
|
| ||||||||||||||||||||||||||||
|
| ($) |
| (%) |
| (%) |
| ($Mil) |
| (%) |
| (%) |
| (%) |
| (%) |
| (%) |
| (%) |
| ($Mil) | |||||||||||||||||
Malvern Federal Savings Bank |
|
|
|
|
|
|
|
|
|
|
|
|
|
|
|
|
|
|
|
|
|
|
|
|
|
|
|
|
|
|
|
|
| ||||||
Superrange |
| $ | 0.00 |
|
| 0.00 | % |
| 0.00 | % | $ | 586 |
|
| 13.26 | % |
| 0.44 | % |
| 0.43 | % |
| 3.28 | % |
| 0.44 | % |
| 3.28 | % |
| 39.8 | ||||||
Maximum |
| $ | 0.00 |
|
| 0.00 | % |
| 0.00 | % | $ | 581 |
|
| 12.58 | % |
| 0.44 | % |
| 0.43 | % |
| 3.45 | % |
| 0.43 | % |
| 3.46 | % |
| 34.6 | ||||||
Midpoint |
| $ | 0.00 |
|
| 0.00 | % |
| 0.00 | % | $ | 577 |
|
| 11.98 | % |
| 0.44 | % |
| 0.43 | % |
| 3.62 | % |
| 0.43 | % |
| 3.63 | % |
| 30.1 | ||||||
Minimum |
| $ | 0.00 |
|
| 0.00 | % |
| 0.00 | % | $ | 573 |
|
| 11.38 | % |
| 0.45 | % |
| 0.43 | % |
| 3.81 | % |
| 0.43 | % |
| 3.82 | % |
| 25.6 | ||||||
|
|
|
|
|
|
|
|
|
|
|
|
|
|
|
|
|
|
|
|
|
|
|
|
|
|
|
|
|
|
|
|
|
| ||||||
All Public Companies(7) |
|
|
|
|
|
|
|
|
|
|
|
|
|
|
|
|
|
|
|
|
|
|
|
|
|
|
|
|
|
|
|
|
| ||||||
Averages |
| $ | 0.39 |
|
| 2.53 | % |
| 33.73 | % | $ | 3,173 |
|
| 12.75 | % |
| 0.65 | % |
| 0.52 | % |
| 4.65 | % |
| 0.48 | % |
| 4.44 | % |
|
| ||||||
Medians |
| $ | 0.32 |
|
| 2.66 | % |
| 18.44 | % | $ | 772 |
|
| 10.65 | % |
| 0.41 | % |
| 0.51 | % |
| 4.45 | % |
| 0.52 | % |
| 4.17 | % |
|
| ||||||
|
|
|
|
|
|
|
|
|
|
|
|
|
|
|
|
|
|
|
|
|
|
|
|
|
|
|
|
|
|
|
|
|
| ||||||
All Non-MHC State of PA(7) |
|
|
|
|
|
|
|
|
|
|
|
|
|
|
|
|
|
|
|
|
|
|
|
|
|
|
|
|
|
|
|
|
| ||||||
Averages |
| $ | 0.45 |
|
| 3.02 | % |
| 46.76 | % | $ | 8,826 |
|
| 10.70 | % |
| 0.35 | % |
| 0.38 | % |
| 5.29 | % |
| 0.38 | % |
| 5.30 | % |
|
| ||||||
Medians |
| $ | 0.46 |
|
| 3.11 | % |
| 46.51 | % | $ | 910 |
|
| 7.00 | % |
| 0.32 | % |
| 0.50 | % |
| 6.33 | % |
| 0.47 | % |
| 5.84 | % |
|
| ||||||
|
|
|
|
|
|
|
|
|
|
|
|
|
|
|
|
|
|
|
|
|
|
|
|
|
|
|
|
|
|
|
|
|
| ||||||
Comparable Group Averages |
|
|
|
|
|
|
|
|
|
|
|
|
|
|
|
|
|
|
|
|
|
|
|
|
|
|
|
|
|
|
|
|
| ||||||
Averages |
| $ | 0.15 |
|
| 1.29 | % |
| 11.67 | % | $ | 567 |
|
| 15.91 | % |
| 0.32 | % |
| 0.56 | % |
| 3.56 | % |
| 0.56 | % |
| 3.56 | % |
|
| ||||||
Medians |
| $ | 0.18 |
|
| 1.47 | % |
| 0.00 | % | $ | 495 |
|
| 16.00 | % |
| 0.06 | % |
| 0.46 | % |
| 3.68 | % |
| 0.49 | % |
| 3.62 | % |
|
| ||||||
|
|
|
|
|
|
|
|
|
|
|
|
|
|
|
|
|
|
|
|
|
|
|
|
|
|
|
|
|
|
|
|
|
| ||||||
Comparable Group |
|
|
|
|
|
|
|
|
|
|
|
|
|
|
|
|
|
|
|
|
|
|
|
|
|
|
|
|
|
|
|
|
| ||||||
BFSB | Brooklyn Federal MHC of NY (31.0) |
| $ | 0.20 |
|
| 1.47 | % |
| 21.91 | % | $ | 390 |
|
| 21.82 | % |
| 0.02 | % |
| 0.97 | % |
| 4.67 | % |
| 0.91 | % |
| 4.35 | % |
|
| |||||
CSBK | Clifton Savings Bncrp MHC of NJ (41.0) |
| $ | 0.20 |
|
| 1.92 | % |
| NM |
| $ | 792 |
|
| 22.19 | % |
| 0.03 | % |
| 0.28 | % |
| 1.25 | % |
| 0.28 | % |
| 1.25 | % |
|
| |||||
COBK | Colonial Bank MHC of NJ (44.9) |
| $ | 0.00 |
|
| 0.00 | % |
| 0.00 | % | $ | 439 |
|
| 8.59 | % |
| 0.32 | % |
| 0.36 | % |
| 3.96 | % |
| 0.35 | % |
| 3.84 | % |
|
| |||||
FXCB | Fox Chase Bancorp MHC of PA (44.5) |
| $ | 0.00 |
|
| 0.00 | % |
| 0.00 | % | $ | 745 |
|
| 17.06 | % |
| 0.03 | % |
| 0.49 | % |
| 2.92 | % |
| 0.54 | % |
| 3.27 | % |
|
| |||||
LSBK | Lake Shore Bancorp MHC of NY (43.7) |
| $ | 0.16 |
|
| 1.78 | % |
| 32.03 | % | $ | 356 |
|
| 14.95 | % |
| 0.37 | % |
| 0.42 | % |
| 2.77 | % |
| 0.42 | % |
| 2.77 | % |
|
| |||||
MGYR | Magyar Bancorp MHC of NJ (45.1) |
| $ | 0.00 |
|
| 0.00 | % |
| 0.00 | % | $ | 474 |
|
| 10.04 | % |
| 1.90 | % |
| 0.17 | % |
| 1.68 | % |
| 0.17 | % |
| 1.68 | % |
|
| |||||
OSHC | Ocean Shore Holding MHC of NJ (44.0) |
| $ | 0.00 |
|
| 0.00 | % |
| 0.00 | % | $ | 603 |
|
| 10.35 | % |
| 0.06 | % |
| 0.44 | % |
| 4.03 | % |
| 0.44 | % |
| 4.03 | % |
|
| |||||
ONFC | Oneida Financial MHC of NY (43.9) |
| $ | 0.48 |
|
| 4.68 | % |
| NM |
| $ | 514 |
|
| 11.42 | % |
| 0.03 | % |
| 0.81 | % |
| 6.59 | % |
| 0.83 | % |
| 6.73 | % |
|
| |||||
PBIP | Prudential Bancorp MHC PA (40.5) |
| $ | 0.20 |
|
| 1.60 | % |
| 27.74 | % | $ | 477 |
|
| 17.32 | % |
| 0.10 | % |
| 0.79 | % |
| 4.31 | % |
| 0.79 | % |
| 4.31 | % |
|
| |||||
ROMA | Roma Financial Corp MHC of NJ (31.0) |
| $ | 0.24 |
|
| 1.47 | % |
| NM |
| $ | 877 |
|
| 25.38 | % |
| NA |
|
| 0.90 | % |
| 3.41 | % |
| 0.90 | % |
| 3.41 | % |
|
| |||||
|
|
(1) | Average of High/Low or Bid/Ask price per share. |
|
|
(2) | EPS (estimate core basis) is based on actual trailing 12 month data, adjusted to omit non-operating items on a tax-effected basis, and is shown on a pro forma basis where appropriate. |
|
|
(3) | P/E = Price to earnings; P/B = Price to book; P/A = Price to assets; P/TB = Price to tangible book value; and P/Core = Price to core earnings. |
|
|
(4) | Indicated 12 month dividend, based on last quarterly dividend declared. |
|
|
(5) | Indicated 12 month dividend as a percent of trailing 12 month estimated core earnings. |
|
|
(6) | ROA (return on assets) and ROE (return on equity) are indicated ratios based on trailing 12 month common earnings and average common equity and total assets balances. |
|
|
(7) | Excludes from averages and medians those companies the subject of actual or rumored acquisition activities or unusual operating characteristics. |
Source: Corporate reports, offering circulars, and RP Financial, LC. calculations. The information provided in this report has been obtained from sources we believe are reliable, but we cannot guarantee the accuracy or completeness of such information.
Copyright (c) 2007 by RP® Financial, LC.
|
|
RP® Financial, LC. | VALUATION ANALYSIS |
2.Price-to-Book (“P/B”). The application of the P/B valuation method requires calculating the Bank’s pro forma market value by applying a valuation P/B ratio, as derived from the Peer Group’s P/B ratio (fully-converted basis), to the Bank’s pro forma book value (fully-converted basis). Based on the $70.0 million midpoint valuation, the Bank’s pro forma P/B and P/TB ratios both equaled 67.93%. In comparison to the average P/B and P/TB ratios for the Peer Group of 86.51% and 89.49%, the Bank’s ratios reflect a discount of 21.5% on a P/B basis and a discount of 24.1% on a P/TB basis. In comparison to the Peer Group’s median P/B and P/TB ratios of 83.99% and 88.89%, respectively, the Bank’s pro forma P/B and P/TB ratios at the midpoint value reflect discounts of 19.1% and 23.6%, respectively. At the top of the super range, the Bank’s P/B and P/TB ratios on a fully-converted basis both equaled 75.82%. In comparison to the Peer Group’s average P/B and P/TB ratios, the Bank’s P/B and P/TB ratios at the top of the super range reflect discounts of 12.4% and 15.3%, respectively. In comparison to the Peer Group’s median P/B and P/TB ratios, the Bank’s P/B and P/TB ratios at the top of the super range reflect discounts of 9.7% and 14.7%, respectively. RP Financial considered the discounts under the P/B approach to be reasonable, in light of the previously referenced valuation adjustments, the nature of the calculation of the P/B ratio which mathematically results in a ratio discounted to book value and the resulting pricing ratios indicated under the earnings approach.
On an MHC reported basis, the Bank’s P/B and P/TB ratios at the $70.0 million midpoint value both equaled 101.21%. In comparison to the average P/B and P/TB ratios indicated for the Peer Group of 156.75% and 167.32%, respectively, the Bank’s ratios were discounted by 35.4% on a P/B basis and 39.5% on a P/TB basis. In comparison to the Peer Group’s median P/B and P/TB ratios of 138.65% and 152.19%, respectively, the Bank’s pro forma P/B and P/TB ratios at the midpoint value reflect discounts of 27.0% and 33.5%, respectively. At the top of the super range, the Bank’s P/B and P/TB ratios on an MHC basis both equaled 119.19%. In comparison to the Peer Group’s average P/B and P/TB ratios, the Bank’s P/B and P/TB ratios at the top of the super range reflect discounts of 24.0% and 28.8%, respectively. In comparison to
|
|
RP® Financial, LC. | VALUATION ANALYSIS |
the Peer Group’s median P/B and P/TB ratios, the Bank’s P/B and P/TB ratios at the top of the super range reflect discounts of 14.0% and 21.7%, respectively.
3.Price-to-Assets (“P/A”). The P/A valuation methodology determines market value by applying a valuation P/A ratio (fully-converted basis) to the Bank’s pro forma asset base, conservatively assuming no deposit withdrawals are made to fund stock purchases. In all likelihood there will be deposit withdrawals, which results in understating the pro forma P/A ratio which is computed herein. At the $70 million midpoint of the valuation range, the Bank’s full conversion value equaled 11.46% of pro forma assets. Comparatively, the Peer Group companies exhibited an average P/A ratio (fully-converted basis) of 22.53%, which implies a discount of 49.1% has been applied to the Bank’s pro forma P/A ratio (fully-converted basis). In comparison to the Peer Group’s median P/A ratio of 18.17%, the Bank’s pro forma P/A ratio at the midpoint value reflects a discount of 36.9%.
On an MHC reported basis, the Bank’s pro forma P/A ratio at the $70.0 million midpoint value equaled 12.13%. In comparison to the Peer Group’s average P/A ratio of 26.68%, the Bank’s P/A ratio indicated a discount of 54.5%. In comparison to the Peer Group’s median P/A ratio of 19.94%, the Bank’s pro forma P/A ratio at the midpoint value reflected a discount of 39.2%.
Comparison to Recent Offerings
As indicated at the beginning of this chapter, RP Financial’s analysis of recent conversion and MHC offering pricing characteristics at closing and in the aftermarket has been limited to a “technical” analysis and, thus, the pricing characteristics of recent conversion offerings can not be a primary determinate of value. Particular focus was placed on the P/TB approach in this analysis, since the P/E multiples do not reflect the actual impact of reinvestment and the source of the stock proceeds (i.e., external funds vs. deposit withdrawals). As previously noted, LaPorte and Northfield were the two MHC offerings closed during the past three months and LaPorte’s offering included a simultaneous acquisition. In comparison to the average closing P/TB ratio 82.2% for the two recent MHC offerings, the Bank’s P/TB ratio of 67.93% at the midpoint value
|
|
RP® Financial, LC. | VALUATION ANALYSIS |
reflects an implied discount of 17.4%. As of December 7, LaPorte closing stock price was 22.7% below its IPO price and Northfield’s closing stock price was 4.9% above its IPO price.
Based on the foregoing, it is our opinion that, as of December 7, 2007, the estimated aggregate pro forma market value of the shares to be issued immediately following the conversion, both shares issued publicly as well as to the MHC, equaled $70,000,000 at the midpoint, equal to 7,000,000 shares offered at a per share value of $10.00. The Board of Directors has established a public offering range such that the public ownership of the Bank will constitute a 43.0% ownership interest prior to the issuance of shares to the Foundation. Based on the public offering range and inclusive of the shares issued to the Foundation, equal to 2.0% of the shares issued in the reorganization, the public ownership of shares will represent 45.0% of the shares issued throughout the valuation range. Based on the foregoing valuation, the corresponding range of shares and market values based on a $10.00 per share price are as shown in the table below. The pro forma valuation calculations relative to the Peer Group (fully-converted basis) are shown in Table 4.5 and are detailed in Exhibit IV-7 and Exhibit IV-8; the pro forma valuation calculations relative to the Peer Group based on reported financials are shown in Table 4.6 and are detailed in Exhibits IV-10 and IV-11.
|
|
|
|
|
|
|
|
|
|
|
|
|
|
|
| Offering |
| MHC |
| Foundation |
| Total |
| ||||
|
|
|
|
|
| ||||||||
Shares |
|
|
|
|
|
|
|
|
|
|
|
|
|
Supermaximum |
|
| 3,980,725 |
|
| 5,091,625 |
|
| 185,150 |
|
| 9,257,500 |
|
Maximum |
|
| 3,461,500 |
|
| 4,427,500 |
|
| 161,000 |
|
| 8,050,000 |
|
Midpoint |
|
| 3,010,000 |
|
| 3,850,000 |
|
| 140,000 |
|
| 7,000,000 |
|
Minimum |
|
| 2,558,500 |
|
| 3,272,500 |
|
| 119,00 |
|
| 5,950,000 |
|
|
|
|
|
|
|
|
|
|
|
|
|
|
|
Market Value |
|
|
|
|
|
|
|
|
|
|
|
|
|
Supermaximum |
| $ | 39,807,250 |
| $ | 50,916,250 |
| $ | 1,851,500 |
| $ | 92,575,000 |
|
Maximum |
|
| 34,615,000 |
|
| 44,275,000 |
|
| 1,610,000 |
|
| 80,500,000 |
|
Midpoint |
|
| 30,100,000 |
|
| 38,500,000 |
|
| 1,400,000 |
|
| 70,000,000 |
|
Minimum |
|
| 25,585,000 |
|
| 32,725,000 |
|
| 1,190,000 |
|
| 59,500,000 |
|
EXHIBITS
|
|
RP® Financial, LC. | LIST OF EXHIBITS |
LIST OF EXHIBITS
|
|
|
|
Exhibit |
| Description | |
| |||
|
|
|
|
| I-1 |
| Map of Office Locations |
|
|
|
|
| I-2 |
| Audited Financial Statements |
|
|
|
|
| I-3 |
| Key Operating Ratios |
|
|
|
|
| I-4 |
| Investment Portfolio Composition |
|
|
|
|
| I-5 |
| Yields and Costs |
|
|
|
|
| I-6 |
| Loan Loss Allowance Activity |
|
|
|
|
| I-7 |
| Interest Rate Risk Analysis |
|
|
|
|
| I-8 |
| Fixed and Adjustable Rate Loans |
|
|
|
|
| I-9 |
| Loan Portfolio Composition |
|
|
|
|
| I-10 |
| Contractual Maturity by Loan Type |
|
|
|
|
| I-11 |
| Loan Originations, Purchases, and Sales |
|
|
|
|
| I-12 |
| Non-Performing Assets |
|
|
|
|
| I-13 |
| Deposit Composition |
|
|
|
|
| I-14 |
| Maturity of Time Deposits |
|
|
|
|
| I-15 |
| Borrowing Activity |
|
|
|
|
| II-1 |
| Description of Office Facilities |
|
|
|
|
| II-2 |
| Historical Interest Rates |
|
|
RP® Financial, LC. | LIST OF EXHIBITS |
LIST OF EXHIBITS (continued)
|
|
|
|
Exhibit |
| Description | |
| |||
|
|
|
|
| III-1 |
| General Characteristics of Publicly-Traded Institutions |
|
|
|
|
| III-2 |
| Public Market Pricing of MHC Institutions |
|
|
|
|
| III-3 |
| Peer Group Market Area Comparative Analysis |
|
|
|
|
| IV-1 |
| Stock Prices: As of December 7, 2007 |
|
|
|
|
| IV-2 |
| Historical Stock Price Indices |
|
|
|
|
| IV-3 |
| Historical Thrift Stock Indices |
|
|
|
|
| IV-4 |
| Market Area Acquisition Activity |
|
|
|
|
| IV-5 |
| Director and Senior Management Summary Resumes |
|
|
|
|
| IV-6 |
| Pro Forma Regulatory Capital Ratios |
|
|
|
|
| IV-7 |
| Pro Forma Analysis Sheets – Full Conversion Basis |
|
|
|
|
| IV-8 |
| Pro Forma Effect of Conversion Proceeds – Full Conversion Basis |
|
|
|
|
| IV-9 |
| Peer Group Core Earnings Analysis |
|
|
|
|
| IV-10 |
| Pro Forma Analysis Sheets – MHC Conversion Basis |
|
|
|
|
| IV-11 |
| Pro Forma Effect of Conversion Proceeds – MHC Conversion Basis |
|
|
|
|
| V-1 |
| Firm Qualifications Statement |
EXHIBIT I-1
Malvern Federal Savings Bank
Map of Office Locations
 |
EXHIBIT I-2
Malvern Federal Savings Bank
Audited Financial Statements
[Incorporated by Reference]
EXHIBIT I-3
Malvern Federal Savings Bank
Key Operating Ratios
Exhibit I-3
Malvern Federal Savings Bank
Key Operating Ratios
|
|
|
|
|
|
|
|
|
|
|
|
|
|
|
|
|
|
| Year Ended September 30, |
| |||||||||||||
|
|
| ||||||||||||||
|
| 2007 |
| 2006 |
| 2005 |
| 2004 |
| 2003 |
| |||||
|
|
|
|
|
|
| ||||||||||
|
|
|
|
|
|
|
|
|
|
|
| |||||
Selected Financial Ratios and Other Data: |
|
|
|
|
|
|
|
|
|
|
|
|
|
|
|
|
Performance Ratios: |
|
|
|
|
|
|
|
|
|
|
|
|
|
|
|
|
Return on assets (ratio of net income to average total assets) |
|
| 0.45 | % |
| 0.64 | % |
| 0.53 | % |
| 0.35 | % |
| 0.34 | % |
Return on average equity (ratio of net income to average equity) |
|
| 5.66 |
|
| 8.06 |
|
| 6.74 |
|
| 4.53 |
|
| 4.41 |
|
Interest rate spread(1) |
|
| 2.42 |
|
| 2.65 |
|
| 2.40 |
|
| 2.00 |
|
| 1.92 |
|
Net interest margin(2) |
|
| 2.65 |
|
| 2.80 |
|
| 2.55 |
|
| 2.14 |
|
| 2.11 |
|
Non-interest expenses to average total assets |
|
| 1.90 |
|
| 1.94 |
|
| 1.95 |
|
| 1.76 |
|
| 1.83 |
|
Efficiency Ratio(3) |
|
| 75.02 |
|
| 71.49 |
|
| 78.50 |
|
| 85.70 |
|
| 89.52 |
|
Asset Quality Ratios: |
|
|
|
|
|
|
|
|
|
|
|
|
|
|
|
|
Non-performing loans as a percent of loans |
|
| 1.50 |
|
| 0.60 |
|
| 0.96 |
|
| 0.74 |
|
| 1.02 |
|
Non-performing assets as a percent of total assets |
|
| 1.47 |
|
| 0.52 |
|
| 0.82 |
|
| 0.58 |
|
| 0.65 |
|
Allowance for loan losses as a percent of total loans |
|
| 0.50 |
|
| 0.74 |
|
| 0.78 |
|
| 0.85 |
|
| 1.03 |
|
Allowance for loan losses as a percent of non-performing loans |
|
| 190.16 |
|
| 124.51 |
|
| 80.49 |
|
| 113.97 |
|
| 101.30 |
|
Capital Ratios: |
|
|
|
|
|
|
|
|
|
|
|
|
|
|
|
|
Total risk-based capital to risk weighted assets |
|
| 11.43 |
|
| 11.19 |
|
| 11.34 |
|
| 12.79 |
|
| 13.45 |
|
Tier 1 risk-based capital to risk weighted assets |
|
| 10.36 |
|
| 10.36 |
|
| 10.45 |
|
| 11.80 |
|
| 12.36 |
|
Tangible capital to tangible assets |
|
| 8.03 |
|
| 8.11 |
|
| 7.79 |
|
| 7.92 |
|
| 7.54 |
|
Tier 1 leverage (core) capital to adjustable tangible assets |
|
| 8.03 |
|
| 8.11 |
|
| 7.79 |
|
| 7.92 |
|
| 7.54 |
|
Equity to total assets |
|
| 7.98 |
|
| 7.96 |
|
| 7.86 |
|
| 7.86 |
|
| 7.60 |
|
Other Data: |
|
|
|
|
|
|
|
|
|
|
|
|
|
|
|
|
Number of full service offices |
|
| 7 |
|
| 7 |
|
| 7 |
|
| 7 |
|
| 6 |
|
|
|
(1) | Represents the difference between the weighted average yield on interest earning assets and the weighted average cost of interest bearing liabilities. |
| |
(2) | Net interest income divided by average interest earning assets. |
| |
(3) | Represents non-interest expense divided by net interest income and dividend income. |
Source: Malvern Federal’s prospectus.
EXHIBIT I-4
Malvern Federal Savings Bank
Investment Portfolio Composition
Exhibit I-4
Malvern Federal Savings Bank
Investment Portfolio Composition
|
|
|
|
|
|
|
|
|
|
|
|
|
|
|
|
|
|
|
|
|
| At September 30, |
| ||||||||||||||||
|
|
| |||||||||||||||||
|
| 2007 |
| 2006 |
| 2005 |
| ||||||||||||
|
|
|
|
| |||||||||||||||
|
| Amortized |
| Fair Value |
| Amortized |
| Fair Value |
| Amortized |
| Fair Value |
| ||||||
|
|
|
|
|
|
|
| ||||||||||||
|
| (Dollars in Thousands) |
| ||||||||||||||||
Securities available for sale: |
|
|
|
|
|
|
|
|
|
|
|
|
|
|
|
|
|
|
|
U.S. Government agencies |
| $ | 7,996 |
| $ | 8,005 |
| $ | 7,000 |
| $ | 6,888 |
| $ | 8,000 |
| $ | 7,807 |
|
U.S. Government obligations |
|
| 4,997 |
|
| 5,000 |
|
| 999 |
|
| 1,002 |
|
| 993 |
|
| 990 |
|
State and municipal obligations |
|
| 2,976 |
|
| 2,945 |
|
| 3,402 |
|
| 3,367 |
|
| 7,839 |
|
| 7,894 |
|
Mortgage-backed securities: |
|
|
|
|
|
|
|
|
|
|
|
|
|
|
|
|
|
|
|
Government National Mortgage Association |
|
| 399 |
|
| 394 |
|
| 595 |
|
| 587 |
|
| 973 |
|
| 965 |
|
Federal Home Loan Mortgage Association |
|
| 9,360 |
|
| 9,074 |
|
| 11,486 |
|
| 10,997 |
|
| 14,402 |
|
| 13,928 |
|
Federal Home Loan Mortgage Corporation |
|
| 2,831 |
|
| 2,767 |
|
| 3,858 |
|
| 3,738 |
|
| 5,188 |
|
| 5,108 |
|
Asset-backed securities |
|
| 1,000 |
|
| 913 |
|
| 1,485 |
|
| 1,445 |
|
| 3,484 |
|
| 3,450 |
|
|
|
|
|
|
|
|
| ||||||||||||
Total available for sale |
|
| 29,559 |
|
| 29,098 |
|
| 28,825 |
|
| 28,024 |
|
| 40,879 |
|
| 40,142 |
|
|
|
|
|
|
|
|
| ||||||||||||
Securities held to maturity: |
|
|
|
|
|
|
|
|
|
|
|
|
|
|
|
|
|
|
|
U.S. Government agencies |
|
| — |
|
| — |
|
| — |
|
| — |
|
| — |
|
| — |
|
U.S. Government obligations |
|
| — |
|
| — |
|
| — |
|
| — |
|
| — |
|
| — |
|
Mortgage-backed securities: |
|
|
|
|
|
|
|
|
|
|
|
|
|
|
|
|
|
|
|
Collateralized mortgage obligations |
|
| 407 |
|
| 407 |
|
| 512 |
|
| 512 |
|
| 631 |
|
| 634 |
|
Federal Home Loan Mortgage Association |
|
| 1,072 |
|
| 1,040 |
|
| 1,221 |
|
| 1,192 |
|
| 1,447 |
|
| 1,430 |
|
Federal Home Loan Mortgage Corporation |
|
| — |
|
| — |
|
| — |
|
| — |
|
| — |
|
| — |
|
Asset-backed securities |
|
| — |
|
| — |
|
| — |
|
| — |
|
| — |
|
| — |
|
|
|
|
|
|
|
|
| ||||||||||||
Total held to maturity |
|
| 1,479 |
|
| 1,447 |
|
| 1,733 |
|
| 1,704 |
|
| 2,078 |
|
| 2,064 |
|
|
|
|
|
|
|
|
| ||||||||||||
FHLB Stock |
|
| 4,560 |
|
| 4,560 |
|
| 4,754 |
|
| 4,754 |
|
| 4,326 |
|
| 4,326 |
|
|
|
|
|
|
|
|
| ||||||||||||
Total investment securities |
| $ | 35,598 |
| $ | 35,105 |
| $ | 35,312 |
| $ | 34,482 |
| $ | 47,283 |
| $ | 46,532 |
|
|
|
|
|
|
|
|
| ||||||||||||
Source: Malvern Federal’s prospectus.
EXHIBIT I-5
Malvern Federal Savings Bank
Yields and Costs
Exhibit I-5
Malvern Federal Savings Bank
Yields and Costs
|
|
|
|
|
|
|
|
|
|
|
|
|
|
|
|
|
|
|
|
|
|
|
|
|
|
|
|
| |
| Year Ended September 30, |
| |||||||||||||||||||||||||||
|
| ||||||||||||||||||||||||||||
| 2007 |
| 2006 |
| 2005 |
| |||||||||||||||||||||||
|
|
|
| ||||||||||||||||||||||||||
| Average |
| Interest |
| Yield/Rate |
| Average |
| Interest |
| Yield/Rate |
| Average |
| Interest |
| Yield/Rate |
| |||||||||||
|
|
|
|
|
|
|
|
|
| ||||||||||||||||||||
|
| (Dollars in thousands) |
| ||||||||||||||||||||||||||
Interest Earning Assets: |
|
|
|
|
|
|
|
|
|
|
|
|
|
|
|
|
|
|
|
|
|
|
|
|
|
|
|
| |
Loans receivable(1) |
| $ | 464,164 |
| $ | 30,732 |
|
| 6.62 | % | $ | 440,768 |
| $ | 28,456 |
|
| 6.46 | % | $ | 391,861 |
| $ | 23,238 |
|
| 5.93 | % | |
Investment securities |
|
| 34,410 |
|
| 1,391 |
|
| 4.48 |
|
| 37,013 |
|
| 1,370 |
|
| 3.70 |
|
| 55,907 |
|
| 1,995 |
|
| 3.57 |
| |
Deposits in other banks |
|
| 7,220 |
|
| 324 |
|
| 4.04 |
|
| 5,847 |
|
| 136 |
|
| 2.33 |
|
| 7,477 |
|
| 96 |
|
| 1.28 |
| |
FHLB stock |
|
| 4,239 |
|
| 323 |
|
| 7.61 |
|
| 4,533 |
|
| 197 |
|
| 4.35 |
|
| 4,067 |
|
| 97 |
|
| 2.38 |
| |
|
|
|
|
|
|
|
|
|
|
|
|
|
|
|
|
| |||||||||||||
Total interest earning assets(1) |
|
| 510,033 |
|
| 32,769 |
|
| 6.42 |
|
| 488,161 |
|
| 30,159 |
|
| 6.18 |
|
| 459,312 |
|
| 25,426 |
|
| 5.54 |
| |
|
|
|
|
|
|
|
|
|
|
| |||||||||||||||||||
Non-interest earning assets |
|
| 17,542 |
|
|
|
|
|
|
|
| 17,421 |
|
|
|
|
|
|
|
| 18,064 |
|
|
|
|
|
|
| |
|
|
|
|
|
|
|
|
|
|
|
|
|
|
|
|
|
|
|
|
|
|
| |||||||
Total assets |
|
| 527,575 |
|
|
|
|
|
|
|
| 505,582 |
|
|
|
|
|
|
|
| 477,375 |
|
|
|
|
|
|
| |
|
|
|
|
|
|
|
|
|
|
|
|
|
|
|
|
|
|
|
|
|
|
| |||||||
|
|
|
|
|
|
|
|
|
|
|
|
|
|
|
|
|
|
|
|
|
|
|
|
|
|
|
|
| |
Interest Bearing Liabilities: |
|
|
|
|
|
|
|
|
|
|
|
|
|
|
|
|
|
|
|
|
|
|
|
|
|
|
|
| |
Demand and NOW accounts |
|
| 53,842 |
|
| 246 |
|
| 0.46 | % |
| 54,017 |
|
| 192 |
|
| 0.36 | % |
| 53,606 |
|
| 209 |
|
| 0.39 | % | |
Money Market accounts |
|
| 59,946 |
|
| 2,327 |
|
| 3.88 |
|
| 39,204 |
|
| 1,034 |
|
| 2.64 |
|
| 36,949 |
|
| 553 |
|
| 1.50 |
| |
Savings accounts |
|
| 41,546 |
|
| 422 |
|
| 1.02 |
|
| 48,560 |
|
| 500 |
|
| 1.03 |
|
| 57,781 |
|
| 595 |
|
| 1.03 |
| |
Certificate accounts |
|
| 261,231 |
|
| 12,392 |
|
| 4.74 |
|
| 249,703 |
|
| 10,573 |
|
| 4.23 |
|
| 232,553 |
|
| 8,813 |
|
| 3.79 |
| |
|
|
|
|
|
|
|
|
|
|
|
|
|
|
|
|
| |||||||||||||
Total Deposits |
|
| 416,565 |
|
| 15,387 |
|
| 3.69 |
|
| 391,484 |
|
| 12,299 |
|
| 3.14 |
|
| 380,889 |
|
| 10,170 |
|
| 2.67 |
| |
|
|
|
|
|
|
|
|
|
|
|
|
|
|
|
|
| |||||||||||||
Borrowed funds |
|
| 64,076 |
|
| 3,848 |
|
| 6.01 |
|
| 70,249 |
|
| 4,203 |
|
| 5.98 |
|
| 56,044 |
|
| 3,540 |
|
| 6.32 |
| |
|
|
|
|
|
|
|
|
|
|
|
|
|
|
|
|
| |||||||||||||
Total interest-bearing liabilities |
|
| 480,641 |
|
| 19,235 |
|
| 4.00 |
|
| 461,733 |
|
| 16,502 |
|
| 3.57 |
|
| 436,934 |
|
| 13,710 |
|
| 3.14 |
| |
|
|
|
|
|
|
|
|
|
|
| |||||||||||||||||||
Non-interest earnings liabilities |
|
| 5,064 |
|
|
|
|
|
|
|
| 3,786 |
|
|
|
|
|
|
|
| 3,392 |
|
|
|
|
|
|
| |
|
|
|
|
|
|
|
|
|
|
|
|
|
|
|
|
|
|
|
|
|
|
| |||||||
Total Liabilities |
|
| 485,705 |
|
|
|
|
|
|
|
| 465,519 |
|
|
|
|
|
|
|
| 440,325 |
|
|
|
|
|
|
| |
|
|
|
|
|
|
|
|
|
|
|
|
|
|
|
|
|
|
|
|
|
|
| |||||||
Equity |
|
| 41,870 |
|
|
|
|
|
|
|
| 40,063 |
|
|
|
|
|
|
|
| 37,050 |
|
|
|
|
|
|
| |
|
|
|
|
|
|
|
|
|
|
|
|
|
|
|
|
|
|
|
|
|
|
| |||||||
Total Liabilities and Equity |
| $ | 527,575 |
|
|
|
|
|
|
| $ | 505,582 |
|
|
|
|
|
|
| $ | 477,375 |
|
|
|
|
|
|
| |
|
|
|
|
|
|
|
|
|
|
|
|
|
|
|
|
|
|
|
|
|
|
| |||||||
Net interest income |
|
|
|
| $ | 13,534 |
|
|
|
|
|
|
| $ | 13,657 |
|
|
|
|
|
|
| $ | 11,716 |
|
|
|
| |
|
|
|
|
|
|
|
|
|
|
|
|
|
|
|
|
|
|
|
|
|
|
| |||||||
Net interest spread |
|
|
|
|
|
|
|
| 2.42 | % |
|
|
|
|
|
|
| 2.65 | % |
|
|
|
|
|
|
| 2.40 | % | |
|
|
|
|
|
|
|
|
|
|
|
|
|
|
|
|
|
|
|
|
|
|
| |||||||
Net interest margin |
|
|
|
|
|
|
|
| 2.65 | % |
|
|
|
|
|
|
| 2.80 | % |
|
|
|
|
|
|
| 2.55 | % | |
|
|
|
|
|
|
|
|
|
|
|
|
|
|
|
|
|
|
|
|
|
|
| |||||||
|
|
(1) | Calculated net of deferred loan fees, loan discounts, loans in process and loss reserves. Includes $9.3 million of loans held for sale at September 30, 2007. |
Source: Malvern Federal’s prospectus.
EXHIBIT I-6
Malvern Federal Savings Bank
Loan Loss Allowance Activity
Exhibit I-6
Malvern Federal Savings Bank
Loan Loss Allowance Activity
|
|
|
|
|
|
|
|
|
|
|
|
|
|
|
|
|
|
| Year Ended September 30, |
| |||||||||||||
|
|
| ||||||||||||||
|
| 2007 |
| 2006 |
| 2005 |
| 2004 |
| 2003 |
| |||||
|
|
|
|
|
|
| ||||||||||
|
| (Dollars in Thousands) |
| |||||||||||||
Balance at beginning of period |
| $ | 3,393 |
| $ | 3,222 |
| $ | 3,034 |
| $ | 3,045 |
| $ | 3,043 |
|
Provision for loan losses |
|
| 1,298 |
|
| 451 |
|
| 290 |
|
| 60 |
|
| 61 |
|
Charge-offs: |
|
|
|
|
|
|
|
|
|
|
|
|
|
|
|
|
Mortgage: |
|
|
|
|
|
|
|
|
|
|
|
|
|
|
|
|
One-to-four family |
|
| — |
|
| — |
|
| — |
|
| 4 |
|
| — |
|
Multi-family |
|
| — |
|
| — |
|
| — |
|
| — |
|
| — |
|
Commercial real estate |
|
| — |
|
| 44 |
|
| 33 |
|
| — |
|
| — |
|
Construction or development |
|
| — |
|
| 66 |
|
| — |
|
| — |
|
| — |
|
Land loans |
|
| — |
|
| — |
|
| — |
|
| — |
|
| — |
|
Commercial |
|
| — |
|
| — |
|
| 3 |
|
| 24 |
|
| — |
|
Consumer: |
|
|
|
|
|
|
|
|
|
|
|
|
|
|
|
|
Home equity lines of credit |
|
| — |
|
|
|
|
| 35 |
|
|
|
|
|
|
|
Second mortgages |
|
| 135 |
|
| 250 |
|
|
|
|
| 10 |
|
|
|
|
Other |
|
| 25 |
|
| 26 |
|
| 45 |
|
| 43 |
|
| 64 |
|
|
|
|
|
|
|
| ||||||||||
Total charge-offs |
|
| 160 |
|
| 386 |
|
| 116 |
|
| 81 |
|
| 64 |
|
|
|
|
|
|
|
| ||||||||||
Recoveries: |
|
|
|
|
|
|
|
|
|
|
|
|
|
|
|
|
Mortgage: |
|
|
|
|
|
|
|
|
|
|
|
|
|
|
|
|
One- to four-family |
|
| — |
|
| — |
|
| — |
|
| — |
|
| — |
|
Multi-family |
|
| — |
|
| — |
|
| — |
|
| — |
|
| — |
|
Commercial real estate |
|
| — |
|
| — |
|
| — |
|
| — |
|
| — |
|
Construction or development |
|
| — |
|
| — |
|
| — |
|
| — |
|
| — |
|
Land loans |
|
| — |
|
| — |
|
| — |
|
| — |
|
| — |
|
Commercial |
|
| — |
|
| 3 |
|
| — |
|
| — |
|
| — |
|
|
|
|
|
|
|
| ||||||||||
Total recoveries |
|
| — |
|
| 3 |
|
| — |
|
| — |
|
| — |
|
|
|
|
|
|
|
| ||||||||||
Consumer: |
|
|
|
|
|
|
|
|
|
|
|
|
|
|
|
|
Home equity lines of credit |
|
| — |
|
|
|
|
|
|
|
|
|
|
|
|
|
Second mortgages |
|
| 3 |
|
| 97 |
|
|
|
|
|
|
|
|
|
|
Other |
|
| 7 |
|
| 6 |
|
| 14 |
|
| 10 |
|
| 5 |
|
|
|
|
|
|
|
| ||||||||||
Total recoveries |
|
| 10 |
|
| 106 |
|
| 14 |
|
| 10 |
|
| 5 |
|
|
|
|
|
|
|
| ||||||||||
Net charge-offs |
|
| 150 |
|
| 280 |
|
| 102 |
|
| 71 |
|
| 59 |
|
|
|
|
|
|
|
| ||||||||||
Balance at end of period |
| $ | 4,541 |
| $ | 3,393 |
| $ | 3,222 |
| $ | 3,034 |
| $ | 3,045 |
|
|
|
|
|
|
|
| ||||||||||
Ratios: |
|
|
|
|
|
|
|
|
|
|
|
|
|
|
|
|
Ratio of allowance for loan losses to non-performing loans |
|
| 190.16 | % |
| 124.5 | % |
| 80.5 | % |
| 113.8 | % |
| 101.3 | % |
|
|
|
|
|
|
| ||||||||||
Source: Malvern Federal’s prospectus.
EXHIBIT I-7
Malvern Federal Savings Bank
Interest Rate Risk Analysis
Exhibit I-7
Interest Rate Risk Analysis
|
|
|
|
|
|
|
|
|
|
|
|
|
| ||||
|
| As of September 30, 2007 |
| As of September 30, 2006 |
| ||||||||||||
|
|
|
| ||||||||||||||
Change in Interest Rates (basis points)(1) |
| Amount |
| Dollar Change from Base |
| Percentage |
| Amount |
| Dollar Change from Base |
| Percentage |
| ||||
|
|
|
|
|
|
| |||||||||||
+300 |
| $ | 28,782 |
| $ | (22,994 | ) | (44 | )% | $ | 29,976 |
| $ | (18,402 | ) | (38 | )% |
+200 |
|
| 36,329 |
|
| (15,447 | ) | (30 | ) |
| 36,348 |
|
| (12,030 | ) | (25 | ) |
+100 |
|
| 44,222 |
|
| (7,554 | ) | (15 | ) |
| 42,618 |
|
| (5,760 | ) | (12 | ) |
0 |
| $ | 51,776 |
|
|
|
|
|
| $ | 48,378 |
|
|
|
|
|
|
-100 |
|
| 57,878 |
|
| + 6,102 |
| + 12 |
|
| 53,348 |
|
| + 4,970 |
| + 10 |
|
-200 |
|
| 62,315 |
|
| + 10,539 |
| + 20 |
|
| 56,928 |
|
| + 8,550 |
| + 18 |
|
| |||||||||||||||||
|
|
(1) | Assumes an instantaneous uniform change in interest rates. A basis point equals 0.01%. |
Source: Malvern Federal’s prospectus.
Exhibit I-8
Malvern Federal Savings Bank
Fixed and Adjustable Rate Loans
Exhibit I-8
Malvern Federal Savings Bank
Fixed and Adjustable Rate Loans
|
|
|
|
|
|
|
|
|
|
|
|
|
|
|
|
|
|
|
|
|
|
|
|
|
|
|
|
|
|
|
|
|
| One-to-Four Family |
| Multi- |
| Commercial Real Estate |
| Construction or Development |
| Land Loans |
| Commercial |
| Home Equity Lines of Credit |
| Second |
| Other |
| Total |
| ||||||||||
|
|
|
|
|
|
|
|
|
|
|
| ||||||||||||||||||||
|
| (Dollars in Thousands) |
| ||||||||||||||||||||||||||||
Amounts due in: |
|
|
|
|
|
|
|
|
|
|
|
|
|
|
|
|
|
|
|
|
|
|
|
|
|
|
|
| |||
One year or less |
|
| 2,139 |
|
| — |
|
| 8,128 |
|
| 25,406 |
|
| 2,795 |
|
| 3,367 |
|
| 145 |
|
| 689 |
|
| 64 |
|
| 42,733 |
|
After one year through two years |
|
| 767 |
|
| 90 |
|
| 6,994 |
|
| 11,760 |
|
| 2,695 |
|
| 2,107 |
|
| — |
|
| 681 |
|
| 142 |
|
| 25,236 |
|
After two years through three years |
|
| 1,226 |
|
| — |
|
| 7,699 |
|
| 1,090 |
|
| — |
|
| 1,775 |
|
| — |
|
| 947 |
|
| 234 |
|
| 12,971 |
|
After three years through five years |
|
| 4,478 |
|
| — |
|
| 1,671 |
|
| 2,789 |
|
| — |
|
| 226 |
|
| — |
|
| 3,707 |
|
| 526 |
|
| 13,397 |
|
After five years through ten years |
|
| 19,166 |
|
| 1,851 |
|
| 72,496 |
|
| 12,407 |
|
| 1,175 |
|
| 3,537 |
|
| 60 |
|
| 13,019 |
|
| 116 |
|
| 123,827 |
|
After ten years through fifteen years |
|
| 51,588 |
|
| — |
|
| 5,835 |
|
| — |
|
| — |
|
| 2,068 |
|
| — |
|
| 44,074 |
|
| 15 |
|
| 103,580 |
|
Beyond fifteen years |
|
| 114,096 | (1) |
| 316 |
|
| 5,677 |
|
| 5,418 |
|
| — |
|
| 2,687 |
|
| 11,606 |
|
| 15,616 |
|
| 428 |
|
| 155,844 | (1) |
|
|
|
|
|
|
|
|
|
|
|
| ||||||||||||||||||||
Total |
| $ | 193,460 |
| $ | 2,257 |
| $ | 108,500 |
| $ | 58,870 |
| $ | 6,665 |
| $ | 15,767 |
| $ | 11,811 |
| $ | 78,733 |
| $ | 1,525 |
| $ | 477,588 | (1) |
|
|
|
|
|
|
|
|
|
|
|
| ||||||||||||||||||||
Interest rate terms on amounts due after one year: |
|
|
|
|
|
|
|
|
|
|
|
|
|
|
|
|
|
|
|
|
|
| |||||||||
Fixed rate |
|
| 151,415 |
|
| 90 |
|
| 30,207 |
|
| 19,584 |
|
| 3,296 |
|
| 730 |
|
| — |
|
| 78,017 |
|
| 1,446 |
|
| 284,785 |
|
Adjustable rate |
|
| 39,906 |
|
| 2,167 |
|
| 70,165 |
|
| 13,880 |
|
| 574 |
|
| 11,670 |
|
| 11,666 |
|
| 27 |
|
| 15 |
|
| 150,070 |
|
|
|
|
|
|
|
|
|
|
|
|
| ||||||||||||||||||||
Total |
| $ | 191,321 |
| $ | 2,257 |
| $ | 100,372 |
| $ | 33,464 |
| $ | 3,870 |
| $ | 12,400 |
| $ | 11,666 |
| $ | 78,044 |
| $ | 1,461 |
| $ | 434,855 |
|
|
|
|
|
|
|
|
|
|
|
|
| ||||||||||||||||||||
|
|
(1) | Includes $9.3 million of one-to four-family mortgage loans due beyond 15 years which were held for sale at September 30, 2007. |
|
|
Source: Malvern Federal’s prospectus. | |
EXHIBIT I-9
Malvern Federal Savings Bank
Loan Portfolio Composition
Exhibit I-9
Malvern Federal Savings Bank
Loan Portfolio Composition
|
|
|
|
|
|
|
|
|
|
|
|
|
|
|
|
|
|
|
|
|
|
|
|
|
|
|
|
|
|
|
|
|
| September 30, |
| ||||||||||||||||||||||||||||
|
|
| |||||||||||||||||||||||||||||
|
| 2007 |
| 2006 |
| 2005 |
| 2004 |
| 2003 |
| ||||||||||||||||||||
|
|
|
|
|
|
| |||||||||||||||||||||||||
|
| Amount |
| Percent |
| Amount |
| Percent |
| Amount |
| Percent |
| Amount |
| Percent |
| Amount |
| Percent |
| ||||||||||
|
|
|
|
|
|
|
|
|
|
|
| ||||||||||||||||||||
|
| (Dollars in Thousands) |
| ||||||||||||||||||||||||||||
Mortgage Loans: |
|
|
|
|
|
|
|
|
|
|
|
|
|
|
|
|
|
|
|
|
|
|
|
|
|
|
|
|
|
|
|
One- to four-family(1) |
| $ | 193,460 |
|
| 40.4 | % | $ | 186,760 |
|
| 40.9 | % | $ | 202,313 |
|
| 48.6 | % | $ | 203,491 |
|
| 56.7 | % | $ | 177,707 |
|
| 59.5 | % |
Commercial real estate |
|
| 108,500 |
|
| 22.7 |
|
| 94,132 |
|
| 20.6 |
|
| 80,512 |
|
| 19.3 |
|
| 63,359 |
|
| 17.7 |
|
| 45,436 |
|
| 15.3 |
|
Construction or development |
|
| 58,870 |
|
| 12.4 |
|
| 67,833 |
|
| 14.8 |
|
| 48,488 |
|
| 11.6 |
|
| 22,039 |
|
| 6.2 |
|
| 11,704 |
|
| 3.9 |
|
Multi-family |
|
| 2,257 |
|
| 0.5 |
|
| 2,283 |
|
| 0.5 |
|
| 413 |
|
| 0.1 |
|
| 516 |
|
| 0.1 |
|
| 270 |
|
| 0.1 |
|
Land loans |
|
| 6,665 |
|
| 1.4 |
|
| 7,675 |
|
| 1.6 |
|
| 3,125 |
|
| 0.8 |
|
| 3,332 |
|
| 0.9 |
|
| 6,497 |
|
| 2.2 |
|
|
|
|
|
|
|
|
|
|
|
|
| ||||||||||||||||||||
Total mortgage loans |
|
| 369,752 |
|
| 77.4 |
|
| 358,683 |
|
| 78.4 |
|
| 334,851 |
|
| 80.4 |
|
| 292,737 |
|
| 81.6 |
|
| 241,614 |
|
| 81.0 |
|
|
|
|
|
|
|
|
|
|
|
|
|
|
|
|
|
|
|
|
|
|
| ||||||||||
Commercial |
|
| 15,767 |
|
| 3.3 |
|
| 16,504 |
|
| 3.6 |
|
| 16,494 |
|
| 4.0 |
|
| 19,743 |
|
| 5.5 |
|
| 19,290 |
|
| 6.4 |
|
|
|
|
|
|
|
|
|
|
|
|
|
|
|
|
|
|
|
|
|
|
| ||||||||||
Consumer: |
|
|
|
|
|
|
|
|
|
|
|
|
|
|
|
|
|
|
|
|
|
|
|
|
|
|
|
|
|
|
|
Home equity lines of credit |
|
| 11,811 |
|
| 2.5 |
|
| 12,702 |
|
| 2.7 |
|
| 14,132 |
|
| 3.4 |
|
| 15,612 |
|
| 4.4 |
|
| 12,380 |
|
| 4.2 |
|
Second mortgages |
|
| 78,733 |
|
| 16.5 |
|
| 67,742 |
|
| 14.9 |
|
| 49,565 |
|
| 11.9 |
|
| 29,159 |
|
| 8.2 |
|
| 19,402 |
|
| 6.5 |
|
Other |
|
| 1,525 |
|
| 0.3 |
|
| 1,621 |
|
| 0.4 |
|
| 1,262 |
|
| 0.3 |
|
| 1,309 |
|
| 0.3 |
|
| 5,683 |
|
| 1.9 |
|
|
|
|
|
|
|
|
|
|
|
|
| ||||||||||||||||||||
Total consumer loans |
|
| 92,069 |
|
| 19.3 |
|
| 82,065 |
|
| 18.0 |
|
| 64,959 |
|
| 15.6 |
|
| 46,080 |
|
| 12.9 |
|
| 37,465 |
|
| 12.6 |
|
|
|
|
|
|
|
|
|
|
|
|
| ||||||||||||||||||||
Total Loans |
|
| 477,588 |
|
| 100.0 | % |
| 457,252 |
|
| 100.0 | % |
| 416,304 |
|
| 100.0 | % |
| 358,560 |
|
| 100.0 | % |
| 298,369 |
|
| 100.0 | % |
|
|
|
|
|
|
|
|
|
|
|
| ||||||||||||||||||||
Less: |
|
|
|
|
|
|
|
|
|
|
|
|
|
|
|
|
|
|
|
|
|
|
|
|
|
|
|
|
|
|
|
Deferred fees and discounts |
|
| (2,404 | ) |
|
|
|
| (1,954 | ) |
|
|
|
| (1,602 | ) |
|
|
|
| (1,107 | ) |
|
|
|
| (194 | ) |
|
|
|
Allowance for losses |
|
| 4,541 |
|
|
|
|
| 3,393 |
|
|
|
|
| 3,222 |
|
|
|
|
| 3,034 |
|
|
|
|
| 3,045 |
|
|
|
|
|
|
|
|
|
|
|
|
|
|
|
|
|
|
|
|
|
|
|
|
|
| ||||||||||
Loans receivable, net |
| $ | 475,451 |
|
|
|
| $ | 455,813 |
|
|
|
| $ | 414,684 |
|
|
|
| $ | 356,633 |
|
|
|
| $ | 295,518 |
|
|
|
|
|
|
|
|
|
|
|
|
|
|
|
|
|
|
|
|
|
|
|
|
|
| ||||||||||
|
|
(1) | Includes $9.3 million of loans held for sale at September 30, 2007. |
Source: Malvern Federal’s prospectus.
EXHIBIT I-10
Malvern Federal Savings Bank
Contractual Maturity by Loan Type
Exhibit I-10
Malvern Federal Savings Bank
Contractual Maturity by Loan Type
|
|
|
|
|
|
|
|
|
|
|
|
|
|
|
|
|
|
|
|
|
|
|
|
|
|
|
|
|
|
|
|
|
| One-to- |
| Multi- |
| Commercial |
| Construction |
| Land |
| Commercial |
| Home |
| Second |
| Other | �� | Total |
| ||||||||||
|
|
|
|
|
|
|
|
|
|
|
| ||||||||||||||||||||
|
| (Dollars in Thousands) |
| ||||||||||||||||||||||||||||
Amounts due in: |
|
|
|
|
|
|
|
|
|
|
|
|
|
|
|
|
|
|
|
|
|
|
|
|
|
|
|
|
|
|
|
One year or less |
|
| 2,139 |
|
| — |
|
| 8,128 |
|
| 25,406 |
|
| 2,795 |
|
| 3,367 |
|
| 145 |
|
| 689 |
|
| 64 |
|
| 42,733 |
|
After one year through two years |
|
| 767 |
|
| 90 |
|
| 6,994 |
|
| 11,760 |
|
| 2,695 |
|
| 2,107 |
|
| — |
|
| 681 |
|
| 142 |
|
| 25,236 |
|
After two years through three years |
|
| 1,226 |
|
| — |
|
| 7,699 |
|
| 1,090 |
|
| — |
|
| 1,775 |
|
| — |
|
| 947 |
|
| 234 |
|
| 12,971 |
|
After three years through five years |
|
| 4,478 |
|
| — |
|
| 1,671 |
|
| 2,789 |
|
| — |
|
| 226 |
|
| — |
|
| 3,707 |
|
| 526 |
|
| 13,397 |
|
After five years through ten years |
|
| 19,166 |
|
| 1,851 |
|
| 72,496 |
|
| 12,407 |
|
| 1,175 |
|
| 3,537 |
|
| 60 |
|
| 13,019 |
|
| 116 |
|
| 123,827 |
|
After ten years through fifteen years |
|
| 51,588 |
|
| — |
|
| 5,835 |
|
| — |
|
| — |
|
| 2,068 |
|
| — |
|
| 44,074 |
|
| 15 |
|
| 103,580 |
|
Beyond fifteen years |
|
| 114,096 | (1) |
| 316 |
|
| 5,677 |
|
| 5,418 |
|
| — |
|
| 2,687 |
|
| 11,606 |
|
| 15,616 |
|
| 428 |
|
| 155,844 | (1) |
|
|
|
|
|
|
|
|
|
|
|
| ||||||||||||||||||||
Total |
| $ | 193,460 |
| $ | 2,257 |
| $ | 108,500 |
| $ | 58,870 |
| $ | 6,665 |
| $ | 15,767 |
| $ | 11,811 |
| $ | 78,733 |
| $ | 1,525 |
| $ | 477,588 | (1) |
|
|
|
|
|
|
|
|
|
|
|
| ||||||||||||||||||||
Interest rate terms on amounts due after one year: |
|
|
|
|
|
|
|
|
|
|
|
|
|
|
|
|
|
|
|
|
|
|
|
|
|
|
|
|
|
|
|
Fixed rate |
|
| 151,415 |
|
| 90 |
|
| 30,207 |
|
| 19,584 |
|
| 3,296 |
|
| 730 |
|
| — |
|
| 78,017 |
|
| 1,446 |
|
| 284,785 |
|
Adjustable rate |
|
| 39,906 |
|
| 2,167 |
|
| 70,165 |
|
| 13,880 |
|
| 574 |
|
| 11,670 |
|
| 11,666 |
|
| 27 |
|
| 15 |
|
| 150,070 |
|
|
|
|
|
|
|
|
|
|
|
|
| ||||||||||||||||||||
Total |
| $ | 191,321 |
| $ | 2,257 |
| $ | 100,372 |
| $ | 33,464 |
| $ | 3,870 |
| $ | 12,400 |
| $ | 11,666 |
| $ | 78,044 |
| $ | 1,461 |
| $ | 434,855 |
|
|
|
|
|
|
|
|
|
|
|
|
| ||||||||||||||||||||
|
|
(1) | Includes $9.3 million of one-to four-family mortgage loans due beyond 15 years which were held for sale at September 30, 2007. |
Source: Malvern Federal’s prospectus.
EXHIBIT I-11
Malvern Federal Savings Bank
Loan Originations, Purchases, and Sales
Exhibit I-11
Malvern Federal Savings Bank
Loan Originations, Purchases, and Sales
|
|
|
|
|
|
|
|
|
|
|
|
| Year Ended September 30, |
| |||||||
|
|
| ||||||||
|
| 2007 |
| 2006 |
| 2005 |
| |||
|
|
|
|
| ||||||
|
| (In Thousands) |
| |||||||
Originations by type: |
|
|
|
|
|
|
|
|
|
|
Adjustable rate: |
|
|
|
|
|
|
|
|
|
|
Mortgage: |
|
|
|
|
|
|
|
|
|
|
One- to four-family |
| $ | 463 |
| $ | 5,906 |
| $ | 3,982 |
|
Multi-family |
|
| — |
|
| 1,908 |
|
| — |
|
Commercial real estate |
|
| 36,974 |
|
| 15,415 |
|
| 16,415 |
|
Construction or development |
|
| 28,196 |
|
| 57,406 |
|
| 48,837 |
|
Land loans |
|
| 116 |
|
| 2,700 |
|
| 98 |
|
Other: |
|
|
|
|
|
|
|
|
|
|
Commercial |
|
| 2,001 |
|
| 2,855 |
|
| — |
|
Home equity lines of credit |
|
| 8,674 |
|
| 12,208 |
|
| 10,878 |
|
Second mortgages |
|
| — |
|
| — |
|
| — |
|
Other |
|
| — |
|
| — |
|
| — |
|
|
|
|
|
| ||||||
Total adjustable-rate |
|
| 76,424 |
|
| 98,398 |
|
| 80,210 |
|
|
|
|
|
| ||||||
Fixed rate: |
|
|
|
|
|
|
|
|
|
|
Mortgage: |
|
|
|
|
|
|
|
|
|
|
One- to four-family |
|
| 23,907 |
|
| 16,805 |
|
| 20,615 |
|
Multi-family |
|
| — |
|
| — |
|
| — |
|
Commercial real estate |
|
| 2,587 |
|
| 4,141 |
|
| 4,792 |
|
Construction or development |
|
| — |
|
| 1,375 |
|
| — |
|
Land loans |
|
| — |
|
| 2,962 |
|
| — |
|
Other: |
|
|
|
|
|
|
|
|
|
|
Commercial |
|
| 9,750 |
|
| 11,498 |
|
| 14,756 |
|
Home equity lines of credit |
|
| — |
|
| — |
|
| — |
|
Second mortgages |
|
| 10,715 |
|
| 11,599 |
|
| 11,472 |
|
Other |
|
| 1,022 |
|
| 2,289 |
|
| 2,610 |
|
|
|
|
|
| ||||||
Total fixed-rate |
|
| 47,981 |
|
| 50,669 |
|
| 54,345 |
|
|
|
|
|
| ||||||
Total loans originated |
|
| 124,405 |
|
| 149,067 |
|
| 134,455 |
|
|
|
|
|
| ||||||
Purchases(1): |
|
|
|
|
|
|
|
|
|
|
Mortgages: |
|
|
|
|
|
|
|
|
|
|
One- to four-family |
|
| 7,303 |
|
| 7,263 |
|
| 20,292 |
|
Construction or development |
|
| 7,606 |
|
| 4,772 |
|
| — |
|
Other: |
|
|
|
|
|
|
|
|
|
|
Second mortgages |
|
| 19,533 |
|
| 25,572 |
|
| 22,102 |
|
|
|
|
|
| ||||||
Total purchased |
|
| 34,442 |
|
| 37,607 |
|
| 42,394 |
|
|
|
|
|
| ||||||
Sales: |
|
|
|
|
|
|
|
|
|
|
Mortgages: |
|
|
|
|
|
|
|
|
|
|
One- to four-family |
|
| — |
|
| 20,627 |
|
| 14,553 |
|
Construction or development |
|
| — |
|
| 1,862 |
|
| — |
|
Other |
|
| — |
|
| — |
|
| — |
|
|
|
|
|
| ||||||
Total sales |
|
| — |
|
| 22,489 |
|
| 14,553 |
|
|
|
|
|
| ||||||
Principal Repayments: |
|
|
|
|
|
|
|
|
|
|
Mortgage: |
|
|
|
|
|
|
|
|
|
|
One- to four-family |
|
| 24,973 |
|
| 24,899 |
|
| 31,515 |
|
Multi-family |
|
| 26 |
|
| 38 |
|
| 103 |
|
Commercial real estate |
|
| 25,193 |
|
| 5,936 |
|
| 4,054 |
|
Construction or development |
|
| 44,765 |
|
| 42,347 |
|
| 22,388 |
|
Land loans |
|
| 1,126 |
|
| 1,113 |
|
| 304 |
|
Exhibit I-11 (continued)
Malvern Federal Savings Bank
Loan Originations, Purchases, and Sales
|
|
|
|
|
|
|
|
|
|
|
|
| Year Ended September 30, |
| |||||||
|
|
| ||||||||
|
| 2007 |
| 2006 |
| 2005 |
| |||
|
|
|
|
| ||||||
|
| (In Thousands) |
| |||||||
| ||||||||||
Other: |
|
|
|
|
|
|
|
|
|
|
Commercial |
|
| 12,487 |
|
| 14,343 |
|
| 18,005 |
|
Home equity lines of credit |
|
| 9,565 |
|
| 13,639 |
|
| 12,358 |
|
Second mortgages |
|
| 19,258 |
|
| 18,993 |
|
| 13,168 |
|
Other |
|
| 1,118 |
|
| 1,929 |
|
| 2,657 |
|
|
|
|
|
| ||||||
Total principal repayments |
|
| 138,511 |
|
| 123,237 |
|
| 104,552 |
|
|
|
|
|
| ||||||
Total deductions |
|
| 138,511 |
|
| 145,726 |
|
| 119,105 |
|
|
|
|
|
| ||||||
Increase (decrease) in other items, net |
|
|
|
|
|
|
|
|
|
|
Net increase (decrease) |
| $ | 20,336 |
| $ | 40,948 |
| $ | 57,744 |
|
|
|
|
|
| ||||||
|
|
(1) | Includes purchase of participation interests in loans and purchases of loans from our network of loan brokers. |
Source: Malvern Federal’s prospectus.
EXHIBIT I-12
Malvern Federal Savings Bank
Non-Performing Assets
Exhibit I-12
Malvern Federal Savings Bank
Non-Performing Assets
|
|
|
|
|
|
|
|
|
|
|
|
|
|
|
|
|
|
| September 30, |
| |||||||||||||
|
|
| ||||||||||||||
|
| 2007 |
| 2006 |
| 2005 |
| 2004 |
| 2003 |
| |||||
|
|
|
|
|
|
| ||||||||||
|
| (Dollars in thousands) |
| |||||||||||||
Non-accruing loans: |
|
|
|
|
|
|
|
|
|
|
|
|
|
|
|
|
One-to-four-family |
| $ | 461 |
| $ | 686 |
| $ | 777 |
| $ | 714 |
| $ | 1,096 |
|
Multi-family |
|
| — |
|
| — |
|
| — |
|
| — |
|
| — |
|
Commercial real estate |
|
| 661 |
|
| 1,500 |
|
| 156 |
|
| 955 |
|
| 1,151 |
|
Construction or development |
|
| — |
|
| — |
|
| — |
|
| — |
|
| — |
|
Land loans |
|
| — |
|
| — |
|
| — |
|
| 52 |
|
| — |
|
Commercial |
|
| 780 |
|
| 174 |
|
| 559 |
|
| 625 |
|
| 152 |
|
Home equity lines of credit |
|
| 14 |
|
| — |
|
| 35 |
|
| — |
|
| 305 |
|
Second mortgages |
|
| 351 |
|
| 341 |
|
| 270 |
|
| 291 |
|
| 214 |
|
Other |
|
| — |
|
| 24 |
|
| 4 |
|
| 25 |
|
| 88 |
|
|
|
|
|
|
|
| ||||||||||
Total non-accruing |
|
| 2,267 |
|
| 2,725 |
|
| 1,801 |
|
| 2,662 |
|
| 3,006 |
|
|
|
|
|
|
|
| ||||||||||
Accruing loans delinquent more than 90 days past due |
|
| — |
|
| — |
|
| — |
|
| — |
|
| — |
|
|
|
|
|
|
|
| ||||||||||
Restructured loans |
|
| 121 |
|
| — |
|
| 2,202 |
|
| — |
|
| — |
|
|
|
|
|
|
|
| ||||||||||
Total non-performing loans |
|
| 2,388 |
|
| 2,725 |
|
| 4,003 |
|
| 2,662 |
|
| 3,006 |
|
|
|
|
|
|
|
| ||||||||||
Real estate owned and other foreclosed assets: |
|
|
|
|
|
|
|
|
|
|
|
|
|
|
|
|
One- to four-family |
|
| 227 |
|
| — |
|
| — |
|
| — |
|
| — |
|
Other |
|
| — |
|
| — |
|
| — |
|
| — |
|
| — |
|
|
|
|
|
|
|
| ||||||||||
Total |
|
| 227 |
|
| — |
|
| — |
|
| — |
|
| — |
|
|
|
|
|
|
|
| ||||||||||
Total non-performing assets |
| $ | 2,615 |
| $ | 2,725 |
| $ | 4,003 |
| $ | 2,662 |
| $ | 3,006 |
|
|
|
|
|
|
|
| ||||||||||
Ratios: |
|
|
|
|
|
|
|
|
|
|
|
|
|
|
|
|
Nonperforming loans as a percent of gross loans |
|
| 0.50 | % |
| 0.60 | % |
| 0.96 | % |
| 0.74 | % |
| 1.00 | % |
|
|
|
|
|
|
| ||||||||||
Nonperforming assets as a percent of total assets |
|
| 0.47 | % |
| 0.53 | % |
| 0.82 | % |
| 0.58 | % |
| 0.65 | % |
|
|
|
|
|
|
| ||||||||||
Source: Malvern Federal’s prospectus.
EXHIBIT I-13
Malvern Federal Savings Bank
Deposit Composition
Exhibit I-13
Malvern Federal Savings Bank
Deposit Composition
|
|
|
|
|
|
|
|
|
|
|
|
|
|
|
|
|
|
|
|
|
| At September 30, |
| ||||||||||||||||
|
|
| |||||||||||||||||
|
| 2007 |
| 2006 |
| 2005 |
| ||||||||||||
|
|
|
|
| |||||||||||||||
|
| Amount |
| Percent of total deposits |
| Amount |
| Percent of total deposits |
| Amount |
| Percent of total deposits |
| ||||||
|
|
|
|
|
|
|
| ||||||||||||
|
| (Dollars in Thousands) |
| ||||||||||||||||
Deposit type: |
|
|
|
|
|
|
|
|
|
|
|
|
|
|
|
|
|
|
|
Savings |
| $ | 38,162 |
|
| 8.8 | % | $ | 44,284 |
|
| 11.0 | % | $ | 51,206 |
|
| 13.3 | % |
Money market |
|
| 73,790 |
|
| 17.0 |
|
| 46,815 |
|
| 11.6 |
|
| 33,831 |
|
| 8.8 |
|
Interest bearing demand |
|
| 43,850 |
|
| 10.1 |
|
| 40,415 |
|
| 10.0 |
|
| 33,083 |
|
| 8.6 |
|
Noninterest bearing demand |
|
| 9,446 |
|
| 2.2 |
|
| 11,873 |
|
| 3.0 |
|
| 21,251 |
|
| 5.5 |
|
|
|
|
|
|
|
|
| ||||||||||||
Total core deposits |
|
| 165,248 |
|
| 38.1 |
|
| 143,387 |
|
| 35.6 |
|
| 139,371 |
|
| 36.2 |
|
|
|
|
|
|
|
|
| ||||||||||||
Time deposits with original maturities of: |
|
|
|
|
|
|
|
|
|
|
|
|
|
|
|
|
|
|
|
Three months or less |
|
| 652 |
|
| 0.2 |
|
| 542 |
|
| 0.1 |
|
| 825 |
|
| 0.2 |
|
Over three months to six months |
|
| 6,100 |
|
| 1.4 |
|
| 6,981 |
|
| 1.7 |
|
| 28,634 |
|
| 7.4 |
|
Over six months to twelve months |
|
| 53,853 |
|
| 12.4 |
|
| 30,092 |
|
| 7.5 |
|
| 26,492 |
|
| 6.9 |
|
Over twelve months |
|
| 207,635 |
|
| 47.9 |
|
| 221,076 |
|
| 55.1 |
|
| 189,723 |
|
| 49.3 |
|
|
|
|
|
|
|
|
| ||||||||||||
Total time deposits |
|
| 268,240 |
|
| 61.9 |
|
| 258,691 |
|
| 64.4 |
|
| 245,674 |
|
| 63.8 |
|
|
|
|
|
|
|
|
| ||||||||||||
Total deposits |
| $ | 433,488 |
|
| 100.0 | % | $ | 402,078 |
|
| 100.0 | % | $ | 385,045 |
|
| 100.0 | % |
|
|
|
|
|
|
|
| ||||||||||||
Source: Malvern Federal’s prospectus.
EXHIBIT I-14
Malvern Federal Savings Bank
Maturity of Time Deposits
Exhibit I-14
Malvern Federal Savings Bank
Maturity of Time Deposits
|
|
|
|
|
|
|
|
|
|
|
|
|
|
|
|
|
|
|
|
|
|
|
|
| Period to maturity from September 30, 2007 |
|
|
|
|
|
|
| |||||||||||||
|
|
|
|
|
|
|
|
| ||||||||||||||
|
| Less than One Year |
| More than One Year to Two Years |
| More Than Two Years to Three Years |
| More than Three Years |
| At September 30, |
| |||||||||||
|
|
|
|
|
|
| ||||||||||||||||
|
|
|
|
|
| 2007 |
| 2006 |
| 2005 |
| |||||||||||
|
|
|
|
|
|
|
|
| ||||||||||||||
|
| (Dollars in Thousands) |
| |||||||||||||||||||
Interest Rate Range |
|
|
|
|
|
|
|
|
|
|
|
|
|
|
|
|
|
|
|
|
|
|
1.99% and below |
| $ | — |
| $ | — |
| $ | — |
| $ | — |
| $ | — |
| $ | — |
| $ | 6,033 |
|
2.00% to 2.99% |
|
| 6,302 |
|
| — |
|
| — |
|
| — |
|
| 6,302 |
|
| 9,049 |
|
| 20,104 |
|
3.00% to 3.99% |
|
| 16,618 |
|
| 10,894 |
|
| 2,983 |
|
| 1,175 |
|
| 31,670 |
|
| 76,313 |
|
| 132,966 |
|
4.00% to 4.99% |
|
| 26,855 |
|
| 15,933 |
|
| 1,936 |
|
| 7,319 |
|
| 52,043 |
|
| 85,051 |
|
| 37,221 |
|
5.00% to 5.99% |
|
| 153,029 |
|
| 20,420 |
|
| 2,413 |
|
| 918 |
|
| 176,780 |
|
| 71,669 |
|
| 32,938 |
|
6.00% and above |
|
| 1,445 |
|
| — |
|
| — |
|
| — |
|
| 1,445 |
|
| 16,609 |
|
| 16,412 |
|
|
|
|
|
|
|
|
|
| ||||||||||||||
Total |
| $ | 204,249 |
| $ | 47,247 |
| $ | 7,332 |
| $ | 9,412 |
| $ | 268,240 |
| $ | 258,691 |
| $ | 245,674 |
|
|
|
|
|
|
|
|
|
| ||||||||||||||
Source: Malvern Federal’s prospectus.
EXHIBIT I-15
Malvern Federal Savings Bank
Borrowing Activity
Exhibit I-15
Malvern Federal Savings Bank
Borrowing Activity
|
|
|
|
|
|
|
|
|
|
|
|
| September 30, |
| |||||||
|
|
| ||||||||
|
| 2007 |
| 2006 |
| 2005 |
| |||
|
|
|
|
| ||||||
|
| (Dollars in Thousands) |
| |||||||
| ||||||||||
FHLB advances |
| $ | 63,387 |
| $ | 63,370 |
| $ | 57,000 |
|
Weighted average interest rate |
|
| 6.07 | % |
| 6.02 | % |
| 6.22 | % |
Highest amount at month-end |
|
|
|
|
|
|
|
|
|
|
Average amount outstanding |
|
|
|
|
|
|
|
|
|
|
|
|
|
|
| ||||||
Other borrowings |
|
| 8,000 |
|
| 7,500 |
|
| 4,500 |
|
Weighted average interest rate |
|
| 5.11 | % |
| 5.30 | % |
| 3.88 | % |
Highest amount at month-end |
|
|
|
|
|
|
|
|
|
|
Average amount outstanding |
|
|
|
|
|
|
|
|
|
|
|
|
|
|
| ||||||
Total borrowings |
| $ | 71,387 |
| $ | 70,870 |
| $ | 61,500 |
|
|
|
|
|
| ||||||
Source: Malvern Federal’s prospectus.
EXHIBIT II-1
Malvern Federal Savings Bank
Description of Office Facilities
Exhibit II-1
Malvern Federal Savings Bank
Description of Office Facilities
|
|
|
|
|
|
|
|
|
|
|
|
|
|
Description/Address |
| Leased/Owned |
| Date of Lease Expiration |
| Net Book Value of Property |
| Amount of Deposits |
| ||||
|
|
|
|
| |||||||||
Paoli Financial Center and Headquarters |
|
| Owned |
|
| N/A |
| $ | 4,194 |
| $ | 159,375 |
|
|
|
|
|
|
|
|
|
|
|
|
|
|
|
Malvern Financial Center |
|
| Owned |
|
| N/A |
|
| 73 |
|
| 50,942 |
|
|
|
|
|
|
|
|
|
|
|
|
|
|
|
Exton Financial Center |
|
| Owned |
|
| N/A |
|
| 549 |
|
| 58,225 |
|
|
|
|
|
|
|
|
|
|
|
|
|
|
|
Coventry Financial Center |
|
| Owned |
|
| N/A |
|
| 527 |
|
| 68,224 |
|
|
|
|
|
|
|
|
|
|
|
|
|
|
|
Berwyn Financial Center |
|
| Owned |
|
| N/A |
|
| 814 |
|
| 44,439 |
|
|
|
|
|
|
|
|
|
|
|
|
|
|
|
Lionville Financial Center |
|
| Owned |
|
| N/A |
|
| 1,074 |
|
| 35,075 |
|
|
|
|
|
|
|
|
|
|
|
|
|
|
|
Westtown Financial Center |
|
| Leased |
|
| 2014 |
|
| 330 |
|
| 17,178 |
|
Source: Malvern Federal’s prospectus.
EXHIBIT II-2
Historical Interest Rates
Exhibit II-2
Historical Interest Rates(1)
|
|
|
|
|
|
|
|
|
|
|
|
|
|
Year/Qtr. Ended |
| Prime |
|
| 90 Day |
|
| One Year |
|
| 10 Year |
| |
|
|
|
|
|
|
|
| ||||||
1999: | Quarter 1 |
| 7.75 | % |
| 4.49 | % |
| 4.72 | % |
| 5.25 | % |
| Quarter 2 |
| 7.75 | % |
| 4.78 | % |
| 5.07 | % |
| 5.81 | % |
| Quarter 3 |
| 8.25 | % |
| 4.88 | % |
| 5.22 | % |
| 5.90 | % |
| Quarter 4 |
| 8.50 | % |
| 5.33 | % |
| 5.98 | % |
| 6.45 | % |
|
|
|
|
|
|
|
|
|
|
|
|
|
|
2000: | Quarter 1 |
| 9.00 | % |
| 5.88 | % |
| 6.28 | % |
| 6.03 | % |
| Quarter 2 |
| 9.50 | % |
| 5.88 | % |
| 6.08 | % |
| 6.03 | % |
| Quarter 3 |
| 9.50 | % |
| 6.23 | % |
| 6.07 | % |
| 5.80 | % |
| Quarter 4 |
| 9.50 | % |
| 5.89 | % |
| 5.32 | % |
| 5.12 | % |
|
|
|
|
|
|
|
|
|
|
|
|
|
|
2001: | Quarter 1 |
| 8.00 | % |
| 4.30 | % |
| 4.09 | % |
| 4.93 | % |
| Quarter 2 |
| 6.75 | % |
| 3.65 | % |
| 3.72 | % |
| 5.42 | % |
| Quarter 3 |
| 6.00 | % |
| 2.40 | % |
| 2.49 | % |
| 4.60 | % |
| Quarter 4 |
| 4.75 | % |
| 1.74 | % |
| 2.17 | % |
| 5.07 | % |
|
|
|
|
|
|
|
|
|
|
|
|
|
|
2002: | Quarter 1 |
| 4.75 | % |
| 1.79 | % |
| 2.70 | % |
| 5.42 | % |
| Quarter 2 |
| 4.75 | % |
| 1.70 | % |
| 2.06 | % |
| 4.86 | % |
| Quarter 3 |
| 4.75 | % |
| 1.57 | % |
| 1.53 | % |
| 3.63 | % |
| Quarter 4 |
| 4.25 | % |
| 1.22 | % |
| 1.32 | % |
| 3.83 | % |
|
|
|
|
|
|
|
|
|
|
|
|
|
|
2003: | Quarter 1 |
| 4.25 | % |
| 1.14 | % |
| 1.19 | % |
| 3.83 | % |
| Quarter 2 |
| 4.00 | % |
| 0.90 | % |
| 1.09 | % |
| 3.54 | % |
| Quarter 3 |
| 4.00 | % |
| 0.95 | % |
| 1.15 | % |
| 3.96 | % |
| Quarter 4 |
| 4.00 | % |
| 0.95 | % |
| 1.26 | % |
| 4.27 | % |
|
|
|
|
|
|
|
|
|
|
|
|
|
|
2004: | Quarter 1 |
| 4.00 | % |
| 0.95 | % |
| 1.20 | % |
| 3.86 | % |
| Quarter 2 |
| 4.00 | % |
| 1.33 | % |
| 2.09 | % |
| 4.62 | % |
| Quarter 3 |
| 4.75 | % |
| 1.70 | % |
| 2.16 | % |
| 4.12 | % |
| Quarter 4 |
| 5.25 | % |
| 2.22 | % |
| 2.75 | % |
| 4.24 | % |
|
|
|
|
|
|
|
|
|
|
|
|
|
|
2005: | Quarter 1 |
| 5.75 | % |
| 2.80 | % |
| 3.43 | % |
| 4.51 | % |
| Quarter 2 |
| 6.00 | % |
| 3.12 | % |
| 3.51 | % |
| 3.98 | % |
| Quarter 3 |
| 6.75 | % |
| 3.55 | % |
| 4.01 | % |
| 4.34 | % |
| Quarter 4 |
| 7.25 | % |
| 4.08 | % |
| 4.38 | % |
| 4.39 | % |
|
|
|
|
|
|
|
|
|
|
|
|
|
|
2006: | Quarter 1 |
| 7.75 | % |
| 4.63 | % |
| 4.82 | % |
| 4.86 | % |
| Quarter 2 |
| 8.25 | % |
| 5.01 | % |
| 5.21 | % |
| 5.15 | % |
| Quarter 3 |
| 8.25 | % |
| 4.88 | % |
| 4.91 | % |
| 4.64 | % |
| Quarter 4 |
| 8.25 | % |
| 5.02 | % |
| 5.00 | % |
| 4.71 | % |
|
|
|
|
|
|
|
|
|
|
|
|
|
|
2007: | Quarter 1 |
| 8.25 | % |
| 5.04 | % |
| 4.90 | % |
| 4.65 | % |
| Quarter 2 |
| 8.25 | % |
| 4.68 | % |
| 4.91 | % |
| 5.03 | % |
| Quarter 3 |
| 7.75 | % |
| 3.82 | % |
| 4.05 | % |
| 4.59 | % |
As of Dec. 7, 2007 |
| 7.50 | % |
| 3.04 | % |
| 3.24 | % |
| 4.12 | % | |
(1) End of period data.
Sources: Federal Reserve and The Wall Street Journal
EXHIBIT III-1
General Characteristics of Publicly-Traded Institutions
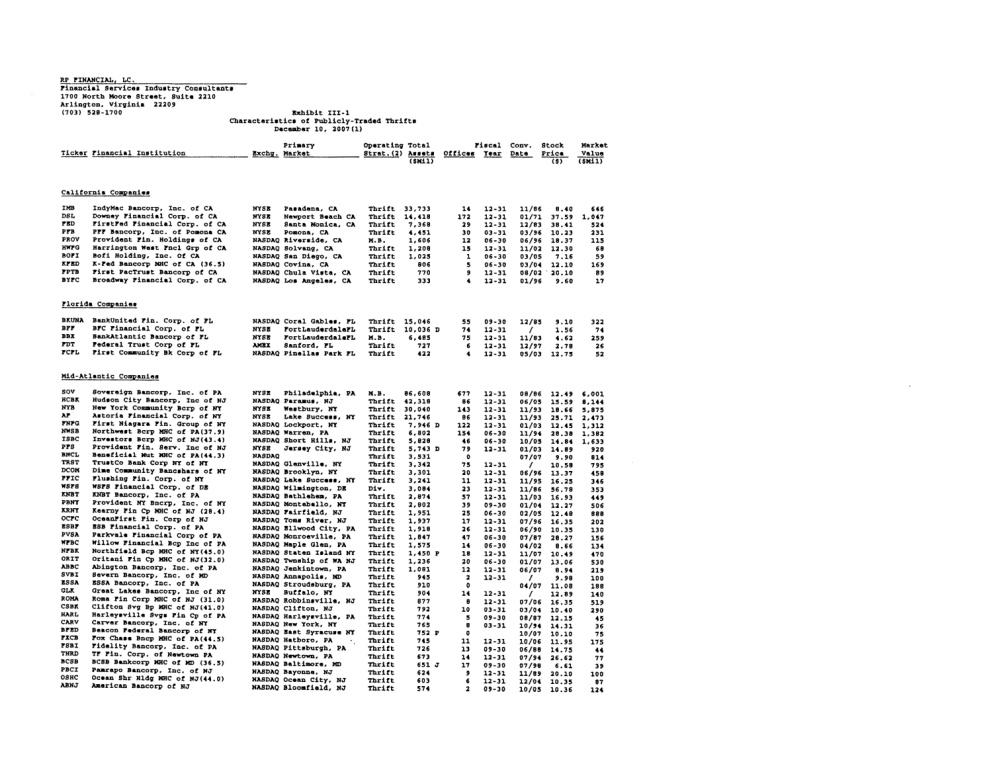
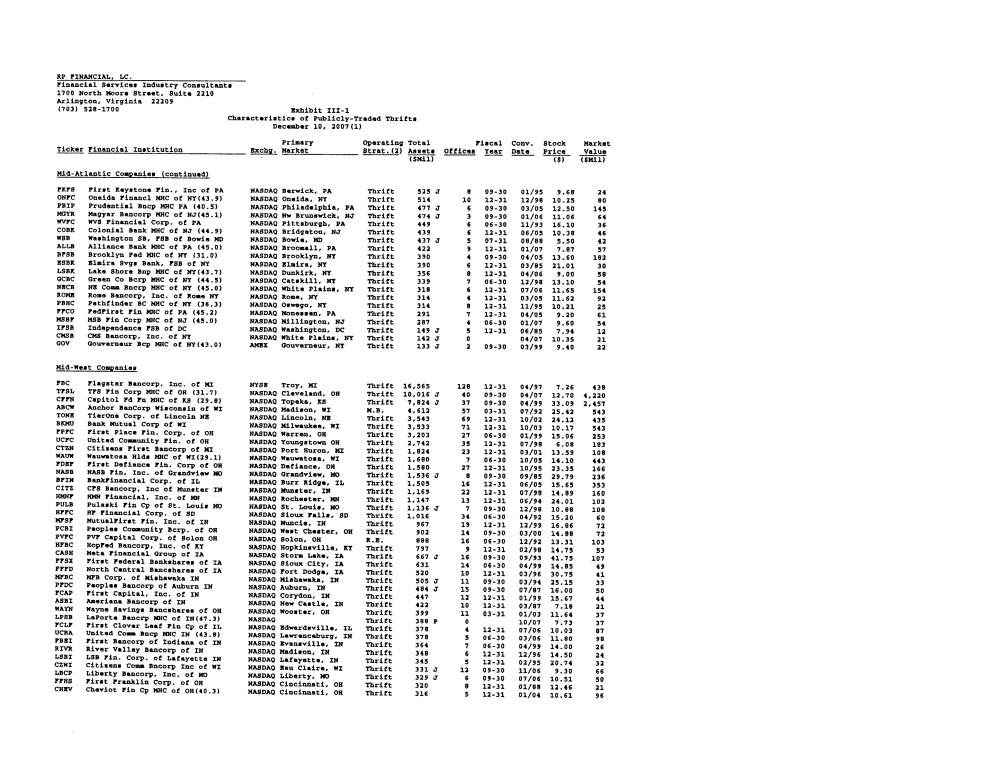
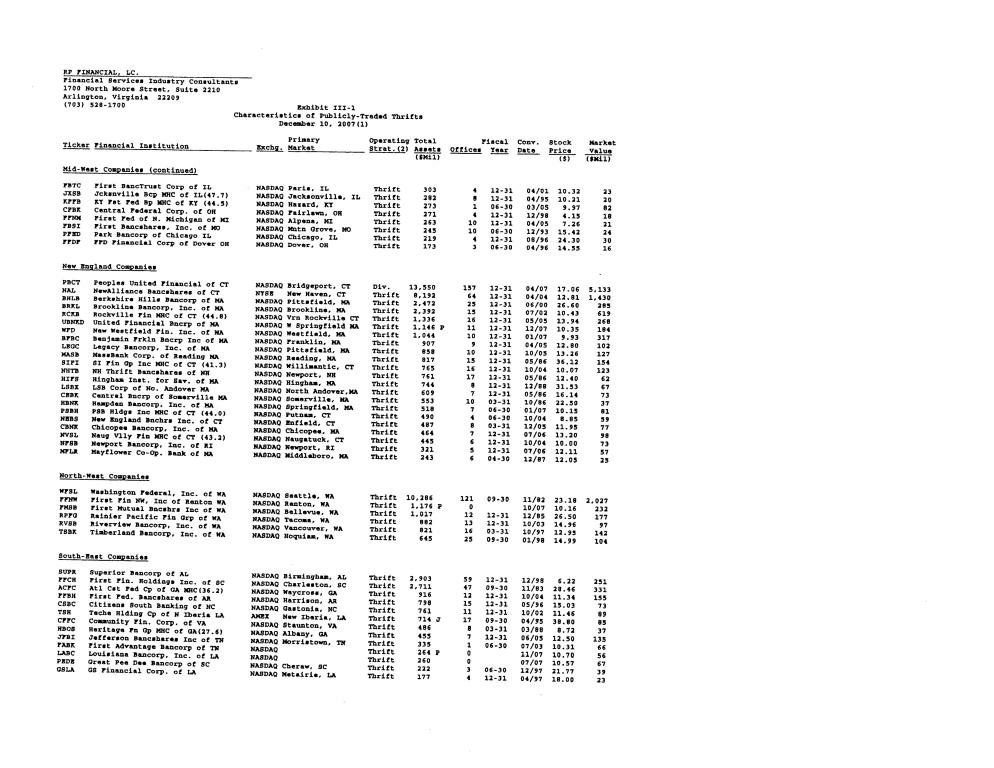

EXHIBIT III-2
Public Market Pricing of MHC Institutions
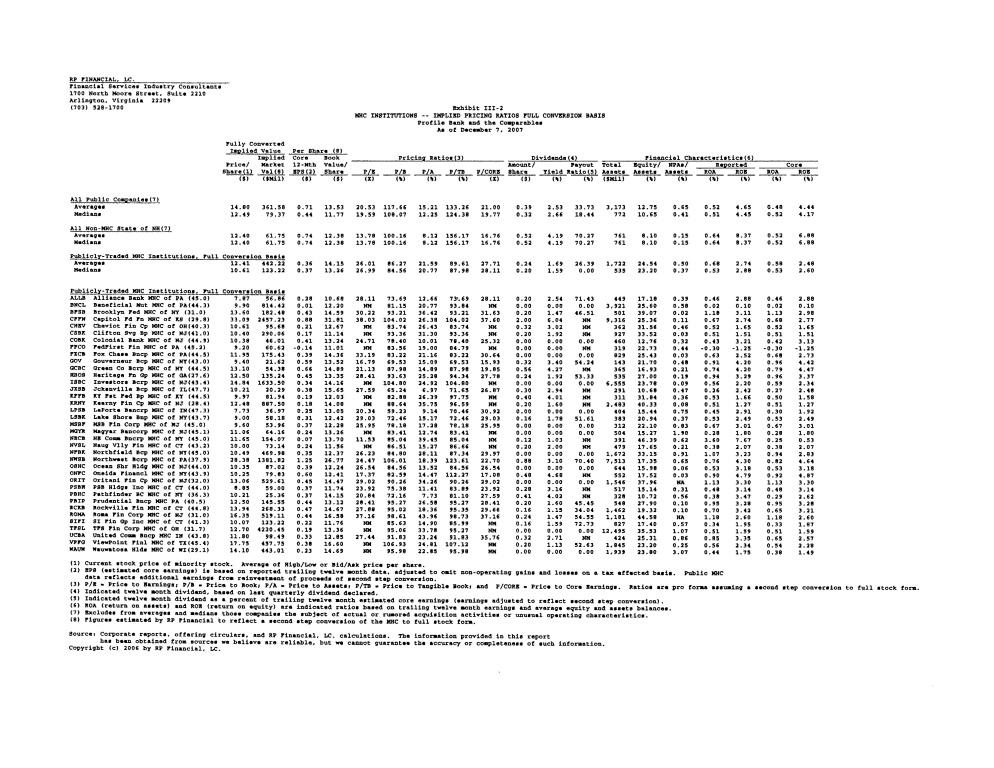
EXHIBIT III-3
Peer Group Market Area Comparative Analysis
Exhibit III-3
Peer Group Market Area Comparative Analysis
|
|
|
|
|
|
|
|
|
|
|
|
|
|
|
|
|
|
|
|
|
|
|
|
|
|
|
|
|
|
|
| Per Capita Income |
| Deposit |
| ||||
|
|
|
| Population |
| Proj. |
| 2000-2007 |
| 2007-2012 |
|
|
| ||||||
|
|
|
|
|
|
|
| Amount |
| % State |
|
| |||||||
Institution |
| County |
| 2000 |
| 2007 |
| 2012 |
|
|
|
|
|
| |||||
|
|
|
|
|
|
|
|
|
| ||||||||||
|
|
|
| (000) |
| (000) |
|
|
|
|
|
|
|
|
|
|
|
|
|
|
|
|
|
|
|
|
|
|
|
|
|
|
|
|
|
|
|
|
|
Brooklyn Federal MHC of NY |
| Kings |
| 2,465 |
| 2,547 |
| 2,606 |
| 3.3 | % | 2.3 | % | 21,956 |
| 70.6 | % | 0.5 | % |
Clifton Savings Bancorp MHC of NJ |
| Passaic |
| 489 |
| 508 |
| 519 |
| 3.8 | % | 2.3 | % | 27,147 |
| 76.8 | % | 5.1 | % |
Colonial Bankshares MHC of NJ |
| Cumberland |
| 146 |
| 155 |
| 161 |
| 5.8 | % | 3.7 | % | 21,637 |
| 61.2 | % | 17.0 | % |
Fox Chase Bancorp MHC of PA |
| Montgomery |
| 750 |
| 790 |
| 818 |
| 5.3 | % | 3.6 | % | 41,542 |
| 150.5 | % | 0.5 | % |
Lake Shore Bancorp MHC of NY |
| Chautauqua |
| 140 |
| 137 |
| 135 |
| -1.9 | % | -1.7 | % | 21,743 |
| 69.9 | % | 14.3 | % |
Magyar Bancorp MHC of NJ |
| Middlesex |
| 750 |
| 804 |
| 843 |
| 7.1 | % | 4.9 | % | 34,656 |
| 98.0 | % | 1.2 | % |
Ocean Shore Holding MHC of NJ |
| Cape May |
| 102 |
| 106 |
| 108 |
| 3.3 | % | 2.5 | % | 31,409 |
| 88.8 | % | 8.2 | % |
Oneida Financial MHC of NY |
| Madison |
| 69 |
| 71 |
| 71 |
| 2.1 | % | 0.7 | % | 25,099 |
| 80.7 | % | 38.9 | % |
Prudential Bancorp MHC of PA |
| Philadelphia |
| 1,518 |
| 1,476 |
| 1,447 |
| -2.7 | % | -1.9 | % | 21,425 |
| 77.6 | % | 0.8 | % |
Roma Financial Corp. MHC of NJ |
| Mercer |
| 351 |
| 372 |
| 385 |
| 6.0 | % | 3.7 | % | 37,002 |
| 104.6 | % | 5.7 | % |
|
|
|
|
|
|
|
|
|
|
|
|
|
|
|
|
|
|
|
|
|
| Averages: |
| 678 |
| 696 |
| 709 |
| 3.2 | % | 2.0 | % | 28,362 |
| 87.9 | % | 9.2 | % |
|
| Medians: |
| 420 |
| 440 |
| 452 |
| 3.6 | % | 2.4 | % | 26,123 |
| 79.1 | % | 5.4 | % |
|
|
|
|
|
|
|
|
|
|
|
|
|
|
|
|
|
|
|
|
Malvern FSB |
| Chester |
| 434 |
| 491 |
| 536 |
| 13.3 | % | 9.0 | % | 43,177 |
| 156.4 | % | 4.7 | % |
|
|
(1) | Total institution deposits in headquarters county as percent of total county deposits as of June 30, 2007. |
Sources: ESRI, FDIC.
EXHIBIT IV-1
Stock Prices:
As of December 7, 2007
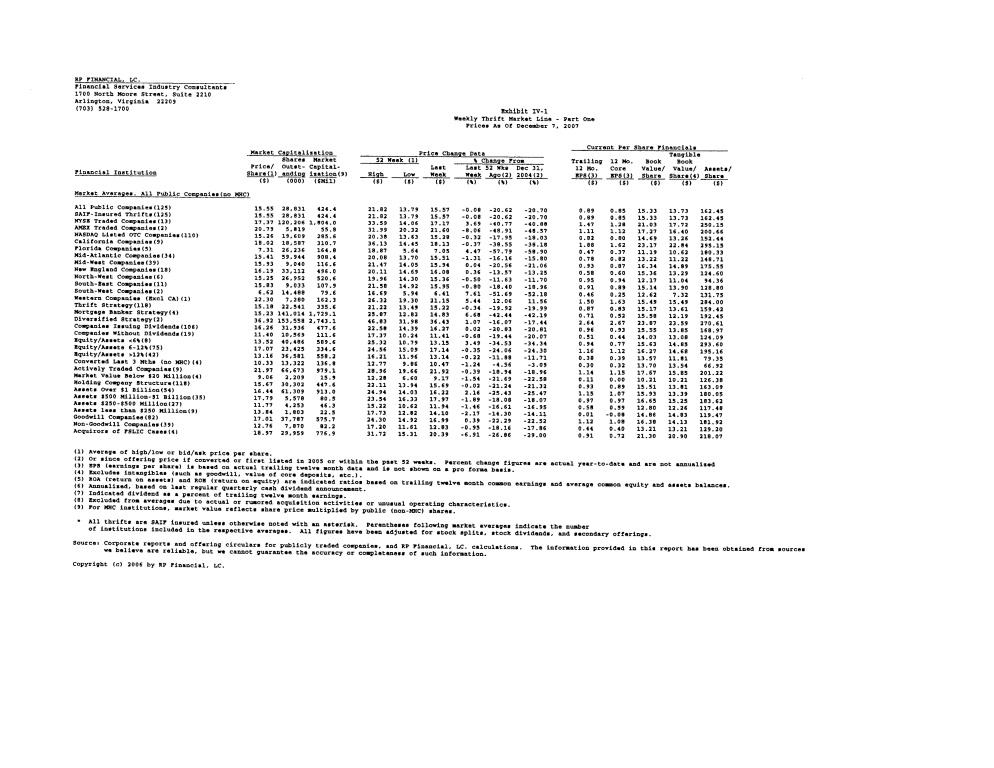
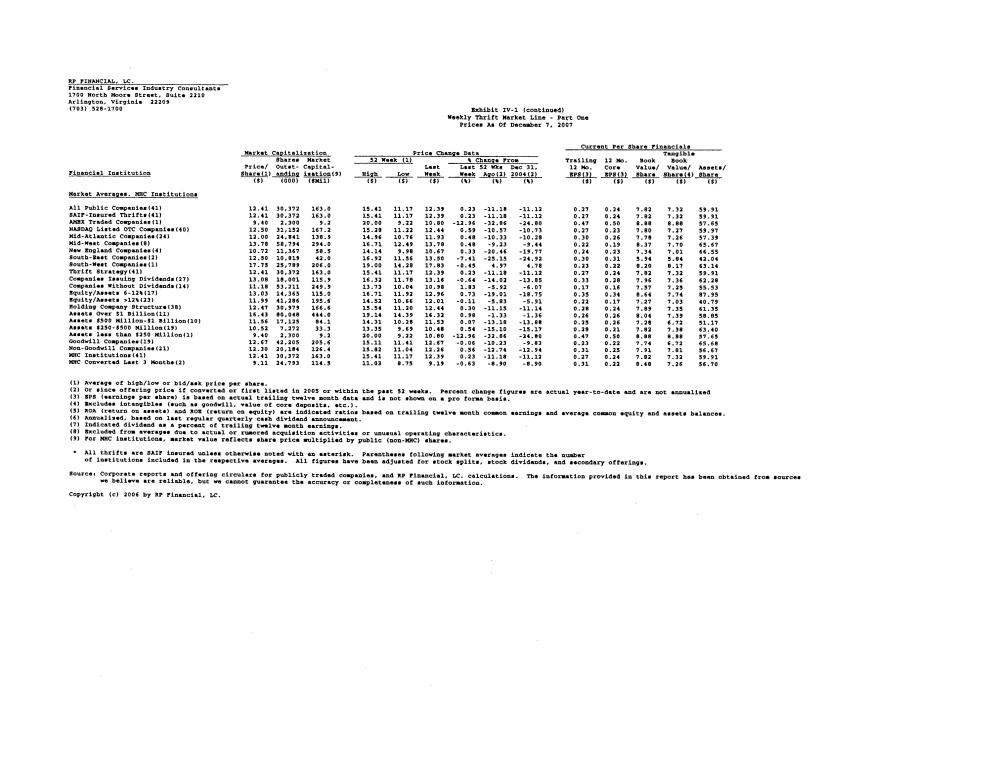
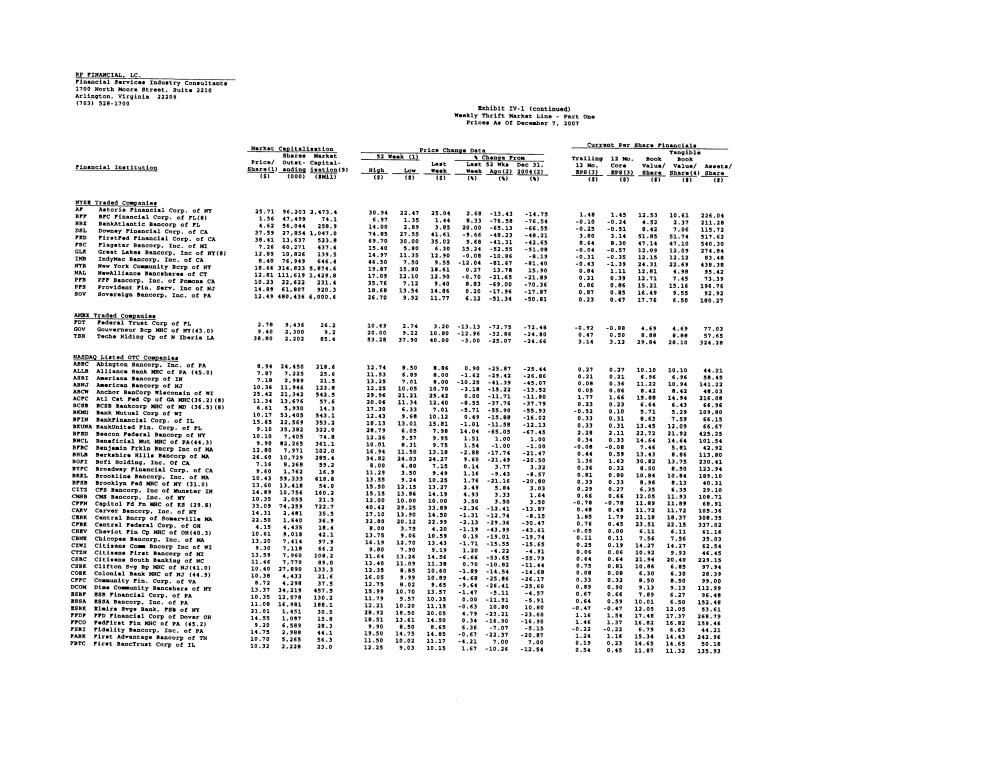
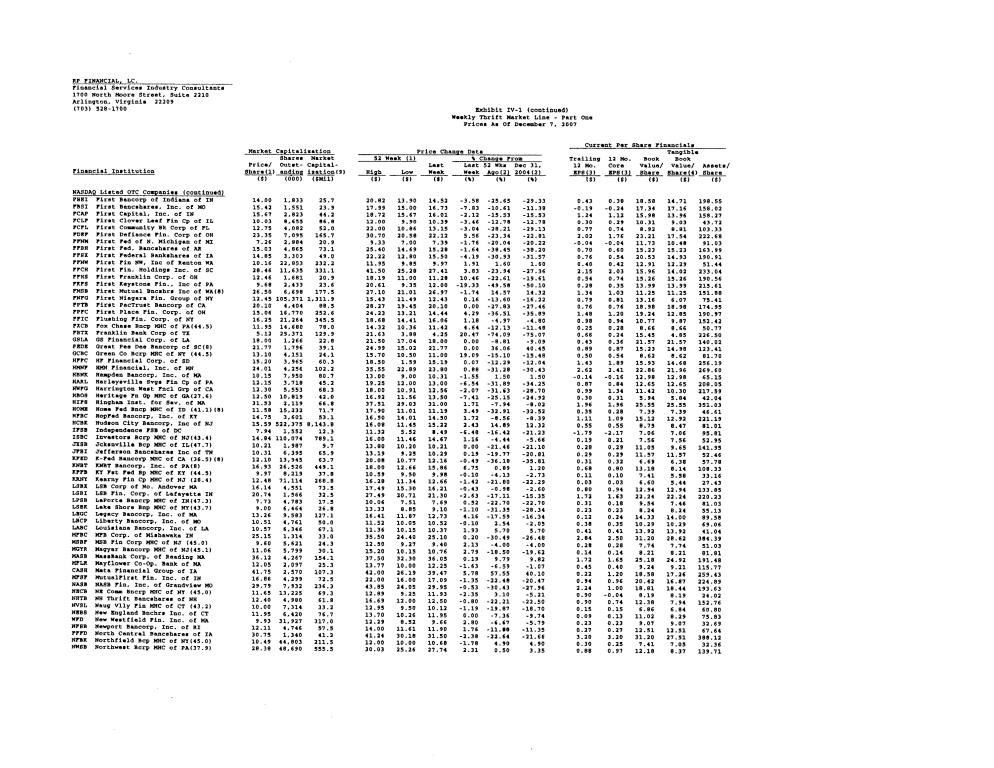
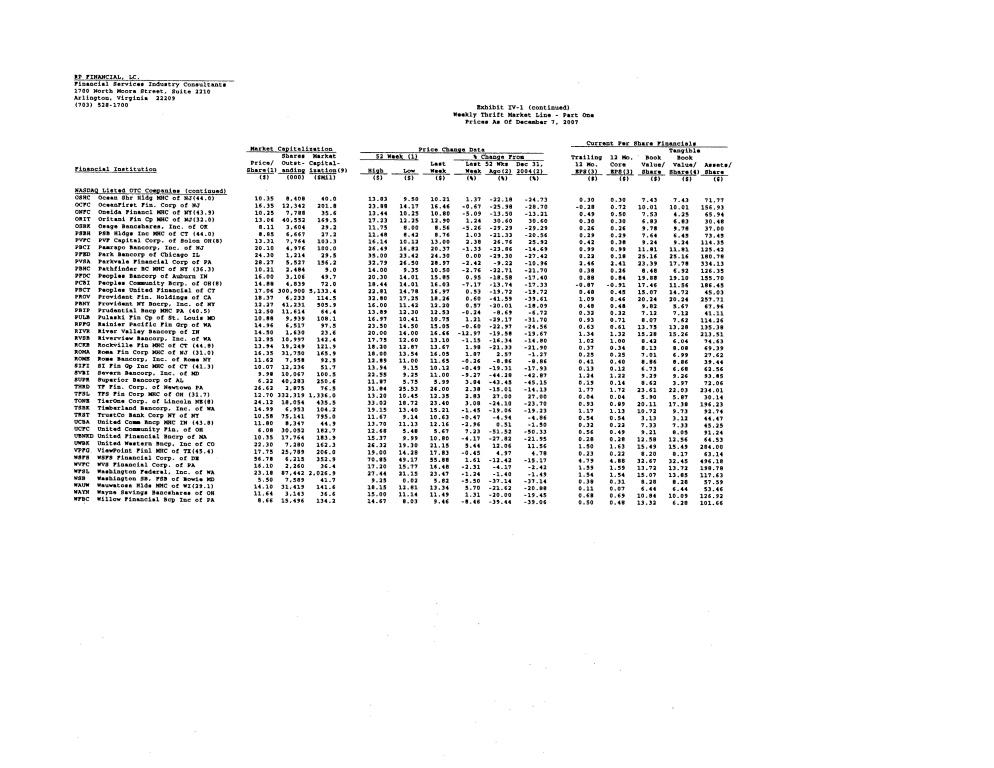
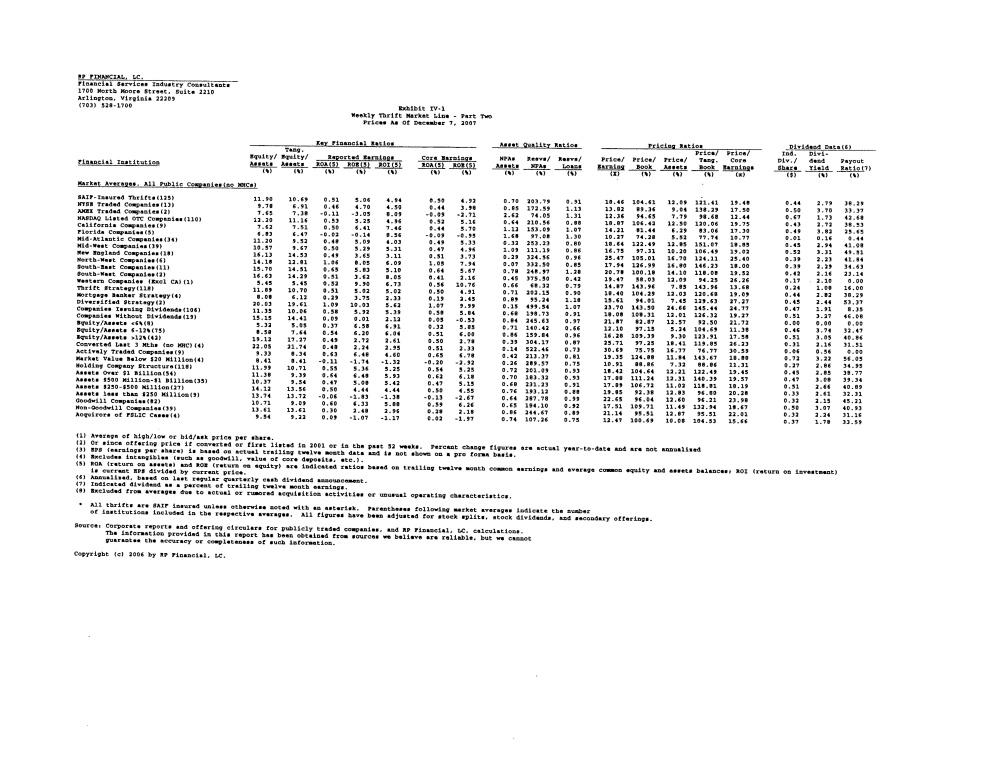
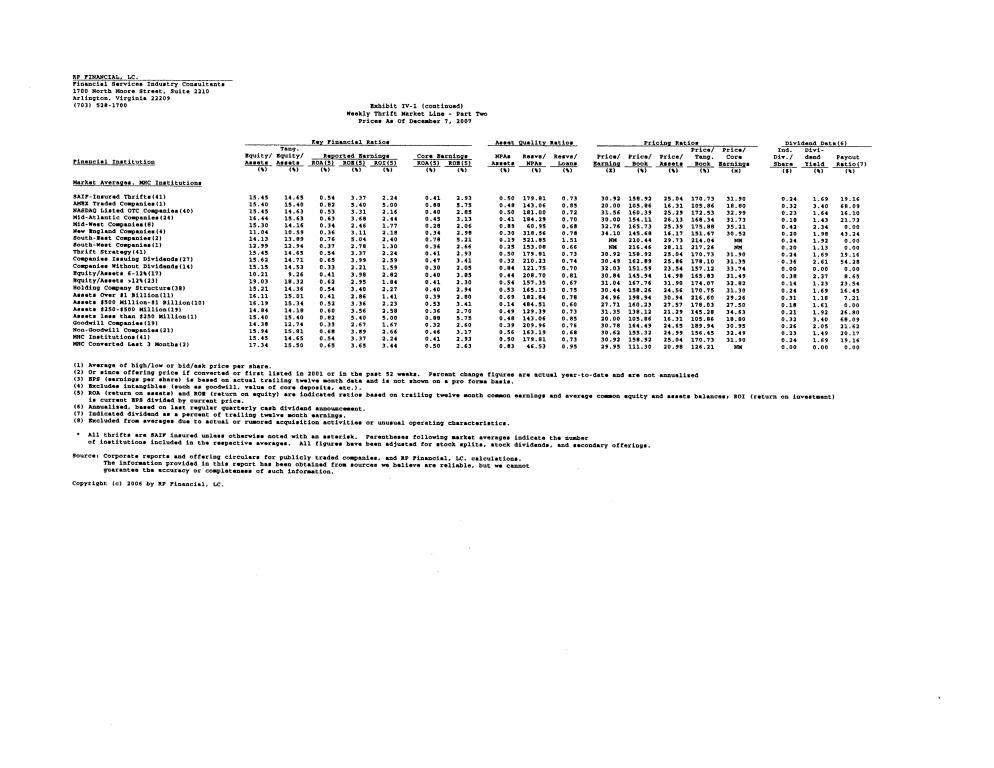
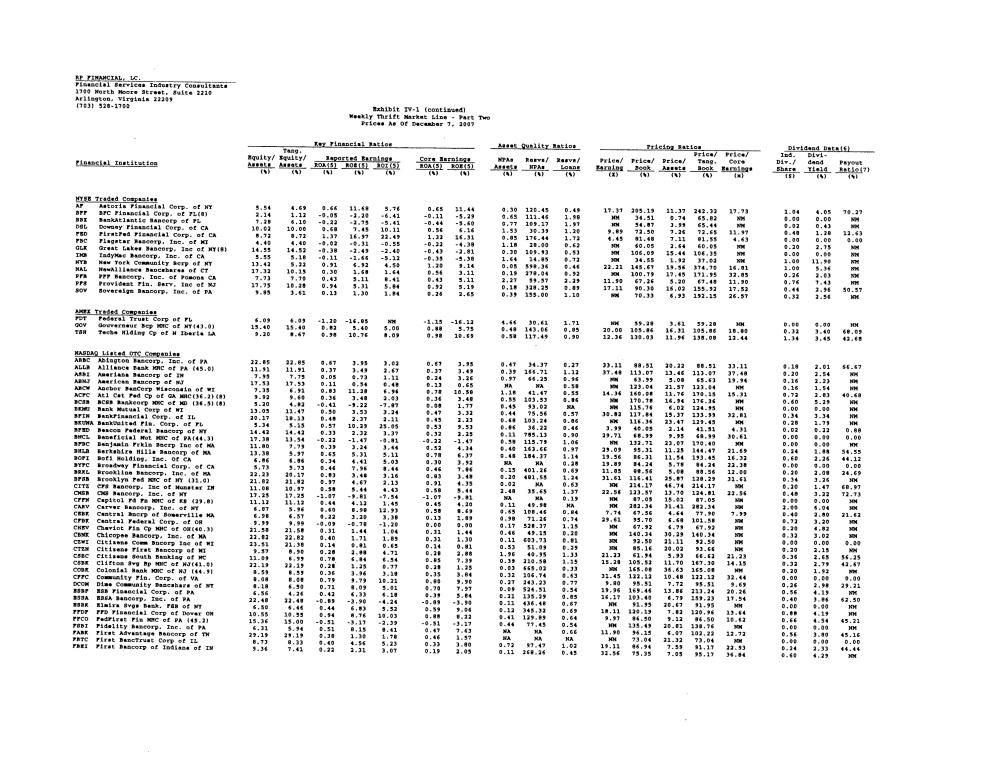
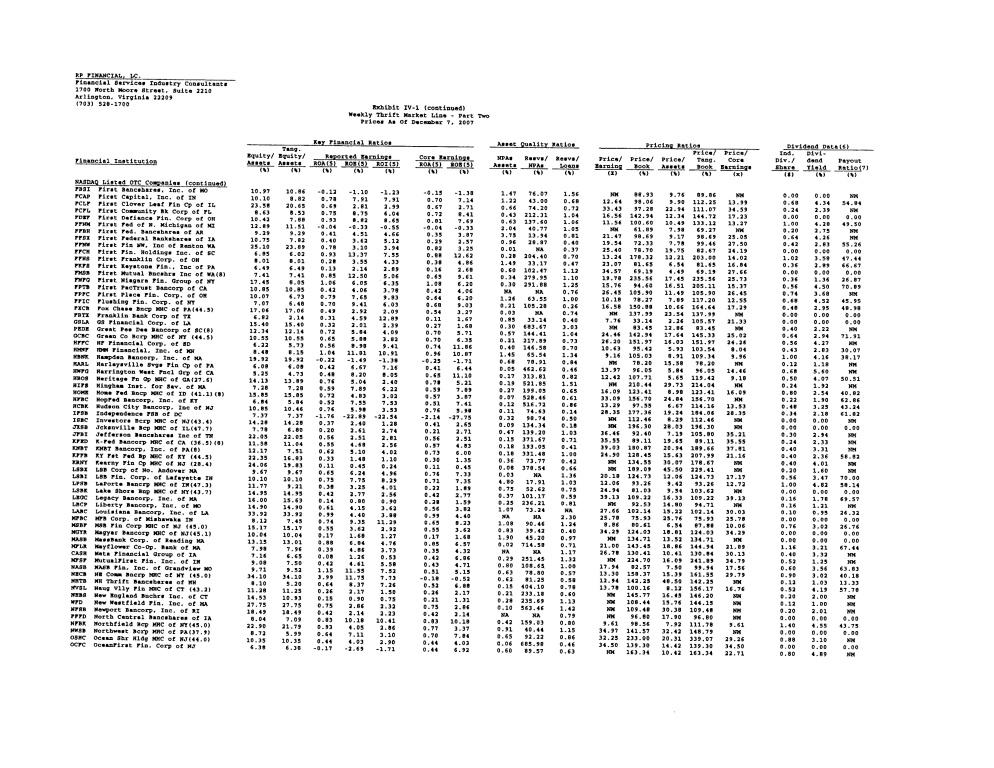
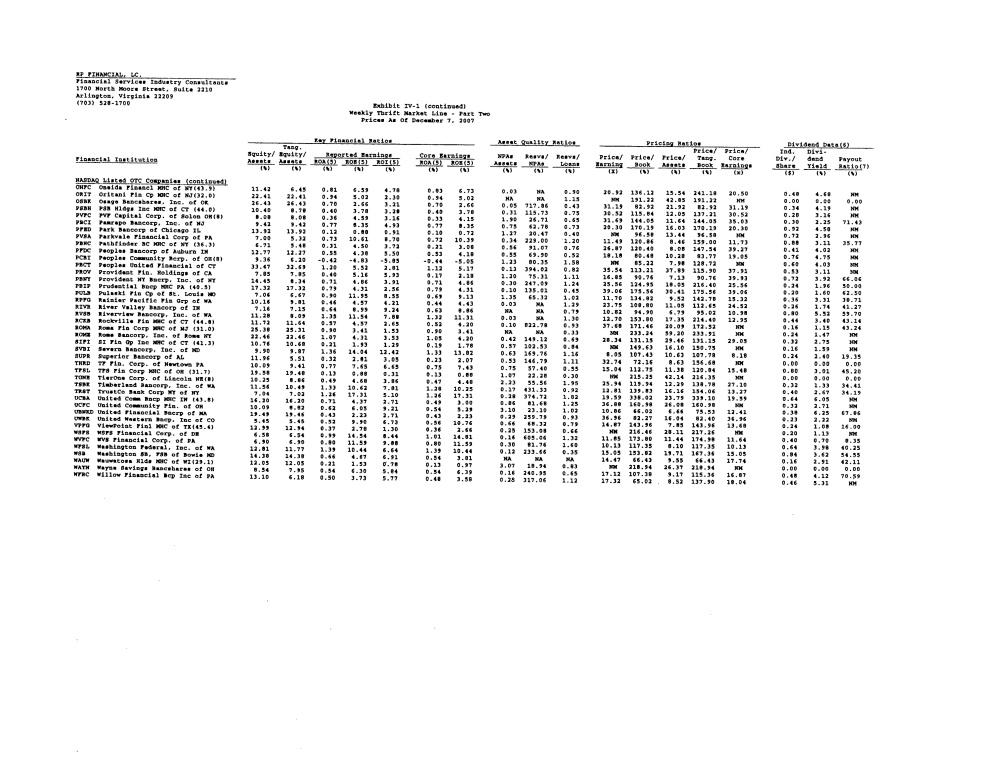
EXHIBIT IV-2
Historical Stock Price Indices
Exhibit IV-2
Historical Stock Price Indices(1)
|
|
|
|
|
|
|
|
|
|
|
|
|
Year/Qtr. Ended |
| DJIA |
| S&P 500 |
| NASDAQ |
| SNL |
| SNL |
| |
|
|
|
|
|
| |||||||
|
|
|
|
|
|
|
|
|
|
|
| |
1999: | Quarter 1 |
| 9786.2 |
| 1286.4 |
| 2,461.4 |
| 707.6 |
| 448.4 |
|
| Quarter 2 |
| 10970.8 |
| 1372.7 |
| 2,686.1 |
| 695.6 |
| 479.3 |
|
| Quarter 3 |
| 10337.0 |
| 1282.7 |
| 2,746.2 |
| 609.1 |
| 409.9 |
|
| Quarter 4 |
| 11497.1 |
| 1469.3 |
| 4,069.3 |
| 562.4 |
| 416.7 |
|
|
|
|
|
|
|
|
|
|
|
|
|
|
2000: | Quarter 1 |
| 10921.9 |
| 1498.6 |
| 4,572.8 |
| 545.6 |
| 421.2 |
|
| Quarter 2 |
| 10447.9 |
| 1454.6 |
| 3,966.1 |
| 567.8 |
| 387.4 |
|
| Quarter 3 |
| 10650.9 |
| 1436.5 |
| 3,672.8 |
| 718.3 |
| 464.6 |
|
| Quarter 4 |
| 10786.9 |
| 1320.3 |
| 2,470.5 |
| 874.3 |
| 479.4 |
|
|
|
|
|
|
|
|
|
|
|
|
|
|
2001: | Quarter 1 |
| 9878.8 |
| 1160.3 |
| 1,840.3 |
| 885.2 |
| 459.2 |
|
| Quarter 2 |
| 10502.4 |
| 1224.4 |
| 2,160.5 |
| 964.5 |
| 493.7 |
|
| Quarter 3 |
| 8847.6 |
| 1040.9 |
| 1,498.8 |
| 953.9 |
| 436.6 |
|
| Quarter 4 |
| 10021.5 |
| 1148.1 |
| 1,950.4 |
| 918.2 |
| 473.7 |
|
|
|
|
|
|
|
|
|
|
|
|
|
|
2002: | Quarter 1 |
| 10403.9 |
| 1147.4 |
| 1,845.4 |
| 1006.7 |
| 498.3 |
|
| Quarter 2 |
| 9243.3 |
| 989.8 |
| 1,463.2 |
| 1121.4 |
| 468.9 |
|
| Quarter 3 |
| 7591.9 |
| 815.3 |
| 1,172.1 |
| 984.3 |
| 396.8 |
|
| Quarter 4 |
| 8341.6 |
| 879.8 |
| 1,335.5 |
| 1073.2 |
| 419.1 |
|
|
|
|
|
|
|
|
|
|
|
|
|
|
2003: | Quarter 1 |
| 7992.1 |
| 848.2 |
| 1,341.2 |
| 1096.2 |
| 401.0 |
|
| Quarter 2 |
| 8985.4 |
| 974.5 |
| 1,622.8 |
| 1266.6 |
| 476.1 |
|
| Quarter 3 |
| 9275.1 |
| 996.0 |
| 1,786.9 |
| 1330.9 |
| 490.9 |
|
| Quarter 4 |
| 10453.9 |
| 1112.0 |
| 2,003.4 |
| 1482.3 |
| 548.6 |
|
|
|
|
|
|
|
|
|
|
|
|
|
|
2004: | Quarter 1 |
| 10357.7 |
| 1126.2 |
| 1,994.2 |
| 1585.3 |
| 562.2 |
|
| Quarter 2 |
| 10435.5 |
| 1140.8 |
| 2,047.8 |
| 1437.8 |
| 546.6 |
|
| Quarter 3 |
| 10080.3 |
| 1114.6 |
| 1,896.8 |
| 1495.1 |
| 556.0 |
|
| Quarter 4 |
| 10783.0 |
| 1211.9 |
| 2,175.4 |
| 1605.6 |
| 595.1 |
|
|
|
|
|
|
|
|
|
|
|
|
|
|
2005: | Quarter 1 |
| 10503.8 |
| 1180.6 |
| 1,999.2 |
| 1516.6 |
| 551.0 |
|
| Quarter 2 |
| 10275.0 |
| 1191.3 |
| 2,057.0 |
| 1577.1 |
| 563.3 |
|
| Quarter 3 |
| 10568.7 |
| 1228.8 |
| 2,151.7 |
| 1527.2 |
| 546.3 |
|
| Quarter 4 |
| 10717.5 |
| 1248.3 |
| 2,205.3 |
| 1616.4 |
| 582.8 |
|
|
|
|
|
|
|
|
|
|
|
|
|
|
2006: | Quarter 1 |
| 11109.3 |
| 1294.8 |
| 2,339.8 |
| 1661.1 |
| 595.5 |
|
| Quarter 2 |
| 11150.2 |
| 1270.2 |
| 2,172.1 |
| 1717.9 |
| 601.1 |
|
| Quarter 3 |
| 11679.1 |
| 1335.9 |
| 2,258.4 |
| 1727.1 |
| 634.0 |
|
| Quarter 4 |
| 12463.2 |
| 1418.3 |
| 2,415.3 |
| 1829.3 |
| 658.6 |
|
|
|
|
|
|
|
|
|
|
|
|
|
|
2007: | Quarter 1 |
| 12354.4 |
| 1420.9 |
| 2,421.6 |
| 1703.6 |
| 634.4 |
|
| Quarter 2 |
| 13408.6 |
| 1503.4 |
| 2,603.2 |
| 1645.9 |
| 622.6 |
|
| Quarter 3 |
| 13895.6 |
| 1526.8 |
| 2,701.5 |
| 1523.3 |
| 595.8 |
|
| As of Dec. 7, 2007 |
| 13625.6 |
| 1504.7 |
| 2,706.2 |
| 1184.2 |
| 535.4 |
|
|
|
(1) | End of period data. |
Sources: SNL Financial and The Wall Street Journal.
EXHIBIT IV-3
Historical Thrift Stock Indices
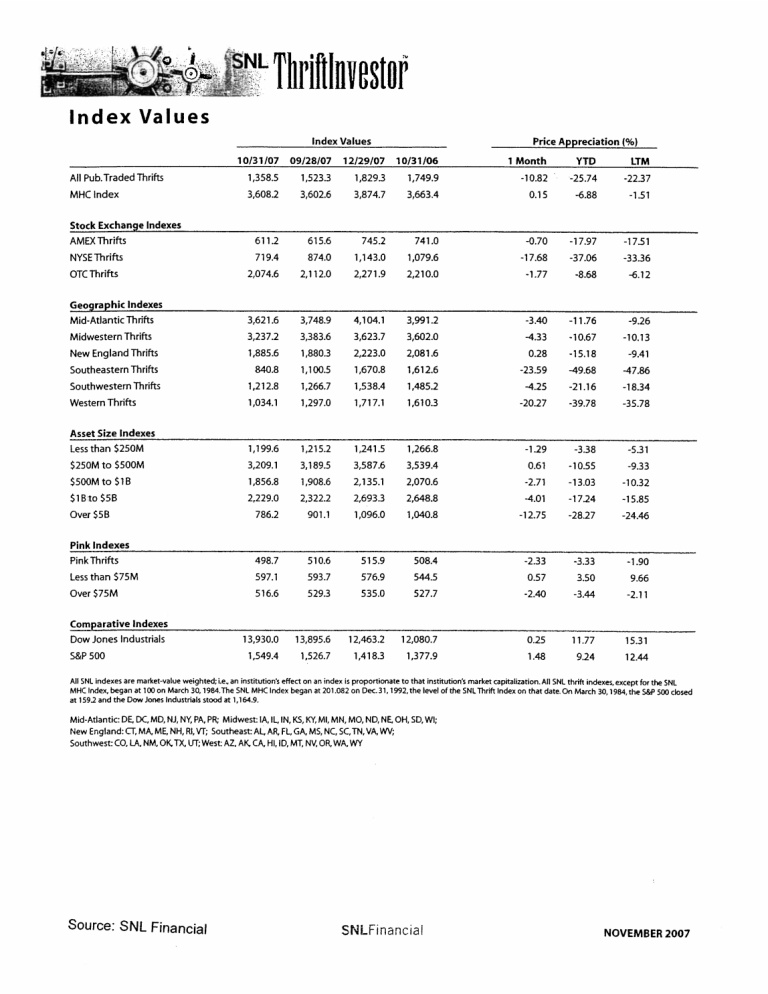
EXHIBIT IV-4
Market Area Acquisition Activity
RP®Financial, LC.
Exhibit IV-4
Pennsylvania Thrift Acquisitions 2004-Present
|
|
|
|
|
|
|
|
|
|
|
|
|
|
|
|
|
|
|
|
|
|
|
|
|
|
|
|
|
|
|
|
|
|
|
|
| Target Financials at Announcement | ||||||||||||||||||
|
|
|
|
|
|
|
|
| |||||||||||||||||||
Announce |
| Complete |
| Buyer Short Name |
| Target Name |
|
|
| Total |
| E/A |
| ROAA |
| ROAE |
| NPAs/ |
| Rsrvs/ | |||||||
|
|
|
|
|
|
|
|
|
|
| |||||||||||||||||
| |||||||||||||||||||||||||||
09/06/2007 |
| Pending |
| National Penn Bancshares Inc. | PA | KNBT Bancorp, Inc. |
|
| PA |
|
| 2,888,789 |
|
| 12.19 |
|
| 0.52 |
|
| 4.17 |
|
| 0.15 |
|
| 407.84 |
04/27/2006 |
| 08/28/2006 |
| First Commonwealth Financial | PA | Laurel Capital Group, Inc. |
|
| PA |
|
| 314,295 |
|
| 8.85 |
|
| 0.61 |
|
| 6.78 |
|
| 0.21 |
|
| 298.95 |
04/13/2006 |
| 09/11/2006 |
| Allegheny Valley Bancorp Inc. | PA | RSV Bancorp, Inc. |
|
| PA |
|
| 77,741 |
|
| 12.81 |
|
| 0.93 |
|
| 7.27 |
|
| 0.32 |
|
| 168.29 |
09/06/2005 |
| 01/26/2006 |
| National Penn Bancshares Inc. | PA | Nittany Financial Corp. |
|
| PA |
|
| 326,517 |
|
| 7.23 |
|
| 1.20 |
|
| 16.01 |
|
| NA |
|
| NA |
12/08/2004 |
| 05/19/2005 |
| KNBT Bancorp Inc. | PA | Northeast Pennsylvania Financial Corp. |
|
| PA |
|
| 836,011 |
|
| 6.99 |
|
| 0.59 |
|
| 8.62 |
|
| 0.86 |
|
| 122.96 |
08/12/2004 |
| 02/11/2005 |
| ESB Financial Corp. | PA | PHSB Financial Corp. |
|
| PA |
|
| 323,003 |
|
| 14.06 |
|
| 0.91 |
|
| 6.70 |
|
| NA |
|
| NA |
03/08/2004 |
| 01/21/2005 |
| Sovereign Bancorp Inc. | PA | Waypoint Financial Corp. |
|
| PA |
|
| 5,329,902 |
|
| 7.55 |
|
| 0.77 |
|
| 9.95 |
|
| 0.18 |
|
| 326.57 |
|
|
|
|
|
|
|
|
|
|
|
|
|
|
|
|
|
|
|
|
|
|
|
|
|
|
|
|
|
|
|
|
|
| Averages: |
|
|
| 1,442,323 |
|
| 9.95 |
|
| 0.79 |
|
| 8.50 |
|
| 0.34 |
|
| 264.92 | ||
|
|
|
|
|
| Medians: |
|
|
| 326,517 |
|
| 8.85 |
|
| 0.77 |
|
| 7.27 |
|
| 0.21 |
|
| 298.95 | ||
|
|
|
|
|
|
|
|
|
|
|
|
|
|
|
|
|
|
|
|
|
|
|
|
|
|
|
|
|
|
|
|
|
|
|
|
|
|
|
|
| Deal Terms and Pricing at Announcement | ||||||||||||||||||||
|
|
|
|
|
|
|
|
|
| |||||||||||||||||||||
Announce |
| Complete |
| Buyer Short Name |
| Target Name |
|
|
| Deal |
| Value/ |
| P/B |
| P/TB |
| P/E |
| P/A |
| Prem/ | ||||||||
|
|
|
|
|
|
|
|
|
|
|
| |||||||||||||||||||
| ||||||||||||||||||||||||||||||
09/06/2007 |
| Pending |
| National Penn Bancshares Inc. | PA | KNBT Bancorp, Inc. |
|
| PA |
|
| 460.1 |
|
| 17.119 |
|
| 126.34 |
|
| 204.67 |
|
| 22.82 |
|
| 15.93 |
|
| 13.14 |
04/27/2006 |
| 08/28/2006 |
| First Commonwealth Financial | PA | Laurel Capital Group, Inc. |
|
| PA |
|
| 57.5 |
|
| 28.250 |
|
| 202.22 |
|
| 227.64 |
|
| 28.25 |
|
| 18.29 |
|
| 13.94 |
04/13/2006 |
| 09/11/2006 |
| Allegheny Valley Bancorp Inc. | PA | RSV Bancorp, Inc. |
|
| PA |
|
| 16.6 |
|
| 29.000 |
|
| 159.96 |
|
| 159.96 |
|
| 31.52 |
|
| 21.29 |
|
| 14.03 |
09/06/2005 |
| 01/26/2006 |
| National Penn Bancshares Inc. | PA | Nittany Financial Corp. |
|
| PA |
|
| 97.8 |
|
| 41.750 |
|
| 373.86 |
|
| 404.17 |
|
| 25.15 |
|
| 29.95 |
|
| 52.62 |
12/08/2004 |
| 05/19/2005 |
| KNBT Bancorp Inc. | PA | Northeast Pennsylvania Financial Corp. |
|
| PA |
|
| 98.7 |
|
| 23.000 |
|
| 156.46 |
|
| 190.24 |
|
| 18.25 |
|
| 11.80 |
|
| 16.21 |
08/12/2004 |
| 02/11/2005 |
| ESB Financial Corp. | PA | PHSB Financial Corp. |
|
| PA |
|
| 82.6 |
|
| 27.000 |
|
| 172.52 |
|
| 172.52 |
|
| 25.71 |
|
| 25.58 |
|
| 19.96 |
03/08/2004 |
| 01/21/2005 |
| Sovereign Bancorp Inc. | PA | Waypoint Financial Corp. |
|
| PA |
|
| 995.7 |
|
| 28.100 |
|
| 232.23 |
|
| 244.77 |
|
| 22.30 |
|
| 18.68 |
|
| 28.89 |
|
|
|
|
|
|
|
|
|
|
|
|
|
|
|
|
|
|
|
|
|
|
|
|
|
|
|
|
|
|
|
|
|
|
|
|
| Averages: |
|
|
| 258.4 |
|
|
|
|
| 203.37 |
|
| 229.14 |
|
| 24.86 |
|
| 20.22 |
|
| 22.68 | ||
|
|
|
|
|
| Medians: |
|
|
| 97.8 |
|
|
|
|
| 172.52 |
|
| 204.67 |
|
| 25.15 |
|
| 18.68 |
|
| 16.21 | ||
EXHIBIT IV-5
Malvern Federal Savings Bank
Director and Senior Management Summary Resumes
Exhibit IV-5
Malvern Federal Savings Bank
Director and Senior Management Summary Resumes
|
|
|
|
|
|
|
|
|
Name |
| Age |
| Position with Malvern Federal Savings Bank |
| Director of |
| Year Term as |
|
|
|
| |||||
Ronald Anderson |
| 51 |
| President and Chief Executive Officer of Malvern Federal Savings Bank since September 2002. Previously, Executive Vice President and Chief Executive Officer of Malvern Federal Savings Bank from September 2001 to September 2002. |
| 2006 |
| 2010 |
|
|
|
|
|
|
|
|
|
F. Claire Hughes, Jr. |
| 63 |
| Chairman of the Board. Retired since January 2007. Previously Vice President, General Manager and Treasurer of Matthews Ford and President of Matthews Leasing Company, Paoli, Pennsylvania. |
| 2001 |
| 2010 |
|
|
|
|
|
|
|
|
|
John B. Yerkes, Jr. |
|
|
| Vice Chairman of the Board. Principal and Chief Executive Officer of Yerkes Associates, Inc., Consulting Civil Engineers, since 1961 and Principal of Ext Level Mapping, C.I.S. Consultants, West Chester, Pennsylvania |
| 1975 |
| 2009 |
|
|
|
|
|
|
|
|
|
Joseph E. Palmer, Jr. |
| 67 |
| Director. Co-owner and manager of Palmer Group Properties, a real estate investment and management company located in Paoli, Pennsylvania since 1994. |
| 1986 |
| 2009 |
|
|
|
|
|
|
|
|
|
David R. Prizer |
| 78 |
| Director. Retired. Previously, owner of Prizer Associates, Inc., Pottstown, Pennsylvania. |
| 1977 |
| 2008 |
|
|
|
|
|
|
|
|
|
Cordine Scartozzi |
| 84 |
| Director. Retired. Previously, President of Paoli Hardware Center from 2001 to 2006. |
| 1977 |
| 2008 |
|
|
|
|
|
|
|
|
|
Edward P. Shanaughy, II |
| 77 |
| Director. Owner of Our Deli, Paoli, Pennsylvania. Previously, Mr. Shanaughy owned and operated 28 meat/butcher stores in New York, Delaware, New Jersey and Pennsylvania. |
| 1986 |
| 2010 |
|
|
|
|
|
|
|
|
|
Kristin S. Camp |
| 38 |
| Director. Partner at Buckley, Brion, McGuire & Morris LLP, West Chester, Pennsylvania since 1996. |
| 2007 |
| 2008 |
|
|
|
|
|
|
|
|
|
George E. Steinmetz |
| 47 |
| Director. Owner, Matthews Paoli Ford, an automobile dealership, Paoli, Pennsylvania since 2002. Previously, Vice President Automobile, Carmax, _________, Pennsylvania from 1995 to 2002. |
| 2007 |
| 2008 |
Exhibit IV-5 (continued)
Malvern Federal Savings Bank
Director and Senior Management Summary Resumes
Executive Officers Who Are Not Also Directors
Dennis Boyle, who is 55 years old, currently is Senior Vice President, Treasurer and Chief Financial Officer of Malvern Federal Savings Bank since January 1999. Previously, Mr. Boyle served as Vice President and Treasurer of Malvern Federal Savings Bank since December 1987 and has served in various other capacities including Controller and Accountant with Malvern Federal Savings Bank since 1974.
William E. Hughes, Jr., who is 50 years old, is currently Senior Vice President and Chief Lending Officer of Malvern Federal Savings Bank since February 1977.
Gerard M. McTear, Jr., who is 44 years old, currently serves as Chief Administrative Officer since June 2007. Previously, Mr. McTear served as Executive Vice President and Chief Operating Officer from July 2002 to June 2007. Prior thereto, Mr. McTear served as Human Resources, Security, Retail Banking Manager since January 2002.
EXHIBIT IV-6
Malvern Federal Savings Bank
Pro Forma Regulatory Capital Ratios
Exhibit IV-6
Malvern Federal Savings Bank
Pro Forma Regulatory Capital Ratios
|
|
|
|
|
|
|
|
|
|
|
|
|
|
|
|
|
|
|
|
|
|
|
|
|
|
|
|
|
|
|
|
|
| Malvern Federal |
|
|
| ||||||||||||||||||||||||||
|
|
| Pro Forma at September 30, 2007 Based on |
| |||||||||||||||||||||||||||
|
|
|
| ||||||||||||||||||||||||||||
|
|
| 2,558,500 Shares Sold at |
| 3,010,000 Shares Sold at |
| 3,461,500 Shares Sold at |
| 3,980,725 Shares Sold at |
| |||||||||||||||||||||
|
|
|
|
|
|
| |||||||||||||||||||||||||
|
| Amount |
| Percent of |
| Amount |
| Percent of |
| Amount |
| Percent of |
| Amount |
| Percent of |
| Amount |
| Percent of |
| ||||||||||
|
|
|
|
|
|
|
|
|
|
|
| ||||||||||||||||||||
|
| (Dollars in Thousands) |
| ||||||||||||||||||||||||||||
Capital at Bank Level: |
|
|
|
|
|
|
|
|
|
|
|
|
|
|
|
|
|
|
|
|
|
|
|
|
|
|
|
|
|
|
|
GAAP capital |
| $ | 44,039 |
|
| 7.98 | % | $ | 53,863 |
|
| 9.55 | % | $ | 55,688 |
|
| 9.83 | % | $ | 57,513 |
|
| 10.12 | % | $ | 59,613 |
|
| 10.44 | % |
|
|
|
|
|
|
|
|
|
|
|
| ||||||||||||||||||||
Tier 1 risk-based capital: |
|
|
|
|
|
|
|
|
|
|
|
|
|
|
|
|
|
|
|
|
|
|
|
|
|
|
|
|
|
|
|
Actual |
| $ | 44,322 |
|
| 8.03 | % | $ | 54,146 |
|
| 9.60 | % | $ | 55,971 |
|
| 9.88 | % | $ | 57,796 |
|
| 10.17 | % | $ | 59,896 |
|
| 10.49 | % |
Requirement |
|
| 8,278 |
|
| 1.50 |
|
| 8,461 |
|
| 1.50 |
|
| 8,494 |
|
| 1.50 |
|
| 8,528 |
|
| 1.50 |
|
| 8,566 |
|
| 1.50 |
|
|
|
|
|
|
|
|
|
|
|
|
| ||||||||||||||||||||
Excess |
| $ | 36,044 |
|
| 6.53 | % | $ | 45,685 |
|
| 8.10 | % | $ | 47,477 |
|
| 8.38 | % | $ | 49,268 |
|
| 8.67 | % | $ | 51,329 |
|
| 8.99 | % |
|
|
|
|
|
|
|
|
|
|
|
| ||||||||||||||||||||
|
|
|
|
|
|
|
|
|
|
|
|
|
|
|
|
|
|
|
|
|
|
|
|
|
|
|
|
|
|
|
|
Core capital: |
|
|
|
|
|
|
|
|
|
|
|
|
|
|
|
|
|
|
|
|
|
|
|
|
|
|
|
|
|
|
|
Actual |
| $ | 44,322 |
|
| 8.03 | % | $ | 54,146 |
|
| 9.60 | % | $ | 55,971 |
|
| 9.88 | % | $ | 57,796 |
|
| 10.17 | % | $ | 59,896 |
|
| 10.49 | % |
Requirement |
|
| 22,075 |
|
| 4.00 |
|
| 22,561 |
|
| 4.00 |
|
| 22,651 |
|
| 4.00 |
|
| 22,740 |
|
| 4.00 |
|
| 22,843 |
|
| 4.00 |
|
|
|
|
|
|
|
|
|
|
|
|
| ||||||||||||||||||||
Excess |
| $ | 22,247 |
|
| 4.03 | % | $ | 31,585 |
|
| 5.60 | % | $ | 33,320 |
|
| 5.88 | % | $ | 35,056 |
|
| 6.17 | % | $ | 37,053 |
|
| 6.49 | % |
|
|
|
|
|
|
|
|
|
|
|
| ||||||||||||||||||||
|
|
|
|
|
|
|
|
|
|
|
|
|
|
|
|
|
|
|
|
|
|
|
|
|
|
|
|
|
|
|
|
Tier 1 risk-based capital: |
|
|
|
|
|
|
|
|
|
|
|
|
|
|
|
|
|
|
|
|
|
|
|
|
|
|
|
|
|
|
|
Actual |
| $ | 44,322 |
|
| 10.36 | % | $ | 54,146 |
|
| 12.59 | % | $ | 55,971 |
|
| 13.00 | % | $ | 57,796 |
|
| 13.41 | % | $ | 59,896 |
|
| 13.88 | % |
Requirement |
|
| 17,105 |
|
| 4.00 |
|
| 17,202 |
|
| 4.00 |
|
| 17,220 |
|
| 4.00 |
|
| 17,238 |
|
| 4.00 |
|
| 17,258 |
|
| 4.00 |
|
|
|
|
|
|
|
|
|
|
|
|
| ||||||||||||||||||||
Excess |
| $ | 27,217 |
|
| 6.36 | % | $ | 36,944 |
|
| 8.59 | % | $ | 38,751 |
|
| 9.00 | % | $ | 40,559 |
|
| 9.41 | % | $ | 42,637 |
|
| 9.88 | % |
|
|
|
|
|
|
|
|
|
|
|
| ||||||||||||||||||||
|
|
|
|
|
|
|
|
|
|
|
|
|
|
|
|
|
|
|
|
|
|
|
|
|
|
|
|
|
|
|
|
Total risk based capital |
| $ | 48,863 |
|
| 11.43 | % | $ | 58,687 |
|
| 13.65 | % | $ | 60,512 |
|
| 14.06 | % | $ | 62,337 |
|
| 14.47 | % | $ | 64,437 |
|
| 14.93 | % |
Risk-based requirement |
|
| 34,209 |
|
| 8.00 |
|
| 34,404 |
|
| 8.00 |
|
| 34,440 |
|
| 8.00 |
|
| 34,475 |
|
| 8.00 |
|
| 34,517 |
|
| 8.00 |
|
|
|
|
|
|
|
|
|
|
|
|
| ||||||||||||||||||||
Excess |
| $ | 14,654 |
|
| 3.43 | % | $ | 24,283 |
|
| 5.65 | % | $ | 26,072 |
|
| 6.06 | % | $ | 27,862 |
|
| 6.47 | % | $ | 29,920 |
|
| 6.93 | % |
|
|
|
|
|
|
|
|
|
|
|
| ||||||||||||||||||||
|
|
|
|
|
|
|
|
|
|
|
|
|
|
|
|
|
|
|
|
|
|
|
|
|
|
|
|
|
|
|
|
Reconciliation of Capital Infused into Malvern Federal Savings Bank: |
|
|
|
|
|
|
|
|
|
|
|
|
|
|
|
|
|
|
|
|
|
|
|
|
|
|
|
|
|
|
|
Net proceeds infused |
|
|
|
|
|
|
| $ | 12,156 |
|
|
|
| $ | 14,393 |
|
|
|
| $ | 16,630 |
|
|
|
| $ | 19,203 |
|
|
|
|
Less: |
|
|
|
|
|
|
|
|
|
|
|
|
|
|
|
|
|
|
|
|
|
|
|
|
|
|
|
|
|
|
|
Common stock acquired by employee stock ownership plan |
|
|
|
|
|
|
|
| (2,332 | ) |
|
|
|
| (2,744 | ) |
|
|
|
| (3,156 | ) |
|
|
|
| (3,629 | ) |
|
|
|
|
|
|
|
|
|
|
|
|
|
|
|
|
|
|
|
|
|
|
|
|
|
|
| ||||||||
Pro forma increase in GAAP and regulatory capital |
|
|
|
|
|
|
| $ | 9,824 |
|
|
|
| $ | 11,649 |
|
|
|
| $ | 13,474 |
|
|
|
| $ | 15,574 |
|
|
|
|
|
|
|
|
|
|
|
|
|
|
|
|
|
|
|
|
|
|
|
|
|
|
|
| ||||||||
|
|
(1) | Adjusted total or adjusted risk-weighted assets, as appropriate. |
Source: Malvern Federal’s prospectus.
EXHIBIT IV-7
Malvern Federal Savings Bank
Pro Forma Analysis Sheets – Full Conversion Basis
Exhibit IV-7
PRO FORMA ANALYSIS SHEET
Malvern Federal Savings Bank
Prices as of December 7, 2007
|
|
|
|
|
|
|
|
|
|
|
|
|
|
|
|
|
|
|
|
|
|
| Peer Group |
| Pennsylvania Companies |
| All Publicly-Traded | ||||||
|
|
|
|
|
|
|
| |||||||||
Price Multiple |
| Symbol |
| Subject (1) |
| Average |
| Median |
| Average |
| Median |
| Average |
| Median |
|
|
|
|
|
|
|
| |||||||||
Price-earnings ratio (x) |
| P/E |
| 24.94 | x | 28.33x |
| 28.72x |
| 18.19x |
| 15.04x |
| 20.53x |
| 19.59x |
Price-core earnings ratio (x) |
| P/Core |
| 24.90 | x | 28.23x |
| 28.72x |
| 18.74x |
| 16.51x |
| 21.00x |
| 19.77x |
Price-book ratio (%) | = | P/B |
| 67.93% |
| 86.51% |
| 83.99% |
| 93.78% |
| 96.15% |
| 117.66% |
| 108.07% |
Price-tangible book ratio (%) | = | P/TB |
| 67.93% |
| 89.49% |
| 88.89% |
| 121.31% |
| 117.35% |
| 133.26% |
| 124.38% |
Price-assets ratio (%) | = | P/A |
| 11.46% |
| 22.53% |
| 18.17% |
| 9.77% |
| 8.10% |
| 15.21% |
| 12.25% |
Valuation Parameters
|
|
|
|
|
|
|
|
|
Pre-Conversion Earnings (Y) |
| $2,412,000 |
| ESOP Stock Purchases (E) |
| 8.00% |
| (5) |
Pre-Conversion Earnings (CY) |
| $2,417,000 |
| Cost of ESOP Borrowings (S) |
| 0.00% |
| (4) |
Pre-Conversion Book Value (B) |
| $44,039,000 |
| ESOP Amortization (T) |
| 15.00 |
| years |
Pre-Conv. Tang. Book Val. (TB) |
| $44,039,000 |
| RRP Amount (M) |
| 4.00% |
|
|
Pre-Conversion Assets (A) |
| $551,932,000 |
| RRP Vesting (N) |
| 5.00 |
| years (5) |
Reinvestment Rate(2)(R) |
| 4.05% |
| Foundation (F) |
| 2.00% |
|
|
Est. Conversion Expenses (3)(X) |
| 2.50% |
| Tax Benefit (Z) |
| 539,000 |
|
|
Tax Rate (TAX) |
| 38.50% |
| Percentage Sold (PCT) |
| 100.00% |
|
|
|
|
|
| Option (O1) |
| 10.00% |
| (6) |
|
|
|
| Estimated Option Value (O2) |
| 38.60% |
| (6) |
|
|
|
| Option vesting (O3) |
| 5.00 |
| (6) |
|
|
|
| Option pct taxable (O4) |
| 25.00% |
| (6) |
Calculation of Pro Forma Value After Conversion
|
|
|
|
|
|
|
1. | V= | P/E * (Y) |
|
| V= | $70,000,000 |
|
| 1 - P/E * PCT * ((1-X-E-M-F)*R*(1-TAX) - (1-TAX)*E/T - (1-TAX)*M/N) - (1-(TAX*O4))*(O1*O2)/O3) |
|
|
| |
|
|
|
|
|
|
|
2. | V= | P/Core * (Y) |
|
| V= | $70,000,000 |
|
| 1 - P/core * PCT * ((1-X-E-M-F)*R*(1-TAX) - (1-TAX)*E/T - (1-TAX)*M/N) - (1-(TAX*O4))*(O1*O2)/O3) |
|
|
| |
|
|
|
|
|
|
|
3. | V= | P/B * (B+Z) |
|
| V= | $70,000,000 |
|
| 1 - P/B * PCT * (1-X-E-M-F) |
|
|
| |
|
|
|
|
|
|
|
4. | V= | P/TB * (TB+Z) |
|
| V= | $70,000,000 |
|
| 1 - P/TB * PCT * (1-X-E-M-F) |
|
|
| |
|
|
|
|
|
|
|
5. | V= | P/A * (A+Z) |
|
| V= | $70,000,000 |
|
| 1 - P/A * PCT * (1-X-E-M-F) |
|
|
| |
|
|
|
|
|
|
|
|
|
|
|
|
|
|
|
|
|
|
|
|
Conclusion |
| Shares Issued |
| Price Per |
| Gross Offering |
| Shares |
| Total Shares |
| Aggregate |
| ||||||
|
|
|
|
|
|
| |||||||||||||
Supermaximum |
|
| 9,072,350 |
|
| 10.00 |
| $ | 90,723,505 |
|
| 185,150 |
|
| 9,257,500 |
| $ | 92,575,000 |
|
Maximum |
|
| 7,889,000 |
|
| 10.00 |
|
| 78,890,000 |
|
| 161,000 |
|
| 8,050,000 |
|
| 80,500,000 |
|
Midpoint |
|
| 6,860,000 |
|
| 10.00 |
|
| 68,600,000 |
|
| 140,000 |
|
| 7,000,000 |
|
| 70,000,000 |
|
Minimum |
|
| 5,831,000 |
|
| 10.00 |
|
| 58,310,000 |
|
| 119,000 |
|
| 5,950,000 |
|
| 59,500,000 |
|
|
|
(1) | Pricing ratios shown reflect the midpoint value. |
(2) | Net return reflects a reinvestment rate of 4.05 percent and a tax rate of 38.5 percent. |
(3) | Offering expenses shown at estimated midpoint value. |
(4) | No cost is applicable since holding company will fund the ESOP loan. |
(5) | ESOP and MRP amortize over 15 years and 5 years, respectively; amortization expenses tax effected at 38.5 percent. |
(6) | 10 percent option plan with an estimated Black-Scholes valuation of 38.60 percent of the exercise price, including a 5 year vesting with 25 percent of the options (granted to directors) tax effected at 38.5 percent. |
EXHIBIT IV-8
Malvern Federal Savings Bank
Pro Forma Effect of Conversion Proceeds – Full Conversion Basis
Exhibit IV-8
PRO FORMA EFFECT OF CONVERSION PROCEEDS
Malvern Federal Savings Bank
At the Maximum Value
|
|
|
|
|
|
1. | Pro Forma Market Capitalization |
| $ | 80,500,000 |
|
| Less: Foundation Shares |
|
| 1,610,000 |
|
|
|
|
| ||
2. | Offering Proceeds |
| $ | 78,890,000 |
|
| Less: Estimated Offering Expenses |
|
| 1,972,250 |
|
|
|
|
| ||
| Net Conversion Proceeds |
| $ | 76,917,750 |
|
|
|
|
|
|
|
3. | Estimated Additional Income from Conversion Proceeds |
|
|
|
|
|
|
|
|
|
|
| Net Conversion Proceeds |
| $ | 76,917,750 |
|
| Less: Cash Contribution to Foundation |
|
| 0 |
|
| Less: Non-Cash Stock Purchases (1) |
|
| 9,660,000 |
|
|
|
|
| ||
| Net Proceeds Reinvested |
| $ | 67,257,750 |
|
| Estimated net incremental rate of return |
|
| 2.49 | % |
|
|
|
| ||
| Reinvestment Income |
| $ | 1,675,222 |
|
| Less: Estimated cost of ESOP borrowings (2) |
|
| 0 |
|
| Less: Amortization of ESOP borrowings (3) |
|
| 264,040 |
|
| Less: Amortization of Options (4) |
|
| 561,644 |
|
| Less: Recognition Plan Vesting (5) |
|
| 396,060 |
|
|
|
|
| ||
| Net Earnings Impact |
| $ | 453,478 |
|
|
|
|
|
|
|
|
|
|
|
|
|
|
|
|
4. | Pro Forma Earnings |
|
|
| Before |
| Net |
| After |
| ||||
|
|
|
|
|
|
|
| |||||||
|
|
|
|
|
|
|
|
|
|
| ||||
| 12 Months ended September 30, 2007 (reported) |
|
|
|
| $ | 2,412,000 |
| $ | 453,478 |
| $ | 2,865,478 |
|
| 12 Months ended September 30, 2007 (core) |
|
|
|
| $ | 2,417,000 |
| $ | 453,478 |
| $ | 2,870,478 |
|
|
|
|
|
|
|
|
|
|
|
|
|
|
|
|
5. | Pro Forma Net Worth |
| Before |
| Net Cash |
| Tax Benefit |
| After |
| ||||
|
|
|
|
|
|
| ||||||||
|
|
|
|
|
|
|
|
|
|
| ||||
| September 30, 2007 |
| $ | 44,039,000 |
| $ | 67,257,750 |
| $ | 619,850 |
| $ | 111,916,600 |
|
| September 30, 2007 (Tangible) |
| $ | 44,039,000 |
| $ | 67,257,750 |
| $ | 619,850 |
| $ | 111,916,600 |
|
|
|
|
|
|
|
|
|
|
|
|
|
|
|
|
6. | Pro Forma Assets |
| Before |
| Net Cash |
| Tax Benefit |
| After |
| ||||
|
|
|
|
|
|
| ||||||||
|
|
|
|
|
|
|
|
|
|
|
|
|
|
|
| September 30, 2007 |
| $ | 551,932,000 |
| $ | 67,257,750 |
| $ | 619,850 |
| $ | 619,809,600 |
|
|
|
(1) | Includes ESOP and RRP stock purchases equal to 8.0 and 4.0 percent of total shares issued, respectively. |
(2) | ESOP stock purchases are internally financed by a loan from the holding company. |
(3) | ESOP borrowings are amortized over 15 years, amortization expense is tax-effected at a 38.5 percent rate. |
(4) | Option valuation based on Black-Scholes model, 5 year vesting, and assumes 25 percent is taxable. |
(5) | RRP is amortized over 5 years, and amortization expense is tax effected at 38.5 percent. |
Exhibit IV-8
PRO FORMA EFFECT OF CONVERSION PROCEEDS
Malvern Federal Savings Bank
At the Midpoint
|
|
|
|
|
|
1. | Pro Forma Market Capitalization |
| $ | 70,000,000 |
|
| Less: Foundation Shares |
|
| 1,400,000 |
|
|
|
|
| ||
2. | Offering Proceeds |
| $ | 68,600,000 |
|
| Less: Estimated Offering Expenses |
|
| 1,715,000 |
|
|
|
|
| ||
| Net Conversion Proceeds |
| $ | 66,885,000 |
|
|
|
|
|
|
|
3. | Estimated Additional Income from Conversion Proceeds |
|
|
|
|
|
|
|
|
|
|
| Net Conversion Proceeds |
| $ | 66,885,000 |
|
| Less: Cash Contribution to Foundation |
|
| 0 |
|
| Less: Non-Cash Stock Purchases (1) |
|
| 8,400,000 |
|
|
|
|
| ||
| Net Proceeds Reinvested |
| $ | 58,485,000 |
|
| Estimated net incremental rate of return |
|
| 2.49 | % |
|
|
|
| ||
| Reinvestment Income |
| $ | 1,456,715 |
|
| Less: Estimated cost of ESOP borrowings (2) |
|
| 0 |
|
| Less: Amortization of ESOP borrowings (3) |
|
| 229,600 |
|
| Less: Amortization of Options (4) |
|
| 488,387 |
|
| Less: Recognition Plan Vesting (5) |
|
| 344,400 |
|
|
|
|
| ||
| Net Earnings Impact |
| $ | 394,329 |
|
|
|
|
|
|
|
|
|
|
|
|
|
|
|
|
4. | Pro Forma Earnings |
|
|
| Before |
| Net |
| After |
| ||||
|
|
|
|
|
|
|
| |||||||
|
|
|
|
|
|
|
|
|
|
|
|
|
|
|
| 12 Months ended September 30, 2007 (reported) |
|
|
|
| $ | 2,412,000 |
| $ | 394,329 |
| $ | 2,806,329 |
|
| 12 Months ended September 30, 2007 (core) |
|
|
|
| $ | 2,417,000 |
| $ | 394,329 |
| $ | 2,811,329 |
|
|
|
|
|
|
|
|
|
|
|
|
|
|
|
|
5. | Pro Forma Net Worth |
| Before |
| Net Cash |
| Tax Benefit |
| After |
| ||||
|
|
|
|
|
|
| ||||||||
|
|
|
|
|
|
|
|
|
|
|
|
|
|
|
| September 30, 2007 |
| $ | 44,039,000 |
| $ | 58,485,000 |
| $ | 539,000 |
| $ | 103,063,000 |
|
| September 30, 2007 (Tangible) |
| $ | 44,039,000 |
| $ | 58,485,000 |
| $ | 539,000 |
| $ | 103,063,000 |
|
|
|
|
|
|
|
|
|
|
|
|
|
|
|
|
6. | Pro Forma Assets |
| Before |
| Net Cash |
| Tax Benefit |
| After |
| ||||
|
|
|
|
|
|
| ||||||||
|
|
|
|
|
|
|
|
|
|
| ||||
| September 30, 2007 |
| $ | 551,932,000 |
| $ | 58,485,000 |
| $ | 539,000 |
| $ | 610,956,000 |
|
|
|
(1) | Includes ESOP and RRP stock purchases equal to 8.0 and 4.0 percent of total shares issued, respectively. |
(2) | ESOP stock purchases are internally financed by a loan from the holding company. |
(3) | ESOP borrowings are amortized over 15 years, amortization expense is tax-effected at a 38.5 percent rate. |
(4) | Option valuation based on Black-Scholes model, 5 year vesting, and assumes 25 percent is taxable. |
(5) | RRP is amortized over 5 years, and amortization expense is tax effected at 38.5 percent. |
Exhibit IV-8
PRO FORMA EFFECT OF CONVERSION PROCEEDS
Malvern Federal Savings Bank
At the Minimum
|
|
|
|
|
|
1. | Pro Forma Market Capitalization |
| $ | 59,500,000 |
|
| Less: Foundation Shares |
|
| 1,190,000 |
|
|
|
|
| ||
2. | Offering Proceeds |
| $ | 58,310,000 |
|
| Less: Estimated Offering Expenses |
|
| 1,457,750 |
|
|
|
|
| ||
| Net Conversion Proceeds |
| $ | 56,852,250 |
|
|
|
|
|
|
|
3. | Estimated Additional Income from Conversion Proceeds |
|
|
|
|
|
|
|
|
|
|
| Net Conversion Proceeds |
| $ | 56,852,250 |
|
| Less: Cash Contribution to Foundation |
|
| 0 |
|
| Less: Non-Cash Stock Purchases (1) |
|
| 7,140,000 |
|
|
|
|
| ||
| Net Proceeds Reinvested |
| $ | 49,712,250 |
|
| Estimated net incremental rate of return |
|
| 2.49 | % |
|
|
|
| ||
| Reinvestment Income |
| $ | 1,238,208 |
|
| Less: Estimated cost of ESOP borrowings (2) |
|
| 0 |
|
| Less: Amortization of ESOP borrowings (3) |
|
| 195,160 |
|
| Less: Amortization of Options (4) |
|
| 415,129 |
|
| Less: Recognition Plan Vesting (5) |
|
| 292,740 |
|
|
|
|
| ||
| Net Earnings Impact |
| $ | 335,179 |
|
|
|
|
|
|
|
|
|
|
|
|
|
|
|
|
4. | Pro Forma Earnings |
|
|
| Before |
| Net |
| After |
| ||||
|
|
|
|
|
|
|
| |||||||
| ||||||||||||||
| 12 Months ended September 30, 2007 (reported) |
|
|
|
| $ | 2,412,000 |
| $ | 335,179 |
| $ | 2,747,179 |
|
| 12 Months ended September 30, 2007 (core) |
|
|
|
| $ | 2,417,000 |
| $ | 335,179 |
| $ | 2,752,179 |
|
|
|
|
|
|
|
|
|
|
|
|
|
|
|
|
5. | Pro Forma Net Worth |
| Before |
| Net Cash |
| Tax Benefit |
| After |
| ||||
|
|
|
|
|
|
| ||||||||
|
|
|
|
|
|
|
|
|
|
|
|
|
|
|
| September 30, 2007 |
| $ | 44,039,000 |
| $ | 49,712,250 |
| $ | 458,150 |
| $ | 94,209,400 |
|
| September 30, 2007 (Tangible) |
| $ | 44,039,000 |
| $ | 49,712,250 |
| $ | 458,150 |
| $ | 94,209,400 |
|
|
|
|
|
|
|
|
|
|
|
|
|
|
|
|
6. | Pro Forma Assets |
| Before |
| Net Cash |
| Tax Benefit |
| After |
| ||||
|
|
|
|
|
|
| ||||||||
|
|
|
|
|
|
|
|
|
|
|
|
|
|
|
| September 30, 2007 |
| $ | 551,932,000 |
| $ | 49,712,250 |
| $ | 458,150 |
| $ | 602,102,400 |
|
|
|
(1) | Includes ESOP and RRP stock purchases equal to 8.0 and 4.0 percent of total shares issued, respectively. |
(2) | ESOP stock purchases are internally financed by a loan from the holding company. |
(3) | ESOP borrowings are amortized over 15 years, amortization expense is tax-effected at a 38.5 percent rate. |
(4) | Option valuation based on Black-Scholes model, 5 year vesting, and assumes 25 percent is taxable. |
(5) | RRP is amortized over 5 years, and amortization expense is tax effected at 38.5 percent. |
Exhibit IV-8
PRO FORMA EFFECT OF CONVERSION PROCEEDS
Malvern Federal Savings Bank
At the Supermaximum Value
|
|
|
|
|
|
1. | Pro Forma Market Capitalization |
| $ | 92,575,000 |
|
| Less: Foundation Shares |
|
| 1,851,500 |
|
|
|
|
| ||
2. | Offering Proceeds |
| $ | 90,723,505 |
|
| Less: Estimated Offering Expenses |
|
| 2,268,088 |
|
|
|
|
| ||
| Net Conversion Proceeds |
| $ | 88,455,417 |
|
|
|
|
|
|
|
3. | Estimated Additional Income from Conversion Proceeds |
|
|
|
|
|
|
|
|
|
|
| Net Conversion Proceeds |
| $ | 88,455,417 |
|
| Less: Cash Contribution to Foundation |
|
| 0 |
|
| Less: Non-Cash Stock Purchases (1) |
|
| 11,109,000 |
|
|
|
|
| ||
| Net Proceeds Reinvested |
| $ | 77,346,417 |
|
| Estimated net incremental rate of return |
|
| 2.49 | % |
|
|
|
| ||
| Reinvestment Income |
| $ | 1,926,506 |
|
| Less: Estimated cost of ESOP borrowings (2) |
|
| 0 |
|
| Less: Amortization of ESOP borrowings (3) |
|
| 303,646 |
|
| Less: Amortization of Options (4) |
|
| 645,891 |
|
| Less: Recognition Plan Vesting (5) |
|
| 455,469 |
|
|
|
|
| ||
| Net Earnings Impact |
| $ | 521,500 |
|
|
|
|
|
|
|
|
|
|
|
|
|
|
|
|
4. | Pro Forma Earnings |
|
|
| Before |
| Net |
| After |
| ||||
|
|
|
|
|
|
|
| |||||||
|
|
|
|
|
|
|
|
|
|
| ||||
| 12 Months ended September 30, 2007 (reported) |
|
|
|
| $ | 2,412,000 |
| $ | 521,500 |
| $ | 2,933,500 |
|
| 12 Months ended September 30, 2007 (core) |
|
|
|
| $ | 2,417,000 |
| $ | 521,500 |
| $ | 2,938,500 |
|
|
|
|
|
|
|
|
|
|
|
|
|
|
|
|
5. | Pro Forma Net Worth |
| Before |
| Net Cash |
| Tax Benefit |
| After |
| ||||
|
|
|
|
|
|
| ||||||||
|
|
|
|
|
|
|
|
|
|
| ||||
| September 30, 2007 |
| $ | 44,039,000 |
| $ | 77,346,417 |
| $ | 712,828 |
| $ | 122,098,245 |
|
| September 30, 2007 (Tangible) |
| $ | 44,039,000 |
| $ | 77,346,417 |
| $ | 712,828 |
| $ | 122,098,245 |
|
|
|
|
|
|
|
|
|
|
|
|
|
|
|
|
6. | Pro Forma Assets |
| Before |
| Net Cash |
| Tax Benefit |
| After |
| ||||
|
|
|
|
|
|
| ||||||||
|
|
|
|
|
|
|
|
|
|
|
|
|
|
|
| September 30, 2007 |
| $ | 551,932,000 |
| $ | 77,346,417 |
| $ | 712,828 |
| $ | 629,991,245 |
|
|
|
(1) | Includes ESOP and RRP stock purchases equal to 8.0 and 4.0 percent of total shares issued, respectively. |
(2) | ESOP stock purchases are internally financed by a loan from the holding company. |
(3) | ESOP borrowings are amortized over 15 years, amortization expense is tax-effected at a 38.5 percent rate. |
(4) | Option valuation based on Black-Scholes model, 5 year vesting, and assumes 25 percent is taxable. |
(5) | RRP is amortized over 5 years, and amortization expense is tax effected at 38.5 percent. |
EXHIBIT IV-9
Peer Group Core Earnings Analysis
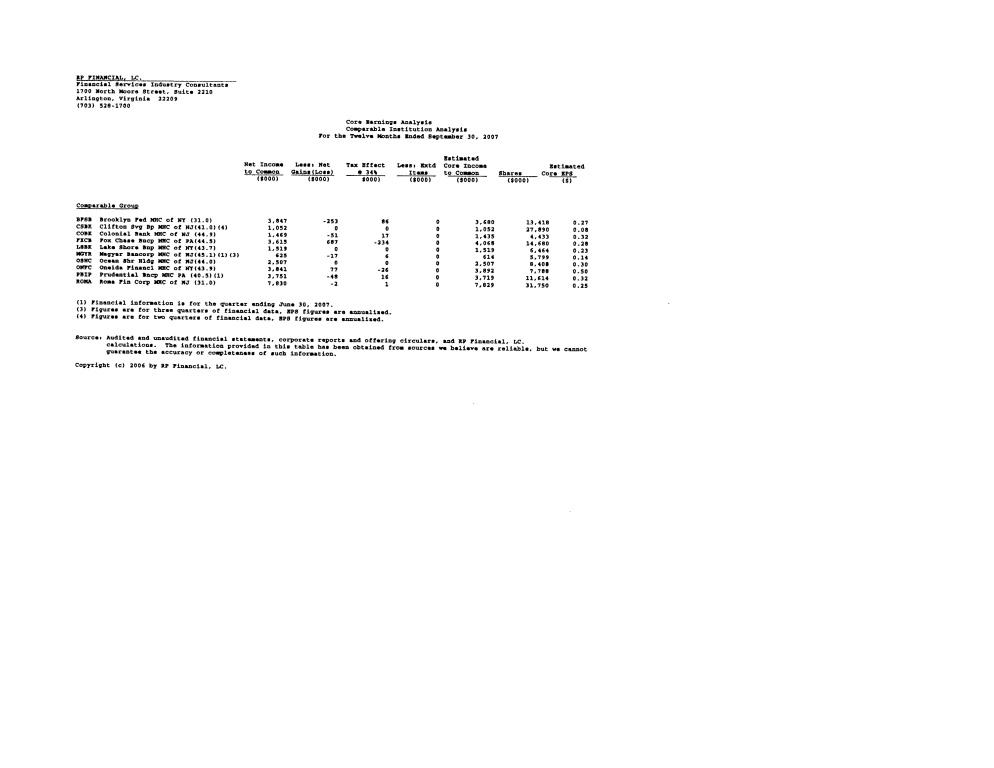
EXHIBIT IV-10
Pro Forma Analysis Sheets – MHC Conversion Basis
EXHIBIT IV-10
PRO FORMA ANALYSIS SHEET
Malvern Federal Savings Bank
December 7, 2007
|
|
|
|
|
|
|
|
|
|
|
|
|
|
|
|
|
|
|
|
|
|
| Peer Group |
| Pennsylvania Companies |
| All Publicly-Traded | ||||||
|
|
|
|
|
|
|
| |||||||||
Price Multiple |
| Symbol |
| Subject (1) |
| Average |
| Median |
| Average |
| Median |
| Average |
| Median |
|
|
|
|
|
|
|
| |||||||||
Price-earnings ratio (x) |
| P/E |
| 27.96 | x | 33.01x |
| 34.50x |
| 18.19x |
| 15.04x |
| 20.53x |
| 19.59x |
Price-core earnings ratio (x) |
| P/Core |
| 27.90 | x | 33.13x |
| 34.50x |
| 18.74x |
| 16.51x |
| 21.00x |
| 19.77x |
Price-book ratio (%) | = | P/B |
| 101.21% |
| 156.75% |
| 138.65% |
| 93.78% |
| 96.15% |
| 117.66% |
| 108.07% |
Price-tangible book ratio (%) | = | P/TB |
| 101.21% |
| 167.32% |
| 152.19% |
| 121.31% |
| 117.35% |
| 133.26% |
| 124.38% |
Price-assets ratio (%) | = | P/A |
| 12.13% |
| 26.68% |
| 19.94% |
| 9.77% |
| 8.10% |
| 15.21% |
| 12.25% |
Valuation Parameters
|
|
|
|
|
|
|
|
|
Pre-Conversion Earnings (Y) |
| $2,410,000 |
| ESOP Stock Purchases (E) |
| 8.71% |
| (5) |
Pre-Conversion Earnings (CY) |
| $2,415,000 |
| Cost of ESOP Borrowings (S) |
| 0.00% |
| (4) |
Pre-Conversion Book Value (B) |
| $43,939,000 |
| ESOP Amortization (T) |
| 15.00 |
| years |
Pre-Conv. Tang. Book Value (TB) |
| $43,939,000 |
| MRP Amount (M) |
| 4.36% |
|
|
Pre-Conversion Assets (A) |
| $551,832,000 |
| MRP Vesting (N) |
| 5.00 |
| years (5) |
Reinvestment Rate(R)(2) |
| 4.05% |
| Foundation (F) |
| 4.65% |
|
|
Est. Conversion Expenses (X)(3) |
| 4.37% |
| Tax Benefit (Z) |
| 539,000 |
|
|
Tax Rate (TAX) |
| 38.50% |
| Percentage Sold (PCT) |
| 45.00% |
|
|
|
|
|
| Option (O1) |
| 10.89% |
| (6) |
|
|
|
| Estimated Option Value (O2) |
| 38.60% |
| (6) |
|
|
|
| Option vesting (O3) |
| 5.00 |
| (6) |
|
|
|
| Option pct taxable (O4) |
| 25.00% |
| (6) |
Calculation of Pro Forma Value After Conversion
|
|
|
|
|
|
|
1. | V= | P/E * (Y) |
|
| V= | $70,000,000 |
|
| 1 - P/E * PCT * ((1-X-E-M-F)*R*(1-TAX) - (1-TAX)*E/T - (1-TAX)*M/N) - (1-(TAX*O4))*(O1*O2)/O3) |
|
|
| |
|
|
|
|
|
|
|
2. | V= | P/Core * (Y) |
|
| V= | $70,000,000 |
|
| 1 - P/core * PCT * ((1-X-E-M-F)*R*(1-TAX) - (1-TAX)*E/T - (1-TAX)*M/N) - (1-(TAX*O4))*(O1*O2)/O3) |
|
|
| |
|
|
|
|
|
|
|
3. | V= | P/B * (B+Z) |
|
| V= | $70,000,000 |
|
| 1 - P/B * PCT * (1-X-E-M-F) |
|
|
| |
|
|
|
|
|
|
|
4. | V= | P/TB * (TB+Z) |
|
| V= | $70,000,010 |
|
| 1 - P/TB * PCT * (1-X-E-M-F) |
|
|
| |
|
|
|
|
|
|
|
5. | V= | P/A * (A+Z) |
|
| V= | $70,000,000 |
|
| 1 - P/A * PCT * (1-X-E-M-F) |
|
|
| |
|
|
|
|
|
|
|
|
|
|
|
|
|
|
|
|
|
|
|
|
|
|
|
|
| |
|
| Shares Owned by |
| Shares Issued |
| Price Per |
| Gross Offering |
| Shares |
| Total Shares |
| Aggregate |
| Full Value | |||||||||
Conclusion |
| The MHC |
| To the Public |
| Share |
| Proceeds |
| Foundation |
| Issued Publicly |
| Publicly |
| Total Shares | |||||||||
|
|
|
|
|
|
|
| ||||||||||||||||||
Supermaximum |
|
| 5,091,625 |
|
|
| 3,980,725 |
|
| 10.00 |
| $ | 39,807,255 |
|
| 185,150 |
|
| 4,165,875 |
| $ | 41,658,755 |
|
| 9,257,500 |
Maximum |
|
| 4,427,500 |
|
|
| 3,461,500 |
|
| 10.00 |
| $ | 34,615,000 |
|
| 161,000 |
|
| 3,622,500 |
|
| 36,225,000 |
|
| 8,050,000 |
Midpoint |
|
| 3,850,000 |
|
|
| 3,010,000 |
|
| 10.00 |
| $ | 30,100,000 |
|
| 140,000 |
|
| 3,150,000 |
|
| 31,500,000 |
|
| 7,000,000 |
Minimum |
|
| 3,272,500 |
|
|
| 2,558,500 |
|
| 10.00 |
| $ | 25,585,000 |
|
| 119,000 |
|
| 2,677,500 |
|
| 26,775,000 |
|
| 5,950,000 |
|
|
(1) | Pricing ratios shown reflect the midpoint value. |
(2) | Net return reflects a reinvestment rate of 4.05 percent, and a tax rate of 38.5 percent. |
(3) | Offering expenses shown at estimated midpoint value. |
(4) | No cost is applicable since holding company will fund the ESOP loan. |
(5) | ESOP and RRP amortize over 15 years and 5 years, respectively; amortization expenses tax effected at 38.5 percent. |
(6) | Option plan with an estimated Black-Scholes valuation of 38.60 percent of the exercise price, including a 5 year vesting with 25 percent of the options (granted to directors) tax effected at 38.5 percent. |
EXHIBIT IV-11
Malvern Federal Savings Bank
Pro Forma Effect of Conversion Proceeds – MHC Conversion Basis
Exhibit IV-11
PRO FORMA EFFECT OF CONVERSION PROCEEDS
Malvern Federal Savings Bank
At the Maximum
|
|
|
|
|
|
1. | Pro Forma Market Capitalization |
| $ | 36,225,000 |
|
| Less: Foundation Shares |
|
| 1,610,000 |
|
|
|
|
| ||
2. | Offering Proceeds |
| $ | 34,615,000 |
|
| Less: Estimated Offering Expenses |
|
| 1,354,969 |
|
|
|
|
| ||
| Net Conversion Proceeds |
| $ | 33,260,031 |
|
|
|
|
|
|
|
3. | Estimated Additional Income from Conversion Proceeds |
|
|
|
|
|
|
|
|
|
|
| Net Conversion Proceeds |
| $ | 33,260,031 |
|
| Less: Cash Contribution to Foundation |
|
| 0 |
|
| Less: Non-Cash Stock Purchases (1) |
|
| 4,733,400 |
|
|
|
|
| ||
| Net Proceeds Reinvested |
| $ | 28,526,631 |
|
| Estimated net incremental rate of return |
|
| 2.49 | % |
|
|
|
| ||
| Reinvestment Income |
| $ | 710,527 |
|
| Less: Estimated cost of ESOP borrowings (2) |
|
| 0 |
|
| Less: Amortization of ESOP borrowings (3) |
|
| 129,380 |
|
| Less: Amortization of Options (4) |
|
| 275,206 |
|
| Less: Recognition Plan Vesting (5) |
|
| 194,069 |
|
|
|
|
| ||
| Net Earnings Impact |
| $ | 111,872 |
|
|
|
|
|
|
|
|
|
|
|
|
|
4. | Pro Forma Earnings |
| Before |
| Net |
| After |
| |||
|
|
|
|
|
| ||||||
|
|
|
|
|
|
|
|
|
|
|
|
| 12 Months ended September 30, 2007 (reported) |
| $ | 2,410,000 |
| $ | 111,872 |
| $ | 2,521,872 |
|
| 12 Months ended September 30, 2007 (core) |
| $ | 2,415,000 |
| $ | 111,872 |
| $ | 2,526,872 |
|
|
|
|
|
|
|
|
|
|
|
|
|
|
|
|
5. | Pro Forma Net Worth |
| Before |
| Net Cash |
| Tax Benefit |
| After |
| ||||
|
|
|
|
|
|
| ||||||||
|
|
|
|
|
|
|
|
|
|
|
|
|
|
|
| September 30, 2007 |
| $ | 43,939,000 |
| $ | 28,526,631 |
| $ | 619,850 |
| $ | 73,085,481 |
|
| September 30, 2007 (Tangible) |
| $ | 43,939,000 |
| $ | 28,526,631 |
| $ | 619,850 |
| $ | 73,085,481 |
|
|
|
|
|
|
|
|
|
|
|
|
|
|
|
|
6. | Pro Forma Assets |
| Before |
| Net Cash |
| Tax Benefit |
| After |
| ||||
|
|
|
|
|
|
| ||||||||
|
|
|
|
|
|
|
|
|
|
|
|
|
|
|
| September 30, 2007 |
| $ | 551,832,000 |
| $ | 28,526,631 |
| $ | 619,850 |
| $ | 580,978,481 |
|
|
|
(1) | Includes ESOP and MRP stock purchases equal to 8.71 percent and 4.36 percent of the public shares, respectively. |
(2) | ESOP stock purchases are internally financed by a loan from the holding company. |
(3) | ESOP borrowings are amortized over 15 years, amortization expense is tax-effected at a 38.5 percent rate. |
(4) | Option valuation based on Black-Scholes model, 5 year vesting, and assuming 25 percent taxable. |
(5) | RRP is amortized over 5 years, and amortization expense is tax effected at 38.5 percent. |
Exhibit IV-11
PRO FORMA EFFECT OF CONVERSION PROCEEDS
Malvern Federal Savings Bank
At the Midpoint
|
|
|
|
|
|
1. | Pro Forma Market Capitalization |
| $ | 31,500,000 |
|
| Less: Foundation Shares |
|
| 1,400,000 |
|
|
|
|
| ||
2. | Offering Proceeds |
| $ | 30,100,000 |
|
| Less: Estimated Offering Expenses |
|
| 1,313,935 |
|
|
|
|
| ||
| Net Conversion Proceeds |
| $ | 28,786,065 |
|
|
|
|
|
|
|
3. | Estimated Additional Income from Conversion Proceeds |
|
|
|
|
|
|
|
|
|
|
| Net Conversion Proceeds |
| $ | 28,786,065 |
|
| Less: Cash Contribution to Foundation |
|
| 0 |
|
| Less: Non-Cash Stock Purchases (1) |
|
| 4,116,000 |
|
|
|
|
| ||
| Net Proceeds Reinvested |
| $ | 24,670,065 |
|
| Estimated net incremental rate of return |
|
| 2.49 | % |
|
|
|
| ||
| Reinvestment Income |
| $ | 614,470 |
|
| Less: Estimated cost of ESOP borrowings (2) |
|
| 0 |
|
| Less: Amortization of ESOP borrowings (3) |
|
| 112,504 |
|
| Less: Amortization of Options (4) |
|
| 239,309 |
|
| Less: Recognition Plan Vesting (5) |
|
| 168,756 |
|
|
|
|
| ||
| Net Earnings Impact |
| $ | 93,900 |
|
|
|
|
|
|
|
|
|
|
|
|
|
4. | Pro Forma Earnings |
| Before |
| Net |
| After |
| |||
|
|
|
|
|
| ||||||
|
|
|
|
|
|
|
|
|
|
|
|
| 12 Months ended September 30, 2007 (reported) |
| $ | 2,410,000 |
| $ | 93,900 |
| $ | 2,503,900 |
|
| 12 Months ended September 30, 2007 (core) |
| $ | 2,415,000 |
| $ | 93,900 |
| $ | 2,508,900 |
|
|
|
|
|
|
|
|
|
|
|
|
|
|
|
|
5. | Pro Forma Net Worth |
| Before |
| Net Cash |
| Tax Benefit |
| After |
| ||||
|
|
|
|
|
|
| ||||||||
|
|
|
|
|
|
|
|
|
|
|
|
|
|
|
| September 30, 2007 |
| $ | 43,939,000 |
| $ | 24,670,065 |
| $ | 539,000 |
| $ | 69,148,065 |
|
| September 30, 2007 (Tangible) |
| $ | 43,939,000 |
| $ | 24,670,065 |
| $ | 539,000 |
| $ | 69,148,065 |
|
|
|
|
|
|
|
|
|
|
|
|
|
|
|
|
6. | Pro Forma Assets |
| Before |
| Net Cash |
| Tax Benefit |
| After |
| ||||
|
|
|
|
|
|
| ||||||||
|
|
|
|
|
|
|
|
|
|
|
|
|
|
|
| September 30, 2007 |
| $ | 551,832,000 |
| $ | 24,670,065 |
| $ | 539,000 |
| $ | 577,041,065 |
|
|
|
(1) | Includes ESOP and MRP stock purchases equal to 8.71 percent and 4.36 percent of the public shares, respectively. |
(2) | ESOP stock purchases are internally financed by a loan from the holding company. |
(3) | ESOP borrowings are amortized over 15 years, amortization expense is tax-effected at a 38.5 percent rate. |
(4) | Option valuation based on Black-Scholes model, 5 year vesting, and assuming 25 percent taxable. |
(5) | RRP is amortized over 5 years, and amortization expense is tax effected at 38.5 percent. |
Exhibit IV-11
PRO FORMA EFFECT OF CONVERSION PROCEEDS
Malvern Federal Savings Bank
At the Minimum
|
|
|
|
|
|
1. | Pro Forma Market Capitalization |
| $ | 26,775,000 |
|
| Less: Foundation Shares |
|
| 1,190,000 |
|
|
|
|
| ||
2. | Offering Proceeds |
| $ | 25,585,000 |
|
| Less: Estimated Offering Expenses |
|
| 1,272,901 |
|
|
|
|
| ||
| Net Conversion Proceeds |
| $ | 24,312,099 |
|
|
|
|
|
|
|
3. | Estimated Additional Income from Conversion Proceeds |
|
|
|
|
|
|
|
|
|
|
| Net Conversion Proceeds |
| $ | 24,312,099 |
|
| Less: Cash Contribution to Foundation |
|
| 0 |
|
| Less: Non-Cash Stock Purchases (1) |
|
| 3,498,600 |
|
|
|
|
| ||
| Net Proceeds Reinvested |
| $ | 20,813,499 |
|
| Estimated net incremental rate of return |
|
| 2.49 | % |
|
|
|
| ||
| Reinvestment Income |
| $ | 518,412 |
|
| Less: Estimated cost of ESOP borrowings (2) |
|
| 0 |
|
| Less: Amortization of ESOP borrowings (3) |
|
| 95,628 |
|
| Less: Amortization of Options (4) |
|
| 203,413 |
|
| Less: Recognition Plan Vesting (5) |
|
| 143,443 |
|
|
|
|
| ||
| Net Earnings Impact |
| $ | 75,928 |
|
|
|
|
|
|
|
|
|
|
|
|
|
|
|
|
4. | Pro Forma Earnings |
| Before |
| Net |
| After |
| ||||||
|
|
|
|
|
| |||||||||
|
|
|
|
|
|
|
|
|
|
|
| |||
| 12 Months ended September 30, 2007 (reported) |
| $ | 2,410,000 |
| $ | 75,928 |
| $ | 2,485,928 |
| |||
| 12 Months ended September 30, 2007 (core) |
| $ | 2,415,000 |
| $ | 75,928 |
| $ | 2,490,928 |
| |||
|
|
|
|
|
|
|
|
|
|
|
|
|
|
|
5. | Pro Forma Net Worth |
| Before |
| Net Cash |
| Tax Benefit |
| After |
| ||||
|
|
|
|
|
|
| ||||||||
|
|
|
|
|
|
|
|
|
|
|
|
|
|
|
| September 30, 2007 |
| $ | 43,939,000 |
| $ | 20,813,499 |
| $ | 458,150 |
| $ | 65,210,649 |
|
| September 30, 2007 (Tangible) |
| $ | 43,939,000 |
| $ | 20,813,499 |
| $ | 458,150 |
| $ | 65,210,649 |
|
|
|
|
|
|
|
|
|
|
|
|
|
|
|
|
6. | Pro Forma Assets |
| Before |
| Net Cash |
| Tax Benefit |
| After |
| ||||
|
|
|
|
|
|
| ||||||||
|
|
|
|
|
|
|
|
|
|
|
|
|
|
|
| September 30, 2007 |
| $ | 551,832,000 |
| $ | 20,813,499 |
| $ | 458,150 |
| $ | 573,103,649 |
|
|
|
(1) | Includes ESOP and MRP stock purchases equal to 8.71 percent and 4.36 percent of the public shares, respectively. |
(2) | ESOP stock purchases are internally financed by a loan from the holding company |
(3) | ESOP borrowings are amortized over 15 years, amortization expense is tax-effected at a 38.5 percent rate. |
(4) | Option valuation based on Black-Scholes model, 5 year vesting, and assuming 25 percent taxable. |
(5) | RRP is amortized over 5 years, and amortization expense is tax effected at 38.5 percent. |
Exhibit IV-11
PRO FORMA EFFECT OF CONVERSION PROCEEDS
Malvern Federal Savings Bank
At the Supermaximum Value
|
|
|
|
|
|
1. | Pro Forma Market Capitalization |
| $ | 41,658,755 |
|
| Less: Foundation Shares |
|
| 1,851,500 | |
|
|
| |||
2. | Offering Proceeds |
| $ | 39,807,255 |
|
| Less: Estimated Offering Expenses |
|
| 1,402,158 | |
|
|
| |||
| Net Conversion Proceeds |
| $ | 38,405,097 |
|
| |||||
3. | Estimated Additional Income from Conversion Proceeds |
|
|
| |
| |||||
| Net Conversion Proceeds |
| $ | 38,405,097 |
|
| Less: Cash Contribution to Foundation |
|
| 0 | |
| Less: Non-Cash Stock Purchases (1) |
|
| 5,443,411 |
|
|
|
| |||
| Net Proceeds Reinvested |
| $ | 32,961,686 | |
| Estimated net incremental rate of return |
|
| 2.49 | % |
|
|
| |||
| Reinvestment Income |
| $ | 820,993 | |
| Less: Estimated cost of ESOP borrowings (2) |
|
| 0 |
|
| Less: Amortization of ESOP borrowings (3) |
|
| 148,787 | |
| Less: Amortization of Options (4) |
|
| 316,487 |
|
| Less: Recognition Plan Vesting (5) |
|
| 223,180 | |
|
|
| |||
| Net Earnings Impact |
| $ | 132,540 |
|
|
|
|
|
|
|
|
|
|
|
|
4. | Pro Forma Earnings |
| Before |
| Net |
| After | |||
|
|
|
|
| ||||||
| ||||||||||
| 12 Months ended September 30, 2007 (reported) |
| $ | 2,410,000 |
| $ | 132,540 |
| $ | 2,542,540 |
| 12 Months ended September 30, 2007 (core) |
| $ | 2,415,000 |
| $ | 132,540 |
| $ | 2,547,540 |
|
|
|
|
|
|
|
|
|
|
|
|
|
|
|
|
|
|
|
|
|
|
|
|
|
5. | Pro Forma Net Worth |
| Before |
| Net Cash |
| Tax Benefit |
| After | ||||
|
|
|
|
|
| ||||||||
| |||||||||||||
| September 30, 2007 |
| $ | 43,939,000 |
| $ | 32,961,686 |
| $ | 712,828 |
| $ | 77,613,514 |
| September 30, 2007 (Tangible) |
| $ | 43,939,000 |
| $ | 32,961,686 |
| $ | 712,828 |
| $ | 77,613,514 |
|
|
|
|
|
|
|
|
|
|
|
|
|
|
|
|
|
|
|
|
|
|
|
|
|
|
|
|
6. | Pro Forma Assets |
| Before |
| Net Cash |
| Tax Benefit |
| After | ||||
|
|
|
|
|
| ||||||||
| |||||||||||||
| September 30, 2007 |
| $ | 551,832,000 |
| $ | 32,961,686 |
| $ | 712,828 |
| $ | 585,506,514 |
|
|
(1) | Includes ESOP and MRP stock purchases equal to 8.71 percent and 4.36 percent of the public shares, respectively. |
(2) | ESOP stock purchases are internally financed by a loan from the holding company. |
(3) | ESOP borrowings are amortized over 15 years, amortization expense is tax-effected at a 38.5 percent rate. |
(4) | Option valuation based on Black-Scholes model, 5 year vesting, and assuming 25 percent taxable. |
(5) | RRP is amortized over 5 years, and amortization expense is tax effected at 38.5 percent. |
EXHIBIT V-1
RP® Financial, LC.
Firm Qualifications Statement
|
RP® FINANCIAL, LC. |
Celebrating 20 Years of Financial Advisory Services |
FIRM QUALIFICATION STATEMENT
RP® Financial provides financial and management consulting, merger advisory and valuation services to the financial services industry nationwide. We offer a broad array of services, high quality and prompt service, hands-on involvement by principals and senior staff, careful structuring of strategic initiatives and sophisticated valuation and other analyses consistent with industry practices and regulatory requirements. Our staff maintains extensive background in financial and management consulting, valuation and investment banking. Our clients include commercial banks, thrifts, credit unions, mortgage companies and other financial services companies.
STRATEGIC PLANNING SERVICES
RP® Financial’s strategic planning services are designed to provide effective feasible plans with quantifiable results. We analyze strategic options to enhance shareholder value, achieve regulatory approval or realize other objectives. Such services involve conducting situation analyses; establishing mission/vision statements, strategic goals and objectives; and identifying strategies to enhance franchise and/or market value, capital management, earnings enhancement, operational matters and organizational issues. Strategic recommendations typically focus on: capital formation and management, asset/liability targets, profitability, return on equity and stock pricing. Our proprietary financial simulation models provide the basis for evaluating the impact of various strategies and assessing their feasibility and compatibility with regulations.
MERGER ADVISORY SERVICES
RP® Financial’s merger advisory services include targeting potential buyers and sellers, assessing acquisition merit, conducting due diligence, negotiating and structuring merger transactions, preparing merger business plans and financial simulations, rendering fairness opinions, preparing mark-to-market analyses and supporting the implementation of post-acquisition strategies. Through financial simulations, comprehensive data bases, valuation proficiency and regulatory familiarity, RP® Financial’s merger advisory services center on enhancing shareholder returns.
VALUATION SERVICES
RP® Financial’s extensive valuation practice includes bank and thrift mergers, thrift mutual-to-stock conversions, insurance company demutualizations, ESOPs, subsidiary companies, purchase accounting and other purposes. We are highly experienced in performing appraisals which conform to regulatory guidelines and appraisal standards. RP® Financial is the nation’s leading valuation firm for thrift mutual-to-stock conversions, with appraised values ranging up to $4 billion.
OTHER CONSULTING SERVICES
RP® Financial offers other consulting services including branching and diversification strategies, feasibility studies and special research. We assist banks/thrifts in preparing CRA plans and evaluating wealth management activities on a de novo or merger basis. Our other consulting services are aided by proprietary valuation and financial simulation models.
KEY PERSONNEL (Years of Relevant Experience & Contact Information)
|
|
|
Ronald S. Riggins, Managing Director (27) | (703) 647-6543 | rriggins@rpfinancial.com |
William E. Pommerening, Managing Director (24) | (703) 647-6546 | wpommerening@rpfinancial.com |
Gregory E. Dunn, Director (25) | (703) 647-6548 | gdunn@rpfinancial.com |
James P. Hennessey, Director (22) | (703) 647-6544 | jhennessey@rpfinancial.com |
James J. Oren, Director (21) | (703) 647-6549 | joren@rpfinancial.com |
Timothy M. Biddle, Senior Vice President (18) | (703) 647-6552 | tbiddle@rpfinancial.com |
|
|
|
|
|
|
|
|
|
Washington Headquarters |
|
|
Rosslyn Center |
| Telephone: (703) 528-1700 |
1700 North Moore Street, Suite 2210 |
| Fax No.: (703) 528-1788 |
Arlington, VA 22209 |
| Toll-Free No.: (866) 723-0594 |
www.rpfinancial.com |
| E-Mail: mail@rpfinancial.com |