EXHIBIT 99.5
PRO FORMA VALUATION UPDATE REPORT
MUTUAL HOLDING COMPANY STOCK OFFERING
MALVERN FEDERAL BANCORP, INC.
Paoli, Pennsylvania
PROPOSED MID-TIER HOLDING COMPANY FOR:
MALVERN FEDERAL SAVINGS BANK
Paoli, Pennsylvania
Dated As Of:
January 25, 2008
|
|
|
|
|
Prepared By:
RP®Financial, LC.
1700 North Moore Street
Suite 2210
Arlington, Virginia 22209
|
|
|
|
|
|
RP®FINANCIAL, LC. |
Financial Services Industry Consultants |
|
|
|
| January 25, 2008 | |
|
| |
|
| |
| Board of Directors | |
| Malvern Federal Savings Bank | |
| 42 East Lancaster Avenue | |
| Paoli, Pennsylvania 19301 | |
|
| |
| Members of the Board of Directors: | |
|
| |
| We have completed and hereby provide an updated appraisal of the estimated pro forma market value of the common stock that has been offered in connection with the plan of stock issuance described below. | |
|
| |
| This updated appraisal is furnished pursuant to the conversion regulations promulgated by the Office of Thrift Supervision (“OTS”). Specifically, this Appraisal has been prepared in accordance with the “Guidelines for Appraisal Reports for the Valuation of Savings and Loan Associations Converting from Mutual to Stock Form of Organization” as set forth by the OTS, and applicable regulatory interpretations thereof. Our original appraisal report, dated December 7, 2007 (the “Original Appraisal”) is incorporated herein by reference. As in the preparation of our Original Appraisal, we believe the data and information used herein is reliable; however, we cannot guarantee the accuracy and completeness of such information. | |
|
| |
| The Board of Directors of Malvern Federal Savings Bank (“Malvern Federal” or the “Bank”) has adopted a plan of reorganization and plan of stock issuance, pursuant to which the Bank will reorganize into a federal mutual holding company structure. As part of the plan of reorganization, the Bank will convert from a federally-chartered mutual savings bank to a federally-chartered stock savings bank and will become a wholly-owned subsidiary of Malvern Federal Bancorp, Inc. (“Bancorp”), a federally-chartered mid-tier holding corporation. Bancorp will issue a majority of its common stock to Malvern Federal Mutual Holding Company (the “MHC”), a federally-chartered mutual holding company, and sell a minority of its common stock to the public. It is anticipated that the public shares will be offered in a subscription offering to the Bank’s Eligible Account Holders, Employee Stock Ownership Plan, Supplemental Eligible Account Holders and Other Members, as such terms are defined for purposes of applicable federal regulatory requirements governing mutual-to-stock conversions. To the extent that shares remain available for purchase after satisfaction of all subscriptions received in the subscription offering, the shares may be offered for sale in a community offering and/or a syndicated community offering. In addition, as part of the reorganization, the Bank will form the Malvern Federal Charitable Foundation (the “Foundation”) to further the Bank’s commitment to the local community. The Foundation will be funded with stock equal to 2% of the stock to be issued in the reorganization The total shares offered for sale to the public and issued to the Foundation will constitute a minority of Bancorp’s stock (49.0% or less). | |
|
| |
|
|
Washington Headquarters |
|
Rosslyn Center | Telephone: (703) 528-1700 |
1700 North Moore Street, Suite 2210 | Fax No.: (703) 528-1788 |
Arlington, VA 22209 | Toll-Free No.: (866) 723-0594 |
www.rpfinancial.com | E-Mail: mail@rpfinancial.com |
|
|
| RP®Financial, LC. |
| This updated appraisal reflects the following noteworthy items: (1) a review of recent developments in Malvern Federal’s financial condition, including financial data through December 31, 2007; (2) an updated comparison of Malvern Federal’s financial condition and operating results versus the Peer Group companies identified in the Original Appraisal; and (3) a review of stock market conditions since the date of the Original Appraisal. |
|
|
| The estimated pro forma market value is defined as the price at which Bancorp’s common stock, immediately upon completion of the public stock offering, would change hands between a willing buyer and a willing seller, neither being under any compulsion to buy or sell and both having reasonable knowledge of relevant facts. |
|
|
| Our valuation is not intended, and must not be construed, as a recommendation of any kind as to the advisability of purchasing shares of the common stock. Moreover, because such valuation is necessarily based upon estimates and projections of a number of matters, all of which are subject to change from time to time, no assurance can be given that persons who purchase shares of common stock in the conversion will thereafter be able to buy or sell such shares at prices related to the foregoing valuation of the pro forma market value thereof. RP Financial is not a seller of securities within the meaning of any federal and state securities laws and any report prepared by RP Financial shall not be used as an offer or solicitation with respect to the purchase or sale of any securities. RP Financial maintains a policy which prohibits the company, its principals or employees from purchasing stock of its client institutions. |
|
|
| Discussion of Relevant Considerations |
|
|
| 1.Financial Results |
|
|
| Table 1 presents summary balance sheet and income statement details for the twelve months ended September 30, 2007 and updated financial information through December 31, 2007. Malvern Federal’s assets decreased by $9.7 million or 17.6% from September 30, 2007 to December 31, 2007. Asset shrinkage during the quarter resulted from the sale of the held for sale loan portfolio, which equaled $9.3 million at September 30, 2007, and a decrease in cash and investments. Asset shrinkage was partially offset by growth of the loans receivable portfolio. Overall, loans receivable increased from $466.2 million or 84.5% of assets at September 30, 2007 to $484.0 million or 89.3% of assets at December 31, 2007, while over the same time period cash and investments (inclusive of FHLB stock) decreased from $54.1 million or 9.8% of assets to $35.5 million or 6.5% of assets. |
|
|
| RP®Financial, LC. |
| Boards of Directors |
| January 25, 2008 |
| Page 3 |
Table 1
Malvern Federal Savings Bank
Recent Financial Data
|
|
|
|
|
|
|
|
|
|
|
|
|
| ||
|
| At September 30, 2007 |
| At December 31, 2007 |
|
| |||||||||
|
| Amount |
| Assets |
| Amount |
| Assets |
|
| |||||
|
|
|
|
|
|
| |||||||||
|
| ($000) |
| (%) |
| ($000) |
| (%) |
|
| |||||
|
|
|
|
|
|
|
|
|
|
|
|
|
| ||
Balance Sheet Data |
|
|
|
|
|
|
|
|
|
|
|
|
| ||
Total assets |
| $ | 551,932 |
|
| 100.0 | % | $ | 542,205 |
|
| 100.0 | % | ||
Cash, cash equivalents |
|
| 18,967 |
|
| 3.4 |
|
| 9,539 |
|
| 1.8 |
| ||
Investment securities |
|
| 30,577 |
|
| 5.5 |
|
| 21,470 |
|
| 4.0 |
| ||
Loans receivable, net |
|
| 466,192 |
|
| 84.5 |
|
| 483,969 |
|
| 89.3 |
| ||
Loans held for sale |
|
| 9,259 |
|
| 1.7 |
|
| — |
|
| 0.0 |
| ||
FHLB stock |
|
| 4,560 |
|
| 0.8 |
|
| 4,472 |
|
| 0.8 |
| ||
Deposits |
|
| 433,488 |
|
| 78.5 |
|
| 425,251 |
|
| 78.4 |
| ||
Borrowings |
|
| 71,387 |
|
| 12.9 |
|
| 68,030 |
|
| 12.5 |
| ||
Total equity |
|
| 44,039 |
|
| 8.0 |
|
| 44,696 |
|
| 8.2 |
| ||
|
|
|
|
|
|
|
|
|
|
|
|
|
| ||
|
| 12 Months Ended |
| 12 Months Ended |
|
| |||||||||
|
|
|
|
| |||||||||||
|
| Amount |
| Avg. Assets |
| Amount |
| Avg. Assets |
|
| |||||
|
|
|
|
|
|
| |||||||||
|
| ($000) |
| (%) |
| ($000) |
| (%) |
|
| |||||
|
|
|
|
|
|
|
|
|
|
| |||||
Summary Income Statement |
|
|
|
|
|
|
|
|
|
|
|
|
| ||
Interest income |
| $ | 32,769 |
|
| 6.11 | % | $ | 32,916 |
|
| 6.21 | % | ||
Interest expense |
|
| (19,235 | ) |
| (3.59 | ) |
| (19,626 | ) |
| (3.70 | ) | ||
|
|
|
|
|
| ||||||||||
Net interest income |
|
| 13,534 |
|
| 2.52 |
|
| 13,290 |
|
| 2.51 |
| ||
Provisions for loan losses |
|
| (1,298 | ) |
| (0.24 | ) |
| (1,368 | ) |
| (0.26 | ) | ||
|
|
|
|
|
| ||||||||||
Net interest income after provisions |
|
| 12,236 |
|
| 2.28 |
|
| 11,922 |
|
| 2.25 |
| ||
|
|
|
|
|
|
|
|
|
|
|
|
|
| ||
Non-interest operating income |
|
| 1,461 |
|
| 0.27 |
|
| 1,439 |
|
| 0.27 |
| ||
Gain (loss) on sale of invest./loans |
|
| (8 | ) |
| 0.00 |
|
| 35 |
|
| 0.00 |
| ||
Non-interest operating expense |
|
| (10,154 | ) |
| (1.89 | ) |
| (10,511 | ) |
| (1.98 | ) | ||
|
|
|
|
|
| ||||||||||
Income before income tax expense |
|
| 3,535 |
|
| 0.66 |
|
| 2,885 |
|
| 0.54 |
| ||
Income taxes |
|
| (1,123 | ) |
| (0.21 | ) |
| (925 | ) |
| (0.17 | ) | ||
|
|
|
|
|
| ||||||||||
Net income |
| $ | 2,412 |
|
| 0.45 | % | $ | 1,960 |
|
| 0.37 | % | ||
|
|
| Sources: Malvern Federal’s prospectus, audited and unaudited financial statements, and RP Financial calculations. |
|
|
| Updated credit quality measures indicated some deterioration in the Bank’s credit quality during the quarter, as non-performing assets increased from $2.6 million or 0.47% of assets at September 30, 2007 to $6.7 million or 1.24% of assets at December 31, 2007. The increase in non-performing assets was related to an increase in non-performing loans, which increased from $2.4 million at September 30, 2007 to $6.5 million at December 31, 2007. A $3.5 million commercial real estate loan accounted for the substantial portion of the increase in the non-performing loan balance. The loan is secured by a medical office building in Philadelphia. |
|
|
| RP®Financial, LC. |
| Boards of Directors |
| January 25, 2008 |
| Page 4 |
|
|
| Asset shrinkage funded deposit run-off as well as a reduction in borrowings during the quarter ended December 31, 2007. Deposits decreased from $433.5 million or 78.5% of assets at September 30, 2007 to $425.3 million or 78.4% of assets at December 31, 2007, while over the same time period borrowings decreased from $71.4 million or 12.9% of assets to $68.0 million or 12.5% of assets. Malvern Federal’s equity increased from $44.0 million to $44.7 million during the quarter ended December 31, 2007. Asset shrinkage combined with the capital growth provided for an increase in the equity-to-assets ratio from 8.0% at September 30, 2007 to 8.2% at December 31, 2007. |
|
|
| Malvern Federal’s operating results for the twelve months ended September 30, 2007 and December31, 2007 are also set forth in Table 1. The Bank’s reported earnings decreased from $2.4 million or 0.45% of average assets for the twelve months ended September 30, 2007 to $2.0 million or 0.37% of average assets for the twelve months ended December 31, 2007. Higher operating expenses accounted for most of the decline in the Bank’s updated earnings. |
|
|
| Malvern Federal’s net interest income to average assets ratio decreased from 2.52% during the twelve months ended September 30, 2007 to 2.51% during the twelve months ended December 31, 2007. The slight reduction in the net interest income ratio was the result of a narrower interest rate spread, as the Bank maintained a lower yield on interest-earning assets and a higher cost of funds during the quarter ended December 31, 2007 compared to the year ago quarter. Overall, the Bank’s interest rate spread narrowed from 2.36% during the quarter ended December 31, 2006 to 2.07% during the quarter ended December 31, 2007. |
|
|
| Higher operating expenses accounted for most of the reduction in the Bank’s updated earnings and as a percent of average assets increased from 1.89% during the twelve months ended September 30, 2007 to 1.98% during the twelve months ended December 31, 2007. Overall, Malvern Federal’s slightly lower net interest income ratio and slightly higher operating expense ratio provided for a lower updated expense coverage ratio (net interest income divided by operating expenses) of 1.27x for the twelve months ended December 31, 2007, versus a comparable ratio of 1.33x for the twelve months ended September 30, 2007. |
|
|
| Non-interest operating income reflected little change in the Bank’s updated earnings, with such income amounting to 0.27% of average assets for both twelve month periods shown in Table 1. Overall, when factoring non-interest operating income into core earnings, the Bank’s updated efficiency ratio of 71.2% (operating expenses, net of goodwill amortization, as a percent of net interest income and non-interest operating income) was also slightly less favorable than the 67.7% efficiency ratio recorded for the twelve months ended September 30, 2007. As the result of a $43,000 gain recorded on the sale of $9.3 million of loans held for sale during the quarter ended December 31, 2007, gains and losses on the sale of loans and investments improved from a nominal loss during the twelve months ended September 30, 2007 to a nominal gain for the twelve months ended December 31, 2007. |
|
|
| RP®Financial, LC. |
| Boards of Directors |
| January 25, 2008 |
| Page 5 |
|
|
| Loan loss provisions increased from $1.3 million or 0.24% of average assets for the twelve months ended September 30, 2007 to $1.4 million or 0.26% of average assets for the twelve months ended December 31, 2007. The slightly higher loan loss provisions established during the most recent twelve month period was largely in connection with the loan growth recorded during the quarter. The spike up in the non-performing loan balance during the quarter ended December 31, 2007 was largely attributable to one $3.5 million loan being placed on non-accrual status, which was taken into consideration in the $852,000 of loan provisions established during the fourth quarter of fiscal 2007. As of December 31, 2007, the Bank maintained valuation allowances of $4.7 million, equal to 71.3% of non-performing loans. |
|
|
| The Bank’s effective tax rate equaled 31.77% and 32.06% during the twelve month periods ended September 30, 2007 and December 31, 2007, respectively. As set forth in the Original Appraisal, the Bank’s marginal effective statutory tax rate approximates 38.5%. |
|
|
| 2.Peer Group Financial Comparisons |
|
|
| Tables 2 and 3 present the financial characteristics and operating results for Malvern Federal, the Peer Group and all publicly-traded thrifts. The Bank’s and the Peer Group’s ratios are based on financial results through December 31, 2007 and September 30, 2007, respectively. |
|
|
| In general, the comparative balance sheet ratios for the Bank and the Peer Group did not vary significantly from the ratios exhibited in the Original Appraisal. Consistent with the Original Appraisal, the Bank’s updated interest-earning asset composition reflected a higher concentration of loans and a lower concentration of cash and investments. Overall, the Bank continued to maintain a slightly higher level of interest-earning assets than the Peer Group, as updated interest-earning assets-to-assets ratios equaled 95.9% and 94.0% for the Bank and the Peer Group, respectively. |
|
|
| The updated mix of deposits and borrowings maintained by Malvern Federal and the Peer Group also did not change significantly from the Original Appraisal. Malvern Federal’s funding composition continued to reflect slightly higher concentrations of deposits and borrowings, relative to the comparable Peer Group measures. Updated interest-bearing liabilities-to-assets ratios equaled 90.9% and 82.9% for the Bank and the Peer Group, respectively. Malvern Federal posted an updated tangible equity-to-assets ratio of 8.2%, which remained below the comparable Peer Group ratio of 15.4%. Overall, Malvern Federal’s updated interest-earning assets-to-interest-bearing liabilities (“IEA/IBL”) ratio equaled 105.5%, which remained below the comparable Peer Group ratio of 113.4%. As discussed in the Original Appraisal, the additional capital realized from stock proceeds should serve to increase Malvern Federal’s IEA/IBL ratio, as the level of interest-bearing liabilities funding assets will be lower due to the increase in capital realized from the offering and the net proceeds realized from the offering will be primarily deployed into interest-earning assets. |
RP® Financial, LC.
Board of Directors
January 25, 2008
Page 6
Table 2
Balance Sheet Composition and Growth Rates
Comparable Institution Analysis
As of September 30, 2007
|
|
|
|
|
|
|
|
|
|
|
|
|
|
|
|
|
|
|
|
|
|
|
|
| Balance Sheet as a Percent of Assets |
| |||||||||||||||||||
|
|
| ||||||||||||||||||||
|
| Cash & |
| MBS & |
| Loans |
| Deposits |
| Borrowed |
| Subd. |
| Net |
| Goodwill |
| Tng Net |
| MEMO: |
| |
|
|
|
|
|
|
|
|
|
|
|
| |||||||||||
Malvern Federal Savings Bank |
|
|
|
|
|
|
|
|
|
|
|
|
|
|
|
|
|
|
|
|
| |
December 31, 2007 |
| 1.8 | % | 4.8 | % | 89.3 | % | 78.4 | % | 12.5 | % | 0.0 | % | 8.2 | % | 0.0 | % | 8.2 | % | 0.0 | % | |
|
|
|
|
|
|
|
|
|
|
|
|
|
|
|
|
|
|
|
|
|
| |
All Public Companies |
|
|
|
|
|
|
|
|
|
|
|
|
|
|
|
|
|
|
|
|
| |
Averages |
| 3.7 | % | 20.2 | % | 70.5 | % | 67.9 | % | 18.0 | % | 0.6 | % | 12.3 | % | 1.0 | % | 11.3 | % | 0.0 | % | |
Medians |
| 2.7 | % | 18.6 | % | 72.1 | % | 68.8 | % | 16.6 | % | 0.0 | % | 10.5 | % | 0.1 | % | 9.4 | % | 0.0 | % | |
|
|
|
|
|
|
|
|
|
|
|
|
|
|
|
|
|
|
|
|
|
| |
State of PA |
|
|
|
|
|
|
|
|
|
|
|
|
|
|
|
|
|
|
|
|
| |
Averages |
| 3.9 | % | 32.7 | % | 57.6 | % | 63.0 | % | 22.9 | % | 0.8 | % | 12.1 | % | 1.5 | % | 10.6 | % | 0.0 | % | |
Medians |
| 2.0 | % | 28.1 | % | 62.0 | % | 66.2 | % | 19.8 | % | 0.0 | % | 10.1 | % | 0.4 | % | 6.9 | % | 0.0 | % | |
|
|
|
|
|
|
|
|
|
|
|
|
|
|
|
|
|
|
|
|
|
| |
Comparable Group |
|
|
|
|
|
|
|
|
|
|
|
|
|
|
|
|
|
|
|
|
| |
Averages |
| 3.3 | % | 29.6 | % | 61.1 | % | 75.0 | % | 7.6 | % | 0.3 | % | 15.9 | % | 0.5 | % | 15.4 | % | 0.0 | % | |
Medians |
| 2.8 | % | 32.9 | % | 55.7 | % | 74.1 | % | 6.4 | % | 0.0 | % | 16.0 | % | 0.0 | % | 16.0 | % | 0.0 | % | |
|
|
|
|
|
|
|
|
|
|
|
|
|
|
|
|
|
|
|
|
|
| |
Comparable Group |
|
|
|
|
|
|
|
|
|
|
|
|
|
|
|
|
|
|
|
|
| |
BFSB | Brooklyn Federal MHC of NY (31.0) |
| 2.4 | % | 20.2 | % | 72.9 | % | 73.5 | % | 2.4 | % | 0.0 | % | 21.8 | % | 0.0 | % | 21.8 | % | 0.0 | % |
CSBK | Clifton Savings Bncrp MHC of NJ (41.0) |
| 2.9 | % | 37.7 | % | 54.6 | % | 71.1 | % | 5.7 | % | 0.0 | % | 22.2 | % | 0.0 | % | 22.2 | % | 0.0 | % |
COBK | Colonial Bank MHC of NJ (44.9) |
| 2.7 | % | 40.5 | % | 52.7 | % | 87.2 | % | 3.8 | % | 0.0 | % | 8.6 | % | 0.0 | % | 8.6 | % | 0.0 | % |
FXCB | Fox Chase Bancorp MHC of PA (44.5) |
| 4.6 | % | 34.4 | % | 56.7 | % | 78.4 | % | 4.0 | % | 0.0 | % | 17.0 | % | 0.0 | % | 17.0 | % | 0.0 | % |
LSBK | Lake Shore Bancorp MHC of NY (43.7) |
| 2.3 | % | 31.4 | % | 60.8 | % | 67.4 | % | 16.0 | % | 0.0 | % | 15.0 | % | 0.0 | % | 15.0 | % | 0.0 | % |
MGYR | Magyar Bancorp MHC of NJ (45.1)(1) |
| 1.1 | % | 10.1 | % | 80.6 | % | 77.9 | % | 10.6 | % | 0.0 | % | 10.2 | % | 0.0 | % | 10.2 | % | 0.0 | % |
OSHC | Ocean Shore Holding MHC of NJ (44.0) |
| 4.1 | % | 10.9 | % | 80.6 | % | 71.0 | % | 15.0 | % | 2.6 | % | 10.4 | % | 0.0 | % | 10.4 | % | 0.0 | % |
ONFC | Oneida Financial MHC of NY (43.9) |
| 5.5 | % | 25.7 | % | 54.6 | % | 76.5 | % | 11.1 | % | 0.0 | % | 11.4 | % | 5.0 | % | 6.4 | % | 0.0 | % |
PBIP | Prudential Bancorp MHC PA (40.5) |
| 2.6 | % | 48.4 | % | 46.2 | % | 74.7 | % | 7.1 | % | 0.0 | % | 17.1 | % | 0.0 | % | 17.1 | % | 0.0 | % |
ROMA | Roma Financial Corp MHC of NJ (31.0) |
| 5.3 | % | 36.4 | % | 51.3 | % | 72.6 | % | 0.7 | % | 0.0 | % | 25.4 | % | 0.1 | % | 25.3 | % | 0.0 | % |
|
|
|
|
|
|
|
|
|
|
|
|
|
|
|
|
|
|
|
|
|
|
|
|
| Balance Sheet Annual Growth Rates |
| Regulatory Capital |
| |||||||||||||||||
|
|
|
| |||||||||||||||||||
|
| Assets |
| MBS, Cash & |
| Loans |
| Deposits |
| Borrows. |
| Net |
| Tng Net |
| Tangible |
| Core |
| Reg.Cap. |
| |
|
|
|
|
|
|
|
|
|
|
|
| |||||||||||
Malvern Federal Savings Bank |
|
|
|
|
|
|
|
|
|
|
|
|
|
|
|
|
|
|
|
|
| |
December 31, 2007 |
| 3.89 | % | -11.85 | % | 4.91 | % | 4.58 | % | -3.22 | % | 6.80 | % | 6.80 | % | 8.21 | % | 8.21 | % | 11.53 | % | |
|
|
|
|
|
|
|
|
|
|
|
|
|
|
|
|
|
|
|
|
|
| |
All Public Companies |
|
|
|
|
|
|
|
|
|
|
|
|
|
|
|
|
|
|
|
|
| |
Averages |
| 5.22 | % | -1.66 | % | 7.29 | % | 4.85 | % | 1.89 | % | 0.65 | % | -0.33 | % | 10.86 | % | 10.70 | % | 17.50 | % | |
Medians |
| 3.71 | % | -4.00 | % | 5.93 | % | 3.32 | % | 0.14 | % | 0.20 | % | -0.22 | % | 9.35 | % | 9.23 | % | 14.55 | % | |
|
|
|
|
|
|
|
|
|
|
|
|
|
|
|
|
|
|
|
|
|
| |
State of PA |
|
|
|
|
|
|
|
|
|
|
|
|
|
|
|
|
|
|
|
|
| |
Averages |
| 2.07 | % | -1.41 | % | 4.94 | % | -2.60 | % | 0.97 | % | 4.84 | % | 4.64 | % | 9.76 | % | 9.06 | % | 18.13 | % | |
Medians |
| 0.38 | % | -5.07 | % | 5.40 | % | 1.03 | % | 0.29 | % | 1.57 | % | 3.43 | % | 9.04 | % | 8.13 | % | 15.80 | % | |
|
|
|
|
|
|
|
|
|
|
|
|
|
|
|
|
|
|
|
|
|
| |
Comparable Group |
|
|
|
|
|
|
|
|
|
|
|
|
|
|
|
|
|
|
|
|
| |
Averages |
| 4.00 | % | -4.13 | % | 8.46 | % | 6.61 | % | -9.11 | % | -0.69 | % | -1.96 | % | 12.94 | % | 12.94 | % | 25.49 | % | |
Medians |
| 1.05 | % | -8.64 | % | 7.27 | % | 1.85 | % | -10.74 | % | -0.18 | % | -1.80 | % | 12.41 | % | 12.41 | % | 24.25 | % | |
|
|
|
|
|
|
|
|
|
|
|
|
|
|
|
|
|
|
|
|
|
| |
Comparable Group |
|
|
|
|
|
|
|
|
|
|
|
|
|
|
|
|
|
|
|
|
| |
BFSB | Brooklyn Federal MHC of NY (31.0) |
| -4.32 | % | -16.22 | % | -0.69 | % | 5.96 | % | -81.24 | % | 6.62 | % | 6.62 | % | 17.20 | % | 17.20 | % | 24.30 | % |
CSBK | Clifton Savings Bncrp MHC of NJ (41.0) |
| -3.75 | % | -14.72 | % | 0.88 | % | 0.27 | % | -25.52 | % | -8.84 | % | -8.84 | % | 18.24 | % | 18.24 | % | 46.81 | % |
COBK | Colonial Bank MHC of NJ (44.9) |
| 15.85 | % | 10.32 | % | 19.16 | % | 20.72 | % | -29.12 | % | 1.80 | % | 1.80 | % | 8.22 | % | 8.22 | % | 16.26 | % |
FXCB | Fox Chase Bancorp MHC of PA (44.5) |
| -2.84 | % | -23.76 | % | 19.54 | % | -3.36 | % | 0.00 | % | 3.47 | % | 3.47 | % | 12.62 | % | 12.62 | % | 25.14 | % |
LSBK | Lake Shore Bancorp MHC of NY (43.7) |
| 1.72 | % | -7.14 | % | 5.44 | % | -1.49 | % | 26.40 | % | -2.60 | % | -2.60 | % | 12.20 | % | 12.20 | % | 24.20 | % |
MGYR | Magyar Bancorp MHC of NJ (45.1)(1) |
| 7.15 | % | 13.85 | % | 5.98 | % | 10.31 | % | -2.97 | % | -1.01 | % | -1.01 | % | NA |
| NA |
| NA |
|
OSHC | Ocean Shore Holding MHC of NJ (44.0) |
| 7.24 | % | -15.51 | % | 12.17 | % | 0.29 | % | 56.48 | % | 0.66 | % | 0.66 | % | 10.52 | % | 10.52 | % | 18.89 | % |
ONFC | Oneida Financial MHC of NY (43.9) |
| 18.27 | % | 21.87 | % | 13.66 | % | 29.68 | % | -18.51 | % | 5.06 | % | -7.65 | % | 6.98 | % | 6.98 | % | 10.69 | % |
PBIP | Prudential Bancorp MHC PA (40.5) |
| 0.38 | % | 0.18 | % | -0.12 | % | 1.94 | % | 6.16 | % | -7.42 | % | -7.42 | % | 17.51 | % | 17.51 | % | 37.66 | % |
ROMA | Roma Financial Corp MHC of NJ (31.0) |
| 0.35 | % | -10.14 | % | 8.57 | % | 1.76 | % | -22.82 | % | -4.63 | % | -4.64 | % | NA |
| NA |
| NA |
|
|
|
(1) Growth rates have been annualized from available financial information. | |
| |
Source: | Audited and unaudited financial statements, corporate reports and offering circulars, and RP® Financial, LC. calculations. The information provided in this table has been obtained from sources we believe are reliable, |
RP® Financial, LC.
Board of Directors
January 25, 2008
Page 7
Table 3
Income as Percent of Average Assets and Yields, Costs, Spreads
Comparable Institution Analysis
For the 12 Months Ended September 30, 2007
|
|
|
|
|
|
|
|
|
|
|
|
|
|
|
|
|
|
|
|
|
|
|
|
| Net Interest Income |
| NII |
| Other Income |
| Total |
| |||||||||||||
|
|
|
|
|
|
|
| |||||||||||||||
|
| Net |
| Income |
| Expense |
| NII |
| Loss |
|
| Loan |
| R.E. |
| Other |
|
| |||
|
|
|
|
|
|
|
|
|
|
|
| |||||||||||
Malvern Federal Savings Bank |
|
|
|
|
|
|
|
|
|
|
|
|
|
|
|
|
|
|
|
|
| |
December 31, 2007 |
| 0.37 | % | 6.21 | % | 3.70 | % | 2.51 | % | 0.26 | % | 2.25 | % | 0.00 | % | 0.00 | % | 0.27 | % | 0.27 | % | |
|
|
|
|
|
|
|
|
|
|
|
|
|
|
|
|
|
|
|
|
|
| |
All Public Companies |
|
|
|
|
|
|
|
|
|
|
|
|
|
|
|
|
|
|
|
|
| |
Averages |
| 0.53 | % | 5.86 | % | 3.17 | % | 2.70 | % | 0.13 | % | 2.57 | % | 0.03 | % | 0.00 | % | 0.61 | % | 0.64 | % | |
Medians |
| 0.49 | % | 5.80 | % | 3.14 | % | 2.69 | % | 0.07 | % | 2.56 | % | 0.00 | % | 0.00 | % | 0.49 | % | 0.51 | % | |
|
|
|
|
|
|
|
|
|
|
|
|
|
|
|
|
|
|
|
|
|
| |
State of PA |
|
|
|
|
|
|
|
|
|
|
|
|
|
|
|
|
|
|
|
|
| |
Averages |
| 0.41 | % | 5.56 | % | 3.20 | % | 2.36 | % | 0.07 | % | 2.29 | % | 0.01 | % | 0.00 | % | 0.43 | % | 0.44 | % | |
Medians |
| 0.50 | % | 5.57 | % | 3.15 | % | 2.45 | % | 0.06 | % | 2.42 | % | 0.00 | % | 0.00 | % | 0.44 | % | 0.47 | % | |
|
|
|
|
|
|
|
|
|
|
|
|
|
|
|
|
|
|
|
|
|
| |
Comparable Group |
|
|
|
|
|
|
|
|
|
|
|
|
|
|
|
|
|
|
|
|
| |
Averages |
| 0.55 | % | 5.53 | % | 2.81 | % | 2.72 | % | 0.01 | % | 2.71 | % | 0.00 | % | 0.00 | % | 0.72 | % | 0.72 | % | |
Medians |
| 0.46 | % | 5.35 | % | 2.90 | % | 2.60 | % | 0.04 | % | 2.66 | % | 0.00 | % | 0.00 | % | 0.37 | % | 0.38 | % | |
| ||||||||||||||||||||||
Comparable Group |
|
|
|
|
|
|
|
|
|
|
|
|
|
|
|
|
|
|
|
|
| |
BFSB | Brooklyn Federal MHC of NY (31.0) |
| 0.96 | % | 6.93 | % | 2.67 | % | 4.26 | % | 0.01 | % | 4.24 | % | 0.00 | % | 0.00 | % | 0.72 | % | 0.72 | % |
CSBK | Clifton Savings Bncrp MHC of NJ (41.0)(1) |
| 0.25 | % | 4.74 | % | 3.01 | % | 1.73 | % | 0.05 | % | 1.69 | % | 0.00 | % | 0.00 | % | 0.14 | % | 0.14 | % |
COBK | Colonial Bank MHC of NJ (44.9) |
| 0.36 | % | 5.35 | % | 3.30 | % | 2.06 | % | 0.03 | % | 2.02 | % | 0.02 | % | 0.00 | % | 0.25 | % | 0.27 | % |
FXCB | Fox Chase Bancorp MHC of PA (44.5) |
| 0.48 | % | 5.35 | % | 2.88 | % | 2.47 | % | -0.27 | % | 2.74 | % | 0.00 | % | 0.00 | % | 0.33 | % | 0.33 | % |
LSBK | Lake Shore Bancorp MHC of NY (43.7) |
| 0.43 | % | 5.15 | % | 2.53 | % | 2.62 | % | 0.04 | % | 2.58 | % | 0.00 | % | 0.00 | % | 0.56 | % | 0.56 | % |
MGYR | Magyar Bancorp MHC of NJ (45.1) |
| 0.15 | % | 6.27 | % | 3.34 | % | 2.93 | % | 0.09 | % | 2.85 | % | 0.00 | % | 0.00 | % | 0.31 | % | 0.31 | % |
OSHC | Ocean Shore Holding MHC of NJ (44.0) |
| 0.43 | % | 5.48 | % | 2.91 | % | 2.57 | % | 0.05 | % | 2.53 | % | 0.00 | % | 0.00 | % | 0.43 | % | 0.43 | % |
ONFC | Oneida Financial MHC of NY (43.9) |
| 0.82 | % | 5.22 | % | 2.40 | % | 2.82 | % | 0.01 | % | 2.81 | % | 0.00 | % | 0.00 | % | 3.77 | % | 3.77 | % |
PBIP | Prudential Bancorp MHC PA (40.5) |
| 0.72 | % | 5.70 | % | 3.13 | % | 2.57 | % | 0.08 | % | 2.49 | % | 0.00 | % | 0.00 | % | 0.22 | % | 0.22 | % |
ROMA | Roma Financial Corp MHC of NJ (31.0) |
| 0.89 | % | 5.13 | % | 1.93 | % | 3.20 | % | 0.05 | % | 3.16 | % | 0.01 | % | 0.00 | % | 0.42 | % | 0.43 | % |
|
|
|
|
|
|
|
|
|
|
|
|
|
|
|
|
|
|
|
|
|
|
|
| G&A/Other Exp. |
| Non-Op. Items |
| Yields, Costs, and Spreads |
| MEMO: |
| MEMO: |
| ||||||||||
|
|
|
|
|
|
| |||||||||||||||
|
| G&A |
| Goodwill |
| Net |
| Extrao. |
| Yield |
| Cost |
| Yld-Cost |
|
|
| ||||
|
|
|
|
|
|
|
|
|
|
| |||||||||||
Malvern Federal Savings Bank |
|
|
|
|
|
|
|
|
|
|
|
|
|
|
|
|
|
|
|
| |
December 31, 2007 |
| 1.98 | % | 0.00 | % | 0.00 | % | 0.00 | % | 6.39 | % | 4.04 | % | 2.35 | % | $ | 6,863 |
| 32.06 | % | |
|
|
|
|
|
|
|
|
|
|
|
|
|
|
|
|
|
|
|
|
| |
All Public Companies |
|
|
|
|
|
|
|
|
|
|
|
|
|
|
|
|
|
|
|
| |
Averages |
| 2.49 | % | 0.02 | % | 0.07 | % | 0.00 | % | 6.23 | % | 3.65 | % | 2.58 | % | $ | 5,704 |
| 32.30 | % | |
Medians |
| 2.48 | % | 0.00 | % | 0.01 | % | 0.00 | % | 6.06 | % | 3.66 | % | 2.63 | % | $ | 4,787 |
| 32.24 | % | |
|
|
|
|
|
|
|
|
|
|
|
|
|
|
|
|
|
|
|
|
| |
State of PA |
|
|
|
|
|
|
|
|
|
|
|
|
|
|
|
|
|
|
|
| |
Averages |
| 2.14 | % | 0.04 | % | -0.01 | % | 0.00 | % | 5.89 | % | 3.66 | % | 2.23 | % | $ | 5,966 |
| 22.06 | % | |
Medians |
| 2.17 | % | 0.00 | % | 0.00 | % | 0.00 | % | 5.81 | % | 3.72 | % | 2.08 | % | $ | 5,286 |
| 25.89 | % | |
|
|
|
|
|
|
|
|
|
|
|
|
|
|
|
|
|
|
|
|
| |
Comparable Group |
|
|
|
|
|
|
|
|
|
|
|
|
|
|
|
|
|
|
|
| |
Averages |
| 2.67 | % | 0.01 | % | 0.00 | % | 0.00 | % | 5.88 | % | 3.40 | % | 2.48 | % | $ | 5,278 |
| 29.01 | % | |
Medians |
| 2.38 | % | 0.00 | % | 0.00 | % | 0.00 | % | 5.66 | % | 3.48 | % | 2.41 | % | $ | 5,286 |
| 28.97 | % | |
| |||||||||||||||||||||
Comparable Group |
|
|
|
|
|
|
|
|
|
|
|
|
|
|
|
|
|
|
|
| |
BFSB | Brooklyn Federal MHC of NY (31.0) |
| 3.52 | % | 0.00 | % | 0.06 | % | 0.00 | % | 7.24 | % | 3.46 | % | 3.78 | % |
| NM |
| 36.18 | % |
CSBK | Clifton Savings Bncrp MHC of NJ (41.0)(1) |
| 1.53 | % | 0.00 | % | 0.00 | % | 0.00 | % | 4.98 | % | 3.93 | % | 1.05 | % | $ | 8,897 |
| 17.37 | % |
COBK | Colonial Bank MHC of NJ (44.9) |
| 2.07 | % | 0.00 | % | 0.01 | % | 0.00 | % | 5.57 | % | 3.64 | % | 1.93 | % | $ | 5,700 |
| NM |
|
FXCB | Fox Chase Bancorp MHC of PA (44.5) |
| 2.51 | % | 0.00 | % | -0.09 | % | 0.00 | % | 5.60 | % | 3.49 | % | 2.11 | % | $ | 5,286 |
| 23.33 | % |
LSBK | Lake Shore Bancorp MHC of NY (43.7) |
| 2.56 | % | 0.00 | % | 0.00 | % | 0.00 | % | 5.44 | % | 3.05 | % | 2.39 | % | $ | 3,832 |
| 25.10 | % |
MGYR | Magyar Bancorp MHC of NJ (45.1) |
| 2.95 | % | 0.00 | % | 0.01 | % | 0.00 | % | 6.81 | % | 3.78 | % | 3.03 | % | $ | 4,780 |
| 26.31 | % |
OSHC | Ocean Shore Holding MHC of NJ (44.0) |
| 2.26 | % | 0.00 | % | 0.00 | % | 0.00 | % | 5.73 | % | 3.30 | % | 2.43 | % | $ | 5,071 |
| 38.19 | % |
ONFC | Oneida Financial MHC of NY (43.9) |
| 5.40 | % | 0.13 | % | -0.02 | % | 0.00 | % | 6.08 | % | 2.78 | % | 3.30 | % | $ | 1,854 |
| 31.32 | % |
PBIP | Prudential Bancorp MHC PA (40.5) |
| 1.69 | % | 0.00 | % | 0.00 | % | 0.00 | % | 5.86 | % | 3.88 | % | 1.98 | % | $ | 6,496 |
| 28.97 | % |
ROMA | Roma Financial Corp MHC of NJ (31.0) |
| 2.23 | % | 0.00 | % | 0.00 | % | 0.00 | % | 5.49 | % | 2.66 | % | 2.83 | % | $ | 5,585 |
| 34.36 | % |
|
|
(1) Income and expense information has been annualized from available financial information. | |
| |
Source: | Audited and unaudited financial statements, corporate reports and offering circulars, and RP® Financial, LC. calculations. The information provided in this table has been obtained from sources we believe are reliable, but we cannot guarantee the accuracy or completeness of such information. |
|
|
| RP® Financial, LC. |
|
|
| Updated growth rates for Malvern Federal are based on annualized growth rates for the 15 months ended December 31, 2007, while the Peer Group’s growth rates are based on growth for the twelve months ended September 30, 2007. Consistent with the Original Appraisal, updated asset growth rates showed comparable asset growth rates 3.9% and 4.0% for the Bank and the Peer Group, respectively. Asset growth for the Bank and the Peer Group was sustained by loan growth, which was in part funded by a decrease in cash and investments for both the Bank and the Peer Group. |
|
|
| Deposit growth funded the Bank’s and the Peer Group asset growth, as well as a reduction in their respective borrowings. The Peer Group’s deposit growth rate of 6.6% was slightly above the Bank’s deposit growth rate of 4.6%. Updated tangible net worth growth rates continued to reflect a stronger growth rate for the Bank (6.8% increase versus a 2.0% decrease for the Peer Group), despite the Peer Group’s higher return on assets ratio. The Peer Group’s capital growth rate continued to be depressed relative to the Bank’s capital growth rate, as the result of maintaining a high level of capital, payment of cash dividends and implementation of stock repurchases. |
|
|
| Table 3 displays comparative operating results for Malvern Federal and the Peer Group, based on their respective earnings for the twelve months ended December 31, 2007 and September 30, 2007. Updated earnings for the Bank and the Peer Group equaled 0.37% and 0.55% of average assets, respectively. Higher levels of net interest income and non-interest operating income, a lower level of loan loss provisions and a lower effective tax rate remained earnings advantages for the Peer Group, while the Bank continued to maintain an earnings advantages with respect to maintaining a lower level of operating expenses. |
|
|
| In terms of core earnings strength, updated expense coverage ratios posted by Malvern Federal and the Peer Group equaled 1.27x and 1.01x, respectively. The Bank’s stronger expense coverage ratio continued to be realized through maintenance of a lower operating expense to average assets ratio (1.98% versus 2.68% for the Peer Group), which was partially offset by the Peer Group’s higher net interest income to average assets ratio (2.72% versus 2.51% for the Bank). The Peer Group’s higher net interest income ratio was realized through maintenance of a lower interest expense ratio, which was partially offset by the Bank’s higher interest income ratio. |
|
|
|
| RP® Financial, LC. | |
|
|
|
| Non-interest operating income remained a larger source of earnings for the Peer Group, as such income amounted to 0.72% and 0.27% of the Peer Group’s and the Bank’s average assets, respectively. Accordingly, taking non-interest operating income into account in assessing Malvern Federal’s core earnings strength relative to the Peer Group’s, the Bank’s updated efficiency ratio of 71.2% remained more favorable than the Peer Group’s updated efficiency ratio of 77.6%. Net gains continued to be a nominal factor in the Bank’s and the Peer Group’s earnings. | |
|
| |
| Loan loss provisions remained a more significant factor in the Bank’s updated earnings, with loan loss provisions established by the Bank and the Peer Group equaling 0.26% and 0.01% of average assets, respectively. | |
|
| |
| Consistent with the Original Appraisal, the Bank maintained a slightly higher effective tax rate than the Peer Group. Updated effective tax rates for the Bank and the Peer Group equaled 32.06% and 29.01%, respectively. | |
|
| |
| The Bank’s updated credit quality measures were viewed as less favorable than the Peer Group’s measures, due to the increase in the Bank’s non-performing loan balance. As shown in Table 4, the Bank’s non-performing assets/assets and non-performing loans/loans ratios of 1.24% and 1.35%, respectively, were well above the comparable Peer Group ratios of 0.32% and 0.19%. The Bank’s updated reserve coverage ratios indicated a lower level of reserves as a percent of non-performing loans (71.3% versus 299.6% for the Peer Group) and a higher level of reserves as a percent of loans (0.96% versus 0.60% for the Peer Group). Net loan charge-offs remained a comparable factor for the Bank and the Peer Group, with net loan charge-offs as a percent of loans equal to 0.03% for the Bank and 0.05% for Peer Group. | |
|
|
|
|
| 3. Stock Market Conditions |
|
|
|
| Since the date of the Original Appraisal, the broader stock market has exhibited a fair amount of volatility and, in general, has declined. News of a 0.25% rate cut by the Federal Reserve sent stocks sharply lower in mid-December 2007, as some investors had hoped for a more significant rate cut. Credit worries and downgrades of several bellwether stocks also contributed to the mid-December pullback in the broader stock market. Weak economic data and expectations that fourth quarter earnings would reflect more large write-downs of subprime mortgage debt by some of the world’s largest banks weighed on stocks in year end trading. | |
RP®Financial, LC.
Board of Directors
January 25, 2008
Page 10
Table 4
Credit Risk Measures and Related Information
Comparable Institution Analysis
As of September 30, 2007 or Most Recent Date Available
|
|
|
|
|
|
|
|
|
|
|
|
|
|
|
|
|
|
|
|
|
|
|
|
|
|
|
Institution |
| REO/ |
| NPAs & |
| NPLs/ |
| Rsrves/ |
| Rsrves/ |
| Rsrves/ |
| Net Loan |
| NLCs/ |
| |||||||||
|
|
|
|
|
|
|
|
| ||||||||||||||||||
|
| (%) |
| (%) |
| (%) |
| (%) |
| (%) |
| (%) |
| ($000) |
| (%) |
| |||||||||
Malvern Federal Savings Bank |
|
| 0.04 | % |
| 1.24 | % |
| 1.35 | % |
| 0.96 | % |
| 71.31 | % |
| 69.07 | % | $ | 156 |
|
| 0.03 | % | |
|
|
|
|
|
|
|
|
|
|
|
|
|
|
|
|
|
|
|
|
|
|
|
|
|
| |
All Public Companies |
|
|
|
|
|
|
|
|
|
|
|
|
|
|
|
|
|
|
|
|
|
|
|
|
| |
Averages |
|
| 0.12 | % |
| 0.64 | % |
| 0.70 | % |
| 0.87 | % |
| 200.29 | % |
| 199.66 | % | $ | 476 |
|
| 0.11 | % | |
Medians |
|
| 0.02 | % |
| 0.40 | % |
| 0.45 | % |
| 0.80 | % |
| 138.00 | % |
| 116.64 | % | $ | 76 |
|
| 0.05 | % | |
|
|
|
|
|
|
|
|
|
|
|
|
|
|
|
|
|
|
|
|
|
|
|
|
|
| |
State of PA |
|
|
|
|
|
|
|
|
|
|
|
|
|
|
|
|
|
|
|
|
|
|
|
|
| |
Averages |
|
| 0.05 | % |
| 0.35 | % |
| 0.56 | % |
| 0.85 | % |
| 206.91 | % |
| 173.24 | % | $ | 155 |
|
| 0.07 | % | |
Medians |
|
| 0.00 | % |
| 0.37 | % |
| 0.41 | % |
| 0.85 | % |
| 207.36 | % |
| 135.01 | % | $ | 13 |
|
| 0.01 | % | |
|
|
|
|
|
|
|
|
|
|
|
|
|
|
|
|
|
|
|
|
|
|
|
|
|
| |
Comparable Group |
|
|
|
|
|
|
|
|
|
|
|
|
|
|
|
|
|
|
|
|
|
|
|
|
| |
Averages |
|
| 0.05 | % |
| 0.32 | % |
| 0.19 | % |
| 0.60 | % |
| 299.61 | % |
| 289.85 | % | $ | 47 |
|
| 0.05 | % | |
Medians |
|
| 0.00 | % |
| 0.06 | % |
| 0.06 | % |
| 0.61 | % |
| 125.86 | % |
| 120.88 | % | $ | 4 |
|
| 0.01 | % | |
|
|
|
|
|
|
|
|
|
|
|
|
|
|
|
|
|
|
|
|
|
|
|
|
|
| |
Comparable Group |
|
|
|
|
|
|
|
|
|
|
|
|
|
|
|
|
|
|
|
|
|
|
|
|
| |
BFSB | Brooklyn Federal MHC of NY (31.0) |
|
| 0.00 | % |
| 0.02 | % |
| 0.02 | % |
| 0.63 | % |
| NA |
|
| NA |
| $ | 0 |
|
| 0.00 | % |
CSBK | Clifton Savings Bncrp MHC of NJ (41.0) |
|
| 0.00 | % |
| 0.03 | % |
| 0.05 | % |
| 0.33 | % |
| 256.23 | % |
| 665.02 | % | $ | 0 |
|
| 0.00 | % |
COBK | Colonial Bank MHC of NJ (44.9) |
|
| 0.00 | % |
| 0.32 | % |
| 0.61 | % |
| 0.63 | % |
| 105.74 | % |
| 106.74 | % | $ | 0 |
|
| 0.00 | % |
FXCB | Fox Chase Bancorp MHC of PA (44.5) |
|
| 0.00 | % |
| 0.03 | % |
| 0.06 | % |
| 0.74 | % |
| 604.61 | % |
| NA |
| $ | 0 |
|
| 0.00 | % |
LSBK | Lake Shore Bancorp MHC of NY (43.7) |
|
| 0.01 | % |
| 0.37 | % |
| 0.45 | % |
| 0.59 | % |
| 125.86 | % |
| 101.17 | % | $ | 20 |
|
| 0.04 | % |
MGYR | Magyar Bancorp MHC of NJ (45.1) |
|
| 0.47 | % |
| 1.90 | % |
| NA |
|
| 0.97 | % |
| 46.73 | % |
| 45.20 | % | $ | 359 |
|
| 0.37 | % |
OSHC | Ocean Shore Holding MHC of NJ (44.0) |
|
| 0.00 | % |
| 0.06 | % |
| 0.07 | % |
| 0.46 | % |
| 908.10 | % |
| 685.98 | % | $ | 7 |
|
| 0.01 | % |
ONFC | Oneida Financial MHC of NY (43.9) |
|
| 0.00 | % |
| 0.03 | % |
| 0.05 | % |
| 0.90 | % |
| NA |
|
| NA |
| $ | 61 |
|
| 0.09 | % |
PBIP | Prudential Bancorp MHC PA (40.5) |
|
| 0.00 | % |
| 0.10 | % |
| NA |
|
| 0.46 | % |
| 50.00 | % |
| 135.01 | % | $ | 0 |
|
| 0.00 | % |
ROMA | Roma Financial Corp MHC of NJ (31.0) |
|
| 0.00 | % |
| NA |
|
| NA |
|
| 0.33 | % |
| NA |
|
| NA |
| $ | 21 |
|
| 0.02 | % |
|
|
Source: | Audited and unaudited financial statements, corporate reports and offering circulars, and RP® Financial, LC. calculations. The information provided in this table has been obtained from sources we believe are reliable, but we cannot guarantee the accuracy or completeness of such information. |
Copyright (c) 2008 by RP® Financial, LC.
|
|
| RP® Financial, LC. |
|
|
| The downward trend in stocks continued at the start of 2008, as mounting concerns about the economy, higher oil prices and news of more large write-downs taken on subprime mortgages and debt all contributed to the negative sentiment in the stock market. IBM’s strong earnings report for the fourth provided a boost to the stock market in mid-January. Stocks tumbled sharply lower heading into the second half of January on investor’s fears of more damage to come from the subprime mortgage crisis following huge fourth quarter losses reported by Citigroup and Merrill Lynch. A surprise 0.75% rate cut by the Federal Reserve on January 22, 2008 helped to limit damage from the prior day’s sell-off in the global markets, which was spurred by fears that a U.S. recession would slow economic growth in the foreign markets as well. News of a possible bond-insurance bailout triggered a sharp mid-day rebound in the Dow Jones Industrial Average (“DJIA”) the day following the rate cut, as the DJIA recovered almost 600 points from morning lows and closed up almost 300 points for the day. Following three consecutive sessions of gains, stocks closed lower at the end of the week on profit taking. On January 25, 2008, the DJIA closed at 12207.17 or 10.4% lower since the date of the Original Appraisal and the NASDAQ closed at 2326.20 or 14.0% lower since the date of the Original Appraisal. |
|
|
| Thrift stocks generally experienced further deterioration since the date of the Original Appraisal. The mid-December downturn in the broader market following the Federal Reserve’s decision to lower rates a quarter point was evidenced in the thrift sector as well. In contrast to the broader stock market, thrift stocks continued to trade lower the day following the rate cut. The weak housing market, as reflected by a sharp drop in home prices and a drop-off in mortgage application volume, along with inflation worries and predictions of massive write-downs that would be recorded in the fourth quarter were noted factors that depressed thrift stocks through the end of December. |
|
|
| The downward spiral in thrift stocks continued at the beginning of 2008, particularly the stocks of those institutions with significant exposure to the subprime mortgage market such as Countrywide Financial and Washington Mutual. Thrift stocks in general were also hurt by weak housing data and the growing prospects that the housing slump would continue throughout 2008. News of a rise in mortgage delinquencies at Countrywide and rumors of Countrywide going into bankruptcy further contributed to the slide in thrift stocks heading into mid-January. The announced acquisition of Countrywide by Bank of America had little impact on thrift stocks in general. Earnings related worries depressed thrift stocks heading into the second half of January, reflecting expectations that more significant credit quality related losses would be a widespread factor in the fourth quarter earnings reports for thrift institutions in general. Thrift stocks moved higher on the surprise rate cut by the Federal and then spiked higher along with the broader stock market the day following the rate cut. Consistent with the broader stock market, thrift stocks traded lower at the end of the week. On January 25, 2008, the SNL Index for all publicly-traded thrifts closed at 1,041.1, a decrease of 12.1% since December 7, 2007. The SNL MHC Index closed at 3,205.7 on January 25, 2008, a decrease of 7.7% since the date of the Original Appraisal. |
|
|
| RP® Financial, LC. |
|
|
| The updated pricing measures for the Peer Group were more in line with the comparatively smaller decrease reflected in the SNL MHC Index, as compared to the larger declines reflected in the SNL Index for all publicly-traded thrifts and the updated pricing measures for all publicly-traded thrifts. The more significant decline in the market cap weighted SNL Index highlights that the large cap issues have led the downturn in thrift stocks, as many of the larger cap issues have taken large write-downs on their holdings of subprime mortgage loans and debt secured by subprime mortgages. The Peer Group’s updated pricing measures on a fully-converted basis continued to reflect higher P/E multiples and lower P/B ratios in comparison to the averages for all publicly-traded thrifts. Since the date of the Original Appraisal, the stock prices of eight out of the ten Peer Group companies were lower as of January 25, 2008. A comparative pricing analysis of the Peer Group and all publicly-traded thrifts is shown in the following table, based on market prices as of December 7, 2007 and January 25, 2008. |
Average Pricing Characteristics
|
|
|
|
|
|
|
|
|
|
|
|
| At Dec. 7, |
| At Jan. 25, |
| % |
| |||
|
|
|
|
| ||||||
| ||||||||||
Peer Group(1) |
|
|
|
|
|
|
|
|
|
|
Price/Earnings (x) |
|
| 28.33 | x |
| 27.73 | x |
| (2.1 | )% |
Price/Core Earnings (x) |
|
| 28.23 |
|
| 27.55 |
|
| (2.4 | ) |
Price/Book (%) |
|
| 86.51 | % |
| 84.26 | % |
| (2.6 | ) |
Price/Tangible Book(%) |
|
| 89.49 |
|
| 87.20 |
|
| (2.6 | ) |
Price/Assets (%) |
|
| 22.53 |
|
| 21.58 |
|
| (4.2 | ) |
Avg. Mkt. Capitalization ($Mil) |
| $ | 164.78 |
| $ | 155.46 |
|
| (5.7 | ) |
|
|
|
|
|
|
|
|
|
|
|
All Publicly-Traded Thrifts |
|
|
|
|
|
|
|
|
|
|
Price/Earnings (x) |
|
| 20.53 | x |
| 19.66 | x |
| (4.2 | )% |
Price/Core Earnings (x) |
|
| 21.00 |
|
| 20.92 |
|
| (0.4 | ) |
Price/Book (%) |
|
| 117.66 | % |
| 110.01 | % |
| (6.5 | ) |
Price/Tangible Book(%) |
|
| 133.26 |
|
| 123.89 |
|
| (7.0 | ) |
Price/Assets (%) |
|
| 15.21 |
|
| 14.42 |
|
| (5.2 | ) |
Avg. Mkt. Capitalization ($Mil) |
| $ | 361.58 |
| $ | 328.65 |
|
| (9.1 | ) |
|
|
| As set forth in the Original Appraisal, the “new issue” market is separate and distinct from the market for seasoned issues like the Peer Group companies in that the pricing ratios for converting issues are computed on a pro forma basis, specifically: (1) the numerator and denominator are both impacted by the conversion offering amount, unlike existing stock issues in which price change affects only the numerator; and (2) the pro forma pricing ratio incorporates assumptions regarding source and use of proceeds, effective tax rates, stock plan purchases, etc. which impact pro forma financials, whereas pricing for existing issues are based on reported financials. The distinction between the pricing of converting and existing issues is perhaps most evident in the case of the price/book (“P/B”) ratio in that the P/B ratio of a converting thrift will typically result in a discount to book value, whereas in the current market for existing thrifts the P/B ratio often reflects a premium to book value. Therefore, it is appropriate to also consider the market for new issues, both at the time of the conversion and in the aftermarket. |
|
|
| RP® Financial, LC. |
|
|
| In general, the difficult market environment for the overall thrift market has filtered into the new issue market as well. Most of the recent conversion offerings have been closed at the midpoint or lower, although some of the recent offerings were terminated with orders falling well short of their offering ranges. As shown in Table 5, two standard conversions, two second-step conversions and three mutual holding company offerings were completed during the past three months. The mutual holding company offerings are considered to be more relevant for purposes of our analysis. Two of the three recent mutual holding company offerings were completed in January 2008 (Sound Financial of Washington and Meridian Interstate Bancorp of Massachusetts), with both offerings closing at approximately their respective midpoints. The other recent mutual holding company offering was completed in November 2007 (Northfield Bancorp of New York), with an offering equal to the top of the selling range. On a fully-converted basis, the average closing pro forma price/tangible book ratio of the recent MHC offerings equaled 76.5%. The two mutual holding company offerings completed in January traded below their IPO prices in initial trading activity, while the mutual holding company offering completed in November traded above its IPO in initial trading activity. As of January 25, 2008, Sound Financial’s stock closed 8.5% below its IPO price, Meridian Interstate’s stock price closed 4.4% below its IPO price and Northfield Bancorp’s stock price closed 2.5% above its IPO price. |
|
|
| Shown in Table 6 are the current pricing ratios for the four companies that have completed fully-converted offerings during the past three months and are traded on NASDAQ or an Exchange. Danvers Bancorp and First Advantage Bancorp were standard conversion offerings and Home Federal Bancorp and United Financial Bancorp were second-step conversion offerings. The current average P/TB ratio of the publicly-traded recent conversions equaled 82.05%. |
|
|
| Summary of Adjustments |
|
|
| In the Original Appraisal, we made the following adjustments to Malvern Federal’s pro forma value based upon our comparative analysis to the Peer Group: |
RP® Financial, LC.
Board of Directors
January 25, 2008
Page 14
Table 5
Pricing Characteristics and After-Market Trends
Recent Conversions Completed (Last Three Months)
|
|
|
|
|
|
|
|
|
|
|
|
|
|
|
|
|
|
|
|
|
|
|
|
|
|
|
|
|
|
| Pre-Conversion Data |
|
|
|
|
| |||||||||||||||
|
|
|
|
|
|
|
|
|
|
|
|
|
| Contribution to |
| ||||||||||
Institutional Information |
|
|
| Financial Info. |
| Asset Quality |
| Offering Information |
| Charitable Found. |
| ||||||||||||||
Institution | Conver. | Ticker |
| Assets |
| Equity/ |
| NPAs/ |
| Res. |
|
| Gross |
| % |
| % of |
| Exp./ |
| Form |
| % of |
| |
|
|
|
|
|
|
|
|
|
|
|
|
|
|
|
|
|
|
|
|
|
|
|
|
|
|
Standard Conversions |
|
|
|
|
|
|
|
|
|
|
|
|
|
|
|
|
|
|
|
|
|
|
|
|
|
Danvers Bancorp, Inc., MA* | 1/10/08 | DNBK-NASDAQ |
| $ | 1,322 |
| 5.12 | % | 0.31 | % | 693 | % | $ | 171.9 |
| 100 | % | 132 | % | 1.7 | % | C/S |
| 350K/3.8% |
|
First Advantage Bancorp, TN | 11/30/07 | FABK-NASDAQ |
| $ | 219 |
| 14.70 | % | 0.80 | % | 114 | % | $ | 53.6 |
| 100 | % | 110 | % | 2.7 | % | N.A. |
| N.A. |
|
|
|
|
|
|
|
|
|
|
|
|
|
|
|
|
|
|
|
|
|
|
|
|
|
|
|
Averages - Standard Conversions: |
| $ | 771 |
| 9.91 | % | 0.56 | % | NM |
| $ | 112.8 |
| 100 | % | 121 | % | 2.2 | % | N.A. |
| N.A. |
| ||
Medians - Standard Conversions: |
| $ | 771 |
| 9.91 | % | 0.56 | % | NM |
| $ | 112.8 |
| 100 | % | 121 | % | 2.2 | % | N.A. |
| N.A. |
| ||
|
|
|
|
|
|
|
|
|
|
|
|
|
|
|
|
|
|
|
|
|
|
|
|
|
|
Second Step Conversions |
|
|
|
|
|
|
|
|
|
|
|
|
|
|
|
|
|
|
|
|
|
|
|
|
|
Home Federal Bancorp, Inc., ID* | 12/20/07 | HOME-NASDAQ |
| $ | 710 |
| 15.87 | % | 0.29 | % | 195 | % | $ | 102.0 |
| 59 | % | 85 | % | 4.4 | % | N.A. |
| N.A. |
|
United Financial Bancorp, Inc., MA* | 12/4/07 | UNBK-NASDAQ |
| $ | 1,064 |
| 13.28 | % | 0.29 | % | 260 | % | $ | 95.6 |
| 54 | % | 85 | % | 2.5 | % | N.A. |
| N.A. |
|
|
|
|
|
|
|
|
|
|
|
|
|
|
|
|
|
|
|
|
|
|
|
|
|
|
|
Averages - Second Step Conversions: |
| $ | 887 |
| 14.58 | % | 0.29 | % | 227 | % | $ | 98.8 |
| 56 | % | 85 | % | 3.4 | % | N.A. |
| N.A. |
| ||
Medians - Second Step Conversions: |
| $ | 887 |
| 14.58 | % | 0.29 | % | 227 | % | $ | 98.8 |
| 56 | % | 85 | % | 3.4 | % | N.A. |
| N.A. |
| ||
|
|
|
|
|
|
|
|
|
|
|
|
|
|
|
|
|
|
|
|
|
|
|
|
|
|
Mutual Holding Company Conversions |
|
|
|
|
|
|
|
|
|
|
|
|
|
|
|
|
|
|
|
|
|
| |||
Meridian Interstate Bncorp, Inc., MA* | 1/23/08 | EBSB-NASDAQ |
| $ | 938 |
| 12.18 | % | 0.56 | % | 72 | % | $ | 100.5 |
| 44 | % | 100 | % | 1.6 | % | S |
| 2.99% |
|
Sound Financial, Inc., WA* | 1/9/08 | SNFL-OTCBB |
| $ | 237 |
| 6.77 | % | 0.29 | % | 118 | % | $ | 13.0 |
| 44 | % | 102 | % | 6.2 | % | C/S |
| 200K/2.27% |
|
Northfield Bancorp, Inc., NY | 11/8/07 | NFBK-NASDAQ |
| $ | 1,288 |
| 13.21 | % | 0.91 | % | 40 | % | $ | 192.7 |
| 43 | % | 132 | % | 1.6 | % | C/S |
| 3M/4.65% |
|
|
|
|
|
|
|
|
|
|
|
|
|
|
|
|
|
|
|
|
|
|
|
|
|
|
|
Averages - Mutual Holding Company Conversions: |
| $ | 821 |
| 10.72 | % | 0.59 | % | 77 | % | $ | 102.0 |
| 44 | % | 111 | % | 3.1 | % | NA |
| NA |
| ||
Medians - Mutual Holding Company Conversions: |
| $ | 938 |
| 12.18 | % | 0.56 | % | 72 | % | $ | 100.5 |
| 44 | % | 102 | % | 1.6 | % | NA |
| NA |
| ||
|
|
|
|
|
|
|
|
|
|
|
|
|
|
|
|
|
|
|
|
|
|
|
|
|
|
| Averages - All Conversions: |
| $ | 825 |
| 11.59 | % | 0.49 | % | 213 | % | $ | 104.2 |
| 63 | % | 107 | % | 2.9 | % | NA |
| NA |
| |
| Medians - All Conversions: |
| $ | 938 |
| 13.21 | % | 0.31 | % | 118 | % | $ | 100.5 |
| 54 | % | 102 | % | 2.5 | % | NA |
| NA |
| |
|
|
|
|
|
|
|
|
|
|
|
|
|
|
|
|
|
|
|
|
|
|
|
|
|
|
|
|
|
|
| Insider Purchases |
|
| Pro Forma Data |
|
| |||||||||||||||||
|
|
|
|
|
|
|
| |||||||||||||||||||
Institutional Information |
|
|
| % Off Incl. Fdn. |
|
|
|
|
| Pricing Ratios(3) |
| Financial Charac. |
|
| ||||||||||||
|
|
|
|
|
|
|
| |||||||||||||||||||
|
|
|
| Benefit Plans |
|
|
| Initial |
|
|
|
|
|
|
|
|
|
|
|
|
|
| ||||
|
|
|
|
|
|
|
|
|
|
|
|
|
|
|
|
|
|
|
|
| ||||||
Institution | Conver. | Ticker |
| ESOP |
| Recog. |
| Stk |
| Mgmt.& |
|
| P/TB |
| Core |
| P/A |
| Core |
| TE/A |
| Core |
| IPO | |
|
|
|
|
|
|
|
|
|
|
|
|
|
|
|
|
|
|
|
|
|
|
|
|
|
|
|
Standard Conversions |
|
|
|
|
|
|
|
|
|
|
|
|
|
|
|
|
|
|
|
|
|
|
|
|
|
|
Danvers Bancorp, Inc., MA* | 1/10/08 | DNBK-NASDAQ |
| 8.0 | % | 4.0 | % | 10.0 | % | 2.8 | % | 0.00 | % | 82.3 | % | 29.9 | x | 12.1 | % | 0.4 | % | 14.7 | % | 2.8 | % | $ 10.00 |
First Advantage Bancorp, TN | 11/30/07 | FABK-NASDAQ |
| 8.0 | % | 4.0 | % | 10.0 | % | 10.0 | % | 0.00 | % | 68.3 | % | 42.6 | x | 19.9 | % | 0.8 | % | 47.0 | % | 1.6 | % | $ 10.00 |
|
|
|
|
|
|
|
|
|
|
|
|
|
|
|
|
|
|
|
|
|
|
|
|
|
|
|
Averages - Standard Conversions: |
| 8.0 | % | 4.0 | % | 10.0 | % | 6.4 | % | 0.00 | % | 75.3 | % | 36.2 | x | 16.0 | % | 0.6 | % | 30.9 | % | 2.2 | % | $ 10.00 | ||
Medians - Standard Conversions: |
| 8.0 | % | 4.0 | % | 10.0 | % | 6.4 | % | 0.00 | % | 75.3 | % | 36.2 | x | 16.0 | % | 0.6 | % | 30.9 | % | 2.2 | % | $ 10.00 | ||
|
|
|
|
|
|
|
|
|
|
|
|
|
|
|
|
|
|
|
|
|
|
|
|
|
|
|
Second Step Conversions |
|
|
|
|
|
|
|
|
|
|
|
|
|
|
|
|
|
|
|
|
|
|
|
|
|
|
Home Federal Bancorp, Inc., ID* | 12/20/07 | HOME-NASDAQ |
| 8.0 | % | 3.5 | % | 8.7 | % | 0.6 | % | 1.90 | % | 87.3 | % | 32.5 | x | 21.8 | % | 0.7 | % | 25.0 | % | 2.7 | % | $ 10.00 |
United Financial Bancorp, Inc., MA* | 12/4/07 | UNBK-NASDAQ |
| 7.9 | % | 3.8 | % | 9.4 | % | 0.4 | % | 2.30 | % | 79.6 | % | 35.2 | x | 15.5 | % | 0.4 | % | 19.5 | % | 2.3 | % | $ 10.00 |
|
|
|
|
|
|
|
|
|
|
|
|
|
|
|
|
|
|
|
|
|
|
|
|
|
|
|
Averages - Second Step Conversions: |
| 7.9 | % | 3.6 | % | 9.0 | % | 0.5 | % | 2.10 | % | 83.4 | % | 33.8 | x | 18.6 | % | 0.6 | % | 22.2 | % | 2.5 | % | $ 10.00 | ||
Medians - Second Step Conversions: |
| 7.9 | % | 3.6 | % | 9.0 | % | 0.5 | % | 2.10 | % | 83.4 | % | 33.8 | x | 18.6 | % | 0.6 | % | 22.2 | % | 2.5 | % | $ 10.00 | ||
|
|
|
|
|
|
|
|
|
|
|
|
|
|
|
|
|
|
|
|
|
|
|
|
|
|
|
Mutual Holding Company Conversions |
|
|
|
|
|
|
|
|
|
|
|
|
|
|
|
|
|
|
|
|
|
|
| |||
Meridian Interstate Bncorp, Inc., MA* | 1/23/08 | EBSB-NASDAQ |
| 8.0 | % | 4.0 | % | 10.0 | % | 1.3 | % | 0.00 | % | 73.7 | % | 48.5 | x | 20.3 | % | 0.3 | % | 20.0 | % | 1.6 | % | $ 10.00 |
Sound Financial, Inc., WA* | 1/9/08 | SNFL-OTCBB |
| 8.7 | % | 4.4 | % | 10.9 | % | 11.4 | % | 0.00 | % | 72.4 | % | 39.4 | x | 11.8 | % | 0.2 | % | 11.2 | % | 2.1 | % | $ 10.00 |
Northfield Bancorp, Inc., NY | 11/8/07 | NFBK-NASDAQ |
| 8.7 | % | 4.4 | % | 10.9 | % | 2.0 | % | 0.00 | % | 83.3 | % | 30.2 | x | 26.8 | % | 0.8 | % | 21.8 | % | 3.3 | % | $ 10.00 |
|
|
|
|
|
|
|
|
|
|
|
|
|
|
|
|
|
|
|
|
|
|
|
|
|
|
|
Averages - Mutual Holding Company Conversions: |
| 8.5 | % | 4.2 | % | 10.6 | % | 4.9 | % | 0.00 | % | 76.5 | % | 39.4 | x | 19.6 | % | 0.4 | % | 17.7 | % | 2.3 | % | $ 10.00 | ||
Medians - Mutual Holding Company Conversions: |
| 8.7 | % | 4.4 | % | 10.9 | % | 2.0 | % | 0.00 | % | 73.7 | % | 39.4 | x | 20.3 | % | 0.3 | % | 20.0 | % | 2.1 | % | $ 10.00 | ||
|
|
|
|
|
|
|
|
|
|
|
|
|
|
|
|
|
|
|
|
|
|
|
|
|
|
|
Averages - All Conversions: |
| 8.2 | % | 4.0 | % | 10.0 | % | 4.1 | % | 0.60 | % | 78.1 | % | 36.9 | x | 18.3 | % | 0.5 | % | 22.7 | % | 2.3 | % | $ 10.00 | ||
Medians - All Conversions: |
| 8.0 | % | 4.0 | % | 10.0 | % | 2.0 | % | 0.00 | % | 79.6 | % | 35.2 | x | 19.9 | % | 0.4 | % | 20.0 | % | 2.3 | % | $ 10.00 | ||
|
|
|
|
|
|
|
|
|
|
|
|
|
|
|
|
|
|
|
|
|
|
|
|
Institutional Information |
|
|
| Post-IPO Pricing Trends |
| ||||||||||||||||||
|
| ||||||||||||||||||||||
|
|
|
| Closing Price: |
| ||||||||||||||||||
|
|
|
|
| |||||||||||||||||||
Institution | Conver. | Ticker |
|
| First |
| % |
|
| After |
| % |
|
| After |
| % |
|
| Thru |
| % |
|
| |||||||||||||||||||||||
|
|
|
|
|
|
|
|
|
|
|
|
|
|
|
|
|
|
|
|
|
|
|
|
Standard Conversions |
|
|
|
|
|
|
|
|
|
|
|
|
|
|
|
|
|
|
|
|
|
|
|
Danvers Bancorp, Inc., MA* | 1/10/08 | DNBK-NASDAQ |
| $ | 9.74 |
| -2.6% |
| $ | 9.69 |
| -3.1% |
| $ | 9.80 |
| -2.0% |
| $ | 9.80 |
| -2.0% |
|
First Advantage Bancorp, TN | 11/30/07 | FABK-NASDAQ |
| $ | 11.17 |
| 11.7% |
| $ | 10.70 |
| 7.0% |
| $ | 10.65 |
| 6.5% |
| $ | $10.65 |
| 6.5% |
|
|
|
|
|
|
|
|
|
|
|
|
|
|
|
|
|
|
|
|
|
|
|
|
|
| Averages - Standard Conversions: |
| $ | 10.46 |
| 4.6% |
| $ | 10.20 |
| 1.9% |
| $ | 10.23 |
| 2.3% |
| $ | 10.23 |
| 2.3% |
| |
| Medians - Standard Conversions: |
| $ | 10.46 |
| 4.6% |
| $ | 10.20 |
| 1.9% |
| $ | 10.23 |
| 2.3% |
| $ | 10.23 |
| 2.3% |
| |
|
|
|
|
|
|
|
|
|
|
|
|
|
|
|
|
|
|
|
|
|
|
|
|
Second Step Conversions |
|
|
|
|
|
|
|
|
|
|
|
|
|
|
|
|
|
|
|
|
|
|
|
Home Federal Bancorp, Inc., ID* | 12/20/07 | HOME-NASDAQ |
| $ | 9.88 |
| -1.2% |
| $ | 10.17 |
| 1.7% |
| $ | 10.30 |
| 3.0% |
| $ | 10.27 |
| 2.7% |
|
United Financial Bancorp, Inc., MA* | 12/4/07 | UNBK-NASDAQ |
| $ | 10.30 |
| 3.0% |
| $ | 10.47 |
| 4.7% |
| $ | 10.50 |
| 5.0% |
| $ | 10.98 |
| 9.8% |
|
|
|
|
|
|
|
|
|
|
|
|
|
|
|
|
|
|
|
|
|
|
|
|
|
Averages - Second Step Conversions: |
| $ | 10.09 |
| 0.9% |
| $ | 10.32 |
| 3.2% |
| $ | 10.40 |
| 4.0% |
| $ | 10.63 |
| 6.3% |
| ||
Medians - Second Step Conversions: |
| $ | 10.09 |
| 0.9% |
| $ | 10.32 |
| 3.2% |
| $ | 10.40 |
| 4.0% |
| $ | 10.63 |
| 6.3% |
| ||
|
|
|
|
|
|
|
|
|
|
|
|
|
|
|
|
|
|
|
|
|
|
|
|
Mutual Holding Company Conversions |
|
|
|
|
|
|
|
|
|
|
|
|
|
|
|
|
|
|
|
|
| ||
Meridian Interstate Bncorp, Inc., MA* | 1/23/08 | EBSB-NASDAQ |
| $ | 9.60 |
| -4.0% |
| $ | 9.56 |
| -4.4% |
| $ | 9.56 |
| -4.4% |
| $ | 9.56 |
| -4.4% |
|
Sound Financial, Inc., WA* | 1/9/08 | SNFL-OTCBB |
| $ | 9.00 |
| -10.0% |
| $ | 9.06 |
| -9.4% |
| $ | 9.15 |
| -8.5% |
| $ | 9.15 |
| -8.5% |
|
Northfield Bancorp, Inc., NY | 11/8/07 | NFBK-NASDAQ |
| $ | 10.45 |
| 4.5% |
| $ | 11.67 |
| 16.7% |
| $ | 10.49 |
| 4.9% |
| $ | 10.25 |
| 2.5% |
|
|
|
|
|
|
|
|
|
|
|
|
|
|
|
|
|
|
|
|
|
|
|
|
|
Averages - Mutual Holding Company Conversions: |
| $ | 9.68 |
| -3.2% |
| $ | 10.10 |
| 1.0% |
| $ | 9.73 |
| -2.7% |
| $ | 9.65 |
| -3.5% |
| ||
Medians - Mutual Holding Company Conversions: |
| $ | 9.60 |
| -4.0% |
| $ | 9.56 |
| -4.4% |
| $ | 9.56 |
| -4.4% |
| $ | 9.56 |
| -4.4% |
| ||
|
|
|
|
|
|
|
|
|
|
|
|
|
|
|
|
|
|
|
|
|
|
|
|
Averages - All Conversions: |
| $ | 10.02 |
| 0.2% |
| $ | 10.19 |
| 1.9% |
| $ | 10.06 |
| 0.6% |
| $ | 10.09 |
| 0.9% |
| ||
Medians - All Conversions: |
| $ | 9.88 |
| -1.2% |
| $ | 10.17 |
| 1.7% |
| $ | 10.30 |
| 3.0% |
| $ | 10.25 |
| 2.5% |
| ||
|
|
Note: * - | Appraisal performed by RP Financial;BOLD=RP Financial did the Conversion Business Plan. “NT” - Not Traded; “NA” - Not Applicable, Not Available; C/S-Cash/Stock. |
|
|
(1) | Non-OTS regulated thrift. |
|
|
(2) | As a percent of MHC offering for MHC transactions. |
|
|
(3) | Does not take into account the adoption of SOP 93-6. |
|
|
(4) | Latest price if offering is less than one week old. |
|
|
(5) | Latest price if offering is more than one week but less than one month old. |
|
|
(6) | Mutual holding company pro forma data on full conversion basis. |
|
|
(7) | Simultaneously completed acquisition of another financial institution. |
|
|
(8) | Simultaneously converted to a commercial bank charter. |
|
|
(9) | Former credit union. |
|
|
| January 25, 2008 |
RP® Financial, LC.
Board of Directors
January 25, 2008
Page 15
Table 6
Market Pricing Comparatives
Prices As of January 25, 2008
|
|
|
|
|
|
|
|
|
|
|
|
|
|
|
|
|
|
|
|
|
|
|
|
|
|
|
|
|
|
|
|
|
|
| Market |
| Per Share Data |
|
|
|
|
|
|
|
|
|
|
|
|
|
|
|
| ||||||||
|
|
|
| Capitalization |
|
| Pricing Ratios(3) |
| ||||||||||||||||||||||
|
|
|
|
| Core |
| Book |
|
| |||||||||||||||||||||
Financial Institution |
| Price/ |
| Market |
|
|
| P/E |
| P/B |
| P/A |
| P/TB |
| P/Core |
| |||||||||||||
|
|
|
|
|
|
|
|
|
| |||||||||||||||||||||
|
| ($) |
| ($Mil) |
| ($) |
| ($) |
| (x) |
| (%) |
| (%) |
| (%) |
| (x) |
| |||||||||||
|
|
|
|
|
|
|
|
|
|
|
|
|
|
|
|
|
|
|
|
|
|
|
|
|
|
|
|
|
|
|
All Public Companies |
| $ | 13.53 |
|
| 328.65 |
| $ | 0.68 |
| $ | 13.33 |
|
| 19.66x |
|
| 110.01 | % |
| 14.42 | % |
| 123.89 | % |
| 20.92x |
| ||
Converted Last 3 Months (no MHC) |
| $ | 10.36 |
|
| 149.84 |
| $ | 0.29 |
| $ | 12.72 |
|
| 31.96x |
|
| 81.97 | % |
| 17.98 | % |
| 82.05 | % |
| 33.45x |
| ||
|
|
|
|
|
|
|
|
|
|
|
|
|
|
|
|
|
|
|
|
|
|
|
|
|
|
|
|
| ||
Converted Last 3 Months (no MHC) |
|
|
|
|
|
|
|
|
|
|
|
|
|
|
|
|
|
|
|
|
|
|
|
|
|
|
|
| ||
DNBK |
| Danvers Bancorp, Inc. of MA |
| $ | 9.80 |
| $ | 174.86 |
| $ | 0.34 |
| $ | 12.18 |
|
| 28.82x |
|
| 80.46 | % |
| 11.88 | % |
| 80.66 | % |
| 28.82x |
|
FABK |
| First Advantage Bancorp of TN |
| $ | 10.65 |
| $ | 56.07 |
| $ | 0.23 |
| $ | 14.65 |
|
| NM |
|
| 72.70 | % |
| 21.22 | % |
| 72.70 | % |
| NM |
|
HOME |
| Home Federal Bancorp Inc. of ID |
| $ | 10.02 |
| $ | 173.39 |
| $ | 0.31 |
| $ | 11.46 |
|
| 27.83x |
|
| 87.43 | % |
| 21.82 | % |
| 87.43 | % |
| 32.32x |
|
UBNK |
| United Financial Bancorp of MA |
| $ | 10.98 |
| $ | 195.05 |
| $ | 0.28 |
| $ | 12.58 |
|
| 39.21x |
|
| 87.28 | % |
| 17.02 | % |
| 87.42 | % |
| 39.21x |
|
|
|
|
|
|
|
|
|
|
|
|
|
|
|
|
|
|
|
|
|
|
|
|
|
|
|
|
|
|
|
| Dividends(4) |
| Financial Characteristics(6) |
| |||||||||||||||||
|
|
|
|
|
|
| |||||||||||||||||||
|
|
|
| Amount/ |
| Yield |
| Payout |
| Total |
| Equity/ |
| NPAs/ |
| Reported |
| Core |
| ||||||
|
|
|
|
|
|
|
|
|
|
|
| ||||||||||||||
|
|
|
|
|
|
|
|
|
| ROA |
| ROE |
| ROA |
| ROE |
| ||||||||
|
|
|
|
|
|
|
|
|
|
|
| ||||||||||||||
|
| ($) |
| ($Mil) |
| (%) |
| ($Mil) |
| (%) |
| (%) |
| (%) |
| (%) |
| (%) |
| (%) |
| ||||
|
|
|
|
|
|
|
|
|
|
|
|
|
|
|
|
|
|
|
|
|
|
|
| ||
All Public Companies |
| $ | 0.39 |
| 2.73 | % | 33.05 | % | $ | 3,142 |
| 12.84 | % | 0.65 | % | 0.52 | % | 4.61 | % | 0.47 | % | 4.38 | % | ||
Converted Last 3 Months (no MHC) |
| $ | 0.11 |
| 1.00 | % | 20.43 | % | $ | 919 |
| 22.10 | % | 0.39 | % | 0.50 | % | 2.36 | % | 0.49 | % | 2.32 | % | ||
|
|
|
|
|
|
|
|
|
|
|
|
|
|
|
|
|
|
|
|
|
|
|
|
|
|
Converted Last 3 Months (no MHC) |
|
|
|
|
|
|
|
|
|
|
|
|
|
|
|
|
|
|
|
|
|
|
| ||
DNBK |
| Danvers Bancorp, Inc. of MA |
| $ | 0.00 |
| 0.00 | % | 0.00 | % | $ | 1,472 |
| 14.77 | % | NA |
| 0.41 | % | 2.79 | % | 0.41 | % | 2.79 | % |
FABK |
| First Advantage Bancorp of TN |
| $ | 0.00 |
| 0.00 | % | 0.00 | % | $ | 264 |
| 29.19 | % | 0.80 | % | 0.38 | % | 1.30 | % | 0.46 | % | 1.57 | % |
HOME |
| Home Federal Bancorp Inc. of ID |
| $ | 0.19 |
| 1.90 | % | 61.29 | % | $ | 795 |
| 24.95 | % | 0.07 | % | 0.78 | % | 3.14 | % | 0.67 | % | 2.71 | % |
UBNK |
| United Financial Bancorp of MA |
| $ | 0.23 |
| 2.09 | % | NM |
| $ | 1,146 |
| 19.49 | % | 0.29 | % | 0.43 | % | 2.23 | % | 0.43 | % | 2.23 | % |
|
|
|
|
|
|
|
|
|
|
|
|
|
|
|
|
|
|
|
|
|
|
|
|
|
|
|
|
(1) | Average of High/Low or Bid/Ask price per share. |
|
|
(2) | EPS (estimate core basis) is based on actual trailing 12 month data, adjusted to omit non-operating items on a tax-effected basis. |
|
|
(3) | P/E = Price to earnings; P/B = Price to book; P/A = Price to assets; P/TB = Price to tangible book value; and P/Core = Price to core earnings. |
|
|
(4) | Indicated 12 month dividend, based on last quarterly dividend declared. |
|
|
(5) | Indicated 12 month dividend as a percent of trailing 12 month estimated core earnings. |
|
|
(6) | ROA (return on assets) and ROE (return on equity) are indicated ratios based on trailing 12 month common earnings and average common equity and total assets balances. |
|
|
(7) | Excludes from averages and medians those companies the subject of actual or rumored acquisition activities or unusual operating characteristics. |
|
|
Source: | Corporate reports, offering circulars, and RP® Financial, LC. calculations. The information provided in this report has been obtained from sources we believe are reliable, but we cannot guarantee the accuracy or completeness of such information. |
Copyright (c) 2008 by RP® Financial, LC.
|
|
| RP®Financial, LC. |
| Boards of Directors |
| January 25, 2008 |
| Page 16 |
|
|
|
|
|
|
|
|
| Key Valuation Parameters: | PreviousValuation | |
| |||
| Financial Condition |
| No Adjustment |
| Profitability, Growth and Viability of Earnings |
| No Adjustment |
| Asset Growth |
| No Adjustment |
| Primary Market Area |
| Moderate Upward |
| Dividends |
| No Adjustment |
| Liquidity of the Shares |
| No Adjustment |
| Marketing of the Issue |
| Moderate Downward |
| Management |
| No Adjustment |
| Effect of Govt. Regulations and Regulatory Reform |
| No Adjustment |
|
|
| The factors concerning the valuation parameters of primary market area, dividends, liquidity of the shares, management and effect of government regulations and regulatory reform did not change since the Original Appraisal. Accordingly, those parameters were not discussed further in this update. |
|
|
| In terms of financial condition, no adjustment remained appropriate as there were no significant changes in the Bank’s and the Peer Group’s respective balance sheet ratios. The increase in the Bank’s non-performing loan balance was substantially related to one loan and was taken into consideration in the Bank’s fourth fiscal quarter through the establishment of additional loan loss provisions. No adjustment remained appropriate for asset growth as well, as the Bank and the Peer Group posted similar asset growth rates sustained by loan growth and on a pro forma basis the Bank’s leverage capacity will be fairly comparable to the Peer Group’s. No adjustment also remained appropriate for earnings, as the Bank’s more favorable core earnings measures continued to be offset by the higher level of loan provisions that were established by the Bank, which was mostly attributable to the loss provisions established in the fourth quarter of fiscal 2007 in consideration of the commercial real estate that went into non-accrual status during the quarter ended December 31, 2007. |
|
|
| The general market for thrift stocks deteriorated further since the date of the Original appraisal, as indicated by the decreases recorded in the SNL Index for all publicly-traded thrifts and the SNL MHC Index for all publicly-traded MHCs. The updated pricing measures for the Peer Group and all publicly-traded thrifts were lower as well compared to the Original Appraisal. Recent thrift offerings have encountered the same challenging market environment that has depressed the broader thrift market, with the majority of recently completed offerings closing at the midpoint or lower. At the same time, some of the recent conversion offerings have not been successfully completed due to orders falling well short of the minimum of their offering ranges. Two of the three recently completed MHC offerings are currently trading below their IPO prices. Accordingly, taking into account the market performance of all-publicly traded thrifts, the Peer Group and recent conversions since the date of the Original Appraisal, a more significant downward adjustment has been applied for marketing of the issue. |
|
|
| RP®Financial, LC. |
| Boards of Directors |
| January 25, 2008 |
| Page 17 |
|
|
| Overall, taking into account the foregoing factors, we believe that a decrease in the Bank’s estimated pro market value as set forth in the Original Appraisal is appropriate. |
|
|
| Basis of Valuation. Fully-Converted Pricing Ratios |
|
|
| Consistent with the original appraisal, to calculate the fully-converted pricing information for MHCs, the reported financial information for the Peer Group companies has been adjusted as follows: (1) all shares owned by the MHC are assumed to be sold at the current trading price in a second-step conversion; (2) the gross proceeds from such a sale are adjusted to reflect reasonable offering expenses and standard stock based benefit plan parameters that would be factored into a second-step conversion of MHC institutions; (3) net proceeds are assumed to be reinvested at market rates on an after-tax basis; and (4) the public ownership interest is adjusted to reflect the pro forma impact of the waived dividends pursuant to applicable regulatory policy. Book value per share and earnings per share figures for the Peer Group companies are adjusted by the impact of the assumed second-step conversion, resulting in an estimation of book value per share and earnings per share figures on a fully-converted basis. Table 7 on the following page shows the calculation of per share financial data (fully-converted basis) for each of the public MHC institutions that form the Peer Group. |
|
|
| Valuation Approaches |
|
|
| In applying the accepted valuation methodology promulgated by the regulatory agencies, i.e., the pro forma market value approach, we considered the three key pricing ratios in valuing Malvern Federal’s to-be-issued stock — price/earnings (“P/E”), price/book (“P/B”), and price/assets (“P/A”) approaches — all performed on a pro forma basis including the effects of the conversion proceeds. |
|
|
| In computing the pro forma impact of the conversion and the related pricing ratios, the valuation parameters utilized in the Original Appraisal did not change in this update, except the reinvestment rate was updated to equal the yield on one-year U.S. Government securities at December 31, 2007. In the Original Appraisal, the reinvestment rate was equal to the yield on one-year U.S. Government securities at September 30, 2007. |
|
|
| RP®Financial, LC. |
| Board of Directors |
| January 25, 2008 |
| Page 18 |
Table 7
Calculation of Implied Per Share Data – Incorporating MHC Second Step Conversion
Comparable Institution Analysis
For the 12 Months Ended September 30, 2007
|
|
|
|
|
|
|
|
|
|
|
|
|
|
|
|
|
|
|
|
|
|
|
|
|
|
|
|
|
|
|
| Current Ownership |
| Current Per Share Data (MHC Ratios) |
| Impact of Second Step Conversion(4) |
| ||||||||||||||||||
|
|
|
|
|
|
| |||||||||||||||||||||
|
|
|
| Total |
| Public |
| MHC |
| EPS |
| Core |
| Book |
| Tang. |
| Assets |
| Share |
| Gross |
| Net Incr. |
| Net Incr. |
|
|
|
|
|
|
|
|
|
|
|
|
|
|
|
|
| ||||||||||||
|
|
|
| (000) |
| (000) |
| (000) |
| ($) |
| ($) |
| ($) |
| ($) |
| ($) |
| ($) |
| ($000) |
| ($000) |
| ($000) |
|
Publicly-Traded MHC Institutions |
|
|
|
|
|
|
|
|
|
|
|
|
|
|
|
|
|
|
|
|
|
|
| ||||
BFSB |
| Brooklyn Federal MHC of NY (31.0) |
| 13,311 |
| 3,968 |
| 9,343 |
| 0.29 |
| 0.28 |
| 6.41 |
| 6.41 |
| 29.33 |
| 12.83 |
| 119,871 |
| 103,089 |
| 2,012 |
|
COBK |
| Colonial Bank MHC of NJ (44.9) |
| 4,433 |
| 2,080 |
| 2,353 |
| 0.33 |
| 0.32 |
| 8.50 |
| 8.50 |
| 99.00 |
| 10.30 |
| 24,236 |
| 20,843 |
| 407 |
|
CSBK |
| Clifton Savings Bncrp MHC of NJ (41.0) |
| 27,890 |
| 12,813 |
| 15,077 |
| 0.08 |
| 0.08 |
| 6.30 |
| 6.30 |
| 28.39 |
| 9.88 |
| 148,961 |
| 128,106 |
| 2,501 |
|
FXCB |
| Fox Chase Bancorp MHC of PA (44.5) |
| 14,680 |
| 6,531 |
| 8,149 |
| 0.25 |
| 0.28 |
| 8.66 |
| 8.66 |
| 50.77 |
| 10.75 |
| 87,602 |
| 75,338 |
| 1,471 |
|
LSBK |
| Lake Shore Bancorp MHC of NY (43.7) |
| 6,464 |
| 2,976 |
| 3,488 |
| 0.23 |
| 0.23 |
| 8.24 |
| 8.24 |
| 55.13 |
| 9.10 |
| 31,741 |
| 27,297 |
| 533 |
|
MGYR |
| Magyar Bancorp MHC of NJ (45.1) |
| 5,791 |
| 2,723 |
| 3,068 |
| 0.12 |
| 0.12 |
| 8.32 |
| 8.32 |
| 81.71 |
| 10.53 |
| 32,331 |
| 27,830 |
| 544 |
|
ONFC |
| Oneida Financial MHC of NY (43.9) |
| 7,788 |
| 3,474 |
| 4,314 |
| 0.49 |
| 0.50 |
| 7.53 |
| 4.25 |
| 65.94 |
| 9.03 |
| 38,955 |
| 33,502 |
| 654 |
|
OSHC |
| Ocean Shore Holding MHC of NJ (44.0) |
| 8,408 |
| 3,860 |
| 4,548 |
| 0.30 |
| 0.30 |
| 7.43 |
| 7.43 |
| 71.77 |
| 10.00 |
| 45,480 |
| 39,113 |
| 764 |
|
PBIP |
| Prudential Bancorp MHC PA (40.5) |
| 11,478 |
| 5,155 |
| 6,323 |
| 0.30 |
| 0.30 |
| 7.05 |
| 7.05 |
| 41.31 |
| 12.72 |
| 80,806 |
| 69,869 |
| 1,369 |
|
ROMA |
| Roma Financial Corp MHC of NJ (31.0) |
| 31,750 |
| 10,147 |
| 21,603 |
| 0.25 |
| 0.25 |
| 7.01 |
| 6.99 |
| 27.62 |
| 15.25 |
| 329,446 |
| 283,323 |
| 5,531 |
|
|
|
|
|
|
|
|
|
|
|
|
|
|
|
|
|
|
|
|
|
|
|
|
|
|
|
|
|
|
|
|
|
|
|
|
|
|
|
|
|
|
|
|
|
|
|
|
|
|
| Pro Forma |
| Pro Forma(5) |
| ||||||||||
|
|
|
|
|
| ||||||||||||
|
|
|
| EPS |
| Core |
| Book |
| Tang. |
| Assets |
| Public |
| Dilution |
|
|
|
|
|
|
|
|
|
|
|
| |||||||
|
|
|
| ($) |
| ($) |
| ($) |
| ($) |
| ($) |
| (%) |
| (%) |
|
Publicly-Traded MHC Institutions |
|
|
|
|
|
|
|
|
|
|
|
|
|
|
| ||
BFSB |
| Brooklyn Federal MHC of NY (31.0) |
| 0.44 |
| 0.43 |
| 14.15 |
| 14.15 |
| 37.07 |
| 29.8 |
| 0.0 |
|
COBK |
| Colonial Bank MHC of NJ (44.9) |
| 0.42 |
| 0.41 |
| 13.2 |
| 13.20 |
| 103.7 |
| 46.9 |
| 0.0 |
|
CSBK |
| Clifton Savings Bncrp MHC of NJ (41.0) |
| 0.17 |
| 0.17 |
| 10.89 |
| 10.89 |
| 32.98 |
| 45.9 |
| 0.0 |
|
FXCB |
| Fox Chase Bancorp MHC of PA (44.5) |
| 0.35 |
| 0.38 |
| 13.79 |
| 13.79 |
| 55.90 |
| 44.5 |
| 0.0 |
|
LSBK |
| Lake Shore Bancorp MHC of NY (43.7) |
| 0.31 |
| 0.31 |
| 12.46 |
| 12.46 |
| 59.35 |
| 46.0 |
| 0.0 |
|
MGYR |
| Magyar Bancorp MHC of NJ (45.1) |
| 0.21 |
| 0.21 |
| 13.12 |
| 13.12 |
| 86.48 |
| 47.0 |
| 0.0 |
|
ONFC |
| Oneida Financial MHC of NY (43.9) |
| 0.57 |
| 0.58 |
| 11.83 |
| 8.55 |
| 70.24 |
| 44.6 |
| 0.0 |
|
OSHC |
| Ocean Shore Holding MHC of NJ (44.0) |
| 0.39 |
| 0.39 |
| 12.08 |
| 12.08 |
| 76.42 |
| 45.9 |
| 0.0 |
|
PBIP |
| Prudential Bancorp MHC PA (40.5) |
| 0.42 |
| 0.42 |
| 13.10 |
| 13.10 |
| 47.28 |
| 44.8 |
| -0.1 |
|
ROMA |
| Roma Financial Corp MHC of NJ (31.0) |
| 0.42 |
| 0.42 |
| 15.93 |
| 15.91 |
| 36.54 |
| 32.0 |
| 0.0 |
|
|
|
|
|
|
|
|
|
|
|
|
|
|
|
|
|
|
|
|
|
|
|
|
(1) | Gross proceeds calculated as stock price multiplied by the number of shares owned by the mutual holding company (i.e., non-public shares). | |||
|
|
|
| |
(2) | Net increase in capital reflects gross proceeds less offering expenses, contra-equity account for leveraged ESOP and deferred compensation account for restricted stock plan. For institutions with assets at the MHC level, the net increase in capital also includes consolidation of MHC assets with the capital of the institution concurrent with hypothetical second step. | |||
|
| |||
|
| Offering expense percent | 2.00% |
|
|
| ESOP percent purchase | 8.00% |
|
|
| Recognition plan percent | 4.00% |
|
|
|
|
|
|
(3) | Net increase in earnings reflects after-tax reinvestment income (assumes ESOP and recognition plan do not generate reinvestment income), less after-tax ESOP amortization and recognition plan vesting: | |||
|
| |||
|
| After-tax reinvestment | 3.18% |
|
|
| ESOP loan term (years) | 10 |
|
|
| Recognition plan vesting (years) | 5 |
|
|
| Effective tax rate | 34.00% |
|
|
|
|
|
|
(4) | Figures reflect adjustments to “non-grandfathered” companies to reflect dilutive impact of cumulative dividends waived by the MHC (reflect FDIC policy regarding waived dividends). | |||
|
|
|
| |
(5) | Reflects pro forma ownership position of minority stockholders after taking into account the OTS and FDIC policies regarding waived dividends assuming a hypothetical second step. For OTS “grandfathered” companies, dilution reflects excess waived dividends and MHC assets. For all other companies, dilution reflects all waived dividends and MHC assets. | |||
|
|
Source: | Audited and unaudited financial statements, corporate reports, offering circulars, and RP Financial, LC. calculations. The information provided in this report has been obtained from sources we believe are reliable, but we cannot guarantee the accuracy or completeness of such information. |
Copyright (c) 2008 by RP® Financial, LC.
|
|
| RP® Financial, LC. |
| Boards of Directors |
| January 25, 2008 |
| Page 19 |
|
|
| Consistent with the Original Appraisal, this updated appraisal continues to be based primarily on fundamental analysis techniques applied to the Peer Group, including the P/E approach, the P/B approach and the P/A approach. Also consistent with the Original Appraisal, this updated appraisal incorporates a “technical” analysis of recently completed conversion and MHC offerings, including principally the P/B approach which (as discussed in the Original Appraisal) is the most meaningful pricing ratio as the pro forma P/E ratios reflect an assumed reinvestment rate and do not yet reflect the actual use of proceeds. |
|
|
| The Bank will adopt Statement of Position (“SOP” 93-6) which will cause earnings per share computations to be based on shares issued and outstanding excluding shares owned by an ESOP where there is not a commitment to release such shares. For the purpose of preparing the pro forma pricing tables and exhibits, we have reflected all shares issued in the offering including shares purchased by the ESOP as outstanding to capture the full dilutive impact of such stock to the Bank’s shareholders. However, we have considered the impact of the Bank’s adoption of SOP 93-6 in the determination of pro forma market value. |
|
|
| Based on the foregoing, we have concluded that a decrease in Malvern Federal’s value is appropriate. Accordingly, RP Financial concluded that as of January 25, 2008, the pro forma market value of the Bank’s full conversion offering, taking into account the dilutive impact of the stock contribution to the Foundation, equaled $63,000,000 at the midpoint, equal to 6,300,000 shares at $10.00 per share. |
|
|
| 1.P/E Approach. In applying the P/E approach, RP Financial’s valuation conclusions considered both reported earnings and a recurring or “core” earnings base, that is, earnings adjusted to exclude any one time non-operating and extraordinary items, plus the estimated after tax-earnings benefit from reinvestment of net stock proceeds. The Bank’s reported earnings equaled $1.960 million for the twelve months ended December 31, 2007. In deriving Malvern Federal’s core earnings, the only adjustment made to reported earnings was to eliminate $35,000 of net gains realized from the sale of loans and investments for the twelve months ended December 31, 2007. As shown below, on a tax effected basis, assuming application of an effective marginal tax rate of 38.5% for the adjustment, the Bank’s core earnings were determined to equal $1.938 million for the twelve months ended December 31, 2007. (Note: see Exhibit 2 for the adjustments applied to the Peer Group’s earnings in the calculation of core earnings). |
|
|
|
|
|
|
| Amount |
| |
|
|
| ||
|
| ($000) |
| |
|
|
|
| |
Net income |
| $ | 1,960 |
|
Deduct: Net gains on loans and investments(1) |
|
| (22 | ) |
|
|
| ||
Core earnings estimate |
| $ | 1,938 |
|
|
|
|
|
|
(1) Tax effected at 38.5%. |
|
|
|
|
|
RP® Financial, LC. |
Boards of Directors |
January 25, 2008 |
Page 20 |
Based on Malvern Federal’s reported and estimated core earnings, and incorporating the impact of the pro forma assumptions discussed previously, the Bank’s reported and core P/E multiples (fully-converted basis) at the $63.0 million midpoint value equaled 30.21 times and 30.54 times, respectively. The Bank’s updated reported and core P/E multiples provided for premiums of 8.9% and 10.9% relative to the Peer Group’s average reported and core P/E multiples of 27.73 times and 27.55 times, respectively (versus discounts of 12.0% and 11.8% relative to the Peer Group’s average reported and core P/E multiples as indicated in the Original Appraisal). In comparison to the Peer Group’s median reported and core earnings multiples of 29.26 times and 28.82 times, respectively, the Bank’s pro forma reported and core P/E multiples at the $63.0 million value indicated premiums of 3.2% and 6.0% (versus discounts of 13.2% and 13.3% relative to the Peer Group’s median reported and core P/E multiples as indicated in the Original Appraisal). The Bank’s implied conversion pricing ratios relative to the Peer Group’s pricing ratios are indicated in Table 8, and the pro forma calculations are detailed in Exhibits 3 and 4.
On an MHC reported basis, the Bank’s reported and core P/E multiples at the $63.0 million value equaled 32.42 times and 32.79 time, respectively. The Bank’s updated reported and core P/E multiples provided for premiums of 5.8% and 1.5% relative to the Peer Group’s average reported and core P/E multiples of 30.63 times and 32.31 times, respectively (versus discounts of 15.3% and 15.8% relative to the Peer Group’s average reported and core P/E multiples as indicated in the Original Appraisal). In comparison to the Peer Group’s median reported and core earnings multiples of 32.27 times and 33.3 times, respectively, the Bank’s pro forma reported and core P/E multiples at the $63.0 million value indicated a premium of 0.5% and a discount of 1.6% on an MHC reported basis (versus discounts of 19.0% and 19.1% relative to the Peer Group’s median reported and core P/E multiples as indicated in the Original Appraisal). The Bank’s implied MHC pricing ratios relative to the MHC pricing ratios for the Peer Group are indicated in Table 9, and the pro forma calculations are detailed in Exhibits 5 and 6.
2.P/B Approach. P/B ratios have generally served as a useful benchmark in the valuation of thrift stocks, with the greater determinant of long term value being earnings. In applying the P/B approach, we considered both reported book value and tangible book value. Based on the $63.0 million midpoint value, the Bank’s P/B and P/TB ratios (fully-converted basis) both equaled 64.39%. In comparison to the average P/B and P/TB ratios indicated for the Peer Group of 84.26% and 87.20%, respectively, Malvern Federal’s updated ratios were discounted by 23.6% and 26.2% (versus discounts of 21.5% and 24.1% from the average Peer Group’s P/B and P/TB ratios as indicated in the Original Appraisal). In comparison to the median P/B and P/TB ratios indicated for the Peer Group of 81.52% and 86.73%, respectively, Malvern Federal’s updated ratios were discounted by 21.0% and 25.8% (versus discounts of 19.1% and 23.6% from the Peer Group’s median P/B and P/TB ratios as indicated in the Original Appraisal).
|
RP®Financial, LC. |
Board of Directors |
January 25, 2008 |
Page 21 |
Table 8
MHC Institutions — Implied Pricing Ratios, Full Conversion Basis
Malvern Federal Savings Bank and the Comparables
As of January 25, 2008
|
|
|
|
|
|
|
|
|
|
|
|
|
|
|
|
|
|
|
|
|
|
|
|
|
|
|
|
|
|
|
|
|
|
|
|
|
|
|
|
|
|
|
|
| |||||
|
| Fully Converted |
| Per Share(8) |
|
|
| |||||||||||||||||
|
|
|
|
|
| |||||||||||||||||||
|
| Price/ |
| Market |
| Core 12 Mo. |
| Book Value/ |
| Pricing Ratios(3) |
| |||||||||||||
|
|
|
|
|
|
| ||||||||||||||||||
Financial Institution |
|
|
|
|
| P/E |
| P/B |
| P/A |
| P/TB |
| P/Core |
| |||||||||
|
|
|
|
|
|
|
|
|
| |||||||||||||||
|
| ($) |
| ($Mil) |
| ($) |
| ($) |
| (x) |
| (%) |
| (%) |
| (%) |
| (x) |
| |||||
Malvern Federal Savings Bank |
|
|
|
|
|
|
|
|
|
|
|
|
|
|
|
|
|
|
|
|
|
|
| |
Superrange |
| $ | 10.00 |
| $ | 83.32 |
| $ | 0.25 |
| $ | 13.80 |
| 39.20x |
| 72.46 | % | 13.60 | % | 72.46 | % | 39.61x |
| |
Maximum |
| $ | 10.00 |
| $ | 72.45 |
| $ | 0.29 |
| $ | 14.60 |
| 34.44x |
| 68.49 | % | 12.01 | % | 68.49 | % | 34.80x |
| |
Midpoint |
| $ | 10.00 |
| $ | 63.00 |
| $ | 0.33 |
| $ | 15.53 |
| 30.21x |
| 64.39 | % | 10.58 | % | 64.39 | % | 30.54x |
| |
Minimum |
| $ | 10.00 |
| $ | 53.55 |
| $ | 0.38 |
| $ | 16.78 |
| 25.92x |
| 59.59 | % | 9.12 | % | 59.59 | % | 26.19x |
| |
|
|
|
|
|
|
|
|
|
|
|
|
|
|
|
|
|
|
|
|
|
|
|
|
|
All Public Companies(7) |
|
|
|
|
|
|
|
|
|
|
|
|
|
|
|
|
|
|
|
|
|
|
| |
Averages |
| $ | 13.53 |
| $ | 328.65 |
| $ | 0.68 |
| $ | 13.33 |
| 19.66x |
| 110.01 | % | 14.42 | % | 123.89 | % | 20.92x |
| |
Medians |
| $ | 11.59 |
| $ | 77.31 |
| $ | 0.41 |
| $ | 11.71 |
| 18.00x |
| 102.92 | % | 11.64 | % | 116.40 | % | 20.21x |
| |
|
|
|
|
|
|
|
|
|
|
|
|
|
|
|
|
|
|
|
|
|
|
|
|
|
All Non-MHC State of PA(7) |
|
|
|
|
|
|
|
|
|
|
|
|
|
|
|
|
|
|
|
|
|
|
| |
Averages |
| $ | 13.85 |
| $ | 557.47 |
| $ | 0.84 |
| $ | 15.18 |
| 15.89x |
| 91.14 | % | 9.59 | % | 115.97 | % | 17.08x |
| |
Medians |
| $ | 11.77 |
| $ | 123.84 |
| $ | 0.60 |
| $ | 13.70 |
| 14.18x |
| 98.33 | % | 7.54 | % | 110.34 | % | 16.37x |
| |
|
|
|
|
|
|
|
|
|
|
|
|
|
|
|
|
|
|
|
|
|
|
|
|
|
|
|
|
|
|
|
|
|
|
|
|
|
|
|
|
|
|
|
|
|
|
|
|
|
|
Publicly-Traded MHC Institutions, Full Conversion Basis |
|
|
|
|
|
|
|
|
|
|
|
|
|
|
|
|
|
|
|
|
|
|
| |
Averages |
| $ | 11.04 |
| $ | 155.46 |
| $ | 0.37 |
| $ | 13.06 |
| 27.73x |
| 84.26 | % | 21.58 | % | 87.20 | % | 27.55x |
| |
Medians |
| $ | 10.42 |
| $ | 115.23 |
| $ | 0.40 |
| $ | 13.11 |
| 29.26x |
| 81.52 | % | 17.28 | % | 86.73 | % | 28.82x |
| |
|
|
|
|
|
|
|
|
|
|
|
|
|
|
|
|
|
|
|
|
|
|
|
|
|
|
|
|
|
|
|
|
|
|
|
|
|
|
|
|
|
|
|
|
|
|
|
|
|
|
Publicly-Traded MHC Institutions, Full Conversion Basis |
|
|
|
|
|
|
|
|
|
|
|
|
|
|
|
|
|
|
|
|
|
|
| |
BFSB | Brooklyn Federal MHC of NY (31.0) |
| $ | 12.83 |
| $ | 170.78 |
| $ | 0.43 |
| $ | 14.15 |
| 29.16x |
| 90.67 | % | 34.61 | % | 90.67 | % | 29.84x |
|
CSBK | Clifton Savings Bncrp MHC of NJ (41.0) |
| $ | 9.88 |
| $ | 275.55 |
| $ | 0.17 |
| $ | 10.89 |
| NM |
| 90.73 | % | 29.96 | % | 90.73 | % | NM |
|
COBK | Colonial Bank MHC of NJ (44.9) |
| $ | 10.30 |
| $ | 45.66 |
| $ | 0.41 |
| $ | 13.20 |
| 24.52x |
| 78.03 | % | 9.93 | % | 78.03 | % | 25.12x |
|
FXCB | Fox Chase Bancorp MHC of PA (44.5) |
| $ | 10.75 |
| $ | 157.81 |
| $ | 0.38 |
| $ | 13.79 |
| 30.71x |
| 77.96 | % | 19.23 | % | 77.96 | % | 28.29x |
|
LSBK | Lake Shore Bancorp MHC of NY (43.7) |
| $ | 9.10 |
| $ | 58.82 |
| $ | 0.31 |
| $ | 12.46 |
| 29.35x |
| 73.03 | % | 15.33 | % | 73.03 | % | 29.35x |
|
MGYR | Magyar Bancorp MHC of NJ (45.1) |
| $ | 10.53 |
| $ | 61.00 |
| $ | 0.21 |
| $ | 13.12 |
| NM |
| 80.26 | % | 12.18 | % | 80.26 | % | NM |
|
OSHC | Ocean Shore Holding MHC of NJ (44.0) |
| $ | 10.00 |
| $ | 84.08 |
| $ | 0.39 |
| $ | 12.08 |
| 25.64x |
| 82.78 | % | 13.09 | % | 82.78 | % | 25.64x |
|
ONFC | Oneida Financial MHC of NY (43.9) |
| $ | 9.03 |
| $ | 70.33 |
| $ | 0.58 |
| $ | 11.83 |
| 15.84x |
| 76.33 | % | 12.86 | % | 105.61 | % | 15.57x |
|
PBIP | Prudential Bancorp MHC PA (40.5) |
| $ | 12.72 |
| $ | 146.38 |
| $ | 0.42 |
| $ | 13.10 |
| 30.29x |
| 97.10 | % | 26.90 | % | 97.10 | % | 30.29x |
|
ROMA | Roma Financial Corp MHC of NJ (31.0) |
| $ | 15.25 |
| $ | 484.19 |
| $ | 0.42 |
| $ | 15.93 |
| 36.31x |
| 95.73 | % | 41.74 | % | 95.85 | % | 36.31x |
|
|
|
|
|
|
|
|
|
|
|
|
|
|
|
|
|
|
|
|
|
|
|
|
|
|
|
|
|
|
|
|
|
|
|
|
|
|
|
|
|
|
|
|
|
|
|
|
|
| |||
|
| Dividends(4) |
| Financial Characteristics(6) |
|
| |||||||||||||||||||
|
|
|
|
| |||||||||||||||||||||
|
| Amount/ |
|
|
| Payout |
| Total |
| Equity/ |
| NPAs/ |
| Reported |
| Core |
| Offering | |||||||
|
|
|
|
|
|
|
|
|
|
| |||||||||||||||
Financial Institution |
|
| Yield |
|
|
|
|
| ROA |
| ROE |
| ROA |
| ROE |
| |||||||||
|
|
|
|
|
|
|
|
|
|
| |||||||||||||||
|
| ($) |
| (%) |
| (%) |
| ($Mil) |
| (%) |
| (%) |
| (%) |
| (%) |
| (%) |
| (%) |
| ($Mil) | |||
Malvern Federal Savings Bank |
|
|
|
|
|
|
|
|
|
|
|
|
|
|
|
|
|
|
|
|
|
|
|
| |
Superrange |
| $ | 0.00 |
| 0.00 | % | 0.00 | % | $ | 612 |
| 18.77 | % | 1.10 | % | 0.35 | % | 1.85 | % | 0.34 | % | 1.83 | % | $81.7 | |
Maximum |
| $ | 0.00 |
| 0.00 | % | 0.00 | % | $ | 603 |
| 17.53 | % | 1.12 | % | 0.35 | % | 1.99 | % | 0.35 | % | 1.97 | % | $71.0 | |
Midpoint |
| $ | 0.00 |
| 0.00 | % | 0.00 | % | $ | 595 |
| 16.43 | % | 1.13 | % | 0.35 | % | 2.13 | % | 0.35 | % | 2.11 | % | $61.7 | |
Minimum |
| $ | 0.00 |
| 0.00 | % | 0.00 | % | $ | 587 |
| 15.30 | % | 1.15 | % | 0.35 | % | 2.30 | % | 0.35 | % | 2.28 | % | $52.5 | |
|
|
|
|
|
|
|
|
|
|
|
|
|
|
|
|
|
|
|
|
|
|
|
|
|
|
All Public Companies(7) |
|
|
|
|
|
|
|
|
|
|
|
|
|
|
|
|
|
|
|
|
|
|
|
| |
Averages |
| $ | 0.39 |
| 2.73 | % | 33.05 | % | $ | 3,142 |
| 12.84 | % | 0.64 | % | 0.52 | % | 4.61 | % | 0.47 | % | 4.38 | % |
| |
Medians |
| $ | 0.32 |
| 2.72 | % | 18.25 | % | $ | 795 |
| 10.75 | % | 0.42 | % | 0.49 | % | 4.31 | % | 0.48 | % | 3.99 | % |
| |
|
|
|
|
|
|
|
|
|
|
|
|
|
|
|
|
|
|
|
|
|
|
|
|
|
|
All Non-MHC State of PA(7) |
|
|
|
|
|
|
|
|
|
|
|
|
|
|
|
|
|
|
|
|
|
|
|
| |
Averages |
| $ | 0.42 |
| 2.82 | % | 38.06 | % | $ | 8,826 |
| 10.72 | % | 0.35 | % | 0.38 | % | 5.22 | % | 0.37 | % | 5.12 | % |
| |
Medians |
| $ | 0.46 |
| 3.50 | % | 40.25 | % | $ | 910 |
| 7.00 | % | 0.32 | % | 0.50 | % | 6.34 | % | 0.47 | % | 5.85 | % |
| |
|
|
|
|
|
|
|
|
|
|
|
|
|
|
|
|
|
|
|
|
|
|
|
|
|
|
|
|
|
|
|
|
|
|
|
|
|
|
|
|
|
|
|
|
|
|
|
|
|
|
|
|
Publicly-Traded MHC Institutions, Full Conversion Basis |
|
|
|
|
|
|
|
|
|
|
|
|
|
|
|
|
|
|
|
|
|
|
|
| |
Averages |
| $ | 0.15 |
| 1.38 | % | 25.36 | % | $ | 647 |
| 24.87 | % | 0.32 | % | 0.70 | % | 2.83 | % | 0.70 | % | 2.85 | % |
| |
Medians |
| $ | 0.18 |
| 1.57 | % | 23.26 | % | $ | 546 |
| 22.83 | % | 0.06 | % | 0.58 | % | 2.86 | % | 0.60 | % | 2.92 | % |
| |
|
|
|
|
|
|
|
|
|
|
|
|
|
|
|
|
|
|
|
|
|
|
|
|
|
|
|
|
|
|
|
|
|
|
|
|
|
|
|
|
|
|
|
|
|
|
|
|
|
|
|
|
Publicly-Traded MHC Institutions, Full Conversion Basis |
|
|
|
|
|
|
|
|
|
|
|
|
|
|
|
|
|
|
|
|
|
|
|
| |
BFSB | Brooklyn Federal MHC of NY (31.0) |
| $ | 0.20 |
| 1.56 | % | 46.51 | % | $ | 493 |
| 38.17 | % | 0.02 | % | 1.16 | % | 3.14 | % | 1.14 | % | 3.07 | % |
|
CSBK | Clifton Savings Bncrp MHC of NJ (41.0) |
| $ | 0.20 |
| 2.02 | % | NM | $ | 920 |
| 33.02 | % | 0.03 | % | 0.51 | % | 1.55 | % | 0.51 | % | 1.55 | % |
| |
COBK | Colonial Bank MHC of NJ (44.9) |
| $ | 0.00 |
| 0.00 | % | 0.00 | % | $ | 460 |
| 12.73 | % | 0.32 | % | 0.43 | % | 3.22 | % | 0.42 | % | 3.14 | % |
|
FXCB | Fox Chase Bancorp MHC of PA (44.5) |
| $ | 0.00 |
| 0.00 | % | 0.00 | % | $ | 821 |
| 24.67 | % | 0.03 | % | 0.62 | % | 2.55 | % | 0.67 | % | 2.77 | % |
|
LSBK | Lake Shore Bancorp MHC of NY (43.7) |
| $ | 0.16 |
| 1.76 | % | 51.61 | % | $ | 384 |
| 20.99 | % | 0.37 | % | 0.53 | % | 2.48 | % | 0.53 | % | 2.48 | % |
|
MGYR | Magyar Bancorp MHC of NJ (45.1) |
| $ | 0.00 |
| 0.00 | % | 0.00 | % | $ | 501 |
| 15.17 | % | 1.90 | % | 0.25 | % | 1.60 | % | 0.25 | % | 1.60 | % |
|
OSHC | Ocean Shore Holding MHC of NJ (44.0) |
| $ | 0.00 |
| 0.00 | % | 0.00 | % | $ | 643 |
| 15.81 | % | 0.06 | % | 0.53 | % | 3.23 | % | 0.53 | % | 3.23 | % |
|
ONFC | Oneida Financial MHC of NY (43.9) |
| $ | 0.48 |
| 5.32 | % | NM | $ | 547 |
| 16.84 | % | 0.03 | % | 0.88 | % | 4.86 | % | 0.90 | % | 4.94 | % |
| |
PBIP | Prudential Bancorp MHC PA (40.5) |
| $ | 0.20 |
| 1.57 | % | 47.62 | % | $ | 544 |
| 27.71 | % | 0.10 | % | 0.89 | % | 3.13 | % | 0.89 | % | 3.13 | % |
|
ROMA | Roma Financial Corp MHC of NJ (31.0) |
| $ | 0.24 |
| 1.57 | % | 57.14 | % | $ | 1,160 |
| 43.60 | % | NA | 1.15 | % | 2.58 | % | 1.15 | % | 2.58 | % |
| |
|
|
(1) | Current stock price of minority stock. Average of High/Low or Bid/Ask price per share. |
(2) | EPS (estimated core earnings) is based on reported trailing 12 month data, adjusted to omit non-operating gains and losses on a tax-effected basis. Public MHC data reflects additional earnings from reinvestment of proceeds of second step conversion. |
(3) | P/E = Price to Earnings; P/B = Price to Book; P/A = Price to Assets; P/TB = Price to Tangible Book; and P/Core = Price to Core Earnings. Ratios are pro forma assuming a second step conversion to full stock form. |
(4) | Indicated 12 month dividend, based on last quarterly dividend declared. |
(5) | Indicated 12 month dividend as a percent of trailing 12 month estimated core earnings (earnings adjusted to reflect second step conversion). |
(6) | ROA (return on assets) and ROE (return on equity) are indicated ratios based on trailing 12 month earnings and average equity and assets balances. |
(7) | Excludes from averages and medians those companies the subject of actual or rumored acquisition activities or unusual operating characteristics. |
(8) | Figures estimated by RP Financial to reflect a second step conversion of the MHC to full stock form. |
|
|
Source: | Corporate reports, offering circulars, and RP® Financial, LC. calculations. The information provided in this report has been obtained from sources we believe are reliable, but we cannot guarantee the accuracy or completeness of such information. |
|
RP®Financial, LC. |
|
Table 9 |
|
|
|
|
|
|
|
|
|
|
|
|
|
|
|
|
|
|
|
|
|
|
|
|
|
|
| Market |
| Per Share Data |
|
|
|
|
|
|
|
|
|
|
| |||||||||
|
|
|
|
|
|
|
|
|
|
|
|
|
| |||||||||||
|
|
| Core |
| Book |
| Pricing Ratios(3) |
| ||||||||||||||||
|
| Price/ |
| Market |
|
|
|
| ||||||||||||||||
|
|
|
|
|
| P/E |
| P/B |
| P/A |
| P/TB |
| P/Core |
| |||||||||
|
|
|
|
|
|
|
|
|
|
| ||||||||||||||
|
| ($) |
| ($Mil) |
| ($) |
| ($) |
| (x) |
| (%) |
| (%) |
| (%) |
| (x) |
| |||||
Malvern Federal Savings Bank |
|
|
|
|
|
|
|
|
|
|
|
|
|
|
|
|
|
|
|
|
|
|
| |
Superrange |
| $ | 10.00 |
| $ | 83.32 |
| $ | 0.23 |
| $ | 8.98 |
| 42.82 | x | 111.36 | % | 14.56 | % | 111.36 | % | 43.31 | x | |
Maximum |
| $ | 10.00 |
| $ | 72.45 |
| $ | 0.27 |
| $ | 9.76 |
| 37.26 | x | 102.46 | % | 12.75 | % | 102.46 | % | 37.69 | x | |
Midpoint |
| $ | 10.00 |
| $ | 63.00 |
| $ | 0.30 |
| $ | 10.66 |
| 32.42 | x | 93.81 | % | 11.16 | % | 93.81 | % | 32.79 | x | |
Minimum |
| $ | 10.00 |
| $ | 53.55 |
| $ | 0.36 |
| $ | 11.88 |
| 27.57 | x | 84.18 | % | 9.54 | % | 84.18 | % | 27.88 | x | |
|
|
|
|
|
|
|
|
|
|
|
|
|
|
|
|
|
|
|
|
|
|
|
|
|
All Public Companies(7) |
|
|
|
|
|
|
|
|
|
|
|
|
|
|
|
|
|
|
|
|
|
|
| |
Averages |
| $ | 13.53 |
| $ | 328.65 |
| $ | 0.68 |
| $ | 13.33 |
| 19.66 | x | 110.01 | % | 14.42 | % | 123.89 | % | 20.92 | x | |
Medians |
| $ | 11.59 |
| $ | 77.31 |
| $ | 0.41 |
| $ | 11.71 |
| 18.00 | x | 102.92 | % | 11.64 | % | 116.40 | % | 20.21 | x | |
|
|
|
|
|
|
|
|
|
|
|
|
|
|
|
|
|
|
|
|
|
|
|
|
|
All Non-MHC State of PA(7) |
|
|
|
|
|
|
|
|
|
|
|
|
|
|
|
|
|
|
|
|
|
|
| |
Averages |
| $ | 13.85 |
| $ | 557.47 |
| $ | 0.84 |
| $ | 15.18 |
| 15.89 | x | 91.14 | % | 9.59 | % | 115.97 | % | 17.08 | x | |
Medians |
| $ | 11.77 |
| $ | 123.84 |
| $ | 0.60 |
| $ | 13.70 |
| 14.18 | x | 98.33 | % | 7.54 | % | 110.34 | % | 16.37 | x | |
|
|
|
|
|
|
|
|
|
|
|
|
|
|
|
|
|
|
|
|
|
|
|
|
|
Comparable Group Averages |
|
|
|
|
|
|
|
|
|
|
|
|
|
|
|
|
|
|
|
|
|
|
| |
Averages |
| $ | 11.04 |
| $ | 61.52 |
| $ | 0.27 |
| $ | 7.55 |
| 30.63 | x | 149.18 | % | 25.31 | % | 158.49 | % | 32.31 | x | |
Medians |
| $ | 10.42 |
| $ | 44.75 |
| $ | 0.28 |
| $ | 7.48 |
| 32.27 | x | 130.58 | % | 18.84 | % | 145.71 | % | 33.33 | x | |
|
|
|
|
|
|
|
|
|
|
|
|
|
|
|
|
|
|
|
|
|
|
|
|
|
Comparable Group |
|
|
|
|
|
|
|
|
|
|
|
|
|
|
|
|
|
|
|
|
|
|
| |
BFSB | Brooklyn Federal MHC of NY (31.0) |
| $ | 12.83 |
| $ | 50.91 |
| $ | 0.28 |
| $ | 6.41 |
| NM |
| 200.16 | % | 43.74 | % | 200.16 | % | NM |
|
CSBK | Clifton Savings Bncrp MHC of NJ (41.0) |
| $ | 9.88 |
| $ | 126.59 |
| $ | 0.08 |
| $ | 6.30 |
| NM |
| 156.83 | % | 34.80 | % | 156.83 | % | NM |
|
COBK | Colonial Bank MHC of NJ (44.9) |
| $ | 10.30 |
| $ | 21.42 |
| $ | 0.32 |
| $ | 8.50 |
| 31.21 |
| 121.18 | % | 10.40 | % | 121.18 | % | 32.19 | x |
FXCB | Fox Chase Bancorp MHC of PA (44.5) |
| $ | 10.75 |
| $ | 70.21 |
| $ | 0.28 |
| $ | 8.66 |
| NM |
| 124.13 | % | 21.17 | % | 124.13 | % | 38.39 | x |
LSBK | Lake Shore Bancorp MHC of NY (43.7) |
| $ | 9.10 |
| $ | 27.08 |
| $ | 0.23 |
| $ | 8.24 |
| 39.57 |
| 110.44 | % | 16.51 | % | 110.44 | % | 39.57 | x |
MGYR | Magyar Bancorp MHC of NJ (45.1) |
| $ | 10.53 |
| $ | 28.67 |
| $ | 0.12 |
| $ | 8.32 |
| NM |
| 126.56 | % | 12.89 | % | 126.56 | % | NM |
|
OSHC | Ocean Shore Holding MHC of NJ (44.0) |
| $ | 10.00 |
| $ | 38.60 |
| $ | 0.30 |
| $ | 7.43 |
| 33.33 |
| 134.59 | % | 13.93 | % | 134.59 | % | 33.33 | x |
ONFC | Oneida Financial MHC of NY (43.9) |
| $ | 9.03 |
| $ | 31.37 |
| $ | 0.50 |
| $ | 7.53 |
| 18.43 |
| 119.92 | % | 13.69 | % | 212.47 | % | 18.06 | x |
PBIP | Prudential Bancorp MHC PA (40.5) |
| $ | 12.72 |
| $ | 65.57 |
| $ | 0.30 |
| $ | 7.05 |
| NM |
| 180.43 | % | 30.79 | % | 180.43 | % | NM |
|
ROMA | Roma Financial Corp MHC of NJ (31.0) |
| $ | 15.25 |
| $ | 154.74 |
| $ | 0.25 |
| $ | 7.01 |
| NM |
| 217.55 | % | 55.21 | % | 218.17 | % | NM |
|
|
|
|
|
|
|
|
|
|
|
|
|
|
|
|
|
|
|
|
|
|
|
|
|
|
|
|
|
|
|
|
|
|
|
| Financial Characteristics(6) |
|
| ||||||||||||||||
|
| Dividends(4) |
|
|
| |||||||||||||||||||||
|
|
| Total |
| Equity/ |
| NPAs/ |
| Reported |
| Core |
|
| |||||||||||||
|
| Amount/ |
|
|
| Payout |
|
|
|
|
|
| Offering |
| ||||||||||||
|
|
| Yield |
|
|
|
|
| ROA |
| ROE |
| ROA |
| ROE |
|
| |||||||||
|
|
|
|
|
|
|
|
|
|
|
| |||||||||||||||
|
| ($) |
| (%) |
| (%) |
| ($Mil) |
| (%) |
| (%) |
| (%) |
| (%) |
| (%) |
| (%) |
| ($Mil) | ||||
Malvern Federal Savings Bank |
|
|
|
|
|
|
|
|
|
|
|
|
|
|
|
|
|
|
|
|
|
|
|
|
| |
Superrange |
| $ | 0.00 |
| 0.00 | % | 0.00 | % | $ | 572 |
| 13.07 | % | 1.18 | % | 0.34 | % | 2.60 | % | 0.34 | % | 2.57 | % | $ | 35.8 | |
Maximum |
| $ | 0.00 |
| 0.00 | % | 0.00 | % | $ | 568 |
| 12.45 | % | 1.19 | % | 0.34 | % | 2.75 | % | 0.34 | % | 2.72 | % | $ | 31.2 | |
Midpoint |
| $ | 0.00 |
| 0.00 | % | 0.00 | % | $ | 565 |
| 11.90 | % | 1.19 | % | 0.34 | % | 2.89 | % | 0.34 | % | 2.86 | % | $ | 27.1 | |
Minimum |
| $ | 0.00 |
| 0.00 | % | 0.00 | % | $ | 561 |
| 11.34 | % | 1.20 | % | 0.35 | % | 3.05 | % | 0.34 | % | 3.02 | % | $ | 23.0 | |
|
|
|
|
|
|
|
|
|
|
|
|
|
|
|
|
|
|
|
|
|
|
|
|
|
|
|
All Public Companies(7) |
|
|
|
|
|
|
|
|
|
|
|
|
|
|
|
|
|
|
|
|
|
|
|
|
| |
Averages |
| $ | 0.39 |
| 2.73 | % | 33.05 | % | $ | 3,142 |
| 12.84 | % | 0.64 | % | 0.52 | % | 4.61 | % | 0.47 | % | 4.38 | % |
|
| |
Medians |
| $ | 0.32 |
| 2.72 | % | 18.25 | % | $ | 795 |
| 10.75 | % | 0.42 | % | 0.49 | % | 4.31 | % | 0.48 | % | 3.99 | % |
|
| |
|
|
|
|
|
|
|
|
|
|
|
|
|
|
|
|
|
|
|
|
|
|
|
|
|
|
|
All Non-MHC State of PA(7) |
|
|
|
|
|
|
|
|
|
|
|
|
|
|
|
|
|
|
|
|
|
|
|
|
| |
Averages |
| $ | 0.42 |
| 2.82 | % | 38.06 | % | $ | 8,826 |
| 10.72 | % | 0.35 | % | 0.38 | % | 5.22 | % | 0.37 | % | 5.12 | % |
|
| |
Medians |
| $ | 0.46 |
| 3.50 | % | 40.25 | % | $ | 910 |
| 7.00 | % | 0.32 | % | 0.50 | % | 6.34 | % | 0.47 | % | 5.85 | % |
|
| |
|
|
|
|
|
|
|
|
|
|
|
|
|
|
|
|
|
|
|
|
|
|
|
|
|
|
|
Comparable Group Averages |
|
|
|
|
|
|
|
|
|
|
|
|
|
|
|
|
|
|
|
|
|
|
|
|
| |
Averages |
| $ | 0.15 |
| 1.38 | % | 11.89 | % | $ | 566 |
| 15.90 | % | 0.32 | % | 0.55 | % | 3.51 | % | 0.56 | % | 3.53 | % |
|
| |
Medians |
| $ | 0.18 |
| 1.57 | % | 0.00 | % | $ | 494 |
| 16.00 | % | 0.06 | % | 0.46 | % | 3.68 | % | 0.49 | % | 3.62 | % |
|
| |
|
|
|
|
|
|
|
|
|
|
|
|
|
|
|
|
|
|
|
|
|
|
|
|
|
|
|
Comparable Group |
|
|
|
|
|
|
|
|
|
|
|
|
|
|
|
|
|
|
|
|
|
|
|
|
| |
BFSB | Brooklyn Federal MHC of NY (31.0) |
| $ | 0.20 |
| 1.56 | % | 21.29 | % | $ | 390 |
| 21.85 | % | 0.02 | % | 0.96 | % | 4.63 | % | 0.93 | % | 4.47 | % |
|
|
CSBK | Clifton Savings Bncrp MHC of NJ (41.0) |
| $ | 0.20 |
| 2.02 | % | NM |
| $ | 792 |
| 22.19 | % | 0.03 | % | 0.28 | % | 1.25 | % | 0.28 | % | 1.25 | % |
|
|
COBK | Colonial Bank MHC of NJ (44.9) |
| $ | 0.00 |
| 0.00 | % | 0.00 | % | $ | 439 |
| 8.59 | % | 0.32 | % | 0.36 | % | 3.96 | % | 0.35 | % | 3.84 | % |
|
|
FXCB | Fox Chase Bancorp MHC of PA (44.5) |
| $ | 0.00 |
| 0.00 | % | 0.00 | % | $ | 745 |
| 17.06 | % | 0.03 | % | 0.49 | % | 2.92 | % | 0.54 | % | 3.27 | % |
|
|
LSBK | Lake Shore Bancorp MHC of NY (43.7) |
| $ | 0.16 |
| 1.76 | % | 32.03 | % | $ | 356 |
| 14.95 | % | 0.37 | % | 0.42 | % | 2.77 | % | 0.42 | % | 2.77 | % |
|
|
MGYR | Magyar Bancorp MHC of NJ (45.1) |
| $ | 0.00 |
| 0.00 | % | 0.00 | % | $ | 473 |
| 10.18 | % | 1.90 | % | 0.15 | % | 1.44 | % | 0.15 | % | 1.44 | % |
|
|
OSHC | Ocean Shore Holding MHC of NJ (44.0) |
| $ | 0.00 |
| 0.00 | % | 0.00 | % | $ | 603 |
| 10.35 | % | 0.06 | % | 0.44 | % | 4.03 | % | 0.44 | % | 4.03 | % |
|
|
ONFC | Oneida Financial MHC of NY (43.9) |
| $ | 0.48 |
| 5.32 | % | NM |
| $ | 514 |
| 11.42 | % | 0.03 | % | 0.81 | % | 6.59 | % | 0.83 | % | 6.73 | % |
|
|
PBIP | Prudential Bancorp MHC PA (40.5) |
| $ | 0.20 |
| 1.57 | % | 29.94 | % | $ | 474 |
| 17.07 | % | 0.10 | % | 0.73 | % | 4.07 | % | 0.73 | % | 4.07 | % |
|
|
ROMA | Roma Financial Corp MHC of NJ (31.0) |
| $ | 0.24 |
| 1.57 | % | NM |
| $ | 877 |
| 25.38 | % | NA |
| 0.90 | % | 3.41 | % | 0.90 | % | 3.41 | % |
|
|
|
|
(1) | Average of High/Low or Bid/Ask price per share. |
|
|
(2) | EPS (estimate core basis) is based on actual trailing 12 month data, adjusted to omit non-operating items on a tax-effected basis, and is shown on a pro forma basis where appropriate. |
|
|
(3) | P/E = Price to earnings; P/B = Price to book; P/A = Price to assets; P/TB = Price to tangible book value; and P/Core = Price to core earnings. |
|
|
(4) | Indicated 12 month dividend, based on last quarterly dividend declared. |
|
|
(5) | Indicated 12 month dividend as a percent of trailing 12 month estimated core earnings. |
|
|
(6) | ROA (return on assets) and ROE (return on equity) are indicated ratios based on trailing 12 month common earnings and average common equity and total assets balances. |
|
|
(7) | Excludes from averages and medians those companies the subject of actual or rumored acquisition activities or unusual operating characteristics. |
|
|
Source: | Corporate reports, offering circulars, and RP Financial, LC. calculations. The information provided in this report has been obtained from sources we believe are reliable, but we cannot guarantee the accuracy or completeness of such information. |
|
|
| RP® Financial, LC. |
| Boards of Directors |
| January 25, 2008 |
| Page 23 |
|
|
| On an MHC reported basis, the Bank’s P/B and P/TB ratios at the $63.0 million midpoint value both equaled 93.81%. In comparison to the average P/B and P/TB ratios indicated for the Peer Group of 149.18% and 158.49%, respectively, Malvern Federal’s updated P/B and P/TB ratios at the midpoint were discounted by 37.1% on a P/B basis and 40.8% on a P/TB basis (versus discounts of 35.4% and 39.5% from the Peer Group’s P/B and P/TB ratios as indicated in the Original Appraisal). In comparison to the median P/B and P/TB ratios indicated for the Peer Group of 130.58% and 145.71%, respectively, Malvern Federal’s updated P/B and P/TB ratios at the midpoint were discounted by 28.2% and 35.6% (versus discounts of 27.0% and 33.5% from the Peer Group’s median P/B and P/TB ratios as indicated in the Original Appraisal). |
|
|
| In addition to the fundamental analysis applied to the Peer Group, RP Financial utilized a technical analysis of recent mutual holding company offerings. As indicated in the Original Appraisal, the pricing characteristics of recent mutual holding company offerings are not the primary determinate of value. Consistent with the Original Appraisal, particular focus was placed on the P/TB approach in this analysis, since the P/E multiples do not reflect the actual impact of reinvestment and the source of the conversion funds (i.e., external funds versus deposit withdrawals). The three recently completed MHC offerings had an average closing pro forma price/tangible book ratio of 76.5% (fully-converted basis). In comparison, the Bank’s P/TB ratio of 64.4% at the midpoint value reflects an implied discount of 15.8% relative to the average closing pro forma P/TB ratio of the recent MHC offerings. As of January 25, 2008, the closing stock prices for the three recent MHC offerings were 4.4% below the IPO price for Meridian Interstate, 8.5% below the IPO price for Sound Financial and 2.5% above the IPO price for Northfield Bancorp. |
|
|
| 3.P/A Approach. P/A ratios are generally not as a reliable indicator of market value, as investors do not place significant weight on total assets as a determinant of market value. Investors place significantly greater weight on book value and earnings — which have received greater weight in our valuation analysis. At the $63.0 million midpoint value value, Malvern Federal’s full conversion pro forma P/A ratio equaled 10.58%. In comparison to the Peer Group’s average P/A ratio (fully-converted basis) of 21.58%, Malvern Federal’s P/A ratio indicated a discount of 51.0% (versus a discount of 49.1% at the midpoint valuation in the Original Appraisal). In comparison to the Peer Group’s median P/A ratio of 17.28% (fully-converted basis), Malvern Federal’s updated P/A ratio at the midpoint indicated a discount of 38.8% (versus a discount of 36.9% at the midpoint valuation in the Original Appraisal). |
|
|
| On an MHC reported basis, Malvern Federal’s pro forma P/A ratio at the $63.0 million midpoint value equaled 11.16%. In comparison to the Peer Group’s average P/A ratio of 25.31%, Malvern Federal’s P/A ratio indicated a discount of 55.9% (versus a discount of 54.5% at the midpoint valuation in the Original Appraisal). In comparison to the Peer Group’s median P/A ratio of 18.84%, Malvern Federal’s updated P/A ratio at the midpoint indicated a discount of 40.8% (versus a discount of 39.2% at the midpoint valuation in the Original Appraisal). |
|
|
| RP® Financial, LC. |
| Boards of Directors |
| January 25, 2008 |
| Page 24 |
|
|
| Valuation Conclusion |
|
|
| We have concluded that the Bank’s estimated pro forma market value should be decreased since the date of the Original Appraisal. Accordingly, it is our opinion that, as of January 25, 2008, the estimated aggregate pro forma market value of the shares to be issued immediately following the conversion, both shares issued publicly as well as to the MHC, equaled $63,000,000 at the midpoint, equal to 6,300,000 shares offered at a per share value of $10.00. The Board of Directors has established a public offering range such that the public ownership of the Bank will constitute a 43.0% ownership interest prior to the issuance of shares to the Foundation. Based on the public offering range and inclusive of the shares issued to the Foundation, equal to 2.0% of the shares issued in the reorganization, the public ownership of shares will represent 45.0% of the shares issued throughout the valuation range. Based on the foregoing valuation, the corresponding range of shares and market values based on a $10.00 per share price are as shown in the table below. The pro forma valuation calculations relative to the Peer Group (fully-converted basis) are shown in Table 8 and are detailed in Exhibit 3 and Exhibit 4; the pro forma valuation calculations relative to the Peer Group based on reported financials are shown in Table 9 and are detailed in Exhibits 5 and 6. |
|
|
|
|
|
|
|
|
|
|
|
|
|
|
|
| Offering |
| MHC Foundation |
| Total |
| ||||||
Shares |
| Shares |
| Shares |
| Shares |
| Shares |
| ||||
|
|
|
|
| |||||||||
Supermaximum |
|
| 3,582,653 |
|
| 4,582,462 |
|
| 166,635 |
|
| 8,331,750 |
|
Maximum |
|
| 3,115,350 |
|
| 3,984,750 |
|
| 144,900 |
|
| 7,245,000 |
|
Midpoint |
|
| 2,709,000 |
|
| 3,465,000 |
|
| 126,000 |
|
| 6,300,000 |
|
Minimum |
|
| 2,302,650 |
|
| 2,945,250 |
|
| 107,100 |
|
| 5,355,000 |
|
|
|
| RP® Financial, LC. |
| Boards of Directors |
| January 25, 2008 |
| Page 25 |
|
|
|
|
|
|
|
|
|
|
|
|
|
|
|
| Offering |
| MHC Foundation |
| Total |
| ||||||
Market Value |
| Shares |
| Shares |
| Shares |
| Shares |
| ||||
|
|
|
|
| |||||||||
Supermaximum |
| $ | 35,826,530 |
| $ | 45,824,620 |
| $ | 1,666,350 |
| $ | 83,317,500 |
|
Maximum |
|
| 31,153,500 |
|
| 39,847,500 |
|
| 1,449,000 |
|
| 72,450,000 |
|
Midpoint |
|
| 27,090000 |
|
| 34,650,000 |
|
| 1,260,000 |
|
| 63,000,000 |
|
Minimum |
|
| 23,026,500 |
|
| 29,452,500 |
|
| 1,071,000 |
|
| 53,550,000 |
|
|
|
| Respectfully submitted, |
|
|
| RP® FINANCIAL, LC. |
|
|
|
|
| President and Managing Director |
|
|
|
|
| Director |


EXHIBITS
RP Financial, LC.
LIST OF EXHIBITS
|
|
|
|
|
Exhibit |
| Description | ||
|
| |||
|
|
| ||
1 |
| Stock Prices: As of January 25, 2008 | ||
|
|
| ||
2 |
| Peer Group Core Earnings Analysis | ||
|
|
| ||
3 |
| Pro Forma Analysis Sheet – Fully Converted Basis | ||
|
|
| ||
4 |
| Pro Forma Effect of Conversion Proceeds – Fully Converted Basis | ||
|
|
| ||
5 |
| Pro Forma Analysis Sheet – Minority Stock Offering | ||
|
|
| ||
6 |
| Pro Forma Effect of Stock Proceeds – Minority Stock Offering | ||
|
|
| ||
7 |
| Firm Qualifications Statement | ||
EXHIBIT 1
Stock Prices
As of January 25, 2008
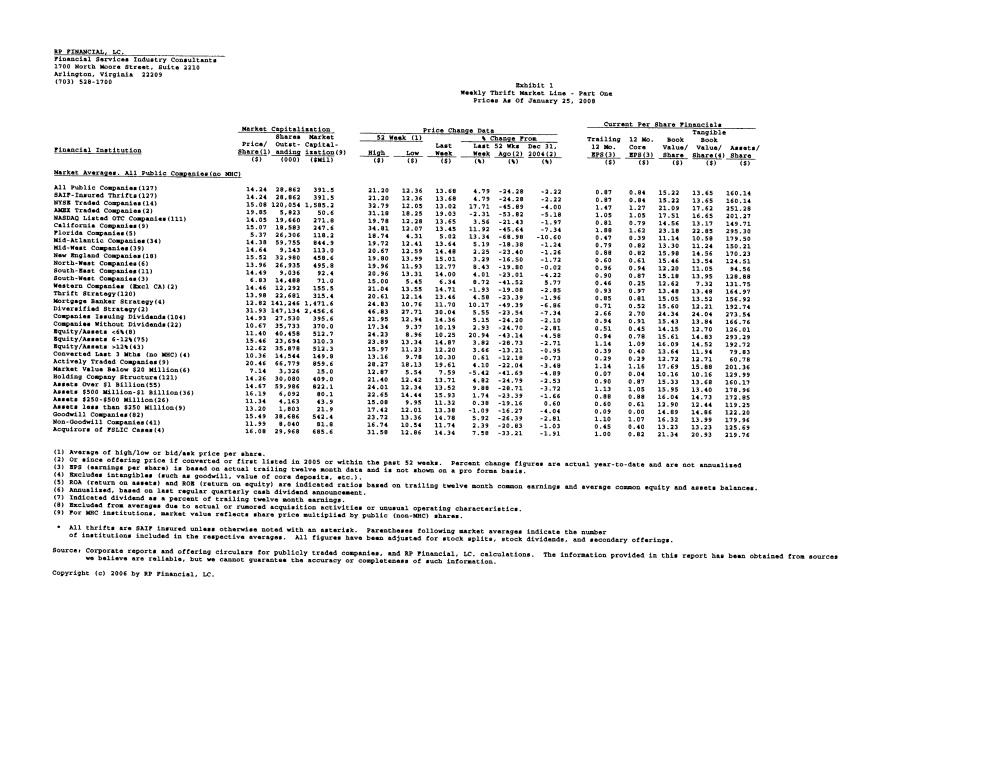
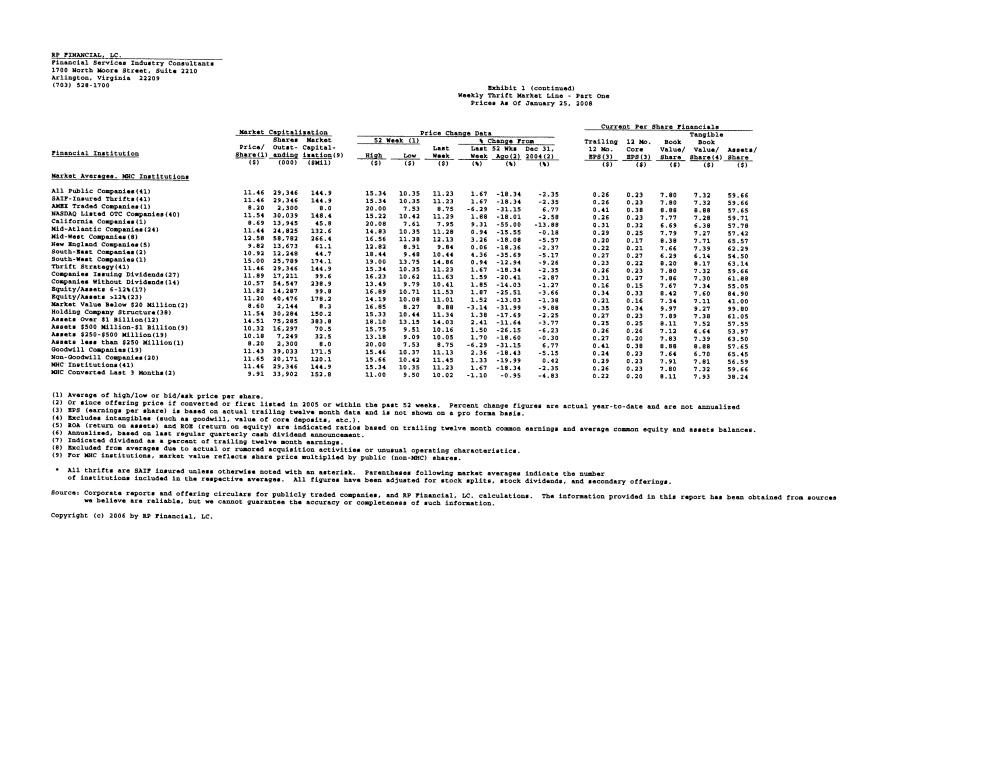
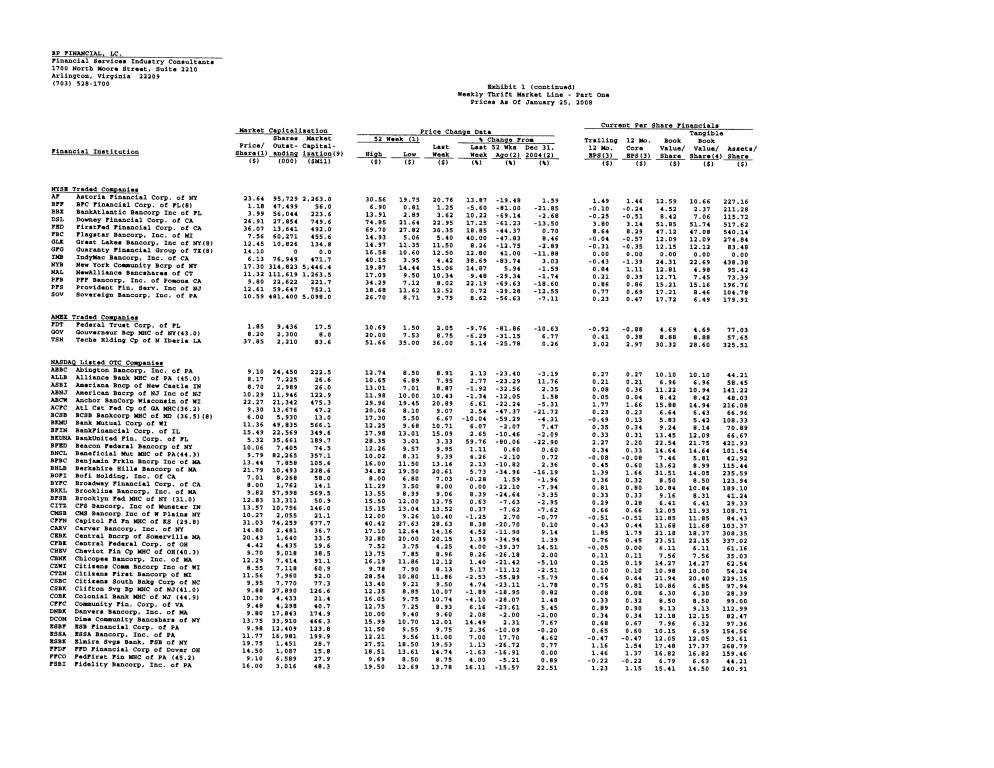
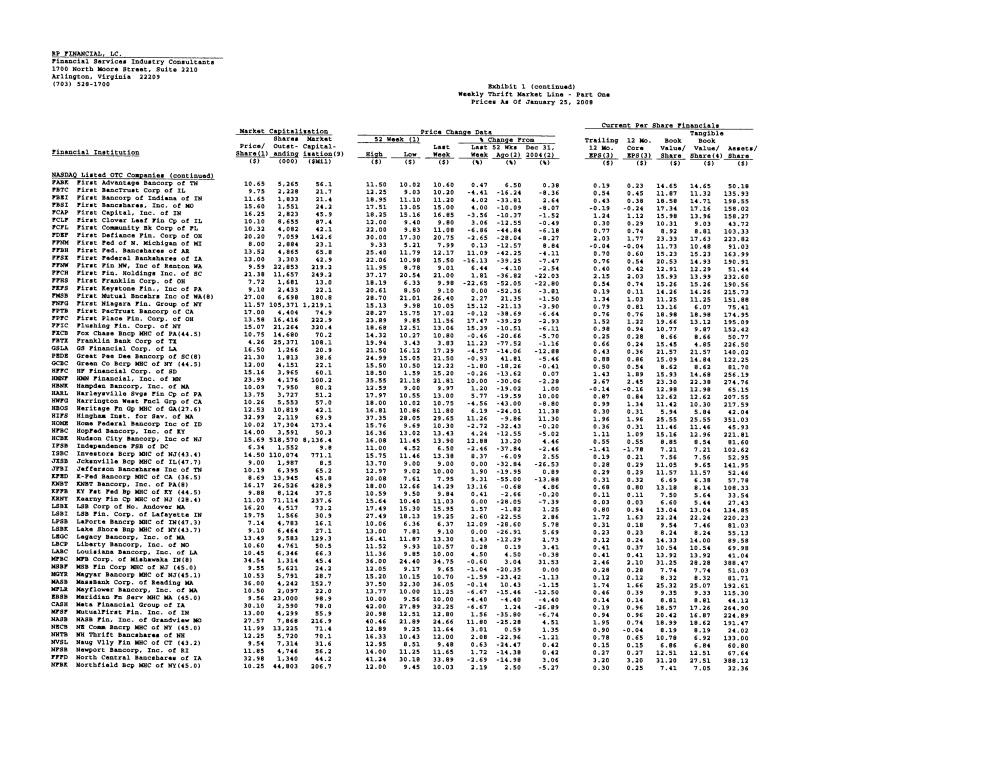
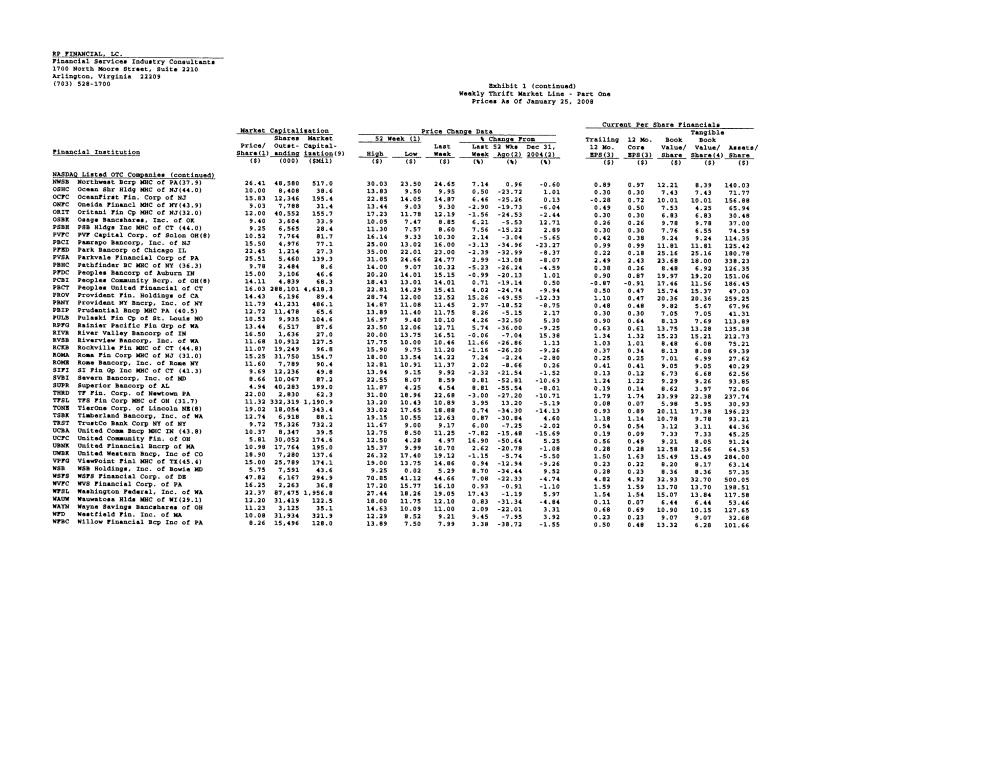
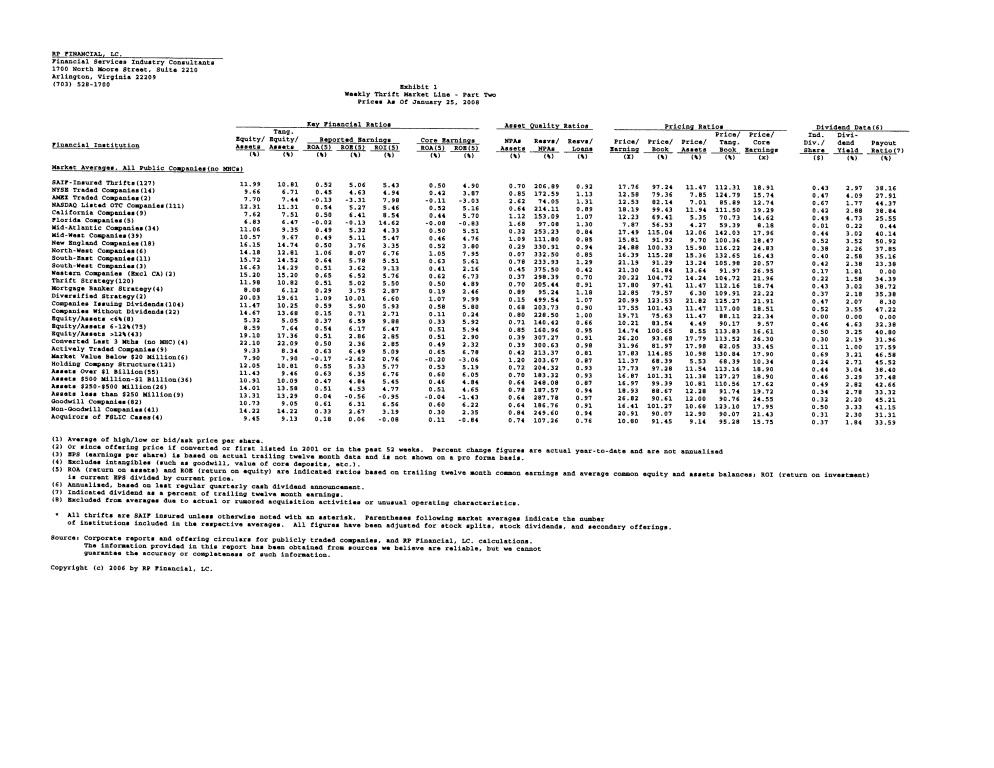
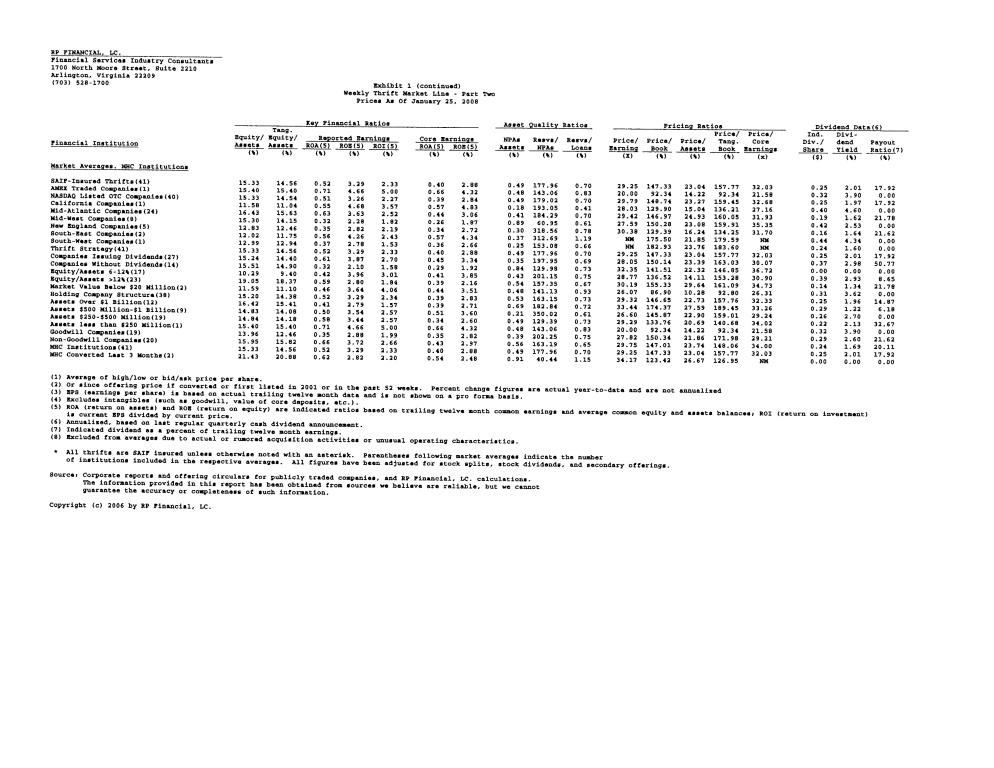
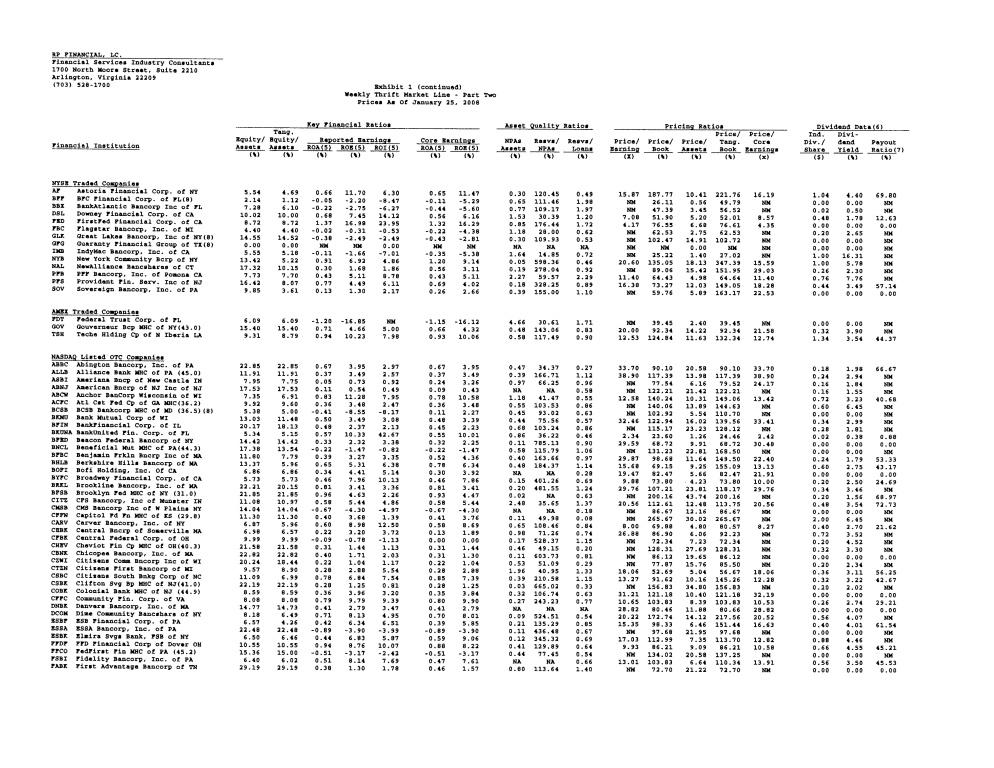
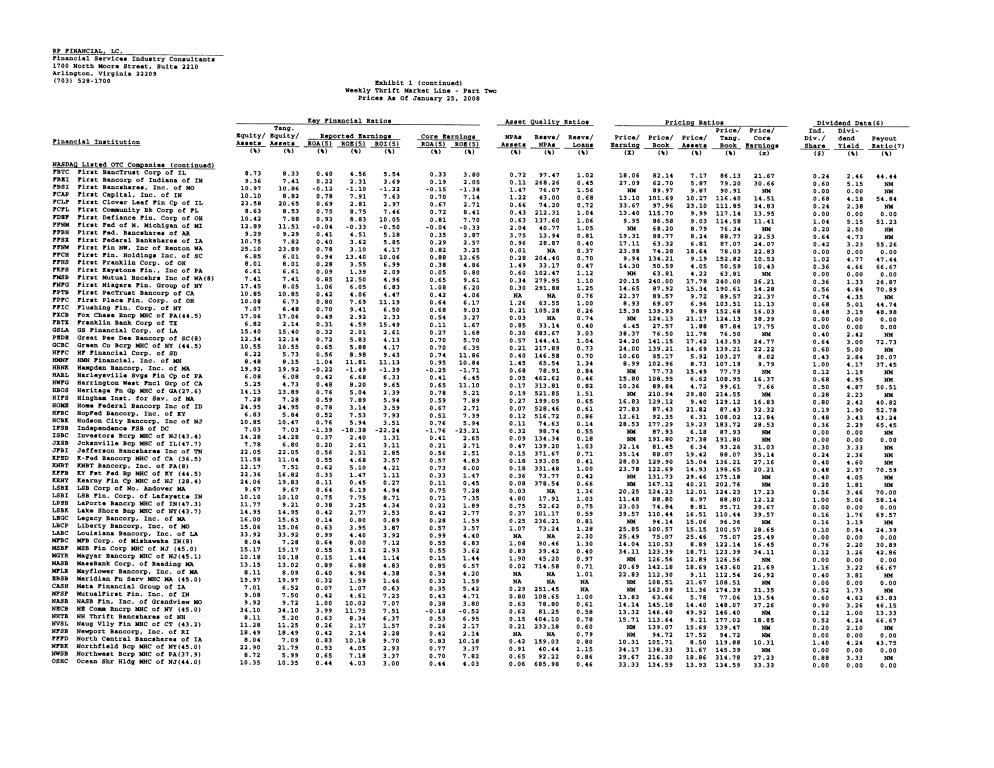
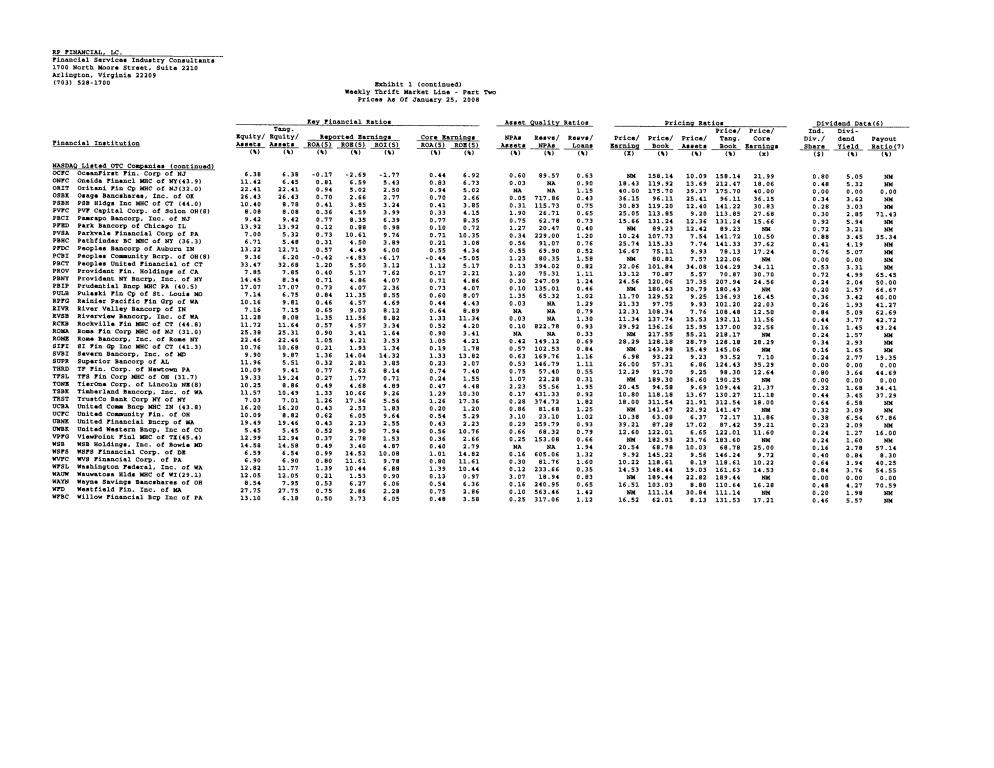
EXHIBIT 2
Core Earnings Analysis
RP® Financial, LC.
Core Earnings Analysis
Comparable Institution Analysis
For the 12 Months Ended September 30, 2007
|
|
|
|
|
|
|
|
|
|
|
|
|
|
|
|
|
|
|
|
|
|
|
|
|
Comparable Group |
| Net Income |
| Less: Net |
| Tax Effect |
| Less: |
| Estimated |
| Shares |
| Estimated |
| |||||||||
|
|
|
|
|
|
|
| |||||||||||||||||
|
|
|
| ($000) |
| ($000) |
| ($000) |
| ($000) |
| ($000) |
| (000) |
| ($) |
| |||||||
| ||||||||||||||||||||||||
BFSB |
| Brooklyn Federal MHC of NY (31.0) |
| $ | 3,847 |
| ($ | 253 | ) | $ | 86 |
| $ | 0 |
| $ | 3,680 |
|
| 13,311 |
| $ | 0.28 |
|
CSBK |
| Clifton Savings Bncrp MHC of NJ (41.0) (1) |
| $ | 1,052 |
| $ | 0 |
| $ | 0 |
| $ | 0 |
| $ | 1,052 |
|
| 27,890 |
| $ | 0.08 |
|
COBK |
| Colonial Bank MHC of NJ (44.9) |
| $ | 1,469 |
| ($ | 51 | ) | $ | 17 |
| $ | 0 |
| $ | 1,435 |
|
| 4,433 |
| $ | 0.32 |
|
FXCB |
| Fox Chase Bancorp MHC of PA (44.5) |
| $ | 3,615 |
| $ | 687 |
| ($ | 234 | ) | $ | 0 |
| $ | 4,068 |
|
| 14,680 |
| $ | 0.28 |
|
LSBK |
| Lake Shore Bancorp MHC of NY (43.7) |
| $ | 1,519 |
| $ | 0 |
| $ | 0 |
| $ | 0 |
| $ | 1,519 |
|
| 6,464 |
| $ | 0.23 |
|
MGYR |
| Magyar Bancorp MHC of NJ (45.1) |
| $ | 717 |
| ($ | 24 | ) | $ | 8 |
| $ | 0 |
| $ | 701 |
|
| 5,791 |
| $ | 0.12 |
|
OSHC |
| Ocean Shore Holding MHC of NJ (44.0) |
| $ | 2,507 |
| $ | 0 |
| $ | 0 |
| $ | 0 |
| $ | 2,507 |
|
| 8,408 |
| $ | 0.30 |
|
ONFC |
| Oneida Financial MHC of NY (43.9) |
| $ | 3,841 |
| $ | 77 |
| ($ | 26 | ) | $ | 0 |
| $ | 3,892 |
|
| 7,788 |
| $ | 0.50 |
|
PBIP |
| Prudential Bancorp MHC PA (40.5) |
| $ | 3,398 |
| $ | 0 |
| $ | 0 |
| $ | 0 |
| $ | 3,398 |
|
| 11,478 |
| $ | 0.30 |
|
ROMA |
| Roma Financial Corp MHC of NJ (31.0) |
| $ | 7,830 |
| ($ | 2 | ) | $ | 1 |
| $ | 0 |
| $ | 7,829 |
|
| 31,750 |
| $ | 0.25 |
|
|
|
(1) | Figures are for two quarters of financial data, EPS figures are annualized. |
|
|
Source: | Audited and unaudited financial statements, corporate reports and offering circulars, and RP®Financial, LC. calculations. The information provided in this table has been obtained from sources we believe are reliable, but we cannot guarantee the accuracy or completeness of such information. |
|
|
Copyright (c) 2008 by RP® Financial, LC. | |
EXHIBIT 3
Pro Forma Analysis Sheet – Fully Converted Basis
Exhibit 3
PRO FORMA ANALYSIS SHEET
Malvern Federal Savings Bank
Prices as of January 25, 2008
|
|
|
|
|
|
|
|
|
|
|
|
|
|
|
|
|
|
|
|
|
|
|
|
|
|
|
| Peer Group |
| Pennsylvania Companies |
| All Publicly-Traded |
| ||||||
|
|
|
|
|
|
|
|
|
|
| |||||||||
Price Multiple |
|
|
| Symbol |
| Subject (1) |
| Average |
| Median |
| Average |
| Median |
| Average |
| Median |
|
|
|
|
|
|
|
|
|
|
|
| |||||||||
Price-earnings ratio (x) |
|
|
| P/E |
| 30.21 | x | 27.73 | x | 29.26 | x | 15.89 | x | 14.18 | x | 19.66 | x | 18.00 | x |
Price-core earnings ratio (x) |
|
|
| P/Core |
| 30.54 | x | 27.55 | x | 28.82 | x | 17.08 | x | 16.37 | x | 20.92 | x | 20.21 | x |
Price-book ratio (%) |
| = |
| P/B |
| 64.39 | % | 84.26 | % | 81.52 | % | 91.14 | % | 98.33 | % | 110.01 | % | 102.92 | % |
Price-tangible book ratio (%) |
| = |
| P/TB |
| 64.39 | % | 87.20 | % | 86.73 | % | 115.97 | % | 110.34 | % | 123.89 | % | 116.40 | % |
Price-assets ratio (%) |
| = |
| P/A |
| 10.58 | % | 21.58 | % | 17.28 | % | 9.59 | % | 7.54 | % | 14.42 | % | 11.64 | % |
|
|
|
|
|
|
|
|
|
|
Valuation Parameters |
|
|
|
|
|
|
|
|
|
|
|
|
|
|
|
|
|
|
|
Pre-Conversion Earnings (Y) |
| $ | 1,960,000 |
| ESOP Stock Purchases (E) |
| 8.00 | % (5) |
|
Pre-Conversion Earnings (CY) |
| $ | 1,938,000 |
| Cost of ESOP Borrowings (S) |
| 0.00 | % (4) |
|
Pre-Conversion Book Value (B) |
| $ | 44,696,000 |
| ESOP Amortization (T) |
| 15.00 | years |
|
Pre-Conv. Tang. Book Val. (TB) |
| $ | 44,696,000 |
| RRP Amount (M) |
| 4.00 | % |
|
Pre-Conversion Assets (A) |
| $ | 542,205,000 |
| RRP Vesting (N) |
| 5.00 | years (5) |
|
Reinvestment Rate (2)(R) |
|
| 3.34 | % | Foundation (F) |
| 2.00 | % |
|
Est. Conversion Expenses (3)(X) |
|
| 2.50 | % | Tax Benefit (Z) |
| 485,100 |
|
|
Tax Rate (TAX) |
|
| 38.50 | % | Percentage Sold (PCT) |
| 100.00 | % |
|
|
|
|
|
| Option (O1) |
| 10.00 | % (6) |
|
|
|
|
|
| Estimated Option Value (O2) |
| 38.60 | % (6) |
|
|
|
|
|
| Option vesting (O3) |
| 5.00 | (6) |
|
|
|
|
|
| Option pct taxable (O4) |
| 25.00 | % (6) |
|
|
|
|
|
|
|
|
Calculation of Pro Forma Value After Conversion |
|
|
|
| ||
|
|
|
|
|
|
|
1. | V= | P/E * (Y) |
| V= | $ | 63,000,000 |
|
|
|
|
|
| |
|
| 1 - P/E * PCT * ((1-X-E-M-F)*R*(1-TAX) - (1-TAX)*E/T - (1-TAX)*M/N) - (1-(TAX*O4))*(O1*O2)/O3) |
|
|
|
|
|
|
|
|
|
|
|
2. | V= | P/Core * (Y) |
| V= | $ | 63,000,000 |
|
|
|
|
|
| |
|
| 1 - P/core * PCT * ((1-X-E-M-F)*R*(1-TAX) - (1-TAX)*E/T - (1-TAX)*M/N) - (1-(TAX*O4))*(O1*O2)/O3) |
|
|
|
|
|
|
|
|
|
|
|
3. | V= | P/B * (B+Z) |
| V= | $ | 63,000,000 |
|
|
|
|
|
| |
|
| 1 - P/B * PCT * (1-X-E-M-F) |
|
|
|
|
|
|
|
|
|
|
|
4. | V= | P/TB * (TB+Z) |
| V= | $ | 63,000,000 |
|
|
|
|
|
| |
|
| 1 - P/TB * PCT * (1-X-E-M-F) |
|
|
|
|
|
|
|
|
|
|
|
5. | V= | P/A * (A+Z) |
| V= | $ | 63,000,000 |
|
|
|
|
|
| |
|
| 1 - P/A * PCT * (1-X-E-M-F) |
|
|
|
|
|
|
|
|
|
|
|
|
|
|
|
|
|
|
|
|
|
|
|
|
|
|
|
Conclusion |
| Shares Issued |
| Price Per |
| Gross Offering |
| Shares |
| Total Shares |
| Aggregate |
| ||
|
|
|
|
|
|
| |||||||||
Supermaximum |
| 8,165,115 |
| 10.00 |
| $ | 81,651,155 |
| 166,635 |
| 8,331,750 |
| $ | 83,317,500 |
|
Maximum |
| 7,100,100 |
| 10.00 |
|
| 71,001,000 |
| 144,900 |
| 7,245,000 |
|
| 72,450,000 |
|
Midpoint |
| 6,174,000 |
| 10.00 |
|
| 61,740,000 |
| 126,000 |
| 6,300,000 |
|
| 63,000,000 |
|
Minimum |
| 5,247,900 |
| 10.00 |
|
| 52,479,000 |
| 107,100 |
| 5,355,000 |
|
| 53,550,000 |
|
|
|
(1) | Pricing ratios shown reflect the midpoint value. |
|
|
(2) | Net return reflects a reinvestment rate of 3.34 percent and a tax rate of 38.5 percent. |
|
|
(3) | Offering expenses shown at estimated midpoint value. |
|
|
(4) | No cost is applicable since holding company will fund the ESOP loan. |
|
|
(5) | ESOP and MRP amortize over 15 years and 5 years, respectively; amortization expenses tax effected at 38.5 percent. |
|
|
(6) | 10 percent option plan with an estimated Black-Scholes valuation of 38.60 percent of the exercise price, including a 5 year vesting with 25 percent of the options (granted to directors) tax effected at 38.5 percent. |
EXHIBIT 4
Pro Forma Effect of Conversion Proceeds – Fully Converted Basis
Exhibit 4
PRO FORMA EFFECT OF CONVERSION PROCEEDS
Malvern Federal Savings Bank
At the Minimum
|
|
|
|
|
|
|
|
|
|
|
|
|
|
|
1. | Pro Forma Market Capitalization |
|
|
|
|
|
|
|
|
|
| $ | 53,550,000 |
|
| Less: Foundation Shares |
|
|
|
|
|
|
|
|
|
|
| 1,071,000 |
|
|
|
|
|
|
|
|
|
|
|
|
|
| ||
2. | Offering Proceeds |
|
|
|
|
|
|
|
|
|
| $ | 52,479,000 |
|
| Less: Estimated Offering Expenses |
|
|
|
|
|
|
|
| 1,311,975 |
| |||
|
|
|
|
|
|
|
|
|
|
|
|
| ||
| Net Conversion Proceeds |
|
|
|
|
|
|
|
|
|
| $ | 51,167,025 |
|
|
|
|
|
|
|
|
|
|
|
|
|
|
|
|
3. | Estimated Additional Income from Conversion Proceeds |
|
|
|
|
|
|
| ||||||
|
|
|
|
|
|
|
|
| ||||||
| Net Conversion Proceeds |
|
|
|
|
|
|
|
|
|
| $ | 51,167,025 |
|
| Less: Cash Contribution to Foundation |
|
|
|
|
|
|
|
| 0 |
| |||
| Less: Non-Cash Stock Purchases (1) |
|
|
|
|
|
|
|
| 6,426,000 |
| |||
|
|
|
|
|
|
|
|
|
|
|
|
| ||
| Net Proceeds Reinvested |
|
|
|
|
|
|
|
|
|
| $ | 44,741,025 |
|
| Estimated net incremental rate of return |
|
|
|
|
|
|
|
| 2.05 | % | |||
|
|
|
|
|
|
|
|
|
|
|
|
| ||
| Reinvestment Income |
|
|
|
|
|
|
|
|
|
| $ | 919,025 |
|
| Less: Estimated cost of ESOP borrowings (2) |
|
|
|
|
|
|
|
| 0 |
| |||
| Less: Amortization of ESOP borrowings (3) |
|
|
|
|
|
|
|
| 175,644 |
| |||
| Less: Amortization of Options (4) |
|
|
|
|
|
|
|
| 373,616 |
| |||
| Less: Recognition Plan Vesting (5) |
|
|
|
|
|
|
|
| 263,466 |
| |||
|
|
|
|
|
|
|
|
|
|
|
|
| ||
| Net Earnings Impact |
|
|
|
|
|
|
|
|
|
| $ | 106,300 |
|
|
|
|
|
|
|
|
|
|
|
|
|
|
|
|
4. | Pro Forma Earnings |
|
|
|
|
|
|
|
|
|
|
|
|
|
|
|
|
|
|
|
|
|
|
|
|
|
|
|
|
|
|
|
|
|
| Before |
| Net |
| After |
| |||
|
|
|
|
|
|
|
|
| ||||||
|
|
|
|
|
|
|
|
|
|
|
| |||
| 12 Months ended December 31, 2007 (reported) |
| $ | 1,960,000 |
| $ | 106,300 |
| $ | 2,066,300 |
| |||
| 12 Months ended December 31, 2007 (core) |
| $ | 1,938,000 |
| $ | 106,300 |
| $ | 2,044,300 |
| |||
|
|
|
|
|
|
|
|
|
|
|
|
|
|
|
5. | Pro Forma Net Worth |
|
|
|
|
|
|
|
|
|
|
|
|
|
|
|
|
|
|
|
|
|
|
|
|
|
|
|
|
|
|
| Before |
| Net Cash |
| Tax Benefit |
| After |
| ||||
|
|
|
|
|
|
| ||||||||
|
|
|
|
|
|
|
|
|
|
|
|
|
|
|
| December 31, 2007 |
| $ | 44,696,000 |
| $ | 44,741,025 |
| $ | 412,335 |
| $ | 89,849,360 |
|
| December 31, 2007 (Tangible) |
| $ | 44,696,000 |
| $ | 44,741,025 |
| $ | 412,335 |
| $ | 89,849,360 |
|
|
|
|
|
|
|
|
|
|
|
|
|
|
|
|
6. | Pro Forma Assets |
|
|
|
|
|
|
|
|
|
|
|
|
|
|
|
|
|
|
|
|
|
|
|
|
|
|
|
|
|
|
| Before |
| Net Cash |
| Tax Benefit |
| After |
| ||||
|
|
|
|
|
|
| ||||||||
|
|
|
|
|
|
|
|
|
|
|
|
|
|
|
| December 31, 2007 |
| $ | 542,205,000 |
| $ | 44,741,025 |
| $ | 412,335 |
| $ | 587,358,360 |
|
|
|
(1) | Includes ESOP and RRP stock purchases equal to 8.0 and 4.0 percent of total shares issued, respectively. |
|
|
(2) | ESOP stock purchases are internally financed by a loan from the holding company. |
|
|
(3) | ESOP borrowings are amortized over 15 years, amortization expense is tax-effected at a 38.5 percent rate. |
|
|
(4) | Option valuation based on Black-Scholes model, 5 year vesting, and assumes 25 percent is taxable. |
|
|
(5) | RRP is amortized over 5 years, and amortization expense is tax effected at 38.5 percent. |
Exhibit 4
PRO FORMA EFFECT OF CONVERSION PROCEEDS
Malvern Federal Savings Bank
At the Midpoint
|
|
|
|
|
|
|
|
|
|
|
|
|
|
|
1. | Pro Forma Market Capitalization |
|
|
|
|
|
|
|
|
|
| $ | 63,000,000 |
|
| Less: Foundation Shares |
|
|
|
|
|
|
|
|
|
|
| 1,260,000 |
|
|
|
|
|
|
|
|
|
|
|
|
|
| ||
2. | Offering Proceeds |
|
|
|
|
|
|
|
|
|
| $ | 61,740,000 |
|
| Less: Estimated Offering Expenses |
|
|
|
|
|
|
|
|
| 1,543,500 |
| ||
|
|
|
|
|
|
|
|
|
|
|
|
| ||
| Net Conversion Proceeds |
|
|
|
|
|
|
|
|
|
| $ | 60,196,500 |
|
|
|
|
|
|
|
|
|
|
|
|
|
|
|
|
3. | Estimated Additional Income from Conversion Proceeds |
|
|
|
|
|
|
|
| |||||
|
|
|
|
|
|
|
|
|
|
|
|
|
|
|
| Net Conversion Proceeds |
|
|
|
|
|
|
|
|
|
| $ | 60,196,500 |
|
| Less: Cash Contribution to Foundation |
|
|
|
|
|
|
|
| 0 |
| |||
| Less: Non-Cash Stock Purchases (1) |
|
|
|
|
|
|
|
| 7,560,000 |
| |||
|
|
|
|
|
|
|
|
|
|
|
|
| ||
| Net Proceeds Reinvested |
|
|
|
|
|
|
|
|
|
| $ | 52,636,500 |
|
| Estimated net incremental rate of return |
|
|
|
|
|
|
|
| 2.05 | % | |||
|
|
|
|
|
|
|
|
|
|
|
|
| ||
| Reinvestment Income |
|
|
|
|
|
|
|
|
|
| $ | 1,081,206 |
|
| Less: Estimated cost of ESOP borrowings (2) |
|
|
|
|
|
| 0 |
| |||||
| Less: Amortization of ESOP borrowings (3) |
|
|
|
|
|
| 206,640 |
| |||||
| Less: Amortization of Options (4) |
|
|
|
|
|
|
|
| 439,548 |
| |||
| Less: Recognition Plan Vesting (5) |
|
|
|
|
|
|
|
| 309,960 |
| |||
|
|
|
|
|
|
|
|
|
|
|
|
| ||
| Net Earnings Impact |
|
|
|
|
|
|
|
|
|
| $ | 125,058 |
|
|
|
|
|
|
|
|
|
|
|
|
|
|
|
|
4. | Pro Forma Earnings |
|
|
|
|
|
|
|
|
|
|
|
|
|
|
|
|
|
|
| Before |
| Net |
| After |
| |||
|
|
|
|
|
|
|
|
| ||||||
|
|
|
|
|
|
|
|
|
|
|
|
|
|
|
| 12 Months ended December 31, 2007 (reported) |
| $ | 1,960,000 |
| $ | 125,058 |
| $ | 2,085,058 |
| |||
| 12 Months ended December 31, 2007 (core) |
| $ | 1,938,000 |
| $ | 125,058 |
| $ | 2,063,058 |
| |||
|
|
|
|
|
|
|
|
|
|
|
|
|
|
|
5. | Pro Forma Net Worth |
|
|
|
|
|
|
|
|
|
|
|
|
|
|
|
|
|
|
|
|
|
|
|
|
|
|
|
|
|
|
| Before |
| Net Cash |
| Tax Benefit |
| After |
| ||||
|
|
|
|
|
|
| ||||||||
|
|
|
|
|
|
|
|
|
|
|
|
|
|
|
| December 31, 2007 |
| $ | 44,696,000 |
| $ | 52,636,500 |
| $ | 485,100 |
| $ | 97,817,600 |
|
| December 31, 2007 (Tangible) |
| $ | 44,696,000 |
| $ | 52,636,500 |
| $ | 485,100 |
| $ | 97,817,600 |
|
|
|
|
|
|
|
|
|
|
|
|
|
|
|
|
6. | Pro Forma Assets |
|
|
|
|
|
|
|
|
|
|
|
|
|
|
|
|
|
|
|
|
|
|
|
|
|
|
|
|
|
|
| Before |
| Net Cash |
| Tax Benefit |
| After |
| ||||
|
|
|
|
|
|
| ||||||||
|
|
|
|
|
|
|
|
|
|
|
|
|
|
|
| December 31, 2007 |
| $ | 542,205,000 |
| $ | 52,636,500 |
| $ | 485,100 |
| $ | 595,326,600 |
|
|
|
(1) | Includes ESOP and RRP stock purchases equal to 8.0 and 4.0 percent of total shares issued, respectively. |
|
|
(2) | ESOP stock purchases are internally financed by a loan from the holding company. |
|
|
(3) | ESOP borrowings are amortized over 15 years, amortization expense is tax-effected at a 38.5 percent rate. |
|
|
(4) | Option valuation based on Black-Scholes model, 5 year vesting, and assumes 25 percent is taxable. |
|
|
(5) | RRP is amortized over 5 years, and amortization expense is tax effected at 38.5 percent. |
Exhibit 4
PRO FORMA EFFECT OF CONVERSION PROCEEDS
Malvern Federal Savings Bank
At the Maximum Value
|
|
|
|
|
|
1. | Pro Forma Market Capitalization |
| $ | 72,450,000 |
|
| Less: Foundation Shares |
|
| 1,449,000 |
|
|
|
|
| ||
2. | Offering Proceeds |
| $ | 71,001,000 |
|
| Less: Estimated Offering Expenses |
|
| 1,775,025 |
|
|
|
|
| ||
| Net Conversion Proceeds |
| $ | 69,225,975 |
|
|
|
|
|
|
|
3. | Estimated Additional Income from Conversion Proceeds |
|
|
|
|
|
|
|
|
|
|
| Net Conversion Proceeds |
| $ | 69,225,975 |
|
| Less: Cash Contribution to Foundation |
|
| 0 |
|
| Less: Non-Cash Stock Purchases (1) |
|
| 8,694,000 |
|
|
|
|
| ||
| Net Proceeds Reinvested |
| $ | 60,531,975 |
|
| Estimated net incremental rate of return |
|
| 2.05 | % |
|
|
|
| ||
| Reinvestment Income |
| $ | 1,243,387 |
|
| Less: Estimated cost of ESOP borrowings (2) |
|
| 0 |
|
| Less: Amortization of ESOP borrowings (3) |
|
| 237,636 |
|
| Less: Amortization of Options (4) |
|
| 505,480 |
|
| Less: Recognition Plan Vesting (5) |
|
| 356,454 |
|
|
|
|
| ||
| Net Earnings Impact |
| $ | 143,817 |
|
|
|
|
|
|
|
|
|
|
|
|
|
|
|
|
4. | Pro Forma Earnings |
|
|
|
|
|
|
|
|
|
|
|
|
|
|
|
|
|
|
|
|
|
|
|
|
|
|
|
|
|
|
|
|
|
| Before |
| Net |
| After |
| |||
|
|
|
|
|
|
|
|
| ||||||
|
|
|
|
|
|
|
|
|
|
|
|
|
|
|
| 12 Months ended December 31, 2007 (reported) |
| $ | 1,960,000 |
| $ | 143,817 |
| $ | 2,103,817 |
| |||
| 12 Months ended December 31, 2007 (core) |
| $ | 1,938,000 |
| $ | 143,817 |
| $ | 2,081,817 |
| |||
| ||||||||||||||
5. | Pro Forma Net Worth |
|
|
|
|
|
|
|
|
|
|
|
|
|
|
|
|
|
|
|
|
|
|
|
|
|
|
|
|
|
|
| Before |
| Net Cash |
| Tax Benefit |
| After |
| ||||
|
|
|
|
|
|
| ||||||||
|
|
|
|
|
|
|
|
|
|
|
|
|
|
|
| December 31, 2007 |
| $ | 44,696,000 |
| $ | 60,531,975 |
| $ | 557,865 |
| $ | 105,785,840 |
|
| December 31, 2007 (Tangible) |
| $ | 44,696,000 |
| $ | 60,531,975 |
| $ | 557,865 |
| $ | 105,785,840 |
|
|
|
|
|
|
|
|
|
|
|
|
|
|
|
|
6. | Pro Forma Assets |
|
|
|
|
|
|
|
|
|
|
|
|
|
|
|
|
|
|
|
|
|
|
|
|
|
|
|
|
|
|
| Before |
| Net Cash |
| Tax Benefit |
| After |
| ||||
|
|
|
|
|
|
| ||||||||
|
|
|
|
|
|
|
|
|
|
|
|
|
|
|
| December 31, 2007 |
| $ | 542,205,000 |
| $ | 60,531,975 |
| $ | 557,865 |
| $ | 603,294,840 |
|
|
|
(1) | Includes ESOP and RRP stock purchases equal to 8.0 and 4.0 percent of total shares issued, respectively. |
|
|
(2) | ESOP stock purchases are internally financed by a loan from the holding company. |
|
|
(3) | ESOP borrowings are amortized over 15 years, amortization expense is tax-effected at a 38.5 percent rate. |
|
|
(4) | Option valuation based on Black-Scholes model, 5 year vesting, and assumes 25 percent is taxable. |
|
|
(5) | RRP is amortized over 5 years, and amortization expense is tax effected at 38.5 percent. |
Exhibit 4
PRO FORMA EFFECT OF CONVERSION PROCEEDS
Malvern Federal Savings Bank
At the Supermaximum Value
|
|
|
|
|
|
1. | Pro Forma Market Capitalization |
| $ | 83,317,500 |
|
| Less: Foundation Shares |
|
| 1,666,350 |
|
|
|
|
| ||
2. | Offering Proceeds |
| $ | 81,651,155 |
|
| Less: Estimated Offering Expenses |
|
| 2,041,279 |
|
|
|
|
| ||
| Net Conversion Proceeds |
| $ | 79,609,876 |
|
|
|
|
|
|
|
3. | Estimated Additional Income from Conversion Proceeds |
|
|
|
|
|
|
|
|
|
|
| Net Conversion Proceeds |
| $ | 79,609,876 |
|
| Less: Cash Contribution to Foundation |
|
| 0 |
|
| Less: Non-Cash Stock Purchases (1) |
|
| 9,998,100 |
|
|
|
|
| ||
| Net Proceeds Reinvested |
| $ | 69,611,776 |
|
| Estimated net incremental rate of return |
|
| 2.05 | % |
|
|
|
| ||
| Reinvestment Income |
| $ | 1,429,895 |
|
| Less: Estimated cost of ESOP borrowings (2) |
|
| 0 |
|
| Less: Amortization of ESOP borrowings (3) |
|
| 273,281 |
|
| Less: Amortization of Options (4) |
|
| 581,302 |
|
| Less: Recognition Plan Vesting (5) |
|
| 409,922 |
|
|
|
|
| ||
| Net Earnings Impact |
| $ | 165,390 |
|
|
|
|
|
|
|
|
|
|
|
|
|
|
|
|
4. | Pro Forma Earnings |
|
|
|
|
|
|
|
|
|
|
|
|
|
|
|
|
|
|
|
|
|
|
|
|
|
|
|
|
|
|
|
|
|
| Before |
| Net |
| After |
| |||
|
|
|
|
|
|
|
|
| ||||||
|
|
|
|
|
|
|
|
|
|
|
|
|
|
|
| 12 Months ended December 31, 2007 (reported) |
| $ | 1,960,000 |
| $ | 165,390 |
| $ | 2,125,390 |
| |||
| 12 Months ended December 31, 2007 (core) |
| $ | 1,938,000 |
| $ | 165,390 |
| $ | 2,103,390 |
| |||
|
|
|
|
|
|
|
|
|
|
|
|
|
|
|
5. | Pro Forma Net Worth |
|
|
|
|
|
|
|
|
|
|
|
|
|
|
|
|
|
|
|
|
|
|
|
|
|
|
|
|
|
|
| Before |
| Net Cash |
| Tax Benefit |
| After |
| ||||
|
|
|
|
|
|
| ||||||||
|
|
|
|
|
|
|
|
|
|
|
|
|
|
|
| December 31, 2007 |
| $ | 44,696,000 |
| $ | 69,611,776 |
| $ | 641,545 |
| $ | 114,949,321 |
|
| December 31, 2007 (Tangible) |
| $ | 44,696,000 |
| $ | 69,611,776 |
| $ | 641,545 |
| $ | 114,949,321 |
|
|
|
|
|
|
|
|
|
|
|
|
|
|
|
|
6. | Pro Forma Assets |
|
|
|
|
|
|
|
|
|
|
|
|
|
|
|
|
|
|
|
|
|
|
|
|
|
|
|
|
|
|
| Before |
| Net Cash |
| Tax Benefit |
| After |
| ||||
|
|
|
|
|
|
| ||||||||
|
|
|
|
|
|
|
|
|
|
|
|
|
|
|
| December 31, 2007 |
| $ | 542,205,000 |
| $ | 69,611,776 |
| $ | 641,545 |
| $ | 612,458,321 |
|
|
|
(1) | Includes ESOP and RRP stock purchases equal to 8.0 and 4.0 percent of total shares issued, respectively. |
|
|
(2) | ESOP stock purchases are internally financed by a loan from the holding company. |
|
|
(3) | ESOP borrowings are amortized over 15 years, amortization expense is tax-effected at a 38.5 percent rate. |
|
|
(4) | Option valuation based on Black-Scholes model, 5 year vesting, and assumes 25 percent is taxable. |
|
|
(5) | RRP is amortized over 5 years, and amortization expense is tax effected at 38.5 percent. |
EXHIBIT 5
Pro Forma Analysis Sheet – Minority Stock Offering
EXHIBIT 5
PRO FORMA ANALYSIS SHEET
Malvern Federal Savings Bank
January 25, 2008
|
|
|
|
|
|
|
|
|
|
|
|
|
|
|
|
|
|
|
|
|
|
|
|
|
|
|
| Peer Group |
| Pennsylvania Companies |
| All Publicly-Traded |
| ||||||
|
|
|
|
|
|
|
|
|
|
| |||||||||
Price Multiple |
|
|
| Symbol |
| Subject (1) |
| Average |
| Median |
| Average |
| Median |
| Average |
| Median |
|
|
|
|
|
|
|
|
|
|
|
| |||||||||
Price-earnings ratio (x) |
|
|
| P/E |
| 32.42 | x | 30.63 | x | 32.27 | x | 15.89 | x | 14.18 | x | 19.66 | x | 18.00 | x |
Price-core earnings ratio (x) |
|
|
| P/Core |
| 32.79 | x | 32.31 | x | 33.33 | x | 17.08 | x | 16.37 | x | 20.92 | x | 20.21 | x |
Price-book ratio (%) |
| = |
| P/B |
| 93.81 | % | 149.18 | % | 130.58 | % | 91.14 | % | 98.33 | % | 110.01 | % | 102.92 | % |
Price-tangible book ratio (%) |
| = |
| P/TB |
| 93.81 | % | 158.49 | % | 145.71 | % | 115.97 | % | 110.34 | % | 123.89 | % | 116.40 | % |
Price-assets ratio (%) |
| = |
| P/A |
| 11.16 | % | 25.31 | % | 18.84 | % | 9.59 | % | 7.54 | % | 14.42 | % | 11.64 | % |
|
|
|
|
|
|
|
|
|
|
|
|
|
|
|
|
|
|
|
|
|
|
|
|
|
|
|
|
|
|
Valuation Parameters |
|
|
|
|
|
|
|
|
|
|
|
|
|
|
|
|
|
|
|
Pre-Conversion Earnings (Y) |
| $ | 1,958,000 |
| ESOP Stock Purchases (E) |
| 8.71 | % (5) |
|
Pre-Conversion Earnings (CY) |
| $ | 1,936,000 |
| Cost of ESOP Borrowings (S) |
| 0.00 | % (4) |
|
Pre-Conversion Book Value (B) |
| $ | 44,596,000 |
| ESOP Amortization (T) |
| 15.00 | years |
|
Pre-Conv. Tang. Book Value (TB) |
| $ | 44,596,000 |
| MRP Amount (M) |
| 4.36 | % |
|
Pre-Conversion Assets (A) |
| $ | 542,105,000 |
| MRP Vesting (N) |
| 5.00 | years (5) |
|
Reinvestment Rate(R)(2) |
|
| 3.34 | % | Foundation (F) |
| 4.65 | % |
|
Est. Conversion Expenses (X)(3) |
|
| 4.75 | % | Tax Benefit (Z) |
| 485,100 |
|
|
Tax Rate (TAX) |
|
| 38.50 | % | Percentage Sold (PCT) |
| 45.00 | % |
|
|
|
|
|
| Option (O1) |
| 10.89 | % (6) |
|
|
|
|
|
| Estimated Option Value (O2) |
| 38.60 | % (6) |
|
|
|
|
|
| Option vesting (O3) |
| 5.00 | (6) |
|
|
|
|
|
| Option pct taxable (O4) |
| 25.00 | % (6) |
|
|
|
|
|
|
|
|
Calculation of Pro Forma Value After Conversion |
|
|
|
| ||
|
|
|
|
|
|
|
1. | V= | P/E * (Y) |
| V= | $ | 63,000,000 |
|
|
|
|
|
| |
|
| 1 - P/E * PCT * ((1-X-E-M-F)*R*(1-TAX) - (1-TAX)*E/T - (1-TAX)*M/N) - (1-(TAX*O4))*(O1*O2)/O3) |
|
|
|
|
|
|
|
|
|
|
|
2. | V= | P/Core * (Y) |
| V= | $ | 63,000,000 |
|
|
|
|
|
| |
|
| 1 - P/core * PCT * ((1-X-E-M-F)*R*(1-TAX) - (1-TAX)*E/T - (1-TAX)*M/N) - (1-(TAX*O4))*(O1*O2)/O3) |
|
|
|
|
|
|
|
|
|
|
|
3. | V= | P/B * (B+Z) |
| V= | $ | 63,000,000 |
|
|
|
|
|
| |
|
| 1 - P/B * PCT * (1-X-E-M-F) |
|
|
|
|
|
|
|
|
|
|
|
4. | V= | P/TB * (TB+Z) |
| V= | $ | 63,000,000 |
|
|
|
|
|
| |
|
| 1 - P/TB * PCT * (1-X-E-M-F) |
|
|
|
|
|
|
|
|
|
|
|
5. | V= | P/A * (A+Z) |
| V= | $ | 63,000,000 |
|
|
|
|
|
| |
|
| 1 - P/A * PCT * (1-X-E-M-F) |
|
|
|
|
|
|
|
|
|
|
|
|
|
|
|
|
|
|
|
|
|
|
|
|
|
Conclusion |
| Shares Owned by |
|
| Shares Issued |
| Price Per |
| Gross Offering |
| Shares |
| Total Shares |
| Aggregate |
| Full Value |
| ||
|
|
|
|
|
|
|
|
|
| |||||||||||
Supermaximum |
| 4,582,462 |
|
| 3,582,653 |
| 10.00 |
| $ | 35,826,530 |
| 166,635 |
| 3,749,288 |
| $ | 37,492,880 |
| 8,331,750 |
|
Maximum |
| 3,984,750 |
|
| 3,115,350 |
| 10.00 |
| $ | 31,153,500 |
| 144,900 |
| 3,260,250 |
|
| 32,602,500 |
| 7,245,000 |
|
Midpoint |
| 3,465,000 |
|
| 2,709,000 |
| 10.00 |
| $ | 27,090,000 |
| 126,000 |
| 2,835,000 |
|
| 28,350,000 |
| 6,300,000 |
|
Minimum |
| 2,945,250 |
|
| 2,302,650 |
| 10.00 |
| $ | 23,026,500 |
| 107,100 |
| 2,409,750 |
|
| 24,097,500 |
| 5,355,000 |
|
|
|
(1) | Pricing ratios shown reflect the midpoint value. |
|
|
(2) | Net return reflects a reinvestment rate of 3.34 percent, and a tax rate of 38.5 percent. |
|
|
(3) | Offering expenses shown at estimated midpoint value. |
|
|
(4) | No cost is applicable since holding company will fund the ESOP loan. |
|
|
(5) | ESOP and RRP amortize over 15 years and 5 years, respectively; amortization expenses tax effected at 38.5 percent. |
|
|
(6) | Option plan with an estimated Black-Scholes valuation of 38.60 percent of the exercise price, including a 5 year vesting with 25 percent of the options (granted to directors) tax effected at 38.5 percent. |
EXHIBIT 6
Pro Forma Effect of Stock Proceeds – Minority Stock Offering
|
Exhibit 6 |
PRO FORMA EFFECT OF CONVERSION PROCEEDS |
Malvern Federal Savings Bank |
At the Minimum |
|
|
|
|
|
|
1. | Pro Forma Market Capitalization |
| $ | 24,097,500 |
|
| Less: Foundation Shares |
|
| 1,071,000 |
|
|
|
|
| ||
2. | Offering Proceeds |
| $ | 23,026,500 |
|
| Less: Estimated Offering Expenses |
|
| 1,249,648 |
|
|
|
|
| ||
| Net Conversion Proceeds |
| $ | 21,776,852 |
|
|
|
|
|
|
|
|
|
|
|
|
|
3. | Estimated Additional Income from Conversion Proceeds |
|
|
|
|
|
|
|
|
|
|
| Net Conversion Proceeds |
| $ | 21,776,852 |
|
| Less: Cash Contribution to Foundation |
|
| 0 |
|
| Less: Non-Cash Stock Purchases (1) |
|
| 3,148,740 |
|
|
|
|
| ||
| Net Proceeds Reinvested |
| $ | 18,628,112 |
|
| Estimated net incremental rate of return |
|
| 2.05 | % |
|
|
|
| ||
| Reinvestment Income |
| $ | 382,640 |
|
| Less: Estimated cost of ESOP borrowings (2) |
|
| 0 |
|
| Less: Amortization of ESOP borrowings (3) |
|
| 86,066 |
|
| Less: Amortization of Options (4) |
|
| 183,072 |
|
| Less: Recognition Plan Vesting (5) |
|
| 129,098 |
|
|
|
|
| ||
| Net Earnings Impact |
| ($ | 15,596 | ) |
|
|
|
|
|
|
|
|
|
|
|
|
4. | Pro Forma Earnings |
|
|
|
|
|
|
|
|
|
|
|
|
| Before |
| Net |
| After |
| |||
|
|
|
|
|
| ||||||
|
|
|
|
|
|
|
|
|
|
|
|
| 12 Months ended December 31, 2007 (reported) |
| $ | 1,958,000 |
| ($ | 15,596 | ) | $ | 1,942,404 |
|
| 12 Months ended December 31, 2007 (core) |
| $ | 1,936,000 |
| ($ | 15,596 | ) | $ | 1,920,404 |
|
|
|
|
|
|
|
|
|
|
|
|
|
|
|
|
5. | Pro Forma Net Worth |
|
|
|
|
|
|
|
|
|
|
|
|
|
|
|
| Before |
| Net Cash |
| Tax Benefit |
| After |
| ||||
|
|
|
|
|
|
| ||||||||
|
|
|
|
|
|
|
|
|
|
|
|
|
|
|
| December 31, 2007 |
| $ | 44,596,000 |
| $ | 18,628,112 |
| $ | 412,335 |
| $ | 63,636,447 |
|
| December 31, 2007 (Tangible) |
| $ | 44,596,000 |
| $ | 18,628,112 |
| $ | 412,335 |
| $ | 63,636,447 |
|
|
|
|
|
|
|
|
|
|
|
|
|
|
|
|
6. | Pro Forma Assets |
|
|
|
|
|
|
|
|
|
|
|
|
|
|
|
| Before |
| Net Cash |
| Tax Benefit |
| After |
| ||||
|
|
|
|
|
|
| ||||||||
|
|
|
|
|
|
|
|
|
|
|
|
|
|
|
| December 31, 2007 |
| $ | 542,105,000 |
| $ | 18,628,112 |
| $ | 412,335 |
| $ | 561,145,447 |
|
|
|
(1) | Includes ESOP and MRP stock purchases equal to 8.71 percent and 4.36 percent of the public shares, respectively. |
| |
(2) | ESOP stock purchases are internally financed by a loan from the holding company. |
| |
(3) | ESOP borrowings are amortized over 15 years, amortization expense is tax-effected at a 38.5 percent rate. |
| |
(4) | Option valuation based on Black-Scholes model, 5 year vesting, and assuming 25 percent taxable. |
| |
(5) | RRP is amortized over 5 years, and amortization expense is tax effected at 38.5 percent. |
Exhibit 6
PRO FORMA EFFECT OF CONVERSION PROCEEDS
Malvern Federal Savings Bank
At the Midpoint
|
|
|
|
|
|
1. | Pro Forma Market Capitalization |
| $ | 28,350,000 |
|
| Less: Foundation Shares |
|
| 1,260,000 |
|
|
|
|
| ||
2. | Offering Proceeds |
| $ | 27,090,000 |
|
| Less: Estimated Offering Expenses |
|
| 1,286,579 |
|
|
|
|
| ||
| Net Conversion Proceeds |
| $ | 25,803,421 |
|
|
|
|
|
|
|
3. | Estimated Additional Income from Conversion Proceeds |
|
|
|
|
|
|
|
|
|
|
| Net Conversion Proceeds |
| $ | 25,803,421 |
|
| Less: Cash Contribution to Foundation |
|
| 0 |
|
| Less: Non-Cash Stock Purchases (1) |
|
| 3,704,400 |
|
|
|
|
| ||
| Net Proceeds Reinvested |
| $ | 22,099,021 |
|
| Estimated net incremental rate of return |
|
| 2.05 | % |
|
|
|
| ||
| Reinvestment Income |
| $ | 453,936 |
|
| Less: Estimated cost of ESOP borrowings (2) |
|
| 0 |
|
| Less: Amortization of ESOP borrowings (3) |
|
| 101,254 |
|
| Less: Amortization of Options (4) |
|
| 215,378 |
|
| Less: Recognition Plan Vesting (5) |
|
| 151,880 |
|
|
|
|
| ||
| Net Earnings Impact |
| ($ | 14,576 | ) |
|
|
|
|
|
|
|
|
|
|
|
|
|
|
|
4. | Pro Forma Earnings |
|
|
|
|
|
|
|
|
|
|
|
|
|
|
|
|
|
|
|
|
|
|
|
|
|
|
|
|
|
|
|
|
| Before |
| Net |
| After |
| ||||
|
|
|
|
|
|
|
| |||||||
|
|
|
|
|
|
|
|
|
|
|
|
|
|
|
| 12 Months ended December 31, 2007 (reported) |
| $ | 1,958,000 |
| ($ | 14,576 | ) | $ | 1,943,424 |
| |||
| 12 Months ended December 31, 2007 (core) |
| $ | 1,936,000 |
| ($ | 14,576 | ) | $ | 1,921,424 |
| |||
|
|
|
|
|
|
|
|
|
|
|
|
|
|
|
5. | Pro Forma Net Worth |
|
|
|
|
|
|
|
|
|
|
|
|
|
|
|
|
|
|
|
|
|
|
|
|
|
|
|
|
|
|
| Before |
| Net Cash |
| Tax Benefit |
| After |
| ||||
|
|
|
|
|
|
| ||||||||
|
|
|
|
|
|
|
|
|
|
|
|
|
|
|
| December 31, 2007 |
| $ | 44,596,000 |
| $ | 22,099,021 |
| $ | 485,100 |
| $ | 67,180,121 |
|
| December 31, 2007 (Tangible) |
| $ | 44,596,000 |
| $ | 22,099,021 |
| $ | 485,100 |
| $ | 67,180,121 |
|
|
|
|
|
|
|
|
|
|
|
|
|
|
|
|
6. | Pro Forma Assets |
|
|
|
|
|
|
|
|
|
|
|
|
|
|
|
|
|
|
|
|
|
|
|
|
|
|
|
|
|
|
| Before |
| Net Cash Proceeds |
| Tax Benefit Of Contribution |
| After Conversion |
| ||||
|
|
|
|
|
|
| ||||||||
|
|
|
|
|
|
|
|
|
|
|
|
|
|
|
| December 31, 2007 |
| $ | 542,105,000 |
| $ | 22,099,021 |
| $ | 485,100 |
| $ | 564,689,121 |
|
|
|
(1) | Includes ESOP and MRP stock purchases equal to 8.71 percent and 4.36 percent of the public shares, respectively. |
(2) | ESOP stock purchases are internally financed by a loan from the holding company. |
(3) | ESOP borrowings are amortized over 15 years, amortization expense is tax-effected at a 38.5 percent rate. |
(4) | Option valuation based on Black-Scholes model, 5 year vesting, and assuming 25 percent taxable. |
(5) | RRP is amortized over 5 years, and amortization expense is tax effected at 38.5 percent. |
Exhibit 6
PRO FORMA EFFECT OF CONVERSION PROCEEDS
Malvern Federal Savings Bank
At the Maximum
|
|
|
|
|
|
1. | Pro Forma Market Capitalization |
| $ | 32,602,500 |
|
| Less: Foundation Shares |
|
| 1,449,000 |
|
|
|
|
| ||
2. | Offering Proceeds |
| $ | 31,153,500 |
|
| Less: Estimated Offering Expenses |
|
| 1,323,510 |
|
|
|
|
| ||
| Net Conversion Proceeds |
| $ | 29,829,990 |
|
|
|
|
|
|
|
3. | Estimated Additional Income from Conversion Proceeds |
|
|
|
|
|
|
|
|
|
|
| Net Conversion Proceeds |
| $ | 29,829,990 |
|
| Less: Cash Contribution to Foundation |
|
| 0 |
|
| Less: Non-Cash Stock Purchases (1) |
|
| 4,260,060 |
|
|
|
|
| ||
| Net Proceeds Reinvested |
| $ | 25,569,930 |
|
| Estimated net incremental rate of return |
|
| 2.05 | % |
|
|
|
| ||
| Reinvestment Income |
| $ | 525,232 |
|
| Less: Estimated cost of ESOP borrowings (2) |
|
| 0 |
|
| Less: Amortization of ESOP borrowings (3) |
|
| 116,442 |
|
| Less: Amortization of Options (4) |
|
| 247,685 |
|
| Less: Recognition Plan Vesting (5) |
|
| 174,662 |
|
|
|
|
| ||
| Net Earnings Impact |
| ($ | 13,557 | ) |
|
|
|
|
|
|
|
|
|
|
|
|
|
|
|
4. | Pro Forma Earnings |
|
|
|
|
|
|
|
|
|
|
|
|
|
|
|
|
|
|
|
|
|
|
|
|
|
|
|
|
|
|
|
|
|
| Before |
| Net |
| After |
| |||
|
|
|
|
|
|
|
|
| ||||||
|
|
|
|
|
|
|
|
|
|
|
|
|
|
|
| 12 Months ended December 31, 2007 (reported) |
| $ | 1,958,000 |
| ($ | 13,557 | ) | $ | 1,944,443 |
| |||
| 12 Months ended December 31, 2007 (core) |
| $ | 1,936,000 |
| ($ | 13,557 | ) | $ | 1,922,443 |
| |||
|
|
|
|
|
|
|
|
|
|
|
|
|
|
|
5. | Pro Forma Net Worth |
|
|
|
|
|
|
|
|
|
|
|
|
|
|
|
|
|
|
|
|
|
|
|
|
|
|
|
|
|
|
| Before |
| Net Cash |
| Tax Benefit |
| After |
| ||||
|
|
|
|
|
|
| ||||||||
|
|
|
|
|
|
|
|
|
|
|
|
|
|
|
| December 31, 2007 |
| $ | 44,596,000 |
| $ | 25,569,930 |
| $ | 557,865 |
| $ | 70,723,795 |
|
| December 31, 2007 (Tangible) |
| $ | 44,596,000 |
| $ | 25,569,930 |
| $ | 557,865 |
| $ | 70,723,795 |
|
|
|
|
|
|
|
|
|
|
|
|
|
|
|
|
6. | Pro Forma Assets |
|
|
|
|
|
|
|
|
|
|
|
|
|
|
|
|
|
|
|
|
|
|
|
|
|
|
|
|
|
|
| Before |
| Net Cash |
| Tax Benefit |
| After |
| ||||
|
|
|
|
|
|
| ||||||||
|
|
|
|
|
|
|
|
|
|
|
|
|
|
|
| December 31, 2007 |
| $ | 542,105,000 |
| $ | 25,569,930 |
| $ | 557,865 |
| $ | 568,232,795 |
|
|
|
(1) | Includes ESOP and MRP stock purchases equal to 8.71 percent and 4.36 percent of the public shares, respectively. |
(2) | ESOP stock purchases are internally financed by a loan from the holding company. |
(3) | ESOP borrowings are amortized over 15 years, amortization expense is tax-effected at a 38.5 percent rate. |
(4) | Option valuation based on Black-Scholes model, 5 year vesting, and assuming 25 percent taxable. |
(5) | RRP is amortized over 5 years, and amortization expense is tax effected at 38.5 percent. |
Exhibit 6
PRO FORMA EFFECT OF CONVERSION PROCEEDS
Malvern Federal Savings Bank
At the Supermaximum Value
|
|
|
|
|
|
1. | Pro Forma Market Capitalization |
| $ | 37,492,880 |
|
| Less: Foundation Shares |
|
| 1,666,350 |
|
|
|
|
| ||
2. | Offering Proceeds |
| $ | 35,826,530 |
|
| Less: Estimated Offering Expenses |
|
| 1,365,980 |
|
|
|
|
| ||
| Net Conversion Proceeds |
| $ | 34,460,550 |
|
|
|
|
|
|
|
3. | Estimated Additional Income from Conversion Proceeds |
|
|
|
|
|
|
|
|
|
|
| Net Conversion Proceeds |
| $ | 34,460,550 |
|
| Less: Cash Contribution to Foundation |
|
| 0 |
|
| Less: Non-Cash Stock Purchases (1) |
|
| 4,899,070 |
|
|
|
|
| ||
| Net Proceeds Reinvested |
| $ | 29,561,480 |
|
| Estimated net incremental rate of return |
|
| 2.05 | % |
|
|
|
| ||
| Reinvestment Income |
| $ | 607,222 |
|
| Less: Estimated cost of ESOP borrowings (2) |
|
| 0 |
|
| Less: Amortization of ESOP borrowings (3) |
|
| 133,908 |
|
| Less: Amortization of Options (4) |
|
| 284,838 |
|
| Less: Recognition Plan Vesting (5) |
|
| 200,862 |
|
|
|
|
| ||
| Net Earnings Impact |
| ($ | 12,385 | ) |
|
|
|
|
|
|
|
|
|
|
|
|
|
|
|
4. | Pro Forma Earnings |
|
|
|
|
|
|
| ||||||
|
|
|
|
|
|
|
|
| ||||||
|
|
| Before |
| Net |
| After |
| ||||||
|
|
|
|
|
| |||||||||
| ||||||||||||||
| 12 Months ended December 31, 2007 (reported) |
| $ | 1,958,000 |
| ($ | 12,385 | ) | $ | 1,945,615 |
| |||
| 12 Months ended December 31, 2007 (core) |
| $ | 1,936,000 |
| ($ | 12,385 | ) | $ | 1,923,615 |
| |||
|
|
|
|
|
|
|
|
|
|
| ||||
5. | Pro Forma Net Worth |
|
|
|
|
|
|
|
|
| ||||
|
|
|
|
|
|
|
|
|
|
| ||||
|
| Before |
| Net Cash |
| Tax Benefit |
| After |
| |||||
|
|
|
|
|
|
| ||||||||
| ||||||||||||||
| December 31, 2007 |
| $ | 44,596,000 |
| $ | 29,561,480 |
| $ | 641,545 |
| $ | 74,799,025 |
|
| December 31, 2007 (Tangible) |
| $ | 44,596,000 |
| $ | 29,561,480 |
| $ | 641,545 |
| $ | 74,799,025 |
|
|
|
|
|
|
|
|
|
|
|
|
|
|
|
|
6. | Pro Forma Assets |
|
|
|
|
|
|
|
|
|
|
|
|
|
|
|
|
|
|
|
|
|
|
|
|
|
|
|
|
|
|
| Before |
| Net Cash |
| Tax Benefit |
| After |
| ||||
|
|
|
|
|
|
| ||||||||
| ||||||||||||||
| December 31, 2007 |
| $ | 542,105,000 |
| $ | 29,561,480 |
| $ | 641,545 |
| $ | 572,308,025 |
|
|
|
(1) | Includes ESOP and MRP stock purchases equal to 8.71 percent and 4.36 percent of the public shares, respectively. |
|
|
(2) | ESOP stock purchases are internally financed by a loan from the holding company. |
|
|
(3) | ESOP borrowings are amortized over 15 years, amortization expense is tax-effected at a 38.5 percent rate. |
|
|
(4) | Option valuation based on Black-Scholes model, 5 year vesting, and assuming 25 percent taxable. |
|
|
(5) | RRP is amortized over 5 years, and amortization expense is tax effected at 38.5 percent. |
EXHIBIT 7
Firm Qualifications Statement
|
RP® FINANCIAL, LC. |
Celebrating 20 Years of Financial Advisory Services |
|
FIRM QUALIFICATION STATEMENT |
RP® Financial provides financial and management consulting, merger advisory and valuation services to the financial services industry nationwide. We offer a broad array of services, high quality and prompt service, hands-on involvement by principals and senior staff, careful structuring of strategic initiatives and sophisticated valuation and other analyses consistent with industry practices and regulatory requirements. Our staff maintains extensive background in financial and management consulting, valuation and investment banking. Our clients include commercial banks, thrifts, credit unions, mortgage companies and other financial services companies.
|
STRATEGIC PLANNING SERVICES |
RP® Financial’s strategic planning services are designed to provide effective feasible plans with quantifiable results. We analyze strategic options to enhance shareholder value, achieve regulatory approval or realize other objectives. Such services involve conducting situation analyses; establishing mission/vision statements, strategic goals and objectives; and identifying strategies to enhance franchise and/or market value, capital management, earnings enhancement, operational matters and organizational issues. Strategic recommendations typically focus on: capital formation and management, asset/liability targets, profitability, return on equity and stock pricing. Our proprietary financial simulation models provide the basis for evaluating the impact of various strategies and assessing their feasibility and compatibility with regulations.
|
MERGER ADVISORY SERVICES |
RP® Financial’s merger advisory services include targeting potential buyers and sellers, assessing acquisition merit, conducting due diligence, negotiating and structuring merger transactions, preparing merger business plans and financial simulations, rendering fairness opinions, preparing mark-to-market analyses and supporting the implementation of post-acquisition strategies. Through financial simulations, comprehensive data bases, valuation proficiency and regulatory familiarity, RP® Financial’s merger advisory services center on enhancing shareholder returns.
|
VALUATION SERVICES |
RP® Financial’s extensive valuation practice includes bank and thrift mergers, thrift mutual-to-stock conversions, insurance company demutualizations, ESOPs, subsidiary companies, purchase accounting and other purposes. We are highly experienced in performing appraisals which conform to regulatory guidelines and appraisal standards. RP® Financial is the nation’s leading valuation firm for thrift mutual-to-stock conversions, with appraised values ranging up to $4 billion.
|
OTHER CONSULTING SERVICES |
RP® Financial offers other consulting services including branching and diversification strategies, feasibility studies and special research. We assist banks/thrifts in preparing CRA plans and evaluating wealth management activities on a de novo or merger basis. Our other consulting services are aided by proprietary valuation and financial simulation models.
|
KEY PERSONNEL (Years of Relevant Experience & Contact Information) |
|
|
|
|
|
Ronald S. Riggins, Managing Director (27) |
| (703) 647-6543 |
| rriggins@rpfinancial.com |
William E. Pommerening, Managing Director (24) |
| (703) 647-6546 |
| wpommerening@rpfinancial.com |
Gregory E. Dunn, Director (25) |
| (703) 647-6548 |
| gdunn@rpfinancial.com |
James P. Hennessey, Director (22) |
| (703) 647-6544 |
| jhennessey@rpfinancial.com |
James J. Oren, Director (21) |
| (703) 647-6549 |
| joren@rpfinancial.com |
Timothy M. Biddle, Senior Vice President (18) |
| (703) 647-6552 |
| tbiddle@rpfinancial.com |
|
|
|
|
Washington Headquarters |
|
Rosslyn Center | Telephone: (703) 528-1700 |
1700 North Moore Street, Suite 2210 | Fax No.: (703) 528-1788 |
Arlington, VA 22209 | Toll-Free No.: (866) 723-0594 |
www.rpfinancial.com | E-Mail: mail@rpfinancial.com |