Exhibit 99.6
PRO FORMA VALUATION UPDATE REPORT
MUTUAL HOLDING COMPANY STOCK OFFERING
MALVERN FEDERAL BANCORP, INC.
Paoli, Pennsylvania
PROPOSED MID-TIER HOLDING COMPANY FOR:
MALVERN FEDERAL SAVINGS BANK
Paoli, Pennsylvania
Dated As Of:
March 19, 2008
|
|
|
|
| |
|
|
|
| Prepared By: |
|
|
|
|
| RP® Financial, LC. |
|
|
|
|
|
|
|
|
RP®FINANCIAL, LC. |
|
| |
Financial Services Industry Consultants |
|
|
|
| March 19, 2008 |
Board of Directors
Malvern Federal Savings Bank
42 East Lancaster Avenue
Paoli, Pennsylvania 19301
Members of the Board of Directors:
We have completed and hereby provide an updated appraisal of the estimated pro forma market value of the common stock that has been offered in connection with the plan of stock issuance described below.
This updated appraisal is furnished pursuant to the conversion regulations promulgated by the Office of Thrift Supervision (“OTS”). Specifically, this Appraisal has been prepared in accordance with the “Guidelines for Appraisal Reports for the Valuation of Savings and Loan Associations Converting from Mutual to Stock Form of Organization” as set forth by the OTS, and applicable regulatory interpretations thereof. Our original appraisal report, dated December 7, 2007 (the “Original Appraisal”), and previous appraisal update report, dated January 25, 2008 (the “First Update”), are incorporated herein by reference. As in the preparation of our Original Appraisal and First update, we believe the data and information used herein is reliable; however, we cannot guarantee the accuracy and completeness of such information.
The Board of Directors of Malvern Federal Savings Bank (“Malvern Federal” or the “Bank”) has adopted a plan of reorganization and plan of stock issuance, pursuant to which the Bank will reorganize into a federal mutual holding company structure. As part of the plan of reorganization, the Bank will convert from a federally-chartered mutual savings bank to a federally-chartered stock savings bank and will become a wholly-owned subsidiary of Malvern Federal Bancorp, Inc. (“Bancorp”), a federally-chartered mid-tier holding corporation. Bancorp will issue a majority of its common stock to Malvern Federal Mutual Holding Company (the “MHC”), a federally-chartered mutual holding company, and sell a minority of its common stock to the public. It is our understanding that the public shares have been offered in a subscription offering to the Bank’s Eligible Account Holders, Employee Stock Ownership Plan, Supplemental Eligible Account Holders and Other Members, as such terms are defined for purposes of applicable federal regulatory requirements governing mutual-to-stock conversions. The stock has also been offered to the public at large in a community offering. In addition, as part of the reorganization, the Bank will form the Malvern Federal Charitable Foundation (the “Foundation”) to further the Bank’s commitment to the local community. The Foundation will be funded with stock equal to 2% of the stock to be issued in the
|
|
|
|
Rosslyn Center | Telephone: (703) 528-1700 |
1700 North Moore Street, Suite 2210 | Fax No.: (703) 528-1788 |
Arlington, VA 22209 | Toll-Free No.: (866) 723-0594 |
www.rpfinancial.com | E-Mail: mail@rpfinancial.com |
RP® Financial, LC.
Boards of Directors
March 19, 2008
Page 2
reorganization. The total shares offered for sale to the public and issued to the Foundation will constitute a minority of Bancorp’s stock (49.0% or less).
This updated appraisal reflects the following noteworthy items: (1) a review of stock market conditions since the date of the First Update; and (2) the results of Malvern Federal’s stock offering, which terminated on March 18, 2008.
The estimated pro forma market value is defined as the price at which Bancorp’s common stock, immediately upon completion of the public stock offering, would change hands between a willing buyer and a willing seller, neither being under any compulsion to buy or sell and both having reasonable knowledge of relevant facts.
Our valuation is not intended, and must not be construed, as a recommendation of any kind as to the advisability of purchasing shares of the common stock. Moreover, because such valuation is necessarily based upon estimates and projections of a number of matters, all of which are subject to change from time to time, no assurance can be given that persons who purchase shares of common stock in the conversion will thereafter be able to buy or sell such shares at prices related to the foregoing valuation of the pro forma market value thereof. RP Financial is not a seller of securities within the meaning of any federal and state securities laws and any report prepared by RP Financial shall not be used as an offer or solicitation with respect to the purchase or sale of any securities. RP Financial maintains a policy which prohibits the company, its principals or employees from purchasing stock of its client institutions.
Discussion of Relevant Considerations
1.Stock Market Conditions
Since the date of the First Update, the broader stock market has exhibited a fair amount of volatility, but, overall, the stock market showed just a slight decline from January 25, 2008 to March 19, 2008. Some positive economic data and a second rate cut by the Federal Reserve in nine days helped the broader stock market to close out the end of January 2008 on an upbeat note. However, recession fears, fueled by a decline in January service-sector activity, triggered a broad based sell-off in the stock market in early-February. A favorable retail sales report for January helped stocks to rebound in mid-February, which was followed by a downward trend heading into late-February amid higher oil prices, more weak economic data and signs of stagflation. Following a brief rally, stocks plunged at the end of February on concerns about the ongoing credit crisis and rising oil prices. Escalating problems in the bond market and weak economic data, which included job losses in the February employment report and a record number of homes entering foreclosure in the fourth quarter, extended the down turn in the broader stock market during the first part of March. Stocks soared heading into mid-March, after the Federal Reserve said it would lend Wall Street $200 billion in a move aimed at taking difficult to trade securities temporarily out of circulation. The
RP® Financial, LC.
Boards of Directors
March 19, 2008
Page 3
stock market experienced heightened volatility in mid-March, with the Dow Jones Industrial Average (“DJIA”) swinging significantly higher or lower on a daily basis. Stocks declined sharply on news of Bear Stearns’ collapse, which was followed by a more than 400 point increase in the DJIA. The surge in stocks was supported by the Federal Reserve cutting its target rate by 0.75% to 2.25% and Goldman Sachs and Lehman Brothers reporting better than expected earnings. Stocks tumbled the following day, with the DJIA declining by almost 300 points on renewed worries about the economy. On March 19, 2008, the DJIA closed at 12099.66 or 0.9% lower since the date of the First Update and the NASDAQ closed at 2209.96 or 5.0% lower since the date of the First Update.
Thrift stocks also performed unevenly since the date of the First Update. In late-January 2008 and through most of February, thrift stocks generally paralleled trends in the broader stock market. Financial stocks led the broader stock market lower at the end of February and into the first part of March, as worries about the health of key financial companies escalated. Shares of thrift stocks were among the hardest hit, as investors dumped thrift stocks in conjunction with a sharp sell-off in the stocks of Fannie Mae and Freddie Mac amid fears that defaults would force them to raise more capital. News of the Federal Reserve’s $200 billion liquidity program sent thrift stocks sharply higher heading into mid-March. Thrift stocks participated in the day-to-day swings experienced in the broader stock market during mid-March, as investors assessed the outlook for mortgage lenders in a slumping market for housing and the possibility of the economy going into recession. On March 19, 2008, the SNL Index for all publicly-traded thrifts closed at 983.6, a decrease of 5.5% since January 25, 2008. Comparatively, the SNL MHC Index closed at 3,346.3 on March 19, 2008, an increase of 4.4% since the date of the First Update.
The updated pricing measures for the Peer Group and all publicly-traded thrifts showed relatively modest changes since the date of the First Update, which highlights that most of the volatility in thrift prices has been in the larger cap issues and, in particular, the large cap issues that have experienced significant losses due to the implosion of the subprime mortgage market. The Peer Group’s updated pricing measures on a fully-converted basis continued to reflect higher P/E multiples and lower P/B ratios in comparison to the averages for all publicly-traded thrifts. Since the date of the First Update, the stock prices of six out of the ten Peer Group companies were lower as of March 19, 2008. A comparative pricing analysis of the Peer Group and all publicly-traded thrifts is shown in the following table, based on market prices as of January 25, 2008 and March 19, 2008.
RP® Financial, LC.
Boards of Directors
March 19, 2008
Page 4
Average Pricing Characteristics
|
|
|
|
|
|
|
|
|
|
|
|
| At Jan. 25, |
| At March 19, |
| % |
| |||
|
|
|
|
| ||||||
|
|
|
|
|
|
|
|
|
|
|
Peer Group(1) |
|
|
|
|
|
|
|
|
|
|
Price/Earnings (x) |
|
| 27.73 | x |
| 28.30 | x |
| 2.1 | % |
Price/Core Earnings (x) |
|
| 27.55 |
|
| 28.72 |
|
| 4.2 |
|
Price/Book (%) |
|
| 84.26 | % |
| 83.67 | % |
| (0.7 | ) |
Price/Tangible Book(%) |
|
| 87.20 |
|
| 86.56 |
|
| (0.7 | ) |
Price/Assets (%) |
|
| 21.58 |
|
| 20.81 |
|
| (3.6 | ) |
Avg. Mkt. Capitalization ($Mil) |
| $ | 155.46 |
| $ | 151.71 |
|
| (2.4 | ) |
|
|
|
|
|
|
|
|
|
|
|
All Publicly-Traded Thrifts |
|
|
|
|
|
|
|
|
|
|
Price/Earnings (x) |
|
| 19.66 | x |
| 19.41 | x |
| (1.3 | )% |
Price/Core Earnings (x) |
|
| 20.92 |
|
| 20.51 |
|
| (2.0 | ) |
Price/Book (%) |
|
| 110.01 | % |
| 108.67 | % |
| (1.2 | ) |
Price/Tangible Book(%) |
|
| 123.89 |
|
| 122.62 |
|
| (1.0 | ) |
Price/Assets (%) |
|
| 14.42 |
|
| 14.08 |
|
| (2.4 | ) |
Avg. Mkt. Capitalization ($Mil) |
| $ | 328.65 |
| $ | 336.47 |
|
| 2.4 |
|
As set forth in the Original Appraisal and First Update, the “new issue” market is separate and distinct from the market for seasoned issues like the Peer Group companies in that the pricing ratios for converting issues are computed on a pro forma basis, specifically: (1) the numerator and denominator are both impacted by the conversion offering amount, unlike existing stock issues in which price change affects only the numerator; and (2) the pro forma pricing ratio incorporates assumptions regarding source and use of proceeds, effective tax rates, stock plan purchases, etc. which impact pro forma financials, whereas pricing for existing issues are based on reported financials. The distinction between the pricing of converting and existing issues is perhaps most evident in the case of the price/book (“P/B”) ratio in that the P/B ratio of a converting thrift will typically result in a discount to book value, whereas in the current market for existing thrifts the P/B ratio often reflects a premium to book value. Therefore, it is appropriate to also consider the market for new issues, both at the time of the conversion and in the aftermarket.
In general, the difficult market environment for the overall thrift market remained evident in the new issue market as well. Most of the recent conversion offerings have not been over subscribed and have typically closed at below the maximum of the valuation range. At the same time, some of the recent offerings were terminated with orders falling well short of their offering ranges. As shown in Table 1, two standard conversions, one second-step conversions and two mutual holding company offerings were completed during the past three months. The mutual holding
RP® Financial, LC.
Board of Directors
March 19, 2008
Page 5
Table 1
Pricing Characteristics and After-Market Trends
Recent Conversions Completed (Last Three Months)
|
|
|
|
|
|
|
|
|
|
|
|
|
|
|
|
|
|
|
|
|
|
|
|
|
|
|
|
|
|
|
|
|
|
|
|
|
|
|
|
|
| Pre-Conversion Data |
|
|
|
|
| ||||||||||||||||||||||||
|
|
|
|
|
|
|
|
|
|
|
|
|
|
| Contribution to |
| |||||||||||||||||||
Institutional Information |
| Financial Info. |
| Asset Quality |
| Offering Information |
| Charitable Found. |
| ||||||||||||||||||||||||||
| |||||||||||||||||||||||||||||||||||
Institution |
| Conver. |
| Ticker |
| Assets |
| Equity/ |
| NPAs/ |
| Res. |
| Gross |
| % |
| % of |
| Exp./ |
| Form |
| % of |
| ||||||||||
|
|
|
|
|
|
|
|
|
|
|
|
| |||||||||||||||||||||||
|
|
|
|
|
| ($Mil) |
| (%) |
| (%) |
| (%) |
| ($Mil.) |
| (%) |
| (%) |
| (%) |
|
|
| (%) |
| ||||||||||
| |||||||||||||||||||||||||||||||||||
|
|
|
|
|
|
|
|
|
|
|
|
|
|
|
|
|
|
|
|
|
|
|
|
|
|
|
|
|
|
|
|
|
|
|
|
Standard Conversions |
|
|
|
|
|
|
|
|
|
|
|
|
|
|
|
|
|
|
|
|
|
|
|
|
|
|
|
|
|
|
|
|
|
|
|
Cape Bancorp, Inc., NJ*(1)(7) |
| 2/1/08 |
| CBNJ-NASDAQ |
| $ | 1,062 |
|
| 11.45 | % |
| 0.44 | % |
| 165 | % | $ | 78.2 |
|
| 100 | % |
| 85 | % |
| 3.2 | % |
| C/S |
|
| 782K/7.0 | % |
Danvers Bancorp, Inc., MA* |
| 1/10/08 |
| DNBK-NASDAQ |
| $ | 1,322 |
|
| 5.12 | % |
| 0.31 | % |
| 693 | % | $ | 171.9 |
|
| 100 | % |
| 132 | % |
| 1.7 | % |
| C/S |
|
| 350K/3.8 | % |
| |||||||||||||||||||||||||||||||||||
Averages - Standard Conversions: |
| $ | 1,192 |
|
| 8.29 | % |
| 0.38 | % |
| NM |
| $ | 125.1 |
|
| 100 | % |
| 109 | % |
| 2.5 | % |
| N.A. |
|
| N.A. |
| ||||
Medians - Standard Conversions: |
| $ | 1,192 |
|
| 8.29 | % |
| 0.38 | % |
| NM |
| $ | 125.1 |
|
| 100 | % |
| 109 | % |
| 2.5 | % |
| N.A. |
|
| N.A. |
| ||||
|
|
|
|
|
|
|
|
|
|
|
|
|
|
|
|
|
|
|
|
|
|
|
|
|
|
|
|
|
|
|
|
|
|
|
|
|
|
|
|
|
|
|
|
|
|
|
|
|
|
|
|
|
|
|
|
|
|
|
|
|
|
|
|
|
|
|
|
|
|
|
|
Second Step Conversions |
|
|
|
|
|
|
|
|
|
|
|
|
|
|
|
|
|
|
|
|
|
|
|
|
|
|
|
|
|
|
|
|
|
|
|
Home Federal Bancorp, Inc., ID* |
| 12/20/07 |
| HOME-NASDAQ |
| $ | 710 |
|
| 15.87 | % |
| 0.29 | % |
| 195 | % | $ | 102.0 |
|
| 59 | % |
| 85 | % |
| 4.4 | % |
| N.A. |
|
| N.A. |
|
| |||||||||||||||||||||||||||||||||||
Averages - Second Step Conversions: |
| $ | 710 |
|
| 15.87 | % |
| 0.29 | % |
| 195 | % | $ | 102.0 |
|
| 59 | % |
| 85 | % |
| 4.4 | % |
| N.A. |
|
| N.A. |
| ||||
Medians - Second Step Conversions: |
| $ | 710 |
|
| 15.87 | % |
| 0.29 | % |
| 195 | % | $ | 102.0 |
|
| 59 | % |
| 85 | % |
| 4.4 | % |
| N.A. |
|
| N.A. |
| ||||
|
|
|
|
|
|
|
|
|
|
|
|
|
|
|
|
|
|
|
|
|
|
|
|
|
|
|
|
|
|
|
|
|
|
|
|
|
|
|
|
|
|
|
|
|
|
|
|
|
|
|
|
|
|
|
|
|
|
|
|
|
|
|
|
|
|
|
|
|
|
|
|
Mutual Holding Company Conversions |
|
|
|
|
|
|
|
|
|
|
|
|
|
|
|
|
|
|
|
|
|
|
|
|
|
|
|
|
|
|
|
|
|
| |
Meridian Interstate Bncorp, Inc., MA* |
| 1/23/08 |
| EBSB-NASDAQ |
| $ | 938 |
|
| 12.18 | % |
| 0.56 | % | �� | 72 | % | $ | 100.5 |
|
| 44 | % |
| 100 | % |
| 1.6 | % |
| S |
|
| 2.99 | % |
Sound Financial, Inc., WA* |
| 1/9/08 |
| SNFL-OTCBB |
| $ | 237 |
|
| 6.77 | % |
| 0.29 | % |
| 118 | % | $ | 13.0 |
|
| 44 | % |
| 102 | % |
| 6.2 | % |
| C/S |
|
| 200K/2.27 | % |
| |||||||||||||||||||||||||||||||||||
Averages - Mutual Holding Company Conversions: |
| $ | 587 |
|
| 9.48 | % |
| 0.43 | % |
| 95 | % | $ | 56.7 |
|
| 44 | % |
| 101 | % |
| 3.9 | % |
| NA |
|
| NA |
| ||||
Medians - Mutual Holding Company Conversions: |
| $ | 587 |
|
| 9.48 | % |
| 0.43 | % |
| 95 | % | $ | 56.7 |
|
| 44 | % |
| 101 | % |
| 3.9 | % |
| NA |
|
| NA |
| ||||
|
|
|
|
|
|
|
|
|
|
|
|
|
|
|
|
|
|
|
|
|
|
|
|
|
|
|
|
|
|
|
|
|
|
|
|
|
|
|
|
|
|
|
|
|
|
|
|
|
|
|
|
|
|
|
|
|
|
|
|
|
|
|
|
|
|
|
|
|
|
|
|
Averages - All Conversions: |
| $ | 854 |
|
| 10.28 | % |
| 0.38 | % |
| 249 | % | $ | 93.1 |
|
| 69 | % |
| 101 | % |
| 3.4 | % |
| NA |
|
| NA |
| ||||
Medians - All Conversions: |
| $ | 938 |
|
| 11.45 | % |
| 0.31 | % |
| 165 | % | $ | 100.5 |
|
| 59 | % |
| 100 | % |
| 3.2 | % |
| NA |
|
| NA |
| ||||
|
|
|
|
|
|
|
|
|
|
|
|
|
|
|
|
|
|
|
|
|
|
|
|
|
|
|
|
|
|
|
|
|
|
|
|
|
|
|
|
|
|
|
|
| Insider Purchases |
|
|
|
| Pro Forma Data |
| ||||||||||||||||||||||||||
|
|
|
|
|
|
|
|
|
|
| ||||||||||||||||||||||||||||
Institutional Information |
| % Off Incl. Fdn. |
|
|
|
|
|
|
| Pricing Ratios(3) |
| Financial Charac. |
| |||||||||||||||||||||||||
| ||||||||||||||||||||||||||||||||||||||
|
|
|
|
|
| Benefit Plans |
|
|
|
|
|
|
|
|
|
|
|
|
|
|
|
|
| |||||||||||||||
|
|
|
|
|
|
|
|
| Initial |
|
|
|
|
|
|
|
|
|
|
|
|
| ||||||||||||||||
Institution |
| Conver. |
| Ticker |
| ESOP |
| Recog |
| Stk |
| Mgmt.& |
|
| P/TB |
| Core |
| P/A |
| Core |
| TE/A |
| Core |
| ||||||||||||
|
|
|
|
|
|
|
|
|
|
|
|
|
| |||||||||||||||||||||||||
|
|
|
|
|
| (%) |
| (%) |
| (%) |
| (%)(2) |
| (%) |
| (%) |
| (x) |
| (%) |
| (%) |
| (%) |
| (%) |
| |||||||||||
| ||||||||||||||||||||||||||||||||||||||
|
|
|
|
|
|
|
|
|
|
|
|
|
|
|
|
|
|
|
|
|
|
|
|
|
|
|
|
|
|
|
|
|
|
|
|
|
|
|
Standard Conversions |
|
|
|
|
|
|
|
|
|
|
|
|
|
|
|
|
|
|
|
|
|
|
|
|
|
|
|
|
|
|
|
|
|
|
|
|
|
|
Cape Bancorp, Inc., NJ*(1)(7) |
| 2/1/08 |
| CBNJ-NASDAQ |
|
| 8.0 | % |
| 4.0 | % |
| 10.0 | % |
| 2.5 | % |
| 0.00 | % |
| 104.9 | % |
| 27.8 | x |
| 11.9 | % |
| 0.4 | % |
| 11.3 | % |
| 2.6 | % |
Danvers Bancorp, Inc., MA* |
| 1/10/08 |
| DNBK-NASDAQ |
|
| 8.0 | % |
| 4.0 | % |
| 10.0 | % |
| 2.8 | % |
| 0.00 | % |
| 82.3 | % |
| 29.9 | x |
| 12.1 | % |
| 0.4 | % |
| 14.7 | % |
| 2.8 | % |
|
|
| 8.0 | % |
| 4.0 | % |
| 10.0 | % |
| 2.7 | % |
| 0.00 | % |
| 93.6 | % |
| 28.8 | x |
| 12.0 | % |
| 0.4 | % |
| 13.0 | % |
| 2.7 | % | ||||
Medians - Standard Conversions: |
|
| 8.0 | % |
| 4.0 | % |
| 10.0 | % |
| 2.7 | % |
| 0.00 | % |
| 93.6 | % |
| 28.8 | x |
| 12.0 | % |
| 0.4 | % |
| 13.0 | % |
| 2.7 | % | ||||
|
|
|
|
|
|
|
|
|
|
|
|
|
|
|
|
|
|
|
|
|
|
|
|
|
|
|
|
|
|
|
|
|
|
|
|
|
|
|
Second Step Conversions |
|
|
|
|
|
|
|
|
|
|
|
|
|
|
|
|
|
|
|
|
|
|
|
|
|
|
|
|
|
|
|
|
|
|
|
|
|
|
Home Federal Bancorp, Inc., ID* |
| 12/20/07 |
| HOME-NASDAQ |
|
| 8.0 | % |
| 3.5 | % |
| 8.7 | % |
| 0.6 | % |
| 1.90 | % |
| 87.3 | % |
| 32.5 | x |
| 21.8 | % |
| 0.7 | % |
| 25.0 | % |
| 2.7 | % |
| ||||||||||||||||||||||||||||||||||||||
Averages - Second Step Conversions: |
|
| 8.0 | % |
| 3.5 | % |
| 8.7 | % |
| 0.6 | % |
| 1.90 | % |
| 87.3 | % |
| 32.5 | x |
| 21.8 | % |
| 0.7 | % |
| 25.0 | % |
| 2.7 | % | ||||
Medians - Second Step Conversions: |
|
| 8.0 | % |
| 3.5 | % |
| 8.7 | % |
| 0.6 | % |
| 1.90 | % |
| 87.3 | % |
| 32.5 | x |
| 21.8 | % |
| 0.7 | % |
| 25.0 | % |
| 2.7 | % | ||||
|
|
|
|
|
|
|
|
|
|
|
|
|
|
|
|
|
|
|
|
|
|
|
|
|
|
|
|
|
|
|
|
|
|
|
|
|
|
|
Mutual Holding Company Conversions |
|
|
|
|
|
|
|
|
|
|
|
|
|
|
|
|
|
|
|
|
|
|
|
|
|
|
|
|
|
|
|
|
|
|
|
|
| |
Meridian Interstate Bncorp, Inc., MA* |
| 1/23/08 |
| EBSB-NASDAQ |
|
| 8.0 | % |
| 4.0 | % |
| 10.0 | % |
| 1.3 | % |
| 0.00 | % |
| 73.7 | % |
| 48.5 | x |
| 20.3 | % |
| 0.3 | % |
| 20.0 | % |
| 1.6 | % |
Sound Financial, Inc., WA* |
| 1/9/08 |
| SNFL-OTCBB |
|
| 8.7 | % |
| 4.4 | % |
| 10.9 | % |
| 11.4 | % |
| 0.00 | % |
| 72.4 | % |
| 39.4 | x |
| 11.8 | % |
| 0.2 | % |
| 11.2 | % |
| 2.1 | % |
| ||||||||||||||||||||||||||||||||||||||
Averages - Mutual Holding Company Conversions: |
|
| 8.4 | % |
| 4.2 | % |
| 10.4 | % |
| 6.3 | % |
| 0.00 | % |
| 73.0 | % |
| 44.0 | x |
| 16.0 | % |
| 0.3 | % |
| 15.6 | % |
| 1.9 | % | ||||
Medians - Mutual Holding Company Conversions: |
|
| 8.4 | % |
| 4.2 | % |
| 10.4 | % |
| 6.3 | % |
| 0.00 | % |
| 73.0 | % |
| 44.0 | x |
| 16.0 | % |
| 0.3 | % |
| 15.6 | % |
| 1.9 | % | ||||
|
|
|
|
|
|
|
|
|
|
|
|
|
|
|
|
|
|
|
|
|
|
|
|
|
|
|
|
|
|
|
|
|
|
|
|
|
|
|
Averages - All Conversions: |
|
| 8.1 | % |
| 4.0 | % |
| 9.9 | % |
| 3.7 | % |
| 0.38 | % |
| 84.1 | % |
| 35.6 | x |
| 15.6 | % |
| 0.4 | % |
| 16.4 | % |
| 2.4 | % | ||||
Medians - All Conversions: |
|
| 8.0 | % |
| 4.0 | % |
| 10.0 | % |
| 2.5 | % |
| 0.00 | % |
| 82.3 | % |
| 32.5 | x |
| 12.1 | % |
| 0.4 | % |
| 14.7 | % |
| 2.6 | % | ||||
|
|
|
|
|
|
|
|
|
|
|
|
|
|
|
|
|
|
|
|
|
|
|
|
|
|
|
|
|
|
|
|
|
|
|
|
|
|
|
|
|
|
|
|
|
| Post-IPO Pricing Trends |
| ||||||||||||||||||||||
|
|
|
|
|
|
|
|
|
|
|
| |||||||||||||||||||||||
Institutional Information |
|
|
|
| Closing Price: |
| ||||||||||||||||||||||||||||
| ||||||||||||||||||||||||||||||||||
Institution |
| Conver. |
| Ticker |
| IPO Price |
| First |
| % |
| After |
| % |
| After |
| % |
| Thru |
| % |
| |||||||||||
|
|
|
|
|
|
|
|
|
|
|
| |||||||||||||||||||||||
|
|
|
|
|
| ($) |
| ($) |
| (%) |
| ($) |
| (%) |
| ($) |
| (%) |
| ($) |
| (%) |
| |||||||||||
| ||||||||||||||||||||||||||||||||||
|
|
|
|
|
|
|
|
|
|
|
|
|
|
|
|
|
|
|
|
|
|
|
|
|
|
|
|
|
|
|
|
|
|
|
Standard Conversions |
|
|
|
|
|
|
|
|
|
|
|
|
|
|
|
|
|
|
|
|
|
|
|
|
|
|
|
|
|
|
|
|
|
|
Cape Bancorp, Inc., NJ*(1)(7) |
|
| 2/1/08 |
|
| CBNJ-NASDAQ |
| $ | 10.00 |
| $ | 10.05 |
|
| 0.5 | % | $ | 9.90 |
|
| -1.0 | % | $ | 9.80 |
|
| -2.0 | % | $ | 9.60 |
|
| -4.0 | % |
Danvers Bancorp, Inc., MA* |
|
| 1/10/08 |
|
| DNBK-NASDAQ |
| $ | 10.00 |
| $ | 9.74 |
|
| -2.6 | % | $ | 9.69 |
|
| -3.1 | % | $ | 10.26 |
|
| 2.6 | % | $ | 10.05 |
|
| 0.5 | % |
| ||||||||||||||||||||||||||||||||||
Averages - Standard Conversions: |
| $ | 10.00 |
| $ | 9.90 |
|
| -1.1 | % | $ | 9.80 |
|
| -2.1 | % | $ | 10.03 |
|
| 0.3 | % | $ | 9.83 |
|
| -1.8 | % | ||||||
Medians - Standard Conversions: |
| $ | 10.00 |
| $ | 9.90 |
|
| -1.1 | % | $ | 9.80 |
|
| -2.1 | % | $ | 10.03 |
|
| 0.3 | % | $ | 9.83 |
|
| -1.8 | % | ||||||
|
|
|
|
|
|
|
|
|
|
|
|
|
|
|
|
|
|
|
|
|
|
|
|
|
|
|
|
|
|
|
|
|
|
|
Second Step Conversions |
|
|
|
|
|
|
|
|
|
|
|
|
|
|
|
|
|
|
|
|
|
|
|
|
|
|
|
|
|
|
|
|
|
|
Home Federal Bancorp, Inc., ID* |
|
| 12/20/07 |
|
| HOME-NASDAQ |
| $ | 10.00 |
| $ | 9.88 |
|
| -1.2 | % | $ | 10.17 |
|
| 1.7 | % | $ | 10.30 |
|
| 3.0 | % | $ | 11.55 |
|
| 15.5 | % |
| ||||||||||||||||||||||||||||||||||
Averages - Second Step Conversions: |
| $ | 10.00 |
| $ | 9.88 |
|
| -1.2 | % | $ | 10.17 |
|
| 1.7 | % | $ | 10.30 |
|
| 3.0 | % | $ | 11.55 |
|
| 15.5 | % | ||||||
Medians - Second Step Conversions: |
| $ | 10.00 |
| $ | 9.88 |
|
| -1.2 | % | $ | 10.17 |
|
| 1.7 | % | $ | 10.30 |
|
| 3.0 | % | $ | 11.55 |
|
| 15.5 | % | ||||||
|
|
|
|
|
|
|
|
|
|
|
|
|
|
|
|
|
|
|
|
|
|
|
|
|
|
|
|
|
|
|
|
|
|
|
Mutual Holding Company Conversions |
|
|
|
|
|
|
|
|
|
|
|
|
|
|
|
|
|
|
|
|
|
|
|
|
|
|
|
|
|
|
|
|
|
|
Meridian Interstate Bncorp, Inc., MA* |
|
| 1/23/08 |
|
| EBSB-NASDAQ |
| $ | 10.00 |
| $ | 9.60 |
|
| -4.0 | % | $ | 9.50 |
|
| -5.0 | % | $ | 9.51 |
|
| -4.9 | % | $ | 9.50 |
|
| -5.0 | % |
Sound Financial, Inc., WA* |
|
| 1/9/08 |
|
| SNFL-OTCBB |
| $ | 10.00 |
| $ | 9.00 |
|
| -10.0 | % | $ | 9.06 |
|
| -9.4 | % | $ | 9.15 |
|
| -8.5 | % | $ | 9.10 |
|
| -9.0 | % |
| ||||||||||||||||||||||||||||||||||
Averages - Mutual Holding Company Conversions: |
| $ | 10.00 |
| $ | 9.30 |
|
| -7.0 | % | $ | 9.28 |
|
| -7.2 | % | $ | 9.33 |
|
| -6.7 | % | $ | 9.30 |
|
| -7.0 | % | ||||||
Medians - Mutual Holding Company Conversions: |
| $ | 10.00 |
| $ | 9.30 |
|
| -7.0 | % | $ | 9.28 |
|
| -7.2 | % | $ | 9.33 |
|
| -6.7 | % | $ | 9.30 |
|
| -7.0 | % | ||||||
|
|
|
|
|
|
|
|
|
|
|
|
|
|
|
|
|
|
|
|
|
|
|
|
|
|
|
|
|
|
|
|
|
|
|
Averages - All Conversions: |
| $ | 10.00 |
| $ | 9.65 |
|
| -3.5 | % | $ | 9.66 |
|
| -3.4 | % | $ | 9.80 |
|
| -2.0 | % | $ | 9.96 |
|
| -0.4 | % | ||||||
Medians - All Conversions: |
| $ | 10.00 |
| $ | 9.74 |
|
| -2.6 | % | $ | 9.69 |
|
| -3.1 | % | $ | 9.80 |
|
| -2.0 | % | $ | 9.60 |
|
| -4.0 | % | ||||||
Note: * - Appraisal performed by RP Financial;BOLD=RP Financial did the Conversion Business Plan. “NT” - Not Traded; “NA” - Not Applicable, Not Available; C/S-Cash/Stock.
|
|
(1) | Non-OTS regulated thrift. |
|
|
(2) | As a percent of MHC offering for MHC transactions. |
|
|
(3) | Does not take into account the adoption of SOP 93-6. |
|
|
(4) | Latest price if offering is less than one week old. |
|
|
(5) | Latest price if offering is more than one week but less than one month old. |
|
|
(6) | Mutual holding company pro forma data on full conversion basis. |
|
|
(7) | Simultaneously completed acquisition of another financial institution. |
|
|
(8) | Simultaneously converted to a commercial bank charter. |
|
|
(9) | Former credit union. |
RP®Financial, LC.
Boards of Directors
March 19, 2008
Page 6
company offerings are considered to be more relevant for purposes of our analysis. Both of the recent mutual holding company offerings were completed in January 2008 (Sound Financial of Washington and Meridian Interstate Bancorp of Massachusetts) and both offerings closed at approximately their respective midpoints. On a fully-converted basis, the average closing pro forma price/tangible book ratio of the recent MHC offerings equaled 73.0%. Both of the recent mutual holding company offerings traded below their IPO prices in initial trading activity. As of March 19, 2008, Sound Financial’s stock closed 9.0% below its IPO price and Meridian Interstate’s stock price closed 5.0% below its IPO price.
Shown in Table 2 are the current pricing ratios for the three companies that have completed fully-converted offerings during the past three months and are traded on NASDAQ or an Exchange. Danvers Bancorp and Cape Bancorp were standard conversion offerings and Home Federal Bancorp was a second-step conversion offering. Cape Bancorp’s offering also included a simultaneous acquisition, which resulted in a comparatively higher pro forma P/TB ratio. The current average P/TB ratio of the publicly-traded recent conversions equaled 93.89%.
2.Results of the Offering
Malvern Federal’s stock offering commenced on February 11, 2008 and terminated on March 18, 2008. The total takedown of the offering amounted to $13,539,760, based on orders received for 1,353,976 shares at $10.00 per share. There were 1,161 orders received for the Bank’s stock. The total orders received in the subscription and community offerings were well below the minimum of the offering range of $23.0 million. A distribution summary of the orders received, as provided by the selling agent Stifel Nicolaus & Company, Incorporated. (“Stifel Nicolaus”) is shown in the table below.
|
|
|
|
|
|
|
|
|
|
|
|
|
|
|
Category |
|
| Shares |
| Number of |
| Average |
| Percent of |
| ||||
|
|
|
|
|
| |||||||||
Eligible Acct. Holders |
|
| 927,444 |
|
| 954 |
|
| 972 |
|
| 68.50 | % | |
ESOP(1) |
|
| 284,004 |
|
| 1 |
|
| 284,004 |
|
| 20.98 |
| |
Supplement Eligible Acct. Holders |
|
| 86,399 |
|
| 74 |
|
| 1,168 |
|
| 6.38 |
| |
Other Members |
|
| 5,175 |
|
| 18 |
|
| 288 |
|
| 0.38 |
| |
Community |
|
| 50,954 |
|
| 114 |
|
| 447 |
|
| 3.76 |
| |
|
|
|
|
|
| |||||||||
Total |
|
| 1,353,976 |
|
| 1,161 |
|
| 1,166 |
|
| 100.00 | % | |
|
|
(1) | An ESOP order was submitted at the maximum of the offering range, but will be limited to a maximum purchase of 8.71% of the public shares issued. |
Orders from Eligible Account Holders accounted for the largest portion of the orders. Based on information provided by Stifel Nicolaus, there were 15 orders for
RP®Financial, LC.
Board of Directors
March 19, 2008
Page 7
Table 2
Market Pricing Comparatives
Prices As of March 19, 2008
|
|
|
|
|
|
|
|
|
|
|
|
|
|
|
|
|
|
|
|
|
|
|
|
|
|
|
|
|
|
| Market |
| Per Share Data |
|
|
|
|
|
|
|
|
|
|
| |||||||||||||
|
|
|
|
|
| |||||||||||||||||||||||
|
| Price/ |
| Market |
| Core |
| Book |
| Pricing Ratios(3) |
| |||||||||||||||||
|
|
|
|
|
|
| ||||||||||||||||||||||
Financial Institution |
|
|
|
|
| P/E |
| P/B |
| P/A |
| P/TB |
| P/Core |
| |||||||||||||
|
|
|
|
|
|
|
|
|
| |||||||||||||||||||
|
| ($) |
| ($Mil) |
| ($) |
| ($) |
| (x) |
| (%) |
| (%) |
| (%) |
| (x) |
| |||||||||
|
|
|
|
|
|
|
|
|
|
|
|
|
|
|
|
|
|
|
|
|
|
|
|
|
|
|
|
|
All Public Companies |
| $ | 13.23 |
| $ | 336.47 |
| $ | 0.53 |
| $ | 13.36 |
|
| 19.41 | x |
| 108.67 | % |
| 14.08 | % |
| 122.62 | % |
| 20.51 | x |
Converted Last 3 Months (no MHC) |
| $ | 10.40 |
| $ | 169.08 |
| $ | 0.31 |
| $ | 12.56 |
|
| 34.98 | x |
| 83.51 | % |
| 16.38 | % |
| 93.89 | % |
| 28.11 | x |
|
|
|
|
|
|
|
|
|
|
|
|
|
|
|
|
|
|
|
|
|
|
|
|
|
|
|
|
|
Converted Last 3 Months (noMHC) |
|
|
|
|
|
|
|
|
|
|
|
|
|
|
|
|
|
|
|
|
|
|
|
|
|
|
|
|
CBNJ Cape Bancorp, Inc. of NJ |
| $ | 9.60 |
| $ | 127.80 |
| $ | 0.36 |
| $ | 13.75 |
|
| 35.56 | x |
| 69.82 | % |
| 11.37 | % |
| 100.73 | % |
| 26.67 | x |
DNBK Danvers Bancorp, Inc. of MA |
| $ | 10.05 |
| $ | 179.32 |
| $ | 0.34 |
| $ | 12.18 |
|
| 29.56 | x |
| 82.51 | % |
| 12.19 | % |
| 82.72 | % |
| 29.56 | x |
HOME Home Federal Bancorp Inc. of ID |
| $ | 11.55 |
| $ | 200.13 |
| $ | 0.24 |
| $ | 11.76 |
|
| 39.83 | x |
| 98.21 | % |
| 25.58 | % |
| 98.21 | % |
| NM |
|
|
|
|
|
|
|
|
|
|
|
|
|
|
|
|
|
|
|
|
|
|
|
|
|
|
|
|
|
|
|
|
|
|
| Dividends(4) |
| Financial Characteristics(6) |
| ||||||||||||||||||||||||||
|
|
|
| ||||||||||||||||||||||||||||
Financial Institution |
| Amount/ |
| Yield |
| Payout |
| Total |
| Equity/ |
| NPAs/ |
| Reported |
| Core |
| ||||||||||||||
|
|
|
|
|
|
|
|
| |||||||||||||||||||||||
|
|
|
|
|
|
| ROA |
| ROE |
| ROA |
| ROE |
| |||||||||||||||||
|
|
|
|
|
|
|
|
|
|
| |||||||||||||||||||||
|
| ($) |
| (%) |
| (%) |
| ($Mil) |
| (%) |
| (%) |
| (%) |
| (%) |
| (%) |
| (%) |
| ||||||||||
|
|
|
|
|
|
|
|
|
|
|
|
|
|
|
|
|
|
|
|
|
|
|
|
|
|
|
|
|
|
|
|
All Public Companies |
| $ | 0.37 |
|
| 2.57 | % |
| 32.88 | % | $ | 3,198 |
|
| 12.61 | % |
| 1.08 | % |
| 0.44 | % |
| 3.75 | % |
| 0.41 | % |
| 3.65 | % |
Converted Last 3 Months (no MHC) |
| $ | 0.07 |
|
| 0.63 | % |
| 0.00 | % | $ | 1,126 |
|
| 19.03 | % |
| 0.46 | % |
| 0.47 | % |
| 2.88 | % |
| 0.47 | % |
| 2.87 | % |
|
|
|
|
|
|
|
|
|
|
|
|
|
|
|
|
|
|
|
|
|
|
|
|
|
|
|
|
|
|
|
|
Converted Last 3 Months (no MHC) |
|
|
|
|
|
|
|
|
|
|
|
|
|
|
|
|
|
|
|
|
|
|
|
|
|
|
|
|
|
|
|
CBNJ Cape Bancorp, Inc. of NJ |
| $ | 0.00 |
|
| 0.00 | % |
| 0.00 | % | $ | 1,124 |
|
| 16.29 | % |
| 0.54 | % |
| 0.32 | % |
| 1.96 | % |
| 0.43 | % |
| 2.62 | % |
DNBK Danvers Bancorp, Inc. of MA |
| $ | 0.00 |
|
| 0.00 | % |
| 0.00 | % | $ | 1,472 |
|
| 14.77 | % |
| 0.55 | % |
| 0.41 | % |
| 2.79 | % |
| 0.41 | % |
| 2.79 | % |
HOME Home Federal Bancorp Inc. of ID |
| $ | 0.22 |
|
| 1.90 | % |
| NM |
| $ | 782 |
|
| 26.04 | % |
| 0.30 | % |
| 0.67 | % |
| 3.88 | % |
| 0.56 | % |
| 3.21 | % |
|
|
(1) | Average of High/Low or Bid/Ask price per share. |
|
|
(2) | EPS (estimate core basis) is based on actual trailing 12 month data, adjusted to omit non-operating items on a tax-effected basis. |
|
|
(3) | P/E = Price to earnings; P/B = Price to book; P/A = Price to assets; P/TB = Price to tangible book value; and P/Core = Price to core earnings. |
|
|
(4) | Indicated 12 month dividend, based on last quarterly dividend declared. |
|
|
(5) | Indicated 12 month dividend as a percent of trailing 12 month estimated core earnings. |
|
|
(6) | ROA (return on assets) and ROE (return on equity) are indicated ratios based on trailing 12 month common earnings and average common equity and total assets balances. |
|
|
(7) | Excludes from averages and medians those companies the subject of actual or rumored acquisition activities or unusual operating characteristics. |
|
|
Source: | Corporate reports, offering circulars, and RP® Financial, LC. calculations. The information provided in this report has been obtained from sources we believe are reliable, but we cannot guarantee the accuracy or completeness of such information. |
RP®Financial, LC.
Boards of Directors
March 19, 2008
Page 8
the maximum order amount of $200,000, which totaled $3.0 million or 22.2% of the total takedown. Out-of-state orders accounted for 24.1% of the total orders received and 66.7% of the maximum orders received. Indicated purchases by the Board, executive officers and their associates totaled $462,500.
Summary of Adjustments
|
|
|
|
In the First Update, we made the following adjustments to Malvern Federal’s pro forma value based upon our comparative analysis to the Peer Group: | |||
|
|
|
|
|
|
| PreviousValuation |
| Key Valuation Parameters: |
| Adjustment |
| |||
| Financial Condition |
| No Adjustment |
| Profitability, Growth and Viability of Earnings |
| No Adjustment |
| Asset Growth |
| No Adjustment |
| Primary Market Area |
| Moderate Upward |
| Dividends |
| No Adjustment |
| Liquidity of the Shares |
| No Adjustment |
| Marketing of the Issue |
| Moderate-Significant |
| Management |
| No Adjustment |
| Effect of Govt. Regulations and Regulatory Reform |
| No Adjustment |
Except for marketing of the issue, the factors for the valuation parameters did not change since the First Update. Accordingly, those parameters were not discussed further in this update.
The general market for thrift stocks continued to struggle, reflecting ongoing worries about deteriorating credit quality and the severe downturn in market conditions for housing. The updated pricing measures for the Peer Group and all publicly-traded thrifts were little changed since the date of the First Update. Recent thrift offerings have encountered the same challenging market environment that has depressed the broader thrift market, with the majority of recently completed offerings closing at the midpoint or lower. The two most recent MHC offerings that were completed closed at approximately the midpoint of their valuation ranges and are currently trading below their IPO prices. Malvern Federal’s subscription and community offerings terminated with orders well below the minimum of the offering range. Accordingly, given the significant shortfall in the orders received and the generally unfavorable market conditions for thrift stocks, a more significant downward adjustment has been applied for marketing of the issue.
RP®Financial, LC.
Boards of Directors
March 19, 2008
Page 9
Overall, taking into account the foregoing factors, we believe that a decrease in the Bank’s estimated pro market value as set forth in the First Update is appropriate.
Basis of Valuation. Fully-Converted Pricing Ratios
Consistent with the Original Appraisal and First Update, to calculate the fully-converted pricing information for MHCs, the reported financial information for the Peer Group companies has been adjusted as follows: (1) all shares owned by the MHC are assumed to be sold at the current trading price in a second-step conversion; (2) the gross proceeds from such a sale are adjusted to reflect reasonable offering expenses and standard stock based benefit plan parameters that would be factored into a second-step conversion of MHC institutions; (3) net proceeds are assumed to be reinvested at market rates on an after-tax basis; and (4) the public ownership interest is adjusted to reflect the pro forma impact of the waived dividends pursuant to applicable regulatory policy. Book value per share and earnings per share figures for the Peer Group companies are adjusted by the impact of the assumed second-step conversion, resulting in an estimation of book value per share and earnings per share figures on a fully-converted basis. Table 3 on the following page shows the calculation of per share financial data (fully-converted basis) for each of the public MHC institutions that form the Peer Group.
Valuation Approaches
In applying the accepted valuation methodology promulgated by the regulatory agencies, i.e., the pro forma market value approach, we considered the three key pricing ratios in valuing Malvern Federal’s to-be-issued stock — price/earnings (“P/E”), price/book (“P/B”), and price/assets (“P/A”) approaches — all performed on a pro forma basis including the effects of the conversion proceeds.
In computing the pro forma impact of the conversion and the related pricing ratios, the valuation parameters utilized in the First Update did not change in this update with the exception of offering expenses on an MHC reported basis..
Consistent with the Original Appraisal and First Update, this updated appraisal continues to be based primarily on fundamental analysis techniques applied to the Peer Group, including the P/E approach, the P/B approach and the P/A approach. Also consistent with the Original Appraisal and First Update, this updated appraisal incorporates a “technical” analysis of recently completed conversion and MHC offerings, including principally the P/B approach which (as discussed in the Original Appraisal and First Update) is the most meaningful pricing ratio as the pro forma P/E ratios reflect an assumed reinvestment rate and do not yet reflect the actual use of proceeds.
RP® Financial, LC.
Board of Directors
March 19, 2008
Page 10
Table 3
Calculation of Implied Per Share Data — Incorporating MHC Second Step Conversion
Comparable Institution Analysis
For the 12 Months Ended December 31, 2007
|
|
|
|
|
|
|
|
|
|
|
|
|
|
|
|
|
|
|
| |
|
|
|
| Current Ownership |
| Current Per Share Data (MHC Ratios) |
| |||||||||||||
|
|
|
|
|
| |||||||||||||||
|
|
|
| Total |
| Public |
| MHC |
| EPS |
| Core |
| Book |
| Tang. |
| Assets |
| |
|
|
|
|
|
|
|
|
|
| |||||||||||
|
|
|
| (000) |
| (000) |
| (000) |
| ($) |
| ($) |
| ($) |
| ($) |
| ($) |
| |
Publicly-Traded MHC Institutions |
|
|
|
|
|
|
|
|
|
|
|
|
|
|
|
|
| |||
BFSB |
| Brooklyn Federal MHC of NY (31.0) |
| 13,268 |
| 3,968 |
| 9,300 |
| 0.25 |
| 0.24 |
| 6.46 |
| 6.46 |
| 30.18 |
| |
COBK |
| Colonial Bank MHC of NJ (44.9) |
| 4,451 |
| 2,080 |
| 2,371 |
| 0.28 |
| 0.27 |
| 8.77 |
| 8.77 |
| 102.87 |
| |
CSBK |
| Clifton Savings Bncrp MHC of NJ (41.0) |
| 27,307 |
| 12,813 |
| 14,494 |
| 0.09 |
| 0.09 |
| 6.25 |
| 6.25 |
| 29.84 |
| |
FXCB |
| Fox Chase Bancorp MHC of PA (44.5) |
| 14,353 |
| 6,531 |
| 7,822 |
| 0.13 |
| 0.17 |
| 8.53 |
| 8.53 |
| 56.64 |
| |
LSBK |
| Lake Shore Bancorp MHC of NY (43.7) |
| 6,464 |
| 2,976 |
| 3,488 |
| 0.23 |
| 0.23 |
| 8.24 |
| 8.24 |
| 55.13 |
| |
MGYR |
| Magyar Bancorp MHC of NJ (45.1) |
| 5,791 |
| 2,723 |
| 3,068 |
| 0.10 |
| 0.10 |
| 8.51 |
| 8.51 |
| 84.22 |
| |
ONFC |
| Oneida Financial MHC of NY (43.9) |
| 7,785 |
| 3,474 |
| 4,311 |
| 0.45 |
| 0.41 |
| 7.62 |
| 4.36 |
| 67.09 |
| |
OSHC |
| Ocean Shore Holding MHC of NJ (44.0) |
| 8,408 |
| 3,860 |
| 4,548 |
| 0.30 |
| 0.30 |
| 7.43 |
| 7.43 |
| 71.77 |
| |
PBIP |
| Prudential Bancorp MHC PA (40.5) |
| 11,371 |
| 5,155 |
| 6,216 |
| 0.27 |
| 0.27 |
| 6.98 |
| 6.98 |
| 41.38 |
| |
ROMA |
| Roma Financial Corp MHC of NJ (31.0) |
| 31,388 |
| 10,147 |
| 21,241 |
| 0.25 |
| 0.25 |
| 7.09 |
| 7.07 |
| 27.94 |
| |
|
|
|
|
|
|
|
|
|
|
|
|
|
|
|
| Impact of Second Step Conversion(4) |
| ||||||
|
|
|
|
| |||||||
|
|
|
| Share |
| Gross |
| Net Incr. |
| Net Incr. |
|
|
|
|
|
|
| ||||||
|
|
|
| ($) |
| ($000) |
| ($000) |
| ($000) |
|
Publicly-Traded MHC Institutions |
|
|
|
|
|
|
|
|
| ||
BFSB |
| Brooklyn Federal MHC of NY (31.0) |
| 11.81 |
| 109,833 |
| 94,456 |
| 1,844 |
|
COBK |
| Colonial Bank MHC of NJ (44.9) |
| 10.00 |
| 23,710 |
| 20,391 |
| 398 |
|
CSBK |
| Clifton Savings Bncrp MHC of NJ (41.0) |
| 10.00 |
| 144,940 |
| 124,648 |
| 2,433 |
|
FXCB |
| Fox Chase Bancorp MHC of PA (44.5) |
| 11.35 |
| 88,780 |
| 76,351 |
| 1,490 |
|
LSBK |
| Lake Shore Bancorp MHC of NY (43.7) |
| 9.75 |
| 34,008 |
| 29,247 |
| 571 |
|
MGYR |
| Magyar Bancorp MHC of NJ (45.1) |
| 9.45 |
| 29,018 |
| 24,980 |
| 488 |
|
ONFC |
| Oneida Financial MHC of NY (43.9) |
| 9.50 |
| 40,955 |
| 35,221 |
| 688 |
|
OSHC |
| Ocean Shore Holding MHC of NJ (44.0) |
| 9.74 |
| 44,298 |
| 38,096 |
| 744 |
|
PBIP |
| Prudential Bancorp MHC PA (40.5) |
| 12.32 |
| 76,958 |
| 66,560 |
| 1,304 |
|
ROMA |
| Roma Financial Corp MHC of NJ (31.0) |
| 14.84 |
| 315,216 |
| 271,086 |
| 5,292 |
|
|
|
|
|
|
|
|
|
|
|
|
|
|
|
|
|
|
|
|
|
|
| Pro Forma |
| Pro Forma(5) |
| ||||||||||
|
|
|
|
|
| ||||||||||||
|
|
|
| EPS |
| Core |
| Book |
| Tang. |
| Assets |
| Public |
| Dilution |
|
|
|
|
|
|
|
|
|
| |||||||||
|
|
|
| ($) |
| ($) |
| ($) |
| ($) |
| ($) |
| (%) |
| (%) |
|
Publicly-Traded MHC Institutions |
|
|
|
|
|
|
|
|
|
|
|
|
|
|
| ||
BFSB |
| Brooklyn Federal MHC of NY (31.0) |
| 0.39 |
| 0.38 |
| 13.58 |
| 13.58 |
| 37.30 |
| 29.9 |
| 0.0 |
|
COBK |
| Colonial Bank MHC of NJ (44.9) |
| 0.37 |
| 0.36 |
| 13.35 |
| 13.35 |
| 107.45 |
| 46.7 |
| 0.0 |
|
CSBK |
| Clifton Savings Bncrp MHC of NJ (41.0) |
| 0.18 |
| 0.18 |
| 10.81 |
| 10.81 |
| 34.40 |
| 46.9 |
| 0.0 |
|
FXCB |
| Fox Chase Bancorp MHC of PA (44.5) |
| 0.23 |
| 0.27 |
| 13.85 |
| 13.85 |
| 61.96 |
| 45.5 |
| 0.0 |
|
LSBK |
| Lake Shore Bancorp MHC of NY (43.7) |
| 0.32 |
| 0.32 |
| 12.76 |
| 12.76 |
| 59.65 |
| 46.0 |
| 0.0 |
|
MGYR |
| Magyar Bancorp MHC of NJ (45.1) |
| 0.18 |
| 0.18 |
| 12.82 |
| 12.82 |
| 88.49 |
| 47.0 |
| 0.0 |
|
ONFC |
| Oneida Financial MHC of NY (43.9) |
| 0.54 |
| 0.50 |
| 12.14 |
| 8.88 |
| 71.61 |
| 44.6 |
| 0.0 |
|
OSHC |
| Ocean Shore Holding MHC of NJ (44.0) |
| 0.39 |
| 0.39 |
| 11.96 |
| 11.96 |
| 76.30 |
| 45.9 |
| 0.0 |
|
PBIP |
| Prudential Bancorp MHC PA (40.5) |
| 0.38 |
| 0.38 |
| 12.80 |
| 12.80 |
| 47.11 |
| 45.2 |
| -0.1 |
|
ROMA |
| Roma Financial Corp MHC of NJ (31.0) |
| 0.42 |
| 0.42 |
| 15.73 |
| 15.71 |
| 36.58 |
| 32.3 |
| 0.0 |
|
|
|
|
|
|
(1) | Gross proceeds calculated as stock price multiplied by the number of shares owned by the mutual holding company (i.e., non-public shares). | |||
|
| |||
(2) | Net increase in capital reflects gross proceeds less offering expenses, contra-equity account for leveraged ESOP and deferred compensation account for restricted stock plan. For institutions with assets at the MHC level, the net increase in capital also includes consolidation of MHC assets with the capital of the institution concurrent with hypothetical second step. | |||
|
| |||
|
| Offering expense percent | 2.00% |
|
|
| ESOP percent purchase | 8.00% |
|
|
| Recognition plan percent | 4.00% |
|
|
|
|
|
|
(3) | Net increase in earnings reflects after-tax reinvestment income (assumes ESOP and recognition plan do not generate reinvestment income), less after-tax ESOP amortization and recognition plan vesting: | |||
|
|
|
|
|
|
| After-tax reinvestment | 3.18% |
|
|
| ESOP loan term (years) | 10 |
|
|
| Recognition plan vesting (years) | 5 |
|
|
| Effective tax rate | 34.00% |
|
|
|
|
|
|
(4) | Figures reflect adjustments to “non-grandfathered” companies to reflect dilutive impact of cumulative dividends waived by the MHC (reflect FDIC policy regarding waived dividends). | |||
|
|
|
|
|
(5) | Reflects pro forma ownership position of minority stockholders after taking into account the OTS and FDIC policies regarding waived dividends assuming a hypothetical second step. For OTS “grandfathered” companies, dilution reflects excess waived dividends and MHC assets. For all other companies, dilution reflects all waived dividends and MHC assets. | |||
|
|
|
|
|
Source: | Audited and unaudited financial statements, corporate reports, offering circulars, and RP Financial, LC. calculations. The information provided in this report has been obtained from sources we believe are reliable, but we cannot guarantee the accuracy or completeness of such information. | |||
Copyright (c) 2008 by RP® Financial, LC.
RP®Financial, LC.
Boards of Directors
March 19, 2008
Page 11
The Bank will adopt Statement of Position (“SOP” 93-6) which will cause earnings per share computations to be based on shares issued and outstanding excluding shares owned by an ESOP where there is not a commitment to release such shares. For the purpose of preparing the pro forma pricing tables and exhibits, we have reflected all shares issued in the offering including shares purchased by the ESOP as outstanding to capture the full dilutive impact of such stock to the Bank’s shareholders. However, we have considered the impact of the Bank’s adoption of SOP 93-6 in the determination of pro forma market value.
Based on the foregoing, we have concluded that, as of March 19, 2008, the estimated aggregate pro forma market value of the shares to be issued immediately following the conversion, both shares issued to the public as well as to the MHC, is equal to $53,500,000.
1. P/E Approach. In applying the P/E approach, RP Financial’s valuation conclusions considered both reported earnings and a recurring or “core” earnings base, that is, earnings adjusted to exclude any one time non-operating and extraordinary items, plus the estimated after tax-earnings benefit from reinvestment of net stock proceeds. The Bank’s reported earnings equaled $1.960 million for the twelve months ended December 31, 2007. In deriving Malvern Federal’s core earnings, the only adjustment made to reported earnings was to eliminate $35,000 of net gains realized from the sale of loans and investments for the twelve months ended December 31, 2007. As shown below, on a tax effected basis, assuming application of an effective marginal tax rate of 38.5% for the adjustment, the Bank’s core earnings were determined to equal $1.938 million for the twelve months ended December 31, 2007. (Note: see Exhibit 2 for the adjustments applied to the Peer Group’s earnings in the calculation of core earnings).
|
|
|
|
|
|
| Amount |
| |
|
|
| ||
|
| ($000) |
| |
| ||||
Net income |
| $ | 1,960 |
|
Deduct: Net gains on loans and investments(1) |
|
| (22 | ) |
|
|
| ||
Core earnings estimate |
| $ | 1,938 |
|
|
|
(1) | Tax effected at 38.5%. |
Based on Malvern Federal’s reported and estimated core earnings, and incorporating the impact of the pro forma assumptions discussed previously, the Bank’s reported and core P/E multiples (fully-converted basis) at the $53.5 million midpoint value equaled 25.89 times and 26.17 times, respectively. The Bank’s updated reported and core P/E multiples provided for discounts of 8.5% and 8.9% relative to the Peer Group’s average reported and core P/E multiples of 28.30 times and 28.72 times, respectively (versus premiums of 8.9% and 10.9% relative to the Peer Group’s average reported and core P/E multiples as indicated in the First Update). In comparison to the
RP®Financial, LC.
Boards of Directors
March 19, 2008
Page 12
Peer Group’s median reported and core earnings multiples of 30.28 times and 30.47 times, respectively, the Bank’s pro forma reported and core P/E multiples at the $53.5 million midpoint value indicated discounts of 14.5% and 14.1% (versus premiums of 3.2% and 6.0% relative to the Peer Group’s median reported and core P/E multiples as indicated in the First Update). The Bank’s implied conversion pricing ratios relative to the Peer Group’s pricing ratios are indicated in Table 4, and the pro forma calculations are detailed in Exhibits 3 and 4.
On an MHC reported basis, the Bank’s reported and core P/E multiples at the $53.5 million midpoint value equaled 27.57 times and 27.89 times, respectively. The Bank’s reported and core P/E multiples provided for discounts of 7.4% and 9.7% relative to the Peer Group’s average reported and core P/E multiples of 29.76 times and 30.89 times, respectively (versus premiums of 5.8% and 1.5% relative to the Peer Group’s average reported and core P/E multiples as indicated in the First Update). In comparison to the Peer Group’s median reported and core earnings multiples which both equaled 32.47 times, the Bank’s pro forma reported and core P/E multiples at the $53.5 million midpoint value indicated discounts of 15.1% and 14.1% on an MHC reported basis (versus a premium of 0.5% and a discount of 1.6% relative to the Peer Group’s median reported and core P/E multiples as indicated in the First Update). The Bank’s implied MHC pricing ratios relative to the MHC pricing ratios for the Peer Group are indicated in Table 5, and the pro forma calculations are detailed in Exhibits 5 and 6.
2. P/B Approach. P/B ratios have generally served as a useful benchmark in the valuation of thrift stocks, with the greater determinant of long term value being earnings. In applying the P/B approach, we considered both reported book value and tangible book value. Based on the $53.5 million midpoint value, the Bank’s P/B and P/TB ratios (fully-converted basis) both equaled 59.56%. In comparison to the average P/B and P/TB ratios indicated for the Peer Group of 83.67% and 86.56%, respectively, Malvern Federal’s updated ratios were discounted by 28.8% and 31.2% (versus discounts of 23.6% and 26.2% from the average Peer Group’s P/B and P/TB ratios as indicated in the First Update). In comparison to the median P/B and P/TB ratios indicated for the Peer Group of 81.69% and 84.46%, respectively, Malvern Federal’s updated ratios were discounted by 27.1% and 29.5% (versus discounts of 21.0% and 25.8% from the Peer Group’s median P/B and P/TB ratios as indicated in the First Update).
On an MHC reported basis, the Bank’s P/B and P/TB ratios at the $53.5 million midpoint value both equaled 84.25%. In comparison to the average P/B and P/TB ratios indicated for the Peer Group of 146.08% and 155.47%, respectively, Malvern Federal’s updated P/B and P/TB ratios at the midpoint were discounted by 42.3% on a P/B basis and 45.8% on a P/TB basis (versus discounts of 37.1% and 40.8% from the Peer Group’s P/B and P/TB ratios as indicated in the First Update). In comparison to the median P/B and P/TB ratios indicated for the Peer Group of 132.07%
RP®Financial, LC.
Board of Directors
March 19, 2008
Page 13
Table 4
MHC Institutions — Implied Pricing Ratios, Full Conversion Basis
Malvern Federal Savings Bank and the Comparables
As of March 19, 2008
|
|
|
|
|
|
|
|
|
|
|
|
|
|
|
|
|
|
|
|
|
|
|
|
|
|
|
|
|
|
|
|
|
|
|
|
|
|
|
|
| Fully Converted |
| Per Share(8) |
| Pricing Ratios(3) |
| Dividends(4) |
| |||||||||||||||||||||||||||||
|
|
|
|
|
| |||||||||||||||||||||||||||||||||
|
| Price/ |
| Market |
| Core 12 Mo. |
| Book Value/ |
|
| Amount/ |
| Yield |
| Payout |
| ||||||||||||||||||||||
|
|
|
|
|
| P/E |
| P/B |
| P/A |
| P/TB |
| P/Core |
|
|
|
| ||||||||||||||||||||
|
|
|
|
|
|
|
|
|
|
|
|
|
| |||||||||||||||||||||||||
|
| ($) |
| ($Mil) |
| ($) |
| ($) |
| (x) |
| (%) |
| (%) |
| (%) |
| (x) |
| ($) |
| (%) |
| (%) |
| |||||||||||||
Financial Institution |
|
|
|
|
|
|
|
|
|
|
|
|
|
|
|
|
|
|
|
|
|
|
|
|
| |||||||||||||
| ||||||||||||||||||||||||||||||||||||||
Malvern Federal Savings Bank |
|
|
|
|
|
|
|
|
|
|
|
|
|
|
|
|
|
|
|
|
|
|
|
|
|
|
|
|
|
|
|
|
|
|
|
|
| |
Superrange |
| $ | 10.00 |
| $ | 70.75 |
| $ | 0.29 |
| $ | 14.75 |
|
| 33.69 | x |
| 67.80 | % |
| 11.76 | % |
| 67.80 | % |
| 34.04x |
| $ | 0.00 |
|
| 0.00 | % |
| 0.00 | % | |
Maximum |
| $ | 10.00 |
| $ | 61.53 |
| $ | 0.33 |
| $ | 15.70 |
|
| 29.55 | x |
| 63.69 | % |
| 10.36 | % |
| 63.69 | % |
| 29.86x |
| $ | 0.00 |
|
| 0.00 | % |
| 0.00 | % | |
Midpoint |
| $ | 10.00 |
| $ | 53.50 |
| $ | 0.38 |
| $ | 16.79 |
|
| 25.89 | x |
| 59.56 | % |
| 9.11 | % |
| 59.56 | % |
| 26.17x |
| $ | 0.00 |
|
| 0.00 | % |
| 0.00 | % | |
Minimum |
| $ | 10.00 |
| $ | 45.48 |
| $ | 0.45 |
| $ | 18.26 |
|
| 22.18 | x |
| 54.76 | % |
| 7.83 | % |
| 54.76 | % |
| 22.42x |
| $ | 0.00 |
|
| 0.00 | % |
| 0.00 | % | |
|
|
|
|
|
|
|
|
|
|
|
|
|
|
|
|
|
|
|
|
|
|
|
|
|
|
|
|
|
|
|
|
|
|
|
|
|
| |
All Public Companies(7) |
|
|
|
|
|
|
|
|
|
|
|
|
|
|
|
|
|
|
|
|
|
|
|
|
|
|
|
|
|
|
|
|
|
|
|
|
| |
Averages |
| $ | 13.23 |
| $ | 336.47 |
| $ | 0.53 |
| $ | 13.36 |
|
| 19.41 | x |
| 108.67 | % |
| 14.08 | % |
| 122.62 | % |
| 20.51x |
| $ | 0.37 |
|
| 2.57 | % |
| 32.88 | % | |
Medians |
| $ | 11.53 |
| $ | 74.35 |
| $ | 0.39 |
| $ | 11.69 |
|
| 18.56 | x |
| 101.28 | % |
| 10.85 | % |
| 112.29 | % |
| 19.90x |
| $ | 0.31 |
|
| 2.65 | % |
| 27.03 | % | |
|
|
|
|
|
|
|
|
|
|
|
|
|
|
|
|
|
|
|
|
|
|
|
|
|
|
|
|
|
|
|
|
|
|
|
|
|
| |
All Non-MHC State of PA(7) |
|
|
|
|
|
|
|
|
|
|
|
|
|
|
|
|
|
|
|
|
|
|
|
|
|
|
|
|
|
|
|
|
|
|
|
|
| |
Averages |
| $ | 14.06 |
| $ | 521.33 |
| $ | 0.63 |
| $ | 14.95 |
|
| 15.37 | x |
| 92.48 | % |
| 9.65 | % |
| 114.79 | % |
| 15.73x |
| $ | 0.42 |
|
| 2.99 | % |
| 42.75 | % | |
Medians |
| $ | 12.70 |
| $ | 101.50 |
| $ | 0.60 |
| $ | 14.03 |
|
| 13.71 | x |
| 98.92 | % |
| 6.53 | % |
| 104.30 | % |
| 14.20x |
| $ | 0.46 |
|
| 3.27 | % |
| 35.63 | % | |
|
|
|
|
|
|
|
|
|
|
|
|
|
|
|
|
|
|
|
|
|
|
|
|
|
|
|
|
|
|
|
|
|
|
|
|
|
| |
Publicly-Traded MHC Institutions, Full Conversion Basis |
|
|
|
|
|
|
|
|
|
|
|
|
|
|
|
|
|
|
|
|
|
|
|
|
|
|
|
|
|
|
|
|
|
|
|
|
| |
Averages |
| $ | 10.88 |
| $ | 151.71 |
| $ | 0.34 |
| $ | 12.98 |
|
| 28.30 | x |
| 83.67 | % |
| 20.81 | % |
| 86.56 | % |
| 28.72x |
| $ | 0.16 |
|
| 1.43 | % |
| 29.18 | % | |
Medians |
| $ | 10.00 |
| $ | 111.18 |
| $ | 0.37 |
| $ | 12.81 |
|
| 30.28 | x |
| 81.69 | % |
| 17.33 | % |
| 84.46 | % |
| 30.47x |
| $ | 0.18 |
|
| 1.62 | % |
| 25.00 | % | |
|
|
|
|
|
|
|
|
|
|
|
|
|
|
|
|
|
|
|
|
|
|
|
|
|
|
|
|
|
|
|
|
|
|
|
|
|
| |
Publicly-Traded MHC Institutions, Full Conversion Basis |
|
|
|
|
|
|
|
|
|
|
|
|
|
|
|
|
|
|
|
|
|
|
|
|
|
|
|
|
|
|
|
|
|
|
|
|
| |
BFSB | Brooklyn Federal MHC of NY (31.0) |
| $ | 11.81 |
| $ | 156.70 |
| $ | 0.38 |
| $ | 13.58 |
|
| 30.28 | x |
| 86.97 | % |
| 31.66 | % |
| 86.97 | % |
| 31.08x |
| $ | 0.28 |
|
| 2.37 | % |
| 73.68 | % |
CSBK | Clifton Savings Bncrp MHC of NJ (41.0) |
| $ | 10.00 |
| $ | 273.07 |
| $ | 0.18 |
| $ | 10.81 |
|
| NM |
|
| 92.51 | % |
| 29.07 | % |
| 92.51 | % |
| NM |
| $ | 0.20 |
|
| 2.00 | % |
| NM |
|
COBK | Colonial Bank MHC of NJ (44.9) |
| $ | 10.00 |
| $ | 44.51 |
| $ | 0.36 |
| $ | 13.35 |
|
| 27.03 | x |
| 74.91 | % |
| 9.31 | % |
| 74.91 | % |
| 27.78x |
| $ | 0.00 |
|
| 0.00 | % |
| 0.00 | % |
FXCB | Fox Chase Bancorp MHC of PA (44.5) |
| $ | 11.35 |
| $ | 162.91 |
| $ | 0.27 |
| $ | 13.85 |
|
| NM |
|
| 81.95 | % |
| 18.32 | % |
| 81.95 | % |
| NM |
| $ | 0.00 |
|
| 0.00 | % |
| 0.00 | % |
LSBK | Lake Shore Bancorp MHC of NY (43.7) |
| $ | 9.75 |
| $ | 63.02 |
| $ | 0.32 |
| $ | 12.76 |
|
| 30.47 | x |
| 76.41 | % |
| 16.35 | % |
| 76.41 | % |
| 30.47x |
| $ | 0.16 |
|
| 1.64 | % |
| 50.00 | % |
MGYR | Magyar Bancorp MHC of NJ (45.1) |
| $ | 9.45 |
| $ | 54.75 |
| $ | 0.18 |
| $ | 12.82 |
|
| NM |
|
| 73.71 | % |
| 10.68 | % |
| 73.71 | % |
| NM |
| $ | 0.00 |
|
| 0.00 | % |
| 0.00 | % |
OSHC | Ocean Shore Holding MHC of NJ (44.0) |
| $ | 9.74 |
| $ | 81.89 |
| $ | 0.39 |
| $ | 11.96 |
|
| 24.97x |
|
| 81.44 | % |
| 12.77 | % |
| 81.44 | % |
| 24.97x |
| $ | 0.00 |
|
| 0.00 | % |
| 0.00 | % |
ONFC | Oneida Financial MHC of NY (43.9) |
| $ | 9.50 |
| $ | 73.96 |
| $ | 0.50 |
| $ | 12.14 |
|
| 17.59 | x |
| 78.25 | % |
| 13.27 | % |
| 106.98 | % |
| 19.00x |
| $ | 0.48 |
|
| 5.05 | % |
| NM |
|
PBIP | Prudential Bancorp MHC PA (40.5) |
| $ | 12.32 |
| $ | 140.47 |
| $ | 0.38 |
| $ | 12.80 |
|
| 32.42 | x |
| 96.25 | % |
| 26.15 | % |
| 96.25 | % |
| 32.42x |
| $ | 0.20 |
|
| 1.62 | % |
| 52.63 | % |
ROMA | Roma Financial Corp MHC of NJ (31.0) |
| $ | 14.84 |
| $ | 465.80 |
| $ | 0.42 |
| $ | 15.73 |
|
| 35.33 | x |
| 94.34 | % |
| 40.57 | % |
| 94.46 | % |
| 35.33x |
| $ | 0.24 |
|
| 1.62 | % |
| 57.14 | % |
|
|
|
|
|
|
|
|
|
|
|
|
|
|
|
|
|
|
|
|
|
|
|
|
|
|
|
|
|
| Financial Characteristics(6) |
|
|
|
| |||||||||||||||||||
|
|
|
|
|
|
| ||||||||||||||||||||
|
|
| Total |
| Equity/ |
| NPAs/ |
| Reported |
| Core |
|
|
| ||||||||||||
|
|
|
|
|
|
|
| Offering |
| |||||||||||||||||
|
|
|
|
|
| ROA |
| ROE |
| ROA |
| ROE |
| Size |
| |||||||||||
|
|
|
|
|
|
|
|
|
|
| ||||||||||||||||
|
|
| ($Mil) |
| (%) |
| (%) |
| (%) |
| (%) |
| (%) |
| (%) |
| ($Mil) |
| ||||||||
Financial Institution |
|
|
|
|
|
|
|
|
|
|
|
|
|
|
|
|
|
|
|
|
|
|
|
|
| |
| ||||||||||||||||||||||||||
Malvern Federal Savings Bank |
|
|
|
|
|
|
|
|
|
|
|
|
|
|
|
|
|
|
|
|
|
|
|
|
| |
Superrange |
| $ | 602 |
|
| 17.34 | % |
| 1.12 | % |
| 0.35 | % |
| 2.01 | % |
| 0.35 | % |
| 1.99 | % | $ | 69.3 |
| |
Maximum |
| $ | 594 |
|
| 16.26 | % |
| 1.13 | % |
| 0.35 | % |
| 2.16 | % |
| 0.35 | % |
| 2.13 | % | $ | 60.3 |
| |
Midpoint |
| $ | 587 |
|
| 15.29 | % |
| 1.15 | % |
| 0.35 | % |
| 2.30 | % |
| 0.35 | % |
| 2.28 | % | $ | 52.4 |
| |
Minimum |
| $ | 581 |
|
| 14.30 | % |
| 1.16 | % |
| 0.35 | % |
| 2.47 | % |
| 0.35 | % |
| 2.44 | % | $ | 44.6 |
| |
|
|
|
|
|
|
|
|
|
|
|
|
|
|
|
|
|
|
|
|
|
|
|
|
|
| |
All Public Companies(7) |
|
|
|
|
|
|
|
|
|
|
|
|
|
|
|
|
|
|
|
|
|
|
|
|
| |
Averages |
| $ | 3,198 |
|
| 12.61 | % |
| 1.08 | % |
| 0.44 | % |
| 3.75 | % |
| 0.41 | % |
| 3.65 | % |
|
|
| |
Medians |
| $ | 799 |
|
| 10.41 | % |
| 0.56 | % |
| 0.44 | % |
| 3.62 | % |
| 0.42 | % |
| 3.51 | % |
|
|
| |
|
|
|
|
|
|
|
|
|
|
|
|
|
|
|
|
|
|
|
|
|
|
|
|
|
| |
All Non-MHC State of PA(7) |
|
|
|
|
|
|
|
|
|
|
|
|
|
|
|
|
|
|
|
|
|
|
|
|
| |
Averages |
| $ | 8,660 |
|
| 10.57 | % |
| 0.48 | % |
| 0.27 | % |
| 3.84 | % |
| 0.28 | % |
| 3.90 | % |
|
|
| |
Medians |
| $ | 931 |
|
| 7.20 | % |
| 0.51 | % |
| 0.50 | % |
| 6.34 | % |
| 0.48 | % |
| 5.85 | % |
|
|
| |
|
|
|
|
|
|
|
|
|
|
|
|
|
|
|
|
|
|
|
|
|
|
|
|
|
| |
Publicly-Traded MHC Institutions, Full Conversion Basis |
|
|
|
|
|
|
|
|
|
|
|
|
|
|
|
|
|
|
|
|
|
|
|
|
| |
Averages |
| $ | 658 |
|
| 24.13 | % |
| 0.39 | % |
| 0.64 | % |
| 2.62 | % |
| 0.64 | % |
| 2.60 | % |
|
|
| |
Medians |
| $ | 547 |
|
| 21.87 | % |
| 0.10 | % |
| 0.54 | % |
| 2.73 | % |
| 0.54 | % |
| 2.69 | % |
|
|
| |
|
|
|
|
|
|
|
|
|
|
|
|
|
|
|
|
|
|
|
|
|
|
|
|
|
| |
Publicly-Traded MHC Institutions, Full Conversion Basis |
|
|
|
|
|
|
|
|
|
|
|
|
|
|
|
|
|
|
|
|
|
|
|
|
| |
BFSB | Brooklyn Federal MHC of NY (31.0) |
| $ | 495 |
|
| 36.41 | % |
| 0.01 | % |
| 1.05 | % |
| 2.89 | % |
| 1.02 | % |
| 2.82 | % |
|
|
|
CSBK | Clifton Savings Bncrp MHC of NJ (41.0) |
| $ | 939 |
|
| 31.42 | % |
| 0.02 | % |
| 0.53 | % |
| 1.65 | % |
| 0.53 | % |
| 1.65 | % |
|
|
|
COBK | Colonial Bank MHC of NJ (44.9) |
| $ | 478 |
|
| 12.42 | % |
| 0.25 | % |
| 0.37 | % |
| 2.85 | % |
| 0.36 | % |
| 2.77 | % |
|
|
|
FXCB | Fox Chase Bancorp MHC of PA (44.5) |
| $ | 889 |
|
| 22.35 | % |
| 0.10 | % |
| 0.39 | % |
| 1.63 | % |
| 0.46 | % |
| 1.92 | % |
|
|
|
LSBK | Lake Shore Bancorp MHC of NY (43.7) |
| $ | 386 |
|
| 21.39 | % |
| NA |
|
| 0.54 | % |
| 2.50 | % |
| 0.54 | % |
| 2.50 | % |
|
|
|
MGYR | Magyar Bancorp MHC of NJ (45.1) |
| $ | 513 |
|
| 14.49 | % |
| 1.81 | % |
| 0.21 | % |
| 1.42 | % |
| 0.21 | % |
| 1.42 | % |
|
|
|
OSHC | Ocean Shore Holding MHC of NJ (44.0) |
| $ | 642 |
|
| 15.67 | % |
| 0.05 | % |
| 0.53 | % |
| 3.26 | % |
| 0.53 | % |
| 3.26 | % |
|
|
|
ONFC | Oneida Financial MHC of NY (43.9) |
| $ | 557 |
|
| 16.95 | % |
| 0.07 | % |
| 0.80 | % |
| 4.49 | % |
| 0.74 | % |
| 4.15 | % |
|
|
|
PBIP | Prudential Bancorp MHC PA (40.5) |
| $ | 537 |
|
| 27.17 | % |
| 0.47 | % |
| 0.81 | % |
| 2.89 | % |
| 0.81 | % |
| 2.89 | % |
|
|
|
ROMA | Roma Financial Corp MHC of NJ (31.0) |
| $ | 1,148 |
|
| 43.00 | % |
| 0.76 | % |
| 1.14 | % |
| 2.61 | % |
| 1.14 | % |
| 2.61 | % |
|
|
|
|
|
(1) | Current stock price of minority stock. Average of High/Low or Bid/Ask price per share. |
|
|
(2) | EPS (estimated core earnings) is based on reported trailing 12 month data, adjusted to omit non-operating gains and losses on a tax-effected basis. Public MHC data reflects additional earnings from reinvestment of proceeds of second step conversion. |
|
|
(3) | P/E = Price to Earnings; P/B = Price to Book; P/A = Price to Assets; P/TB = Price to Tangible Book; and P/Core = Price to Core Earnings. Ratios are pro forma assuming a second step conversion to full stock form. |
|
|
(4) | Indicated 12 month dividend, based on last quarterly dividend declared. |
|
|
(5) | Indicated 12 month dividend as a percent of trailing 12 month estimated core earnings (earnings adjusted to reflect second step conversion). |
|
|
(6) | ROA (return on assets) and ROE (return on equity) are indicated ratios based on trailing 12 month earnings and average equity and assets balances. |
|
|
(7) | Excludes from averages and medians those companies the subject of actual or rumored acquisition activities or unusual operating characteristics. |
|
|
(8) | Figures estimated by RP Financial to reflect a second step conversion of the MHC to full stock form. |
|
|
Source: | Corporate reports, offering circulars, and RP® Financial, LC. calculations. The information provided in this report has been obtained from sources we believe are reliable, but we cannot guarantee the accuracy or completeness of such information. |
RP®Financial, LC.
Board of Directors
March 19, 2008
Page 14
Table 5
Public Market Pricing
Malvern Federal Savings Bank and the Comparables
As of March 19, 2008
|
|
|
|
|
|
|
|
|
|
|
|
|
|
|
|
|
|
|
|
|
|
|
|
|
|
|
|
|
|
|
|
|
|
|
|
|
|
|
|
| Market |
| Per Share Data |
|
|
|
|
|
|
|
|
|
|
|
|
|
|
|
|
| |||||||||||||||||
|
|
|
|
|
|
|
|
|
|
|
|
|
| Dividends(4) |
| |||||||||||||||||||||||
|
|
| Core |
| Book |
| Pricing Ratios(3) |
|
| |||||||||||||||||||||||||||||
|
| Price/ |
| Market |
|
|
|
| Amount/ |
| Yield |
| Payout |
| ||||||||||||||||||||||||
|
|
|
|
|
| P/E |
| P/B |
| P/A |
| P/TB |
| P/Core |
|
|
|
| ||||||||||||||||||||
|
|
|
|
|
|
|
|
|
|
|
|
|
| |||||||||||||||||||||||||
|
| ($) |
| ($Mil) |
| ($) |
| ($) |
| (x) |
| (%) |
| (%) |
| (%) |
| (x) |
| ($) |
| (%) |
| (%) |
| |||||||||||||
Malvern Federal Savings Bank |
|
|
|
|
|
|
|
|
|
|
|
|
|
|
|
|
|
|
|
|
|
|
|
|
|
|
|
|
|
|
|
|
|
|
|
|
| |
Superrange |
| $ | 10.00 |
| $ | 70.75 |
| $ | 0.27 |
| $ | 9.90 |
|
| 36.43x |
|
| 101.01 | % |
| 12.47 | % |
| 101.01 | % |
| 36.85x |
| $ | 0.00 |
|
| 0.00 | % |
| 0.00 | % | |
Maximum |
| $ | 10.00 |
| $ | 61.53 |
| $ | 0.31 |
| $ | 10.80 |
|
| 31.70x |
|
| 92.59 | % |
| 10.91 | % |
| 92.59 | % |
| 32.06x |
| $ | 0.00 |
|
| 0.00 | % |
| 0.00 | % | |
Midpoint |
| $ | 10.00 |
| $ | 53.50 |
| $ | 0.36 |
| $ | 11.87 |
|
| 27.57x |
|
| 84.25 | % |
| 9.54 | % |
| 84.25 | % |
| 27.89x |
| $ | 0.00 |
|
| 0.00 | % |
| 0.00 | % | |
Minimum |
| $ | 10.00 |
| $ | 45.48 |
| $ | 0.42 |
| $ | 13.31 |
|
| 23.45x |
|
| 75.13 | % |
| 8.15 | % |
| 75.13 | % |
| 23.72x |
| $ | 0.00 |
|
| 0.00 | % |
| 0.00 | % | |
|
|
|
|
|
|
|
|
|
|
|
|
|
|
|
|
|
|
|
|
|
|
|
|
|
|
|
|
|
|
|
|
|
|
|
|
|
| |
All Public Companies(7) |
|
|
|
|
|
|
|
|
|
|
|
|
|
|
|
|
|
|
|
|
|
|
|
|
|
|
|
|
|
|
|
|
|
|
|
|
| |
Averages |
| $ | 13.23 |
| $ | 336.47 |
| $ | 0.53 |
| $ | 13.36 |
|
| 19.41x |
|
| 108.67 | % |
| 14.08 | % |
| 122.62 | % |
| 20.51x |
| $ | 0.37 |
|
| 2.57 | % |
| 32.88 | % | |
Medians |
| $ | 11.53 |
| $ | 74.35 |
| $ | 0.39 |
| $ | 11.69 |
|
| 18.56x |
|
| 101.28 | % |
| 10.85 | % |
| 112.29 | % |
| 19.90x |
| $ | 0.31 |
|
| 2.65 | % |
| 27.03 | % | |
|
|
|
|
|
|
|
|
|
|
|
|
|
|
|
|
|
|
|
|
|
|
|
|
|
|
|
|
|
|
|
|
|
|
|
|
|
| |
All Non-MHC State of PA(7) |
|
|
|
|
|
|
|
|
|
|
|
|
|
|
|
|
|
|
|
|
|
|
|
|
|
|
|
|
|
|
|
|
|
|
|
|
| |
Averages |
| $ | 14.06 |
| $ | 521.33 |
| $ | 0.63 |
| $ | 14.95 |
|
| 15.37x |
|
| 92.48 | % |
| 9.65 | % |
| 114.79 | % |
| 15.73x |
| $ | 0.42 |
|
| 2.99 | % |
| 42.75 | % | |
Medians |
| $ | 12.70 |
| $ | 101.50 |
| $ | 0.60 |
| $ | 14.03 |
|
| 13.71x |
|
| 98.92 | % |
| 6.53 | % |
| 104.30 | % |
| 14.20x |
| $ | 0.46 |
|
| 3.27 | % |
| 35.63 | % | |
|
|
|
|
|
|
|
|
|
|
|
|
|
|
|
|
|
|
|
|
|
|
|
|
|
|
|
|
|
|
|
|
|
|
|
|
|
| |
Comparable Group Averages |
|
|
|
|
|
|
|
|
|
|
|
|
|
|
|
|
|
|
|
|
|
|
|
|
|
|
|
|
|
|
|
|
|
|
|
|
| |
Averages |
| $ | 10.88 |
| $ | 60.94 |
| $ | 0.23 |
| $ | 7.59 |
|
| 29.76x |
|
| 146.08 | % |
| 24.19 | % |
| 155.47 | % |
| 30.89x |
| $ | 0.16 |
|
| 1.43 | % |
| 10.93 | % | |
Medians |
| $ | 10.00 |
| $ | 42.23 |
| $ | 0.25 |
| $ | 7.53 |
|
| 32.47x |
|
| 132.07 | % |
| 18.86 | % |
| 146.53 | % |
| 32.47x |
| $ | 0.18 |
|
| 1.62 | % |
| 0.00 | % | |
|
|
|
|
|
|
|
|
|
|
|
|
|
|
|
|
|
|
|
|
|
|
|
|
|
|
|
|
|
|
|
|
|
|
|
|
|
| |
|
|
|
|
|
|
|
|
|
|
|
|
|
|
|
|
|
|
|
|
|
|
|
|
|
|
|
|
|
|
|
|
|
|
|
|
|
| |
Comparable Group |
|
|
|
|
|
|
|
|
|
|
|
|
|
|
|
|
|
|
|
|
|
|
|
|
|
|
|
|
|
|
|
|
|
|
|
|
| |
BFSB | Brooklyn Federal MHC of NY (31.0) |
| $ | 11.81 |
| $ | 46.86 |
| $ | 0.24 |
| $ | 6.46 |
|
| NM |
|
| 182.82 | % |
| 39.13 | % |
| 182.82 | % |
| NM |
| $ | 0.28 |
|
| 2.37 | % |
| NM |
|
CSBK | Clifton Savings Bncrp MHC of NJ (41.0) |
| $ | 10.00 |
| $ | 128.13 |
| $ | 0.09 |
| $ | 6.25 |
|
| NM |
|
| 160.00 | % |
| 33.51 | % |
| 160.00 | % |
| NM |
| $ | 0.20 |
|
| 2.00 | % |
| NM |
|
COBK | Colonial Bank MHC of NJ (44.9) |
| $ | 10.00 |
| $ | 20.80 |
| $ | 0.27 |
| $ | 8.77 |
|
| 35.71 |
|
| 114.03 | % |
| 9.72 | % |
| 114.03 | % |
| 37.04x |
| $ | 0.00 |
|
| 0.00 | % |
| 0.00 | % |
FXCB | Fox Chase Bancorp MHC of PA (44.5) |
| $ | 11.35 |
| $ | 74.13 |
| $ | 0.17 |
| $ | 8.53 |
|
| NM |
|
| 133.06 | % |
| 20.04 | % |
| 133.06 | % |
| NM |
| $ | 0.00 |
|
| 0.00 | % |
| 0.00 | % |
LSBK | Lake Shore Bancorp MHC of NY (43.7) |
| $ | 9.75 |
| $ | 29.02 |
| $ | 0.23 |
| $ | 8.24 |
|
| NM |
|
| 118.33 | % |
| 17.69 | % |
| 118.33 | % |
| NM |
| $ | 0.16 |
|
| 1.64 | % |
| 32.03 | % |
MGYR | Magyar Bancorp MHC of NJ (45.1) |
| $ | 9.45 |
| $ | 25.73 |
| $ | 0.10 |
| $ | 8.51 |
|
| NM |
|
| 111.05 | % |
| 11.22 | % |
| 111.05 | % |
| NM |
| $ | 0.00 |
|
| 0.00 | % |
| 0.00 | % |
OSHC | Ocean Shore Holding MHC of NJ (44.0) |
| $ | 9.74 |
| $ | 37.60 |
| $ | 0.30 |
| $ | 7.43 |
|
| 32.47 |
|
| 131.09 | % |
| 13.57 | % |
| 131.09 | % |
| 32.47x |
| $ | 0.00 |
|
| 0.00 | % |
| 0.00 | % |
ONFC | Oneida Financial MHC of NY (43.9) |
| $ | 9.50 |
| $ | 33.00 |
| $ | 0.41 |
| $ | 7.62 |
|
| 21.11 |
|
| 124.67 | % |
| 14.16 | % |
| 217.89 | % |
| 23.17x |
| $ | 0.48 |
|
| 5.05 | % |
| NM |
|
PBIP | Prudential Bancorp MHC PA (40.5) |
| $ | 12.32 |
| $ | 63.51 |
| $ | 0.27 |
| $ | 6.98 |
|
| NM |
|
| 176.50 | % |
| 29.77 | % |
| 176.50 | % |
| NM |
| $ | 0.20 |
|
| 1.62 | % |
| 33.58 | % |
ROMA | Roma Financial Corp MHC of NJ (31.0) |
| $ | 14.84 |
| $ | 150.58 |
| $ | 0.25 |
| $ | 7.09 |
|
| NM |
|
| 209.31 | % |
| 53.11 | % |
| 209.90 | % |
| NM |
| $ | 0.24 |
|
| 1.62 | % |
| NM |
|
|
|
|
|
|
|
|
|
|
|
|
|
|
|
|
|
|
|
|
|
|
|
|
|
|
| |
|
| Financial Characteristics(6) |
|
|
|
| ||||||||||||||||||||
|
|
|
|
|
| |||||||||||||||||||||
|
| Total |
| Equity/ |
| NPAs/ |
| Reported |
|
| Core |
|
|
| ||||||||||||
|
|
|
|
|
|
| Offering |
| ||||||||||||||||||
|
|
|
|
| ROA |
| ROE |
| ROA |
| ROE |
| Size |
| ||||||||||||
|
|
|
|
|
|
|
|
|
| |||||||||||||||||
|
| ($Mil) |
| (%) |
| (%) |
| (%) |
| (%) |
| (%) |
| (%) |
| ($Mil) |
| |||||||||
|
|
|
|
|
|
|
|
|
|
|
|
|
|
|
|
|
|
|
|
|
|
|
|
|
| |
Malvern Federal Savings Bank |
|
|
|
|
|
|
|
|
|
|
|
|
|
|
|
|
|
|
|
|
|
|
|
|
| |
Superrange |
| $ | 567 |
|
| 12.33 | % |
| 1.19 | % |
| 0.34 | % |
| 2.78 | % |
| 0.34 | % |
| 2.74 | % | $ | 30.4 |
| |
Maximum |
| $ | 564 |
|
| 11.79 | % |
| 1.19 | % |
| 0.34 | % |
| 2.92 | % |
| 0.34 | % |
| 2.88 | % | $ | 26.5 |
| |
Midpoint |
| $ | 561 |
|
| 11.32 | % |
| 1.20 | % |
| 0.35 | % |
| 3.05 | % |
| 0.34 | % |
| 3.02 | % | $ | 23.0 |
| |
Minimum |
| $ | 558 |
|
| 10.84 | % |
| 1.21 | % |
| 0.35 | % |
| 3.21 | % |
| 0.34 | % |
| 3.17 | % | $ | 19.6 |
| |
|
|
|
|
|
|
|
|
|
|
|
|
|
|
|
|
|
|
|
|
|
|
|
|
|
| |
All Public Companies(7) |
|
|
|
|
|
|
|
|
|
|
|
|
|
|
|
|
|
|
|
|
|
|
|
|
| |
Averages |
| $ | 3,198 |
|
| 12.61 | % |
| 1.08 | % |
| 0.44 | % |
| 3.75 | % |
| 0.41 | % |
| 3.65 | % |
|
|
| |
Medians |
| $ | 799 |
|
| 10.41 | % |
| 0.56 | % |
| 0.44 | % |
| 3.62 | % |
| 0.42 | % |
| 3.51 | % |
|
|
| |
|
|
|
|
|
|
|
|
|
|
|
|
|
|
|
|
|
|
|
|
|
|
|
|
|
| |
All Non-MHC State of PA(7) |
|
|
|
|
|
|
|
|
|
|
|
|
|
|
|
|
|
|
|
|
|
|
|
|
| |
Averages |
| $ | 8,660 |
|
| 10.57 | % |
| 0.48 | % |
| 0.27 | % |
| 3.84 | % |
| 0.28 | % |
| 3.90 | % |
|
|
| |
Medians |
| $ | 931 |
|
| 7.20 | % |
| 0.51 | % |
| 0.50 | % |
| 6.34 | % |
| 0.48 | % |
| 5.85 | % |
|
|
| |
|
|
|
|
|
|
|
|
|
|
|
|
|
|
|
|
|
|
|
|
|
|
|
|
|
| |
Comparable Group Averages |
|
|
|
|
|
|
|
|
|
|
|
|
|
|
|
|
|
|
|
|
|
|
|
|
| |
Averages |
| $ | 580 |
|
| 15.49 | % |
| 0.39 | % |
| 0.49 | % |
| 3.12 | % |
| 0.49 | % |
| 3.09 | % |
|
|
| |
Medians |
| $ | 505 |
|
| 15.00 | % |
| 0.10 | % |
| 0.43 | % |
| 3.35 | % |
| 0.43 | % |
| 3.29 | % |
|
|
| |
|
|
|
|
|
|
|
|
|
|
|
|
|
|
|
|
|
|
|
|
|
|
|
|
|
| |
Comparable Group |
|
|
|
|
|
|
|
|
|
|
|
|
|
|
|
|
|
|
|
|
|
|
|
|
| |
BFSB | Brooklyn Federal MHC of NY (31.0) |
| $ | 400 |
|
| 21.40 | % |
| 0.01 | % |
| 0.83 | % |
| 3.93 | % |
| 0.80 | % |
| 3.77 | % |
|
|
|
CSBK | Clifton Savings Bncrp MHC of NJ (41.0) |
| $ | 815 |
|
| 20.95 | % |
| 0.02 | % |
| 0.31 | % |
| 1.42 | % |
| 0.31 | % |
| 1.42 | % |
|
|
|
COBK | Colonial Bank MHC of NJ (44.9) |
| $ | 458 |
|
| 8.53 | % |
| 0.25 | % |
| 0.29 | % |
| 3.33 | % |
| 0.28 | % |
| 3.21 | % |
|
|
|
FXCB | Fox Chase Bancorp MHC of PA (44.5) |
| $ | 813 |
|
| 15.06 | % |
| 0.10 | % |
| 0.24 | % |
| 1.48 | % |
| 0.32 | % |
| 1.94 | % |
|
|
|
LSBK | Lake Shore Bancorp MHC of NY (43.7) |
| $ | 356 |
|
| 14.95 | % |
| NA |
|
| 0.42 | % |
| 2.77 | % |
| 0.42 | % |
| 2.77 | % |
|
|
|
MGYR | Magyar Bancorp MHC of NJ (45.1) |
| $ | 488 |
|
| 10.10 | % |
| 1.81 | % |
| 0.12 | % |
| 1.19 | % |
| 0.12 | % |
| 1.19 | % |
|
|
|
OSHC | Ocean Shore Holding MHC of NJ (44.0) |
| $ | 603 |
|
| 10.35 | % |
| 0.05 | % |
| 0.44 | % |
| 4.03 | % |
| 0.44 | % |
| 4.03 | % |
|
|
|
ONFC | Oneida Financial MHC of NY (43.9) |
| $ | 522 |
|
| 11.36 | % |
| 0.07 | % |
| 0.72 | % |
| 5.98 | % |
| 0.65 | % |
| 5.45 | % |
|
|
|
PBIP | Prudential Bancorp MHC PA (40.5) |
| $ | 471 |
|
| 16.87 | % |
| 0.47 | % |
| 0.65 | % |
| 3.69 | % |
| 0.65 | % |
| 3.69 | % |
|
|
|
ROMA | Roma Financial Corp MHC of NJ (31.0) |
| $ | 877 |
|
| 25.38 | % |
| 0.76 | % |
| 0.89 | % |
| 3.36 | % |
| 0.89 | % |
| 3.36 | % |
|
|
|
|
|
(1) | Average of High/Low or Bid/Ask price per share. |
|
|
(2) | EPS (estimate core basis) is based on actual trailing 12 month data, adjusted to omit non-operating items on a tax-effected basis, and is shown on a pro forma basis where appropriate. |
|
|
(3) | P/E = Price to earnings; P/B = Price to book; P/A = Price to assets; P/TB = Price to tangible book value; and P/Core = Price to core earnings. |
|
|
(4) | Indicated 12 month dividend, based on last quarterly dividend declared. |
|
|
(5) | Indicated 12 month dividend as a percent of trailing 12 month estimated core earnings. |
|
|
(6) | ROA (return on assets) and ROE (return on equity) are indicated ratios based on trailing 12 month common earnings and average common equity and total assets balances. |
|
|
(7) | Excludes from averages and medians those companies the subject of actual or rumored acquisition activities or unusual operating characteristics. |
|
|
Source: | Corporate reports, offering circulars, and RP Financial, LC. calculations. The information provided in this report has been obtained from sources we believe are reliable, but we cannot guarantee the accuracy or completeness of such information. |
RP®Financial, LC.
Boards of Directors
March 19, 2008
Page 15
and 146.53%, respectively, Malvern Federal’s updated P/B and P/TB ratios at the midpoint were discounted by 36.2% and 42.5% (versus discounts of 28.2% and 35.6% from the Peer Group’s median P/B and P/TB ratios as indicated in the First Update).
In addition to the fundamental analysis applied to the Peer Group, RP Financial utilized a technical analysis of recent mutual holding company offerings. As indicated in the Original Appraisal and First Update, the pricing characteristics of recent mutual holding company offerings are not the primary determinate of value. Consistent with the Original Appraisal and First Update, particular focus was placed on the P/TB approach in this analysis, since the P/E multiples do not reflect the actual impact of reinvestment and the source of the conversion funds (i.e., external funds versus deposit withdrawals). The two recently completed MHC offerings (Meridian Interstate Bancorp and Sound Financial, Inc.) had an average closing pro forma price/tangible book ratio of 73.0% (fully-converted basis). In comparison, the Bank’s P/TB ratio of 59.56% at the midpoint value reflects an implied discount of 18.4% relative to the average closing pro forma P/TB ratio of the two recent MHC offerings. As of March 19, 2008, the closing stock prices for Meridian Interstate and Sound Financial reflected declines of 5.0% and 9.0% from their respective IPO prices.
3.P/A Approach. P/A ratios are generally not as a reliable indicator of market value, as investors do not place significant weight on total assets as a determinant of market value. Investors place significantly greater weight on book value and earnings — which have received greater weight in our valuation analysis. At the $53.5 million midpoint value, Malvern Federal’s full conversion pro forma P/A ratio equaled 9.11%. In comparison to the Peer Group’s average P/A ratio (fully-converted basis) of 20.81%, Malvern Federal’s P/A ratio indicated a discount of 56.2% (versus a discount of 51.0% at the midpoint valuation in the First Update). In comparison to the Peer Group’s median P/A ratio of 17.33% (fully-converted basis), Malvern Federal’s updated P/A ratio at the midpoint indicated a discount of 47.4% (versus a discount of 38.8% at the midpoint valuation in the First Update).
On an MHC reported basis, Malvern Federal’s pro forma P/A ratio at the $53.5 million midpoint value equaled 9.54%. In comparison to the Peer Group’s average P/A ratio of 24.19%, Malvern Federal’s P/A ratio indicated a discount of 60.6% (versus a discount of 55.9% at the midpoint valuation in the First Update). In comparison to the Peer Group’s median P/A ratio of 18.86%, Malvern Federal’s updated P/A ratio at the midpoint value indicated a discount of 49.4% (versus a discount of 40.8% at the midpoint valuation in the First Update).
Valuation Conclusion
We have concluded that the Bank’s estimated pro forma market value should be decreased since the date of the First Update. Accordingly, it is our opinion that, as of
RP®Financial, LC.
Boards of Directors
March 19, 2008
Page 16
March 19, 2008, the estimated aggregate pro forma market value of the shares to be issued immediately following the conversion, both shares issued publicly as well as to the MHC, equaled $53,500,000 at the midpoint, equal to 5,350,000 shares offered at a per share value of $10.00. The Board of Directors has established a public offering range such that the public ownership of the Bank will constitute a 43.0% ownership interest prior to the issuance of shares to the Foundation. Based on the public offering range and inclusive of the shares issued to the Foundation, equal to 2.0% of the shares issued in the reorganization, the public ownership of shares will represent 45.0% of the shares issued throughout the valuation range. Based on the foregoing valuation, the corresponding range of shares and market values based on a $10.00 per share price are as shown in the table below. The pro forma valuation calculations relative to the Peer Group (fully-converted basis) are shown in Table 8 and are detailed in Exhibit 3 and Exhibit 4; the pro forma valuation calculations relative to the Peer Group based on reported financials are shown in Table 9 and are detailed in Exhibits 5 and 6.
|
|
|
|
|
|
|
|
|
|
|
|
|
|
|
| Offering |
| MHC |
| Foundation |
| Total |
| ||||
|
|
|
|
|
| ||||||||
Shares |
|
|
|
|
|
|
|
|
|
|
|
|
|
Supermaximum |
|
| 3,042,411 |
|
| 3,891,456 |
|
| 141,508 |
|
| 7,075,375 |
|
Maximum |
|
| 2,645,575 |
|
| 3,383,875 |
|
| 123,050 |
|
| 6,152,500 |
|
Midpoint |
|
| 2,300,500 |
|
| 2,942,500 |
|
| 107,000 |
|
| 5,350,000 |
|
Minimum |
|
| 1,955,425 |
|
| 2,501,125 |
|
| 90,950 |
|
| 4,547,500 |
|
|
|
|
|
|
|
|
|
|
|
|
|
|
|
Market Value |
|
|
|
|
|
|
|
|
|
|
|
|
|
Supermaximum |
| $ | 30,424,110 |
| $ | 38,914,560 |
| $ | 1,415,080 |
| $ | 70,753,750 |
|
Maximum |
|
| 26,445,750 |
|
| 33,838,750 |
|
| 1,230,500 |
|
| 61,525,000 |
|
Midpoint |
|
| 23,005,000 |
|
| 29,425,000 |
|
| 1,070,000 |
|
| 53,500,000 |
|
Minimum |
|
| 19,544,250 |
|
| 25,011,250 |
|
| 909,500 |
|
| 45,475,000 |
|
|
|
| Respectfully submitted, |
|
|
| RP® FINANCIAL, LC. |
|
|
|
|
| Ronald S. Riggins |
| President and Managing Director |
|
|
| Gregory E. Dunn |
| Director |


EXHIBITS
RP®Financial, LC.
LIST OF EXHIBITS
|
|
|
|
Exhibit |
|
| |
Number |
|
| Description |
|
| ||
|
|
| |
1 |
| Stock Prices: As of March 19, 2008 | |
|
|
| |
2 |
| Peer Group Core Earnings Analysis | |
|
|
| |
3 |
| Pro Forma Analysis Sheet – Fully Converted Basis | |
|
|
| |
4 |
| Pro Forma Effect of Conversion Proceeds – Fully Converted Basis | |
|
|
| |
5 |
| Pro Forma Analysis Sheet – Minority Stock Offering | |
|
|
| |
6 |
| Pro Forma Effect of Stock Proceeds – Minority Stock Offering | |
|
|
| |
7 |
| Firm Qualifications Statement | |
EXHIBIT 1
Stock Prices
As of March 19, 2008

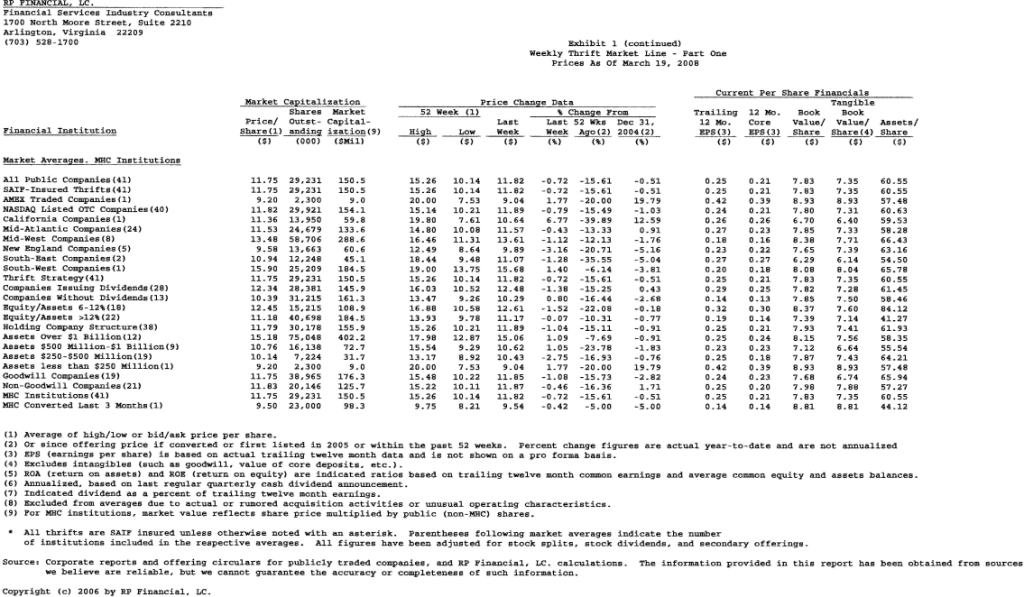
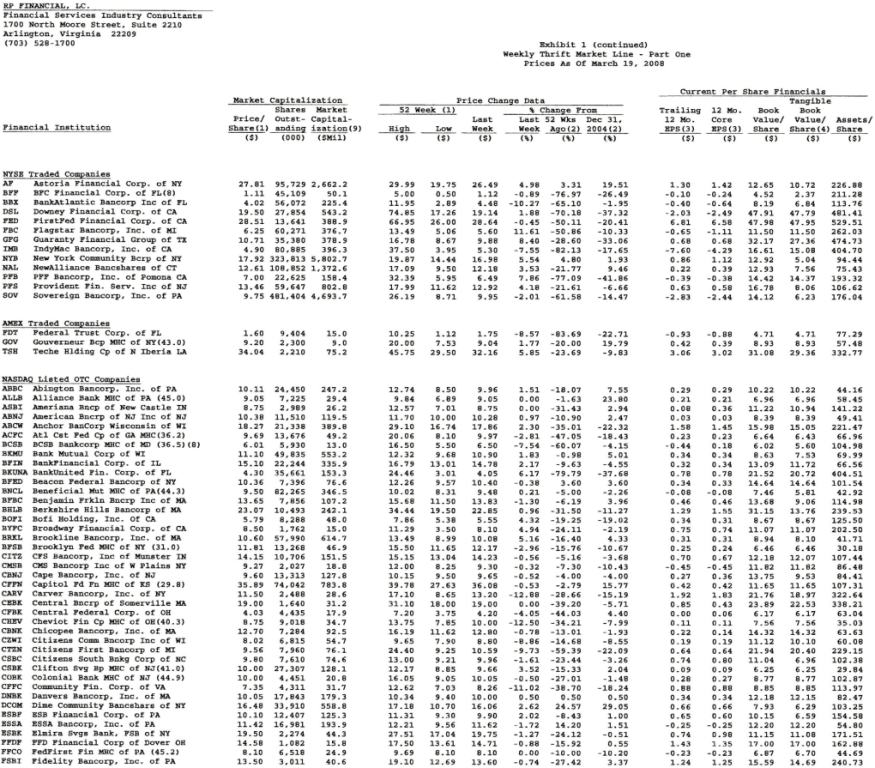
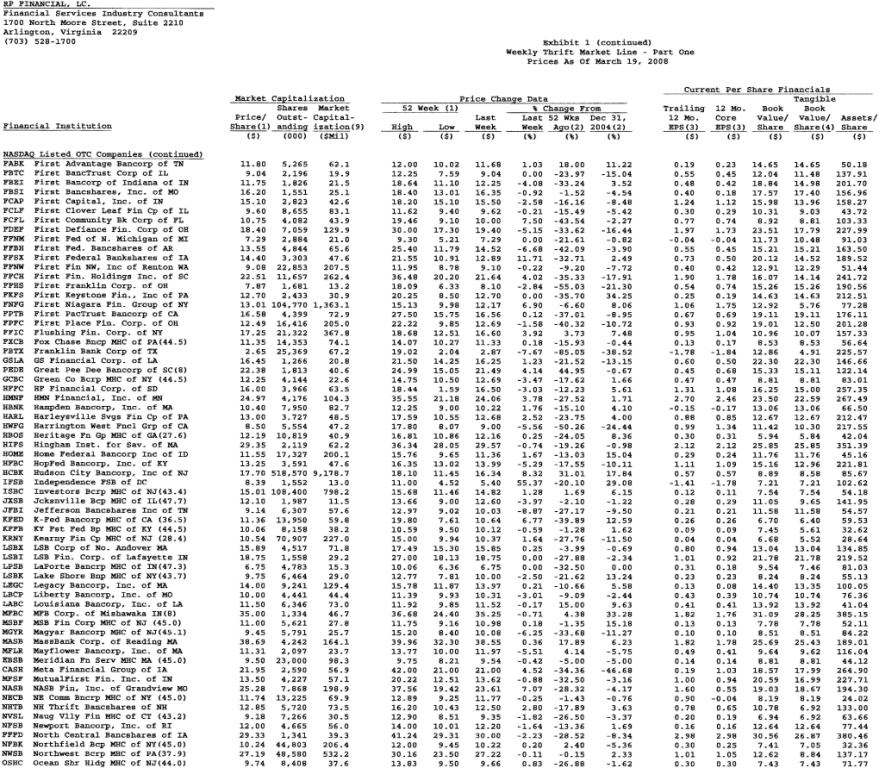
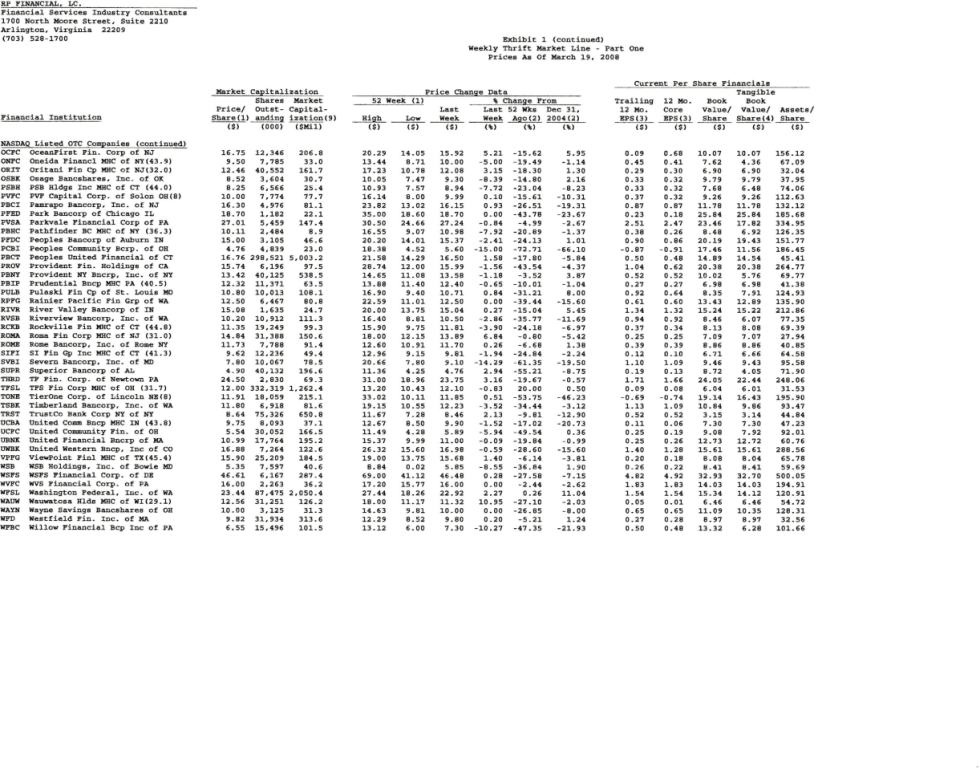
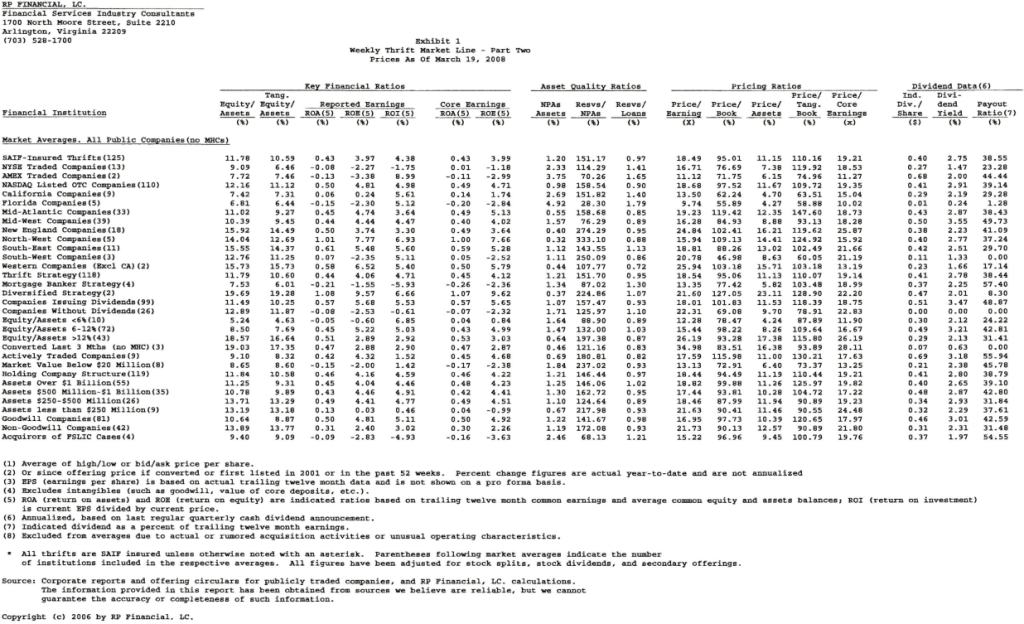
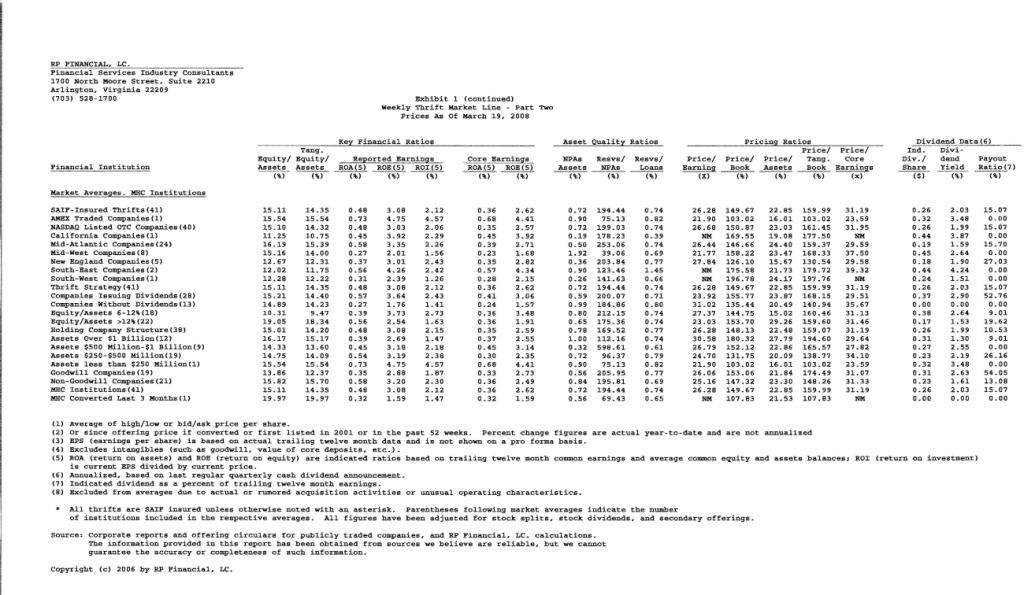
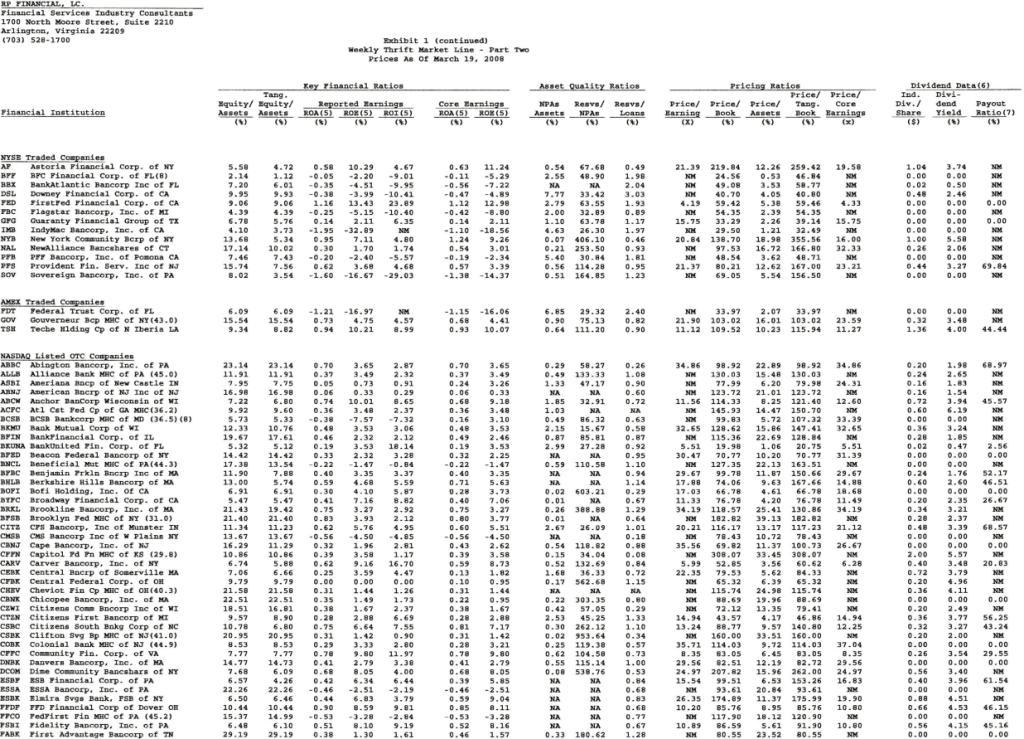
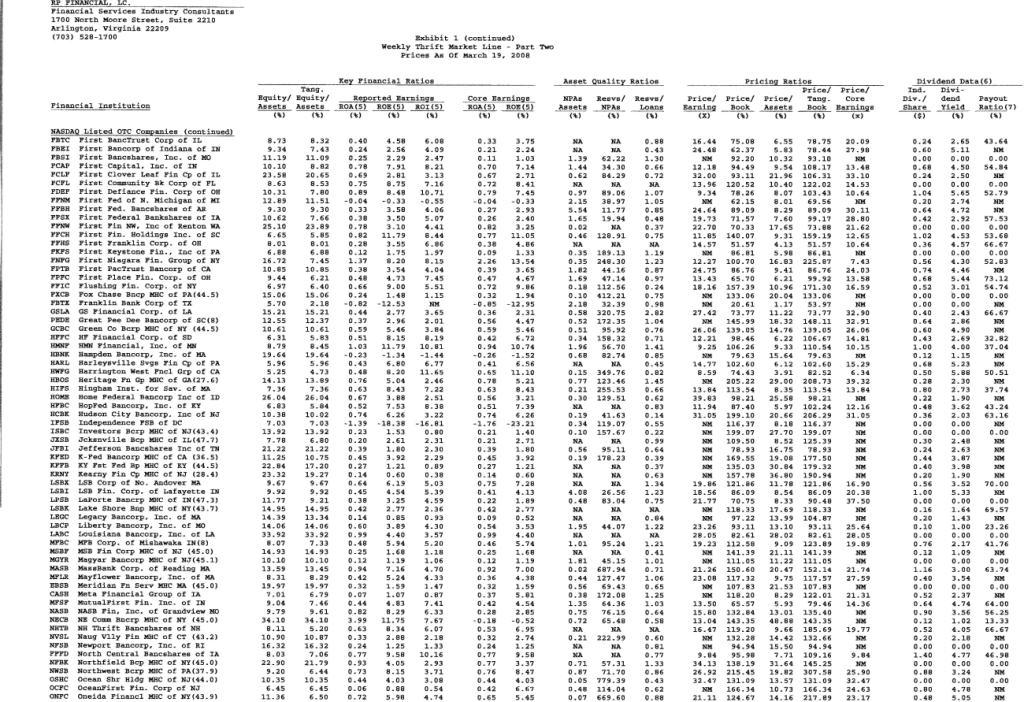
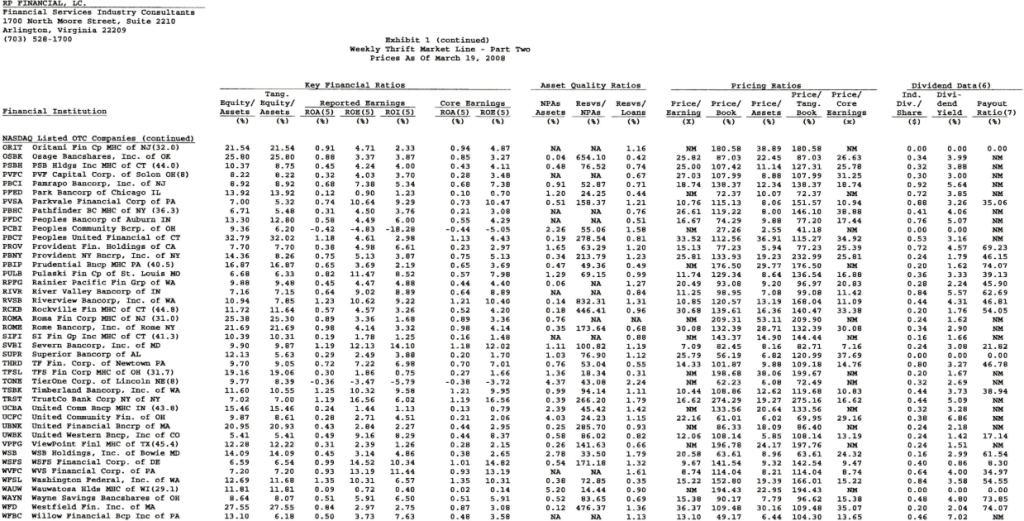
EXHIBIT 2
Core Earnings Analysis
RP® Financial, LC.
Core Earnings Analysis
Comparable Institution Analysis
For the 12 Months Ended December 31, 2007
|
|
|
|
|
|
|
|
|
|
|
|
|
|
|
|
|
|
|
|
|
|
|
|
|
|
Comparable Group |
| Net Income |
| Less: Net |
| Tax Effect |
| Less: |
| Estimated |
| Shares |
| Estimated |
| ||||||||||
|
|
|
|
|
|
|
| ||||||||||||||||||
|
| ($000) |
| ($000) |
| ($000) |
| ($000) |
| ($000) |
| (000) |
| ($) |
| ||||||||||
|
|
|
|
|
|
|
|
|
|
|
|
|
|
|
|
|
|
|
|
|
|
|
|
|
|
BFSB |
|
| Brooklyn Federal MHC of NY (31.0) |
| $ | 3,332 |
| ($ | 293 | ) | $ | 100 |
| $ | 0 |
| $ | 3,139 |
|
| 13,268 |
| $ | 0.24 |
|
CSBK |
|
| Clifton Savings Bncrp MHC of NJ (41.0)(2) |
| $ | 1,749 |
| $ | 0 |
| $ | 0 |
| $ | 0 |
| $ | 1,749 |
|
| 27,307 |
| $ | 0.09 |
|
COBK |
|
| Colonial Bank MHC of NJ (44.9) |
| $ | 1,231 |
| ($ | 54 | ) | $ | 18 |
| $ | 0 |
| $ | 1,195 |
|
| 4,451 |
| $ | 0.27 |
|
FXCB |
|
| Fox Chase Bancorp MHC of PA (44.5) |
| $ | 1,930 |
| $ | 873 |
| ($ | 297 | ) | $ | 0 |
| $ | 2,506 |
|
| 14,353 |
| $ | 0.17 |
|
LSBK |
|
| Lake Shore Bancorp MHC of NY (43.7)(1) |
| $ | 1,519 |
| $ | 0 |
| $ | 0 |
| $ | 0 |
| $ | 1,519 |
|
| 6,464 |
| $ | 0.23 |
|
MGYR |
|
| Magyar Bancorp MHC of NJ (45.1) |
| $ | 587 |
| ($ | 22 | ) | $ | 7 |
| $ | 0 |
| $ | 572 |
|
| 5,791 |
| $ | 0.10 |
|
OSHC |
|
| Ocean Shore Holding MHC of NJ (44.0)(1) |
| $ | 2,507 |
| $ | 0 |
| $ | 0 |
| $ | 0 |
| $ | 2,507 |
|
| 8,408 |
| $ | 0.30 |
|
ONFC |
|
| Oneida Financial MHC of NY (43.9) |
| $ | 3,505 |
| ($ | 490 | ) | $ | 167 |
| $ | 0 |
| $ | 3,182 |
|
| 7,785 |
| $ | 0.41 |
|
PBIP |
|
| Prudential Bancorp MHC PA (40.5) |
| $ | 3,112 |
| $ | 0 |
| $ | 0 |
| $ | 0 |
| $ | 3,112 |
|
| 11,371 |
| $ | 0.27 |
|
ROMA |
|
| Roma Financial Corp MHC of NJ (31.0)(1) |
| $ | 7,830 |
| ($ | 2 | ) | $ | 1 |
| $ | 0 |
| $ | 7,829 |
|
| 31,388 |
| $ | 0.25 |
|
|
|
(1) | Financial data is for the 12 months ended September 30, 2007. |
(2) | Figures are for three quarters of financial data, EPS figures are annualized. |
|
|
Source: | Audited and unaudited financial statements, corporate reports and offering circulars, and RP®Financial, LC. calculations. The information provided in this table has been obtained from sources we believe are reliable, but we cannot guarantee the accuracy or completeness of such information. |
Copyright (c) 2008 by RP® Financial, LC.
EXHIBIT 3
Pro Forma Analysis Sheet – Fully Converted Basis
Exhibit 3
PRO FORMA ANALYSIS SHEET
Malvern Federal Savings Bank
Prices as of March 19, 2008
|
|
|
|
|
|
|
|
|
|
|
|
|
|
|
|
|
|
|
|
|
|
|
|
|
|
|
| Peer Group |
| Pennsylvania Companies |
| All Publicly-Traded |
| ||||||
|
|
|
|
|
|
|
|
|
|
| |||||||||
Price Multiple |
|
|
| Symbol |
| Subject (1) |
| Average |
| Median |
| Average |
| Median |
| Average |
| Median |
|
|
|
|
|
|
|
|
|
|
|
| |||||||||
Price-earnings ratio (x) |
|
|
| P/E |
| 25.89 | x | 28.30 | x | 30.28 | x | 15.37 | x | 13.71 | x | 19.41 | x | 18.56 | x |
Price-core earnings ratio (x) |
|
|
| P/Core |
| 26.17 | x | 28.72 | x | 30.47 | x | 15.73 | x | 14.20 | x | 20.51 | x | 19.90 | x |
Price-book ratio (%) |
| = |
| P/B |
| 59.56 | % | 83.67 | % | 81.69 | % | 92.48 | % | 98.92 | % | 108.67 | % | 101.28 | % |
Price-tangible book ratio (%) |
| = |
| P/TB |
| 59.56 | % | 86.56 | % | 84.46 | % | 114.79 | % | 104.30 | % | 122.62 | % | 112.29 | % |
Price-assets ratio (%) |
| = |
| P/A |
| 9.11 | % | 20.81 | % | 17.33 | % | 9.65 | % | 6.53 | % | 14.08 | % | 10.85 | % |
|
|
|
|
|
|
|
|
|
|
|
|
|
|
|
|
|
|
|
|
Valuation Parameters
|
|
|
|
|
Pre-Conversion Earnings (Y) |
| $ | 1,960,000 |
|
Pre-Conversion Earnings (CY) |
| $ | 1,938,000 |
|
Pre-Conversion Book Value (B) |
| $ | 44,696,000 |
|
Pre-Conv. Tang. Book Val. (TB) |
| $ | 44,696,000 |
|
Pre-Conversion Assets (A) |
| $ | 542,205,000 |
|
Reinvestment Rate (2)(R) |
|
| 3.34 | % |
Est. Conversion Expenses (3)(X) |
|
| 2.50 | % |
Tax Rate (TAX) |
|
| 38.50 | % |
|
|
|
|
|
|
|
ESOP Stock Purchases (E) |
|
| 8.00 | % |
| (5) |
Cost of ESOP Borrowings (S) |
|
| 0.00 | % |
| (4) |
ESOP Amortization (T) |
|
| 15.00 |
|
| years |
RRP Amount (M) |
|
| 4.00 | % |
|
|
RRP Vesting (N) |
|
| 5.00 |
|
| years (5) |
Foundation (F) |
|
| 2.00 | % |
|
|
Tax Benefit (Z) |
|
| 411,950 |
|
|
|
Percentage Sold (PCT) |
|
| 100.00 | % |
|
|
Option (O1) |
|
| 10.00 | % |
| (6) |
Estimated Option Value (O2) |
|
| 38.60 | % |
| (6) |
Option vesting (O3) |
|
| 5.00 |
|
| (6) |
Option pct taxable (O4) |
|
| 25.00 | % |
| (6) |
Calculation of Pro Forma Value After Conversion
|
|
|
|
|
|
|
|
|
|
|
1. | V= |
| P/E * (Y) |
|
| V= |
| $ | 53,500,000 |
|
|
|
|
|
|
|
|
|
| ||
|
|
| 1 - P/E * PCT * ((1-X-E-M-F)*R*(1-TAX) - (1-TAX)*E/T - (1-TAX)*M/N) - (1-(TAX*O4))*(O1*O2)/O3) |
|
|
|
|
|
| |
|
|
|
|
|
|
|
|
|
|
|
2. | V= |
| P/Core * (Y) |
|
| V= |
| $ | 53,500,000 |
|
|
|
|
|
|
|
|
|
| ||
|
|
| 1 - P/core * PCT * ((1-X-E-M-F)*R*(1-TAX) - (1-TAX)*E/T - (1-TAX)*M/N) - (1-(TAX*O4))*(O1*O2)/O3) |
|
|
|
|
|
| |
| ||||||||||
3. | V= |
| P/B * (B+Z) |
|
| V= |
| $ | 53,500,000 |
|
|
|
|
|
|
|
|
|
|
| |
|
|
| 1 - P/B * PCT * (1-X-E-M-F) |
|
|
|
|
|
|
|
|
|
|
|
|
|
|
|
|
|
|
4. | V= |
| P/TB * (TB+Z) |
|
| V= |
| $ | 53,500,000 |
|
|
|
|
|
|
|
|
|
|
| |
|
|
| 1 - P/TB * PCT * (1-X-E-M-F) |
|
|
|
|
|
|
|
|
|
|
|
|
|
|
|
|
|
|
5. | V= |
| P/A * (A+Z) |
|
| V= |
| $ | 53,500,000 |
|
|
|
|
|
|
|
|
|
|
| |
|
|
| 1 - P/A * PCT * (1-X-E-M-F) |
|
|
|
|
|
|
|
|
|
|
|
|
|
|
|
|
|
|
|
|
|
|
|
|
|
|
|
Conclusion |
| Shares Issued |
| Price Per |
| Gross Offering |
| Shares |
| Total Shares |
| Aggregate |
| ||||||
|
|
|
|
|
|
| |||||||||||||
Supermaximum |
|
| 6,933,867 |
|
| 10.00 |
| $ | 69,338,670 |
|
| 141,508 |
|
| 7,075,375 |
| $ | 70,753,750 |
|
Maximum |
|
| 6,029,450 |
|
| 10.00 |
|
| 60,294,500 |
|
| 123,050 |
|
| 6,152,500 |
|
| 61,525,000 |
|
Midpoint |
|
| 5,243,000 |
|
| 10.00 |
|
| 52,430,000 |
|
| 107,000 |
|
| 5,350,000 |
|
| 53,500,000 |
|
Minimum |
|
| 4,456,550 |
|
| 10.00 |
|
| 44,565,500 |
|
| 90,950 |
|
| 4,547,500 |
|
| 45,475,000 |
|
|
|
(1) | Pricing ratios shown reflect the midpoint value. |
|
|
(2) | Net return reflects a reinvestment rate of 3.34 percent and a tax rate of 38.5 percent. |
|
|
(3) | Offering expenses shown at estimated midpoint value. |
|
|
(4) | No cost is applicable since holding company will fund the ESOP loan. |
|
|
(5) | ESOP and MRP amortize over 15 years and 5 years, respectively; amortization expenses tax effected at 38.5 percent. |
|
|
(6) | 10 percent option plan with an estimated Black-Scholes valuation of 38.60 percent of the exercise price, including a 5 year vesting with 25 percent of the options (granted to directors) tax effected at 38.5 percent. |
EXHIBIT 4
Pro Forma Effect of Conversion Proceeds – Fully Converted Basis
Exhibit 4
PRO FORMA EFFECT OF CONVERSION PROCEEDS
Malvern Federal Savings Bank
At the Minimum
|
|
|
|
|
|
1. | Pro Forma Market Capitalization |
| $ | 45,475,000 |
|
| Less: Foundation Shares |
|
| 909,500 |
|
|
|
|
| ||
2. | Offering Proceeds |
| $ | 44,565,500 |
|
| Less: Estimated Offering Expenses |
|
| 1,114,137 |
|
|
|
|
| ||
| Net Conversion Proceeds |
| $ | 43,451,362 |
|
| Estimated Additional Income from Conversion Proceeds |
|
|
|
|
| |||||
| Net Conversion Proceeds |
| $ | 43,451,362 |
|
| Less: Cash Contribution to Foundation |
|
| 0 |
|
| Less: Non-Cash Stock Purchases (1) |
|
| 5,457,000 |
|
|
|
|
| ||
| Net Proceeds Reinvested |
| $ | 37,994,362 |
|
| Estimated net incremental rate of return |
|
| 2.05 | % |
|
|
|
| ||
| Reinvestment Income |
| $ | 780,442 |
|
| Less: Estimated cost of ESOP borrowings (2) |
|
| 0 |
|
| Less: Amortization of ESOP borrowings (3) |
|
| 149,158 |
|
| Less: Amortization of Options (4) |
|
| 317,277 |
|
| Less: Recognition Plan Vesting (5) |
|
| 223,737 |
|
|
|
|
| ||
| Net Earnings Impact |
| $ | 90,270 |
|
|
|
|
|
|
|
|
|
|
|
|
|
4. | Pro Forma Earnings |
| Before |
| Net |
| After |
| |||
|
|
|
|
|
| ||||||
| |||||||||||
| 12 Months ended December 31, 2007 (reported) |
| $ | 1,960,000 |
| $ | 90,270 |
| $ | 2,050,270 |
|
| 12 Months ended December 31, 2007 (core) |
| $ | 1,938,000 |
| $ | 90,270 |
| $ | 2,028,270 |
|
|
|
|
|
|
|
|
|
|
|
|
|
|
|
|
5. | Pro Forma Net Worth |
| Before |
| Net Cash |
| Tax Benefit |
| After |
| ||||
|
|
|
|
|
|
| ||||||||
| ||||||||||||||
| December 31, 2007 |
| $ | 44,696,000 |
| $ | 37,994,362 |
| $ | 350,158 |
| $ | 83,040,520 |
|
| December 31, 2007 (Tangible) |
| $ | 44,696,000 |
| $ | 37,994,362 |
| $ | 350,158 |
| $ | 83,040,520 |
|
|
|
|
|
|
|
|
|
|
|
|
|
|
|
|
6. | Pro Forma Assets |
| Before |
| Net Cash |
| Tax Benefit |
| After |
| ||||
|
|
|
|
|
|
| ||||||||
| ||||||||||||||
| December 31, 2007 |
| $ | 542,205,000 |
| $ | 37,994,362 |
| $ | 350,158 |
| $ | 580,549,520 |
|
|
|
(1) | Includes ESOP and RRP stock purchases equal to 8.0 and 4.0 percent of total shares issued, respectively. |
|
|
(2) | ESOP stock purchases are internally financed by a loan from the holding company. |
|
|
(3) | ESOP borrowings are amortized over 15 years, amortization expense is tax-effected at a 38.5 percent rate. |
|
|
(4) | Option valuation based on Black-Scholes model, 5 year vesting, and assumes 25 percent is taxable. |
|
|
(5) | RRP is amortized over 5 years, and amortization expense is tax effected at 38.5 percent. |
Exhibit 4
PRO FORMA EFFECT OF CONVERSION PROCEEDS
Malvern Federal Savings Bank
At the Midpoint
|
|
|
|
|
|
1. | Pro Forma Market Capitalization |
| $ | 53,500,000 |
|
| Less: Foundation Shares |
|
| 1,070,000 |
|
|
|
|
| ||
2. | Offering Proceeds |
| $ | 52,430,000 |
|
| Less: Estimated Offering Expenses |
|
| 1,310,750 |
|
|
|
|
| ||
| Net Conversion Proceeds |
| $ | 51,119,250 |
|
| Estimated Additional Income from Conversion Proceeds |
|
|
|
|
| |||||
| Net Conversion Proceeds |
| $ | 51,119,250 |
|
| Less: Cash Contribution to Foundation |
|
| 0 |
|
| Less: Non-Cash Stock Purchases (1) |
|
| 6,420,000 |
|
|
|
|
| ||
| Net Proceeds Reinvested |
| $ | 44,699,250 |
|
| Estimated net incremental rate of return |
|
| 2.05 | % |
|
|
|
| ||
| Reinvestment Income |
| $ | 918,167 |
|
| Less: Estimated cost of ESOP borrowings (2) |
|
| 0 |
|
| Less: Amortization of ESOP borrowings (3) |
|
| 175,480 |
|
| Less: Amortization of Options (4) |
|
| 373,267 |
|
| Less: Recognition Plan Vesting (5) |
|
| 263,220 |
|
|
|
|
| ||
| Net Earnings Impact |
| $ | 106,200 |
|
|
|
|
|
|
|
|
|
|
|
|
|
4. | Pro Forma Earnings |
| Before |
| Net |
| After |
| |||
|
|
|
|
|
| ||||||
| |||||||||||
| 12 Months ended December 31, 2007 (reported) |
| $ | 1,960,000 |
| $ | 106,200 |
| $ | 2,066,200 |
|
| 12 Months ended December 31, 2007 (core) |
| $ | 1,938,000 |
| $ | 106,200 |
| $ | 2,044,200 |
|
|
|
|
|
|
|
|
|
|
|
|
|
|
|
|
5. | Pro Forma Net Worth |
| Before |
| Net Cash |
| Tax Benefit |
| After |
| ||||
|
|
|
|
|
|
| ||||||||
| ||||||||||||||
| December 31, 2007 |
| $ | 44,696,000 |
| $ | 44,699,250 |
| $ | 411,950 |
| $ | 89,807,200 |
|
| December 31, 2007 (Tangible) |
| $ | 44,696,000 |
| $ | 44,699,250 |
| $ | 411,950 |
| $ | 89,807,200 |
|
|
|
|
|
|
|
|
|
|
|
|
|
|
|
|
6. | Pro Forma Assets |
| Before |
| Net Cash |
| Tax Benefit |
| After |
| ||||
|
|
|
|
|
|
| ||||||||
| ||||||||||||||
| December 31, 2007 |
| $ | 542,205,000 |
| $ | 44,699,250 |
| $ | 411,950 |
| $ | 587,316,200 |
|
|
|
(1) | Includes ESOP and RRP stock purchases equal to 8.0 and 4.0 percent of total shares issued, respectively. |
|
|
(2) | ESOP stock purchases are internally financed by a loan from the holding company. |
|
|
(3) | ESOP borrowings are amortized over 15 years, amortization expense is tax-effected at a 38.5 percent rate. |
|
|
(4) | Option valuation based on Black-Scholes model, 5 year vesting, and assumes 25 percent is taxable. |
|
|
(5) | RRP is amortized over 5 years, and amortization expense is tax effected at 38.5 percent. |
Exhibit 4
PRO FORMA EFFECT OF CONVERSION PROCEEDS
Malvern Federal Savings Bank
At the Maximum Value
|
|
|
|
|
|
1. | Pro Forma Market Capitalization |
| $ | 61,525,000 |
|
| Less: Foundation Shares |
|
| 1,230,500 |
|
|
|
|
| ||
2. | Offering Proceeds |
| $ | 60,294,500 |
|
| Less: Estimated Offering Expenses |
|
| 1,507,362 |
|
|
|
|
| ||
| Net Conversion Proceeds |
| $ | 58,787,137 |
|
| Estimated Additional Income from Conversion Proceeds |
|
|
|
|
| |||||
| Net Conversion Proceeds |
| $ | 58,787,137 |
|
| Less: Cash Contribution to Foundation |
|
| 0 |
|
| Less: Non-Cash Stock Purchases (1) |
|
| 7,383,000 |
|
|
|
|
| ||
| Net Proceeds Reinvested |
| $ | 51,404,137 |
|
| Estimated net incremental rate of return |
|
| 2.05 | % |
|
|
|
| ||
| Reinvestment Income |
| $ | 1,055,892 |
|
| Less: Estimated cost of ESOP borrowings (2) |
|
| 0 |
|
| Less: Amortization of ESOP borrowings (3) |
|
| 201,802 |
|
| Less: Amortization of Options (4) |
|
| 429,257 |
|
| Less: Recognition Plan Vesting (5) |
|
| 302,703 |
|
|
|
|
| ||
| Net Earnings Impact |
| $ | 122,131 |
|
|
|
|
|
|
|
|
|
|
|
|
|
4. | Pro Forma Earnings |
| Before |
| Net |
| After |
| |||
|
|
|
|
|
| ||||||
| |||||||||||
| 12 Months ended December 31, 2007 (reported) |
| $ | 1,960,000 |
| $ | 122,131 |
| $ | 2,082,131 |
|
| 12 Months ended December 31, 2007 (core) |
| $ | 1,938,000 |
| $ | 122,131 |
| $ | 2,060,131 |
|
|
|
|
|
|
|
|
|
|
|
|
|
|
|
|
5. | Pro Forma Net Worth |
| Before |
| Net Cash |
| Tax Benefit |
| After |
| ||||
|
|
|
|
|
|
| ||||||||
| ||||||||||||||
| December 31, 2007 |
| $ | 44,696,000 |
| $ | 51,404,137 |
| $ | 473,743 |
| $ | 96,573,880 |
|
| December 31, 2007 (Tangible) |
| $ | 44,696,000 |
| $ | 51,404,137 |
| $ | 473,743 |
| $ | 96,573,880 |
|
|
|
|
|
|
|
|
|
|
|
|
|
|
|
|
6. | Pro Forma Assets |
| Before |
| Net Cash |
| Tax Benefit |
| After |
| ||||
|
|
|
|
|
|
| ||||||||
| ||||||||||||||
| December 31, 2007 |
| $ | 542,205,000 |
| $ | 51,404,137 |
| $ | 473,743 |
| $ | 594,082,880 |
|
|
|
(1) | Includes ESOP and RRP stock purchases equal to 8.0 and 4.0 percent of total shares issued, respectively. |
|
|
(2) | ESOP stock purchases are internally financed by a loan from the holding company. |
|
|
(3) | ESOP borrowings are amortized over 15 years, amortization expense is tax-effected at a 38.5 percent rate. |
|
|
(4) | Option valuation based on Black-Scholes model, 5 year vesting, and assumes 25 percent is taxable. |
|
|
(5) | RRP is amortized over 5 years, and amortization expense is tax effected at 38.5 percent. |
Exhibit 4
PRO FORMA EFFECT OF CONVERSION PROCEEDS
Malvern Federal Savings Bank
At the Supermaximum Value
|
|
|
|
|
|
1. | Pro Forma Market Capitalization |
| $ | 70,753,750 |
|
| Less: Foundation Shares |
|
| 1,415,080 |
|
|
|
|
| ||
2. | Offering Proceeds |
| $ | 69,338,670 |
|
| Less: Estimated Offering Expenses |
|
| 1,733,467 |
|
|
|
|
| ||
| Net Conversion Proceeds |
| $ | 67,605,203 |
|
| Estimated Additional Income from Conversion Proceeds |
|
|
|
|
| |||||
| Net Conversion Proceeds |
| $ | 67,605,203 |
|
| Less: Cash Contribution to Foundation |
|
| (5 | ) |
| Less: Non-Cash Stock Purchases (1) |
|
| 8,490,450 |
|
|
|
|
| ||
| Net Proceeds Reinvested |
| $ | 59,114,758 |
|
| Estimated net incremental rate of return |
|
| 2.05 | % |
|
|
|
| ||
| Reinvestment Income |
| $ | 1,214,276 |
|
| Less: Estimated cost of ESOP borrowings (2) |
|
| 0 |
|
| Less: Amortization of ESOP borrowings (3) |
|
| 232,072 |
|
| Less: Amortization of Options (4) |
|
| 493,645 |
|
| Less: Recognition Plan Vesting (5) |
|
| 348,108 |
|
|
|
|
| ||
| Net Earnings Impact |
| $ | 140,450 |
|
|
|
|
|
|
|
|
|
|
|
|
|
4. | Pro Forma Earnings |
| Before |
| Net |
| After |
| |||
|
|
|
|
|
| ||||||
| |||||||||||
| 12 Months ended December 31, 2007 (reported) |
| $ | 1,960,000 |
| $ | 140,450 |
| $ | 2,100,450 |
|
| 12 Months ended December 31, 2007 (core) |
| $ | 1,938,000 |
| $ | 140,450 |
| $ | 2,078,450 |
|
|
|
|
|
|
|
|
|
|
|
|
|
|
|
|
5. | Pro Forma Net Worth |
| Before |
| Net Cash |
| Tax Benefit |
| After |
| ||||
|
|
|
|
|
|
| ||||||||
| ||||||||||||||
| December 31, 2007 |
| $ | 44,696,000 |
| $ | 59,114,758 |
| $ | 544,804 |
| $ | 104,355,562 |
|
| December 31, 2007 (Tangible) |
| $ | 44,696,000 |
| $ | 59,114,758 |
| $ | 544,804 |
| $ | 104,355,562 |
|
|
|
|
|
|
|
|
|
|
|
|
|
|
|
|
6. | Pro Forma Assets |
| Before |
| Net Cash |
| Tax Benefit |
| After |
| ||||
|
|
|
|
|
|
| ||||||||
| ||||||||||||||
| December 31, 2007 |
| $ | 542,205,000 |
| $ | 59,114,758 |
| $ | 544,804 |
| $ | 601,864,562 |
|
|
|
(1) | Includes ESOP and RRP stock purchases equal to 8.0 and 4.0 percent of total shares issued, respectively. |
|
|
(2) | ESOP stock purchases are internally financed by a loan from the holding company. |
|
|
(3) | ESOP borrowings are amortized over 15 years, amortization expense is tax-effected at a 38.5 percent rate. |
|
|
(4) | Option valuation based on Black-Scholes model, 5 year vesting, and assumes 25 percent is taxable. |
|
|
(5) | RRP is amortized over 5 years, and amortization expense is tax effected at 38.5 percent. |
EXHIBIT 5
Pro Forma Analysis Sheet – Minority Stock Offering
EXHIBIT 5
PRO FORMA ANALYSIS SHEET
Malvern Federal Savings Bank
March 19, 2008
|
|
|
|
|
|
|
|
|
|
|
|
|
|
|
|
|
|
|
|
|
|
|
|
|
|
|
|
|
|
|
|
| Peer Group |
|
| Pennsylvania Companies |
|
| All Publicly-Traded |
| |||||||||
|
|
|
|
|
|
|
|
|
|
|
|
| ||||||||||||
Price Multiple |
|
| Symbol |
| Subject (1) |
|
| Average |
|
| Median |
|
| Average |
|
| Median |
|
| Average |
|
| Median |
|
|
|
|
|
|
|
|
|
|
|
|
|
|
|
|
| |||||||||
Price-earnings ratio (x) |
|
| P/E |
| 27.57 | x |
| 29.76 | x |
| 32.47 | x |
| 15.37 | x |
| 13.71 | x |
| 19.41 | x |
| 18.56 | x |
Price-core earnings ratio (x) |
|
| P/Core |
| 27.89 | x |
| 30.89 | x |
| 32.47 | x |
| 15.73 | x |
| 14.20 | x |
| 20.51 | x |
| 19.90 | x |
Price-book ratio (%) | = |
| P/B |
| 84.25 | % |
| 146.08 | % |
| 132.07 | % |
| 92.48 | % |
| 98.92 | % |
| 108.67 | % |
| 101.28 | % |
Price-tangible book ratio (%) | = |
| P/TB |
| 84.25 | % |
| 155.47 | % |
| 146.53 | % |
| 114.79 | % |
| 104.30 | % |
| 122.62 | % |
| 112.29 | % |
Price-assets ratio (%) | = |
| P/A |
| 9.54 | % |
| 24.19 | % |
| 18.86 | % |
| 9.65 | % |
| 6.53 | % |
| 14.08 | % |
| 10.85 | % |
Valuation Parameters
|
|
|
|
|
Pre-Conversion Earnings (Y) |
| $ | 1,958,000 |
|
Pre-Conversion Earnings (CY) |
| $ | 1,936,000 |
|
Pre-Conversion Book Value (B) |
| $ | 44,596,000 |
|
Pre-Conv. Tang. Book Value (TB) |
| $ | 44,596,000 |
|
Pre-Conversion Assets (A) |
| $ | 542,105,000 |
|
Reinvestment Rate(R)(2) |
|
| 3.34 | % |
Est. Conversion Expenses (X)(3) |
|
| 5.89 | % |
Tax Rate (TAX) |
|
| 38.50 | % |
|
|
|
|
|
|
ESOP Stock Purchases (E) |
|
| 8.71 | % | (5) |
Cost of ESOP Borrowings (S) |
|
| 0.00 | % | (4) |
ESOP Amortization (T) |
|
| 15.00 |
| years |
MRP Amount (M) |
|
| 4.36 | % |
|
MRP Vesting (N) |
|
| 5.00 |
| years (5) |
Foundation (F) |
|
| 4.65 | % |
|
Tax Benefit (Z) |
|
| 411,950 |
|
|
Percentage Sold (PCT) |
|
| 45.00 | % |
|
Option (O1) |
|
| 10.89 | % | (6) |
Estimated Option Value (O2) |
|
| 38.60 | % | (6) |
Option vesting (O3) |
|
| 5.00 |
| (6) |
Option pct taxable (O4) |
|
| 25.00 | % | (6) |
Calculation of Pro Forma Value After Conversion
|
|
|
|
|
|
|
|
|
|
|
1. | V= |
| P/E * (Y) |
|
| V= |
| $ | 53,500,000 |
|
|
|
|
|
|
|
|
| |||
|
|
| 1 - P/E * PCT * ((1-X-E-M-F)*R*(1-TAX) - (1-TAX)*E/T - (1-TAX)*M/N) - (1-(TAX*O4) )*(O1*O2)/O3) |
|
|
|
|
|
| |
|
|
|
|
|
|
|
|
|
| |
2. | V= |
| P/Core * (Y) |
|
| V= |
| $ | 53,500,000 |
|
|
|
|
|
|
|
|
| |||
|
|
| 1 - P/core * PCT * ((1-X-E-M-F)*R*(1-TAX) - (1-TAX)*E/T - - (1-TAX)*M/N) - - (1- (TAX*O4) )*(O1*O2)/O3) |
|
|
|
|
|
| |
|
|
|
|
|
|
|
|
|
| |
3. | V= |
| P/B * (B+Z) |
|
| V= |
| $ | 53,500,000 |
|
|
|
|
|
|
|
|
|
| ||
|
|
| 1 - P/B * PCT * (1-X-E-M-F) |
|
|
|
|
|
|
|
|
|
|
|
|
|
|
|
|
|
|
4. | V= |
| P/TB * (TB+Z) |
|
| V= |
| $ | 53,500,000 |
|
|
|
|
|
|
|
|
|
| ||
|
|
| 1 - P/TB * PCT * (1-X-E-M-F) |
|
|
|
|
|
|
|
|
|
|
|
|
|
|
|
|
|
|
5. | V= |
| P/A * (A+Z) |
|
| V= |
| $ | 53,500,000 |
|
|
|
|
|
|
|
|
|
| ||
|
|
| 1 - P/A * PCT * (1-X-E-M-F) |
|
|
|
|
|
|
|
|
|
|
|
|
|
|
|
|
|
|
|
|
|
|
|
|
|
|
|
Conclusion |
| Shares Owned by |
| Shares Issued |
| Price Per |
|
| Gross Offering |
| Shares |
| Total Shares |
|
| Aggregate |
| Full Value |
|
|
|
|
|
|
|
|
|
| |||||||||||
Supermaximum |
| 3,891,456 |
| 3,042,411 |
| 10.00 |
| $ | 30,424,110 |
| 141,508 |
| 3,183,919 |
| $ | 31,839,190 |
| 7,075,375 |
|
Maximum |
| 3,383,875 |
| 2,645,575 |
| 10.00 |
| $ | 26,455,750 |
| 123,050 |
| 2,768,625 |
|
| 27,686,250 |
| 6,152,500 |
|
Midpoint |
| 2,942,500 |
| 2,300,500 |
| 10.00 |
| $ | 23,005,000 |
| 107,000 |
| 2,407,500 |
|
| 24,075,000 |
| 5,350,000 |
|
Minimum |
| 2,501,125 |
| 1,955,425 |
| 10.00 |
| $ | 19,554,250 |
| 90,950 |
| 2,046,375 |
|
| 20,463,750 |
| 4,547,500 |
|
|
|
(1) | Pricing ratios shown reflect the midpoint value. |
|
|
(2) | Net return reflects a reinvestment rate of 3.34 percent, and a tax rate of 38.5 percent. |
|
|
(3) | Offering expenses shown at estimated midpoint value. |
|
|
(4) | No cost is applicable since holding company will fund the ESOP loan. |
|
|
(5) | ESOP and RRP amortize over 15 years and 5 years, respectively; amortization expenses tax effected at 38.5 percent. |
|
|
(6) | Option plan with an estimated Black-Scholes valuation of 38.60 percent of the exercise price, including a 5 year vesting with 25 percent of the options (granted to directors) tax effected at 38.5 percent. |
EXHIBIT 6
Pro Forma Effect of Stock Proceeds – Minority Stock Offering
Exhibit 6
PRO FORMA EFFECT OF CONVERSION PROCEEDS
Malvern Federal Savings Bank
At the Minimum
|
|
|
|
|
|
1. | Pro Forma Market Capitalization |
| $ | 20,463,750 |
|
| Less: Foundation Shares |
|
| 909,500 |
|
|
|
|
| ||
2. | Offering Proceeds |
| $ | 19,554,250 |
|
| Less: Estimated Offering Expenses |
|
| 1,323,091 |
|
|
|
|
| ||
| Net Conversion Proceeds |
| $ | 18,231,159 |
|
|
|
|
|
|
|
3. | Estimated Additional Income from Conversion Proceeds |
|
|
|
|
|
|
|
|
|
|
| Net Conversion Proceeds |
| $ | 18,231,159 |
|
| Less: Cash Contribution to Foundation |
|
| 0 |
|
| Less: Non-Cash Stock Purchases (1) |
|
| 2,673,930 |
|
|
|
|
| ||
| Net Proceeds Reinvested |
| $ | 15,557,229 |
|
| Estimated net incremental rate of return |
|
| 2.05 | % |
|
|
|
| ||
| Reinvestment Income |
| $ | 319,561 |
|
| Less: Estimated cost of ESOP borrowings (2) |
|
| 0 |
|
| Less: Amortization of ESOP borrowings (3) |
|
| 73,087 |
|
| Less: Amortization of Options (4) |
|
| 155,466 |
|
| Less: Recognition Plan Vesting (5) |
|
| 109,631 |
|
|
|
|
| ||
| Net Earnings Impact |
| ($ | 18,623 | ) |
|
|
|
|
|
|
|
|
|
|
|
|
|
|
|
4. | Pro Forma Earnings |
|
|
|
| Before |
| Net |
| After |
| |||
|
|
|
|
|
|
|
|
| ||||||
|
|
|
|
|
|
|
|
|
|
|
|
|
|
|
| 12 Months ended December 31, 2007 (reported) |
| $ | 1,958,000 |
| ($ | 18,623 | ) | $ | 1,939,377 |
| |||
| 12 Months ended December 31, 2007 (core) |
| $ | 1,936,000 |
| ($ | 18,623 | ) | $ | 1,917,377 |
| |||
|
|
|
|
|
|
|
|
|
|
|
|
|
|
|
5. | Pro Forma Net Worth |
| Before |
| Net Cash |
| Tax Benefit |
| After |
| ||||
|
|
|
|
|
|
| ||||||||
|
|
|
|
|
|
|
|
|
|
|
|
|
|
|
| December 31, 2007 |
| $ | 44,596,000 |
| $ | 15,557,229 |
| $ | 350,158 |
| $ | 60,503,386 |
|
| December 31, 2007 (Tangible) |
| $ | 44,596,000 |
| $ | 15,557,229 |
| $ | 350,158 |
| $ | 60,503,386 |
|
|
|
|
|
|
|
|
|
|
|
|
|
|
|
|
|
|
|
|
|
|
|
|
|
|
|
|
|
|
|
6. | Pro Forma Assets |
| Before |
| Net Cash |
| Tax Benefit |
| After |
| ||||
|
|
|
|
|
|
| ||||||||
|
|
|
|
|
|
|
|
|
|
|
|
|
|
|
| December 31, 2007 |
| $ | 542,105,000 |
| $ | 15,557,229 |
| $ | 350,158 |
| $ | 558,012,386 |
|
|
|
(1) | Includes ESOP and MRP stock purchases equal to 8.71 percent and 4.36 percent of the public shares, respectively. |
|
|
(2) | ESOP stock purchases are internally financed by a loan from the holding company. |
|
|
(3) | ESOP borrowings are amortized over 15 years, amortization expense is tax-effected at a 38.5 percent rate. |
|
|
(4) | Option valuation based on Black-Scholes model, 5 year vesting, and assuming 25 percent taxable. |
|
|
(5) | RRP is amortized over 5 years, and amortization expense is tax effected at 38.5 percent. |
Exhibit 6
PRO FORMA EFFECT OF CONVERSION PROCEEDS
Malvern Federal Savings Bank
At the Midpoint
|
|
|
|
|
|
1. | Pro Forma Market Capitalization |
| $ | 24,075,000 |
|
| Less: Foundation Shares |
|
| 1,070,000 |
|
|
|
|
| ||
2. | Offering Proceeds |
| $ | 23,005,000 |
|
| Less: Estimated Offering Expenses |
|
| 1,354,453 |
|
|
|
|
| ||
| Net Conversion Proceeds |
| $ | 21,650,547 |
|
|
|
|
|
|
|
|
|
|
|
|
|
3. | Estimated Additional Income from Conversion Proceeds |
|
|
|
|
|
|
|
|
|
|
| Net Conversion Proceeds |
| $ | 21,650,547 |
|
| Less: Cash Contribution to Foundation |
|
| 0 |
|
| Less: Non-Cash Stock Purchases (1) |
|
| 3,145,800 |
|
|
|
|
| ||
| Net Proceeds Reinvested |
| $ | 18,504,747 |
|
| Estimated net incremental rate of return |
|
| 2.05 | % |
|
|
|
| ||
| Reinvestment Income |
| $ | 380,106 |
|
| Less: Estimated cost of ESOP borrowings (2) |
|
| 0 |
|
| Less: Amortization of ESOP borrowings (3) |
|
| 85,985 |
|
| Less: Amortization of Options (4) |
|
| 182,901 |
|
| Less: Recognition Plan Vesting (5) |
|
| 128,978 |
|
|
|
|
| ||
| Net Earnings Impact |
| ($ | 17,758 | ) |
|
|
|
|
|
|
|
|
|
|
|
|
|
|
|
4. | Pro Forma Earnings |
|
|
| Before |
| Net |
| After |
| ||||
|
|
|
|
|
|
|
|
| ||||||
| ||||||||||||||
| 12 Months ended December 31, 2007 (reported) |
| $ | 1,958,000 |
| ($ | 17,758 | ) | $ | 1,940,242 |
| |||
| 12 Months ended December 31, 2007 (core) |
| $ | 1,936,000 |
| ($ | 17,758 | ) | $ | 1,918,242 |
| |||
|
|
|
|
|
|
|
|
|
|
|
|
|
|
|
5. | Pro Forma Net Worth |
| Before |
| Net Cash |
| Tax Benefit |
| After |
| ||||
|
|
|
|
|
|
| ||||||||
| ||||||||||||||
| December 31, 2007 |
| $ | 44,596,000 |
| $ | 18,504,747 |
| $ | 411,950 |
| $ | 63,512,697 |
|
| December 31, 2007 (Tangible) |
| $ | 44,596,000 |
| $ | 18,504,747 |
| $ | 411,950 |
| $ | 63,512,697 |
|
|
|
|
|
|
|
|
|
|
|
|
|
|
|
|
|
|
|
|
|
|
|
|
|
|
|
|
|
|
|
6. | Pro Forma Assets |
| Before |
|
| Net Cash |
| Tax Benefit |
| After |
| |||
|
|
|
|
|
|
| ||||||||
|
|
|
|
|
|
|
|
|
|
|
|
|
|
|
| December 31, 2007 |
| $ | 542,105,000 |
| $ | 18,504,747 |
| $ | 411,950 |
| $ | 561,021,697 |
|
|
|
(1) | Includes ESOP and MRP stock purchases equal to 8.71 percent and 4.36 percent of the public shares, respectively. |
|
|
(2) | ESOP stock purchases are internally financed by a loan from the holding company. |
|
|
(3) | ESOP borrowings are amortized over 15 years, amortization expense is tax-effected at a 38.5 percent rate. |
|
|
(4) | Option valuation based on Black-Scholes model, 5 year vesting, and assuming 25 percent taxable. |
|
|
(5) | RRP is amortized over 5 years, and amortization expense is tax effected at 38.5 percent. |
Exhibit 6
PRO FORMA EFFECT OF CONVERSION PROCEEDS
Malvern Federal Savings Bank
At the Maximum
|
|
|
|
|
| ||
1. | Pro Forma Market Capitalization |
| $ | 27,686,250 |
| ||
| Less: Foundation Shares |
|
| 1,230,500 |
| ||
|
|
|
| ||||
2. | Offering Proceeds |
| $ | 26,455,750 |
| ||
| Less: Estimated Offering Expenses |
|
| 1,385,815 |
| ||
|
|
|
| ||||
| Net Conversion Proceeds |
| $ | 25,069,935 |
| ||
|
|
|
|
|
| ||
|
|
|
|
|
| ||
3. | Estimated Additional Income from Conversion Proceeds |
|
|
|
| ||
|
|
|
|
|
| ||
| Net Conversion Proceeds |
| $ | 25,069,935 |
| ||
| Less: Cash Contribution to Foundation |
|
| 0 |
| ||
| Less: Non-Cash Stock Purchases (1) |
|
| 3,617,670 |
| ||
|
|
|
| ||||
| Net Proceeds Reinvested |
| $ | 21,452,265 |
| ||
| Estimated net incremental rate of return |
|
| 2.05 | % | ||
|
|
|
| ||||
| Reinvestment Income |
| $ | 440,651 |
| ||
| Less: Estimated cost of ESOP borrowings (2) |
|
| 0 |
| ||
| Less: Amortization of ESOP borrowings (3) |
|
| 98,883 |
| ||
| Less: Amortization of Options (4) |
|
| 210,336 |
| ||
| Less: Recognition Plan Vesting (5) |
|
| 148,324 |
| ||
|
|
|
| ||||
| Net Earnings Impact |
| ($ | 16,892 | ) | ||
|
|
|
|
|
|
|
|
|
|
|
|
|
|
|
4. | Pro Forma Earnings |
|
|
|
| Before |
|
| Net |
|
| After |
| |
|
|
|
|
|
|
|
|
| ||||||
| ||||||||||||||
| 12 Months ended December 31, 2007 (reported) |
| $ | 1,958,000 |
| ($ | 16,892 | ) | $ | 1,941,108 |
| |||
| 12 Months ended December 31, 2007 (core) |
| $ | 1,936,000 |
| ($ | 16,892 | ) | $ | 1,919,108 |
| |||
|
|
|
|
|
|
|
|
|
|
|
|
|
|
|
5. | Pro Forma Net Worth |
| Before |
| Net Cash |
| Tax Benefit |
| After |
| ||||
|
|
|
|
|
|
| ||||||||
| ||||||||||||||
| December 31, 2007 |
| $ | 44,596,000 |
| $ | 21,452,265 |
| $ | 473,743 |
| $ | 66,522,007 |
|
| December 31, 2007 (Tangible) |
| $ | 44,596,000 |
| $ | 21,452,265 |
| $ | 473,743 |
| $ | 66,522,007 |
|
|
|
|
|
|
|
|
|
|
|
|
|
|
|
|
6. | Pro Forma Assets |
| Before |
| Net Cash |
| Tax Benefit |
| After |
| ||||
|
|
|
|
|
|
| ||||||||
|
|
|
|
|
|
|
|
|
|
|
|
|
|
|
| December 31, 2007 |
| $ | 542,105,000 |
| $ | 21,452,265 |
| $ | 473,743 |
| $ | 564,031,007 |
|
|
|
(1) | Includes ESOP and MRP stock purchases equal to 8.71 percent and 4.36 percent of the public shares, respectively. |
|
|
(2) | ESOP stock purchases are internally financed by a loan from the holding company. |
|
|
(3) | ESOP borrowings are amortized over 15 years, amortization expense is tax-effected at a 38.5 percent rate. |
|
|
(4) | Option valuation based on Black-Scholes model, 5 year vesting, and assuming 25 percent taxable. |
|
|
(5) | RRP is amortized over 5 years, and amortization expense is tax effected at 38.5 percent. |
Exhibit 6
PRO FORMA EFFECT OF CONVERSION PROCEEDS
Malvern Federal Savings Bank
At the Supermaximum Value
|
|
|
|
|
|
1. | Pro Forma Market Capitalization |
| $ | 31,839,190 |
|
| Less: Foundation Shares |
|
| 1,415,075 |
|
|
|
|
| ||
2. | Offering Proceeds |
| $ | 30,424,110 |
|
| Less: Estimated Offering Expenses |
|
| 1,421,881 |
|
|
|
|
| ||
| Net Conversion Proceeds |
| $ | 29,002,229 |
|
|
|
|
|
|
|
|
|
|
|
|
|
3. | Estimated Additional Income from Conversion Proceeds |
|
|
|
|
|
|
|
|
|
|
| Net Conversion Proceeds |
| $ | 29,002,229 |
|
| Less: Cash Contribution to Foundation |
|
| (0 | ) |
| Less: Non-Cash Stock Purchases (1) |
|
| 4,160,321 |
|
|
|
|
| ||
| Net Proceeds Reinvested |
| $ | 24,841,908 |
|
| Estimated net incremental rate of return |
|
| 2.05 | % |
|
|
|
| ||
| Reinvestment Income |
| $ | 510,278 |
|
| Less: Estimated cost of ESOP borrowings (2) |
|
| 0 |
|
| Less: Amortization of ESOP borrowings (3) |
|
| 113,715 |
|
| Less: Amortization of Options (4) |
|
| 241,886 |
|
| Less: Recognition Plan Vesting (5) |
|
| 170,573 |
|
|
|
|
| ||
| Net Earnings Impact |
| ($ | 15,897 | ) |
|
|
|
|
|
|
|
|
|
|
|
|
|
|
| |||
4. | Pro Forma Earnings |
|
|
| Before |
| Net |
| After |
| |||||||
|
|
|
|
|
|
|
|
| |||||||||
| |||||||||||||||||
| 12 Months ended December 31, 2007 (reported) |
| $ | 1,958,000 |
| ($ | 15,897 | ) | $ | 1,942,103 |
|
|
|
| |||
| 12 Months ended December 31, 2007 (core) |
| $ | 1,936,000 |
| ($ | 15,897 | ) | $ | 1,920,103 |
| ||||||
|
|
|
|
|
|
|
|
|
|
|
|
|
|
|
5. | Pro Forma Net Worth |
| Before |
| Net Cash |
| Tax Benefit |
| After |
| ||||
|
|
|
|
|
|
| ||||||||
| ||||||||||||||
| December 31, 2007 |
| $ | 44,596,000 |
| $ | 24,841,908 |
| $ | 544,804 |
| $ | 69,982,712 |
|
| December 31, 2007 (Tangible) |
| $ | 44,596,000 |
| $ | 24,841,908 |
| $ | 544,804 |
| $ | 69,982,712 |
|
|
|
|
|
|
|
|
|
|
|
|
|
|
|
|
6. | Pro Forma Assets |
| Before |
| Net Cash |
| Tax Benefit |
| After |
| ||||
|
|
|
|
|
|
| ||||||||
| ||||||||||||||
| December 31, 2007 |
| $ | 542,105,000 |
| $ | 24,841,908 |
| $ | 544,804 |
| $ | 567,491,712 |
|
|
|
(1) | Includes ESOP and MRP stock purchases equal to 8.71 percent and 4.36 percent of the public shares, respectively. |
|
|
(2) | ESOP stock purchases are internally financed by a loan from the holding company. |
|
|
(3) | ESOP borrowings are amortized over 15 years, amortization expense is tax-effected at a 38.5 percent rate. |
|
|
(4) | Option valuation based on Black-Scholes model, 5 year vesting, and assuming 25 percent taxable. |
|
|
(5) | RRP is amortized over 5 years, and amortization expense is tax effected at 38.5 percent. |
EXHIBIT 7
Firm Qualifications Statement
|
|
RP®FINANCIAL, LC. | |
| |
Celebrating 20 Years of Financial Advisory Services | |
|
FIRM QUALIFICATION STATEMENT |
RP® Financial provides financial and management consulting, merger advisory and valuation services to the financial services industry nationwide. We offer a broad array of services, high quality and prompt service, hands-on involvement by principals and senior staff, careful structuring of strategic initiatives and sophisticated valuation and other analyses consistent with industry practices and regulatory requirements. Our staff maintains extensive background in financial and management consulting, valuation and investment banking. Our clients include commercial banks, thrifts, credit unions, mortgage companies and other financial services companies.
RP® Financial’s strategic planning services are designed to provide effective feasible plans with quantifiable results. We analyze strategic options to enhance shareholder value, achieve regulatory approval or realize other objectives. Such services involve conducting situation analyses; establishing mission/vision statements, strategic goals and objectives; and identifying strategies to enhance franchise and/or market value, capital management, earnings enhancement, operational matters and organizational issues. Strategic recommendations typically focus on: capital formation and management, asset/liability targets, profitability, return on equity and stock pricing. Our proprietary financial simulation models provide the basis for evaluating the impact of various strategies and assessing their feasibility and compatibility with regulations.
RP® Financial’s merger advisory services include targeting potential buyers and sellers, assessing acquisition merit, conducting due diligence, negotiating and structuring merger transactions, preparing merger business plans and financial simulations, rendering fairness opinions, preparing mark-to-market analyses and supporting the implementation of post-acquisition strategies. Through financial simulations, comprehensive data bases, valuation proficiency and regulatory familiarity, RP® Financial’s merger advisory services center on enhancing shareholder returns.
RP® Financial’s extensive valuation practice includes bank and thrift mergers, thrift mutual-to-stock conversions, insurance company demutualizations, ESOPs, subsidiary companies, purchase accounting and other purposes. We are highly experienced in performing appraisals which conform to regulatory guidelines and appraisal standards. RP® Financial is the nation’s leading valuation firm for thrift mutual-to-stock conversions, with appraised values ranging up to $4 billion.
RP® Financial offers other consulting services including branching and diversification strategies, feasibility studies and special research. We assist banks/thrifts in preparing CRA plans and evaluating wealth management activities on a de novo or merger basis. Our other consulting services are aided by proprietary valuation and financial simulation models.
|
|
|
|
|
KEY PERSONNEL (Years of Relevant Experience & Contact Information) | ||||
|
|
|
|
|
Ronald S. Riggins, Managing Director (27) |
| (703) 647-6543 |
| rriggins@rpfinancial.com |
William E. Pommerening, Managing Director (24) |
| (703) 647-6546 |
| wpommerening@rpfinancial.com |
Gregory E. Dunn, Director (25) |
| (703) 647-6548 |
| gdunn@rpfinancial.com |
James P. Hennessey, Director (22) |
| (703) 647-6544 |
| jhennessey@rpfinancial.com |
James J. Oren, Director (21) |
| (703) 647-6549 |
| joren@rpfinancial.com |
Timothy M. Biddle, Senior Vice President (18) |
| (703) 647-6552 |
| tbiddle@rpfinancial.com |
|
|
|
|
|
|
|
Washington Headquarters |
|
Rosslyn Center | Telephone: (703) 528-1700 |
1700 North Moore Street, Suite 2210 | Fax No.: (703) 528-1788 |
Arlington, VA 22209 | Toll-Free No.: (866) 723-0594 |
www.rpfinancial.com | E-Mail: mail@rpfinancial.com |