Exhibit 99.2
Q2 2019 Conference Call August 7, 2019
2 Safe Harbor This presentation contains forward - looking statements concerning Atomera Incorporated (““Atomera,” the “Company,” “we,” “us,” and “our”). The words “believe,” “may,” “will,” “potentially,” “estimate,” “continue,” “anticipate,” “intend,” “could,” “would,” “project,” “plan,” “expect” and similar expressions that convey uncertainty of future events or outcomes are intended to identify forward - looking statements. These forward - looking statements are subject to a number of risks, uncertainties and assumptions, including those disclosed in the section "Risk Factors" included in our Prospectus Supplement filed with the SEC on May 30, 2019. In light of these risks, uncertainties and assumptions, the forward - looking events and circumstances discussed in this presentation may not occur and actual results could differ materially and adversely from those anticipated or implied in our forward - looking statements. You should not rely upon forward - looking statements as predictions of future events. Although we believe that the expectations reflected in our forward - looking statements are reasonable, we cannot guarantee that the future results, levels of activity, performance or events and circumstances described in the forward - looking statements will be achieved or occur. This presentation contains only basic information concerning Atomera. The Company’s filings with the Securities Exchange Commission, including the Prospectus Supplement , include more information about factors that could affect the Company’s operating and financial results. We assume no obligation to update information contained in this presentation. Although this presentation may remain available on the Company's website or elsewhere, its continued availability does not indicate that we are reaffirming or confirming any of the information contained herein.
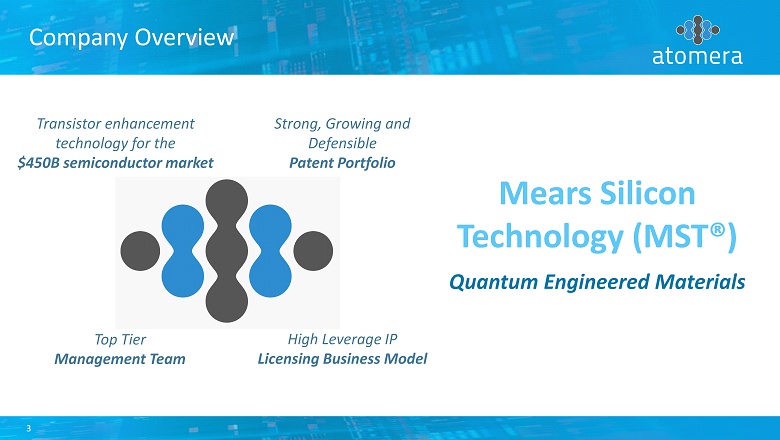
Mears Silicon Technology (MST®) Quantum Engineered Materials 3 Company Overview Strong, Growing and Defensible Patent Portfolio High Leverage IP Licensing Business Model Top Tier Management Team Transistor enhancement technology for the $450B semiconductor market
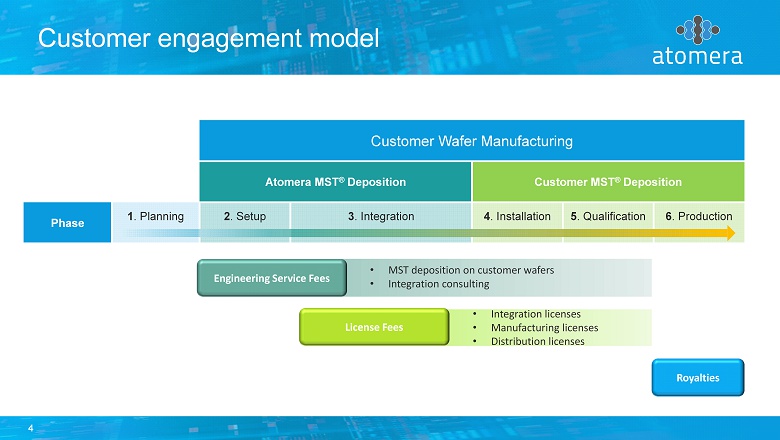
4 Customer engagement model v Customer Wafer Manufacturing Atomera MST ® Deposition Customer MST ® Deposition Phase 1 . Planning 2 . Setup 3 . Integration 4 . Installation 5 . Qualification 6 . Production Royalties Engineering Service Fees • MST deposition on customer wafers • Integration consulting License Fees • Integration licenses • Manufacturing licenses • Distribution licenses
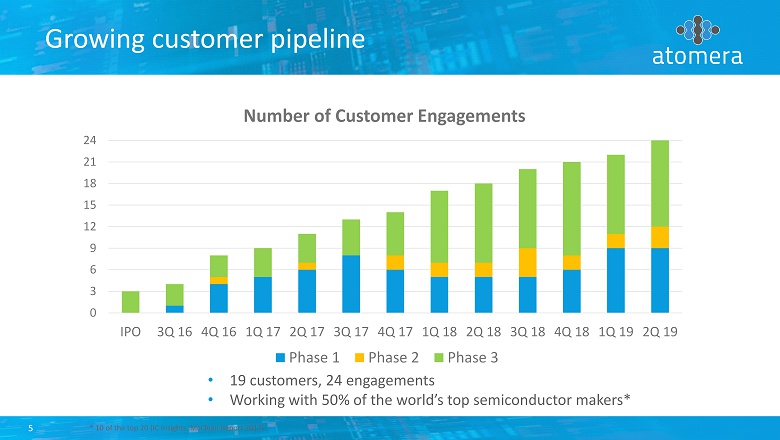
5 Growing customer pipeline • 19 customers, 24 engagements • Working with 50% of the world’s top semiconductor makers* 0 3 6 9 12 15 18 21 24 IPO 3Q 16 4Q 16 1Q 17 2Q 17 3Q 17 4Q 17 1Q 18 2Q 18 3Q 18 4Q 18 1Q 19 2Q 19 Number of Customer Engagements Phase 1 Phase 2 Phase 3 * 10 of the top 20 (IC Insights, McClean Report 2017)
6 Three technical breakthroughs MST - SP provides up to 50% performance gains for 5V Analog Enhancements for FinFET devices RF SOI improvements applicable to the 5G cellular space
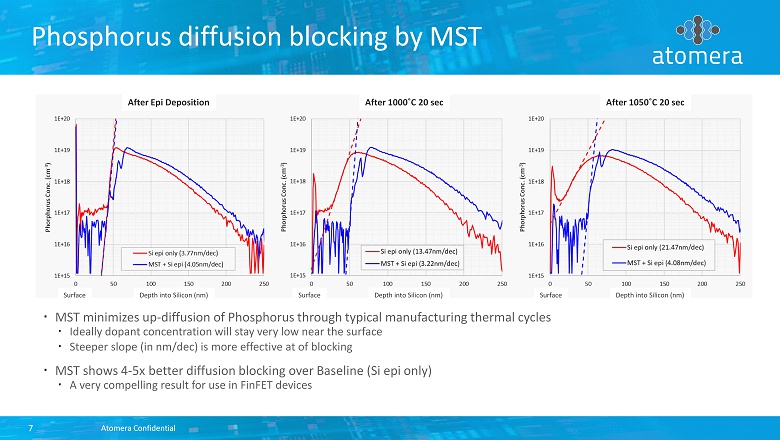
8/7/2019 Atomera Confidential 7 Phosphorus diffusion blocking by MST MST minimizes up - diffusion of Phosphorus through typical manufacturing thermal cycles Ideally dopant concentration will stay very low near the surface Steeper slope (in nm/ dec ) is more effective at of blocking MST shows 4 - 5x better diffusion blocking over Baseline (Si epi only) A very compelling result for use in FinFET devices Depth into Silicon (nm) Surface Depth into Silicon (nm) Surface Depth into Silicon (nm) Surface After 1000˚C 20 sec After 1050˚C 20 sec After Epi Deposition
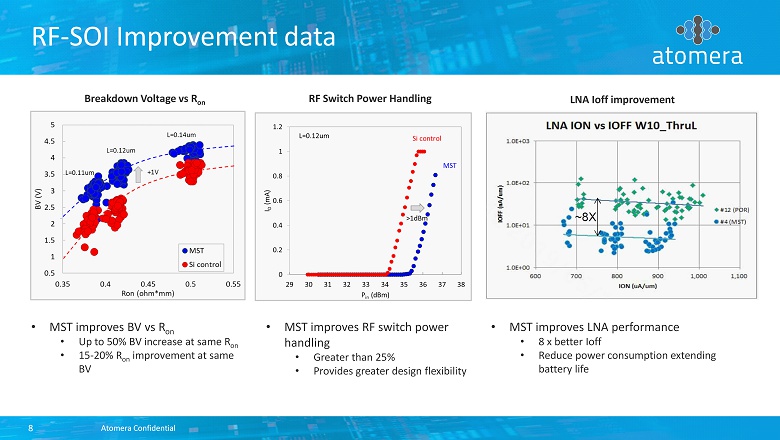
8/7/2019 Atomera Confidential 8 RF - SOI Improvement data Breakdown Voltage vs R on RF Switch Power Handling LNA Ioff improvement • MST improves BV vs R on • Up to 50% BV increase at same R on • 15 - 20% R on improvement at same BV • MST improves RF switch power handling • Greater than 25% • Provides greater design flexibility • MST improves LNA performance • 8 x better Ioff • Reduce power consumption extending battery life

9 Financial Review * Adjusted EBITDA is a non - GAAP financial measure. A full reconciliation of GAAP and non - GAAP results is contained in our press release. Some figures do not total exactly due to rounding. Q2 '18 Q3 '18 Q4 '18 Q1 '19 Q2 '19 GAAP Results Revenue $0.1M - $0.15M $0.07M $0.07M Gross Profit ($0.02M) - $0.12M $0.07M $0.05M Operating Expense ($3.2M) ($3.5M) ($3.4M) ($3.7M) ($3.8M) Net Loss ($3.2M) ($3.4M) ($3.2M) ($3.5M) ($3.6M) Loss Per Share ($0.26) ($0.28) ($0.22) ($0.24) ($0.24) Reconciliation between GAAP & Non-GAAP Net Loss (GAAP) ($3.2M) ($3.4M) ($3.2M) ($3.5M) ($3.6M) Stock-Based Compensation $0.6M $0.6M $0.6M $0.7M $0.8M Adjusted EBITDA (Non-GAAP)* ($2.6M) ($2.8M) ($2.6M) ($2.9M) ($2.9M) July 31, 2019 Liquidity Actual Cash $18.5M Shares Outstanding 17.1M

Thank You 10