Exhibit 99.1
| 2010 Annual Shareholders’ Meeting May 19, 2010 Alan I. Rothenberg Chairman and Chief Executive Officer 1st Century Bancshares, Inc. Jason P. DiNapoli President and Chief Operating Officer 1st Century Bancshares, Inc. |
| Safe Harbor Statement Certain matters discussed in this presentation may constitute forward-looking statements within the meaning of the “safe harbor” provisions of the Private Securities Litigation Reform Act of 1995. You can find many (but not all) of these statements by looking for words such as “approximates,” “believes,” “expects,” “anticipates,” “estimates,” “intends,” “plans,” “would,” “may” or other similar expressions in this presentation. Forward-looking statements are based upon management’s current expectations and assumptions and speak only as of the date hereof. The actual results of 1st Century Bancshares, Inc., the Company, may differ materially and adversely from those expressed in any forward-looking statements as a result of various factors and uncertainties, including but not limited to, the impact of changes in interest rates, a continued decline in economic conditions, increased competition among financial service providers, the Company’s ability to attract deposit and loan customers, the quality of the Company’s earning assets, government regulations and management’s ability to manage the Company’s operations. The Company’s periodic filings with the U.S. Securities and Exchange Commission discuss the most significant risk factors known to management as of the date of such filings. The Company undertakes no obligation to revise or update any forward-looking statements for any reason. |
| Founded by business people for business people in 2004, 1st Century Bank meets the specific needs of entrepreneurs, professionals and small businesses. Our success has been achieved by providing an extraordinary level of personal service and serving as advocates for our clients to meet every day business needs and solve specific business challenges. 1st Century Bank 1 “I am the Chairman of 1st Century Bank and I have my direct telephone number and my cell phone number on my business card. We are here for our customers when they need us, any time and any place.” Alan I. Rothenberg, Chairman |
| 1st Century Bank Profile Attractive Market Headquartered in Century City – West Los Angeles franchise. Strong demographics; $18 billion in total deposits* in the surrounding five zip codes: 90024; 90025; 90064; 90067 and 90210. Building Relationships 1st Century Bank is committed to building long-term relationships by acting as trusted advisors and client advocates. Big, Small Bank 1st Century Bank offers its customers big money center banking technologies and services with traditional, small community bank-like relationships that serve specific and unique client needs. Exceptional Service We provide an extraordinary level of personal service by acting as advocates for our clients to meet every day business needs and solve specific business challenges. *Source: FDIC as of June 30,2009 computed annually. 2 |
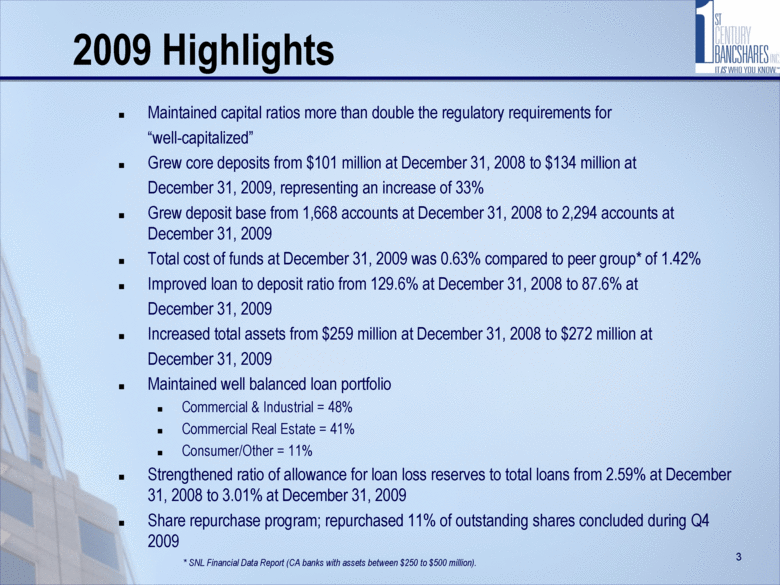
| 2009 Highlights Maintained capital ratios more than double the regulatory requirements for “well-capitalized” Grew core deposits from $101 million at December 31, 2008 to $134 million at December 31, 2009, representing an increase of 33% Grew deposit base from 1,668 accounts at December 31, 2008 to 2,294 accounts at December 31, 2009 Total cost of funds at December 31, 2009 was 0.63% compared to peer group* of 1.42% Improved loan to deposit ratio from 129.6% at December 31, 2008 to 87.6% at December 31, 2009 Increased total assets from $259 million at December 31, 2008 to $272 million at December 31, 2009 Maintained well balanced loan portfolio Commercial & Industrial = 48% Commercial Real Estate = 41% Consumer/Other = 11% Strengthened ratio of allowance for loan loss reserves to total loans from 2.59% at December 31, 2008 to 3.01% at December 31, 2009 Share repurchase program; repurchased 11% of outstanding shares concluded during Q4 2009 3 * SNL Financial Data Report (CA banks with assets between $250 to $500 million). |
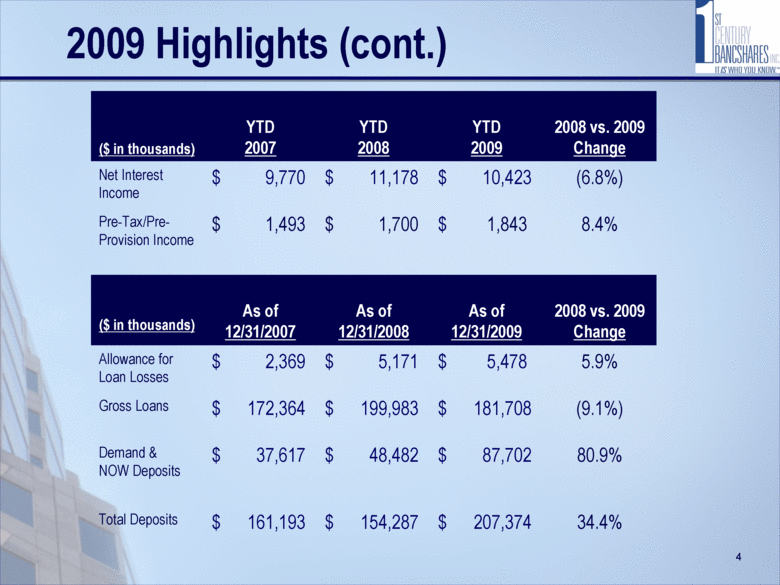
| 2009 Highlights (cont.) ($ in thousands) YTD 2007 YTD 2008 YTD 2009 2008 vs. 2009 Change Net Interest Income $ 9,770 $ 11,178 $ 10,423 (6.8%) Pre-Tax/Pre-Provision Income $ 1,493 $ 1,700 $ 1,843 8.4% ($ in thousands) As of 12/31/2007 As of 12/31/2008 As of 12/31/2009 2008 vs. 2009 Change Allowance for Loan Losses $ 2,369 $ 5,171 $ 5,478 5.9% Gross Loans $ 172,364 $ 199,983 $ 181,708 (9.1%) Demand & NOW Deposits $ 37,617 $ 48,482 $ 87,702 80.9% Total Deposits $ 161,193 $ 154,287 $ 207,374 34.4% 4 |
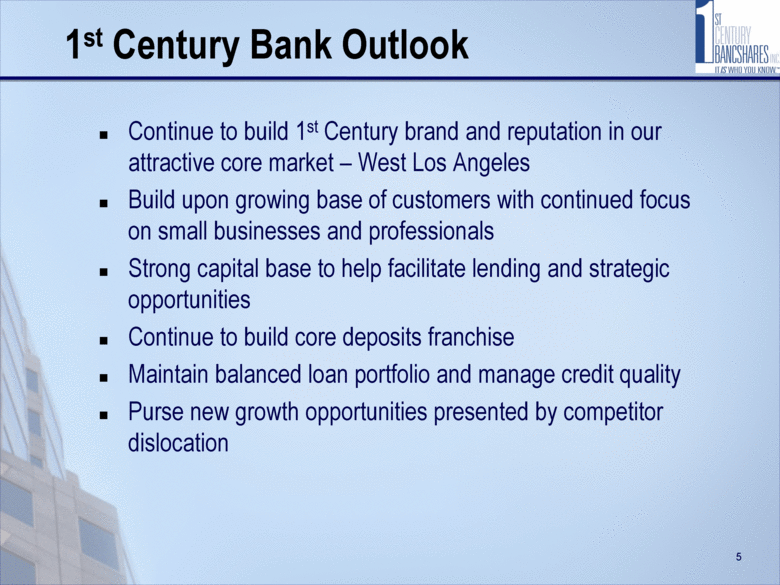
| 1st Century Bank Outlook 5 Continue to build 1st Century brand and reputation in our attractive core market – West Los Angeles Build upon growing base of customers with continued focus on small businesses and professionals Strong capital base to help facilitate lending and strategic opportunities Continue to build core deposits franchise Maintain balanced loan portfolio and manage credit quality Purse new growth opportunities presented by competitor dislocation |
| Financial Overview |
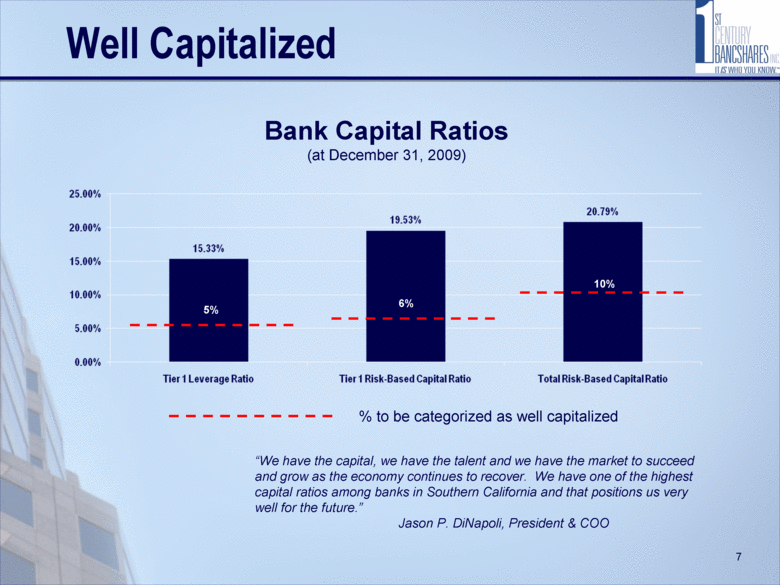
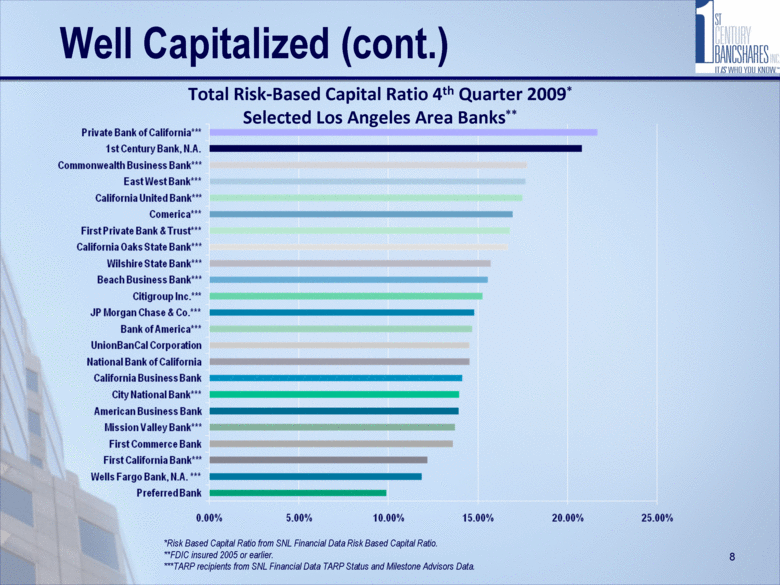
| Well Capitalized Bank Capital Ratios (at December 31, 2009) % to be categorized as well capitalized 7 5% 6% 10% “We have the capital, we have the talent and we have the market to succeed and grow as the economy continues to recover. We have one of the highest capital ratios among banks in Southern California and that positions us very well for the future.” Jason P. DiNapoli, President & COO |
| Well Capitalized (cont.) Total Risk-Based Capital Ratio 4th Quarter 2009* Selected Los Angeles Area Banks** 8 *Risk Based Capital Ratio from SNL Financial Data Risk Based Capital Ratio. **FDIC insured 2005 or earlier. ***TARP recipients from SNL Financial Data TARP Status and Milestone Advisors Data. |
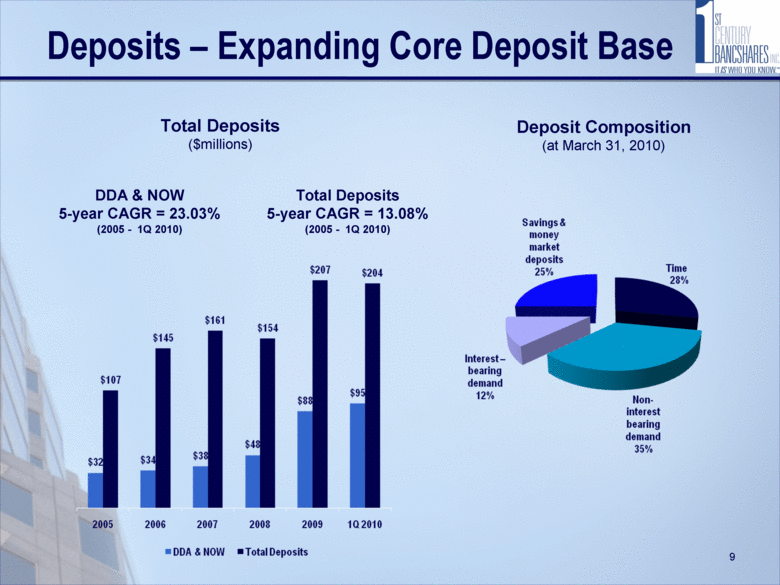
| Deposits – Expanding Core Deposit Base Total Deposits ($millions) Deposit Composition (at March 31, 2010) 9 DDA & NOW 5-year CAGR = 23.03% (2005 - 1Q 2010) Total Deposits 5-year CAGR = 13.08% (2005 - 1Q 2010) |
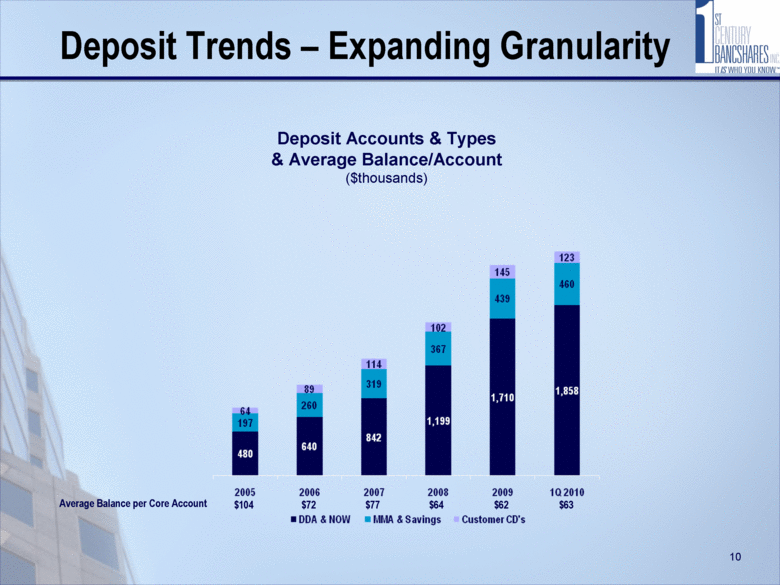
| Deposit Trends – Expanding Granularity Deposit Accounts & Types & Average Balance/Account ($thousands) 10 Average Balance per Core Account $104 $72 $77 $64 $62 $63 |
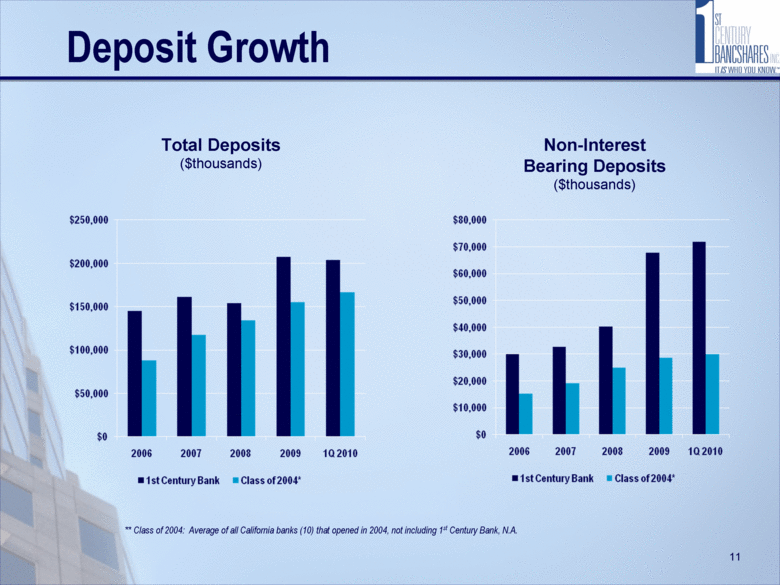
| Deposit Growth ** Class of 2004: Average of all California banks (10) that opened in 2004, not including 1st Century Bank, N.A. 11 Total Deposits ($thousands) Non-Interest Bearing Deposits ($thousands) |
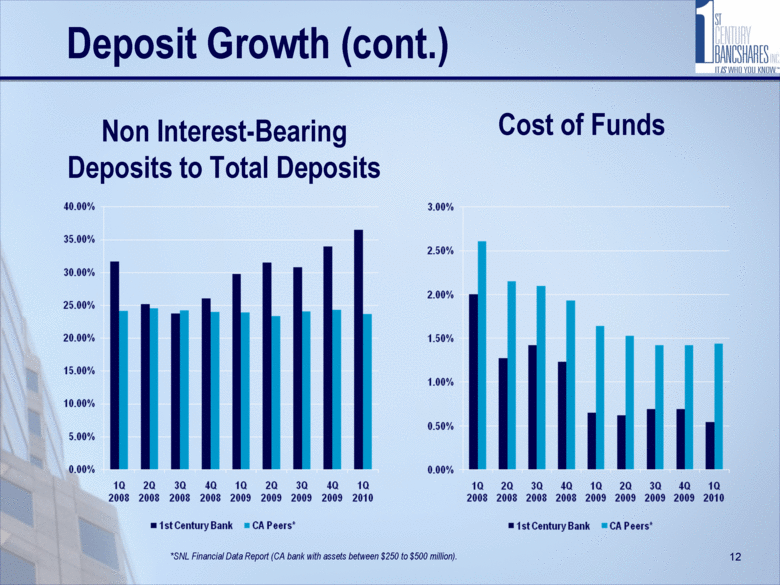
| Non Interest-Bearing Deposits to Total Deposits *SNL Financial Data Report (CA bank with assets between $250 to $500 million). 12 Deposit Growth (cont.) Cost of Funds |
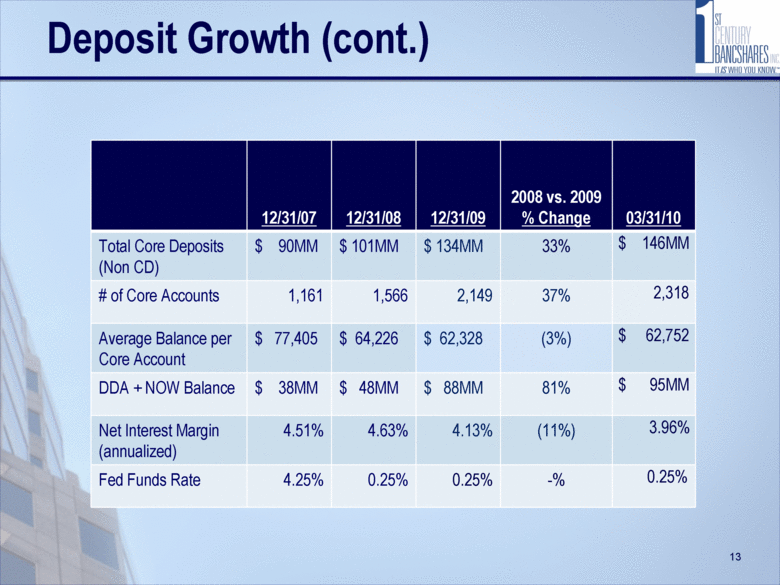
| 12/31/07 12/31/08 12/31/09 2008 vs. 2009 % Change 03/31/10 Total Core Deposits (Non CD) $ 90MM $ 101MM $ 134MM 33% $ 146MM # of Core Accounts 1,161 1,566 2,149 37% 2,318 Average Balance per Core Account $ 77,405 $ 64,226 $ 62,328 (3%) $ 62,752 DDA + NOW Balance $ 38MM $ 48MM $ 88MM 81% $ 95MM Net Interest Margin (annualized) 4.51% 4.63% 4.13% (11%) 3.96% Fed Funds Rate 4.25% 0.25% 0.25% -% 0.25% Deposit Growth (cont.) 13 |
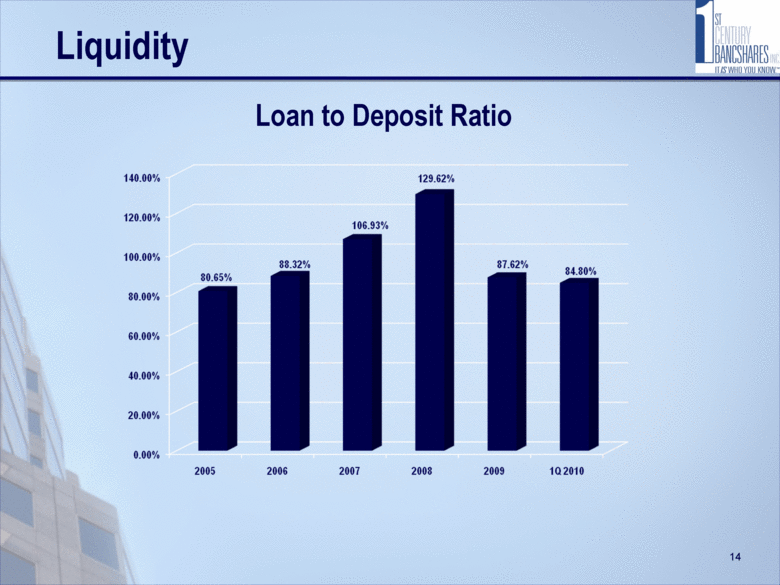
| Loan to Deposit Ratio Liquidity 14 |
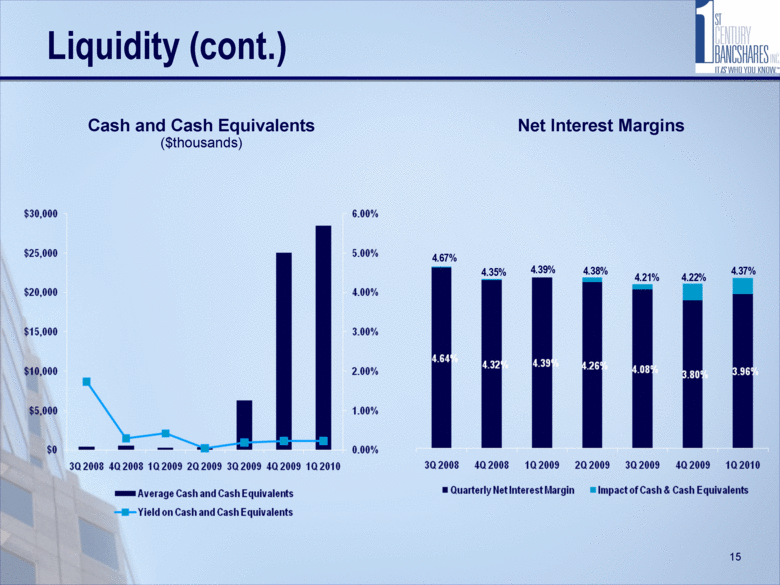
| Liquidity (cont.) ($thousands) 4.67% 4.35% 4.39% 4.38% 4.21% 4.22% 4.37% 15 Cash and Cash Equivalents Net Interest Margins |
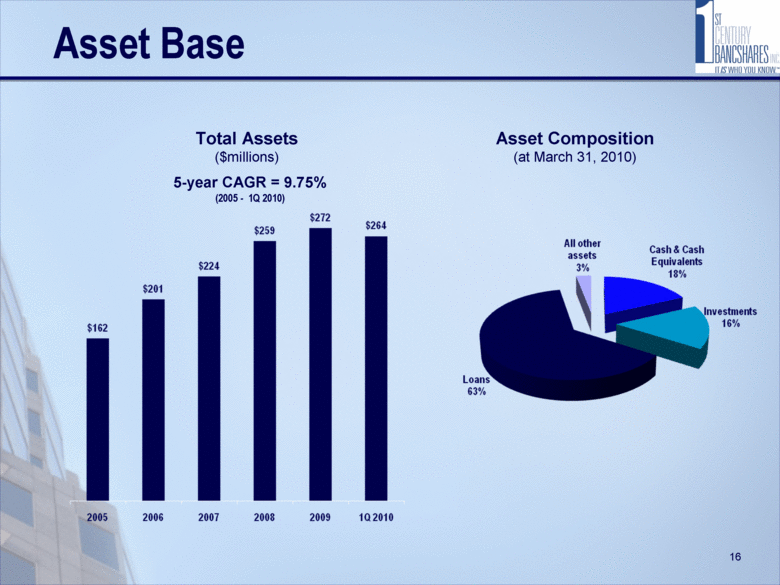
| Asset Base Total Assets ($millions) 5-year CAGR = 9.75% (2005 - 1Q 2010) Asset Composition (at March 31, 2010) 16 |
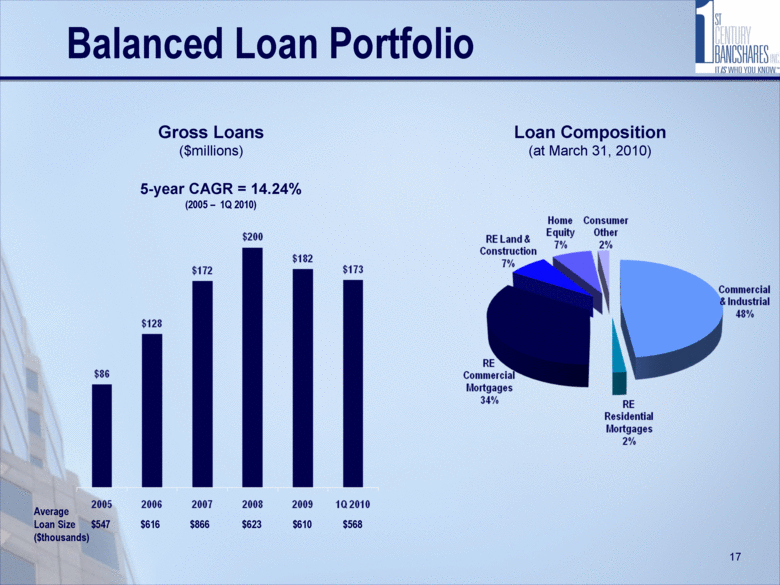
| Balanced Loan Portfolio Gross Loans ($millions) 5-year CAGR = 14.24% (2005 – 1Q 2010) Loan Composition (at March 31, 2010) 17 Average Loan Size ($thousands) $623 $610 $568 $866 $616 $547 |
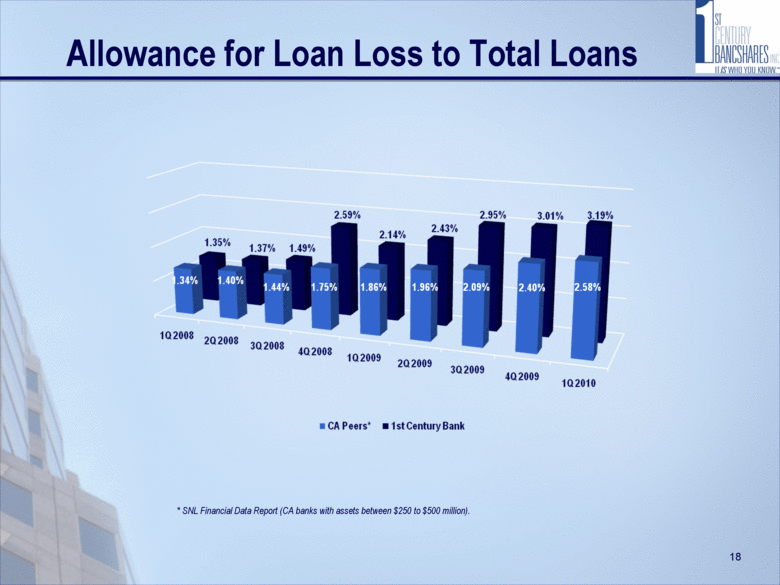
| Allowance for Loan Loss to Total Loans * SNL Financial Data Report (CA banks with assets between $250 to $500 million). 18 |
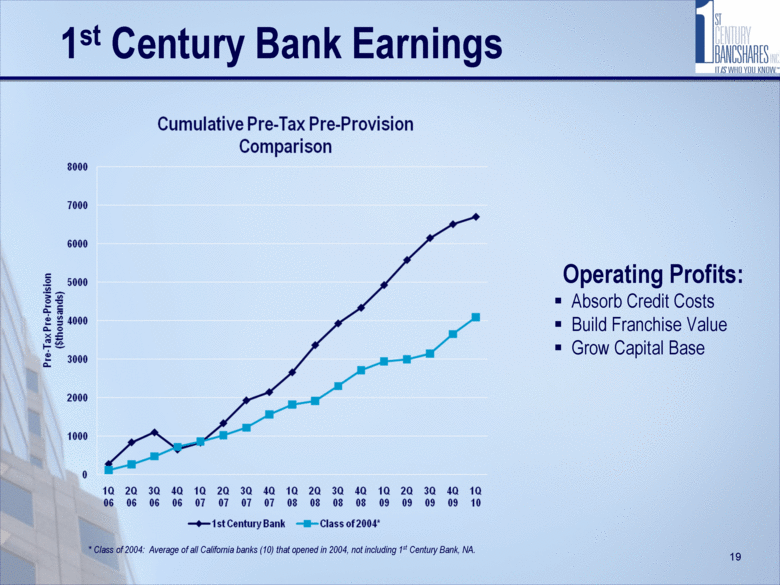
| 1st Century Bank Earnings * Class of 2004: Average of all California banks (10) that opened in 2004, not including 1st Century Bank, NA. Operating Profits: Absorb Credit Costs Build Franchise Value Grow Capital Base 19 |
| Quarterly Net Income (Loss) & Quarterly Pre-tax/Pre-provision Income ($thousands) 20 Operating Results *4Q 2007 results include a $2.1 mm net tax benefit to reverse previously recorded tax valuation allowance. **3Q 2009 results include a $3.4mm tax provision to establish a tax valuation allowance and a $1.7 mm provision for loan losses. 4Q 2008 3Q 2009** 4Q 2009 |
| Program commenced: September 2008 Program approved: Purchase of up to $5 million of common stock 24 month period Program concluded Q4 2009: Purchased shares 1,163,800 % of total outstanding shares 11.1% Average purchase price $4.30 Book value at March 31, 2010 $5.08 Stock Buy Back 21 |
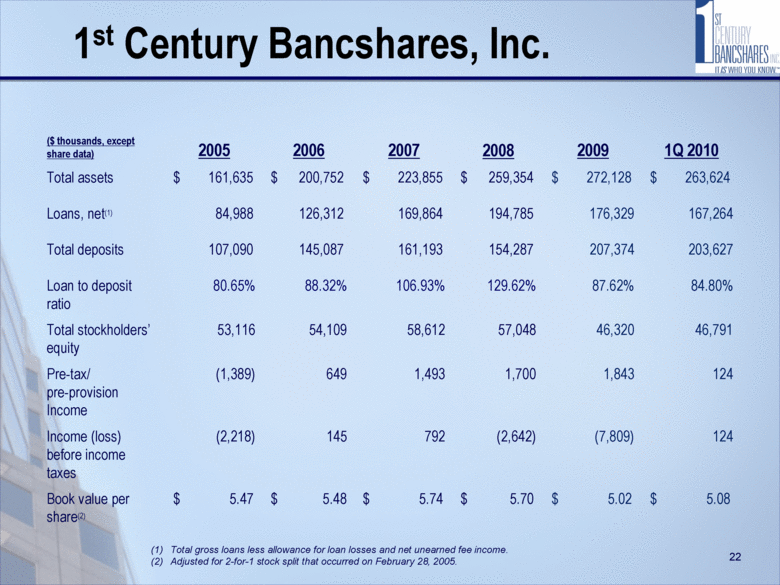
| 1st Century Bancshares, Inc. ($ thousands, except share data) 2005 2006 2007 2008 2009 1Q 2010 Total assets $ 161,635 $ 200,752 $ 223,855 $ 259,354 $ 272,128 $ 263,624 Loans, net(1) 84,988 126,312 169,864 194,785 176,329 167,264 Total deposits 107,090 145,087 161,193 154,287 207,374 203,627 Loan to deposit ratio 80.65% 88.32% 106.93% 129.62% 87.62% 84.80% Total stockholders’ equity 53,116 54,109 58,612 57,048 46,320 46,791 Pre-tax/ pre-provision Income (1,389) 649 1,493 1,700 1,843 124 Income (loss) before income taxes (2,218) 145 792 (2,642) (7,809) 124 Book value per share(2) $ 5.47 $ 5.48 $ 5.74 $ 5.70 $ 5.02 $ 5.08 Total gross loans less allowance for loan losses and net unearned fee income. Adjusted for 2-for-1 stock split that occurred on February 28, 2005. 22 |
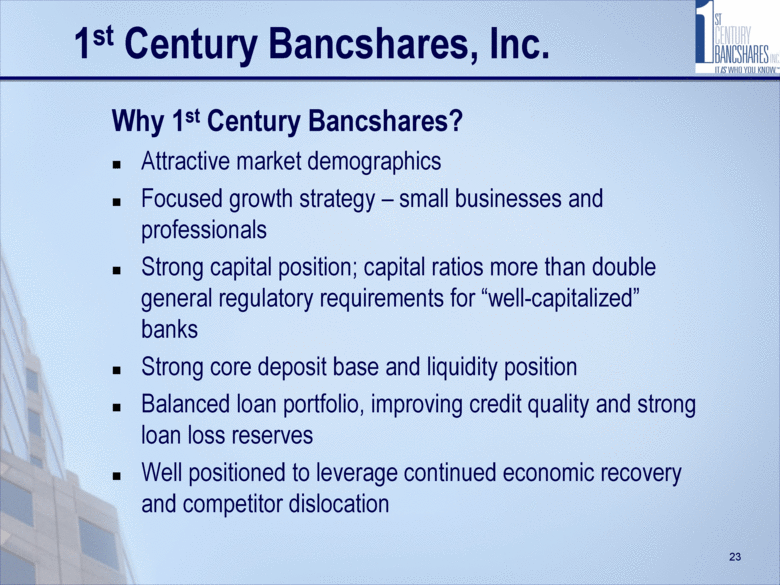
| Why 1st Century Bancshares? Attractive market demographics Focused growth strategy – small businesses and professionals Strong capital position; capital ratios more than double general regulatory requirements for “well-capitalized” banks Strong core deposit base and liquidity position Balanced loan portfolio, improving credit quality and strong loan loss reserves Well positioned to leverage continued economic recovery and competitor dislocation 1st Century Bancshares, Inc. 23 |
| Feel free to reach any of us with any questions. Or better yet, contact us to refer family, friends and colleagues to your family here at 1st Century Bank. Alan I. Rothenberg Chairman & CEO 310.270.9501 Jason DiNapoli President & COO 310.270.9505 Bonnie Rubin SVP, Regional Director 310.270.9511 Rich Rothenberg Managing Director, BD 310.270.9508 Greg Haddad SVP, Relationship Manager 310.270.9524 Justin Weissman AVP, Relationship Manager 310.270.9550 1st Century Bancshares, Inc. 24 |
