1Q 2009 Earnings Call
May 8, 2009
Exhibit 99.2

The following information contains forward-looking statements, including forward-looking statements
within the meaning of the Private Securities Litigation Reform Act of 1995. Such forward-looking
statements include, but are not limited to, statements concerning Colfax's plans, objectives,
expectations and intentions and other statements that are not historical or current facts. Forward-
looking statements are based on Colfax's current expectations and involve risks and uncertainties that
could cause actual results to differ materially from those expressed or implied in such forward-looking
statements. Factors that could cause Colfax's results to differ materially from current expectations
include, but are not limited to factors detailed in Colfax's reports filed with the U.S. Securities and
Exchange Commission as well as its Annual Report on Form 10-K under the caption “Risk Factors”. In
addition, these statements are based on a number of assumptions that are subject to change. This
presentation speaks only as of this date. Colfax disclaims any duty to update the information herein.
Forward-Looking Statements
1

Adjusted net income of $10.4 million (24 cents per share), an increase of 2.1% including
negative currency effects of 5 cents per share
Net sales of $136.3 million, an increase of 4.3% (organic growth of 17.9%)
Adjusted operating income of $17.1 million, a decrease of 6.6% including negative
currency effects of $3.4 million
Adjusted EBITDA of $20.5 million, a decrease of 7.0% including negative currency
effects of $3.7 million
First quarter orders of $120.8 million, a decrease of 33.0% (organic decrease of 25.5%)
Backlog of $305.6 million
Solid performance in Q1 2009
Q1 2009 Highlights
2

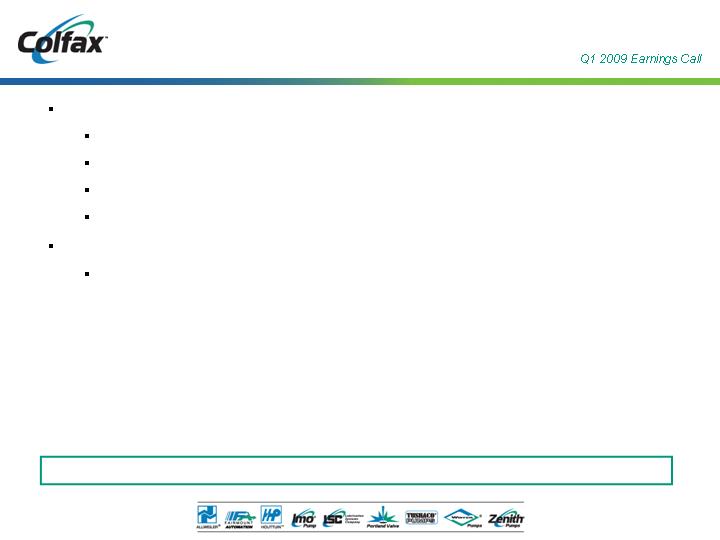
Solid Results for Q1 2009
Organic sales up 18% year over year, down 13% sequentially (Q4 and Q1 seasonally
strongest and weakest, respectively)
Supported by strong backlog entering 2009
Organic sales in four strategic end markets increased 24% to 45%
Commercial marine – up 45%
Oil & gas – up 25%
Power generation – up 24%
Navy – up 32%
General industrial – down 2%
Strong growth in four strategic end markets
Q1 2009 Highlights Continued
3

Global Business Conditions Continued to Weaken in Q1
Organic orders declined 25% year over year, down 3% sequentially
Decline driven by commercial marine (down 57%) and general industrial (down 28%)
Decline in commercial marine orders includes cancellations of $6 million
Weakness in most general industrial submarkets including distribution, chemical
and building products
Power generation – down 12% (due to project timing)
Strong organic order growth in oil & gas (up 22%) and global navy (up 75%)
Weakening economy impacting orders
Q1 2009 Highlights Continued
4

Rightsizing to support declining orders
Organic sales growth over last 3 years (12%, 14% and 14%) supported by CBS initiatives
Able to be flexible in a declining market environment
Initial steps include reduction in temporary and contract workers
Initiated cost reductions worldwide (expect savings of $11 million in 2009)
Reduced headcount by about 5% (approximately 120 associates as of May 1)
European furlough programs begun (approximately 628 associates as of May 1)
Consolidated Aberdeen, NC facility
Severance and asset impairment costs minimal ($0.7 million)
Structuring business to match current conditions
Profit Protection Plans
5

Expect to maintain margins
Discretionary spending curtailed
Evaluating additional cost savings measures; have contingency plans in place
Based on visibility of 4 to 6 months, able to take preemptive actions as needed
CBS activity continues in all areas
Structuring business to match current conditions
Profit Protection Plans Continued
6
2009
Q1
2008
Q1
-
2008
2007
2006
2005
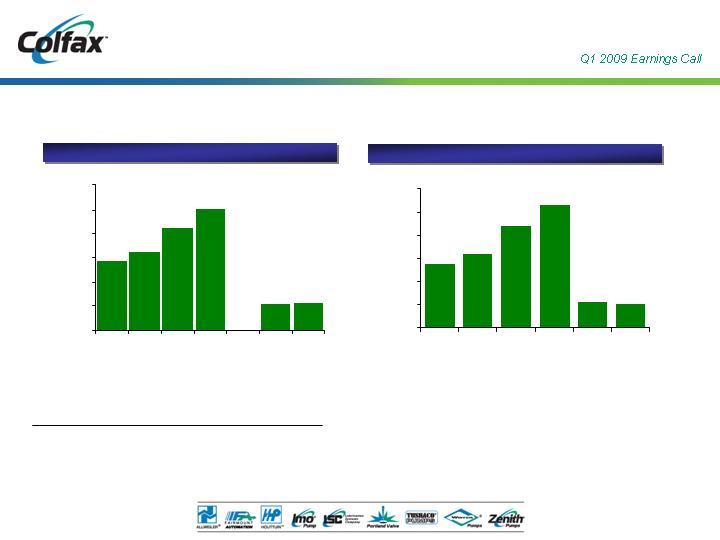
$720.0
$600.0
$480.0
$360.0
$240.0
$120.0
$0.0
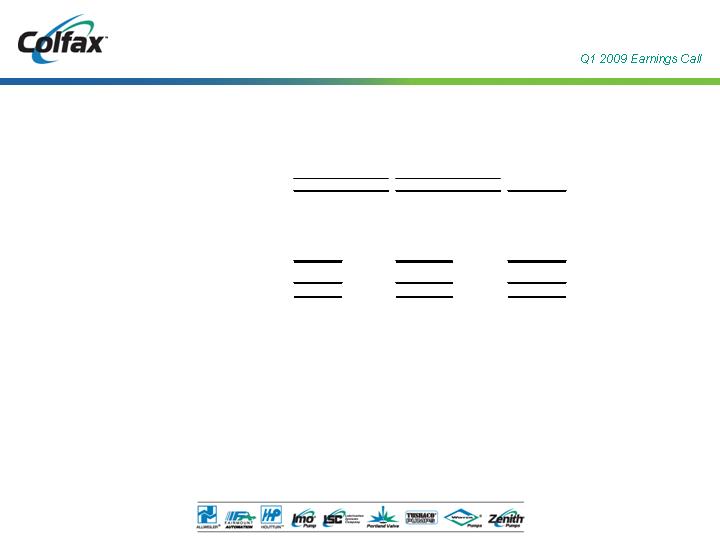
$136.3
$130.7
$604.9
$506.3
$393.6
$345.5
15.0%
16.8%
17.5%
17.4%
16.3%
15.9%
% Margin
--
--
--
--
19.5%
4.5%
1.1%
13.9%
4.3%
--
28.6%
13.9%
Total Growth
(13.6)%
--
7.1%
0.8%
--
FX Translation
--
--
8.0%
1.4%
--
Acquisitions
17.9%
--
13.5%
11.8%
--
Existing
Businesses
Revenue and Adjusted EBITDA
(1) Refer to Appendix for Non-GAAP reconciliation.
__________________
Note: Dollars in millions.
Revenue
Adjusted EBITDA (1)
$54.8
$64.1
$88.2
$105.6
$22.0
$20.5
$0.0
$20.0
$40.0
$60.0
$80.0
$100.0
$120.0
2005
2006
2007
2008
Q1
2008
Q1
2009
7
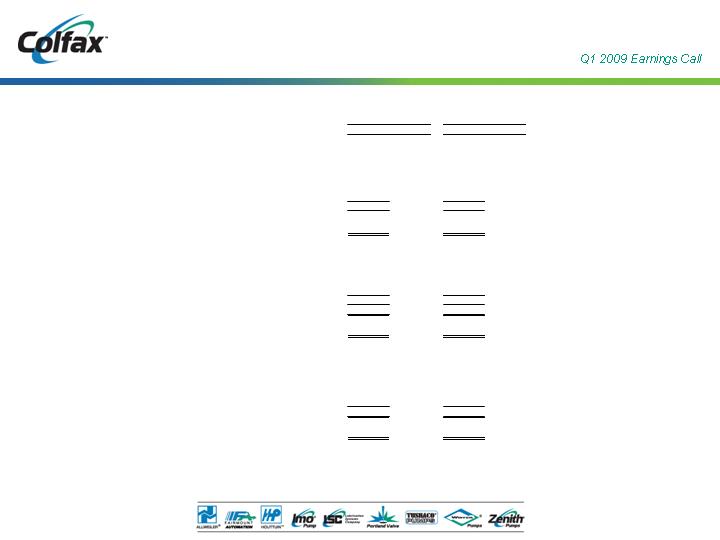
____________________
Note: Dollars in millions.
Q1 2009
Q1 2008
-
2008
2007
2006
2005
$720.0
$600.0
$480.0
$360.0
$240.0
$120.0
$0.0
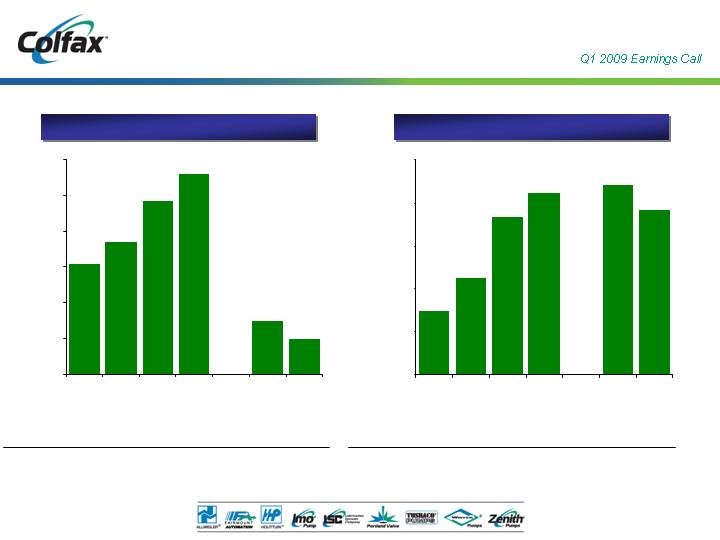
$120.8
$180.3
$669.2
$581.5
$442.3
$370.4
Orders
Backlog
Orders and Backlog
--
--
--
--
15.1%
6.1%
2.0%
7.0%
(33.0)%
--
31.5%
19.4%
Total Growth
(7.5)%
--
7.8%
0.5%
--
FX Translation
--
--
6.1%
1.2%
--
Acquisitions
(25.5)%
--
17.6%
17.7%
--
Existing
Businesses
15.2%
(5.0)%
5.2%
15.0%
(13.6)%
--
63.3%
51.6%
Total Growth
(10.8)%
--
13.1%
12.1%
--
FX Translation
--
--
3.0%
--
--
Acquisitions
(2.8)%
--
47.2%
39.5%
--
Existing
Businesses
$118.3
$179.3
$292.8
$337.3
$353.6
$305.6
$0.0
$80.0
$160.0
$240.0
$320.0
$400.0
2005
2006
2007
2008
-
Q1 2008
Q1 2009
8
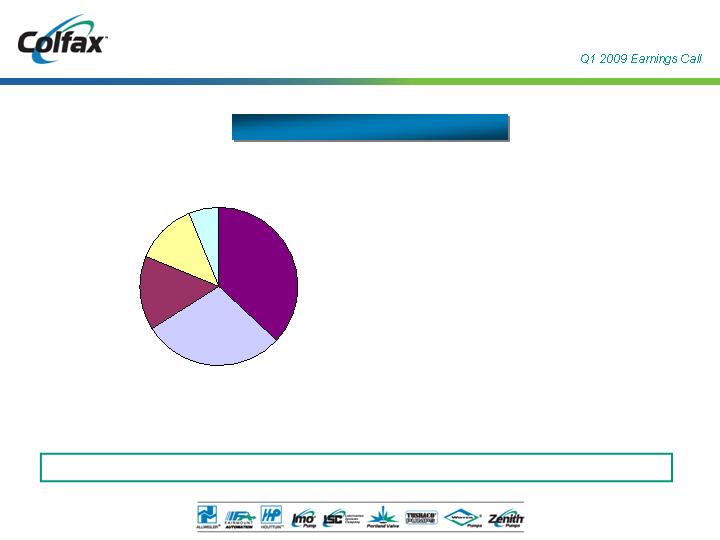
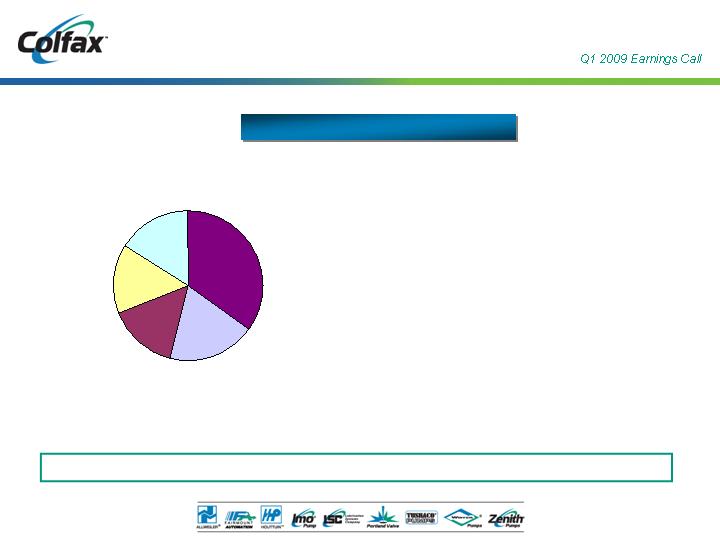
Q1 2009 Sales by End Market
Well positioned in five attractive and diverse end markets
Q1 2009 Sales: $136.3 million
(2)%
18%
(14)%
4%
General Industrial
Total
32%
29%
Global Navy
24%
11%
Power Generation
25%
20%
Oil & Gas
Commercial Marine
45%
21%
Organic Growth
Total Growth
Power
Generation
13%
Oil & Gas
15%
Commercial
Marine
29%
General
Industrial
37%
Global Navy
6%
9
Q1 2009 Orders by End Market
Oil & Gas and Global Navy showing healthy organic growth
Q1 2009 Orders: $120.8 million
(28)%
(25)%
(36)%
(33)%
General Industrial
Total
75%
73%
Global Navy
(12)%
(21)%
Power Generation
22%
16%
Oil & Gas
Commercial Marine
(57)%
(64)%
Organic Growth
Total Growth
Oil & Gas
15%
Commercial
Marine
19%
General
Industrial
35%
Global Navy
16%
Power
Generation
15%
10
Strong balance sheet
Debt to adjusted EBITDA < 1
Debt of $95 million, principal payments of $5 million in 2009, matures in 2013
Cash = $34 million
$130 million available on revolver
Strong cash flow
Adjusted EBITDA (TTM) of $104 million
Strong balance sheet and credit availability provide flexibility
Strong Financial Condition
11
Refer to Appendix for Non-GAAP reconciliation.
__________________
Note: Dollars in millions.
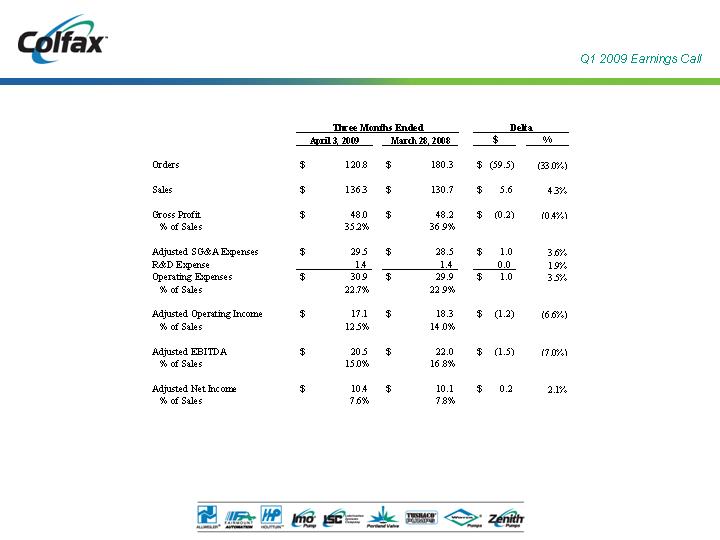
Income Statement Summary
12
____________________
Note: Dollars in millions.
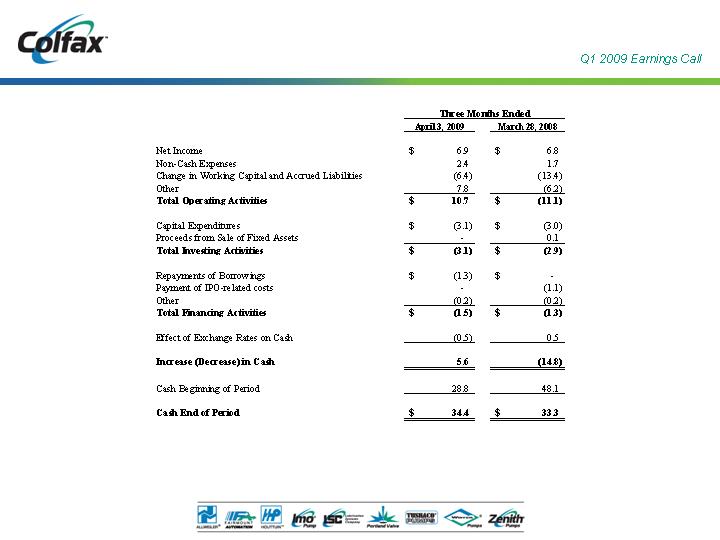
Statement of Cash Flows Summary
13
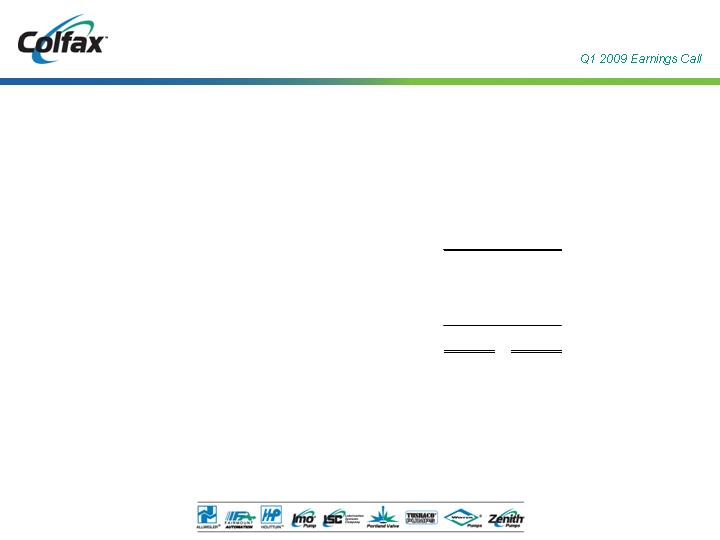
Adjusted EPS for 2009 of $1.00 to $1.07
2009 Outlook Summary
$540 million
to
$525 million
2009 Total
(4)%
to
(2)%
2009 Organic growth (1)
Revenue Range
$1.07
to
$1.00
2009 Adjusted net income per share (2)
$0.76
to
$0.69
2009 Net income per share
EPS Range
(1) Excludes impact of foreign exchange rate fluctuations and acquisitions
(2) Excludes impact of asbestos coverage litigation and asbestos liability and defense costs
(See Appendix for Non-GAAP reconciliation)
$2.5 million
Incremental public company costs
43.3 million
Outstanding shares
$8 million
Interest expense
32%
Tax rate
$1.32
Euro
$7 million
Asbestos liability and defense costs
$12 million
Asbestos coverage litigation
Assumptions
14

Well Positioned for the Future
Leading Brand Names
Generating Aftermarket
Sales and Services
Experienced Management
Team in Place to Grow
Organically and Through
Strategic Acquisitions
Global Leader in Specialty
Fluid Handling Products
Proven Application
Expertise in Solving
Critical Customer Needs
Serving Fast
Growing Infrastructure
Driven End Markets
CBS-Driven Culture Focused
on Profitable Sales Growth
15

Appendix
16

Disclaimer
Adjusted net income, adjusted net income per share, adjusted operating income and adjusted EBITDA exclude
asbestos liability and defense cost (income) and asbestos coverage litigation expense, certain legacy legal
charges, certain due diligence costs, certain severance and asset impairment charges as well as one time initial
public offering-related costs to the extent they impact the periods presented. Adjusted selling, general and
administrative expenses exclude severance and asset impairment costs, certain legacy legal charges and
certain due diligence costs to the extent they impact the periods presented. Adjusted net income also reflects
interest expense as if the initial public offering (IPO) had occurred at the beginning of 2007 and presents income
taxes at an effective tax rate of 32% in 2009 and 34% in 2008. Adjusted net income per share in 2008 assumes
the 44,006,026 shares outstanding at the closing of the IPO to be outstanding since January 1, 2007. Projected
adjusted net income per share excludes asbestos coverage litigation, asbestos liability and defense costs and
severance and asset impairment costs. Organic sales growth and organic order growth (decline) exclude the
impact of foreign exchange rate fluctuations. These non-GAAP financial measures assist Colfax in comparing
its operating performance on a consistent basis because, among other things, they remove the impact of
changes in our capital structure and asset base, non-recurring items such as IPO-related costs, legacy asbestos
issues (except in the case of EBITDA) and items outside the control of its operating management team.
Sales and order information by end market are estimates. We periodically update our customer groupings in
order to refine these estimates. During 2008, reclassifications of previously reported amounts were made to
conform to current period presentation. No changes have been made to total sales or orders.
17
____________________
Note: Dollars in thousands.
Non-GAAP Reconciliation
April 3, 2009
March 28, 2008
EBITDA
Net income
6,861
$
6,798
$
Interest expense
1,846
4,497
Provision for income taxes
3,103
3,578
Depreciation and amortization
3,373
3,695
EBITDA
15,183
$
18,568
$
EBITDA margin
11.1%
14.2%
Adjusted EBITDA
Net income
6,861
$
6,798
$
Interest expense
1,846
4,497
Provision for income taxes
3,103
3,578
Depreciation and amortization
3,373
3,695
Severance and asset impairment costs
661
-
Asbestos liability and defense costs
1,645
278
Asbestos coverage litigation expense
2,966
3,139
Adjusted EBITDA
20,455
$
21,985
$
Adjusted EBITDA margin
15.0%
16.8%
Three Months Ended
18
Non-GAAP Reconciliation
____________________
Note: Dollars in thousands.
2008
2007
2006
2005
EBITDA
Net (loss) income
(571)
$
64,882
$
94
$
12,247
$
Interest expense
11,822
19,246
14,186
9,026
Provision for income taxes
5,438
39,147
3,866
6,907
Depreciation and amortization
14,788
15,239
11,481
11,430
EBITDA
31,477
$
138,514
$
29,627
$
39,610
$
EBITDA margin
5.2%
27.4%
7.5%
11.5%
Adjusted EBITDA
Net (loss) income
(571)
$
64,882
$
94
$
12,247
$
Interest expense
11,822
19,246
14,186
9,026
Provision for income taxes
5,438
39,147
3,866
6,907
Depreciation and amortization
14,788
15,239
11,481
11,430
Legacy asbestos expense (income)
12,391
(50,346)
33,816
18,112
IPO - related costs
57,017
-
-
-
Legacy legal expenses
4,131
-
8,330
3,100
Due diligence costs
582
-
-
-
Other post-employment benefit settlement
-
-
(9,102)
(251)
Cross currency swap
-
-
-
(2,075)
Environmental indemnification
-
-
-
(3,100)
Discontinued operations
-
-
1,397
(616)
Adjusted EBITDA
105,598
$
88,168
$
64,068
$
54,780
$
Adjusted EBITDA margin
17.5%
17.4%
16.3%
15.9%
19

____________________
Note: Dollars in thousands, except per share amounts.
Non-GAAP Reconciliation
April 3, 2009
March 28, 2008
Adjusted Net Income and Adjusted Earnings per Share
Net income
6,861
$
6,798
$
Severance and asset impairment costs
661
-
Asbestos liability and defense costs
1,645
278
Asbestos coverage litigation expense
2,966
3,139
Interest adjustment to effect IPO at beginning of period
-
1,577
Tax adjustment to effective rate of 32% and 34%, respectively
(1,773)
(1,648)
Adjusted net income
10,360
$
10,144
$
Adjusted net income margin
7.6%
7.8%
Weighted average shares outstanding - diluted
43,312,306
-
Shares outstanding at closing of IPO
-
44,006,026
Adjusted net income per share
0.24
$
0.23
$
Net income per share-basic
and diluted in accordance with GAAP
0.16
$
0.31
$
Adjusted Operating Income
Operating income
11,810
$
14,873
$
Severance and asset impairment costs
661
-
Asbestos liability and defense costs
1,645
278
Asbestos coverage litigation expense
2,966
3,139
Adjusted operating income
17,082
$
18,290
$
Adjusted operating income margin
12.5%
14.0%
Three Months Ended
20
____________________
Note: Dollars in thousands.
Non-GAAP Reconciliation
April 3, 2009
March 28, 2008
Adjusted SG&A Expense
Selling, general and administrative expenses
30,187
$
28,507
$
Severance and asset impairment costs
661
-
Adjusted selling, general and administrative expenses
29,526
$
28,507
$
21.7%
21.8%
Three Months Ended
21
____________________
Note: Dollars in millions.
Sales & Order Growth
Backlog
at
$
%
$
%
Period
End
Three Months Ended March 28, 2008
130.7
$
180.3
$
353.6
$
Components of Growth:
Existing Businesses
23.4
17.9%
(45.9)
(25.5%)
(9.8)
(2.8%)
Foreign Currency Translation
(17.8)
(13.6%)
(13.6)
(7.5%)
(38.2)
(10.8%)
Total Growth
5.6
4.3%
(59.5)
(33.0%)
(48.0)
(13.6%)
Three Months Ended April 3, 2009
136.3
$
120.8
$
305.6
$
Sales
Orders
22
Sales & Order Growth
____________________
Note: Dollars in millions.
$
%
$
%
Year Ended December 31, 2005
345.5
$
370.4
$
Components of Growth:
Organic Growth from Existing Businesses
40.7
11.8%
65.6
17.7%
Acquisitions
4.8
1.4%
4.4
1.2%
Foreign Currency Translation
2.6
0.8%
1.9
0.5%
Total Growth
48.1
13.9%
71.9
19.4%
Year Ended December 31, 2006
393.6
$
442.3
$
Components of Growth:
Organic Growth from Existing Businesses
53.3
13.5%
77.7
17.6%
Acquisitions
31.3
8.0%
27.2
6.1%
Foreign Currency Translation
28.1
7.1%
34.3
7.8%
Total Growth
112.7
28.6%
139.2
31.5%
Year Ended December 31, 2007
506.3
$
581.5
$
Components of Growth:
Organic Growth from Existing Businesses
70.2
13.9%
40.9
7.0%
Acquisitions
5.5
1.1%
11.7
2.0%
Foreign Currency Translation
22.9
4.5%
35.1
6.1%
Total Growth
98.6
19.5%
87.7
15.1%
Year Ended December 31, 2008
604.9
$
669.2
$
Sales
Orders
23
Non-GAAP Reconciliation
Projected net income per share - fully diluted
0.69
$
0.76
$
Severance and asset impairment costs *
0.01
0.01
Asbestos coverage litigation
0.19
0.19
Asbestos liability and defense costs
0.11
0.11
Projected adjusted net income per share - fully diluted
$ 1.00
$ 1.07
* Actual costs for first quarter 2009
EPS Range
Colfax Corporation
Reconciliation of Projected 2009 Net Income Per Share to Adjusted Net Income Per Share
Amounts in Dollars
(unaudited)
24