3Q 2009 Preliminary Earnings Call
November 3, 2009
Exhibit 99.2

The preliminary financial results reflect management’s best estimate of the Company’s
net asbestos liability based upon information currently available. The preliminary results
do not reflect any potential adjustments from the favorable asbestos ruling on October
14, 2009 for the Company’s Warren Pumps subsidiary. The Company expects additional
information related to this matter to become available prior to filing its third quarter Form
10-Q with the SEC on or before November 16, 2009. Any adjustments that result from the
Company’s evaluation of this information will be reflected in the Company’s financial
statements included in its third quarter Form 10-Q.
Preliminary Results
1

The following information contains forward-looking statements, including forward-looking statements
within the meaning of the Private Securities Litigation Reform Act of 1995. Such forward-looking
statements include, but are not limited to, statements concerning Colfax's plans, objectives,
expectations and intentions and other statements that are not historical or current facts. Forward-
looking statements are based on Colfax's current expectations and involve risks and uncertainties that
could cause actual results to differ materially from those expressed or implied in such forward-looking
statements. Factors that could cause Colfax's results to differ materially from current expectations
include, but are not limited to factors detailed in Colfax's reports filed with the U.S. Securities and
Exchange Commission as well as its Annual Report on Form 10-K under the caption “Risk Factors”. In
addition, these statements are based on a number of assumptions that are subject to change. This
presentation speaks only as of this date. Colfax disclaims any duty to update the information herein.
Forward-Looking Statements
2

Adjusted net income of $10.0 million (23 cents per share) compared to $12.1 million (28
cents per share) in Q3 2008, including negative currency effects of 1 cent per share
Net sales of $128.5 million compared to $153.5 million in Q3 2008, a decrease of 16.2%
(organic decline of 12.0%)
Adjusted operating income of $16.5 million compared to $20.3 million in Q3 2008,
including negative currency effects of $0.8 million
Adjusted EBITDA of $20.2 million compared to $24.0 million in Q3 2008, including
negative currency effects of $1.0 million
Third quarter orders of $124.3 million compared to $173.8 in Q3 2008, a decrease of
28.5% (organic decline of 25.5%)
Backlog of $298.0 million
Q3 2009 Highlights
3
Lower results for Q3 2009 vs. Q3 2008 but held margin
Organic sales down 12% overall driven by general industrial; strong growth in global navy (up 79%)
and power generation (up 17%)
Gross profit margin up 40 bps to 35.9% and adjusted EBITDA margin held at 15.7%
Global business conditions still weak; seeing signs of improvement
Organic orders declined 26% - commercial marine (down 27%), oil & gas (down 49%), and
general industrial (down 33%)
Weakness in most general industrial submarkets including chemical, machinery
support and building products
Marine cancellations minimal ($0.5 million in Q3 2009)
Organic orders up 15% sequentially, backlog up slightly
Solid increases in commercial marine (up 25%), power generation (up 44%), global
navy (up 55%) and general industrial (up 15%)
Purchased PD-Technik, a provider of commercial marine products and services in
Hamburg, Germany – enhances aftermarket opportunities
Q3 2009 Highlights Continued
4

YTD 2009 Highlights
Adjusted net income of $28.9 million (67 cents per share) compared to $36.2 million
(82 cents per share) in 2008, including negative currency effects of 10 cents per share
Net sales of $394.1 million compared to $445.5 million in 2008, a decrease of 11.6%
(organic decline of 2.5%)
Adjusted operating income of $47.9 million compared to $62.2 million in 2008,
including negative currency effects of $6.4 million
Adjusted EBITDA of $58.5 million compared to $73.5 million in 2008, including
negative currency effects of $7.2 million
Orders of $349.2 million compared to $542.9 million in 2008, a decrease of 35.7%
(organic decline of 29.9%)
5
Continuing to rightsize to align capacity with demand
Major actions since the beginning of the year:
Reduced temporary, contract and full-time employees (approximately 230 associates)
Implemented furlough programs in Germany (approximately 628 associates, 100 full-time
equivalents)
Closed facility in Aberdeen, NC
Closing Sanford, NC facility by year end
Expect savings of about $16 million in 2009, including furlough-related savings
Expect restructuring expenses of about $14 million in 2009 for activities announced to
date
Additional restructuring anticipated in 4Q
Will remain agile and respond as conditions warrant
CBS activity continues in all areas
Profit Protection Plan Update
6
2009
YTD
2008
YTD
-
Q3 2009
Q3 2008
$500.0
$400.0
$300.0
$200.0
$100.0
$0.0
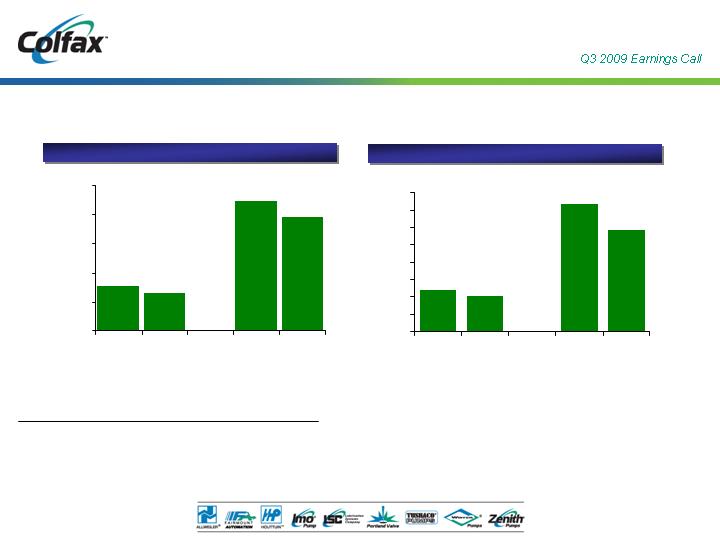
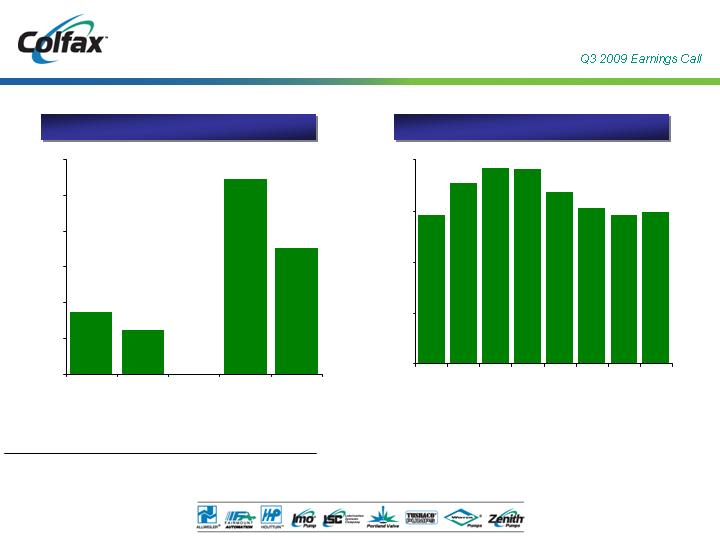
$394.1
$445.5
$128.5
$153.5
14.8%
16.5%
15.7%
15.7%
% Margin
0.1%
--
0.3%
--
Acquisitions
(16.2)%
(4.6)%
(12.0)%
(11.6)%
--
--
Total Growth (Decline)
(9.1)%
--
--
FX Translation
(2.5)%
--
--
Existing Businesses
Revenue and Adjusted EBITDA
(1) Refer to Appendix for Non-GAAP reconciliation.
__________________
Note: Dollars in millions.
Revenue
Adjusted EBITDA (1)
$24.0
$20.2
$73.5
$58.5
$0.0
$10.0
$20.0
$30.0
$40.0
$50.0
$60.0
$70.0
$80.0
Q3 2008
Q3 2009
-
YTD
2008
YTD
2009
7
____________________
Note: Dollars in millions.
YTD 2009
YTD 2008
Q3 2009
Q3 2008
$600.0
$500.0
$400.0
$300.0
$200.0
$100.0
$0.0
$349.2
$542.9
$124.3
$173.8
Orders
Backlog
Orders and Backlog
0.1%
--
0.2%
--
Acquisitions
(35.7)%
--
(28.5)%
Total Growth
(5.8)%
--
(3.2)%
--
FX Translation
(29.9)%
--
(25.5)%
--
Existing
Businesses
$292.8
$353.6
$384.0
$383.1
$337.3
$305.6
$292.3
$298.0
$0.0
$100.0
$200.0
$300.0
$400.0
Q4
2007
Q1
2008
Q2
2008
Q3
2008
Q4
2008
Q1
2009
Q2
2009
Q3
2009
8
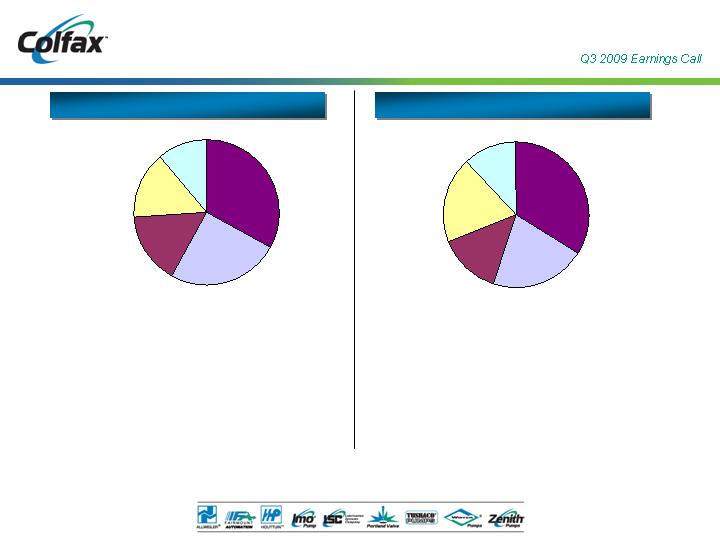
Q3 2009 Sales and Orders by End Market
(12)%
(16)%
Total
(34)%
(36)%
General Industrial
79%
78%
Global Navy
17%
12%
Power Generation
(8)%
(8)%
Oil & Gas
Commercial Marine
(9)%
(18)%
Organic Growth
Total Growth
25%
Marine
Commercial
11%
Global Navy
15%
Generation
Power
16%
Oil & Gas
33%
Industrial
General
Sales: $128.5 million
Orders: $124.3 million
(26)%
(29)%
Total
(33)%
(35)%
General Industrial
59%
55%
Global Navy
(7)%
(9)%
Power Generation
(49)%
(49)%
Oil & Gas
Commercial Marine
(27)%
(33)%
Organic Growth
Total Growth
General
Industrial
34%
Oil & Gas
14%
Power
Generation
19%
Global Navy
12%
Commercial
Marine
21%
9
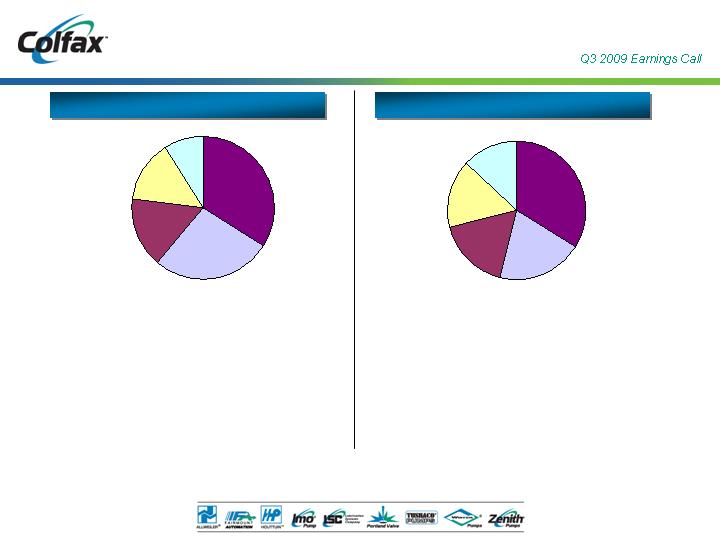
2009 YTD Sales and Orders by End Market
(30)%
(36)%
Total
(35)%
(41)%
General Industrial
32%
29%
Global Navy
(14)%
(20)%
Power Generation
(23)%
(27)%
Oil & Gas
Commercial Marine
(48)%
(56)%
Organic Growth
Total Growth
Orders: $349.2 million
Sales: $394.1 million
9%
Global Navy
14%
Generation
Power
16%
Oil & Gas
27%
Marine
Commercial
34%
Industrial
General
(3)%
(12)%
Total
(21)%
(28)%
General Industrial
46%
43%
Global Navy
-
(8)%
Power Generation
4%
-
Oil & Gas
Commercial Marine
13%
(4)%
Organic Growth
Total Growth
General
Industrial
34%
Commercial
Marine
20%
Oil & Gas
17%
Power
Generation
16%
Global Navy
13%
10
2009 Q3 vs. Q2 Sales and Orders by End Market
(4)%
(0)%
Total
(5)%
(2)%
General Industrial
39%
40%
Global Navy
(2)%
1%
Power Generation
(7)%
(6)%
Oil & Gas
Commercial Marine
(16)%
(8)%
Organic Growth
Total Growth
15%
20%
Total
15%
19%
General Industrial
55%
56%
Global Navy
44%
49%
Power Generation
(28)%
(27)%
Oil & Gas
Commercial Marine
25%
36%
Organic Growth
Total Growth
Sales
Orders
11

Strong balance sheet
Debt to adjusted EBITDA - approximately 1X
Debt of $93 million, principal payments of $9 million in 2010, matures in 2013
Cash = $51 million
$136 million available on revolver
Strong cash flow
Adjusted EBITDA (LTM) of $84 million
Strong Financial Condition
Note: As of 10/2/09
12
Refer to Appendix for Non-GAAP reconciliation.
__________________
Note: Dollars in millions.
Preliminary Income Statement Summary
Three Months Ended
Delta
October 2, 2009
September 26, 2008
$
%
Orders
$ 124.3
$ 173.8
$ (49.5)
(28.5)%
Sales
$ 128.5
$ 153.5
$ (24.9)
(16.2)%
Gross Profit
$ 46.2
$ 54.5
$ (8.3)
(15.2)%
% of Sales
35.9%
35.5%
Adjusted SG&A Expenses
$ 28.1
$ 32.7
$ (4.5)
(13.8)%
R&D Expense
1.5
1.5
0.0
3.0 %
Operating Expenses
$ 29.7
$ 34.1
$ (4.5)
(13.1)%
% of Sales
23.1%
22.2%
Adjusted Operating Income
$ 16.5
$ 20.3
$ (3.8)
(18.7)%
% of Sales
12.9%
13.3%
Adjusted EBITDA
$ 20.2
$ 24.0
$ (3.8)
(15.9)%
% of Sales
15.7%
15.7%
Adjusted Net Income
$ 10.0
$ 12.1
$ (2.1)
(17.6)%
% of Sales
7.8%
7.9%
Adjusted Net Income Per Share
$ 0.23
$ 0.28
$ (0.05)
(16.3)%
13

Preliminary Income Statement Summary
Refer to Appendix for Non-GAAP reconciliation.
__________________
Note: Dollars in millions.
Delta
October 2, 2009
September 26, 2008
$
%
Orders
$ 349.2
$ 542.9
$ (193.7)
(35.7)%
Sales
$ 394.1
$ 445.5
$ (51.5)
(11.6)%
Gross Profit
$ 138.8
$ 159.4
$ (20.6)
(12.9)%
% of Sales
35.2%
35.8%
Adjusted SG&A Expense
$ 86.2
$ 92.8
$ (6.6)
(7.1)%
R&D Expense
4.6
4.4
0.2
4.1 %
Operating Expenses
$ 90.9
$ 97.2
$ (6.4)
(6.6)%
% of Sales
23.1%
21.8%
Adjusted Operating Income
$ 47.9
$ 62.2
$ (14.3)
(23.0)%
% of Sales
12.2%
14.0%
Adusted EBITDA
$ 58.5
$ 73.5
$ (15.0)
(20.4)%
% of Sales
14.8%
16.5%
Adjusted Net Income
$ 28.9
$ 36.2
$ (7.3)
(20.2)%
% of Sales
7.3%
8.1%
Adjusted Net Income Per Share
$ 0.67
$ 0.82
$ (0.16)
(18.9)%
Nine Months Ended
14
____________________
Note: Dollars in millions.
Preliminary Statement of Cash Flows Summary
October 2, 2009
September 26, 2008
Net income (loss)
13.0
$
(11.0)
$
Non-cash expenses
14.0
9.5
Change in working capital and accrued liabilities
6.1
(26.3)
Other
0.9
(2.9)
Total Operating Activities
34.0
$
(30.7)
$
Capital expenditures
(7.8)
$
(13.3)
$
Acquisitions, net of cash acquired
(1.3)
-
Other
0.3
-
��
Total Investing Activities
(8.8)
$
(13.3)
$
Repayments of borrowings
(3.8)
$
(107.8)
$
Proceeds from IPO, net of offering costs
-
193.0
Dividends paid to preferred shareholders
-
(38.5)
Other
(0.4)
(3.4)
Total Financing Activities
(4.2)
$
43.3
$
Effect of exchange rates on cash
1.0
0.5
Increase (decrease) in cash
22.0
(0.2)
Cash, beginning of period
28.8
48.1
Cash, end of period
50.8
$
47.9
$
Nine Months Ended
15
2009 Outlook Summary
$525 million
To
$515 million
2009 Total
(10)%
To
(8)%
2009 Organic growth (1)
Revenue Range
$0.94
To
$0.88
2009 Adjusted net income per share (2)
$0.41
To
$0.35
2009 Net income per share
EPS Range
(1) Excludes impact of acquisitions and foreign exchange rate fluctuations
(2) Excludes impact of asbestos coverage litigation, asbestos liability and defense costs, and restructuring and other related charges
(See Appendix for Non-GAAP reconciliation)
$2.5 million
Incremental public company costs
43.3 million
Outstanding shares
$8 million
Interest expense
32%
Tax rate
$1.46
Euro
$7 million
Asbestos liability and defense costs
$12 million
Asbestos coverage litigation
Assumptions
NOTE: Guidance as of 11/3/09
16
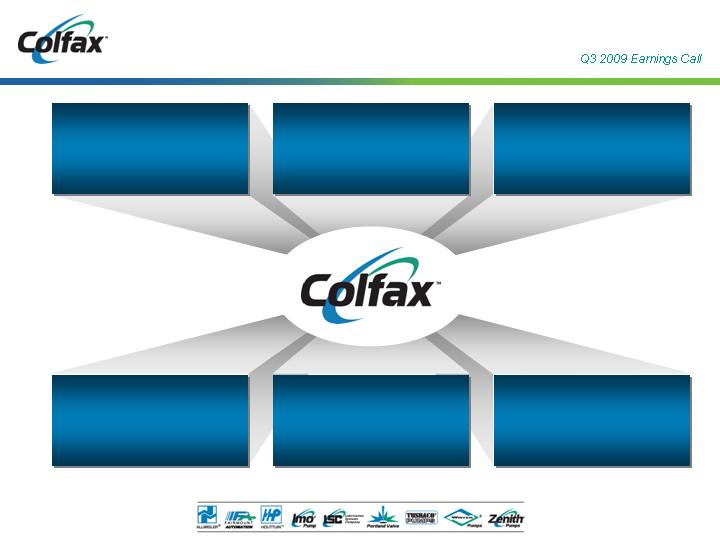
Well Positioned for the Future
Leading Brand Names
Generating Aftermarket
Sales and Services
Experienced Management
Team in Place to Grow
Organically and Through
Strategic Acquisitions
Global Leader in Specialty
Fluid Handling Products
Proven Application
Expertise in Solving
Critical Customer Needs
Serving Fast
Growing Infrastructure
Driven End Markets
CBS-Driven Culture Focused
on Profitable Sales Growth
17

Appendix
18
Adjusted net income, adjusted net income per share, adjusted operating income and adjusted EBITDA exclude
asbestos liability and defense costs (income) and asbestos coverage litigation expenses, certain legacy legal
charges, certain due diligence costs, restructuring and other related charges as well as one time initial public
offering-related costs to the extent they impact the periods presented. Adjusted selling, general and
administrative expenses exclude certain legacy legal adjustments and certain due diligence costs. Adjusted net
income also reflects interest expense as if the initial public offering (IPO) had occurred at the beginning of 2007
and presents income taxes at an effective tax rate of 32% in 2009 and 34% in 2008. Adjusted net income per share
in 2008 assumes the 44,006,026 shares outstanding at the closing of the IPO to be outstanding since January 1,
2007. Projected adjusted net income per share excludes actual and estimated restructuring and other related
charges, asbestos coverage litigation expenses and asbestos liability and defense costs. Organic sales growth
(decline) and organic order growth (decline) exclude the impact of acquisitions and foreign exchange rate
fluctuations. These non-GAAP financial measures assist Colfax in comparing its operating performance on a
consistent basis because, among other things, they remove the impact of changes in our capital structure and
asset base, non-recurring items such as IPO-related costs, legacy asbestos issues (except in the case of EBITDA)
and items outside the control of its operating management team.
Sales and order information by end market are estimates. We periodically update our customer groupings in
order to refine these estimates. During 2009, reclassifications of previously reported amounts were made to
conform to current period presentation. No changes have been made to total sales or orders.
Disclaimer
19
____________________
Note: Dollars in thousands.
Non-GAAP Reconciliation
(Preliminary
1
and unaudited)
October 2, 2009
September 26, 2008
October 2, 2009
September 26, 2008
EBITDA
Net income (loss)
1,819
$
13,651
$
13,046
$
(10,950)
$
Interest expense
1,834
1,951
5,466
9,684
Provision (benefit) for income taxes
64
5,329
5,309
(3,772)
Depreciation and amortization
3,681
3,695
10,592
11,345
EBITDA
7,398
$
24,626
$
34,413
$
6,307
$
EBITDA margin
5.8%
16.0%
8.7%
1.4%
Adjusted EBITDA
Net income (loss)
1,819
$
13,651
$
13,046
$
(10,950)
$
Interest expense
1,834
1,951
5,466
9,684
Provision (benefit) for income taxes
64
5,329
5,309
(3,772)
Depreciation and amortization
3,681
3,695
10,592
11,345
Restructuring and other related charges
9,608
-
10,755
-
IPO-related costs
-
-
-
57,017
Legacy legal adjustment
-
-
-
4,131
Due diligence costs
-
582
-
582
Asbestos liability and defense costs (income)
1,377
(6,312)
4,504
(6,749)
Asbestos coverage litigation expense
1,845
5,148
8,838
12,257
Adjusted EBITDA
20,228
$
24,044
$
58,510
$
73,545
$
Adjusted EBITDA margin
15.7%
15.7%
14.8%
16.5%
1
Three Months Ended
Nine Months Ended
The preliminary financial results as of and for the three and nine months ending October
2
,
2009
reflect management’s best estimate of the Company’s net
asbestos liability based upon information currently available. The preliminary results do not reflect any potential adjustments from the favorable asbestos ruling
on October
14
,
2009
for the Company’s Warren Pumps subsidiary
.
The Company expects additional information related to this matter to become available
prior to filing its third quarter Form
10
-
Q with the SEC on or before November
16
,
2009
.
Any adjustments that result from the Company’s evaluation of this
information will be reflected in the Company’s financial statements included in its third quarter Form
10
-
Q
.
20
____________________
Note: Dollars in thousands, except per share amounts.
Non-GAAP Reconciliation
(Preliminary
1
and unaudited)
October 2, 2009
September 26, 2008
October 2, 2009
September 26, 2008
Adjusted Net Income and Adjusted Earnings per Share
Net income (loss)
1,819
$
13,651
$
13,046
$
(10,950)
$
Restructuring and other related charges
9,608
-
10,755
-
IPO-related costs
-
-
-
57,017
Legacy legal adjustment
-
-
-
4,131
Due diligence costs
-
582
-
582
Asbestos liability and defense costs (income)
1,377
(6,312)
4,504
(6,749)
Asbestos coverage litigation expense
1,845
5,148
8,838
12,257
Interest adjustment to effect IPO at beginning of period
-
-
-
2,302
Tax adjustment to effective rate of 32% and 34%, respectively
(4,644)
(926)
(8,276)
(22,410)
Adjusted net income
10,005
$
12,143
$
28,867
$
36,180
$
Adjusted net income margin
7.8%
7.9%
7.3%
8.1%
Weighted average shares outstanding - diluted
43,324,995
-
43,274,177
-
Shares outstanding at closing of IPO
-
44,006,026
-
44,006,026
Adjusted net income per share
0.23
$
0.28
$
0.67
$
0.82
$
Net income per share-basic
and diluted in accordance with GAAP
0.04
$
0.31
$
0.30
$
(0.43)
$
Adjusted Operating Income
Operating income (loss)
3,717
$
20,931
$
23,821
$
(5,038)
$
Restructuring and other related charges
9,608
-
10,755
-
IPO-related costs
-
-
-
57,017
Legacy legal adjustment
-
-
-
4,131
Due diligence costs
-
582
-
582
Asbestos liability and defense costs (income)
1,377
(6,312)
4,504
(6,749)
Asbestos coverage litigation expense
1,845
5,148
8,838
12,257
Adjusted operating income
16,547
$
20,349
$
47,918
$
62,200
$
Adjusted operating income margin
12.9%
13.3%
12.2%
14.0%
1
Three Months Ended
Nine Months Ended
The preliminary financial results as of and for the three and nine months ending October
2
,
2009
reflect management’s best estimate of the Company’s net asbestos
liability based upon information currently available. The preliminary results do not reflect any potential adjustments from the favorable asbestos ruling on October
14
,
2009
for the Company’s Warren Pumps subsidiary
.
The Company expects additional information related to this matter to become available prior to filing its third
quarter Form
10
-
Q with the SEC on or before November
16
,
2009
.
Any adjustments that result from the Company’s evaluation of this information will be reflected in
the Company’s financial statements included in its third quarter Form
10
-
Q
.
21
____________________
Note: Dollars in millions.
Sales & Order Growth
$
%
$
%
Three Months Ended September 26, 2008
153.5
$
173.8
$
Components of Change:
Existing Businesses
(18.4)
(12.0)%
(44.3)
(25.5)%
Acquisitions
0.5
0.3 %
0.4
0.2 %
Foreign Currency Translation
(7.1)
(4.6)%
(5.6)
(3.2)%
Total
(25.0)
(16.2)%
(49.5)
(28.5)%
Three Months Ended October 2, 2009
128.5
$
124.3
$
Backlog
at
$
%
$
%
Period
End
Nine Months Ended September 26, 2008
445.5
$
542.9
$
383.1
$
Components of Change:
Existing Businesses
(11.4)
(2.5)%
(162.6)
(29.9)%
(83.9)
(21.9)%
Acquisitions
0.5
0.1 %
0.4
0.1 %
0.5
0.1 %
Foreign Currency Translation
(40.5)
(9.1)%
(31.5)
(5.8)%
(1.7)
(0.4)%
Total
(51.4)
(11.6)%
(193.7)
(35.7)%
(85.1)
(22.2)%
Nine Months Ended October 2, 2009
394.1
$
349.2
$
298.0
$
Sales
Orders
Sales
Orders
22
____________________
Note: Dollars in thousands.
Non-GAAP Reconciliation
October 2, 2009
September 26, 2008
October 2, 2009
September 26, 2008
Adjusted SG&A Expense
Selling, general and administrative expenses
28,136
$
33,233
$
86,248
$
97,516
$
Legacy legal adjustment
-
-
-
4,131
Due diligence costs
-
582
-
582
Adjusted selling, general and administrative expenses
28,136
$
32,651
$
86,248
$
92,803
$
21.9%
21.3%
21.9%
20.8%
Three Months Ended
Nine Months Ended
23
Non-GAAP Reconciliation
Projected net income per share - fully diluted
$ 0.35
$ 0.41
Restructuring and other related charges incurred year-to-date
0.17
0.17
Estimated fourth quarter restructuring and other related charges2
0.06
0.06
Asbestos coverage litigation
0.19
0.19
Asbestos liability and defense costs
0.11
0.11
Projected adjusted net income per share - fully diluted
$ 0.88
$ 0.94
1
2
Represents estimated costs related to restructuring actions implemented through November 3, 2009.
EPS Range
Does not reflect any potential adjustments from the favorable asbestos ruling on October 14, 2009 fot the Company’s
Warren Pumps subsidiary. The Company expects additional information related to this matter to become available
prior to filing its third quarter Form 10-Q with the SEC on or before November 16, 2009. Any adjustments that result
from the Company’s evaluation of this information will be reflected in the Company’s financial statements included in
its third quarter Form 10-Q.
Colfax Corporation
Reconciliation of Projected 2009 Net Income Per Share1to Adjusted Net Income Per Share
Amounts in Dollars
(unaudited)
24