
Prepared by February 7, 2012 Fourth Quarter 2011 Earnings Conference Call
2 The following information contains forward - looking statements, including forward - looking statements within the meaning of the Private Securities Litigation Reform Act of 1995. Such forward - looking statements include, but are not limited to, statements concerning Colfax's plans, objectives, expectations and intentions and other statements that are not historical or current facts, including the expected effects of the proposed Charter acquisition, its anticipated benefits and the potential impact on our business. Forward - looking statements are based on Colfax's current expectations and involve risks and uncertainties that could cause actual results to differ materially from those expressed or implied in such forward - looking statements. Factors that could cause Colfax's results to differ materially from current expectations include, but are not limited to, factors detailed in Colfax's reports filed with the U.S. Securities and Exchange Commission including its 2010 Annual Report on Form 10 - K and its Quarterly Report on Form 10 - Q for the period ended September 30, 2011 under the caption “Risk Factors”. In addition, these statements are based on a number of assumptions that are subject to change. This presentation speaks only as of this date. Colfax disclaims any duty to update the information herein. Forward - Looking Statements
3 3 Q4 and Full Year 2011 Results
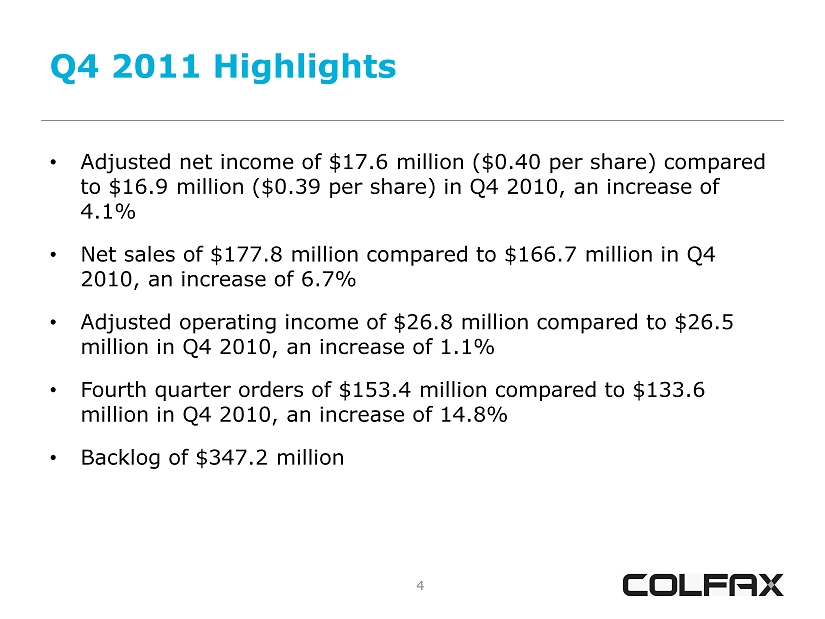
4 Q4 2011 Highlights • Adjusted net income of $17.6 million ($0.40 per share) compared to $16.9 million ($0.39 per share) in Q4 2010, an increase of 4.1% • Net sales of $177.8 million compared to $166.7 million in Q4 2010, an increase of 6.7% • Adjusted operating income of $26.8 million compared to $26.5 million in Q4 2010, an increase of 1.1% • Fourth quarter orders of $153.4 million compared to $133.6 million in Q4 2010, an increase of 14.8% • Backlog of $347.2 million 4
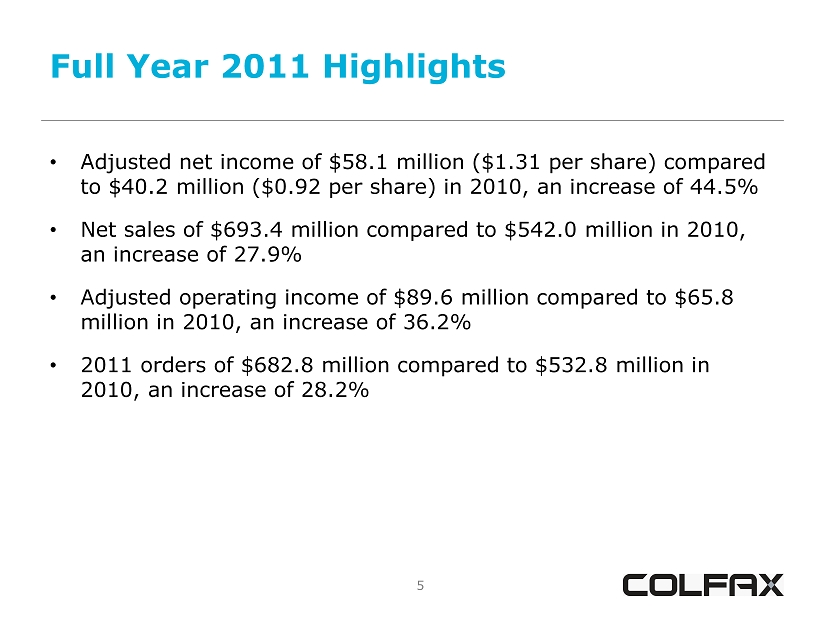
5 Full Year 2011 Highlights • Adjusted net income of $58.1 million ($1.31 per share) compared to $40.2 million ($0.92 per share) in 2010, an increase of 44.5% • Net sales of $693.4 million compared to $542.0 million in 2010, an increase of 27.9% • Adjusted operating income of $89.6 million compared to $65.8 million in 2010, an increase of 36.2% • 2011 orders of $682.8 million compared to $532.8 million in 2010, an increase of 28.2% 5
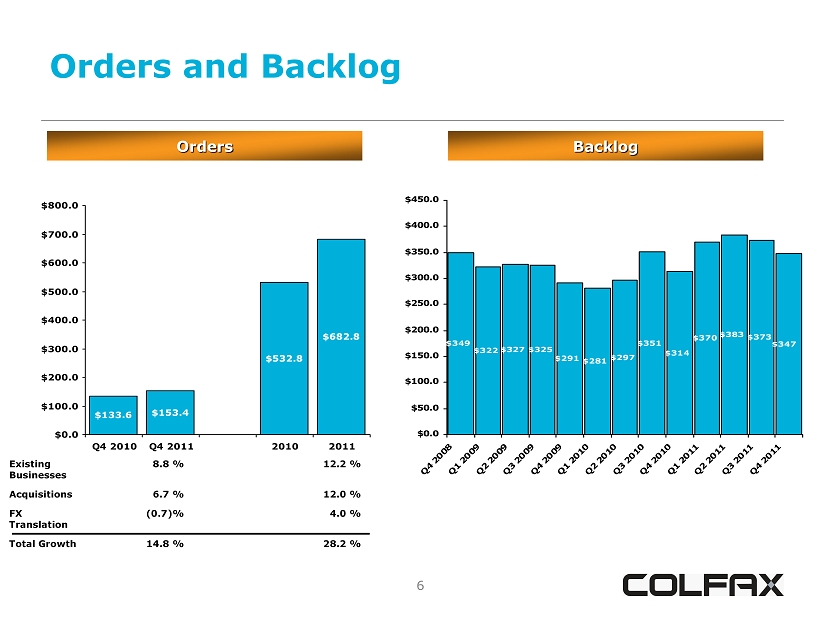
6 Orders and Backlog 6 Orders $133.6 $153.4 $532.8 $682.8 $0.0 $100.0 $200.0 $300.0 $400.0 $500.0 $600.0 $700.0 $800.0 Q4 2010 Q4 2011 2010 2011 Existing Businesses 8.8 % 12.2 % Acquisitions 6.7 % 12.0 % FX Translation (0.7)% 4.0 % Total Growth 14.8 % 28.2 % Backlog $370 $383 $373 $347 $327 $349 $322 $325 $291 $281 $297 $351 $314 $0.0 $50.0 $100.0 $150.0 $200.0 $250.0 $300.0 $350.0 $400.0 $450.0 Q4 2008Q1 2009Q2 2009Q3 2009Q4 2009Q1 2010Q2 2010Q3 2010Q4 2010Q1 2011Q2 2011Q3 2011Q4 2011
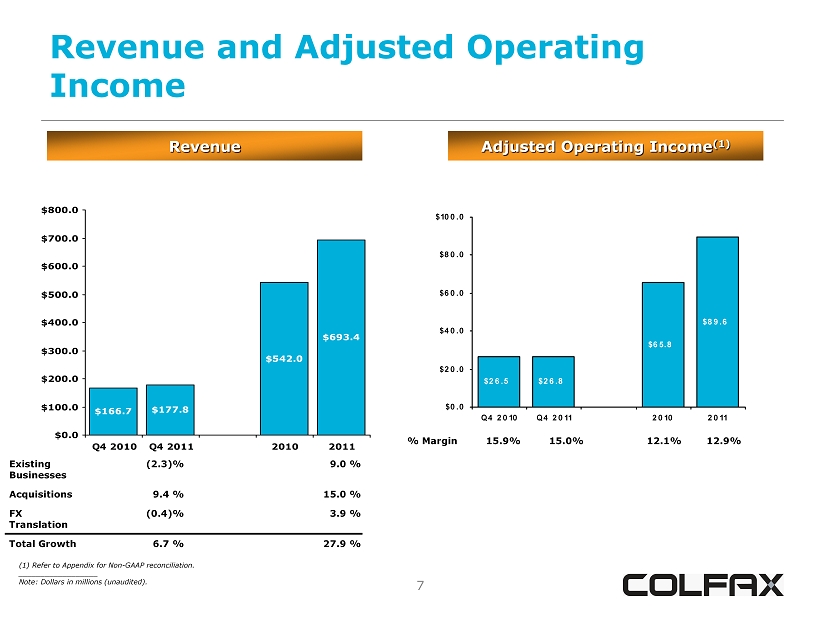
7 Revenue and Adjusted Operating Income 7 Revenue $166.7 $177.8 $542.0 $693.4 $0.0 $100.0 $200.0 $300.0 $400.0 $500.0 $600.0 $700.0 $800.0 Q4 2010 Q4 2011 2010 2011 Existing Businesses (2.3)% 9.0 % Acquisitions 9.4 % 15.0 % FX Translation (0.4)% 3.9 % Total Growth 6.7 % 27.9 % Adjusted Operating Income (1) $26.5 $26.8 $65.8 $89.6 $0.0 $20.0 $40.0 $60.0 $80.0 $100.0 Q4 2010 Q4 2011 2010 2011 % Margin 15.9% 15.0% 12.1% 12.9% (1) Refer to Appendix for Non - GAAP reconciliation. __________________ Note: Dollars in millions (unaudited).
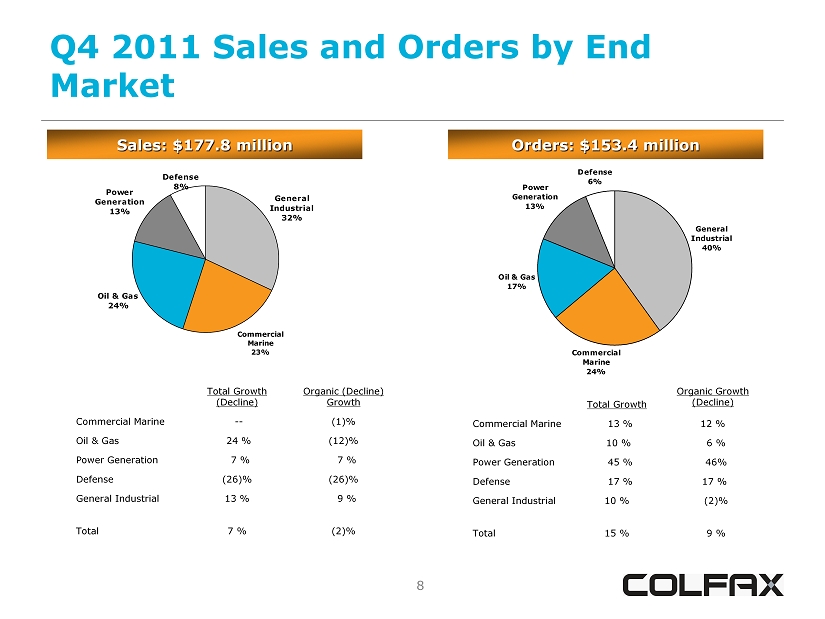
8 Q4 2011 Sales and Orders by End Market 8 Sales: $177.8 million Orders: $153.4 million General Industrial 32% Oil & Gas 24% Power Generation 13% Defense 8% Commercial Marine 23% General Industrial 40% Oil & Gas 17% Power Generation 13% Defense 6% Commercial Marine 24% Total Growth (Decline) Organic (Decline) Growth Commercial Marine -- (1)% Oil & Gas 24 % (12)% Power Generation 7 % 7 % Defense (26)% (26)% General Industrial 13 % 9 % Total 7 % (2)% Total Growth Organic Growth (Decline) Commercial Marine 13 % 12 % Oil & Gas 10 % 6 % Power Generation 45 % 46% Defense 17 % 17 % General Industrial 10 % (2)% Total 15 % 9 %
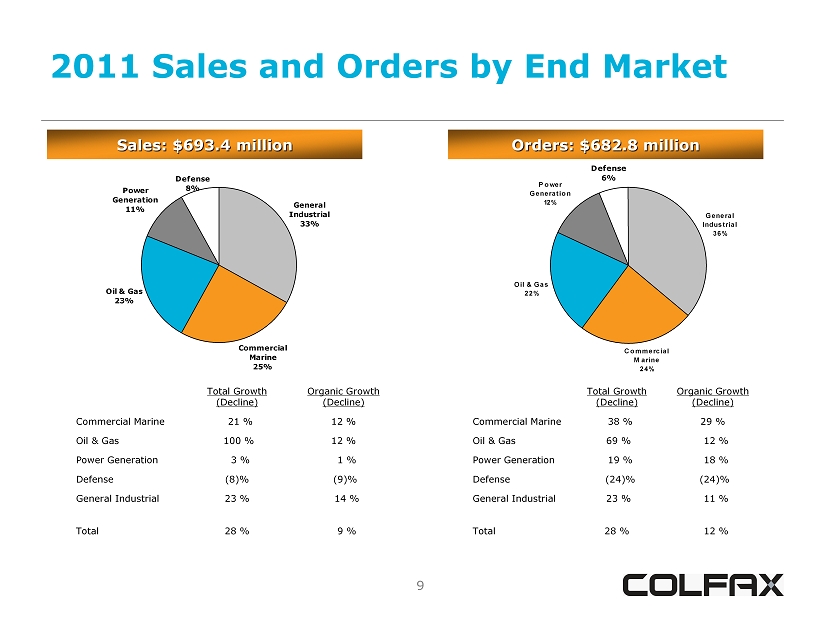
9 2011 Sales and Orders by End Market 9 Sales: $693.4 million Orders: $682.8 million General Industrial 33% Oil & Gas 23% Power Generation 11% Defense 8% Commercial Marine 25% General Industrial 36% Oil & Gas 22% Power Generation 12% Defense 6% Commercial Marine 24% Total Growth (Decline) Organic Growth (Decline) Commercial Marine 21 % 12 % Oil & Gas 100 % 12 % Power Generation 3 % 1 % Defense (8)% (9)% General Industrial 23 % 14 % Total 28 % 9 % Total Growth (Decline) Organic Growth (Decline) Commercial Marine 38 % 29 % Oil & Gas 69 % 12 % Power Generation 19 % 18 % Defense (24)% (24)% General Industrial 23 % 11 % Total 28 % 12 %
10 10 Fluid - Handling End Markets
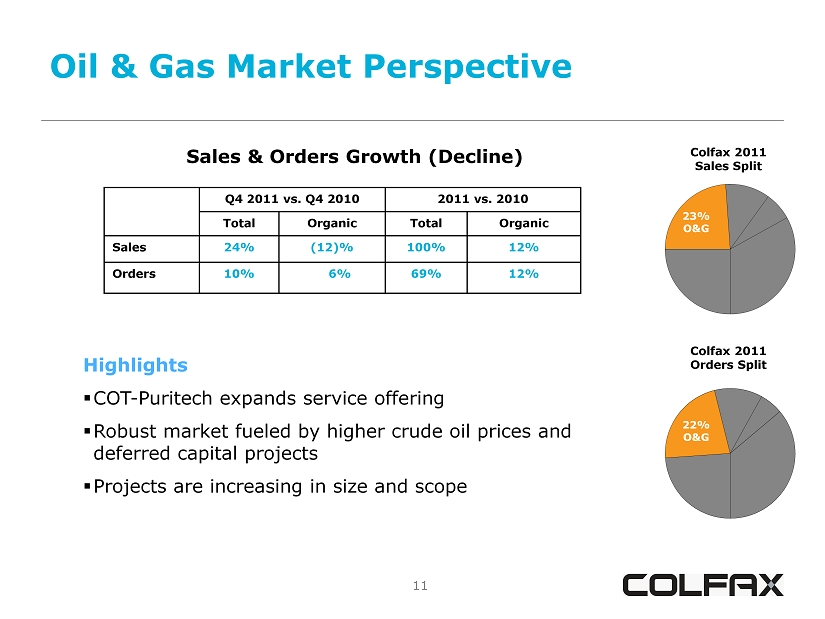
11 Oil & Gas Market Perspective 11 Sales & Orders Growth (Decline) Q4 2011 vs. Q4 2010 2011 vs. 2010 Total Organic Total Organic Sales 24% (12)% 100% 12% Orders 10% 6% 69% 12% Colfax 2011 Sales Split 23% O&G Colfax 2011 Orders Split 22% O&G Highlights ▪ COT - Puritech expands service offering ▪ Robust market fueled by higher crude oil prices and deferred capital projects ▪ Projects are increasing in size and scope
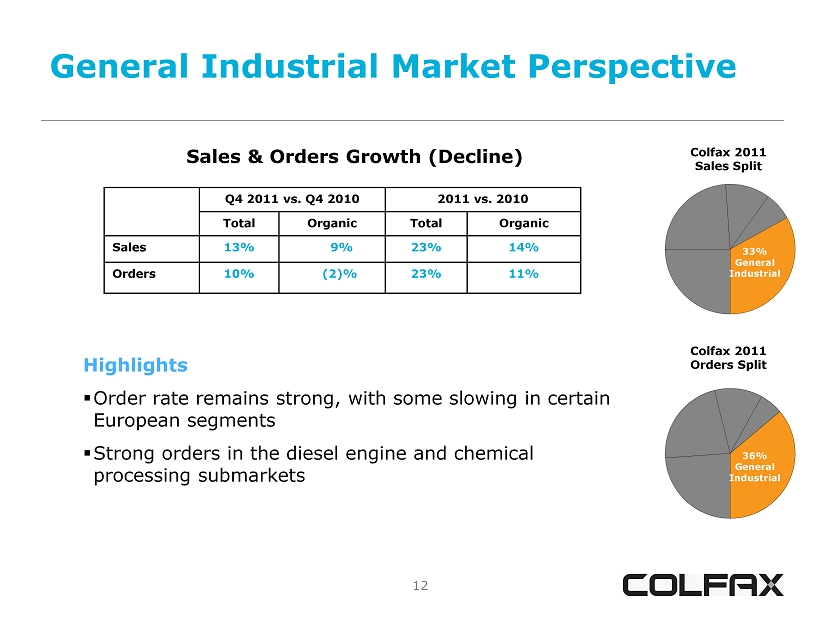
12 General Industrial Market Perspective 12 Sales & Orders Growth (Decline) Q4 2011 vs. Q4 2010 2011 vs. 2010 Total Organic Total Organic Sales 13% 9% 23% 14% Orders 10% (2)% 23% 11% Colfax 2011 Sales Split 33% General Industrial Colfax 2011 Orders Split Highlights ▪ Order rate remains strong, with some slowing in certain European segments ▪ Strong orders in the diesel engine and chemical processing submarkets 36% General Industrial
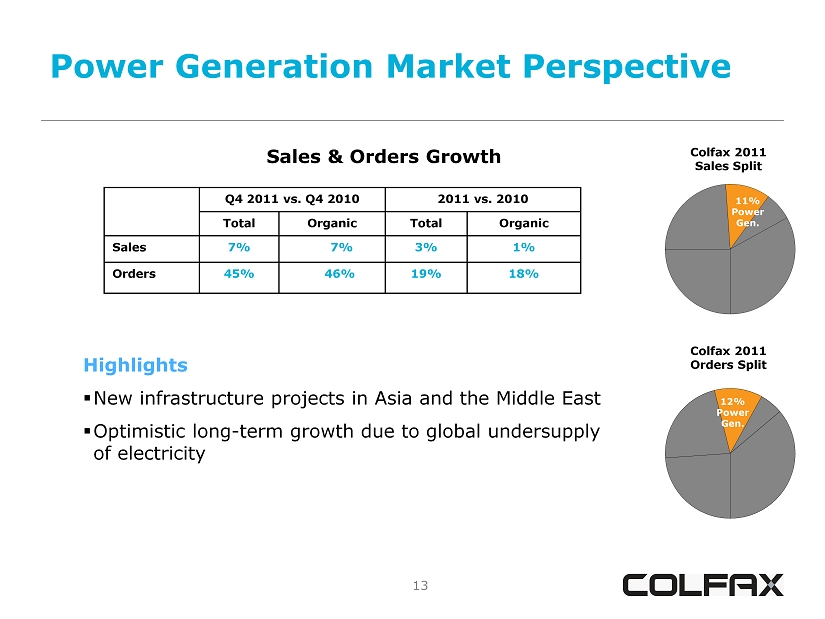
13 Power Generation Market Perspective 13 Sales & Orders Growth Q4 2011 vs. Q4 2010 2011 vs. 2010 Total Organic Total Organic Sales 7% 7% 3% 1% Orders 45% 46% 19% 18% Colfax 2011 Sales Split 11% Power Gen. Colfax 2011 Orders Split Highlights ▪ New infrastructure projects in Asia and the Middle East ▪ Optimistic long - term growth due to global undersupply of electricity 12% Power Gen.
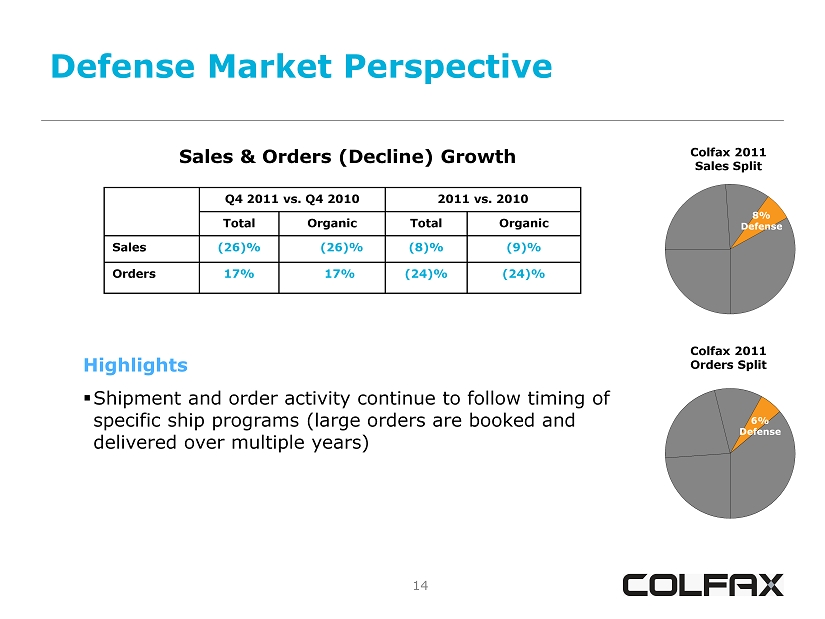
14 Defense Market Perspective 14 Sales & Orders (Decline) Growth Q4 2011 vs. Q4 2010 2011 vs. 2010 Total Organic Total Organic Sales (26)% (26)% (8)% (9)% Orders 17% 17% (24)% (24)% Colfax 2011 Sales Split 8% Defense Colfax 2011 Orders Split Highlights ▪ Shipment and order activity continue to follow timing of specific ship programs (large orders are booked and delivered over multiple years) 6% Defense
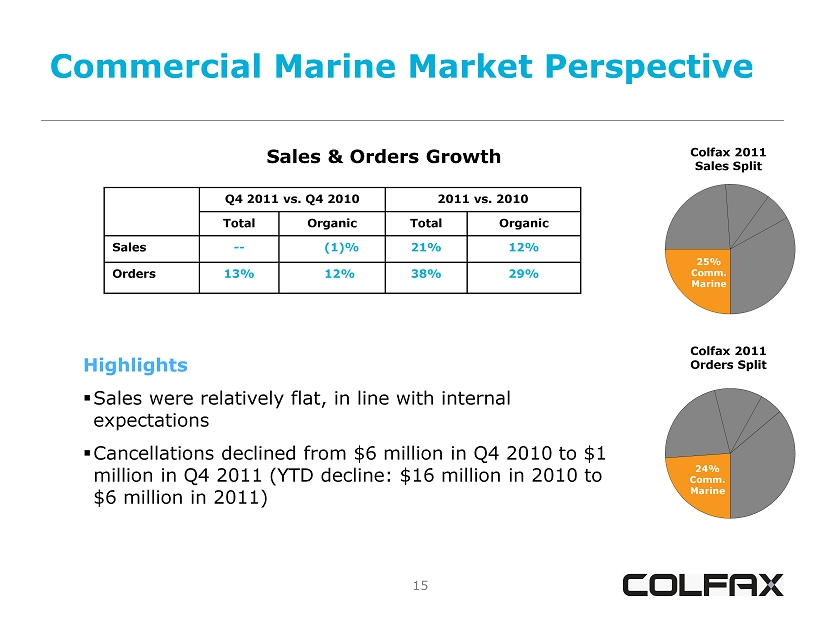
15 Commercial Marine Market Perspective 15 Sales & Orders Growth Q4 2011 vs. Q4 2010 2011 vs. 2010 Total Organic Total Organic Sales -- (1)% 21% 12% Orders 13% 12% 38% 29% Colfax 2011 Sales Split 25% Comm. Marine Colfax 2011 Orders Split Highlights ▪ Sales were relatively flat, in line with internal expectations ▪ Cancellations declined from $6 million in Q4 2010 to $1 million in Q4 2011 (YTD decline: $16 million in 2010 to $6 million in 2011) 24% Comm. Marine

16 16 Howden and ESAB Update
17 Charter Acquisition Update • Transaction successfully closed on January 13 th • Initial focus at Howden: – Intensify focus of lean – Streamline functions and simplify organizational structure – Leverage existing best practice models – Deploy CBS and improve our value - added selling capability • Initial focus at ESAB: – Building the best team – Provide Voice of Customer - based products and services to regional end markets – Align organization strategically and structurally – Leverage global resources – Deploy CBS and provide exceptional customer service 17
18 18 Results of Operations
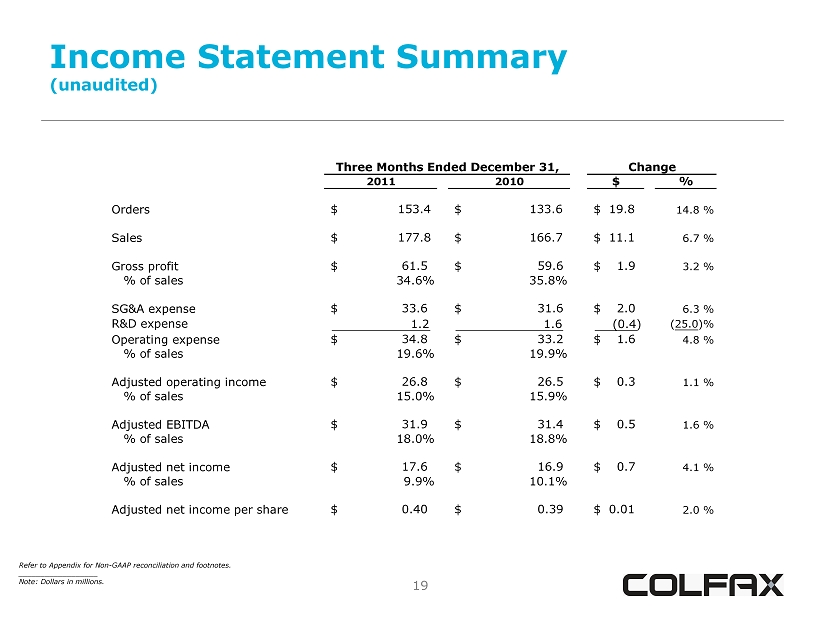
19 Income Statement Summary (unaudited) 19 Refer to Appendix for Non - GAAP reconciliation and footnotes. __________________ Note: Dollars in millions. Change 2011 2010 $ % Orders $ 153.4 $ 133.6 $ 19.8 14.8 % Sales $ 177.8 $ 166.7 $ 11.1 6.7 % Gross profit $ 61.5 $ 59.6 $ 1.9 3.2 % % of sales 34.6% 35.8% SG&A expense $ 33.6 $ 31.6 $ 2.0 6.3 % R&D expense 1.2 1.6 (0.4) (25.0)% Operating expense $ 34.8 $ 33.2 $ 1.6 4.8 % % of sales 19.6% 19.9% Adjusted operating income $ 26.8 $ 26.5 $ 0.3 1.1 % % of sales 15.0% 15.9% Adjusted EBITDA $ 31.9 $ 31.4 $ 0.5 1.6 % % of sales 18.0% 18.8% Adjusted net income $ 17.6 $ 16.9 $ 0.7 4.1 % % of sales 9.9% 10.1% Adjusted net income per share $ 0.40 $ 0.39 $ 0.01 2.0 % Three Months Ended December 31,
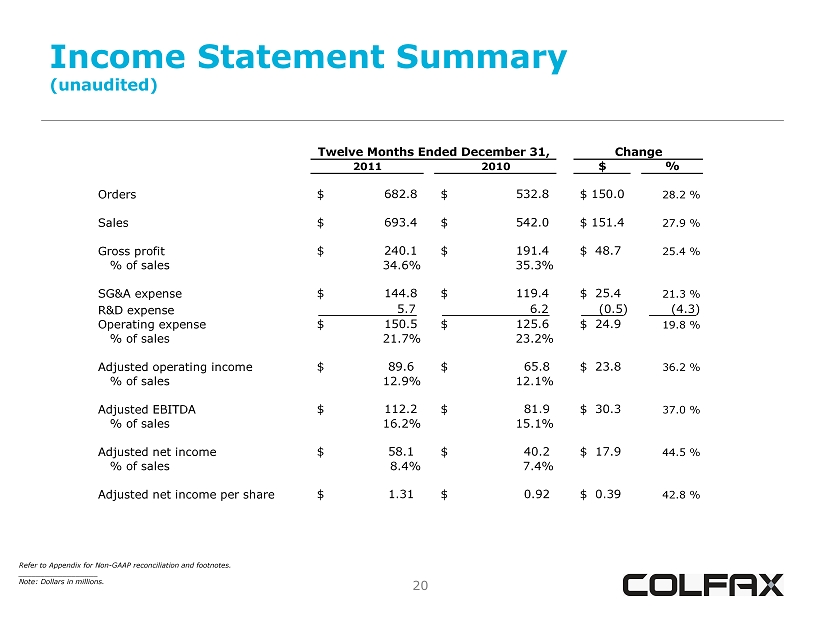
20 Income Statement Summary (unaudited) 20 Refer to Appendix for Non - GAAP reconciliation and footnotes. __________________ Note: Dollars in millions. Twelve Months Ended December 31, Change 2011 2010 $ % Orders $ 682.8 $ 532.8 $ 150.0 28.2 % Sales $ 693.4 $ 542.0 $ 151.4 27.9 % Gross profit $ 240.1 $ 191.4 $ 48.7 25.4 % % of sales 34.6% 35.3% SG&A expense $ 144.8 $ 119.4 $ 25.4 21.3 % R&D expense 5.7 6.2 (0.5) (4.3) Operating expense $ 150.5 $ 125.6 $ 24.9 19.8 % % of sales 21.7% 23.2% Adjusted operating income $ 89.6 $ 65.8 $ 23.8 36.2 % % of sales 12.9% 12.1% Adjusted EBITDA $ 112.2 $ 81.9 $ 30.3 37.0 % % of sales 16.2% 15.1% Adjusted net income $ 58.1 $ 40.2 $ 17.9 44.5 % % of sales 8.4% 7.4% Adjusted net income per share $ 1.31 $ 0.92 $ 0.39 42.8 %
21 21 Appendix
22 Disclaimer 22 Colfax has provided financial information that has not been prepared in accordance with GAAP. These non - GAAP financial measures are adjusted net income, adjusted net income per share, projected adjusted net income per share, adjusted operating income, earnings before interest, taxes and depreciation (EBITDA), adjusted EBITDA, organic sales growth and organic order growth. Adjusted net income, adjusted net income per share, adjusted EBITDA and adjusted operating income exclude asbestos liability and defense costs and asbestos coverage litigation expenses, restructuring and other related charges, and beginning in Q3 2011, charges related to the Charter acquisition to the extent they impact the periods presented. Projected adjusted net income per share reflects Colfax’s definition beginning in 2012, which includes asbestos liability and defense costs and restructuring programs that are considered normal improvements to our operating process, but excludes asbestos coverage litigation expense, expenses related to major restructuring programs at Charter or any additional structural changes announced in the future, expenses related to the Charter acquisition and significant year - one fair value adjustment amortization expense in excess of the normal straight - line expense that will continue. The effective tax rates used to calculate adjusted net income, adjusted net income per share and projected adjusted net income per share are 30.5% for the full year and Q4 periods of 2011 in comparison to 32% for both the full year and Q4 periods of 2010. Organic sales growth and organic order growth exclude the impact of acquisitions and foreign exchange rate fluctuations. These non - GAAP financial measures assist Colfax in comparing its operating performance on a consistent basis because, among other things, they remove the impact of legacy asbestos issues, costs related to the Charter acquisition and items outside the control of its operating management. Sales and order information by end market are estimates. We periodically update our customer groupings order to refine these estimates.
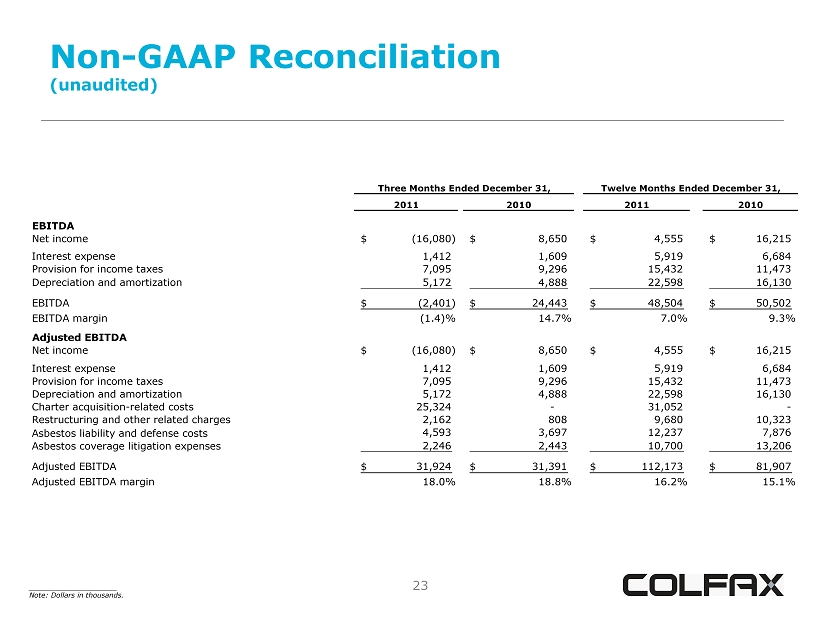
23 Non - GAAP Reconciliation (unaudited) ____________________ Note: Dollars in thousands. 2011 2010 2011 2010 EBITDA Net income (16,080)$ 8,650$ 4,555$ 16,215$ Interest expense 1,412 1,609 5,919 6,684 Provision for income taxes 7,095 9,296 15,432 11,473 Depreciation and amortization 5,172 4,888 22,598 16,130 EBITDA (2,401)$ 24,443$ 48,504$ 50,502$ EBITDA margin (1.4)% 14.7% 7.0% 9.3% Adjusted EBITDA Net income (16,080)$ 8,650$ 4,555$ 16,215$ Interest expense 1,412 1,609 5,919 6,684 Provision for income taxes 7,095 9,296 15,432 11,473 Depreciation and amortization 5,172 4,888 22,598 16,130 Charter acquisition-related costs 25,324 - 31,052 - Restructuring and other related charges 2,162 808 9,680 10,323 Asbestos liability and defense costs 4,593 3,697 12,237 7,876 Asbestos coverage litigation expenses 2,246 2,443 10,700 13,206 Adjusted EBITDA 31,924$ 31,391$ 112,173$ 81,907$ Adjusted EBITDA margin 18.0% 18.8% 16.2% 15.1% Three Months Ended December 31, Twelve Months Ended December 31,
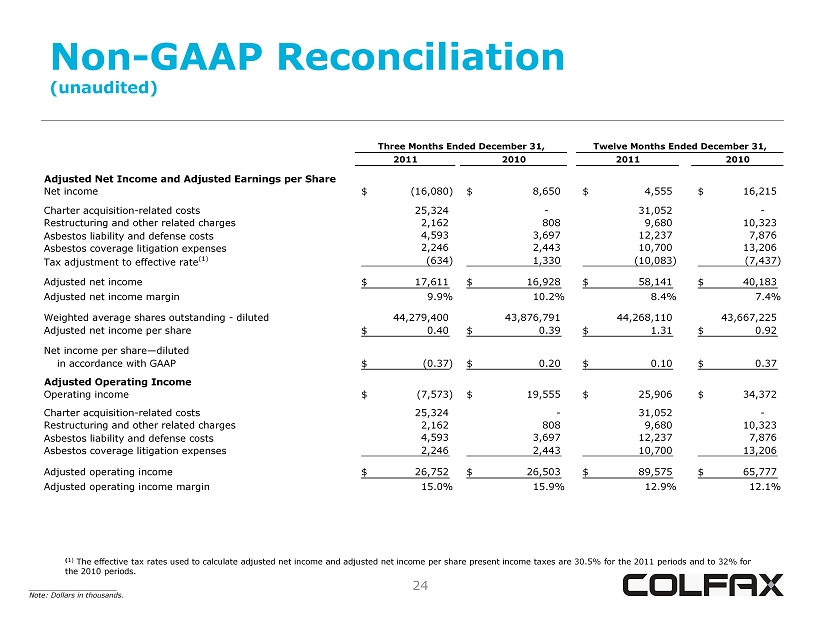
24 Non - GAAP Reconciliation (unaudited) ____________________ Note: Dollars in thousands. ( 1) The effective tax rates used to calculate adjusted net income and adjusted net income per share present income taxes are 30.5 % for the 2011 periods and to 32% for the 2010 periods. 2011 2010 2011 2010 Adjusted Net Income and Adjusted Earnings per Share Net income (16,080)$ 8,650$ 4,555$ 16,215$ Charter acquisition-related costs 25,324 - 31,052 - Restructuring and other related charges 2,162 808 9,680 10,323 Asbestos liability and defense costs 4,593 3,697 12,237 7,876 Asbestos coverage litigation expenses 2,246 2,443 10,700 13,206 Tax adjustment to effective rate (1) (634) 1,330 (10,083) (7,437) Adjusted net income 17,611$ 16,928$ 58,141$ 40,183$ Adjusted net income margin 9.9% 10.2% 8.4% 7.4% Weighted average shares outstanding - diluted 44,279,400 43,876,791 44,268,110 43,667,225 Adjusted net income per share 0.40$ 0.39$ 1.31$ 0.92$ Net income per share—diluted in accordance with GAAP (0.37)$ 0.20$ 0.10$ 0.37$ Adjusted Operating Income Operating income (7,573)$ 19,555$ 25,906$ 34,372$ - Charter acquisition-related costs 25,324 - 31,052 - Restructuring and other related charges 2,162 808 9,680 10,323 Asbestos liability and defense costs 4,593 3,697 12,237 7,876 Asbestos coverage litigation expenses 2,246 2,443 10,700 13,206 Adjusted operating income 26,752$ 26,503$ 89,575$ 65,777$ Adjusted operating income margin 15.0% 15.9% 12.9% 12.1% Three Months Ended December 31, Twelve Months Ended December 31,
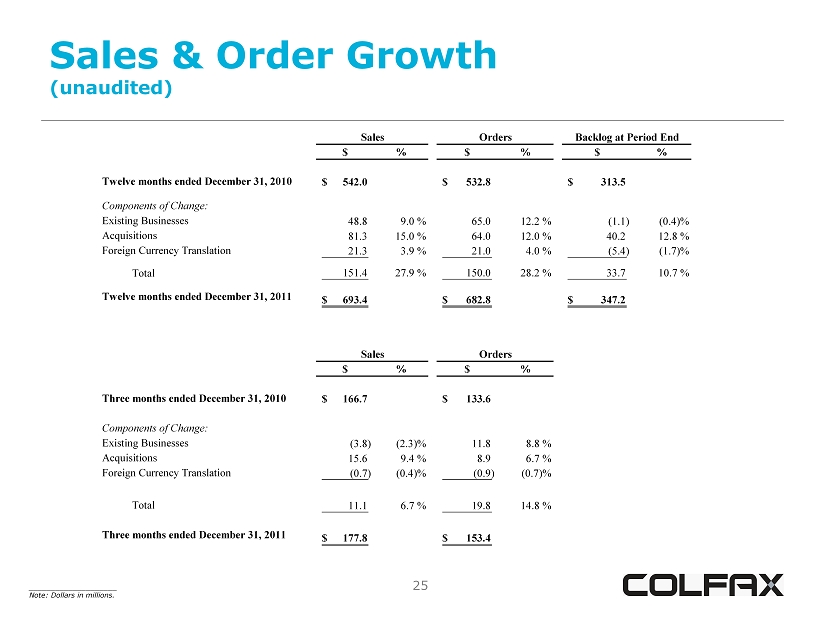
25 Sales & Order Growth (unaudited) ____________________ Note: Dollars in millions. $ % $ % $ % Twelve months ended December 31, 2010 542.0$ 532.8$ 313.5$ Components of Change: Existing Businesses 48.8 9.0 % 65.0 12.2 % (1.1) (0.4)% Acquisitions 81.3 15.0 % 64.0 12.0 % 40.2 12.8 % Foreign Currency Translation 21.3 3.9 % 21.0 4.0 % (5.4) (1.7)% Total 151.4 27.9 % 150.0 28.2 % 33.7 10.7 % Twelve months ended December 31, 2011 693.4$ 682.8$ 347.2$ $ % $ % Three months ended December 31, 2010 166.7$ 133.6$ Components of Change: Existing Businesses (3.8) (2.3)% 11.8 8.8 % Acquisitions 15.6 9.4 % 8.9 6.7 % Foreign Currency Translation (0.7) (0.4)% (0.9) (0.7)% Total 11.1 6.7 % 19.8 14.8 % Three months ended December 31, 2011 177.8$ 153.4$ Sales Orders Sales Backlog at Period EndOrders
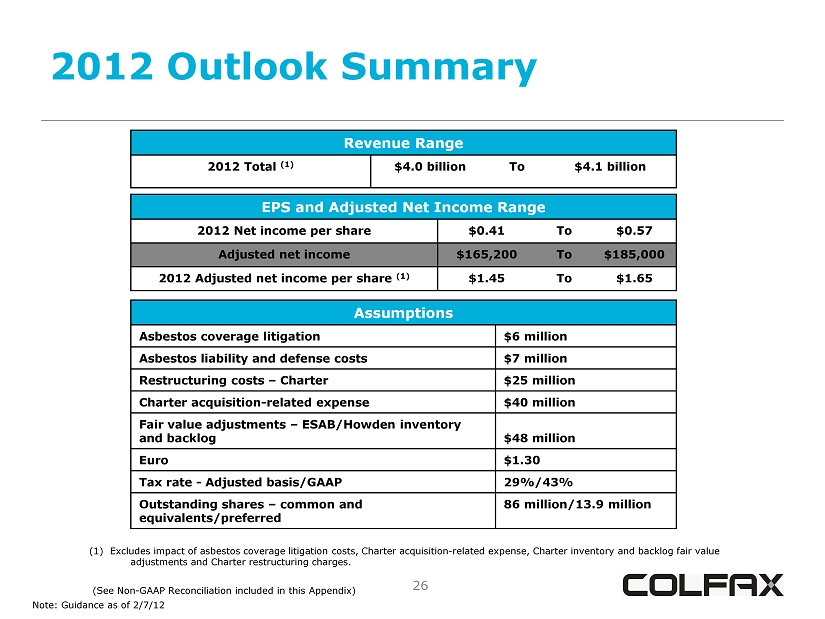
26 2012 Outlook Summary Revenue Range 2012 Total (1) $4.0 billion To $4.1 billion EPS and Adjusted Net Income Range 2012 Net income per share $0.41 To $0.57 Adjusted net income $165,200 To $185,000 2012 Adjusted net income per share (1) $1.45 To $1.65 Assumptions Asbestos coverage litigation $6 million Asbestos liability and defense costs $7 million Restructuring costs – Charter $25 million Charter acquisition - related expense $40 million Fair value adjustments – ESAB/Howden inventory and backlog $48 million Euro $1.30 Tax rate - Adjusted basis/GAAP 29%/43% Outstanding shares – common and equivalents/preferred 86 million/13.9 million (1) Excludes impact of asbestos coverage litigation costs, Charter acquisition - related expense, Charter inventory and backlog f air value adjustments and Charter restructuring charges. (See Non - GAAP Reconciliation included in this Appendix) Note: Guidance as of 2/7/12
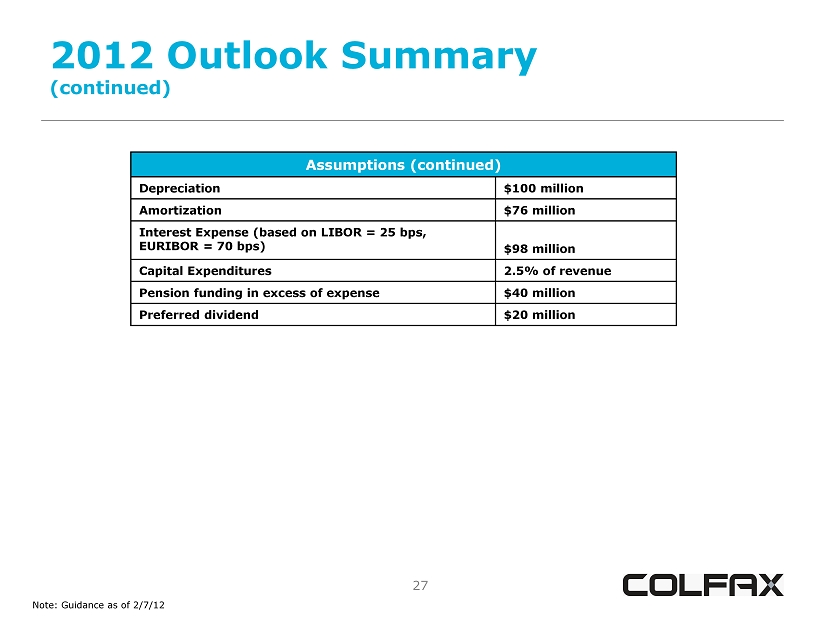
27 2012 Outlook Summary (continued) Assumptions (continued) Depreciation $100 million Amortization $76 million Interest Expense (based on LIBOR = 25 bps, EURIBOR = 70 bps) $98 million Capital Expenditures 2.5% of revenue Pension funding in excess of expense $40 million Preferred dividend $20 million Note: Guidance as of 2/7/12
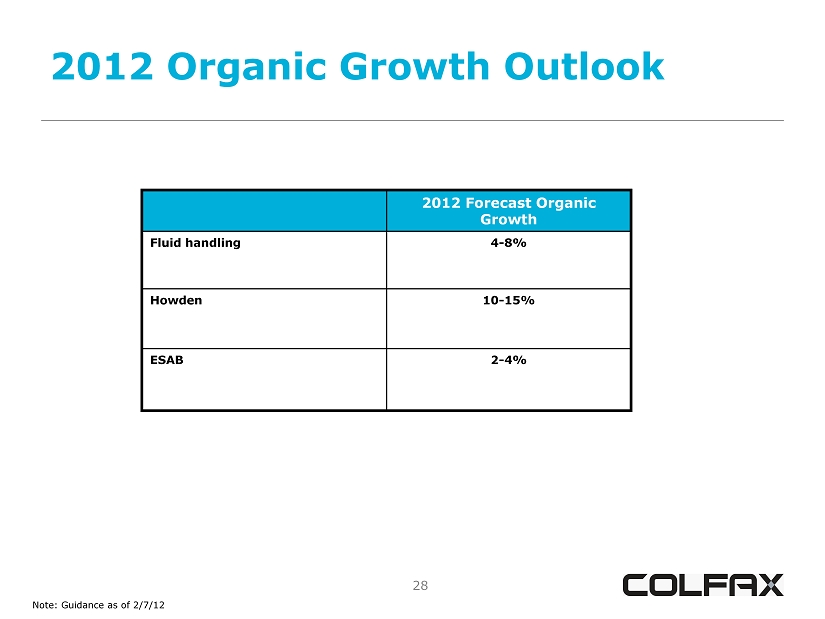
28 2012 Organic Growth Outlook Note: Guidance as of 2/7/12 2012 Forecast Organic Growth Fluid handling 4 - 8% Howden 10 - 15% ESAB 2 - 4%
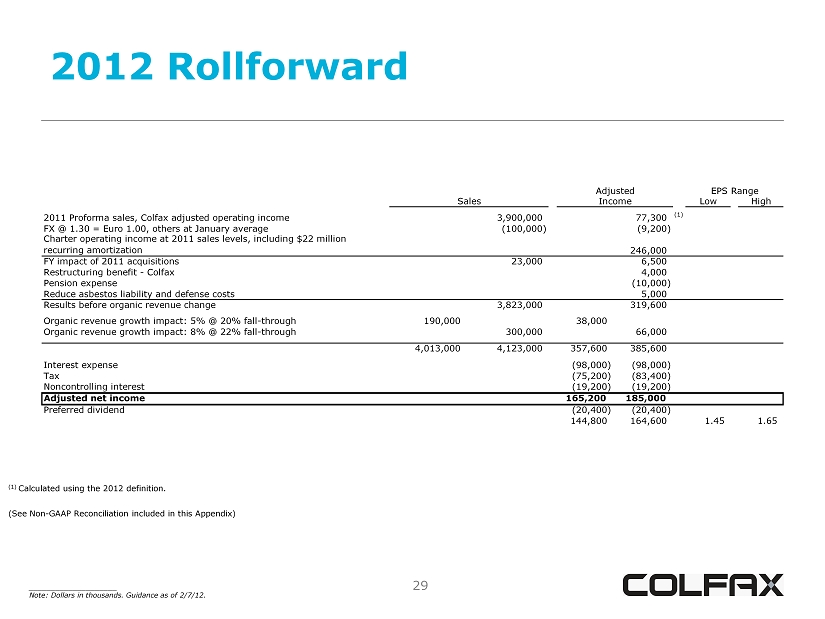
29 2012 Rollforward ____________________ Note: Dollars in thousands. Guidance as of 2/7/12. (1) Calculated using the 2012 definition. (See Non - GAAP Reconciliation included in this Appendix) Low High 2011 Proforma sales, Colfax adjusted operating income (1) FX @ 1.30 = Euro 1.00, others at January average Charter operating income at 2011 sales levels, including $22 million recurring amortization FY impact of 2011 acquisitions Restructuring benefit - Colfax Pension expense Reduce asbestos liability and defense costs Results before organic revenue change Organic revenue growth impact: 5% @ 20% fall-through 190,000 38,000 Organic revenue growth impact: 8% @ 22% fall-through 300,000 66,000 4,013,000 4,123,000 357,600 385,600 Interest expense (98,000) (98,000) Tax (75,200) (83,400) Noncontrolling interest (19,200) (19,200) Adjusted net income 165,200 185,000 Preferred dividend (20,400) (20,400) 144,800 164,600 1.45 1.65 5,000 EPS Range Sales 3,900,000 (100,000) 77,300 (9,200) 23,000 3,823,000 Adjusted Income 319,600 246,000 6,500 4,000 (10,000)

30 Significant Impacts on 2012 Projected Earnings Per Share EPS Impact Preferred Stock Impact on EPS Available to Common Shareholders $0.20 / share Asbestos Liability and Defense Costs $0.05 / share Incremental Amortization of Intangibles $0.16 / share Pension Expense $0.15 / share
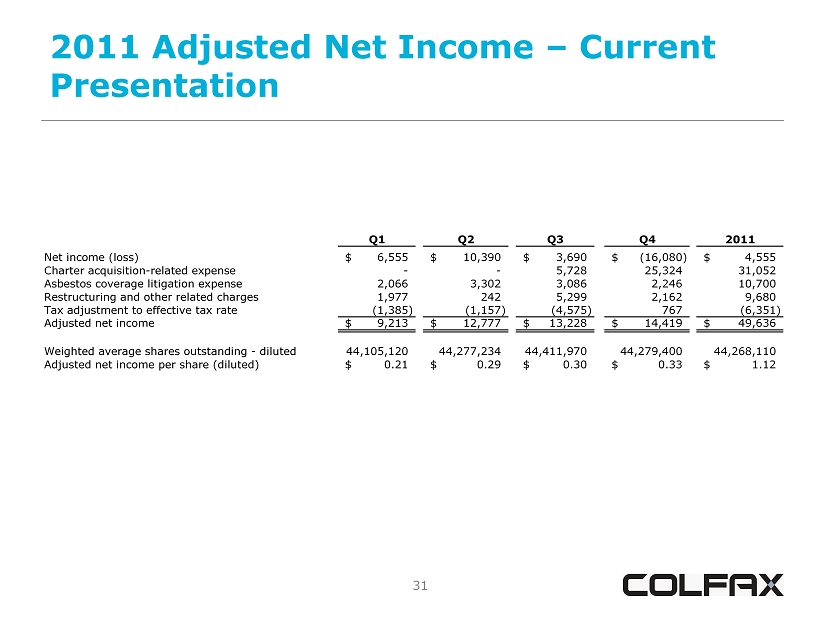
31 2011 Adjusted Net Income – Current Presentation Q1 Q2 Q3 Q4 2011 Net income (loss) 6,555$ 10,390$ 3,690$ (16,080)$ 4,555$ Charter acquisition-related expense - - 5,728 25,324 31,052 Asbestos coverage litigation expense 2,066 3,302 3,086 2,246 10,700 Restructuring and other related charges 1,977 242 5,299 2,162 9,680 Tax adjustment to effective tax rate (1,385) (1,157) (4,575) 767 (6,351) Adjusted net income 9,213$ 12,777$ 13,228$ 14,419$ 49,636$ Weighted average shares outstanding - diluted 44,105,120 44,277,234 44,411,970 44,279,400 44,268,110 Adjusted net income per share (diluted) 0.21$ 0.29$ 0.30$ 0.33$ 1.12$
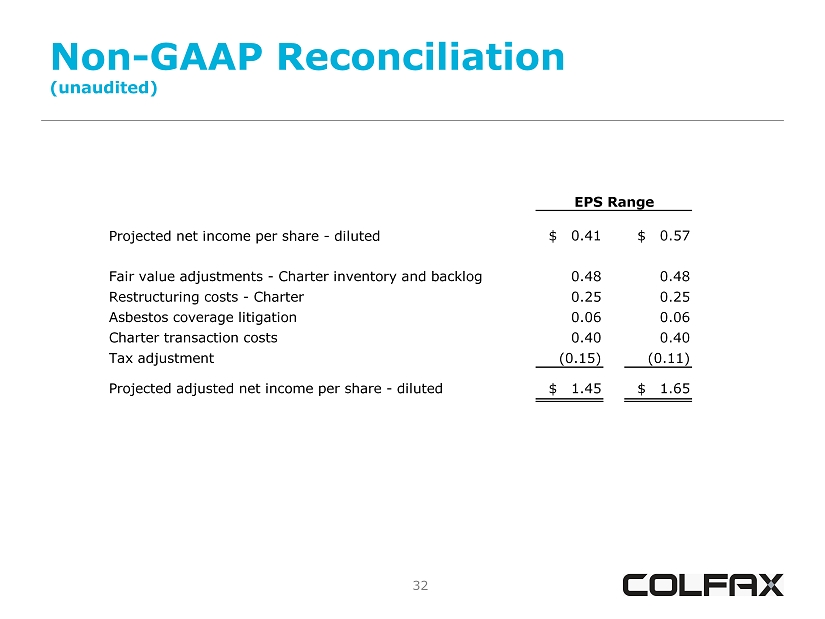
32 Non - GAAP Reconciliation (unaudited) Projected net income per share - diluted $ 0.41 $ 0.57 Fair value adjustments - Charter inventory and backlog 0.48 0.48 Restructuring costs - Charter 0.25 0.25 Asbestos coverage litigation 0.06 0.06 Charter transaction costs 0.40 0.40 Tax adjustment (0.15) (0.11) Projected adjusted net income per share - diluted $ 1.45 $ 1.65 EPS Range