 Q1 2008 Earnings Call June 17, 2008 Exhibit 99.2 |
 1 Forward Looking Statements The following information contains forward-looking statements, including forward- looking statements within the meaning of the Private Securities Litigation Reform Act of 1995. Such forward-looking statements include, but are not limited to, statements concerning Colfax's plans, objectives, expectations and intentions and other statements that are not historical or current facts. Forward-looking statements are based on Colfax's current expectations and involve risks and uncertainties that could cause actual results to differ materially from those expressed or implied in such forward-looking statements. Factors that could cause Colfax's results to differ materially from current expectations include, but are not limited to factors detailed in Colfax's Registration Statement on Form S-1 under the caption "Risk Factors" and other reports filed with the U.S. Securities and Exchange Commission. In addition, these statements are based on a number of assumptions that are subject to change. This presentation speaks only as of this date. Colfax disclaims any duty to update the information herein. |
 2 Q1 2008 Highlights Adjusted net income of $8.9 million, an increase of 48.3% Net sales of $130.7 million, an increase of 13.9% Adjusted operating income of $18.3 million, an increase of 24.5% Adjusted EBITDA of $22.0 million, an increase of 20.9% Record first quarter orders of $180.3 million, an increase of 37.8% Record backlog of $353.6 million, an increase of 72.8% Well Positioned For Strong Performance in 2008 |
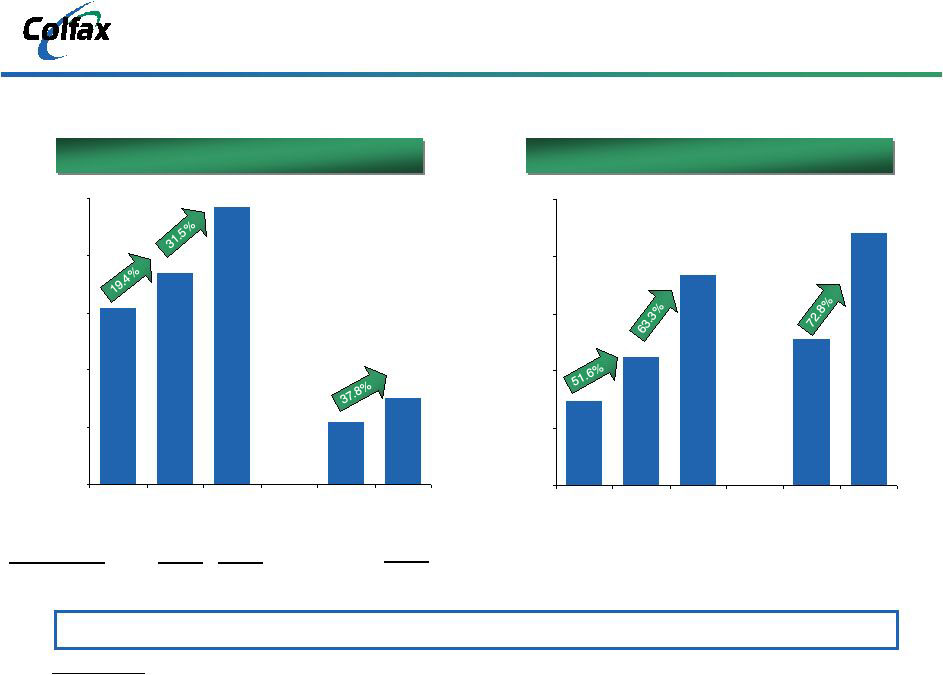 3 Note: Dollars in millions. Historical Orders & Backlog $118.3 $179.3 $292.8 $204.6 $353.6 $0.0 $80.0 $160.0 $240.0 $320.0 $400.0 2005 2006 2007 - Q1 2007 Q1 2008 $370.4 $442.3 $581.5 $130.8 $180.3 $0.0 $120.0 $240.0 $360.0 $480.0 $600.0 2005 2006 2007 - Q1 2007 Q1 2008 17.7% 17.6% Acquisitions 1.2% 6.1% FX Translation 0.5% 7.8% Total Growth -- -- -- -- 19.4% 31.5% 24.2% 1.6% 12.1% 37.8% Existing Businesses -- -- -- -- Accelerating Order and Backlog Growth Orders Orders Backlog Backlog |
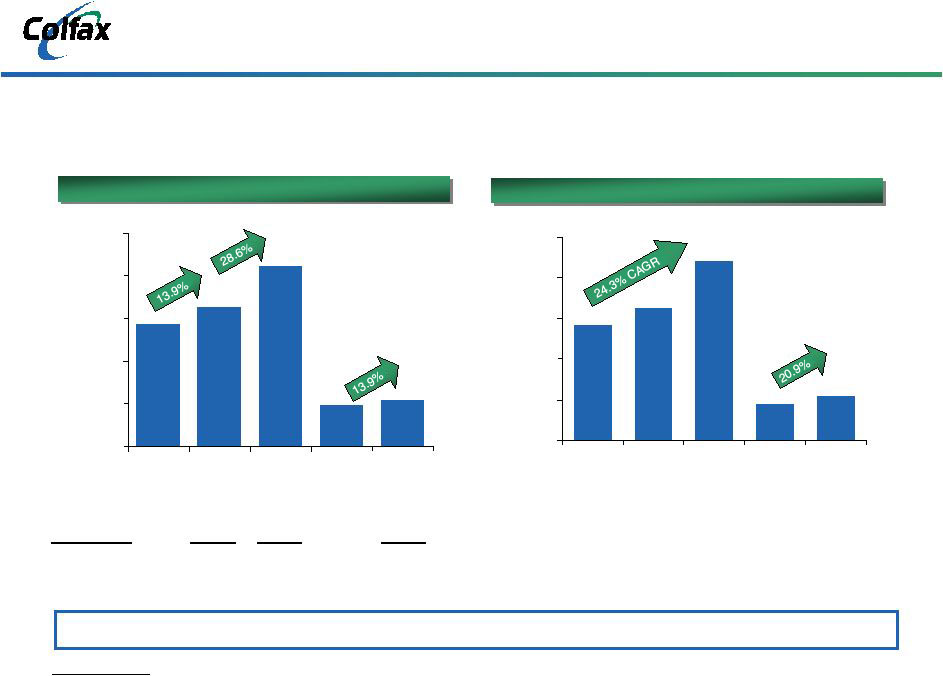 4 $57.1 $64.8 $88.2 $18.2 $22.0 $0.0 $20.0 $40.0 $60.0 $80.0 $100.0 2005 2006 2007 Q1 2007 Q1 2008 Financial Performance Overview Note: Dollars in millions. (1) Please refer to the Appendix for the Non-GAAP reconciliation. % Margin 16.5% 16.5% 17.4% $345.5 $393.6 $506.3 $114.8 $130.7 $0.0 $120.0 $240.0 $360.0 $480.0 $600.0 2005 2006 2007 Q1 2007 Q1 2008 11.8% 13.5% Acquisitions 1.4% 8.0% FX Translation 0.8% 7.1% Total Growth 13.9% 28.6% -- -- -- Existing Businesses -- -- -- 15.9% 16.8% 2.1% 2.2% 9.6% 13.9% Consistent Track Record of Profitable Sales Growth Revenue Adjusted EBITDA (1) |
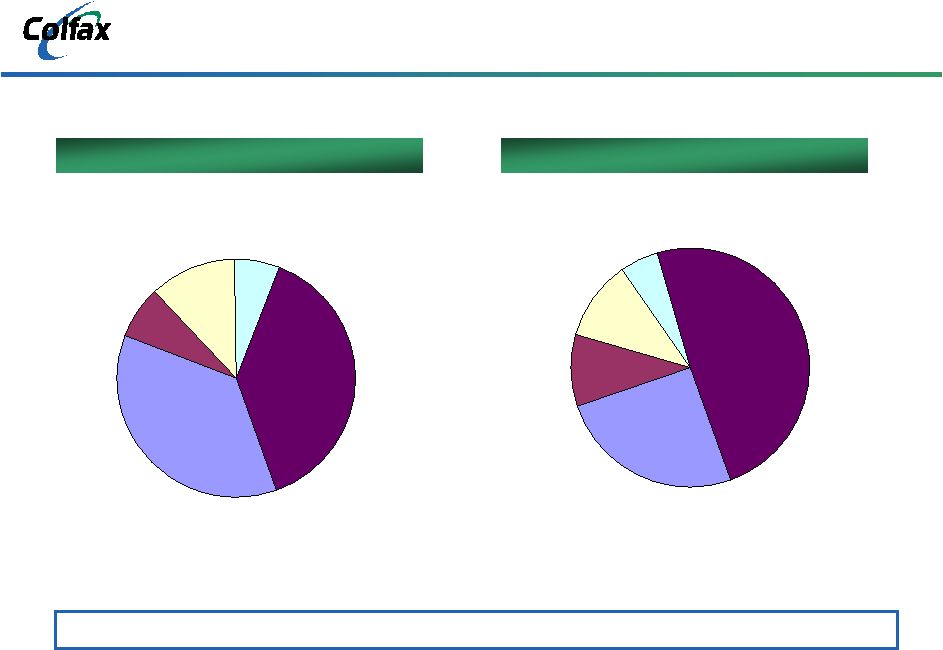 5 Q1 2008 Sales and Orders by End Market Q1 2008 Orders: $180.3 million Q1 2008 Orders: $180.3 million Q1 2008 Sales: $130.7 million Q1 2008 Sales: $130.7 million Commercial Marine 36% Oil & Gas 7% Power Generation 12% Navy 6% General Industrial 39% Commercial Marine 25% Oil & Gas 10% Power Generation 11% Navy 5% General Industrial 49% Well Positioned in Five Attractive and Diverse End Markets |
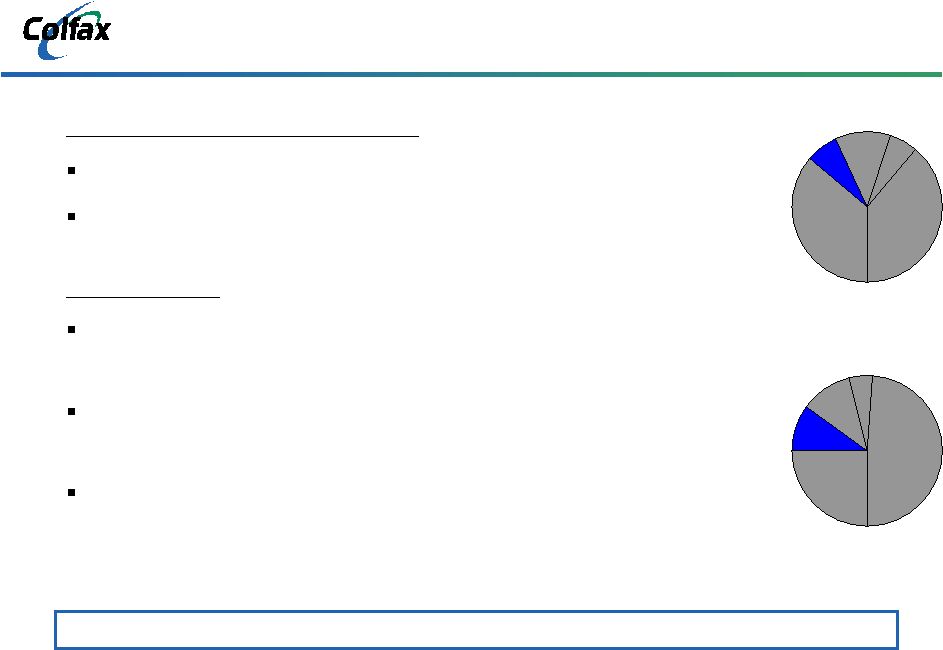
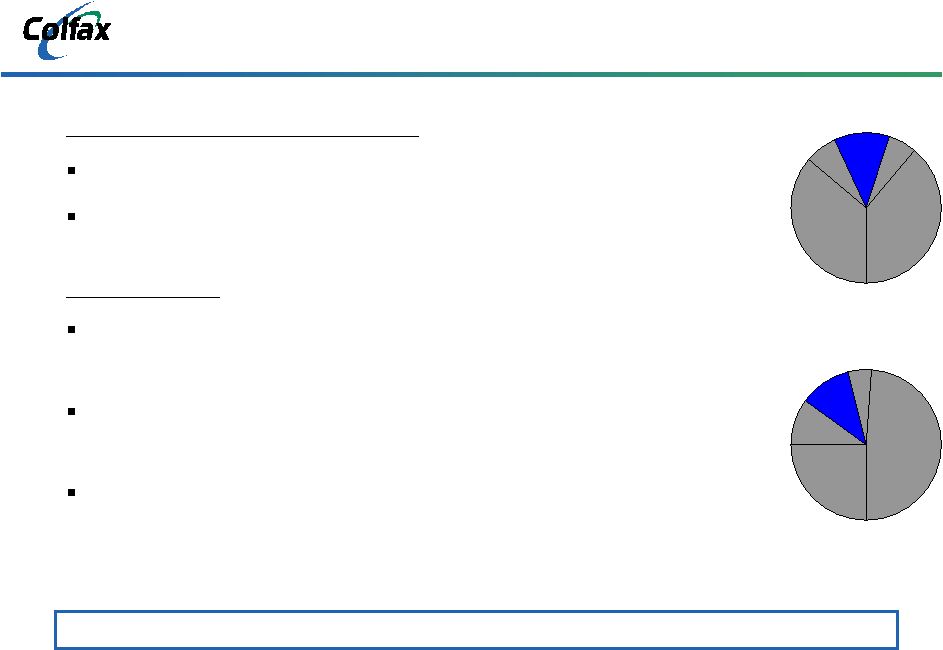
 6 Commercial Marine Market Perspective Q1 2008 Year-Over Year Results Orders up 99.1% year-over-year (76.0% organic growth) Sales up 11.6% year-over-year (-1.0% organic growth) Market Trends Growth in international trade and demand for bulk commodities driving increased ship construction Global market with China taking leadership position Aging fleet, environmental regulations requiring ship owners to upgrade or replace ships Local presence required to effectively serve customers and capture aftermarket business Executing Strategies To Drive Profitable Sales Growth Colfax Q1 08 Orders Split 36% Comm. Marine Colfax Q1 08 Sales Split 25% Comm. Marine |
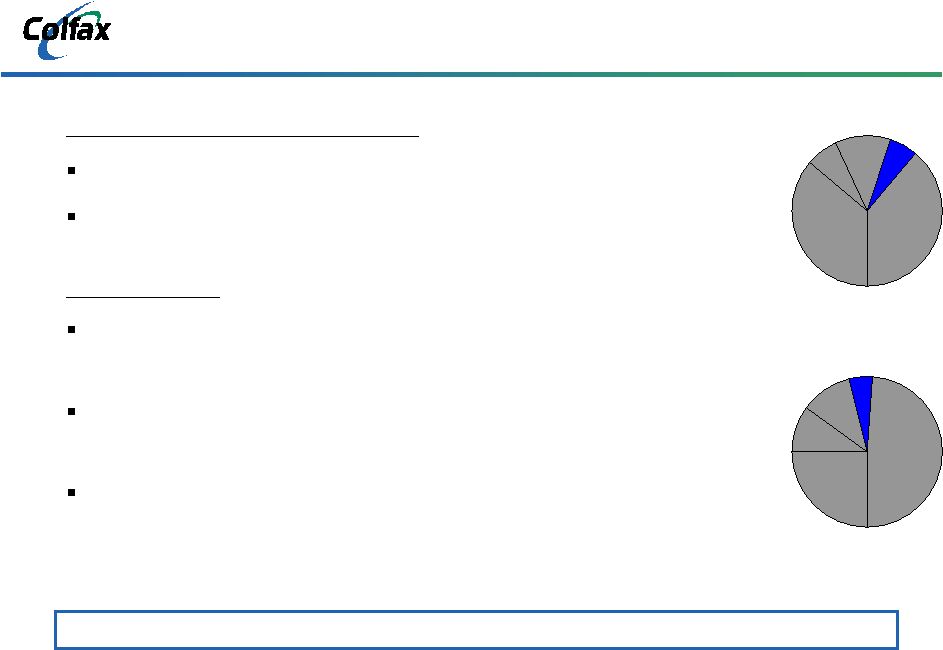
 7 Oil & Gas Market Perspective Strong Product Portfolio Capable of Solving Needs of Evolving Oil & Gas Market Colfax Q1 08 Orders Split 7% O&G Colfax Q1 08 Sales Split 10% O&G Q1 2008 Year-Over Year Results Orders down 24.7% year-over-year (-26.5% organic growth) Sales down 7.3% year-over-year (-10.1% organic growth) Market Trends Elevated oil prices and depleting supplies spurring heavy oil exploration, transport and processing Customers focusing more on “total cost of ownership” to reduce downtime and increase efficiency Application expertise critical to winning large project orders |
 8 Power Generation Market Perspective Leading Supplier of Lubrication Solutions to Power Generation OEMs Colfax Q1 08 Orders Split 12% Power Gen. Colfax Q1 08 Sales Split 11% Power Gen. Q1 2008 Year-Over Year Results Orders up 18.7% year-over-year (10.2% organic growth) Sales up 37.6% year-over-year (27.4% organic growth) Market Trends Robust economic growth in Asia and Middle East driving investment in energy infrastructure projects Aging power infrastructure in mature markets creating upgrade projects to increase efficiency and lower operating costs Multiple forms of power generation (gas, coal, hydro, nuclear) being employed to satisfy growing global demand |
 9 Global Navy Market Perspective Developing Innovative Fluid Handling Products and Systems to Drive Future Growth Colfax Q1 08 Orders Split 6% Navy Colfax Q1 08 Sales Split 5% Navy Q1 2008 Year-Over Year Results Orders up 107.3% year-over-year (104.8% organic growth) Sales down 26.7% year-over-year (-27.7% organic growth) Market Trends Sovereign navies around the world expanding fleets to address heightened national security level concerns U.S. Navy continues to invest in the next generation of naval vessels Increased demand for integrated fluid handling systems and solutions to reduce operating costs |
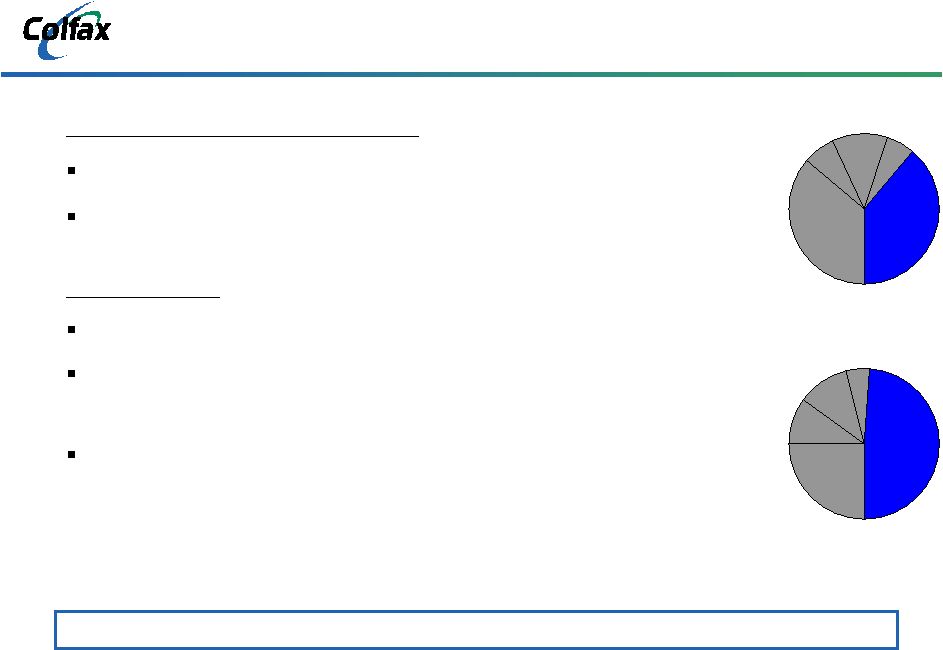 10 General Industrial Perspective Leading Supplier of Highly Engineered Fluid Handling Products and Systems with Global Reach Colfax Q1 08 Orders Split 39% General Industrial Colfax Q1 08 Sales Split 49% General Industrial Q1 2008 Year-Over Year Results Orders up 21.2% year-over-year (10.3% organic growth) Sales up 23.2% year-over-year (12.2% organic growth) Market Trends Global economic development driving increased capital investment Developing regions embracing engineered products and solutions that reduce costs and increase efficiency Global footprint and channel optimization required to cover broad end market applications |
 11 Note: Dollars in millions. Income Statement Summary First Quarter Delta 2007 2008 $ % Orders $130.8 $180.3 $49.5 37.8% Sales $114.8 $130.7 $15.9 13.9% Gross Profit $38.8 $48.2 $9.4 24.2% % of Sales 33.8% 36.9% SG&A Expense $23.1 $28.5 $5.4 23.4% R&D Expense $1.0 $1.4 $0.4 40.0% Operating Expenses $24.1 $29.9 $5.8 24.1% % of Sales 21.0% 22.9% Adjusted Operating Income $14.7 $18.3 $3.6 24.5% % of Sales 12.8% 14.0% Adjusted EBITDA $18.2 $22.0 $3.8 20.9% % of Sales 15.9% 16.8% Adjusted Net Income $6.0 $8.9 $2.9 48.3% % of Sales 5.2% 6.8% |
 12 Note: Dollars in millions. Statement of Cash Flows Summary Net Income Non-Cash Expenses Other Total Operating Activities Capital Expenditures Acquisitions Other Total Investing Activities Net Borrowings Other Total Financing Activities Effect of Exchange Rates Increase (Decrease in Cash) Cash Beginning of Period Cash End of Period Three Months Ended 3/30/2007 3/28/2008 $6.0 $6.8 $4.5 $1.7 ($5.2) ($13.4) ($4.0) ($6.2) $1.3 ($11.1) ($1.5) ($3.0) ($28.5) $0.0 $0.0 $0.0 ($30.0) ($2.9) $36.5 $0.0 ($0.4) ($1.3) $36.1 ($1.3) $1.1 $0.5 $8.5 ($14.8) $7.6 $48.1 $16.1 $33.3 Change in Working Capital and Accrued Liabilities |
 13 21.56 million shares sold (11.85 million primary / 9.71 million secondary) 44.01 million shares outstanding post offering Primarily to repay a portion of existing debt, effective redemption of preferred stock through conversion and sale of common, pay dividends and general corporate purposes IPO Summary Shares Sold Use of Proceeds $18.00 per share IPO Price Began trading May 8, 2008 Completed offering May 13, 2008 Date $193.4 million Net Proceeds |
 14 Pro Forma Capitalization Note: Dollars in millions. Well Capitalized for Growth Going Forward As Adjusted Actual For IPO Cash $33.3 $69.1 Total Debt $207.8 $129.3 Shareholder's Equity $64.2 $225.5 Total Capitalization $272.0 $354.8 Total Debt / Total Capitalization 76.4% 36.5% As of March 28, 2008 As of March 28, 2008 |
 15 Well Positioned for the Future Global Leader in Specialty Global Leader in Specialty Fluid Handling Products Fluid Handling Products Proven Application Proven Application Expertise in Solving Expertise in Solving Critical Customer Needs Critical Customer Needs Serving Fast Serving Fast Growing Infrastructure Growing Infrastructure Driven End Markets Driven End Markets Experienced Management Experienced Management Team in Place to Grow Team in Place to Grow Organically and Through Organically and Through Strategic Acquisitions Strategic Acquisitions CBS-Driven Culture Focused on Profitable Sales Growth Leading Brand Names Generating Aftermarket Sales and Services |
 Questions |
 Appendix |
 18 Note: Dollars in millions. Non-GAAP Reconciliation Fiscal Year End Three Months Ended 2005 2006 2007 3/30/2007 3/28/2008 Adjusted EBITDA: Net Income $12.2 $0.1 $64.9 $6.0 $6.8 Provision for Income Taxes 6.9 3.9 39.1 4.0 3.6 Interest Expense 9.0 14.2 19.2 4.8 4.5 Depreciation and Amortization 11.4 11.5 15.2 3.5 3.7 Asbestos Liability and Defense Costs (Income) 14.3 21.8 (65.2) (2.3) 0.3 Asbestos Coverage Litigation Expense 3.8 12.0 14.9 2.2 3.1 Adjusted EBITDA $57.1 $64.8 $88.2 $18.2 $22.0 Adjusted EBITDA Margin 16.5% 16.5% 17.4% 15.9% 16.8% Discontinued Operations Expense (Income) (0.6) 1.4 0.0 0.0 0.0 |