
FIRST QUARTER 2013 | EARNINGS CONFERENCE CALL
2 FORWARD-LOOKING STATEMENTS The following information contains forward-looking statements, including forward-looking statements within the meaning of the Private Securities Litigation Reform Act of 1995. Such forward-looking statements include, but are not limited to, statements concerning Colfax's plans, objectives, expectations and intentions and other statements that are not historical or current facts. Forward- looking statements are based on Colfax's current expectations and involve risks and uncertainties that could cause actual results to differ materially from those expressed or implied in such forward-looking statements. Factors that could cause Colfax's results to differ materially from current expectations include, but are not limited to, factors detailed in Colfax's reports filed with the U.S. Securities and Exchange Commission including its 2012 Annual Report on Form 10-K under the caption “Risk Factors”. In addition, these statements are based on a number of assumptions that are subject to change. This presentation speaks only as of this date. Colfax disclaims any duty to update the information herein.
Q1 2013 RESULTS
4 Q1 2013 HIGHLIGHTS • Adjusted net income of $33.6 million ($0.26 per share) compared to $25.5 million ($0.23 per share) in Q1 2012 • Net sales of $947.1 million, an increase of 6.8% from Q1 2012 net sales of $886.4 million (an organic decrease of 2.7%) • Adjusted operating income of $78.2 million compared to $63.4 million in Q1 2012 • First quarter gas- and fluid-handling orders of $502.1 million compared to orders of $497.5 million in Q1 2012, an increase of 0.9% (an organic decrease of 4.3%) • Gas- and fluid-handling backlog of $1.4 billion at period end

GAS AND FLUID HANDLING
6 GAS AND FLUID HANDLING HIGHLIGHTS • Net sales of $425.1 million remained relatively consistent with prior year net sales of $425.3 million in Q1 2012 (an organic decline of 1.7%) • Adjusted segment operating income of $44.2 million and adjusted segment operating income margin of 10.4% • First quarter orders of $502.1 million compared to $497.5 million in Q1 2012, an increase of 0.9% • Backlog of $1.4 billion at period end
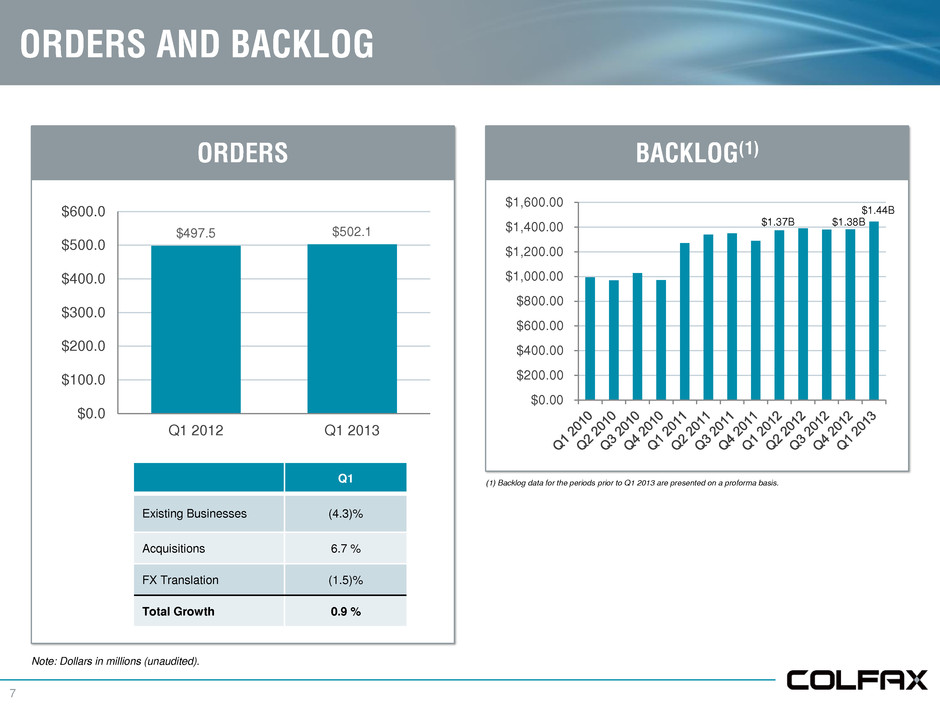
7 ORDERS AND BACKLOG $497.5 $502.1 $0.0 $100.0 $200.0 $300.0 $400.0 $500.0 $600.0 Q1 2012 Q1 2013 $0.00 $200.00 $400.00 $600.00 $800.00 $1,000.00 $1,200.00 $1,400.00 $1,600.00 $1.38B $1.37B ORDERS BACKLOG(1) Q1 Existing Businesses (4.3)% Acquisitions 6.7 % FX Translation (1.5)% Total Growth 0.9 % (1) Backlog data for the periods prior to Q1 2013 are presented on a proforma basis. Note: Dollars in millions (unaudited). $1.44B
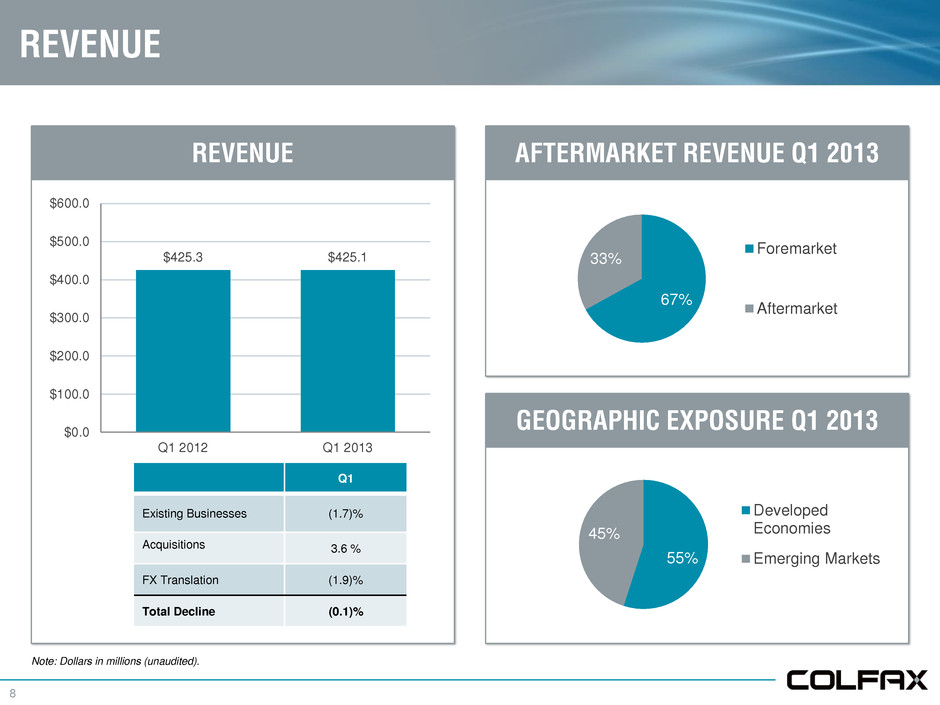
8 GEOGRAPHIC EXPOSURE Q1 2013 REVENUE $425.3 $425.1 $0.0 $100.0 $200.0 $300.0 $400.0 $500.0 $600.0 Q1 2012 Q1 2013 67% 33% Foremarket Aftermarket REVENUE AFTERMARKET REVENUE Q1 2013 55% 45% Developed Economies Emerging Markets Note: Dollars in millions (unaudited). Q1 Existing Businesses (1.7)% Acquisitions 3.6 % FX Translation (1.9)% Total Decline (0.1)%
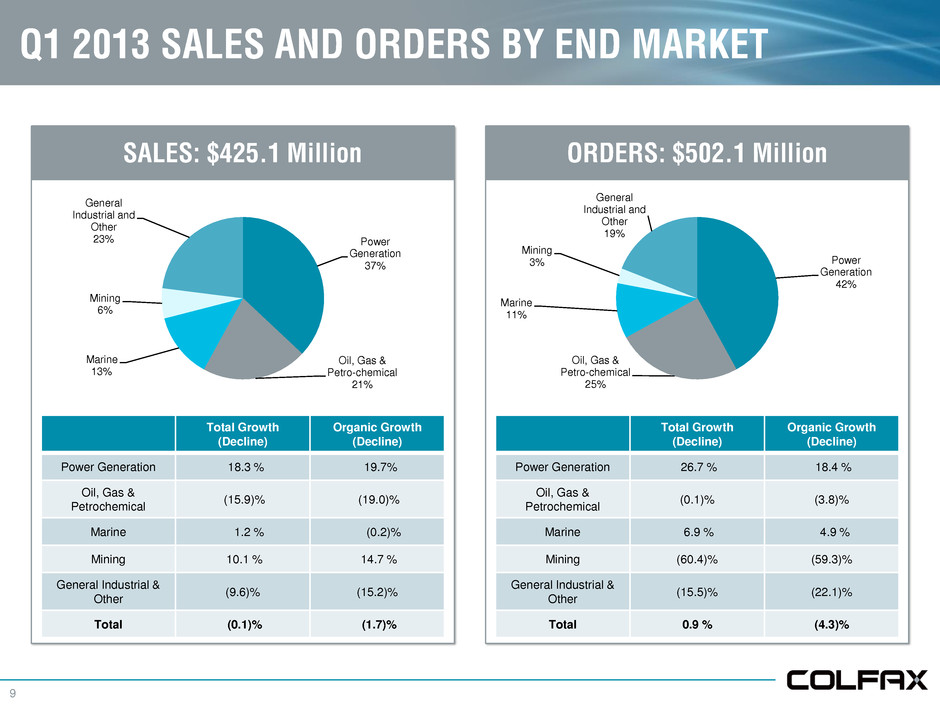
9 Q1 2013 SALES AND ORDERS BY END MARKET Power Generation 37% Oil, Gas & Petro-chemical 21% Marine 13% Mining 6% General Industrial and Other 23% SALES: $425.1 Million Total Growth (Decline) Organic Growth (Decline) Power Generation 18.3 % 19.7% Oil, Gas & Petrochemical (15.9)% (19.0)% Marine 1.2 % (0.2)% Mining 10.1 % 14.7 % General Industrial & Other (9.6)% (15.2)% Total (0.1)% (1.7)% Power Generation 42% Oil, Gas & Petro-chemical 25% Marine 11% Mining 3% General Industrial and Other 19% ORDERS: $502.1 Million Total Growth (Decline) Organic Growth (Decline) Power Generation 26.7 % 18.4 % Oil, Gas & Petrochemical (0.1)% (3.8)% Marine 6.9 % 4.9 % Mining (60.4)% (59.3)% General Industrial & Other (15.5)% (22.1)% Total 0.9 % (4.3)%
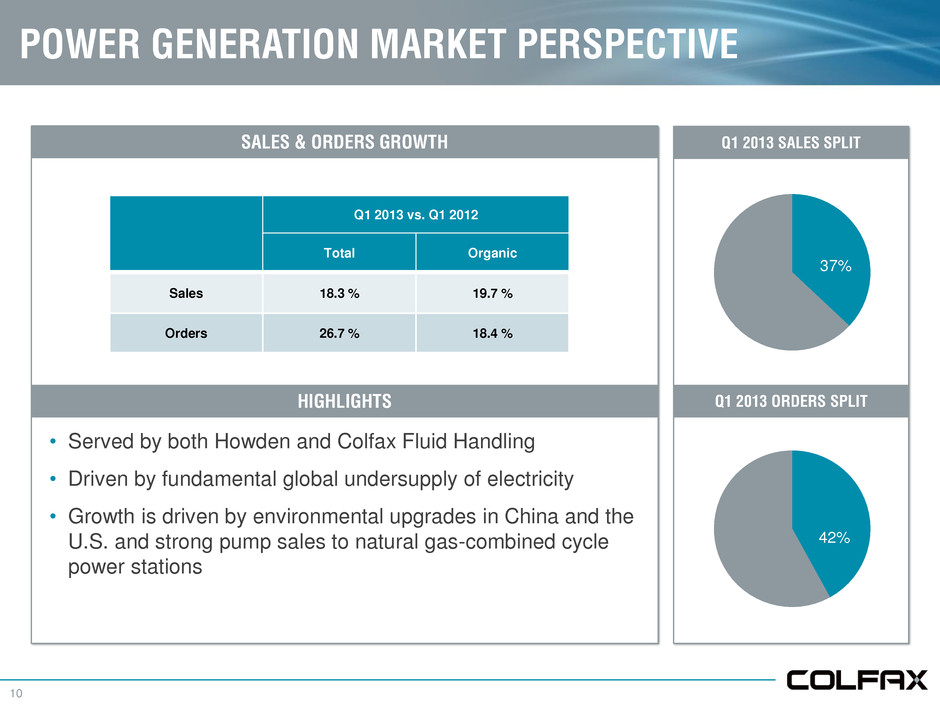
10 POWER GENERATION MARKET PERSPECTIVE SALES & ORDERS GROWTH Q1 2013 vs. Q1 2012 Total Organic Sales 18.3 % 19.7 % Orders 26.7 % 18.4 % 42% • Served by both Howden and Colfax Fluid Handling • Driven by fundamental global undersupply of electricity • Growth is driven by environmental upgrades in China and the U.S. and strong pump sales to natural gas-combined cycle power stations Q1 2013 SALES SPLIT Q1 2013 ORDERS SPLIT 37% HIGHLIGHTS
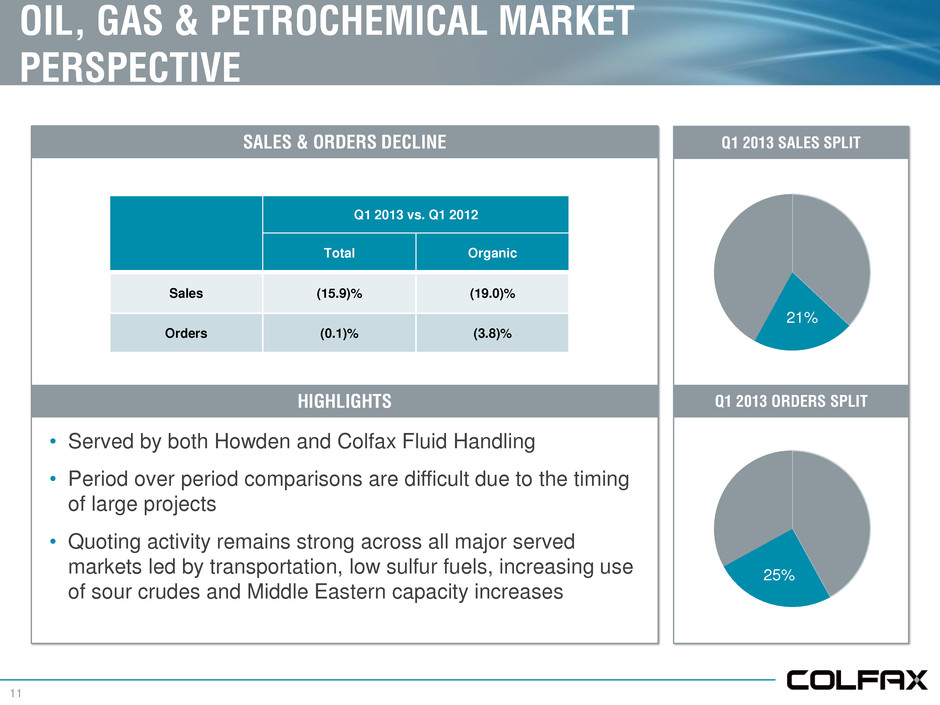
11 OIL, GAS & PETROCHEMICAL MARKET PERSPECTIVE SALES & ORDERS DECLINE 25% • Served by both Howden and Colfax Fluid Handling • Period over period comparisons are difficult due to the timing of large projects • Quoting activity remains strong across all major served markets led by transportation, low sulfur fuels, increasing use of sour crudes and Middle Eastern capacity increases Q1 2013 SALES SPLIT Q1 2013 ORDERS SPLIT 21% HIGHLIGHTS Q1 2013 vs. Q1 2012 Total Organic Sales (15.9)% (19.0)% Orders (0.1)% (3.8)%
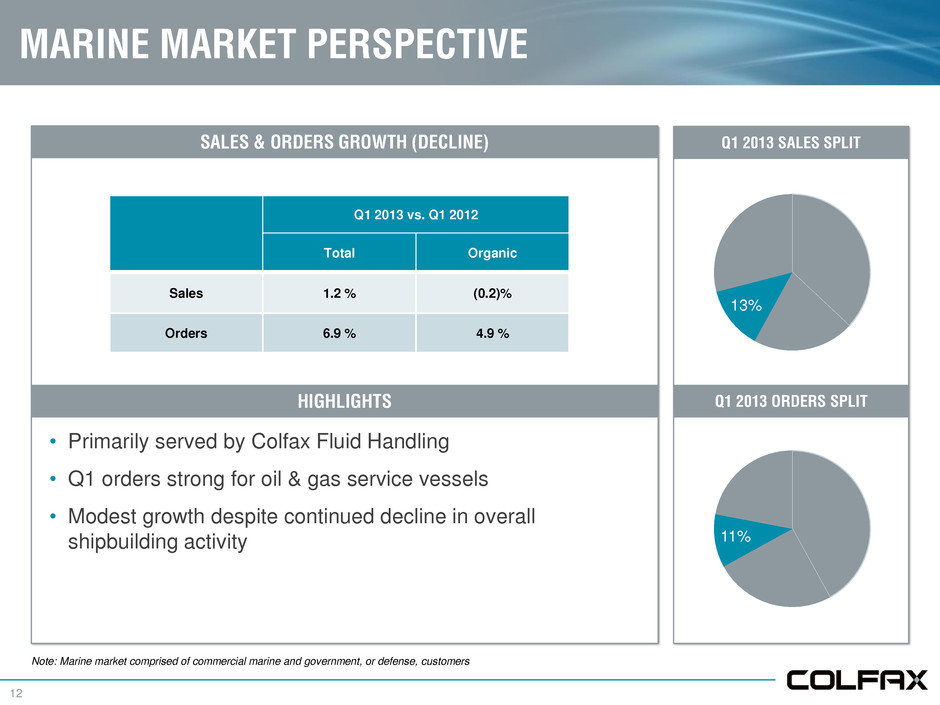
12 MARINE MARKET PERSPECTIVE SALES & ORDERS GROWTH (DECLINE) 11% • Primarily served by Colfax Fluid Handling • Q1 orders strong for oil & gas service vessels • Modest growth despite continued decline in overall shipbuilding activity Q1 2013 SALES SPLIT Q1 2013 ORDERS SPLIT 13% HIGHLIGHTS Note: Marine market comprised of commercial marine and government, or defense, customers Q1 2013 vs. Q1 2012 Total Organic Sales 1.2 % (0.2)% Orders 6.9 % 4.9 %
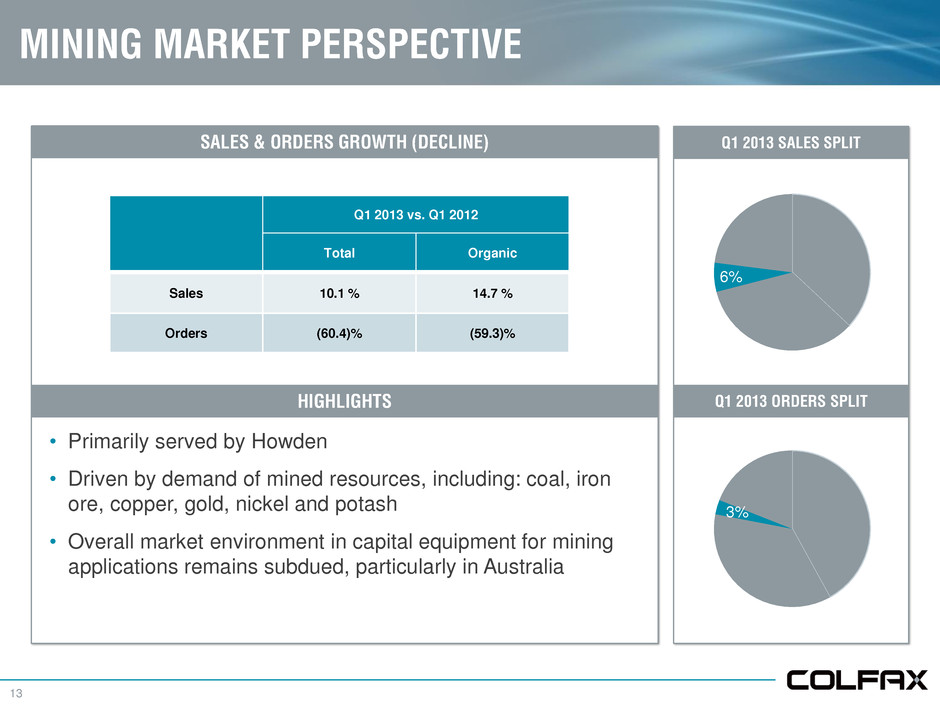
13 MINING MARKET PERSPECTIVE SALES & ORDERS GROWTH (DECLINE) 3% • Primarily served by Howden • Driven by demand of mined resources, including: coal, iron ore, copper, gold, nickel and potash • Overall market environment in capital equipment for mining applications remains subdued, particularly in Australia Q1 2013 SALES SPLIT Q1 2013 ORDERS SPLIT 6% HIGHLIGHTS Q1 2013 vs. Q1 2012 Total Organic Sales 10.1 % 14.7 % Orders (60.4)% (59.3)%
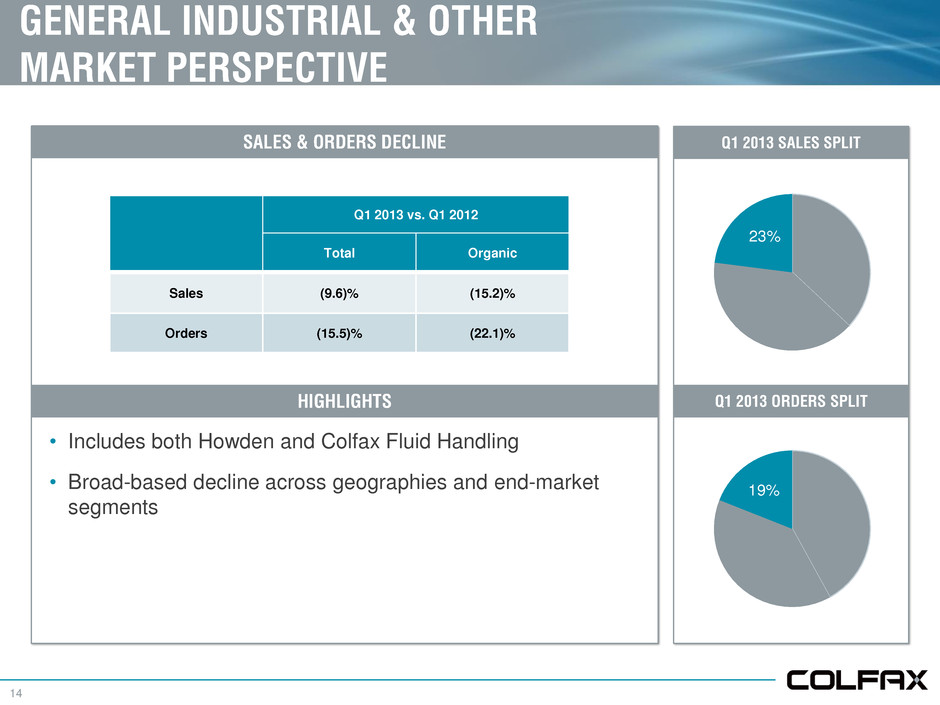
14 GENERAL INDUSTRIAL & OTHER MARKET PERSPECTIVE SALES & ORDERS DECLINE 19% • Includes both Howden and Colfax Fluid Handling • Broad-based decline across geographies and end-market segments Q1 2013 SALES SPLIT Q1 2013 ORDERS SPLIT 23% HIGHLIGHTS Q1 2013 vs. Q1 2012 Total Organic Sales (9.6)% (15.2)% Orders (15.5)% (22.1)%

FABRICATION TECHNOLOGY
16 FABRICATION TECHNOLOGY HIGHLIGHTS • Net sales of $522.0 million compared to net sales of $461.1 million in Q1 2012, an increase of 13.2% (an organic decline of 3.7%) • Adjusted segment operating income of $44.5 million and adjusted segment operating income margin of 8.5% • Excluding Soldex: – Gross margin increased approximately one percentage point, despite the organic decline in sales – Selling, general and administrative expense as a percentage of sales reduced 50 basis points from Q1 2012 – Adjusted segment operating income margin improved 1.3% sequentially and 1.1% over Q1 2012
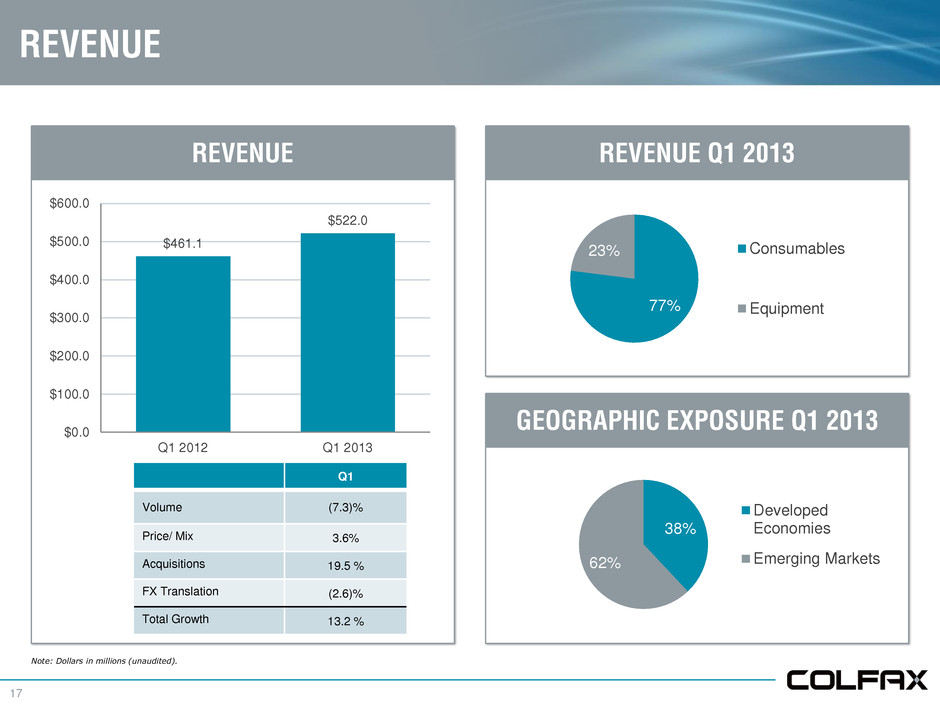
17 GEOGRAPHIC EXPOSURE Q1 2013 REVENUE $461.1 $522.0 $0.0 $100.0 $200.0 $300.0 $400.0 $500.0 $600.0 Q1 2012 Q1 2013 77% 23% Consumables Equipment REVENUE REVENUE Q1 2013 38% 62% Developed Economies Emerging Markets Note: Dollars in millions (unaudited). Q1 Volume (7.3)% Price/ Mix 3.6% Acquisitions 19.5 % FX Translation (2.6)% Total Growth 13.2 %
RESULTS OF OPERATIONS
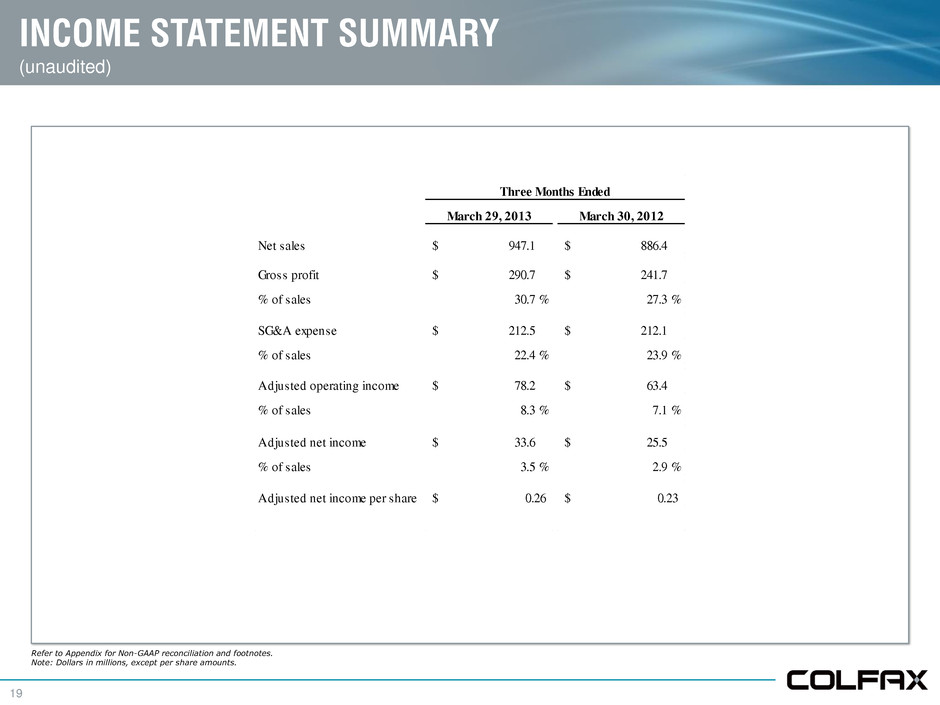
19 INCOME STATEMENT SUMMARY (unaudited) Refer to Appendix for Non-GAAP reconciliation and footnotes. Note: Dollars in millions, except per share amounts. March 29, 2013 March 30, 2012 Net sales 947.1$ 886.4$ Gross profit 290.7$ 241.7$ % of sales 30.7 % 27.3 % SG&A expense 212.5$ 212.1$ % of sales 22.4 % 23.9 % Adjusted operating income 78.2$ 63.4$ % of sales 8.3 % 7.1 % Adjusted net income 33.6$ 25.5$ % of sales 3.5 % 2.9 % Adjusted net income per share 0.26$ 0.23$ Three Months Ended

APPENDIX

21 DISCLAIMER Colfax has provided financial information that has not been prepared in accordance with GAAP. These non-GAAP financial measures are adjusted net income, adjusted net income per share, adjusted operating income, organic sales growth (decline) and organic order growth (decline). Adjusted net income, adjusted net income per share and adjusted operating income exclude asbestos coverage litigation expense, expenses related to major restructuring programs and expenses and significant year-one fair value adjustment amortization expense related to the Charter acquisition, to the extent they impact the periods presented. The effective tax rates used to calculate adjusted net income and adjusted net income per share are 30.5% for the first quarter of 2013 and 31% for the first quarter of 2012. Organic sales growth (decline) and organic order growth (decline) exclude the impact of acquisitions and foreign exchange rate fluctuations. These non-GAAP financial measures assist Colfax in comparing its operating performance on a consistent basis because, among other things, they remove the impact of asbestos insurance coverage issues and expenses, expenses and year-one fair value adjustment amortization expense related to the Charter acquisition and major restructuring programs. Sales and order information by end market are estimates. We periodically update our customer groupings order to refine these estimates.
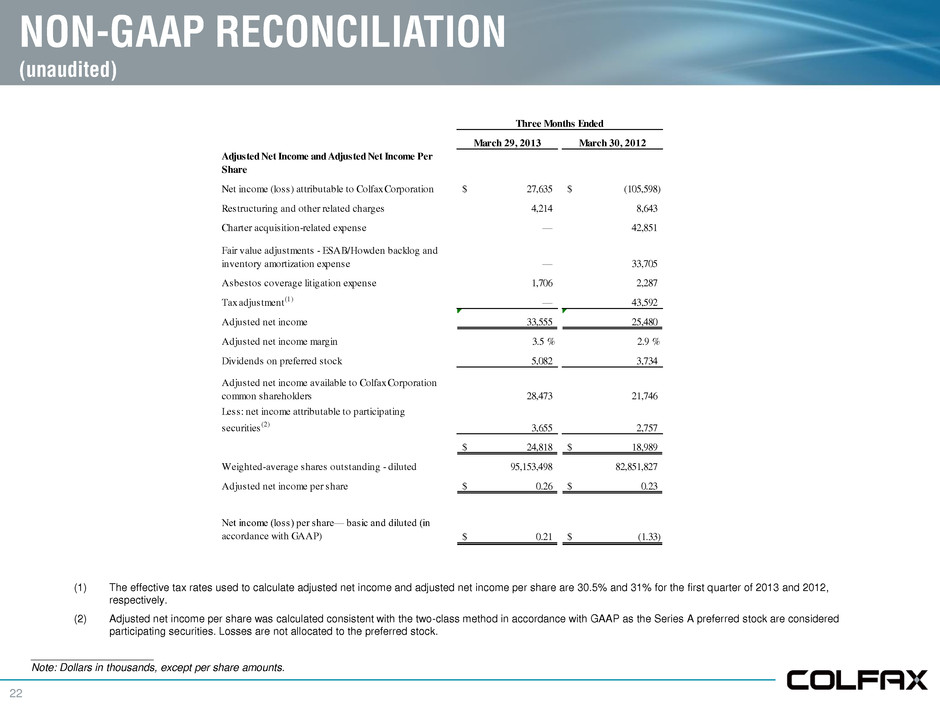
22 NON-GAAP RECONCILIATION (unaudited) (1) The effective tax rates used to calculate adjusted net income and adjusted net income per share are 30.5% and 31% for the first quarter of 2013 and 2012, respectively. (2) Adjusted net income per share was calculated consistent with the two-class method in accordance with GAAP as the Series A preferred stock are considered participating securities. Losses are not allocated to the preferred stock. _____________________ Note: Dollars in thousands, except per share amounts. March 29, 2013 March 30, 2012 Adjusted Net Income and Adjusted Net Income Per Share Net income (loss) attributable to Colfax Corporation 27,635$ (105,598)$ Restructuring and other related charges 4,214 8,643 Charter acquisition-related expense — 42,851 Fair value adjustments - ESAB/Howden backlog and inventory amortization expense — 33,705 Asbestos coverage litigation expense 1,706 2,287 Tax adjustment(1) — 43,592 Adjusted net income 33,555 25,480 Adjusted net income margin 3.5 % 2.9 % Dividends on preferred stock 5,082 3,734 Adjusted net income available to Colfax Corporation common shareholders 28,473 21,746 Less: net income attributable to participating securities (2) 3,655 2,757 24,818$ 18,989$ Weighted-average shares outstanding - diluted 95,153,498 82,851,827 Adjusted net income per share 0.26$ 0.23$ Net income (loss) per share— basic and diluted (in accordance with GAAP) 0.21$ (1.33)$ Three Months Ended
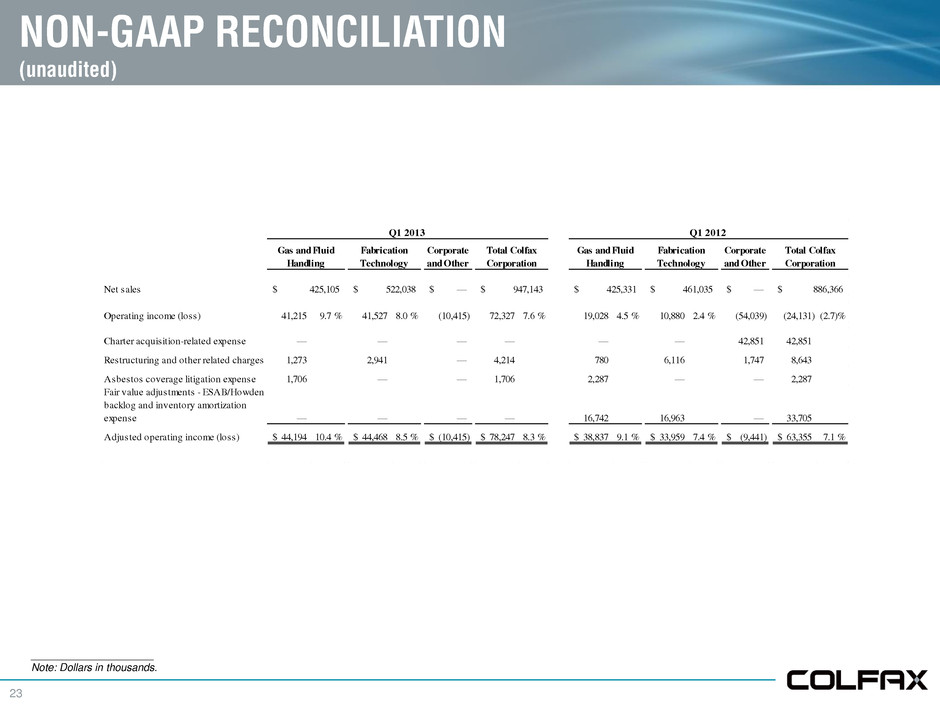
23 NON-GAAP RECONCILIATION (unaudited) _____________________ Note: Dollars in thousands. Corporate and Other Corporate and Other Net sales —$ —$ Operating income (loss) 41,215 9.7 % 41,527 8.0 % (10,415) 72,327 7.6 % 19,028 4.5 % 10,880 2.4 % (54,039) (24,131) (2.7)% Charter acquisition-related expense — — — — — — 42,851 42,851 Restructuring and other related charges 1,273 2,941 — 4,214 780 6,116 1,747 8,643 Asbestos coverage litigation expense 1,706 — — 1,706 2,287 — — 2,287 Fair value adjustments - ESAB/Howden backlog and inventory amortization expense — — — — 16,742 16,963 — 33,705 Adjusted operating income (loss) 44,194$ 10.4 % 44,468$ 8.5 % (10,415)$ 78,247$ 8.3 % 38,837$ 9.1 % 33,959$ 7.4 % (9,441)$ 63,355$ 7.1 % 886,366$ 425,105$ 522,038$ 947,143$ 425,331$ 461,035$ Q1 2013 Q1 2012 Gas and Fluid Handling Fabrication Technology Total Colfax Corporation Gas and Fluid Handling Fabrication Technology Total Colfax Corporation
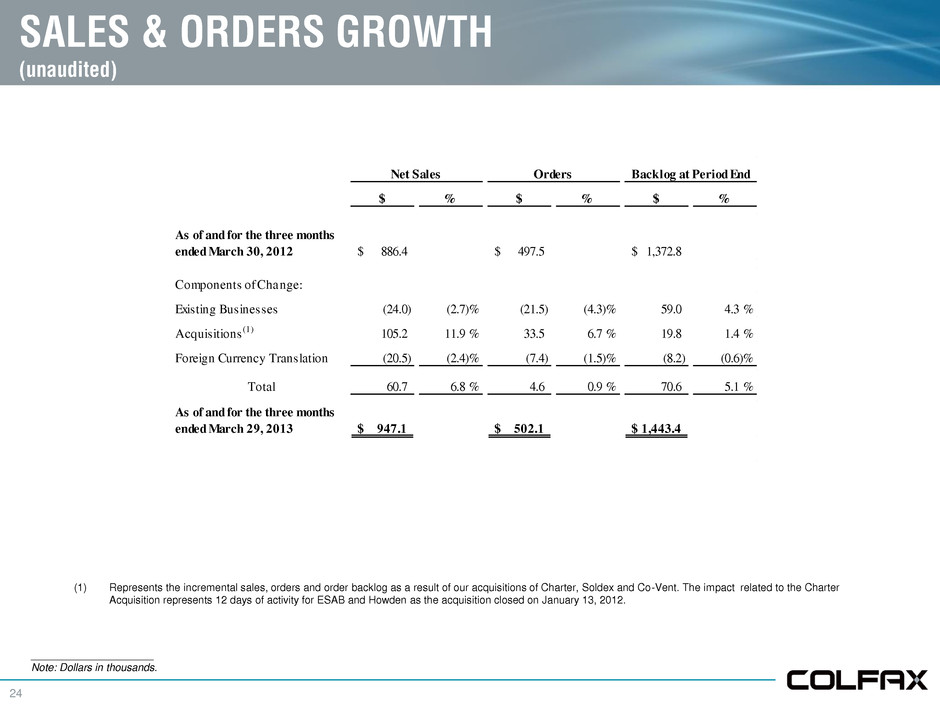
24 SALES & ORDERS GROWTH (unaudited) _____________________ Note: Dollars in thousands. $ % $ % $ % As of and for the three months ended March 30, 2012 886.4$ 497.5$ 1,372.8$ Components of Change: Existing Businesses (24.0) (2.7)% (21.5) (4.3)% 59.0 4.3 % Acquisitions (1) 105.2 11.9 % 33.5 6.7 % 19.8 1.4 % Foreign Currency Translation (20.5) (2.4)% (7.4) (1.5)% (8.2) (0.6)% Total 60.7 6.8 % 4.6 0.9 % 70.6 5.1 % As of and for the three months ended March 29, 2013 947.1$ 502.1$ 1,443.4$ Net Sales Orders Backlog at Period End (1) Represents the incremental sales, orders and order backlog as a result of our acquisitions of Charter, Soldex and Co-Vent. The impact related to the Charter Acquisition represents 12 days of activity for ESAB and Howden as the acquisition closed on January 13, 2012.


