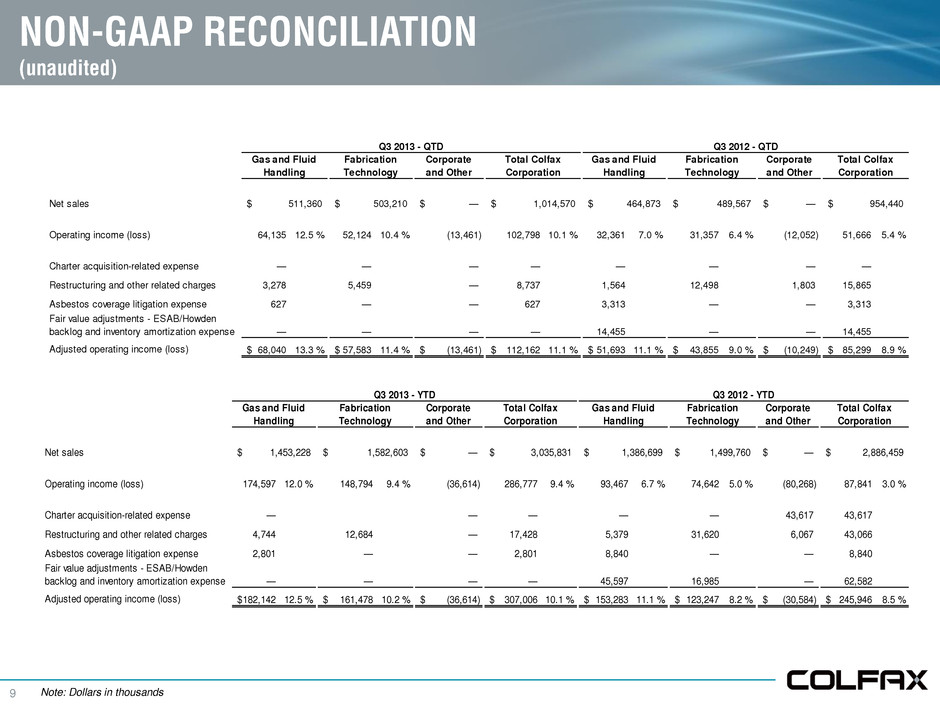
9 NON-GAAP RECONCILIATION (unaudited) Corporate and Other Corporate and Other Net sales —$ —$ Operating income (loss) 64,135 12.5 % 52,124 10.4 % (13,461) 102,798 10.1 % 32,361 7.0 % 31,357 6.4 % (12,052) 51,666 5.4 % Charter acquisition-related expense — — — — — — — — Restructuring and other related charges 3,278 5,459 — 8,737 1,564 12,498 1,803 15,865 Asbestos coverage litigation expense 627 — — 627 3,313 — — 3,313 Fair value adjustments - ESAB/Howden backlog and inventory amortization expense — — — — 14,455 — — 14,455 Adjusted operating income (loss) 68,040$ 13.3 % 57,583$ 11.4 % (13,461)$ 112,162$ 11.1 % 51,693$ 11.1 % 43,855$ 9.0 % (10,249)$ 85,299$ 8.9 % 954,440$ Q3 2013 - QTD Q3 2012 - QTD Gas and Fluid Handling Fabrication Technology Total Colfax Corporation Gas and Fluid Handling Fabrication Technology Total Colfax Corporation 511,360$ 503,210$ 1,014,570$ 464,873$ 489,567$ Corporate and Other Corporate and Other et sales —$ —$ Operating income (loss) 174,59 12.0 % 148,794 9.4 % (36,614) 286,777 9.4 % 93,467 6.7 % 74,642 5.0 % (80,268) 87,841 3.0 % Charter acquisition-related expense — — — — 43,617 43,617 Restructuring and other related charges 4,744 12,684 — 17,428 5,379 31,620 6,067 43,066 Asbestos coverage litigation expense 2,801 — — 2,801 8,840 — — 8,840 Fair value adjustments - ESAB/Howden backlog and inventory amortization expense — — — — 45,597 16,985 — 62,582 Adjusted operating income (loss) 182,142$ 12.5 % 161,478$ 10.2 % (36,614)$ 307,006$ 10.1 % 153,283$ 11.1 % 123,247$ 8.2 % (30,584)$ 245,946$ 8.5 % 2,886,459$ Q3 2013 - YTD Q3 2012 - YTD Gas and Fluid Handling Fabrication Technology Total Colfax Corporation Gas and Fluid Handling Fabrication Technology Total Colfax Corporation 1,453,228$ 1,582,603$ 3,035,831$ 1,386,699$ 1,499,760$ Note: Dollars in thousands
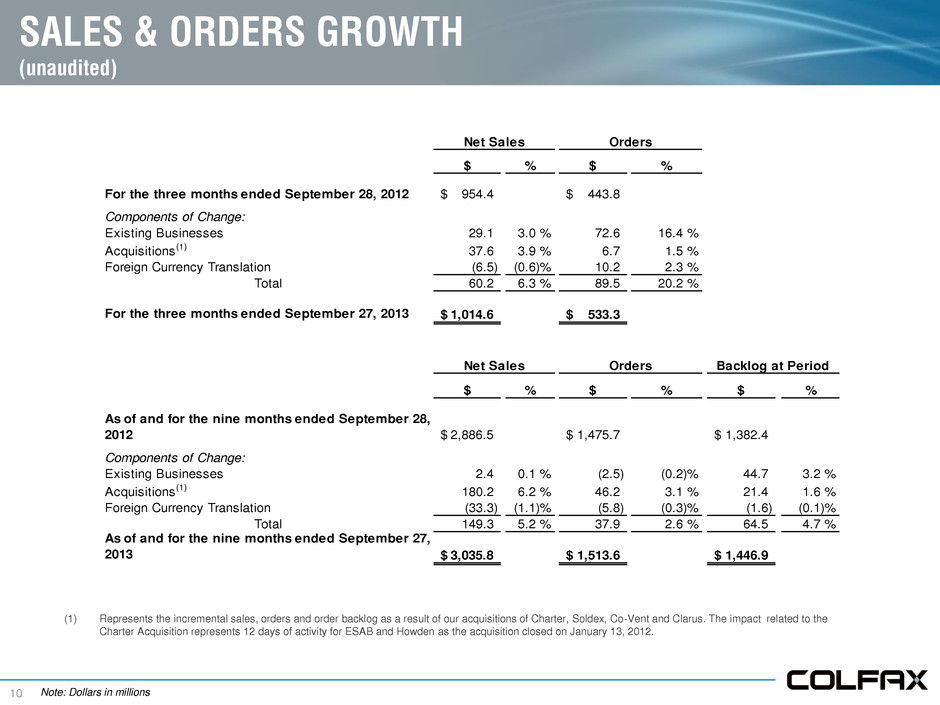
10 SALES & ORDERS GROWTH (unaudited) (1) Represents the incremental sales, orders and order backlog as a result of our acquisitions of Charter, Soldex, Co-Vent and Clarus. The impact related to the Charter Acquisition represents 12 days of activity for ESAB and Howden as the acquisition closed on January 13, 2012. $ % $ % For the three months ended September 28, 2012 954.4$ 443.8$ Components of Change: Existing Businesses 29.1 3.0 % 72.6 16.4 % Acquisitions(1) 37.6 3.9 % 6.7 1.5 % Foreign Currency Translation (6.5) (0.6)% 10.2 2.3 % Total 60.2 6.3 % 89.5 20.2 % For the three months ended September 27, 2013 1,014.6$ 533.3$ $ % $ % $ % As of and for the nine months ended September 28, 2012 2,886.5$ 1,475.7$ 1,382.4$ Components of Change: Existing Businesses 2.4 0.1 % (2.5) (0.2)% 44.7 3.2 % Acquisitions(1) 180.2 6.2 % 46.2 3.1 % 21.4 1.6 % Foreign Currency Translation (33.3) (1.1)% (5.8) (0.3)% (1.6) (0.1)% Total 149.3 5.2 % 37.9 2.6 % 64.5 4.7 % As of and for the nine months ended September 27, 2013 3,035.8$ 1,513.6$ 1,446.9$ Backlog at Period Net Sales Orders Net Sales Orders Note: Dollars in millions

