
1 INVESTOR PRESENTATION August 2016 Filed by Easterly Acquisition Corp. Pursuant to Rule 425 under the Securities Act of 1933 Subject Company: Sungevity, Inc. Commission File No.: 132-02806

2 NO OFFER OR SOLICITATION The information in this communication is for informational purposes only and is neither an offer to sell or purchase, nor the solicitation of an offer to buy or sell any securities, nor is it a solicitation of any vote, consent, or approval in any jurisdiction pursuant to or in connection with the proposed transaction or otherwise, nor shall there be any sale, issuance or transfer of securities in any jurisdiction in contravention of applicable law. No offer of securities shall be made except by means of a prospectus meeting the requirements of Section 10 of the Securities Act of 1933, as amended, and otherwise in accordance with applicable law. CERTAIN INFORMATION This communication includes information based on independent industry publications and other sources. Although we believe that the data presented is reliable, we have not independently verifi ed such information. ADDITIONAL INFORMATION AND WHERE TO FIND IT This communication relates to a proposed business combination between Easterly Acquisition Corp. (“Easterly”) and Sungevity, Inc. (“Sungevity”) and may be deemed to be solicitation material in respect of the proposed business combination between Easterly and Sungevity. The proposed business combination will be submitted to the respective stockholders of Easterly and Sungevity for their approval. In connection with the proposed business combination, Easterly fi led a registration statement on Form S-4 and preliminary joint proxy and consent solicitation statement/prospectus forming a part thereof on July 20, 2016 with the U.S. Securities and Exchange Commission (“SEC”). This communication is not a substitute for the registration statement and preliminary joint proxy and consent solicitation statement/prospectus that Easterly fi led with the SEC or any other documents that Sungevity or Easterly may fi le with the SEC or send to stockholders in connection with the proposed transaction. The registration statement and preliminary joint proxy and consent solicitation statement/prospectus contains important information about Easterly, Sungevity, the proposed business combination and related matters. Investors and security holders are urged to read the registration statement and preliminary joint proxy and consent solicitation statement/prospectus carefully. A copy of the defi nitive joint proxy and consent solicitation statement/prospectus will be sent when available to all stockholders of Easterly and Sungevity seeking the required stockholder approval. Investors and stockholders can obtain free copies of the registration statement and preliminary joint proxy and consent solicitation statement/prospectus and other documents fi led with the SEC by Easterly through the web site maintained by the SEC at www.sec.gov. In addition, investors and stockholders can obtain free copies of the registration statement and preliminary joint proxy and consent solicitation statement/prospectus from Easterly by accessing Easterly’s website at www.easterlyacquisition.com. PARTICIPANTS IN SOLICITATION Easterly and Sungevity, and their respective directors and executive offi cers, may be deemed participants in the solicitation of proxies of Easterly stockholders in respect of the proposed business combination. Information about the directors and executive offi cers of Easterly and Sungevity and more detailed information regarding the identity of all potential participants, and their direct and indirect interests, by security holdings or otherwise, are set forth in Easterly’s registration statement on Form S-4 and preliminary joint proxy and consent solicitation statement/prospectus. Investors may obtain additional information about the interests of such participants by reading such registration statement and preliminary joint proxy and consent solicitation statement/prospectus. FORWARD-LOOKING STATEMENTS This communication contains “forward-looking statements” within the meaning of Section 21E of the Securities Exchange Act of 1934, as amended, and the Private Securities Litigation Reform Act of 1995, known as the PSLRA. Forward-looking statements may relate to the proposed business combination between Easterly and Sungevity and any other statements relating to future results, strategy and plans of Easterly and Sungevity (including certain projections and business trends, and statements which may be identifi ed by the use of the words “plans”, “expects” or “does not expect”, “estimated”, “is expected”, “budget”, “scheduled”, “estimates”, “forecasts”, “intends”, “anticipates” or “does not anticipate”, or “believes”, or variations of such words and phrases or state that certain actions, events or results “may”, “could”, “would”, “might”, “projects”, “will” or “will be taken”, “occur” or “be achieved”). Forward-looking statements are based on the opinions and estimates of management of Easterly or Sungevity, as the case may be, as of the date such statements are made, and they are subject to known and unknown risks, uncertainties, assumptions and other factors that may cause the actual results, level of activity, performance or achievements to be materially different from those expressed or implied by such forward-looking statements. For Sungevity, these risks and uncertainties include, but are not limited to, its revenues and operating performance, the ability to obtain additional fi nancing, general economic conditions, industry trends, legislation or regulatory requirements affecting the business in which it is engaged, management of growth, amount of redemptions, its business strategy and plans, fl uctuations in customer demand, the result of future fi nancing efforts and its dependence on key personnel. For Easterly, factors include, but are not limited to, the successful combination of Easterly with Sungevity’s business, the ability to retain key personnel and the ability to achieve stockholder and regulatory approvals and to successfully close the transaction. Additional information on these and other factors that may cause actual results and Easterly’s performance to differ materially is included in Easterly’s periodic reports fi led with the SEC, including but not limited to Easterly’s Form 10-K for the year ended December 31, 2015 and subsequent Forms 10-Q. Copies may be obtained by contacting Easterly or the SEC. Readers are cautioned not to place undue reliance upon any forward-looking statements, which speak only as of the date made. These forward-looking statements are made only as of the date hereof, and Easterly undertakes no obligations to update or revise the forward-looking statements, whether as a result of new information, future events or otherwise, except as required by law. PROJECTIONS Any estimates, forecasts or projections set forth in this presentation have been prepared by Sungevity and/or Easterly management in good faith on a basis believed to be reasonable. Such estimates, forecasts and projections involve signifi cant elements of subjective judgment and analysis as well as risks (many of which are beyond our control). As such, no representation can be made as to the attainability of our forecasts and projections. Investors are cautioned that such estimates, forecasts or projections have not been audited and have not been prepared in conformance with generally accepted accounting principles. For a listing of risks and other factors that could impact our ability to attain our projected results, please see “Forward-Looking Statements” above. USE OF NON-GAAP FINANCIAL MEASURES This communication includes non-GAAP fi nancial measures. Defi nitions of these non-GAAP fi nancial measures and reconciliations of these non-GAAP fi nancial measures to the most directly comparable GAAP fi nancial measures are included elsewhere in this communication. DISCLAIMERS

3 TRANSACTION OVERVIEW Darrell W. Crate Chairman of the Board of Directors of Easterly Acquisition Corp. Avshalom Kalichstein Chief Executive Offi cer and Director of Easterly Acquisition Corp. Andrew Birch CEO and Co-Founder of Sungevity, Inc. PRESENTERS SUMMARY OF TRANSACTION Sungevity, Inc. combining with Easterly Acquisition Corp.(1) • Expected Sungevity ownership at close: 59% • Expected EACQ ownership at close: 41% New company becomes Sungevity Holdings, Inc. • Nasdaq ticker: SGVT • Sungevity management stays in place • Andrew Birch, Darrell Crate, and Avshalom Kalichstein continue on board of the combined company Sungevity shareholders receive: • Balance sheet to support growth • Liquidity for stockholders and employees • Access to public markets • Access to Easterly expertise Easterly shareholders receive: • Entry to high growth solar market with asset-light model • Access to over 9 years of investment in the platform • Partnership with top-tier management team (1) See slide 24 for details.

4 TRANSACTION HIGHLIGHTS Projected to be Cash Flow Positive by Year End 2016. 2018 Adj. EBITDA Expected to be up to $90mm(2) Experienced Management Team with Strong Customer Experience Culture Industry-Leading Customer Acquisition Platform & Channel Partner Network Revenue Growth Compounding at 68%(1) Scalable Business: Asset-Light Platform Model Well Capitalized with up to $200mm New Cash Well Positioned to Grow Along the Expected Solar Adoption Curve (1) Represents period from 2015 to 2018E. See slide 21 for detail. (2) Adjusted EBITDA; upper bound of stated guidance range. See slide 20 for detail.

5 The leading solar technology platform that maximizes growth from channel partnerships, customer referrals, and supply chain partners • Asset-light business that manages sales process, automates design, and outsources origination, hardware, installation, fi nancing, and services for residential and commercial markets • Provides best-in-class customer experience leveraging technology for effi cient customer acquisition • Customer-focused with multiple product and fi nancing options • 77% deployed systems CAGR over the past fi ve years • Serves over 25,000(1) customers with world-class net promoter score of 65(2) WHO WE ARE ASSETLIGHT BUSINESS MODEL (1) As of June 30, 2016. (2) Represents average fi ve year period ending March 31, 2016. INTRODUCTION TO SUNGEVITY Focused on key value-added activities Do own the customer relationship Do own the software platform Do own network of partnerships . . . Do not own trucks or installers Do not own manufacturing Do not have a fi nancial company balance sheet . . . Germany Netherlands Belgium Sungevity offi ces
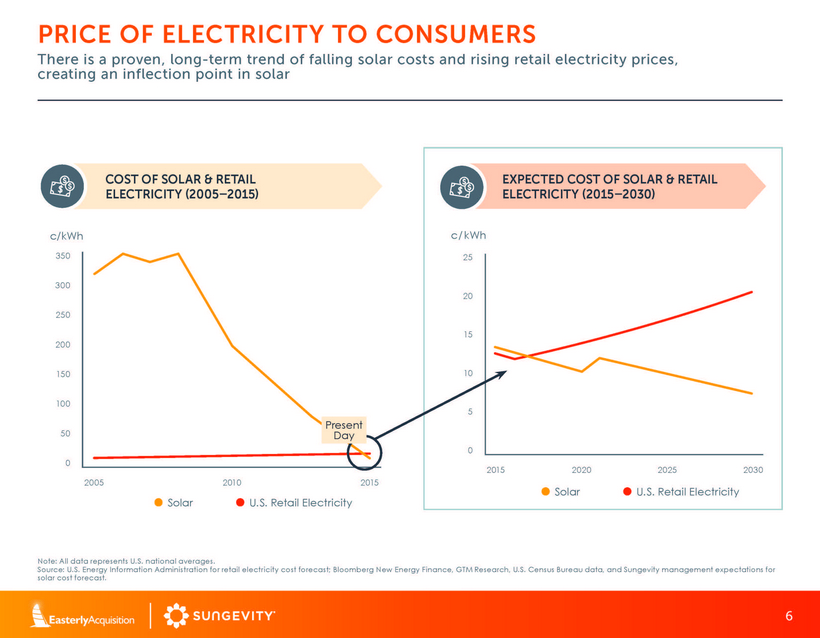
6 PRICE OF ELECTRICITY TO CONSUMERS There is a proven, long-term trend of falling solar costs and rising retail electricity prices, creating an inflection point in solar 300 350 250 200 150 100 50 0 2005 2010 2015 c/kWh Solar U.S. Retail Electricity Note: All data represents U.S. national averages. Source: U.S. Energy Information Administration for retail electricity cost forecast; Bloomberg New Energy Finance, GTM Research, U.S. Census Bureau data, and Sungevity management expectations for solar cost forecast. COST OF SOLAR & RETAIL ELECTRICITY 20052015 EXPECTED COST OF SOLAR & RETAIL ELECTRICITY 20152030 Solar U.S. Retail Electricity 25 20 15 10 5 0 2015 2020 2025 2030 c/ kWh Present Day

7 RESIDENTIAL SOLAR ADOPTION AT AN INFLECTION POINT Improving customer economics and increasing awareness drive high growth in solar Source: GTM Research U.S. Solar Market Insight, 2015 Year in Review (March 2016). Annual U.S. Residential Solar Installations (MW) 2000 2001 2002 2003 2004 2005 2006 2007 2008 2009 2010 2011 2012 2013 2014 2015 2016E 2017E 2018E 2019E 2020E 6,000 5,000 4,000 3,000 2,000 1,000 0 35% CAGR from 2011

8 RESIDENTIAL SOLAR MARKET IS GROWING RAPIDLY As more residential households reach grid parity, the addressable market for solar customers is expected to grow significantly Source: GTM Research, U.S. Census Bureau with Easterly and Sungevity management estimates. Includes U.S. only. 2015 2020E Cumulative residential solar installs: 4.3 million Households for which solar is expected to be cheaper than retail: 88 million 4.8x growth from 2015 Cumulative residential solar installs: 0.9 million Estimated households for which solar would be cheaper than retail: 35 million 2.5x growth from 2015
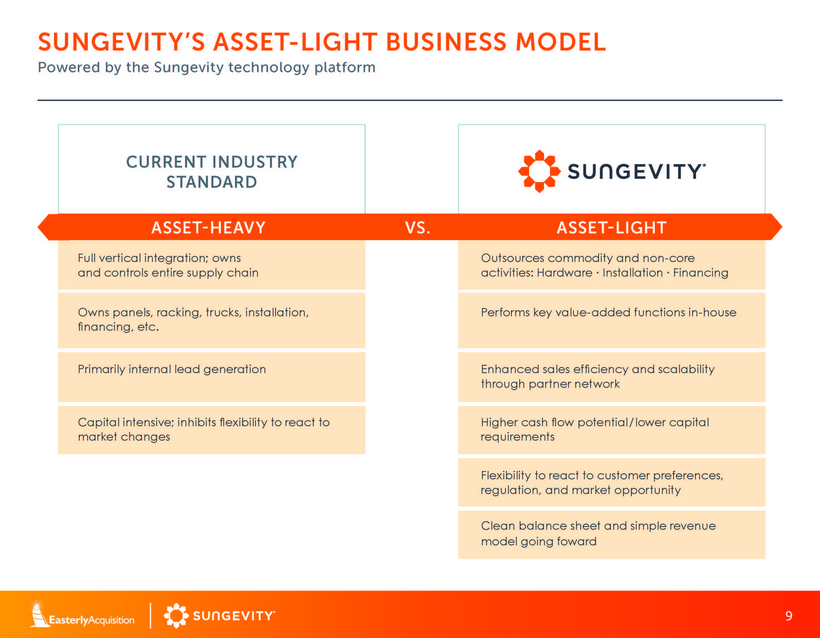
9 Outsources commodity and non-core activities: Hardware · Installation · Financing Flexibility to react to customer preferences, regulation, and market opportunity Enhanced sales effi ciency and scalability through partner network Clean balance sheet and simple revenue model going foward Capital intensive; inhibits fl exibility to react to market changes Higher cash fl ow potential/ lower capital requirements Primarily internal lead generation Owns panels, racking, trucks, installation, fi nancing, etc. Performs key value-added functions in-house Full vertical integration; owns and controls entire supply chain ASSETHEAVY ASSETLIGHT SUNGEVITY’S ASSET-LIGHT BUSINESS MODEL VS. CURRENT INDUSTRY STANDARD Powered by the Sungevity technology platform

10 DIFFERENTIATED TECHNOLOGY CREATES THE SOLAR PLATFORM COMPANY WITH ROBUST NETWORK OF PARTNERS High-quality partnerships drive growth, cost optimization, and capital efficiency LEAD GEN + QUALIFICATION INSTALLATION SERVICE USAGE + DESIGN SALE REFERRAL SUNGEVITY STANDARDIZED INSANE CUSTOMER EXPERIENCE SELECTED PARTNERS Network of >50 professional installation companies FINANCING 25,000+ delighted customers • Referrals • Direct Marketing • Inside Sales • Outside Sales • Sunshine Referral Network • System Design SUNGEVITY TECHNOLOGY PLATFORM

11 PIONEERING SOLAR PLATFORM TECHNOLOGY Seamless upfront experience, increased operational efficiency, and ongoing customer engagement provide customers with a consistent, high-quality experience FIRST TO AUTOMATE DESIGN QUICKLY AND EASILY REFER FRIENDS TRACK INSTALLATION ONLINE iQUOTE: FIRST TO TAKE SOLAR ONLINE AUTOMATED HOME VISIT ONGOING MONITORING OF PRODUCTION DATA
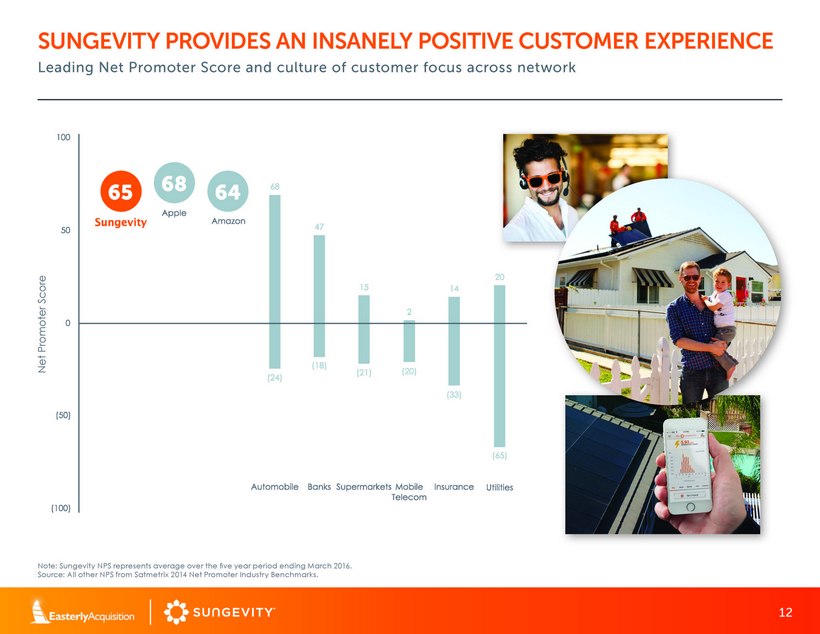
12 SUNGEVITY PROVIDES AN INSANELY POSITIVE CUSTOMER EXPERIENCE Leading Net Promoter Score and culture of customer focus across network Note: Sungevity NPS represents average over the fi ve year period ending March 2016. Source: All other NPS from Satmetrix 2014 Net Promoter Industry Benchmarks. Net Promoter Score

13 Home Batteries 20YEAR CUSTOMER RELATIONSHIPS PRESENT FUTURE OPPORTUNITIES TO FURTHER MONETIZE CUSTOMER BASE Energy-Effi cient Appliances Smart Home Energy Monitoring and Management EV Charging

14 STRONG AND CAPABLE EXECUTIVE MANAGEMENT TEAM Sungevity is led by seasoned and proven executives Andrew Birch CEO and Co-Founder To Be Announced Chief Financial Offi cer Cayce Roy Chief Operating Offi cer Susan Hollingshead Chief Administrative and People Offi cer Peter Graf Chief Product Offi cer Steve Atherton Chief Technology Offi cer Dave Dunlap Chief Development Offi cer Jan Slaghekke Chief Global Offi cer • CEO since 2008 • Previously Business Development Manager for BP Solar • Also served as Vice President at Bear Stearns and at Cazenove & Co • 25 years of experience with logistics and supply chain • 7 years in operations leadership roles at Amazon - Improved both transportation network and fulfillment operations - Built Amazon Marketplace • 20+ years of experience in enterprise software • 18 years at SAP - Co-founder of SAP Marketplace spin-off - EVP roles in marketing, platform development, and sustainability • 20+ years of tech-enabled services companies experience across sales, marketing, product management, IT, and operations • Previously served as SVP of Worldwide Operations at ServiceSource

15 FINANCIAL REVIEW

16 Sungevity Systems Deployed Annually PROVEN TRACK RECORD OF SYSTEMS GROWTH Note: Includes U.S. residential and international. CAGR is tied to midpoint of stated guidance range. Based on Sungevity management's expectations. 63% CAGR Sungevity, with Easterly, is well positioned to take advantage of the solar adoption curve

17 PLATFORM MODEL ENABLES RAPID SCALABILITY Uniquely positioned to tap into large market of motivated partners (1) U.S. only.
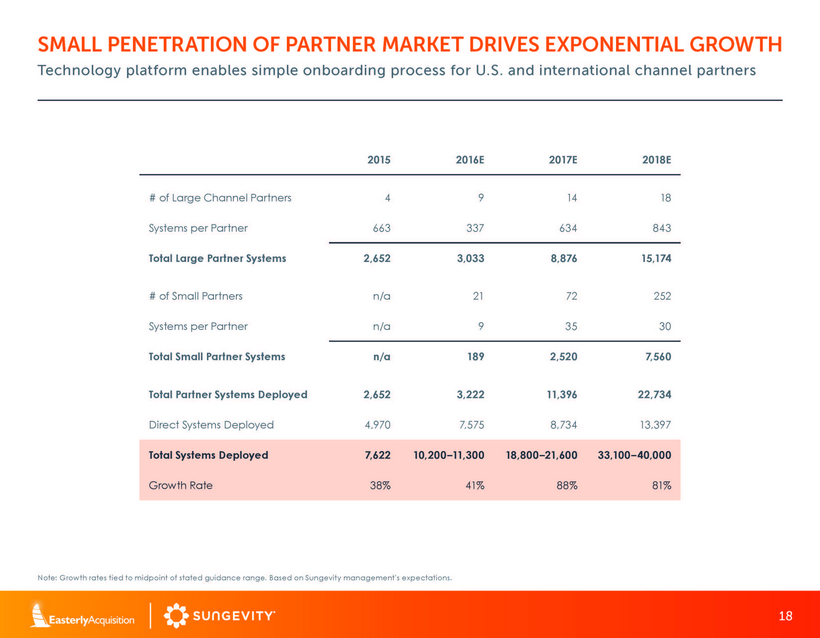
18 SMALL PENETRATION OF PARTNER MARKET DRIVES EXPONENTIAL GROWTH Technology platform enables simple onboarding process for U.S. and international channel partners 2015 2016E 2017E 2018E # of Large Channel Partners 4 9 14 18 Systems per Partner 663 337 634 843 Total Large Partner Systems 2,652 3,033 8,876 15,174 # of Small Partners n/a 21 72 252 Systems per Partner n/a 9 35 30 Total Small Partner Systems n/a 189 2,520 7,560 Total Partner Systems Deployed 2,652 3,222 11,396 22,734 Direct Systems Deployed 4,970 7,575 8,734 13,397 Total Systems Deployed 7,622 10,200–11,300 18,800–21,600 33,100–40,000 Growth Rate 38% 41% 88% 81% Note: Growth rates tied to midpoint of stated guidance range. Based on Sungevity management's expectations.

19 SIMPLE FINANCIAL MODEL Sungevity has a simple business model that requires focus on only a few key drivers = Total Contribution x Number of Deployed Systems = EBITDA – Fixed Costs Average Selling Price per System – COGS per System – Variable Operating Costs per System = Contribution per System

20 EBITDA BUILDUP Midpoint of Projections 2015A 2016E 2017E 2018E Average Selling Price per System ($) $19,116 $18,343 $18,079 $18,046 COGS per System ($) $13,743 $12,192 $10,591 $10,401 Variable Operating Costs per System ($) $9,383 $5,145 $3,633 $3,616 Contribution per System ($4,010) $1,006 $3,856 $4,029 Residential Deployed Systems 7,622 ~11,000 ~20,000 ~37,000 Residential Contribution ($mm) ($31) $11 $78 $146 Commercial Contribution ($mm) ($1) $3 $2 $3 Fixed Costs ($mm) $67 $75 $73 $77 Adjusted EBITDA Guidance(1) ($mm) ($99) ($63)–($58) $0–$15 $52–$90 Note: Residential includes U.S. and international. Numbers rounded to nearest whole number. (1) Numbers are midpoints of stated guidance range. Simple model provides clear picture of cash generation

21 FINANCIAL SUMMARY Sungevity expects to be cash flow breakeven by the end of 2016 (1) See page 22 for reconciliation. GAAP revenue does not take into account timing difference and cash infl ows between deployment and interconnection of systems that have been installed, but not yet recognized as revenue. (2) Growth rates tied to midpoints of stated guidance range. (3) EBITDA is a non-GAAP measure; see page 23 for a reconciliation to GAAP. See page 20 for EBITDA build-up. (4) Based on Sungevity management’s projections; assumes business combination with Easterly closes in 2016. (5) CAGRs are midpoints of stated guidance range. ($ in millions) Actual Projected(4) 2015 2016E 2017E 2018E GAAP Revenue(1) $151 $200–$220 $340–$390 $595–$720 % Growth(2) 41% 39% 74% 80% Adjusted EBITDA(3) ($99) ($63)–($58) $0–$15 $52–$90 % Margin n/a n/a 0%–4% 7%–15% Systems Deployed 7,622 10,200–11,300 18,800–21,600 33,100–40,000 REVENUE5 20152018E 68% CAGR SYSTEMS DEPLOYED4 20152018E 69% CAGR
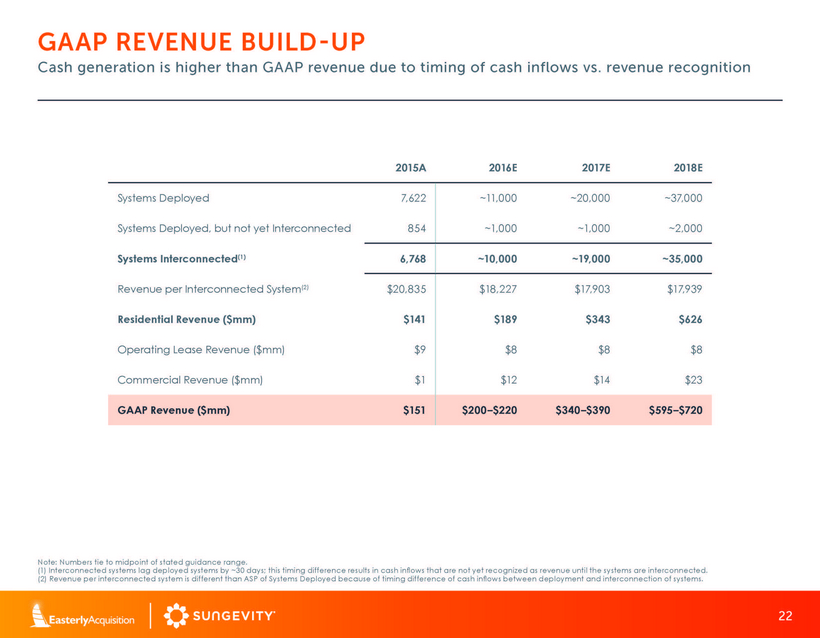
22 GAAP REVENUE BUILDUP 2015A 2016E 2017E 2018E Systems Deployed 7,622 ~11,000 ~20,000 ~37,000 Systems Deployed, but not yet Interconnected 854 ~1,000 ~1,000 ~2,000 Systems Interconnected(1) 6,768 ~10,000 ~19,000 ~35,000 Revenue per Interconnected System(2) $20,835 $18,227 $17,903 $17,939 Residential Revenue ($mm) $141 $189 $343 $626 Operating Lease Revenue ($mm) $9 $8 $8 $8 Commercial Revenue ($mm) $1 $12 $14 $23 GAAP Revenue ($mm) $151 $200–$220 $340–$390 $595–$720 Note: Numbers tie to midpoint of stated guidance range. (1) Interconnected systems lag deployed systems by ~30 days; this timing difference results in cash infl ows that are not yet recognized as revenue until the systems are interconnected. (2) Revenue per interconnected system is different than ASP of Systems Deployed because of timing difference of cash infl ows between deployment and interconnection of systems. Cash generation is higher than GAAP revenue due to timing of cash inflows vs. revenue recognition

23 2015 AND Q1 2016 NET INCOME TO ADJUSTED EBITDA RECONCILIATION (in millions) 2015A Q1 2016A GAAP Net Income ($126) ($27) $1 ($0) $1 $1 + Timing difference: installation vs. interconnection(1) + Depreciation & amortization + Stock-based comp $4 $1 - Operating lease gross (profi t)/loss(2) ($4) ($1) + Non-current warranty expense $3 $1 + Interest expense, net $24 $4 + Fair value of warrants gain/(loss) ($2) $3 - Loss on other income (gain) $1 $0 - Taxes ($1) ($1) =Adjusted EBITDA ($99) ($19) Source: Audited financials for 2015 and reviewed Q1 2016 financials, except ‘Adjusted EBITDA’ and ‘Timing difference: installation vs. interconnection,' which are management estimates. Note: Sungevity is unable to reconcile the forward-looking projections of Adjusted EBITDA to GAAP net income (loss) because the nature and amount of the constituent adjustments are subject to a number of variables and cannot be estimated at this time. The information that is unavailable at this time consists of warrant expense treatment upon deal closing, tax treatment, and tax equity partnership treatment for Q2-4 2016, 2017, and 2018. The outcome of these variables are likely to have a material impact on Sungevity’s GAAP net income (loss). (1) Timing difference results in cash infl ows that are not yet recognized as revenue until the systems are interconnected. (2) Removes gross margin attributable to leases not sold under MSAs, which were initiated between 2010-2014.

24 TRANSACTION STRUCTURE Anticipated Use of Proceeds: • Accelerate partnership strategy and geographic expansion • Further barrier to entry through technological development • Provides permanence for channel partners • Selective mergers and acquisitions • Differentiation through clean balance sheet (1) Assumes no redemptions. (2) An additional 4.80 million shares will be approved and reserved for stock or option grants and/or restricted future stock units. (3) Expected to be struck at greater of $11.50 or prevailing market price at grant. (4) Assumes no redemptions and up to $10 million in transaction fees and expenses. (5) Estimated fees, including deferred IPO underwriting fee, legal fees, and transaction advisory fees, and other transaction expenses. Warrants and Options Outstanding (Shares in millions) Amount Strike Price Expiration Notes Warrants–Public 10.00 $11.50 5 Years Redeemable when share price reaches $18.00 Warrants–Easterly Sponsor 6.75 $11.50 5 Years Non-redeemable Management Options(2) 4.80 $11.50(3) 10 Years 4-year vesting with 1-year cliff Anticipated Pro-Forma Ownership at Closing(1) (in millions) # of Shares % of Shares Current Sungevity Securityholders and Management 35.7 58.9% Existing Easterly Shareholders 25.0 41.1% Total 60.7 100.0% Sources and Uses of Capital Sources of Capital Uses of Capital Easterly Cash in Trust ($mm) $200.0 Cash to Balance Sheet(4)($mm) $190.0 Transaction Fees and Expenses(5)($mm) 10.0 Total $200.0 Total $200.0

25 TRANSACTION HIGHLIGHTS (1) Represents period from 2015 to 2018E. See slide 21 for detail. (2) Adjusted EBITDA; upper bound of stated guidance range. See slide 20 for detail. Projected to be Cash Flow Positive by Year End 2016. 2018 Adj. EBITDA Expected to be up to $90mm(2) Experienced Management Team with Strong Customer Experience Culture Industry-Leading Customer Acquisition Platform & Channel Partner Network Revenue Growth Compounding at 68%(1) Scalable Business: Asset-Light Platform Model Well Capitalized with up to $200mm New Cash Well Positioned to Grow Along the Expected Solar Adoption Curve

26 APPENDIX
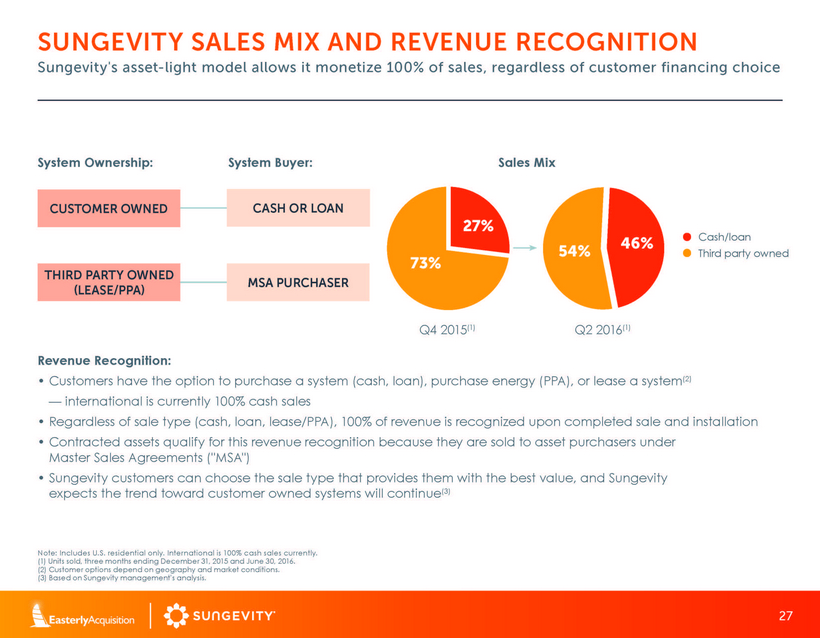
27 SUNGEVITY SALES MIX AND REVENUE RECOGNITION Note: Includes U.S. residential only. International is 100% cash sales currently. (1) Units sold, three months ending December 31, 2015 and June 30, 2016. (2) Customer options depend on geography and market conditions. (3) Based on Sungevity management's analysis. Sungevity's asset-light model allows it monetize 100% of sales, regardless of customer financing choice Revenue Recognition: • Customers have the option to purchase a system (cash, loan), purchase energy (PPA), or lease a system(2) — international is currently 100% cash sales • Regardless of sale type (cash, loan, lease/PPA), 100% of revenue is recognized upon completed sale and installation • Contracted assets qualify for this revenue recognition because they are sold to asset purchasers under Master Sales Agreements ("MSA") • Sungevity customers can choose the sale type that provides them with the best value, and Sungevity expects the trend toward customer owned systems will continue(3) System Ownership: System Buyer: Sales Mix Q4 2015(1) Q2 2016(1) CUSTOMER OWNED CASH OR LOAN MSA PURCHASER THIRD PARTY OWNED LEASE/PPA 73% 27% 54% 46% Cash/loan Third party owned

28 DEPLOYED SYSTEMS QUARTERLY SEASONALITY Note: Percentages represent three year averages of deployed residential systems by quarter in the U.S. and international from 2014 through 2016E. Higher system deployments in H2 driven by sales seasonality 19% 20% 21% 35% Historical range of deployed residential systems 21% 23% 25% 30%

29 Sungevity expects to be cash flow breakeven by the end of 2016 (1) Based on Sungevity management's projections; total system costs are rounded to the nearest dollar. (2) Percentage reduction from $18,633 to $15,350. Cost reduction driven by concrete, measurable steps taken in 2015/2016: CUSTOMER ACQUISITION • Automation of sales processes has increased conversion rate • Optimized lead generation • Decreased cancellation rate • Improved sales fl ow process • Increased product mix to suit customer needs FULFILLMENT • Shortened time from sale to installation by 20–30 days • New offi ce in less costly labor market • Installer automation tool (BEAM) deployment LABOR • Market competition drives better pricing • New contracts online in H2 2016 HARDWARE • New contracts LOWER UNIT COSTS AND HIGHER SALES VOLUMES DRIVE CASH FLOW BREAKEVEN MILESTONE -18%(2)

30 EBITDA RECONCILIATION ($ in millions) 2015A 2016E 2017E 2018E GAAP (Loss)/Profi t from Operations ($105) ($75) ($17) $38 +Depreciation & amortization $1 $6 $3 $3 + Stock-based comp $4 $4 $4 $4 + Non-current warranty expense $3 $5 $11 $19 - Operating lease gross (profi t)/loss(1) ($4) ($4) ($4) ($4) + Timing difference: installation vs. interconnection(2) $1 $4 $10 $12 =Adjusted EBITDA ($99) ($61) $7 $72 Note: Numbers tie to midpoint of stated guidance range. Numbers rounded to nearest whole number. (1) Removes gross margin attributable to leases not sold under MSAs, which were initiated between 2010-2014. (2) Timing difference results in cash infl ows that are not yet recognized as revenue until the systems are interconnected.

31 BALANCE SHEET SUMMARY Sungevity has a simple balance sheet Source: Sungevity unaudited financials. Some figures do not match reviewed Q1 2016 financials due to rounding. (1) Does not include all anticipated transaction adjustments (e.g. change in warrant liabilities, assumption of Easterly liabilities, etc.), assumes no redemptions. (2) Includes restricted cash, prepaid expenses, goodwill, and other assets. (3) Includes deferred lease and rebate revenue, lease pass-through financing obligations, and other liabilities. (4) Total Shareholders Equity and other includes convertible redeemable stock, redeemable non-controlling interest and stockholders’ deficit. ($ in millions; as of 3/31/16) GAAP Actuals Transaction Adjustments(1) Adjusted Cash and cash equivalents $14.6 $200.0 $214.6 Accounts and rebates receivable $8.7 $8.7 Inventory $36.7 $36.7 Solar energy systems, net $77.2 $77.2 Property and equipment $7.6 $7.6 Other assets(2) $18.0 $18.0 Total assets $162.7 $362.7 Accounts payable and accrued liabilities $42.8 $42.8 Deferred revenue $50.6 $50.6 Debt $69.1 $69.1 Warrant liabilities $12.1 $12.1 Other liabilities(3) $16.0 $16.0 Total Liabilities $190.7 $190.7 Total Shareholders Equity and other(4) ($27.9) $200.0 $172.1 Total Liabilities and Shareholders Equity $162.7 $362.7

32 SIGNIFICANT EXPERIENCE GROWING PLATFORM BUSINESSES Darrell W. Crate Chairman of the Board of Directors, Easterly Acquisition Corp. 26+ Years Experience Avshalom Kalichstein Chief Executive Offi cer and Director, Easterly Acquisition Corp. 19+ Years Experience • Co-founded Easterly LLC in September 2009 • Chairman of the Board and co-founder of Easterly Government Properties (NYSE: DEA), a top decile performer among all U.S. REITs • CFO of Affiliated Managers Group (NYSE: AMG) from 1998 to 2011; during this time, AUM grew from $50bn to $340bn and firm valuation grew from $450mm to $6bn • Managing Director of Chase Manhattan’s Financial Institutions Group, focusing on investment management firms • Other relevant experience includes: National Treasurer for Mitt Romney’s 2008 and 2012 presidential campaigns • Managing Principal of Easterly LLC • Founded Solel Investment Group LLC in 2011, acquiring over $900mm in specialty finance assets • Managing Director of J.C. Flowers & Co. from 2004 to 2011; focused on consumer and commercial finance, banking and property & casualty insurance investments • Led Shinsei Bank’s corporate development group from 2001 to 2004 • Other relevant experience includes: VP Finance and Corporate Development with SoftNet Systems, associate with Capital Z Partners and analyst with the Financial Institutions Group at Goldman Sachs
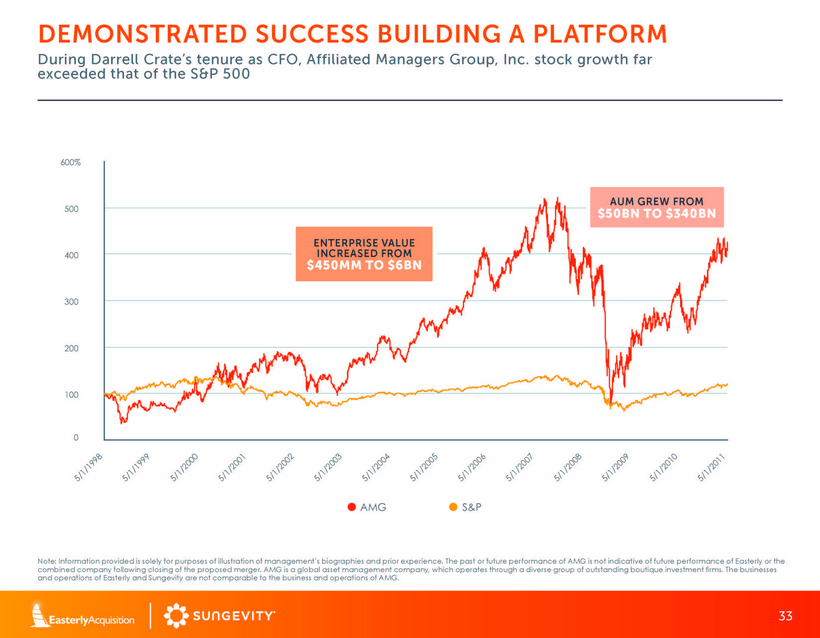
33 0 100 200 300 400 500 600% 5/1/1998 5/1/1999 5/1/2000 5/1/2001 5/1/2002 5/1/2003 5/1/2004 5/1/2005 5/1/2006 5/1/2007 5/1/2008 5/1/2009 5/1/2010 5/1/2011 AMG S&P DEMONSTRATED SUCCESS BUILDING A PLATFORM During Darrell Crate’s tenure as CFO, Affiliated Managers Group, Inc. stock growth far exceeded that of the S&P 500 Note: Information provided is solely for purposes of illustration of management’s biographies and prior experience. The past or future performance of AMG is not indicative of future performance of Easterly or the combined company following closing of the proposed merger. AMG is a global asset management company, which operates through a diverse group of outstanding boutique investment fi rms. The businesses and operations of Easterly and Sungevity are not comparable to the business and operations of AMG. ENTERPRISE VALUE INCREASED FROM $450MM TO $6BN AUM GREW FROM $50BN TO $340BN

34 OUTPERFORMANCE OVER RUSSELL 2000 OF 42.1% OUTPERFORMANCE OVER RMZ OF 39.6% DEA +42.9% RMZ +3.3% Russell +0.8% EASTERLY GOVERNMENT PROPERTIES PERFORMANCE Note: pricing as of 7/28/16; performance inclusive of dividends. Information provided is solely for purposes of illustration of management’s biographies. The past or future performance of DEA is not indicative of future performance of Easterly or the combined company following closing of the proposed merger. DEA is a real estate investment trust and is focused primarily on the acquisition, development and management of Class A commercial properties that are leased to U.S. government agencies through the General Services Administration. The businesses and operations of Easterly and Sungevity are not comparable to the business and operations of DEA. Since IPO, Easterly Government Properties (NYSE: DEA) has outperformed both the MSCI U.S. REIT Index (RMZ) and the Russell 2000 Index