VERSO CORPORATION Deutsche Bank Leveraged Finance Conference September 28, 2016
CONFIDENTIAL INTERNAL USE ONLY Disclaimer 1 This document contains highly confidential information and is solely for informational purposes. You should not rely upon or use it to form the definitive basis for any decision or action whatsoever, with respect to any proposed transaction or otherwise. You and your affiliates and agents must hold this document and any oral information provided in connection with this document, as well as any information derived by you from the information contained herein, in strict confidence and may not communicate, reproduce or disclose it to any other person, or refer to it publicly, in whole or in part at any time except with our prior written consent. If you are not the intended recipient of this document, please delete and destroy all copies immediately. This document is “as is” and is based, in part, on information obtained from other sources. Our use of such information does not imply that we have independently verified or necessarily agree with any of such information, and we have assumed and relied upon the accuracy and completeness of such information for purposes of this document. Neither we nor any of our affiliates or agents, make any representation or warranty, express or implied, in relation to the accuracy or completeness of the information contained in this document or any oral information provided in connection herewith, or any data it generates and expressly disclaim any and all liability (whether direct or indirect, in contract, tort or otherwise) in relation to any of such information or any errors or omissions therein. Any views or terms contained herein are preliminary, and are based on financial, economic, market and other conditions prevailing as of the date of this document and are subject to change. We undertake no obligations or responsibility to update any of the information contained in this document. Past performance does not guarantee or predict future performance. This document does not constitute an offer to sell or the solicitation of an offer to buy any security, nor does it constitute an offer or commitment to lend, syndicate or arrange a financing, underwrite or purchase or act as an agent or advisor or in any other capacity with respect to any transaction, or commit capital, or to participate in any trading strategies, and does not constitute legal, regulatory, accounting or tax advice to the recipient. This document does not constitute and should not be considered as any form of financial opinion or recommendation by us or any of our affiliates. This document is not a research report nor should it be construed as such. This document includes projections. Any projections reflect various estimates and assumptions concerning anticipated results. No representations or warranties are made by us or any of our affiliates as to the accuracy of any such projections. Whether or not any such projections are in fact achieved will depend upon future events some of which are not within our control. Accordingly, actual results may vary from the projected results and such variations may be material. We undertake no obligation, and do not currently intend, to update our projections.
CONFIDENTIAL INTERNAL USE ONLY Disclaimer - continued 2 Forward-Looking Statements In this presentation, all statements that are not purely historical facts are forward-looking statements within the meaning of Section 27A of the Securities Act of 1933, as amended, and Section 21E of the Securities Exchange Act of 1934, as amended. Forward-looking statements may be identified by the words “believe,” “expect,” “anticipate,” “project,” “plan,” “estimate,” “intend” and other similar expressions and include our guidance for our results for the year ending December 31, 2016 and our projection pension and OPEB obligations. Forward-looking statements are based on currently available business, economic, financial and other information and reflect the current beliefs, expectations and views of the management team of Verso Corporation (the “Company”) with respect to future developments and their potential effects on the Company. Actual results could vary materially depending on risks and uncertainties that may affect the Company and its business including for example, our ability to consummate a financing. For a discussion of the risks and uncertainties affecting the Company and its business, please refer to the risks and uncertainties as well as those discussed in the Company’s filings with the Securities and Exchange Commission. Neither the Company nor PJT assume any obligation to update forward- looking statements made in this presentation to reflect subsequent events or circumstances or actual outcomes. Non-GAAP Measures In this presentation, “EBITDA,” “Adjusted EBITDA” and “Adjusted EBITDA margin” are financial measures not prepared in accordance with U.S. GAAP. Adjusted EBITDA consists of net income before interest, taxes, depreciation and amortization and other adjustments to eliminate the impact of certain items that we do not consider to be indicative of our performance. These non-GAAP measures should be considered a supplement to, and not as a substitute for, or superior to, financial measures calculated in accordance with GAAP. Verso uses Adjusted EBITDA as a way of evaluating our performance relative to our peers. Verso believes that Adjusted EBITDA is an operating performance measure commonly used in our industry that provides investors and analysts with a measure of ongoing operating results unaffected by differences in capital structures, capital investment cycles, and ages of related assets among otherwise comparable companies. We believe that the supplemental adjustments applied in calculating Adjusted EBITDA are reasonable and appropriate to provide additional information to investors. Because Adjusted EBITDA is not a measurement determined in accordance with accounting principles generally accepted in the United States, or “GAAP,” and is susceptible to varying calculations, Adjusted EBITDA, as presented, may not be comparable to similarly titled measures of other companies. You should consider our Adjusted EBITDA in addition to, and not as a substitute for, or superior to, our operating or net income or cash flows from operating activities, which are determined in accordance with GAAP.

CONFIDENTIAL INTERNAL USE ONLY Presenters • Allen Campbell Verso Corporation SVP and Chief Financial Officer • Tim Nusbaum Verso Corporation Treasurer 3
CONFIDENTIAL INTERNAL USE ONLY Verso Corporation Company Profile
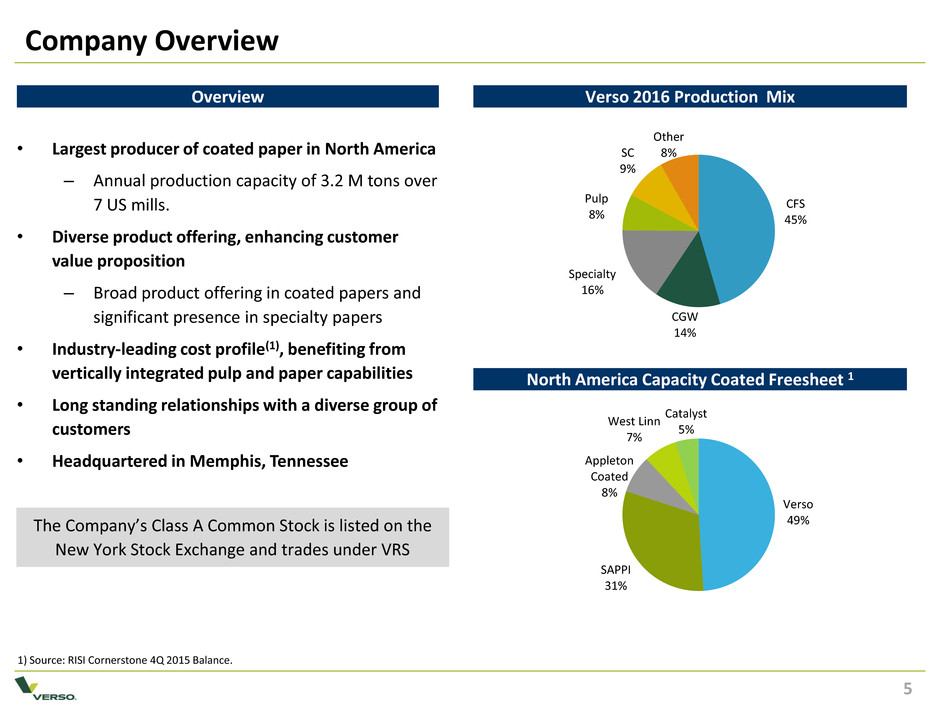
CONFIDENTIAL INTERNAL USE ONLY Company Overview 5 5 Verso 49% SAPPI 31% Appleton Coated 8% West Linn 7% Catalyst 5% • Largest producer of coated paper in North America – Annual production capacity of 3.2 M tons over 7 US mills. • Diverse product offering, enhancing customer value proposition – Broad product offering in coated papers and significant presence in specialty papers • Industry-leading cost profile(1), benefiting from vertically integrated pulp and paper capabilities • Long standing relationships with a diverse group of customers • Headquartered in Memphis, Tennessee Verso 2016 Production Mix Overview The Company’s Class A Common Stock is listed on the New York Stock Exchange and trades under VRS 1) Source: RISI Cornerstone 4Q 2015 Balance. CFS 45% CGW 14% Specialty 16% Pulp 8% SC 9% Other 8% North America Capacity Coated Freesheet 1
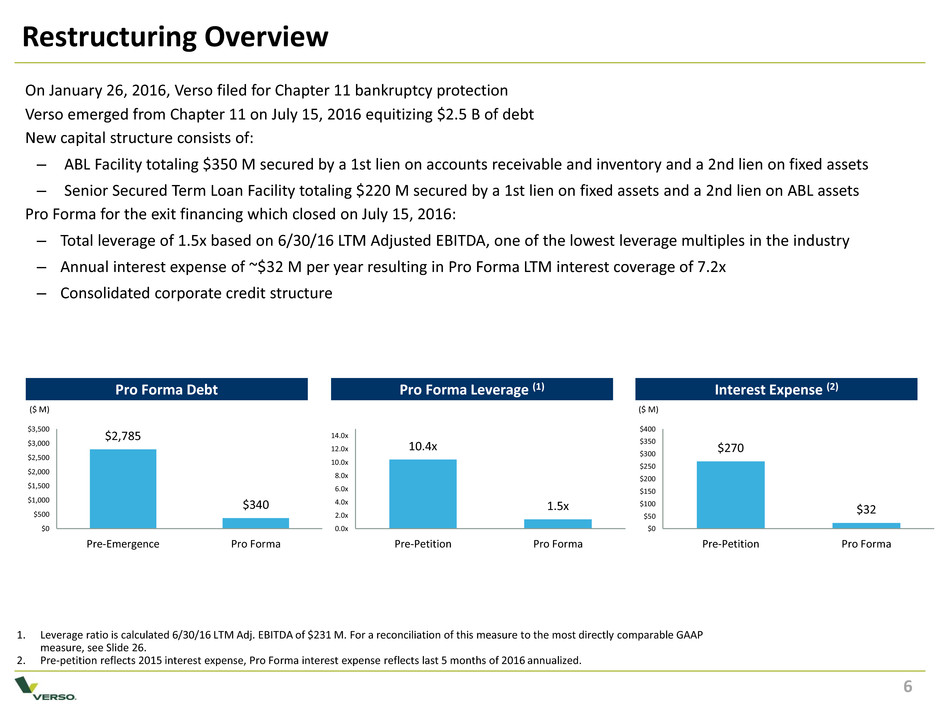
CONFIDENTIAL INTERNAL USE ONLY 6 1. Leverage ratio is calculated 6/30/16 LTM Adj. EBITDA of $231 M. For a reconciliation of this measure to the most directly comparable GAAP measure, see Slide 26. 2. Pre-petition reflects 2015 interest expense, Pro Forma interest expense reflects last 5 months of 2016 annualized. Restructuring Overview Pro Forma Debt Pro Forma Leverage (1) Interest Expense (2) $2,785 $340 $0 $500 $1,000 $1,500 $2,000 $2,500 $3,000 $3,500 Pre-Emergence Pro Forma 10.4x 1.5x 0.0x 2.0x 4.0x 6.0x 8.0x 10.0x 12.0x 14.0x Pre-Petition Pro Forma ($ M) ($ M) $270 $32 $0 $50 $100 $150 $200 $250 $300 $350 $400 Pre-Petition Pro Forma On January 26, 2016, Verso filed for Chapter 11 bankruptcy protection Verso emerged from Chapter 11 on July 15, 2016 equitizing $2.5 B of debt New capital structure consists of: – ABL Facility totaling $350 M secured by a 1st lien on accounts receivable and inventory and a 2nd lien on fixed assets – Senior Secured Term Loan Facility totaling $220 M secured by a 1st lien on fixed assets and a 2nd lien on ABL assets Pro Forma for the exit financing which closed on July 15, 2016: – Total leverage of 1.5x based on 6/30/16 LTM Adjusted EBITDA, one of the lowest leverage multiples in the industry – Annual interest expense of ~$32 M per year resulting in Pro Forma LTM interest coverage of 7.2x – Consolidated corporate credit structure 6
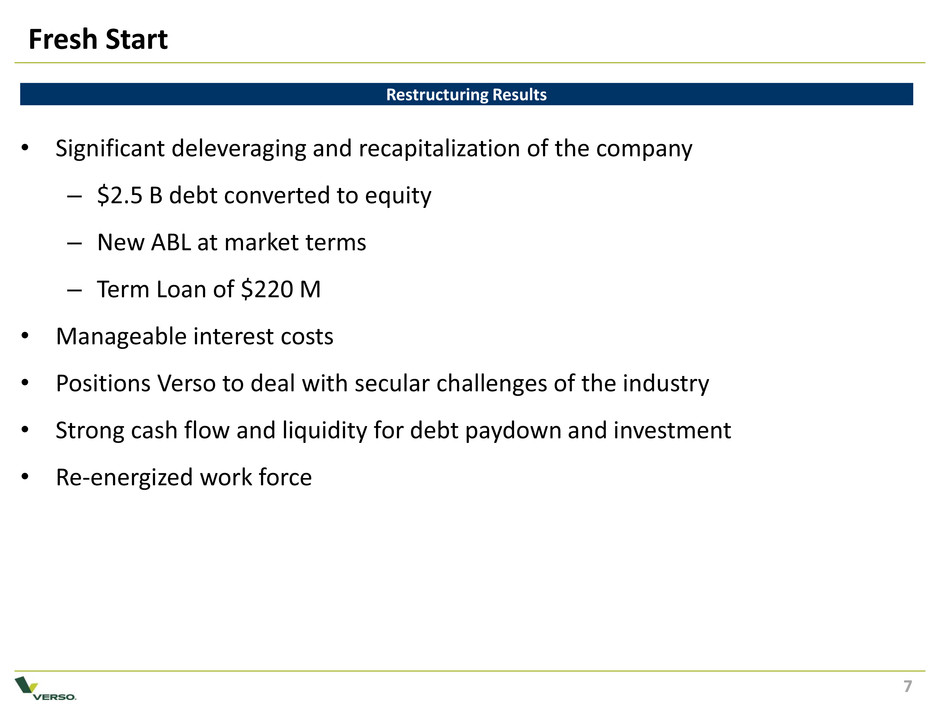
CONFIDENTIAL INTERNAL USE ONLY Fresh Start Restructuring Results • Significant deleveraging and recapitalization of the company – $2.5 B debt converted to equity – New ABL at market terms – Term Loan of $220 M • Manageable interest costs • Positions Verso to deal with secular challenges of the industry • Strong cash flow and liquidity for debt paydown and investment • Re-energized work force 7
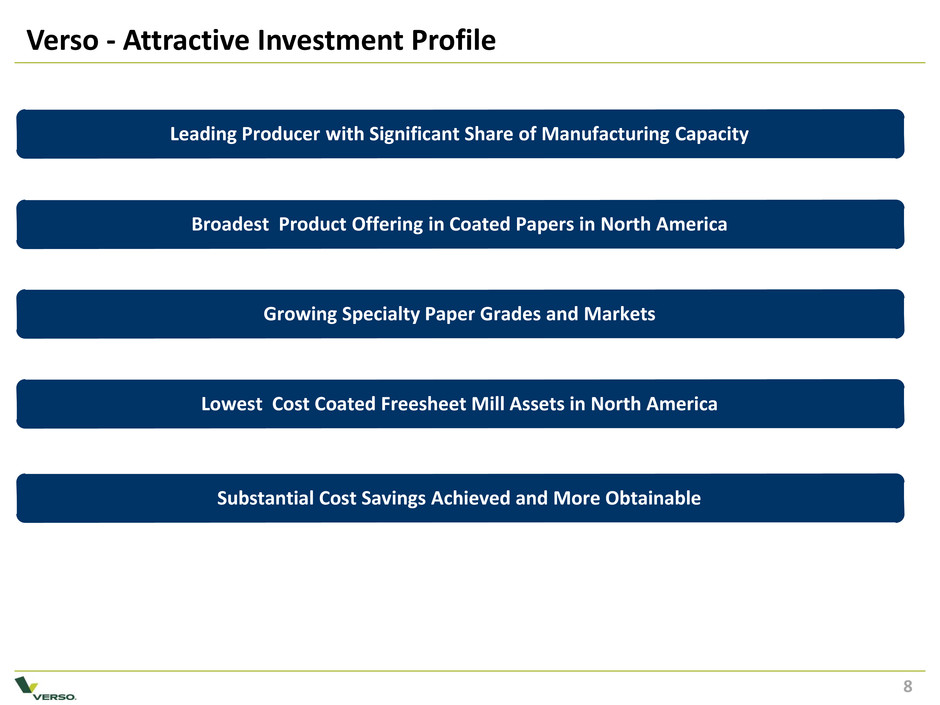
CONFIDENTIAL INTERNAL USE ONLY Verso - Attractive Investment Profile Substantial Cost Savings Achieved and More Obtainable Growing Specialty Paper Grades and Markets Leading Producer with Significant Share of Manufacturing Capacity Lowest Cost Coated Freesheet Mill Assets in North America Broadest Product Offering in Coated Papers in North America 8
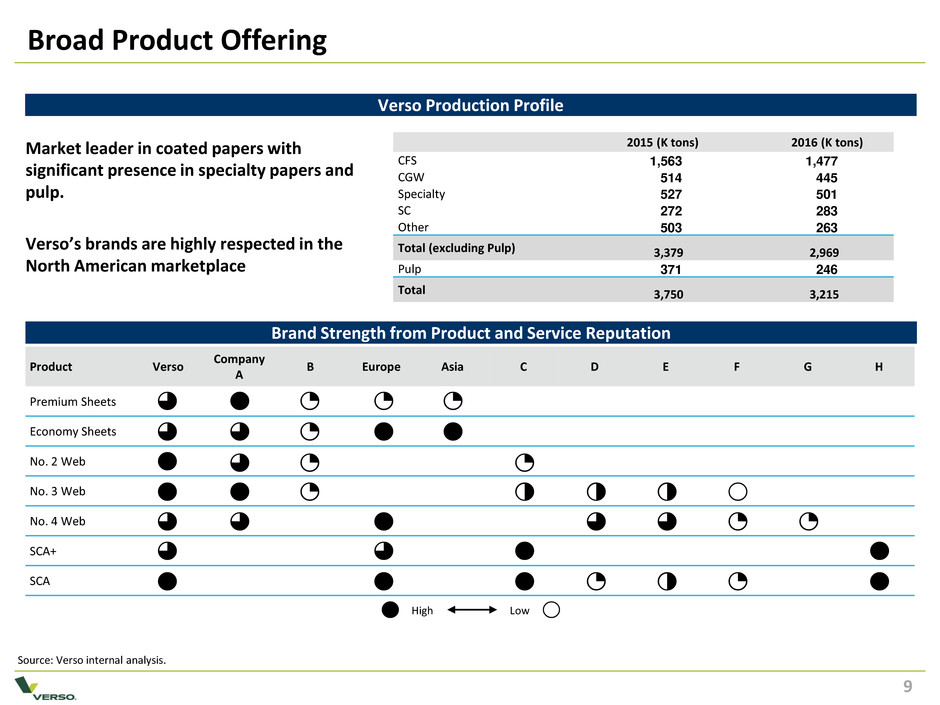
CONFIDENTIAL INTERNAL USE ONLY 9 Broad Product Offering 9 Market leader in coated papers with significant presence in specialty papers and pulp. Verso’s brands are highly respected in the North American marketplace Product Verso Company A B Europe Asia C D E F G H Premium Sheets Economy Sheets No. 2 Web No. 3 Web No. 4 Web SCA+ SCA Source: Verso internal analysis. High Low Verso Production Profile 2015 (K tons) 2016 (K tons) CFS 1,563 1,477 CGW 514 445 Specialty 527 501 SC 272 283 Other 503 263 Total (excluding Pulp) 3,379 2,969 Pulp 371 246 Total 3,750 3,215 Brand Strength from Product and Service Reputation
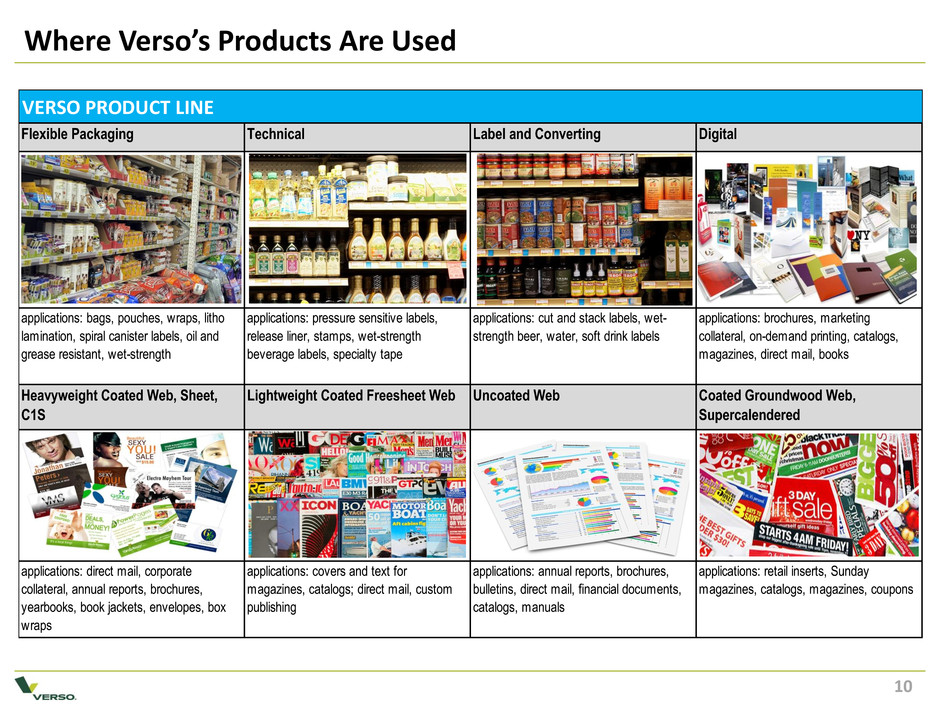
CONFIDENTIAL INTERNAL USE ONLY Where Verso’s Products Are Used 10 Flexible Packaging Technical Label and Converting Digital applications: bags, pouches, wraps, litho lamination, spiral canister labels, oil and grease resistant, wet-strength applications: pressure sensitive labels, release liner, stamps, wet-strength beverage labels, specialty tape applications: cut and stack labels, wet- strength beer, water, soft drink labels applications: brochures, marketing collateral, on-demand printing, catalogs, magazines, direct mail, books applications: direct mail, corporate collateral, annual reports, brochures, yearbooks, book jackets, envelopes, box wraps applications: covers and text for magazines, catalogs; direct mail, custom publishing applications: annual reports, brochures, bulletins, direct mail, financial documents, catalogs, manuals applications: retail inserts, Sunday magazines, catalogs, magazines, coupons VERSO PRODUCT LINE Heavyweight Coated Web, Sheet, C1S Lightweight Coated Freesheet Web Uncoated Web Coated Groundwood Web, Supercalendered
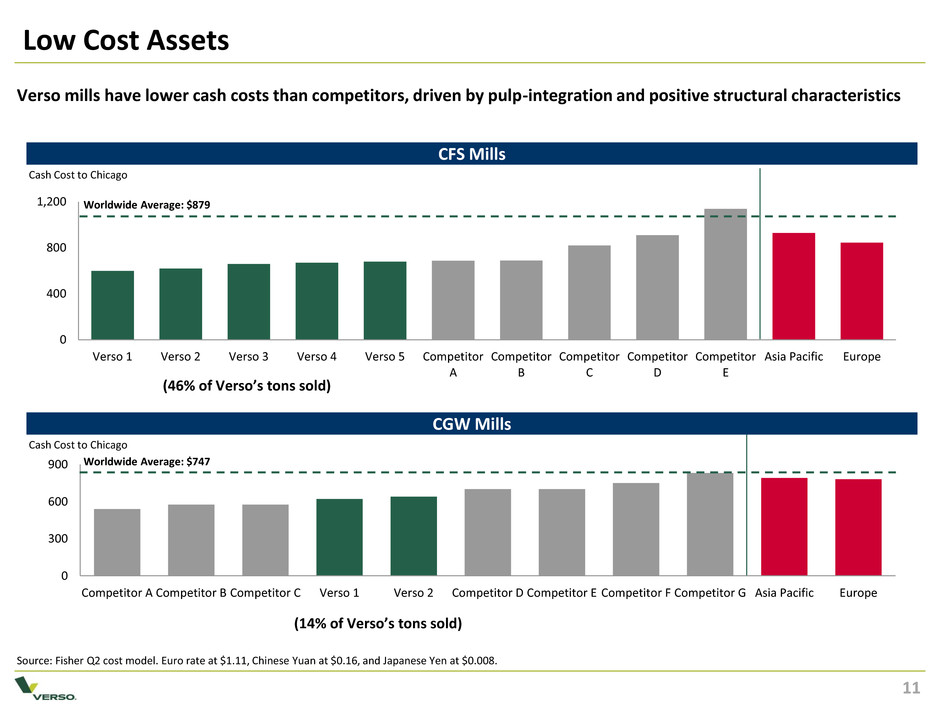
CONFIDENTIAL INTERNAL USE ONLY Low Cost Assets 11 Source: Fisher Q2 cost model. Euro rate at $1.11, Chinese Yuan at $0.16, and Japanese Yen at $0.008. Verso mills have lower cash costs than competitors, driven by pulp-integration and positive structural characteristics CFS Mills CGW Mills 0 300 600 900 Competitor A Competitor B Competitor C Verso 1 Verso 2 Competitor D Competitor E Competitor F Competitor G Asia Pacific Europe 0 400 800 1,200 Verso 1 Verso 2 Verso 3 Verso 4 Verso 5 Competitor A Competitor B Competitor C Competitor D Competitor E Asia Pacific Europe Cash Cost to Chicago Worldwide Average: $879 Cash Cost to Chicago Worldwide Average: $747 11 (46% of Verso’s tons sold) (14% of Verso’s tons sold)
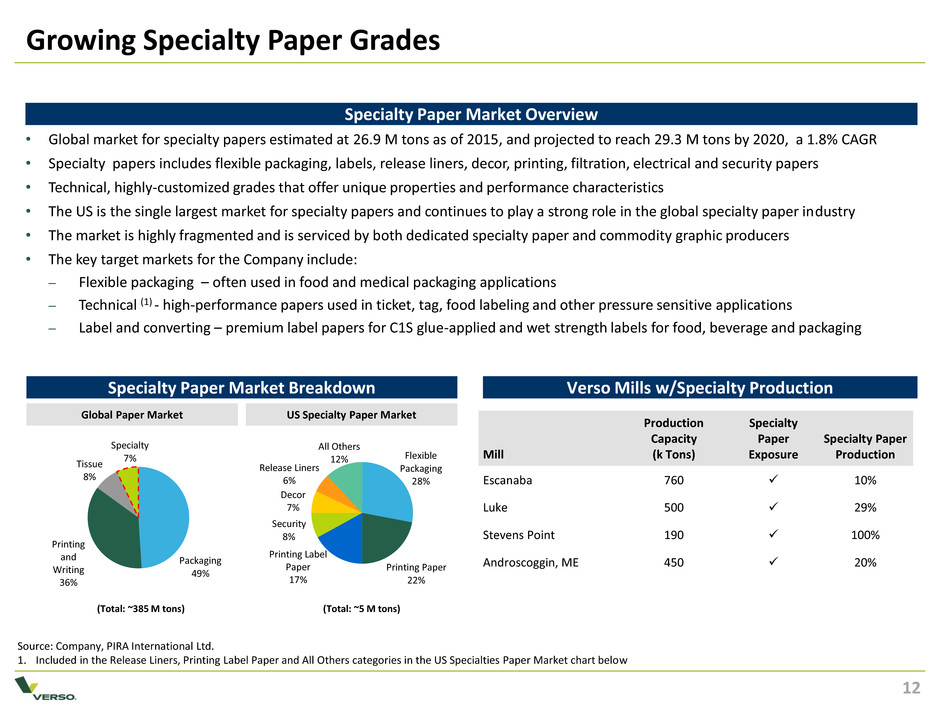
CONFIDENTIAL INTERNAL USE ONLY Growing Specialty Paper Grades 12 Source: Company, PIRA International Ltd. 1. Included in the Release Liners, Printing Label Paper and All Others categories in the US Specialties Paper Market chart below Specialty Paper Market Overview Specialty Paper Market Breakdown • Global market for specialty papers estimated at 26.9 M tons as of 2015, and projected to reach 29.3 M tons by 2020, a 1.8% CAGR • Specialty papers includes flexible packaging, labels, release liners, decor, printing, filtration, electrical and security papers • Technical, highly-customized grades that offer unique properties and performance characteristics • The US is the single largest market for specialty papers and continues to play a strong role in the global specialty paper industry • The market is highly fragmented and is serviced by both dedicated specialty paper and commodity graphic producers • The key target markets for the Company include: – Flexible packaging – often used in food and medical packaging applications – Technical (1) - high-performance papers used in ticket, tag, food labeling and other pressure sensitive applications – Label and converting – premium label papers for C1S glue-applied and wet strength labels for food, beverage and packaging Verso Mills w/Specialty Production US Specialty Paper Market Global Paper Market Flexible Packaging 28% Printing Paper 22% Printing Label Paper 17% Security 8% Decor 7% Release Liners 6% All Others 12% (Total: ~385 M tons) (Total: ~5 M tons) Mill Production Capacity (k Tons) Specialty Paper Exposure Specialty Paper Production Escanaba 760 10% Luke 500 29% Stevens Point 190 100% Androscoggin, ME 450 20% Packaging 49% Printing and Writing 36% Tissue 8% Specialty 7% 12
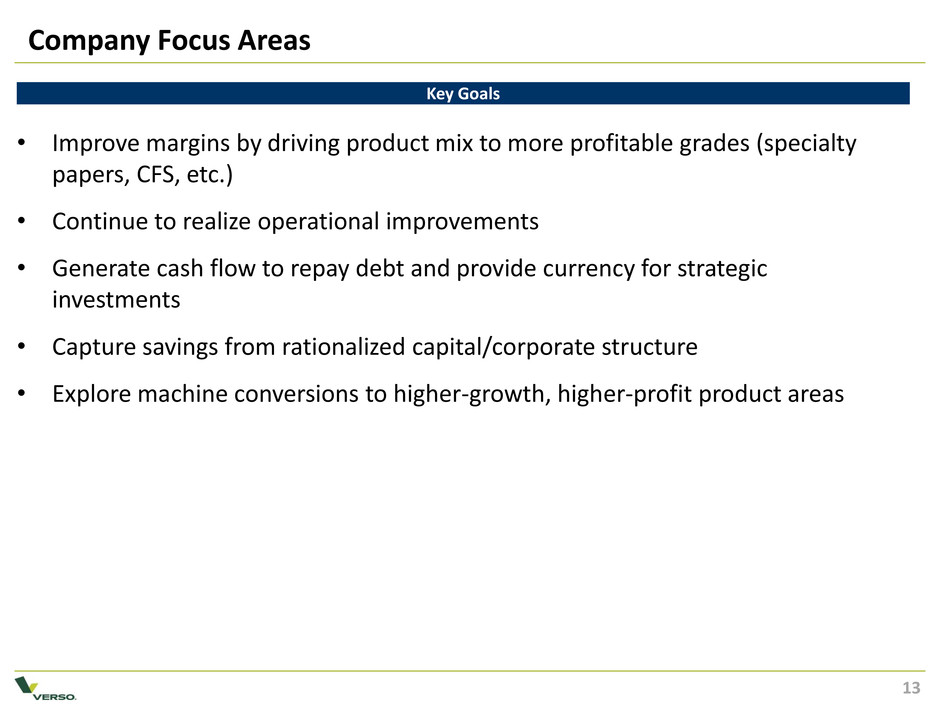
CONFIDENTIAL INTERNAL USE ONLY Company Focus Areas 13 Key Goals • Improve margins by driving product mix to more profitable grades (specialty papers, CFS, etc.) • Continue to realize operational improvements • Generate cash flow to repay debt and provide currency for strategic investments • Capture savings from rationalized capital/corporate structure • Explore machine conversions to higher-growth, higher-profit product areas

CONFIDENTIAL INTERNAL USE ONLY Industry Update and Outlook
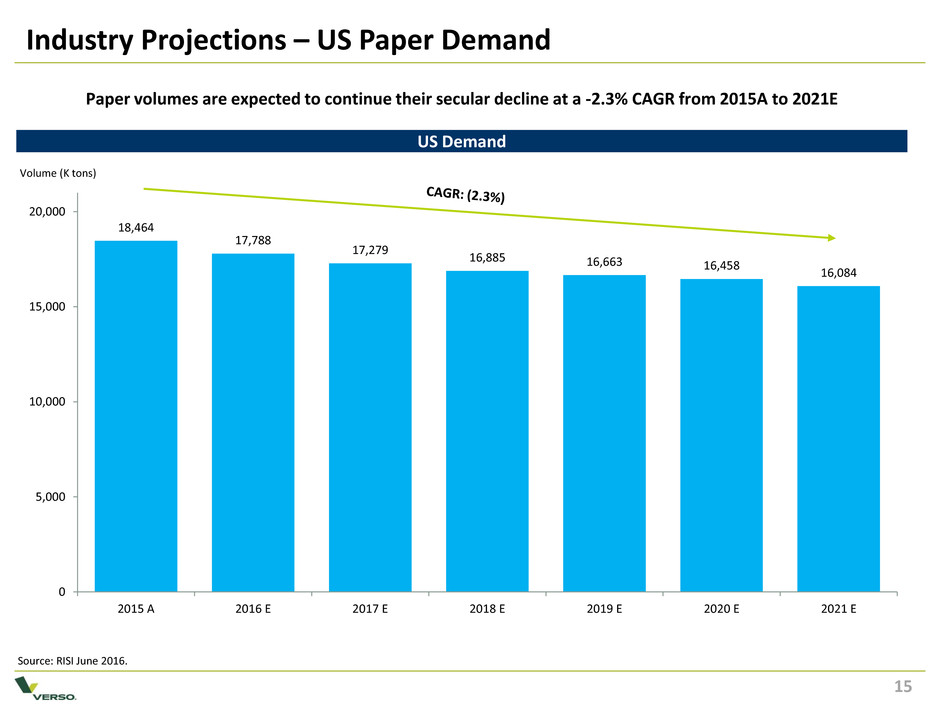
CONFIDENTIAL INTERNAL USE ONLY Industry Projections – US Paper Demand Volume (K tons) Source: RISI June 2016. US Demand Paper volumes are expected to continue their secular decline at a -2.3% CAGR from 2015A to 2021E 18,464 17,788 17,279 16,885 16,663 16,458 16,084 0 5,000 10,000 15,000 20,000 2015 A 2016 E 2017 E 2018 E 2019 E 2020 E 2021 E 15
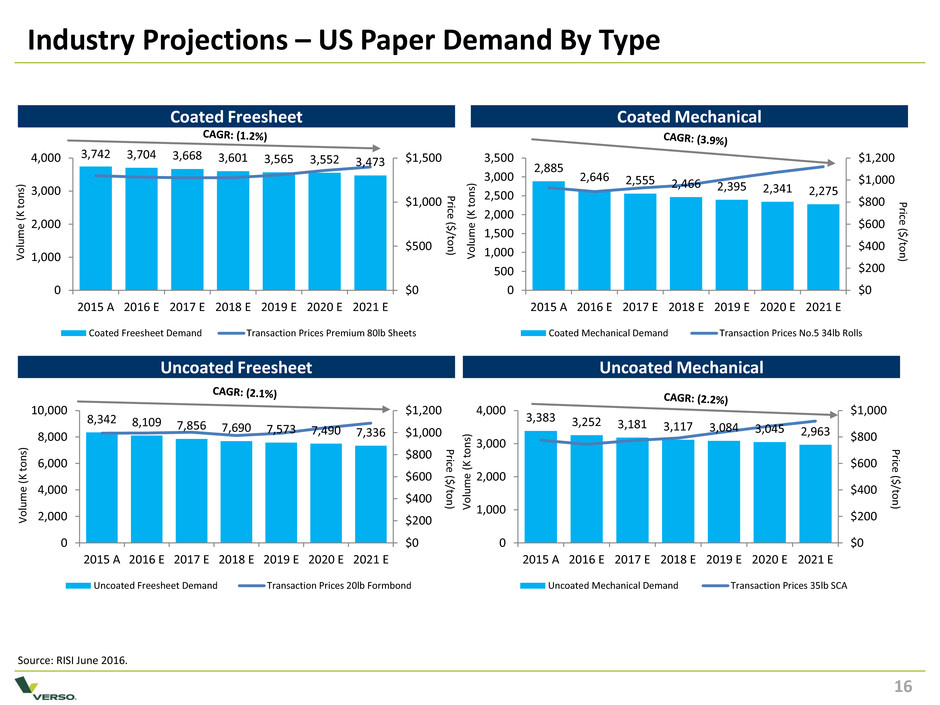
CONFIDENTIAL INTERNAL USE ONLY 3,383 3,252 3,181 3,117 3,084 3,045 2,963 $0 $200 $400 $600 $800 $1,000 0 1,000 2,000 3,000 4,000 2015 A 2016 E 2017 E 2018 E 2019 E 2020 E 2021 E Uncoated Mechanical Demand Transaction Prices 35lb SCA 8,342 8,109 7,856 7,690 7,573 7,490 7,336 $0 $200 $400 $600 $800 $1,000 $1,200 0 2,000 4,000 6,000 8,000 10,000 2015 A 2016 E 2017 E 2018 E 2019 E 2020 E 2021 E Uncoated Freesheet Demand Transaction Prices 20lb Formbond 3,742 3,704 3,668 3,601 3,565 3,552 3,473 $0 $500 $1,000 $1,500 0 1,000 2,000 3,000 4,000 2015 A 2016 E 2017 E 2018 E 2019 E 2020 E 2021 E Coated Freesheet Demand Transaction Prices Premium 80lb Sheets 2,885 2,646 2,555 2,466 2,395 2,341 2,275 $0 $200 $400 $600 $800 $1,000 $1,200 0 500 1,000 1,500 2,000 2,500 3,000 3,500 2015 A 2016 E 2017 E 2018 E 2019 E 2020 E 2021 E Coated Mechanical Demand Transaction Prices No.5 34lb Rolls Industry Projections – US Paper Demand By Type Source: RISI June 2016. Coated Freesheet Uncoated Freesheet Coated Mechanical Uncoated Mechanical V o lu m e (K t o n s) Pric e ($/t o n ) V o lu m e (K t o n s) Pric e ($/t o n ) Pric e ($/t o n ) Pric e ($/t o n ) V o lu m e (K t o n s) V o lu m e (K t o n s) 16
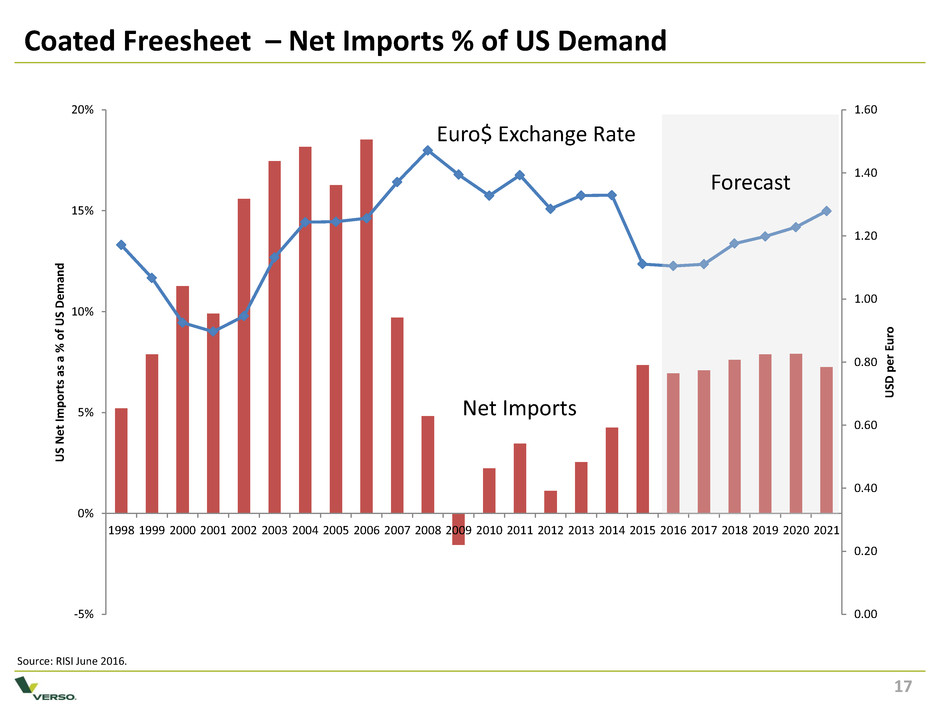
CONFIDENTIAL INTERNAL USE ONLY 0.00 0.20 0.40 0.60 0.80 1.00 1.20 1.40 1.60 -5% 0% 5% 10% 15% 20% 1998 1999 2000 2001 2002 2003 2004 2005 2006 2007 2008 2009 2010 2011 2012 2013 2014 2015 2016 2017 2018 2019 2020 2021 U SD p e r Eu ro U S N e t Im p o rts as a % o f U S D e m an d Coated Freesheet – Net Imports % of US Demand Forecast Source: RISI June 2016. Euro$ Exchange Rate Net Imports 17
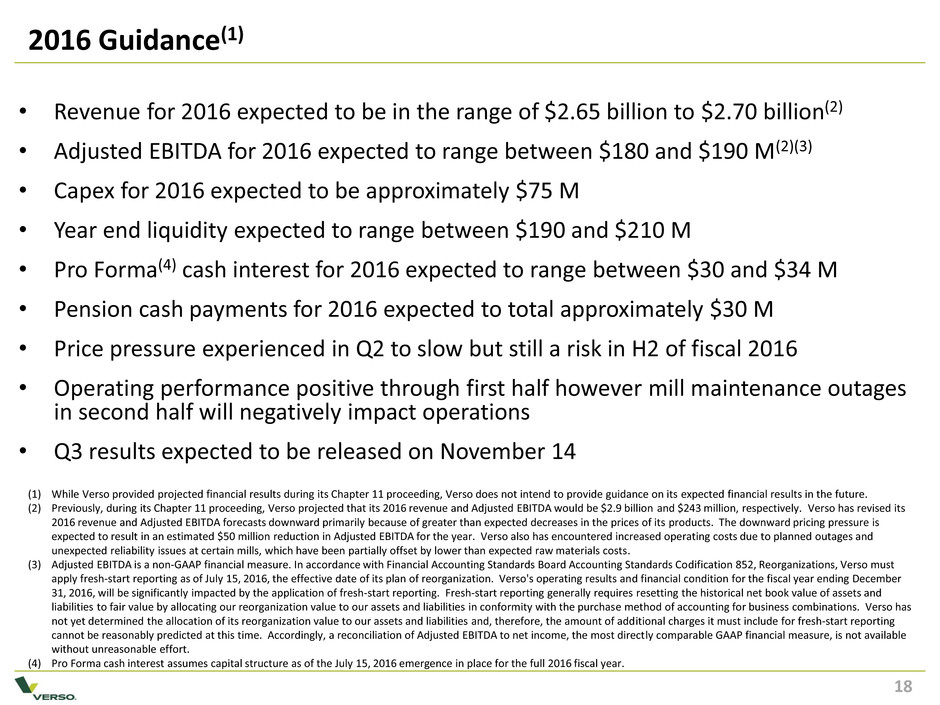
CONFIDENTIAL INTERNAL USE ONLY 2016 Guidance(1) • Revenue for 2016 expected to be in the range of $2.65 billion to $2.70 billion(2) • Adjusted EBITDA for 2016 expected to range between $180 and $190 M(2)(3) • Capex for 2016 expected to be approximately $75 M • Year end liquidity expected to range between $190 and $210 M • Pro Forma(4) cash interest for 2016 expected to range between $30 and $34 M • Pension cash payments for 2016 expected to total approximately $30 M • Price pressure experienced in Q2 to slow but still a risk in H2 of fiscal 2016 • Operating performance positive through first half however mill maintenance outages in second half will negatively impact operations • Q3 results expected to be released on November 14 (1) While Verso provided projected financial results during its Chapter 11 proceeding, Verso does not intend to provide guidance on its expected financial results in the future. (2) Previously, during its Chapter 11 proceeding, Verso projected that its 2016 revenue and Adjusted EBITDA would be $2.9 billion and $243 million, respectively. Verso has revised its 2016 revenue and Adjusted EBITDA forecasts downward primarily because of greater than expected decreases in the prices of its products. The downward pricing pressure is expected to result in an estimated $50 million reduction in Adjusted EBITDA for the year. Verso also has encountered increased operating costs due to planned outages and unexpected reliability issues at certain mills, which have been partially offset by lower than expected raw materials costs. (3) Adjusted EBITDA is a non-GAAP financial measure. In accordance with Financial Accounting Standards Board Accounting Standards Codification 852, Reorganizations, Verso must apply fresh-start reporting as of July 15, 2016, the effective date of its plan of reorganization. Verso's operating results and financial condition for the fiscal year ending December 31, 2016, will be significantly impacted by the application of fresh-start reporting. Fresh-start reporting generally requires resetting the historical net book value of assets and liabilities to fair value by allocating our reorganization value to our assets and liabilities in conformity with the purchase method of accounting for business combinations. Verso has not yet determined the allocation of its reorganization value to our assets and liabilities and, therefore, the amount of additional charges it must include for fresh-start reporting cannot be reasonably predicted at this time. Accordingly, a reconciliation of Adjusted EBITDA to net income, the most directly comparable GAAP financial measure, is not available without unreasonable effort. (4) Pro Forma cash interest assumes capital structure as of the July 15, 2016 emergence in place for the full 2016 fiscal year. 18
CONFIDENTIAL INTERNAL USE ONLY Recent Financial Performance
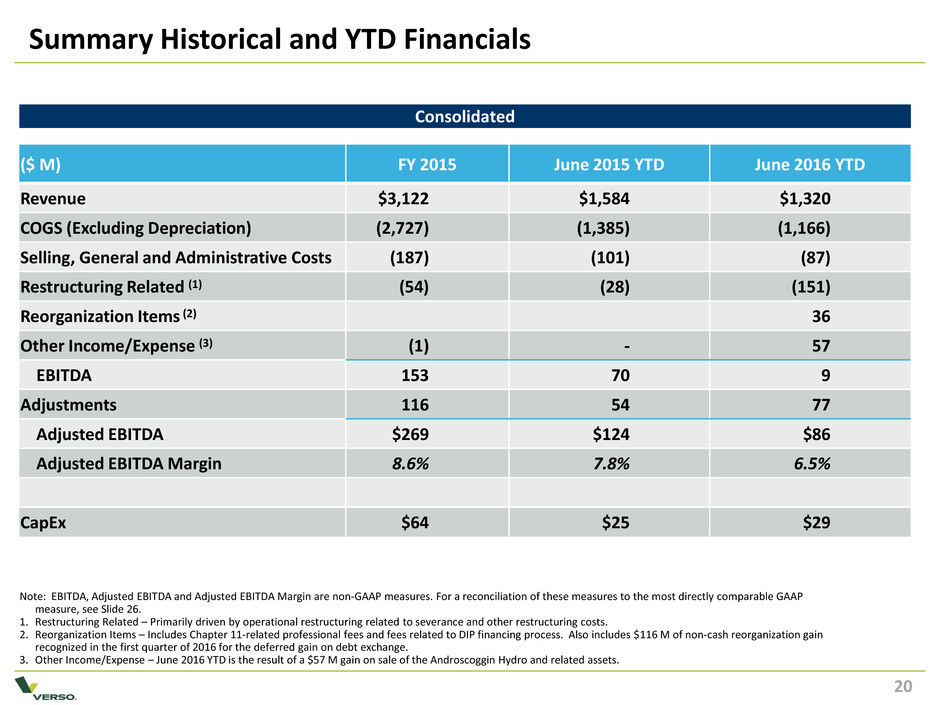
CONFIDENTIAL INTERNAL USE ONLY Summary Historical and YTD Financials 20 Note: EBITDA, Adjusted EBITDA and Adjusted EBITDA Margin are non-GAAP measures. For a reconciliation of these measures to the most directly comparable GAAP measure, see Slide 26. 1. Restructuring Related – Primarily driven by operational restructuring related to severance and other restructuring costs. 2. Reorganization Items – Includes Chapter 11-related professional fees and fees related to DIP financing process. Also includes $116 M of non-cash reorganization gain recognized in the first quarter of 2016 for the deferred gain on debt exchange. 3. Other Income/Expense – June 2016 YTD is the result of a $57 M gain on sale of the Androscoggin Hydro and related assets. Consolidated ($ M) FY 2015 June 2015 YTD June 2016 YTD Revenue $3,122 $1,584 $1,320 COGS (Excluding Depreciation) (2,727) (1,385) (1,166) Selling, General and Administrative Costs (187) (101) (87) Restructuring Related (1) (54) (28) (151) Reorganization Items (2) 36 Other Income/Expense (3) (1) - 57 EBITDA 153 70 9 Adjustments 116 54 77 Adjusted EBITDA $269 $124 $86 Adjusted EBITDA Margin 8.6% 7.8% 6.5% CapEx $64 $25 $29 20
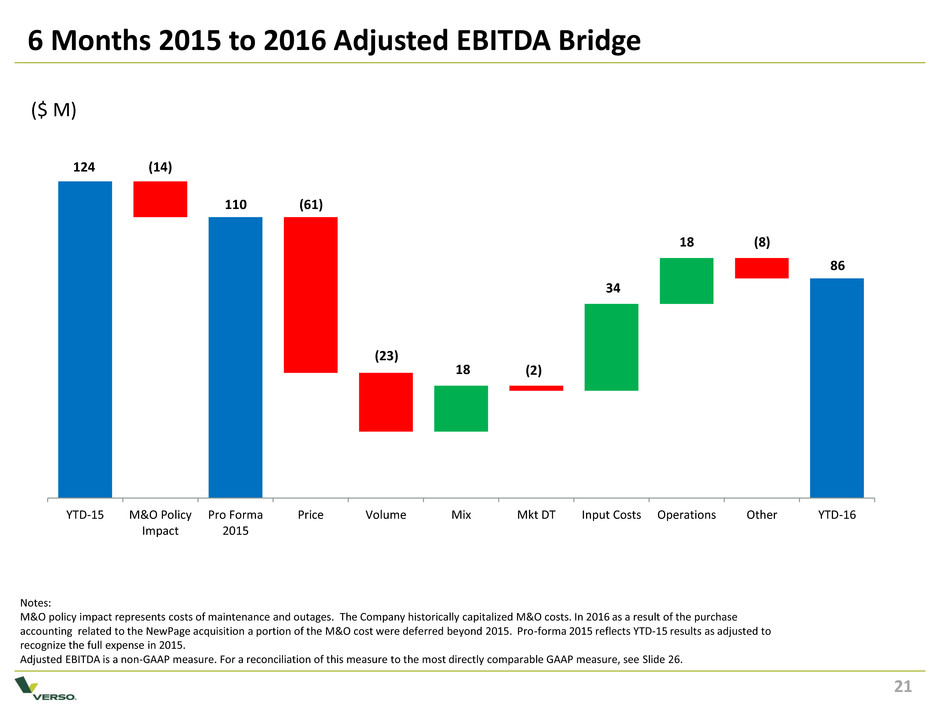
CONFIDENTIAL INTERNAL USE ONLY 21 21 ($ M) YTD-15 M&O Policy Impact Pro Forma 2015 Price Volume Mix Mkt DT Input Costs Operations Other YTD-16 124 (14) 18 (23) (61) 110 18 (2) 86 (8) 34 6 Months 2015 to 2016 Adjusted EBITDA Bridge Notes: M&O policy impact represents costs of maintenance and outages. The Company historically capitalized M&O costs. In 2016 as a result of the purchase accounting related to the NewPage acquisition a portion of the M&O cost were deferred beyond 2015. Pro-forma 2015 reflects YTD-15 results as adjusted to recognize the full expense in 2015. Adjusted EBITDA is a non-GAAP measure. For a reconciliation of this measure to the most directly comparable GAAP measure, see Slide 26.
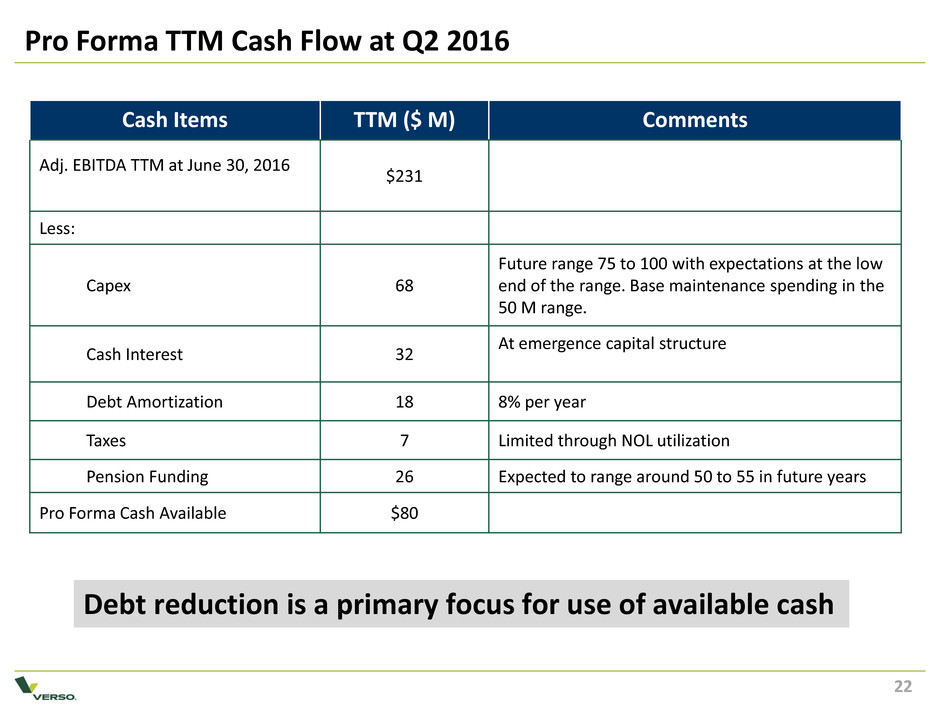
CONFIDENTIAL INTERNAL USE ONLY Pro Forma TTM Cash Flow at Q2 2016 Cash Items TTM ($ M) Comments Adj. EBITDA TTM at June 30, 2016 $231 Less: Capex 68 Future range 75 to 100 with expectations at the low end of the range. Base maintenance spending in the 50 M range. Cash Interest 32 At emergence capital structure Debt Amortization 18 8% per year Taxes 7 Limited through NOL utilization Pension Funding 26 Expected to range around 50 to 55 in future years Pro Forma Cash Available $80 Debt reduction is a primary focus for use of available cash 22
CONFIDENTIAL INTERNAL USE ONLY Financial Appendix
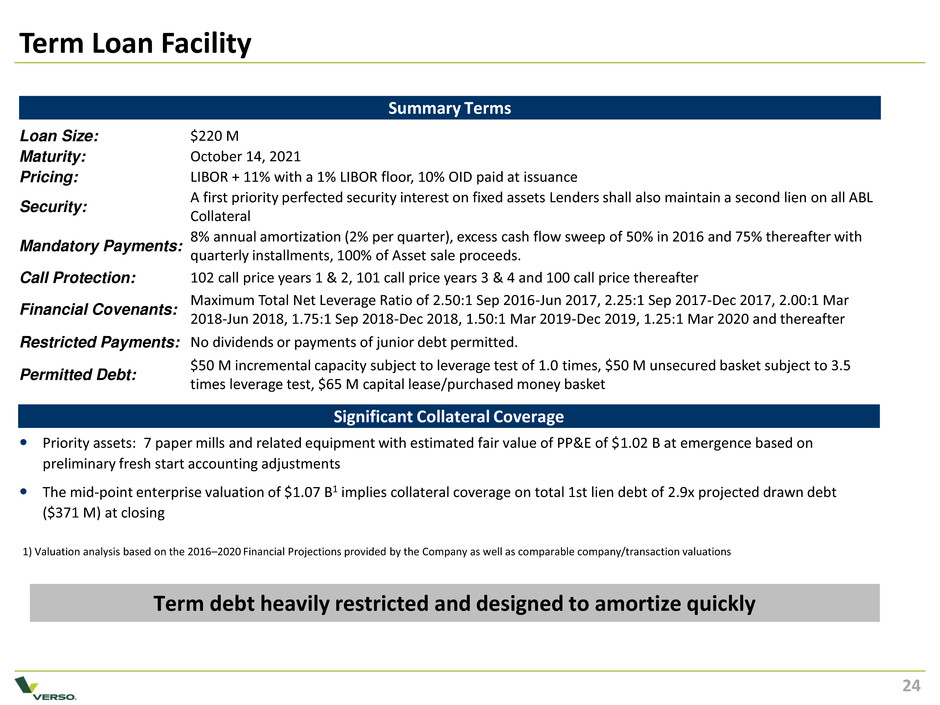
CONFIDENTIAL INTERNAL USE ONLY Significant Collateral Coverage Term Loan Facility Summary Terms Loan Size: $220 M Maturity: October 14, 2021 Pricing: LIBOR + 11% with a 1% LIBOR floor, 10% OID paid at issuance Security: A first priority perfected security interest on fixed assets Lenders shall also maintain a second lien on all ABL Collateral Mandatory Payments: 8% annual amortization (2% per quarter), excess cash flow sweep of 50% in 2016 and 75% thereafter with quarterly installments, 100% of Asset sale proceeds. Call Protection: 102 call price years 1 & 2, 101 call price years 3 & 4 and 100 call price thereafter Financial Covenants: Maximum Total Net Leverage Ratio of 2.50:1 Sep 2016-Jun 2017, 2.25:1 Sep 2017-Dec 2017, 2.00:1 Mar 2018-Jun 2018, 1.75:1 Sep 2018-Dec 2018, 1.50:1 Mar 2019-Dec 2019, 1.25:1 Mar 2020 and thereafter Restricted Payments: No dividends or payments of junior debt permitted. Permitted Debt: $50 M incremental capacity subject to leverage test of 1.0 times, $50 M unsecured basket subject to 3.5 times leverage test, $65 M capital lease/purchased money basket Term debt heavily restricted and designed to amortize quickly Priority assets: 7 paper mills and related equipment with estimated fair value of PP&E of $1.02 B at emergence based on preliminary fresh start accounting adjustments The mid-point enterprise valuation of $1.07 B1 implies collateral coverage on total 1st lien debt of 2.9x projected drawn debt ($371 M) at closing 1) Valuation analysis based on the 2016–2020 Financial Projections provided by the Company as well as comparable company/transaction valuations 24
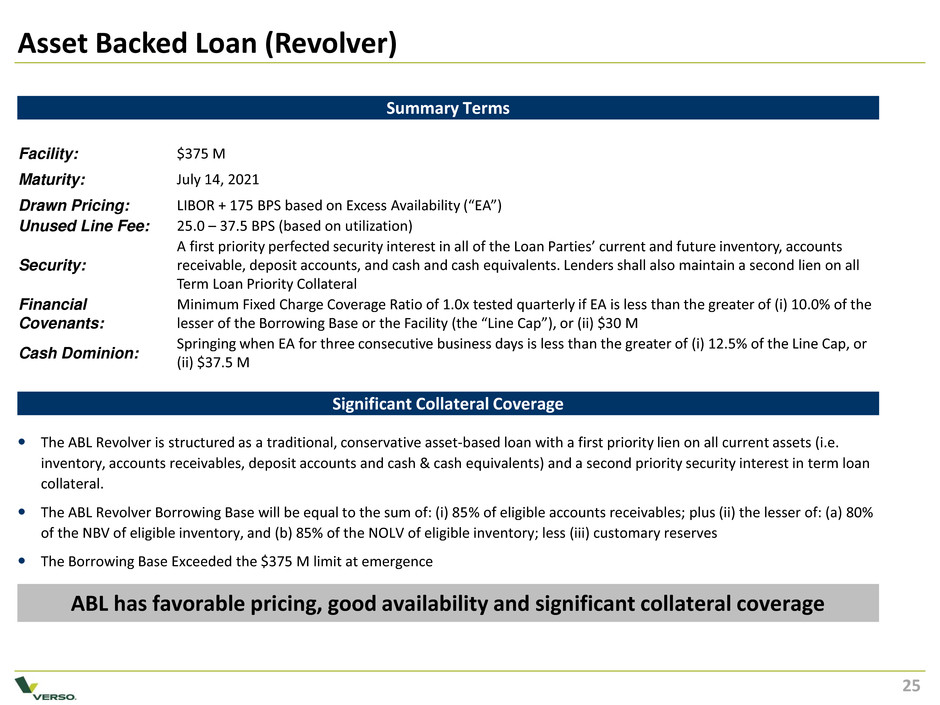
CONFIDENTIAL INTERNAL USE ONLY Significant Collateral Coverage Asset Backed Loan (Revolver) Summary Terms Facility: $375 M Maturity: July 14, 2021 Drawn Pricing: LIBOR + 175 BPS based on Excess Availability (“EA”) Unused Line Fee: 25.0 – 37.5 BPS (based on utilization) Security: A first priority perfected security interest in all of the Loan Parties’ current and future inventory, accounts receivable, deposit accounts, and cash and cash equivalents. Lenders shall also maintain a second lien on all Term Loan Priority Collateral Financial Covenants: Minimum Fixed Charge Coverage Ratio of 1.0x tested quarterly if EA is less than the greater of (i) 10.0% of the lesser of the Borrowing Base or the Facility (the “Line Cap”), or (ii) $30 M Cash Dominion: Springing when EA for three consecutive business days is less than the greater of (i) 12.5% of the Line Cap, or (ii) $37.5 M ABL has favorable pricing, good availability and significant collateral coverage The ABL Revolver is structured as a traditional, conservative asset-based loan with a first priority lien on all current assets (i.e. inventory, accounts receivables, deposit accounts and cash & cash equivalents) and a second priority security interest in term loan collateral. The ABL Revolver Borrowing Base will be equal to the sum of: (i) 85% of eligible accounts receivables; plus (ii) the lesser of: (a) 80% of the NBV of eligible inventory, and (b) 85% of the NOLV of eligible inventory; less (iii) customary reserves The Borrowing Base Exceeded the $375 M limit at emergence 25
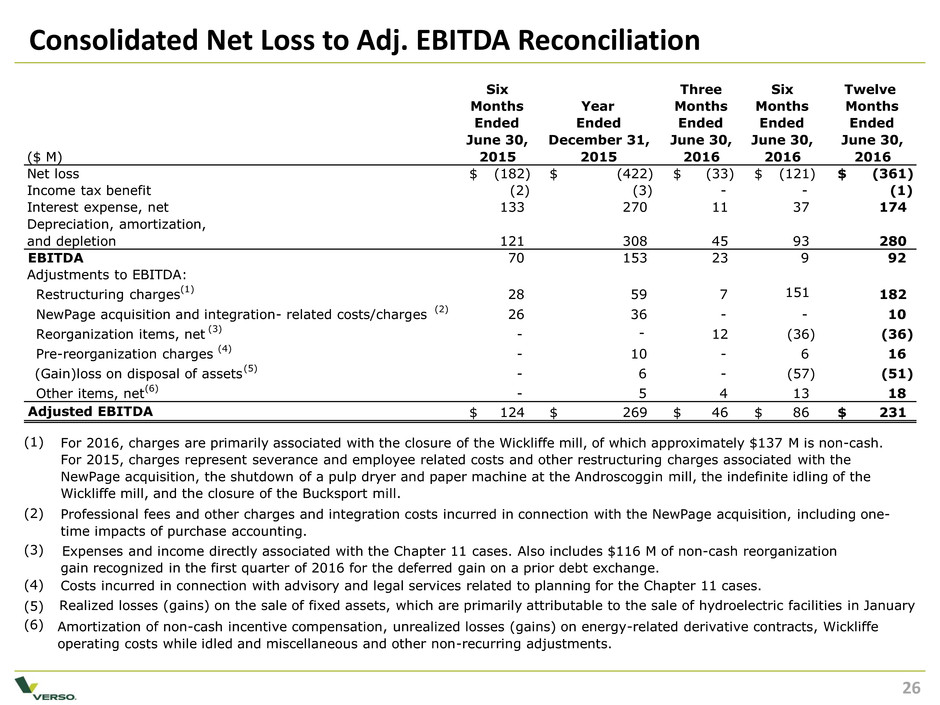
CONFIDENTIAL INTERNAL USE ONLY Consolidated Net Loss to Adj. EBITDA Reconciliation 26 Six Three Six Twelve Months Year Months Months Months Ended Ended Ended Ended Ended June 30, December 31, June 30, June 30, June 30, ($ M) 2015 2015 2016 2016 2016 Net loss (182) $ (422) $ (33) $ (121) $ (361) $ Income tax benefit (2) (3) - - (1) Interest expense, net 133 270 11 37 174 Depreciation, amortization, and depletion 121 308 45 93 280 EBITDA 70 153 23 9 92 Adjustments to EBITDA: Restructuring charges (1) 28 59 7 151 182 NewPage acquisition and integration- related costs/charges (2) 26 36 - - 10 Reorganization items, net (3) - 12 (36) (36) Pre-reorganization charges (4) - 10 - 6 16 (Gain)loss on disposal of assets (5) - 6 - (57) (51) Other items, net (6) - 5 4 13 18 Adjusted EBITDA 124 $ 269 $ 46 $ 86 $ 231 $ (1) (2) (3) (4) (5) (6) For 2016, charges are primarily associated with the closure of the Wickliffe mill, of which approximately $137 M is non-cash. For 2015, charges represent severance and employee related costs and other restructuring charges associated with the NewPage acquisition, the shutdown of a pulp dryer and paper machine at the Androscoggin mill, the indefinite idling of the Wickliffe mill, and the closure of the Bucksport mill. Professional fees and other charges and integration costs incurred in connection with the NewPage acquisition, including one- time impacts of purchase accounting. Amortization of non-cash incentive compensation, unrealized losses (gains) on energy-related derivative contracts, Wickliffe operating costs while idled and miscellaneous and other non-recurring adjustments. Expenses and income directly associated with the Chapter 11 cases. Also includes $116 M of non-cash reorganization gain recognized in the first quarter of 2016 for the deferred gain on a prior debt exchange. Realized losses (gains) on the sale of fixed assets, which are primarily attributable to the sale of hydroelectric facilities in January Costs incurred in connection with advisory and legal services related to planning for the Chapter 11 cases. -

CONFIDENTIAL INTERNAL USE ONLY Pension and OPEB Obligations – Subject to changes with Fresh Start Accounting 1. Net Pension and OPEB Obligation as of 12/31/15 as publically shared and filed with 8-K filing of exit presentation June 6, 2016. 2. Plan Year Projected Funding Requirements updated per actuarial projections as of August 2016. ($ M) FY 2015 Verso(1) Verso Pension Benefit Obligation $103 Plan Assets 62 Verso Net Pension Benefit Obligation $41 NewPage(1) NewPage Pension Benefit Obligation $1,569 Plan Assets 1,082 NewPage Net Pension Benefit Obligation $487 NewPage OPEB Obligation 37 Plan Assets - NewPage Net OPEB Obligation $37 NewPage Total Net Pension/OPEB Obligation $524 Consolidated Total Consolidated Net Pension/OPEB Obligation $565 FY 2016 FY 2017 FY 2018 FY 2019 FY 2020 Consolidated Pension Funding (30) (52) (55) (57) (55) OPEB Funding (7) (6) (4) (4) (3) Total Net Payments ($37) ($58) ($59) ($61) ($58) Projected Pension Funding (2) Net Pension and OPEB Obligations 27 Projected Funding Assumptions •Effective target liability discount rate of ~6.14% in 2016 • Contributions meet minimum funding standard and maintain a minimum 80% AFTAP • New Mortality tables assumed effective 2017. Net Unfunded Pension and OPEB liability is anticipated to increase by approximately $125 M with the application of fresh start accounting primarily due to a lower effective discount rate compared to year end 2015.


